UNITED STATES
SECURITIES AND EXCHANGE COMMISSION
WASHINGTON, D.C. 20549
FORM 10-K
ANNUAL REPORT
PURSUANT TO SECTION 13 OR 15(d)
OF THE SECURITIES EXCHANGE ACT OF 1934
(Mark One)
(X) | ANNUAL REPORT PURSUANT TO SECTION 13 OR 15(d) OF THE SECURITIES EXCHANGE ACT OF 1934 |
|
|
| For the fiscal year ended June 30, 2016 |
OR | |
|
|
( ) | TRANSITION REPORT PURSUANT TO SECTION 13 OR 15(d) OF THE SECURITIES EXCHANGE ACT OF 1934 |
| For the transition period from ______________ to ________________ |
Commission file number 0-14112
JACK HENRY & ASSOCIATES, INC.
(Exact name of registrant as specified in its charter)
Delaware |
| 43-1128385 |
(State or Other Jurisdiction of Incorporation) |
| (I.R.S Employer Identification No.) |
663 Highway 60, P.O. Box 807, Monett, MO 65708
(Address of Principle Executive Offices)
(Zip Code)
417-235-6652
(Registrant's telephone number, including area code)
Securities registered pursuant to Section 12(b) of the Act:
Title of each class |
| Name of each exchange on which registered |
Common Stock ($0.01 par value) |
| NASDAQ Global Select Market |
Securities registered pursuant to Section 12(g) of the Act: None
Indicate by check mark if the registrant is a well-known seasoned issuer, as defined in Rule 405 of the Securities Act.
Yes [ X ] No [ ]
Indicate by check mark if the registrant is not required to file reports pursuant to Section 13 or 15(d) of the Act.
Yes [ ] No [ X ]
Indicate by check mark whether the registrant (1) has filed all reports required to be filed by Section 13 or 15(d) of the Securities Exchange Act of 1934 during the preceding 12 months (or for such shorter period that the registrant was required to file such reports), and (2) has been subject to such filing requirements for the past 90 days.
Yes [ X ] No [ ]
Indicate by check mark whether the registrant has submitted electronically and posted on its corporate Website, if any, every Interactive Data File required to be submitted and posted pursuant to Rule 405 of Regulation S-T during the preceding 12 months (or for such shorter period that the registrant was required to submit and post such files).
Yes [ X ] No [ ]
Indicate by check mark if disclosure of delinquent filers pursuant to Item 405 of Regulation S-K is not contained herein, and will not be contained, to the best of registrant's knowledge, in definitive proxy or information statements incorporated by reference in Part III of this Form 10-K or any amendment to this Form 10-K. [X]
Indicate by check mark whether the Registrant is a large accelerated filer, an accelerated filer, a non-accelerated filer or a smaller reporting company. See the definitions of "large accelerated filer," "accelerated filer" and "smaller reporting company" in Rule 12b-2 of the Exchange Act.
Large accelerated filer | [X] |
| Accelerated filer | [ ] |
|
|
|
|
|
Non-accelerated filer | [ ] | (Do not check if a smaller reporting company) | Smaller reporting company | [ ] |
Indicate by check mark whether the Registrant is a shell company (as defined in Rule 12b-2 of the Exchange Act)
Yes [ ] No [ X ]
As of August 24, 2016 , the Registrant had 78,535,929 shares of Common Stock outstanding ($0.01 par value). On December 31, 2015 , the aggregate market value of the Common Stock held by persons other than those who may be deemed affiliates of Registrant was $6,234,140,228 (based on the average of the reported high and low sales prices on NASDAQ on December 31, 2015 ).
DOCUMENTS INCORPORATED BY REFERENCE
Portions of the Company's Notice of Annual Meeting of Stockholders and Proxy Statement for its 2016 Annual Meeting of Stockholders (the "Proxy Statement") are incorporated by reference into Part II, Item 5 and into Part III of this Report.
TABLE OF CONTENTS
|
| Page Reference |
|
|
|
PART I |
|
|
|
|
|
ITEM 1. | BUSINESS | 5 |
|
|
|
ITEM 1A. | RISK FACTORS | 13 |
|
|
|
ITEM 1B. | UNRESOLVED STAFF COMMENTS | 16 |
|
|
|
ITEM 2. | PROPERTIES | 16 |
|
|
|
ITEM 3. | LEGAL PROCEEDINGS | 16 |
|
|
|
ITEM 4. | MINE SAFETY DISCLOSURES | 17 |
|
|
|
PART II |
|
|
|
|
|
ITEM 5. | MARKET FOR REGISTRANT'S COMMON EQUITY, RELATED STOCKHOLDER MATTERS AND ISSUER PURCHASES OF EQUITY SECURITIES | 18 |
|
|
|
ITEM 6. | SELECTED FINANCIAL DATA | 20 |
|
|
|
ITEM 7. | MANAGEMENT'S DISCUSSION AND ANALYSIS OF FINANCIAL CONDITION AND RESULTS OF OPERATIONS | 20 |
|
|
|
ITEM 7A. | QUANTITATIVE AND QUALITATIVE DISCLOSURES ABOUT MARKET RISK | 34 |
|
|
|
ITEM 8. | FINANCIAL STATEMENTS AND SUPPLEMENTARY DATA | 35 |
|
|
|
ITEM 9. | CHANGES IN AND DISAGREEMENTS WITH ACCOUNTANTS ON ACCOUNTING AND FINANCIAL DISCLOSURE | 62 |
|
|
|
ITEM 9A. | CONTROLS AND PROCEDURES | 62 |
|
|
|
ITEM 9B. | OTHER INFORMATION | 62 |
|
|
|
PART III |
|
|
|
|
|
ITEM 10. | DIRECTORS, EXECUTIVE OFFICERS AND CORPORATE GOVERNANCE | 63 |
|
|
|
ITEM 11. | EXECUTIVE COMPENSATION | 63 |
|
|
|
ITEM 12. | SECURITY OWNERSHIP OF CERTAIN BENEFICIAL OWNERS AND MANAGEMENT AND RELATED STOCKHOLDER MATTERS | 63 |
|
|
|
ITEM 13. | CERTAIN RELATIONSHIPS AND RELATED TRANSACTIONS, AND DIRECTOR INDEPENDENCE | 63 |
|
|
|
ITEM 14. | PRINCIPAL ACCOUNTANT FEES AND SERVICES | 63 |
|
|
|
PART IV |
|
|
|
|
|
ITEM 15 | EXHIBITS AND FINANCIAL STATEMENT SCHEDULES | 64 |
|
|
|
ITEM 16 | FORM 10-K SUMMARY | 66 |
3
In this report, all references to "JHA", the "Company", "we", "us", and "our", refer to Jack Henry & Associates, Inc., and its wholly owned subsidiaries.
FORWARD LOOKING STATEMENTS
Certain statements in this report, other than purely historical information, including estimates, projections, statements relating to our business plans, objectives and expected operating results, and the assumptions upon which those statements are based, are "forward-looking statements" within the meaning of the Private Securities Litigation Reform Act of 1995, Section 27A of the Securities Act of 1933 and Section 21E of the Securities Exchange Act of 1934. Forward-looking statements may appear throughout this report, including without limitation, in Management's Discussion and Analysis of Financial Condition and Results of Operations. Forward-looking statements generally are identified by the words "believe," "project," "expect," "anticipate," "estimate," and similar expressions. Forward-looking statements are based on current expectations and assumptions that are subject to risks and uncertainties which may cause actual results to differ materially from the forward-looking statements. A detailed discussion of risks and uncertainties that could cause actual results and events to differ materially from such forward-looking statements is included in the section titled "Risk Factors" (Part I, Item 1A of this Form 10-K). We undertake no obligation to update or revise publicly any forward-looking statements, whether as a result of new information, future events, or otherwise.
4
PART I
ITEM 1. BUSINESS
Jack Henry & Associates, Inc. was founded in 1976 as a provider of core information processing solutions for community banks. Today, the Company's extensive array of products and services includes processing transactions, automating business processes, and managing information for over 10,500 financial institutions and diverse corporate entities.
JHA provides its products and services through three business brands:
• | Jack Henry Banking is a leading provider of integrated data processing systems to over 1,100 banks ranging from community banks to multi-billion dollar institutions with assets of up to $30 billion . Our banking solutions support both in-house and outsourced operating environments with three functionally distinct core processing platforms and more than 100 integrated complementary solutions. |
• | Symitar is a leading provider of core data processing solutions for credit unions of all sizes, with over 800 credit union customers. Symitar markets two functionally distinct core processing platforms and more than 50 integrated complementary solutions that support both in-house and outsourced operating environments. |
• | ProfitStars is a leading provider of highly specialized products and services to financial institutions that are primarily not core customers of the Company. ProfitStars offers highly specialized financial performance, imaging and payments processing, information security and risk management, retail delivery, and online and mobile solutions. ProfitStars' products and services enhance the performance of financial services organizations of all asset sizes and charters, and diverse corporate entities with nearly 10,200 domestic and international customers. |
Our products and services enable our customers to implement technology solutions that can be tailored to support their unique growth, service, operational, and performance goals. Our solutions also enable financial institutions to offer the high-demand products and services required to compete more successfully, and to capitalize on evolving trends shaping the financial services industry.
We are committed to exceeding our customers' service-related expectations. We measure and monitor customer satisfaction using formal annual surveys and online surveys initiated each day randomly by routine support requests. The results of this extensive survey process confirm that our service consistently exceeds our customers' expectations and generates excellent customer retention rates.
We also focus on establishing long-term customer relationships, continually expanding and strengthening those relationships with cross sales of additional products and services, earning new traditional and nontraditional clients, and ensuring each product offering is highly competitive.
The majority of our revenue is derived from recurring electronic payment services and outsourcing services that both generally have contract terms of five years or greater, and support and service fees. Less predictable software license fees, paid by customers implementing our software solutions in-house, and hardware sales, including all non-software products that we re-market in order to support our software systems, complement our primary revenue sources.
JHA ended fiscal 2016 with $1,354.6 million in revenue. This has increased from $946.4 million at the end of fiscal 2011 , representing a compound annual growth rate during this five-year period of 7% . Net income from continuing operations has grown from $128.4 million to $248.9 million during this same five-year period, representing a compound annual growth rate of 14% . Information regarding the classification of our business into separate segments serving the banking and credit union industries is set forth in Note 13 to the Consolidated Financial Statements (see Item 8).
JHA's progress and performance have been guided by the focused work ethic and fundamental ideals fostered by the Company's founders 40 years ago:
• | Do the right thing, |
• | Do whatever it takes, and |
• | Have fun. |
We recognize that our associates and their collective contribution are ultimately responsible for JHA's past, present, and future success. Recruiting and retaining high-quality employees is essential to our ongoing growth and financial performance, and we have established a corporate culture that sustains high levels of employee satisfaction.
Industry Background
Jack Henry Banking primarily serves commercial banks and savings institutions with up to $30 billion in assets. According to the Federal Deposit Insurance Corporation ("FDIC"), there were more than 6,100 commercial banks and savings institutions in this asset range as of December 31, 2015 . Jack Henry Banking currently supports over 1,100 of these banks with its core information processing platforms and complementary products and services.
5
Symitar serves credit unions of all asset sizes. According to the Credit Union National Association ("CUNA"), there were nearly 6,300 domestic credit unions as of December 31, 2015 . Symitar currently supports over 800 of these credit unions with core information processing platforms and complementary products and services.
ProfitStars serves financial services organizations of all asset sizes and charters and other diverse corporate entities. ProfitStars currently supports nearly 10,200 institutions with specialized solutions for generating additional revenue and growth, increasing security, mitigating operational risks, and controlling operating costs.
The FDIC reports the number of commercial banks and savings institutions declined 19% from the beginning of calendar year 2011 to the end of calendar year 2015 . Although the number of banks declined at a 4% compound annual rate during this period, aggregate assets increased at a compound annual rate of 4% and totaled $14.9 trillion as of December 31, 2015 . There was one new bank charter issued in calendar year 2015 , compared to none in calendar 2014 . Comparing calendar years 2015 to 2014 , mergers increased 11% .
CUNA reports the number of credit unions declined 18% from the beginning of calendar year 2011 to the end of calendar year 2015 . Although the number of credit unions declined at a 4% compound annual rate during this period, aggregate assets increased at a compound annual rate of 6% and totaled $1.2 trillion as of December 31, 2015 .
Community and mid-tier banks and credit unions are important in the communities and to the consumers they serve. Bank customers and credit union members rely on these institutions to provide personalized, relationship-based service and competitive financial products and services available through the customer's delivery channel of choice. Institutions are recognizing that attracting and retaining customers/members in today's highly competitive financial industry and realizing near and long term performance goals are often technology-dependent. Financial institutions must implement technological solutions that enable them to:
• | Maximize performance with accessible, accurate, and timely business intelligence information; |
• | Offer the high-demand products and services needed to successfully compete with traditional competitors and non-traditional competitors created by convergence within the financial services industry; |
• | Enhance the customer/member experience at varied points of contact; |
• | Expand existing customer/member relationships and strengthen exit barriers by cross selling additional products and services; |
• | Capitalize on new revenue and deposit growth opportunities; |
• | Increase operating efficiencies and reduce operating costs; |
• | Implement e-commerce, mobile, and digital strategies that provide the convenience-driven services required in today's financial services industry; |
• | Protect mission-critical information assets and operational infrastructure; |
• | Protect customers/members with various security tools from fraud and related financial losses; |
• | Maximize the day-to-day use of technology and return on technology investments; and |
• | Ensure full regulatory compliance. |
JHA's extensive product and service offering enables diverse financial institutions to capitalize on these business opportunities and respond to these business challenges. We strive to establish a long-term, value-added technology partnership with each customer, and to continually expand our offering with the specific solutions our customers need to prosper in the evolving financial services industry.
Mission Statement
JHA's mission is to protect and increase the value of its stockholders' investment by providing quality products and services to our customers. We perform this mission by:
• | Concentrating our activities on what we know best - information systems and services for financial institutions; |
• | Providing outstanding commitment and service to our customers so that the perceived value of our products and services is consistent with the real value; and |
• | Maintaining a work environment that is personally, professionally, and financially rewarding to our employees. |
Business Strategy
Our fundamental business strategy is to generate organic revenue and earnings growth supplemented by strategic acquisitions. We execute this strategy by:
• | Providing commercial banks and credit unions with core software systems that provide excellent functionality, and support in-house and outsourced operating environments with identical functionality. |
6
• | Expanding each core customer relationship by cross-selling complementary products and services that enhance the functionality provided by our core information processing systems. |
• | Maintaining a company-wide commitment to customer service that consistently exceeds our customers' expectations and generates high levels of customer retention. |
• | Capitalizing on our acquisition strategy. |
Acquisition Strategy
We have a disciplined approach to acquisitions and have been successful in supplementing our organic growth with strategic acquisitions, including 29 acquisitions since the end of fiscal 1999. We continue to explore acquisitions that have the potential to:
• | Expand our suite of complementary products and services; |
• | Provide products and services that can be sold to both existing core and non-core customers and outside our base to new customers; and /or |
• | Provide selective opportunities to sell outside our traditional markets in the financial services industry. |
We have completed two acquisitions in the last 3 years. After 40 years in business we have very few gaps in our product line, so it is increasingly difficult to find proven products or services that would enable our clients and prospects to better optimize their business opportunities or solve specific operational issues. In addition, we see few acquisition opportunities that would expand our market or enable our entry into adjacent markets within the financial services industry that are fairly priced or that we could assimilate into our company without material distractions.
We have a solid track record of executing acquisitions from both a financial and operational standpoint and we will continue to pursue acquisition opportunities that support our strategic direction, complement and accelerate our organic growth, and generate long-term profitable growth for our shareholders. Until we identify appropriate acquisition opportunities, we will continue to find alternative ways to leverage our cash position and balance sheet to the benefit of our shareholders, such as repurchases of our stock and continued payment of dividends.
Our five most recent acquisitions were:
Fiscal Year | Company or Product Name | Products and Services |
2016 | Bayside Business Solutions | Portfolio management systems and factoring software |
2014 | Banno | Mobile banking, web development and data-enriched marketing technology |
2010 | iPay Technologies | Electronic bill payment and P2P services |
2010 | PEMCO Technology Services | Payment transaction processing solutions for credit unions |
2010 | Goldleaf Financial Solutions | Integrated technology and payment processing solutions |
Solutions
Our proprietary solutions are marketed through three business brands:
• | Jack Henry Banking supports commercial banks with information and transaction processing platforms that provide enterprise-wide automation. We have three functionally distinct core bank processing systems and more than 100 complementary solutions, including business intelligence and bank management, retail and business banking, internet banking and electronic payment services, risk management and protection, and item and document imaging solutions. Our banking solutions have state-of-the-art functional capabilities, and we can re-market the hardware required by each software system. Our banking solutions can be delivered in-house or through outsourced delivery model, and are backed by a company-wide commitment to provide exceptional personal service. Jack Henry Banking is a recognized market leader, currently supporting over 1,100 banks with its technology platforms. |
• | Symitar supports credit unions of all sizes with information and transaction processing platforms that provide enterprise-wide automation. Its solutions include two functionally distinct core processing systems and more than 50 complementary solutions, including business intelligence and credit union management, member and member business services, internet banking and electronic payment services, risk management and protection, and item and document imaging solutions. Our credit union solutions also have state-of-the-art functional capabilities, and we can re-market the hardware required by each software system. Our credit union solutions can be delivered in-house or through outsourced delivery model, and are also backed by our company-wide commitment to provide exceptional personal service. Symitar currently supports over 800 credit union customers. |
• | ProfitStars is a leading provider of specialized products and services assembled through our focused diversification acquisition strategy. These solutions are compatible with a wide variety of information technology platforms and |
7
operating environments, and include proven solutions for generating additional revenue and growth, increasing security and mitigating operational risks, and/or controlling operating costs. ProfitStars' products and services enhance the performance of financial services organizations of all asset sizes and charters, and diverse corporate entities with nearly 10,200 domestic and international customers. These distinct products and services can be implemented individually or as solution suites to address specific business problems or needs and enable effective responses to dynamic industry trends.
We will continue to develop and maintain functionally robust, integrated solutions that are supported with high service levels; regularly enhancing those solutions using an interactive customer enhancement process; compliant with relevant regulations; updated with proven advances in technology; and consistent with JHA's reputation as a premium product and service provider.
Core Software Systems
Core software systems primarily consist of the integrated applications required to process deposit, loan, and general ledger transactions, and to maintain centralized customer/member information.
Jack Henry Banking markets three core software systems to banks and Symitar markets two core software systems to credit unions. These core systems are available for in-house installation at customer sites, or financial institutions can outsource ongoing information processing to JHA.
Jack Henry Banking's three core banking platforms are:
• | SilverLake®, a robust IBM Power System™ (i/OS) based system primarily designed for commercial-focused banks with assets ranging from $500 million to $30 billion. However, some progressive smaller banks and start-up banks also select SilverLake. This system has been implemented by over 400 banks, and now automates approximately 6.5% of the domestic banks with assets less than $30 billion. |
• | CIF 20/20®, a parameter-driven, easy-to-use system that now supports over 530 banks ranging from de novo institutions to those with assets exceeding $2 billion. CIF 20/20 is the most widely used IBM Power System™ (i/OS) core processing system in the community bank market. |
• | Core Director®, a Windows®-based, client/server system that now supports nearly 200 banks ranging from de novo institutions to those with assets exceeding $1 billion. Core Director is a cost-efficient operating platform and provides intuitive point-and-click operation. |
Symitar's two core credit union platforms are:
• | Episys®, a robust IBM Power System™ (AIX®) based system primarily designed for credit unions with more than $50 million in assets. It has been implemented by over 640 credit unions and is ranked as the system implemented by more credit unions with assets exceeding $25 million than any other alternative system. |
• | CruiseNet®, a Windows-based, client/server system designed primarily for credit unions with less than $50 million in assets. It has been implemented by more than 160 credit unions, is cost-efficient, and provides intuitive point-and-click, drag-and-drop operation. |
Customers electing to install our solutions in-house license the proprietary software systems based on initial license fees. The large majority of these customers pay ongoing annual software maintenance fees. We also re-market the hardware and peripheral equipment that is required by our software solutions; and we contract to perform software implementation, data conversion, training, ongoing support, and other related services. In-house customers generally license our core software systems under a standard license agreement that provides a fully paid, nonexclusive, nontransferable right to use the software on a single computer at a single location.
Customers can eliminate the significant up-front capital expenditures required by in-house installations and the responsibility for operating information and transaction processing infrastructures by outsourcing these functions to JHA. Our core outsourcing services are provided through a national network of four data centers located in three physical locations. We also provide image item processing services from two host/archive sites and several key entry and balancing locations throughout the country. We print and mail customer statements for financial institutions from three regional printing and rendering centers. Customers electing to outsource their core processing typically sign contracts for five or more years that include transaction-based processing fees and minimum guaranteed payments during the contract period.
We support the dynamic business requirements of our core bank and credit union clients with ongoing enhancements to each core system, the regular introduction of new integrated complementary products, the ongoing integration of practical new technologies, and regulatory compliance initiatives. JHA also serves each core customer as a single point of contact, support, and accountability.
8
Complementary Products and Services
We provide more than 100 complementary products and services that are sold to our core bank and credit union customers, and selectively sold by our ProfitStars division to financial services organizations that use other core processing systems.
These complementary solutions enable core bank and credit union clients to respond to evolving customer/member demands, expedite speed-to-market with competitive offerings, increase operating efficiency, address specific operational issues, and generate new revenue streams. The highly specialized solutions sold by ProfitStars enable diverse financial services organizations and corporate entities to generate additional revenue and growth opportunities, increase security and mitigate operational risks, and control operating costs.
JHA regularly introduces new products and services based on demand for integrated complementary solutions from our existing core clients, and based on the growing demand among financial services organizations and corporate entities for specialized solutions capable of increasing revenue and growth opportunities, mitigating and controlling operational risks, and containing costs. The Company's Industry Research department solicits customer guidance on the business solutions they need, evaluates available solutions and competitive offerings, and manages the introduction of new product offerings. JHA's new complementary products and services are developed internally, acquired, or provided through strategic alliances.
Electronic Payment Services
Electronic payment services supports our customers with convenient and secure payment processing designed to help them simplify complex payment processing, attract profitable retail and commercial accounts, increase operating efficiencies, comply with regulatory mandates, and proactively mitigate and manage payments-related risk and fraud while staying at the forefront of payments innovation.
Jack Henry identifies three components of Electronic Payment Services:
• | Card Services provides a comprehensive suite of Automated Teller Machine ("ATM"), debit, and credit card transaction processing and management solutions. Our card processing solutions, which include awards, fraud detection, ability to hot card and initiate new replacement cards, and ATM management products, are fully integrated with JHA's core and complementary solutions, facilitating seamless transaction processing. |
• | Bill Pay and Mobile banking platforms are offered through our iPay and Banno product offerings. iPay offers iPay Business Bill Pay™, a full suite of online financial management solutions designed to meet the distinct needs of small businesses, as well as iPay Consumer Bill Pay™, a solution that supports single or recurring payments, allows customers to receive bills electronically, and easily integrates with any internet banking provider. Banno Mobile™ offers a native mobile banking application for both iOS and Android that offers innovative and cost-effective mobile services that can be marketed with customer's own brand identity. It allows customers to aggregate all of their account balances and transactional data from multiple financial institutions and empowers them with the convenience of anytime, anywhere account access. |
• | Processing/ Other- Enterprise Payment Solutions (EPS), is a comprehensive payments engine and the leading total payments solution on the market today. EPS offers an integrated suite of remote deposit capture, ACH and card transaction processing solutions, risk management tools, reporting capabilities, and more for financial institutions of all sizes. EPS helps financial institutions succeed in today's competitive market to increase revenue, improve efficiencies, better manage compliance, and enhance customer relationships. Commercial Lending Solutions help FIs securely transition from a traditional lending portfolio (focused on real estate-based consumer lending) to a more fully-diversified portfolio developed via commercial and industrial lending. Our solutions also provide reliable ways to retain creditworthy business customers facing financial hurdles, without the risk of loan loss. |
Hardware Systems
Our software systems operate on a variety of hardware platforms. We have established remarketing agreements with IBM Corporation (fulfilled directly and through IBM distributors), Avnet, Inc., and other hardware providers that allow JHA to purchase hardware and related maintenance services at a discount and resell them directly to our customers. We currently sell the IBM Power Systems; Lenovo servers and workstations; Dell servers and workstations; Burroughs, RDM, Panini, Digital Check, Canon check scanners; and other devices that complement our software solutions.
9
Implementation and Training
The majority of our new core bank and credit union customers contract with us for implementation and training services in connection with their systems.
A complete core system implementation typically includes detailed planning, project management, data conversion, and testing. Our experienced implementation teams travel to customer facilities to help manage the process and ensure that all data is transferred from the legacy system to the JHA system. Our implementation fees are fixed or hourly based on the core system being installed.
We also provide extensive initial and ongoing education to our customers. Know-It-All Education is a comprehensive training program that supports new customers with basic training and longtime customers with continuing education. The curricula provide the ongoing training financial institutions need to maximize the use of JHA's core and complementary products, to optimize ongoing system enhancements, and to fully understand dynamic year-end legislative and regulatory requirements. Each basic, intermediate, and advanced course is delivered by system experts, supported by professional materials and training tools, and incorporates different educational media in a blended learning approach. Know-It-All Education supports distinct learning preferences with a variety of delivery channels, including classroom-based courses offered in JHA's regional training centers, Internet-based live instruction, eLearning courses, on-site training, and train-the-trainer programs.
Support and Services
We serve our customers as a single point of contact and support for the complex solutions we provide. The Company's comprehensive support infrastructure incorporates:
• | Exacting service standards; |
• | Trained support staff available 24 hours-a-day, 365 days-a-year; |
• | Assigned account managers; |
• | Sophisticated support tools, resources, and technology; |
• | Broad experience converting diverse banks and credit unions to our core platforms from every competitive platform; |
• | Highly effective change management and control processes; and |
• | A best practices methodology developed and refined through the company-wide, day-to-day experience supporting over 10,500 diverse clients. |
Most in-house customers contract for annual software support services, and this represents a significant source of recurring revenue for JHA. These support services are typically priced at approximately 18% to 20% of the respective product's software license fee. These fees generally increase as customer assets increase and as additional complementary products are purchased. Annual software support fees are typically billed during June and are paid in advance for the entire fiscal year, with pro-ration for new product implementations that occur during the year. Hardware support fees also are usually paid in advance for entire contract periods which typically range from one to five years. Most support contracts automatically renew unless the customer or JHA gives notice of termination at least 30 days prior to contract expiration.
High levels of support are provided to our outsourced customers by the same support infrastructure utilized for in-house customers. However, these support fees are included as part of monthly outsourcing fees.
JHA regularly measures customer satisfaction using formal annual surveys and more frequent online surveys initiated randomly by routine support requests. This process shows that we consistently exceed our customers' service-related expectations.
Backlog
Backlog consists of contracted in-house products and services that have not been delivered. Backlog also includes the minimum monthly payments for the remaining portion of multi-year outsourcing contracts, and typically includes the minimum payments guaranteed for the remainder of the contract period.
Backlog as of June 30, 2016 totaled $620.6 million , consisting of contracts signed for future delivery of software, hardware, and implementation services (in-house backlog) of approximately $95.6 million , and $525.0 million for outsourcing services. Approximately $406.0 million of the outsourcing services backlog as of June 30, 2016 is not expected to be realized during fiscal 2017 due to the long-term nature of our outsourcing contracts. Backlog as of June 30, 2015 totaled $527.8 million , consisting of $96.3 million for future delivery of in-house software, hardware, and implementation services (in-house backlog), and $431.5 million for outsourcing services.
10
The in-house backlog does not include amounts related to items that have been delivered but cannot be recognized as revenue due to accounting rules for software revenue recognition; those amounts are included in deferred revenue on the balance sheet to the extent that they have been billed to the customer as of June 30, 2016 and 2015 .
Our outsourcing backlog continues to experience growth based on new contracting activities and renewals of multi-year contracts, and although the appropriate portion of this revenue will be recognized during fiscal 2017 , the backlog is expected to trend up gradually for the foreseeable future due to renewals of existing relationships and new contracting activities.
Research and Development
We invest significant resources in ongoing research and development to develop new software solutions and services, and enhance existing solutions with additional functionality and features required to ensure regulatory compliance. Our core and the majority of our complementary systems are typically enhanced once each year. Product-specific enhancements are largely customer-driven with recommended enhancements formally gathered through focus groups, change control boards, strategic initiatives meetings, annual user group meetings, and ongoing customer contact. We also continually evaluate and implement process improvements that expedite the delivery of new products and enhancements to our customers, and reduce related costs.
Research and development expenses for fiscal years 2016 , 2015 , and 2014 were $81.2 million , $71.5 million , and $66.7 million , respectively. Capitalized software for fiscal years 2016 , 2015 , and 2014 was $96.4 million , $76.9 million , and $62.2 million , respectively.
Sales and Marketing
JHA serves established, well defined markets that provide ongoing sales and cross-sales opportunities.
Jack Henry Banking sells core processing systems and integrated complementary solutions primarily to domestic commercial banks with assets up to $30 billion . Symitar sells core processing systems and integrated complementary solutions primarily to domestic credit unions of all asset sizes. The marketing and sales initiatives within these business lines are primarily focused on identifying banks and credit unions evaluating alternative core information and transaction processing solutions. ProfitStars sells specialized niche solutions that complement existing technology platforms to domestic financial services organizations of all asset sizes and charters.
Dedicated sales forces support each of JHA's three business brands. Sales executives are responsible for the activities required to earn new customers in assigned territories, and regional account executives are responsible for nurturing customer relationships and cross selling additional products and services. Our sales professionals receive base salaries and performance-based commission compensation. Brand-specific sales support staff provide a variety of services, including product and service demonstrations, responses to prospect-issued requests-for-proposals, and proposal and contract generation. Our marketing department supports all three business lines with lead generation and brand-building activities, including participation in state-specific, regional, and national trade shows; print and online advertising; telemarketing; customer newsletters; ongoing promotional campaigns; and media relations. JHA also hosts annual national user group meetings which provide opportunities to network with existing clients and demonstrate new products and services.
JHA has sold select products and services in the Caribbean, Europe, Canada, and South America. International sales account for approximately 1% of JHA's total revenue in each of the three years ended June 30, 2016 , 2015 , and 2014 .
Competition
The market for companies providing technology solutions to financial services organizations is competitive, and we expect that competition from both existing competitors and companies entering our existing or future markets will remain strong. Some of JHA's current competitors have longer operating histories, larger customer bases, and greater financial resources. The principal competitive factors affecting the market for technology solutions include product/service functionality, price, operating flexibility and ease-of-use, customer support, and existing customer references. For more than a decade there has been significant consolidation among providers of products and services designed for financial institutions, and this consolidation is expected to continue in the future.
Jack Henry Banking and Symitar compete with large vendors that provide information and transaction processing solutions to banks and credit unions, including Fidelity National Information Services, Inc.; Fiserv, Inc.; and DH Corporation. ProfitStars competes with an array of disparate vendors that provide niche solutions to financial services organizations and corporate entities.
Intellectual Property, Patents, and Trademarks
Although we believe our success depends upon our technical expertise more than our proprietary rights, our future success and ability to compete depend in part upon our proprietary technology. We have registered or filed applications
11
for our primary trademarks. Most of our technology is not patented. Instead, we rely on a combination of contractual rights, copyrights, trademarks, and trade secrets to establish and protect our proprietary technology. We generally enter into confidentiality agreements with our employees, consultants, resellers, customers, and potential customers. Access to and distribution of our Company's source code is restricted, and the disclosure and use of other proprietary information is further limited. Despite our efforts to protect our proprietary rights, unauthorized parties can attempt to copy or otherwise obtain, or use our products or technology. We cannot be certain that the steps taken in this regard will be adequate to prevent misappropriation of our technology or that our competitors will not independently develop technologies that are substantially equivalent or superior to our technology.
Regulatory Compliance
JHA maintains a corporate commitment to address compliance issues and implement requirements imposed by the federal regulators prior to the effective date of such requirements when adequate prior notice is given. JHA's compliance program is provided by a team of compliance analysts and auditors that possess extensive regulatory agency and financial institution experience, and a thorough working knowledge of JHA and our solutions. These compliance professionals leverage multiple channels to remain informed about potential and recently enacted regulatory requirements, including regular discussions on emerging topics with the Federal Financial Institutions Examination Council ("FFIEC") examination team and training sessions sponsored by various professional associations.
JHA has a process to inform internal departments of new and revised regulatory requirements. Upcoming regulatory changes also are presented to the Company's product-specific change control boards and the necessary product changes are included in the ongoing product development cycle. A representative of JHA's compliance organization serves on every change control board to ensure that the regulatory perspective is addressed in proposed product/service changes. We publish newsletters to keep our customers informed of regulatory changes that could impact their operations. Periodically, customer advisory groups are assembled to discuss significant regulatory changes.
Internal audits of our systems, networks, operations, business recovery plans, and applications are conducted and specialized outside firms are periodically engaged to perform testing and validation of our systems, processes, plans and security. Ensuring that confidential information remains private is a high priority, and JHA's initiatives to protect confidential information include regular third-party application reviews intended to better secure information access. Additional third-party reviews are performed throughout the organization, such as vulnerability tests, intrusion tests, and Statement on Standards for Attestation Engagements ("SSAE") 16 reviews. The FFIEC conducts annual reviews throughout the Company and issues reports that are reviewed by the JHA Risk and Compliance Committee of the Board of Directors.
Government Regulation
The financial services industry is subject to extensive and complex federal and state regulation. All financial institutions are subject to substantial regulatory oversight and supervision. Our products and services must comply with the extensive and evolving regulatory requirements applicable to our customers, including but not limited to those mandated by federal truth-in-lending and truth-in-savings rules, the Privacy of Consumer Financial Information regulations, usury laws, the Equal Credit Opportunity Act, the Fair Housing Act, the Electronic Funds Transfer Act, the Fair Credit Reporting Act, the Bank Secrecy Act, the USA Patriot Act, the Gramm-Leach-Bliley Act, the Community Reinvestment Act and the Dodd-Frank Wall Street Reform and Consumer Protection Act. The compliance of JHA's products and services with these requirements depends on a variety of factors, including the particular functionality, the interactive design, the classification of customers, and the manner in which the customer utilizes the products and services. Our customers are contractually responsible for assessing and determining what is required of them under these regulations and then we assist them in meeting their regulatory needs through our products and services. The impact of the Dodd-Frank Wall Street Reform and Consumer Protection Act is still evolving as the regulations are written to implement the various provisions of the law. We cannot predict the impact these regulations, any future amendments to these regulations or any newly implemented regulations will have on our business in the future.
JHA is not chartered by the Office of the Comptroller of Currency, the Board of Governors of the Federal Reserve System, the National Credit Union Administration or other federal or state agencies that regulate or supervise depository institutions. However, operating as a service provider to financial institutions, JHA's operations are governed by the same regulatory requirements as those imposed on financial institutions, and subject to periodic reviews by FFIEC regulators who have broad supervisory authority to remedy any shortcomings identified in such reviews.
JHA provides outsourced services through OutLink ™ Data Centers, electronic transaction processing through Card Processing Solutions, Internet banking through NetTeller, MemberConnect ™, and Banno online solutions, bill payment through iPay, network security monitoring through our Gladiator unit, Cloud Services and business recovery services through Centurion Disaster Recovery.
12
The outsourcing services provided by JHA are subject to examination by FFIEC regulators under the Bank Service Company Act. These examinations cover a wide variety of subjects, including system development, functionality, reliability, and security, as well as disaster preparedness and business recovery planning. Our outsourcing services are also subject to examination by state banking authorities on occasion.
Employees
As of June 30, 2016 and 2015 , JHA had 5,861 and 5,822 full-time employees, respectively. Of our full-time employees, approximately 949 are employed in the credit union segment of our business, with the remainder employed in the bank segment or in general and administrative functions that serve both segments. Our employees are not covered by a collective bargaining agreement and there have been no labor-related work stoppages.
Available Information
JHA's Website is easily accessible to the public at www.jackhenry.com . The "For Investors" portion of the Website provides key corporate governance documents, the code of conduct, an archive of press releases, and other relevant Company information. Our annual report on Form 10-K, quarterly reports on Form 10-Q, current reports on Form 8-K, and other filings and amendments thereto that are made with the U.S. Securities and Exchange Commission (SEC) also are available free of charge on our Website as soon as reasonably practical after these reports have been filed with or furnished to the SEC. The SEC also maintains a website that contains reports, proxy and information statements, and other information regarding issuers that file electronically with the SEC at http://www.sec.gov .
ITEM 1A. RISK FACTORS
The Company's business and the results of its operations are affected by numerous factors and uncertainties, some of which are beyond our control. The following is a description of some of the important risks and uncertainties that may cause our actual results of operations in future periods to differ from those expected or desired.
Security problems could damage our reputation and business. We rely on industry-standard encryption, network and Internet security systems, most of which we license from third parties, to provide the security and authentication necessary to effect secure transmission of data. Our services and infrastructure are increasingly reliant on the Internet. Computer networks and the Internet are vulnerable to unauthorized access, computer viruses and other disruptive problems such as denial of service attacks and other forms of cyber-terrorism. Individual personal computers can be stolen, and customer data media can be lost in shipment. Under state and proposed federal laws requiring consumer notification of security breaches, the costs to remediate security breaches can be substantial. Advances in computer capabilities, new discoveries in the field of cryptography or other events or developments may render our security measures inadequate. Security risks may result in liability to our customers, damage to our reputation, and may deter financial institutions from purchasing our products. We will continue to expend significant capital and other resources protecting against the threat of security breaches, and, in the event of a breach, we may need to expend resources alleviating problems caused by such breach. Addressing security problems may result in interruptions, delays or cessation of service to users, any of which could harm our business.
Operational failure in our outsourcing facilities could expose us to damage claims, increase regulatory scrutiny and cause us to lose customers. Damage or destruction that interrupts our outsourcing operations could cause delays and failures in customer processing which could hurt our relationship with customers, damage our reputation, expose us to damage claims, and cause us to incur substantial additional expense to relocate operations and repair or replace damaged equipment. Our back-up systems and procedures may not prevent disruption, such as a prolonged interruption of our transaction processing services. In the event that an interruption extends for more than several hours, we may experience data loss or a reduction in revenues by reason of such interruption. Any significant interruption of service could reduce revenue, have a negative impact on our reputation, result in damage claims, lead our present and potential customers to choose other service providers, and lead to increased regulatory scrutiny of the critical services we provide to financial institutions, with resulting increases in compliance burdens and costs.
Failures associated with payment transactions could result in financial loss. The volume and dollar amount of payment transactions that we process is significant and continues to grow. We settle funds on behalf of financial institutions, other businesses and consumers and receive funds from clients, card issuers, payment networks and consumers on a daily basis for a variety of transaction types. Transactions facilitated by us include debit card, credit card, electronic bill payment transactions, Automated Clearing House ("ACH") payments and check clearing that support consumers, financial institutions and other businesses. If the continuity of operations, integrity of processing, or ability to detect or prevent fraudulent payments were compromised in connection with payments transactions, this could result in financial as well as reputational loss to us. In addition, we rely on various financial institutions to provide ACH services in support of funds settlement for certain of our products. If we are unable to obtain such ACH services in the future, that could have a material adverse effect on our business, financial position and results of operations. In addition, we
13
may issue credit to consumers, financial institutions or other businesses as part of the funds settlement. A default on this credit by a counterparty could result in a financial loss to us.
A material weakness in our internal controls could have a material adverse effect on us. Our management is responsible for establishing and maintaining adequate internal control over our financial reporting, as defined in Rule 13a-15(f) under the Securities Exchange Act of 1934, as amended. In June 2015 we restated our consolidated financial statements for the quarter ended September 30, 2014, for the years ended June 30, 2014, 2013 and 2012 and for the quarterly periods within the fiscal years ended June 30, 2014 and 2013 (the "Restated Periods"). The determination to restate the financial statements for the Restated Periods was made upon the identification of errors related to our method of accounting for revenue from certain bundled software multi-element agreements. In connection with the consolidated financial statements for the year ending June 30, 2016, management believes that the identified material weakness in our internal controls over financial reporting were fully remediated.
Effective internal controls are necessary for us to provide reasonable assurance with respect to our financial reports and to mitigate risk of fraud. If additional material weaknesses in our internal control are discovered or occur in the future, our consolidated financial statements may contain material misstatements and we could be required to restate our financial results, which could materially and adversely affect our business and results of operations or financial condition, restrict our ability to access the capital markets, require us to expend significant resources to correct the weaknesses or deficiencies, subject us to fines, penalties or judgments, harm our reputation or otherwise cause a decline in investor confidence.
Our business may be adversely impacted by U.S. and global market and economic conditions. We derive most of our revenue from products and services we provide to the financial services industry. If the economic environment worsens, we could face a reduction in demand from current and potential clients for our products and services, which could have a material adverse effect on our business, results of operations and financial condition. In addition, a growing portion of our revenue is derived from transaction processing fees, which depend heavily on levels of consumer and business spending. Deterioration in general economic conditions could reduce transaction volumes and the Company's related revenues.
Changes in the banking and credit union industry could reduce demand for our products . Cyclical fluctuations in economic conditions affect profitability and revenue growth at commercial banks and credit unions. Because our business is concentrated in financial institutions, unfavorable economic conditions negatively affect the spending of banks and credit unions, including spending on computer software and hardware. Such conditions could reduce both our sales to new customers and upgrade/complementary product sales to existing customers. The Company could also experience the loss of customers due to their acquisition or financial failure.
Competition or general economic conditions may result in decreased demand or require price reductions or other concessions to customers which could result in lower margins and reduce income. We vigorously compete with a variety of software vendors and service providers in all of our major product lines. We compete on the basis of product quality, reliability, performance, ease of use, quality of support and services, integration with other products and pricing. Some of our competitors may have advantages over us due to their size, product lines, greater marketing resources, or exclusive intellectual property rights. New competitors regularly appear with new products, services and technology for financial institutions. If competitors offer more favorable pricing, payment or other contractual terms, warranties, or functionality, or if general economic conditions decline such that customers are less willing or able to pay the cost of our products and services, we may need to lower prices or offer favorable terms in order to successfully compete.
The loss of key employees could adversely affect our business. We depend on the contributions and abilities of our senior management and other key employees. Our Company has grown significantly in recent years and our management remains concentrated in a small number of highly qualified individuals. We have recently completed a planned transition of Chief Executive Officer from Jack Prim to David Foss, a senior executive with long Company tenure. If we lose one or more of our key employees, we could suffer a loss of managerial experience, and management resources would have to be diverted from other activities to compensate for this loss. We do not have employment agreements with any of our executive officers.
The services we provide to our customers are subject to government regulation that could hinder the development of our business, increase costs, or impose constraints on the way we conduct our operations. The financial services industry is subject to extensive and complex federal and state regulation. As a supplier of services to financial institutions, portions of our operations are examined by the Office of the Comptroller of the Currency, the Federal Reserve Board, the Federal Deposit Insurance Corporation, and the National Credit Union Association, among other regulatory agencies. These agencies regulate services we provide and the manner in which we operate, and we are required to comply with a broad range of applicable laws and regulations.
14
In addition, existing laws, regulations, and policies could be amended or interpreted differently by regulators in a manner that imposes additional costs and has a negative impact on our existing operations or that limits our future growth or expansion. The Dodd-Frank Wall Street Reform and Consumer Protection Act, signed into law in 2010, significantly changed the regulation of the financial services industry, producing new regulatory agencies and voluminous new regulations, some of which are still being written. The Consumer Financial Protection Bureau was established, which is implementing numerous new regulations applicable to "supervised service providers" such as the Company. These new regulations may require additional programming or other costly changes in our processes or personnel. Our customers are also regulated entities, and actions by regulatory authorities could determine both the decisions they make concerning the purchase of data processing and other services and the timing and implementation of these decisions. Concerns are growing with respect to the use, confidentiality, and security of private customer information. Regulatory agencies, Congress and state legislatures are considering numerous regulatory and statutory proposals to protect the interests of consumers and to require compliance with standards and policies that have not been defined.
The software we provide to our customers is also affected by government regulation. We are generally obligated to our customers to provide software solutions that comply with applicable federal and state regulations. In particular, numerous new regulations have been proposed and are still being written to implement the Dodd-Frank Wall Street Reform and Consumer Protection Act of 2010. Substantial software research and development and other corporate resources have been and will continue to be applied to adapt our software products to this evolving, complex and often unpredictable regulatory environment. Our failure to provide compliant solutions could result in significant fines or consumer liability on our customers, for which we may bear ultimate liability.
Our failure to comply with regulations or to meet regulatory expectations could adversely affect our business and results of operations. While much of our operations are not directly subject to regulations applicable to financial institutions, as a provider of processing services to such institutions, we are examined on a regular basis by various regulatory authorities. If we fail to comply with applicable regulations or guidelines, we could be subject to regulatory actions or rating changes and suffer harm to our customer relationships and reputation. Such failures could require significant expenditures to correct and could negatively affect our ability to retain customers and obtain new customers.
Our failure to comply with the rules of the payment card networks could adversely affect our business. We are subject to card association and network rules governing Visa, MasterCard and similar organizations, including the Payment Card Data Security Standards. If we fail to comply with these rules we could be fined or our certifications could be suspended or terminated, which could limit our ability to service our customers and result in reductions in revenues and increased costs of operations.
If we fail to adapt our products and services to changes in technology and the markets we serve, we could lose existing customers and be unable to attract new business. The markets for our software and hardware products and services are characterized by changing customer and regulatory requirements and rapid technological changes. These factors and new product introductions by our existing competitors or by new market entrants could reduce the demand for our existing products and services and we may be required to develop or acquire new products and services. Our future success is dependent on our ability to enhance our existing products and services in a timely manner and to develop or acquire new products and services. If we are unable to develop or acquire new products and services as planned, or if we fail to sell our new or enhanced products and services, we may incur unanticipated expenses or fail to achieve anticipated revenues, as well as lose prospective sales.
Our growth may be affected if we are unable to find or complete suitable acquisitions. We have augmented the growth of our business with a number of acquisitions and we plan to continue to acquire appropriate businesses, products and services. This strategy depends on our ability to identify, negotiate and finance suitable acquisitions. Merger and acquisition activity in our industry has affected the availability and pricing of such acquisitions. If we are unable to acquire suitable acquisition candidates, we may experience slower growth.
If others claim that we have infringed their intellectual property rights, we could be liable for significant damages or could be required to change our processes. We have agreed to indemnify many of our customers against claims that our products and services infringe on the proprietary rights of others. Infringement claims have been and will in the future be asserted with regard to our software solutions and services. Such claims, whether with or without merit, are time-consuming, may result in costly litigation and may not be resolved on terms favorable to us. If our defense of such claims is not successful, we could be forced to pay damages or could be subject to injunctions that would cause us to cease making or selling certain applications or force us to redesign applications.
Consolidation and failures of financial institutions will continue to reduce the number of our customers and potential customers. Our primary market consists of approximately 6,100 commercial and savings banks and 6,300 credit unions. The number of commercial banks and credit unions has decreased because of failures and mergers and acquisitions and is expected to continue to decrease as more consolidation occurs.
15
Acquisitions may be costly and difficult to integrate. We have acquired a number of businesses in the past and will continue to explore acquisitions in the future. We may not be able to successfully integrate acquired companies. We may encounter problems with the integration of new businesses including: financial control and computer system compatibility; unanticipated costs; unanticipated quality or customer problems with acquired products or services; differing regulatory and industry standards; diversion of management's attention; adverse effects on existing business relationships with suppliers and customers; loss of key employees; and significant amortization expenses related to acquired assets. To finance future acquisitions, we may have to increase our borrowing or sell equity or debt securities to the public. If we fail to integrate our acquisitions, our business, financial condition and results of operations could be materially and adversely affected. Failed acquisitions could also produce material and unpredictable impairment charges as we periodically review our acquired assets.
We may not be able to manage growth. We have grown both internally and through acquisitions. Our expansion has and will continue to place significant demands on our administrative, operational, financial and management personnel and systems. We may not be able to enhance and expand our product lines, manage costs, adapt our infrastructure and modify our systems to accommodate future growth.
Expansion of services to non-traditional customers could expose us to new risks. We have expanded our services to business lines that are marketed outside our traditional, regulated, and litigation-averse base of financial institution customers. These non-regulated customers may entail greater operational, credit and litigation risks than we have faced before and could result in increases in bad debts and litigation costs.
Failure to achieve favorable renewals of service contracts could negatively affect our outsourcing business. Our contracts with our customers for outsourced data processing services generally run for a period of five or more years. We will continue to experience greater numbers of these contracts coming up for renewal each year. Renewal time presents our customers with the opportunity to consider other providers or to renegotiate their contracts with us. If we are not successful in achieving high renewal rates upon favorable terms, our outsourcing revenues and profit margins will suffer.
The impairment of a significant portion of our goodwill and intangible assets would adversely affect our results of operations. Our balance sheet includes goodwill and intangible assets that represent 38% of our total assets at June 30, 2016. On an annual basis, and whenever circumstances require, we review our intangible assets for impairment. If the carrying value of a material asset is determined to be impaired, it will be written down to fair value by a charge to operating earnings. An impairment of a significant portion of these intangible assets could have a material negative effect on our operating results.
ITEM 1B. UNRESOLVED STAFF COMMENTS
None.
ITEM 2. PROPERTIES
We own 154 acres located in Monett, Missouri on which we maintain nine office buildings, plus shipping & receiving and maintenance buildings. We also own buildings in Houston, Texas; Allen, Texas; Albuquerque, New Mexico; Birmingham, Alabama; Lenexa, Kansas; Angola, Indiana; Shawnee Mission, Kansas; Rogers, Arkansas; Oklahoma City, Oklahoma; Elizabethtown, Kentucky; Springfield, Missouri and San Diego, California. Our owned facilities represent approximately 1,000,000 square feet of office space in ten states. We have 37 leased office facilities in 21 states, which total approximately 655,000 square feet. All of our owned and leased office facilities are for normal business purposes.
Of our facilities, the credit union segment uses office space totaling approximately 193,000 square feet in twelve facilities. The majority of our San Diego, California offices are used in the credit union segment, as are portions of eleven other office facilities. The remainder of our leased and owned facilities, approximately 1,462,000 square feet of office space, is primarily devoted to serving our bank segment or supports our whole business.
We own four aircraft. Many of our customers are located in communities that do not have an easily accessible commercial airline service. We primarily use our airplanes in connection with implementation, sales of systems and internal requirements for day-to-day operations. Transportation costs for implementation and other customer services are billed to our customers. We lease property, including real estate and related facilities, at the Monett, Missouri municipal airport.
ITEM 3. LEGAL PROCEEDINGS
Information with respect to our legal proceedings may be found at "Litigation" in Note 6 to the Financial Statements in Item 8, which is incorporated herein by reference.
16
ITEM 4. MINE SAFETY DISCLOSURES
None.
17
Table of Contents
PART II
ITEM 5. MARKET FOR REGISTRANT'S COMMON EQUITY, RELATED STOCKHOLDER MATTERS AND ISSUER PURCHASES OF EQUITY SECURITIES
The Company's common stock is quoted on the NASDAQ Global Select Market ("NASDAQ"), formerly known as the NASDAQ National Market, under the symbol "JKHY". The following table sets forth, for the periods indicated, the high and low sales price per share of the common stock as reported by NASDAQ.
|
| Fiscal 2016 |
| Fiscal 2015 | ||||||||||||
|
| High |
| Low |
| High |
| Low | ||||||||
Fourth Quarter |
| $ | 87.27 | |
| $ | 80.44 | |
| $ | 70.25 | |
| $ | 60.10 | |
Third Quarter |
| 86.23 | |
| 73.19 | |
| 70.18 | |
| 60.60 | | ||||
Second Quarter |
| 79.92 | |
| 68.31 | |
| 63.85 | |
| 51.86 | | ||||
First Quarter |
| 71.75 | |
| 63.84 | |
| 60.84 | |
| 54.78 | | ||||
The Company established a practice of paying quarterly dividends at the end of fiscal 1990 and has paid dividends with respect to every quarter since that time. Quarterly dividends per share paid on the common stock for the two most recent fiscal years ended 2016 and 2015 are as follows:
|
| Fiscal 2016 |
| Fiscal 2015 | ||||
Fourth Quarter |
| $ | 0.280 | |
| $ | 0.250 | |
Third Quarter |
| 0.280 | |
| 0.250 | | ||
Second Quarter |
| 0.250 | |
| 0.220 | | ||
First Quarter |
| 0.250 | |
| 0.220 | | ||
The declaration and payment of any future dividends will continue to be at the discretion of our Board of Directors and will depend upon, among other factors, our earnings, capital requirements, contractual restrictions, and operating and financial condition. The Company does not currently foresee any changes in its dividend practices.
Information regarding the Company's equity compensation plans is set forth under the caption "Equity Compensation Plan Information" in the Company's definitive Proxy Statement and is incorporated herein by reference.
On August 24, 2016 , there were approximately 92,900 holders of the Company's common stock. On that same date the last sale price of the common shares as reported on NASDAQ was $87.82 per share.
Issuer Purchases of Equity Securities
The following shares of the Company were repurchased during the quarter ended June 30, 2016 :
| Total Number of Shares Purchased (1) |
| Average Price of Share |
| Total Number of Shares Purchased as Part of Publicly Announced Plans (1) |
| Maximum Number of Shares that May Yet Be Purchased Under the Plans (2) | ||||
April 1- April 30, 2016 | - | |
|
|
| - | |
| 6,028,499 | | |
May 1- May 31, 2016 | - | |
|
|
| - | |
| 6,028,499 | | |
June 1- June 30 2016 | 246,746 | |
| 83.36 | |
| 246,400 | |
| 5,782,099 | |
Total | 246,746 | |
| 83.36 | |
| 246,400 | |
| 5,782,099 | |
(1) 246,400 shares were purchased through a publicly announced repurchase plan. There were 346 shares surrendered to the Company to satisfy tax withholding obligations in connection with employee restricted stock awards.
(2) Total stock repurchase authorizations approved by the Company's Board of Directors as of February 17, 2015 were for 30.0 million shares. These authorizations have no specific dollar or share price targets and no expiration dates.
18
Table of Contents
Performance Graph
The following chart presents a comparison for the five-year period ended June 30, 2016 , of the market performance of the Company's common stock with the S&P 500 Index and an index of peer companies selected by the Company:
COMPARISON OF 5 YEAR CUMULATIVE TOTAL RETURN
Among Jack Henry & Associates, Inc., the S&P 500 Index, and a Peer Group
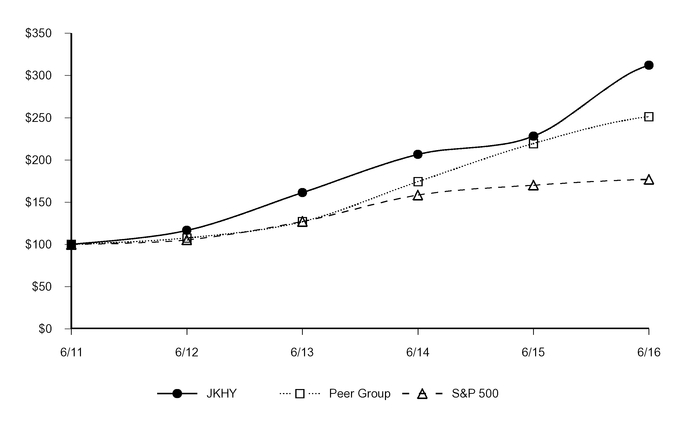
The following information depicts a line graph with the following values:
| 2011 | | 2012 | | 2013 | | 2014 | | 2015 | | 2016 | |
JKHY | 100.00 | | 116.62 | | 161.33 | | 206.53 | | 228.24 | | 312.11 | |
Peer Group | 100.00 | | 107.65 | | 126.89 | | 174.28 | | 219.46 | | 251.24 | |
S&P 500 | 100.00 | | 105.45 | | 127.17 | | 158.46 | | 170.22 | | 177.02 | |
This comparison assumes $100 was invested on June 30, 2011 , and assumes reinvestments of dividends. Total returns are calculated according to market capitalization of peer group members at the beginning of each period. Peer companies selected are in the business of providing specialized computer software, hardware and related services to financial institutions and other businesses.
Companies in the Peer Group are ACI Worldwide, Inc., Bottomline Technology, Inc., Broadridge Financial Solutions, Cardtronics, Inc., Convergys Corp., Corelogic, Inc., DST Systems, Inc., Euronet Worldwide, Inc., Fair Isaac Corp., Fidelity National Information Services, Inc., Fiserv, Inc., Global Payments, Inc., Moneygram International, Inc., SS&C Technologies Holdings, Inc., Total Systems Services, Inc., Tyler Technologies, Inc., Verifone Systems, Inc., and WEX, Inc..
Heartland Payment Systems, Inc. was removed from the peer group as it merged with Global Payments, Inc. in April 2016.
19
Table of Contents
ITEM 6. SELECTED FINANCIAL DATA
Selected Financial Data | ||||||||||||||||||||
(In Thousands, Except Per Share Data) | ||||||||||||||||||||
|
| YEAR ENDED JUNE 30, | ||||||||||||||||||
Income Statement Data |
| 2016 |
| 2015 |
| 2014 |
| 2013 |
| 2012 | ||||||||||
Revenue (1) |
| $ | 1,354,646 | |
| $ | 1,256,190 | |
| $ | 1,173,173 | |
| $ | 1,107,524 | |
| $ | 1,017,667 | |
Income from continuing operations |
| $ | 248,867 | |
| $ | 211,221 | |
| $ | 186,715 | |
| $ | 167,610 | |
| $ | 152,040 | |
Basic net income per share, continuing operations |
| $ | 3.13 | |
| $ | 2.60 | |
| $ | 2.20 | |
| $ | 1.95 | |
| $ | 1.76 | |
Diluted net income per share, continuing operations |
| $ | 3.12 | |
| $ | 2.59 | |
| $ | 2.19 | |
| $ | 1.94 | |
| $ | 1.74 | |
Dividends declared per share |
| $ | 1.06 | |
| $ | 0.94 | |
| $ | 0.84 | |
| $ | 0.56 | |
| $ | 0.44 | |
Balance Sheet Data |
|
|
|
|
|
|
|
|
|
| ||||||||||
Total deferred revenue |
| $ | 521,054 | |
| $ | 531,987 | |
| $ | 492,868 | |
| $ | 439,596 | |
| $ | 409,139 | |
Total assets |
| $ | 1,815,512 | |
| $ | 1,836,835 | |
| $ | 1,680,703 | |
| $ | 1,672,386 | |
| $ | 1,655,652 | |
Long-term debt |
| $ | - | |
| $ | 50,102 | |
| $ | 3,729 | |
| $ | 7,366 | |
| $ | 106,166 | |
Stockholders' equity |
| $ | 996,210 | |
| $ | 991,534 | |
| $ | 967,387 | |
| $ | 1,015,816 | |
| $ | 935,738 | |
(1) Revenue includes license sales, support and service revenues, and hardware sales, less returns and allowances.
ITEM 7. MANAGEMENT'S DISCUSSION AND ANALYSIS OF FINANCIAL CONDITION AND RESULTS OF OPERATIONS
The following section provides management's view of the financial condition and results of operations and should be read in conjunction with the Selected Financial Data, the audited Consolidated Financial Statements, and related notes included elsewhere in this report.
OVERVIEW
Jack Henry & Associates, Inc. (JHA) is headquartered in Monett, Missouri, employs approximately 6,000 associates nationwide, and is a leading provider of technology solutions and payment processing services primarily for financial services organizations. Its solutions serve over 10,500 customers and are marketed and supported through three primary brands. Jack Henry Banking® supports banks ranging from community banks to multi-billion dollar institutions with assets up to $30 billion , with information and transaction processing solutions. Symitar® is a leading provider of information and transaction processing solutions for credit unions of all sizes. ProfitStars® provides highly specialized products and services that enable financial institutions of every asset size and charter, and diverse corporate entities outside the financial services industry, to mitigate and control risks, optimize revenue and growth opportunities, and contain costs. JHA's integrated solutions are available for in-house, outsourced, or hosted delivery.
Each of our brands share the fundamental commitment to provide high quality business solutions, service levels that consistently exceed customer expectations, integration of solutions and practical new technologies. The quality of our solutions, our high service standards, and the fundamental way we do business typically foster long-term customer relationships, attract prospective customers, and have enabled us to capture substantial market share.
Through internal product development, disciplined acquisitions, and alliances with companies offering niche solutions that complement our proprietary solutions, we regularly introduce new products and services and generate new cross-sales opportunities across our three business brands. We provide compatible computer hardware for our in-house installations and secure processing environments for our outsourced and hosted solutions. We perform data conversions, software implementations, initial and ongoing customer training, and ongoing customer support services.
Our primary competitive advantage is customer service. Our support infrastructure and strict standards provide service levels we believe to be the highest in the markets we serve and generate high levels of customer satisfaction and retention. We consistently measure customer satisfaction using comprehensive annual surveys and randomly generated daily surveys we receive in our everyday business. Dedicated surveys are also used to grade specific aspects of our customer experience, including product implementation, education, and consulting services.
A significant proportion of our revenue is derived from recurring outsourcing fees and electronic payment transaction processing fees that predominantly have contract terms of five years or greater at inception. Support and service fees also include in-house maintenance fees which primarily contain annual contract terms, implementation services revenue, and bundled services revenue, which is a combination of license, implementation, and maintenance revenue
20
Table of Contents
from our revenue arrangements. Less predictable software license fees and hardware sales complement our primary revenue sources. We continually seek opportunities to increase revenue while at the same time containing costs to expand margins.
During the last five fiscal years, our revenues have grown from $1,017,667 in fiscal 2012 to $ 1,354,646 in fiscal 2016 . Income from continuing operations has grown from $152,040 in fiscal 2012 to $248,867 in fiscal 2016 . This growth has resulted primarily from internal expansion.
We have two reportable segments: bank systems and services and credit union systems and services. The respective segments include all related license, support and service, and hardware sales along with the related cost of sales.
We continue to focus on our objective of providing the best integrated solutions, products and customer service to our clients. We are cautiously optimistic regarding ongoing economic improvement and expect our clients to continue investing in our products and services to improve their operating efficiencies and performance. We anticipate that consolidation within the financial services industry will continue. Regulatory conditions and legislation such as the Dodd-Frank Wall Street Reform and Consumer Protection Act will continue to impact the financial services industry and could motivate some financial institutions to postpone discretionary spending.
A detailed discussion of the major components of the results of operations follows. All dollar and share amounts are in thousands and discussions compare fiscal 2016 to fiscal 2015 and compare fiscal 2015 to fiscal 2014 .
RESULTS OF OPERATIONS
FISCAL 2016 COMPARED TO FISCAL 2015
In fiscal 2016 , revenues increased 8% or $98,456 compared to the fiscal 2015 , with strong growth continuing in our support and service revenues, particularly our outsourcing services, bundled services, and electronic payment services. Cost of sales increased just 7% , contributing to an 8% increase in gross profit. Net operating expenses increased 1% , and the provision for income taxes increased 6% compared to the prior year. The increased revenue and above changes resulted in a combined 18% increase in net income for fiscal 2016 .
We move into fiscal 2017 following a strong performance in fiscal 2016 . Significant portions of our business continue to come from recurring revenue and our healthy sales pipeline is also encouraging. Our customers continue to face regulatory and operational challenges which our products and services address, and in these times they have an even greater need for our solutions that directly address institutional profitability, efficiency, and security. Our strong balance sheet, access to extensive lines of credit, the strength of our existing product line and an unwavering commitment to superior customer service position us well to address current and future opportunities.
A detailed discussion of the major components of the results of operations for the fiscal year ended June 30, 2016 follows. All dollar amounts are in thousands and discussions compare the current fiscal year ended June 30, 2016 to the prior fiscal year ended June 30, 2015 .
REVENUE
License Revenue | Year Ended June 30, |
| % Change | |||||||
| 2016 |
| 2015 |
|
| |||||
License | $ | 3,041 | |
| $ | 2,635 | |
| 15 | % |
Percentage of total revenue | <1% | |
| <1% | |
|
| | ||
License revenue represents the sale and delivery of application software systems contracted with us by the customer, which are not part of a bundled arrangement. We license our proprietary software products under standard license agreements that typically provide the customer with a non-exclusive, non-transferable right to use the software on a single computer and for a single financial institution.
Non-bundled license revenue increased due mainly to an increase in standalone license sales in our Banking segment. Such license fees will fluctuate as non-bundled license sales are sporadic in nature.
21
Table of Contents
Support and Service Revenue | Year Ended June 30, |
| % Change | |||||||
| 2016 |
| 2015 |
|
| |||||
Support and service | $ | 1,300,978 | |
| $ | 1,200,652 | |
| 8 | % |
Percentage of total revenue | 96 | % |
| 96 | % |
|
| |||
|
|
|
|
|
| |||||
| Year over Year |
|
| |||||||
| $ Change |
| % Change |
|
| |||||
In-House Support & Other Services | $ | 17,846 | |
| 6 | % |
|
| ||
Electronic Payment Services | 28,325 | |
| 6 | % |
|
| |||
Outsourcing Services | 33,941 | |
| 13 | % |
|
| |||
Implementation Services | (11,289 | ) |
| (15 | )% |
|
| |||
Bundled Products & Services | 31,503 | |
| 50 | % |
|
| |||
Total Increase | $ | 100,326 | |
|
|
|
| |||
Support and service revenues are generated from supporting our customers in operating their systems and to enhance and update the software, electronic payment services, outsourced data processing services, implementation services (including conversion, installation, configuration and training) and revenue from our bundled software multi-element agreements. There was growth in most support and service revenue components in fiscal 2016 .
In-house support and other services revenue increased due to annual maintenance renewal fee increases for both core and complementary products as our customers' assets grow and new customers began renewing their annual maintenance. Increased software usage revenue from Alogent mobile remote deposits also contributed to the increase.
Electronic payment services continued to show growth over the prior year, although that growth slowed due to some of our large customers being acquired and price compression on contract renewals in our card services offerings. The revenue increases are mainly attributable to strong performance across debit/credit card transaction processing services, online bill payment services and ACH processing. Deconversion revenue for electronic payment services increased $9,617 over the prior year. Excluding these fees, we had a 4% increase in electronic payment services revenue.
Outsourcing services for banks and credit unions continue to drive revenue growth as customers continue to show a preference for outsourced delivery of our solutions. Revenues from outsourcing services are typically earned under multi-year service contracts and therefore provide a long-term stream of recurring revenues. We expect the trend towards outsourced product delivery to benefit outsourcing services revenue for the foreseeable future.
Implementation services include implementation services for our electronic payment services customers as well as standalone customization services, merger conversion services, image conversion services and network monitoring services. Implementation services revenue decreased due to a decrease in stand-alone implementations in the banking segment. Revenue from these standalone services has decreased as implementation services related to our bundled arrangements have increased.
Bundled products and services revenue is combined revenue from the multiple elements in our bundled arrangements, including license, implementation services and maintenance, which cannot be recognized separately due to a lack of vendor-specific objective evidence of fair value. Bundled products and services revenue increased over last year mainly due to increased revenues from our core and complementary credit union arrangements. $26,567 of the increase was due to terminations of minor pending products and services on certain contracts that have allowed for the release of revenue that was being deferred until contract completion in both our credit union and banking core and complementary arrangements.
Hardware Revenue | Year Ended June 30, |
| % Change | |||||||
| 2016 |
| 2015 |
|
| |||||
Hardware | $ | 50,627 | |
| $ | 52,903 | |
| (4 | )% |
Percentage of total revenue | 4 | % |
| 4 | % |
|
| |||
The Company has entered into remarketing agreements with several hardware manufacturers and suppliers under which we sell computer hardware, hardware maintenance and related services to our customers. Revenue related to hardware sales is recognized when the hardware is shipped to our customers.
22
Table of Contents
Hardware revenue decreased due to a decrease in complementary hardware products delivered. Although there will be quarterly fluctuations, we expect an overall decreasing trend in hardware sales to continue due to the change in sales mix towards outsourcing contracts, which typically do not include hardware, and the general deflationary trend of computer prices.
COST OF SALES AND GROSS PROFIT
Cost of license represented the cost of software from third party vendors associated with non-bundled application software licenses. These costs were recognized when license revenue was recognized.
Cost of support and service represented costs associated with conversion and implementation efforts, ongoing support for our customers, operation of our data and item centers providing services for our outsourced customers, electronic payment services and direct operating costs. These costs were recognized as they were incurred or, for direct costs associated with obtaining and implementing our bundled arrangements, they were deferred and recognized ratably as the related revenues for these arrangements are recognized, typically beginning when Post Contract Support ("PCS") is the only remaining undelivered element, and ending at the end of the initial bundled PCS term.
Cost of hardware consisted of the direct and indirect costs of purchasing the equipment from the manufacturers and delivery to our customers. These costs were recognized at the same time as the related hardware revenue was recognized. Ongoing operating costs to provide support to our customers were recognized as they were incurred.
| Year Ended June 30, |
| % Change | |||||||
| 2016 |
| 2015 |
|
| |||||
Cost of License | $ | 1,197 | |
| $ | 1,187 | |
| 1 | % |
Percentage of total revenue | <1% | |
| <1% | |
|
| |||
License Gross Profit | $ | 1,844 | |
| $ | 1,448 | |
| 27 | % |
Gross Profit Margin | 61 | % |
| 55 | % |
|
| |||
Cost of support and service | $ | 737,108 | |
| $ | 680,750 | |
| 8 | % |
Percentage of total revenue | 54 | % |
| 54 | % |
|
| |||
Support and Service Gross Profit | $ | 563,870 | |
| $ | 519,902 | |
| 8 | % |
Gross Profit Margin | 43 | % |
| 43 | % |
|
| |||
Cost of hardware | $ | 35,346 | |
| $ | 38,399 | |
| (8 | )% |
Percentage of total revenue | 3 | % |
| 3 | % |
|
| |||
Hardware Gross Profit | $ | 15,281 | |
| $ | 14,504 | |
| 5 | % |
Gross Profit Margin | 30 | % |
| 27 | % |
|
| |||
TOTAL COST OF SALES | $ | 773,651 | |
| $ | 720,336 | |
| 7 | % |
Percentage of total revenue | 57 | % |
| 57 | % |
|
| |||
TOTAL GROSS PROFIT | $ | 580,995 | |
| $ | 535,854 | |
| 8 | % |
Gross Profit Margin | 43 | % |
| 43 | % |
|
| |||
Cost of license consists of the direct costs of third party software that are a part of a non-bundled arrangement. Sales of these third party software products increased slightly compared to the last year. Shifts in sales mix between the products that make up these costs cause fluctuations in the margins from period to period.
Gross profit margins in support and service remained consistent with the prior year.
In general, changes in cost of hardware trend consistently with hardware revenue. For the current period, margins were slightly higher due to increased sales of higher margin hardware upgrade products compared to the prior year.
23
Table of Contents
OPERATING EXPENSES
Selling and Marketing | Year Ended June 30, |
| % | |||||||
| 2016 |
| 2015 |
|
| |||||
Selling and marketing | $ | 90,079 | |
| $ | 89,004 | |
| 1 | % |
Percentage of total revenue | 7 | % |
| 7 | % |
|
| |||
Dedicated sales forces, inside sales teams, technical sales support teams and channel partners conduct our sales efforts for our two reportable segments, and are overseen by regional and national sales managers. Our sales executives are responsible for pursuing lead generation activities for new core customers. Our account executives nurture long-term relationships with our client base and cross sell our many complementary products and services.
Selling and marketing expenses increased slightly compared to fiscal 2015 due to increased salary expense, but remained a consistent percentage of total revenue in both periods.
Research and Development | Year Ended June 30, |
| % | |||||||
| 2016 |
| 2015 |
|
| |||||
Research and development | $ | 81,234 | |
| $ | 71,495 | |
| 14 | % |
Percentage of total revenue | 6 | % |
| 6 | % |
|
| |||
We devote significant effort and expense to develop new software, service products and continually upgrade and enhance our existing offerings. We believe our research and development efforts are highly efficient because of the extensive experience of our research and development staff and because our product development is highly customer-driven.
Research and development expenses increased primarily due to increased headcount and related personnel costs, but were consistent with the prior year as a percentage of total revenue.
General and Administrative | Year Ended June 30, |
| % | |||||||
| 2016 |
| 2015 |
|
| |||||
General and administrative | $ | 67,514 | |
| $ | 64,364 | |
| 5 | % |
Percentage of total revenue | 5 | % |
| 5 | % |
|
| |||
General and administrative costs included all expenses related to finance, legal, and human resources, plus all administrative costs. These expenses increased primarily due to increased headcount and related salaries, but were a consistent percentage of revenue in each year.
Gain on Disposal of Business
In fiscal 2016 , we sold our Alogent business ("Alogent") to Antelope Acquisition Co., an affiliate of Battery Ventures, resulting in a gain totaling $19,491 . In fiscal 2015 , we had a gain totaling $6,874 due to the sale of the TeleWeb™ suite of Internet and mobile banking software products to Data Center Inc. (DCI).
INTEREST INCOME AND EXPENSE | Year Ended June 30, |
| % Change | |||||||
| 2016 |
| 2015 |
|
| |||||
Interest Income | $ | 307 | |
| $ | 169 | |
| 82 | % |
Interest Expense | $ | (1,430 | ) |
| $ | (1,594 | ) |
| (10 | )% |
Interest income fluctuated due to changes in invested balances and yields on invested balances. Interest expense remained low for both the current and prior years, in line with our debt balances in both years.
24
Table of Contents
PROVISION FOR INCOME TAXES | Year Ended June 30, |
| % | |||||||
| 2016 |
| 2015 |
|
| |||||
Provision For Income Taxes | $ | 111,669 | |
| $ | 105,219 | |
| 6 | % |
Effective Rate | 31.0 | % |
| 33.3 | % |
|
| |||
The decrease in the effective tax rate was primarily due a significant difference in the book versus tax basis in Alogent stock, as well as the retroactive permanent extension of the Research and Experimentation Credit ("R&E Credit") to January 1, 2015 during fiscal 2016 .
NET INCOME
Net income increased from $211,221 , or $2.59 per diluted share, in fiscal 2015 to $248,867 , or $3.12 per diluted share, in fiscal 2016 . This translates to an increase of 18% in net income.
FISCAL 2015 COMPARED TO FISCAL 2014
In fiscal 2015 , revenues increased 7% or $83,017 compared to the prior year due primarily to growth in all components of support and service revenues, particularly our electronic payment services and our outsourcing services. Cost of sales increased 6% , in line with revenue. The growth in revenue and the Company's continued focus on cost management continued to drive up gross margins, which has resulted in a 9% increase in gross profit.
Operating expenses increased 6% and the provision for income taxes increased 4% compared to the prior year-to-date period. The increased revenue and above changes resulted in a combined 13% increase in net income for fiscal 2015 .
REVENUE
License Revenue | Year Ended |
| % | |||||||
| June 30, |
| Change | |||||||
| 2015 |
| 2014 |
|
| |||||
License | $ | 2,635 | |
| $ | 2,184 | |
| 21 | % |
Percentage of total revenue | <1% | |
| <1% | |
|
| |||
License revenue represents the sale and delivery of application software systems contracted with us by the customer, which are not part of a bundled arrangement. We license our proprietary software products under standard license agreements that typically provide the customer with a non-exclusive, non-transferable right to use the software on a single computer and for a single financial institution.
Non-bundled license revenue increased due mainly to an increase in standalone license sales in our Credit Union segment. Such license fees will fluctuate as non-bundled license sales are sporadic in nature.
Support and Service Revenue | Year Ended |
| % | |||||||
| June 30, |
| Change | |||||||
| 2015 |
| 2014 |
|
| |||||
Support and service | $ | 1,200,652 | |
| $ | 1,112,331 | |
| 8 | % |
Percentage of total revenue | 96 | % |
| 95 | % |
|
| |||
| Year over Year Change |
|
| |||||
| $ Change |
| % Change |
|
| |||
In-House Support & Other Services | $ | 3,603 | |
| 1 | % |
|
|
Electronic Payment Services | 38,321 | |
| 9 | % |
|
| |
Outsourcing Services | 35,490 | |
| 15 | % |
|
| |
Implementation Services | 8,704 | |
| 13 | % |
|
| |
Bundled Products & Services | 2,203 | |
| 4 | % |
|
| |
Total Increase | $ | 88,321 | |
|
|
|
| |
25
Table of Contents
Support and service revenues are generated from annual support to assist the customer in operating their systems and to enhance and update the software, electronic payment services, outsourced data processing services, implementation services (including conversion, installation, configuration and training) and revenue from our bundled software multi-element agreements. There was growth in all components of support and service revenue in fiscal 2015.
In-house support and other services revenue increased due to annual maintenance renewal fee increases for both core and complementary products as our customers' assets grow.
Electronic payment services continue to experience the largest dollar growth. The revenue increases are attributable to strong performance across debit/credit card transaction processing services, online bill payment services and ACH processing.
Outsourcing services for banks and credit unions continue to drive revenue growth as customers continue to show a preference for outsourced delivery of our solutions. We expect the trend towards outsourced product delivery to benefit outsourcing services revenue for the foreseeable future. Revenues from outsourcing services are typically earned under multi-year service contracts and therefore provide a long-term stream of recurring revenues.
Implementation services include implementation services for our outsourcing and electronic payment services customers as well as standalone customization services, merger conversion services, image conversion services and network monitoring services. Implementation services revenue increased due mainly to increased implementations across our core, online banking, imaging solutions and payments products.
Bundled products and services revenue is combined revenue from the multiple elements in our bundled arrangements, including license, implementation services and maintenance, which cannot be recognized separately due to a lack of vendor-specific objective evidence of fair value. Bundled products and services revenue increased slightly from last year mainly due to increased revenues from our core and complementary banking products, furthered by an increase in core credit union products. The increase was partially offset by reduced revenues from our Alogent suite of remote deposit capture products.
Hardware Revenue | Year Ended |
| % | |||||||
| June 30, |
| Change | |||||||
| 2015 |
| 2014 |
|
| |||||
Hardware | $ | 52,903 | |
| $ | 58,658 | |
| (10 | )% |
Percentage of total revenue | 4 | % |
| 5 | % |
|
| |||
The Company has entered into remarketing agreements with several hardware manufacturers under which we sell computer hardware, hardware maintenance and related services to our customers. Revenue related to hardware sales is recognized when the hardware is shipped to our customers.
Hardware revenue decreased due to a decrease in complementary hardware products delivered. Although there will be quarterly fluctuations, we expect an overall decreasing trend in hardware sales to continue due to the change in sales mix towards outsourcing contracts, which typically do not include hardware, and the general deflationary trend of computer prices.
COST OF SALES AND GROSS PROFIT
Cost of license represented the cost of software from third party vendors through remarketing agreements associated with non-bundled application software licenses. These costs were recognized when license revenue was recognized. Cost of support and service represented costs associated with conversion and implementation efforts, ongoing support for our in-house customers, operation of our data and item centers providing services for our outsourced customers, electronic payment services and direct operating costs. These costs were recognized as they were incurred or, for direct costs associated with obtaining and implementing our bundled arrangements, they are deferred and recognized ratably as the related revenues for these arrangements are recognized, typically beginning when PCS is the only remaining undelivered element, and ending at the end of the initial bundled PCS term. Cost of hardware consisted of the direct and indirect costs of purchasing the equipment from the manufacturers and delivery to our customers. These costs were recognized at the same time as the related hardware revenue was recognized. Ongoing operating costs to provide support to our customers were recognized as they were incurred.
26
Table of Contents
| Year Ended |
| % | |||||||
| June 30, |
| Change | |||||||
| 2015 |
| 2014 |
|
| |||||
|
|
|
|
|
| |||||
Cost of License | $ | 1,187 | |
| $ | 908 | |
| 31 | % |
Percentage of total revenue | <1% | |
| <1% | |
|
| |||
License Gross Profit | $ | 1,448 | |
| $ | 1,276 | |
| 13 | % |
Gross Profit Margin | 55 | % |
| 58 | % |
|
| |||
Cost of support and service | $ | 680,750 | |
| $ | 634,756 | |
| 7 | % |
Percentage of total revenue | 54 | % |
| 54 | % |
|
| |||
Support and Service Gross Profit | $ | 519,902 | |
| $ | 477,575 | |
| 9 | % |
Gross Profit Margin | 43 | % |
| 43 | % |
|
| |||
Cost of hardware | $ | 38,399 | |
| $ | 43,708 | |
| (12 | )% |
Percentage of total revenue | 3 | % |
| 4 | % |
|
| |||
Hardware Gross Profit | $ | 14,504 | |
| $ | 14,950 | |
| (3 | )% |
Gross Profit Margin | 27 | % |
| 25 | % |
|
| |||
TOTAL COST OF SALES | $ | 720,336 | |
| $ | 679,372 | |
| 6 | % |
Percentage of total revenue | 57 | % |
| 58 | % |
|
| |||
TOTAL GROSS PROFIT | $ | 535,854 | |
| $ | 493,801 | |
| 9 | % |
Gross Profit Margin | 43 | % |
| 42 | % |
|
| |||
Cost of license consisted of the direct costs of third party software that was part of a non-bundled arrangement. Sales of these third party software products increased compared to last year, causing a decrease in gross profit margins. Shifts in sales mix between the products that make up these costs cause fluctuations in the margins from period to period.
Gross profit margins in support and service remained consistent with the prior year.
In general, changes in cost of hardware trended consistently with hardware revenue. For the fiscal year, margins were slightly higher due to increased sales of higher margin hardware upgrade products.
OPERATING EXPENSES
Selling and Marketing | Year Ended |
| % | |||||||
| June 30, |
| Change | |||||||
| 2015 |
| 2014 |
|
| |||||
Selling and marketing | $ | 89,004 | |
| $ | 85,443 | |
| 4 | % |
Percentage of total revenue | 7 | % |
| 7 | % |
|
| |||
Dedicated sales forces, inside sales teams, technical sales support teams and channel partners conducted our sales efforts for our two reportable segments, and were overseen by regional sales managers. Our sales executives were responsible for pursuing lead generation activities for new core customers. Our account executives nurtured long-term relationships with our client base and cross sold our many complementary products and services.
Selling and marketing expenses for the year increased mainly due to higher commission expenses and a general increase in sales headcount and related personnel salaries. This is in line with increased sales volume of long term service contracts on which commissions were paid as a percentage of total revenue.
Research and Development | Year Ended |
| % | |||||||
| June 30, |
| Change | |||||||
| 2015 |
| 2014 |
|
| |||||
Research and development | $ | 71,495 | |
| $ | 66,748 | |
| 7 | % |
Percentage of total revenue | 6 | % |
| 6 | % |
|
| |||
27
Table of Contents
We devote significant effort and expense to develop new software, service products and continually upgrade and enhance our existing offerings. Typically, we upgrade our various core and complementary software applications once per year. We believe our research and development efforts are highly efficient because of the extensive experience of our research and development staff and because our product development is highly customer-driven.
Research and development expenses increased primarily due to increased headcount and related personnel costs, but were consistent with the prior year as a percentage of total revenue.
General and Administrative | Year Ended |
| % | |||||||
| June 30, |
| Change | |||||||
| 2015 |
| 2014 |
|
| |||||
General and administrative | $ | 64,364 | |
| $ | 53,312 | |
| 21 | % |
Percentage of total revenue | 5 | % |
| 5 | % |
|
| |||
General and administrative costs included all expenses related to finance, legal, human resources, plus all administrative costs.
General and administrative expenses in the current year were higher due to the impact of a Lyndhurst related insurance recovery in the prior year coupled with increased headcount and related personnel costs. These costs were consistent with the prior year as a percentage of total revenue.
Gain on Disposal of Business
In fiscal 2015 , we had a gain totaling $6,874 due to the sale of the TeleWeb™ suite of Internet and mobile banking software products to Data Center Inc. (DCI). No businesses were disposed of in fiscal 2014 .
INTEREST INCOME AND EXPENSE | Year Ended |
| % | |||||||
| June 30, |
| Change | |||||||
| 2015 |
| 2014 |
|
| |||||
Interest Income | $ | 169 | |
| $ | 377 | |
| (55 | )% |
Interest Expense | $ | (1,594 | ) |
| $ | (1,105 | ) |
| 44 | % |
Interest income fluctuated due to changes in invested balances and yields on invested balances. Interest expense increased due to interest on the borrowing from our revolving credit facility in the second quarter.
PROVISION FOR INCOME TAXES | Year Ended June 30, |
| % | |||||||
| 2015 |
| 2014 |
|
| |||||
Provision For Income Taxes | $ | 105,219 | |
| $ | 100,855 | |
| 4 | % |
Effective Rate | 33.3 | % |
| 35.1 | % |
|
| |||
The decrease in the effective tax rate was primarily due to favorable state tax law changes, as well as the retroactive extension of the Research & Experimentation Credit for the period January 1, 2014 to December 31, 2014 during fiscal 2015.
NET INCOME
Net income increased from $186,715 , or $2.19 per diluted share in fiscal 2014 to $211,221 or $2.59 per diluted share in fiscal 2015 .
REPORTABLE SEGMENT DISCUSSION
The Company is a provider of integrated computer systems that perform data processing (available for in-house installations or outsourced services) for banks and credit unions. The Company's operations are classified into two reportable segments: bank systems and services ("Bank") and credit union systems and services ("Credit Union"). The Company evaluates the performance of its segments and allocates resources to them based on various factors, including prospects for growth, return on investment, and return on revenue.
28
Table of Contents
Bank Systems and Services |
|
|
|
|
|
|
|
|
| ||||||||
| 2016 |
| % Change |
| 2015 |
| % Change |
| 2014 | ||||||||
Revenue | $ | 996,668 | |
| 4 | % |
| $ | 962,729 | |
| 7 | % |
| $ | 897,671 | |
Gross profit | $ | 407,600 | |
| 2 | % |
| $ | 400,659 | |
| 8 | % |
| $ | 372,473 | |
Gross profit margin | 41 | % |
|
|
| 42 | % |
|
|
| 41 | % | |||||
In fiscal 2016 , revenue in the Bank segment increased 4% compared to the prior fiscal year. The increase was due mainly to a 12% increase in outsourcing services. Gross profit margin decreased only slightly compared to the last fiscal year.
In fiscal 2015 , revenue increased 7% overall in the Bank segment compared to the prior year. The increase was due mainly to 9% growth in electronic transaction processing services and a 14% increase in outsourcing services. Gross profit margins increased 1% over fiscal 2014 .
Credit Union Systems and Services |
|
|
|
|
|
|
|
|
| ||||||||
| 2016 |
| % Change |
| 2015 |
| % Change |
| 2014 | ||||||||
Revenue | $ | 357,978 | |
| 22 | % |
| $ | 293,461 | |
| 7 | % |
| $ | 275,502 | |
Gross profit | $ | 173,395 | |
| 28 | % |
| $ | 135,195 | |
| 11 | % |
| $ | 121,328 | |
Gross profit margin | 48 | % |
|
|
| 46 | % |
|
|
| 44 | % | |||||
In fiscal 2016 , revenue in the Credit Union segment increased 22% due to increases in support & service revenue. Support & service revenues grew 22% through increases in electronic payment services, in-house maintenance renewals, and bundled services. Gross profit margins for the Credit Union segment increased 2% mainly due to economies of scale realized from growing transaction volume in our payment processing services.
In fiscal 2015 , revenue in the Credit Union segment increased 7% due to increases in support & service revenue. Support & service revenues grew 7% through increases in electronic payment services, in-house maintenance renewals, and outsourcing services. Gross profit margins for the Credit Union segment increased mainly due economies of scale realized from growing transaction volume in our payment processing services.
LIQUIDITY AND CAPITAL RESOURCES
The Company's cash and cash equivalents decreased to $70,310 at June 30, 2016 from $148,313 at June 30, 2015 . The decrease from June 30, 2015 is primarily due to repayments on our revolving credit facility and repurchases of treasury stock during fiscal 2016, partially offset by increased net income and proceeds from the disposal of a business.
The following table summarizes net cash from operating activities in the statement of cash flows:
| Year Ended | ||||||
| June 30, | ||||||
| 2016 |
| 2015 | ||||
Net income | $ | 248,867 | |
| $ | 211,221 | |
Non-cash expenses | 159,698 | |
| 149,162 | | ||
Change in receivables | (13,735 | ) |
| (21,346 | ) | ||
Change in deferred revenue | 4,364 | |
| 40,565 | | ||
Change in other assets and liabilities | (34,078 | ) |
| (5,812 | ) | ||
Net cash provided by operating activities | $ | 365,116 | |
| $ | 373,790 | |
Cash provided by operating activities decreased 2% compared to this fiscal 2015 due mainly to increased income tax payments. Cash from operations is primarily used to repay debt, pay dividends, repurchase stock, and for capital expenditures.
Cash used in investing activities for fiscal 2016 totaled $135,963 and included: capital expenditures on facilities and equipment of $56,325 , which was mainly for the purchase of computer equipment and aircraft; $96,411 for the ongoing enhancements and development of existing and new product offerings; $8,275 for the acquisition of Bayside Business Solutions, net of cash acquired; and $11,826 for the purchase and development of internal use software. This was
29
Table of Contents
partially offset by $34,030 of proceeds from the sale of our Alogent division and $2,844 of proceeds from the sale of assets. Cash used in investing activities for fiscal 2015 totaled $136,984 and included capital expenditures on facilities and equipment of $54,409 , which mainly included the purchase of aircraft and computer equipment, $76,872 for the development of software, and $14,020 for the purchase and development of internal use software. These expenditures were partially offset by $8,135 of proceeds related to the TeleWeb™ suite of Internet and mobile banking software products and $182 of proceeds from the sale of assets.
Financing activities used cash of $307,156 for fiscal 2016 . Cash used was $175,662 for the purchase of treasury shares, repayment of the revolving credit facility and capital leases of $152,500 , and dividends paid to stockholders of $84,118 . This was partially offset by borrowings of $100,000 against our revolving credit facility and $5,124 net cash inflow from the issuance of stock and tax related to stock-based compensation. Financing activities used cash in fiscal 2015 of $158,870 . Cash used was $122,691 for the purchase of treasury shares, dividends paid to stockholders of $76,410 , repayments of the revolving credit facility and capital leases totaling $50,783 , and debt acquisition cost of $901 . This was partially offset by borrowings of $90,000 and $1,915 net cash inflow from the issuance of stock and tax related to stock-based compensation.
At June 30, 2016 , the Company had negative working capital of $11,803 however, the largest component of current liabilities was deferred revenue of $343,525 , which primarily relates to our annual in-house maintenance agreements and deferred bundled product and service arrangements. The cash outlay necessary to provide the services related to these deferred revenues is significantly less than this recorded balance. In addition, we have not experienced any significant issues with our current collection efforts and we have access to remaining lines of credit in excess of $300,000 . We continue to generate substantial cash inflows from operations. Therefore, we do not anticipate any liquidity problems arising from this condition.
Capital Requirements and Resources
The Company generally uses existing resources and funds generated from operations to meet its capital requirements. Capital expenditures totaling $56,325 and $54,409 for the twelve months ending June 30, 2016 and June 30, 2015 , respectively, were made primarily for additional equipment and the improvement of existing facilities. These additions were funded from cash generated by operations. At June 30, 2016 , the Company had $16,058 of purchase commitments related to property and equipment, all of which we anticipate will be funded from cash generated by operations.
The Board of Directors has authorized the Company to repurchase shares of its common stock. Under this authorization, the Company may finance its share repurchases with available cash reserves or short-term borrowings on its existing credit facilities. The share repurchase program does not include specific price targets or timetables and may be suspended at any time. At June 30, 2016 , there were 24,209 shares in treasury stock and the Company had the remaining authority to repurchase up to 5,782 additional shares. The total cost of treasury shares at June 30, 2016 is $876,134 . During fiscal 2016 , the Company repurchased 2,366 treasury shares for $175,662 . At June 30, 2015 , there were 21,843 shares in treasury stock and the Company had authority to repurchase up to 8,148 additional shares.
Capital leases
The Company has entered into various capital lease obligations for the use of certain computer equipment. The Company currently has short term capital lease obligations totaling $200 at June 30, 2016 . Included in property and equipment are assets under capital leases totaling $2,329 , which have accumulated depreciation totaling $898 .
Revolving credit facility
The revolving credit facility allows for borrowings of up to $300,000 , which may be increased by the Company at any time until maturity to $600,000 . The credit facility bears interest at a variable rate equal to (a) a rate based on LIBOR or (b) an alternate base rate (the highest of (i) the Prime Rate for such day, (ii) the sum of the Federal Funds Effective Rate for such day plus 0.50% and (iii) the Eurocurrency Rate for a one month Interest Period on such day for dollars plus 1.0% ), plus an applicable percentage in each case determined by the Company's leverage ratio. The credit facility is guaranteed by certain subsidiaries of the Company. The credit facility is subject to various financial covenants that require the Company to maintain certain financial ratios as defined in the agreement. As of June 30, 2016 , the Company was in compliance with all such covenants. The revolving loan terminates February 20, 2020 and at June 30, 2016 there was no outstanding balance.
Other lines of credit
The Company renewed an unsecured bank credit line on March 3, 2014 which provides for funding of up to $5,000 and bears interest at the prime rate less 1% . The credit line was renewed through April 30, 2017 . At June 30, 2016 , no amount was outstanding.
30
OFF BALANCE SHEET ARRANGEMENTS AND CONTRACTUAL OBLIGATIONS
At June 30, 2016 , the Company's total off balance sheet contractual obligations were $65,432 . This balance consists of $49,374 of long-term operating leases for various facilities and equipment which expire from 2017 to 2030 and $16,058 of purchase commitments related mainly to open purchase orders. The contractual obligations table below excludes $8,390 of liabilities for uncertain tax positions as we are unable to reasonably estimate the ultimate amount or timing of settlement.
Contractual obligations by period as of June 30, 2016 |
| Less than 1 year |
| 1-3 years |
| 3-5 years |
| More than 5 years |
| TOTAL | | |||||||||
Operating lease obligations |
| $ | 9,515 | |
| $ | 14,486 | |
| $ | 8,452 | |
| $ | 16,921 | |
| $ | 49,374 | |
Capital lease obligations |
| 200 | |
| - | |
| - | |
| - | |
| 200 | | |||||
Purchase obligations |
| 16,058 | |
| - | |
| - | |
| - | |
| 16,058 | | |||||
Total |
| $ | 25,773 | |
| $ | 14,486 | |
| $ | 8,452 | |
| $ | 16,921 | |
| $ | 65,632 | |
RECENT ACCOUNTING PRONOUNCEMENTS
The Financial Accounting Standards Board ("FASB") issued Accounting Standards Update ("ASU") No. 2014-09, Revenue from Contracts with Customers in May 2014. The new standard will supersede much of the existing authoritative literature for revenue recognition. In August 2015, the FASB also issued ASU No. 2015-14 which deferred the effective date of the new standard by one year. The standard and related amendments will be effective for the Company for its annual reporting period beginning July 1, 2018, including interim periods within that reporting period. Along with the deferral of the effective date, ASU No. 2015-14 allows early application as of the original effective date. Entities are allowed to transition to the new standard by either recasting prior periods or recognizing the cumulative effect as of the beginning of the period of adoption. In March 2016, the FASB issued ASU No. 2016-08, which addresses principal versus agent considerations under the new revenue standard. ASU No. 2016-10 and ASU No. 2016-12 issued in April and May 2016 also address specific aspects of the new standard. The Company is currently evaluating the newly issued guidance, including which transition approach will be applied and the estimated impact it will have on our consolidated financial statements.
In April 2015, the FASB issued ASU No. 2015-03, Interest-Imputation of Interest (Subtopic 835-30): Simplifying the Presentation of Debt Issuance Costs. This ASU requires that debt issuance costs be presented in the balance sheet as a direct deduction from the carrying amount of the related debt liability (same treatment as debt discounts). ASU No. 2015-03 will be effective for the Company in its fiscal year ended June 30, 2017. Early adoption is permitted provided that the guidance is applied from the beginning of the fiscal year of adoption. The Company currently classifies debt issuance costs as an asset, and will adopt these changes beginning July 1, 2016.
ASU No. 2015-17 was issued by the FASB in November 2015 as part of the Simplification Initiative. This ASU eliminates the requirement to separate deferred income tax liabilities and assets into non-current and current amounts. ASU No. 2015-17 is effective for the Company for its annual reporting period beginning July 1, 2017 and early adoption is permitted. In the third quarter of fiscal 2016, management elected to early adopt and all deferred income tax assets and liabilities are reported as non-current. At March 31, 2016, the current portion of our deferred income tax liability was $7,034 . Prior periods were not retrospectively adjusted.
The FASB issued ASU No. 2016-02, Leases, in February 2016. This ASU aims to increase transparency and comparability among organizations by recognizing lease assets and liabilities on the balance sheet and requiring disclosure of key information regarding leasing arrangements. ASU No. 2016-02 will be effective for Jack Henry's annual reporting period beginning July 1, 2019 and early adoption is permitted. The Company is currently assessing the impact this new standard will have on our consolidated financial statements.
The FASB issued Accounting Standards Update ("ASU") No. 2016-09, Improvements to Employee Share-Based Payment Accounting in March 2016. The new standard will simplify several aspects of the accounting for share-based payment transactions, including reporting of excess tax benefits and shortfalls, application of forfeiture rates, statutory minimum withholding considerations, and classification within the statement of cash flows. ASU No. 2016-09 is effective for the Company's annual reporting period beginning July 1, 2017 and early adoption is permitted. The Company is currently evaluating the newly issued guidance, including the estimated impact it will have on our consolidated financial statements. The Company currently anticipates the changes will be adopted in the first quarter of the annual reporting period beginning July 1, 2016.
31
Table of Contents
CRITICAL ACCOUNTING POLICIES
We prepare our consolidated financial statements in accordance with accounting principles generally accepted in the United States ("U.S. GAAP"). The significant accounting policies are discussed in Note 1 to the consolidated financial statements. The preparation of consolidated financial statements in accordance with U.S. GAAP requires us to make estimates and judgments that affect the reported amounts of assets, liabilities, revenue and expenses, as well as disclosure of contingent assets and liabilities. We base our estimates and judgments upon historical experience and other factors believed to be reasonable under the circumstances. Changes in estimates or assumptions could result in a material adjustment to the consolidated financial statements.
We have identified several critical accounting estimates. An accounting estimate is considered critical if both: (a) the nature of the estimates or assumptions is material due to the levels of subjectivity and judgment involved, and (b) the impact of changes in the estimates and assumptions would have a material effect on the consolidated financial statements.
Revenue Recognition
We recognize revenue net of any applicable discounts in accordance with generally accepted accounting principles and with guidance provided within Staff Accounting Bulletins issued by the Securities and Exchange Commission. The application of these pronouncements requires judgment, including whether a software arrangement includes multiple elements, whether any elements are essential to the functionality of any other elements, and whether vendor-specific objective evidence ("VSOE") of fair value exists for those elements. Customers receive certain elements of our products and services over time. Changes to the elements in a software arrangement or in our ability to identify VSOE for those elements could materially impact the amount of earned and deferred revenue reflected in the financial statements.
License Arrangements: For software license agreements, the Company recognizes revenue when persuasive evidence of an arrangement exists, delivery of the product or service has occurred, the fee is fixed or determinable and collection is probable. For arrangements where the fee is not fixed or determinable, revenue is deferred until payments become due. The Company's software license agreements generally include multiple products and services or "elements." Generally, none of these elements are deemed to be essential to the functionality of the other elements.
For multiple element arrangements, which contain software elements and non-software elements, we allocate revenue to the software deliverables and the non-software deliverables as a group based on the relative selling prices of all of the deliverables in the arrangement. For our non-software deliverables, we allocate the arrangement consideration based on the relative selling price of the deliverables using estimated selling price ("ESP"). For our software elements, we use VSOE for this allocation when it can be established and ESP when VSOE cannot be established.
The selling price for each element is based upon the following selling price hierarchy: VSOE if available, third party evidence ("TPE") if VSOE is not available, or ESP if neither VSOE or TPE are available. Generally, we are not able to determine TPE because our go-to-market strategy differs from that of our peers and our offerings contain a significant level of differentiation such that the comparable pricing of products with similar functionality cannot be obtained. ESP is determined after considering both market conditions (such as the sale of similar products in the market place) and entity-specific factors (such as pricing practices and the specifics of each transaction).
For our non-software deliverables, a delivered item is accounted for as a separate unit of accounting if the delivered item has standalone value and if the customer has a general right of return relative to the delivered item, delivery or performance of the undelivered item is probable and substantially within our control.
For our software licenses and related services, including the software elements of multiple-element software and non-software arrangements, U.S. GAAP generally requires revenue earned on software arrangements involving multiple elements to be allocated to each element based on VSOE of fair value. VSOE of fair value is determined for implementation services based on a rate per hour for stand-alone professional services and the estimated hours for the bundled implementation, if the hours can be reasonably estimated. VSOE of fair value is determined for post-contract support ("PCS") based upon the price charged when sold separately. For a majority of the elements within our software arrangements, we have determined that VSOE cannot be established; therefore, revenue on our software arrangements is generally deferred until the only remaining element is PCS. At that point, the entire arrangement fee is recognized ratably over the remaining PCS period, assuming that all other criteria for revenue recognition have been met. The amounts deferred are included in the balance sheet as deferred revenue and recognized as Bundled Products & Services revenue within Support & Service revenue in the consolidated statements of income.
For arrangements that include specified upgrades, such upgrades are accounted for as a separate element of the arrangement. For those specified upgrades for which VSOE of fair value cannot be determined, revenue related to the software elements within the arrangement is deferred until such specified upgrades have been delivered.
32
Table of Contents
Support and Service Fee Revenue (Non-software): Maintenance support revenue contracted for outside of a license arrangement is recognized pro-rata over the contract period, typically one year.
Outsourced data processing and ATM, debit card, and other transaction processing services revenue is recognized in the month the transactions are processed or the services are rendered.
Hardware Revenue: Hardware revenue is recognized upon delivery to the customer, when title and risk of loss are transferred. In most cases, we do not stock in inventory the hardware products we sell, but arrange for third-party suppliers to drop-ship the products to our customers on our behalf. The revenue related to these hardware sales is recorded gross. The Company also remarkets maintenance contracts on hardware to our customers. Gross hardware maintenance revenue is recognized ratably over the agreement period.
Revenue-based taxes collected from customers and remitted to governmental authorities are presented on a net basis (i.e. excluded from revenues).
Deferred Costs
Costs for certain software and hardware maintenance contracts with third parties, which are prepaid, are recognized ratably over the life of the maintenance contract, generally one to five years, with the related revenue amortized from deferred revenues.
Direct and incremental costs associated with arrangements subject to Accounting Standards Codification ("ASC") 985-605 (for which VSOE of fair value cannot be established) are deferred until the only remaining element in the revenue arrangement is PCS at which point the costs are recognized ratably over the remaining PCS period with the related revenue. Deferred direct and incremental costs associated with arrangements not subject to ASC 985-605 consist primarily of certain up-front costs incurred in connection with our software hosting arrangements and are recognized ratably over the contract period which typically ranges from 5-7 years. These costs include commissions, costs of third-party licenses and the direct costs of our implementation services, consisting of payroll and other fringe benefits.
Depreciation and Amortization Expense
The calculation of depreciation and amortization expense is based on the estimated economic lives of the underlying property, plant and equipment and intangible assets, which have been examined for their useful life and determined that no impairment exists. We believe it is unlikely that any significant changes to the useful lives of our tangible and intangible assets will occur in the near term, but rapid changes in technology or changes in market conditions could result in revisions to such estimates that could materially affect the carrying value of these assets and the Company's future consolidated operating results. We consider whether there is potential for impairment of any long-lived assets, and perform testing for valuation if it is determined that there is a triggering event causing risk of impairment.
Capitalization of software development costs
We capitalize certain costs incurred to develop commercial software products. For software that is to be sold, significant estimates and assumptions include: establishing when technological feasibility has been met and costs should be capitalized, determining the appropriate period over which to amortize the capitalized costs based on the estimated useful lives, estimating the marketability of the commercial software products and related future revenues, and assessing the unamortized cost balances for impairment. Cost incurred prior to establishing technological feasibility are expensed as incurred. Amortization begins on the date of general release and the appropriate amortization period is based on estimates of future revenues from sales of the products. We consider various factors to project marketability and future revenues, including an assessment of alternative solutions or products, current and historical demand for the product, and anticipated changes in technology that may make the product obsolete.
For internal use software, capitalization begins at the beginning of application development. Costs incurred prior to this are expensed as incurred. Significant estimates and assumptions include determining the appropriate amortization period based on the estimated useful life and assessing the unamortized cost balances for impairment. Amortization begins on the date the software is placed in service and the amortization period is based on estimated useful life.
A significant change in an estimate related to one or more software products could result in a material change to our results of operations.
Estimates used to determine current and deferred income taxes
We make certain estimates and judgments in determining income tax expense for financial statement purposes. These estimates and judgments occur in the calculation of certain tax assets and liabilities, which arise from differences in the timing of recognition of revenue and expense for tax and financial statement purposes. We also must determine the likelihood of recoverability of deferred tax assets, and adjust any valuation allowances accordingly. Considerations include the period of expiration of the tax asset, planned use of the tax asset, and historical and projected taxable
33
Table of Contents
income as well as tax liabilities for the tax jurisdiction to which the tax asset relates. Valuation allowances are evaluated periodically and will be subject to change in each future reporting period as a result of changes in one or more of these factors. Also, liabilities for uncertain tax positions require significant judgment in determining what constitutes an individual tax position as well as assessing the outcome of each tax position. Changes in judgment as to recognition or measurement of tax positions can materially affect the estimate of the effective tax rate and consequently, affect our financial results.
Assumptions related to purchase accounting and goodwill
We account for our acquisitions using the purchase method of accounting. This method requires estimates to determine the fair values of assets and liabilities acquired, including judgments to determine any acquired intangible assets such as customer-related intangibles, as well as assessments of the fair value of existing assets such as property and equipment. Liabilities acquired can include balances for litigation and other contingency reserves established prior to or at the time of acquisition, and require judgment in ascertaining a reasonable value. Third party valuation firms may be used to assist in the appraisal of certain assets and liabilities, but even those determinations would be based on significant estimates provided by us, such as forecast revenues or profits on contract-related intangibles. Numerous factors are typically considered in the purchase accounting assessments, which are conducted by Company professionals from legal, finance, human resources, information systems, program management and other disciplines. Changes in assumptions and estimates of the acquired assets and liabilities would result in changes to the fair values, resulting in an offsetting change to the goodwill balance associated with the business acquired.
As goodwill is not amortized, goodwill balances are regularly assessed for potential impairment. Such assessments require an analysis of future cash flow projections as well as a determination of an appropriate discount rate to calculate present values. Cash flow projections are based on management-approved estimates, which involve the input of numerous Company professionals from finance, operations and program management. Key factors used in estimating future cash flows include assessments of labor and other direct costs on existing contracts, estimates of overhead costs and other indirect costs, and assessments of new business prospects and projected win rates. The Company's most recent assessment indicates that no reporting units are currently at risk of impairment as the fair value of each reporting unit is significantly in excess of the carrying value. However, significant changes in the estimates and assumptions used in purchase accounting and goodwill impairment testing could have a material effect on the consolidated financial statements.
ITEM 7A. QUANTITATIVE AND QUALITATIVE DISCLOSURES ABOUT MARKET RISK
Market risk refers to the risk that a change in the level of one or more market prices, interest rates, indices, volatilities, correlations or other market factors such as liquidity, will result in losses for a certain financial instrument or group of financial instruments. We are currently exposed to credit risk on credit extended to customers and interest risk on outstanding debt. We do not currently use any derivative financial instruments. We actively monitor these risks through a variety of controlled procedures involving senior management.
Based on the controls in place and the credit worthiness of the customer base, we believe the credit risk associated with the extension of credit to our customers will not have a material adverse effect on our consolidated financial position, results of operations, or cash flows.
We have no outstanding debt with variable interest rates as of June 30, 2016 and are therefore not currently exposed to interest risk.
34
Table of Contents
ITEM 8. FINANCIAL STATEMENTS AND SUPPLEMENTARY DATA
| Reports of Independent Registered Public Accounting Firm | 36 |
|
|
|
| Management's Annual Report on Internal Control over Financial Reporting | 38 |
|
|
|
| Financial Statements |
|
|
|
|
| Consolidated Statements of Income, |
|
| Years Ended June 30, 2016, 2015, and 2014 | 39 |
|
|
|
| Consolidated Balance Sheets, |
|
| June 30, 2016 and 2015 | 40 |
|
|
|
| Consolidated Statements of Changes in Stockholders' Equity, |
|
| Years Ended June 30, 2016, 2015, and 2014 | 41 |
|
|
|
| Consolidated Statements of Cash Flows, |
|
| Years Ended June 30, 2016, 2015, and 2014 | 42 |
|
|
|
| Notes to Consolidated Financial Statements | 43 |
Financial Statement Schedules
There are no schedules included because they are not applicable or the required information is shown in the consolidated financial statements or notes thereto.
35
Table of Contents
REPORT OF INDEPENDENT REGISTERED PUBLIC ACCOUNTING FIRM
To the Board of Directors and Stockholders of Jack Henry & Associates, Inc.
In our opinion, the accompanying consolidated balance sheet and the related consolidated statements of income, changes in stockholders' equity and cash flows present fairly, in all material respects, the financial position of Jack Henry & Associates, Inc. and its subsidiaries at June 30, 2016, and the results of their operations and their cash flows for the year then ended in conformity with accounting principles generally accepted in the United States of America. Also in our opinion, the Company maintained, in all material respects, effective internal control over financial reporting as of June 30, 2016, based on criteria established in Internal Control - Integrated Framework (2013) issued by the Committee of Sponsoring Organizations of the Treadway Commission (COSO). The Company's management is responsible for these financial statements, for maintaining effective internal control over financial reporting and for its assessment of the effectiveness of internal control over financial reporting, included in the accompanying Management's Annual Report on Internal Control over Financial Reporting. Our responsibility is to express opinions on these financial statements and on the Company's internal control over financial reporting based on our integrated audit. We conducted our audit in accordance with the standards of the Public Company Accounting Oversight Board (United States). Those standards require that we plan and perform the audit to obtain reasonable assurance about whether the financial statements are free of material misstatement and whether effective internal control over financial reporting was maintained in all material respects. Our audit of the financial statements included examining, on a test basis, evidence supporting the amounts and disclosures in the financial statements, assessing the accounting principles used and significant estimates made by management, and evaluating the overall financial statement presentation. Our audit of internal control over financial reporting included obtaining an understanding of internal control over financial reporting, assessing the risk that a material weakness exists, and testing and evaluating the design and operating effectiveness of internal control based on the assessed risk. Our audit also included performing such other procedures as we considered necessary in the circumstances. We believe that our audit provides a reasonable basis for our opinions.
A company's internal control over financial reporting is a process designed to provide reasonable assurance regarding the reliability of financial reporting and the preparation of financial statements for external purposes in accordance with generally accepted accounting principles. A company's internal control over financial reporting includes those policies and procedures that (i) pertain to the maintenance of records that, in reasonable detail, accurately and fairly reflect the transactions and dispositions of the assets of the company; (ii) provide reasonable assurance that transactions are recorded as necessary to permit preparation of financial statements in accordance with generally accepted accounting principles, and that receipts and expenditures of the company are being made only in accordance with authorizations of management and directors of the company; and (iii) provide reasonable assurance regarding prevention or timely detection of unauthorized acquisition, use, or disposition of the company's assets that could have a material effect on the financial statements.
Because of its inherent limitations, internal control over financial reporting may not prevent or detect misstatements. Also, projections of any evaluation of effectiveness to future periods are subject to the risk that controls may become inadequate because of changes in conditions, or that the degree of compliance with the policies or procedures may deteriorate.
/s/ PricewaterhouseCoopers LLP
Kansas City, Missouri
August 29, 2016
36
Table of Contents
REPORT OF INDEPENDENT REGISTERED PUBLIC ACCOUNTING FIRM
To the Board of Directors and Stockholders of
Jack Henry & Associates, Inc.
Monett, Missouri
We have audited the accompanying consolidated balance sheet of Jack Henry & Associates, Inc. and subsidiaries (the "Company") as of June 30, 2015, and the related consolidated statements of income, changes in stockholders' equity, and cash flows for each of the two years in the period ended June 30, 2015. These financial statements are the responsibility of the Company's management. Our responsibility is to express an opinion on these financial statements based on our audits.
We conducted our audits in accordance with the standards of the Public Company Accounting Oversight Board (United States). Those standards require that we plan and perform the audit to obtain reasonable assurance about whether the financial statements are free of material misstatement. An audit includes examining, on a test basis, evidence supporting the amounts and disclosures in the financial statements. An audit also includes assessing the accounting principles used and significant estimates made by management, as well as evaluating the overall financial statement presentation. We believe that our audits provide a reasonable basis for our opinion.
In our opinion, such consolidated financial statements present fairly, in all material respects, the financial position of Jack Henry & Associates, Inc. and subsidiaries as of June 30, 2015, and the results of their operations and their cash flows for each of the two years in the period ended June 30, 2015, in conformity with accounting principles generally accepted in the United States of America.
/s/Deloitte & Touche LLP
Kansas City, Missouri
September 11, 2015
37
Table of Contents
MANAGEMENT'S ANNUAL REPORT ON INTERNAL CONTROL OVER FINANCIAL REPORTING
The management of Jack Henry & Associates, Inc. is responsible for establishing and maintaining adequate internal control over financial reporting, as such term is defined in Exchange Act Rule 13a-15(f). The Company's internal control over financial reporting is a process designed to provide reasonable assurance regarding the reliability of financial reporting and the preparation of the Company's consolidated financial statements for external reporting purposes in accordance with accounting principles generally accepted in the United States of America.
The Company's internal control over financial reporting includes policies and procedures pertaining to the maintenance of records that, in reasonable detail, accurately and fairly reflect transactions and dispositions of assets of the Company; provide reasonable assurance transactions are recorded as necessary to permit preparation of consolidated financial statements in accordance with accounting principles generally accepted in the United States of America, and receipts and expenditures of the Company are being made only in accordance with authorizations of management and the directors of the Company; and provide reasonable assurance regarding prevention or timely detection of unauthorized acquisition, use or disposition of the Company's assets that could have a material effect on the Company's consolidated financial statements. All internal controls, no matter how well designed, have inherent limitations. Therefore, even where internal control over financial reporting is determined to be effective, it can provide only reasonable assurance. Projections of any evaluation of effectiveness to future periods are subject to the risk controls may become inadequate because of changes in conditions, or the degree of compliance with the policies or procedures may deteriorate.
As of June 30, 2016 , management conducted an assessment of the effectiveness of the Company's internal control over financial reporting based on the framework established in Internal Control-Integrated Framework (2013) issued by the Committee of Sponsoring Organizations of the Treadway Commission (COSO). Based on this assessment, management has concluded the Company's internal control over financial reporting as of June 30, 2016 was effective.
The Company's internal control over financial reporting as of June 30, 2016 has been audited by the Company's independent registered public accounting firm, as stated in their report appearing in this Item 8.
38
Table of Contents
JACK HENRY & ASSOCIATES, INC. AND SUBSIDIARIES | |||||||||||
CONSOLIDATED STATEMENTS OF INCOME | |||||||||||
(In Thousands, Except Per Share Data) | |||||||||||
|
|
|
|
|
| ||||||
| Year Ended | ||||||||||
| June 30, | ||||||||||
| 2016 |
| 2015 |
| 2014 | ||||||
REVENUE |
|
|
|
|
| ||||||
License | $ | 3,041 | |
| $ | 2,635 | |
| $ | 2,184 | |
Support and service | 1,300,978 | |
| 1,200,652 | |
| 1,112,331 | | |||
Hardware | 50,627 | |
| 52,903 | |
| 58,658 | | |||
Total revenue | 1,354,646 | |
| 1,256,190 | |
| 1,173,173 | | |||
|
|
|
|
|
| ||||||
COST OF SALES |
|
|
|
|
| ||||||
Cost of license | 1,197 | |
| 1,187 | |
| 908 | | |||
Cost of support and service | 737,108 | |
| 680,750 | |
| 634,756 | | |||
Cost of hardware | 35,346 | |
| 38,399 | |
| 43,708 | | |||
Total cost of sales | 773,651 | |
| 720,336 | |
| 679,372 | | |||
|
|
|
|
|
| ||||||
GROSS PROFIT | 580,995 | |
| 535,854 | |
| 493,801 | | |||
|
|
|
|
|
| ||||||
OPERATING EXPENSES |
|
|
|
|
| ||||||
Selling and marketing | 90,079 | |
| 89,004 | |
| 85,443 | | |||
Research and development | 81,234 | |
| 71,495 | |
| 66,748 | | |||
General and administrative | 67,514 | |
| 64,364 | |
| 53,312 | | |||
Gain on disposal of a business | (19,491 | ) |
| (6,874 | ) |
| - | | |||
Total operating expenses | 219,336 | |
| 217,989 | |
| 205,503 | | |||
|
|
|
|
|
| ||||||
OPERATING INCOME | 361,659 | |
| 317,865 | |
| 288,298 | | |||
|
|
|
|
|
| ||||||
INTEREST INCOME (EXPENSE) |
|
|
|
|
| ||||||
Interest income | 307 | |
| 169 | |
| 377 | | |||
Interest expense | (1,430 | ) |
| (1,594 | ) |
| (1,105 | ) | |||
Total interest income (expense) | (1,123 | ) |
| (1,425 | ) |
| (728 | ) | |||
|
|
|
|
|
| ||||||
INCOME BEFORE INCOME TAXES | 360,536 | |
| 316,440 | |
| 287,570 | | |||
|
|
|
|
|
| ||||||
PROVISION FOR INCOME TAXES | 111,669 | |
| 105,219 | |
| 100,855 | | |||
|
|
|
|
|
| ||||||
NET INCOME | $ | 248,867 | |
| $ | 211,221 | |
| $ | 186,715 | |
|
|
|
|
|
| ||||||
Basic earnings per share | $ | 3.13 | |
| $ | 2.60 | |
| $ | 2.20 | |
Basic weighted average shares outstanding | 79,416 | |
| 81,353 | |
| 84,866 | | |||
|
|
|
|
|
| ||||||
Diluted earnings per share | $ | 3.12 | |
| $ | 2.59 | |
| $ | 2.19 | |
Diluted weighted average shares outstanding | 79,734 | |
| 81,601 | |
| 85,396 | | |||
See notes to consolidated financial statements
39
Table of Contents
JACK HENRY & ASSOCIATES, INC. AND SUBSIDIARIES | |||||||
CONSOLIDATED BALANCE SHEETS | |||||||
(In Thousands, Except Share and Per Share Data) | |||||||
|
|
|
| ||||
| June 30, |
| June 30, | ||||
ASSETS |
|
|
| ||||
CURRENT ASSETS: |
|
|
| ||||
Cash and cash equivalents | $ | 70,310 | |
| $ | 148,313 | |
Receivables, net | 253,923 | |
| 245,387 | | ||
Income tax receivable | 15,636 | |
| 2,753 | | ||
Prepaid expenses and other | 56,588 | |
| 69,096 | | ||
Deferred costs | 35,472 | |
| 27,950 | | ||
Total current assets | 431,929 | |
| 493,499 | | ||
PROPERTY AND EQUIPMENT, net | 298,564 | |
| 296,332 | | ||
OTHER ASSETS: |
|
|
| ||||
Non-current deferred costs | 99,799 | |
| 96,423 | | ||
Computer software, net of amortization | 222,115 | |
| 191,541 | | ||
Other non-current assets | 70,461 | |
| 52,432 | | ||
Customer relationships, net of amortization | 104,085 | |
| 122,204 | | ||
Other intangible assets, net of amortization | 35,706 | |
| 34,038 | | ||
Goodwill | 552,853 | |
| 550,366 | | ||
Total other assets | 1,085,019 | |
| 1,047,004 | | ||
Total assets | $ | 1,815,512 | |
| $ | 1,836,835 | |
LIABILITIES AND STOCKHOLDERS' EQUITY |
|
|
| ||||
CURRENT LIABILITIES: |
|
|
| ||||
Accounts payable | $ | 14,596 | |
| $ | 9,933 | |
Accrued expenses | 85,411 | |
| 78,962 | | ||
Accrued income taxes | - | |
| 5,543 | | ||
Deferred income tax liability | - | |
| 7,034 | | ||
Notes payable and current maturities of long term debt | 200 | |
| 2,595 | | ||
Deferred revenues | 343,525 | |
| 339,544 | | ||
Total current liabilities | 443,732 | |
| 443,611 | | ||
LONG TERM LIABILITIES: |
|
|
| ||||
Non-current deferred revenues | 177,529 | |
| 192,443 | | ||
Non-current deferred income tax liability | 188,601 | |
| 150,223 | | ||
Debt, net of current maturities | - | |
| 50,102 | | ||
Other long-term liabilities | 9,440 | |
| 8,922 | | ||
Total long term liabilities | 375,570 | |
| 401,690 | | ||
Total liabilities | 819,302 | |
| 845,301 | | ||
STOCKHOLDERS' EQUITY |
|
|
| ||||
Preferred stock - $1 par value; 500,000 shares authorized, none issued | - | |
| - | | ||
Common stock - $0.01 par value; 250,000,000 shares authorized; | 1,029 | |
| 1,027 | | ||
Additional paid-in capital | 440,123 | |
| 424,536 | | ||
Retained earnings | 1,431,192 | |
| 1,266,443 | | ||
Less treasury stock at cost | (876,134 | ) |
| (700,472 | ) | ||
Total stockholders' equity | 996,210 | |
| 991,534 | | ||
Total liabilities and equity | $ | 1,815,512 | |
| $ | 1,836,835 | |
See notes to consolidated financial statements
40
Table of Contents
JACK HENRY & ASSOCIATES, INC. AND SUBSIDIARIES | |||||||||||
CONSOLIDATED STATEMENTS OF CHANGES IN STOCKHOLDERS' EQUITY | |||||||||||
(In Thousands, Except Share and Per Share Data) | |||||||||||
|
|
|
|
|
| ||||||
| Year Ended June 30, | ||||||||||
| 2016 |
| 2015 |
| 2014 | ||||||
|
|
|
|
|
| ||||||
PREFERRED SHARES: | - | |
| - | |
| - | | |||
|
|
|
|
|
| ||||||
COMMON SHARES: |
|
|
|
|
| ||||||
Shares, beginning of year | 102,695,214 | |
| 102,429,926 | |
| 101,993,808 | | |||
Shares issued for equity-based payment arrangements | 121,348 | |
| 172,661 | |
| 344,372 | | |||
Shares issued for Employee Stock Purchase Plan | 87,409 | |
| 92,627 | |
| 91,746 | | |||
Shares, end of year | 102,903,971 | |
| 102,695,214 | |
| 102,429,926 | | |||
|
|
|
|
|
| ||||||
COMMON STOCK - PAR VALUE $0.01 PER SHARE: |
|
|
|
|
| ||||||
Balance, beginning of year | $ | 1,027 | |
| $ | 1,024 | |
| $ | 1,020 | |
Shares issued for equity-based payment arrangements | 1 | |
| 2 | |
| 3 | | |||
Shares issued for Employee Stock Purchase Plan | 1 | |
| 1 | |
| 1 | | |||
Balance, end of year | $ | 1,029 | |
| $ | 1,027 | |
| $ | 1,024 | |
|
|
|
|
|
| ||||||
ADDITIONAL PAID-IN CAPITAL: |
|
|
|
|
| ||||||
Balance, beginning of year | $ | 424,536 | |
| $ | 412,512 | |
| $ | 400,710 | |
Shares issued upon exercise of stock options | 696 | |
| 640 | |
| 606 | | |||
Tax withholding related to share based compensation | (2,590 | ) |
| (7,951 | ) |
| (6,598 | ) | |||
Shares issued for Employee Stock Purchase Plan | 5,710 | |
| 4,880 | |
| 4,283 | | |||
Tax benefits from share-based compensation | 1,051 | |
| 4,343 | |
| 3,420 | | |||
Stock-based compensation expense | 10,720 | |
| 10,112 | |
| 10,091 | | |||
Balance, end of year | $ | 440,123 | |
| $ | 424,536 | |
| $ | 412,512 | |
|
|
|
|
|
| ||||||
RETAINED EARNINGS: |
|
|
|
|
| ||||||
Balance, beginning of year | $ | 1,266,443 | |
| $ | 1,131,632 | |
| $ | 1,016,168 | |
Net income | 248,867 | |
| 211,221 | |
| 186,715 | | |||
Dividends | (84,118 | ) |
| (76,410 | ) |
| (71,251 | ) | |||
Balance, end of year | $ | 1,431,192 | |
| $ | 1,266,443 | |
| $ | 1,131,632 | |
|
|
|
|
|
| ||||||
TREASURY STOCK: |
|
|
|
|
| ||||||
Balance, beginning of year | $ | (700,472 | ) |
| $ | (577,781 | ) |
| $ | (402,082 | ) |
Purchase of treasury shares | (175,662 | ) |
| (122,691 | ) |
| (175,699 | ) | |||
Balance, end of year | $ | (876,134 | ) |
| $ | (700,472 | ) |
| $ | (577,781 | ) |
|
|
|
|
|
| ||||||
TOTAL STOCKHOLDERS' EQUITY | $ | 996,210 | |
| $ | 991,534 | |
| $ | 967,387 | |
|
|
|
|
|
| ||||||
Dividends declared per share | $ | 1.06 | |
| $ | 0.94 | |
| $ | 0.84 | |
See notes to consolidated financial statements.
41
Table of Contents
JACK HENRY & ASSOCIATES, INC. AND SUBSIDIARIES | |||||||||||
CONSOLIDATED STATEMENTS OF CASH FLOWS | |||||||||||
(In Thousands) | |||||||||||
|
|
|
|
|
| ||||||
| Year Ended | ||||||||||
| June 30, | ||||||||||
| 2016 |
| 2015 |
| 2014 | ||||||
CASH FLOWS FROM OPERATING ACTIVITIES: |
|
|
|
|
| ||||||
Net Income | $ | 248,867 | |
| $ | 211,221 | |
| $ | 186,715 | |
Adjustments to reconcile net income from operations to net cash from operating activities: |
|
|
|
|
| ||||||
Depreciation | 50,571 | |
| 54,155 | |
| 52,935 | | |||
Amortization | 79,077 | |
| 64,841 | |
| 54,836 | | |||
Change in deferred income taxes | 37,524 | |
| 29,443 | |
| 12,752 | | |||
Excess tax benefits from stock-based compensation | (1,306 | ) |
| (4,343 | ) |
| (3,406 | ) | |||
Expense for stock-based compensation | 10,720 | |
| 10,112 | |
| 10,091 | | |||
(Gain)/loss on disposal of assets and businesses | (16,888 | ) |
| (5,046 | ) |
| (784 | ) | |||
Changes in operating assets and liabilities: |
|
|
|
|
| ||||||
Change in receivables | (13,735 | ) |
| (21,346 | ) |
| 7,498 | | |||
Change in prepaid expenses, deferred costs and other | (29,577 | ) |
| (33,858 | ) |
| (28,565 | ) | |||
Change in accounts payable | 4,663 | |
| (583 | ) |
| (1,252 | ) | |||
Change in accrued expenses | 7,460 | |
| 14,483 | |
| (6,364 | ) | |||
Change in income taxes | (16,624 | ) |
| 14,146 | |
| 5,251 | | |||
Change in deferred revenues | 4,364 | |
| 40,565 | |
| 51,952 | | |||
Net cash from operating activities | 365,116 | |
| 373,790 | |
| 341,659 | | |||
|
|
|
|
|
| ||||||
CASH FLOWS FROM INVESTING ACTIVITIES: |
|
|
|
|
| ||||||
Payment for acquisitions, net of cash acquired | (8,275 | ) |
| - | |
| (27,894 | ) | |||
Capital expenditures | (56,325 | ) |
| (54,409 | ) |
| (33,185 | ) | |||
Proceeds from the sale of businesses | 34,030 | |
| 8,135 | |
| - | | |||
Proceeds from the sale of assets | 2,844 | |
| 182 | |
| 7,781 | | |||
Internal use software | (11,826 | ) |
| (14,020 | ) |
| (16,288 | ) | |||
Computer software developed | (96,411 | ) |
| (76,872 | ) |
| (62,194 | ) | |||
Net cash from investing activities | (135,963 | ) |
| (136,984 | ) |
| (131,780 | ) | |||
|
|
|
|
|
| ||||||
CASH FLOWS FROM FINANCING ACTIVITIES: |
|
|
|
|
| ||||||
Borrowings on credit facilities | 100,000 | |
| 90,000 | |
| 25,000 | | |||
Repayments on credit facilities | (152,500 | ) |
| (50,783 | ) |
| (47,158 | ) | |||
Debt acquisition costs | - | |
| (901 | ) |
| - | | |||
Purchase of treasury stock | (175,662 | ) |
| (122,691 | ) |
| (175,699 | ) | |||
Dividends paid | (84,118 | ) |
| (76,410 | ) |
| (71,251 | ) | |||
Excess tax benefits from stock-based compensation | 1,306 | |
| 4,343 | |
| 3,406 | | |||
Proceeds from issuance of common stock upon exercise of stock options | 697 | |
| 642 | |
| 609 | | |||
Minimum tax withholding payments related to share based compensation | (2,590 | ) |
| (7,951 | ) |
| (6,598 | ) | |||
Proceeds from sale of common stock | 5,711 | |
| 4,881 | |
| 4,284 | | |||
Net cash from financing activities | (307,156 | ) |
| (158,870 | ) |
| (267,407 | ) | |||
NET CHANGE IN CASH AND CASH EQUIVALENTS | $ | (78,003 | ) |
| $ | 77,936 | |
| $ | (57,528 | ) |
CASH AND CASH EQUIVALENTS, BEGINNING OF PERIOD | $ | 148,313 | |
| $ | 70,377 | |
| $ | 127,905 | |
CASH AND CASH EQUIVALENTS, END OF PERIOD | $ | 70,310 | |
| $ | 148,313 | |
| $ | 70,377 | |
See notes to consolidated financial statements
42
Table of Contents
JACK HENRY & ASSOCIATES, INC. AND SUBSIDIARIES
NOTES TO CONSOLIDATED FINANCIAL STATEMENTS
(In Thousands, Except Per Share Amounts)
NOTE 1. | NATURE OF OPERATIONS AND SUMMARY OF SIGNIFICANT ACCOUNTING POLICIES |
DESCRIPTION OF THE COMPANY
Jack Henry & Associates, Inc. and subsidiaries ("JHA" or the "Company") is a provider of integrated computer systems and services that has developed and acquired a number of banking and credit union software systems. The Company's revenues are predominately earned by marketing those systems to financial institutions nationwide together with computer equipment (hardware), by providing the conversion and software implementation services for financial institutions to utilize JHA software systems, and by providing other related services. JHA also provides continuing support and services to customers using in-house or outsourced systems.
CONSOLIDATION
The consolidated financial statements include the accounts of JHA and all of its subsidiaries, which are wholly-owned, and all intercompany accounts and transactions have been eliminated.
PRIOR PERIOD RECLASSIFICATION
Certain amounts included within the consolidated statements of income and the consolidated statement of cash flows for the year ended June 30, 2015 have been reclassified to separately disclose the gain on disposal of businesses and proceeds from the sale of businesses. This adjustment resulted in disclosures on disposal of a business as a separate line to the consolidated statements of income and increased general and administrative operating expense by $6,874 for June 30, 2015 . This new line only included gains on the sales of businesses. All other gains and losses on assets are still included in the line items to which they relate. There was no change in total operating expenses. The adjustment also resulted in a separate line on the consolidated statements of cash flows for proceeds from the sale of businesses and decreased proceeds from sale of assets by $8,135 for June 30, 2015 . There was no change to net cash from investing activities or total cash flows.
USE OF ESTIMATES
The preparation of financial statements in conformity with accounting principles generally accepted in the United States of America requires management to make estimates and assumptions that affect the reported amounts of assets and liabilities and disclosure of contingent assets and liabilities as of the date of the financial statements and the reported amounts of revenues and expenses during the reporting period. Actual results could differ from those estimates.
REVENUE RECOGNITION
The Company derives revenue from the following sources: license arrangements, support and service fees (non-software) and hardware sales. There are no rights of return, condition of acceptance or price protection in the Company's sales contracts.
License Arrangements: For software license agreements, the Company recognizes revenue when persuasive evidence of an arrangement exists, delivery of the product or service has occurred, the fee is fixed or determinable and collection is probable. For arrangements where the fee is not fixed or determinable, revenue is deferred until payments become due. The Company's software license agreements generally include multiple products and services or "elements." Generally, none of these elements are deemed to be essential to the functionality of the other elements.
For multiple element arrangements, which contain software elements and non-software elements, we allocate revenue to the software deliverables and the non-software deliverables as a group based on the relative selling prices of all of the deliverables in the arrangement. For our non-software deliverables, we allocate the arrangement consideration based on the relative selling price of the deliverables using estimated selling price ("ESP"). For our software elements, we use vendor-specific objective evidence ("VSOE") for this allocation when it can be established and ESP when VSOE cannot be established.
The selling price for each element is based upon the following selling price hierarchy: VSOE if available, third party evidence ("TPE") if VSOE is not available, or ESP if neither VSOE or TPE are available. Generally, we are not able to determine TPE because our go-to-market strategy differs from that of our peers and our offerings contain a significant level of differentiation such that the comparable pricing of products with similar functionality cannot be obtained. ESP is determined after considering both market conditions (such as the sale of similar products in the market place) and entity-specific factors (such as pricing practices and the specifics of each transaction).
43
Table of Contents
For our non-software deliverables, a delivered item is accounted for as a separate unit of accounting if the delivered item has standalone value and if the customer has a general right of return relative to the delivered item, delivery or performance of the undelivered item is probable and substantially within our control.
For our software licenses and related services, including the software elements of multiple-element software and non-software arrangements, U.S. GAAP generally require revenue earned on software arrangements involving multiple elements to be allocated to each element based on vendor-specific objective evidence ("VSOE") of fair value. VSOE of fair value is determined for implementation services based on a rate per hour for stand-alone professional services and the estimated hours for the bundled implementation, if the hours can be reasonably estimated. VSOE of fair value is determined for post-contract support ("PCS") based upon the price charged when sold separately. For a majority of the elements within our software arrangements, we have determined that VSOE cannot be established; therefore, revenue on our software arrangements is generally deferred until the only remaining element is post-contract support ("PCS"). At that point, the entire arrangement fee is recognized ratably over the remaining PCS period, assuming that all other criteria for revenue recognition have been met. The amounts deferred are included in the balance sheet as deferred revenue and recognized as Bundled Products & Services revenue within Support & Service revenue in the consolidated statements of income.
For arrangements that include specified upgrades, such upgrades are accounted for as a separate element of the arrangement. For those specified upgrades for which VSOE of fair value cannot be determined, revenue related to the software elements within the arrangement is deferred until such specified upgrades have been delivered.
Total revenue recognized ratably related to our Bundled Products & Services was $94,391 , $62,888 , and $60,685 for the years ended June 30, 2016 , 2015 , and 2014 , respectively.
Support and Service Fee Revenue (Non-software): Maintenance support revenue contracted for outside of a license arrangement is recognized pro-rata over the contract period, typically one year.
Outsourced data processing and ATM, debit card, and other transaction processing services revenue is recognized in the month the transactions are processed or the services are rendered.
Hardware Revenue: Hardware revenue is recognized upon delivery to the customer, when title and risk of loss are transferred. In most cases, we do not stock in inventory the hardware products we sell, but arrange for third-party suppliers to drop-ship the products to our customers on our behalf. The revenue related to these hardware sales is recorded gross. The Company also remarkets maintenance contracts on hardware to our customers. Hardware maintenance revenue is recognized ratably over the agreement period.
Revenue-based taxes collected from customers and remitted to governmental authorities are presented on a net basis (i.e. excluded from revenues).
DEFERRED COSTS
Costs for certain software and hardware maintenance contracts with third parties, which are prepaid, are recognized ratably over the life of the maintenance contract, generally one to five years, with the related revenue amortized from deferred revenues.
Direct and incremental costs associated with arrangements subject to Accounting Standards Codification ("ASC") 985-605 (for which VSOE of fair value cannot be established) are deferred until the only remaining element in the revenue arrangement is PCS at which point the costs are recognized ratably over the remaining PCS period with the related revenue. Deferred direct and incremental costs associated with arrangements not subject to ASC 985-605 consist primarily of certain up-front costs incurred in connection with our software hosting arrangements and are recognized ratably over the contract period which typically ranges from 5-7 years. These costs include commissions, costs of third-party licenses and the direct costs of our implementation services, consisting of payroll and other fringe benefits.
DEFERRED REVENUES
Deferred revenues consist primarily of prepaid annual software support fees, deferred bundled software arrangements revenue, and prepaid hardware maintenance fees. Deferred bundled software arrangements revenue and hardware maintenance contracts may be recognized over multiple years; therefore, the related deferred revenue and maintenance are classified as current or non-current in accordance with the terms of the contract. Software and hardware deposits received are also reflected as deferred revenues.
The vast majority of our maintenance (PCS) renews annually and runs from July 1 to June 30. Renewal billings are submitted to customers each June and the Company has the right to bill at that date; therefore we include those billings as gross in deferred revenue and as a receivable on our balance sheet at the end of each fiscal year.
44
Table of Contents
COMPUTER SOFTWARE DEVELOPMENT
The Company capitalizes new product development costs incurred for software to be sold from the point at which technological feasibility has been established through the point at which the product is ready for general availability. Software development costs that are capitalized are evaluated on a product-by-product basis annually and are assigned an estimated economic life based on the type of product, market characteristics, and maturity of the market for that particular product. These costs are amortized based on current and estimated future revenue from the product or on a straight-line basis, whichever yields greater amortization expense. All of this amortization expense is included within Cost of support and service.
The Company capitalizes development costs for internal use software beginning at the start of application development. Amortization begins on the date the software is placed in service and the amortization period is based on estimated useful life.
CASH EQUIVALENTS
The Company considers all highly liquid investments with maturities of three months or less at the time of acquisition to be cash equivalents.
ACCOUNTS RECEIVABLE
Receivables are recorded at the time of billing. A reasonable estimate the realizability of customer receivables is made through the establishment of an allowance for doubtful accounts, which is estimated based on a combination of write-off history, aging analysis, and any specifically known collection issues.
PROPERTY AND EQUIPMENT AND INTANGIBLE ASSETS
Property and equipment is stated at cost and depreciated using the straight-line method over the estimated useful lives of the assets.
Intangible assets consist of goodwill, customer relationships, computer software, and trade names acquired in business acquisitions in addition to internally developed computer software. The amounts are amortized, with the exception of those with an indefinite life (such as goodwill), over an estimated economic benefit period, generally three to twenty years.
The Company reviews its long-lived assets and identifiable intangible assets with finite lives for impairment whenever events or changes in circumstances have indicated that the carrying amount of its assets might not be recoverable. The Company evaluates goodwill and other indefinite-lived intangible assets for impairment of value on an annual basis as of January 1 and between annual tests if events or changes in circumstances indicate that the asset might be impaired.
COMPREHENSIVE INCOME
Comprehensive income for each of the years ending June 30, 2016 , 2015 , and 2014 equals the Company's net income.
REPORTABLE SEGMENT INFORMATION
In accordance with U.S. GAAP, the Company's operations are classified as two reportable segments: bank systems and services and credit union systems and services (see Note 13). Revenue by type of product and service is presented on the face of the consolidated statements of income. Substantially all the Company's revenues are derived from operations and assets located within the United States of America.
COMMON STOCK
The Board of Directors has authorized the Company to repurchase shares of its common stock. Under this authorization, the Company may finance its share repurchases with available cash reserves or short-term borrowings on its existing credit facilities. The share repurchase program does not include specific price targets or timetables and may be suspended at any time. At June 30, 2016 , there were 24,209 shares in treasury stock and the Company had the remaining authority to repurchase up to 5,782 additional shares. The total cost of treasury shares at June 30, 2016 is $876,134 . During fiscal 2016 , the Company repurchased 2,366 treasury shares for $175,662 . At June 30, 2015 , there were 21,843 shares in treasury stock and the Company had authority to repurchase up to 8,148 additional shares.
Dividends declared per share were $1.06 , $0.94 , and $0.84 for the years ended June 30, 2016 , 2015 , and 2014 , respectively.
EARNINGS PER SHARE
Per share information is based on the weighted average number of common shares outstanding during the year. Stock options have been included in the calculation of income per diluted share to the extent they are dilutive. The difference
45
Table of Contents
between basic and diluted weighted average shares outstanding is the dilutive effect of outstanding stock options and restricted stock (see Note 10).
INCOME TAXES
Deferred tax liabilities and assets are recognized for the tax effects of differences between the financial statement and tax bases of assets and liabilities. A valuation allowance would be established to reduce deferred tax assets if it is more likely than not that a deferred tax asset will not be realized.
The Company recognizes the tax benefit from an uncertain tax position only if it is more likely than not that the tax position will be sustained on examination by the taxing authorities, based upon the technical merits of the position. The tax benefit recognized in the financial statements from such a position is measured based on the largest benefit that has a greater than 50% likelihood of being realized upon ultimate settlement. Also, interest and penalties expense are recognized on the full amount of deferred benefits for uncertain tax positions. Our policy is to include interest and penalties related to unrecognized tax benefits in income tax expense.
RECENT ACCOUNTING PRONOUNCEMENTS
The Financial Accounting Standards Board ("FASB") issued Accounting Standards Update ("ASU") No. 2014-09, Revenue from Contracts with Customers in May 2014. The new standard will supersede much of the existing authoritative literature for revenue recognition. In August 2015, the FASB also issued ASU No. 2015-14 which deferred the effective date of the new standard by one year. The standard and related amendments will be effective for the Company for its annual reporting period beginning July 1, 2018, including interim periods within that reporting period. Along with the deferral of the effective date, ASU No. 2015-14 allows early application as of the original effective date. Entities are allowed to transition to the new standard by either recasting prior periods or recognizing the cumulative effect as of the beginning of the period of adoption. In March 2016, the FASB issued ASU No. 2016-08, which addresses principal versus agent considerations under the new revenue standard. ASU No. 2016-10 and ASU No. 2016-12 issued in April and May 2016 also address specific aspects of the new standard. The Company is currently evaluating the newly issued guidance, including which transition approach will be applied and the estimated impact it will have on our consolidated financial statements.
In April 2015, the FASB issued ASU No. 2015-03, Interest-Imputation of Interest (Subtopic 835-30): Simplifying the Presentation of Debt Issuance Costs. This ASU requires that debt issuance costs be presented in the balance sheet as a direct deduction from the carrying amount of the related debt liability (same treatment as debt discounts). ASU No. 2015-03 will be effective for the Company in its fiscal year ended June 30, 2017. Early adoption is permitted provided that the guidance is applied from the beginning of the fiscal year of adoption. The Company currently classifies debt issuance costs as an asset, and will adopt these changes beginning July 1, 2016.
ASU No. 2015-17 was issued by the FASB in November 2015 as part of the Simplification Initiative. This ASU eliminates the requirement to separate deferred income tax liabilities and assets into non-current and current amounts. ASU No. 2015-17 is effective for the Company for its annual reporting period beginning July 1, 2017 and early adoption is permitted. In the third quarter of fiscal 2016, management elected to early adopt and all deferred income tax assets and liabilities are reported as non-current. At March 31, 2016, the current portion of our deferred income tax liability was $7,034 . Prior periods were not retrospectively adjusted.
The FASB issued ASU No. 2016-02, Leases, in February 2016. This ASU aims to increase transparency and comparability among organizations by recognizing lease assets and liabilities on the balance sheet and requiring disclosure of key information regarding leasing arrangements. ASU No. 2016-02 will be effective for Jack Henry's annual reporting period beginning July 1, 2019 and early adoption is permitted. The Company is currently assessing the impact this new standard will have on our consolidated financial statements.
The FASB issued Accounting Standards Update ("ASU") No. 2016-09, Improvements to Employee Share-Based Payment Accounting in March 2016. The new standard will simplify several aspects of the accounting for share-based payment transactions, including reporting of excess tax benefits and shortfalls, application of forfeiture rates, statutory minimum withholding considerations, and classification within the statement of cash flows. ASU No. 2016-09 is effective for the Company's annual reporting period beginning July 1, 2017 and early adoption is permitted. The Company is currently evaluating the newly issued guidance, including the estimated impact it will have on our consolidated financial statements. The Company currently anticipates the changes will be adopted in the first quarter of the annual reporting period beginning July 1, 2016.
46
Table of Contents
NOTE 2. FAIR VALUE OF FINANCIAL INSTRUMENTS
For cash equivalents, amounts receivable or payable and short-term borrowings, fair values approximate carrying value, based on the short-term nature of the assets and liabilities. The fair value of long term debt also approximates carrying value as estimated using discounted cash flows based on the Company's current incremental borrowing rates.
The Company's estimates of the fair value for financial assets and financial liabilities are based on the framework established in the fair value accounting guidance. The framework is based on the inputs used in valuation, gives the highest priority to quoted prices in active markets, and requires that observable inputs be used in the valuations when available. The three levels of the hierarchy are as follows:
Level 1: inputs to the valuation are quoted prices in an active market for identical assets
Level 2: inputs to the valuation include quoted prices for similar assets in active markets that are observable either directly or indirectly
Level 3: valuation is based on significant inputs that are unobservable in the market and the Company's own estimates of assumptions that we believe market participants would use in pricing the asset
Fair value of financial assets, included in cash and cash equivalents, and financial liabilities is as follows:
|
| Estimated Fair Value Measurements |
| Total Fair | ||||||||||||
|
| Level 1 |
| Level 2 |
| Level 3 |
| Value | ||||||||
June 30, 2016 |
|
|
|
|
|
|
|
| ||||||||
Financial Assets: |
|
|
|
|
|
|
|
| ||||||||
Money market funds |
| $ | 35,782 | |
| $ | - | |
| $ | - | |
| $ | 35,782 | |
Financial Liabilities: |
|
|
|
|
|
|
|
| ||||||||
Revolving credit facility |
| $ | - | |
| $ | - | |
| $ | - | |
| $ | - | |
June 30, 2015 |
|
| |
|
|
|
|
|
| | ||||||
Financial Assets: |
|
|
|
|
|
|
|
| ||||||||
Money market funds |
| $ | 98,888 | |
| $ | - | |
| $ | - | |
| $ | 98,888 | |
Financial Liabilities: |
|
|
|
|
|
|
|
| ||||||||
Revolving credit facility |
| $ | - | |
| $ | 50,000 | |
| $ | - | |
| $ | 50,000 | |
NOTE 3. PROPERTY AND EQUIPMENT
The classification of property and equipment, together with their estimated useful lives is as follows:
| June 30, |
|
|
| ||||||
| 2016 |
| 2015 |
| Estimated Useful Life | |||||
Land | $ | 24,987 | |
| $ | 24,987 | |
|
|
|
Land improvements | 25,470 | |
| 25,428 | |
| 5 - 20 years |
| ||
Buildings | 146,464 | |
| 144,414 | |
| 20 - 30 years |
| ||
Leasehold improvements | 46,897 | |
| 32,169 | |
| 5 - 30 years | (1) | ||
Equipment and furniture | 337,565 | |
| 327,949 | |
| 3 - 10 years |
| ||
Aircraft and equipment | 37,967 | |
| 37,695 | |
| 5 - 10 years |
| ||
Construction in progress | 7,373 | |
| 23,563 | |
|
|
| ||
| 626,723 | |
| 616,205 | |
|
|
| ||
Less accumulated depreciation | 328,159 | |
| 319,873 | |
|
|
| ||
Property and equipment, net | $ | 298,564 | |
| $ | 296,332 | |
|
|
|
(1) Lesser of lease term or estimated useful life
Property and equipment included $651 and $1,343 that was in accrued liabilities at June 30, 2016 and 2015 , respectively. Also, the Company acquired $4,344 of computer equipment through capital leases for the year ended June 30, 2015 . There were no acquisitions through capital leases in fiscal 2016 . These amounts were excluded from capital expenditures on the statements of cash flows.
47
Table of Contents
NOTE 4. OTHER ASSETS
Goodwill
The carrying amount of goodwill for the years ended June 30, 2016 and 2015 , by reportable segments, is as follows:
| June 30, | ||||||
Bank systems and services | 2016 |
| 2015 | ||||
Beginning balance | $ | 420,795 | |
| $ | 423,190 | |
Goodwill, acquired during the year | 6,099 | |
| - | | ||
Goodwill, written off related to sale | (3,612 | ) |
| (2,395 | ) | ||
Ending balance | $ | 423,282 | |
| $ | 420,795 | |
|
|
|
| ||||
Credit Union systems and services |
|
|
| ||||
Beginning balance | $ | 129,571 | |
| $ | 129,571 | |
Goodwill, acquired during the year | - | |
| - | | ||
Ending balance | $ | 129,571 | |
| $ | 129,571 | |
The Goodwill acquired during the year was a result of our purchase of Bayside Business Solutions, Inc. The goodwill of $6,099 arising from this acquisition consists largely of the growth potential, synergies and economies of scale expected from combining the operations of the Company with those of Bayside Business Solutions, together with the value of Bayside Business Solutions' assembled workforce. Goodwill from this acquisition has been allocated to our banking segment.
During the year the Company sold its Alogent business (Alogent) to Antelope Acquisition Co., an affiliate of Battery Ventures. Alogent was included in our banking segment. Goodwill allocated to the carrying amount of the net assets sold was calculated based on the relative fair values of the business disposed and the portion of the reporting unit that was retained.
Other Intangible Assets
Information regarding other identifiable intangible assets is as follows:
| June 30, 2016 | |||||||||
| Gross Carrying Amount |
| Accumulated Amortization |
| Net | |||||
Customer relationships | $ | 266,545 | |
| (162,460 | ) |
| $ | 104,085 | |
Computer software | $ | 474,738 | |
| (252,623 | ) |
| $ | 222,115 | |
Other intangible assets: |
|
|
|
|
| |||||
Purchased software | 43,692 | |
| (17,475 | ) |
| 26,217 | | ||
Trade names | 12,802 | |
| (3,313 | ) |
| 9,489 | | ||
Other intangible assets, total | $ | 56,494 | |
| (20,788 | ) |
| $ | 35,706 | |
|
|
|
|
|
| |||||
| June 30, 2015 | |||||||||
| Gross Carrying Amount |
| Accumulated Amortization |
| Net | |||||
Customer relationships | $ | 276,337 | |
| (154,133 | ) |
| $ | 122,204 | |
Computer software | $ | 416,674 | |
| (225,133 | ) |
| $ | 191,541 | |
Other intangible assets: |
|
|
|
|
| |||||
Purchased software | 32,192 | |
| (7,818 | ) |
| 24,374 | | ||
Trade names | 12,498 | |
| (2,834 | ) |
| 9,664 | | ||
Total | $ | 44,690 | |
| (10,652 | ) |
| $ | 34,038 | |
Customer relationships have lives ranging from 5 to 20 years.
Computer software includes cost of software to be sold, leased, or marketed of $108,991 and costs of internal-use software of $113,124 at June 30, 2016 .
48
Table of Contents
Computer software includes the unamortized cost of commercial software products developed or acquired by the Company, which are capitalized and amortized over useful lives ranging from 5 to 10 years. Amortization expense for computer software totaled $54,810 , $43,798 , and $37,720 for the fiscal years ended June 30, 2016 , 2015 , and 2014 , respectively. There were no material impairments in any of the fiscal years presented.
Our other intangible assets have useful lives ranging from 3 to 20 years.
Amortization expense for all intangible assets was $79,077 , $64,841 , and $54,836 for the fiscal years ended June 30, 2016 , 2015 , and 2014 , respectively. The estimated aggregate future amortization expense for each of the next five years for all intangible assets remaining as of June 30, 2016 , is as follows:
Years Ending June 30, | Computer Software |
| Customer Relationships |
| Other Intangible Assets |
| Total | ||||||||
2017 | $ | 53,326 | |
| $ | 13,097 | |
| $ | 10,968 | |
| $ | 77,391 | |
2018 | 46,062 | |
| 12,509 | |
| 7,400 | |
| 65,971 | | ||||
2019 | 37,781 | |
| 12,244 | |
| 3,660 | |
| 53,685 | | ||||
2020 | 27,091 | |
| 10,074 | |
| 939 | |
| 38,104 | | ||||
2021 | 11,742 | |
| 8,430 | |
| 642 | |
| 20,814 | | ||||
NOTE 5. DEBT
The Company's outstanding long and short term debt is as follows:
| June 30, |
| June 30, | ||||
| 2016 |
| 2015 | ||||
LONG TERM DEBT |
|
|
| ||||
Revolving credit facility | $ | - | |
| $ | 50,000 | |
Capital leases | - | |
| 816 | | ||
| - | |
| 50,816 | | ||
Less current maturities | - | |
| 714 | | ||
Debt, net of current maturities | $ | - | |
| $ | 50,102 | |
SHORT TERM DEBT |
|
|
| ||||
Capital leases | $ | 200 | |
| $ | 1,881 | |
Current maturities of long-term debt | - | |
| 714 | | ||
Notes payable and current maturities of long term debt | $ | 200 | |
| $ | 2,595 | |
The following table summarizes the annual principal payments required as of June 30, 2016 :
Years ended June 30, |
| ||
2017 | $ | 200 | |
| $ | 200 | |
Capital leases
The Company has entered into various capital lease obligations for the use of certain computer equipment. The Company currently has short term capital lease obligations totaling $200 at June 30, 2016 . Included in property and equipment are assets under capital leases totaling $2,329 , which have accumulated depreciation totaling $898 .
Revolving credit facility
The revolving credit facility provides for borrowings of up to $300,000 , which may be increased by the Company at any time until maturity to $600,000 . The credit facility bears interest at a variable rate equal to (a) a rate based on LIBOR or (b) an alternate base rate (the highest of (i) the Prime Rate for such day, (ii) the sum of the Federal Funds Effective Rate for such day plus 0.50% and (iii) the Eurocurrency Rate for a one month Interest Period on such day for dollars plus 1.0% ), plus an applicable percentage in each case determined by the Company's leverage ratio. The credit facility is guaranteed by certain subsidiaries of the Company. The credit facility is subject to various financial covenants that require the Company to maintain certain financial ratios as defined in the agreement. As of June 30, 2016 , the Company was in compliance with all such covenants. The revolving loan terminates February 20, 2020 and at June 30, 2016 there was no outstanding balance.
49
Table of Contents
Other lines of credit
The Company renewed an unsecured bank credit line on March 3, 2014 which provides for funding of up to $5,000 and bears interest at the prime rate less 1% . The credit line was renewed through April 30, 2017 . At June 30, 2016 , no amount was outstanding.
Interest
The Company paid interest of $1,320 , $1,111 , and $620 during the years ended June 30, 2016 , 2015 , and 2014 , respectively.
NOTE 6. COMMITMENTS AND CONTINGENCIES
Litigation
We are subject to various routine legal proceedings and claims, including the following:
In 2013 a patent infringement lawsuit entitled DataTreasury Corporation v. Jack Henry & Associates, Inc. et. al . was filed against the Company, several subsidiaries and a number of customer financial institutions in the US District Court for the Eastern District of Texas. The complaint seeks damages, interest, injunctive relief, and attorneys' fees for the alleged infringement of two patents, as well as trebling of damage awards for alleged willful infringement. We believe we have strong defenses and have defended the lawsuit vigorously. A part of that defense has been the filing of challenges to the validity of plaintiff's patents in post-grant proceedings at the Patent Trial and Appeal Board ("PTAB") of the U.S. Patent and Trademark Office. On April 29 and July 8, and September 1 2015, the PTAB issued decisions holding that all relevant claims of the plaintiff's patents are unpatentable and invalid. DataTreasury has appealed the PTAB decisions to the U.S. Court of Appeals for the Federal Circuit. At this stage, we cannot make a reasonable estimate of possible loss or range of loss, if any, arising from this lawsuit.
Property and Equipment
The Company had no material commitments at June 30, 2016 to purchase property and equipment. There were $13,089 material commitments at June 30, 2015 , mainly related to the purchase of aircraft.
Leases
The Company leases certain property under operating leases which expire over the next 14 years, but certain of the leases contain options to extend the lease term. All lease payments are based on the lapse of time but include, in some cases, payments for operating expenses and property taxes. There are no purchase options on real estate leases at this time. Certain leases on real estate are subject to annual escalations for increases in operating expenses and property taxes.
As of June 30, 2016 , net future minimum lease payments are as follows:
Years Ending June 30, | Lease Payments | ||
2017 | $ | 9,515 | |
2018 | 8,519 | | |
2019 | 5,967 | | |
2020 | 4,865 | | |
2021 | 3,587 | | |
Thereafter | 16,921 | | |
Total | $ | 49,374 | |
Rent expense was $10,167 , $9,547 , and $8,609 in 2016 , 2015 , and 2014 respectively.
50
Table of Contents
NOTE 7. INCOME TAXES
The provision for income taxes from continuing operations consists of the following:
| Year Ended June 30, | ||||||||||
| 2016 |
| 2015 |
| 2014 | ||||||
Current: |
|
|
|
|
| ||||||
Federal | $ | 66,574 | |
| $ | 70,555 | |
| $ | 77,937 | |
State | 7,571 | |
| 5,221 | |
| 10,166 | | |||
Deferred: |
|
|
|
|
| ||||||
Federal | 34,355 | |
| 28,018 | |
| 10,636 | | |||
State | 3,169 | |
| 1,425 | |
| 2,116 | | |||
| $ | 111,669 | |
| $ | 105,219 | |
| $ | 100,855 | |
The tax effects of temporary differences related to deferred taxes shown on the balance sheets were:
| June 30, | ||||||
| 2016 |
| 2015 | ||||
Deferred tax assets: |
|
|
| ||||
Contract and service revenues and costs | $ | 69,597 | |
| $ | 68,503 | |
Expense reserves (bad debts, insurance, franchise tax and vacation) | 14,770 | |
| 14,612 | | ||
Net operating loss carryforwards | 3,543 | |
| 3,682 | | ||
Other, net | 2,090 | |
| 1,493 | | ||
Total gross deferred tax assets | 90,000 | |
| 88,290 | | ||
Valuation allowance | (608 | ) |
| (650 | ) | ||
Net deferred tax assets | 89,392 | |
| 87,640 | | ||
|
|
|
| ||||
Deferred tax liabilities: |
|
|
| ||||
Accelerated tax depreciation | (40,857 | ) |
| (32,331 | ) | ||
Accelerated tax amortization | (160,719 | ) |
| (142,776 | ) | ||
Contract and service revenues and costs | (76,417 | ) |
| (69,790 | ) | ||
Total gross deferred liabilities | (277,993 | ) |
| (244,897 | ) | ||
|
|
|
| ||||
Net deferred tax liability | $ | (188,601 | ) |
| $ | (157,257 | ) |
The following analysis reconciles the statutory federal income tax rate to the effective income tax rates reflected above:
| Year Ended June 30, | |||||||
| 2016 |
| 2015 |
| 2014 | |||
Computed "expected" tax expense | 35.0 | % |
| 35.0 | % |
| 35.0 | % |
Increase (reduction) in taxes resulting from: |
|
|
|
|
| |||
State income taxes, net of federal income tax benefits | 1.9 | % |
| 1.4 | % |
| 2.8 | % |
Research and development credit | (2.5 | )% |
| (1.5 | )% |
| (0.8 | )% |
Domestic production activities deduction | (1.9 | )% |
| (2.0 | )% |
| (2.2 | )% |
Tax over book basis in subsidiary stock | (1.7 | )% |
| - | % |
| - | % |
Other (net) | 0.2 | % |
| 0.4 | % |
| 0.3 | % |
| 31.0 | % |
| 33.3 | % |
| 35.1 | % |
As of June 30, 2016 , we have $6,048 of gross net operating loss ("NOL") carryforwards pertaining to the acquisition of Goldleaf Financial Solutions, Inc., which are expected to be utilized after the application of IRC Section 382. Separately, as of June 30, 2016 , we have state NOL carryforwards with a tax-effected value of $1,470 . The federal and state losses have varying expiration dates, ranging from 2016 to 2035 . Based on state tax rules which restrict our utilization of these losses, we believe it is more likely than not that $608 of these losses will expire unutilized. Accordingly, a valuation allowance of $608 and $650 has been recorded against these assets as of June 30, 2016 and 2015 , respectively.
51
Table of Contents
The Company paid income taxes of $90,307 , $61,885 , and $83,014 in 2016 , 2015 , and 2014 respectively.
At June 30, 2016 , the Company had $7,421 of gross unrecognized tax benefits, $5,986 of which, if recognized, would affect our effective tax rate. At June 30, 2015 , the Company had $7,104 of unrecognized tax benefits, $5,193 of which, if recognized, would affect our effective tax rate. We had accrued interest and penalties of $1,178 and $1,120 related to uncertain tax positions at June 30, 2016 and 2015 , respectively. The income tax provision included interest expense and penalties (or benefits) on unrecognized tax benefits of $47 , $(155) , and $582 in the years ending June 30, 2016 , 2015 , and 2014 , respectively.
A reconciliation of the unrecognized tax benefits for the years ended June 30, 2016 and 2015 follows:
| Unrecognized Tax Benefits | ||
Balance at July 1, 2014 | $ | 7,834 | |
Additions for current year tax positions | 1,351 | | |
Reductions for current year tax positions | (56 | ) | |
Additions for prior year tax positions | 483 | | |
Reductions for prior year tax positions | (998 | ) | |
Reductions related to expirations of statute of limitations | (1,510 | ) | |
Balance at June 30, 2015 | 7,104 | | |
Additions for current year tax positions | 1,581 | | |
Reductions for current year tax positions | (56 | ) | |
Additions for prior year tax positions | 507 | | |
Reductions for prior year tax positions | (38 | ) | |
Reductions related to expirations of statute of limitations | (1,677 | ) | |
Balance at June 30, 2016 | $ | 7,421 | |
During the period ended June 30, 2016 , the Internal Revenue Service commenced an examination of the Company's U.S. federal income tax returns for fiscal years ended June 30, 2014 and 2015 . The examination is ongoing. At this time, it is anticipated that the examination will not result in a material change to the Company's financial statements.
The U.S. federal and state income tax returns for June 30, 2013 and all subsequent years remain subject to examination as of June 30, 2016 under statute of limitations rules. We anticipate that potential changes due to lapsing statutes of limitations and examination closures could reduce the unrecognized tax benefits balance by $1,500 - $3,000 within twelve months of June 30, 2016 .
NOTE 8. INDUSTRY AND SUPPLIER CONCENTRATIONS
The Company sells its products to banks, credit unions, and financial institutions throughout the United States and generally does not require collateral. All billings to customers are due 30 days from date of billing. Reserves (which are insignificant at June 30, 2016 , 2015 , and 2014 ) are maintained for potential credit losses.
In addition, the Company purchases most of its computer hardware and related maintenance for resale in relation to installation of JHA software systems from two suppliers. There are a limited number of hardware suppliers for these required items. If these relationships were terminated, it could have a negative impact on the operations of the Company.
NOTE 9. STOCK-BASED COMPENSATION
Our pre-tax operating income for the years ended June 30, 2016 , 2015 , and 2014 includes $10,720 , $10,112 , and $10,091 of equity-based compensation costs, respectively, of which $9,712 , $9,251 , and $9,335 relates to the restricted stock plans, respectively. The income tax benefits from stock option exercises and restricted stock vests totaled $1,051 , $4,343 , and $3,420 for the years ended June 30, 2016 , 2015 , and 2014 , respectively.
2005 NSOP and 1996 SOP
The Company previously issued options to employees under the 1996 Stock Option Plan ("1996 SOP") and to outside directors under the 2005 Non-Qualified Stock Option Plan ("2005 NSOP").
The 1996 SOP was adopted by the Company on October 29, 1996 , for its employees. Terms and vesting periods of the options were determined by the Compensation Committee of the Board of Directors when granted and for options outstanding include vesting periods up to four years. Shares of common stock were reserved for issuance under this
52
Table of Contents
plan at the time of each grant, which must be at or above fair market value of the stock at the grant date. The options terminate 30 days after termination of employment, 3 months after retirement, one year after death or 10 years after the date of grant. The plan terminated by its terms on October 29, 2006 . No options previously granted under the 1996 SOP remain outstanding and vested at June 30, 2016 .
The 2005 NSOP was adopted by the Company on September 23, 2005 , for its outside directors. Generally, options are exercisable beginning 6 months after grant at an exercise price equal to the fair market value of the stock at the grant date. For individuals who have served less than four continuous years, 25% of all options will vest after one year of service, 50% shall vest after two years, and 75% shall vest after three years of service on the Board. The options terminate upon surrender of the option, upon the expiration of one year following notification of a deceased optionee, or 10 years after grant. 700 shares of common stock have been reserved for issuance under this plan with a maximum of 100 for each director.
A summary of option plan activity under the plan is as follows:
| Number of Shares |
| Weighted Average Exercise Price |
| Aggregate Intrinsic Value | |||||
Outstanding July 1, 2013 | 144 | |
| 21.79 | |
|
| |||
Granted | - | |
| - | |
|
| |||
Forfeited | - | |
| - | |
|
| |||
Exercised | (19 | ) |
| 18.42 | |
|
| |||
Outstanding July 1, 2014 | 125 | |
| 22.29 | |
|
| |||
Granted | - | |
| - | |
|
| |||
Forfeited | - | |
| - | |
|
| |||
Exercised | (25 | ) |
| 19.17 | |
|
| |||
Outstanding July 1, 2015 | 100 | |
| 23.07 | |
|
| |||
Granted | - | |
| - | |
|
| |||
Forfeited | - | |
| - | |
|
| |||
Exercised | (50 | ) |
| 23.99 | |
|
| |||
Outstanding June 30, 2016 | 50 | |
| $ | 22.14 | |
| $ | 3,256 | |
Vested June 30, 2016 | 50 | |
| $ | 22.14 | |
| $ | 3,256 | |
Exercisable June 30, 2016 | 50 | |
| $ | 22.14 | |
| $ | 3,256 | |
There were no options granted during any period presented. Compensation cost related to outstanding options has now been fully recognized. The weighted average remaining contractual term on options currently exercisable as of June 30, 2016 was 2.57 years .
The total intrinsic value of options exercised was $3,011 , $1,044 , and $704 for the fiscal years ended June 30, 2016 , 2015 , and 2014 , respectively.
Restricted Stock Plan and 2015 Equity Incentive Plan
The Restricted Stock Plan was adopted by the Company on November 1, 2005 , for its employees. The plan expired on November 1, 2015 . Up to 3,000 shares of common stock were available for issuance under the plan. The 2015 Equity Incentive Plan was adopted by the company on November 10, 2015 for its employees. Up to 3,000 shares of common stock are available for issuance under the 2015 Equity Incentive Plan. Upon issuance, shares of restricted stock are subject to forfeiture and to restrictions which limit the sale or transfer of the shares during the restriction period. The restrictions will be lifted over periods ranging from 3 years to 7 years from grant date.
53
Table of Contents
The following table summarizes non-vested share awards activity:
Share awards | Shares |
| Weighted Average Grant Date Fair Value | |||
Outstanding July 1, 2013 | 252 | |
| 25.92 | | |
Granted | 30 | |
| 54.13 | | |
Vested | (143 | ) |
| 24.41 | | |
Forfeited | (1 | ) |
| 22.17 | | |
Outstanding July 1, 2014 | 138 | |
| 33.56 | | |
Granted | 12 | |
| 57.77 | | |
Vested | (71 | ) |
| 35.69 | | |
Forfeited | (7 | ) |
| 46.39 | | |
Outstanding July 1, 2015 | 72 | |
| 34.28 | | |
Granted | 22 | |
| 66.31 | | |
Vested | (24 | ) |
| 43.45 | | |
Forfeited | (12 | ) |
| 23.82 | | |
Outstanding June 30, 2016 | 58 | |
| $ | 44.95 | |
The non-vested share awards do not participate in dividends during the restriction period. As a result, the weighted-average fair value of the non-vested share awards was based on the fair market value of the Company's equity shares on the grant date, less the present value of the expected future dividends to be declared during the restriction period, consistent with the methodology for calculating compensation expense on such awards.
At June 30, 2016 , there was $913 of compensation expense that has yet to be recognized related to non-vested restricted stock share awards, which will be recognized over a weighted-average period of 0.69 years .
An amendment to the Restricted Stock Plan was adopted by the Company on August 20, 2010 . Unit awards were made to employees remaining in continuous employment throughout the performance period and vary based on the Company's percentile ranking in Total Shareholder Return ("TSR") over the performance period compared to a peer group of companies. TSR is defined as the change in the stock price through the performance period plus dividends per share paid during the performance period, all divided by the stock price at the beginning of the performance period. It is the intention of the Company to settle the unit awards in shares of the Company's stock. Certain Restricted Stock Unit awards are not tied to performance goals, and for such awards, vesting occurs over a period of 1 to 3 years.
The following table summarizes non-vested unit awards as of June 30, 2016 , as well as activity for the year then ended:
Unit awards | Shares |
| Weighted Average Grant Date Fair Value |
| Aggregate | ||
Outstanding July 1, 2013 | 814 | |
| 23.08 | |
|
|
Granted | 164 | |
| 48.21 | |
|
|
Vested | (168 | ) |
| 15.77 | |
|
|
Forfeited | (101 | ) |
| 15.77 | |
|
|
Outstanding July 1, 2014 | 709 | |
| 31.66 | |
|
|
Granted | 178 | |
| 53.62 | |
|
|
Vested | (277 | ) |
| 19.69 | |
|
|
Forfeited | (111 | ) |
| 22.74 | |
|
|
Outstanding July 1, 2015 | 499 | |
| 48.13 | |
|
|
Granted | 130 | |
| 75.99 | |
|
|
Vested | (99 | ) |
| 44.09 | |
|
|
Forfeited | (101 | ) |
| 45.89 | |
|
|
Outstanding June 30, 2016 | 429 | |
| $58.06 |
| $37,415 | |
54
Table of Contents
The Company utilized a Monte Carlo pricing model customized to the specific provisions of the Company's plan design to value unit awards subject to performance targets on the grant dates. The weighted average assumptions used in this model to estimate fair value at the grant dates are as follows:
| Year Ended June 30, | |||||||
| 2016 | |
| 2015 | |
| 2014 | |
Volatility | 15.6 | % |
| 17.8 | % |
| 21.6 | % |
Risk free interest rate | 1.06 | % |
| 1.06 | % |
| 0.91 | % |
Dividend yield | 1.5 | % |
| 1.5 | % |
| 1.6 | % |
Stock Beta | 0.741 | |
| 0.765 | |
| 0.837 | |
For the year ended June 30, 2016 , 118 unit awards were granted and measured using the above assumptions. The remaining 12 unit awards granted are not subject to performance targets, and therefore the estimated fair value at measurement date is valued in the same manner as restricted stock award grants.
At June 30, 2016 , there was $9,822 of compensation expense that has yet to be recognized related to non-vested restricted stock unit awards, which will be recognized over a weighted-average period of 1.09 years .
The fair value of restricted shares at vest date totaled $8,677 , $20,275 , and $16,070 for the years ended June 30, 2016 , 2015 , and 2014 , respectively.
NOTE 10. EARNINGS PER SHARE
The following table reflects the reconciliation between basic and diluted earnings per share.
| Year Ended June 30, | ||||||||||
| 2016 |
| 2015 |
| 2014 | ||||||
Net Income | $ | 248,867 | |
| $ | 211,221 | |
| $ | 186,715 | |
Common share information: |
|
|
|
|
| ||||||
Weighted average shares outstanding for basic earnings per share | 79,416 | |
| 81,353 | |
| 84,866 | | |||
Dilutive effect of stock options and restricted stock | 318 | |
| 248 | |
| 530 | | |||
Weighted average shares outstanding for diluted earnings per share | 79,734 | |
| 81,601 | |
| 85,396 | | |||
Basic earnings per share | $ | 3.13 | |
| $ | 2.60 | |
| $ | 2.20 | |
Diluted earnings per share | $ | 3.12 | |
| $ | 2.59 | |
| $ | 2.19 | |
Per share information is based on the weighted average number of common shares outstanding for each of the fiscal years. Stock options and restricted stock have been included in the calculation of earnings per share to the extent they are dilutive. The two-class method for computing EPS has not been applied because no outstanding awards participate in dividends. There were no anti-dilutive stock options and restricted stock excluded for fiscal 2016, no shares excluded for fiscal 2015, and 24 shares excluded for fiscal 2014.
NOTE 11. EMPLOYEE BENEFIT PLANS
The Company established an employee stock purchase plan in 2006 . The plan allows the majority of employees the opportunity to directly purchase shares of the Company at a 15% discount. The plan does not meet the criteria as a non-compensatory plan. As a result, the Company records the total dollar value of the stock discount given to employees under the plan as expense. Total expense recorded by the Company under the plan for the year ended June 30, 2016 , 2015 and 2014 was $1,008 , $861 and $756 , respectively.
The Company has a defined contribution plan for its employees: the 401(k) Retirement Savings Plan (the "Plan"). The Plan is subject to the Employee Retirement Income Security Act of 1975 ("ERISA") as amended. Under the Plan, the Company matches 100% of full time employee contributions up to 5% of compensation subject to a maximum of $5 per year. In order to receive matching contributions, employees must be 18 years of age and be employed for at least six months . The Company has the option of making a discretionary contribution; however, none has been made for any of the three most recent fiscal years. The total matching contributions for the Plan were $16,794 , $15,378 , and $13,617 for fiscal 2016 , 2015 and 2014 , respectively.
55
Table of Contents
NOTE 12. BUSINESS ACQUISITION
Bayside Business Solutions, Inc.
Effective July 1, 2015 , the Company acquired all of the equity interests of Bayside Business Solutions, an Alabama-based company that provides technology solutions and payment processing services primarily for the financial services industry, for $10,000 paid in cash. This acquisition was funded using existing operating cash. The acquisition of Bayside Business Solutions expanded the Company's presence in commercial lending within the industry.
Management has completed a purchase price allocation of Bayside Business Solutions and its assessment of the fair value of acquired assets and liabilities assumed. The recognized amounts of identifiable assets acquired and liabilities assumed, based upon their fair values as of July 1, 2015 are set forth below:
Current assets | $ | 1,922 | |
Long-term assets | 253 | | |
Identifiable intangible assets | 5,005 | | |
Total liabilities assumed | (3,279 | ) | |
Total identifiable net assets | 3,901 | | |
Goodwill | 6,099 | | |
Net assets acquired | $ | 10,000 | |
The goodwill of $6,099 arising from this acquisition consists largely of the growth potential, synergies and economies of scale expected from combining the operations of the Company with those of Bayside Business Solutions, together with the value of Bayside Business Solutions' assembled workforce. Goodwill from this acquisition has been allocated to our Banking Systems and Services segment. The goodwill is not expected to be deductible for income tax purposes.
Identifiable intangible assets from this acquisition consist of customer relationships of $3,402 , $659 of computer software and other intangible assets of $944 . The weighted average amortization period for acquired customer relationships, acquired computer software, and other intangible assets is 15 years , 5 years , and 20 years , respectively.
Current assets were inclusive of cash acquired of $1,725 . The fair value of current assets acquired included accounts receivable of $178 . The gross amount of receivables was $178 , none of which was expected to be uncollectible.
During fiscal year 2016, the Company incurred $55 in costs related to the acquisition of Bayside Business Solutions. These costs included fees for legal, valuation and other fees. These costs were included within general and administrative expenses.
The results of Bayside Business Solutions' operations included in the Company's consolidated statement of income for the twelve months ended June 30, 2016 included revenue of $4,273 and after-tax net income of $303 .
The accompanying consolidated statements of income for the fiscal year ended June 30, 2016 do not include any revenues and expenses related to this acquisition prior to the acquisition date. The impact of this acquisition was considered immaterial to both the current and prior periods of our consolidated financial statements and pro forma financial information has not been provided.
Banno, LLC
Effective March 1, 2014 , the Company acquired all of the equity interests of Banno, an Iowa-based company that provides Web and transaction marketing services with a focus on the mobile medium, for $27,910 paid in cash. This
acquisition was funded using existing operating cash. The acquisition of Banno expanded the Company's presence in online and mobile technologies within the industry.
During fiscal year 2014, the Company incurred $30 in costs related to the acquisition of Banno. These costs included fees for legal, valuation and other fees. These costs were included within general and administrative expenses. The results of Banno's operations included in the Company's consolidated statements of income for the year ended June 30, 2016 included revenue of $6,393 and after-tax net loss of $1,289 . For the year ended June 30, 2015 , our consolidated statements of income included revenue of $4,175 and after-tax net loss of $1,784 attributable to Banno. The results of Banno's operations included in the Company's consolidated statement of operations from the acquisition date to June 30, 2014 included revenue of $848 and after-tax net loss of $1,121 .
The accompanying consolidated statements of income for the twelve month period ended June 30, 2016 do not include any revenues and expenses related to this acquisition prior to the acquisition date. The impact of this acquisition was considered immaterial to both the current and prior periods of our consolidated financial statements and pro forma financial information has not been provided.
56
Table of Contents
NOTE 13. REPORTABLE SEGMENT INFORMATION
The Company is a provider of integrated computer systems that perform data processing (available for in-house installations or outsourced services) for banks and credit unions. The Company's operations are classified into two reportable segments: bank systems and services ("Bank") and credit union systems and services ("Credit Union"). The Company evaluates the performance of its segments and allocates resources to them based on various factors, including prospects for growth, return on investment, and return on revenue.
| Year Ended | ||||||||||
| June 30, 2016 | ||||||||||
| Bank |
| Credit Union |
| Total | ||||||
REVENUE |
|
|
|
|
| ||||||
License | $ | 2,536 | |
| $ | 505 | |
| $ | 3,041 | |
Support and service | 960,738 | |
| 340,240 | |
| 1,300,978 | | |||
Hardware | 33,394 | |
| 17,233 | |
| 50,627 | | |||
Total revenue | 996,668 | |
| 357,978 | |
| 1,354,646 | | |||
COST OF SALES |
|
|
|
|
| ||||||
Cost of license | 1,058 | |
| 139 | |
| 1,197 | | |||
Cost of support and service | 564,851 | |
| 172,257 | |
| 737,108 | | |||
Cost of hardware | 23,159 | |
| 12,187 | |
| 35,346 | | |||
Total cost of sales | 589,068 | |
| 184,583 | |
| 773,651 | | |||
GROSS PROFIT | $ | 407,600 | |
| $ | 173,395 | |
| 580,995 | | |
|
|
|
|
|
| ||||||
OPERATING EXPENSES |
|
|
|
| 219,336 | | |||||
|
|
|
|
|
| ||||||
INTEREST INCOME (EXPENSE) |
|
|
|
| (1,123 | ) | |||||
|
|
|
|
|
| ||||||
INCOME BEFORE INCOME TAXES |
|
|
|
| $ | 360,536 | | ||||
57
Table of Contents
| Year Ended | ||||||||||
| June 30, 2015 | ||||||||||
| Bank |
| Credit Union |
| Total | ||||||
REVENUE |
|
|
|
|
| ||||||
License | $ | 1,727 | |
| $ | 908 | |
| $ | 2,635 | |
Support and service | 922,545 | |
| 278,107 | |
| 1,200,652 | | |||
Hardware | 38,457 | |
| 14,446 | |
| 52,903 | | |||
Total revenue | 962,729 | |
| 293,461 | |
| 1,256,190 | | |||
COST OF SALES |
|
|
|
|
| ||||||
Cost of license | 832 | |
| 355 | |
| 1,187 | | |||
Cost of support and service | 533,407 | |
| 147,343 | |
| 680,750 | | |||
Cost of hardware | 27,831 | |
| 10,568 | |
| 38,399 | | |||
Total cost of sales | 562,070 | |
| 158,266 | |
| 720,336 | | |||
GROSS PROFIT | $ | 400,659 | |
| $ | 135,195 | |
| 535,854 | | |
|
|
|
|
|
| ||||||
OPERATING EXPENSES |
|
|
|
| 217,989 | | |||||
|
|
|
|
|
| ||||||
INTEREST INCOME (EXPENSE) |
|
|
|
| (1,425 | ) | |||||
|
|
|
|
|
| ||||||
INCOME BEFORE INCOME TAXES |
|
|
|
| $ | 316,440 | | ||||
| Year Ended | ||||||||||
| June 30, 2014 | ||||||||||
| Bank |
| Credit Union |
| Total | ||||||
REVENUE |
|
|
|
|
| ||||||
License | $ | 1,514 | |
| $ | 670 | |
| $ | 2,184 | |
Support and service | 853,500 | |
| 258,831 | |
| 1,112,331 | | |||
Hardware | 42,657 | |
| 16,001 | |
| 58,658 | | |||
Total revenue | 897,671 | |
| 275,502 | |
| 1,173,173 | | |||
COST OF SALES |
|
|
|
|
| ||||||
Cost of license | 555 | |
| 353 | |
| 908 | | |||
Cost of support and service | 492,777 | |
| 141,979 | |
| 634,756 | | |||
Cost of hardware | 31,866 | |
| 11,842 | |
| 43,708 | | |||
Total cost of sales | 525,198 | |
| 154,174 | |
| 679,372 | | |||
GROSS PROFIT | $ | 372,473 | |
| $ | 121,328 | |
| 493,801 | | |
|
|
|
|
|
| ||||||
OPERATING EXPENSES |
|
|
|
| 205,503 | | |||||
|
|
|
|
|
| ||||||
INTEREST INCOME (EXPENSE) |
|
|
|
| (728 | ) | |||||
|
|
|
|
|
| ||||||
INCOME BEFORE INCOME TAXES |
|
|
|
| $ | 287,570 | | ||||
58
Table of Contents
| Year Ended June 30, | ||||||||||
| 2016 |
| 2015 |
| 2014 | ||||||
Depreciation expense |
|
|
|
|
| ||||||
Bank systems and services | $ | 47,076 | |
| $ | 50,154 | |
| $ | 48,382 | |
Credit Unions systems and services | 3,495 | |
| 4,001 | |
| 4,553 | | |||
Total | $ | 50,571 | |
| $ | 54,155 | |
| $ | 52,935 | |
Amortization expense |
|
|
|
|
| ||||||
Bank systems and services | $ | 58,914 | |
| $ | 47,502 | |
| $ | 39,152 | |
Credit Unions systems and services | 20,163 | |
| 17,339 | |
| 15,684 | | |||
Total | $ | 79,077 | |
| $ | 64,841 | |
| $ | 54,836 | |
Capital expenditures |
|
|
|
|
| ||||||
Bank systems and services | $ | 54,529 | |
| $ | 53,730 | |
| $ | 32,736 | |
Credit Unions systems and services | 1,796 | |
| 679 | |
| 449 | | |||
Total | $ | 56,325 | |
| $ | 54,409 | |
| $ | 33,185 | |
| June 30, |
| June 30, | ||||
| 2016 |
| 2015 | ||||
Property and equipment, net |
|
|
| ||||
Bank systems and services | $ | 269,020 | |
| $ | 263,231 | |
Credit Union systems and services | 29,544 | |
| 33,101 | | ||
Total | $ | 298,564 | |
| $ | 296,332 | |
Intangible assets, net |
|
|
| ||||
Bank systems and services | $ | 682,229 | |
| $ | 664,231 | |
Credit Union systems and services | 232,530 | |
| 233,918 | | ||
Total | $ | 914,759 | |
| $ | 898,149 | |
The Company has not disclosed any additional asset information by segment, as the information is not produced internally and its preparation is impracticable.
NOTE 14: SUBSEQUENT EVENTS
Dividends
On August 19, 2016 , the Company's Board of Directors declared a cash dividend of $0.28 per share on its common
stock, payable on September 27, 2016 to shareholders of record on September 7, 2016 .
59
Table of Contents
QUARTERLY FINANCIAL INFORMATION
(unaudited)
| For the Year Ended June 30, 2016 | ||||||||||||||||||
| Quarter 1 |
| Quarter 2 |
| Quarter 3 |
| Quarter 4 |
| Total | ||||||||||
REVENUE |
|
|
|
|
|
|
|
|
| ||||||||||
License | $ | 1,604 | |
| $ | 634 | |
| $ | 292 | |
| $ | 511 | |
| $ | 3,041 | |
Support and service | 307,746 | |
| 320,219 | |
| 319,649 | |
| 353,364 | |
| 1,300,978 | | |||||
Hardware | 12,268 | |
| 12,019 | |
| 13,245 | |
| 13,095 | |
| 50,627 | | |||||
Total revenue | 321,618 | |
| 332,872 | |
| 333,186 | |
| 366,970 | |
| 1,354,646 | | |||||
COST OF SALES |
|
|
|
|
|
|
|
|
| ||||||||||
Cost of license | 181 | |
| 498 | |
| 193 | |
| 325 | |
| 1,197 | | |||||
Cost of support and service | 174,714 | |
| 181,989 | |
| 184,527 | |
| 195,878 | |
| 737,108 | | |||||
Cost of hardware | 8,768 | |
| 7,958 | |
| 9,553 | |
| 9,067 | |
| 35,346 | | |||||
Total cost of sales | 183,663 | |
| 190,445 | |
| 194,273 | |
| 205,270 | |
| 773,651 | | |||||
GROSS PROFIT | 137,955 | |
| 142,427 | |
| 138,913 | |
| 161,700 | |
| 580,995 | | |||||
OPERATING EXPENSES |
|
|
|
|
|
|
|
|
| ||||||||||
Selling and marketing | 21,751 | |
| 22,231 | |
| 22,732 | |
| 23,365 | |
| 90,079 | | |||||
Research and development | 18,554 | |
| 18,862 | |
| 19,854 | |
| 23,964 | |
| 81,234 | | |||||
General and administrative | 17,113 | |
| 16,547 | |
| 16,497 | |
| 17,357 | |
| 67,514 | | |||||
Gain on disposal of a business | - | |
| - | |
| - | |
| (19,491 | ) |
| (19,491 | ) | |||||
Total operating expenses | 57,418 | |
| 57,640 | |
| 59,083 | |
| 45,195 | |
| 219,336 | | |||||
OPERATING INCOME | 80,537 | |
| 84,787 | |
| 79,830 | |
| 116,505 | |
| 361,659 | | |||||
INTEREST INCOME (EXPENSE) |
|
|
|
|
|
|
|
|
| ||||||||||
Interest income | 113 | |
| 91 | |
| 54 | |
| 49 | |
| 307 | | |||||
Interest expense | (220 | ) |
| (276 | ) |
| (486 | ) |
| (448 | ) |
| (1,430 | ) | |||||
Total interest income (expense) | (107 | ) |
| (185 | ) |
| (432 | ) |
| (399 | ) |
| (1,123 | ) | |||||
INCOME BEFORE INCOME TAXES | 80,430 | |
| 84,602 | |
| 79,398 | |
| 116,106 | |
| 360,536 | | |||||
PROVISION FOR INCOME TAXES | 29,064 | |
| 25,254 | |
| 25,515 | |
| 31,836 | |
| 111,669 | | |||||
NET INCOME | $ | 51,366 | |
| $ | 59,348 | |
| $ | 53,883 | |
| $ | 84,270 | |
| $ | 248,867 | |
|
|
|
|
|
|
|
|
|
| | |||||||||
Basic earnings per share | $ | 0.64 | |
| $ | 0.75 | |
| $ | 0.68 | |
| $ | 1.07 | |
| $ | 3.13 | |
Basic weighted average shares outstanding | 80,545 | |
| 79,473 | |
| 78,805 | |
| 78,841 | |
| 79,416 | | |||||
|
|
|
|
|
|
|
|
|
| ||||||||||
Diluted earnings per share | $ | 0.64 | |
| $ | 0.74 | |
| $ | 0.68 | |
| $ | 1.06 | |
| $ | 3.12 | |
Diluted weighted average shares outstanding | 80,735 | |
| 79,770 | |
| 79,167 | |
| 79,261 | |
| 79,734 | | |||||
60
Table of Contents
| For the Year Ended June 30, 2015 | ||||||||||||||||||
| Quarter 1 |
| Quarter 2 |
| Quarter 3 |
| Quarter 4 |
| Total | ||||||||||
REVENUE |
|
|
|
|
|
|
|
|
| ||||||||||
License | $ | 503 | |
| $ | 491 | |
| $ | 569 | |
| $ | 1,072 | |
| $ | 2,635 | |
Support and service | 288,216 | |
| 296,905 | |
| 296,896 | |
| 318,635 | |
| 1,200,652 | | |||||
Hardware | 12,755 | |
| 13,898 | |
| 12,244 | |
| 14,006 | |
| 52,903 | | |||||
Total revenue | 301,474 | |
| 311,294 | |
| 309,709 | |
| 333,713 | |
| 1,256,190 | | |||||
COST OF SALES |
|
|
|
|
|
|
|
|
| ||||||||||
Cost of license | 409 | |
| 308 | |
| 285 | |
| 185 | |
| 1,187 | | |||||
Cost of support and service | 165,090 | |
| 170,377 | |
| 168,457 | |
| 176,826 | |
| 680,750 | | |||||
Cost of hardware | 9,385 | |
| 9,574 | |
| 9,152 | |
| 10,288 | |
| 38,399 | | |||||
Total cost of sales | 174,884 | |
| 180,259 | |
| 177,894 | |
| 187,299 | |
| 720,336 | | |||||
GROSS PROFIT | 126,590 | |
| 131,035 | |
| 131,815 | |
| 146,414 | |
| 535,854 | | |||||
OPERATING EXPENSES |
|
|
|
|
|
|
|
|
| ||||||||||
Selling and marketing | 21,663 | |
| 22,175 | |
| 21,674 | |
| 23,492 | |
| 89,004 | | |||||
Research and development | 16,791 | |
| 17,681 | |
| 17,522 | |
| 19,501 | |
| 71,495 | | |||||
General and administrative | 16,510 | |
| 18,388 | |
| 15,417 | |
| 14,049 | |
| 64,364 | | |||||
Gain on disposal of a business | - | |
| (6,874 | ) |
| - | |
| - | |
| (6,874 | ) | |||||
Total operating expenses | 54,964 | |
| 51,370 | |
| 54,613 | |
| 57,042 | |
| 217,989 | | |||||
OPERATING INCOME | 71,626 | |
| 79,665 | |
| 77,202 | |
| 89,372 | |
| 317,865 | | |||||
INTEREST INCOME (EXPENSE) |
|
|
|
|
|
|
|
|
| ||||||||||
Interest income | 57 | |
| 28 | |
| 33 | |
| 51 | |
| 169 | | |||||
Interest expense | (266 | ) |
| (337 | ) |
| (669 | ) |
| (322 | ) |
| (1,594 | ) | |||||
Total interest income (expense) | (209 | ) |
| (309 | ) |
| (636 | ) |
| (271 | ) |
| (1,425 | ) | |||||
INCOME BEFORE INCOME TAXES | 71,417 | |
| 79,356 | |
| 76,566 | |
| 89,101 | |
| 316,440 | | |||||
PROVISION FOR INCOME TAXES | 25,329 | |
| 25,474 | |
| 25,854 | |
| 28,562 | |
| 105,219 | | |||||
NET INCOME | $ | 46,088 | |
| $ | 53,882 | |
| $ | 50,712 | |
| $ | 60,539 | |
| $ | 211,221 | |
|
|
|
|
|
|
|
|
|
| | |||||||||
Basic net income per share | $ | 0.56 | |
| $ | 0.66 | |
| $ | 0.63 | |
| $ | 0.75 | |
| $ | 2.60 | |
Basic weighted average shares outstanding | 82,195 | |
| 81,432 | |
| 80,880 | |
| 80,904 | |
| 81,353 | | |||||
|
|
|
|
|
|
|
|
|
| ||||||||||
Diluted net income per share | $ | 0.56 | |
| $ | 0.66 | |
| $ | 0.63 | |
| $ | 0.75 | |
| $ | 2.59 | |
Diluted weighted average shares outstanding | 82,589 | |
| 81,634 | |
| 81,094 | |
| 81,086 | |
| 81,601 | | |||||
61
Table of Contents
ITEM 9. CHANGES IN AND DISAGREEMENTS WITH ACCOUNTANTS ON ACCOUNTING AND FINANCIAL DISCLOSURES
None.
ITEM 9A. CONTROLS AND PROCEDURES
Disclosure Controls and Procedures
As of the end of the period covered by this Annual Report on Form 10-K, an evaluation was carried out under the supervision and with the participation of our management, including our Company's Chief Executive Officer (CEO) and Chief Financial Officer (CFO), of the effectiveness of the design and operation of our disclosure controls and procedures pursuant to Exchange Act Rules 13a-15 and 15d-15. Based upon that evaluation, the CEO and CFO concluded that our disclosure controls and procedures are effective to ensure that information we are required to disclose in reports that we file or submit under the Exchange Act is recorded, processed, summarized and reported within the time periods specified in SEC rules and forms. For this purpose, disclosure controls and procedures include controls and procedures designed to ensure that information required to be disclosed under the Exchange Act is accumulated and communicated to the Company's management, including the CEO and CFO, as appropriate to allow timely decisions regarding required disclosure.
Management's Report on Internal Control over Financial Reporting
The Management's Report on Internal Control over Financial Reporting required by this Item 9A is in Item 8, "Financial Statements and Supplementary Data." The Company's independent registered public accounting firm has audited our internal control over financial reporting as of June 30, 2016 ; their report is included in Item 8 of this Form 10-K.
Remediation of Prior Period Material Weakness
As of June 30, 2015, we reported a material weakness in our controls over revenue recognition. A material weakness is a deficiency, or a combination of deficiencies, in internal control over financial reporting such that there is a reasonable possibility that a material misstatement of the Company's annual or interim financial statements will not be prevented or detected on a timely basis.
There were a number of deficiencies in the design and operating effectiveness of internal control over financial reporting that, in the aggregate, constituted a material weakness. The material weakness resulted from a failure in the Company's risk assessment process wherein the risk assessment process did not identify or evaluate the inherent risks and complexities associated with accounting for revenue arrangements with software elements. To remediate the material weakness reported in the Form 10-K for the year ended June 30, 2015, we designed and implemented new controls and enhanced and revised the design of existing controls and procedures to apply proper revenue recognition accounting under ASC 985 and ASC 605.
The Company successfully completed documentation and the testing of the new and enhanced controls and, as of June 30, 2016 , has concluded that the material weakness has been remediated.
Changes in Internal Control over Financial Reporting
Except as noted in the Remediation of Prior Period Material Weakness section above, there has been no change in internal control over financial reporting that has materially affected, or is reasonably likely to affect, the Company's internal control over financial reporting.
ITEM 9B. OTHER INFORMATION
None.
62
Table of Contents
PART III
Information required by Items 10, 11, 12, 13 and 14 of Part III is omitted from this report and will be filed within 120 days after the Company's June 30, 2016 fiscal year end in the definitive proxy statement for our 2016 Annual Meeting of Stockholders (the "Proxy Statement").
ITEM 10. DIRECTORS, EXECUTIVE OFFICERS AND CORPORATE GOVERNANCE
See the information under the captions "Election of Directors", "Corporate Governance", "Section 16(a) Beneficial Ownership Reporting Compliance", and " Executive Officers and Significant Employees " in the Proxy Statement, which is incorporated herein by reference.
ITEM 11. EXECUTIVE COMPENSATION
See the information under captions "Corporate Governance", "Director Compensation", "Compensation Committee Report", "Compensation Discussion and Analysis", "Compensation and Risk", and "Executive Compensation" in the Proxy Statement, which is incorporated herein by reference.
ITEM 12. SECURITY OWNERSHIP OF CERTAIN BENEFICIAL OWNERS AND MANAGEMENT AND RELATED STOCKHOLDER MATTERS
See the information under the captions "Stock Ownership of Certain Stockholders" and "Equity Compensation Plan Information" in the Proxy Statement, which is incorporated herein by reference.
ITEM 13. CERTAIN RELATIONSHIPS AND RELATED TRANSACTIONS, AND DIRECTOR INDEPENDENCE
See the information under the captions "Election of Directors - Director Independence" and "Certain Relationships and Related Transactions" in the Proxy Statement, which is incorporated herein by reference.
ITEM 14. PRINCIPAL ACCOUNTANT FEES AND SERVICES
See the information under the captions "Audit Committee Report" and "Ratification of the Selection of Independent Registered Public Accounting Firm" in the Proxy Statement, which is incorporated herein by reference.
63
PART IV
ITEM 15. EXHIBITS AND FINANCIAL STATEMENT SCHEDULES
(a) The following documents are filed as part of this Report:
(1) The following Consolidated Financial Statements of the Company and its subsidiaries and the Report of Independent Registered Public Accounting Firm thereon appear under Item 8 of this Report:
- Reports of Independent Registered Public Accounting Firm
- Consolidated Statements of Income for the years ended June 30, 2016 , 2015 and 2014
- Consolidated Balance Sheets as of June 30, 2016 and 2015
- Consolidated Statements of Changes in Stockholders' Equity for the years ended June 30, 2016 , 2015 and 2014
- Consolidated Statements of Cash Flows for the years ended June 30, 2016 , 2015 and 2014
- Notes to the Consolidated Financial Statements
(2) The following Financial Statement Schedules filed as part of this Report appear under Item 8 of this Report:
There are no schedules included because they are not applicable or the required information is shown in the Consolidated Financial Statements or Notes thereto.
(3) See "Index to Exhibits" set forth below.
All exhibits not attached hereto are incorporated by reference to a prior filing as indicated.
Index to Exhibits
Exhibit No. Description
3.1.7 | Restated Certificate of Incorporation attached as Exhibit 3.1.7 to the Company's Annual Report on Form 10-K for the Year ended June 30, 2003. |
3.2.6 | Restated and Amended Bylaws attached as Exhibit 3.2.6 to the Company's Current Report on Form 8-K filed February 17, 2016. |
10.8 | Form of Indemnity Agreement entered into as of August 27, 1996, between the Company and each of its Directors and Executive Officers, attached as Exhibit 10.8 to the Company's Annual Report on Form 10-K for the Year Ended June 30, 1996. |
10.29 | Jack Henry & Associates, Inc. 2006 Employee Stock Purchase Plan attached as Exhibit 10.29 to the Company's Current Report on Form 8-K filed November 6, 2006. |
10.32 | Form of Restricted Stock Agreement (executives) attached as Exhibit 10.32 to the Company's Current Report on Form 8-K filed September 10, 2007. |
10.34 | Amendment No. 2 to Jack Henry & Associates, Inc. 2006 Employee Stock Purchase Plan attached as Exhibit 10.34 to the Company's Current Report on Form 8-K filed November 1, 2007. |
10.38 | Jack Henry & Associates, Inc. 2005 Non-Qualified Stock Option Plan, as amended and restated May 9, 2008, attached as Exhibit 10.38 to the Company's Annual Report on Form 10-K filed August 29, 2008. |
10.39 | Revised Form of Restricted Stock Agreement (executives) attached as Exhibit 10.39 to the Company's Quarterly Report on Form 10-Q filed November 6, 2009. |
10.43 | Jack Henry & Associates Inc. Restricted Stock Plan, as amended and restated effective November 9, 2010, attached as Exhibit 10.1 to the Company's Current Report on Form 8-K filed November 12, 2010. |
Table of Contents
10.44 | Form of Performance Shares Agreement attached as Exhibit 10.1 to the Company's Current Report on Form 8-K filed September 12, 2012. |
10.45 | Jack Henry & Associates, Inc. 2012 Annual Incentive Plan, effective September 1, 2012 and approved by the stockholders on November 14, 2012, attached as Exhibit 10.1 to the Company's Current Report on Form 8-K filed November 16, 2012. |
10.46 | Jack Henry & Associates, Inc. 2005 Non-Qualified Stock Option Plan, as amended August 20, 2010, attached as Exhibit 10.1 to the Company's Quarterly Report on form 10-Q filed February 7, 2013. |
10.47 | Form of Restricted Stock Agreement (independent directors) attached as Exhibit 10.47 to the Company's Quarterly Report on Form 10-Q filed November 8, 2013. |
10.48 | Form of Termination Benefits Agreements (executives) attached as Exhibit 10.48 to the Company's Quarterly Report on Form 10-Q filed February 6, 2014. |
10.49 | Jack Henry & Associates, Inc. Deferred Compensation Plan attached as Exhibit 10.49 to the Company's Quarterly Report on Form 10-Q filed November 5, 2014. |
10.50 | Jack Henry & Associates, Inc. Non-Employee Directors Deferred Compensation Plan attached as Exhibit 10.50 to the Company's Quarterly Report on Form 10-Q filed November 5, 2014. |
10.51 | Form of Performance Shares Agreement (executives) attached as Exhibit 10.51 to the Company's Quarterly Report on Form 10-Q filed November 5, 2014. |
10.52 | Credit Agreement among Jack Henry & Associates, Inc., U.S. Bank National Association and certain other Lenders, attached as Exhibit 10.52 to the Company's Current Report on Form 8-K filed February 24, 2015. |
10.53 | Form of Restricted Stock Unit Agreement (Non-Employee Directors) attached as Exhibit 10.52 to the Company's Quarterly Report on Form 10-Q filed June 25, 2015. |
10.54 | First Amendment to Credit Agreement attached as Exhibit 10.53 to the Company's Quarterly Report on Form 10-Q filed June 25, 2015. |
10.55 | Second Amendment to Credit Agreement attached as Exhibit 10.54 to the Company's Quarterly Report on Form 10-Q filed June 25, 2015. |
10.56 | Jack Henry & Associates, Inc. 2015 Equity Incentive Plan attached as Exhibit 10.56 to the Company's Current Report on Form 8-K filed November 16, 2015. |
10.57 | Form of Restricted Stock Unit Agreement (non-employee directors) attached as Exhibit 10.57 to the Company's Quarterly Report on Form 10-Q filed February 5, 2016. |
10.58 | Form of Nonqualified Stock Option Agreement (executives) attached as Exhibit 10.58 to the Company's Current Report on Form 8-K filed July 1, 2016. |
10.59 | Form of Restricted Stock Agreement (executives) attached as Exhibit 10.59 to the Company's Current Report on Form 8-K filed July 1, 2016. |
21.1 | List of the Company's subsidiaries. |
23.1 | Consent of Independent Registered Public Accounting Firm- PricewaterhouseCoopers LLP. |
23.2 | Consent of Independent Registered Public Accounting Firm- Deloitte & Touche LLP. |
31.1 | Certification of the Chief Executive Officer. |
65
Table of Contents
31.2 | Certification of the Chief Financial Officer. |
32.1 | Written Statement of the Chief Executive Officer Pursuant to 18 U.S.C. Section 1350. |
32.2 | Written Statement of the Chief Financial Officer Pursuant to 18 U.S.C. Section 1350. |
101.INS* | XBRL Instance Document |
101.SCH* | XBRL Taxonomy Extension Schema Document |
101.CAL* | XBRL Taxonomy Extension Calculation Linkbase Document |
101.DEF* | XBRL Taxonomy Extension Definition Linkbase Document |
101.LAB* | XBRL Taxonomy Extension Label Linkbase Document |
101.PRE* | XBRL Taxonomy Extension Presentation Linkbase Document |
* Furnished with this report on Form 10-K are the following documents formatted in XBRL (Extensible Business Reporting Language): (i) the Consolidated Balance Sheets at June 30, 2016 and June 30, 2015 , (ii) the Consolidated Statements of Income for the years ended June 30, 2016 , 2015 and 2014 , (iii) the Consolidated Statements of Shareholders' Equity for the years ended June 30, 2016 , 2015 and 2014 , (iv) the Consolidated Statements of Cash Flows for the years ended June 30, 2016 , 2015 and 2014 , and (v) Notes to Consolidated Financial Statements.
ITEM 16. FORM 10-K SUMMARY
None.
66
Table of Contents
SIGNATURES
Pursuant to the requirements of Section 13 or 15(d) of the Securities Exchange Act of 1934, the registrant has duly caused this report to be signed on its behalf by the undersigned, thereunto duly authorized this 29th day of August, 2016 .
JACK HENRY & ASSOCIATES, INC., Registrant
By /s/ David B. Foss
Chief Executive Officer
Pursuant to the requirements of the Securities Exchange Act of 1934, this report has been signed below by the following persons on behalf of the registrant and in the capacities and on the dates indicated:
|
|
|
Signature | Capacity | Date |
|
|
|
|
|
|
/s/ John F. Prim | Executive Chairman of the Board and Director | August 29, 2016 |
|
|
|
/s/ David B. Foss David B. Foss | President and Chief Executive Officer (Principal Executive Officer) | August 29, 2016 |
|
|
|
/s/ Kevin D. Williams Kevin D. Williams | Chief Financial Officer and Treasurer (Principal Accounting Officer) | August 29, 2016 |
|
|
|
/s/ Matthew Flanigan Matthew Flanigan | Director | August 29, 2016 |
|
|
|
/s/ Tom H. Wilson, Jr Tom H. Wilson, Jr | Director | August 29, 2016 |
|
|
|
/s/ Jacqueline R. Fiegel Jacqueline R. Fiegel | Director | August 29, 2016 |
|
|
|
/s/ Thomas A. Wimsett Thomas A. Wimsett | Director | August 29, 2016 |
|
|
|
/s/ Laura G. Kelly Laura G. Kelly | Director | August 29, 2016 |
|
|
|
/s/ Shruti Miyashiro Shruti S. Miyashiro | Director | August 29, 2016 |
|
|
|
/s/ Wesley A. Brown Wesley A. Brown | Director | August 29, 2016 |
67