Table of Contents
|
UNITED STATES
SECURITIES AND EXCHANGE COMMISSION
WASHINGTON, D.C. 20549
|
FORM 10-K
|
ý | ANNUAL REPORT PURSUANT TO SECTION 13 OR 15(d) OF THE SECURITIES EXCHANGE ACT OF 1934 |
For the fiscal year ended November 30, 2016
OR
¨ | TRANSITION REPORT PURSUANT TO SECTION 13 OR 15(d) OF THE SECURITIES EXCHANGE ACT OF 1934 |
For the transition period from to
Commission file number 1-14947
|
JEFFERIES GROUP LLC
(Exact name of registrant as specified in its charter)
|
Delaware | 95-4719745 |
(State or other jurisdiction of incorporation or organization) | (I.R.S. Employer Identification No.) |
|
|
520 Madison Avenue, New York, New York | 10022 |
(Address of principal executive offices) | (Zip Code) |
Registrant's telephone number, including area code: (212) 284-2550
Securities registered pursuant to Section 12(b) of the Act:
Title of each class: |
| Name of each exchange on which registered: |
5.125% Senior Notes Due 2023 |
| New York Stock Exchange |
Securities registered pursuant to Section 12(g) of the Act: Limited Liability Company Interests
|
Indicate by check mark if the registrant is a well-known seasoned issuer, as defined in Rule 405 of the Securities Act. Yes ý No ¨
Indicate by check mark if the registrant is not required to file reports pursuant to Section 13 or Section 15(d) of the Act. Yes ¨ No ý
Indicate by check mark whether the registrant (1) has filed all reports required to be filed by Section 13 or 15(d) of the Securities Exchange Act of 1934 during the preceding 12 months (or for such shorter period that the registrant was required to file such reports), and (2) has been subject to such filing requirements for the past 90 days. Yes ý No ¨
Indicate by check mark whether the registrant has submitted electronically and posted on its corporate Web site, if any, every Interactive Data File required to be submitted and posted pursuant to Rule 405 of Regulation S-T (§ 232.405 of this chapter) during the preceding 12 months (or for such shorter period that the registrant was required to submit and post such files). Yes ý No ¨
Indicate by check mark if disclosure of delinquent filers pursuant to Item 405 of Regulation S-K (§ 232.405 of this chapter) is not contained herein, and will not be contained, to the best of registrant's knowledge, in definitive proxy or information statements incorporated by reference in Part III of this Form 10-K or any amendment to this Form 10-K. ý
Indicate by check mark whether the registrant is a large accelerated filer, an accelerated filer, a non-accelerated filer, or a smaller reporting company. See the definitions of "large accelerated filer," "accelerated filer" and "smaller reporting company" in Rule 12b-2 of the Exchange Act.
Large accelerated filer ☐ | Accelerated filer ☐ |
Non-accelerated filer ☒ | Smaller reporting company ☐ |
Indicate by check mark whether the registrant is a shell company (as defined in Rule 12b-2 of the Act). Yes ¨ No ý
State the aggregate market value of the voting and non-voting common equity held by non-affiliates computed by reference to the price at which the common equity was last sold, or the average bid and asked price of such common equity, as of the last business day of the registrant's most recently completed second fiscal quarter. $0 as of May 31, 2016.
The Registrant is a wholly-owned subsidiary of Leucadia National Corporation and meets the conditions set forth in General Instructions I(1)(a) and (b) of Form 10-K and is therefore filing this Form 10-K with a reduced disclosure format as permitted by Instruction I(2).
Table of Contents
JEFFERIES GROUP LLC
INDEX TO QUARTERLY REPORT ON FORM 10-K
November 30, 2016
PART I. | |
| Page |
Item 1. Business | 3 |
Item 1A. Risk Factors | 6 |
Item 1B. Unresolved Staff Comments | 11 |
Item 2. Properties | 11 |
Item 3. Legal Proceedings | 12 |
Item 4. Mine Safety Disclosures | 12 |
|
|
PART II. FINANCIAL INFORMATION | |
|
|
Item 5. Market for Registrant's Common Equity, Related Stockholder Matters and Issuer Purchases Equity Securities | 13 |
Item 6. Selected Financial Data | 13 |
Item 7. Management's Discussion and Analysis of Financial Condition and Results of Operations | 13 |
Consolidated Results of Operations | 14 |
Executive Summary | 14 |
Revenues by Source | 16 |
Non-interest Expenses | 21 |
Accounting Developments | 23 |
Critical Accounting Policies | 24 |
Liquidity, Financial Condition and Capital Resources | 26 |
Risk Management | 37 |
Item 7A. Quantitative and Qualitative Disclosures About Market Risk | 44 |
Item 8. Financial Statements and Supplementary Data | 45 |
Index to Consolidated Financial Statements | 45 |
Management's Report on Internal Control Over Financial Reporting | 46 |
Report of Independent Registered Public Accounting Firm | 47 |
Consolidated Statements of Financial Condition | 48 |
Consolidated Statements of Earnings | 49 |
Consolidated Statements of Comprehensive Income | 50 |
Consolidated Statements of Changes in Equity | 51 |
Consolidated Statements of Cash Flows | 52 |
Notes to Consolidated Financial Statements | 54 |
Item 9. Changes in and Disagreements with Accountants on Accounting and Financial Disclosure | 120 |
Item 9A. Controls and Procedures | 120 |
Item 9B. Other Information | 120 |
| |
1
Table of Contents
PART III. OTHER INFORMATION | |
|
|
Item 10. Directors, Executive Officers and Corporate Governance | 120 |
Item 11. Executive Compensation | 120 |
Item 12. Security Ownership of Certain Beneficial Owners and Management and Related Stockholder Matters | 120 |
Item 13. Certain Relationships and Related Transactions, and Director Independence | 120 |
Item 14. Principal Accountant Fees and Services | 121 |
|
|
PART IV. EXHIBTS AND SIGNATURES | |
|
|
Item 15. Exhibits and Financial Statement Schedules | 122 |
Item 16. Form 10-K Summary | 122 |
Signatures | 123 |
2
Table of Contents
JEFFERIES GROUP LLC AND SUBSIDIARIES
PART I
Item 1. Business
Introduction
Jefferies Group LLC and its subsidiaries operate as a global full service, integrated securities and investment banking firm. Our largest subsidiary, Jefferies LLC ("Jefferies"), was founded in the U.S. in 1962 and our first international operating subsidiary, Jefferies International Limited ("Jefferies Europe"), was established in the U.K. in 1986. On March 1, 2013, we became an indirect wholly owned subsidiary of Leucadia National Corporation ("Leucadia") (referred to herein as the "Leucadia Transaction"). Richard Handler, our Chief Executive Officer and Chairman, is Leucadia's Chief Executive Officer and Brian P. Friedman, our Chairman of the Executive Committee, is Leucadia's President. Messrs. Handler and Friedman are also Leucadia Directors. We are an SEC reporting company and retain a credit rating separate from Leucadia.
At November 30, 2016 , we had 3,329 employees in the Americas, Europe, the Middle East and Asia. Our global headquarters and executive offices are located at 520 Madison Avenue, New York, New York 10022. We also have regional headquarters in London and Hong Kong. Our primary telephone number is (212) 284-2550 and our Internet address is jefferies.com .
The following documents and reports are available on our public website:
• | Earnings Releases and Other Public Announcements |
• | Annual and interim reports on Form 10-K; |
• | Quarterly reports on Form 10-Q; |
• | Current reports on Form 8-K; |
• | Code of Ethics; |
• | Reportable waivers, if any, from our Code of Ethics by our executive officers; |
• | Board of Directors Corporate Governance Guidelines; |
• | Charter of the Corporate Governance and Nominating Committee of the Board of Directors; |
• | Charter of the Compensation Committee of the Board of Directors; |
• | Charter of the Audit Committee of the Board of Directors; and |
• | Any amendments to the above-mentioned documents and reports. |
We expect to use our website as a main form of communication of significant news. We encourage you to visit our website for additional information. In addition, you may also obtain a printed copy of any of the above documents or reports by sending a request to Investor Relations, Jefferies Group LLC, 520 Madison Avenue, New York, NY 10022, by calling 221-284-2550 or by sending an email to [email protected].
Business Segments
We report our activities in two business segments: Capital Markets and Asset Management .
• | Capital Markets includes our investment banking, sales and trading and other related services. Investment banking provides capital markets and financial advisory services to our clients across most industry sectors in the Americas, Europe and Asia. Our sales and trading businesses include market-making, sales and financing across the spectrum of equities, fixed income and foreign exchange products. Related services include, among other things, prime brokerage, research and corporate lending. |
• | Asset Management provides investment management services to investors in the U.S. and overseas. |
Financial information regarding our reportable business segments for the years ended November 30, 2016 , 2015 and 2014 is set forth in Note 20, Segment Reporting in our consolidated financial statements included within this Annual Report on Form 10-K in Part II, Item 8.
Our Businesses
Capital Markets
Our Capital Markets segment focuses on Equities, Fixed Income and Investment Banking. We primarily serve institutional investors, corporations and government entities.
3
Table of Contents
JEFFERIES GROUP LLC AND SUBSIDIARIES
Equities
Equities Research, Sales and Trading
We provide our clients full-service equities research, sales and trading capabilities across global securities markets. We earn commissions or spread revenue by executing, settling and clearing transactions for clients across these markets in equity and equity-related products, including common stock, American depository receipts, global depository receipts, exchange-traded funds, exchange-traded and over-the-counter ("OTC") equity derivatives, convertible and other equity-linked products and closed-end funds. Our equity research, sales and trading efforts are organized across three geographical regions: the Americas; Europe and the Middle East and Africa ("EMEA"); and Asia Pacific. Our main product lines within the regions are cash equities, electronic trading, equity derivatives and convertibles. Our clients are primarily institutional market participants such as mutual funds, hedge funds, investment advisors, pension and profit sharing plans and insurance companies. Through our global research team and sales force, we maintain relationships with our clients, distribute investment research and strategy, trading ideas, market information and analyses across a range of industries and receive and execute client orders. Our equity research covers over 2,000 companies around the world and a further nearly 700 companies are covered by nine leading local firms in Asia Pacific with whom we maintain alliances.
Equity Finance
Our Equity Finance business provides financing, securities lending and other prime brokerage services. We offer prime brokerage services in the U.S. that provide hedge funds, money managers and registered investment advisors with execution, financing, clearing, reporting and administrative services. We finance our clients' securities positions through margin loans that are collateralized by securities, cash or other acceptable liquid collateral. We earn an interest spread equal to the difference between the amount we pay for funds and the amount we receive from our clients. We also operate a matched book in equity and corporate bond securities, whereby we borrow and lend securities versus cash or liquid collateral and earn a net interest spread. We offer selected prime brokerage clients the option of custodying their assets at an unaffiliated U.S. broker-dealer that is a subsidiary of a bank holding company. Under this arrangement, we directly provide our clients with all customary prime brokerage services.
Wealth Management
We provide tailored wealth management services designed to meet the needs of high net worth individuals, their families and their businesses, private equity and venture funds and small institutions. Our advisors provide access to all of our institutional execution capabilities and deliver other financial services. Our open architecture platform affords clients access to products and services from both our firm and from a variety of other major financial services institutions.
Fixed Income
Fixed Income Sales and Trading
We provide our clients with sales and trading of investment grade corporate bonds, U.S. and European government and agency securities, municipal bonds, mortgage- and asset-backed securities, leveraged loans, high yield and distressed securities, emerging markets debt, interest rate derivative products, as well as foreign exchange trade execution. Jefferies is designated as a Primary Dealer by the Federal Reserve Bank of New York and Jefferies International Limited is designated in similar capacities for several countries in Europe. Additionally, through the use of repurchase agreements, we act as an intermediary between borrowers and lenders of short-term funds and obtain funding for various of our inventory positions. We trade and make markets globally in cleared and uncleared swaps and forwards referencing, among other things, interest rates, investment grade and non-investment grade corporate credits, credit indexes and asset-backed security indexes.
Our strategists and economists provide ongoing commentary and analysis of the global fixed income markets. In addition, our fixed income desk strategists provide ideas and analysis across a variety of fixed income products.
Futures
In April 2015 we entered into a definitive agreement to transfer certain of our futures activities to Société Générale S.A. That transaction closed in the second quarter of 2015 and we completed the exit of our Futures business during the second quarter of 2016.
Investment Banking
We provide our clients around the world with a full range of equity capital markets, debt capital markets and financial advisory services. Our services are enhanced by our deep industry expertise, our global distribution capabilities and our senior level commitment to our clients.
Approximately 760 investment banking professionals operate in the Americas, Europe and Asia, and are organized into industry, product and geographic coverage groups. Our industry coverage groups include: Consumer & Retail, Energy, Financial Institutions, Healthcare, Industrials, Real Estate, Gaming & Lodging, Technology, Media & Telecommunications, Financial Sponsors and
4
Table of Contents
JEFFERIES GROUP LLC AND SUBSIDIARIES
Public Finance. Our product coverage groups include equity capital markets, debt capital markets, and advisory, which includes both mergers and acquisitions and restructuring and recapitalization expertise. Our geographic coverage groups include coverage teams based in major cities in the United States, Toronto, London, Frankfurt, Paris, Milan, Stockholm, Mumbai, Hong Kong, Singapore and Dubai.
Equity Capital Markets
We provide a broad range of equity financing capabilities to companies and financial sponsors. These capabilities include private equity placements, initial public offerings, follow-on offerings, block trades and equity-linked convertible securities transactions.
Debt Capital Markets
We provide a wide range of debt and acquisition financing capabilities for companies, financial sponsors and government entities. We focus on structuring, underwriting and distributing public and private debt, including investment grade debt, high yield bonds, leveraged loans, municipal debt, mortgage and other asset-backed securities, and liability management solutions.
Advisory Services
We provide mergers and acquisition and restructuring and recapitalization services to companies, financial sponsors and government entities. In the mergers and acquisition area, we advise sellers and buyers on corporate sales and divestitures, acquisitions, mergers, tender offers, spinoffs, joint ventures, strategic alliances and takeover and proxy fight defense. In the restructuring and recapitalization area, we provide to companies, bondholders and lenders a full range of restructuring advisory capabilities as well as expertise in the structuring, valuation and placement of securities issued in recapitalizations.
Asset Management
Through Jefferies Investment Advisers, LLC ("JIA") and partnerships with Leucadia Asset Management, LLC ("LAM"), we manage and provide services to a diverse group of alternative asset management platforms across a spectrum of investment strategies and asset classes. We are supporting and developing focused strategies managed by distinct management teams. Strategies currently offered by JIA to pension funds, insurance companies, sovereign wealth funds, and other institutional investors through these platforms include systematic quant and global equity event-driven.
Leucadia has made investments in certain managed accounts and funds managed by these programs and, accordingly, a portion of the net results are allocated directly to Leucadia.
Competition
All aspects of our business are intensely competitive. We compete primarily with large global bank holding companies that engage in capital markets activities, but also with firms listed in the NYSE Arca Securities Broker/Dealer Index, other brokers and dealers, and investment banking firms. The large global bank holding companies have substantially greater capital and resources than we do. We believe that the principal factors affecting our competitive standing include the quality, experience and skills of our professionals, the depth of our relationships, the breadth of our service offerings, our ability to deliver consistently our integrated capabilities, and our culture, tenacity and commitment to serve our clients.
Regulation
Regulation in the United States. The financial services industry in which we operate is subject to extensive regulation. In the U.S., the Securities and Exchange Commission ("SEC") is the federal agency responsible for the administration of federal securities laws, and the Commodity Futures Trading Commission ("CFTC") is the federal agency responsible for the administration of laws relating to commodity interests (including futures and swaps). In addition, self-regulatory organizations, principally Financial Industry Regulatory Authority ("FINRA") and the National Futures Association ("NFA"), are actively involved in the regulation of financial services businesses. The SEC, CFTC and self-regulatory organizations conduct periodic examinations of broker-dealers, investment advisers, futures commission merchants ("FCMs") and swap dealers. The applicable self-regulatory authority for Jefferies' activities as a broker-dealer is FINRA, and the applicable self-regulatory authority for Jefferies' FCM activities is the National Futures Association ("NFA"). Financial services businesses are also subject to regulation by state securities commissions and attorneys general in those states in which they do business.
5
Table of Contents
JEFFERIES GROUP LLC AND SUBSIDIARIES
Broker-dealers are subject to SEC and FINRA regulations that cover all aspects of the securities business, including sales and trading methods, trade practices among broker-dealers, use and safekeeping of customers' funds and securities, capital structure of securities firms, anti-money laundering efforts, recordkeeping and the conduct of directors, officers and employees. Registered advisors are subject to, among other requirements, SEC regulations concerning marketing, transactions with affiliates, disclosure to clients, and recordkeeping; and advisors that are also registered as commodity trading advisors or commodity pool operators are also subject to regulation by the CFTC and the NFA. FCMs, introducing brokers and swap dealers that engage in commodities, futures or swap transactions are subject to regulation by the CFTC and the NFA. Additional legislation, changes in rules promulgated by the SEC, CFTC and self-regulatory organizations, or changes in the interpretation or enforcement of existing laws and rules may directly affect the operations and profitability of broker-dealers, investment advisers, FCMs and swap dealers. The SEC, the CFTC, self-regulatory organizations, state securities commissions and state attorneys general may conduct administrative proceedings or initiate civil litigation that can result in censure, fine, suspension, expulsion of a firm, its officers or employees, or revocation of a firm's licenses.
Regulatory Capital Requirements. Several of our entities are subject to financial capital requirements that are set by regulation. Jefferies and Jefferies Execution Services, Inc. ("Jefferies Execution"), are registered broker-dealers and are subject to the SEC's Uniform Net Capital Rule (the "Net Capital Rule"). Jefferies and Jefferies Execution have elected to compute their minimum net capital requirement in accordance with the "Alternative Net Capital Requirement" as permitted by the Net Capital Rule, which provides that a broker-dealer shall not permit its net capital, as defined, to be less than the greater of 2% of its aggregate debit balances (primarily customer-related receivables) or $250,000 ($1.5 million for prime brokers). Compliance with the Net Capital Rule could limit operations of our broker-dealers, such as underwriting and trading activities, that could require the use of significant amounts of capital, and may also restrict their ability to make loans, advances, dividends and other payments.
Jefferies is also registered as an FCM and is therefore subject to the minimum financial requirements for FCMs set by the CFTC. Jefferies as an FCM is required to maintain minimum net capital being the greater of $1.0 million or its risk-based capital requirements computed as 8% of the total risk margin requirements for positions carried by the FCM in customer accounts and non-customer accounts. Jefferies, as a dually registered broker-dealer and FCM, is required to maintain net capital in excess of the greater of the SEC or CFTC minimum financial requirements.
Our subsidiaries that are registered swap dealers will become subject to capital requirements under the Dodd-Frank Act once the relevant rules become final. For additional information see Item 1A. Risk Factors - "Recent legislation and new and pending regulation may significantly affect our business."
Jefferies Group LLC is not subject to any regulatory capital rules.
See Net Capital within Item 7. Management's Discussion and Analysis and Note 19, Net Capital Requirements in this Annual Report on Form 10-K for additional discussion of net capital calculations.
Regulation outside the United States. We are an active participant in the international capital markets and provide investment banking services internationally, primarily in Europe and Asia. As is true in the U.S., our subsidiaries are subject to extensive regulations proposed, promulgated and enforced by, among other regulatory bodies, the European Commission and European Supervisory Authorities (including the European Banking Authority and European Securities and Market Authority), U.K. Financial Conduct Authority, Hong Kong Securities and Futures Commission, the Japan Financial Services Agency and the Monetary Authority of Singapore. Every country in which we do business imposes upon us laws, rules and regulations similar to those in the U.S., including with respect to some form of capital adequacy rules, customer protection rules, data protection regulations, anti-money laundering and anti-bribery rules, compliance with other applicable trading and investment banking regulations and similar regulatory reform. For additional information see Item 1A. Risk Factors - "Extensive international regulation of our business limits our activities, and, if we violate these regulations, we may be subject to significant penalties."
Item 1A. Risk Factors
Factors Affecting Our Business
The following factors describe some of the assumptions, risks, uncertainties and other factors that could adversely affect our business or that could otherwise result in changes that differ materially from our expectations. In addition to the specific factors mentioned in this report, we may also be affected by other factors that affect businesses generally such as global or regional changes in economic, business or political conditions, acts of war, terrorism and natural disasters.
6
Table of Contents
JEFFERIES GROUP LLC AND SUBSIDIARIES
Recent legislation and new and pending regulation may significantly affect our business.
In recent years, there has been significant legislation and increased regulation affecting the financial services industry. These legislative and regulatory initiatives affect not only us, but also our competitors and certain of our clients. These changes could have an effect on our revenue and profitability, limit our ability to pursue certain business opportunities, impact the value of assets that we hold, require us to change certain business practices, impose additional costs on us and otherwise adversely affect our business. Accordingly, we cannot provide assurance that legislation and regulation will not eventually have an adverse effect on our business, results of operations, cash flows and financial condition.
Many of these new laws and rules are the result of commitments made since 2008 by leaders of the G-20 nations to reduce the systemic risk arising from financial derivatives. Title VII of the Dodd-Frank Act and the rules and regulations adopted and to be adopted by the SEC and CFTC introduce a comprehensive regulatory regime for swaps and security-based swaps and parties that deal in such swaps and security-based swaps. Two of our subsidiaries are registered as swap dealers with the CFTC and are members of the NFA. We may also register one or more additional subsidiaries as security-based swap dealers with the SEC in the future. Title VII and related impending regulations subject certain swaps and security-based swaps to clearing and exchange trading requirements and subject swap dealers and security-based swap dealers to significant new burdens. We have already incurred significant compliance and operational costs as a result of the Dodd-Frank Act, and when all the final rules contemplated by Title VII have been implemented, our swap dealer entities will also be subject to mandatory capital and margin requirements that will likely have an effect on our business. While there continues to be uncertainty about the full impact of these changes, we will continue to be subject to a more complex regulatory framework, and will incur costs to comply with new requirements as well as to monitor for compliance in the future.
Section 619 of the Dodd-Frank Act (Volcker Rule) limits certain proprietary trading by banking entities such as banks, bank holding companies and similar institutions. Although we are not a banking entity and are not otherwise subject to these rules, some of our clients and many of our counterparties are banks or entities affiliated with banks and are subject to these restrictions. The effects of the Volcker Rule and related regulations on the depth, liquidity and pricing in swaps and securities markets has yet to be completely assessed. Negative effects could result from an expansive extraterritorial application of the Dodd-Frank Act in general or the Volcker Rule in particular and/or insufficient international coordination with respect to adoption of rules for derivatives and other financial reforms in other jurisdictions.
In addition, the scope, timing and final implementation of regulatory reform, including as a result of the recent U.S. presidential and congressional elections, is uncertain and could negatively impact our business.
Extensive international regulation of our business limits our activities, and, if we violate these regulations, we may be subject to significant penalties.
The financial services industry is subject to extensive laws, rules and regulations in every country in which we operate. Firms that engage in securities and derivatives trading, wealth and asset management and investment banking must comply with the laws, rules and regulations imposed by national and state governments and regulatory and self-regulatory bodies with jurisdiction over such activities. Such laws, rules and regulations cover all aspects of the financial services business, including, but not limited to, sales and trading methods, trade practices, use and safekeeping of customers' funds and securities, capital structure, anti-money laundering and anti-bribery and corruption efforts, recordkeeping and the conduct of directors, officers and employees.
Each of our regulators supervises our business activities to monitor compliance with such laws, rules and regulations in the relevant jurisdiction. In addition, if there are instances in which our regulators question our compliance with laws, rules, and regulations, they may investigate the facts and circumstances to determine whether we have complied. At any moment in time, we may be subject to one or more such investigation or similar reviews. At this time, all such investigations and similar reviews are insignificant in scope and immaterial to us. However, there can be no assurance that, in the future, the operations of our businesses will not violate such laws, rules, or regulations and such investigations and similar reviews will not result in adverse regulatory requirements, regulatory enforcement actions and/or fines.
7
Table of Contents
JEFFERIES GROUP LLC AND SUBSIDIARIES
The European Market Infrastructure Regulation ("EMIR") relating to derivatives was enacted in August 2012 and, in common with the Dodd-Frank Act in the U.S., is intended, among other things, to reduce counterparty risk by requiring standardized over-the-counter derivatives be cleared through a central counterparty and reported to registered trade repositories and making uncleared OTC derivatives subject to mandatory margining. EMIR is being introduced in phases in the European Union (including the U.K.), with implementation of additional requirements expected through 2019. The European Union finalized the Markets in Financial Instruments Regulation and a revision of the Market in Financial Instruments Directive, both of which are expected to become effective in January 2018. These give effect to the commitments of the Group of Twenty Finance Ministers and Central Bank Governors, including new market structure-related, reporting, investor protection-related and organizational requirements, requirements on pre- and post-trade transparency, requirements to use certain venues when trading financial instruments (which includes certain derivative instruments), requirements affecting the way investment managers can obtain research, powers of regulators to impose position limits and provisions on regulatory sanctions. The European Union is also currently considering or executing upon significant revisions to laws covering: resolution of banks, investment firms and market infrastructure; administration of financial benchmarks; credit rating activities; anti-money-laundering controls; data security and privacy; remuneration principles and proportionality; disclosures under the Basel regime aiming to increase market transparency and consistency and corporate governance in financial firms.
Additional legislation, changes in rules, changes in the interpretation or enforcement of existing laws and rules, or the entering into businesses that subject us to new rules and regulations may directly affect our business, results of operations and financial condition. We continue to monitor the impact of new U.S. and international regulation on our businesses.
Changing financial, economic and political conditions could result in decreased revenues, losses or other adverse consequences.
As a global securities and investment banking firm, global or regional changes in the financial markets or economic and political conditions could adversely affect our business in many ways, including the following:
• | A market downturn could lead to a decline in the volume of transactions executed for customers and, therefore, to a decline in the revenues we receive from commissions and spreads. |
• | Unfavorable conditions or changes in general political, economic or market conditions, including general uncertainty regarding the U.S. economic environment as a result of the recent U.S. presidential election, could reduce the number and size of transactions in which we provide underwriting, financial advisory and other services. Our investment banking revenues, in the form of financial advisory and sales and trading or placement fees, are directly related to the number and size of the transactions in which we participate and could therefore be adversely affected by unfavorable financial, economic or political conditions. |
• | Adverse changes in the market could lead to losses from principal transactions and inventory positions. |
• | Adverse changes in the market could also lead to a reduction in revenues from asset management fees and investment income from managed funds and losses on our own capital invested in managed funds. Even in the absence of a market downturn, below-market investment performance by our funds and portfolio managers could reduce asset management revenues and assets under management and result in reputational damage that might make it more difficult to attract new investors. |
• | Limitations on the availability of credit can affect our ability to borrow on a secured or unsecured basis, which may adversely affect our liquidity and results of operations. Global market and economic conditions have been particularly disrupted and volatile in the last several years and may be in the future. Our cost and availability of funding could be affected by illiquid credit markets and wider credit spreads. |
• | New or increased taxes on compensation payments such as bonuses or on balance sheet items may adversely affect our profits. |
• | Should one of our customers or competitors fail, our business prospects and revenue could be negatively impacted due to negative market sentiment causing customers to cease doing business with us and our lenders to cease loaning us money, which could adversely affect our business, funding and liquidity. |
The U.K.'s exit from the European Union could adversely affect our business.
The referendum held in the U.K. on June 23, 2016 resulted in a determination that the U.K. should exit the European Union. Such an exit from the European Union is unprecedented and it is unclear how the U.K.'s access to the EU Single Market, and the wider trading, legal and regulatory environment in which we, our customers and our counterparties operate, will be impacted and how this will affect our and their businesses and the global macroeconomic environment. The uncertainty surrounding the timing, terms and consequences of the U.K.'s exit could adversely impact customer and investor confidence, result in additional market volatility and adversely affect our businesses, including our revenues from trading and investment banking activities, particularly in Europe, and our results of operations and financial condition.
8
Table of Contents
JEFFERIES GROUP LLC AND SUBSIDIARIES
We may be adversely affected by changes in U.S. and non-U.S. tax laws in the countries in which we operate.
The U.S. Congress and the Administration have indicated a desire to reform the U.S. corporate income tax. As part of any tax reform, it is possible that the 35 percent corporate income tax rate may be reduced. Additionally, there may be other potential changes including modifying the taxation of income earned outside the U.S., and/or limiting or eliminating various other deductions, credits or tax preferences. At this time, it is not possible to measure the potential impact on the value of Jefferies' deferred tax assets, business, prospects or results of operations that might result upon enactment.
Unfounded allegations about us could result in extreme price volatility and price declines in our securities and loss of revenue, clients, and employees.
Our reputation and business activity can be affected by statements and actions of third parties, even false or misleading statements by them. In addition, our operations in the past have been impacted as some clients either ceased doing business or temporarily slowed down the level of business they do, thereby decreasing our revenue stream. Although we were able to reverse the negative impact of past unfounded allegations and false rumors, there is no assurance that we will be able to do so successfully in the future and our potential failure to do so could have a material adverse effect on our business, financial condition and liquidity.
A credit-rating agency downgrade could significantly impact our business.
Maintaining an investment grade credit rating is important to our business and financial condition. We intend to access the capital markets and issue debt securities from time to time; and a decrease in our credit rating would not only increase our borrowing costs, but could also decrease demand for our debt securities and make a successful financing more difficult. In addition, in connection with certain over-the-counter derivative contract arrangements and certain other trading arrangements, we may be required to provide additional collateral to counterparties, exchanges and clearing organizations in the event of a credit rating downgrade. Such a downgrade could also negatively impact our debt-securities prices. There can be no assurance that our credit ratings will not be downgraded.
Our principal trading and investments expose us to risk of loss.
A considerable portion of our revenues is derived from trading in which we act as principal. We may incur trading losses relating to the purchase, sale or short sale of fixed income, high yield, international, convertible, and equity securities and futures and commodities for our own account. In any period, we may experience losses on our inventory positions as a result of the level and volatility of equity, fixed income and commodity prices (including oil prices), lack of trading volume and illiquidity. From time to time, we may engage in a large block trade in a single security or maintain large position concentrations in a single security, securities of a single issuer, securities of issuers engaged in a specific industry, or securities from issuers located in a particular country or region. In general, because our inventory is marked to market on a daily basis, any adverse price movement in these securities could result in a reduction of our revenues and profits. In addition, we may engage in hedging transactions that if not successful, could result in losses.
We may incur losses if our risk management is not effective.
We seek to monitor and control our risk exposure. Our risk management processes and procedures are designed to limit our exposure to acceptable levels as we conduct our business. We apply a comprehensive framework of limits on a variety of key metrics to constrain the risk profile of our business activities. The size of the limit reflects our risk tolerance for a certain activity. Our framework includes inventory position and exposure limits on a gross and net basis, scenario analysis and stress tests, Value-at-Risk, sensitivities, exposure concentrations, aged inventory, amount of Level 3 assets, counterparty exposure, leverage, cash capital, and performance analysis. See Risk Management within Item 7. Management's Discussion and Analysis in this Annual Report on Form 10-K for additional discussion. While we employ various risk monitoring and risk mitigation techniques, those techniques and the judgments that accompany their application, including risk tolerance determinations, cannot anticipate every economic and financial outcome or the specifics and timing of such outcomes. As a result, we may incur losses notwithstanding our risk management processes and procedures.
As a holding company, we are dependent for liquidity from payments from our subsidiaries, many of which are subject to restrictions.
As a holding company, we depend on dividends, distributions and other payments from our subsidiaries to fund payments on our obligations, including debt obligations. Many of our subsidiaries, including our broker-dealer subsidiaries, are subject to regulation that restrict dividend payments or reduce the availability of the flow of funds from those subsidiaries to us. In addition, our broker-dealer subsidiaries are subject to restrictions on their ability to lend or transact with affiliates and to minimum regulatory capital requirements.
9
Table of Contents
JEFFERIES GROUP LLC AND SUBSIDIARIES
Increased competition may adversely affect our revenues, profitability and staffing.
All aspects of our business are intensely competitive. We compete directly with a number of bank holding companies and commercial banks, other brokers and dealers, investment banking firms and other financial institutions. In addition to competition from firms currently in the securities business, there has been increasing competition from others offering financial services, including automated trading and other services based on technological innovations. We believe that the principal factors affecting competition involve market focus, reputation, the abilities of professional personnel, the ability to execute the transaction, relative price of the service and products being offered, bundling of products and services and the quality of service. Increased competition or an adverse change in our competitive position could lead to a reduction of business and therefore a reduction of revenues and profits.
Competition also extends to the hiring and retention of highly skilled employees. A competitor may be successful in hiring away employees, which may result in our losing business formerly serviced by such employees. Competition can also raise our costs of hiring and retaining the employees we need to effectively operate our business.
Operational risks may disrupt our business, result in regulatory action against us or limit our growth.
Our businesses are highly dependent on our ability to process, on a daily basis, a large number of transactions across numerous and diverse markets in many currencies, and the transactions we process have become increasingly complex. If any of our financial, accounting or other data processing systems do not operate properly or are disabled or if there are other shortcomings or failures in our internal processes, people or systems, we could suffer an impairment to our liquidity, financial loss, a disruption of our businesses, liability to clients, regulatory intervention or reputational damage. These systems may fail to operate properly or become disabled as a result of events that are wholly or partially beyond our control, including a disruption of electrical or communications services or our inability to occupy one or more of our buildings. The inability of our systems to accommodate an increasing volume of transactions could also constrain our ability to expand our businesses.
Certain of our financial and other data processing systems rely on access to and the functionality of operating systems maintained by third parties. If the accounting, trading or other data processing systems on which we are dependent are unable to meet increasingly demanding standards for processing and security or, if they fail or have other significant shortcomings, we could be adversely affected. Such consequences may include our inability to effect transactions and manage our exposure to risk.
In addition, despite the contingency plans we have in place, our ability to conduct business may be adversely impacted by a disruption in the infrastructure that supports our businesses and the communities in which they are located. This may include a disruption involving electrical, communications, transportation or other services used by us or third parties with which we conduct business.
Our operations rely on the secure processing, storage and transmission of confidential and other information in our computer systems and networks. Although we take protective measures and devote significant resources to maintaining and upgrading our systems and networks with measures such as intrusion and detection prevention systems, monitoring firewalls to safeguard critical business applications and supervising third party providers that have access to our systems, our computer systems, software and networks may be vulnerable to unauthorized access, computer viruses or other malicious code, and other events that could have a security impact. Additionally, if a client's computer system, network or other technology is compromised by unauthorized access, we may face losses or other adverse consequences by unknowingly entering into unauthorized transactions. If one or more of such events occur, this potentially could jeopardize our or our clients' or counterparties' confidential and other information processed and stored in, and transmitted through, our computer systems and networks. Furthermore, such events may cause interruptions or malfunctions in our, our clients', our counterparties' or third parties' operations, including the transmission and execution of unauthorized transactions. We may be required to expend significant additional resources to modify our protective measures or to investigate and remediate vulnerabilities or other exposures, and we may be subject to litigation and financial losses that are either not insured against or not fully covered through any insurance maintained by us. The increased use of smartphones, tablets and other mobile devices as well as cloud computing may also heighten these and other operational risks. Similar to other firms, we and our third party providers continue to be the subject of attempted unauthorized access, computer viruses and malware, and cyber attacks designed to disrupt or degrade service or cause other damage and denial of service. Additional challenges are posed by external parties, including foreign state actors. There can be no assurance that such unauthorized access or cyber incidents will not occur in the future, and they could occur more frequently and on a larger scale.
We are also subject to laws and regulations relating to the privacy of the information of clients, employees or others, and any failure to comply with these regulations could expose us to liability and/or reputational damage. In addition, our businesses are increasingly subject to laws and regulations relating to surveillance, encryption and data on-shoring in the jurisdictions in which we operate. Compliance with these laws and regulations may require us to change our policies, procedures and technology for information security, which could, among other things, make us more vulnerable to cyber attacks and misappropriation, corruption or loss of information or technology.
10
Table of Contents
JEFFERIES GROUP LLC AND SUBSIDIARIES
We face numerous risks and uncertainties as we expand our business.
We expect the growth of our business to come primarily from internal expansion and through acquisitions and strategic partnering. As we expand our business, there can be no assurance that our financial controls, the level and knowledge of our personnel, our operational abilities, our legal and compliance controls and our other corporate support systems will be adequate to manage our business and our growth. The ineffectiveness of any of these controls or systems could adversely affect our business and prospects. In addition, as we acquire new businesses and introduce new products, we face numerous risks and uncertainties integrating their controls and systems into ours, including financial controls, accounting and data processing systems, management controls and other operations. A failure to integrate these systems and controls, and even an inefficient integration of these systems and controls, could adversely affect our business and prospects.
Certain business initiatives, including expansions of existing businesses, may bring us into contact directly or indirectly, with individuals and entities that are not within our traditional client and counterparty base and may expose us to new asset classes and new markets. These business activities expose us to new and enhanced risks, greater regulatory scrutiny of these activities, increased credit-related, sovereign and operational risks, and reputational concerns regarding the manner in which these assets are being operated or held.
Legal liability may harm our business.
Many aspects of our business involve substantial risks of liability, and in the normal course of business, we have been named as a defendant or codefendant in lawsuits involving primarily claims for damages. The risks associated with potential legal liabilities often may be difficult to assess or quantify and their existence and magnitude often remain unknown for substantial periods of time. The expansion of our business, including increases in the number and size of investment banking transactions and our expansion into new areas impose greater risks of liability. In addition, unauthorized or illegal acts of our employees could result in substantial liability to us. Substantial legal liability could have a material adverse financial effect or cause us significant reputational harm, which in turn could seriously harm our business and our prospects.
Our business is subject to significant credit risk.
In the normal course of our businesses, we are involved in the execution, settlement and financing of various customer and principal securities and derivative transactions. These activities are transacted on a cash, margin or delivery-versus-payment basis and are subject to the risk of counterparty or customer nonperformance. Even when transactions are collateralized by the underlying security or other securities, we still face the risks associated with changes in the market value of the collateral through settlement date or during the time when margin is extended and collateral has not been secured or the counterparty defaults before collateral or margin can be adjusted. We may also incur credit risk in our derivative transactions to the extent such transactions result in uncollateralized credit exposure to our counterparties.
We seek to control the risk associated with these transactions by establishing and monitoring credit limits and by monitoring collateral and transaction levels daily. We may require counterparties to deposit additional collateral or return collateral pledged. In the case of aged securities failed to receive, we may, under industry regulations, purchase the underlying securities in the market and seek reimbursement for any losses from the counterparty. However, there can be no assurances that our risk controls will be successful.
Item 1B.Unresolved Staff Comments
None.
Item 2. Properties
We maintain offices in over 30 cities throughout the world. Our principal offices include our global headquarters in New York City, our European headquarters in London and our Asia headquarters in Hong Kong. In addition, we maintain backup data center facilities with redundant technologies for each of our three main data center hubs in Jersey City, London and Hong Kong. We lease all of our office space, or contract via service arrangement, which management believes is adequate for our business.
11
Table of Contents
JEFFERIES GROUP LLC AND SUBSIDIARIES
Item 3. Legal Proceedings
Many aspects of our business involve substantial risks of legal and regulatory liability. In the normal course of business, we have been named as defendants or co-defendants in lawsuits involving primarily claims for damages. We are also involved in a number of regulatory matters, including exams, investigations and similar reviews, arising out of the conduct of our business. Based on currently available information, we do not believe that any pending matter will have a material adverse effect on our financial condition.
Item 4. Mine Safety Disclosures
Not applicable.
12
Table of Contents
PART II
Item 5. Market for Registrant's Common Equity, Related Stockholder Matters and Issuer Purchases of Equity Securities
None.
Item 6
.Selected Financial Data
Omitted pursuant to general instruction I(2)(a) to Form 10-K.
Item 7. Management's Discussion and Analysis of Financial Condition and Results of Operations
This report contains or incorporates by reference "forward looking statements" within the meaning of the safe harbor provisions of Section 27A of the Securities Act of 1933 and Section 21E of the Securities Exchange Act of 1934. Forward looking statements include statements about our future and statements that are not historical facts. These forward looking statements are usually preceded by the words "believe," "intend," "may," "will," or similar expressions. Forward looking statements may contain expectations regarding revenues, earnings, operations and other results, and may include statements of future performance, plans and objectives. Forward looking statements also include statements pertaining to our strategies for future development of our business and products. Forward looking statements represent only our belief regarding future events, many of which by their nature are inherently uncertain. It is possible that the actual results may differ, possibly materially, from the anticipated results indicated in these forward-looking statements. Information regarding important factors that could cause actual results to differ, perhaps materially, from those in our forward looking statements is contained in this report and other documents we file. You should read and interpret any forward looking statement together with these documents, including the following:
• | the description of our business contained in this report under the caption "Business"; |
• | the risk factors contained in this report under the caption "Risk Factors"; |
• | the discussion of our analysis of financial condition and results of operations contained in this report under the caption "Management's Discussion and Analysis of Financial Condition and Results of Operations" herein; |
• | the discussion of our risk management policies, procedures and methodologies contained in this report under the caption "Management's Discussion and Analysis of Financial Condition and Results of Operations-Risk Management" herein; |
• | the notes to the consolidated financial statements contained in this report; and |
• | cautionary statements we make in our public documents, reports and announcements. |
Any forward looking statement speaks only as of the date on which that statement is made. We will not update any forward looking statement to reflect events or circumstances that occur after the date on which the statement is made, except as required by applicable law.
The Company's results of operations for the 12 months ended November 30, 2016 ("2016"), November 30, 2015 ("2015") and November 30, 2014 ("2014") are discussed below.
13
Table of Contents
JEFFERIES GROUP LLC AND SUBSIDIARIES
Consolidated Results of Operations
The following table provides an overview of our consolidated results of operations (dollars in thousands):
|
|
| % Change from Prior Year | ||||||||||||||
| 2016 |
| 2015 |
| 2014 |
| 2016 |
| 2015 | ||||||||
Net revenues | $ | 2,414,614 | |
| $ | 2,475,241 | |
| $ | 2,990,138 | |
| (2.4 | )% |
| (17.2 | )% |
Non-interest expenses | 2,384,642 | |
| 2,361,014 | |
| 2,687,117 | |
| 1.0 | % |
| (12.1 | )% | |||
Earnings before income taxes | 29,972 | |
| 114,227 | |
| 303,021 | |
| (73.8 | )% |
| (62.3 | )% | |||
Income tax expense | 14,566 | |
| 18,898 | |
| 142,061 | |
| (22.9 | )% |
| (86.7 | )% | |||
Net earnings | 15,406 | |
| 95,329 | |
| 160,960 | |
| (83.8 | )% |
| (40.8 | )% | |||
Net earnings to noncontrolling interests | (28 | ) |
| 1,795 | |
| 3,400 | |
| (101.6 | )% |
| (47.2 | )% | |||
Net earnings attributable to Jefferies Group LLC | 15,434 | |
| 93,534 | |
| 157,560 | |
| (83.5 | )% |
| (40.6 | )% | |||
Effective tax rate | 48.6 | % |
| 16.5 | % |
| 46.9 | % |
| 194.5 | % |
| (64.8 | )% | |||
Executive Summary
2016 Compared with 2015
Consolidated Results
• | Net revenues for 2016 were $2,414.6 million , compared with $2,475.2 million for 2015, a decrease of $60.6 million , or 2.4% . |
• | The results for 2016 were impacted by an extremely volatile bear market environment during the first three months of the year, with meaningful improvement over the rest of the year. Net revenues for the first quarter of 2016 declined $292.7 million, or 49.5%, compared to the first quarter of 2015. |
• | Throughout 2016, we continued to maintain strong leverage ratios, capital base and liquidity. |
Business Results
• | The decrease in total net revenues for 2016, as compared to 2015, primarily reflects a 17% decline in investment banking net revenues, and lower results in non-core equities net revenues, partially offset by meaningfully increased net revenues in fixed income. |
• | Lower investment banking results are attributable to lower new issue equity and leveraged finance capital markets revenues, partially offset by higher advisory revenues. Our investment banking results benefited from a record quarter of advisory fees in the fourth quarter of 2016, as well as improvement in our capital markets activity, which began in the late summer of 2016, leading to an increase in new issue transaction volume. |
• | The increase in fixed income revenues was across most products, as a result of new hires, a reduction in our downside risk profile since mid-2015 and improved market conditions in 2016. 2015 was adversely impacted by lower levels of liquidity and deterioration in the global energy and distressed markets. |
• | The decline in equities net revenues was primarily attributable to a net loss of $17.9 million recognized during 2016 from our investment in two equity positions, including KCG Holdings, Inc. ("KCG"), compared with a net gain of $49.2 million in 2015 from these two positions. The decline in results was also due to net mark-to-market gains from certain equity inventory positions during 2015, which were not repeated during 2016. Equities revenues also include a net loss of $9.3 million from our share of our Jefferies Finance joint venture in 2016, compared with net revenues of $41.4 million in 2015. |
• | Net revenues for 2016 included investment income from managed funds of $4.7 million , compared with investment losses from managed funds of $23.8 million in 2015, primarily due to lower valuations in the energy and shipping sectors in 2015. |
Expenses
• | Non-interest expenses for 2016 increased $23.6 million , or 1.0% , to $2,384.6 million , compared with $2,361.0 million for 2015, reflecting an increase in Compensation and benefits expense, partially offset by a decrease in Non-compensation expenses. |
14
Table of Contents
JEFFERIES GROUP LLC AND SUBSIDIARIES
• | Compensation and benefits expense for 2016 was $1,568.9 million , an increase of $101.8 million , or 6.9% , from 2015. Compensation and benefits expense as a percentage of Net revenues was 65.0% for 2016 compared with 59.3% in 2015. The increase in the compensation ratio for 2016 as compared to 2015 is primarily due to the composition of revenue by business line in the first quarter of 2016. |
• | Non-compensation expenses for 2016 were $815.7 million , a decrease of $78.2 million , or 8.7% , from 2015. The decrease in 2016 was due to our exiting the Bache business, which in 2015 generated $127.2 million of non-compensation expenses. There were no meaningful non-compensation expenses related to the Bache business in 2016. This reduction was partially offset by higher technology and professional fees related to investments in our trading platforms. |
Jefferies Bache
• | On April 9, 2015, we entered into an agreement to transfer certain of the client activities of our Jefferies Bache business to Société Générale S.A. During the second quarter of 2016, we completed the exit of the Futures business. |
• | Net revenues globally from this business activity, which are included within our fixed income results, and expenses directly related to the Bache business, which are included within non-interest expenses, were $80.2 million and $214.8 million, respectively, for 2015. There were no meaningful revenues or expenses from the Bache business for 2016. |
• | For further information, refer to Note 22, Exit Costs , in our consolidated financial statements included within this Annual Report on Form 10-K. |
Headcount
• | At November 30, 2016 , we had 3,329 employees globally, a decrease of 228 employees from our headcount of 3,557 at November 30, 2015. Our headcount decreased, primarily as a result of exiting the Bache business, as well as continued discipline in headcount and productivity management and corporate services outsourcing. |
2015 Compared with 2014
Consolidated Results
• | Net revenues for 2015 were $2,475.2 million , compared with $2,990.1 million for 2014, a decrease of $514.9 million , or 17.2% . |
• | The results primarily reflect challenging market conditions in fixed income throughout 2015 and lower revenues in investment banking, partially offset by increased revenues in equities. We saw record revenues in investment banking for 2014. In addition, net revenues from our Bache business for 2015, which are included within our fixed income results, were $80.2 million compared with $202.8 million in 2014. |
Business Results
• | Almost all our fixed income credit businesses were impacted by lower levels of liquidity due to the expectations of interest rate increases by the Federal Reserve and deterioration in the global energy and distressed markets. There were a number of periods of extreme volatility, which were followed by periods of low trading volumes. |
• | Results in 2015 also include a net gain of $49.1 million from our investment in KCG, compared with a loss of $14.7 million from our investment in KCG and a gain of $19.9 million from our investment in Harbinger Group Inc. ("HRG") in 2014. We sold HRG to Leucadia in March 2014. |
• | Net revenues for 2015 included investment losses from managed funds of $23.8 million, compared with investment losses from managed funds of $9.6 million in 2014, primarily due to lower valuations in the energy and shipping sectors during 2015. |
Expenses
• | Non-interest expenses decreased $326.1 million , or 12.1% , to $2,361.0 million for 2015 compared with $2,687.1 million for 2014, reflecting a decrease in both Compensation and benefits expense and Non-compensation expenses. |
• | Compensation and benefits expense for 2015 was $1,467.1 million , a decrease of $231.4 million , or 13.6% , from 2014. Compensation and benefits expenses as a percentage of Net revenues was 59.3% for 2015 compared with 56.8% in 2014. |
• | Non-compensation expenses for 2015 were $893.9 million , a decrease of $94.7 million , or 9.6% , from 2014, primarily due to a goodwill impairment loss of $51.9 million related to our Jefferies Bache business during 2014. In addition, during the fourth quarter of 2014, we recognized a bad debt provision, which primarily relates to a receivable of $52.3 million from a client to which we provided futures clearing and execution services, which declared bankruptcy. |
15
Table of Contents
JEFFERIES GROUP LLC AND SUBSIDIARIES
Jefferies Bache
• | Total non-interest expenses, since the agreement on April 9, 2015, include costs of $73.1 million, on a pre-tax basis, related to our exit of the Bache business. The after-tax impact of these costs is $52.6 million. These costs consist primarily of severance, retention and benefit payments for employees, incremental amortization of outstanding restricted stock and cash awards, contract termination costs and incremental amortization expense of capitalized software expected to no longer be used subsequent to the wind-down of the business. |
• | Net revenues from this business activity for 2015, which are included within our fixed income results, were $80.2 million compared with $202.8 million in 2014. This is comprised of commissions, principal transaction revenues and net interest revenues. Expenses directly related to the Bache business, which are included within non-interest expenses, for 2015 were $214.8 million compared with $348.2 million in 2014. |
• | For further information, refer to Note 22, Exit Costs in our consolidated financial statements included within this Annual Report on Form 10-K. |
Headcount
• | At November 30, 2015 , we had 3,557 employees globally, a decrease of 358 employees from our headcount at November 30, 2014 of 3,915 . Since November 30, 2014 , our headcount has decreased due to headcount reductions related to the exiting of the Bache business and corporate services outsourcing, partially offset by increases across our investment banking, equities and asset management businesses. |
Revenues by Source
For presentation purposes, the remainder of "Results of Operations" is presented on a detailed product and expense basis, rather than on a business segment basis. Net revenues presented for our equities and fixed income businesses include allocations of interest income and interest expense as we assess the profitability of these businesses inclusive of the net interest revenue or expense associated with the respective activities, which is a function of the mix of each business's associated assets and liabilities and the related funding costs.
The composition of our net revenues has varied over time as financial markets and the scope of our operations have changed. The composition of net revenues can also vary from period to period due to fluctuations in economic and market conditions, and our own performance. The following provides a summary of "Revenues by Source" (dollars in thousands):
|
|
| % Change from | |||||||||||||||||||||||
| 2016 |
| 2015 |
| 2014 |
| ||||||||||||||||||||
| Amount |
| % of Net Revenues |
| Amount |
| % of Net Revenues |
| Amount |
| % of Net Revenues |
| 2016 |
| 2015 | |||||||||||
Equities | $ | 549,553 | |
| 22.8 | % |
| $ | 757,447 | |
| 30.7 | % |
| $ | 696,221 | |
| 23.3 | % |
| (27.4 | )% |
| 8.8 | % |
Fixed income | 640,026 | |
| 26.5 | |
| 270,772 | |
| 10.9 | |
| 747,596 | |
| 25.0 | |
| 136.4 | % |
| (63.8 | )% | |||
Total sales and trading | 1,189,579 | |
| 49.3 | |
| 1,028,219 | |
| 41.6 | |
| 1,443,817 | |
| 48.3 | |
| 15.7 | % |
| (28.8 | )% | |||
Equity | 235,207 | |
| 9.7 | |
| 408,474 | |
| 16.5 | |
| 339,683 | |
| 11.4 | |
| (42.4 | )% |
| 20.3 | % | |||
Debt | 304,576 | |
| 12.6 | |
| 398,179 | |
| 16.1 | |
| 627,536 | |
| 21.0 | |
| (23.5 | )% |
| (36.5 | )% | |||
Capital markets | 539,783 | |
| 22.3 | |
| 806,653 | |
| 32.6 | |
| 967,219 | |
| 32.4 | |
| (33.1 | )% |
| (16.6 | )% | |||
Advisory | 654,190 | |
| 27.1 | |
| 632,354 | |
| 25.5 | |
| 562,055 | |
| 18.8 | |
| 3.5 | % |
| 12.5 | % | |||
Total investment banking | 1,193,973 | |
| 49.4 | |
| 1,439,007 | |
| 58.1 | |
| 1,529,274 | |
| 51.2 | |
| (17.0 | )% |
| (5.9 | )% | |||
Asset management fees and investment income (loss) from managed funds: |
|
|
|
|
|
|
|
|
|
|
|
|
|
|
| |||||||||||
Asset management fees | 26,412 | |
| 1.1 | |
| 31,819 | |
| 1.3 | |
| 26,682 | |
| 0.9 | |
| (17.0 | )% |
| 19.3 | % | |||
Investment income (loss) from managed funds | 4,650 | |
| 0.2 | |
| (23,804 | ) |
| (1.0 | ) |
| (9,635 | ) |
| (0.4 | ) |
| 119.5 | % |
| (147.1 | )% | |||
Total | 31,062 | |
| 1.3 | |
| 8,015 | |
| 0.3 | |
| 17,047 | |
| 0.5 | |
| 287.5 | % |
| (53.0 | )% | |||
Net revenues | $ | 2,414,614 | |
| 100.0 | % |
| $ | 2,475,241 | |
| 100.0 | % |
| $ | 2,990,138 | |
| 100.0 | % |
| (2.4 | )% |
| (17.2 | )% |
16
Table of Contents
JEFFERIES GROUP LLC AND SUBSIDIARIES
The following table sets forth our total sales and trading net revenues (dollars in thousands):
|
|
| % Change from Prior Year | ||||||||||||||
| 2016 |
| 2015 |
| 2014 |
| 2016 |
| 2015 | ||||||||
Commissions and other fees | $ | 611,574 | |
| $ | 659,002 | |
| $ | 668,801 | |
| (7.2 | )% |
| (1.5 | )% |
Principal transactions | 519,652 | |
| 172,608 | |
| 532,292 | |
| 201.1 | % |
| (67.6 | )% | |||
Other | 19,724 | |
| 74,074 | |
| 78,881 | |
| (73.4 | )% |
| (6.1 | )% | |||
Net interest | 38,629 | |
| 122,535 | |
| 163,843 | |
| (68.5 | )% |
| (25.2 | )% | |||
Total sales and trading net revenues | $ | 1,189,579 | |
| $ | 1,028,219 | |
| $ | 1,443,817 | |
| 15.7 | % |
| (28.8 | )% |
Equities Net Revenue
Equities net revenues include equity commissions, equity security principal trading and investments (including our investments in KCG and other equity securities) and net interest revenue generated by our equities sales and trading, prime services and wealth management businesses relating to the following products:
• | cash equities, |
• | electronic trading, |
• | equity derivatives, |
• | convertible securities, |
• | prime brokerage, |
• | securities finance and |
• | alternative investment strategies. |
Equities net revenue also includes our share of the net earnings from our joint venture investments in Jefferies Finance, LLC ("Jefferies Finance") and Jefferies LoanCore, LLC ("Jefferies LoanCore"), which are accounted for under the equity method. Equities revenues also included our investment in HRG, which we sold to Leucadia in March 2014, at fair market value.
2016 Compared with 2015
• | Total equities net revenues were $549.6 million for 2016, a decrease of $207.9 million , compared with $757.4 million for 2015. |
• | Results during 2016 include a net loss of $17.9 million from our investment in two equity positions, including KCG, compared with a net gain of $49.2 million in 2015 from these two positions. In addition, equities net revenues for 2015 included significant gains on additional securities positions, which were not repeated during 2016. |
• | Equities commission revenues gained slightly with improved market share across various product and client segments. Commissions in our U.S. cash equities and equity derivatives businesses held firm, while global electronic trading commissions gained from increased volumes and client market share. In our global electronic trading business, we have market leading customized algorithms in over 40 countries. European equities commissions increased due to improved market share, while commissions in our Asia Pacific cash equities business declined because of a challenging market environment. Our global cash businesses were among the highest market share gainers compared with our peers and, in the U.S. and U.K., our platform remains in the top 10. |
• | Equities trading revenues were solid across most of our equities sales and trading businesses in 2016. Trading revenues from client market making improved in our U.S. and European cash equities businesses. Equity derivatives trading revenues declined due to a difficult volatility trading climate and convertibles trading revenues declined driven by weakness in the energy sector during 2016. In addition, certain strategic investments gained from exposures to energy, volatility, financial and currency markets. |
• | Equities net revenues during 2016 included a net loss of $9.3 million from our share of Jefferies Finance, primarily due to the mark down of certain loans held for sale during the first part of 2016, compared with net revenues of $41.4 million in 2015. Net revenues from our share of Jefferies LoanCore also decreased during 2016 as compared to 2015 due to a decrease in loan closings and syndications. |
17
Table of Contents
JEFFERIES GROUP LLC AND SUBSIDIARIES
2015 Compared with 2014
• | Total equities net revenues were $757.4 million for 2015, an increase of $61.2 million compared with $696.2 million for 2014. |
• | Results in 2015 include a net gain of $49.1 million from our investment in KCG compared with a loss of $14.7 million from our investment in KCG and a gain of $19.9 million from our investment in HRG in 2014. We sold HRG to Leucadia in March 2014. |
• | Strong revenues in 2015, as a result of increased trading volumes, from our electronic trading platform contributed to higher commissions revenues. Total equities net revenue also includes higher revenues from the Asia Pacific cash equities business and net mark-to-market gains from equity investments, as well as growth from our wealth management platform. This was partially offset by lower revenues from equity block trading results from our U.S. cash equities business and lower commissions in our European cash equities business. |
• | Equities net revenue from our Jefferies LoanCore joint venture during 2015 includes higher revenues from an increase in loan closings and securitizations by the venture over 2014. Equities net revenue from our Jefferies Finance joint venture during 2015 includes lower revenues as a result of syndicate costs associated with the sell down of commitments, as well as reserves taken on certain loans held for investment as compared with 2014. |
Fixed Income Net Revenues
Fixed income net revenues includes commissions, principal transactions and net interest revenue generated by our fixed income sales and trading businesses from the following products:
• | investment grade corporate bonds, |
• | mortgage- and asset-backed securities, |
• | government and agency securities, |
• | interest rate derivatives, |
• | municipal bonds, |
• | emerging markets debt, |
• | high yield and distressed securities, |
• | bank loans, |
• | foreign exchange and |
• | commodities trading activities. |
2016 Compared with 2015
• | Fixed income net revenues totaled $640.0 million for 2016, an increase of $369.3 million , compared with net revenues of $270.8 million in 2015. |
• | 2015 included $80.2 million of net revenues globally from the Bache business activity. There were no meaningful revenues from the Bache business during 2016, as we completed the exit of the Bache business during the second quarter of 2016. Excluding revenues from the Bache business activity, revenues increased $449.5 million , or 235.8% . |
• | We recorded higher revenues in 2016 as compared with 2015 due to improved trading conditions across most core businesses, partially offset by lower revenues in our international rates business due to lower trading volumes. |
• | Revenues in our leveraged credit business were strong on increased trading volumes within high yield and distressed, as a result of an improved credit environment, as well as strategic growth in the business, compared with mark-to-market write-downs in 2015. Results in our emerging markets business during 2016 were higher due to an upgraded sales and trading team and increased levels of volatility and improved market conditions. Revenues from our corporates businesses increased as compared to 2015 due to increased client activity and higher demand for new issuances and higher yielding investments. Our mortgages businesses were positively impacted by increased demand for spread products, compared with the negative impact of market volatility as credit spreads tightened for these asset classes and expectations of future rate increases in 2015. The municipal securities business performed well during 2016, as improved trading activity was driven by market technicals, compared with net outflows in 2015. Volatility during 2016 due to fluctuating expectations as to future Federal Reserve interest rate increases contributed to increased revenues in our U.S. rates business. |
18
Table of Contents
JEFFERIES GROUP LLC AND SUBSIDIARIES
2015 Compared with 2014
• | Fixed income net revenues were $270.8 million for 2015, a decrease of $476.8 million , compared with net revenues of $747.6 million in 2014. |
• | 2015 included $80.2 million of net revenues globally from the Bache business activity compared with $202.8 million in 2014. Excluding revenues from the Bache business activity, revenues decreased $354.2 million . |
• | The lower revenues in 2015 were primarily due to tighter trading conditions across most core businesses and losses in our high yield distressed sales and trading business and international mortgages business, partially offset by higher revenues in our U.S. and international rates businesses, as well as our U.S. investment grade corporate credit business. |
• | The higher revenues in our U.S. and international rates businesses, as well as our U.S. investment grade corporate credit business, resulted from higher transaction volumes as volatility caused attractive yields and interest in new issuances. However, that same volatility negatively impacted the municipal securities business as prices declined and the sector experienced overall net cash outflows. Most of our credit fixed income businesses were negatively impacted during 2015 by periods of extreme volatility and market conditions, as investors focused on liquidity, resulting in periods of low trading volume. In addition, results in our distressed trading businesses were negatively impacted by our position in the energy sector and led to mark-to-market write-downs in our inventory and results in our emerging markets business were lower due to slower growth in the emerging markets during 2015. Our mortgages business was also negatively impacted by market volatility as credit spreads tightened for these asset classes and expectations of future rate increases resulted in lower trading volumes and revenues. |
Investment Banking Revenue
Investment banking revenues include the following businesses:
• | Capital markets revenues include underwriting and placement revenues related to corporate debt, municipal bonds, mortgage- and asset-backed securities and equity and equity-linked securities. |
• | Advisory revenues consist primarily of advisory and transaction fees generated in connection with merger, acquisition and restructuring transactions. |
The following table sets forth our investment banking revenue (dollars in thousands):
|
|
| % Change from Prior Year | ||||||||||||||
| 2016 |
| 2015 |
| 2014 |
| 2016 |
| 2015 | ||||||||
Equity | $ | 235,207 | |
| $ | 408,474 | |
| $ | 339,683 | |
| (42.4 | )% |
| 20.3 | % |
Debt | 304,576 | |
| 398,179 | |
| 627,536 | |
| (23.5 | )% |
| (36.5 | )% | |||
Capital markets | 539,783 | |
| 806,653 | |
| 967,219 | |
| (33.1 | )% |
| (16.6 | )% | |||
Advisory | 654,190 | |
| 632,354 | |
| 562,055 | |
| 3.5 | % |
| 12.5 | % | |||
Total | $ | 1,193,973 | |
| $ | 1,439,007 | |
| $ | 1,529,274 | |
| (17.0 | )% |
| (5.9 | )% |
The following table sets forth our Investment banking activities (dollars in billions):
| Deals Completed |
| Aggregate Value | |||||||||||||||||
| 2016 |
| 2015 |
| 2014 |
| 2016 |
| 2015 |
| 2014 | |||||||||
Public and private debt financings | 892 | |
| 1,003 | |
| 1,109 | |
| $ | 188.6 | |
| $ | 199.8 | |
| $ | 250.0 | |
Public and private equity and convertible offerings (1) | 117 | |
| 191 | |
| 193 | |
| 20.8 | |
| 53.9 | |
| 66.0 | | |||
Advisory transactions (2) | 179 | |
| 171 | |
| 144 | |
| 135.2 | |
| 141.0 | |
| 176.0 | | |||
(1) | We acted as sole or joint bookrunner on 113, 176 and 159 offerings during 2016, 2015 and 2014 , respectively. |
(2) | The number of advisory deals completed includes 18, 13 and 12 restructuring and recapitalization transactions during 2016, 2015 and 2014 , respectively. |
19
Table of Contents
JEFFERIES GROUP LLC AND SUBSIDIARIES
2016 Compared with 2015
• | Total investment banking revenues were $1,194.0 million for 2016, 17.0% lower than 2015. Lower investment banking results were attributable to lower new issue equity and leveraged finance capital markets revenues. This was primarily as a result of the capital markets slowdown, which began in the second half of 2015 and continued for much of 2016. We generated $235.2 million and $304.6 million in equity and debt capital market revenues, respectively, for 2016, a decrease of 42.4% and 23.5% , respectively, from 2015. |
• | Our reduced capital markets activity for 2016 was partially offset by record advisory revenues. Specifically, our advisory revenues for 2016 increased 3.5% compared to 2015, primarily through an increase in the number of M&A and restructuring transactions, including closing a record number of M&A transactions in excess of $1 billion. |
• | Our investment banking results benefited both from a record fourth quarter of advisory fees in 2016, with our M&A and restructuring and recapitalization businesses showing continued momentum, and from improvement in capital markets activity, which began in the late summer of 2016, leading to an increase in new issue transaction volume. |
2015 Compared with 2014
• | Total investment banking revenue was $1,439.0 million for 2015, $90.3 million lower than 2014 , reflecting lower debt capital market revenues, partially offset by record equity capital markets and advisory revenues. |
• | Overall, capital markets revenues for 2015 decreased 16.6% from 2014, primarily due to significantly lower transaction volume in the leveraged finance market. From equity and debt capital raising activities, we generated $408.5 million and $398.2 million in revenues, respectively, an increase of 20.3% and a decrease of 36.5% , respectively, from 2014. Record advisory revenues of $632.4 million for 2015, an increase of 12.5% from 2014, were primarily due to higher transaction volume. |
Asset Management Fees and Investment Income (Loss) from Managed Funds
Asset management revenue includes the following:
• | management and performance fees from funds and accounts managed by us, |
• | management and performance fees from related party managed funds and |
• | accounts and investment income (loss) from our investments in these funds, accounts and related party managed funds. |
The key components of asset management revenues are the level of assets under management and the performance return, whether on an absolute basis or relative to a benchmark or hurdle. These components can be affected by financial markets, profits and losses in the applicable investment portfolios and client capital activity. Further, asset management fees vary with the nature of investment management services. The terms under which clients may terminate our investment management authority, and the requisite notice period for such termination, varies depending on the nature of the investment vehicle and the liquidity of the portfolio assets.
The following summarizes the results of our Asset Management businesses by asset class (in thousands):
|
|
| % Change from Prior Year | ||||||||||||||
| 2016 |
| 2015 |
| 2014 |
| 2016 |
| 2015 | ||||||||
Asset management fees: |
|
|
|
|
|
|
|
|
| ||||||||
Fixed income (1) | $ | 2,482 | |
| $ | 4,090 | |
| $ | 6,087 | |
| (39.3 | )% |
| (32.8 | )% |
Equities | 1,757 | |
| 4,875 | |
| 9,212 | |
| (64.0 | )% |
| (47.1 | )% | |||
Multi-asset | 22,173 | |
| 20,173 | |
| 8,863 | |
| 9.9 | % |
| 127.6 | % | |||
Convertibles (2) | - | |
| 2,681 | |
| 2,520 | |
| (100.0 | )% |
| 6.4 | % | |||
Total asset management fees | 26,412 | |
| 31,819 | |
| 26,682 | |
| (17.0 | )% |
| 19.3 | % | |||
Investment income (loss) from managed funds | 4,650 | |
| (23,804 | ) |
| (9,635 | ) |
| 119.5 | % |
| (147.1 | )% | |||
Total | $ | 31,062 | |
| $ | 8,015 | |
| $ | 17,047 | |
| 287.5 | % |
| (53.0 | )% |
20
Table of Contents
JEFFERIES GROUP LLC AND SUBSIDIARIES
(1) | Fixed income asset management fees represent ongoing consideration we receive from the sale of contracts to manage certain collateralized loan obligations ("CLOs") to Barings, LLC (formerly known as Babson Capital Management, LLC) in January 2010. As sale consideration, we are entitled to a portion of the asset management fees earned under the contracts for their remaining lives. Investment income (loss) from managed funds primarily is comprised of net unrealized markups (markdowns) in private equity funds managed by related parties. |
(2) | During the fourth quarter of 2014, as part of a strategic review of our business, we decided to liquidate our International Asset Management business, which provided long only investment solutions in global convertible bonds to institutional investors. Asset management fees from this business comprise our convertibles asset strategy in the table above. |
Assets under Management
Period end assets under management by predominant asset class were as follows (in millions):
| November 30, | ||||||
| 2016 |
| 2015 | ||||
Assets under management (1): |
|
|
| ||||
Equities | $ | 170 | |
| $ | 18 | |
Multi-asset | 884 | |
| 688 | | ||
Total | $ | 1,054 | |
| $ | 706 | |
(1) | Assets under management include assets actively managed by us, including hedge funds and certain managed accounts. Assets under management do not include the assets of funds that are consolidated due to the level or nature of our investment in such funds. |
Non-interest Expenses
Non-interest expenses were as follows (dollars in thousands):
|
|
| % Change from Prior Year | ||||||||||||||
| 2016 |
| 2015 |
| 2014 |
| 2016 |
| 2015 | ||||||||
Compensation and benefits | $ | 1,568,948 | |
| $ | 1,467,131 | |
| $ | 1,698,530 | |
| 6.9 | % |
| (13.6 | )% |
Non-compensation expenses: |
|
|
|
|
|
|
|
|
| ||||||||
Floor brokerage and clearing fees | 167,205 | |
| 199,780 | |
| 215,329 | |
| (16.3 | )% |
| (7.2 | )% | |||
Technology and communications | 262,396 | |
| 313,044 | |
| 268,212 | |
| (16.2 | )% |
| 16.7 | % | |||
Occupancy and equipment rental | 101,133 | |
| 101,138 | |
| 107,767 | |
| - | % |
| (6.2 | )% | |||
Business development | 93,105 | |
| 105,963 | |
| 106,984 | |
| (12.1 | )% |
| (1.0 | )% | |||
Professional services | 112,562 | |
| 103,972 | |
| 109,601 | |
| 8.3 | % |
| (5.1 | )% | |||
Bad debt provision | 7,365 | |
| (396 | ) |
| 55,355 | |
| N/M | |
| N/M | | |||
Goodwill impairment | - | |
| - | |
| 54,000 | |
| N/M | |
| (100.0 | )% | |||
Other | 71,928 | |
| 70,382 | |
| 71,339 | |
| 2.2 | % |
| (1.3 | )% | |||
Total non-compensation expenses | 815,694 | |
| 893,883 | |
| 988,587 | |
| (8.7 | )% |
| (9.6 | )% | |||
Total non-interest expenses | $ | 2,384,642 | |
| $ | 2,361,014 | |
| $ | 2,687,117 | |
| 1.0 | % |
| (12.1 | )% |
N/M - Not Meaningful
Compensation and Benefits
• | Compensation and benefits expense consists of salaries, benefits, cash bonuses, commissions, annual cash compensation awards and the amortization of certain non-annual share-based and cash compensation awards to employees. |
• | Cash and historical share-based awards and a portion of cash awards granted to employees as part of year end compensation generally contain provisions such that employees who terminate their employment or are terminated without cause may continue to vest in their awards, so long as those awards are not forfeited as a result of other forfeiture provisions (primarily non-compete clauses) of those awards. Accordingly, the compensation expense for a portion of awards granted at year end as part of annual compensation is recorded in the year of the award. |
21
Table of Contents
JEFFERIES GROUP LLC AND SUBSIDIARIES
• | Included within Compensation and benefits expense are share-based amortization expense for senior executive awards granted in September 2012 and February 2016, non-annual share-based and cash-based awards to other employees and certain year end awards that contain future service requirements for vesting. Senior executive awards contain market and performance conditions and are being amortized over their respective future service periods. |
• | Refer to Note 15, Compensation Plans included within this Annual Report on Form 10-K, for further details on compensation and benefits. |
2016 Compared with 2015
• | Compensation and benefits expense was $1,568.9 million for 2016 compared with $1,467.1 million for 2015. |
• | Compensation and benefits expense as a percentage of Net revenues was 65.0% for 2016 and 59.3% for 2015. The increase in the compensation ratio for 2016 as compared to 2015 is due to the composition of revenue by business line in the first quarter of 2016. |
• | Compensation expense related to the amortization of share- and cash-based awards amounted to $287.3 million for 2016 compared with $307.1 million 2015. |
• | Compensation and benefits expense directly related to the activities of our Bache business was $87.7 million for 2015 and not meaningful for 2016. Included within compensation and benefits expense for the Bache business for 2015 are severance, retention and related benefits costs of $38.2 million incurred as part of decisions surrounding the exit of this business. |
• | Employee headcount was 3,329 globally at November 30, 2016 , a decrease of 228 employees from our headcount of 3,557 at November 30, 2015 . Our headcount has decreased , primarily as a result of exiting the Bache business, as well as continued discipline in headcount, productivity management and corporate services outsourcing. |
2015 Compared with 2014
• | Compensation and benefits expense was $1,467.1 million for 2015 compared with $1,698.5 million for 2014. |
• | Compensation and benefits expense as a percentage of Net revenues was 59.3% for 2015 and 56.8% for 2014. |
• | Compensation expense related to the amortization of share- and cash-based awards amounted to $307.1 million for 2015 compared with $284.3 million for 2014. |
• | Compensation and benefits expense directly related to the activities of our Bache business was $87.7 million for 2015 and $98.6 million for 2014. Included within compensation and benefits expense for the Bache business for 2015 are severance, retention and related benefits costs of $38.2 million incurred as part of decisions surrounding the exit of this business. |
• | At November 30, 2015 , we had 3,557 employees globally, a decrease of 358 employees from our headcount at November 30, 2014 of 3,915 . Since November 30, 2014 , our headcount has decreased due to headcount reductions related to the exiting of the Bache business and corporate services outsourcing, partially offset by increases across our investment banking, equities and asset management businesses. |
Non-Compensation Expenses
2016 Compared with 2015
• | Non-compensation expenses were $815.7 million for 2016, a decrease of $78.2 million , or 8.7% , compared with $893.9 million for 2015. |
• | Non-compensation expenses as a percentage of Net revenues was 33.8% and 36.1% for 2016 and 2015 , respectively. |
22
Table of Contents
JEFFERIES GROUP LLC AND SUBSIDIARIES
• | Non-compensation expenses for 2016 were $815.7 million , a decrease of $78.2 million , or 8.7% , from 2015. The decrease in 2016 was due to our exiting the Bache business, which in 2015 generated $127.2 million of non-compensation expenses, including accelerated amortization expense of $19.7 million related to capitalized software, $11.2 million in contract termination costs and professional services costs of approximately $2.5 million in connection with our actions related to exiting the Bache business. There were no meaningful non-compensation expenses related to the Bache business in 2016. This reduction in 2016 was partially offset by higher Technology and communications expenses, excluding the Bache business, and higher Professional services expenses, excluding the Bache business. Technology and communications expenses, excluding the Bache business, increased due to higher costs associated with the development of the various trading systems and projects associated with corporate support infrastructure. In both years, we continued to incur legal and consulting fees as part of implementing various regulatory requirements, which are recognized in Professional services expenses. During 2015, we also released $4.4 million in reserves related to the resolution of bankruptcy claims against Lehman Brothers Holdings, Inc., which is presented within Bad debt expenses. |
2015 Compared with 2014
• | Non-compensation expenses were $893.9 million for 2015, a decrease of $94.7 million , or 9.6% , compared with $988.6 million in 2014. |
• | Non-compensation expenses as a percentage of Net revenues was 36.1% and 33.1% for 2015 and 2014, respectively. |
• | The decrease in non-compensation expenses was primarily due to lower other expenses primarily related to impairment losses and bad debt expenses recognized for 2014. Non-compensation expenses for 2014 include a goodwill impairment loss of $51.9 million related to our Jefferies Bache business, which constitutes our global futures sales and trading operations. In addition, a goodwill impairment loss of $2.1 million was recognized in 2014 related to our International Asset Management business. Additionally, $7.6 million in impairment losses were recognized related to customer relationship intangible assets within our Jefferies Bache and International Asset Management businesses, which is presented within Other expenses. During 2015, we also released $4.4 million in reserves related to the resolution of bankruptcy claims against Lehman Brothers Holdings, Inc., which is presented within Bad debt expenses. During the fourth quarter of 2014, we recognized a bad debt provision, which primarily relates to a receivable of $52.3 million from a client to which we provided futures clearing and execution services, which declared bankruptcy. |
• | Non-compensation expenses associated directly with the activities of the Bache business were $127.2 million for 2015 and $249.6 million for 2014. Technology and communications expenses for 2015 included accelerated amortization expense of $19.7 million related to capitalized software and $11.2 million in contract termination costs related to our Jefferies Bache business. During 2015, we incurred professional services costs of approximately $2.5 million in connection with our actions related to exiting the Bache business. |
Income Taxes
2016 Compared with 2015
• | For 2016, the provision for income taxes was $14.6 million , an effective tax rate of 48.6% , compared with a provision for income taxes of $18.9 million , an effective tax rate of 16.5% , for 2015. |
• | The change in the effective tax rate during 2016 as compared with 2015 is primarily attributable to excess stock detriments related to share-based compensation that was less than the compensation cost recognized for financial reporting purposes. |
• | Given the uncertainty surrounding tax reform in the U.S., in December 2016, we repatriated earnings and associated foreign taxes from certain foreign subsidiaries. This will have a positive impact on our effective tax rate in 2017. |
2015 Compared with 2014
• | For 2015, the provision for income taxes was $18.9 million , an effective tax rate of 16.5% , compared with a provision for income taxes of $142.1 million , an effective tax rate of 46.9% , for 2014. |
• | The change in the effective tax rate during 2015 as compared with 2014 is primarily due to net tax benefits related to the resolution of state income tax examinations and statute expirations during 2015, a change in the geographical mix of earnings and the impact of the goodwill impairment charge that was non-deductible in 2014. |
Accounting Developments
For a discussion of recently issued accounting developments and their impact on our consolidated financial statements, see Note 3, Accounting Developments , in our consolidated financial statements included within this Annual Report on Form 10-K.
23
Table of Contents
JEFFERIES GROUP LLC AND SUBSIDIARIES
Critical Accounting Policies
The consolidated financial statements are prepared in conformity with U.S. GAAP, which requires management to make estimates and assumptions that affect the amounts reported in the consolidated financial statements and related notes. Actual results can and may differ from estimates. These differences could be material to the financial statements.
We believe our application of U.S. GAAP and the associated estimates are reasonable. Our accounting estimates are constantly reevaluated, and adjustments are made when facts and circumstances dictate a change. Historically, we have found our application of accounting policies to be appropriate, and actual results have not differed materially from those determined using necessary estimates.
We believe our critical accounting policies (policies that are both material to the financial condition and results of operations and require our most subjective or complex judgments) are our valuation of financial instruments, assessment of goodwill and our use of estimates related to compensation and benefits during the year.
For further discussion of the following significant accounting policies and other significant accounting policies, see Note 2, Summary of Significant Accounting Policies , in our consolidated financial statements included within this Annual Report on Form 10-K.
Valuation of Financial Instruments
Financial instruments owned and Financial instruments sold, not yet purchased are recorded at fair value. The fair value of a financial instrument is the amount that would be received to sell an asset or paid to transfer a liability in an orderly transaction between market participants at the measurement date (the exit price). Unrealized gains or losses are generally recognized in Principal transaction revenues in our Consolidated Statements of Earnings.
For information on the composition of our financial instruments owned and financial instruments sold, not yet purchased recorded at fair value, see Note 4, Fair Value Disclosures , in our consolidated financial statements included within this Annual Report on Form 10-K.
Fair Value Hierarchy – In determining fair value, we maximize the use of observable inputs and minimize the use of unobservable inputs by requiring that observable inputs be used when available. Observable inputs are inputs that market participants would use in pricing the asset or liability based on market data obtained from independent sources. Unobservable inputs reflect our assumptions that market participants would use in pricing the asset or liability developed based on the best information available in the circumstances. We apply a hierarchy to categorize our fair value measurements broken down into three levels based on the transparency of inputs, where Level 1 uses observable prices in active markets and Level 3 uses valuation techniques that incorporate significant unobservable inputs and broker quotes that are considered less observable. Greater use of management judgment is required in determining fair value when inputs are less observable or unobservable in the marketplace, such as when the volume or level of trading activity for a financial instrument has decreased and when certain factors suggest that observed transactions may not be reflective of orderly market transactions. Judgment must be applied in determining the appropriateness of available prices, particularly in assessing whether available data reflects current prices and/or reflects the results of recent market transactions. Prices or quotes are weighed when estimating fair value with greater reliability placed on information from transactions that are considered to be representative of orderly market transactions.
Fair value is a market based measure; therefore, when market observable inputs are not available, our judgment is applied to reflect those judgments that a market participant would use in valuing the same asset or liability. The availability of observable inputs can vary for different products. We use prices and inputs that are current as of the measurement date even in periods of market disruption or illiquidity. The valuation of financial instruments classified in Level 3 of the fair value hierarchy involves the greatest amount of management judgment. (See Note 2, Summary of Significant Accounting Policies , and Note 4, Fair Value Disclosures , in our consolidated financial statements included within this Annual Report on Form 10-K for further information on the definitions of fair value, Level 1, Level 2 and Level 3 and related valuation techniques.)
Level 3 Assets and Liabilities – For information on the composition and activity of our Level 3 assets and Level 3 liabilities, see Note 4, Fair Value Disclosures , in our consolidated financial statements included within this Annual Report on Form 10-K.
Controls Over the Valuation Process for Financial Instruments – Our Independent Price Verification Group, independent of the trading function, plays an important role in determining that our financial instruments are appropriately valued and that fair value measurements are reliable. This is particularly important where prices or valuations that require inputs are less observable. In the event that observable inputs are not available, the control processes are designed to assure that the valuation approach utilized is appropriate and consistently applied and that the assumptions are reasonable. Where a pricing model is used to determine fair value, these control processes include reviews of the pricing model's theoretical soundness and appropriateness by risk management personnel with relevant expertise who are independent from the trading desks. In addition, recently executed comparable transactions and other observable market data are considered for purposes of validating assumptions underlying the model.
24
Table of Contents
JEFFERIES GROUP LLC AND SUBSIDIARIES
Goodwill
At November 30, 2016 , goodwill recorded on our Consolidated Statement of Financial Condition is $1,640.7 million ( 4.4% of total assets). The nature and accounting for goodwill is discussed in Note 2, Summary of Significant Accounting Policies and Note 10, Goodwill and Other Intangible Assets , in our consolidated financial statements included within this Annual Report on Form 10-K. Goodwill must be allocated to reporting units and tested for impairment at least annually, or when circumstances or events make it more likely than not that an impairment occurred. Goodwill is tested by comparing the estimated fair value of each reporting unit with its carrying value. Our annual goodwill impairment testing date is August 1, which did not indicate any goodwill impairment in any of our reporting units at August 1, 2016.
We use allocated tangible equity plus allocated goodwill and intangible assets for the carrying amount of each reporting unit. The amount of equity allocated to a reporting unit is based on our cash capital model deployed in managing our businesses, which seeks to approximate the capital a business would require if it were operating independently. For further information on our Cash Capital Policy, refer to the Liquidity, Financial Condition and Capital Resources section herein. Intangible assets are allocated to a reporting unit based on either specifically identifying a particular intangible asset as pertaining to a reporting unit or, if shared among reporting units, based on an assessment of the reporting unit's benefit from the intangible asset in order to generate results.
Estimating the fair value of a reporting unit requires management judgment and often involves the use of estimates and assumptions that could have a significant effect on whether or not an impairment charge is recorded and the magnitude of such a charge. Estimated fair values for our reporting units utilize market valuation methods that incorporate price-to-earnings and price-to-book multiples of comparable public companies. Under the market approach, the key assumptions are the selected multiples and our internally developed forecasts of future profitability, growth and return on equity for each reporting unit. The weight assigned to the multiples requires judgment in qualitatively and quantitatively evaluating the size, profitability and the nature of the business activities of the reporting units as compared to the comparable publicly-traded companies. In addition, as the fair values determined under the market approach represent a noncontrolling interest, we apply a control premium to arrive at the estimate fair value of each reporting unit on a controlling basis.
The carrying values of goodwill by reporting unit at November 30, 2016 are as follows: $563.2 million in Investment Banking, $159.9 million in Equities and Wealth Management, $914.6 million in Fixed Income and $3.0 million in Strategic Investments.
The results of our assessment on August 1, 2016 indicated that all our reporting units had a fair value in excess of their carrying amounts based on current projections. While no goodwill impairment was identified, the valuation methodology for our reporting units are sensitive to management's forecasts of future profitability, which comes with a level of uncertainty regarding U.S. and global economic conditions, trading volumes and equity and debt capital market transaction levels.
Refer to Note 10, Goodwill and Other Intangible Assets in our consolidated financial statements included within this Annual Report on Form 10-K, for further details on goodwill.
Compensation and Benefits
A portion of our compensation and benefits represents discretionary bonuses, which are finalized at year end. In addition to the level of net revenues, our overall compensation expense in any given year is influenced by prevailing labor markets, revenue mix, profitability, individual and business performance metrics, and our use of share-based compensation programs. We believe the most appropriate way to allocate estimated annual total compensation among interim periods is in proportion to net revenues earned. Consequently, during the year we accrue compensation and benefits based on annual targeted compensation ratios, taking into account the mix of our revenues and the timing of expense recognition.
25
Table of Contents
JEFFERIES GROUP LLC AND SUBSIDIARIES
Liquidity, Financial Condition and Capital Resources
Our Chief Financial Officer and Global Treasurer are responsible for developing and implementing our liquidity, funding and capital management strategies. These policies are determined by the nature and needs of our day to day business operations, business opportunities, regulatory obligations, and liquidity requirements.
Our actual levels of capital, total assets and financial leverage are a function of a number of factors, including asset composition, business initiatives and opportunities, regulatory requirements and cost and availability of both long term and short term funding. We have historically maintained a balance sheet consisting of a large portion of our total assets in cash and liquid marketable securities, arising principally from traditional securities brokerage and trading activity. The liquid nature of these assets provides us with flexibility in financing and managing our business.
The Balance Sheet
A business unit level balance sheet and cash capital analysis is prepared and reviewed with senior management on a weekly basis. As a part of this balance sheet review process, capital is allocated to all assets and gross and adjusted balance sheet limits are established. This process ensures that the allocation of capital and costs of capital are incorporated into business decisions. The goals of this process are to protect the firm's platform, enable our businesses to remain competitive, maintain the ability to manage capital proactively and hold businesses accountable for both balance sheet and capital usage.
We actively monitor and evaluate our financial condition and the composition of our assets and liabilities. We continually monitor our overall securities inventory, including the inventory turnover rate, which confirms the liquidity of our overall assets. Substantially all of our Financial instruments owned and Financial instruments sold, not yet purchased are valued on a daily basis and we monitor and employ balance sheet limits for our various businesses. In connection with our government and agency fixed income business and our role as a primary dealer in these markets, a sizable portion of our securities inventory is comprised of U.S. government and agency securities and other G-7 government securities.
The following table provides detail on key balance sheet asset and liability line items (dollars in millions):
| November 30, |
|
| |||||||
| 2016 |
| 2015 |
| % Change | |||||
Total assets | $ | 36,941.3 | |
| $ | 38,564.0 | |
| (4.2 | )% |
Cash and cash equivalents | 3,529.1 | |
| 3,510.2 | |
| 0.5 | % | ||
Cash and securities segregated and on deposit for regulatory purposes or deposited with clearing and depository organizations | 857.3 | |
| 751.1 | |
| 14.1 | % | ||
Financial instruments owned | 13,809.5 | |
| 16,559.1 | |
| (16.6 | )% | ||
Financial instruments sold, not yet purchased | 8,359.2 | |
| 6,785.1 | |
| 23.2 | % | ||
Total Level 3 assets | 413.3 | |
| 541.7 | |
| (23.7 | )% | ||
|
|
|
|
|
| |||||
Securities borrowed | $ | 7,743.6 | |
| $ | 6,975.1 | |
| 11.0 | % |
Securities purchased under agreements to resell | 3,862.5 | |
| 3,857.3 | |
| 0.1 | % | ||
Total securities borrowed and securities purchased under agreements to resell | $ | 11,606.1 | |
| $ | 10,832.4 | |
| 7.1 | % |
|
|
|
|
|
| |||||
Securities loaned | $ | 2,819.1 | |
| $ | 2,979.3 | |
| (5.4 | )% |
Securities sold under agreements to repurchase | 6,791.7 | |
| 10,004.4 | |
| (32.1 | )% | ||
Total securities loaned and securities sold under agreements to repurchase | $ | 9,610.8 | |
| $ | 12,983.7 | |
| (26.0 | )% |
Total assets at November 30, 2016 and 2015 were $36.9 billion and $38.6 billion , respectively, a decline of 4.2% . This decline reflects reductions that we implemented beginning in the fourth quarter of 2015 given our view of the market environment, which is also reflected in an overall reduction in risk at the comparable period ends. During 2016 , average total assets (measured based upon week-end balances) were approximately 17.6% higher than total assets at November 30, 2016 .
26
Table of Contents
JEFFERIES GROUP LLC AND SUBSIDIARIES
Our total Financial instruments owned inventory at November 30, 2016 was $13.8 billion , a decrease of 16.6% from inventory of $16.6 billion at November 30, 2015 , primarily due to decreases in mortgage- and asset-backed securities due to global market and economic concerns in 2016 . Financial instruments sold, not yet purchased inventory was $8.4 billion and $6.8 billion at November 30, 2016 and 2015 , respectively, with the increase primarily driven by government, federal agency and other sovereign obligations and corporate equity and debt securities inventory due to increased market volatility caused by concerns about the pace of global economic growth and uncertainty around the Federal Reserve and major central banks' monetary policies partially offset by a decrease in loans due to settlements during 2016 . Our overall net inventory position was $5.5 billion and $9.8 billion at November 30, 2016 and 2015 , respectively. The change in our net inventory balance is attributed to a reduction in most net inventory positions, primarily mortgage- and asset-backed securities and government, federal agency and other sovereign obligations, partially offset by an increase in net loans. While our total Financial instruments owned declined from November 30, 2015 to November 30, 2016 , our Level 3 Financial instruments owned as a percentage of total Financial instruments also declined to 3.0% at November 30, 2016 from 3.3% at November 30, 2015 .
Securities financing assets and liabilities include both financing for our financial instruments trading activity and matched book transactions. Matched book transactions accommodate customers, as well as obtain securities for the settlement and financing of inventory positions. The aggregate outstanding balance of our securities borrowed and securities purchased under agreements to resell increased by 7.1% from November 30, 2015 to November 30, 2016 , due to an increase in firm financing of our short inventory and a decrease in the netting benefit for our collateralized financing transactions, partially offset by a decrease in our matched book activity. The outstanding balance of our securities loaned and securities sold under agreement to repurchase decreased by 26.0% from November 30, 2015 to November 30, 2016 due to decreases in our matched book activity and firm financing of our inventory, partially offset by a decrease in the netting benefit for our collateralized financing transactions. Our average month end balances of total reverse repos and stock borrows during 2016 were 23.9% higher than the November 30, 2016 balances. Our average month end balances of total repos and stock loans during 2016 were 48.9% higher than the November 30, 2016 balances.
The following table presents our period end balance, average balance and maximum balance at any month end within the periods presented for Securities purchased under agreements to resell and Securities sold under agreements to repurchase (in millions):
| Year Ended | ||||||
| 2016 |
| 2015 | ||||
Securities Purchased Under Agreements to Resell: |
|
|
| ||||
Period end | $ | 3,862 | |
| $ | 3,857 | |
Month end average | 5,265 | |
| 5,719 | | ||
Maximum month end | 7,001 | |
| 7,577 | | ||
Securities Sold Under Agreements to Repurchase: |
|
|
| ||||
Period end | $ | 6,792 | |
| $ | 10,004 | |
Month end average | 11,410 | |
| 14,026 | | ||
Maximum month end | 16,620 | |
| 18,629 | | ||
Fluctuations in the balance of our repurchase agreements from period to period and intraperiod are dependent on business activity in those periods. Additionally, the fluctuations in the balances of our securities purchased under agreements to resell over the periods presented are influenced in any given period by our clients' balances and our clients' desires to execute collateralized financing arrangements via the repurchase market or via other financing products. Average balances and period end balances will fluctuate based on market and liquidity conditions and we consider the fluctuations intraperiod to be typical for the repurchase market.
27
Table of Contents
JEFFERIES GROUP LLC AND SUBSIDIARIES
Leverage Ratios
The following table presents total assets, adjusted assets, total equity, total member's equity, tangible equity and tangible member's equity with the resulting leverage ratios (in thousands):
|
| November 30, | ||||||
|
| 2016 |
| 2015 | ||||
Total assets | $ | 36,941,276 | |
| $ | 38,563,972 | | |
Deduct: | Securities borrowed | (7,743,562 | ) |
| (6,975,136 | ) | ||
| Securities purchased under agreements to resell | (3,862,488 | ) |
| (3,857,306 | ) | ||
|
|
|
|
| ||||
Add: | Financial instruments sold, not yet purchased | 8,359,202 | |
| 6,785,064 | | ||
| Less derivative liabilities | (637,535 | ) |
| (208,548 | ) | ||
Subtotal | 7,721,667 | |
| 6,576,516 | | |||
Deduct: | Cash and securities segregated and on deposit for regulatory purposes or deposited with clearing and depository organizations | (857,337 | ) |
| (751,084 | ) | ||
| Goodwill and intangible assets | (1,847,124 | ) |
| (1,882,371 | ) | ||
Adjusted assets (1) | $ | 30,352,432 | |
| $ | 31,674,591 | | |
Total equity | $ | 5,370,597 | |
| $ | 5,509,377 | | |
Deduct: | Goodwill and intangible assets | (1,847,124 | ) |
| (1,882,371 | ) | ||
Tangible total equity | $ | 3,523,473 | |
| $ | 3,627,006 | | |
Total member's equity (2) | $ | 5,369,946 | |
| $ | 5,481,909 | | |
Deduct: | Goodwill and intangible assets | (1,847,124 | ) |
| (1,882,371 | ) | ||
Tangible member's equity (2) | $ | 3,522,822 | |
| $ | 3,599,538 | | |
Leverage ratio (2) (3) | 6.9 | |
| 7.0 | | |||
Tangible gross leverage ratio (2) (4) | 10.0 | |
| 10.2 | | |||
Adjusted leverage ratio (1) (2) (5) | 8.6 | |
| 8.7 | | |||
(1) | Adjusted assets is a non-GAAP financial measure and excludes certain assets that are considered of lower risk as they are generally self-financed by customer liabilities through our securities lending activities. We view the resulting measure of adjusted leverage, also a non-GAAP financial measure, as a more relevant measure of financial risk when comparing financial services companies. |
(2) | As compared to November 30, 2015 , the decrease to total member's equity at November 30, 2016 is attributed to foreign currency translation adjustments, primarily due to the decline in the British pound rate of exchange against the U.S. dollar, partially offset by net earnings. |
(3) | Leverage ratio equals total assets divided by total equity. |
(4) | Tangible gross leverage ratio (a non-GAAP financial measure) equals total assets less goodwill and identifiable intangible assets divided by tangible member's equity. The tangible gross leverage ratio is used by Rating Agencies in assessing our leverage ratio. |
(5) | Adjusted leverage ratio (a non-GAAP financial measure) equals adjusted assets divided by tangible total equity. |
Liquidity Management
The key objectives of the liquidity management framework are to support the successful execution of our business strategies while ensuring sufficient liquidity through the business cycle and during periods of financial distress. Our liquidity management policies are designed to mitigate the potential risk that we may be unable to access adequate financing to service our financial obligations without material franchise or business impact.
The principal elements of our liquidity management framework are our Contingency Funding Plan, our Cash Capital Policy and our assessment of Maximum Liquidity Outflow.
Contingency Funding Plan . Our Contingency Funding Plan is based on a model of a potential liquidity contraction over a one year time period. This incorporates potential cash outflows during a liquidity stress event, including, but not limited to, the following:
• | repayment of all unsecured debt maturing within one year and no incremental unsecured debt issuance; |
• | maturity rolloff of outstanding letters of credit with no further issuance and replacement with cash collateral; |
28
Table of Contents
JEFFERIES GROUP LLC AND SUBSIDIARIES
• | higher margin requirements than currently exist on assets on securities financing activity, including repurchase agreements; |
• | liquidity outflows related to possible credit downgrade; |
• | lower availability of secured funding; |
• | client cash withdrawals; |
• | the anticipated funding of outstanding investment and loan commitments; and |
• | certain accrued expenses and other liabilities and fixed costs. |
Cash Capital Policy . We maintain a cash capital model that measures long-term funding sources against requirements. Sources of cash capital include our equity and the noncurrent portion of long-term borrowings. Uses of cash capital include the following:
• | illiquid assets such as equipment, goodwill, net intangible assets, exchange memberships, deferred tax assets and certain investments; |
• | a portion of securities inventory that is not expected to be financed on a secured basis in a credit stressed environment ( i.e. , margin requirements) and |
• | drawdowns of unfunded commitments. |
To ensure that we do not need to liquidate inventory in the event of a funding crisis, we seek to maintain surplus cash capital, which is reflected in the leverage ratios we maintain. Our total long-term capital of $10.5 billion at November 30, 2016 exceeded our cash capital requirements.
Maximum Liquidity Outflow . Our businesses are diverse, and our liquidity needs are determined by many factors, including market movements, collateral requirements and client commitments, all of which can change dramatically in a difficult funding environment. During a liquidity crisis, credit-sensitive funding, including unsecured debt and some types of secured financing agreements, may be unavailable, and the terms ( e.g. , interest rates, collateral provisions and tenor) or availability of other types of secured financing may change. As a result of our policy to ensure we have sufficient funds to cover what we estimate may be needed in a liquidity crisis, we hold more cash and unencumbered securities and have greater long-term debt balances than our businesses would otherwise require. As part of this estimation process, we calculate a Maximum Liquidity Outflow that could be experienced in a liquidity crisis. Maximum Liquidity Outflow is based on a scenario that includes both a market-wide stress and firm-specific stress, characterized by some or all of the following elements:
• | Global recession, default by a medium-sized sovereign, low consumer and corporate confidence, and general financial instability. |
• | Severely challenged market environment with material declines in equity markets and widening of credit spreads. |
• | Damaging follow-on impacts to financial institutions leading to the failure of a large bank. |
• | A firm-specific crisis potentially triggered by material losses, reputational damage, litigation, executive departure, and/or a ratings downgrade. |
The following are the critical modeling parameters of the Maximum Liquidity Outflow:
• | Liquidity needs over a 30-day scenario. |
• | A two-notch downgrade of our long-term senior unsecured credit ratings. |
• | No support from government funding facilities. |
• | A combination of contractual outflows, such as upcoming maturities of unsecured debt, and contingent outflows ( e.g ., actions though not contractually required, we may deem necessary in a crisis). We assume that most contingent outflows will occur within the initial days and weeks of a crisis. |
• | No diversification benefit across liquidity risks. We assume that liquidity risks are additive. |
The calculation of our Maximum Liquidity Outflow under the above stresses and modeling parameters considers the following potential contractual and contingent cash and collateral outflows:
• | All upcoming maturities of unsecured long-term debt, commercial paper, promissory notes and other unsecured funding products assuming we will be unable to issue new unsecured debt or rollover any maturing debt. |
• | Repurchases of our outstanding long-term debt in the ordinary course of business as a market maker. |
29
Table of Contents
JEFFERIES GROUP LLC AND SUBSIDIARIES
• | A portion of upcoming contractual maturities of secured funding trades due to either the inability to refinance or the ability to refinance only at wider haircuts ( i.e. , on terms which require us to post additional collateral). Our assumptions reflect, among other factors, the quality of the underlying collateral and counterparty concentration. |
• | Collateral postings to counterparties due to adverse changes in the value of our over-the-counter ("OTC") derivatives and other outflows due to trade terminations, collateral substitutions, collateral disputes, collateral calls or termination payments required by a two-notch downgrade in our credit ratings. |
• | Variation margin postings required due to adverse changes in the value of our outstanding exchange-traded derivatives and any increase in initial margin and guarantee fund requirements by derivative clearing houses. |
• | Liquidity outflows associated with our prime brokerage business, including withdrawals of customer credit balances, and a reduction in customer short positions. |
• | Liquidity outflows to clearing banks to ensure timely settlements of cash and securities transactions. |
• | Draws on our unfunded commitments considering, among other things, the type of commitment and counterparty. |
• | Other upcoming large cash outflows, such as tax payments. |
Based on the sources and uses of liquidity calculated under the Maximum Liquidity Outflow scenarios, we determine, based on a calculated surplus or deficit, additional long-term funding that may be needed versus funding through the repurchase financing market and consider any adjustments that may be necessary to our inventory balances and cash holdings. At November 30, 2016, we have sufficient excess liquidity to meet all contingent cash outflows detailed in the Maximum Liquidity Outflow. We regularly refine our model to reflect changes in market or economic conditions and the firm's business mix.
Sources of Liquidity
The following are financial instruments that are cash and cash equivalents or are deemed by management to be generally readily convertible into cash, marginable or accessible for liquidity purposes within a relatively short period of time (dollars in thousands):
| November 30, 2016 |
| Average Balance Quarter ended November 30, 2016 (1) |
| November 30, 2015 | ||||||
Cash and cash equivalents: |
|
|
|
|
| ||||||
Cash in banks | $ | 905,003 | |
| $ | 866,598 | |
| $ | 973,796 | |
Certificate of deposit | 25,000 | |
| 25,000 | |
| 75,000 | | |||
Money market investments | 2,599,066 | |
| 1,535,870 | |
| 2,461,367 | | |||
Total cash and cash equivalents | 3,529,069 | |
| 2,427,468 | |
| 3,510,163 | | |||
Other sources of liquidity: |
|
|
|
|
| ||||||
Debt securities owned and securities purchased under agreements to resell (2) | 1,455,398 | |
| 1,234,599 | |
| 1,265,840 | | |||
Other (3)(4) | 318,646 | |
| 604,424 | |
| 163,890 | | |||
Total other sources (4) | 1,774,044 | |
| 1,839,023 | |
| 1,429,730 | | |||
Total cash and cash equivalents and other liquidity sources (4) | $ | 5,303,113 | |
| $ | 4,266,491 | |
| $ | 4,939,893 | |
Total cash and cash equivalents and other liquidity sources as % of total assets (4) | 14.4 | % |
|
|
| 12.8 | % | ||||
Total cash and cash equivalents and other liquidity sources as % of total assets less goodwill and intangible assets (4) | 15.1 | % |
|
|
| 13.5 | % | ||||
(1) | Average balances are calculated based on weekly balances. |
(2) | Consists of high quality sovereign government securities and reverse repurchase agreements collateralized by U.S. government securities and other high quality sovereign government securities; deposits with a central bank within the European Economic Area, Canada, Australia, Japan, Switzerland or the USA; and securities issued by a designated multilateral development bank and reverse repurchase agreements with underlying collateral comprised of these securities. |
(3) | Other includes unencumbered inventory representing an estimate of the amount of additional secured financing that could be reasonably expected to be obtained from our financial instruments owned that are currently not pledged after considering reasonable financing haircuts. |
30
Table of Contents
JEFFERIES GROUP LLC AND SUBSIDIARIES
(4) | Other sources of liquidity at November 30, 2015 has been reduced by $141.2 million from what was previously disclosed, to reflect adjustments for certain securities that have subsequently been identified to have been encumbered. |
In addition to the cash balances and liquidity pool presented above, the majority of financial instruments (both long and short) in our trading accounts are actively traded and readily marketable. At November 30, 2016 , we had the ability to readily obtain repurchase financing for 75.4% of our inventory at haircuts of 10% or less, which reflects the liquidity of our inventory. In addition, as a matter of our policy, all of these assets have internal capital assessed, which is in addition to the funding haircuts provided in the securities finance markets. Additionally, certain of our Financial instruments owned primarily consisting of bank loans, consumer loans and investments are predominantly funded by long term capital. Under our cash capital policy, we model capital allocation levels that are more stringent than the haircuts used in the market for secured funding; and we maintain surplus capital at these more stringent levels. We continually assess the liquidity of our inventory based on the level at which we could obtain financing in the market place for a given asset. Assets are considered to be liquid if financing can be obtained in the repurchase market or the securities lending market at collateral haircut levels of 10% or less. The following summarizes our financial instruments by asset class that we consider to be of a liquid nature and the amount of such assets that have not been pledged as collateral at November 30, 2016 and 2015 (in thousands):
| November 30, | ||||||||||||||
| 2016 |
| 2015 | ||||||||||||
| Liquid Financial Instruments |
| Unencumbered Liquid Financial Instruments (2) |
| Liquid Financial Instruments |
| Unencumbered Liquid Financial Instruments (2) | ||||||||
Corporate equity securities | $ | 1,815,819 | |
| $ | 280,733 | |
| $ | 1,881,419 | |
| $ | 268,664 | |
Corporate debt securities | 1,818,150 | |
| - | |
| 1,999,162 | |
| 89,230 | | ||||
U.S. government, agency and municipal securities | 3,157,737 | |
| 600,456 | |
| 2,987,784 | |
| 317,518 | | ||||
Other sovereign obligations | 2,258,035 | |
| 854,942 | |
| 2,444,339 | |
| 1,026,842 | | ||||
Agency mortgage-backed securities (1) | 1,090,391 | |
| - | |
| 3,371,680 | |
| - | | ||||
Loans and other receivables | 274,842 | |
| - | |
| - | |
| - | | ||||
Total | $ | 10,414,974 | |
| $ | 1,736,131 | |
| $ | 12,684,384 | |
| $ | 1,702,254 | |
(1) | Consists solely of agency mortgage-backed securities issued by Freddie Mac, Fannie Mae and Ginnie Mae. These securities include pass-through securities, securities backed by adjustable rate mortgages ("ARMs"), collateralized mortgage obligations, commercial mortgage-backed securities and interest- and principal-only securities. |
(2) | Unencumbered liquid balances represent assets that can be sold or used as collateral for a loan, but have not been. |
Average liquid financial instruments were $11.8 billion and $15.2 billion for 2016 and 2015 , respectively. Average unencumbered liquid financial instruments were $1.6 billion and $1.9 billion for 2016 and 2015 , respectively.
In addition to being able to be readily financed at modest haircut levels, we estimate that each of the individual securities within each asset class above could be sold into the market and converted into cash within three business days under normal market conditions, assuming that the entire portfolio of a given asset class was not simultaneously liquidated. There are no restrictions on the unencumbered liquid securities, nor have they been pledged as collateral.
Sources of Funding and Capital Resources
Our assets are funded by equity capital, senior debt, convertible debt, securities loaned, securities sold under agreements to repurchase, customer free credit balances, bank loans and other payables.
31
Table of Contents
JEFFERIES GROUP LLC AND SUBSIDIARIES
Secured Financing
We rely principally on readily available secured funding to finance our inventory of financial instruments. Our ability to support increases in total assets is largely a function of our ability to obtain short and intermediate-term secured funding, primarily through securities financing transactions. We finance a portion of our long inventory and cover some of our short inventory by pledging and borrowing securities in the form of repurchase or reverse repurchase agreements (collectively "repos"), respectively. Approximately 75.7% of our cash and non-cash repurchase financing activities use collateral that is considered eligible collateral by central clearing corporations. Central clearing corporations are situated between participating members who borrow cash and lend securities (or vice versa); accordingly repo participants contract with the central clearing corporation and not one another individually. Therefore, counterparty credit risk is borne by the central clearing corporation which mitigates the risk through initial margin demands and variation margin calls from repo participants. The comparatively large proportion of our total repo activity that is eligible for central clearing reflects the high quality and liquid composition of the inventory we carry in our trading books. For those asset classes not eligible for central clearinghouse financing, we seek to execute our bi-lateral financings on an extended term basis and the tenor of our repurchase and reverse repurchase agreements generally exceeds the expected holding period of the assets we are financing. Weighted average maturity of cash and non-cash repurchase agreements for non-clearing corporation eligible funded inventory is approximately three months at November 30, 2016 .
Our ability to finance our inventory via central clearinghouses and bi-lateral arrangements is augmented by our ability to draw bank loans on an uncommitted basis under our various banking arrangements. At November 30, 2016 , short-term borrowings, which must be repaid within one year or less and include bank loans and overdrafts, borrowings under revolving credit facilities, structured notes and a demand loan margin financing facility, totaled $525.8 million . Interest under the bank lines is generally at a spread over the federal funds rate. Letters of credit are used in the normal course of business mostly to satisfy various collateral requirements in favor of exchanges in lieu of depositing cash or securities. Average daily short-term borrowings outstanding were $399.6 million and $65.3 million for 2016 and 2015 , respectively.
Our short-term borrowings include the following facilities:
• | Demand Loan Facility. On February 19, 2016, we entered into a demand loan margin financing facility ("Demand Loan Facility") in a maximum principal amount of $25.0 million to satisfy certain of our margin obligations. Interest is based on an annual rate equal to the weighted average LIBOR as defined in the Demand Loan Facility agreement plus 150 basis points. The Demand Loan Facility was terminated with an effective date of November 30, 2016 . |
• | Secured Revolving Loan Facilities. On October 29, 2015 , we entered into a secured revolving loan facility ("First Secured Revolving Loan Facility") whereby the lender agrees to make available a revolving loan facility in a maximum principal amount of $50.0 million in U.S. dollars to purchase eligible receivables that meet certain requirements as defined in the First Secured Revolving Loan Facility agreement. Interest is based on an annual rate equal to the lesser of the LIBOR rate plus three and three-quarters percent or the maximum rate as defined in the First Secured Revolving Loan Facility agreement. On December 14, 2015, we entered into a second secured revolving loan facility ("Second Revolving Loan Facility", and together with the First Secured Revolving Loan Facility, "Secured Revolving Loan Facilities") whereby the lender agrees to make available a revolving loan facility in a maximum principal amount of $50.0 million in U.S. dollars to purchase eligible receivables that meet certain requirements as defined in the Second Secured Revolving Loan Facility agreement. Interest is based on an annual rate equal to the lesser of the LIBOR rate plus four and one-quarter percent or the maximum rate as defined in the Second Secured Revolving Loan Facility agreement. |
• | Intraday Credit Facility. The Bank of New York Mellon agrees to make revolving intraday credit advances ("Intraday Credit Facility") for an aggregate committed amount of $250.0 million in U.S. dollars. The Intraday Credit Facility contains a financial covenant, which includes a minimum regulatory net capital requirement. Interest is based on the higher of the Federal funds effective rate plus 0.5% or the prime rate. At November 30, 2016 , we were in compliance with all debt covenants under the Intraday Credit Facility. |
32
Table of Contents
JEFFERIES GROUP LLC AND SUBSIDIARIES
In addition to the above financing arrangements, we issue notes backed by eligible collateral under a master repurchase agreement, which provides an additional financing source for our inventory (our "repurchase agreement financing program"). The notes issued under the program are presented within Other secured financings in the Consolidated Statement of Financial Condition. At November 30, 2016 , our outstanding notes were $718.0 million and are as follows:
Series |
| Issued |
| Principal |
| Maturity |
2014-4 (1) |
| December 19, 2014 |
| $60.0 million |
| December 16, 2016 |
2014-5 (2) |
| January 20, 2015 |
| $68.1 million |
| January 18, 2017 |
2015-2 (1) (3) |
| May 12, 2015 |
| $170.0 million |
| May 15, 2018 |
2016-1 (1) |
| February 5, 2016 |
| $218.3 million |
| February 4, 2017 |
2016-3 (1) |
| May 12, 2016 |
| $201.6 million |
| May 11, 2017 |
(1) | These notes bear interest at a spread over one month LIBOR. |
(2) | This note bears interest at a spread over three month LIBOR. |
(3) | At November 30, 2016, this note is redeemable at the option of the noteholders. |
For additional details on our repurchase agreement financing program, refer to Note 8, Variable Interest Entities , in our consolidated financial statements included within this Annual Report on Form 10-K.
Total Long-Term Capital
At November 30, 2016 and 2015 , we had total long-term capital of $10.5 billion and $10.8 billion resulting in a long-term debt to equity capital ratio of 0.96:1 at both dates. Our total long-term capital base at November 30, 2016 and 2015 was as follows (in thousands):
| November 30, | ||||||
| 2016 |
| 2015 | ||||
Long-Term Debt (1) (2) | $ | 5,130,822 | |
| $ | 5,287,697 | |
Total Equity | 5,370,597 | |
| 5,509,377 | | ||
Total Long-Term Capital | $ | 10,501,419 | |
| $ | 10,797,074 | |
(1) | Long-term capital at November 30, 2016 excludes $6.3 million of our Structured Notes, as these notes are redeemable on May 4, 2017, and $346.2 million of our 3.875% Convertible Senior Debentures, as these debentures are redeemable on November 1, 2017. Refer to Note 12, Long-Term Debt , in our consolidated financial statements included within this Annual Report on Form 10-K for further details on these notes. |
(2) | Long-term capital at November 30, 2015 excludes $353.0 million of our 5.5% Senior Notes, as these notes matured on March 15, 2016. |
Long-Term Debt
During 2016, we issued structured notes with a total principal amount of approximately $275.4 million . Certain of the structured notes contain various interest rate payment terms and are accounted for at fair value, with changes in fair value resulting from a change in the instrument-specific credit risk presented in other comprehensive income and changes in fair value resulting from non-credit components recognized in Principal transaction revenues. The fair value of the structured notes was $248.9 million at November 30, 2016 . During 2016, approximately $350.0 million of long-term borrowings matured or were retired. On January 17, 2017, we issued 4.85% senior notes with a principal amount of $750.0 million, due 2027.
In addition, on January 21, 2016, we issued $15.0 million of Class A Notes, due 2022, and $7.5 million of Class B Notes, due 2022, secured by aircraft and related operating leases and which were non-recourse to us. In June 2016, the Class A Notes and the Class B Notes were repurchased and retired.
At November 30, 2016 , our long-term debt has a weighted average maturity of approximately seven years.
33
Table of Contents
JEFFERIES GROUP LLC AND SUBSIDIARIES
Our long-term debt ratings at November 30, 2016 are as follows:
| Rating |
| Outlook |
Moody's Investors Service (1) | Baa3 |
| Stable |
Standard and Poor's | BBB- |
| Stable |
Fitch Ratings (2) | BBB- |
| Stable |
(1) | On January 21, 2016, Moody's affirmed our long-term debt rating of Baa3 and our rating outlook was changed from negative to stable. On March 15, 2016, Moody's reaffirmed this rating and rating outlook. |
(2) | On February 29, 2016, Fitch reaffirmed our long-term debt rating of BBB- and our rating outlook of stable. |
At November 30, 2016 , the long-term ratings on our principal operating broker-dealers, Jefferies LLC ("Jefferies") (a U.S. broker-dealer) and Jefferies International Limited (a U.K. broker-dealer) are as follows:
| Jefferies |
| Jefferies International Limited | ||||
| Rating |
| Outlook |
| Rating |
| Outlook |
Moody's Investors Service (1) | Baa2 |
| Stable |
| Baa2 |
| Stable |
Standard and Poor's | BBB |
| Stable |
| BBB |
| Stable |
(1) | On January 21, 2016, Moody's affirmed these long-term debt ratings and the rating outlook was changed from negative to stable. |
Access to external financing to finance our day to day operations, as well as the cost of that financing, is dependent upon various factors, including our debt ratings. Our current debt ratings are dependent upon many factors, including industry dynamics, operating and economic environment, operating results, operating margins, earnings trend and volatility, balance sheet composition, liquidity and liquidity management, our capital structure, our overall risk management, business diversification and our market share and competitive position in the markets in which we operate. Deteriorations in any of these factors could impact our credit ratings. While certain aspects of a credit rating downgrade are quantifiable pursuant to contractual provisions, the impact on our business and trading results in future periods is inherently uncertain and depends on a number of factors, including the magnitude of the downgrade, the behavior of individual clients and future mitigating action taken by us.
In connection with certain over-the-counter derivative contract arrangements and certain other trading arrangements, we may be required to provide additional collateral to counterparties, exchanges and clearing organizations in the event of a credit rating downgrade. At November 30, 2016 , the amount of additional collateral that could be called by counterparties, exchanges and clearing organizations under the terms of such agreements in the event of a downgrade of our long-term credit rating below investment grade was $51.4 million. For certain foreign clearing organizations credit rating is only one of several factors employed in determining collateral that could be called. The above represents management's best estimate for additional collateral to be called in the event of credit rating downgrade. The impact of additional collateral requirements is considered in our Contingency Funding Plan and calculation of Maximum Liquidity Outflow, as described above.
Equity Capital
As compared to November 30, 2015 , the decrease to total member's equity at November 30, 2016 is attributed to foreign currency translation adjustments, primarily due to the decline in the British pound rate of exchange against the U.S. dollar, partially offset by net earnings.
Net Capital
As broker-dealers registered with the SEC and member firms of the Financial Industry Regulatory Authority ("FINRA"), Jefferies and Jefferies Execution are subject to the Securities and Exchange Commission Uniform Net Capital Rule ("Rule 15c3-1"), which requires the maintenance of minimum net capital, and have elected to calculate minimum capital requirements using the alternative method permitted by Rule 15c3-1 in calculating net capital. Jefferies, as a dually-registered U.S. broker-dealer and FCM, is also subject to Rule 1.17 of the Commodity Futures Trading Commission ("CFTC"), which sets forth minimum financial requirements. The minimum net capital requirement in determining excess net capital for a dually-registered U.S. broker-dealer and FCM is equal to the greater of the requirement under Rule 15c3-1 or CFTC Rule 1.17.
34
Table of Contents
JEFFERIES GROUP LLC AND SUBSIDIARIES
At November 30, 2016 , Jefferies and Jefferies Execution's net capital and excess net capital were as follows (in thousands):
| Net Capital |
| Excess Net Capital | ||||
Jefferies | $ | 1,467,729 | |
| $ | 1,398,748 | |
Jefferies Execution | 8,260 | |
| 8,010 | | ||
FINRA is the designated self-regulatory organization ("DSRO") for our U.S. broker-dealers and the National Futures Association is the DSRO for Jefferies as an FCM.
Certain other U.S. and non-U.S. subsidiaries are subject to capital adequacy requirements as prescribed by the regulatory authorities in their respective jurisdictions, including Jefferies International Limited which is subject to the regulatory supervision and requirements of the Financial Conduct Authority in the United Kingdom. The Dodd-Frank Wall Street Reform and Consumer Protection Act (the "Dodd-Frank Act") was signed into law on July 21, 2010. The Dodd-Frank Act contains provisions that require the registration of all swap dealers, major swap participants, security-based swap dealers, and/or major security-based swap participants. While entities that register under these provisions will be subject to regulatory capital requirements, these regulatory capital requirements have not yet been finalized. We expect that these provisions will result in modifications to the regulatory capital requirements of some of our entities, and will result in some of our other entities becoming subject to regulatory capital requirements for the first time, including Jefferies Financial Services, Inc., which registered as a swap dealer with the CFTC during January 2013 and Jefferies Financial Products LLC, which registered during August 2014.
The regulatory capital requirements referred to above may restrict our ability to withdraw capital from our regulated subsidiaries.
Contractual Obligations and Commitments
For information on our commitments and guarantees, see Note 18, Commitments, Contingencies and Guarantees , in our consolidated financial statements included within this Annual Report on Form 10-K.
The table below provides information about our contractual obligations at November 30, 2016 . The table presents principal cash flows with expected maturity dates (in millions):
| Expected Maturity Date |
|
| ||||||||||||||||||||
| 2017 |
| 2018 |
| 2019 and 2020 |
| 2021 and 2022 |
| 2023 and Later |
| Total | ||||||||||||
Contractual obligations: |
|
|
|
|
|
|
|
|
|
|
| ||||||||||||
Unsecured long-term debt (contractual principal payments net of unamortized discounts and premiums) (1) | $ | 346.2 | |
| $ | 824.2 | |
| $ | 1,317.3 | |
| $ | 827.6 | |
| $ | 2,168.1 | |
| $ | 5,483.4 | |
Interest payment obligations on senior notes (2) | 298.1 | |
| 259.7 | |
| 407.7 | |
| 268.7 | |
| 1,111.9 | |
| 2,346.1 | | ||||||
Operating leases (net of subleases) - premises and equipment (3) | 61.2 | |
| 61.7 | |
| 109.9 | |
| 100.5 | |
| 512.0 | |
| 845.3 | | ||||||
Master sale and leaseback agreement (3) | 3.8 | |
| 1.5 | |
| 0.2 | |
| - | |
| - | |
| 5.5 | | ||||||
Purchase obligations (4) | 87.5 | |
| 57.8 | |
| 77.9 | |
| 51.5 | |
| 11.4 | |
| 286.1 | | ||||||
Total contractual obligations | $ | 796.8 | |
| $ | 1,204.9 | |
| $ | 1,913.0 | |
| $ | 1,248.3 | |
| $ | 3,803.4 | |
| $ | 8,966.4 | |
(1) | For additional information on long-term debt, see Note 12, Long-Term Debt , in our consolidated financial statements included within this Annual Report on Form 10-K. |
(2) | Amounts based on applicable interest rates at November 30, 2016 . |
(3) | For additional information on operating leases related to certain premises and equipment and a master sale and leaseback agreement, see Note 18, Commitments, Contingencies and Guarantees , in our consolidated financial statements included within this Annual Report on Form 10-K. |
(4) | Purchase obligations for goods and services primarily include payments for outsourcing and computer and telecommunications maintenance agreements. Purchase obligations at November 30, 2016 reflect the minimum contractual obligations under legally enforceable contracts. |
We expect to make cash payments of $645.5 million on January 31, 2017 related to compensation awards for fiscal 2016. See Note 15, Compensation Plans , in our consolidated financial statements included within this Annual Report on Form 10-K for further information.
35
Table of Contents
JEFFERIES GROUP LLC AND SUBSIDIARIES
In the normal course of business we engage in other off balance sheet arrangements, including derivative contracts. Neither derivatives' notional amounts nor underlying instrument values are reflected as assets or liabilities in our Consolidated Statements of Financial Condition. Rather, the fair value of derivative contracts are reported in the Consolidated Statements of Financial Condition as Financial instruments owned or Financial instruments sold, not yet purchased as applicable. Derivative contracts are reflected net of cash paid or received pursuant to credit support agreements and are reported on a net by counterparty basis when a legal right of offset exists under an enforceable master netting agreement. For additional information about our accounting policies and our derivative activities see Note 2, Summary of Significant Accounting Policies , Note 4, Fair Value Disclosures , and Note 5, Derivative Financial Instruments , in our consolidated financial statements included within this Annual Report on Form 10-K.
We are routinely involved with variable interest entities ("VIEs") in the normal course of business. At November 30, 2016, we did not have any commitments to purchase assets from our VIEs. For additional information regarding our involvement with VIEs, see Note 7, Securitization Activities , and Note 8, Variable Interest Entities , in our consolidated financial statements included within this Annual Report on Form 10-K.
Due to the uncertainty regarding the timing and amounts that will ultimately be paid, our liability for unrecognized tax benefits has been excluded from the above contractual obligations table. See Note 17, Income Taxes , in our consolidated financial statements included within this Annual Report on Form 10-K for further information.
36
Table of Contents
JEFFERIES GROUP LLC AND SUBSIDIARIES
Risk Management
Overview
Risk is an inherent part of our business and activities. The extent to which we properly and effectively identify, assess, monitor and manage each of the various types of risk involved in our activities is critical to our financial soundness, viability and profitability. Accordingly, we have a comprehensive risk management approach, with a formal governance structure and processes to identify, assess, monitor and manage risk. Principal risks involved in our business activities include market, credit, liquidity and capital, operational, legal and compliance, new business, and reputational risk.
Risk management is a multifaceted process that requires communication, judgment and knowledge of financial products and markets. Accordingly, our risk management process encompasses the active involvement of executive and senior management, and also many departments independent of the revenue-producing business units, including the Risk Management, Operations, Compliance, Legal and Finance Departments. Our risk management policies, procedures and methodologies are fluid in nature and are subject to ongoing review and modification.
For discussion of liquidity and capital risk management, refer to the "Liquidity, Financial Condition and Capital Resources" section herein.
Governance and Risk Management Structure
Our Board of Directors. Our Board of Directors and its Audit Committee play an important role in reviewing our risk management process and risk tolerance. Our Board of Directors and Audit Committee are provided with data relating to risk at each of its regularly scheduled meetings. Our Chief Risk Officer and Global Treasurer meet with the Board of Directors on not less than a quarterly basis to present our risk profile and liquidity profile and to respond to questions.
Risk Committees. We make extensive use of internal committees to govern risk taking and ensure that business activities are properly identified, assessed, monitored and managed. Our Risk Management Committee meets weekly to discuss our risk, capital, and liquidity profile in detail. In addition, business or market trends and their potential impact on the risk profile are discussed. Membership is comprised of our Chief Executive Officer and Chairman, Chairman of the Executive Committee, Chief Financial Officer, Chief Risk Officer and Global Treasurer. The Committee approves limits for us as a whole, and across risk categories and business lines. It also reviews all limit breaches. Limits are reviewed on at least an annual basis. Other risk related committees include Market Risk Management, Credit Risk Management, New Business, Underwriting Acceptance, Margin Oversight, Executive Management and Operating Committees. These Committees govern risk taking and ensure that business activities are properly managed for their area of oversight.
Risk Related Policies. We make use of various policies in the risk management process:
• | Market Risk Policy- This policy sets out roles, responsibilities, processes and escalation procedures regarding market risk management. |
• | Independent Price Verification Policy - This policy sets out roles, responsibilities, processes and escalation procedures regarding independent price verification for securities and other financial instruments. |
• | Operational Risk Policy - This policy sets out roles, responsibilities, processes and escalation procedures regarding operational risk management. |
• | Credit Risk Policy- This policy provides standards and controls for credit risk-taking throughout our global business activities. This policy also governs credit limit methodology and counterparty review. |
• | Model Validation Policy- This policy sets out roles, processes and escalation procedures regarding model validation and model risk management. |
Risk Management Key Metrics
We apply a comprehensive framework of limits on a variety of key metrics to constrain the risk profile of our business activities. The size of the limit reflects our risk tolerance for a certain activity under normal business conditions. Key metrics included in our framework include inventory position and exposure limits on a gross and net basis, scenario analysis and stress tests, Value-at-Risk, sensitivities (greeks), exposure concentrations, aged inventory, amount of Level 3 assets, counterparty exposure, leverage, cash capital, and performance analysis metrics.
37
Table of Contents
JEFFERIES GROUP LLC AND SUBSIDIARIES
Market Risk
The potential for changes in the value of financial instruments is referred to as market risk. Our market risk generally represents the risk of loss that may result from a change in the value of a financial instrument as a result of fluctuations in interest rates, credit spreads, equity prices, commodity prices and foreign exchange rates, along with the level of volatility. Interest rate risks result primarily from exposure to changes in the yield curve, the volatility of interest rates, and credit spreads. Equity price risks result from exposure to changes in prices and volatilities of individual equities, equity baskets and equity indices. Commodity price risks result from exposure to the changes in prices and volatilities of individual commodities, commodity baskets and commodity indices. Market risk arises from market making, proprietary trading, underwriting, specialist and investing activities. We seek to manage our exposure to market risk by diversifying exposures, controlling position sizes, and establishing economic hedges in related securities or derivatives. Due to imperfections in correlations, gains and losses can occur even for positions that are hedged. Position limits in trading and inventory accounts are established and monitored on an ongoing basis. Each day, consolidated position and exposure reports are prepared and distributed to various levels of management, which enable management to monitor inventory levels and results of the trading groups.
Value-at-Risk
We estimate Value-at-Risk ("VaR") using a model that simulates revenue and loss distributions on our trading portfolios by applying historical market changes to the current portfolio. Using the results of this simulation, VaR measures the potential loss in value of our financial instruments due to adverse market movements over a specified time horizon at a given confidence level. We calculate a one-day VaR using a one year look-back period measured at a 95% confidence level.
As with all measures of VaR, our estimate has inherent limitations due to the assumption that historical changes in market conditions are representative of the future. Furthermore, the VaR model measures the risk of a current static position over a one-day horizon and might not capture the market risk of positions that cannot be liquidated or offset with hedges in a one-day period. Published VaR results reflect past trading positions while future risk depends on future positions.
While we believe the assumptions and inputs in our risk model are reasonable, we could incur losses greater than the reported VaR because the historical market prices and rates changes may not be an accurate measure of future market events and conditions. Consequently, this VaR estimate is only one of a number of tools we use in our daily risk management activities.
When comparing our VaR numbers to those of other firms, it is important to remember that different methodologies and assumptions could produce significantly different results.
Our average daily VaR decreased to $7.91 million for 2016 from $12.39 million for 2015 . The decrease was driven by lower block trading activity and firmwide defensive positioning resulting in lower equity risk and fixed income exposures, partially offset by a lower diversification benefit. Excluding our investment in KCG, our average VaR decreased to $5.77 million for 2016 from $9.97 million for 2015 .
The following table illustrates each separate component of VaR for each component of market risk by interest rate, equity, currency and commodity products, as well as for our overall trading positions using the past 365 days of historical data (in millions):
|
|
| Daily VaR (1) Value-at-Risk In Trading Portfolios |
|
|
|
|
|
|
|
| ||||||||||||||||||||
| VaR at November 30, 2016 |
|
| VaR at November 30, 2015 |
|
| |||||||||||||||||||||||||
|
| Daily VaR for 2016 |
|
| Daily VaR for 2015 | ||||||||||||||||||||||||||
Risk Categories: |
|
| Average |
| High |
| Low |
|
|
| Average |
| High |
| Low | ||||||||||||||||
Interest Rates | $ | 5.82 | |
| $ | 4.96 | |
| $ | 6.99 | |
| $ | 3.43 | |
| $ | 5.01 | |
| $ | 5.84 | |
| $ | 8.06 | |
| $ | 4.19 | |
Equity Prices | 6.71 | |
| 5.42 | |
| 9.55 | |
| 2.60 | |
| 6.69 | |
| 9.79 | |
| 13.61 | |
| 5.39 | | ||||||||
Currency Rates | 0.19 | |
| 0.41 | |
| 3.01 | |
| 0.07 | |
| 0.30 | |
| 0.46 | |
| 3.32 | |
| 0.12 | | ||||||||
Commodity Prices | 0.51 | |
| 0.84 | |
| 2.44 | |
| 0.31 | |
| 0.82 | |
| 0.57 | |
| 1.62 | |
| 0.04 | | ||||||||
Diversification Effect (2) | (4.79 | ) |
| (3.72 | ) |
| N/A | |
| N/A | |
| (5.09 | ) |
| (4.27 | ) |
| N/A | |
| N/A | | ||||||||
Firmwide | $ | 8.44 | |
| $ | 7.91 | |
| $ | 11.40 | |
| $ | 4.30 | |
| $ | 7.73 | |
| $ | 12.39 | |
| $ | 17.75 | |
| $ | 6.35 | |
(1) | For the VaR numbers reported above, a one-day time horizon, with a one year look-back period, and a 95% confidence level were used. |
(2) | The diversification effect is not applicable for the maximum and minimum VaR values as the firmwide VaR and the VaR values for the four risk categories might have occurred on different days during the year. |
The aggregated VaR presented here is less than the sum of the individual components ( i.e. , interest rate risk, foreign exchange rate risk, equity risk and commodity price risk) due to the benefit of diversification among the four risk categories. Diversification benefit equals the difference between aggregated VaR and the sum of VaRs for the four risk categories and arises because the market risk categories are not perfectly correlated.
38
Table of Contents
JEFFERIES GROUP LLC AND SUBSIDIARIES
The chart below reflects our daily VaR over the last four quarters:
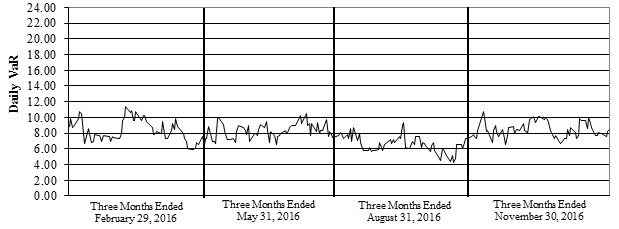
The primary method used to test the efficacy of the VaR model is to compare our actual daily net revenue for those positions included in our VaR calculation with the daily VaR estimate. This evaluation is performed at various levels of the trading portfolio, from the holding company level down to specific business lines. For the VaR model, trading related revenue is defined as principal transaction revenue, trading related commissions, revenue from securitization activities and net interest income. For a 95% confidence one day VaR model ( i.e., no intra-day trading), assuming current changes in market value are consistent with the historical changes used in the calculation, net trading losses would not be expected to exceed the VaR estimates more than twelve times on an annual basis ( i.e., once in every 20 days). During 2016 , results of the evaluation at the aggregate level demonstrated three days when the net trading loss exceeded the 95% one day VaR.
Certain positions within financial instruments are not included in the VaR model because VaR is not the most appropriate measure of risk. Accordingly, Risk Management has additional procedures in place to assure that the level of potential loss that would arise from market movements are within acceptable levels. Such procedures include performing stress tests, monitoring concentration risk and tracking price target/stop loss levels. The table below presents the potential reduction in net income associated with a 10% stress of the fair value of the positions that are not included in the VaR model at November 30, 2016 (in thousands):
| 10% Sensitivity | ||
Private investments | $ | 20,980 | |
Corporate debt securities in default | 5,040 | | |
Trade claims | 491 | | |
39
Table of Contents
JEFFERIES GROUP LLC AND SUBSIDIARIES
VaR also excludes the impact of changes in our own credit spreads on financial liabilities for which the fair value option was elected. The estimated credit spread risk sensitivity for each one basis point widening in our own credit spreads on financial liabilities for which the fair value option was elected was an increase in value of approximately $250,000 at November 30, 2016.
Daily Net Trading Revenue
Excluding trading losses associated with the daily marking to market of our investment in KCG, there were 21 days with trading losses out of a total of 253 trading days in 2016 . Including these losses, there were 38 days with trading losses. The histogram below presents the distribution of our actual daily net trading revenue for substantially all of our trading activities for 2016 (in millions).
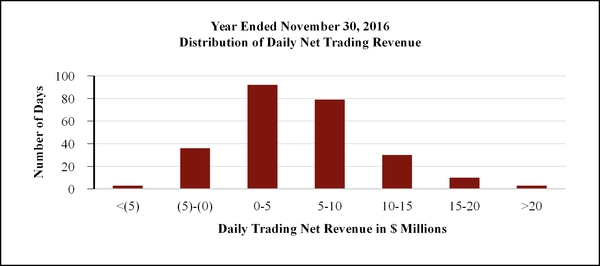
Scenario Analysis and Stress Tests
While VaR measures potential losses due to adverse changes in historical market prices and rates, we use stress testing to analyze the potential impact of specific events or moderate or extreme market moves on our current portfolio both firm wide and within business segments. Stress scenarios comprise both historical market price and rate changes and hypothetical market environments, and generally involve simultaneous changes of many risk factors. Indicative market changes in our scenarios include, but are not limited to, a large widening of credit spreads, a substantial decline in equities markets, significant moves in selected emerging markets, large moves in interest rates, changes in the shape of the yield curve and large moves in European markets. In addition, we also perform ad hoc stress tests and add new scenarios as market conditions dictate. Because our stress scenarios are meant to reflect market moves that occur over a period of time, our estimates of potential loss assume some level of position reduction for liquid positions. Unlike our VaR, which measures potential losses within a given confidence interval, stress scenarios do not have an associated implied probability; rather, stress testing is used to estimate the potential loss from market moves that tend to be larger than those embedded in the VaR calculation.
Stress testing is performed and reported regularly as part of the risk management process. Stress testing is used to assess our aggregate risk position as well as for limit setting and risk/reward analysis.
Counterparty Credit Risk and Issuer Country Exposure
Counterparty Credit Risk
Credit risk is the risk of loss due to adverse changes in a counterparty's credit worthiness or its ability or willingness to meet its financial obligations in accordance with the terms and conditions of a financial contract. We are exposed to credit risk as trading counterparty to other broker-dealers and customers, as a direct lender and through extending loan commitments, as a holder of securities and as a member of exchanges and clearing organizations.
It is critical to our financial soundness and profitability that we properly and effectively identify, assess, monitor, and manage the various credit and counterparty risks inherent in our businesses. Credit is extended to counterparties in a controlled manner in order to generate acceptable returns, whether such credit is granted directly or is incidental to a transaction. All extensions of credit are monitored and managed on an enterprise level in order to limit exposure to loss related to credit risk.
40
Table of Contents
JEFFERIES GROUP LLC AND SUBSIDIARIES
Our Credit Risk Framework is responsible for identifying credit risks throughout the operating businesses, establishing counterparty limits and managing and monitoring those credit limits. Our framework includes:
• | defining credit limit guidelines and credit limit approval processes; |
• | providing a consistent and integrated credit risk framework across the enterprise; |
• | approving counterparties and counterparty limits with parameters set by the Risk Management Committee; |
• | negotiating, approving and monitoring credit terms in legal and master documentation; |
• | delivering credit limits to all relevant sales and trading desks; |
• | maintaining credit reviews for all active and new counterparties; |
• | operating a control function for exposure analytics and exception management and reporting; |
• | determining the analytical standards and risk parameters for on-going management and monitoring of global credit risk books; |
• | actively managing daily exposure, exceptions, and breaches; |
• | monitoring daily margin call activity and counterparty performance (in concert with the Margin Department); and |
• | setting the minimum global requirements for systems, reports, and technology. |
Credit Exposures
Credit exposure exists across a wide-range of products including cash and cash equivalents, loans, securities finance transactions and over-the-counter derivative contracts.
• | Loans and lending arise in connection with our capital markets activities and represents the current exposure, amount at risk on a default event with no recovery of loans. Current exposure represents loans that have been drawn by the borrower and lending commitments that were outstanding. In addition, credit exposures on forward settling traded loans are included within our loans and lending exposures for consistency with the balance sheet categorization of these items. |
• | Securities and margin finance includes credit exposure arising on securities financing transactions (reverse repurchase agreements, repurchase agreements and securities lending agreements) to the extent the fair value of the underlying collateral differs from the contractual agreement amount and from margin provided to customers. |
• | Derivatives represent OTC derivatives, which are reported net by counterparty when a legal right of setoff exists under an enforceable master netting agreement. Derivatives are accounted for at fair value net of cash collateral received or posted under credit support agreements. In addition, credit exposures on forward settling trades are included within our derivative credit exposures. |
• | Cash and cash equivalents include both interest-bearing and non-interest bearing deposits at banks. |
Current counterparty credit exposures at November 30, 2016 and November 30, 2015 are summarized in the tables below and provided by credit quality, region and industry (in millions). Credit exposures presented take netting and collateral into consideration by counterparty and master agreement. Collateral taken into consideration includes both collateral received as cash as well as collateral received in the form of securities or other arrangements. Current exposure is the loss that would be incurred on a particular set of positions in the event of default by the counterparty, assuming no recovery. Current exposure equals the fair value of the positions less collateral. Issuer risk is the credit risk arising from inventory positions (for example, corporate debt securities and secondary bank loans). Issuer risk is included in our country risk exposure tables below. Of our counterparty credit exposure at November 30, 2016 , excluding cash and cash equivalents, the percentage of exposure from investment grade counterparties increased slightly to 82% from 79% at November 30, 2015 , and is mainly concentrated in North America.
When comparing our credit exposure at November 30, 2016 with credit exposure at November 30, 2015 , excluding cash and cash equivalents, current exposure has decreased 6% to approximately $1.2 billion from $1.3 billion. Counterparty credit exposure decreased over 2015 by 24% from loans and lending primarily due to North American loans and by 11% over the year from securities and margin finance. Counterparty credit exposure from OTC derivatives increased by 54%, primarily associated with CLO warehouse funding arrangements.
41
Table of Contents
JEFFERIES GROUP LLC AND SUBSIDIARIES
Counterparty Credit Exposure by Credit Rating | |||||||||||||||||||||||||||||||||||||||||||||||
| Loans and Lending |
| Securities and Margin Finance |
| OTC Derivatives |
| Total |
| Cash and Cash Equivalents |
| Total with Cash and Cash Equivalents | ||||||||||||||||||||||||||||||||||||
| At |
| At |
| At |
| At |
| At |
| At | ||||||||||||||||||||||||||||||||||||
| November 30, |
| November |
| November 30, |
| November |
| November 30, |
| November |
| November 30, |
| November |
| November 30, |
| November |
| November 30, |
| November | ||||||||||||||||||||||||
AAA Range | $ | - | |
| $ | - | |
| $ | - | |
| $ | 11.8 | |
| $ | - | |
| $ | - | |
| $ | - | |
| $ | 11.8 | |
| $ | 2,601.4 | |
| $ | 2,461.4 | |
| $ | 2,601.4 | |
| $ | 2,473.2 | |
AA Range | 44.0 | |
| - | |
| 87.3 | |
| 152.3 | |
| 2.1 | |
| 4.4 | |
| 133.4 | |
| 156.7 | |
| 37.0 | |
| 175.0 | |
| 170.4 | |
| 331.7 | | ||||||||||||
A Range | 4.2 | |
| 1.0 | |
| 539.2 | |
| 556.4 | |
| 214.7 | |
| 96.0 | |
| 758.1 | |
| 653.4 | |
| 814.1 | |
| 846.3 | |
| 1,572.2 | |
| 1,499.7 | | ||||||||||||
BBB Range | 4.9 | |
| 86.6 | |
| 117.3 | |
| 107.9 | |
| 9.4 | |
| 31.7 | |
| 131.6 | |
| 226.2 | |
| 51.2 | |
| 25.8 | |
| 182.8 | |
| 252.0 | | ||||||||||||
BB or Lower | 100.1 | |
| 181.6 | |
| 6.2 | |
| 14.8 | |
| 23.8 | |
| 30.1 | |
| 130.1 | |
| 226.5 | |
| 25.1 | |
| - | |
| 155.2 | |
| 226.5 | | ||||||||||||
Unrated | 93.5 | |
| 56.3 | |
| - | |
| - | |
| - | |
| 0.1 | |
| 93.5 | |
| 56.4 | |
| 0.3 | |
| 1.7 | |
| 93.8 | |
| 58.1 | | ||||||||||||
Total | $ | 246.7 | |
| $ | 325.5 | |
| $ | 750.0 | |
| $ | 843.2 | |
| $ | 250.0 | |
| $ | 162.3 | |
| $ | 1,246.7 | |
| $ | 1,331.0 | |
| $ | 3,529.1 | |
| $ | 3,510.2 | |
| $ | 4,775.8 | |
| $ | 4,841.2 | |
| |||||||||||||||||||||||||||||||||||||||||||||||
Counterparty Credit Exposure by Region | |||||||||||||||||||||||||||||||||||||||||||||||
| Loans and Lending |
| Securities and Margin Finance |
| OTC Derivatives |
| Total |
| Cash and Cash Equivalents |
| Total with Cash and Cash Equivalents | ||||||||||||||||||||||||||||||||||||
| At |
| At |
| At |
| At |
| At |
| At | ||||||||||||||||||||||||||||||||||||
| November 30, |
| November |
| November 30, |
| November |
| November 30, |
| November |
| November 30, |
| November |
| November 30, |
| November |
| November 30, |
| November | ||||||||||||||||||||||||
Asia/Latin America/Other | $ | 4.9 | |
| $ | 10.1 | |
| $ | 16.3 | |
| $ | 15.3 | |
| $ | 32.7 | |
| $ | 40.6 | |
| $ | 53.9 | |
| $ | 66.0 | |
| $ | 165.8 | |
| $ | 159.6 | |
| $ | 219.7 | |
| $ | 225.6 | |
Europe | - | |
| 0.4 | |
| 234.4 | |
| 212.2 | |
| 20.9 | |
| 43.4 | |
| 255.3 | |
| 256.0 | |
| 248.0 | |
| 341.8 | |
| 503.3 | |
| 597.8 | | ||||||||||||
North America | 241.8 | |
| 315.0 | |
| 499.3 | |
| 615.7 | |
| 196.4 | |
| 78.3 | |
| 937.5 | |
| 1,009.0 | |
| 3,115.3 | |
| 3,008.8 | |
| 4,052.8 | |
| 4,017.8 | | ||||||||||||
Total | $ | 246.7 | |
| $ | 325.5 | |
| $ | 750.0 | |
| $ | 843.2 | |
| $ | 250.0 | |
| $ | 162.3 | |
| $ | 1,246.7 | |
| $ | 1,331.0 | |
| $ | 3,529.1 | |
| $ | 3,510.2 | |
| $ | 4,775.8 | |
| $ | 4,841.2 | |
| |||||||||||||||||||||||||||||||||||||||||||||||
Counterparty Credit Exposure by Industry | |||||||||||||||||||||||||||||||||||||||||||||||
| Loans and Lending |
| Securities and Margin Finance |
| OTC Derivatives |
| Total |
| Cash and Cash Equivalents |
| Total with Cash and Cash Equivalents | ||||||||||||||||||||||||||||||||||||
| At |
| At |
| At |
| At |
| At |
| At | ||||||||||||||||||||||||||||||||||||
| November 30, |
| November |
| November 30, |
| November |
| November 30, |
| November |
| November 30, |
| November |
| November 30, |
| November |
| November 30, |
| November | ||||||||||||||||||||||||
Asset Managers | $ | - | |
| $ | - | |
| $ | 39.7 | |
| $ | 69.8 | |
| $ | 10.9 | |
| $ | - | |
| $ | 50.6 | |
| $ | 69.8 | |
| $ | 2,599.1 | |
| $ | 2,461.3 | |
| $ | 2,649.7 | |
| $ | 2,531.1 | |
Banks, Broker-dealers | 0.2 | |
| 0.9 | |
| 435.9 | |
| 464.9 | |
| 170.4 | |
| 95.2 | |
| 606.5 | |
| 561.0 | |
| 930.0 | |
| 1,048.9 | |
| 1,536.5 | |
| 1,609.9 | | ||||||||||||
Commodities | - | |
| - | |
| - | |
| - | |
| 3.3 | |
| 16.7 | |
| 3.3 | |
| 16.7 | |
| - | |
| - | |
| 3.3 | |
| 16.7 | | ||||||||||||
Corporates | 204.4 | |
| 193.9 | |
| - | |
| - | |
| 18.4 | |
| 11.3 | |
| 222.8 | |
| 205.2 | |
| - | |
| - | |
| 222.8 | |
| 205.2 | | ||||||||||||
Other | 42.1 | |
| 130.7 | |
| 274.4 | |
| 308.5 | |
| 47.0 | |
| 39.1 | |
| 363.5 | |
| 478.3 | |
| - | |
| - | |
| 363.5 | |
| 478.3 | | ||||||||||||
Total | $ | 246.7 | |
| $ | 325.5 | |
| $ | 750.0 | |
| $ | 843.2 | |
| $ | 250.0 | |
| $ | 162.3 | |
| $ | 1,246.7 | |
| $ | 1,331.0 | |
| $ | 3,529.1 | |
| $ | 3,510.2 | |
| $ | 4,775.8 | |
| $ | 4,841.2 | |
(1) | Loans and lending amounts have been recast to conform to the current period's presentation. Loans and lending amounts include the current exposure, the amount at risk on a default event with no recovery of loans. Previously, loans and lending amounts represented the notional value. |
For additional information regarding credit exposure to OTC derivative contracts, refer to Note 5, Derivative Financial Instruments , in our consolidated financial statements included within this Annual Report on Form 10-K.
42
Table of Contents
JEFFERIES GROUP LLC AND SUBSIDIARIES
Country Risk Exposure
Country risk is the risk that events or developments that occur in the general environment of a country or countries due to economic, political, social, regulatory, legal or other factors, will affect the ability of obligors of the country to honor their obligations. We define the country of risk as the country of jurisdiction or domicile of the obligor. The following tables reflect our top exposure at November 30, 2016 and 2015 to the sovereign governments, corporations and financial institutions in those non- U.S. countries in which we have a net long issuer and counterparty exposure (in millions):
| November 30, 2016 | ||||||||||||||||||||||||||||||||||
| Issuer Risk |
| Counterparty Risk |
| Issuer and Counterparty Risk | ||||||||||||||||||||||||||||||
| Fair Value of Long Debt Securities |
| Fair Value of Short Debt Securities |
| Net Derivative Notional Exposure |
| Loans and Lending |
| Securities and Margin Finance |
| OTC Derivatives |
| Cash and Cash Equivalents |
| Excluding Cash and Cash Equivalents |
| Including Cash and Cash Equivalents | ||||||||||||||||||
Germany | $ | 318.9 | |
| $ | (166.4 | ) |
| $ | 815.3 | |
| $ | - | |
| $ | 86.9 | |
| $ | 0.3 | |
| $ | 111.9 | |
| $ | 1,055.0 | |
| $ | 1,166.9 | |
Italy | 1,069.8 | |
| (844.2 | ) |
| 69.8 | |
| - | |
| - | |
| 0.2 | |
| - | |
| 295.6 | |
| 295.6 | | |||||||||
France | 356.2 | |
| (538.4 | ) |
| 419.5 | |
| - | |
| 24.8 | |
| 3.4 | |
| - | |
| 265.5 | |
| 265.5 | | |||||||||
United Kingdom | 290.1 | |
| (136.4 | ) |
| (12.7 | ) |
| - | |
| 61.0 | |
| 13.4 | |
| 37.7 | |
| 215.4 | |
| 253.1 | | |||||||||
Spain | 210.4 | |
| (151.7 | ) |
| - | |
| - | |
| - | |
| 0.3 | |
| 50.2 | |
| 59.0 | |
| 109.2 | | |||||||||
Hong Kong | 34.0 | |
| (30.2 | ) |
| 1.3 | |
| - | |
| 0.5 | |
| - | |
| 79.1 | |
| 5.6 | |
| 84.7 | | |||||||||
Switzerland | 80.7 | |
| (33.6 | ) |
| 12.1 | |
| - | |
| 11.4 | |
| 2.2 | |
| 4.1 | |
| 72.8 | |
| 76.9 | | |||||||||
Ireland | 124.4 | |
| (61.2 | ) |
| 4.4 | |
| - | |
| 0.6 | |
| - | |
| - | |
| 68.2 | |
| 68.2 | | |||||||||
Singapore | 36.2 | |
| (9.6 | ) |
| 3.9 | |
| - | |
| - | |
| - | |
| 16.1 | |
| 30.5 | |
| 46.6 | | |||||||||
Qatar | 15.2 | |
| (0.7 | ) |
| - | |
| - | |
| - | |
| 27.1 | |
| - | |
| 41.6 | |
| 41.6 | | |||||||||
Total | $ | 2,535.9 | |
| $ | (1,972.4 | ) |
| $ | 1,313.6 | |
| $ | - | |
| $ | 185.2 | |
| $ | 46.9 | |
| $ | 299.1 | |
| $ | 2,109.2 | |
| $ | 2,408.3 | |
| November 30, 2015 | ||||||||||||||||||||||||||||||||||
| Issuer Risk |
| Counterparty Risk |
| Issuer and Counterparty Risk | ||||||||||||||||||||||||||||||
| Fair Value of Long Debt Securities |
| Fair Value of Short Debt Securities |
| Net Derivative Notional Exposure |
| Loans and Lending |
| Securities and Margin Finance |
| OTC Derivatives |
| Cash and Cash Equivalents |
| Excluding Cash and Cash Equivalents |
| Including Cash and Cash Equivalents | ||||||||||||||||||
Belgium | $ | 413.8 | |
| $ | (48.8 | ) |
| $ | 6.2 | |
| $ | - | |
| $ | - | |
| $ | - | |
| $ | 157.8 | |
| $ | 371.2 | |
| $ | 529.0 | |
United Kingdom | 711.6 | |
| (359.3 | ) |
| 52.4 | |
| 0.4 | |
| 31.6 | |
| 25.4 | |
| 26.3 | |
| 462.1 | |
| 488.4 | | |||||||||
Netherlands | 543.5 | |
| (139.6 | ) |
| (23.4 | ) |
| - | |
| 36.2 | |
| 2.0 | |
| - | |
| 418.7 | |
| 418.7 | | |||||||||
Italy | 1,112.2 | |
| (662.4 | ) |
| (105.6 | ) |
| - | |
| - | |
| 0.2 | |
| - | |
| 344.4 | |
| 344.4 | | |||||||||
Ireland | 164.3 | |
| (27.4 | ) |
| 3.3 | |
| - | |
| 3.5 | |
| - | |
| - | |
| 143.7 | |
| 143.7 | | |||||||||
Spain | 394.0 | |
| (291.9 | ) |
| (1.6 | ) |
| - | |
| - | |
| 0.2 | |
| 26.6 | |
| 100.7 | |
| 127.3 | | |||||||||
Australia | 86.6 | |
| (24.9 | ) |
| 9.6 | |
| 37.4 | |
| - | |
| 0.3 | |
| 0.8 | |
| 109.0 | |
| 109.8 | | |||||||||
Hong Kong | 38.1 | |
| (22.3 | ) |
| (2.9 | ) |
| - | |
| 0.4 | |
| - | |
| 74.8 | |
| 13.3 | |
| 88.1 | | |||||||||
Switzerland | 79.5 | |
| (28.9 | ) |
| (6.6 | ) |
| - | |
| 34.5 | |
| 5.2 | |
| 3.7 | |
| 83.7 | |
| 87.4 | | |||||||||
Portugal | 111.9 | |
| (38.2 | ) |
| - | |
| - | |
| - | |
| - | |
| - | |
| 73.7 | |
| 73.7 | | |||||||||
Total | $ | 3,655.5 | |
| $ | (1,643.7 | ) |
| $ | (68.6 | ) |
| $ | 37.8 | |
| $ | 106.2 | |
| $ | 33.3 | |
| $ | 290.0 | |
| $ | 2,120.5 | |
| $ | 2,410.5 | |
In addition, our issuer and counterparty risk exposure to Puerto Rico was $31.0 million, which is in connection with our municipal securities market-making activities. The government of Puerto Rico is seeking to restructure much of its $70.0 billion in debt on a voluntary basis. At November 30, 2016, we had no other material exposure to countries where either sovereign or non-sovereign sectors potentially pose potential default risk as the result of liquidity concerns.
Operational Risk
Operational risk refers to the risk of loss resulting from our operations, including, but not limited to, improper or unauthorized execution and processing of transactions, deficiencies in our operating systems, business disruptions and inadequacies or breaches in our internal control processes. Our businesses are highly dependent on our ability to process, on a daily basis, a large number of transactions across numerous and diverse markets in many currencies. In addition, the transactions we process have become increasingly complex. If our financial, accounting or other data processing systems do not operate properly or are disabled or if there are other shortcomings or failures in our internal processes, people or systems, we could suffer an impairment to our liquidity, financial loss, a disruption of our businesses, liability to clients, regulatory intervention or reputational damage.
43
Table of Contents
JEFFERIES GROUP LLC AND SUBSIDIARIES
These systems may fail to operate properly or become disabled as a result of events that are wholly or partially beyond our control, including a disruption of electrical or communications services or our inability to occupy one or more of our buildings. The inability of our systems to accommodate an increasing volume of transactions could also constrain our ability to expand our businesses. We also face the risk of operational failure or termination of any of the clearing agents, exchanges, clearing houses or other financial intermediaries we use to facilitate our securities transactions. Any such failure or termination could adversely affect our ability to effect transactions and manage our exposure to risk. In addition, despite the contingency plans we have in place, our ability to conduct business may be adversely impacted by a disruption in the infrastructure that supports our businesses and the communities in which they are located. This may include a disruption involving electrical, communications, transportation or other services used by us or third parties with which we conduct business.
Our operations rely on the secure processing, storage and transmission of confidential and other information in our computer systems and networks. Although we take protective measures and endeavor to modify them as circumstances warrant, our computer systems, software and networks may be vulnerable to unauthorized access, computer viruses or other malicious code, and other events that could have a security impact. If one or more of such events occur, this potentially could jeopardize our or our clients' or counterparties' confidential and other information processed and stored in, and transmitted through, our computer systems and networks, or otherwise cause interruptions or malfunctions in our, our clients', our counterparties' or third parties' operations. We may be required to expend significant additional resources to modify our protective measures or to investigate and remediate vulnerabilities or other exposures, and we may be subject to litigation and financial losses that are either not insured against or not fully covered through any insurance maintained by us.
Our Operational Risk framework includes governance, collection of operational risk incidents, proactive operational risk management, and periodic review and analysis of business metrics to identify and recommend controls and process-related enhancements.
Each revenue producing and support department is responsible for the management and reporting of operational risks and the implementation of the Operational Risk policy and processes within the department. Operational Risk policy, framework, infrastructure, methodology, processes, guidance and oversight of the operational risk processes are centralized and consistent firm wide and also subject to regional operational risk governance.
Legal and Compliance Risk
Legal and compliance risk includes the risk of noncompliance with applicable legal and regulatory requirements. We are subject to extensive regulation in the different jurisdictions in which we conduct our business. We have various procedures addressing issues such as regulatory capital requirements, sales and trading practices, use of and safekeeping of customer funds, credit granting, collection activities, anti-money laundering and record keeping. These risks also reflect the potential impact that changes in local and international laws and tax statutes have on the economics and viability of current or future transactions. In an effort to mitigate these risks, we continuously review new and pending regulations and legislation and participate in various industry interest groups. We also maintain an anonymous hotline for employees or others to report suspected inappropriate actions by us or by our employees or agents.
New Business Risk
New business risk refers to the risks of entering into a new line of business or offering a new product. By entering a new line of business or offering a new product, we may face risks that we are unaccustomed to dealing with and may increase the magnitude of the risks we currently face. The New Business Committee reviews proposals for new businesses and new products to determine if we are prepared to handle the additional or increased risks associated with entering into such activities.
Reputational Risk
We recognize that maintaining our reputation among clients, investors, regulators and the general public is an important aspect of minimizing legal and operational risks. Maintaining our reputation depends on a large number of factors, including the selection of our clients and the conduct of our business activities. We seek to maintain our reputation by screening potential clients and by conducting our business activities in accordance with high ethical standards. Our reputation and business activity can be affected by statements and actions of third parties, even false or misleading statements by them. We actively monitor public comment concerning us and are vigilant in seeking to assure accurate information and perception prevails.
Item 7A. Quantitative and Qualitative Disclosures About Market Risk
Quantitative and qualitative disclosures about market risk are set forth under "Management's Discussion and Analysis of Financial Condition and Results of Operations -Risk Management" in Part II, Item 7 of this Form 10-K.
44
Table of Contents
Item 8. Financial Statements and Supplementary Data
INDEX TO CONSOLIDATED FINANCIAL STATEMENTS
| Page |
Management's Report on Internal Control over Financial Reporting | 46 |
Report of Independent Registered Public Accounting Firm | 47 |
Consolidated Statements of Financial Condition | 48 |
Consolidated Statements of Earnings | 49 |
Consolidated Statements of Comprehensive Income | 50 |
Consolidated Statements of Changes in Equity | 51 |
Consolidated Statements of Cash Flows | 52 |
Notes to Consolidated Financial Statements | 54 |
45
Table of Contents
Management's Report on Internal Control over Financial Reporting
Our management is responsible for establishing and maintaining adequate internal control over financial reporting. Internal control over financial reporting is a process designed to provide reasonable assurance regarding the reliability of financial reporting and the preparation of financial statements for external purposes in accordance with generally accepted accounting principles. A company's internal control over financial reporting includes those policies and procedures that pertain to the maintenance of records that, in reasonable detail, accurately and fairly reflect the transactions and dispositions of the assets of the company; provide reasonable assurance that transactions are recorded as necessary to permit preparation of financial statements in accordance with generally accepted accounting principles, and that receipts and expenditures of the company are being made only in accordance with authorizations of management and directors of the company; and provide reasonable assurance regarding prevention or timely detection of unauthorized acquisition, use, or disposition of the company's assets that could have a material effect on the financial statements.
Because of its inherent limitations, internal control over financial reporting may not prevent or detect misstatements. Also, projections of any evaluation of effectiveness to future periods are subject to the risk that controls may become inadequate because of changes in conditions, or that the degree of compliance with the policies or procedures may deteriorate.
Management evaluated our internal control over financial reporting as of November 30, 2016 . In making this assessment, management used the criteria set forth by the Committee of Sponsoring Organizations of the Treadway Commission in Internal Control - Integrated Framework (2013) . As a result of this assessment and based on the criteria in this framework, management has concluded that, as of November 30, 2016 , our internal control over financial reporting was effective.
PricewaterhouseCoopers LLP, our independent registered public accounting firm, has audited and issued a report on our internal control over financial reporting, which appears on page 47.
46
Table of Contents
Report of Independent Registered Public Accounting Firm
To the Board of Directors and Member of Jefferies Group LLC:
In our opinion, the accompanying consolidated statements of financial condition and the related consolidated statements of earnings, of comprehensive income, of changes in equity, and of cash flows present fairly, in all material respects, the financial position of Jefferies Group LLC and its subsidiaries (the "Company") at November 30, 2016 and 2015 and the results of their operations and their cash flows for each of the three years in the period ended November 30, 2016 in conformity with accounting principles generally accepted in the United States of America. In addition, in our opinion, the financial statement schedules listed in the index appearing under Item 15(a)(1) and Item 15(a)(2) presents fairly, in all material respects, the information set forth therein when read in conjunction with the related consolidated financial statements. Also in our opinion, the Company maintained, in all material respects, effective internal control over financial reporting as of November 30, 2016, based on criteria established in Internal Control - Integrated Framework (2013) issued by the Committee of Sponsoring Organizations of the Treadway Commission (COSO). The Company's management is responsible for these financial statements and financial statement schedules, for maintaining effective internal control over financial reporting and for its assessment of the effectiveness of internal control over financial reporting, included in the accompanying "Management's Report on Internal Control over Financial Reporting". Our responsibility is to express opinions on these financial statements, on the financial statement schedules and on the Company's internal control over financial reporting based on our integrated audits. We conducted our audits in accordance with the standards of the Public Company Accounting Oversight Board (United States). Those standards require that we plan and perform the audits to obtain reasonable assurance about whether the financial statements are free of material misstatement and whether effective internal control over financial reporting was maintained in all material respects. Our audits of the financial statements included examining, on a test basis, evidence supporting the amounts and disclosures in the financial statements, assessing the accounting principles used and significant estimates made by management, and evaluating the overall financial statement presentation. Our audit of internal control over financial reporting included obtaining an understanding of internal control over financial reporting, assessing the risk that a material weakness exists, and testing and evaluating the design and operating effectiveness of internal control based on the assessed risk. Our audits also included performing such other procedures as we considered necessary in the circumstances. We believe that our audits provide a reasonable basis for our opinions.
A company's internal control over financial reporting is a process designed to provide reasonable assurance regarding the reliability of financial reporting and the preparation of financial statements for external purposes in accordance with generally accepted accounting principles. A company's internal control over financial reporting includes those policies and procedures that (i) pertain to the maintenance of records that, in reasonable detail, accurately and fairly reflect the transactions and dispositions of the assets of the company; (ii) provide reasonable assurance that transactions are recorded as necessary to permit preparation of financial statements in accordance with generally accepted accounting principles, and that receipts and expenditures of the company are being made only in accordance with authorizations of management and directors of the company; and (iii) provide reasonable assurance regarding prevention or timely detection of unauthorized acquisition, use, or disposition of the company's assets that could have a material effect on the financial statements.
Because of its inherent limitations, internal control over financial reporting may not prevent or detect misstatements. Also, projections of any evaluation of effectiveness to future periods are subject to the risk that controls may become inadequate because of changes in conditions, or that the degree of compliance with the policies or procedures may deteriorate.
/s/ PricewaterhouseCoopers LLP
New York, New York
January 27, 2017
47
Table of Contents
JEFFERIES GROUP LLC AND SUBSIDIARIES
CONSOLIDATED STATEMENTS OF FINANCIAL CONDITION
(In thousands)
| November 30, | ||||||
| 2016 |
| 2015 | ||||
ASSETS |
|
|
| ||||
Cash and cash equivalents ($16,805 and $2,015 at November 30, 2016 and 2015, respectively, related to consolidated VIEs) | $ | 3,529,069 | |
| $ | 3,510,163 | |
Cash and securities segregated and on deposit for regulatory purposes or deposited with clearing and depository organizations | 857,337 | |
| 751,084 | | ||
Financial instruments owned, at fair value, (including securities pledged of $9,706,881 and $12,207,123 at November 30, 2016 and 2015, respectively; and $87,153 and $68,951 at November 30, 2016 and 2015, respectively, related to consolidated VIEs) | 13,809,512 | |
| 16,559,116 | | ||
Investments in managed funds | 186,508 | |
| 85,775 | | ||
Loans to and investments in related parties | 653,872 | |
| 825,908 | | ||
Securities borrowed | 7,743,562 | |
| 6,975,136 | | ||
Securities purchased under agreements to resell | 3,862,488 | |
| 3,857,306 | | ||
Receivables: |
|
|
| ||||
Brokers, dealers and clearing organizations | 2,009,163 | |
| 1,574,759 | | ||
Customers | 843,114 | |
| 1,191,316 | | ||
Fees, interest and other ($1,547 and $329 at November 30, 2016 and 2015, respectively, related to consolidated VIEs) | 310,894 | |
| 260,924 | | ||
Premises and equipment | 265,553 | |
| 243,486 | | ||
Goodwill | 1,640,653 | |
| 1,656,588 | | ||
Other assets | 1,229,551 | |
| 1,072,411 | | ||
Total assets | $ | 36,941,276 | |
| $ | 38,563,972 | |
LIABILITIES AND EQUITY |
|
|
| ||||
Short-term borrowings | $ | 525,842 | |
| $ | 310,659 | |
Financial instruments sold, not yet purchased, at fair value | 8,359,202 | |
| 6,785,064 | | ||
Collateralized financings: |
|
|
| ||||
Securities loaned | 2,819,132 | |
| 2,979,300 | | ||
Securities sold under agreements to repurchase | 6,791,676 | |
| 10,004,428 | | ||
Other secured financings (includes $41,768 and $68,345 at fair value at November 31, 2016 and 2015, respectively; and $755,544 and $762,909 at November 30, 2016 and 2015, respectively, related to consolidated VIEs) | 755,576 | |
| 762,909 | | ||
Payables: |
|
|
| ||||
Brokers, dealers and clearing organizations | 3,290,404 | |
| 2,742,001 | | ||
Customers | 2,297,292 | |
| 2,780,493 | | ||
Accrued expenses and other liabilities ($735 and $893 at November 30, 2016 and 2015, respectively, related to consolidated VIEs) | 1,248,200 | |
| 1,049,019 | | ||
Long-term debt (includes $248,856 and $0 at fair value at November 30, 2016 and 2015, respectively) | 5,483,355 | |
| 5,640,722 | | ||
Total liabilities | 31,570,679 | |
| 33,054,595 | | ||
EQUITY |
|
|
| ||||
Member's paid-in capital | 5,538,103 | |
| 5,526,855 | | ||
Accumulated other comprehensive loss: |
|
|
| ||||
Currency translation adjustments | (152,305 | ) |
| (36,811 | ) | ||
Changes in instrument specific credit risk | (6,494 | ) |
| - | | ||
Additional minimum pension liability | (9,358 | ) |
| (8,135 | ) | ||
Total accumulated other comprehensive loss | (168,157 | ) |
| (44,946 | ) | ||
Total member's equity | 5,369,946 | |
| 5,481,909 | | ||
Noncontrolling interests | 651 | |
| 27,468 | | ||
Total equity | 5,370,597 | |
| 5,509,377 | | ||
Total liabilities and equity | $ | 36,941,276 | |
| $ | 38,563,972 | |
See accompanying notes to consolidated financial statements.
48
Table of Contents
JEFFERIES GROUP LLC AND SUBSIDIARIES
CONSOLIDATED STATEMENTS OF EARNINGS
(In thousands)
| Year Ended November 30, | ||||||||||
| 2016 |
| 2015 |
| 2014 | ||||||
Revenues: |
|
|
|
|
| ||||||
Commissions and other fees | $ | 611,574 | |
| $ | 659,002 | |
| $ | 668,801 | |
Principal transactions | 519,652 | |
| 172,608 | |
| 532,292 | | |||
Investment banking | 1,193,973 | |
| 1,439,007 | |
| 1,529,274 | | |||
Asset management fees and investment income from managed funds | 31,062 | |
| 8,015 | |
| 17,047 | | |||
Interest | 857,838 | |
| 922,189 | |
| 1,019,970 | | |||
Other | 19,724 | |
| 74,074 | |
| 78,881 | | |||
Total revenues | 3,233,823 | |
| 3,274,895 | |
| 3,846,265 | | |||
Interest expense | 819,209 | |
| 799,654 | |
| 856,127 | | |||
Net revenues | 2,414,614 | |
| 2,475,241 | |
| 2,990,138 | | |||
Non-interest expenses: |
|
|
|
|
| ||||||
Compensation and benefits | 1,568,948 | |
| 1,467,131 | |
| 1,698,530 | | |||
Non-compensation expenses: |
|
|
|
|
| ||||||
Floor brokerage and clearing fees | 167,205 | |
| 199,780 | |
| 215,329 | | |||
Technology and communications | 262,396 | |
| 313,044 | |
| 268,212 | | |||
Occupancy and equipment rental | 101,133 | |
| 101,138 | |
| 107,767 | | |||
Business development | 93,105 | |
| 105,963 | |
| 106,984 | | |||
Professional services | 112,562 | |
| 103,972 | |
| 109,601 | | |||
Bad debt provision | 7,365 | |
| (396 | ) |
| 55,355 | | |||
Goodwill impairment | - | |
| - | |
| 54,000 | | |||
Other | 71,928 | |
| 70,382 | |
| 71,339 | | |||
Total non-compensation expenses | 815,694 | |
| 893,883 | |
| 988,587 | | |||
Total non-interest expenses | 2,384,642 | |
| 2,361,014 | |
| 2,687,117 | | |||
Earnings before income taxes | 29,972 | |
| 114,227 | |
| 303,021 | | |||
Income tax expense | 14,566 | |
| 18,898 | |
| 142,061 | | |||
Net earnings | 15,406 | |
| 95,329 | |
| 160,960 | | |||
Net earnings (loss) attributable to noncontrolling interests | (28 | ) |
| 1,795 | |
| 3,400 | | |||
Net earnings attributable to Jefferies Group LLC | $ | 15,434 | |
| $ | 93,534 | |
| $ | 157,560 | |
See accompanying notes to consolidated financial statements.
49
Table of Contents
JEFFERIES GROUP LLC AND SUBSIDIARIES
CONSOLIDATED STATEMENTS OF COMPREHENSIVE INCOME
(In thousands)
| Year Ended November 30, | ||||||||||
| 2016 |
| 2015 |
| 2014 | ||||||
Net earnings | $ | 15,406 | |
| $ | 95,329 | |
| $ | 160,960 | |
Other comprehensive loss, net of tax: |
|
|
|
|
| ||||||
Currency translation and other adjustments | (115,494 | ) |
| (27,157 | ) |
| (30,995 | ) | |||
Changes in instrument specific credit risk, net of tax (1) | (6,494 | ) |
| - | |
| - | | |||
Minimum pension liability adjustments, net of tax (2) | (1,223 | ) |
| (3,116 | ) |
| (7,778 | ) | |||
Total other comprehensive loss, net of tax (3) | (123,211 | ) |
| (30,273 | ) |
| (38,773 | ) | |||
Comprehensive income (loss) | (107,805 | ) |
| 65,056 | |
| 122,187 | | |||
Net earnings (loss) attributable to noncontrolling interests | (28 | ) |
| 1,795 | |
| 3,400 | | |||
Comprehensive income (loss) attributable to Jefferies Group LLC | $ | (107,777 | ) |
| $ | 63,261 | |
| $ | 118,787 | |
(1) | Includes income tax benefit of approximately $4.3 million for the year ended November 30, 2016 . |
(2) | Includes income tax benefit of approximately $0.3 million , $4.2 million and $0.5 million for the years ended November 30, 2016 , 2015 and 2014 , respectively. |
(3) | None of the components of other comprehensive loss are attributable to noncontrolling interests. |
See accompanying notes to consolidated financial statements.
50
Table of Contents
JEFFERIES GROUP LLC AND SUBSIDIARIES
CONSOLIDATED STATEMENTS OF CHANGES IN EQUITY
(In thousands)
| Year Ended November 30, | ||||||||||
| 2016 |
| 2015 |
| 2014 | ||||||
Member's paid-in capital: |
|
|
|
|
| ||||||
Balance, beginning of period | $ | 5,526,855 | |
| $ | 5,439,256 | |
| $ | 5,280,420 | |
Net earnings attributable to Jefferies Group LLC | 15,434 | |
| 93,534 | |
| 157,560 | | |||
Tax benefit (detriment) for issuance of share-based awards | (4,186 | ) |
| (5,935 | ) |
| 1,276 | | |||
Balance, end of period | $ | 5,538,103 | |
| $ | 5,526,855 | |
| $ | 5,439,256 | |
Accumulated other comprehensive income (loss) (1) (2): |
|
|
|
|
| ||||||
Balance, beginning of period | $ | (44,946 | ) |
| $ | (14,673 | ) |
| $ | 24,100 | |
Currency adjustments | (115,494 | ) |
| (27,157 | ) |
| (30,995 | ) | |||
Changes in instrument specific credit risk, net of tax | (6,494 | ) |
| - | |
| - | | |||
Pension adjustments, net of tax | (1,223 | ) |
| (3,116 | ) |
| (7,778 | ) | |||
Balance, end of period | $ | (168,157 | ) |
| $ | (44,946 | ) |
| $ | (14,673 | ) |
Total member's equity | $ | 5,369,946 | |
| $ | 5,481,909 | |
| $ | 5,424,583 | |
Noncontrolling interests: |
|
|
|
|
| ||||||
Balance, beginning of period | $ | 27,468 | |
| $ | 38,848 | |
| $ | 117,154 | |
Net earnings (loss) attributable to noncontrolling interests | (28 | ) |
| 1,795 | |
| 3,400 | | |||
Contributions | 9,390 | |
| - | |
| 39,075 | | |||
Distributions | (563 | ) |
| (4,982 | ) |
| - | | |||
Deconsolidation of asset management company | (35,616 | ) |
| (8,193 | ) |
| (120,781 | ) | |||
Balance, end of period | $ | 651 | |
| $ | 27,468 | |
| $ | 38,848 | |
Total equity | $ | 5,370,597 | |
| $ | 5,509,377 | |
| $ | 5,463,431 | |
(1) | The components of other comprehensive income (loss) are attributable to Jefferies Group LLC. None of the components of other comprehensive income (loss) are attributable to noncontrolling interests. |
(2) | There were no material reclassifications out of Accumulated other comprehensive income during the years ended November 30, 2016 , 2015 and 2014 . |
See accompanying notes to consolidated financial statements.
51
Table of Contents
JEFFERIES GROUP LLC AND SUBSIDIARIES
CONSOLIDATED STATEMENTS OF CASH FLOWS
(In thousands)
| Year Ended November 30, | ||||||||||
| 2016 |
| 2015 |
| 2014 | ||||||
Cash flows from operating activities: |
|
|
|
|
| ||||||
Net earnings | $ | 15,406 | |
| $ | 95,329 | |
| $ | 160,960 | |
Adjustments to reconcile net earnings to net cash used in operating activities: |
|
|
|
|
| ||||||
Depreciation and amortization | (2,365 | ) |
| 15,236 | |
| 691 | | |||
Goodwill impairment | - | |
| - | |
| 54,000 | | |||
Deferred income taxes | (14,013 | ) |
| 88,796 | |
| 122,195 | | |||
Income on loans to and investments in related parties | (17,184 | ) |
| (75,717 | ) |
| (90,243 | ) | |||
Distributions received on investments in related parties | 38,180 | |
| 76,681 | |
| 53,985 | | |||
Other adjustments | (32,711 | ) |
| (97,804 | ) |
| (78,064 | ) | |||
Net change in assets and liabilities: |
|
|
|
|
| ||||||
Cash and securities segregated and on deposit for regulatory purposes or deposited with clearing and depository organizations | (107,771 | ) |
| 2,691,028 | |
| 166,108 | | |||
Receivables: |
|
|
|
|
| ||||||
Brokers, dealers and clearing organizations | (477,273 | ) |
| 576,832 | |
| 11,872 | | |||
Customers | 348,055 | |
| 57,837 | |
| (294,412 | ) | |||
Fees, interest and other | (54,366 | ) |
| 541 | |
| (12,062 | ) | |||
Securities borrowed | (805,779 | ) |
| (127,060 | ) |
| (1,497,438 | ) | |||
Financial instruments owned | 2,529,114 | |
| 2,003,978 | |
| (2,243,053 | ) | |||
Investments in managed funds | (138,572 | ) |
| 15,498 | |
| 13,473 | | |||
Securities purchased under agreements to resell | (112,777 | ) |
| 53,817 | |
| (200,568 | ) | |||
Other assets | (173,616 | ) |
| (63,110 | ) |
| (146,114 | ) | |||
Payables: |
|
|
|
|
| ||||||
Brokers, dealers and clearing organizations | 584,426 | |
| 471,661 | |
| 968,615 | | |||
Customers | (483,188 | ) |
| (3,455,080 | ) |
| 1,089,423 | | |||
Securities loaned | (122,946 | ) |
| 385,929 | |
| 95,607 | | |||
Financial instruments sold, not yet purchased | 1,753,647 | |
| (2,043,319 | ) |
| 1,832,930 | | |||
Securities sold under agreements to repurchase | (3,144,433 | ) |
| (650,795 | ) |
| (84,303 | ) | |||
Accrued expenses and other liabilities | 296,067 | |
| (259,665 | ) |
| 48,485 | | |||
Net cash used in operating activities | (122,099 | ) |
| (239,387 | ) |
| (27,913 | ) | |||
Cash flows from investing activities: |
|
|
|
|
| ||||||
Contributions to loans to and investments in related parties | (538,186 | ) |
| (1,438,675 | ) |
| (2,786,394 | ) | |||
Distributions from loans to and investments in related parties | 689,226 | |
| 1,384,944 | |
| 2,751,384 | | |||
Net payments on premises and equipment | (75,772 | ) |
| (68,813 | ) |
| (110,536 | ) | |||
Payment on purchase of aircraft | (27,500 | ) |
| - | |
| - | | |||
Proceeds from sale of aircraft | 29,450 | |
| - | |
| - | | |||
Deconsolidation of asset management entity | (77 | ) |
| (16,512 | ) |
| (137,856 | ) | |||
Cash received from contingent consideration | 2,617 | |
| 4,444 | |
| 6,253 | | |||
Net cash provided by (used in) investing activities | 79,758 | |
| (134,612 | ) |
| (277,149 | ) | |||
52
Table of Contents
JEFFERIES GROUP LLC AND SUBSIDIARIES
CONSOLIDATED STATEMENTS OF CASH FLOWS – CONTINUED
(In thousands)
| Year Ended November 30, | ||||||||||
| 2016 |
| 2015 |
| 2014 | ||||||
Cash flows from financing activities: |
|
|
|
|
| ||||||
Excess tax benefits from the issuance of share-based awards | $ | 489 | |
| $ | 749 | |
| $ | 1,921 | |
Proceeds from short-term borrowings | 15,313,383 | |
| 17,263,217 | |
| 18,965,163 | | |||
Payments on short-term borrowings | (15,108,501 | ) |
| (16,964,558 | ) |
| (18,965,163 | ) | |||
Proceeds from secured credit facility | - | |
| 903,000 | |
| 2,819,000 | | |||
Payments on secured credit facility | - | |
| (1,073,000 | ) |
| (2,849,000 | ) | |||
Net (payments on) proceeds from other secured financings | (7,333 | ) |
| 157,085 | |
| 371,113 | | |||
Net proceeds from issuance of long-term debt, net of issuance costs | 299,779 | |
| - | |
| 681,222 | | |||
Repayment of long-term debt | (373,246 | ) |
| (500,000 | ) |
| (250,000 | ) | |||
Net change in bank overdrafts | (46,536 | ) |
| 29,295 | |
| 20,974 | | |||
Proceeds from contributions of noncontrolling interests | 9,390 | |
| - | |
| 39,075 | | |||
Payments on distributions to noncontrolling interests | (563 | ) |
| (4,982 | ) |
| - | | |||
Net cash provided by (used in) financing activities | 86,862 | |
| (189,194 | ) |
| 834,305 | | |||
Effect of changes in exchange rates on cash and cash equivalents | (25,615 | ) |
| (6,612 | ) |
| (10,394 | ) | |||
Net increase (decrease) in cash and cash equivalents | 18,906 | |
| (569,805 | ) |
| 518,849 | | |||
Cash and cash equivalents at beginning of period | 3,510,163 | |
| 4,079,968 | |
| 3,561,119 | | |||
Cash and cash equivalents at end of period | $ | 3,529,069 | |
| $ | 3,510,163 | |
| $ | 4,079,968 | |
|
|
|
|
|
| ||||||
Supplemental disclosures of cash flow information: |
|
|
|
|
| ||||||
Cash paid (received) during the period for: |
|
|
|
|
| ||||||
Interest | $ | 859,466 | |
| $ | 859,815 | |
| $ | 922,194 | |
Income taxes, net | (6,410 | ) |
| (683 | ) |
| 120,703 | | |||
See accompanying notes to consolidated financial statements.
53
Table of Contents
JEFFERIES GROUP LLC AND SUBSIDIARIES
NOTES TO CONSOLIDATED FINANCIAL STATEMENTS
Index
Note | Page |
Note 1. Organization and Basis of Presentation | 55 |
Note 2. Summary of Significant Accounting Policies | 56 |
Note 3. Accounting Developments | 63 |
Note 4. Fair Value Disclosures | 65 |
Note 5. Derivative Financial Instruments | 82 |
Note 6. Collateralized Transactions | 87 |
Note 7. Securitization Activities | 89 |
Note 8. Variable Interest Entities | 90 |
Note 9. Investments | 94 |
Note 10. Goodwill and Other Intangible Assets | 97 |
Note 11. Short-Term Borrowings | 99 |
Note 12. Long-Term Debt | 100 |
Note 13. Noncontrolling Interests | 101 |
Note 14. Benefit Plans | 102 |
Note 15. Compensation Plans | 107 |
Note 16. Non-Interest Expenses | 109 |
Note 17. Income Taxes | 109 |
Note 18. Commitments, Contingencies and Guarantees | 112 |
Note 19. Net Capital Requirements | 115 |
Note 20. Segment Reporting | 115 |
Note 21. Related Party Transactions | 117 |
Note 22. Exit Costs | 118 |
Note 23. Selected Quarterly Financial Data | 119 |
54
Table of Contents
JEFFERIES GROUP LLC AND SUBSIDIARIES
NOTES TO CONSOLIDATED FINANCIAL STATEMENTS - CONTINUED
Note 1. Organization and Basis of Presentation
Organization
Jefferies Group LLC and its subsidiaries operate as a global full service, integrated securities and investment banking firm. The accompanying Consolidated Financial Statements represent the accounts of Jefferies Group LLC and all our subsidiaries (together "we" or "us"). The subsidiaries of Jefferies Group LLC include Jefferies LLC ("Jefferies"), Jefferies Execution Services, Inc. ("Jefferies Execution"), Jefferies International Limited, Jefferies Hong Kong Limited, Jefferies Financial Services, Inc., Jefferies Funding LLC, Jefferies Leveraged Credit Products, LLC and all other entities in which we have a controlling financial interest or are the primary beneficiary. On April 9, 2015, we entered into an agreement to transfer certain of the client activities of our Futures business to Société Générale S.A. and initiated a plan to substantially exit the remaining aspects of our Futures business. During the second quarter of 2016, we completed the exit of the Futures business. For further information on the exit of the Bache business, refer to Note 22, Exit Costs .
Jefferies Group LLC is an indirect wholly owned subsidiary of Leucadia National Corporation ("Leucadia"). Leucadia does not guarantee any of our outstanding debt securities. Our 3.875% Convertible Senior Debentures due 2029 are convertible into Leucadia common shares (see Note 12, Long-Term Debt , for further details). Jefferies Group LLC retains a credit rating separate from Leucadia and is a Securities and Exchange Commission ("SEC") reporting company, filing annual, quarterly and periodic financial reports. Richard Handler, our Chief Executive Officer and Chairman, is the Chief Executive Officer of Leucadia, as well as a Director of Leucadia. Brian P. Friedman, our Chairman of the Executive Committee, is Leucadia's President and a Director of Leucadia.
We operate in two business segments, Capital Markets and Asset Management. Capital Markets, which represents substantially our entire business, includes our securities, commodities, futures and foreign exchange trading and investment banking activities, which provides the research, sales, trading, origination and advisory effort for various equity, fixed income and advisory products and services. Asset Management provides investment management services to various private investment funds and separate accounts.
Basis of Presentation
The accompanying Consolidated Financial Statements have been prepared in accordance with U.S. generally accepted accounting principles ("U.S. GAAP") for financial information.
We have made a number of estimates and assumptions relating to the reporting of assets and liabilities and the disclosure of contingent assets and liabilities to prepare these financial statements in conformity with U.S. GAAP. The most important of these estimates and assumptions relate to fair value measurements, compensation and benefits, goodwill and intangible assets, the ability to realize deferred tax assets and the recognition and measurement of uncertain tax positions. Although these and other estimates and assumptions are based on the best available information, actual results could be materially different from these estimates.
Consolidation
Our policy is to consolidate all entities that we control by ownership a majority of the outstanding voting stock. In addition, we consolidate entities that meet the definition of a variable interest entity ("VIE") for which we are the primary beneficiary. The primary beneficiary is the party who has the power to direct the activities of a VIE that most significantly impact the entity's economic performance and who has an obligation to absorb losses of the entity or a right to receive benefits from the entity that could potentially be significant to the entity. For consolidated entities that are less than wholly owned, the third-party's holding of equity interest is presented as Noncontrolling interests in the Consolidated Statements of Financial Condition and Consolidated Statements of Changes in Equity. The portion of net earnings attributable to the noncontrolling interests is presented as Net earnings to noncontrolling interests in the Consolidated Statements of Earnings.
In situations in which we have significant influence, but not control, of an entity that does not qualify as a VIE, we apply either the equity method of accounting or fair value accounting pursuant to the fair value option election under U.S. GAAP, with our portion of net earnings or gains and losses recorded within Other revenues or Principal transaction revenues, respectively. We also have formed nonconsolidated investment vehicles with third-party investors that are typically organized as partnerships or limited liability companies and are carried at fair value. We act as general partner or managing member for these investment vehicles and have generally provided the third-party investors with termination or "kick-out" rights.
Intercompany accounts and transactions are eliminated in consolidation.
55
Table of Contents
JEFFERIES GROUP LLC AND SUBSIDIARIES
NOTES TO CONSOLIDATED FINANCIAL STATEMENTS - CONTINUED
Immaterial Adjustments
We made immaterial correcting adjustments (referred to as "adjustments") to our Consolidated Statements of Cash Flows for the years ended November 30, 2015 and 2014. The adjustments relate to a classification error in the reporting of the net change in bank overdrafts within our Consolidated Statements of Cash Flows. The adjustments have no effect on our Consolidated Statements of Financial Condition, the Consolidated Statements of Earnings, the Consolidated Statements of Changes in Equity or the Consolidated Statements of Comprehensive Income for the years ended November 30, 2015 and 2014. We do not believe these adjustments are material to our financial statements for any previously reported period.
The following table presents equal and offsetting adjustments were made to the Net change in accrued expenses and other liabilities and the Net change in bank overdrafts (in thousands):
| Year Ended November 30, | ||||||
| 2015 |
| 2014 | ||||
Increase (decrease) |
|
|
| ||||
Net change in accrued expenses and other liabilities | $ | (29,295 | ) |
| $ | (20,974 | ) |
Net change in bank overdrafts | 29,295 | |
| 20,974 | | ||
The following table sets forth the adjustments and revisions to our Consolidated Statements of Cash Flows (in thousands):
| Year Ended November 30, | ||||||||||||||
| 2015 |
| 2014 | ||||||||||||
| As Originally Reported |
| As Revised |
| As Originally Reported |
| As Revised | ||||||||
Operating activities |
|
|
|
|
|
|
| ||||||||
Increase (decrease) in accrued expenses and other liabilities | $ | (230,370 | ) |
| $ | (259,665 | ) |
| $ | 69,459 | |
| $ | 48,485 | |
Net cash used in operating activities | (210,092 | ) |
| (239,387 | ) |
| (6,939 | ) |
| (27,913 | ) | ||||
|
|
|
|
|
|
|
| ||||||||
Financing activities |
|
|
|
|
|
|
| ||||||||
Net change in bank overdrafts | $ | - | |
| $ | 29,295 | |
| $ | - | |
| $ | 20,974 | |
Net cash provided by (used in) financing activities | (218,489 | ) |
| (189,194 | ) |
| 813,331 | |
| 834,305 | | ||||
Note 2. Summary of Significant Accounting Policies
Revenue Recognition Policies
Commissions and Other Fees. All customer securities transactions are reported on the Consolidated Statements of Financial Condition on a settlement date basis with related income reported on a trade-date basis. We permit institutional customers to allocate a portion of their gross commissions to pay for research products and other services provided by third parties. The amounts allocated for those purposes are commonly referred to as soft dollar arrangements. These arrangements are accounted for on an accrual basis and, as we are not the primary obligor for these arrangements, netted against commission revenues in the Consolidated Statements of Earnings. In addition, we earn asset-based fees associated with the management and supervision of assets, account services and administration related to customer accounts.
Principal Transactions. Financial instruments owned and Financial instruments sold, but not yet purchased (all of which are recorded on a trade-date basis) are carried at fair value with gains and losses reflected in Principal transaction revenues in the Consolidated Statements of Earnings on a trade date basis. Fees received on loans carried at fair value are also recorded within Principal transaction revenues.
56
Table of Contents
JEFFERIES GROUP LLC AND SUBSIDIARIES
NOTES TO CONSOLIDATED FINANCIAL STATEMENTS - CONTINUED
Investment Banking. Underwriting revenues and fees from mergers and acquisitions, restructuring and other investment banking advisory assignments or engagements are recorded when the services related to the underlying transactions are completed under the terms of the assignment or engagement. Expenses associated with such assignments are deferred until reimbursed by the client, the related revenue is recognized or the engagement is otherwise concluded. Expenses are recorded net of client reimbursements and netted against revenues. Unreimbursed expenses with no related revenues are included in Business development and Professional services expenses in the Consolidated Statements of Earnings.
Asset Management Fees and Investment Income from Managed Funds. Asset management fees and investment income from managed funds include revenues we earn from management, administrative and performance fees from funds and accounts managed by us, revenues from management and performance fees we earn from related-party managed funds and investment income from our investments in these funds. We earn fees in connection with management and investment advisory services performed for various funds and managed accounts. These fees are based on assets under management or an agreed upon notional amount and may include performance fees based upon the performance of the funds. Management and administrative fees are generally recognized over the period that the related service is provided. Generally, performance fees are earned when the return on assets under management exceeds certain benchmark returns, "high-water marks" or other performance targets. Performance fees are accrued (or reversed) on a monthly basis based on measuring performance to date versus any relevant benchmark return hurdles stated in the investment management agreement. Performance fees are not subject to adjustment once the measurement period ends (generally annual periods) and the performance fees have been realized.
Interest Revenue and Expense. We recognize contractual interest on Financial instruments owned and Financial instruments sold, but not yet purchased, on an accrual basis as a component of interest revenue and expense. Interest flows on derivative trading transactions and dividends are included as part of the fair valuation of these contracts and recognized in Principal transaction revenues in the Consolidated Statements of Earnings rather than as a component of interest revenue or expense. We account for our short- and long-term borrowings on an accrual basis with related interest recorded as Interest expense. Discounts/premiums arising on our long-term debt are accreted/amortized to Interest expense using the effective yield method over the remaining lives of the underlying debt obligations. In addition, we recognize interest revenue related to our securities borrowed and securities purchased under agreements to resell activities and interest expense related to our securities loaned and securities sold under agreements to repurchase activities on an accrual basis.
Cash Equivalents
Cash equivalents include highly liquid investments, including money market funds and certificates of deposit, not held for resale with original maturities of three months or less.
Cash and Securities Segregated and on Deposit for Regulatory Purposes or Deposited With Clearing and Depository Organizations
In accordance with Rule 15c3-3 of the Securities Exchange Act of 1934, Jefferies as a broker-dealer carrying client accounts, is subject to requirements related to maintaining cash or qualified securities in a segregated reserve account for the exclusive benefit of its clients. Certain other entities are also obligated by rules mandated by their primary regulators to segregate or set aside cash or equivalent securities to satisfy regulations, promulgated to protect customer assets. In addition, certain exchange and/or clearing organizations require cash and/or securities to be deposited by us to conduct day to day activities.
Financial Instruments and Fair Value
Financial instruments owned and Financial instruments sold, not yet purchased are recorded at fair value, either as required by accounting pronouncements or through the fair value option election. These instruments primarily represent our trading activities and include both cash and derivative products. Gains and losses are recognized in Principal transaction revenues in our Consolidated Statements of Earnings. The fair value of a financial instrument is the amount that would be received to sell an asset or paid to transfer a liability in an orderly transaction between market participants at the measurement date (the exit price).
57
Table of Contents
JEFFERIES GROUP LLC AND SUBSIDIARIES
NOTES TO CONSOLIDATED FINANCIAL STATEMENTS - CONTINUED
Fair Value Hierarchy
In determining fair value, we maximize the use of observable inputs and minimize the use of unobservable inputs by requiring that observable inputs be used when available. Observable inputs are inputs that market participants would use in pricing the asset or liability based on market data obtained from independent sources. Unobservable inputs reflect our assumptions that market participants would use in pricing the asset or liability developed based on the best information available in the circumstances. We apply a hierarchy to categorize our fair value measurements broken down into three levels based on the transparency of inputs as follows:
Level 1: | Quoted prices are available in active markets for identical assets or liabilities at the reported date. |
Level 2: | Pricing inputs are other than quoted prices in active markets, which are either directly or indirectly observable at the reported date. The nature of these financial instruments include cash instruments for which quoted prices are available but traded less frequently, derivative instruments that fair values for which have been derived using model inputs that are directly observable in the market, or can be derived principally from or corroborated by observable market data, and instruments that are fair valued using other financial instruments, the parameters of which can be directly observed. |
Level 3: | Instruments that have little to no pricing observability at the reported date. These financial instruments are measured using management's best estimate of fair value, where the inputs into the determination of fair value require significant management judgment or estimation. |
Financial instruments are valued at quoted market prices, if available. Certain financial instruments have bid and ask prices that can be observed in the marketplace. For financial instruments whose inputs are based on bid-ask prices, the financial instrument is valued at the point within the bid-ask range that meets our best estimate of fair value. We use prices and inputs that are current at the measurement date. For financial instruments that do not have readily determinable fair values using quoted market prices, the determination of fair value is based upon consideration of available information, including types of financial instruments, current financial information, restrictions on dispositions, fair values of underlying financial instruments and quotations for similar instruments.
The valuation of financial instruments may include the use of valuation models and other techniques. Adjustments to valuations derived from valuation models may be made when, in management's judgment, features of the financial instrument such as its complexity, the market in which the financial instrument is traded and risk uncertainties about market conditions, require that an adjustment be made to the value derived from the models. Adjustments from the price derived from a valuation model reflect management's judgment that other participants in the market for the financial instrument being measured at fair value would also consider in valuing that same financial instrument. To the extent that valuation is based on models or inputs that are less observable or unobservable in the market, the determination of fair value requires more judgment.
The availability of observable inputs can vary and is affected by a wide variety of factors, including, for example, the type of financial instrument and market conditions. As the observability of prices and inputs may change for a financial instrument from period to period, this condition may cause a transfer of an instrument among the fair value hierarchy levels. Transfers among the levels are recognized at the beginning of each period. The degree of judgment exercised in determining fair value is greatest for instruments categorized in Level 3.
Valuation Process for Financial Instruments
Our Independent Price Verification ("IPV") Group, which is part of our Finance department, in partnership with Risk Management, is responsible for establishing our valuation policies and procedures. The IPV Group and Risk Management, which are independent of our business functions, play an important role and serve as a control function in determining that our financial instruments are appropriately reflected at fair value. This is particularly important where prices or valuations that require inputs are less observable. In the event that observable inputs are not available, the control processes are designed to assure that the valuation approach utilized is appropriate and consistently applied and that the assumptions are reasonable. The IPV Group reports to the Global Controller and is subject to the oversight of the IPV Committee, which comprises our Chief Financial Officer, Global Controller, Chief Risk Officer and Principal Accounting Officer, among other personnel. Our independent price verification policies and procedures are reviewed, at a minimum, annually, and changes to the policies require the approval of the IPV Committee.
58
Table of Contents
JEFFERIES GROUP LLC AND SUBSIDIARIES
NOTES TO CONSOLIDATED FINANCIAL STATEMENTS - CONTINUED
Price Testing Process. The business units are responsible for determining the fair value of our financial instruments using approved valuation models and methodologies. In order to ensure that the business unit valuations represent a fair value exit price, the IPV Group tests and validates the fair value of our financial instruments inventory. In the testing process, the IPV Group obtains prices and valuation inputs from independent sources, consistently adheres to established procedures set forth in our valuation policies for sourcing prices and valuation inputs and utilizing valuation methodologies. Sources used to validate fair value prices and inputs include, but are not limited to, exchange data, recently executed transactions, pricing data obtained from third party vendors, pricing and valuation services, broker quotes and observed comparable transactions.
To the extent discrepancies between the business unit valuations and the pricing or valuations resulting from the price testing process are identified, such discrepancies are investigated by the IPV Group and fair values are adjusted, as appropriate. The IPV Group maintains documentation of its testing, results, rationale and recommendations and prepares a monthly summary of its valuation results. This process also forms the basis for our classification of fair values within the fair value hierarchy ( i.e., Level 1, Level 2 or Level 3). The IPV Group utilizes the additional expertise of Risk Management personnel in valuing more complex financial instruments and financial instruments with less or limited pricing observability. The results of the valuation testing are reported to the IPV Committee on a monthly basis, which discusses the results and determines the financial instrument fair values in the consolidated financial statements. This process specifically assists the Chief Financial Officer in asserting as to the fair presentation of our financial condition and results of operations as included within our Quarterly Reports on Form 10-Q and Annual Report on Form 10-K. At each quarter end, the overall valuation results, as determined by the IPV Committee, are presented to the Audit Committee.
Judgment exercised in determining Level 3 fair value measurements is supplemented by daily analysis of profit and loss performed by the Product Control functions. Gains and losses, which result from changes in fair value, are evaluated and corroborated daily based on an understanding of each trading desk's overall risk positions and developments in a particular market on the given day. Valuation techniques generally rely on recent transactions of suitably comparable financial instruments and use the observable inputs from those comparable transactions as a validation basis for Level 3 inputs. Level 3 fair value measurements are further validated through subsequent sales testing and market comparable sales, if such information is available. Level 3 fair value measurements require documentation of the valuation rationale applied, which is reviewed for consistency in application from period to period.
Third Party Pricing Information. Pricing information obtained from external data providers (including independent pricing services and brokers) may incorporate a range of market quotes from dealers, recent market transactions and benchmarking model derived prices to quoted market prices and trade data for comparable securities. External pricing data is subject to evaluation for reasonableness by the IPV Group using a variety of means including comparisons of prices to those of similar product types, quality and maturities, consideration of the narrowness or wideness of the range of prices obtained, knowledge of recent market transactions and an assessment of the similarity in prices to comparable dealer offerings in a recent time period. Our processes challenge the appropriateness of pricing information obtained from external data providers (including independent pricing services and brokers) to validate the data for consistency with the definition of a fair value exit price. Our process includes understanding and evaluating the external data providers' valuation methodologies. For corporate, U.S. government and agency, and municipal debt securities, and loans, to the extent we use independent pricing services or broker quotes in our valuation process, the vendor service providers are collecting and aggregating observable market information as to recent trade activity and active bid-ask submissions. The composite pricing information received from the independent pricing service is thus not based on unobservable inputs or proprietary models. For mortgage- and other asset-backed securities, collateralized debt obligations ("CDOs") and collateralized loan obligations ("CLOs"), our independent pricing services use a matrix evaluation approach, incorporating both observable yield curves and market yields on comparable securities as well as implied inputs from observed trades for comparable securities in order to determine prepayment speeds, cumulative default rates and loss severity. Further, we consider pricing data from multiple service providers as available as well as compare pricing data to prices we have observed for recent transactions, if any, in order to corroborate our valuation inputs.
Model Review Process. If a pricing model is used to determine fair value, the pricing model is reviewed for theoretical soundness and appropriateness by Risk Management, independent from the trading desks, and then approved by Risk Management to be used in the valuation process. Review and approval of a model for use may include benchmarking the model against relevant third party valuations, testing sample trades in the model, backtesting the results of the model against actual trades and stress-testing the sensitivity of the pricing model using varying inputs and assumptions. In addition, recently executed comparable transactions and other observable market data are considered for purposes of validating assumptions underlying the model. Models are independently reviewed and validated by Risk Management annually or more frequently if market conditions or use of the valuation model changes.
59
Table of Contents
JEFFERIES GROUP LLC AND SUBSIDIARIES
NOTES TO CONSOLIDATED FINANCIAL STATEMENTS - CONTINUED
Investments in Managed Funds
Investments in managed funds include our investments in funds managed by us and our investments in related-party managed funds in which we are entitled to a portion of the management and/or performance fees. Investments in nonconsolidated managed funds are accounted for at fair value based on the net asset value ("NAV") of the funds provided by the fund managers with gains or losses included in Asset management fees and investment income (loss) from managed funds in the Consolidated Statements of Earnings.
Loans to and Investments in Related Parties
Loans to and investments in related parties include investments in private equity and other operating entities made in connection with our capital markets activities in which we exercise significant influence over operating and capital decisions and loans issued in connection with such activities. Loans to and investments in related parties are accounted for using the equity method or at cost, as appropriate. Revenues on Loans to and investments in related parties are included in Other revenues in the Consolidated Statements of Earnings. See Note 9, Investments , and Note 21, Related Party Transactions , for additional information regarding certain of these investments.
Securities Borrowed and Securities Loaned
Securities borrowed and securities loaned are carried at the amounts of cash collateral advanced and received in connection with the transactions and accounted for as collateralized financing transactions. In connection with both trading and brokerage activities, we borrow securities to cover short sales and to complete transactions in which customers have failed to deliver securities by the required settlement date, and lend securities to other brokers and dealers for similar purposes. We have an active securities borrowed and lending matched book business in which we borrow securities from one party and lend them to another party. When we borrow securities, we generally provide cash to the lender as collateral, which is reflected in our Consolidated Statements of Financial Condition as Securities borrowed. We earn interest revenues on this cash collateral. Similarly, when we lend securities to another party, that party provides cash to us as collateral, which is reflected in our Consolidated Statements of Financial Condition as Securities loaned. We pay interest expense on the cash collateral received from the party borrowing the securities. The initial collateral advanced or received approximates or is greater than the fair value of the securities borrowed or loaned. We monitor the fair value of the securities borrowed and loaned on a daily basis and request additional collateral or return excess collateral, as appropriate.
Securities Purchased Under Agreements to Resell and Securities Sold Under Agreements to Repurchase
Securities purchased under agreements to resell and Securities sold under agreements to repurchase (collectively "repos") are accounted for as collateralized financing transactions and are recorded at their contracted resale or repurchase amount plus accrued interest. We earn and incur interest over the term of the repo, which is reflected in Interest revenue and Interest expense on our Consolidated Statements of Earnings on an accrual basis. Repos are presented in the Consolidated Statements of Financial Condition on a net-basis by counterparty, where permitted by U.S. GAAP. We monitor the fair value of the underlying securities daily versus the related receivable or payable balances. Should the fair value of the underlying securities decline or increase, additional collateral is requested or excess collateral is returned, as appropriate.
Offsetting of Derivative Financial Instruments and Securities Financing Agreements
To manage our exposure to credit risk associated with our derivative activities and securities financing transactions, we may enter into International Swaps and Derivative Association, Inc. ("ISDA") master netting agreements, master securities lending agreements, master repurchase agreements or similar agreements and collateral arrangements with counterparties. A master agreement creates a single contract under which all transactions between two counterparties are executed allowing for trade aggregation and a single net payment obligation. Master agreements provide protection in bankruptcy in certain circumstances and, where legally enforceable, enable receivables and payables with the same counterparty to be settled or otherwise eliminated by applying amounts due against all or a portion of an amount due from the counterparty or a third party. Under our ISDA master netting agreements, we typically also execute credit support annexes, which provide for collateral, either in the form of cash or securities, to be posted by or paid to a counterparty based on the fair value of the derivative receivable or payable based on the rates and parameters established in the credit support annex.
In the event of the counterparty's default, provisions of the master agreement permit acceleration and termination of all outstanding transactions covered by the agreement such that a single amount is owed by, or to, the non-defaulting party. In addition, any collateral posted can be applied to the net obligations, with any excess returned; and the collateralized party has a right to liquidate the collateral. Any residual claim after netting is treated along with other unsecured claims in bankruptcy court.
60
Table of Contents
JEFFERIES GROUP LLC AND SUBSIDIARIES
NOTES TO CONSOLIDATED FINANCIAL STATEMENTS - CONTINUED
The conditions supporting the legal right of offset may vary from one legal jurisdiction to another and the enforceability of master netting agreements and bankruptcy laws in certain countries or in certain industries is not free from doubt. The right of offset is dependent both on contract law under the governing arrangement and consistency with the bankruptcy laws of the jurisdiction where the counterparty is located. Industry legal opinions with respect to the enforceability of certain standard provisions in respective jurisdictions are relied upon as a part of managing credit risk. In cases where we have not determined an agreement to be enforceable, the related amounts are not offset. Master netting agreements are a critical component of our risk management processes as part of reducing counterparty credit risk and managing liquidity risk.
We are also a party to clearing agreements with various central clearing parties. Under these arrangements, the central clearing counterparty facilitates settlement between counterparties based on the net payable owed or receivable due and, with respect to daily settlement, cash is generally only required to be deposited to the extent of the net amount. In the event of default, a net termination amount is determined based on the market values of all outstanding positions and the clearing organization or clearing member provides for the liquidation and settlement of the net termination amount among all counterparties to the open contracts or transactions.
Refer to Note 5, Derivative Financial Instruments and Note 6, Collateralized Transactions , for further information.
Premises and Equipment
Premises and equipment are depreciated using the straight-line method over the estimated useful lives of the related assets (generally three to ten years ). Leasehold improvements are amortized using the straight-line method over the term of the related leases or the estimated useful lives of the assets, whichever is shorter. Premises and equipment includes internally developed software. The carrying values of internally developed software ready for its intended use are depreciated over the remaining useful life.
At November 30, 2016 and 2015 , furniture, fixtures and equipment, including amounts under capital leases, amounted to $374.2 million and $365.8 million , respectively, and leasehold improvements amounted to $200.5 million and $190.5 million , respectively. Accumulated depreciation and amortization was $309.2 million and $312.8 million at November 30, 2016 and 2015 , respectively.
Depreciation and amortization expense amounted to $47.9 million , $78.7 million and $58.0 million for the years ended November 30, 2016 , 2015 and 2014 , respectively.
Goodwill and Intangible Assets
Goodwill . Goodwill represents the excess acquisition cost over the fair value of net tangible and intangible assets acquired. Goodwill is not amortized and is subject to annual impairment testing on August 1 or between annual tests if an event or change in circumstance occurs that would more likely than not reduce the fair value of a reporting unit below its carrying value. In testing for goodwill impairment, we have the option to first assess qualitative factors to determine whether the existence of events or circumstances lead to a determination that it is more likely than not that the fair value of a reporting unit is less than its carrying amount. If, after assessing the totality of events and circumstances, we conclude that it is not more likely than not that the fair value of a reporting unit is less than its carrying amount, then performing the two-step impairment test is not required. If we conclude otherwise, we are required to perform the two-step impairment test. The goodwill impairment test is performed at the reporting unit level by comparing the estimated fair value of a reporting unit with its respective carrying value. If the estimated fair value exceeds the carrying value, goodwill at the reporting unit level is not impaired. If the estimated fair value is less than carrying value, further analysis is necessary to determine the amount of impairment, if any, by comparing the implied fair value of the reporting unit's goodwill to the carrying value of the reporting unit's goodwill.
The fair value of reporting units are based on widely accepted valuation techniques that we believe market participants would use, although the valuation process requires significant judgment and often involves the use of significant estimates and assumptions. The methodologies we utilize in estimating the fair value of reporting units include market valuation methods that incorporate price-to-earnings and price-to-book multiples of comparable exchange traded companies and multiples of merger and acquisitions of similar businesses. The estimates and assumptions used in determining fair value could have a significant effect on whether or not an impairment charge is recorded and the magnitude of such a charge. Adverse market or economic events could result in impairment charges in future periods.
Intangible Assets . Intangible assets deemed to have finite lives are amortized on a straight line basis over their estimated useful lives, where the useful life is the period over which the asset is expected to contribute directly, or indirectly, to our future cash flows. Intangible assets are reviewed for impairment on an interim basis when certain events or circumstances exist. For amortizable intangible assets, impairment exists when the carrying amount of the intangible asset exceeds its fair value. At least annually, the remaining useful life is evaluated.
61
Table of Contents
JEFFERIES GROUP LLC AND SUBSIDIARIES
NOTES TO CONSOLIDATED FINANCIAL STATEMENTS - CONTINUED
An intangible asset with an indefinite useful life is not amortized but assessed for impairment annually, or more frequently, when events or changes in circumstances occur indicating that it is more likely than not that the indefinite-lived asset is impaired. Impairment exists when the carrying amount exceeds its fair value. In testing for impairment, we have the option to first perform a qualitative assessment to determine whether it is more likely than not that an impairment exists. If it is determined that it is not more likely than not that an impairment exists, a quantitative impairment test is not necessary. If we conclude otherwise, we are required to perform a quantitative impairment test.
Intangible assets are included in Other assets on the Consolidated Statement of Financial Condition. The Company's annual indefinite-lived intangible asset impairment testing date is August 1. To the extent an impairment loss is recognized, the loss establishes the new cost basis of the asset that is amortized over the remaining useful life of that asset, if any. Subsequent reversal of impairment losses is not permitted.
Refer to Note 10, Goodwill and Other Intangible Assets , for further information.
Income Taxes
Our results of operations are included in the consolidated federal and applicable state income tax returns filed by Leucadia. In states that neither accept nor require combined or unitary tax returns, certain subsidiaries file separate state income tax returns. We also are subject to income tax in various foreign jurisdictions in which we operate. We account for our provision for income taxes using a "separate return" method. Amounts provided for income taxes are based on income reported for financial statement purposes and do not necessarily represent amounts currently payable. Pursuant to a tax sharing agreement entered into between us and Leucadia, payments are made between us and Leucadia to settle current tax assets and liabilities.
Deferred tax assets and liabilities are recognized for the future tax consequences attributable to differences between the financial statement carrying amounts of existing assets and liabilities and their respective tax bases and for tax loss carryforwards. Deferred tax assets and liabilities are measured using enacted tax rates expected to apply to taxable income in the years in which those temporary differences are expected to be recovered or settled. The effect of a change in tax rates on deferred tax assets and liabilities is recognized in income in the period that includes the enactment date. We provide deferred taxes on our temporary differences and on any carryforwards that we could claim on our hypothetical tax return. The realization of deferred tax assets is assessed and a valuation allowance is recorded to the extent that it is more likely than not that any portion of the deferred tax asset will not be realized on the basis of its projected separate return results.
The tax benefits related to share-based awards are recognized as an increase to Additional paid-in capital. These amounts, and other windfall tax benefits/(detriments), are included in Tax benefit/(detriment) for issuance of share-based awards on the Consolidated Statements of Changes in Equity. In the event tax deductions associated with share-based awards are less than the cumulative compensation cost recognized for financial reporting purposes, we look to Leucadia's consolidated pool of windfall tax benefits in the calculation of our income tax provision. During the first quarter of fiscal 2016, the consolidated pool of windfall tax benefits had been exhausted. As a result, our tax detriments are now recognized in our Consolidated Statement of Earnings until such time the Leucadia consolidated cumulative compensation cost recognized for tax purposes exceeds the amount recognized for financial reporting purposes.
We record uncertain tax positions using a two-step process: (i) we determine whether it is more likely than not that each tax position will be sustained on the basis of the technical merits of the position; and (ii) for those tax positions that meet the more-likely-than-not recognition threshold, we recognize the largest amount of tax benefit that is more than 50 percent likely to be realized upon ultimate settlement with the related tax authority.
Legal Reserves
In the normal course of business, we have been named, from time to time, as a defendant in legal and regulatory proceedings. We are also involved, from time to time, in other exams, investigations and similar reviews (both formal and informal) by governmental and self-regulatory agencies regarding our businesses, certain of which may result in judgments, settlements, fines, penalties or other injunctions.
We recognize a liability for a contingency in Accrued expenses and other liabilities when it is probable that a liability has been incurred and the amount of loss can be reasonably estimated. If the reasonable estimate of a probable loss is a range, we accrue the most likely amount of such loss, and if such amount is not determinable, then we accrue the minimum in the range as the loss accrual. The determination of the outcome and loss estimates requires significant judgment on the part of management. We believe that any other matters for which we have determined a loss to be probable and reasonably estimable are not material to the consolidated financial statements.
62
Table of Contents
JEFFERIES GROUP LLC AND SUBSIDIARIES
NOTES TO CONSOLIDATED FINANCIAL STATEMENTS - CONTINUED
In many instances, it is not possible to determine whether any loss is probable or even possible or to estimate the amount of any loss or the size of any range of loss. We believe that, in the aggregate, the pending legal actions or regulatory proceedings and any other exams, investigations or similar reviews (both formal and informal) should not have a material adverse effect on our consolidated results of operations, cash flows or financial condition. In addition, we believe that any amount that could be reasonably estimated of potential loss or range of potential loss in excess of what has been provided in the consolidated financial statements is not material.
Share-based Compensation
Share-based awards are measured based on the grant-date fair value of the award and recognized over the period from the service inception date through the date the employee is no longer required to provide service to earn the award. Expected forfeitures are included in determining share-based compensation expense.
Foreign Currency Translation
Assets and liabilities of foreign subsidiaries having non-U.S. dollar functional currencies are translated at exchange rates at the end of a period. Revenues and expenses are translated at average exchange rates during the period. The gains or losses resulting from translating foreign currency financial statements into U.S. dollars, net of hedging gains or losses and taxes, if any, are included in Other comprehensive income. Gains or losses resulting from foreign currency transactions are included in Principal transaction revenues in the Consolidated Statements of Earnings.
Securitization Activities
We engage in securitization activities related to corporate loans, consumer loans, commercial mortgage loans and mortgage-backed and other asset-backed securities. Such transfers of financial assets are accounted for as sales when we have relinquished control over the transferred assets. The gain or loss on sale of such financial assets depends, in part, on the previous carrying amount of the assets involved in the transfer allocated between the assets sold and the retained interests, if any, based upon their respective fair values at the date of sale. We may retain interests in the securitized financial assets as one or more tranches of the securitization. These retained interests are included within Financial instruments owned in the Consolidated Statements of Financial Condition at fair value. Any changes in the fair value of such retained interests are recognized within Principal transactions revenues in the Consolidated Statements of Earnings.
When a transfer of assets does not meet the criteria of a sale, we account for the transfer as a secured borrowing and continue to recognize the assets of a secured borrowing in Financial instruments owned and recognize the associated financing in Other secured financings in the Consolidated Statements of Financial Condition.
Note 3. Accounting Developments
Accounting Standards to be Adopted in Future Periods
Statement of Cash Flows. In August 2016, the Financial Accounting Standards Board ("FASB") issued Accounting Standards Update ("ASU") No. 2016-15, Classification of Certain Cash Receipts and Cash Payments. The guidance adds or clarifies guidance on the classification of certain cash receipts and payments in the statement of cash flows. The guidance is effective in the first quarter of fiscal 2019 and early adoption is permitted. In November 2016, the FASB issued ASU No. 2016-18, Restricted Cash. The guidance requires that a statement of cash flows explain the change during the period in the total of cash, cash equivalents and amounts generally described as restricted cash or restricted cash equivalents. The guidance is effective in the first quarter of fiscal 2019 and early adoption is permitted. We are currently evaluating the impact of these new ASUs on our Consolidated Statements of Cash Flows.
Financial Instruments-Credit Losses. In June 2016, the FASB issued ASU No. 2016-13, Measurement of Credit Losses on Financial Instruments. The guidance provides for estimating credit losses on certain types of financial instruments by introducing an approach based on expected losses. The guidance is effective in the first quarter of fiscal 2021 and early adoption is permitted in the first quarter of fiscal 2020. We are currently evaluating the impact of the new guidance on our consolidated financial statements.
63
Table of Contents
JEFFERIES GROUP LLC AND SUBSIDIARIES
NOTES TO CONSOLIDATED FINANCIAL STATEMENTS - CONTINUED
Employee Share-Based Payments. In March 2016, the FASB issued ASU No. 2016-09, Improvements to Employee Share-Based Payment Accounting. The guidance simplifies various aspects related to how share-based payments are accounted for and presented in the consolidated financial statements. The amendments include the recognition of all excess tax benefits and tax deficiencies as income tax expense or benefit in the Consolidated Statement of Earnings and changes to the timing of recognition of excess tax benefits, the accounting for forfeitures, classification of awards as either equity or liabilities and classification on the statement of cash flows. We early adopted this standard on December 1, 2016 and the adoption did not have a material effect on our consolidated financial statements. We elected to account for forfeitures as they occur, which will result in dividends and dividend equivalents originally charged against retained earnings for forfeited shares to be reclassified to compensation cost in the period in which the forfeiture occurs. In addition, the current period's excess tax benefit related to stock-based compensation will be presented as an operating activity rather than a financing activity in the Consolidated Statements of Cash Flows on a retrospective basis.
Leases. In February 2016, the FASB issued ASU No. 2016-02, Leases. The guidance affects the accounting for leases and provides for a lessee model that brings substantially all leases onto the balance sheet. The guidance is effective in the first quarter of fiscal 2019 and early adoption is permitted. We are currently evaluating the impact of the new guidance on our consolidated financial statements.
Financial Instruments. In January 2016, the FASB issued ASU No. 2016-01, Financial Instruments-Overall: Recognition and Measurement of Financial Assets and Financial Liabilities. The guidance affects the accounting for equity investments, financial liabilities under the fair value option and the presentation and disclosure requirements of financial instruments. The guidance is effective in the first quarter of fiscal 2019. We are currently evaluating the impact of the new guidance related to equity investments and the presentation and disclosure requirements of financial instruments on our consolidated financial statements. Early adoption is permitted for the accounting guidance on financial liabilities under the fair value option and we adopted this guidance in the first quarter of fiscal 2016. The adoption of this accounting guidance did not have a material effect on our consolidated financial statements.
Revenue Recognition . In May 2014, the FASB issued ASU No. 2014-09, Revenue from Contracts with Customers ("ASU No. 2014-09"). The accounting guidance defines how companies report revenues from contracts with customers, and also requires enhanced disclosures. The guidance, as stated in ASU No. 2014-09, was effective beginning in the first quarter of fiscal 2018. In August 2015, the FASB issued ASU No. 2015-14, Revenue from Contracts with Customers - Deferral of Effective Date, which defers the effective date by one year, with early adoption on the original effective date permitted. We intend to adopt the new guidance on December 1, 2017 with a cumulative-effect adjustment to opening retained earnings. Because the guidance does not apply to revenue associated with financial instruments, including loans and securities that are accounted for under other U.S. GAAP, we do not expect the guidance to have a material impact on the elements of our Consolidated Statements of Earnings most closely associated with financial instruments, including Principal transaction revenues, Interest income and Interest expense. Our implementation efforts include the identification of revenue within the scope of the guidance, the evaluation of certain revenue contracts, education and discussions with our control functions, and periodic discussions with our audit committee. Our evaluation of the impact of the new guidance on our consolidated financial statements is ongoing, and we continue to evaluate the timing of recognition for various revenues, which may be accelerated or deferred depending on the features of the client arrangements and the presentation of certain contract costs (whether presented gross or offset against revenues).
Adopted Accounting Standards
Debt Issuance Costs. In April 2015, the FASB issued ASU No. 2015-03, Simplifying the Presentation of Debt Issuance Costs. The accounting guidance requires that debt issuance costs related to a recognized debt liability be reported in the Consolidated Statements of Financial Condition as a direct deduction from the carrying amount of that debt liability. The guidance is effective retrospectively and we adopted this guidance in the first quarter of fiscal 2016. The adoption of this accounting guidance did not have a material impact on our Consolidated Statements of Financial Condition.
Consolidation. In February 2015, the FASB issued ASU No. 2015-02, Consolidation (Topic 810): Amendments to the Consolidation Analysis. The amendment eliminates the deferral of certain consolidation standards for entities considered to be investment companies and modifies the consolidation analysis performed on certain types of legal entities. The guidance is effective beginning in the first quarter of fiscal 2017 and we adopted it in the first quarter of fiscal 2016 using a modified retrospective approach. The adoption of this accounting guidance resulted in the deconsolidation of an asset management vehicle, which resulted in the following adjustment to the Consolidated Statement of Financial Condition on December 1, 2015: a decrease of $27.0 million in Investments in managed funds, a decrease of $0.7 million in Accrued expenses and other liabilities and a decrease of $26.3 million in Noncontrolling interests. For further information on the adoption of ASU No. 2015-02, refer to Note 8, Variable Interest Entities.
64
Table of Contents
JEFFERIES GROUP LLC AND SUBSIDIARIES
NOTES TO CONSOLIDATED FINANCIAL STATEMENTS - CONTINUED
Note 4. Fair Value Disclosures
The following is a summary of our financial assets and liabilities that are accounted for at fair value on a recurring basis, excluding Investments at fair value based on NAV of $24.3 million and $36.7 million at November 30, 2016 and 2015 , respectively, by level within the fair value hierarchy (in thousands):
| November 30, 2016 | ||||||||||||||||||
| Level 1 (1) |
| Level 2 (1) |
| Level 3 |
| Counterparty and Cash Collateral Netting (2) |
| Total | ||||||||||
Assets: |
|
|
|
|
|
|
|
|
| ||||||||||
Financial instruments owned: |
|
|
|
|
|
|
|
|
| ||||||||||
Corporate equity securities | $ | 1,742,463 | |
| $ | 90,662 | |
| $ | 21,739 | |
| $ | - | |
| $ | 1,854,864 | |
Corporate debt securities | - | |
| 2,675,020 | |
| 25,005 | |
| - | |
| 2,700,025 | | |||||
CDOs and CLOs | - | |
| 54,306 | |
| 54,354 | |
| - | |
| 108,660 | | |||||
U.S. government and federal agency securities | 2,389,397 | |
| 56,726 | |
| - | |
| - | |
| 2,446,123 | | |||||
Municipal securities | - | |
| 708,469 | |
| 27,257 | |
| - | |
| 735,726 | | |||||
Sovereign obligations | 1,432,556 | |
| 990,492 | |
| - | |
| - | |
| 2,423,048 | | |||||
Residential mortgage-backed securities | - | |
| 960,494 | |
| 38,772 | |
| - | |
| 999,266 | | |||||
Commercial mortgage-backed securities | - | |
| 296,405 | |
| 20,580 | |
| - | |
| 316,985 | | |||||
Other asset-backed securities | - | |
| 63,587 | |
| 40,911 | |
| - | |
| 104,498 | | |||||
Loans and other receivables | - | |
| 1,557,233 | |
| 81,872 | |
| - | |
| 1,639,105 | | |||||
Derivatives | 3,825 | |
| 4,606,278 | |
| 6,429 | |
| (4,255,998 | ) |
| 360,534 | | |||||
Investments at fair value | - | |
| - | |
| 96,369 | |
| - | |
| 96,369 | | |||||
Total financial instruments owned, excluding Investments at fair value based on NAV | $ | 5,568,241 | |
| $ | 12,059,672 | |
| $ | 413,288 | |
| $ | (4,255,998 | ) |
| $ | 13,785,203 | |
|
|
|
|
|
|
|
|
|
| ||||||||||
Liabilities: |
|
|
|
|
|
|
|
|
| ||||||||||
Financial instruments sold, not yet purchased: |
|
|
|
|
|
|
|
|
| ||||||||||
Corporate equity securities | $ | 1,577,405 | |
| $ | 16,806 | |
| $ | 313 | |
| $ | - | |
| $ | 1,594,524 | |
Corporate debt securities | - | |
| 1,718,424 | |
| 523 | |
| - | |
| 1,718,947 | | |||||
U.S. government and federal agency securities | 976,497 | |
| - | |
| - | |
| - | |
| 976,497 | | |||||
Sovereign obligations | 1,375,590 | |
| 1,253,754 | |
| - | |
| - | |
| 2,629,344 | | |||||
Loans | - | |
| 801,977 | |
| 378 | |
| - | |
| 802,355 | | |||||
Derivatives | 568 | |
| 4,856,310 | |
| 9,870 | |
| (4,229,213 | ) |
| 637,535 | | |||||
Total financial instruments sold, not yet purchased | $ | 3,930,060 | |
| $ | 8,647,271 | |
| $ | 11,084 | |
| $ | (4,229,213 | ) |
| $ | 8,359,202 | |
Other secured financings | $ | - | |
| $ | 41,350 | |
| $ | 418 | |
| $ | - | |
| $ | 41,768 | |
Long term debt | $ | - | |
| $ | 248,856 | |
| $ | - | |
| $ | - | |
| $ | 248,856 | |
(1) | There were no material transfers between Level 1 and Level 2 for the year ended November 30, 2016 . |
(2) | Represents counterparty and cash collateral netting across the levels of the fair value hierarchy for positions with the same counterparty. |
65
Table of Contents
JEFFERIES GROUP LLC AND SUBSIDIARIES
NOTES TO CONSOLIDATED FINANCIAL STATEMENTS - CONTINUED
| November 30, 2015 | ||||||||||||||||||
| Level 1 (1) |
| Level 2 (1) |
| Level 3 |
| Counterparty and Cash Collateral Netting (2) |
| Total | ||||||||||
Assets: |
|
|
|
|
|
|
|
|
| ||||||||||
Financial instruments owned: |
|
|
|
|
|
|
|
|
| ||||||||||
Corporate equity securities | $ | 1,853,351 | |
| $ | 133,732 | |
| $ | 40,906 | |
| $ | - | |
| $ | 2,027,989 | |
Corporate debt securities | - | |
| 2,867,165 | |
| 25,876 | |
| - | |
| 2,893,041 | | |||||
CDOs and CLOs | - | |
| 89,144 | |
| 85,092 | |
| - | |
| 174,236 | | |||||
U.S. government and federal agency securities | 2,555,018 | |
| 90,633 | |
| - | |
| - | |
| 2,645,651 | | |||||
Municipal securities | - | |
| 487,141 | |
| - | |
| - | |
| 487,141 | | |||||
Sovereign obligations | 1,251,366 | |
| 1,407,955 | |
| 120 | |
| - | |
| 2,659,441 | | |||||
Residential mortgage-backed securities | - | |
| 2,731,070 | |
| 70,263 | |
| - | |
| 2,801,333 | | |||||
Commercial mortgage-backed securities | - | |
| 1,014,913 | |
| 14,326 | |
| - | |
| 1,029,239 | | |||||
Other asset-backed securities | - | |
| 118,629 | |
| 42,925 | |
| - | |
| 161,554 | | |||||
Loans and other receivables | - | |
| 1,123,044 | |
| 189,289 | |
| - | |
| 1,312,333 | | |||||
Derivatives | 1,037 | |
| 4,395,704 | |
| 19,785 | |
| (4,165,446 | ) |
| 251,080 | | |||||
Investments at fair value | - | |
| 26,224 | |
| 53,120 | |
| - | |
| 79,344 | | |||||
Total financial instruments owned, excluding Investments at fair value based on NAV | $ | 5,660,772 | |
| $ | 14,485,354 | |
| $ | 541,702 | |
| $ | (4,165,446 | ) |
| $ | 16,522,382 | |
|
|
|
|
|
|
|
|
|
| ||||||||||
Liabilities: |
|
|
|
|
|
|
|
|
| ||||||||||
Financial instruments sold, not yet purchased: |
|
|
|
|
|
|
|
|
| ||||||||||
Corporate equity securities | $ | 1,382,377 | |
| $ | 36,518 | |
| $ | 38 | |
| $ | - | |
| $ | 1,418,933 | |
Corporate debt securities | - | |
| 1,556,941 | |
| - | |
| - | |
| 1,556,941 | | |||||
U.S. government and federal agency securities | 1,488,121 | |
| - | |
| - | |
| - | |
| 1,488,121 | | |||||
Sovereign obligations | 837,614 | |
| 505,382 | |
| - | |
| - | |
| 1,342,996 | | |||||
Residential mortgage-backed securities | - | |
| 117 | |
| - | |
| - | |
| 117 | | |||||
Loans | - | |
| 758,939 | |
| 10,469 | |
| - | |
| 769,408 | | |||||
Derivatives | 364 | |
| 4,446,639 | |
| 19,543 | |
| (4,257,998 | ) |
| 208,548 | | |||||
Total financial instruments sold, not yet purchased | $ | 3,708,476 | |
| $ | 7,304,536 | |
| $ | 30,050 | |
| $ | (4,257,998 | ) |
| $ | 6,785,064 | |
Other secured financings (3) | $ | - | |
| $ | 67,801 | |
| $ | 544 | |
| $ | - | |
| $ | 68,345 | |
(1) | There were no material transfers between Level 1 and Level 2 for the year ended November 30, 2015 . |
(2) | Represents counterparty and cash collateral netting across the levels of the fair value hierarchy for positions with the same counterparty. |
(3) | Level 2 liabilities include $67.8 million of other secured financings that were previously not disclosed in our Annual Report on Form 10-K for the year ended November 30, 2015 . |
The following is a description of the valuation basis, including valuation techniques and inputs, used in measuring our financial assets and liabilities that are accounted for at fair value on a recurring basis:
Corporate Equity Securities
• | Exchange Traded Equity Securities: Exchange-traded equity securities are measured based on quoted closing exchange prices, which are generally obtained from external pricing services, and are categorized within Level 1 of the fair value hierarchy, otherwise they are categorized within Level 2 of the fair value hierarchy. |
66
Table of Contents
JEFFERIES GROUP LLC AND SUBSIDIARIES
NOTES TO CONSOLIDATED FINANCIAL STATEMENTS - CONTINUED
• | Non-exchange Traded Equity Securities : Non-exchange traded equity securities are measured primarily using broker quotations, pricing data from external pricing services and prices observed for recently executed market transactions and are categorized within Level 2 of the fair value hierarchy. Where such information is not available, non-exchange traded equity securities are categorized within Level 3 of the fair value hierarchy and measured using valuation techniques involving quoted prices of or market data for comparable companies, similar company ratios and multiples ( e.g. , price/Earnings before interest, taxes, depreciation and amortization ("EBITDA"), price/book value), discounted cash flow analyses and transaction prices observed for subsequent financing or capital issuance by the Company. When using pricing data of comparable companies, judgment must be applied to adjust the pricing data to account for differences between the measured security and the comparable security ( e.g. , issuer market capitalization, yield, dividend rate, geographical concentration). |
• | Equity Warrants: Non-exchange traded equity warrants are measured primarily using pricing data from external pricing services, prices observed for recently executed market transactions and broker quotations are categorized within Level 2 of the fair value hierarchy. Where such information is not available, non-exchange traded equity warrants are generally categorized within Level 3 of the fair value hierarchy and are measured using the Black-Scholes model with key inputs impacting the valuation including the underlying security price, implied volatility, dividend yield, interest rate curve, strike price and maturity date. |
Corporate Debt Securities
• | Corporate Bonds: Corporate bonds are measured primarily using pricing data from external pricing services and broker quotations, where available, prices observed for recently executed market transactions and bond spreads or credit default swap spreads of the issuer adjusted for basis differences between the swap curve and the bond curve. Corporate bonds measured using these valuation methods are categorized within Level 2 of the fair value hierarchy. If broker quotes, pricing data or spread data is not available, alternative valuation techniques are used including cash flow models incorporating interest rate curves, single name or index credit default swap curves for comparable issuers and recovery rate assumptions. Corporate bonds measured using alternative valuation techniques are categorized within Level 3 of the fair value hierarchy and are a limited portion of our corporate bonds. |
• | High Yield Corporate and Convertible Bonds: A significant portion of our high yield corporate and convertible bonds are categorized within Level 2 of the fair value hierarchy and are measured primarily using broker quotations and pricing data from external pricing services, where available, and prices observed for recently executed market transactions of comparable size. Where pricing data is less observable, valuations are categorized within Level 3 and are based on pending transactions involving the issuer or comparable issuers, prices implied from an issuer's subsequent financings or recapitalizations, models incorporating financial ratios and projected cash flows of the issuer and market prices for comparable issuers. |
CDOs and CLOs
CDOs and CLOs are measured based on prices observed for recently executed market transactions of the same or similar security or based on valuations received from third party brokers or data providers and are categorized within Level 2 or Level 3 of the fair value hierarchy depending on the observability and significance of the pricing inputs. Valuation that is based on recently executed market transactions of similar securities incorporates additional review and analysis of pricing inputs and comparability criteria including but not limited to collateral type, tranche type, rating, origination year, prepayment rates, default rates, and loss severity.
U.S. Government and Federal Agency Securities
• | U.S. Treasury Securities: U.S. Treasury securities are measured based on quoted market prices and categorized within Level 1 of the fair value hierarchy. |
• | U.S. Agency Issued Debt Securities: Callable and non-callable U.S. agency issued debt securities are measured primarily based on quoted market prices obtained from external pricing services and are generally categorized within Level 1 or Level 2 of the fair value hierarchy. |
Municipal Securities
Municipal securities are measured based on quoted prices obtained from external pricing services and are generally categorized within Level 2 of the fair value hierarchy.
67
Table of Contents
JEFFERIES GROUP LLC AND SUBSIDIARIES
NOTES TO CONSOLIDATED FINANCIAL STATEMENTS - CONTINUED
Sovereign Obligations
Foreign sovereign government obligations are measured based on quoted market prices obtained from external pricing services, where available, or recently executed independent transactions of comparable size. To the extent external price quotations are not available or recent transactions have not been observed, valuation techniques incorporating interest rate yield curves and country spreads for bonds of similar issuers, seniority and maturity are used to determine fair value of sovereign bonds or obligations. Foreign sovereign government obligations are classified in Level 1, Level 2 or Level 3 of the fair value hierarchy, primarily based on the country of issuance.
Residential Mortgage-Backed Securities
• | Agency Residential Mortgage-Backed Securities ("RMBS"): Agency RMBS include mortgage pass-through securities (fixed and adjustable rate), collateralized mortgage obligations and interest-only and principal-only securities and are generally measured using market price quotations from external pricing services and categorized within Level 2 of the fair value hierarchy. |
• | Agency Residential Interest-Only and Inverse Interest-Only Securities ("Agency Inverse IOs"): The fair value of Agency Inverse IOs is estimated using expected future cash flow techniques that incorporate prepayment models and other prepayment assumptions to amortize the underlying mortgage loan collateral. We use prices observed for recently executed transactions to develop market-clearing spread and yield curve assumptions. Valuation inputs with regard to the underlying collateral incorporate weighted average coupon, loan-to-value, credit scores, geographic location, maximum and average loan size, originator, servicer, and weighted average loan age. Agency Inverse IOs are categorized within Level 2 of the fair value hierarchy. We also use vendor data in developing our assumptions, as appropriate. |
• | Non-Agency RMBS: Fair values are determined primarily using discounted cash flow methodologies and securities are categorized within Level 2 or Level 3 of the fair value hierarchy based on the observability and significance of the pricing inputs used. Performance attributes of the underlying mortgage loans are evaluated to estimate pricing inputs, such as prepayment rates, default rates and the severity of credit losses. Attributes of the underlying mortgage loans that affect the pricing inputs include, but are not limited to, weighted average coupon; average and maximum loan size; loan-to-value; credit scores; documentation type; geographic location; weighted average loan age; originator; servicer; historical prepayment, default and loss severity experience of the mortgage loan pool; and delinquency rate. Yield curves used in the discounted cash flow models are based on observed market prices for comparable securities and published interest rate data to estimate market yields. |
Commercial Mortgage-Backed Securities
• | Agency Commercial Mortgage-Backed Securities ("CMBS"): Government National Mortgage Association ("GNMA") project loans are measured based on inputs corroborated from and benchmarked to observed prices of recent securitization transactions of similar securities with adjustments incorporating an evaluation for various factors, including prepayment speeds, default rates, and cash flow structures as well as the likelihood of pricing levels in the current market environment. Federal National Mortgage Association ("FNMA") Delegated Underwriting and Servicing ("DUS") mortgage-backed securities are generally measured by using prices observed for recently executed market transactions to estimate market-clearing spread levels for purposes of estimating fair value. GNMA project loan bonds and FNMA DUS mortgage-backed securities are categorized within Level 2 of the fair value hierarchy. |
• | Non-Agency CMBS: Non-agency CMBS are measured using pricing data obtained from external pricing services and prices observed for recently executed market transactions and are categorized within Level 2 and Level 3 of the fair value hierarchy. |
Other Asset-Backed Securities
Other asset-backed securities ("ABS") include, but are not limited to, securities backed by auto loans, credit card receivables, student loans and other consumer loans and are categorized within Level 2 and Level 3 of the fair value hierarchy. Valuations are primarily determined using pricing data obtained from external pricing services and broker quotes and prices observed for recently executed market transactions.
Loans and Other Receivables
• | Corporate Loans: Corporate loans categorized within Level 2 of the fair value hierarchy are measured based on market price quotations where market price quotations from external pricing services are supported by transaction data. Corporate loans categorized within Level 3 of the fair value hierarchy are measured based on price quotations that are considered to be less transparent, market prices for debt securities of the same creditor, and estimates of future cash flow incorporating assumptions regarding creditor default and recovery rates and consideration of the issuer's capital structure. |
68
Table of Contents
JEFFERIES GROUP LLC AND SUBSIDIARIES
NOTES TO CONSOLIDATED FINANCIAL STATEMENTS - CONTINUED
• | Participation Certificates in Agency Residential Loans: Valuations of participation certificates in agency residential loans are based on observed market prices of recently executed purchases and sales of similar loans. The loan participation certificates are categorized within Level 2 of the fair value hierarchy given the observability and volume of recently executed transactions and availability of data provider pricing. |
• | Project Loans and Participation Certificates in GNMA Project and Construction Loans: Valuations of participation certificates in GNMA project and construction loans are based on inputs corroborated from and benchmarked to observed prices of recent securitizations of assets with similar underlying loan collateral to derive an implied spread. Securitization prices are adjusted to estimate the fair value of the loans incorporating an evaluation for various factors, including prepayment speeds, default rates, and cash flow structures, as well as the likelihood of pricing levels in the current market environment. The measurements are categorized within Level 2 of the fair value hierarchy given the observability and volume of recently executed transactions. |
• | Consumer Loans and Funding Facilities: Consumer and small business whole loans and related funding facilities are valued based on observed market transactions incorporating additional valuation inputs including, but not limited to, delinquency and default rates, prepayment rates, borrower characteristics, loan risk grades and loan age. These assets are categorized within Level 2 or Level 3 of the fair value hierarchy. |
• | Escrow and Trade Claim Receivables: Escrow and trade claim receivables are categorized within Level 3 of the fair value hierarchy where fair value is estimated based on reference to market prices and implied yields of debt securities of the same or similar issuers. Escrow and trade claim receivables are categorized within Level 2 of the fair value hierarchy where fair value is based on recent trade activity in the same security. |
Derivatives
• | Listed Derivative Contracts: Listed derivative contracts that are actively traded are measured based on quoted exchange prices, which are generally obtained from external pricing services, and are categorized within Level 1 of the fair value hierarchy. Listed derivatives for which there is limited trading activity are measured based on incorporating the closing auction price of the underlying equity security, use similar valuation approaches as those applied to over-the-counter derivative contracts and are categorized within Level 2 of the fair value hierarchy. |
• | OTC Derivative Contracts: Over-the-counter ("OTC") derivative contracts are generally valued using models, whose inputs reflect assumptions that we believe market participants would use in valuing the derivative in a current period transaction. Inputs to valuation models are appropriately calibrated to market data. For many OTC derivative contracts, the valuation models do not involve material subjectivity as the methodologies do not entail significant judgment and the inputs to valuation models do not involve a high degree of subjectivity as the valuation model inputs are readily observable or can be derived from actively quoted markets. OTC derivative contracts are primarily categorized within Level 2 of the fair value hierarchy given the observability and significance of the inputs to the valuation models. Where significant inputs to the valuation are unobservable, derivative instruments are categorized within Level 3 of the fair value hierarchy. |
OTC options include OTC equity, foreign exchange, interest rate and commodity options measured using various valuation models, such as the Black-Scholes, with key inputs impacting the valuation including the underlying security, foreign exchange spot rate or commodity price, implied volatility, dividend yield, interest rate curve, strike price and maturity date. Discounted cash flow models are utilized to measure certain OTC derivative contracts including the valuations of our interest rate swaps, which incorporate observable inputs related to interest rate curves, valuations of our foreign exchange forwards and swaps, which incorporate observable inputs related to foreign currency spot rates and forward curves and valuations of our commodity swaps and forwards, which incorporate observable inputs related to commodity spot prices and forward curves. Credit default swaps include both index and single-name credit default swaps. External prices are available as inputs in measuring index credit default swaps and single-name credit default swaps. For commodity and equity total return swaps, market prices are observable for the underlying asset and used as the basis for measuring the fair value of the derivative contracts. Total return swaps executed on other underlyings are measured based on valuations received from external pricing services.
69
Table of Contents
JEFFERIES GROUP LLC AND SUBSIDIARIES
NOTES TO CONSOLIDATED FINANCIAL STATEMENTS - CONTINUED
Investments at Fair Value and Investments in Managed Funds
Investments at fair value based on NAV and Investments in Managed Funds include investments in hedge funds, fund of funds, private equity funds, convertible bond funds and commodity funds, which are measured at the NAV of the funds, provided by the fund managers and are excluded from the fair value hierarchy. Investments at fair value also include direct equity investments in private companies, which are measured at fair value using valuation techniques involving quoted prices of or market data for comparable companies, similar company ratios and multiples ( e.g. , price/EBITDA, price/book value), discounted cash flow analyses and transaction prices observed for subsequent financing or capital issuance by the company. Direct equity investments in private companies are categorized within Level 2 or Level 3 of the fair value hierarchy. Additionally, investments at fair value include investments in insurance contracts relating to our defined benefit plan in Germany. Fair value for the insurance contracts is determined using a third party and is categorized within Level 3 of the fair value hierarchy.
The following tables present information about our investments in entities that have the characteristics of an investment company (in thousands):
| November 30, 2016 | ||||||||
| Fair Value (1) |
| Unfunded Commitments |
| Redemption Frequency (if currently eligible) | ||||
Equity Long/Short Hedge Funds (2) | $ | 34,446 | |
| $ | - | |
| Monthly, Quarterly |
Fixed Income and High Yield Hedge Funds (3) | 772 | |
| - | |
| - | ||
Fund of Funds (4) | 230 | |
| - | |
| - | ||
Equity Funds (5) | 42,179 | |
| 20,295 | |
| - | ||
Multi-asset Funds (6) | 133,190 | |
| - | |
| - | ||
Total | $ | 210,817 | |
| $ | 20,295 | |
|
|
| November 30, 2015 (7) | ||||||||
| Fair Value (1) |
| Unfunded Commitments |
| Redemption Frequency (if currently eligible) | ||||
Equity Long/Short Hedge Funds (2) | $ | 54,725 | |
| $ | - | |
| Monthly, Quarterly |
Fixed Income and High Yield Hedge Funds (3) | 1,703 | |
| - | |
| - | ||
Fund of Funds (4) | 287 | |
| 94 | |
| - | ||
Equity Funds (5) | 42,111 | |
| 20,791 | |
| - | ||
Multi-asset Funds (6) | 23,358 | |
| - | |
| Monthly, Quarterly | ||
Convertible Bond Funds (8) | 326 | |
| - | |
| At Will | ||
Total | $ | 122,510 | |
| $ | 20,885 | |
|
|
(1) | Where fair value is calculated based on NAV, fair value has been derived from each of the funds' capital statements. |
(2) | This category includes investments in hedge funds that invest, long and short, primarily in equity securities in domestic and international markets in both the public and private sectors. At November 30, 2016 , approximately 2% of the fair value of investments in this category is classified as being in liquidation. |
(3) | This category includes investments in funds that invest in loans secured by a first trust deed on property, domestic and international public high yield debt, private high yield investments, senior bank loans, public leveraged equities, distressed debt, and private equity investments. There are no redemption provisions. At November 30, 2015 , the underlying assets of 8% of these funds were being liquidated and we are unable to estimate when the underlying assets will be fully liquidated. |
(4) | This category includes investments in fund of funds that invest in various private equity funds. At November 30, 2016 and 2015 , approximately 100% and 95% , respectively, of the fair value of investments in this category are managed by us and have no redemption provisions. The investments in this category are gradually being liquidated or we have requested redemption; however, we are unable to estimate when these funds will be received. |
(5) | At November 30, 2016 and 2015 , the fair value of investments in this category include investments in equity funds that invest in the equity of various U.S. and foreign private companies in the energy, technology, internet service and telecommunication service industries. These investments cannot be redeemed; instead, distributions are received through the liquidation of the underlying assets of the funds which are expected to liquidate in one to seven years. |
70
Table of Contents
JEFFERIES GROUP LLC AND SUBSIDIARIES
NOTES TO CONSOLIDATED FINANCIAL STATEMENTS - CONTINUED
(6) | This category includes investments in hedge funds that invest long and short, primarily in multi-asset securities in domestic and international markets in both the public and private sectors. At November 30, 2016 and 2015 , investments representing approximately 12% and 100% , respectively, of the fair value of investments in this category are redeemable with 30 - 90 days prior written notice. |
(7) | Prior period amounts have been recast to conform to the current year's presentation due to the presentation of multi-asset funds. Previously, these investments had been classified within equity long/short hedge funds. |
(8) | This category represents an investment in the Jefferies Umbrella Fund, an open-ended investment company managed by us that invested primarily in convertible bonds. The underlying assets were fully liquidated during the year ended November 30, 2016 . |
Other Secured Financings
Other secured financings that are accounted for at fair value include notes issued by consolidated VIEs, which are classified as Level 2 or Level 3 within the fair value hierarchy. Fair value is based on recent transaction prices for similar assets.
Long-term Debt-Structured Notes
Long-term debt includes variable rate and fixed to floating rate structured notes that contain various interest rate payment terms and are generally measured using valuation models for the derivative and debt portions of the notes. These models incorporate market price quotations from external pricing sources referencing the appropriate interest rate curves and are generally categorized within Level 2 of the fair value hierarchy. The impact of the Company's own credit spreads is also included based on observed secondary bond market spreads and asset-swap spreads.
Long-term Debt-Embedded Conversion Option
The embedded conversion option presented within long-term debt represents the fair value of the conversion option on Leucadia shares within our 3.875% Convertible Senior Debentures, due November 1, 2029 and categorized as Level 3 within the fair value hierarchy. The conversion option was valued using a convertible bond model using as inputs the price of Leucadia's common stock, the conversion strike price, 252 -day historical volatility, a maturity date of November 1, 2017 (the first put date), dividend yield and the risk-free interest rate curve.
71
Table of Contents
JEFFERIES GROUP LLC AND SUBSIDIARIES
NOTES TO CONSOLIDATED FINANCIAL STATEMENTS - CONTINUED
The following is a summary of changes in fair value of our financial assets and liabilities that have been categorized within Level 3 of the fair value hierarchy for the year ended November 30, 2016 (in thousands):
| Year Ended November 30, 2016 | ||||||||||||||||||||||||||||||||||
| Balance at November 30, 2015 |
| Total gains/ losses (realized and unrealized) (1) |
| Purchases |
| Sales |
| Settlements |
| Issuances |
| Net transfers into/ (out of) Level 3 |
| Balance at November 30, 2016 |
| Change in unrealized gains/ (losses) relating to instruments still held at November 30, 2016 (1) | ||||||||||||||||||
Assets: |
|
|
|
|
|
|
|
|
|
|
|
|
|
|
|
|
| ||||||||||||||||||
Financial instruments owned: |
|
|
|
|
|
|
|
|
|
|
|
|
|
|
|
|
| ||||||||||||||||||
Corporate equity securities | $ | 40,906 | |
| $ | (8,463 | ) |
| $ | 3,365 | |
| $ | (49 | ) |
| $ | (671 | ) |
| $ | - | |
| $ | (13,349 | ) |
| $ | 21,739 | |
| $ | 291 | |
Corporate debt securities | 25,876 | |
| (16,230 | ) |
| 27,242 | |
| (29,347 | ) |
| (7,223 | ) |
| - | |
| 24,687 | |
| 25,005 | |
| (18,799 | ) | |||||||||
CDOs and CLOs | 85,092 | |
| (14,918 | ) |
| 52,316 | |
| (69,394 | ) |
| (2,750 | ) |
| - | |
| 4,008 | |
| 54,354 | |
| (7,628 | ) | |||||||||
Municipal securities | - | |
| (1,462 | ) |
| - | |
| - | |
| - | |
| - | |
| 28,719 | |
| 27,257 | |
| (1,462 | ) | |||||||||
Sovereign obligations | 120 | |
| 5 | |
| - | |
| (125 | ) |
| - | |
| - | |
| - | |
| - | |
| - | | |||||||||
RMBS | 70,263 | |
| (9,612 | ) |
| 623 | |
| (12,249 | ) |
| (931 | ) |
| - | |
| (9,322 | ) |
| 38,772 | |
| (1,095 | ) | |||||||||
CMBS | 14,326 | |
| (7,550 | ) |
| 3,132 | |
| (2,024 | ) |
| (2,229 | ) |
| - | |
| 14,925 | |
| 20,580 | |
| (7,243 | ) | |||||||||
Other ABS | 42,925 | |
| (14,381 | ) |
| 133,986 | |
| (102,952 | ) |
| (8,769 | ) |
| - | |
| (9,898 | ) |
| 40,911 | |
| (18,056 | ) | |||||||||
Loans and other receivables | 189,289 | |
| (42,566 | ) |
| 75,264 | |
| (69,262 | ) |
| (46,851 | ) |
| - | |
| (24,002 | ) |
| 81,872 | |
| (52,003 | ) | |||||||||
Investments at fair value | 53,120 | |
| (13,278 | ) |
| 26,228 | |
| (542 | ) |
| (1,107 | ) |
| - | |
| 31,948 | |
| 96,369 | |
| (13,208 | ) | |||||||||
Liabilities: |
|
|
|
|
|
|
|
|
|
|
|
|
|
|
|
|
| ||||||||||||||||||
Financial instruments sold, not yet purchased: |
|
|
|
|
|
|
|
|
|
|
|
|
|
|
|
|
| ||||||||||||||||||
Corporate equity securities | $ | 38 | |
| $ | - | |
| $ | - | |
| $ | 313 | |
| $ | (38 | ) |
| $ | - | |
| $ | - | |
| $ | 313 | |
| $ | - | |
Corporate debt securities | - | |
| (27 | ) |
| - | |
| 550 | |
| - | |
| - | |
| - | |
| 523 | |
| - | | |||||||||
Net derivatives (2) | (242 | ) |
| (1,760 | ) |
| - | |
| 11,101 | |
| 31 | |
| 2,067 | |
| (7,756 | ) |
| 3,441 | |
| (6,458 | ) | |||||||||
Loans | 10,469 | |
| - | |
| - | |
| 378 | |
| - | |
| - | |
| (10,469 | ) |
| 378 | |
| - | | |||||||||
Other secured financings | 544 | |
| (126 | ) |
| - | |
| - | |
| - | |
| - | |
| - | |
| 418 | |
| (126 | ) | |||||||||
(1) | Realized and unrealized gains/losses are reported in Principal transaction revenues in the Consolidated Statements of Earnings. |
(2) | Net derivatives represent Financial instruments owned-Derivatives and Financial instruments sold, not yet purchased -Derivatives. |
Analysis of Level 3 Assets and Liabilities for the Year Ended November 30, 2016
During the year ended November 30, 2016 , transfers of assets of $179.6 million from Level 2 to Level 3 of the fair value hierarchy are primarily attributed to:
• | CDOs and CLOs of $19.4 million , RMBS of $17.5 million , CMBS of $17.4 million and other ABS of $16.9 million , for which no recent trade activity was observed for purposes of determining observable inputs; |
• | Loans and other receivables of $13.8 million due to a lower number of contributors for certain vendor quotes supporting classification within Level 2; |
• | Investments at fair value of $31.9 million , municipal securities of $28.7 million and corporate debt securities of $28.1 million due to a lack of observable market transactions. |
During the year ended November 30, 2016 , transfers of assets of $133.2 million from Level 3 to Level 2 are primarily attributed to:
• | RMBS of $26.8 million , other ABS of $26.8 million and CDOs and CLOs of $15.4 million , for which market trades were observed in the year for either identical or similar securities; |
72
Table of Contents
JEFFERIES GROUP LLC AND SUBSIDIARIES
NOTES TO CONSOLIDATED FINANCIAL STATEMENTS - CONTINUED
• | Loans and other receivables of $37.8 million due to a greater number of contributors for certain vendor quotes supporting classification into Level 2; |
• | Corporate equity securities of $19.2 million due to an increase in observable market transactions. |
There were $10.5 million transfers of loan liabilities from Level 3 to Level 2 due to an increase in observable inputs in the valuation.
Net losses on Level 3 assets were $128.5 million and net gains on Level 3 net liabilities were $1.9 million for the year ended November 30, 2016 . Net losses on Level 3 assets were primarily due to decreased valuations of loans and other receivables, corporate debt securities, CDOs and CLOs, other ABS, certain investments at fair value, RMBS, corporate equity securities and CMBS. Net gains on Level 3 net liabilities were primarily due to increased valuations of certain net derivatives.
The following is a summary of changes in fair value of our financial assets and liabilities that have been categorized within Level 3 of the fair value hierarchy for the year ended November 30, 2015 (in thousands):
| Year Ended November 30, 2015 | ||||||||||||||||||||||||||||||||||
| Balance at November 30, 2014 |
| Total gains/ losses (realized and unrealized) (1) |
| Purchases |
| Sales |
| Settlements |
| Issuances |
| Net transfers into/ |
| Balance at November 30, 2015 |
| Change in unrealized gains/ (losses) relating to instruments still held at November 30, 2015 (1) | ||||||||||||||||||
Assets: |
|
|
|
|
|
|
|
|
|
|
|
|
|
|
|
|
| ||||||||||||||||||
Financial instruments owned: |
|
|
|
|
|
|
|
|
|
|
|
|
|
|
|
|
| ||||||||||||||||||
Corporate equity securities | $ | 20,964 | |
| $ | 11,154 | |
| $ | 21,385 | |
| $ | (6,391 | ) |
| $ | - | |
| $ | - | |
| $ | (6,206 | ) |
| $ | 40,906 | |
| $ | 11,424 | |
Corporate debt securities | 22,766 | |
| (11,013 | ) |
| 21,534 | |
| (14,636 | ) |
| - | |
| - | |
| 7,225 | |
| 25,876 | |
| (9,443 | ) | |||||||||
CDOs and CLOs | 124,650 | |
| (66,332 | ) |
| 104,998 | |
| (107,381 | ) |
| (5,754 | ) |
| - | |
| 34,911 | |
| 85,092 | |
| (48,514 | ) | |||||||||
Municipal securities | - | |
| 10 | |
| - | |
| - | |
| (21,551 | ) |
| - | |
| 21,541 | |
| - | |
| - | | |||||||||
Sovereign obligations | - | |
| 47 | |
| 1,032 | |
| (1,031 | ) |
| - | |
| - | |
| 72 | |
| 120 | |
| 39 | | |||||||||
RMBS | 82,557 | |
| (12,951 | ) |
| 18,961 | |
| (31,762 | ) |
| (597 | ) |
| - | |
| 14,055 | |
| 70,263 | |
| (4,498 | ) | |||||||||
CMBS | 26,655 | |
| (3,813 | ) |
| 3,480 | |
| (10,146 | ) |
| (6,861 | ) |
| - | |
| 5,011 | |
| 14,326 | |
| (3,205 | ) | |||||||||
Other ABS | 2,294 | |
| (990 | ) |
| 42,922 | |
| (1,299 | ) |
| (2 | ) |
| - | |
| - | |
| 42,925 | |
| (254 | ) | |||||||||
Loans and other receivables | 97,258 | |
| (14,755 | ) |
| 792,345 | |
| (576,536 | ) |
| (124,365 | ) |
| - | |
| 15,342 | |
| 189,289 | |
| (16,802 | ) | |||||||||
Investments at fair value | 53,224 | |
| 64,380 | |
| 5,510 | |
| (124,852 | ) |
| (4,093 | ) |
| - | |
| 58,951 | |
| 53,120 | |
| (388 | ) | |||||||||
Liabilities: |
|
|
|
|
|
|
|
|
|
|
|
|
|
|
|
|
| ||||||||||||||||||
Financial instruments sold, not yet purchased: |
|
|
|
|
|
|
|
|
|
|
|
|
|
|
|
|
| ||||||||||||||||||
Corporate equity securities | $ | 38 | |
| $ | - | |
| $ | - | |
| $ | - | |
| $ | - | |
| $ | - | |
| $ | - | |
| $ | 38 | |
| $ | - | |
Corporate debt securities | 223 | |
| (110 | ) |
| (6,804 | ) |
| 6,691 | |
| - | |
| - | |
| - | |
| - | |
| - | | |||||||||
Net derivatives (2) | (4,638 | ) |
| (7,310 | ) |
| (6,705 | ) |
| 13,522 | |
| 37 | |
| 2,437 | |
| 2,415 | |
| (242 | ) |
| 4,754 | | |||||||||
Loans | 14,450 | |
| (163 | ) |
| (2,059 | ) |
| 229 | |
| - | |
| - | |
| (1,988 | ) |
| 10,469 | |
| 104 | | |||||||||
Other secured financings | 30,825 | |
| - | |
| - | |
| - | |
| (15,704 | ) |
| 36,995 | |
| (51,572 | ) |
| 544 | |
| - | | |||||||||
Embedded conversion option | 693 | |
| (693 | ) |
| - | |
| - | |
| - | |
| - | |
| - | |
| - | |
| 693 | | |||||||||
(1) | Realized and unrealized gains/losses are reported in Principal transaction revenues in the Consolidated Statements of Earnings. |
(2) | Net derivatives represent Financial instruments owned-Derivatives and Financial instruments sold, not yet purchased -Derivatives. |
Analysis of Level 3 Assets and Liabilities for the Year Ended November 30, 2015
During the year ended November 30, 2015 , transfers of assets of $236.7 million from Level 2 to Level 3 of the fair value hierarchy are primarily attributed to:
73
Table of Contents
JEFFERIES GROUP LLC AND SUBSIDIARIES
NOTES TO CONSOLIDATED FINANCIAL STATEMENTS - CONTINUED
• | CDOs and CLOs of $69.8 million , non-agency RMBS of $30.4 million and CMBS of $11.3 million , for which no recent trade activity was observed for purposes of determining observable inputs; |
• | Municipal securities of $21.5 million and loans and other receivables of $20.1 million due to a lower number of contributors comprising vendor quotes to support classification within Level 2; |
• | Investments at fair value of $74.7 million and corporate debt securities of $7.4 million due to a lack of observable market transactions. |
During the year ended November 30, 2015 , transfers of assets of $85.8 million from Level 3 to Level 2 are primarily attributed to:
• | Non-agency RMBS of $16.3 million and CMBS of $6.3 million , for which market trades were observed in the period for either identical or similar securities; |
• | CDOs and CLOs of $34.9 million and loans and other receivables of $4.7 million due to a greater number of contributors for certain vendor quotes supporting classification into Level 2; |
• | Investments at fair value of $15.8 million due to an increase in observable market transactions; |
• | Corporate equity securities of $7.7 million due to an increase in observable market transactions. |
During the year ended November 30, 2015 , there were $51.6 million transfers of other secured financings from Level 3 to Level 2 due to an increase in observable inputs in the valuation.
Net losses on Level 3 assets were $34.3 million and net gains on Level 3 net liabilities were $8.3 million for the year ended November 30, 2015 . Net losses on Level 3 assets were primarily due to decreased valuations of CDOs and CLOs, certain loans and other receivables, RMBS and CMBS, partially offset by increased valuations of certain investments at fair value and corporate equity securities. Net gains on Level 3 liabilities were primarily due to decreased valuations of certain derivative liabilities.
74
Table of Contents
JEFFERIES GROUP LLC AND SUBSIDIARIES
NOTES TO CONSOLIDATED FINANCIAL STATEMENTS - CONTINUED
The following is a summary of changes in fair value of our financial assets and liabilities that have been categorized within Level 3 of the fair value hierarchy for the year ended November 30, 2014 (in thousands):
| Year Ended November 30, 2014 | ||||||||||||||||||||||||||||||||||
| Balance at November 30, 2013 |
| Total gains/ losses (realized and unrealized) (1) |
| Purchases |
| Sales |
| Settlements |
| Issuances |
| Net transfers into/ (out of) Level 3 |
| Balance at November 30, 2014 |
| Change in unrealized gain/ (losses) relating to instruments still held at November 30, 2014 (1) | ||||||||||||||||||
Assets: |
|
|
|
|
|
|
|
|
|
|
|
|
|
|
|
|
| ||||||||||||||||||
Financial instruments owned: |
|
|
|
|
|
|
|
|
|
|
|
|
|
|
|
|
| ||||||||||||||||||
Corporate equity securities | $ | 9,884 | |
| $ | 957 | |
| $ | 18,138 | |
| $ | (12,826 | ) |
| $ | - | |
| $ | - | |
| $ | 4,811 | |
| $ | 20,964 | |
| $ | 2,324 | |
Corporate debt securities | 25,666 | |
| 6,629 | |
| 38,316 | |
| (40,328 | ) |
| - | |
| - | |
| (7,517 | ) |
| 22,766 | |
| 8,982 | | |||||||||
CDOs and CLOs | 37,216 | |
| (6,386 | ) |
| 204,337 | |
| (181,757 | ) |
| (1,297 | ) |
| - | |
| 72,537 | |
| 124,650 | |
| (1,141 | ) | |||||||||
U.S. government and federal agency securities | - | |
| 13 | |
| 2,505 | |
| (2,518 | ) |
| - | |
| - | |
| - | |
| - | |
| - | | |||||||||
RMBS | 105,492 | |
| (9,870 | ) |
| 42,632 | |
| (61,689 | ) |
| (1,847 | ) |
| - | |
| 7,839 | |
| 82,557 | |
| (4,679 | ) | |||||||||
CMBS | 17,568 | |
| (4,237 | ) |
| 49,159 | |
| (51,360 | ) |
| (782 | ) |
| - | |
| 16,307 | |
| 26,655 | |
| (2,384 | ) | |||||||||
Other ABS | 12,611 | |
| 1,784 | |
| 4,987 | |
| (18,002 | ) |
| - | |
| - | |
| 914 | |
| 2,294 | |
| 1,484 | | |||||||||
Loans and other receivables | 145,890 | |
| (31,311 | ) |
| 130,169 | |
| (92,140 | ) |
| (60,390 | ) |
| - | |
| 5,040 | |
| 97,258 | |
| (26,864 | ) | |||||||||
Investments, at fair value | 66,931 | |
| 13,781 | |
| 32,493 | |
| (43,286 | ) |
| (1,243 | ) |
| - | |
| (15,452 | ) |
| 53,224 | |
| (1,876 | ) | |||||||||
Liabilities: |
|
|
|
|
|
|
|
|
|
|
|
|
|
|
|
|
| ||||||||||||||||||
Financial instruments sold, not yet purchased: |
|
|
|
|
|
|
|
|
|
|
|
|
|
|
|
|
| ||||||||||||||||||
Corporate equity securities | $ | 38 | |
| $ | - | |
| $ | - | |
| $ | - | |
| $ | - | |
| $ | - | |
| $ | - | |
| $ | 38 | |
| $ | - | |
Corporate debt securities | - | |
| (149 | ) |
| (565 | ) |
| 960 | |
| - | |
| - | |
| (23 | ) |
| 223 | |
| (8 | ) | |||||||||
Net derivatives (2) | 6,905 | |
| 15,055 | |
| (24,682 | ) |
| 1,094 | |
| 322 | |
| - | |
| (3,332 | ) |
| (4,638 | ) |
| (15,615 | ) | |||||||||
Loans | 22,462 | |
| - | |
| (18,332 | ) |
| 11,338 | |
| - | |
| - | |
| (1,018 | ) |
| 14,450 | |
| - | | |||||||||
Other secured financings | 8,711 | |
| - | |
| - | |
| - | |
| (17,525 | ) |
| 39,639 | |
| - | |
| 30,825 | |
| - | | |||||||||
Embedded conversion option | 9,574 | |
| (8,881 | ) |
| - | |
| - | |
| - | |
| - | |
| - | |
| 693 | |
| 8,881 | | |||||||||
(1) | Realized and unrealized gains/losses are reported in Principal transaction revenues in the Consolidated Statements of Earnings. |
(2) | Net derivatives represent Financial instruments owned-Derivatives and Financial instruments sold, not yet purchased -Derivatives. |
Analysis of Level 3 Assets and Liabilities for the Year Ended November 30, 2014
During the year ended November 30, 2014 , transfers of assets of $139.0 million from Level 2 to Level 3 of the fair value hierarchy are attributed to:
• | Non-agency RMBS of $30.3 million and CMBS of $16.6 million , for which no recent trade activity was observed for purposes of determining observable inputs; |
• | Loans and other receivables of $8.5 million due to a lower number of contributors comprising vendor quotes to support classification within Level 2; |
• | CDOs and CLOs of $73.0 million which have little to no transparency related to trade activity. |
• | Corporate equity securities of $9.7 million due to a lack of observable market transactions. |
75
Table of Contents
JEFFERIES GROUP LLC AND SUBSIDIARIES
NOTES TO CONSOLIDATED FINANCIAL STATEMENTS - CONTINUED
During the year ended November 30, 2014 , transfers of assets of $54.6 million from Level 3 to Level 2 are attributed to:
• | Non-agency RMBS of $22.4 million , for which market trades were observed in the period for either identical or similar securities; |
• | Loans and other receivables of $3.5 million and investments at fair value of $15.5 million due to a greater number of contributors for certain vendor quotes supporting classification into Level 2; |
• | Corporate equity securities of $4.9 million and corporate debt securities of $7.5 million due to an increase in observable market transactions. |
During the year ended November 30, 2014 , there were transfers of loan liabilities of $1.0 million from Level 3 to Level 2 and $3.3 million of net derivative liabilities from Level 3 to Level 2 due to an increase in observable inputs in the valuation and an increase in observable inputs used in valuing of derivative contracts, respectively.
Net losses on Level 3 assets were $28.6 million and net losses on Level 3 liabilities were $6.0 million for the year ended November 30, 2014 . Net losses on Level 3 assets were primarily due to a decrease in valuation of certain loans and other receivables, RMBS and CMBS, partially offset by increased valuations of certain investments at fair value, certain corporate debt securities and other ABS. Net losses on Level 3 liabilities were primarily due to increased valuations of certain derivatives, partially offset by decreased valuations of the embedded conversion option.
Quantitative Information about Significant Unobservable Inputs used in Level 3 Fair Value Measurements at November 30, 2016 and 2015
The tables below present information on the valuation techniques, significant unobservable inputs and their ranges for our financial assets and liabilities, subject to threshold levels related to the market value of the positions held, measured at fair value on a recurring basis with a significant Level 3 balance. The range of unobservable inputs could differ significantly across different firms given the range of products across different firms in the financial services sector. The inputs are not representative of the inputs that could have been used in the valuation of any one financial instrument ( i.e., the input used for valuing one financial instrument within a particular class of financial instruments may not be appropriate for valuing other financial instruments within that given class). Additionally, the ranges of inputs presented below should not be construed to represent uncertainty regarding the fair values of our financial instruments; rather, the range of inputs is reflective of the differences in the underlying characteristics of the financial instruments in each category.
For certain categories, we have provided a weighted average of the inputs allocated based on the fair values of the financial instruments comprising the category. We do not believe that the range or weighted average of the inputs is indicative of the reasonableness of uncertainty of our Level 3 fair values. The range and weighted average are driven by the individual financial instruments within each category and their relative distribution in the population. The disclosed inputs when compared with the inputs as disclosed in other periods should not be expected to necessarily be indicative of changes in our estimates of unobservable inputs for a particular financial instrument as the population of financial instruments comprising the category will vary from period to period based on purchases and sales of financial instruments during the period as well as transfers into and out of Level 3 each period.
76
Table of Contents
JEFFERIES GROUP LLC AND SUBSIDIARIES
NOTES TO CONSOLIDATED FINANCIAL STATEMENTS - CONTINUED
November 30, 2016 | ||||||||||||||
Financial Instruments Owned |
| Fair Value (in thousands) |
| Valuation Technique |
| Significant Unobservable Input(s) |
| Input / Range |
| Weighted Average | ||||
Corporate equity securities |
| $ | 19,799 | |
|
|
|
|
|
|
|
| ||
Non-exchange traded securities |
| Market approach |
| Underlying stock price |
| $3-$75 |
| $ | 15 | | ||||
|
|
|
| Comparable pricing |
| Underlying stock price |
| $218 |
| - | | |||
|
|
|
|
|
| Comparable asset price |
| $11 |
| - | | |||
|
|
|
| Present value |
| Average silver production (tons per day) |
| 666 |
| - | | |||
Corporate debt securities |
| $ | 25,005 | |
|
|
|
|
|
|
|
| ||
|
|
|
| Convertible bond model |
| Discount rate/yield |
| 9% |
| - | | |||
|
|
|
|
|
| Volatility |
| 40% |
| - | | |||
|
|
|
| Market approach |
| Transaction level |
| $30 |
| - | | |||
CDOs and CLOs |
| $ | 33,016 | |
| Discounted cash flows |
| Constant prepayment rate |
| 10%-20% |
| 19 | % | |
|
|
|
|
|
| Constant default rate |
| 2%-4% |
| 2 | % | |||
|
|
|
|
|
| Loss severity |
| 25%-70% |
| 40 | % | |||
|
|
|
|
|
| Yield |
| 7%-17% |
| 12 | % | |||
|
|
|
| Scenario analysis |
| Estimated recovery percentage |
| 28%-38% |
| 31 | % | |||
RMBS |
| $ | 38,772 | |
| Discounted cash flows |
| Constant prepayment rate |
| 0%-11% |
| 5 | % | |
|
|
|
|
|
| Constant default rate |
| 1%-7% |
| 3 | % | |||
|
|
|
|
|
| Loss severity |
| 35%-100% |
| 62 | % | |||
|
|
|
|
|
| Yield |
| 2%-10% |
| 6 | % | |||
CMBS |
| $ | 20,580 | |
| Discounted cash flows |
| Yield |
| 6%-11% |
| 8 | % | |
|
|
|
|
|
| Cumulative loss rate |
| 5%-95% |
| 39 | % | |||
Other ABS |
| $ | 40,911 | |
| Discounted cash flows |
| Constant prepayment rate |
| 4%-20% |
| 14 | % | |
|
|
|
|
|
| Constant default rate |
| 0%-31% |
| 13 | % | |||
|
|
|
|
|
| Loss severity |
| 0%-100% |
| 90 | % | |||
|
|
|
|
|
| Yield |
| 4%-17% |
| 15 | % | |||
|
|
|
| Market approach |
| Price |
| $72 |
| - | | |||
Loans and other receivables |
| $ | 54,347 | |
| Market approach |
| EBITDA (a) multiple |
| 3.3 |
| - | | |
|
|
|
|
|
| Discount rate/yield |
| 2%-4% |
| 3 | % | |||
|
|
|
|
|
| Transaction level |
| $0.42 |
| - | | |||
|
|
|
| Present value |
| Average silver production (tons per day) |
| 666 |
| - | | |||
|
|
|
| Scenario analysis |
| Estimated recovery percentage |
| 6%-50% |
| 37 | % | |||
Derivatives |
| $ | 6,429 | |
|
|
|
|
|
|
|
| ||
Equity swaps |
|
|
| Comparable pricing |
| Comparable asset price |
| $102 |
| - | | |||
Credit default swaps |
| Market approach |
| Credit spread |
| 265 bps |
| - | | |||||
Investments at fair value |
|
|
|
|
|
|
|
|
|
| ||||
Private equity securities |
| $ | 42,907 | |
| Market approach |
| Transaction level |
| $250 |
| - | | |
|
|
|
|
|
| Price |
| $25,815,720 |
| - | | |||
Liabilities |
|
|
|
|
|
|
|
|
|
| ||||
Financial Instruments Sold, Not Yet Purchased: |
|
|
|
|
|
| ||||||||
Derivatives |
| $ | 9,870 | |
|
|
|
|
|
|
|
| ||
Equity options |
|
|
| Option model |
| Volatility |
| 45% |
| - | | |||
|
|
|
| Default rate |
| Default probability |
| 0% |
| - | | |||
Equity swaps |
|
|
| Comparable pricing |
| Comparable asset price |
| $102 |
| - | | |||
Unfunded commitments |
|
|
| Market approach |
| Discount rate/yield |
| 4% |
| - | | |||
Variable funding note swaps |
|
|
| Discounted cash flows |
| Constant prepayment rate |
| 20% |
| - | | |||
|
|
|
|
|
| Constant default rate |
| 2% |
| - | | |||
|
|
|
|
|
| Loss severity |
| 25% |
| - | | |||
|
|
|
|
|
| Yield |
| 16% |
| - | | |||
(a) Earnings before interest, taxes, depreciation and amortization ("EBITDA").
77
Table of Contents
JEFFERIES GROUP LLC AND SUBSIDIARIES
NOTES TO CONSOLIDATED FINANCIAL STATEMENTS - CONTINUED
November 30, 2015 | ||||||||||||||
Financial Instruments Owned |
| Fair Value (in thousands) |
| Valuation Technique |
| Significant Unobservable Input(s) |
| Input / Range |
| Weighted Average | ||||
Corporate equity securities |
| $ | 20,285 | |
|
|
|
|
|
|
|
| ||
Non-exchange traded securities |
| Market approach |
| EBITDA multiple |
| 4.4 |
| - | | |||||
|
|
|
|
|
| Transaction level |
| $1 |
| - | | |||
|
|
|
|
|
| Underlying stock price |
| $5-$102 |
| $ | 19 | | ||
Corporate debt securities |
| $ | 20,257 | |
| Convertible bond model |
| Discount rate/yield |
| 86% |
| - | | |
|
|
|
| Market approach |
| Transaction level |
| $59 |
| - | | |||
CDOs and CLOs |
| $ | 49,923 | |
| Discounted cash flows |
| Constant prepayment rate |
| 5%-20% |
| 13 | % | |
|
|
|
|
|
| Constant default rate |
| 2%-8% |
| 2 | % | |||
|
|
|
|
|
| Loss severity |
| 25%-90% |
| 52 | % | |||
|
|
|
|
|
| Yield |
| 6%-13% |
| 10 | % | |||
RMBS |
| $ | 70,263 | |
| Discounted cash flows |
| Constant prepayment rate |
| 0%-50% |
| 13 | % | |
|
|
|
|
|
| Constant default rate |
| 1%-9% |
| 3 | % | |||
|
|
|
|
|
| Loss severity |
| 25%-70% |
| 39 | % | |||
|
|
|
|
|
| Yield |
| 1%-9% |
| 6 | % | |||
CMBS |
| $ | 14,326 | |
| Discounted cash flows |
| Yield |
| 7%-30% |
| 16 | % | |
|
|
|
|
|
| Cumulative loss rate |
| 2%-63% |
| 23 | % | |||
Other ABS |
| $ | 21,463 | |
| Discounted cash flows |
| Constant prepayment rate |
| 6%-8% |
| 7 | % | |
|
|
|
|
|
| Constant default rate |
| 3%-5% |
| 4 | % | |||
|
|
|
|
|
| Loss severity |
| 55%-75% |
| 62 | % | |||
|
|
|
|
|
| Yield |
| 7%-22% |
| 18 | % | |||
|
|
|
| Over-collateralization |
| Over-collateralization percentage |
| 117%-125% |
| 118 | % | |||
Loans and other receivables |
| $ | 161,470 | |
| Comparable pricing |
| Comparable asset price |
| $99-$100 |
| $ | 99.7 | |
|
|
|
| Market approach |
| Discount rate/yield |
| 2%-17% |
| 12 | % | |||
|
|
|
|
|
| EBITDA multiple |
| 10.0 |
| - | | |||
|
|
|
| Scenario analysis |
| Estimated recovery percentage |
| 6%-100% |
| 83 | % | |||
Derivatives |
| $ | 19,785 | |
|
|
|
|
|
|
|
| ||
Commodity forwards |
|
|
| Market approach |
| Discount rate/yield |
| 47% |
| - | | |||
|
|
|
|
|
| Transaction level |
| $9,500,000 |
| - | | |||
Unfunded commitments |
|
|
| Comparable pricing |
| Comparable asset price |
| $100 |
| - | | |||
|
|
|
| Market approach |
| Credit spread |
| 298 bps |
| - | | |||
Total return swaps |
|
|
| Comparable pricing |
| Comparable asset price |
| $91.7-$92.4 |
| $ | 92.1 | | ||
Investments at fair value |
| $ | 7,693 | |
|
|
|
|
|
|
|
| ||
Private equity securities |
|
|
| Market approach |
| Transaction level |
| $64 |
| - | | |||
|
|
|
|
|
| Price |
| $5,200,000 |
| - | | |||
Liabilities |
|
|
|
|
|
|
|
|
|
| ||||
Financial Instruments Sold, Not Yet Purchased: |
|
|
|
|
|
| ||||||||
Derivatives |
| $ | 19,543 | |
|
|
|
|
|
|
|
| ||
Equity options |
|
|
| Option model |
| Volatility |
| 45% |
| - | | |||
|
|
|
| Default rate |
| Default probability |
| 0% |
| - | | |||
Unfunded commitments |
|
|
| Comparable pricing |
| Comparable asset price |
| $79-$100 |
| $ | 82.6 | | ||
|
|
|
| Market approach |
| Discount rate/yield |
| 3%-10% |
| 10 | % | |||
|
|
|
| Discounted cash flows |
| Constant prepayment rate |
| 20% |
| - | | |||
|
|
|
|
|
| Constant default rate |
| 2% |
| - | | |||
|
|
|
|
|
| Loss severity |
| 25% |
| - | | |||
|
|
|
|
|
| Yield |
| 11% |
| - | | |||
Total return swaps |
|
|
| Comparable pricing |
| Comparable asset price |
| $91.7-92.4 |
| $ | 92.1 | | ||
Loans and other receivables |
| $ | 10,469 | |
| Comparable pricing |
| Comparable asset price |
| $100 |
| - | | |
The fair values of certain Level 3 assets and liabilities that were determined based on third-party pricing information, unadjusted past transaction prices, reported NAV or a percentage of the reported enterprise fair value are excluded from the above tables. At November 30, 2016 and 2015 , asset exclusions consisted of $131.5 million and $156.2 million , respectively, primarily comprised of private equity securities, CDOs and CLOs, municipal securities, non-exchange traded securities and loans and other receivables. At November 30, 2016 and 2015 , liability exclusions consisted of $1.6 million and $0.6 million , respectively, of other secured financings, loans and other receivables, and corporate debt and equity securities.
78
Table of Contents
JEFFERIES GROUP LLC AND SUBSIDIARIES
NOTES TO CONSOLIDATED FINANCIAL STATEMENTS - CONTINUED
Sensitivity of Fair Values to Changes in Significant Unobservable Inputs
For recurring fair value measurements categorized within Level 3 of the fair value hierarchy, the sensitivity of the fair value measurement to changes in significant unobservable inputs and interrelationships between those unobservable inputs (if any) are described below:
• | Loans and other receivables, unfunded commitments, non-exchange traded securities, equity swaps and total return swaps using comparable pricing valuation techniques. A significant increase (decrease) in the comparable asset and underlying stock price in isolation would result in a significantly higher (lower) fair value measurement. |
• | Corporate debt securities using a convertible bond model. A significant increase (decrease) in the bond discount rate/yield would result in a significantly lower (higher) fair value measurement. A significant increase (decrease) in volatility would result in a significantly higher (lower) fair value measurement. |
• | Non-exchange traded securities, corporate debt securities, loans and other receivables, unfunded commitments, commodity forwards, credit default swaps, other ABS and private equity securities using a market approach valuation technique. A significant increase (decrease) in the EBITDA or other multiples in isolation would result in a significantly higher (lower) fair value measurement. A significant increase (decrease) in the discount rate/yield of a loan and other receivable or certain derivatives would result in a significantly lower (higher) fair value measurement. A significant increase (decrease) in the transaction level of a private equity security, non-exchange traded security, corporate debt security, loan and other receivable or certain derivatives would result in a significantly higher (lower) fair value measurement. A significant increase (decrease) in the underlying stock price of the non-exchange traded securities would result in a significantly higher (lower) fair value measurement. A significant increase (decrease) in the credit spread of certain derivatives would result in a significantly lower (higher) fair value measurement. A significant increase (decrease) in the price of the private equity securities or other asset backed securities would result in a significantly higher (lower) fair value measurement. |
• | Loans and other receivables and CDOs and CLOs using scenario analysis. A significant increase (decrease) in the possible recovery rates of the cash flow outcomes underlying the investment would result in a significantly higher (lower) fair value measurement for the financial instrument. |
• | CDOs and CLOs, RMBS and CMBS and other ABS, variable funding notes and unfunded commitments using a discounted cash flow valuation technique. A significant increase (decrease) in isolation in the constant default rate, loss severity or cumulative loss rate would result in a significantly lower (higher) fair value measurement. The impact of changes in the constant prepayment rate would have differing impacts depending on the capital structure of the security. A significant increase (decrease) in the security yield would result in a significantly lower (higher) fair value measurement. |
• | Certain other ABS using an over-collateralization model. A significant increase (decrease) in the over-collateralization percentage would result in a significantly higher (lower) fair value measurement. |
• | Derivative equity options using an option model. A significant increase (decrease) in volatility would result in a significantly higher (lower) fair value measurement. |
• | Derivative equity options using a default rate model. A significant increase (decrease) in default probability would result in a significantly lower (higher) fair value measurement. |
• | Non-exchange traded securities and loans and other receivables using a present value model. A significant increase (decrease) in average silver production would result in a significantly higher (lower) fair value measurement. |
79
Table of Contents
JEFFERIES GROUP LLC AND SUBSIDIARIES
NOTES TO CONSOLIDATED FINANCIAL STATEMENTS - CONTINUED
Fair Value Option Election
We have elected the fair value option for all loans and loan commitments made by our capital markets businesses. These loans and loan commitments include loans entered into by our Investment Banking division in connection with client bridge financing and loan syndications, loans purchased by our leveraged credit trading desk as part of its bank loan trading activities and mortgage and consumer loan commitments, purchases and fundings in connection with mortgage- and other asset-backed securitization activities. Loans and loan commitments originated or purchased by our leveraged credit and mortgage-backed businesses are managed on a fair value basis. Loans are included in Financial instruments owned and loan commitments are included in Financial instruments owned and Financial instruments sold, not yet purchased on the Consolidated Statements of Financial Condition. The fair value option election is not applied to loans made to affiliate entities as such loans are entered into as part of ongoing, strategic business ventures. Loans to affiliate entities are included within Loans to and investments in related parties on the Consolidated Statements of Financial Condition and are accounted for on an amortized cost basis. We have also elected the fair value option for certain of our structured notes, which are managed by our capital markets business and are included in Long-term debt on the Consolidated Statement of Financial Condition. We have elected the fair value option for certain financial instruments held by subsidiaries as the investments are risk managed by us on a fair value basis. The fair value option has also been elected for certain secured financings that arise in connection with our securitization activities and other structured financings. Other secured financings, Receivables – Brokers, dealers and clearing organizations, Receivables – Customers, Receivables – Fees, interest and other, Payables – Brokers, dealers and clearing organizations and Payables – Customers, are accounted for at cost plus accrued interest rather than at fair value; however, the recorded amounts approximate fair value due to their liquid or short-term nature.
The following is a summary of gains (losses) due to changes in instrument specific credit risk on loans, other receivables and debt instruments and gains (losses) due to other changes in fair value on long-term debt measured at fair value under the fair value option (in thousands):
| Year Ended November 30, | ||||||||||
| 2016 |
| 2015 |
| 2014 | ||||||
Financial Instruments Owned: |
|
|
|
|
| ||||||
Loans and other receivables | $ | (68,812 | ) |
| $ | (17,389 | ) |
| $ | (24,785 | ) |
Financial Instruments Sold: |
|
|
|
|
| ||||||
Loans | $ | 9 | |
| $ | (162 | ) |
| $ | (585 | ) |
Loan commitments | 5,509 | |
| 7,502 | |
| (15,459 | ) | |||
Long-term debt: |
|
|
|
|
| ||||||
Changes in instrument specific credit risk (1) | $ | (10,745 | ) |
| $ | - | |
| $ | - | |
Other changes in fair value (2) | 30,995 | |
| - | |
| - | | |||
(1) | Changes in instrument-specific credit risk related to structured notes are included in the Consolidated Statements of Comprehensive Income. |
(2) | Other changes in fair value are included within Principal transactions revenues on the Consolidated Statements of Earnings. |
The following is a summary of the amount by which contractual principal exceeds fair value for loans and other receivables and long-term debt measured at fair value under the fair value option (in thousands):
| November 30, | ||||||
| 2016 |
| 2015 | ||||
Financial Instruments Owned: |
|
|
| ||||
Loans and other receivables (1) | $ | 1,325,938 | |
| $ | 408,369 | |
Loans and other receivables on nonaccrual status and/or greater than 90 days past due (1) (2) | 205,746 | |
| 54,652 | | ||
Long-term debt | 20,202 | |
| - | | ||
(1) | Interest income is recognized separately from other changes in fair value and is included within Interest revenues on the Consolidated Statements of Earnings. |
(2) | Amounts include loans and other receivables greater than 90 days past due of $64.6 million and $29.7 million at November 30, 2016 and 2015 , respectively. |
80
Table of Contents
JEFFERIES GROUP LLC AND SUBSIDIARIES
NOTES TO CONSOLIDATED FINANCIAL STATEMENTS - CONTINUED
The aggregate fair value of loans and other receivables on nonaccrual status and/or greater than 90 days past due was $29.8 million and $307.5 million at November 30, 2016 and 2015 , respectively, which includes loans and other receivables greater than 90 days past due, was $18.9 million and $11.3 million at November 30, 2016 and 2015 , respectively.
Assets and Liabilities Measured at Fair Value on a Non-recurring Basis
Certain assets were measured at fair value on a non-recurring basis and are not included in the tables above. These assets include goodwill and intangible assets. The following table presents those assets measured at fair value on a non-recurring basis for which the Company recognized a non-recurring fair value adjustment during the years ended November 30, 2016 , 2015 and 2014 (in thousands):
| Carrying Value at November 30, 2016 |
| Level 2 |
| Level 3 |
| Impairment Losses for the Year Ended November 30, 2016 | ||||||||
Capital Markets Reporting Unit: |
|
|
|
|
|
|
| ||||||||
Exchange ownership interests and registrations (1) | $ | 2,716 | |
| $ | 2,716 | |
| $ | - | |
| $ | 1,284 | |
| Carrying Value at November 30, 2015 |
| Level 2 |
| Level 3 |
| Impairment Losses for the Year Ended November 30, 2015 | ||||||||
Futures Reporting Unit (2): |
|
|
|
|
|
|
| ||||||||
Exchange ownership interests and registrations (1) | $ | 4,178 | |
| $ | 4,178 | |
| $ | - | |
| $ | 1,289 | |
| Carrying Value at November 30, 2014 |
| Level 2 |
| Level 3 |
| Impairment Losses for the Year Ended November 30, 2014 | ||||||||
Futures Reporting Unit (2): |
|
|
|
|
|
|
| ||||||||
Exchange ownership interests and registrations (1) | $ | 5,608 | |
| $ | 5,608 | |
| $ | - | |
| $ | 178 | |
Goodwill (3) | - | |
| - | |
| - | |
| 51,900 | | ||||
Intangible assets (4) | - | |
| - | |
| - | |
| 7,534 | | ||||
|
|
|
|
|
|
|
| ||||||||
International Asset Management Reporting Unit (5): |
|
|
|
|
|
|
| ||||||||
Goodwill (5) | $ | - | |
| $ | - | |
| $ | - | |
| $ | 2,100 | |
Intangible assets (5) | - | |
| - | |
| - | |
| 60 | | ||||
(1) | Impairment losses of $1.3 million , $1.3 million and $0.2 million , were recognized in Other expenses, during the years ended November 30, 2016 , 2015 and 2014 , respectively, for exchange memberships, which represent ownership interests in market exchanges on which trading business is conducted, and registrations. The fair value of these exchange memberships is based on observed quoted sales prices for each individual membership. (See Note 10, Goodwill and Other Intangible Assets .) |
(2) | Given management's decision to pursue strategic alternatives for our Futures business, including possible disposal, as a result of the operating performance and margin challenges experienced by the business, an impairment analysis of the carrying amounts of goodwill, intangible assets and certain other assets employed directly by the business was performed at November 30, 2015 and 2014 , respectively. (See Note 10, Goodwill and Other Intangible Assets .) |
(3) | An impairment loss for goodwill allocated to our Futures business with a carrying amount of $51.9 million was recognized for the year ended November 30, 2014 . The fair value of the Futures business was estimated 1) by comparison to similar companies using publicly traded price-to-tangible book multiples as the basis for valuation and 2) by utilizing a discounted cash flow methodology based on internally developed forecasts of profitability and an appropriate risk-adjusted discount rate. |
(4) | See Note 10, Goodwill and Other Intangible Assets for further information. |
81
Table of Contents
JEFFERIES GROUP LLC AND SUBSIDIARIES
NOTES TO CONSOLIDATED FINANCIAL STATEMENTS - CONTINUED
(5) | Given management's decision to liquidate our International Asset Management business, an impairment analysis of the carrying amounts of goodwill, intangible assets and certain other assets employed directly by the business was performed at November 30, 2014 . (See Note 10, Goodwill and Other Intangible Assets . |
There were no assets measured at fair value on a non-recurring basis, which utilized Level 1 inputs during the years ended November 30, 2016 , 2015 and 2014 . There were no liabilities measured at fair value on a non-recurring basis during the years ended November 30, 2016 , 2015 and 2014 .
Financial Instruments Not Measured at Fair Value
Certain of our financial instruments are not carried at fair value but are recorded at amounts that approximate fair value due to their liquid or short-term nature and generally negligible credit risk. These financial assets include Cash and cash equivalents and Cash and securities segregated and on deposit for regulatory purposes or deposited with clearing and depository organizations and would generally be presented in Level 1 of the fair value hierarchy. Cash and securities segregated and on deposit for regulatory purposes or deposited with clearing and depository organizations includes U.S. treasury securities with a fair value of $99.9 million at November 30, 2016.
Note 5. Derivative Financial Instruments
Off-Balance Sheet Risk
We have contractual commitments arising in the ordinary course of business for securities loaned or purchased under agreements to resell, repurchase agreements, future purchases and sales of foreign currencies, securities transactions on a when-issued basis and underwriting. Each of these financial instruments and activities contains varying degrees of off-balance sheet risk whereby the fair values of the securities underlying the financial instruments may be in excess of, or less than, the contract amount. The settlement of these transactions is not expected to have a material effect upon our consolidated financial statements.
Derivative Financial Instruments
Our derivative activities are recorded at fair value in the Consolidated Statements of Financial Condition in Financial instruments owned and Financial instruments sold, not yet purchased, net of cash paid or received under credit support agreements and on a net counterparty basis when a legally enforceable right to offset exists under a master netting agreement. Net realized and unrealized gains and losses are recognized in Principal transaction revenues in the Consolidated Statements of Earnings on a trade date basis and as a component of cash flows from operating activities in the Consolidated Statements of Cash Flows. Acting in a trading capacity, we may enter into derivative transactions to satisfy the needs of our clients and to manage our own exposure to market and credit risks resulting from our trading activities. (See Note 4, Fair Value Disclosures , and Note 18, Commitments, Contingencies and Guarantees , for additional disclosures about derivative financial instruments.)
Derivatives are subject to various risks similar to other financial instruments, including market, credit and operational risk. The risks of derivatives should not be viewed in isolation, but rather should be considered on an aggregate basis along with our other trading-related activities. We manage the risks associated with derivatives on an aggregate basis along with the risks associated with proprietary trading as part of our firm wide risk management policies.
In connection with our derivative activities, we may enter into ISDA master netting agreements or similar agreements with counterparties. See Note 2, Summary of Significant Accounting Policies , for additional information regarding the offsetting of derivative contracts.
The following tables present the fair value and related number of derivative contracts at November 30, 2016 and 2015 categorized by type of derivative contract and the platform on which these derivatives are transacted. The fair value of assets/liabilities represents our receivable/payable for derivative financial instruments, gross of counterparty netting and cash collateral received and pledged. The following tables also provide information regarding 1) the extent to which, under enforceable master netting arrangements, such balances are presented net in the Consolidated Statements of Financial Condition as appropriate under U.S. GAAP and 2) the extent to which other rights of setoff associated with these arrangements exist and could have an effect on our financial position (in thousands, except contract amounts).
82
Table of Contents
JEFFERIES GROUP LLC AND SUBSIDIARIES
NOTES TO CONSOLIDATED FINANCIAL STATEMENTS - CONTINUED
| November 30, 2016 (1) | ||||||||||||
| Assets |
| Liabilities | ||||||||||
| Fair Value |
| Number of Contracts |
| Fair Value |
| Number of Contracts | ||||||
Interest rate contracts: |
|
|
|
|
|
|
| ||||||
Exchange-traded | $ | 2,275 | |
| 24,300 | |
| $ | 24 | |
| 29,773 | |
Cleared OTC | 2,835,812 | |
| 3,596 | |
| 2,636,469 | |
| 3,445 | | ||
Bilateral OTC | 444,159 | |
| 1,136 | |
| 522,965 | |
| 1,627 | | ||
Foreign exchange contracts: |
|
|
|
|
|
|
| ||||||
Exchange-traded | - | |
| 376 | |
| - | |
| 686 | | ||
Bilateral OTC | 529,609 | |
| 7,448 | |
| 516,869 | |
| 7,633 | | ||
Equity contracts: |
|
|
|
|
|
|
| ||||||
Exchange-traded | 712,767 | |
| 2,820,702 | |
| 1,095,582 | |
| 2,410,956 | | ||
Bilateral OTC | 72,041 | |
| 1,077 | |
| 67,033 | |
| 1,191 | | ||
Commodity contracts: |
|
|
|
|
|
|
| ||||||
Exchange-traded | - | |
| 1,356 | |
| - | |
| 920 | | ||
Credit contracts: |
|
|
|
|
|
|
| ||||||
Cleared OTC | 645 | |
| 6 | |
| 2,304 | |
| 8 | | ||
Bilateral OTC | 19,225 | |
| 213 | |
| 25,503 | |
| 184 | | ||
Total gross derivative assets/ liabilities: |
|
|
|
|
|
|
| ||||||
Exchange-traded | 715,042 | |
|
|
| 1,095,606 | |
|
| ||||
Cleared OTC | 2,836,457 | |
|
|
| 2,638,773 | |
|
| ||||
Bilateral OTC | 1,065,034 | |
|
|
| 1,132,370 | |
|
| ||||
Amounts offset in the Consolidated Statements of Financial Condition (2): |
|
|
|
|
|
|
| ||||||
Exchange-traded | (691,009 | ) |
|
|
| (691,009 | ) |
|
| ||||
Cleared OTC | (2,751,650 | ) |
|
|
| (2,638,774 | ) |
|
| ||||
Bilateral OTC | (813,340 | ) |
|
|
| (899,431 | ) |
|
| ||||
Net amounts per Consolidated Statements of Financial Condition (3) | $ | 360,534 | |
|
|
| $ | 637,535 | |
|
| ||
(1) | Exchange traded derivatives include derivatives executed on an organized exchange. Cleared OTC derivatives include derivatives executed bilaterally and subsequently novated to and cleared through central clearing counterparties. Bilateral OTC derivatives include derivatives executed and settled bilaterally without the use of an organized exchange or central clearing counterparty. |
(2) | Amounts netted include both netting by counterparty and for cash collateral paid or received. |
(3) | We have not received or pledged additional collateral under master netting agreements and/or other credit support agreements that is eligible to be offset beyond what has been offset in the Consolidated Statements of Financial Condition. |
83
Table of Contents
JEFFERIES GROUP LLC AND SUBSIDIARIES
NOTES TO CONSOLIDATED FINANCIAL STATEMENTS - CONTINUED
| November 30, 2015 (1) | ||||||||||||
| Assets |
| Liabilities | ||||||||||
| Fair Value |
| Number of Contracts |
| Fair Value |
| Number of Contracts | ||||||
Interest rate contracts: |
|
|
|
|
|
|
| ||||||
Exchange-traded | $ | 998 | |
| 52,605 | |
| $ | 364 | |
| 70,672 | |
Cleared OTC | 2,213,730 | |
| 2,742 | |
| 2,202,836 | |
| 2,869 | | ||
Bilateral OTC | 695,365 | |
| 1,401 | |
| 646,758 | |
| 1,363 | | ||
Foreign exchange contracts: |
|
|
|
|
|
|
| ||||||
Exchange-traded | - | |
| 441 | |
| - | |
| 112 | | ||
Bilateral OTC (4) | 453,202 | |
| 7,646 | |
| 466,021 | |
| 7,264 | | ||
Equity contracts: |
|
|
|
|
|
|
| ||||||
Exchange-traded | 955,287 | |
| 3,054,315 | |
| 1,004,699 | |
| 2,943,657 | | ||
Bilateral OTC | 61,004 | |
| 1,039 | |
| 81,085 | |
| 1,070 | | ||
Commodity contracts: |
|
|
|
|
|
|
| ||||||
Exchange-traded | - | |
| 1,726 | |
| - | |
| 1,684 | | ||
Bilateral OTC (4) | 19,342 | |
| 29 | |
| 4,628 | |
| 28 | | ||
Credit contracts: |
|
|
|
|
|
|
| ||||||
Cleared OTC | 621 | |
| 39 | |
| 841 | |
| 44 | | ||
Bilateral OTC | 16,977 | |
| 100 | |
| 59,314 | |
| 135 | | ||
Total gross derivative assets/liabilities: |
|
|
|
|
|
|
| ||||||
Exchange-traded | 956,285 | |
|
|
| 1,005,063 | |
|
| ||||
Cleared OTC | 2,214,351 | |
|
|
| 2,203,677 | |
|
| ||||
Bilateral OTC | 1,245,890 | |
|
|
| 1,257,806 | |
|
| ||||
Amounts offset in the Consolidated Statements of Financial Condition (2): |
|
|
|
|
|
|
| ||||||
Exchange-traded | (938,482 | ) |
|
|
| (938,482 | ) |
|
| ||||
Cleared OTC | (2,184,438 | ) |
|
|
| (2,184,438 | ) |
|
| ||||
Bilateral OTC | (1,042,526 | ) |
|
|
| (1,135,078 | ) |
|
| ||||
Net amounts per Consolidated Statements of Financial Condition (3) | $ | 251,080 | |
|
|
| $ | 208,548 | |
|
| ||
(1) | Exchange traded derivatives include derivatives executed on an organized exchange. Cleared OTC derivatives include derivatives executed bilaterally and subsequently novated to and cleared through central clearing counterparties. Bilateral OTC derivatives include derivatives executed and settled bilaterally without the use of an organized exchange or central clearing counterparty. |
(2) | Amounts netted include both netting by counterparty and for cash collateral paid or received. |
(3) | We have not received or pledged additional collateral under master netting agreements and/or other credit support agreements that is eligible to be offset beyond what has been offset in the Consolidated Statements of Financial Condition. |
(4) | Bilateral OTC commodity contracts increased in assets by a fair value of $19.3 million and by 29 contracts and in liabilities by a fair value of $4.6 million and by 28 contracts with corresponding decreases in bilateral OTC foreign exchange contracts from those amounts previously reported to correct for the classification of certain contracts. The total amount of bilateral OTC contracts remained unchanged. |
84
Table of Contents
JEFFERIES GROUP LLC AND SUBSIDIARIES
NOTES TO CONSOLIDATED FINANCIAL STATEMENTS - CONTINUED
The following table presents unrealized and realized gains (losses) on derivative contracts (in thousands):
| Year Ended November 30, | ||||||||||
Gains (Losses) | 2016 |
| 2015 |
| 2014 | ||||||
Interest rate contracts | $ | (34,319 | ) |
| $ | (37,601 | ) |
| $ | (149,587 | ) |
Foreign exchange contracts | 18,122 | |
| 36,101 | |
| 39,872 | | |||
Equity contracts | (650,815 | ) |
| (137,636 | ) |
| (327,978 | ) | |||
Commodity contracts | 1,310 | |
| 21,409 | |
| 58,746 | | |||
Credit contracts | 13,039 | |
| (14,397 | ) |
| (23,934 | ) | |||
Total | $ | (652,663 | ) |
| $ | (132,124 | ) |
| $ | (402,881 | ) |
The net gains (losses) on derivative contracts in the table above are one of a number of activities comprising our business activities and are before consideration of economic hedging transactions, which generally offset the net gains (losses) included above. We substantially mitigate our exposure to market risk on our cash instruments through derivative contracts, which generally provide offsetting revenues, and we manage the risk associated with these contracts in the context of our overall risk management framework.
OTC Derivatives. The following tables set forth by remaining contract maturity the fair value of OTC derivative assets and liabilities at November 30, 2016 (in thousands):
| OTC Derivative Assets (1) (2) (3) | ||||||||||||||||||
| 0 – 12 Months |
| 1 – 5 Years |
| Greater Than 5 Years |
| Cross-Maturity Netting (4) |
| Total | ||||||||||
Equity swaps and options | $ | 27,436 | |
| $ | 5,727 | |
| $ | - | |
| $ | - | |
| $ | 33,163 | |
Credit default swaps | - | |
| 4,542 | |
| 3,463 | |
| (1,588 | ) |
| 6,417 | | |||||
Total return swaps | 20,749 | |
| 389 | |
| - | |
| (200 | ) |
| 20,938 | | |||||
Foreign currency forwards, swaps and options | 95,052 | |
| 35,988 | |
| - | |
| (10,547 | ) |
| 120,493 | | |||||
Interest rate swaps, options and forwards | 120,053 | |
| 189,153 | |
| 134,507 | |
| (71,604 | ) |
| 372,109 | | |||||
Total | $ | 263,290 | |
| $ | 235,799 | |
| $ | 137,970 | |
| $ | (83,939 | ) |
| 553,120 | | |
Cross product counterparty netting |
|
|
|
|
|
|
|
| (623 | ) | |||||||||
Total OTC derivative assets included in Financial instruments owned |
|
|
|
|
|
|
|
| $ | 552,497 | | ||||||||
(1) | At November 30, 2016 , we held exchange traded derivative assets and other credit agreements with a fair value of $25.4 million , which are not included in this table. |
(2) | OTC derivative assets in the table above are gross of collateral received. OTC derivative assets are recorded net of collateral received on the Consolidated Statements of Financial Condition. At November 30, 2016 , cash collateral received was $217.4 million . |
(3) | Derivative fair values include counterparty netting within product category. |
(4) | Amounts represent the netting of receivable balances with payable balances for the same counterparty within product category across maturity categories. |
85
Table of Contents
JEFFERIES GROUP LLC AND SUBSIDIARIES
NOTES TO CONSOLIDATED FINANCIAL STATEMENTS - CONTINUED
| OTC Derivative Liabilities (1) (2) (3) | ||||||||||||||||||
| 0 – 12 Months |
| 1 – 5 Years |
| Greater Than 5 Years |
| Cross-Maturity Netting (4) |
| Total | ||||||||||
Equity swaps and options | $ | 10,993 | |
| $ | 20,354 | |
| $ | - | |
| $ | - | |
| $ | 31,347 | |
Credit default swaps | 16 | |
| 1,594 | |
| 7,147 | |
| (1,588 | ) |
| 7,169 | | |||||
Total return swaps | 12,088 | |
| 2,407 | |
| - | |
| (200 | ) |
| 14,295 | | |||||
Foreign currency forwards, swaps and options | 92,375 | |
| 26,011 | |
| - | |
| (10,547 | ) |
| 107,839 | | |||||
Fixed income forwards | 3,401 | |
| - | |
| - | |
| - | |
| 3,401 | | |||||
Interest rate swaps, options and forwards | 108,085 | |
| 121,975 | |
| 92,029 | |
| (71,604 | ) |
| 250,485 | | |||||
Total | $ | 226,958 | |
| $ | 172,341 | |
| $ | 99,176 | |
| $ | (83,939 | ) |
| 414,536 | | |
Cross product counterparty netting |
|
|
|
|
|
|
|
| (623 | ) | |||||||||
Total OTC derivative liabilities included in Financial instruments sold, not yet purchased |
|
|
|
|
|
|
|
| $ | 413,913 | | ||||||||
(1) | At November 30, 2016 , we held exchange traded derivative liabilities and other credit agreements with a fair value of $414.2 million , which are not included in this table. |
(2) | OTC derivative liabilities in the table above are gross of collateral pledged. OTC derivative liabilities are recorded net of collateral pledged on the Consolidated Statements of Financial Condition. At November 30, 2016 , cash collateral pledged was $190.6 million . |
(3) | Derivative fair values include counterparty netting within product category. |
(4) | Amounts represent the netting of receivable balances with payable balances for the same counterparty within product category across maturity categories. |
At November 30, 2016 , the counterparty credit quality with respect to the fair value of our OTC derivatives assets was as follows (in thousands):
Counterparty credit quality (1): |
| ||
A- or higher | $ | 380,574 | |
BBB- to BBB+ | 39,535 | | |
BB+ or lower | 51,834 | | |
Unrated | 80,554 | | |
Total | $ | 552,497 | |
(1) | We utilize internal credit ratings determined by our Risk Management department. Credit ratings determined by Risk Management use methodologies that produce ratings generally consistent with those produced by external rating agencies. |
Contingent Features
Certain of our derivative instruments contain provisions that require our debt to maintain an investment grade credit rating from each of the major credit rating agencies. If our debt were to fall below investment grade, it would be in violation of these provisions and the counterparties to the derivative instruments could request immediate payment or demand immediate and ongoing full overnight collateralization on our derivative instruments in liability positions. The aggregate fair value of all derivative instruments with such credit-risk-related contingent features that are in a liability position at November 30, 2016 and 2015 is $70.6 million and $114.5 million , respectively, for which we have posted collateral of $44.4 million and $97.2 million , respectively, in the normal course of business. If the credit-risk-related contingent features underlying these agreements were triggered on November 30, 2016 and 2015 , we would have been required to post an additional $26.1 million and $19.7 million , respectively, of collateral to our counterparties.
86
Table of Contents
JEFFERIES GROUP LLC AND SUBSIDIARIES
NOTES TO CONSOLIDATED FINANCIAL STATEMENTS - CONTINUED
Note 6. Collateralized Transactions
We enter into secured borrowing and lending arrangements to obtain collateral necessary to effect settlement, finance inventory positions, meet customer needs or re-lend as part of our dealer operations. We monitor the fair value of the securities loaned and borrowed on a daily basis as compared with the related payable or receivable, and request additional collateral or return excess collateral, as appropriate. We pledge financial instruments as collateral under repurchase agreements, securities lending agreements and other secured arrangements, including clearing arrangements. Our agreements with counterparties generally contain contractual provisions allowing the counterparty the right to sell or repledge the collateral. Pledged securities owned that can be sold or repledged by the counterparty are included within Financial instruments owned and noted parenthetically as Securities pledged on our Consolidated Statements of Financial Condition.
The following tables set forth the carrying value of securities lending arrangements and repurchase agreements by class of collateral pledged (in thousands):
| November 30, 2016 | ||||||||||
| Securities Lending Arrangements |
| Repurchase Agreements |
| Total | ||||||
Collateral Pledged: |
|
|
|
|
| ||||||
Corporate equity securities | $ | 2,046,243 | |
| $ | 66,291 | |
| $ | 2,112,534 | |
Corporate debt securities | 731,276 | |
| 1,907,888 | |
| 2,639,164 | | |||
Mortgage- and asset-backed securities | - | |
| 2,171,480 | |
| 2,171,480 | | |||
U.S. government and federal agency securities | 41,613 | |
| 9,232,624 | |
| 9,274,237 | | |||
Municipal securities | - | |
| 553,010 | |
| 553,010 | | |||
Sovereign obligations | - | |
| 2,625,079 | |
| 2,625,079 | | |||
Loans and other receivables | - | |
| 455,960 | |
| 455,960 | | |||
Total | $ | 2,819,132 | |
| $ | 17,012,332 | |
| $ | 19,831,464 | |
| November 30, 2015 | ||||||||||
| Securities Lending Arrangements |
| Repurchase Agreements |
| Total | ||||||
Collateral Pledged: |
|
|
|
|
| ||||||
Corporate equity securities | $ | 2,195,912 | |
| $ | 275,880 | |
| $ | 2,471,792 | |
Corporate debt securities | 748,405 | |
| 1,752,222 | |
| 2,500,627 | | |||
Mortgage- and asset-backed securities | - | |
| 3,537,812 | |
| 3,537,812 | | |||
U.S. government and federal agency securities | 34,983 | |
| 12,006,081 | |
| 12,041,064 | | |||
Municipal securities | - | |
| 357,350 | |
| 357,350 | | |||
Sovereign obligations | - | |
| 1,804,103 | |
| 1,804,103 | | |||
Loans and other receivables | - | |
| 462,534 | |
| 462,534 | | |||
Total | $ | 2,979,300 | |
| $ | 20,195,982 | |
| $ | 23,175,282 | |
The following tables set forth the carrying value of securities lending arrangements and repurchase agreements by remaining contractual maturity (in thousands):
| November 30, 2016 | ||||||||||||||||||
| Overnight and Continuous |
| Up to 30 Days |
| 30-90 Days |
| Greater than 90 Days |
| Total | ||||||||||
Securities lending arrangements | $ | 2,131,891 | |
| $ | 39,673 | |
| $ | 104,516 | |
| $ | 543,052 | |
| $ | 2,819,132 | |
Repurchase agreements | 9,147,176 | |
| 2,008,119 | |
| 3,809,533 | |
| 2,047,504 | |
| 17,012,332 | | |||||
Total | $ | 11,279,067 | |
| $ | 2,047,792 | |
| $ | 3,914,049 | |
| $ | 2,590,556 | |
| $ | 19,831,464 | |
87
Table of Contents
JEFFERIES GROUP LLC AND SUBSIDIARIES
NOTES TO CONSOLIDATED FINANCIAL STATEMENTS - CONTINUED
| November 30, 2015 | ||||||||||||||||||
| Overnight and Continuous |
| Up to 30 Days |
| 30-90 Days |
| Greater than 90 Days |
| Total | ||||||||||
Securities lending arrangements | $ | 1,522,475 | |
| $ | - | |
| $ | 973,201 | |
| $ | 483,624 | |
| $ | 2,979,300 | |
Repurchase agreements | 7,850,791 | |
| 5,218,059 | |
| 5,291,729 | |
| 1,835,403 | |
| 20,195,982 | | |||||
Total | $ | 9,373,266 | |
| $ | 5,218,059 | |
| $ | 6,264,930 | |
| $ | 2,319,027 | |
| $ | 23,175,282 | |
We receive securities as collateral under resale agreements, securities borrowing transactions and customer margin loans. We also receive securities as collateral in connection with securities-for-securities transactions in which we are the lender of securities. In many instances, we are permitted by contract to rehypothecate the securities received as collateral. These securities may be used to secure repurchase agreements, enter into securities lending transactions, satisfy margin requirements on derivative transactions or cover short positions. At November 30, 2016 and 2015 , the approximate fair value of securities received as collateral by us that may be sold or repledged was $25.5 billion and $26.2 billion , respectively. At November 30, 2016 and 2015 , a substantial portion of the securities received by us had been sold or repledged.
Offsetting of Securities Financing Agreements
To manage our exposure to credit risk associated with securities financing transactions, we may enter into master netting agreements and collateral arrangements with counterparties. Generally, transactions are executed under standard industry agreements, including, but not limited to, master securities lending agreements (securities lending transactions) and master repurchase agreements (repurchase transactions). See Note 2, Summary of Significant Accounting Policies , for additional information regarding the offsetting of securities financing agreements.
The following tables provide information regarding repurchase agreements and securities borrowing and lending arrangements that are recognized in the Consolidated Statements of Financial Condition and 1) the extent to which, under enforceable master netting arrangements, such balances are presented net in the Consolidated Statements of Financial Condition as appropriate under U.S. GAAP and 2) the extent to which other rights of setoff associated with these arrangements exist and could have an effect on our financial position (in thousands).
| November 30, 2016 | ||||||||||||||||||||||
| Gross Amounts |
| Netting in Consolidated Statement of Financial Condition |
| Net Amounts in Consolidated Statement of Financial Condition |
| Additional Amounts Available for Setoff (1) |
| Available Collateral (2) |
| Net Amount (3) | ||||||||||||
Assets |
|
|
|
|
|
|
|
|
|
|
| ||||||||||||
Securities borrowing arrangements | $ | 7,743,562 | |
| $ | - | |
| $ | 7,743,562 | |
| $ | (710,611 | ) |
| $ | (647,290 | ) |
| $ | 6,385,661 | |
Reverse repurchase agreements | 14,083,144 | |
| (10,220,656 | ) |
| 3,862,488 | |
| (176,275 | ) |
| (3,591,654 | ) |
| 94,559 | | ||||||
Liabilities |
|
|
|
|
|
|
|
|
|
|
| ||||||||||||
Securities lending arrangements | $ | 2,819,132 | |
| $ | - | |
| $ | 2,819,132 | |
| $ | (710,611 | ) |
| $ | (2,064,299 | ) |
| $ | 44,222 | |
Repurchase agreements | 17,012,332 | |
| (10,220,656 | ) |
| 6,791,676 | |
| (176,275 | ) |
| (5,780,909 | ) |
| 834,492 | | ||||||
88
Table of Contents
JEFFERIES GROUP LLC AND SUBSIDIARIES
NOTES TO CONSOLIDATED FINANCIAL STATEMENTS - CONTINUED
| November 30, 2015 | ||||||||||||||||||||||
| Gross Amounts |
| Netting in Consolidated Statement of Financial Condition |
| Net Amounts in Consolidated Statement of Financial Condition |
| Additional Amounts Available for Setoff (1) |
| Available Collateral (2) |
| Net Amount (4) | ||||||||||||
Assets |
|
|
|
|
|
|
|
|
|
|
| ||||||||||||
Securities borrowing arrangements | $ | 6,975,136 | |
| $ | - | |
| $ | 6,975,136 | |
| $ | (478,991 | ) |
| $ | (667,099 | ) |
| $ | 5,829,046 | |
Reverse repurchase agreements | 14,048,860 | |
| (10,191,554 | ) |
| 3,857,306 | |
| (83,452 | ) |
| (3,745,215 | ) |
| 28,639 | | ||||||
Liabilities |
|
|
|
|
|
|
|
|
|
|
| ||||||||||||
Securities lending arrangements | $ | 2,979,300 | |
| $ | - | |
| $ | 2,979,300 | |
| $ | (478,991 | ) |
| $ | (2,464,395 | ) |
| $ | 35,914 | |
Repurchase agreements | 20,195,982 | |
| (10,191,554 | ) |
| 10,004,428 | |
| (83,452 | ) |
| (8,103,468 | ) |
| 1,817,508 | | ||||||
(1) | Under master netting agreements with our counterparties, we have the legal right of offset with a counterparty, which incorporates all of the counterparty's outstanding rights and obligations under the arrangement. These balances reflect additional credit risk mitigation that is available by counterparty in the event of a counterparty's default, but which are not netted in the balance sheet because other netting provisions of U.S. GAAP are not met. |
(2) | Includes securities received or paid under collateral arrangements with counterparties that could be liquidated in the event of a counterparty default and thus offset against a counterparty's rights and obligations under the respective repurchase agreements or securities borrowing or lending arrangements. |
(3) | Amounts include $6,337.5 million of securities borrowing arrangements, for which we have received securities collateral of $6,146.0 million , and $810.4 million of repurchase agreements, for which we have pledged securities collateral of $834.2 million , which are subject to master netting agreements but we have not determined the agreements to be legally enforceable. |
(4) | Amounts include $5,796.1 million of securities borrowing arrangements, for which we have received securities collateral of $5,613.3 million , and $1,807.2 million of repurchase agreements, for which we have pledged securities collateral of $1,875.3 million , which are subject to master netting agreements but we have not determined the agreements to be legally enforceable. |
Cash and Securities Segregated and on Deposit for Regulatory Purposes or Deposited with Clearing and Depository Organizations
Cash and securities deposited with clearing and depository organizations and segregated in accordance with regulatory regulations totaled $857.3 million and $751.1 million at November 30, 2016 and 2015 , respectively. Segregated cash and securities consist of deposits in accordance with Rule 15c3-3 of the Securities Exchange Act of 1934, which subjects Jefferies as a broker-dealer carrying customer accounts to requirements related to maintaining cash or qualified securities in segregated special reserve bank accounts for the exclusive benefit of its customers.
Note 7. Securitization Activities
We engage in securitization activities related to corporate loans, commercial mortgage loans, consumer loans and mortgage-backed and other asset-backed securities. In our securitization transactions, we transfer these assets to special purpose entities ("SPEs") and act as the placement or structuring agent for the beneficial interests sold to investors by the SPE. A significant portion of our securitization transactions are the securitization of assets issued or guaranteed by U.S. government agencies. These SPEs generally meet the criteria of VIEs; however, we generally do not consolidate the SPEs as we are not considered the primary beneficiary for these SPEs. See Note 8, Variable Interest Entities , for further discussion on VIEs and our determination of the primary beneficiary.
We account for our securitization transactions as sales, provided we have relinquished control over the transferred assets. Transferred assets are carried at fair value with unrealized gains and losses reflected in Principal transactions revenues in the Consolidated Statement of Earnings prior to the identification and isolation for securitization. Subsequently, revenues recognized upon securitization are reflected as net underwriting revenues. We generally receive cash proceeds in connection with the transfer of assets to an SPE. We may, however, have continuing involvement with the transferred assets, which is limited to retaining one or more tranches of the securitization (primarily senior and subordinated debt securities in the form of mortgage- and other-asset backed securities or CLOs), which are included within Financial instruments owned and are generally initially categorized as Level 2 within the fair value hierarchy. We apply fair value accounting to the securities.
89
Table of Contents
JEFFERIES GROUP LLC AND SUBSIDIARIES
NOTES TO CONSOLIDATED FINANCIAL STATEMENTS - CONTINUED
The following table presents activity related to our securitizations that were accounted for as sales in which we had continuing involvement (in millions):
| Year Ended November 30, | ||||||||||
| 2016 |
| 2015 |
| 2014 | ||||||
Transferred assets | $ | 5,786.0 | |
| $ | 5,770.5 | |
| $ | 6,112.6 | |
Proceeds on new securitizations | 5,809.0 | |
| 5,811.3 | |
| 6,221.1 | | |||
Cash flows received on retained interests | 28.2 | |
| 31.2 | |
| 46.3 | | |||
We have no explicit or implicit arrangements to provide additional financial support to these SPEs, have no liabilities related to these SPEs and do not have any outstanding derivative contracts executed in connection with these securitization activities at November 30, 2016 and 2015 .
The following tables summarize our retained interests in SPEs where we transferred assets and have continuing involvement and received sale accounting treatment (in millions):
| November 30, | ||||||||||||||
| 2016 |
| 2015 | ||||||||||||
Securitization Type | Total Assets |
| Retained Interests |
| Total Assets |
| Retained Interests | ||||||||
U.S. government agency RMBS | $ | 7,584.9 | |
| $ | 31.0 | |
| $ | 10,901.9 | |
| $ | 203.6 | |
U.S. government agency CMBS | 1,806.3 | |
| 29.6 | |
| 2,313.4 | |
| 87.2 | | ||||
CLOs | 4,102.2 | |
| 37.0 | |
| 4,538.4 | |
| 51.5 | | ||||
Consumer and other loans | 395.7 | |
| 25.3 | |
| 655.0 | |
| 31.0 | | ||||
Total assets represent the unpaid principal amount of assets in the SPEs in which we have continuing involvement and are presented solely to provide information regarding the size of the transaction and the size of the underlying assets supporting our retained interests, and are not considered representative of the risk of potential loss. Assets retained in connection with a securitization transaction represent the fair value of the securities of one or more tranches issued by an SPE, including senior and subordinated tranches. Our risk of loss is limited to this fair value amount which is included within total Financial instruments owned on our Consolidated Statements of Financial Condition.
Although not obligated, in connection with secondary market-making activities we may make a market in the securities issued by these SPEs. In these market-making transactions, we buy these securities from and sell these securities to investors. Securities purchased through these market-making activities are not considered to be continuing involvement in these SPEs. To the extent we purchased securities through these market-making activities and we are not deemed to be the primary beneficiary of the VIE, these securities are included in agency and non-agency mortgage- and asset-backed securitizations in the nonconsolidated VIEs section presented in Note 8, Variable Interest Entities .
Note 8. Variable Interest Entities
VIEs are entities in which equity investors lack the characteristics of a controlling financial interest. VIEs are consolidated by the primary beneficiary. The primary beneficiary is the party who has both (1) the power to direct the activities of a VIE that most significantly impact the entity's economic performance and (2) an obligation to absorb losses of the entity or a right to receive benefits from the entity that could potentially be significant to the entity.
Our variable interests in VIEs include debt and equity interests, commitments, guarantees and certain fees. Our involvement with VIEs arises primarily from:
• | Purchases of securities in connection with our trading and secondary market making activities, |
• | Retained interests held as a result of securitization activities, including the resecuritization of mortgage- and other asset-backed securities and the securitization of commercial mortgage, corporate and consumer loans, |
• | Acting as placement agent and/or underwriter in connection with client-sponsored securitizations, |
• | Financing of agency and non-agency mortgage- and other asset-backed securities, |
90
Table of Contents
JEFFERIES GROUP LLC AND SUBSIDIARIES
NOTES TO CONSOLIDATED FINANCIAL STATEMENTS - CONTINUED
• | Warehousing funding arrangements for client-sponsored consumer loan vehicles and CLOs through participation certificates and revolving loan and note commitments, and |
• | Loans to, investments in and fees from various investment vehicles. |
We determine whether we are the primary beneficiary of a VIE upon our initial involvement with the VIE and we reassess whether we are the primary beneficiary of a VIE on an ongoing basis. Our determination of whether we are the primary beneficiary of a VIE is based upon the facts and circumstances for each VIE and requires significant judgment. Our considerations in determining the VIE's most significant activities and whether we have power to direct those activities include, but are not limited to, the VIE's purpose and design and the risks passed through to investors, the voting interests of the VIE, management, service and/or other agreements of the VIE, involvement in the VIE's initial design and the existence of explicit or implicit financial guarantees. In situations where we have determined that the power over the VIE's significant activities is shared, we assess whether we are the party with the power over the most significant activities. If we are the party with the power over the most significant activities, we meet the "power" criteria of the primary beneficiary. If we do not have the power over the most significant activities or we determine that decisions require consent of each sharing party, we do not meet the "power" criteria of the primary beneficiary.
We assess our variable interests in a VIE both individually and in aggregate to determine whether we have an obligation to absorb losses of or a right to receive benefits from the VIE that could potentially be significant to the VIE. The determination of whether our variable interest is significant to the VIE requires significant judgment. In determining the significance of our variable interest, we consider the terms, characteristics and size of the variable interests, the design and characteristics of the VIE, our involvement in the VIE and our market-making activities related to the variable interests.
Consolidated VIEs
The following table presents information about our consolidated VIEs at November 30, 2016 and 2015 (in millions). The assets and liabilities in the tables below are presented prior to consolidation and thus a portion of these assets and liabilities are eliminated in consolidation.
| November 30, | ||||||||||||||
| 2016 |
| 2015 | ||||||||||||
| Securitization Vehicles |
| Other |
| Securitization Vehicles |
| Other | ||||||||
Cash | $ | 16.1 | |
| $ | 0.7 | |
| $ | 0.5 | |
| $ | 1.5 | |
Financial instruments owned | 86.6 | |
| 0.6 | |
| 68.3 | |
| 0.6 | | ||||
Securities purchased under agreement to resell (1) | 733.5 | |
| - | |
| 717.3 | |
| - | | ||||
Fees, interest and other receivables | 1.5 | |
| - | |
| 0.3 | |
| 0.2 | | ||||
Total assets | $ | 837.7 | |
| $ | 1.3 | |
| $ | 786.4 | |
| $ | 2.3 | |
Other secured financings (2) | $ | 813.1 | |
| $ | - | |
| $ | 785.0 | |
| $ | - | |
Other liabilities | 24.1 | |
| 0.2 | |
| 1.4 | |
| 0.3 | | ||||
Total liabilities | $ | 837.2 | |
| $ | 0.2 | |
| $ | 786.4 | |
| $ | 0.3 | |
(1) | Securities purchased under agreement to resell represent an amount due under a collateralized transaction on a related consolidated entity, which is eliminated in consolidation. |
(2) | Approximately $57.6 million and $22.1 million of the secured financing represents an amount held by us in inventory and is eliminated in consolidation at November 30, 2016 and 2015 , respectively. |
Securitization Vehicles . We are the primary beneficiary of securitization vehicles associated with our financing of consumer and small business loans. In the creation of the securitization vehicles, we were involved in the decisions made during the establishment and design of the entities and hold variable interests consisting of the securities retained that could potentially be significant. The assets of the VIEs consist of the small business loans and term loans backed by consumer installment receivables, which are available for the benefit of the vehicles' beneficial interest holders. The creditors of the VIEs do not have recourse to our general credit and the assets of the VIEs are not available to satisfy any other debt.
We are also the primary beneficiary of mortgage-backed financing vehicles to which we sell agency and non-agency residential and commercial mortgage loans and mortgage-backed securities pursuant to the terms of a master repurchase agreement. We manage the assets within these vehicles. Our variable interests in these vehicles consist of our collateral margin maintenance obligations under the master repurchase agreement and retained interests in securities issued. The assets of these VIEs consist of reverse repurchase agreements, which are available for the benefit of the vehicle's debt holders. The creditors of these VIEs do not have recourse to our general credit and each such VIE's assets are not available to satisfy any other debt.
91
Table of Contents
JEFFERIES GROUP LLC AND SUBSIDIARIES
NOTES TO CONSOLIDATED FINANCIAL STATEMENTS - CONTINUED
Other. We are the primary beneficiary of certain investment vehicles set up for the benefit of our employees. We manage and invest alongside our employees in these vehicles. The assets of these VIEs consist of private equity securities, and are available for the benefit of the entities' equity holders. Our variable interests in these vehicles consist of equity securities. The creditors of these VIEs do not have recourse to our general credit and each such VIE's assets are not available to satisfy any other debt.
Nonconsolidated VIEs
The following tables present information about our variable interests in nonconsolidated VIEs (in millions):
| November 30, 2016 | ||||||||||||||
| Carrying Amount |
| Maximum Exposure to Loss |
| VIE Assets | ||||||||||
| Assets |
| Liabilities |
|
| ||||||||||
CLOs | $ | 263.3 | |
| $ | 4.8 | |
| $ | 920.0 | |
| $ | 4,451.7 | |
Consumer loan vehicles | 90.3 | |
| - | |
| 219.6 | |
| 985.5 | | ||||
Related party private equity vehicles | 37.6 | |
| - | |
| 63.6 | |
| 155.6 | | ||||
Other private investment vehicles | 52.3 | |
| - | |
| 53.8 | |
| 3,874.7 | | ||||
Total | $ | 443.5 | | | $ | 4.8 | | | $ | 1,257.0 | | | $ | 9,467.5 | |
| November 30, 2015 | ||||||||||||||
| Carrying Amount |
| Maximum Exposure to Loss |
| VIE Assets | ||||||||||
| Assets |
| Liabilities |
|
| ||||||||||
CLOs | $ | 73.6 | |
| $ | 0.2 | |
| $ | 458.1 | |
| $ | 6,368.7 | |
Consumer loan vehicles | 188.3 | |
| - | |
| 845.8 | |
| 1,133.0 | | ||||
Related party private equity vehicles | 39.3 | |
| - | |
| 65.8 | |
| 168.2 | | ||||
Other private investment vehicles | 51.3 | |
| - | |
| 52.8 | |
| 4,312.0 | | ||||
Total | $ | 352.5 | | | $ | 0.2 | | | $ | 1,422.5 | | | $ | 11,981.9 | |
Our maximum exposure to loss often differs from the carrying value of the variable interests. The maximum exposure to loss is dependent on the nature of our variable interests in the VIEs and is limited to the notional amounts of certain loan and equity commitments and guarantees. Our maximum exposure to loss does not include the offsetting benefit of any financial instruments that may be utilized to hedge the risks associated with our variable interests and is not reduced by the amount of collateral held as part of a transaction with a VIE.
Collateralized Loan Obligations. Assets collateralizing the CLOs include bank loans, participation interests and sub-investment grade and senior secured U.S. loans. We underwrite securities issued in CLO transactions on behalf of sponsors and provide advisory services to the sponsors. We may also sell corporate loans to the CLOs. Our variable interests in connection with CLOs where we have been involved in providing underwriting and/or advisory services consist of the following:
• | Forward sale agreements whereby we commit to sell, at a fixed price, corporate loans and ownership interests in an entity holding such corporate loans to CLOs, |
• | Warehouse funding arrangements in the form of participation interests in corporate loans held by CLOs and commitments to fund such participation interests, |
• | Trading positions in securities issued in a CLO transaction, |
• | Investments in variable funding notes issued by CLOs, and |
• | A guarantee to a CLO managed by Jefferies Finance, LLC ("Jefferies Finance"), whereby we guarantee certain of the obligations of Jefferies Finance to the CLO. |
In addition, we owned variable interests in a CLO previously managed by us. During the year ended November 30, 2016, the CLO was liquidated and our variable interests, which consisted of debt securities and a right to a portion of the CLO's management and incentive fees, were repaid. Our exposure to loss from the CLO was limited to our investments in the debt securities held. The assets of the CLO consisted primarily of senior secured loans, unsecured loans and high yield bonds.
92
Table of Contents
JEFFERIES GROUP LLC AND SUBSIDIARIES
NOTES TO CONSOLIDATED FINANCIAL STATEMENTS - CONTINUED
Consumer Loan Vehicles. We provide financing and lending related services to certain client-sponsored VIEs in the form of revolving funding note agreements, revolving credit facilities and forward purchase agreements. The underlying assets, which are collateralizing the vehicles, are primarily composed of unsecured consumer and small business loans. In addition, we may provide structuring and advisory services and act as an underwriter or placement agent for securities issued by the vehicles. We do not control the activities of these entities.
Related Party Private Equity Vehicles. We have committed to invest equity in private equity funds (the "JCP Funds") managed by Jefferies Capital Partners, LLC (the "JCP Manager"). Additionally, we have committed to invest equity in the general partners of the JCP Funds (the "JCP General Partners") and the JCP Manager. Our variable interests in the JCP Funds, JCP General Partners and JCP Manager (collectively, the "JCP Entities") consist of equity interests that, in total, provide us with limited and general partner investment returns of the JCP Funds, a portion of the carried interest earned by the JCP General Partners and a portion of the management fees earned by the JCP Manager. Our total equity commitment in the JCP Entities is $148.1 million , of which $125.1 million and $124.6 million was funded at November 30, 2016 and 2015 , respectively. The carrying value of our equity investments in the JCP Entities was $37.6 million and $39.3 million at November 30, 2016 and 2015 , respectively. Our exposure to loss is limited to the total of our carrying value and unfunded equity commitment. The assets of the JCP Entities primarily consist of private equity and equity related investments.
We have also provided a guarantee of a portion of Energy Partners I, LP's obligations under a credit agreement. Energy Partners I, LP, is a private equity fund owned and managed by our employees. The maximum exposure to loss of the guarantee was $3.0 million at November 30, 2016 and 2015 . Energy Partners I, LP, has assets consisting primarily of debt and equity investments.
Other Private Investment Vehicles. At November 30, 2016 and 2015 , we had equity commitments to invest $75.8 million and $50.8 million , respectively, in various other private investment vehicles, of which $74.3 million and $49.3 million was funded, respectively. The carrying value of our equity investments was $52.3 million and $51.3 million at November 30, 2016 and 2015 , respectively. Our exposure to loss is limited to the total of our carrying value and unfunded equity commitment. These private investment vehicles have assets primarily consisting of private and public equity investments, debt instruments and various oil and gas assets.
Mortgage- and Other Asset-Backed Securitization Vehicles. In connection with our secondary trading and market making activities, we buy and sell agency and non-agency mortgage-backed securities and other asset-backed securities, which are issued by third party securitization SPEs and are generally considered variable interests in VIEs. Securities issued by securitization SPEs are backed by residential mortgage loans, U.S. agency collateralized mortgage obligations, commercial mortgage loans, CDOs and CLOs and other consumer loans, such as installment receivables, auto loans and student loans. These securities are accounted for at fair value and included in Financial instruments owned on our Consolidated Statements of Financial Condition. We have no other involvement with the related SPEs and therefore do not consolidate these entities.
We also engage in underwriting, placement and structuring activities for third-party-sponsored securitization trusts generally through agency (FNMA ("Fannie Mae"), Federal Home Loan Mortgage Corporation ("Freddie Mac") or GNMA ("Ginnie Mae")) or non-agency-sponsored SPEs and may purchase loans or mortgage-backed securities from third parties that are subsequently transferred into the securitization trusts. The securitizations are backed by residential and commercial mortgage, home equity and auto loans. We do not consolidate agency-sponsored securitizations as we do not have the power to direct the activities of the SPEs that most significantly impact their economic performance. Further, we are not the servicer of non-agency-sponsored securitizations and therefore do not have power to direct the most significant activities of the SPEs and accordingly, do not consolidate these entities. We may retain unsold senior and/or subordinated interests at the time of securitization in the form of securities issued by the SPEs.
We transfer existing securities, typically mortgage-backed securities, into resecuritization vehicles. These transactions in which debt securities are transferred to a VIE in exchange for new beneficial interests occur in connection with both agency and non-agency-sponsored VIEs. Our consolidation analysis is largely dependent on our role and interest in the resecuritization trusts. Most resecuritizations in which we are involved are in connection with investors seeking securities with specific risk and return characteristics. As such, we have concluded that the decision-making power is shared between us and the investor(s), considering the joint efforts involved in structuring the trust and selecting the underlying assets as well as the level of security interests the investor(s) hold in the SPE; therefore, we do not consolidate the resecuritization VIEs.
At November 30, 2016 and 2015 , we held $1,002.2 million and $3,359.1 million of agency mortgage-backed securities, respectively, and $439.4 million and $630.5 million of non-agency mortgage and other asset-backed securities, respectively, as a result of our secondary trading and market making activities, underwriting, placement and structuring activities and resecuritization activities. Our maximum exposure to loss on these securities is limited to the carrying value of our investments in these securities. Mortgage- and other asset-backed securitization vehicles discussed within this section are not included in the above table containing information about our variable interests in nonconsolidated VIEs.
93
Table of Contents
JEFFERIES GROUP LLC AND SUBSIDIARIES
NOTES TO CONSOLIDATED FINANCIAL STATEMENTS - CONTINUED
Note 9. Investments
We have investments in Jefferies Finance, Jefferies LoanCore LLC ("Jefferies LoanCore") and KCG Holdings, Inc. ("KCG"). Our investments in Jefferies Finance and Jefferies LoanCore are accounted for under the equity method and are included in Loans to and investments in related parties on the Consolidated Statements of Financial Condition with our share of the investees' earnings recognized in Other revenues in the Consolidated Statements of Earnings. Our investment in KCG is accounted for at fair value by electing the fair value option available under U.S. GAAP and is included in Financial instruments owned, at fair value - Corporate equity securities on the Consolidated Statements of Financial Condition with changes in fair value recognized in Principal transaction revenues on the Consolidated Statements of Earnings. We have limited partnership interests of 11% and 50% in Jefferies Capital Partners V L.P. and the SBI USA Fund L.P. (together, "JCP Fund V"), respectively, which are private equity funds managed by a team led by Brian P. Friedman, one of our directors and our Chairman of the Executive Committee.
Jefferies Finance
On October 7, 2004 , we entered into an agreement with Massachusetts Mutual Life Insurance Company ("MassMutual") and Babson Capital Management LLC (which is now Barings, LLC) to form Jefferies Finance, a joint venture entity. Jefferies Finance is a commercial finance company whose primary focus is the origination and syndication of senior secured debt to middle market and growth companies in the form of term and revolving loans. Loans are originated primarily through the investment banking efforts of Jefferies. Jefferies Finance may also originate other debt products such as second lien term, bridge and mezzanine loans, as well as related equity co-investments. Jefferies Finance also purchases syndicated loans in the secondary market.
At November 30, 2016 , we and MassMutual each have equity commitments to Jefferies Finance of $600.0 million for a combined total commitment of $1.2 billion . At November 30, 2016 , we have funded $493.9 million of our $600.0 million commitment, leaving $106.1 million unfunded. The investment commitment is scheduled to expire on March 1, 2017 with automatic one year extensions absent a 60 day termination notice by either party.
Jefferies Finance has executed a Secured Revolving Credit Facility with us and MassMutual, to be funded equally, to support loan underwritings by Jefferies Finance. The Secured Revolving Credit Facility bears interest based on the interest rates of the related Jefferies Finance underwritten loans and is secured by the underlying loans funded by the proceeds of the facility. The total Secured Revolving Credit Facility is a committed amount of $500.0 million , at November 30, 2016 . Advances are shared equally between us and MassMutual. The facility is scheduled to mature on March 1, 2017 with automatic one year extensions absent a 60 day termination notice by either party. At November 30, 2016 and 2015 , we have funded $0.0 and $19.3 million , respectively, of each of our $250.0 million and $250.0 million commitments, respectively. During the years ended November 30, 2016 , 2015 and 2014 , we earned interest income of $0.1 million , $0.9 million , $2.0 million , respectively, and unfunded commitment fees of $1.2 million , $1.6 million and $1.9 million , respectively, which are included in the Consolidated Statements of Earnings related to the Secured Revolving Credit Facility.
The following is a summary of selected financial information for Jefferies Finance (in millions):
| November 30, | ||||||
| 2016 |
| 2015 | ||||
Total assets | $ | 7,277.3 | |
| $ | 7,292.1 | |
Total liabilities | 6,336.3 | |
| 6,297.3 | | ||
Total equity | 941.1 | |
| 994.8 | | ||
Our total equity balance | 470.5 | |
| 497.4 | | ||
Separate financial statements for Jefferies Finance are included in this Annual Report on Form 10-K. The results of Jefferies Finance were a net loss of $(19.6) million for the year ended November 30, 2016, and net earnings of $83.4 million and $138.6 million for the years ended November 30, 2015 and 2014 , respectively.
We engage in debt capital markets transactions with Jefferies Finance related to the originations of loans by Jefferies Finance. In connection with such transactions, we earned fees of $112.6 million , $122.7 million and $199.5 million , during the years ended November 30, 2016 , 2015 and 2014 , respectively, which are recognized in Investment banking revenues in the Consolidated Statements of Earnings. In addition, we paid fees to Jefferies Finance in respect of certain loans originated by Jefferies Finance of $0.5 million , $5.9 million and $10.6 million during the years ended November 30, 2016 , 2015 and 2014 , respectively, which are recognized as Business development expenses in the Consolidated Statements of Earnings.
94
Table of Contents
JEFFERIES GROUP LLC AND SUBSIDIARIES
NOTES TO CONSOLIDATED FINANCIAL STATEMENTS - CONTINUED
We acted as placement agent in connection with several CLOs managed by Jefferies Finance, for which we recognized fees of $2.6 million , $6.2 million and $4.6 million during the years ended November 30, 2016 , 2015 and 2014 , respectively, which are included in Investment banking revenues on the Consolidated Statement of Earnings. At November 30, 2016 and 2015 , we held securities issued by CLOs managed by Jefferies Finance, which are included within Financial instruments owned, and provided a guarantee whereby we are required to make certain payments to a CLO in the event that Jefferies Finance is unable to meet its obligations to the CLO. Additionally, we have entered into participation agreements and derivative contracts with Jefferies Finance based on certain securities issued by the CLO.
We acted as underwriter in connection with senior notes issued by Jefferies Finance, for which we recognized underwriting fees of $1.3 million and $7.7 million during the years ended November 30, 2015 and 2014 , respectively.
Under a service agreement, we charged Jefferies Finance $46.1 million , $51.7 million , and $41.6 million for services provided during the years ended November 30, 2016 , 2015 and 2014 , respectively. At November 30, 2016 , we had a payable to Jefferies Finance, included within Accrued expenses and other liabilities on the Consolidated Statements of Financial Condition, of $5.8 million . At November 30, 2015 we had a receivable from Jefferies Finance, included within Other assets on the Consolidated Statements of Financial Condition, of $7.8 million .
Jefferies LoanCore
On February 23, 2011, we entered into a joint venture agreement with the Government of Singapore Investment Corporation ("GIC") and LoanCore, LLC and formed Jefferies LoanCore, a commercial real estate finance company. In March 2016, the Canada Pension Plan Investment Board acquired a 24% equity interest in Jefferies LoanCore through a direct acquisition from the GIC. Jefferies LoanCore originates and purchases commercial real estate loans throughout the U.S. with the support of the investment banking and securitization capabilities of Jefferies and the real estate and mortgage investment expertise of the GIC and LoanCore, LLC. During the year ended November 30, 2016 , Jefferies LoanCore's aggregate equity commitments were reduced from $600.0 million to $400.0 million . At November 30, 2016 and 2015 , we had funded $70.1 million and $207.4 million , respectively, of each of our $194.0 million and $291.0 million equity commitments, respectively, and have a 48.5% voting interest in Jefferies LoanCore.
The following is a summary of selected financial information for Jefferies LoanCore (in millions):
| November 30, | ||||||
| 2016 |
| 2015 | ||||
Total assets | $ | 1,827.2 | |
| $ | 2,069.1 | |
Total liabilities | 1,505.0 | |
| 1,469.8 | | ||
Total equity | 322.2 | |
| 599.3 | | ||
Our total equity balance | 156.3 | |
| 290.7 | | ||
Separate financial statements for Jefferies LoanCore are included in this Annual Report on Form 10-K. The net earnings of Jefferies LoanCore were $71.8 million , $79.0 million and $38.7 million for the years ended November 30, 2016 , 2015 and 2014 , respectively.
Under a service agreement, we charged Jefferies LoanCore $0.2 million , $0.2 million and $0.1 million during the years ended November 30, 2016 , 2015 and 2014 , respectively, for administrative services. Receivables from Jefferies LoanCore, included within Other assets on the Consolidated Statements of Financial Condition, were $16,000 and $16,000 at November 30, 2016 and 2015 , respectively.
In connection with the securitization of commercial real estate loans originated by Jefferies LoanCore, we earned placement fees of $0.1 million , $1.6 million and $1.6 million during the years ended November 30, 2016 , 2015 and 2014 , respectively.
JCP Fund V
The amount of our investments in JCP Fund V included within Investments in managed funds on the Consolidated Statements of Financial Condition was $29.1 million and $29.7 million at November 30, 2016 and 2015 , respectively. We account for these investments at fair value based on the NAV of the funds provided by the fund managers (see Note 2, Summary of Significant Accounting Policies ). Losses from these investments were $1.1 million , $24.3 million and $10.3 million for the years ended November 30, 2016 , 2015 and 2014 , respectively, and are included in Asset management fees and investment income (loss) from managed funds in the Consolidated Statements of Earnings.
At November 30, 2016 and 2015 , we were committed to invest equity of up to $85.0 million in JCP Fund V. At November 30, 2016 , our unfunded commitment relating to JCP Fund V was $11.3 million .
95
Table of Contents
JEFFERIES GROUP LLC AND SUBSIDIARIES
NOTES TO CONSOLIDATED FINANCIAL STATEMENTS - CONTINUED
The following is a summary of selected financial information for 100.0% of JCP Fund V, in which we own effectively 35.2% of the combined equity interests (in thousands):
| September 30, 2016 (1) |
| December 31, 2015 (1) | ||||
Total assets | $ | 82,869 | |
| $ | 76,555 | |
Total liabilities | 73 | |
| 99 | | ||
Total partners' capital | 82,616 | |
| 76,456 | | ||
| Nine Months Ended September 30, 2016 (1) |
| Three Months Ended December 31, 2015 (1) |
| Nine Months Ended September 30, 2015 (1) |
| Three Months Ended December 31, 2014 (1) |
| Nine Months Ended September 30, 2014 (1) |
| Three Months Ended December 31, 2013 (1) | ||||||||||||
Net increase (decrease) in net assets resulting from operations | $ | 6,159 | |
| $ | (7,886 | ) |
| $ | (1,751 | ) |
| $ | (65,700 | ) |
| $ | (24,239 | ) |
| $ | (2,947 | ) |
(1) | Financial information for JCP Fund V within our financial position and results of operations at November 30, 2016 and 2015 and for the years ended November 30, 2016 , 2015 and 2014 is included based on the presented periods. |
KCG
At November 30, 2016 , we owned approximately 24% of the outstanding common stock of KCG. We elected to record our investment in KCG at fair value under the fair value option as the investment was acquired as part of our capital markets activities. The valuation of our investment at November 30, 2016 is based on the closing exchange price of KCG and included within Level 1 of the fair value hierarchy. Changes in the fair value of our investment in KCG were $19.6 million , $49.1 million and $(14.7) million for the years ended November 30, 2016 , 2015 and 2014 , respectively, and are recognized in Principal transactions revenues on the Consolidated Statements of Earnings.
The following is a summary of selected financial information for KCG at December 31, 2016 and 2015, the most recently available public financial information for the company (in millions):
| December 31, | ||||||
| 2016 |
| 2015 | ||||
Total assets | $ | 6,260.8 | |
| $ | 6,040.5 | |
Total liabilities | 4,903.5 | |
| 4,596.4 | | ||
Total equity | 1,357.3 | |
| 1,444.1 | | ||
For the years ended December 31, 2016 , 2015 and 2014 , KCG reported net income of $255.7 million , $249.1 million and $61.1 million , respectively.
In connection with a KCG shares and warrants exchange transaction, we earned advisory fees of $2.9 million during the year ended November 30, 2016 .
We have separately entered into securities lending transactions with KCG in the normal course of our capital markets activities. The balances of securities borrowed and securities loaned were $9.2 million and $9.2 million , respectively, at November 30, 2016 , and $6.3 million and $16.5 million , respectively, at November 30, 2015 .
96
Table of Contents
JEFFERIES GROUP LLC AND SUBSIDIARIES
NOTES TO CONSOLIDATED FINANCIAL STATEMENTS - CONTINUED
Note 10. Goodwill and Other Intangible Assets
Goodwill
Goodwill attributed to our reportable segments are as follows (in thousands):
| November 30, | ||||||
| 2016 |
| 2015 | ||||
Capital Markets (1) | $ | 1,637,653 | |
| $ | 1,653,588 | |
Asset Management (1) | 3,000 | |
| 3,000 | | ||
Total goodwill | $ | 1,640,653 | |
| $ | 1,656,588 | |
(1) | Accumulated goodwill impairments related to the Capital Markets segment were $51.9 million at December 1, 2016 and 2015 , and goodwill prior to these impairments was $1,689.6 million and $1,705.5 million at December 1, 2016 and 2015 , respectively. Accumulated goodwill impairments related to the Asset Management segment were $2.1 million at December 1, 2016 and 2015 , and goodwill prior to these impairments was $5.1 million at both December 1, 2016 and 2015 . |
The following table is a summary of the changes to goodwill (in thousands):
| Year Ended November 30, | ||||||
| 2016 |
| 2015 | ||||
Balance, at beginning of period | $ | 1,656,588 | |
| $ | 1,662,636 | |
Purchase accounting adjustments (1) | - | |
| (1,959 | ) | ||
Translation adjustments | (15,935 | ) |
| (4,089 | ) | ||
Balance, at end of period | $ | 1,640,653 | |
| $ | 1,656,588 | |
(1) | During the year ended November 30, 2015, we made correcting adjustments to decrease goodwill by $2.0 million . Goodwill had been overstated in the historical financial statements since we became an indirect wholly owned subsidiary of Leucadia on March 1, 2013. Financial instruments owned and Accrued expenses and other liabilities had been understated, while the net deferred tax asset and net income tax receivable, both of which are presented within Other assets on the face of the consolidated statements of financial condition, had been overstated. We do not believe this misstatement is material to our financial statements for any previously reported period. |
Goodwill Impairment Testing
A reporting unit is an operating segment or one level below an operating segment. The quantitative goodwill impairment test is performed at the level of the reporting unit and consists of two steps. In the first step, the fair value of each reporting unit is compared with its carrying value, including goodwill and allocated intangible assets. If the fair value is in excess of the carrying value, the goodwill for the reporting unit is considered not to be impaired. If the fair value is less than the carrying value, then a second step is performed in order to measure the amount of the impairment loss, if any, which is based on comparing the implied fair value of the reporting unit's goodwill to the carrying value of the reporting unit's goodwill.
Allocated equity plus allocated goodwill and intangible assets are used for the carrying amount of each reporting unit. The amount of equity allocated to a reporting unit is based on our cash capital model deployed in managing our businesses, which seeks to approximate the capital a business would require if it were operating independently. Intangible assets are allocated to a reporting unit based on either specifically identifying a particular intangible asset as pertaining to a reporting unit or, if shared among reporting units, based on an assessment of the reporting unit's benefit from the intangible asset in order to generate results.
Estimating the fair value of a reporting unit requires management judgment. Estimated fair values for our reporting units were determined using a market valuation method that incorporate price-to-earnings and price-to-book multiples of comparable public companies. In addition, as the fair values determined under the market approach represent a noncontrolling interest, we applied a control premium to arrive at the estimated fair value of each reporting unit on a controlling basis. We engaged an independent valuation specialist to assist us in our valuation process at August 1, 2016.
97
Table of Contents
JEFFERIES GROUP LLC AND SUBSIDIARIES
NOTES TO CONSOLIDATED FINANCIAL STATEMENTS - CONTINUED
Our annual goodwill impairment testing at August 1, 2016 did not indicate any goodwill impairment in any of our reporting units. Substantially all of our goodwill is allocated to our Investment Banking, Equities, and Fixed Income reporting units, for which the results of our assessment indicated that these reporting units had a fair value in excess of their carrying amounts based on current projections. At November 30, 2016 , goodwill allocated to these reporting units is $1,637.7 million of total goodwill of $1,640.7 million . For the remaining less significant reporting units, we have used a net asset approach for valuation and the fair value of each of the reporting units is equal to its book value.
Intangible Assets
Intangible assets are included in Other assets in the Consolidated Statements of Financial Condition. The following tables present the gross carrying amount, changes in carrying amount, net carrying amount and weighted average amortization period of identifiable intangible assets at November 30, 2016 and 2015 (in thousands):
| November 30, 2016 |
| Weighted average remaining lives (years) | ||||||||||||||||||
| Gross cost |
| Disposals (1) |
| Impairment losses |
| Accumulated amortization |
| Net carrying amount |
| |||||||||||
Customer relationships | $ | 125,381 | |
| $ | - | |
| $ | - | |
| $ | (42,283 | ) |
| $ | 83,098 | |
| 12.1 |
Trade name | 128,052 | |
| - | |
| - | |
| (13,720 | ) |
| 114,332 | |
| 31.3 | |||||
Exchange and clearing organization membership interests and registrations | 11,704 | |
| (1,379 | ) |
| (1,284 | ) |
| - | |
| 9,041 | |
| N/A | |||||
Total | $ | 265,137 | |
| $ | (1,379 | ) |
| $ | (1,284 | ) |
| $ | (56,003 | ) |
| $ | 206,471 | |
|
|
| November 30, 2015 |
| Weighted average remaining lives (years) | ||||||||||||||||||
| Gross cost |
| Disposals (1) |
| Impairment losses |
| Accumulated amortization |
| Net carrying amount |
| |||||||||||
Customer relationships | $ | 127,667 | |
| $ | - | |
| $ | - | |
| $ | (34,754 | ) |
| $ | 92,913 | |
| 12.9 |
Trade name | 131,288 | |
| - | |
| - | |
| (10,315 | ) |
| 120,973 | |
| 32.3 | |||||
Exchange and clearing organization membership interests and registrations | 14,413 | |
| (1,227 | ) |
| (1,289 | ) |
| - | |
| 11,897 | |
| N/A | |||||
Total | $ | 273,368 | |
| $ | (1,227 | ) |
| $ | (1,289 | ) |
| $ | (45,069 | ) |
| $ | 225,783 | |
|
|
(1) | Activity is primarily related to the sale of certain exchange and clearing organization membership interests in the Futures reporting unit due to the exit of the business. |
We performed our annual impairment testing of intangible assets with an indefinite useful life, which consists of exchange and clearing organization membership interests and registrations, at August 1, 2016. We elected to perform a quantitative assessment of membership interests and registrations that have available quoted sales prices as well as certain other membership interests and registrations that have declined in utilization. A qualitative assessment was performed on the remainder of our indefinite-life intangible assets. In applying our quantitative assessment at August 1, 2016 and 2015, we recognized an impairment loss of $1.3 million and $1.3 million , respectively, on certain exchange memberships. With regard to our qualitative assessment of the remaining indefinite-life intangible assets, based on our assessment of market conditions, the utilization of the assets and the replacement costs associated with the assets, we have concluded that it is not more likely than not that the intangible assets are impaired.
Amortization Expense
For finite life intangible assets, aggregate amortization expense amounted to $12.0 million , $12.2 million and $12.8 million for the years ended November 30, 2016 , 2015 and 2014 , respectively. These expenses are included in Other expenses on the Consolidated Statements of Earnings.
The estimated future amortization expense for the five succeeding fiscal years is as follows (in thousands):
Year ended November 30, 2017 | $ | 12,198 | |
Year ended November 30, 2018 | 12,198 | | |
Year ended November 30, 2019 | 12,198 | | |
Year ended November 30, 2020 | 12,198 | | |
Year ended November 30, 2021 | 12,198 | | |
98
Table of Contents
JEFFERIES GROUP LLC AND SUBSIDIARIES
NOTES TO CONSOLIDATED FINANCIAL STATEMENTS - CONTINUED
Note 11. Short-Term Borrowings
Short-term borrowings at November 30, 2016 and 2015 include the following (in thousands):
| November 30, | ||||||
| 2016 |
| 2015 | ||||
Bank loans (1) | $ | 372,301 | |
| $ | 262,000 | |
Secured revolving loan facilities | 57,086 | |
| 48,659 | | ||
Floating rate puttable notes | 96,455 | |
| - | | ||
Total short-term borrowings | $ | 525,842 | |
| $ | 310,659 | |
(1) | Bank loans are payable on demand and must be repaid in one year or less. Amount at November 30, 2016 includes $10.3 million related to bank overdrafts. |
At November 30, 2016 , the weighted average interest rate on short-term borrowings outstanding is 1.77% per annum. Average daily short-term borrowings outstanding were $399.6 million and $65.3 million for the year ended November 30, 2016 and 2015 , respectively.
During 2016, under our $2.0 billion Euro Medium Term Note Program, we issued floating rate puttable notes with an aggregate principal amount of €91.0 million . These notes are currently redeemable.
On February 19, 2016, we entered into a demand loan margin financing facility ("Demand Loan Facility") in a maximum principal amount of $25.0 million to satisfy certain of our margin obligations. Interest is based on an annual rate equal to weighted average LIBOR as defined in the Demand Loan Facility agreement plus 150 basis points . The Demand Loan Facility was terminated with an effective date of November 30, 2016 .
On October 29, 2015 , we entered into a secured revolving loan facility ("First Secured Revolving Loan Facility"), whereby the lender agrees to make available a revolving loan facility in a maximum principal amount of $50.0 million to purchase eligible receivables that meet certain requirements as defined in the First Secured Revolving Loan Facility agreement. Interest is based on an annual rate equal to the lesser of the LIBOR rate plus three and three-quarters percent or the maximum rate as defined in the First Secured Revolving Loan Facility agreement. On December 14, 2015, we entered into a second secured revolving loan facility ("Second Revolving Loan Facility"), whereby the lender agrees to make available a revolving loan facility in a maximum principal amount of $50.0 million to purchase eligible receivables that meet certain requirements as defined in the Second Secured Revolving Loan Facility agreement. Interest is based on an annual rate equal to the lesser of the LIBOR rate plus four and one-quarter percent or the maximum rate as defined in the Second Secured Revolving Loan Facility agreement.
The Bank of New York Mellon agrees to make revolving intraday credit advances ("Intraday Credit Facility") for an aggregate committed amount of $250.0 million . The Intraday Credit Facility contains a financial covenant, which includes a minimum regulatory net capital requirement. Interest is based on the higher of the Federal funds effective rate plus 0.5% or the prime rate. At November 30, 2016 , we were in compliance with debt covenants under the Intraday Credit Facility.
99
Table of Contents
JEFFERIES GROUP LLC AND SUBSIDIARIES
NOTES TO CONSOLIDATED FINANCIAL STATEMENTS - CONTINUED
Note 12. Long-Term Debt
The following summarizes our long-term debt carrying values (including unamortized discounts and premiums and valuation adjustment, where applicable) (in thousands):
| November 30, | ||||||
| 2016 |
| 2015 | ||||
Unsecured Long-Term Debt |
|
|
| ||||
5.5% Senior Notes, due March 15, 2016 (effective interest rate of 2.52%) | $ | - | |
| $ | 353,025 | |
5.125% Senior Notes, due April 13, 2018 (effective interest rate of 3.46%) | 817,813 | |
| 830,298 | | ||
8.5% Senior Notes, due July 15, 2019 (effective interest rate of 4.00%) | 778,367 | |
| 806,125 | | ||
2.375% Euro Medium Term Notes, due May 20, 2020 (effective rate of 2.42%) | 528,250 | |
| 526,436 | | ||
6.875% Senior Notes, due April 15, 2021 (effective interest rate of 4.40%) | 823,797 | |
| 838,765 | | ||
2.25% Euro Medium Term Notes, due July 13, 2022 (effective rate of 4.08%) | 3,848 | |
| 3,779 | | ||
5.125% Senior Notes, due January 20, 2023 (effective interest rate of 4.55%) | 618,355 | |
| 620,890 | | ||
6.45% Senior Debentures, due June 8, 2027 (effective interest rate of 5.46%) | 377,806 | |
| 379,711 | | ||
3.875% Convertible Senior Debentures, due November 1, 2029 (effective interest rate of 3.50%) (1) | 346,187 | |
| 347,307 | | ||
6.25% Senior Debentures, due January 15, 2036 (effective interest rate of 6.03%) | 512,396 | |
| 512,730 | | ||
6.50% Senior Notes, due January 20, 2043 (effective interest rate of 6.09%) | 421,333 | |
| 421,656 | | ||
Structured Notes (2) (3) | 255,203 | |
| - | | ||
Total long-term debt | $ | 5,483,355 | |
| $ | 5,640,722 | |
(1) | The change in fair value of the conversion feature, which is included within Principal transaction revenues in the Consolidated Statements of Earnings, was not material for the years ended November 30, 2016 and 2015 , and amounted to a gain of $8.9 million for the year ended November 30, 2014 . |
(2) | Includes $248.9 million at fair value at November 30, 2016 . A weighted average coupon rate is not meaningful, as substantially all of the structured notes are carried at fair value. |
(3) | Of the $255.2 million of structured notes at November 30, 2016 , $6.3 million matures in 2018, $10.7 million matures in 2019, and the remaining $238.2 million matures in 2024 or thereafter. |
During the year ended November 30, 2016 , we issued structured notes with a total principal amount of approximately $275.4 million . Structured notes of $248.9 million at November 30, 2016 contain various interest rate payment terms and are accounted for at fair value, with changes in fair value resulting from a change in the instrument-specific credit risk presented in other comprehensive income and changes in fair value resulting from non-credit components recognized in Principal transaction revenues. During the year ended November 30, 2014 , under our $2.0 billion Euro Medium Term Note Program, we issued senior unsecured notes with a principal amount of €500.0 million , due 2020. Proceeds amounted to €498.7 million . We did not issue notes during the year ended November 30, 2015 . During the years ended November 30, 2016 , 2015 and 2014 , approximately $350.0 million , $500.0 million and $250.0 million of long-term borrowings matured or were retired, respectively. On January 17, 2017, we issued 4.85% senior notes with a principal amount of $750.0 million , due 2027.
In addition, on January 21, 2016, we issued $15.0 million of Class A Notes, due 2022, and $7.5 million of Class B Notes, due 2022, secured by aircraft and related operating leases and which were non-recourse to us. In June 2016, the Class A Notes and the Class B Notes were repurchased and retired.
100
Table of Contents
JEFFERIES GROUP LLC AND SUBSIDIARIES
NOTES TO CONSOLIDATED FINANCIAL STATEMENTS - CONTINUED
Our 3.875% convertible debentures due 2029 (principal amount of $345.0 million ) (the "debentures") remain issued and outstanding and are convertible into common shares of Leucadia. At December 12, 2016, each $1,000 debenture is currently convertible into 22.7634 shares of Leucadia's common stock (equivalent to a conversion price of approximately $43.93 per share of Leucadia's common stock). The debentures are convertible at the holders' option any time beginning on August 1, 2029 and convertible at any time if: 1) Leucadia's common stock price is greater than or equal to 130% of the conversion price for at least 20 trading days in a period of 30 consecutive trading days; 2) if the trading price per debenture is less than 95% of the price of the common stock times the conversion ratio for any 10 consecutive trading days; 3) if the debentures are called for redemption; or 4) upon the occurrence of specific corporate actions. The debentures may be redeemed for par, plus accrued interest, on or after November 1, 2012 if the price of Leucadia's common stock is greater than 130% of the conversion price for at least 20 days in a period of 30 consecutive trading days and we may redeem the debentures for par, plus accrued interest, at our election any time on or after November 1, 2017. Holders may require us to repurchase the debentures for par, plus accrued interest, on November 1, 2017, 2019 and 2024. In addition to ordinary interest, commencing November 1, 2017, contingent interest will accrue at 0.375% if the average trading price of a debenture for five trading days ending on and including the third trading day immediately preceding a six -month interest period equals or exceeds $1,200 per $1,000 debenture. The conversion option to Leucadia common shares embedded within the debentures is accounted for on a standalone basis at fair value with changes in fair value recognized in Principal transaction revenues and is presented within Long-term debt in the Consolidated Statements of Financial Condition. At November 30, 2016 and 2015 , the fair value of the conversion option was not material.
Secured Long-Term Debt – On August 26, 2011, certain subsidiaries with a guarantee from Jefferies Group LLC entered into a committed senior secured revolving credit facility ("Credit Facility") with a group of commercial banks in U.S. dollars, Euros and Sterling, for an aggregate committed amount of $950.0 million with availability subject to one or more borrowing bases and of which $250.0 million could be borrowed without a borrowing base requirement. On June 26, 2014, we amended and restated the Credit Facility for three years and reduced the committed amount to $750.0 million . The Credit Facility contained certain financial covenants, including, but not limited to, restrictions on future indebtedness of our subsidiaries, minimum tangible net worth and liquidity requirements and minimum capital requirements. Interest was based on, in the case of U.S. dollar borrowings, the Federal funds rate or the London Interbank Offered Rate or, in the case of Euro and Sterling borrowings, the Euro Interbank Offered Rate and the London Interbank Offered Rate, respectively. The obligations of each borrower under the Credit Facility were secured by substantially all the assets of such borrower, but none of the borrowers was responsible for any obligations of any other borrower. We terminated the Credit Facility on July 31, 2015, due to the exiting of the Bache business. For further information with respect to the Credit Facility, refer to Note 22, Exit Costs .
Note 13. Noncontrolling Interests
Noncontrolling interests represent equity interests in consolidated subsidiaries, comprised primarily of asset management entities and investment vehicles set up for the benefit of our employees that are not attributable, either directly or indirectly, to us ( i.e. , minority interests). The following table presents noncontrolling interests at November 30, 2016 and 2015 (in thousands):
| November 30, | ||||||
| 2016 |
| 2015 | ||||
Global Equity Event Opportunity Fund, LLC (1) | $ | - | |
| $ | 26,292 | |
Other | 651 | |
| 1,176 | | ||
Noncontrolling interests | $ | 651 | |
| $ | 27,468 | |
(1) | The reduction is primarily related to the deconsolidation of the entity on December 1, 2015, due to the adoption of ASU No. 2015-02. (See Note 3, Accounting Developments , for further information on the adoption of this guidance.) No gain or loss was recognized upon deconsolidation. Noncontrolling interests attributed to Leucadia were $26.3 million at November 30, 2015 . |
101
Table of Contents
JEFFERIES GROUP LLC AND SUBSIDIARIES
NOTES TO CONSOLIDATED FINANCIAL STATEMENTS - CONTINUED
Note 14. Benefit Plans
U.S. Pension Plan
We maintain a defined benefit pension plan, Jefferies Group LLC Employees' Pension Plan (the "U.S. Pension Plan"), which is subject to the provisions of the Employee Retirement Income Security Act of 1974, as amended, and covers certain of our employees. Under the U.S. Pension Plan, benefits to participants are based on years of service and the employee's career average pay. Effective December 31, 2005, benefits under the U.S. Pension Plan were frozen with no further benefit accruing to participants for future service after December 31, 2005.
Employer Contributions - Our funding policy is to contribute to the U.S. Pension Plan at least the minimum amount required for funding purposes under applicable employee benefit and tax laws. We contributed $3.0 million to the U.S. Pension Plan during the year ended November 30, 2016 . We do not anticipate making a contribution to the plan during the year ended November 30, 2017.
The following tables summarize the changes in the projected benefit obligation, the fair value of the assets and the funded status of the plan (in thousands):
| Year Ended November 30, | ||||||
| 2016 |
| 2015 | ||||
Change in projected benefit obligation: |
|
|
| ||||
Projected benefit obligation, beginning of period | $ | 58,330 | |
| $ | 55,262 | |
Service cost | 400 | |
| 250 | | ||
Interest cost | 2,311 | |
| 2,340 | | ||
Actuarial losses | 862 | |
| 4,280 | | ||
Administrative expenses paid | (461 | ) |
| (359 | ) | ||
Benefits paid | (2,711 | ) |
| (729 | ) | ||
Settlements | - | |
| (2,714 | ) | ||
Projected benefit obligation, end of period | $ | 58,731 | |
| $ | 58,330 | |
Change in plan assets: |
|
|
| ||||
Fair value of assets, beginning of period | $ | 47,031 | |
| $ | 51,085 | |
Benefits paid | (2,711 | ) |
| (729 | ) | ||
Administrative expenses paid | (461 | ) |
| (359 | ) | ||
Actual return on plan assets | 3,133 | |
| (252 | ) | ||
Contributions | 3,000 | |
| - | | ||
Settlements | - | |
| (2,714 | ) | ||
Fair value of assets, end of period | $ | 49,992 | |
| $ | 47,031 | |
Funded status at end of period | $ | (8,739 | ) |
| $ | (11,299 | ) |
The amounts recognized in our Consolidated Statements of Financial Condition are as follows (in thousands):
| November 30, | ||||||
| 2016 |
| 2015 | ||||
Consolidated statements of financial condition: |
|
|
| ||||
Liabilities | $ | 8,739 | |
| $ | 11,299 | |
Accumulated other comprehensive income, before taxes: |
|
|
| ||||
Net losses | $ | (5,901 | ) |
| $ | (5,255 | ) |
102
Table of Contents
JEFFERIES GROUP LLC AND SUBSIDIARIES
NOTES TO CONSOLIDATED FINANCIAL STATEMENTS - CONTINUED
The following tables summarize the components of net periodic pension cost and other amounts recognized in Other comprehensive income, before taxes (in thousands):
| Year Ended November 30, | ||||||||||
| 2016 |
| 2015 |
| 2014 | ||||||
Components of net periodic pension cost: |
|
|
|
|
| ||||||
Service cost | $ | 400 | |
| $ | 250 | |
| $ | 250 | |
Interest cost on projected benefit obligation | 2,311 | |
| 2,340 | |
| 2,429 | | |||
Expected return on plan assets | (2,917 | ) |
| (3,357 | ) |
| (3,125 | ) | |||
Net amortization | - | |
| - | |
| (94 | ) | |||
Settlement losses | - | |
| 244 | |
| - | | |||
Net periodic pension cost | $ | (206 | ) |
| $ | (523 | ) |
| $ | (540 | ) |
| Year Ended November 30, | ||||||||||
| 2016 |
| 2015 |
| 2014 | ||||||
Amounts recognized in Other comprehensive income: |
|
|
|
|
| ||||||
Net losses arising during the period | $ | 646 | |
| $ | 7,890 | |
| $ | 3,784 | |
Amortization of net gain | - | |
| - | |
| 94 | | |||
Settlements during the period | - | |
| (244 | ) |
| - | | |||
Total losses recognized in Other comprehensive income | 646 | |
| 7,646 | |
| 3,878 | | |||
Net losses recognized in net periodic benefit cost and Other comprehensive income | $ | 440 | |
| $ | 7,123 | |
| $ | 3,338 | |
The assumptions used to determine the actuarial present value of the projected obligation and net periodic pension benefit cost are as follows:
| Year Ended November 30, | |||||||
| 2016 |
| 2015 |
| 2014 | |||
Discount rate used to determine benefit obligation | 3.90 | % |
| 4.10 | % |
| 4.30 | % |
Weighted average assumptions used to determine net pension cost: |
|
|
|
|
| |||
Discount rate | 4.10 | % |
| 4.30 | % |
| 5.10 | % |
Expected long-term rate of return on plan assets | 6.25 | % |
| 6.75 | % |
| 6.75 | % |
Expected Benefit Payments - Expected benefit payments for each of the next five fiscal years and in the aggregate for the five fiscal years thereafter are as follows (in thousands):
2017 | $ | 1,981 | |
2018 | 2,149 | | |
2019 | 3,039 | | |
2020 | 2,475 | | |
2021 | 2,311 | | |
2022 through 2026 | 23,957 | | |
103
Table of Contents
JEFFERIES GROUP LLC AND SUBSIDIARIES
NOTES TO CONSOLIDATED FINANCIAL STATEMENTS - CONTINUED
Plan Assets - The following tables present the fair value of plan assets by level within the fair value hierarchy (in thousands):
| At November 30, 2016 | ||||||||||
| Level 1 |
| Level 2 |
| Total | ||||||
Plan assets (1): |
|
|
|
|
| ||||||
Cash and cash equivalents | $ | 1,135 | |
| $ | - | |
| $ | 1,135 | |
Listed equity securities (2) | 32,342 | |
| - | |
| 32,342 | | |||
Fixed income securities: |
|
|
|
|
| ||||||
Corporate debt securities | - | |
| 4,906 | |
| 4,906 | | |||
Foreign corporate debt securities | - | |
| 1,835 | |
| 1,835 | | |||
U.S. government securities | 5,370 | |
| - | |
| 5,370 | | |||
Agency mortgage-backed securities | - | |
| 3,330 | |
| 3,330 | | |||
CMBS | - | |
| 591 | |
| 591 | | |||
ABS | - | |
| 483 | |
| 483 | | |||
Total plan assets | $ | 38,847 | |
| $ | 11,145 | |
| $ | 49,992 | |
(1) | There are no plan assets classified within Level 3 of the fair value hierarchy. |
(2) | Listed equity securities are diversified across a spectrum of primarily U.S. large-cap companies. |
| At November 30, 2015 | ||||||||||
| Level 1 |
| Level 2 |
| Total | ||||||
Plan assets (1): |
|
|
|
|
| ||||||
Cash and cash equivalents | $ | 487 | |
| $ | - | |
| $ | 487 | |
Listed equity securities (2) | 29,156 | |
| - | |
| 29,156 | | |||
Fixed income securities: |
|
|
|
|
| ||||||
Corporate debt securities | - | |
| 6,598 | |
| 6,598 | | |||
Foreign corporate debt securities | - | |
| 2,140 | |
| 2,140 | | |||
U.S. government securities | 3,975 | |
| - | |
| 3,975 | | |||
Agency mortgage-backed securities | - | |
| 3,504 | |
| 3,504 | | |||
CMBS | - | |
| 425 | |
| 425 | | |||
ABS | - | |
| 746 | |
| 746 | | |||
Total plan assets | $ | 33,618 | |
| $ | 13,413 | |
| $ | 47,031 | |
(1) | There are no plan assets classified within Level 3 of the fair value hierarchy. |
(2) | Listed equity securities are diversified across a spectrum of primarily U.S. large-cap companies. |
Valuation technique and inputs - The following is a description of the valuation techniques and inputs used in measuring plan assets accounted for at fair value on a recurring basis:
• | Cash equivalents are valued at cost, which approximates fair value and are categorized in Level 1 of the fair value hierarchy; |
• | Listed equity securities are valued using the quoted prices in active markets for identical assets; |
• | Fixed income securities: |
◦ | Corporate debt, mortgage- and asset-backed securities and other securities valuations use data readily available to all market participants and use inputs available for substantially the full term of the security. Valuation inputs include benchmark yields, reported trades, broker dealer quotes, issuer spreads, two sided markets, benchmark securities, bids, offers, reference data, and industry and economic events; |
◦ | U.S. government and agency securities valuations generally include quoted bid prices in active markets for identical or similar assets. |
104
Table of Contents
JEFFERIES GROUP LLC AND SUBSIDIARIES
NOTES TO CONSOLIDATED FINANCIAL STATEMENTS - CONTINUED
Investment Policies and Strategies - Assets in the plan are invested under guidelines adopted by the Administrative Committee of the U.S. Pension Plan. Because the U.S. Pension Plan exists to provide a vehicle for funding future benefit obligations, the investment objectives of the portfolio take into account the nature and timing of future plan liabilities. The policy recognizes that the portfolio's long-term investment performance and its ability to meet the plan's overall objectives are dependent on the strategic asset allocation which includes adequate diversification among assets classes.
The target allocation of plan assets for 2017 is approximately 50% equities and 50% fixed income securities. The target asset allocation was determined based on the risk tolerance characteristics of the plan and, at times, may be adjusted to achieve the plan's investment objective and to minimize any concentration of investment risk. The Administrative Committee evaluates the asset allocation strategy and adjusts the allocation if warranted based upon market conditions and the impact of the investment strategy on future contribution requirements. The expected long-term rate of return assumption is based on an analysis of historical experience of the portfolio and the summation of prospective returns for each asset class in proportion to the fund's current asset allocation.
The equity portfolio may invest up to 5% of the market value of the portfolio in any one company and may invest up to 10% of the market value of the portfolio in any one sector or up to two times the percentage weighting of any one sector as defined by the S&P 500 or the Russell 1000 Value indices, whichever is higher. Permissible investments specified under the equity portfolio of the plan include equity securities of U.S. and non-U.S. incorporated entities and private placement securities issued pursuant to Rule 144A. At least 75% of the market value of the fixed income portfolio must be invested in investment grade securities rated BBB-/Baa3, including cash and cash equivalents. Permissible investments specified under the fixed income portfolio of the plan include: public or private debt obligations issued or guaranteed by U.S. or foreign issuers; preferred, hybrid, mortgage or asset-backed securities; senior loans; and derivatives and foreign currency exchange contracts.
German Pension Plan
In connection with the acquisition of Jefferies Bache from Prudential on July 1, 2011, we acquired a defined benefits pension plan located in Germany (the "German Pension Plan") for the benefit of eligible employees of Jefferies Bache in that territory. The German Pension Plan has no plan assets and is therefore unfunded. We have purchased insurance contracts from multi-national insurers held in the name of Jefferies Bache Limited to provide for the plan's future obligations. The investment in these insurance contracts is included in Financial Instruments owned in the Consolidated Statements of Financial Condition and has a fair value of $15.2 million and $15.3 million at November 30, 2016 and 2015 , respectively. We expect to pay our pension obligations from the cash flows available to us under the insurance contracts. All costs relating to the plan (including insurance premiums and other costs as computed by the insurers) are paid by us. In connection with the acquisition, it was agreed with Prudential that any insurance premiums and funding obligations related to pre-acquisition date service will be reimbursed to us by Prudential.
The provisions and assumptions used in the German Pension Plan are based on local conditions in Germany. We did no t contribute to the plan during the years ended November 30, 2016 and 2015 .
The following tables summarize the changes in the projected benefit obligation and the components of net periodic pension cost (in thousands):
| Year Ended November 30, | ||||||
| 2016 |
| 2015 | ||||
Change in projected benefit obligation: |
|
|
| ||||
Projected benefit obligation, beginning of period | $ | 23,545 | |
| $ | 28,434 | |
Interest cost | 529 | |
| 523 | | ||
Actuarial loss (gain) | 1,157 | |
| (40 | ) | ||
Benefits paid | (1,104 | ) |
| (1,069 | ) | ||
Currency adjustment | 39 | |
| (4,303 | ) | ||
Projected benefit obligation, end of period | $ | 24,166 | |
| $ | 23,545 | |
Funded status at end of period | $ | (24,166 | ) |
| $ | (23,545 | ) |
105
Table of Contents
JEFFERIES GROUP LLC AND SUBSIDIARIES
NOTES TO CONSOLIDATED FINANCIAL STATEMENTS - CONTINUED
The amounts recognized in our Consolidated Statements of Financial Condition are as follows (in thousands):
| November 30, | ||||||
| 2016 |
| 2015 | ||||
Consolidated statements of financial condition: |
|
|
| ||||
Liabilities | $ | 24,166 | |
| $ | 23,545 | |
Accumulated other comprehensive income, before taxes: |
|
|
| ||||
Net losses | $ | (5,748 | ) |
| $ | (4,917 | ) |
The following tables summarize the components of net periodic pension cost and other amounts recognized in Other comprehensive income, before taxes (in thousands):
| Year Ended November 30, | ||||||||||
| 2016 |
| 2015 |
| 2014 | ||||||
Components of net periodic pension cost: |
|
|
|
|
| ||||||
Service cost | $ | - | |
| $ | - | |
| $ | 40 | |
Interest cost on projected benefit obligation | 529 | |
| 523 | |
| 801 | | |||
Net amortization | 326 | |
| 325 | |
| 244 | | |||
Net periodic pension cost | $ | 855 | |
| $ | 848 | |
| $ | 1,085 | |
| Year Ended November 30, | ||||||||||
| 2016 |
| 2015 |
| 2014 | ||||||
Amounts recognized in other comprehensive income: |
|
|
|
|
| ||||||
Net (gain) loss arising during the period | $ | 1,157 | |
| $ | (39 | ) |
| $ | 4,631 | |
Amortization of net loss | (326 | ) |
| (325 | ) |
| (244 | ) | |||
Total loss (gain) recognized in Other comprehensive income | $ | 831 | |
| $ | (364 | ) |
| $ | 4,387 | |
Net losses recognized in net periodic benefit cost and Other comprehensive income | $ | 1,686 | |
| $ | 484 | |
| $ | 5,472 | |
The following are assumptions used to determine the actuarial present value of the projected benefit obligation and net periodic pension benefit cost:
| Year Ended November 30, | ||||
| 2016 |
| 2015 |
| 2014 |
Projected benefit obligation: |
|
|
|
|
|
Discount rate | 1.70% |
| 2.20% |
| 2.10% |
Rate of compensation increase (1) | N/A |
| N/A |
| 3.00% |
Net periodic pension benefit cost: |
|
|
|
|
|
Discount rate | 2.20% |
| 2.10% |
| 3.40% |
Rate of compensation increase (1) | N/A |
| N/A |
| 3.00% |
(1) There were no active participants of the pension plan at November 30, 2016 and 2015 .
106
Table of Contents
JEFFERIES GROUP LLC AND SUBSIDIARIES
NOTES TO CONSOLIDATED FINANCIAL STATEMENTS - CONTINUED
Expected Benefit Payments - Expected benefit payments for each of the next five fiscal years and in the aggregate for the five fiscal years thereafter are as follows (in thousands):
2017 | $ | 1,142 | |
2018 | 1,147 | | |
2019 | 1,122 | | |
2020 | 1,169 | | |
2021 | 1,177 | | |
2022 through 2026 | 5,814 | | |
Note 15. Compensation Plans
Leucadia sponsors our following share-based compensation plans: Incentive Compensation Plan, Employee Stock Purchase Plan ("ESPP") and the Deferred Compensation Plan. The outstanding and future share-based awards relating to these plans relate to Leucadia common shares. The fair value of share-based awards is estimated on the date of grant based on the market price of the underlying common stock less the impact of market conditions and selling restrictions subsequent to vesting, if any, and is amortized as compensation expense over the related requisite service periods. We are allocated costs associated with awards granted to our employees under such plans.
In addition, we sponsor non-share-based compensation plans. Non-share-based compensation plans sponsored by us include a profit sharing plan and other forms of restricted cash awards.
The components of total compensation cost associated with certain of our compensation plans are as follows (in millions):
| Year Ended November 30, | ||||||||||
| 2016 |
| 2015 |
| 2014 | ||||||
Components of compensation cost: |
|
|
|
|
| ||||||
Restricted cash awards | $ | 263.7 | |
| $ | 249.2 | |
| $ | 193.7 | |
Restricted stock and RSUs (1) | 23.5 | |
| 57.9 | |
| 84.5 | | |||
Profit sharing plan | 6.0 | |
| 6.1 | |
| 6.1 | | |||
Total compensation cost | $ | 293.2 | |
| $ | 313.2 | |
| $ | 284.3 | |
(1) | Total compensation cost associated with restricted stock and RSUs includes the amortization of sign-on, retention and senior executive awards, less forfeitures and clawbacks. Additionally, we recognize compensation cost related to the discount provided to employees in electing to defer compensation under the Deferred Compensation Plan. This compensation cost was approximately $150,000 , $399,000 and $268,000 for the years ended November 30, 2016 , 2015 and 2014 , respectively. |
Remaining unamortized amounts related to certain compensation plans at November 30, 2016 are as follows (dollars in millions):
| Remaining Unamortized Amounts |
| Weighted Average Vesting Period (in Years) | ||
Non-vested share-based awards | $ | 29.9 | |
| 2 |
Restricted cash awards | 468.3 | |
| 3 | |
Total | $ | 498.2 | |
|
|
107
Table of Contents
JEFFERIES GROUP LLC AND SUBSIDIARIES
NOTES TO CONSOLIDATED FINANCIAL STATEMENTS - CONTINUED
In December 2016, we approved approximately $96.1 million of restricted cash awards related to the 2016 performance year that contain a future service requirement. Absent estimated or actual forfeitures or cancellations or accelerations, the annual compensation cost for these awards will be recognized as follows (in millions):
| Year Ended November 30, |
|
|
|
| ||||||||||||||
| 2016 |
| 2017 |
| 2018 |
| Thereafter |
| Total | ||||||||||
Restricted cash awards | $ | 19.1 | |
| $ | 19.1 | |
| $ | 18.4 | |
| $ | 39.5 | |
| $ | 96.1 | |
The following are descriptions of the compensation plans.
Incentive Compensation Plan. The Incentive Compensation Plan ("Incentive Plan") allows for awards in the form of incentive stock options (within the meaning of Section 422 of the Internal Revenue Code), nonqualified stock options, stock appreciation rights, restricted stock, unrestricted stock, performance awards, restricted stock units, dividend equivalents or other share-based awards. Restricted stock units ("RSUs") give a participant the right to receive fully vested common shares at the end of a specified deferral period, allowing a participant to hold an interest tied to common stock on a tax deferred basis. Prior to settlement, RSUs carry no voting or dividend rights associated with the stock ownership, but dividend equivalents are accrued to the extent there are dividends declared on the underlying common shares as cash amounts or as deemed reinvestments in additional RSUs. Awards issued and outstanding related to the Incentive Plan relate to shares of Leucadia.
Restricted stock and RSUs may be granted to new employees as sign-on awards, to existing employees as "retention" awards and to certain executive officers as awards for multiple years. Sign-on and retention awards are generally subject to annual ratable vesting over a four -year service period and are amortized as compensation expense on a straight line basis over the related four years. Restricted stock and RSUs are granted to certain senior executives with market, performance and service conditions. Market conditions are incorporated into the grant-date fair value of senior executive awards using a Monte Carlo valuation model. Compensation expense for awards with market conditions is recognized over the service period and is not reversed if the market condition is not met. Awards with performance conditions are amortized over the service period if we determine that it is probable that the performance condition will be achieved. Awards granted to senior executives related to the 2015 and 2014 fiscal years did not meet performance targets, and as a result, compensation expense has been adjusted to reflect the reduced number of shares that have vested.
Employee Stock Purchase Plan. There is also an ESPP which we consider noncompensatory effective January 1, 2007. The ESPP permits all regular full-time employees and employees who work part time over 20 hours per week to purchase, at a discount, Leucadia common shares. Annual employee contributions are limited to $21,250 , are voluntary and made through payroll deduction. The stock purchase price is equal to 95% of the closing price of common stock on the last day of the applicable session (monthly).
Deferred Compensation Plan. There is also a Deferred Compensation Plan, which was established in 2001. Eligible employees are able to defer compensation on a pre-tax basis, with deferred amounts deemed invested at a discount in Leucadia common shares, or by allocating among any combination of other investment funds available under the Deferred Compensation Plan. We often invest directly, as a principal, in investments corresponding to the other investment funds, relating to our obligations to perform under the Deferred Compensation Plan. The compensation deferred by our employees is expensed in the period earned. The change in fair value of our investments in assets corresponding to the specified other investment funds are recognized in Principal transaction revenues and changes in the corresponding deferred compensation liability are reflected as Compensation and benefits expense in our Consolidated Statements of Earnings.
Profit Sharing Plan . We have a profit sharing plan, covering substantially all employees, which includes a salary reduction feature designed to qualify under Section 401(k) of the Internal Revenue Code.
Restricted Cash Awards. We provide compensation to new and existing employees in the form of loans and/or other cash awards which are subject to ratable vesting terms with service requirements. We amortize these awards to compensation expense over the relevant service period, which is generally considered to start at the beginning of the annual compensation year.
108
Table of Contents
JEFFERIES GROUP LLC AND SUBSIDIARIES
NOTES TO CONSOLIDATED FINANCIAL STATEMENTS - CONTINUED
Note 16. Non-interest Expenses
See the Consolidated Statements of Earnings for details on our non-interest expenses. Included within Other expenses are the following (in thousands):
| Year Ended November 30, | ||||||||||
| 2016 |
| 2015 |
| 2014 | ||||||
Bad debt provision (1) | $ | 7,365 | |
| $ | (396 | ) |
| $ | 55,355 | |
Goodwill impairment (2) | - | |
| - | |
| 54,000 | | |||
Intangible assets amortization and impairment (3) | 13,328 | |
| 13,487 | |
| 20,569 | | |||
(1) | During the year ended November 30, 2015, we released $4.4 million in reserves related to the resolution of bankruptcy claims against Lehman Brothers Holdings, Inc. During the fourth quarter of 2014, we recognized a bad debt provision, which primarily relates to a receivable of $52.3 million from a client to which we provided futures clearing and execution services, which declared bankruptcy. |
(2) | Goodwill impairment losses of $51.9 million and $2.1 million at November 30, 2014 were recognized in the Futures and International Asset Management reporting units at November 30, 2014, respectively. (See Note 10, Goodwill and Other Intangible Assets for further information.) |
(3) | The amounts for the years ended November 30, 2016 and 2015 both include an impairment loss of $1.3 million on certain exchange memberships. The amount for the year ended November 30, 2014 includes impairment losses at November 30, 2014 of $7.5 million and $0.1 million in the Futures business and the International Asset Management business, respectively. (See Note 10, Goodwill and Other Intangible Assets for further information.) |
Note 17. Income Taxes
Total income taxes were allocated as follows (in thousands):
| Year Ended November 30, | ||||||||||
| 2016 |
| 2015 |
| 2014 | ||||||
Income tax expense | $ | 14,566 | |
| $ | 18,898 | |
| $ | 142,061 | |
Stockholders' equity, for compensation expense for tax purposes (in excess of)/less than amounts recognized for financial reporting purposes | 4,186 | |
| 5,935 | |
| (1,276 | ) | |||
The provision for income tax expense consists of the following components (in thousands):
| Year Ended November 30, | ||||||||||
| 2016 |
| 2015 |
| 2014 | ||||||
Current: |
|
|
|
|
| ||||||
U.S. Federal | $ | 27,473 | |
| $ | (45,007 | ) |
| $ | 4,335 | |
U.S. state and local | 6,196 | |
| (28,260 | ) |
| 4,056 | | |||
Foreign | (5,090 | ) |
| 3,369 | |
| 11,475 | | |||
Total current | 28,579 | |
| (69,898 | ) |
| 19,866 | | |||
Deferred: |
|
|
|
|
| ||||||
U.S. Federal | (11,249 | ) |
| 74,085 | |
| 87,293 | | |||
U.S. state and local | (4,819 | ) |
| 22,811 | |
| 27,181 | | |||
Foreign | 2,055 | |
| (8,100 | ) |
| 7,721 | | |||
Total deferred | (14,013 | ) |
| 88,796 | |
| 122,195 | | |||
Total income tax expense | $ | 14,566 | |
| $ | 18,898 | |
| $ | 142,061 | |
109
Table of Contents
JEFFERIES GROUP LLC AND SUBSIDIARIES
NOTES TO CONSOLIDATED FINANCIAL STATEMENTS - CONTINUED
The following table presents the U.S. and non-U.S. components of income before income tax expense (in thousands):
| Year Ended November 30, | ||||||||||
| 2016 |
| 2015 |
| 2014 | ||||||
U.S. | $ | 34,178 | |
| $ | 82,515 | |
| $ | 285,806 | |
Non-U.S. (1) | (4,206 | ) |
| 31,712 | |
| 17,215 | | |||
Income before income tax expense | $ | 29,972 | |
| $ | 114,227 | |
| $ | 303,021 | |
(1) | For purposes of this table, non-U.S. income is defined as income generated from operations located outside the U.S. |
Income tax expense differed from the amounts computed by applying the U.S. Federal statutory income tax rate of 35% to earnings before income taxes as a result of the following (dollars in thousands):
| Year Ended November 30, | |||||||||||||||||||
| 2016 |
| 2015 |
| 2014 | |||||||||||||||
| Amount |
| Percent |
| Amount |
| Percent |
| Amount |
| Percent | |||||||||
Computed expected income taxes | $ | 10,490 | |
| 35.0 | % |
| $ | 39,979 | |
| 35.0 | % |
| $ | 106,058 | |
| 35.0 | % |
Increase (decrease) in income taxes resulting from: |
|
|
|
|
|
|
|
|
|
|
| |||||||||
State and city income taxes, net of Federal income tax benefit | 124 | |
| 0.5 | |
| (3,542 | ) |
| (3.1 | ) |
| 20,304 | |
| 6.7 | | |||
International operations (including foreign rate differential) | (3,404 | ) |
| (11.4 | ) |
| (11,474 | ) |
| (10.0 | ) |
| (3,061 | ) |
| (1.0 | ) | |||
Tax exempt income | (4,640 | ) |
| (15.5 | ) |
| (6,789 | ) |
| (5.9 | ) |
| (6,746 | ) |
| (2.2 | ) | |||
Non deductible settlements | - | |
| - | |
| - | |
| - | |
| 3,850 | |
| 1.3 | | |||
Valuation allowance related to the Jefferies Bache business | - | |
| - | |
| - | |
| - | |
| 4,655 | |
| 1.5 | | |||
Goodwill impairment | - | |
| - | |
| - | |
| - | |
| 13,619 | |
| 4.5 | | |||
Foreign tax credits | - | |
| - | |
| (7,240 | ) |
| (6.3 | ) |
| (3,149 | ) |
| (1.0 | ) | |||
Non-deductible Jefferies Bache wind down costs | - | |
| - | |
| 3,225 | |
| 2.8 | |
| - | |
| - | | |||
Meals and entertainment | 4,640 | |
| 15.5 | |
| 5,232 | |
| 4.6 | |
| 4,103 | |
| 1.4 | | |||
Excess stock detriment | 9,755 | |
| 32.6 | |
| - | |
| - | |
| - | |
| - | | |||
Federal benefits related to prior year tax filings | (2,928 | ) |
| (9.8 | ) |
| 199 | |
| 0.1 | |
| 1,055 | |
| 0.3 | | |||
Other, net | 529 | |
| 1.7 | |
| (692 | ) |
| (0.7 | ) |
| 1,373 | |
| 0.4 | | |||
Total income taxes | $ | 14,566 | |
| 48.6 | % |
| $ | 18,898 | |
| 16.5 | % |
| $ | 142,061 | |
| 46.9 | % |
The following table presents a reconciliation of gross unrecognized tax benefits (in thousands):
| Year Ended November 30, | ||||||||||
| 2016 |
| 2015 |
| 2014 | ||||||
Balance at beginning of period | $ | 107,902 | |
| $ | 126,662 | |
| $ | 126,844 | |
Increases based on tax positions related to the current period | 5,045 | |
| - | |
| 4,831 | | |||
Increases based on tax positions related to prior periods | 1,447 | |
| 2,818 | |
| 1,624 | | |||
Decreases based on tax positions related to prior periods | (4,520 | ) |
| (3,883 | ) |
| (1,709 | ) | |||
Decreases related to settlements with taxing authorities | (347 | ) |
| (17,695 | ) |
| (4,928 | ) | |||
Balance at end of period | $ | 109,527 | |
| $ | 107,902 | |
| $ | 126,662 | |
The total amount of unrecognized benefit that, if recognized, would favorably affect the effective tax rate was $73.1 million and $71.9 million (net of federal benefits of taxes) at November 30, 2016 and 2015 , respectively.
110
Table of Contents
JEFFERIES GROUP LLC AND SUBSIDIARIES
NOTES TO CONSOLIDATED FINANCIAL STATEMENTS - CONTINUED
We recognize interest accrued related to unrecognized tax benefits in Interest expense. Penalties, if any, are recognized in Other expenses in the Consolidated Statements of Earnings. Net interest expense related to unrecognized tax benefits was $6.5 million , $2.2 million and $7.7 million for the years ended November 30, 2016 , 2015 and 2014 , respectively. At November 30, 2016 and 2015 , we had interest accrued of approximately $39.3 million and $32.8 million , respectively, included in Accrued expenses and other liabilities in the Consolidated Statements of Financial Condition. No material penalties were accrued for the years ended November 30, 2016 and 2015 .
The cumulative tax effects of temporary differences that give rise to significant portions of the deferred tax assets and liabilities are presented below (in thousands):
| November 30, | ||||||
| 2016 |
| 2015 | ||||
Deferred tax assets: |
|
|
| ||||
Compensation and benefits | $ | 285,542 | |
| $ | 253,291 | |
Net operating loss | 11,021 | |
| 7,862 | | ||
Long-term debt | 60,707 | |
| 95,765 | | ||
Accrued expenses and other | 124,269 | |
| 113,259 | | ||
Sub-total | 481,539 | |
| 470,177 | | ||
Valuation allowance | (9,464 | ) |
| (13,337 | ) | ||
Total deferred tax assets | 472,075 | |
| 456,840 | | ||
Deferred tax liabilities: |
|
|
| ||||
Amortization of intangibles | 107,474 | |
| 103,560 | | ||
Other | 21,630 | |
| 26,345 | | ||
Total deferred tax liabilities | 129,104 | |
| 129,905 | | ||
Net deferred tax asset, included in Other assets | $ | 342,971 | |
| $ | 326,935 | |
The valuation allowance represents the portion of our deferred tax assets for which it is more likely than not that the benefit of such items will not be realized. We believe that the realization of the net deferred tax asset of $343.0 million is more likely than not based on expectations of future taxable income in the jurisdictions in which we operate.
At November 30, 2016 , we had gross net operating loss carryforwards of $56.3 million , primarily in Europe (primarily the United Kingdom ("U.K.")). The losses in the U.K. have an unlimited carryforward period. A deferred tax asset of $0.8 million related to net operating losses in Asia has been fully offset by a valuation allowance while $5.9 million of deferred tax assets related to net operating losses in Europe has been fully offset by a valuation allowance. The remaining valuation allowance is attributable to deferred tax assets related to compensation and benefits, capital losses, and tax credits in the U.K.
We have a tax sharing agreement between us and Leucadia. Refer to Note 21. Related Party Transactions, for further information.
At November 30, 2016 and 2015 , we had approximately $157.0 million and $205.0 million , respectively, of earnings attributable to foreign subsidiaries that are indefinitely reinvested abroad and for which no U.S. Federal income tax provision has been recorded. Accordingly, a deferred tax liability of approximately $55.0 million and $59.0 million has not been recorded with respect to these earnings at November 30, 2016 and 2015 , respectively.
We are currently under examination by the Internal Revenue Service and other major tax jurisdictions. We do not expect that resolution of these examinations will have a material effect on our consolidated financial position, but could have a material impact on the consolidated results of operations for the period in which resolution occurs. It is reasonably possible that, within the next twelve months, statutes of limitation will expire which would have the effect of reducing the balance of unrecognized tax benefits by $2.7 million .
111
Table of Contents
JEFFERIES GROUP LLC AND SUBSIDIARIES
NOTES TO CONSOLIDATED FINANCIAL STATEMENTS - CONTINUED
The table below summarizes the earliest tax years that remain subject to examination in the major tax jurisdictions in which we operate:
Jurisdiction | Tax Year |
United States | 2007 |
California | 2007 |
New Jersey | 2010 |
New York State | 2001 |
New York City | 2003 |
United Kingdom | 2014 |
Hong Kong | 2009 |
Note 18. Commitments, Contingencies and Guarantees
Commitments
The following table summarizes our commitments at November 30, 2016 (in millions):
| Expected Maturity Date (fiscal years) |
|
| ||||||||||||||||||||
| 2017 |
| 2018 |
| 2019 and 2020 |
| 2021 and 2022 |
| 2023 and Later |
| Maximum Payout | ||||||||||||
Equity commitments (1) | $ | 0.8 | |
| $ | 8.6 | |
| $ | 11.3 | |
| $ | - | |
| $ | 234.0 | |
| $ | 254.7 | |
Loan commitments (1) | 304.6 | |
| 11.9 | |
| 71.6 | |
| 44.0 | |
| - | |
| 432.1 | | ||||||
Underwriting commitments | 349.4 | |
| - | |
| - | |
| - | |
| - | |
| 349.4 | | ||||||
Forward starting reverse repos (2) | 4,668.7 | |
| - | |
| - | |
| - | |
| - | |
| 4,668.7 | | ||||||
Forward starting repos (2) | 2,539.2 | |
| - | |
| - | |
| - | |
| - | |
| 2,539.2 | | ||||||
Other unfunded commitments (1) | - | |
| 37.0 | |
| 4.8 | |
| 33.8 | |
| 13.2 | |
| 88.8 | | ||||||
Total commitments | $ | 7,862.7 | |
| $ | 57.5 | |
| $ | 87.7 | |
| $ | 77.8 | |
| $ | 247.2 | |
| $ | 8,332.9 | |
(1) | Equity, loan and other unfunded commitments are presented by contractual maturity date. The amounts, however, are available on demand. |
(2) | At November 30, 2016 , $4,592.9 million within forward starting reverse repos and $2,464.6 million within repos settled within three business days. |
Equity Commitments. Includes commitments to invest in our joint ventures, Jefferies Finance and Jefferies LoanCore, and commitments to invest in private equity funds and in Jefferies Capital Partners, LLC, the manager of the private equity funds, which consists of a team led by Brian P. Friedman, one of our directors and Chairman of the Executive Committee. At November 30, 2016 , our outstanding commitments relating to Jefferies Capital Partners, LLC and its private equity funds was $23.1 million .
See Note 9, Investments , for additional information regarding our investments in Jefferies Finance and Jefferies LoanCore.
Additionally, at November 30, 2016 , we had other outstanding equity commitments to invest up to $1.6 million in various other investments.
Loan Commitments. From time to time we make commitments to extend credit to investment banking and other clients in loan syndication, acquisition finance and securities transactions and to SPE sponsors in connection with the funding of CLO and other asset-backed transactions. These commitments and any related drawdowns of these facilities typically have fixed maturity dates and are contingent on certain representations, warranties and contractual conditions applicable to the borrower. At November 30, 2016 , we had $182.1 million of outstanding loan commitments to clients.
Loan commitments outstanding at November 30, 2016 also include our portion of the outstanding secured revolving credit facility provided to Jefferies Finance, to support loan underwritings by Jefferies Finance.
Underwriting Commitments. In connection with investment banking activities, we may from time to time provide underwriting commitments to our clients in connection with capital raising transactions.
112
Table of Contents
JEFFERIES GROUP LLC AND SUBSIDIARIES
NOTES TO CONSOLIDATED FINANCIAL STATEMENTS - CONTINUED
Forward Starting Reverse Repos and Repos. We enter into commitments to take possession of securities with agreements to resell on a forward starting basis and to sell securities with agreements to repurchase on a forward starting basis that are primarily secured by U.S. government and agency securities.
Other Unfunded Commitments. Other unfunded commitments include obligations in the form of revolving notes to provide financing to asset-backed and CLO vehicles. Upon advancing funds, drawn amounts are collateralized by the assets of an entity.
Leases. As lessee, we lease certain premises and equipment under non-cancelable agreements expiring at various dates through 2039 which are operating leases. At November 30, 2016 , future minimum aggregate annual lease payments under such leases (net of subleases) for fiscal years ended November 30, 2017 through 2021 and the aggregate amount thereafter, are as follows (in thousands):
Fiscal Year | Operating Leases | ||
2017 | $ | 61,226 | |
2018 | 61,701 | | |
2019 | 59,364 | | |
2020 | 50,521 | | |
2021 | 48,429 | | |
Thereafter | 564,077 | | |
Total | $ | 845,318 | |
The total minimum rentals to be received in the future under non-cancelable subleases at November 30, 2016 was $17.6 million .
Rental expense, net of subleases, amounted to $56.1 million , $57.4 million and $57.4 million for the years ended November 30, 2016 , 2015 and 2014 , respectively.
During 2012, we entered into a master sale and leaseback agreement under which we sold and have leased back existing and additional new equipment supplied by the lessor. The transaction resulted in a gain of $2.0 million , which is being amortized into earnings in proportion to and is reflected net against the leased equipment. The lease may be terminated by us in the third quarter of fiscal 2017 for a termination cost of the present value of the remaining lease payments plus a residual value. If not terminated early, the lease term is approximately five years from the start of the supply of new and additional equipment, which commenced on various dates in 2013 and continued into 2015. At November 30, 2016 , minimum future lease payments are as follows (in thousands):
Fiscal Year | Minimum Future Lease Payments | ||
2017 | $ | 3,798 | |
2018 | 1,513 | | |
2019 | 189 | | |
Net minimum lease payments | 5,500 | | |
Less amount representing interest | 177 | | |
Present value of net minimum lease payments | $ | 5,323 | |
Guarantees
Derivative Contracts. As a dealer, we make markets and trade in a variety of derivative instruments. Certain derivative contracts that we have entered into meet the accounting definition of a guarantee under U.S. GAAP, including credit default swaps, written foreign currency options and written equity put options. On certain of these contracts, such as written interest rate caps and foreign currency options, the maximum payout cannot be quantified since the increase in interest or foreign exchange rates are not contractually limited by the terms of the contract. As such, we have disclosed notional values as a measure of our maximum potential payout under these contracts.
113
Table of Contents
JEFFERIES GROUP LLC AND SUBSIDIARIES
NOTES TO CONSOLIDATED FINANCIAL STATEMENTS - CONTINUED
The following table summarizes the notional amounts associated with our derivative contracts meeting the definition of a guarantee under U.S. GAAP at November 30, 2016 (in millions):
| Expected Maturity Date (Fiscal Years) |
|
| ||||||||||||||||||||
| 2017 |
| 2018 |
| 2019 and 2020 |
| 2021 and 2022 |
| 2023 and Later |
| Notional/ Maximum Payout | ||||||||||||
Guarantee Type: |
|
|
|
|
|
|
|
|
|
|
| ||||||||||||
Derivative contracts-non-credit related | $ | 18,838.6 | |
| $ | 820.4 | |
| $ | - | |
| $ | - | |
| $ | 421.8 | |
| $ | 20,080.8 | |
Written derivative contracts-credit related | - | |
| 52.2 | |
| 24.6 | |
| 360.8 | |
| - | |
| 437.6 | | ||||||
Total derivative contracts | $ | 18,838.6 | |
| $ | 872.6 | |
| $ | 24.6 | |
| $ | 360.8 | |
| $ | 421.8 | |
| $ | 20,518.4 | |
At November 30, 2016 the external credit ratings of the underlyings or referenced assets for our credit related derivatives contracts (in millions):
| External Credit Rating |
|
| ||||||||||||||||||||||||
| AAA/ Aaa |
| AA/Aa |
| A |
| BBB/ Baa |
| Below Investment Grade |
| Unrated |
| Notional/ Maximum Payout | ||||||||||||||
Credit related derivative contracts: |
|
|
|
|
|
|
|
|
|
|
|
|
| ||||||||||||||
Index credit default swaps | $ | 54.0 | |
| $ | - | |
| $ | - | |
| $ | - | |
| $ | - | |
| $ | - | |
| $ | 54.0 | |
Single name credit default swaps | - | |
| - | |
| 79.5 | |
| 42.9 | |
| 261.2 | |
| - | |
| 383.6 | | |||||||
The derivative contracts deemed to meet the definition of a guarantee under U.S. GAAP are before consideration of hedging transactions and only reflect a partial or "one-sided" component of any risk exposure. Written equity options and written credit default swaps are often executed in a strategy that is in tandem with long cash instruments ( e.g. , equity and debt securities). We substantially mitigate our exposure to market risk on these contracts through hedges, such as other derivative contracts and/or cash instruments, and we manage the risk associated with these contracts in the context of our overall risk management framework. We believe notional amounts overstate our expected payout and that fair value of these contracts is a more relevant measure of our obligations. At November 30, 2016 , the fair value of derivative contracts meeting the definition of a guarantee is approximately $313.1 million .
Loan Guarantees . We have provided a guarantee to Jefferies Finance that matures in January 2021, whereby we are required to make certain payments to an SPE sponsored by Jefferies Finance in the event that Jefferies Finance is unable to meet its obligations to the SPE. The maximum amount payable under the guarantee is $18.1 million at November 30, 2016 . We have also provided a guarantee of a portion of Energy Partners I, LP's obligations under a credit agreement. The maximum exposure to loss of the guarantee is $3.0 million at November 30, 2016 . See Note 8, Variable Interest Entities for further information.
Standby Letters of Credit. At November 30, 2016 , we provided guarantees to certain counterparties in the form of standby letters of credit in the amount of $33.3 million , which expire within two years . Standby letters of credit commit us to make payment to the beneficiary if the guaranteed party fails to fulfill its obligation under a contractual arrangement with that beneficiary. Since commitments associated with these collateral instruments may expire unused, the amount shown does not necessarily reflect the actual future cash funding requirement.
Other Guarantees. We are members of various exchanges and clearing houses. In the normal course of business we provide guarantees to securities clearinghouses and exchanges. These guarantees generally are required under the standard membership agreements, such that members are required to guarantee the performance of other members. Additionally, if a member becomes unable to satisfy its obligations to the clearinghouse, other members would be required to meet these shortfalls. To mitigate these performance risks, the exchanges and clearinghouses often require members to post collateral. Our obligations under such guarantees could exceed the collateral amounts posted. Our maximum potential liability under these arrangements cannot be quantified; however, the potential for us to be required to make payments under such guarantees is deemed remote. Accordingly, no liability has been recognized for these arrangements.
114
Table of Contents
JEFFERIES GROUP LLC AND SUBSIDIARIES
NOTES TO CONSOLIDATED FINANCIAL STATEMENTS - CONTINUED
Note 19. Net Capital Requirements
As broker-dealers registered with the SEC and member firms of the Financial Industry Regulatory Authority ("FINRA"), Jefferies and Jefferies Execution are subject to the SEC Uniform Net Capital Rule ("Rule 15c3-1"), which requires the maintenance of minimum net capital, and have elected to calculate minimum capital requirements under the alternative method permitted by Rule 15c3-1 in calculating net capital. Jefferies is also registered as an FCM and is subject to Rule 1.17 of the CFTC, which sets forth minimum financial requirements. The minimum net capital requirement in determining excess net capital for a dually registered U.S. broker-dealer and FCM is equal to the greater of the requirement under Rule 15c3-1 or CFTC Rule 1.17.
At November 30, 2016 , Jefferies and Jefferies Execution's net capital and excess net capital were as follows (in thousands):
| Net Capital |
| Excess Net Capital | ||||
Jefferies | $ | 1,467,729 | |
| $ | 1,398,748 | |
Jefferies Execution | 8,260 | |
| 8,010 | | ||
FINRA is the designated self-regulatory organization ("DSRO") for our U.S. broker-dealers and the National Futures Association is the DSRO for Jefferies as an FCM.
Certain other U.S. and non-U.S. subsidiaries are subject to capital adequacy requirements as prescribed by the regulatory authorities in their respective jurisdictions, including Jefferies International Limited, which is authorized and regulated by the Financial Conduct Authority in the U.K.
The regulatory capital requirements referred to above may restrict our ability to withdraw capital from our regulated subsidiaries.
At November 30, 2016 and 2015 , $4,833.0 million and $5,202.7 million , respectively, of net assets of our consolidated subsidiaries are restricted, as they reflect regulatory capital requirements or require regulatory approval prior to the payment of cash dividends and advances to the parent company.
Note 20. Segment Reporting
We operate in two principal segments – Capital Markets and Asset Management. The Capital Markets segment includes our securities, commodities, futures and foreign exchange brokerage trading activities and investment banking, which is composed of underwriting and financial advisory activities. The Capital Markets reportable segment provides the sales, trading, origination and advisory effort for various fixed income, equity and advisory products and services. The Asset Management segment provides investment management services to investors in the U.S. and overseas.
Our reportable business segment information is prepared using the following methodologies:
• | Net revenues and expenses directly associated with each reportable business segment are included in determining earnings before taxes. |
• | Net revenues and expenses not directly associated with specific reportable business segments are allocated based on the most relevant measures applicable, including each reportable business segment's net revenues, headcount and other factors. |
• | Reportable business segment assets include an allocation of indirect corporate assets that have been fully allocated to our reportable business segments, generally based on each reportable business segment's capital utilization. |
115
Table of Contents
JEFFERIES GROUP LLC AND SUBSIDIARIES
NOTES TO CONSOLIDATED FINANCIAL STATEMENTS - CONTINUED
Our net revenues and expenses by segment are summarized below (in millions):
| Year Ended November 30, | ||||||||||
| 2016 |
| 2015 |
| 2014 | ||||||
Capital Markets: |
|
|
|
|
| ||||||
Net revenues | $ | 2,339.3 | |
| $ | 2,415.1 | |
| $ | 2,949.0 | |
Expenses | $ | 2,321.5 | |
| $ | 2,325.2 | |
| $ | 2,652.0 | |
Asset Management: |
|
|
|
|
| ||||||
Net revenues | $ | 75.3 | |
| $ | 60.1 | |
| $ | 41.1 | |
Expenses | $ | 63.1 | |
| $ | 35.8 | |
| $ | 35.1 | |
Total: |
|
|
|
|
| ||||||
Net revenues | $ | 2,414.6 | |
| $ | 2,475.2 | |
| $ | 2,990.1 | |
Expenses | $ | 2,384.6 | |
| $ | 2,361.0 | |
| $ | 2,687.1 | |
The following table summarizes our total assets by segment (in millions):
| November 30, | ||||||
| 2016 |
| 2015 | ||||
Segment assets: |
|
|
| ||||
Capital Markets | $ | 35,931.8 | |
| $ | 37,805.0 | |
Asset Management | 1,009.5 | |
| 759.0 | | ||
Total assets | $ | 36,941.3 | |
| $ | 38,564.0 | |
Net Revenues by Geographic Region
Net revenues for the Capital Market segment are recorded in the geographic region in which the position was risk-managed or, in the case of investment banking, in which the senior coverage banker is located. For Asset Management, net revenues are allocated according to the location of the investment advisor. Net revenues by geographic region were as follows (in thousands):
| Year Ended November 30, | ||||||||||
| 2016 |
| 2015 |
| 2014 | ||||||
Americas (1) | $ | 1,870,355 | |
| $ | 1,887,007 | |
| $ | 2,261,683 | |
Europe (2) | 458,046 | |
| 510,044 | |
| 634,358 | | |||
Asia | 86,213 | |
| 78,190 | |
| 94,097 | | |||
Net revenues | $ | 2,414,614 | |
| $ | 2,475,241 | |
| $ | 2,990,138 | |
(1) | Substantially all relates to U.S. results. |
(2) | Substantially all relates to U.K. results. |
116
Table of Contents
JEFFERIES GROUP LLC AND SUBSIDIARIES
NOTES TO CONSOLIDATED FINANCIAL STATEMENTS - CONTINUED
Note 21. Related Party Transactions
Jefferies Capital Partners Related Funds. We have equity investments in the JCP Manager and in private equity funds, which are managed by a team led by Brian P. Friedman, one of our directors and our Chairman of the Executive Committee ("Private Equity Related Funds"). At November 30, 2016 and 2015 , our equity investments in Private Equity Related Funds were in aggregate $37.7 million and $39.6 million , respectively. We also charge the JCP Manager for certain services under a service agreement. The following table presents other revenues and investment income (loss) related to net gains and losses on our investment in Private Equity Related Funds and service charges (in thousands):
| Year Ended November 30, | ||||||||||
| 2016 |
| 2015 |
| 2014 | ||||||
Other revenues and investment income (loss) | $ | (2,328 | ) |
| $ | (26,179 | ) |
| $ | (14,868 | ) |
Service charges | 760 | |
| 1,341 | |
| 2,497 | | |||
For further information regarding our commitments and funded amounts to the Private Equity Related Funds, see Note 18, Commitments, Contingencies and Guarantees .
Berkadia Commercial Mortgage, LLC. At November 30, 2016 and 2015 , we have commitments to purchase $817.0 million and $752.4 million , respectively, in agency CMBS from Berkadia Commercial Mortgage, LLC, which is partially owned by Leucadia.
HRG Group Inc. ( " HRG " ) . As part of our loan secondary trading activities we had unsettled purchases and sales of loans pertaining to portfolio companies within funds managed by HRG, which is partially owned by Leucadia, of $261.6 million at November 30, 2015 . Additionally, we recognized investment banking and advisory revenues of $1.3 million and $0.5 million , for the years ended November 30, 2015 and 2014 , respectively.
Officers, Directors and Employees . At November 30, 2016 and 2015 , we had $38.4 million and $28.3 million , respectively, of loans outstanding to certain of our employees (none of whom are executive officers or directors) that are included in Other assets on the Consolidated Statements of Financial Condition. Receivables from and payables to customers include balances arising from officers, directors and employees individual security transactions. These transactions are subject to the same regulations as all customer transactions and are provided on substantially the same terms. During the year ended November 30, 2014, we sold private equity interests with a fair value of $4.0 million at their then fair value to a private equity fund owned by our employees. At November 30, 2016 and 2015 , we have provided a guarantee of a credit agreement for a private equity fund owned by our employees. See Note 8, Variable Interest Entities and Note 18, Commitments, Contingencies & Guarantees for further information.
Leucadia . The following is a description of related party transactions with Leucadia:
• | Under a service agreement we charge Leucadia for certain services, which amounted to $27.6 million , $34.6 million and $22.3 million for the years ended November 30, 2016 , 2015 and 2014 , respectively. At November 30, 2016 and 2015 , we had a receivable from Leucadia of $2.8 million and $10.2 million , respectively, which is included within Other assets on the Consolidated Statements of Financial Condition. At November 30, 2016 and 2015 , we had a payable to Leucadia of $1.9 million and $0.6 million , respectively, related to certain services provided by Leucadia, which is included within Accrued expenses and other liabilities on the Consolidated Statements of Financial Condition. |
• | Pursuant to a tax sharing agreement entered into between us and Leucadia, payments are made between us and Leucadia to settle current tax assets and liabilities. At November 30, 2016 and 2015 , a net current tax receivable from Leucadia of $80.1 million and $109.5 million , respectively, is included in Other assets on the Consolidated Statements of Financial Condition. |
• | Of the total noncontrolling interests in asset management entities that are consolidated by us at November 30, 2015 , $26.3 million are attributed to Leucadia. |
• | In July 2016, Leucadia Funding LLC, a subsidiary of Leucadia, made a $30.0 million capital contribution to a hedge fund managed by us. |
• | In March 2016, we made a capital contribution of $114.0 million to a hedge fund managed by a subsidiary of Leucadia. |
• | On August 28, 2015, we sold an equity position to Leucadia at fair value of $124.4 million for cash. There was no gain or loss on the transaction. |
117
Table of Contents
JEFFERIES GROUP LLC AND SUBSIDIARIES
NOTES TO CONSOLIDATED FINANCIAL STATEMENTS - CONTINUED
• | We provide capital markets and asset management services to Leucadia and its affiliates. The following table presents the revenues earned by type of services provided (in thousands): |
| Year Ended November 30, | ||||||||||
| 2016 |
| 2015 |
| 2014 | ||||||
Investment banking and advisory | $ | 1,786 | |
| $ | 21,185 | |
| $ | 2,800 | |
Asset management | 155 | |
| 400 | |
| - | | |||
Commissions and other fees | 88 | |
| 43 | |
| - | | |||
For information on transactions with our equity method investees, see Note 9, Investments .
Note 22. Exit Costs
Jefferies Bache . On April 9, 2015, we entered into an agreement with Société Générale S.A. (the "Agreement") to transfer certain client exchange and OTC transactions associated with our Jefferies Bache business for the net book value of the over-the-counter transactions, calculated in accordance with certain principles set forth in the agreement, plus the repayment of certain margin loans in respect of certain exchange transactions. In addition, we initiated a plan to substantially exit the remaining aspects of the business, which was completed during the second quarter of 2016. The pre-tax losses of the Jefferies Bache business were $1.9 million , $134.7 million and $145.4 million for the years ended November 30, 2016 , 2015 and 2014, respectively.
In addition, we terminated our $750.0 million Credit Facility on July 31, 2015. During the year ended November 30, 2015, we recognized costs of $3.8 million related to the Credit Facility.
The following summarizes our recorded restructuring and impairment costs (in thousands):
| Year Ended November 30, | ||||||
| 2016 |
| 2015 | ||||
Severance costs | $ | 279 | |
| $ | 30,327 | |
Accelerated amortization of restricted stock and restricted cash awards | 41 | |
| 7,922 | | ||
Accelerated amortization of capitalized software | - | |
| 19,745 | | ||
Contract termination costs | 1,234 | |
| 11,247 | | ||
Other expenses | 300 | |
| 3,853 | | ||
Total | $ | 1,854 | |
| $ | 73,094 | |
Of the above costs, $341,000 and $28.7 million are of a non-cash nature for the years ended November 30, 2016 and 2015, respectively. Restructuring and exit costs are wholly attributed to our Capital Markets segment and were recorded in the following categories on the Consolidated Statement of Earnings (in thousands):
| Year Ended November 30, | ||||||
| 2016 |
| 2015 | ||||
Compensation and benefits | $ | 320 | |
| $ | 38,249 | |
Technology and communications | 1,234 | |
| 30,992 | | ||
Professional services | - | |
| 2,508 | | ||
Other expenses | 300 | |
| 1,345 | | ||
Total | $ | 1,854 | |
| $ | 73,094 | |
118
Table of Contents
JEFFERIES GROUP LLC AND SUBSIDIARIES
NOTES TO CONSOLIDATED FINANCIAL STATEMENTS - CONTINUED
The following summarizes our restructuring reserve activity (in thousands):
| Severance costs |
| Other costs |
| Contract termination costs |
| Total restructuring costs |
| Accelerated amortization of restricted stock and restricted cash awards |
| Accelerated amortization of capitalized software |
| Impairments |
| Total | ||||||||||||||||
Balance at February 28, 2015 | $ | - | |
| $ | - | |
| $ | - | |
| $ | - | |
|
|
|
|
|
|
| | ||||||||
Expenses | 30,327 | |
| 2,774 | |
| 11,247 | |
| 44,348 | |
| $ | 7,922 | |
| $ | 19,745 | |
| $ | 1,079 | |
| $ | 73,094 | | ||||
Payments | (25,522 | ) |
| (2,774 | ) |
| (11,247 | ) |
| (39,543 | ) |
|
|
|
|
|
|
| | ||||||||||||
Liability at November 30, 2015 | $ | 4,805 | |
| $ | - | |
| $ | - | |
| $ | 4,805 | |
| |
| |
|
|
| | ||||||||
Expenses | 279 | |
| 300 | |
| 1,234 | |
| 1,813 | |
| $ | 41 | |
| $ | - | |
| - | |
| $ | 1,854 | | |||||
Payments | (5,084 | ) |
| (300 | ) |
| (1,234 | ) |
| (6,618 | ) |
|
|
|
|
|
|
|
| ||||||||||||
Liability at November 30, 2016 | $ | - | |
| $ | - | |
| $ | - | |
| $ | - | |
|
|
|
|
|
|
|
| ||||||||
Note 23. Selected Quarterly Financial Data (Unaudited)
The following is a summary of unaudited quarterly statements of earnings for the years ended November 30, 2016 and 2015 (in thousands):
| Three Months Ended | ||||||||||||||
| November 30, 2016 |
| August 31, 2016 |
| May 31, 2016 |
| February 29, 2016 | ||||||||
Total revenues | $ | 939,960 | |
| $ | 863,841 | |
| $ | 936,917 | |
| $ | 493,105 | |
Net revenues | 741,769 | |
| 654,450 | |
| 719,408 | |
| 298,987 | | ||||
Earnings (loss) before income taxes | 96,529 | |
| 80,722 | |
| 102,597 | |
| (249,876 | ) | ||||
Net earnings (loss) attributable to Jefferies Group LLC | 87,180 | |
| 41,169 | |
| 53,898 | |
| (166,813 | ) | ||||
| Three Months Ended | ||||||||||||||
| November 30, 2015 |
| August 31, 2015 |
| May 31, 2015 |
| February 28, 2015 | ||||||||
Total revenues | $ | 701,930 | |
| $ | 781,123 | |
| $ | 1,008,510 | |
| $ | 783,332 | |
Net revenues | 513,087 | |
| 578,928 | |
| 791,554 | |
| 591,672 | | ||||
Earnings before income taxes | 9,538 | |
| 7,093 | |
| 84,712 | |
| 12,884 | | ||||
Net earnings attributable to Jefferies Group LLC | 19,962 | |
| 2,057 | |
| 59,833 | |
| 11,682 | | ||||
119
Table of Contents
JEFFERIES GROUP LLC AND SUBSIDIARIES
Item 9. Changes in and Disagreements with Accountants on Accounting and Financial Disclosure
None.
Item 9A. Controls and Procedures
Disclosure Controls and Procedures
Our management, under the direction of our Chief Executive Officer and Chief Financial Officer, evaluated the effectiveness of our disclosure controls and procedures as of November 30, 2016 . Based on that evaluation, our Chief Executive Officer and Chief Financial Officer concluded that our disclosure controls and procedures as of November 30, 2016 are functioning effectively to provide reasonable assurance that the information required to be disclosed by us in reports filed under the Securities Exchange Act of 1934 is (i) recorded, processed, summarized and reported within the time periods specified in the SEC's rules and forms and (ii) accumulated and communicated to our management, including our Chief Executive Officer and Chief Financial Officer, as appropriate to allow timely decisions regarding disclosure. A controls system cannot provide absolute assurance that the objectives of the controls system are met, and no evaluation of controls can provide absolute assurance that all control issues and instances of fraud, if any, within a company have been detected.
Internal Control over Financial Reporting
Management's annual report on internal control over financial reporting is contained in Part II, Item 8 of this Form 10-K.
Changes in Internal Control over Financial Reporting
No change in our internal control over financial reporting occurred during the quarter ended November 30, 2016 that has materially affected, or is reasonably likely to materially affect, our internal control over financial reporting.
Item 9B. Other Information
None.
PART III
Item 10. Directors, Executive Officers and Corporate Governance
Omitted pursuant to General Instruction I(2)(c) to Form 10-K.
Item 11. Executive Compensation
Omitted pursuant to General Instruction I(2)(c) to Form 10-K.
Item 12. Security Ownership of Certain Beneficial Owners and Management and Related Stockholder Matters
Omitted pursuant to General Instruction I(2)(c) to Form 10-K.
Item 13. Certain Relationships and Related Transactions, and Director Independence
Omitted pursuant to General Instruction I(2)(c) to Form 10-K.
120
Table of Contents
JEFFERIES GROUP LLC AND SUBSIDIARIES
Item 14. Principal Accountant Fees and Services
For the fiscal years ended November 30, 2016 and 2015 , the fees for services provided by PricewaterhouseCoopers LLP were as follows:
| Year Ended November 30, | ||||||
| 2016 |
| 2015 | ||||
Audit Fees | $ | 6,685,689 | |
| $ | 6,481,521 | |
Audit-Related Fees | 410,000 | |
| 435,000 | | ||
Tax Fees | 514,359 | |
| 320,370 | | ||
All Other Fees | - | |
| 87,000 | | ||
Total All Fees | $ | 7,610,048 | |
| $ | 7,323,891 | |
Audit Fees - The Audit Fees reported above reflect fees for services provided during fiscal 2016 and 2015 . These amounts include fees for professional services rendered as our principal accountant for the audit of our consolidated financial statements included in this Annual Report on Form 10-K, the audits of various affiliates and investment funds managed by Jefferies or its affiliates, the audit of internal controls over financial reporting required by Section 404 of Sarbanes-Oxley, reviews of the interim consolidated financial statements included in our quarterly reports on Form 10-Q, the issuance of comfort letters, consents and other services related to SEC and other regulatory filings, audit fees related to other services that are normally provided in connection with statutory and regulatory filings or engagements. The Audit Committee preapproves all auditing services and permitted non-audit services to be performed for us by our independent registered public accounting firm, which are approved by the Audit Committee prior to the completion of the audit. In 2016 , the Audit Committee preapproved all auditing services performed for us by the independent registered public accounting firm.
Audit-Related Fees - The Audit-Related Fees reported above reflect fees for services provided during fiscal 2016 and 2015 . These amounts include fees for assurance and related services that are reasonably related to the performance of the audit or review of our financial statements and are not reported under "Audit Fees" above. Specifically, the Audit-Related services included the audit of our pension plan, preparation of our SOC1 report, performing agreed upon procedures related to specific matters at our request, the audits of our employee benefit plans, accounting consultations, and other services that are normally provided in connection with statutory and regulatory filings or engagements.
Tax Fees - Tax Fees includes fees for services provided during fiscal 2016 and 2015 related to tax compliance, tax advice and tax planning.
All Other Fees - Includes fees during fiscal 2015 for performing agreed upon procedures relating to structuring and placing certain funds.
121
Table of Contents
JEFFERIES GROUP LLC AND SUBSIDIARIES
PART IV
Item 15. Exhibits and Financial Statement Schedules
(a)1. Financial Statements
The financial statements required to be filed hereunder are listed on page S-1.
(a)2 . Financial Statement Schedules
The financial statement schedules required to be filed hereunder are listed on page S-1.
(a)3. Exhibits
3.1 | Certificate of Formation of Jefferies Group LLC effective as of March 1, 2013 is incorporated by reference to Exhibit 3.2 of Registrant's Form 8-K filed on March 1, 2013. |
3.2 | Certificate of Conversion of Jefferies Group LLC effective as of March 1, 2013 is incorporated by reference to Exhibit 3.1 of Registrant's Form 8-K filed on March 1, 2013. |
3.3 | Limited Liability Company Agreement of Jefferies Group LLC dated as of March 1, 2013 is incorporated by reference to Exhibit 3.3 of Registrant's Form 8-K filed on March 1, 2013. |
4 | Instruments defining the rights of holders of long-term debt securities of the Registrant and its subsidiaries are omitted pursuant to Item 601(b)(4)(iii) of Regulation S-K. Registrant hereby agrees to furnish copies of these instruments to the Commission upon request. |
12* | Computation of Ratio of Earnings to Fixed Charges and to Combined Fixed Charges and Preferred Stock Dividends. |
23.1* | Consent of PricewaterhouseCoopers LLP. |
23.2* | Consent of Deloitte & Touche LLP. |
23.3* | Consent of PricewaterhouseCoopers LLP. |
31.1* | Rule 13a-14(a)/15d-14(a) Certification by Chief Financial Officer. |
31.2* | Rule 13a-14(a)/15d-14(a) Certification by Chief Executive Officer. |
32* | Rule 13a-14(b)/15d-14(b) and Section 1350 of Title 18 U.S.C. Certification by the Chief Executive Officer and Chief Financial Officer. |
101* | Interactive data files pursuant to Rule 405 of Regulation S-T: (i) the Consolidated Statements of Financial Condition as of November 30, 2016 and November 30, 2015; (ii) the Consolidated Statements of Earnings for the years ended November 30, 2016, 2015 and 2014; (iii) the Consolidated Statements of Comprehensive Income for the years ended November 30, 2016, 2015 and 2014; (iv) the Consolidated Statements of Changes in Equity for the years ended November 30, 2016, 2015 and 2014; (v) the Consolidated Statements of Cash Flows for the years ended November 30, 2016, 2015 and 2014; and (vi) the Notes to Consolidated Financial Statements. |
|
* Filed herewith.
(c) | Financial Statement Schedules |
| Jefferies Finance LLC financial statements as of November 30, 2016 and 2015, and for the years ended November 30, 2016, 2015 and 2014 |
| Jefferies LoanCore financial statements as of November 30, 2016 and 2015, and for the years ended November 30, 2016, 2015 and 2014 |
Item 16. Form 10-K Summary
None
122
Table of Contents
SIGNATURES
Pursuant to the requirements of Section 13 or 15(d) of the Securities Exchange Act of 1934, the Registrant has duly caused this report to be signed on its behalf by the undersigned, thereunto duly authorized.
|
JEFFERIES GROUP LLC |
|
/s/ RICHARD B. HANDLER |
Richard B. Handler |
Chairman of the Board of Directors, |
Chief Executive Officer |
Dated: January 27, 2017
Pursuant to the requirements of the Securities Exchange Act of 1934, this report has been signed below by the following persons on behalf of the Registrant and in the capacities and on the dates indicated.
|
|
|
|
|
|
|
|
| Name |
| Title |
| Date |
|
|
|
| |||
/s/ |
| RICHARD B. HANDLER |
| Chairman of the Board of Directors, Chief Executive Officer |
| January 27, 2017 |
|
| Richard B. Handler |
|
| ||
|
|
|
| |||
/s/ |
| PEREGRINE C. BROADBENT |
| Executive Vice President and Chief Financial Officer (Principal Accounting Officer) |
| January 27, 2017 |
|
| Peregrine C. Broadbent |
|
| ||
|
|
|
| |||
/s/ |
| BRIAN P. FRIEDMAN |
| Director and Chairman, Executive Committee |
| January 27, 2017 |
|
| Brian P. Friedman |
|
| ||
|
|
|
| |||
/s/ |
| W. PATRICK CAMPBELL |
| Director |
| January 27, 2017 |
|
| W. Patrick Campbell |
|
| ||
|
|
|
| |||
/s/ |
| BARRY J. ALPERIN |
| Director |
| January 27, 2017 |
|
| Barry J. Alperin |
|
| ||
|
|
|
| |||
/s/ |
| RICHARD G. DOOLEY |
| Director |
| January 27, 2017 |
|
| Richard G. Dooley |
|
| ||
|
|
|
| |||
/s/ |
| MARYANNE GILMARTIN |
| Director |
| January 27, 2017 |
|
| MaryAnne Gilmartin |
|
| ||
|
|
|
| |||
/s/ |
| JOSEPH S. STEINBERG |
| Director |
| January 27, 2017 |
|
| Joseph S. Steinberg |
|
| ||
|
|
|
|
|
|
|
/s/ |
| JACOB M. KATZ |
| Director |
| January 27, 2017 |
|
| Jacob M. Katz |
|
| ||
123
Table of Contents
Jefferies Group LLC
Index to Financial Statements and
Financial Statement Schedules
Items (15)(a)(1) and (15)(a)(2)
| Page |
Financial Statements |
|
Management's Report on Internal Control over Financial Reporting | 46 |
Report of Independent Registered Public Accounting Firm | 47 |
Consolidated Statements of Financial Condition | 48 |
Consolidated Statements of Earnings | 49 |
Consolidated Statements of Comprehensive Income | 50 |
Consolidated Statements of Changes in Equity | 51 |
Consolidated Statements of Cash Flows | 52 |
Notes to Consolidated Financial Statements | 54 |
|
|
Financial Statement Schedules |
|
Schedule I - Condensed Financial Information of Jefferies Group LLC (Parent Company Only) at November 30, 2016 and 2015 and for each of the three fiscal years ended November 30, 2016, 2015 and 2014 | S-2 - S-5 |
S-1
Table of Contents
JEFFERIES GROUP LLC
(PARENT COMPANY ONLY)
CONDENSED STATEMENTS OF FINANCIAL CONDITION
(In thousands)
| November 30, | ||||||
| 2016 |
| 2015 | ||||
ASSETS |
|
|
| ||||
Cash and cash equivalents | $ | 1,178,475 | |
| $ | 824,239 | |
Cash and securities segregated and on deposited for regulatory purposes or deposited with clearing and depository organizations | 36,148 | |
| 66,203 | | ||
Financial instruments owned, at fair value | 130,116 | |
| 138,820 | | ||
Investments in managed funds | 34,170 | |
| 34,933 | | ||
Loans to and investments in related parties | 473,912 | |
| 520,550 | | ||
Investment in subsidiaries | 4,757,824 | |
| 4,892,454 | | ||
Advances to subsidiaries | 1,262,211 | |
| 1,423,175 | | ||
Subordinated notes receivable | 2,802,440 | |
| 2,924,479 | | ||
Other assets | 569,291 | |
| 590,581 | | ||
Total assets | $ | 11,244,587 | |
| $ | 11,415,434 | |
LIABILITIES AND EQUITY |
|
|
| ||||
Short-term borrowings | $ | 96,456 | |
| $ | - | |
Financial instruments sold, not yet purchased, at fair value | 7,285 | |
| 21,024 | | ||
Accrued expenses and other liabilities | 287,545 | |
| 271,779 | | ||
Long-term debt | 5,483,355 | |
| 5,640,722 | | ||
Total liabilities | 5,874,641 | |
| 5,933,525 | | ||
EQUITY |
|
|
| ||||
Member's paid-in capital | 5,538,103 | |
| 5,526,855 | | ||
Accumulated other comprehensive loss: |
|
|
| ||||
Currency translation adjustments | (152,305 | ) |
| (36,811 | ) | ||
Changes in instrument specific credit risk | (6,494 | ) |
| - | | ||
Additional minimum pension liability | (9,358 | ) |
| (8,135 | ) | ||
Total accumulated other comprehensive loss | (168,157 | ) |
| (44,946 | ) | ||
Total member's equity | 5,369,946 | |
| 5,481,909 | | ||
Total liabilities and equity | $ | 11,244,587 | |
| $ | 11,415,434 | |
See accompanying notes to condensed financial statements.
S-2
Table of Contents
JEFFERIES GROUP LLC
(PARENT COMPANY ONLY)
CONDENSED STATEMENTS OF OPERATIONS AND COMPREHENSIVE INCOME
(In thousands)
| Year Ended November 30, | ||||||||||
| 2016 |
| 2015 |
| 2014 | ||||||
Revenues: |
|
|
|
|
| ||||||
Principal transactions | $ | 952 | |
| $ | 68,720 | |
| $ | 46,416 | |
Asset management fees and investment income (loss) from managed funds | 1,222 | |
| (20,889 | ) |
| (7,452 | ) | |||
Interest | 226,781 | |
| 201,632 | |
| 194,568 | | |||
Other | (8,156 | ) |
| 33,193 | |
| 81,511 | | |||
Total revenues | 220,799 | |
| 282,656 | |
| 315,043 | | |||
Interest expense | 235,556 | |
| 250,919 | |
| 251,020 | | |||
Net revenues | (14,757 | ) |
| 31,737 | |
| 64,023 | | |||
Non-interest expenses: |
|
|
|
|
| ||||||
Total non-interest expenses | 5,187 | |
| 5,984 | |
| 9,263 | | |||
Earnings (loss) before income taxes | (19,944 | ) |
| 25,753 | |
| 54,760 | | |||
Income tax expense (benefit) | (9,574 | ) |
| 3,958 | |
| 22,650 | | |||
Net earnings (loss) before undistributed earnings of subsidiaries | (10,370 | ) |
| 21,795 | |
| 32,110 | | |||
Undistributed earnings of subsidiaries | 25,804 | |
| 71,739 | |
| 125,450 | | |||
Net earnings | 15,434 | |
| 93,534 | |
| 157,560 | | |||
Other comprehensive loss, net of tax: |
|
|
|
|
| ||||||
Currency translation and other adjustments | (115,494 | ) |
| (27,157 | ) |
| (30,995 | ) | |||
Change in instrument specific credit risk | (6,494 | ) |
| - | |
| - | | |||
Minimum pension liability adjustments, net of tax | (1,223 | ) |
| (3,116 | ) |
| (7,778 | ) | |||
Total other comprehensive loss, net of tax | (123,211 | ) |
| (30,273 | ) |
| (38,773 | ) | |||
Comprehensive income (loss) | $ | (107,777 | ) |
| $ | 63,261 | |
| $ | 118,787 | |
See accompanying notes to condensed financial statements.
S-3
Table of Contents
JEFFERIES GROUP LLC
(PARENT COMPANY ONLY)
CONDENSED STATEMENTS OF CASH FLOWS
(In thousands)
| Year Ended November 30, | ||||||||||
| 2016 |
| 2015 |
| 2014 | ||||||
Cash flows from operating activities: |
|
|
|
|
| ||||||
Net earnings | $ | 15,434 | |
| $ | 93,534 | |
| $ | 157,560 | |
Adjustments to reconcile net earnings to net cash used in operating activities: |
|
|
|
|
| ||||||
Amortization | (63,681 | ) |
| (76,945 | ) |
| (80,424 | ) | |||
Undistributed earnings of subsidiaries | (25,804 | ) |
| (71,739 | ) |
| (125,450 | ) | |||
Loss (income) on loans to and investments in related parties | 10,251 | |
| (40,460 | ) |
| (67,965 | ) | |||
Distributions received on investments in related parties | 17,050 | |
| 40,500 | |
| 35,562 | | |||
Other adjustments | (34,496 | ) |
| (98,870 | ) |
| (78,064 | ) | |||
Net change in assets and liabilities: |
|
|
|
|
| ||||||
Cash and securities segregated and on deposit for regulatory purposes or deposited with clearing and depository organizations | 30,055 | |
| (4,714 | ) |
| (28,155 | ) | |||
Financial instruments owned | 8,704 | |
| 53,290 | |
| (45,950 | ) | |||
Investments in managed funds | 763 | |
| 19,907 | |
| (1,028 | ) | |||
Other assets | 20,986 | |
| 77,064 | |
| 47,666 | | |||
Financial instruments sold, not yet purchased | (13,739 | ) |
| (8,802 | ) |
| 21,462 | | |||
Accrued expenses and other liabilities | 15,125 | |
| (36,397 | ) |
| 38,477 | | |||
Net cash used in operating activities | (19,352 | ) |
| (53,632 | ) |
| (126,309 | ) | |||
Cash flows from investing activities: |
|
|
|
|
| ||||||
Investments in, advances to and subordinated notes receivable from subsidiaries | 327,110 | |
| 420,797 | |
| 82,143 | | |||
Loans to and investments in related parties | 19,337 | |
| (19,301 | ) |
| (469 | ) | |||
Cash received from contingent consideration | 2,617 | |
| 4,444 | |
| 6,253 | | |||
Net cash provided by investing activities | 349,064 | |
| 405,940 | |
| 87,927 | | |||
Cash flows from financing activities: |
|
|
|
|
| ||||||
Excess tax benefits from the issuance of share-based awards | 489 | |
| 749 | |
| 1,921 | | |||
Proceeds from short-term borrowings | 102,238 | |
| 750,000 | |
| 1,160,000 | | |||
Payments on short-term borrowings | (5,786 | ) |
| (750,000 | ) |
| (1,160,000 | ) | |||
Net proceeds from issuance of senior notes, net of issuance costs | 277,583 | |
| - | |
| 681,222 | | |||
Repayment of long-term debt | (350,000 | ) |
| (500,000 | ) |
| (250,000 | ) | |||
Net cash provided by (used in) financing activities | 24,524 | |
| (499,251 | ) |
| 433,143 | | |||
Net increase (decrease) in cash and cash equivalents | 354,236 | |
| (146,943 | ) |
| 394,761 | | |||
Cash and cash equivalents at beginning of period | 824,239 | |
| 971,182 | |
| 576,421 | | |||
Cash and cash equivalents at end of period | $ | 1,178,475 | |
| $ | 824,239 | |
| $ | 971,182 | |
|
|
|
|
|
| ||||||
Supplemental disclosures of cash flow information: |
|
|
|
|
| ||||||
Cash paid (received) during the period for: |
|
|
|
|
| ||||||
Interest | $ | 300,680 | |
| $ | 329,926 | |
| $ | 330,261 | |
Income taxes, net | (8,654 | ) |
| (5,859 | ) |
| 111,542 | | |||
See accompanying notes to condensed financial statements.
S-4
Table of Contents
JEFFERIES GROUP LLC
(PARENT COMPANY ONLY)
NOTES TO CONDENSED FINANCIAL STATEMENTS
Note 1. Introduction and Basis of Presentation
The accompanying condensed financial statements (the "Parent Company Financial Statements"), including the notes thereto, should be read in conjunction with the consolidated financial statements of Jefferies Group LLC (the "Company") and the notes thereto found in the Company's Annual Report on Form 10-K for the year ended November 30, 2016 . For purposes of these condensed non-consolidated financial statements, the Company's wholly owned and majority owned subsidiaries are accounted for using the equity method of accounting ("equity method subsidiaries").
The Parent Company is an indirect wholly owned subsidiary of Leucadia National Corporation ("Leucadia"). Leucadia does not guarantee any of our outstanding debt securities. Our 3.875% Convertible Senior Debentures due 2029 are convertible into Leucadia common shares.
The Parent Company Financial Statements have been prepared in accordance with U.S. generally accepted accounting principles ("U.S. GAAP") for financial information. The significant accounting policies of the Parent Company Financial Statements are those used by the Company on a consolidated basis, to the extent applicable. For further information regarding the significant accounting policies refer to Note 2, Summary of Significant Accounting Policies in the Company's consolidated financial statements included in the Annual Report on Form 10-K for the year ended November 30, 2016 .
The Company has made a number of estimates and assumptions relating to the reporting of assets and liabilities and the disclosure of contingent assets and liabilities to prepare these financial statements in conformity with U.S. GAAP. The most important of these estimates and assumptions relate to fair value measurements, goodwill and intangible assets, the ability to realize deferred tax assets and the recognition and measurement of uncertain tax positions. Although these and other estimates and assumptions are based on the best available information, actual results could be materially different from these estimates.
Note 2. Transactions with Subsidiaries
The Parent Company has transactions with its consolidated subsidiaries, Leucadia and certain other affiliated entities determined on an agreed upon basis and has guaranteed certain unsecured lines of credit and contractual obligations of certain equity method subsidiaries.
Note 3. Guarantees
In the normal course of its business, the Parent Company issues guarantees in respect of obligations of certain of its wholly owned subsidiaries under trading and other financial arrangements, including guarantees to various trading counterparties and banks. The Parent Company records all derivative contracts and Financial instruments owned and Financial instruments sold, not yet purchased at fair value on its consolidated statements of financial condition.
Certain of the Parent Company's equity method subsidiaries are members of various exchanges and clearing houses. In the normal course of business, the Parent Company provides guarantees to securities clearinghouses and exchanges. These guarantees generally are required under the standard membership agreements, such that members are required to guarantee the performance of other members. Additionally, if a member becomes unable to satisfy its obligations to the clearinghouse, other members would be required to meet these shortfalls. To mitigate these performance risks, the exchanges and clearinghouses often require members to post collateral. The Parent Company's obligations under such guarantees could exceed the collateral amounts posted. The maximum potential liability under these arrangements cannot be quantified; however, the potential for the Parent Company to be required to make payments under such guarantees is deemed remote. Accordingly no liability has been recognized for these arrangements.
The Parent Company has provided a guarantee in respect of certain obligations of Jefferies Finance LLC that matures in January 2021, whereby the Parent Company is required to make certain payments to an SPE sponsored by Jefferies Finance in the event that Jefferies Finance is unable to meet its obligations to the SPE and a guarantee of a credit agreement for a fund owned by employees. At November 30, 2016 , the maximum amount payable under these guarantees is $21.1 million .
The Parent Company guarantees certain financing arrangements of subsidiaries. The financing arrangements totaled a maximum obligation of $62.0 million at November 30, 2016.
Structured Notes. Structured notes of $255.2 million at November 30, 2016 were jointly and severally co-issued by our wholly-owned subsidiary Jefferies Group Capital Finance Inc.
S-5
Table of Contents
Jefferies Finance LLC and Subsidiaries
Consolidated Balance Sheets as of November 30, 2016 and 2015 and Related Statements
of Earnings, Changes in Members' Equity and Cash Flows for the Years Ended November 30,
2016, 2015 and 2014 and Independent Auditor's Report
JEFFERIES FINANCE LLC AND SUBSIDIARIES
Table of contents
| PAGE | ||||
Independent Auditors' Report | 1 | |||
CONSOLIDATED FINANCIAL STATEMENTS: | ||||
Consolidated Balance Sheets | 2 | |||
Consolidated Statements of Earnings | 4 | |||
Consolidated Statements of Changes in Members' Equity | 5 | |||
Consolidated Statements of Cash Flows | 6 | |||
Notes to Consolidated Financial Statements | 7 | |||
INDEPENDENT AUDITORS' REPORT
To the Board of Directors of
Jefferies Finance LLC and Subsidiaries
New York, NY
We have audited the accompanying consolidated financial statements of Jefferies Finance LLC and Subsidiaries (the "Company"), which comprise the consolidated balance sheets as of November 30, 2016 and 2015, and the related consolidated statements of earnings, changes in members' equity, and cash flows for the years ended November 30, 2016, 2015 and 2014, and the related notes to the consolidated financial statements.
Management's Responsibility for the Consolidated Financial Statements
Management is responsible for the preparation and fair presentation of these consolidated financial statements in accordance with accounting principles generally accepted in the United States of America; this includes the design, implementation, and maintenance of internal control relevant to the preparation and fair presentation of consolidated financial statements that are free from material misstatement, whether due to fraud or error.
Auditors' Responsibility
Our responsibility is to express an opinion on these consolidated financial statements based on our audits. We conducted our audits in accordance with auditing standards generally accepted in the United States of America. Those standards require that we plan and perform the audit to obtain reasonable assurance about whether the consolidated financial statements are free from material misstatement.
An audit involves performing procedures to obtain audit evidence about the amounts and disclosures in the consolidated financial statements. The procedures selected depend on the auditor's judgment, including the assessment of the risks of material misstatement of the consolidated financial statements, whether due to fraud or error. In making those risk assessments, the auditor considers internal control relevant to the Company's preparation and fair presentation of the consolidated financial statements in order to design audit procedures that are appropriate in the circumstances, but not for the purpose of expressing an opinion on the effectiveness of the Company's internal control. Accordingly, we express no such opinion. An audit also includes evaluating the appropriateness of accounting policies used and the reasonableness of significant accounting estimates made by management, as well as evaluating the overall presentation of the consolidated financial statements.
We believe that the audit evidence we have obtained is sufficient and appropriate to provide a basis for our audit opinion.
Opinion
In our opinion, the consolidated financial statements referred to above present fairly, in all material respects, the financial position of Jefferies Finance LLC and Subsidiaries as of November 30, 2016 and 2015, and the results of their operations and their cash flows for the years ended November 30, 2016, 2015 and 2014 in accordance with accounting principles generally accepted in the United States of America.
/s/ DELOITTE & TOUCHE LLP
New York, New York
January 26, 2017
1
CONSOLIDATED FINANCIAL STATEMENTS
JEFFERIES FINANCE LLC AND SUBSIDIARIES
Consolidated Balance Sheets
As of November 30, 2016 and 2015
(Dollars in thousands)
| NOVEMBER 30, 2016 | NOVEMBER 30, 2015 | |||||||
ASSETS | ||||||||
Cash | $ | 656,556 | $ | 1,491,833 | ||||
Restricted cash | 975,891 | 1,275,900 | ||||||
Loans receivable, net of deferred loan fees | 4,409,558 | 3,915,273 | ||||||
Less allowance for loan losses | (65,897 | ) | (53,970 | ) | ||||
|
|
|
| |||||
Loans receivable, net | 4,343,661 | 3,861,303 | ||||||
Loans held for sale, net | 930,462 | 247,853 | ||||||
Accrued interest receivable | 32,794 | 32,349 | ||||||
Investments (includes restricted investments of $156,780 and $215,809 at November 30, 2016 and 2015 respectively) | 179,216 | 241,778 | ||||||
Other assets | 158,752 | 141,043 | ||||||
|
|
|
| |||||
TOTAL ASSETS | $ | 7,277,332 | $ | 7,292,059 | ||||
|
|
|
| |||||
LIABILITIES AND MEMBERS' EQUITY | ||||||||
LIABILITIES: | ||||||||
Credit facilities | $ | 346,862 | $ | 381,956 | ||||
Secured notes payable, net | 3,916,792 | 4,034,711 | ||||||
Interest payable | 34,122 | 27,825 | ||||||
Other liabilities | 353,697 | 182,070 | ||||||
Due to affiliates | 23,971 | 8,175 | ||||||
Long-term debt | 1,660,829 | 1,662,548 | ||||||
|
|
|
| |||||
Total liabilities | 6,336,273 | 6,297,285 | ||||||
MEMBERS' EQUITY | 941,059 | 994,774 | ||||||
|
|
|
| |||||
TOTAL LIABILITIES AND MEMBERS' EQUITY | $ | 7,277,332 | $ | 7,292,059 | ||||
|
|
|
| |||||
See notes to consolidated financial statements.
(Continued)
2
JEFFERIES FINANCE LLC AND SUBSIDIARIES
Consolidated Balance Sheets (Continued)
As of November 30, 2016 and 2015
(Dollars in thousands)
The table below presents the carrying amount and classification of assets of consolidated variable interest entities ("VIEs") that can be used only to settle obligations of the consolidated VIEs and the liabilities of consolidated VIEs for which creditors (or beneficial interest holders) do not have recourse to Jefferies Finance LLC assets. The assets and liabilities of these consolidated VIEs are included in the Consolidated Balance Sheets and are presented net of intercompany eliminations.
| NOVEMBER 30, 2016 | NOVEMBER 30, 2015 | |||||||
ASSETS | ||||||||
Restricted cash | $ | 925,969 | $ | 1,200,396 | ||||
Loans receivable, net of deferred loan fees | 3,825,255 | 3,388,328 | ||||||
Less allowance for loan losses | (56,089 | ) | (47,828 | ) | ||||
|
|
|
| |||||
Loans receivable, net | 3,769,166 | 3,340,500 | ||||||
Loans held for sale, net | 4,034 | 2,579 | ||||||
Accrued interest receivable | 20,867 | 19,388 | ||||||
Investments (includes restricted investments of $156,780 and $215,809 at November 30, 2016 and 2015, respectively) | 164,670 | 225,629 | ||||||
Other assets | 125,169 | 92,386 | ||||||
|
|
|
| |||||
TOTAL ASSETS | $ | 5,009,875 | $ | 4,880,878 | ||||
|
|
|
| |||||
LIABILITIES | ||||||||
Credit Facilities | $ | 124,151 | $ | - | ||||
Secured notes payable, net | 3,916,792 | 4,034,711 | ||||||
Interest payable | 16,839 | 11,304 | ||||||
Other liabilities | 256,601 | 129,941 | ||||||
Due to affiliates | 181 | 266 | ||||||
|
|
|
| |||||
TOTAL LIABILITIES | $ | 4,314,564 | $ | 4,176,222 | ||||
|
|
|
| |||||
See notes to consolidated financial statements.
3
JEFFERIES FINANCE LLC AND SUBSIDIARIES
Consolidated Statements of Earnings
For the Years Ended November 30, 2016, 2015 and 2014
(Dollars in thousands)
| NOVEMBER 30, 2016 | NOVEMBER 30, 2015 | NOVEMBER 30, 2014 | ||||||||||
NET INTEREST AND FEE INCOME: | ||||||||||||
Fee income, net | $ | 130,356 | $ | 170,679 | $ | 172,314 | ||||||
Interest income | 292,457 | 256,032 | 195,366 | |||||||||
|
|
|
|
|
| |||||||
Total interest and fee income | 422,813 | 426,711 | 367,680 | |||||||||
Interest expense | 273,833 | 232,841 | 144,928 | |||||||||
|
|
|
|
|
| |||||||
Net interest and fee income | 148,980 | 193,870 | 222,752 | |||||||||
Provision for loan losses | 37,880 | 29,900 | 7,979 | |||||||||
|
|
|
|
|
| |||||||
Net interest and fee income after provision for loan losses | 111,100 | 163,970 | 214,773 | |||||||||
|
|
|
|
|
| |||||||
OTHER LOSSES, NET | (75,548 | ) | (16,640 | ) | (9,999 | ) | ||||||
|
|
|
|
|
| |||||||
OTHER EXPENSES: | ||||||||||||
Compensation and benefits | 24,533 | 32,620 | 33,029 | |||||||||
General, administrative and other | 32,148 | 27,850 | 27,640 | |||||||||
|
|
|
|
|
| |||||||
Total other expenses | 56,681 | 60,470 | 60,669 | |||||||||
|
|
|
|
|
| |||||||
(LOSSES) EARNINGS BEFORE INCOME TAX EXPENSE | (21,129 | ) | 86,860 | 144,105 | ||||||||
INCOME TAX (BENEFIT) EXPENSE | (1,514 | ) | 3,421 | 5,542 | ||||||||
|
|
|
|
|
| |||||||
NET (LOSS) EARNINGS | $ | (19,615 | ) | $ | 83,439 | $ | 138,563 | |||||
|
|
|
|
|
| |||||||
See notes to consolidated financial statements.
4
JEFFERIES FINANCE LLC AND SUBSIDIARIES
Consolidated Statements of Changes in Members' Equity
For the Years Ended November 30, 2016, 2015 and 2014
(Dollars in thousands)
| CLASS A MEMBERS | CLASS B MEMBERS | TOTAL MEMBERS' EQUITY | ||||||||||
BALANCE-November 30, 2014 | $ | 914,157 | $ | 78,178 | $ | 992,335 | ||||||
Distributions | (64,800 | ) | (16,200 | ) | (81,000 | ) | ||||||
Net earnings | 66,752 | 16,687 | 83,439 | |||||||||
|
|
|
|
|
| |||||||
BALANCE-November 30, 2015 | $ | 916,109 | $ | 78,665 | $ | 994,774 | ||||||
Distributions | (27,280 | ) | (6,820 | ) | (34,100 | ) | ||||||
Net loss | (15,693 | ) | (3,922 | ) | (19,615 | ) | ||||||
|
|
|
|
|
| |||||||
BALANCE-November 30, 2016 | $ | 873,136 | $ | 67,923 | $ | 941,059 | ||||||
|
|
|
|
|
| |||||||
See notes to consolidated financial statements.
5
JEFFERIES FINANCE LLC AND SUBSIDIARIES
Consolidated Statements of Cash Flows
For the Years Ended November 30, 2016, 2015 and 2014
(Dollars in thousands)
| NOVEMBER 30, 2016 | NOVEMBER 30, 2015 | NOVEMBER 30, 2014 | ||||||||||
CASH FLOWS FROM OPERATING ACTIVITIES: | ||||||||||||
Net (loss) earnings | $ | (19,615 | ) | $ | 83,439 | $ | 138,563 | |||||
Adjustments to reconcile net (loss) earnings to net cash (used in) provided by operating activities: | ||||||||||||
Amortization of deferred loan fees and discounts | (50,022 | ) | (46,518 | ) | (35,618 | ) | ||||||
Amortization of deferred structuring fees | 19,797 | 18,430 | 9,690 | |||||||||
Amortization of discount on secured notes | 9,611 | 7,418 | 3,763 | |||||||||
Provision for loan losses | 37,880 | 29,900 | 7,979 | |||||||||
Realized loss (gain) on sale of loans held for sale | 34,545 | 9,610 | (5,429 | ) | ||||||||
Change in fair value of loans held for sale | 8,267 | 1,552 | 8,859 | |||||||||
Realized loss on sales of investments | 24,597 | 2,437 | 114 | |||||||||
Unrealized loss on investments | 8,139 | 5,218 | 6,455 | |||||||||
Deferred income tax expense (benefit) | 55 | (604 | ) | 1,489 | ||||||||
(Increase) decrease in operating assets: | ||||||||||||
Origination of loans held for sale | (9,570,812 | ) | (13,616,750 | ) | (13,937,341 | ) | ||||||
Proceeds from sales of loans held for sale | 8,842,177 | 14,392,732 | 13,843,178 | |||||||||
Principal collections on loans held for sale | 3,215 | 1,651 | 13,610 | |||||||||
Accrued interest receivable | (445 | ) | (3,796 | ) | (6,005 | ) | ||||||
Other assets | (15,211 | ) | (4,991 | ) | (15,645 | ) | ||||||
Increase (decrease) in operating liabilities: | ||||||||||||
Interest payable | 6,297 | 307 | 17,378 | |||||||||
Other liabilities | 4,679 | 275,142 | 11,044 | |||||||||
Due to affiliates | 15,796 | (38,391 | ) | 13,494 | ||||||||
|
|
|
|
|
| |||||||
Net cash (used in) provided by operating activities | (641,050 | ) | 1,116,786 | 75,578 | ||||||||
|
|
|
|
|
| |||||||
CASH FLOWS FROM INVESTING ACTIVITIES: | ||||||||||||
Origination and purchases of loans receivable | (3,824,179 | ) | (4,450,748 | ) | (3,658,903 | ) | ||||||
Principal collections of loans receivable | 2,714,137 | 3,088,609 | 1,936,162 | |||||||||
Proceeds from sales of loans held for sale | 790,602 | 576,147 | 369,983 | |||||||||
Net change in restricted cash | 300,009 | (605,886 | ) | (592,060 | ) | |||||||
Purchases of investments | (661,896 | ) | (475,235 | ) | (589,117 | ) | ||||||
Proceeds from sales of investments | 690,183 | 464,887 | 352,998 | |||||||||
|
|
|
|
|
| |||||||
Net cash provided by (used in) investing activities | 8,856 | (1,402,226 | ) | (2,180,937 | ) | |||||||
|
|
|
|
|
| |||||||
CASH FLOWS FROM FINANCING ACTIVITIES: | ||||||||||||
Capital distributions | (34,100 | ) | (81,000 | ) | (71,124 | ) | ||||||
Capital contributions | - | - | 250,000 | |||||||||
Repayments of secured notes payable | (454,780 | ) | (91,317 | ) | (89,028 | ) | ||||||
Proceeds from sale of secured notes | - | - | 12,925 | |||||||||
Net proceeds from issuance of secured notes | 326,304 | 1,275,970 | 1,885,611 | |||||||||
Purchases of secured notes | (3,263 | ) | - | - | ||||||||
Net proceeds from long-term debt | - | 208,666 | 832,552 | |||||||||
Repayment of long-term debt | (2,150 | ) | - | - | ||||||||
Proceeds from borrowings on credit facilities | 1,112,148 | 4,834,843 | 7,856,957 | |||||||||
Repayments on credit facilities | (1,147,242 | ) | (4,946,111 | ) | (8,158,358 | ) | ||||||
|
|
|
|
|
| |||||||
Net cash (used in) provided by financing activities | (203,083 | ) | 1,201,051 | 2,519,535 | ||||||||
|
|
|
|
|
| |||||||
NET (DECREASE) INCREASE IN CASH | (835,277 | ) | 915,611 | 414,176 | ||||||||
CASH-Beginning of the year | 1,491,833 | 576,222 | 162,046 | |||||||||
|
|
|
|
|
| |||||||
CASH-End of the year | $ | 656,556 | $ | 1,491,833 | $ | 576,222 | ||||||
|
|
|
|
|
| |||||||
SUPPLEMENTAL INFORMATION: | ||||||||||||
Cash paid for interest | $ | 237,719 | $ | 208,498 | $ | 114,252 | ||||||
|
|
|
|
|
| |||||||
Cash paid for income taxes, net | $ | 279 | $ | 3,316 | $ | 2,570 | ||||||
|
|
|
|
|
| |||||||
NONCASH ITEMS: | ||||||||||||
Conversion of loan receivable to investments | $ | 24,414 | $ | 7,880 | $ | - | ||||||
|
|
|
|
|
| |||||||
See notes to consolidated financial statements.
6
JEFFERIES FINANCE LLC AND SUBSIDIARIES
Notes to Consolidated Financial Statements
November 30, 2016 and 2015
1. ORGANIZATION AND BASIS OF PRESENTATION
Organizational Structure -Jefferies Finance LLC ("JFIN"), a limited liability company, was organized under the laws of Delaware and commenced operations on October 7, 2004. JFIN will continue in perpetuity unless sooner dissolved as provided in the Amended and Restated Limited Liability Company Agreement, dated May 31, 2011, as amended, modified and/or supplemented from time to time, among JFIN and its members: Massachusetts Mutual Life Insurance Company ("Mass Mutual"), Babson Capital Management LLC ("BCM"), and Jefferies Group LLC ("JGL" and, together with Mass Mutual and BCM, the "Members"). On June 1, 2016 the LLC agreement was amended to transfer BCM's share of the Class B interest to Mass Mutual and BCM ceased to be a Member.
JFIN is a commercial finance company that structures, underwrites and syndicates primarily senior secured loans to corporate borrowers. JFIN's operations are primarily conducted through two business lines, Underwriting & Arrangement and Portfolio & Asset Management. JFIN also purchases performing loans in the syndicated markets. JFIN may also originate second lien term loans, bridge loans, mezzanine loans as well as related equity co-investments and purchase stressed and distressed loans in the secondary markets. In addition, JFIN and two of its subsidiaries, Apex Credit Partners LLC and JFIN Asset Management LLC ("JFAM"), each act as investment advisers for several funds and are registered with the Securities and Exchange Commission as Registered Investment Advisers ("RIA") under the Investment Advisers Act of 1940 since March 1, 2012, November 19, 2014, and February 5, 2016, respectively.
The accompanying consolidated financial statements refer to JFIN and all its subsidiaries (the "Company"), which includes all entities in which the Company has a controlling interest or is the primary beneficiary, including collateralized loan obligation funds ("CLOs"). See Note 8, Variable Interest Entities, for more information on the CLOs. JFIN Fund III LLC and JFIN Business Credit Fund I LLC are wholly owned subsidiaries created for the purpose of holding loans originated and purchased by JFIN which in general are subsequently securitized into CLOs.
JFIN's capital structure consists of Class A members and Class B members, owning 80% and 20% of JFIN, respectively. Net earnings and losses are allocated on a pro rata basis across all Members, unless a loss allocation would cause a negative capital account.
Subsequent Events -The Company has evaluated events and transactions that occurred subsequent to November 30, 2016 through January 26, 2017, the date that these consolidated financial statements were issued. The Company determined that there were no events or transactions, during such period that would require recognition or disclosure in these consolidated financial statements.
2. SUMMARY OF SIGNIFICANT ACCOUNTING POLICIES
Basis of Presentation and Use of Estimates -The preparation of the consolidated financial statements is in conformity with generally accepted accounting principles in the United States of America ("U.S. GAAP").
U.S. GAAP requires management to make estimates that affect the amounts reported in the consolidated financial statements and the accompanying notes. The most significant of these estimates relate to the allowance for loan losses and fair value measurements. These estimates reflect management's best judgment about current economic and market conditions and their effects based on information available as of the date of these consolidated financial statements. Although these and other estimates and assumptions are based on the best available information, actual results could be materially different from these estimates.
Principles of Consolidation -The accompanying consolidated financial statements reflect the Company's consolidated accounts, including the subsidiaries and the related consolidated results of operations with all intercompany balances and transactions eliminated in consolidation. In addition, the Company consolidates entities which meet the definition of a VIE for which the Company is the primary beneficiary. The primary beneficiary is the party who has the power to direct the activities of a VIE that most significantly impact the entity's economic performance and who has an obligation to absorb losses of the entity or a right to receive benefits from the entity that could potentially be significant to the entity.
Revenue Recognition Policies
Interest and Fee Income -Interest and fee income are recorded on an accrual basis to the extent that such amounts are earned and expected to be collected. Premiums and discounts are amortized into interest income using a level yield over the contractual life of the loan.
7
JEFFERIES FINANCE LLC AND SUBSIDIARIES
Notes to Consolidated Financial Statements
November 30, 2016 and 2015
Deferred Loan Fees, Net -Direct loan underwriting fees, net of specific costs, are deferred and amortized using a level yield as adjustments to the related loan's yield over the contractual life of the loan. Direct loan fees, net of specific costs, related to revolving credit facilities are amortized on a straight-line basis over the contractual life of the revolving credit facility as fee income.
Underwriting fees are recognized on a pro-rata basis as the corresponding loan is syndicated. If the Company retains a portion of the syndicated loan, a portion of the fee is deferred to produce a yield that is not less than the average yield on the portion of the syndicated loans that is held by the other syndicate members. In the event that a loan is prepaid before the scheduled maturity, all remaining deferred loan fees are recorded to interest income.
Cash and Restricted Cash -Cash represents overnight deposits. The Company maintained its cash and restricted cash balances of $1,632.4 million and $2,767.7 million at November 30, 2016 and 2015, respectively, at several financial institutions.
Restricted cash on deposit in respect of the Company's credit facilities and CLOs represents the amount of principal and interest collections received. The use of principal cash is limited to purchasing eligible loans or the potential reduction of related debt. Cash on deposit in the interest account is limited to the payment of interest, fees and other expenses as outlined in the governing documents.
Loans Receivable, Net -Loans receivable are recorded at cost, adjusted for unamortized premiums or discounts, net of unamortized deferred underwriting fees and net of allowance for loan losses. The Company intends to hold the majority of its loans until maturity. Loans for which the Company has the intent and ability to hold for the foreseeable future or until maturity are classified as held for investment.
Allowance for Loan Losses -The allowance for loan losses is a reserve established through a charge to provision for loan losses. The allowance, in the judgment of management, is necessary to reserve for estimated loan losses inherent in the loan portfolio. The allowance for loan losses includes reserves calculated in accordance with Financial Accounting Standards Board ("FASB") Accounting Standards Codification ("ASC") Topic 310, Receivables and allowance allocations calculated in accordance with ASC Topic 450, Contingencies . Further information regarding the Company's policies and methodology used to estimate the allowance for loan losses is presented in Note 4.
Loans Held for Sale, Net -The Company's business includes the structuring and underwriting of loan products with the intent to syndicate the majority of the loan to third parties. During the primary syndication process, loans that have been committed to be purchased by third parties but not yet settled are classified as Loans held for sale, net. The Company may invest in a percentage of an originated loan based upon the management of risk with respect to the entire portfolio. When the Company's position is larger than originally intended, the excess hold is also classified to Loans held for sale, net, on the Consolidated Balance Sheets.
Syndication activities and sales of loans held for sale are accounted for as sales based on the Company's satisfaction of the criteria for such accounting which provides that, as transferor, among other requirements, the Company has surrendered control over the loans. The sale of loans transferred from loans receivable to loans held for sale of approximately $790.6 million are included in proceeds from sales of loans held for sale in investing activities in the Consolidated Statements of Cash Flows.
Loans held for sale, net are carried at the lower of cost or fair value, as determined on an individual loan basis, net of unamortized deferred underwriting fees and valuation allowances. Net unrealized losses or gains, if any, are recognized in a valuation allowance through charges to earnings in Other losses, net in the Consolidated Statements of Earnings.
Unamortized premiums, discounts, origination fees and direct costs on loans held for sale are recognized as a component of the gain or loss on sale. Gains and losses on sales of loans held for sale are recognized on trade dates and are determined by the difference between the sale proceeds and the carrying value of the loans and are recorded in Other losses, net, in the Consolidated Statements of Earnings.
Investments -Investments are recorded on a trade date basis. Investments, including financial derivative instruments are recorded on the Consolidated Balance Sheets at fair value with changes in value recorded as a component of Other losses, net, in the Consolidated Statements of Earnings.
8
JEFFERIES FINANCE LLC AND SUBSIDIARIES
Notes to Consolidated Financial Statements
November 30, 2016 and 2015
The Company has elected to carry its investments primarily at fair value under the fair value option election in accordance with ASC Topic 825, Financial Instruments . The Company's election is done on an instrument-by-instrument basis. The election is made upon the acquisition of the eligible financial asset. The fair value election may not be revoked once an election is made.
The Company presents derivatives on the Consolidated Balance Sheets within Investments, with resulting gains or losses recognized in Other losses, net in the Consolidated Statements of Earnings. Fair value is based on dealer quotes, pricing models, discounted cash flow methodologies, or similar techniques for which the determination of fair value may require significant management judgment or estimation. Pricing information obtained from external data providers (including independent pricing services and brokers) may incorporate a range of market quotes from dealers, recent market transactions, benchmarking model derived prices to quoted market prices and trade data for comparable securities. External pricing data is subject to evaluation for reasonableness using a variety of means including comparisons of prices to those of similar product types, quality and maturities, consideration of the narrowness or wideness of the range of prices obtained, knowledge of recent market transactions and an assessment of the similarity in prices to comparable dealer offerings in a recent time period. Derivative contracts are valued using models, whose input reflect the assumption that the Company believes market participants would use in valuing the derivative in a current period transaction. Inputs to valuation models are appropriately calibrated to market data.
Deferred Structuring Fees -Deferred structuring fees on Credit facilities, Secured notes payable and Long-term debt are included in Other assets on the Consolidated Balance Sheets and are amortized to Interest expense in the Consolidated Statements of Earnings over the contractual term of the borrowing using a level yield.
Fair Value Hierarchy -In determining fair value, the Company maximizes the use of observable inputs and minimizes the use of unobservable inputs by requiring that observable inputs be used when available. Observable inputs are inputs that market participants would use in pricing the asset or liability based on market data obtained from independent sources.
If unobservable inputs are used, the Company will use assumptions that reflect the assumptions that market participants would use in pricing the asset or liability developed based on the best information available in the circumstances.
The Company applies a hierarchy to categorize its fair value measurements broken down into three levels based on the transparency of inputs as follows:
Level 1-Quoted prices are available in active markets for identical assets or liabilities as of the reported date.
Level 2-Pricing inputs are other than quoted prices in active markets, which are either directly or indirectly observable as of the reported date. The nature of these financial instruments include cash instruments, for which quoted prices are available but traded less frequently; derivative instruments whose fair values have been derived using a model where inputs to the model are directly observable in the market or can be derived principally from or corroborated by observable market data; and instruments that are fair valued using other financial instruments, the parameters of which can be directly observed.
Level 3-Instruments that have little to no pricing observability as of the reported date. These financial instruments are measured using management's best estimate of fair value, where the inputs into the determination of fair value require significant management judgment or estimation.
The valuation of financial instruments may include the use of valuation models and other techniques. Adjustments to valuations derived from valuation models may be made when, in management's judgment, the features of the financial instrument, such as its complexity or the market in which the financial instrument is traded and risk uncertainties about market conditions, require that an adjustment be made to the value derived from the models.
The Company's fair value measurements involve third party pricing for the majority of its assets and liabilities. If third party pricing is unavailable, the Company may employ various valuation techniques and models, which involve inputs that are observable, when available. The Company's valuation policies and procedures are reviewed at least annually and are updated as necessary. Further, the Company tracks the fair values of significant assets and liabilities using a variety of methods including third party vendors, comparison to previous trades and an assessment for overall reasonableness. See Note 7 for further information on fair value measurements.
9
JEFFERIES FINANCE LLC AND SUBSIDIARIES
Notes to Consolidated Financial Statements
November 30, 2016 and 2015
New Accounting Developments
Revenue Recognition -In May 2014, the FASB issued ASU, No. 2014-09, Revenue from Contracts with Customers which defines how companies report revenues from contracts with customers, and also require enhanced disclosures. The guidance is effective beginning in the first quarter of fiscal year 2019. FASB issued ASU, No. 2015-14 which deferred the effective date by one year. Subsequently, it was updated with ASU No. 2016-10 and ASU No. 2016-12. The Company does not expect this guidance to have a material effect on the consolidated financial condition, results of operations or cash flows.
Presentation of Financial Statements -In August 2014, the FASB issued ASU, No. 2014-15, Disclosure of Uncertainties about an Entity's Ability to Continue as a Going Concern which requires management to evaluate whether there are conditions or events, considered in the aggregate, that raise substantial doubt about the entity's ability to continue as a going concern within one year after the date that the financial statements are issued (or within one year after the date that the financial statements are available to be issued when applicable). The guidance is effective beginning in the first quarter of fiscal year 2017. The Company does not expect this guidance to have a material effect on the consolidated financial condition, results of operations or cash flows.
Consolidation -In February 2015, the FASB issued ASU, No. 2015-02, Amendments to Consolidation Analysis which requires companies to reevaluate whether they should consolidate certain entities. Subsequently, it was updated with ASU No. 2016-17. The guidance is effective beginning in the first quarter of fiscal year 2017 and early adoption is permitted. The Company early adopted this guidance in fiscal year 2015. The adoption of this guidance did not have an impact on the Company's consolidated financial condition, results of operations or cash flows.
Presentation of Debt Issuance Costs -In April 2015, the FASB issued ASU, No. 2015-03, Amendments to Simplifying the Presentation of Debt Issuance Costs which requires companies to present debt issue costs as a direct deduction from that debt liability. The guidance is effective beginning in the first quarter of fiscal year 2017 and early adoption is permitted. The Company is currently evaluating the impact of the new guidance on the Company's consolidated financial statements. The Company does not expect this guidance to have a material effect on the consolidated financial condition, results of operations or cash flows.
Financial Instruments -In January 2016, the FASB issued ASU, No. 2016-01, Financial Instruments-Overall: Recognition and Measurement of Financial Assets and Financial Liabilities. The guidance affects the accounting for equity investments, financial liabilities under fair value option and the presentation and disclosure requirements of financial instruments. The guidance is effective in the first quarter of fiscal year 2019. Early adoption is permitted for the accounting guidance on financial liabilities under the fair value option. The Company is currently evaluating the impact of the new guidance on the Company's consolidated financial statements. In June 2016, the FASB issued ASU, No. 2016-13, Financial Instruments-Credit Losses: Measurement of Credit Losses on Financial Instruments. The guidance replaces the incurred loss impairment methodology in current U.S. GAAP with a methodology that reflects expected credit losses and requires consideration of a broader range of reasonable and supportable information to inform credit loss estimates. The guidance is effective in the first quarter of fiscal year 2021 and early adoption is permitted. The Company is currently evaluating the impact of the new guidance on the Company's consolidated financial statements.
Statement of Cash Flows -In August 2016, the FASB issued ASU, No. 2016-15, Statement of Cash Flows: Classification of Certain Cash Receipts and Cash Payments. The guidance provides specific guidance on eight cash flow classification issues. The guidance is effective in the first quarter of fiscal year 2019 and early adoption is permitted. The Company is currently evaluating the impact of the new guidance on the Company's consolidated financial statements. In November 2016, the FASB issued ASU, No. 2016-18, Statement of Cash Flows: Restricted Cash. The guidance provides specific guidance on classification and presentation of changes in restricted cash on the statement of cash flows. The guidance is effective in the first quarter of fiscal year 2019 and early adoption is permitted. The Company is currently evaluating the impact of the new guidance on the Company's consolidated financial statements.
10
JEFFERIES FINANCE LLC AND SUBSIDIARIES
Notes to Consolidated Financial Statements
November 30, 2016 and 2015
3. RESTRICTED CASH
The following is a summary of restricted cash as of November 30, 2016 and 2015 (in thousands):
| 2016 | 2015 | |||||||
Principal and interest collections on loans held in credit facilities and CLOs | $ | 217,146 | $ | 202,098 | ||||
Reserves held in credit facilities and CLOs to support future commitments | 758,745 | 1,073,802 | ||||||
|
|
|
| |||||
Total restricted cash | $ | 975,891 | $ | 1,275,900 | ||||
|
|
|
| |||||
As of November 30, 2016 there was $765.0 million of cash and investments in the revolver CLOs to support future drawdowns. The CLOs require the cash on deposit in interest accounts to be used to pay senior management fees, interest to note holders, subordinate management fees and any residual to the subordinate note holders, providing the structure is in compliance with the collateralization tests. In the event the CLOs were not in compliance with the collateralization tests, cash in the interest accounts would be used to pay senior management fees, interest to the note holders and the residual could be diverted to reduce the secured notes outstanding.
4. LOANS RECEIVABLE, NET
The Company's loan receivable portfolio consists primarily of senior secured loans in various industries. The portfolio is segmented into originated and secondary loans which reflect how the portfolio is managed. Originated is a designation that indicates that the Company has had a major role in underwriting the loan either as an arranger or other title. Secondary is a designation that indicates that the Company acquired the loans through primary syndications conducted by other arrangers or purchased in the open market.
The following is a summary of outstanding loan balances as of November 30, 2016 and 2015 (in thousands):
| 2016 | 2015 | |||||||
Loans receivable: | ||||||||
Originated | $ | 1,991,214 | $ | 2,104,665 | ||||
Secondary | 2,572,418 | 1,950,678 | ||||||
|
|
|
| |||||
Total loans receivable | 4,563,632 | 4,055,343 | ||||||
Less: original issue discount | (64,964 | ) | (50,691 | ) | ||||
|
|
|
| |||||
Total loans receivable, net of original issue discount | 4,498,668 | 4,004,652 | ||||||
Less: deferred loan fees | (89,110 | ) | (89,379 | ) | ||||
|
|
|
| |||||
Total loans receivable, net of deferred loan fees | 4,409,558 | 3,915,273 | ||||||
Less: allowance for loan losses | (65,897 | ) | (53,970 | ) | ||||
|
|
|
| |||||
Total loans receivable, net | $ | 4,343,661 | $ | 3,861,303 | ||||
|
|
|
| |||||
As of November 30, 2016 there was $33.3 million and $31.7 million of original issue discount included in originated and secondary loans, respectively. As of November 30, 2015 there was $31.8 million and $18.9 million of original issue discount included in originated and secondary loans, respectively.
As of November 30, 2016 and 2015, $4.3 billion and $3.9 billion of loans receivable were pledged as collateral against the Company's credit facilities and secured notes issued by the CLOs, respectively.
Nonaccrual Loans -If a loan is 90 days or more past due or the borrower is not able to service its debt and other obligations, the loan is placed on nonaccrual status. When a loan is placed on nonaccrual status, interest previously recognized as interest income but not yet paid is reversed and the recognition of interest income on that loan will stop until
11
JEFFERIES FINANCE LLC AND SUBSIDIARIES
Notes to Consolidated Financial Statements
November 30, 2016 and 2015
factors indicating doubtful collection no longer exist and the loan has been brought current. Exceptions to this policy will be made if the loan is well secured and in the process of collection. Payments received on nonaccrual loans are typically applied to principal outstanding unless collectability of the principal amount is reasonably assured, in which case interest is recognized on a cash basis. On the date the borrower pays in full all overdue amounts, the borrower's loan will emerge from nonaccrual status and all overdue interest, including those from prior years, will be recognized as interest income in the current period.
The following is an analysis of past due loans at November 30, 2016 (in thousands):
| LOANS 30-89 DAYS PAST DUE | LOANS 90 OR MORE DAYS PAST DUE | TOTAL PAST DUE LOANS | CURRENT LOANS | TOTAL LOANS | ||||||||||||||||
Originated | $ | 21,214 | $ | 6,003 | $ | 27,217 | $ | 1,930,723 | $ | 1,957,940 | ||||||||||
Secondary | - | 8,797 | 8,797 | 2,531,931 | 2,540,728 | |||||||||||||||
|
|
|
|
|
|
|
|
|
| |||||||||||
Total | $ | 21,214 | $ | 14,800 | $ | 36,014 | $ | 4,462,654 | $ | 4,498,668 | ||||||||||
|
|
|
|
|
|
|
|
|
| |||||||||||
The following is an analysis of past due loans as of November 30, 2015 (in thousands):
| LOANS 30-89 DAYS PAST DUE | LOANS 90 OR MORE DAYS PAST DUE | TOTAL PAST DUE LOANS | CURRENT LOANS | TOTAL LOANS | ||||||||||||||||
Originated | $ | - | $ | - | $ | - | $ | 2,072,898 | $ | 2,072,898 | ||||||||||
Secondary | 13,563 | - | 13,563 | 1,918,191 | 1,931,754 | |||||||||||||||
|
|
|
|
|
|
|
|
|
| |||||||||||
Total | $ | 13,563 | $ | - | $ | 13,563 | $ | 3,991,089 | $ | 4,004,652 | ||||||||||
|
|
|
|
|
|
|
|
|
| |||||||||||
Impaired Loans -Loans are considered impaired when, based on current information and events, it is probable the Company will be unable to collect all amounts due in accordance with the original contractual terms of the loan agreement, including scheduled principal and interest payments. Impairment is evaluated on an individual loan basis. If a loan is impaired, a specific valuation allowance is allocated, if necessary, so that the loan is reported net, at the present value of estimated future cash flows using the loan's effective rate or at the fair value of collateral if repayment is expected solely from the collateral.
Payments received on impaired loans are typically applied to principal outstanding unless collectability of the principal amount is reasonably assured, in which case interest is recognized on a cash basis. Loans will be charged off against the allowance when full collection of the principal from the sale of collateral, if applicable, or the enforcement of guarantees is remote. The Company does not necessarily wait until the final resolution of a loan to charge off the uncollectible balance.
The following is a summary of impaired loans as of November 30, 2016 (in thousands):
| RECORDED INVESTMENT | UNPAID PRINCIPAL BALANCE | RELATED ALLOWANCE | AVERAGE RECORDED INVESTMENT | |||||||||||||
With allowance recorded: | ||||||||||||||||
Originated | $ | 62,301 | $ | 66,848 | $ | 20,816 | $ | 50,551 | ||||||||
Secondary | 12,912 | 26,512 | 10,243 | 28,211 | ||||||||||||
|
|
|
|
|
|
|
| |||||||||
Total | $ | 75,213 | $ | 93,360 | $ | 31,059 | $ | 78,762 | ||||||||
|
|
|
|
|
|
|
| |||||||||
12
JEFFERIES FINANCE LLC AND SUBSIDIARIES
Notes to Consolidated Financial Statements
November 30, 2016 and 2015
The following is a summary of impaired loans as of November 30, 2015 (in thousands):
| RECORDED INVESTMENT | UNPAID PRINCIPAL BALANCE | RELATED ALLOWANCE | AVERAGE RECORDED INVESTMENT | |||||||||||||
With allowance recorded: | ||||||||||||||||
Originated | $ | 38,801 | $ | 42,701 | $ | 6,418 | $ | 11,651 | ||||||||
Secondary | 43,509 | 44,883 | 22,321 | 22,427 | ||||||||||||
|
|
|
|
|
|
|
| |||||||||
Total | $ | 82,310 | $ | 87,584 | $ | 28,739 | $ | 34,078 | ||||||||
|
|
|
|
|
|
|
| |||||||||
The average recorded investment reflects the change in the balance of impaired loans as of November 30, 2016 and 2015.
As of November 30, 2016 and 2015, each individual impaired loan had a specific allowance recorded.
Interest income was not recognized on impaired and nonaccrual loans during the years ended November 30, 2016, 2015 and 2014. If the impaired and nonaccrual loans had been performing, an additional $3.9 million, $1.5 million and $0.6 million of interest income would have been recorded for the years ended November 30, 2016, 2015 and 2014, respectively.
Allowance for Loan Losses -The Company's allowance for loan losses reflects management's estimate of net loan losses inherent in the loan portfolio. The allowance for general loan losses is calculated as the aggregate loan loss reserve for losses inherent in the portfolio that have not yet been identified.
Reserve factors are assigned to the loans in the portfolio, which dictate the percentage of the total outstanding loan balance that is reserved. The loan portfolio information is regularly reviewed to determine whether it is necessary to revise the reserve factors.
The reserve factors used in the calculation are determined by analyzing the following elements:
| ∎ | the types of loans; |
| ∎ | the expected loss with regard to the loan type; |
| ∎ | the internal credit rating assigned to the loans; and |
| ∎ | type of industry for a given loan. |
The Company has a policy to reserve for impaired loans based on a comparison of the recorded carrying value of the loan to either the present value of the loan's expected cash flow or the estimated fair value of the underlying collateral where applicable. The Company considers market value of the loan in its determination of the loan losses for impaired loans. There is no threshold when evaluating for impaired loans. Loans will be charged off against the allowance when full collection of the principal from the sale of collateral or the enforcement of guarantees is remote. The Company does not necessarily wait until the final resolution of a loan to charge off the uncollectible balance.
The Company regularly tests the allowance for loan losses for reasonableness. In determining reasonableness, trends in the elements analyzed in establishing the reserve factors described above are reviewed. In addition, the Company continues to monitor the market to corroborate the reserve levels on similar loan products. The Company also computes an allowance for unfunded lending commitments using a methodology that is similar to that used for loans. The table below summarizes the Company's reporting of its allowance for loan losses:
CONSOLIDATED | CONSOLIDATED | |||
Allowance for loan losses on: | ||||
Loans | Allowance for loan losses | Provision for loan losses | ||
Unfunded loan commitments | Other liabilities | General, administrative and other |
13
JEFFERIES FINANCE LLC AND SUBSIDIARIES
Notes to Consolidated Financial Statements
November 30, 2016 and 2015
The following is a summary of the activity in the allowance for loan losses for the year ended November 30, 2016 (in thousands):
| ORIGINATED | SECONDARY | TOTAL | ||||||||||
Balance, November 30, 2015 | $ | 17,454 | $ | 36,516 | $ | 53,970 | ||||||
Provision for loan losses-general | 3,751 | 5,857 | 9,608 | |||||||||
Provision for loan losses-specific | 15,045 | 13,227 | 28,272 | |||||||||
Transfers to loans held for sale, net | - | (12,654 | ) | (12,654 | ) | |||||||
Charge-offs | (647 | ) | (12,652 | ) | (13,299 | ) | ||||||
|
|
|
|
|
| |||||||
Balance, November 30, 2016 | 35,603 | 30,294 | 65,897 | |||||||||
|
|
|
|
|
| |||||||
Balance, end of period-general | $ | 14,787 | $ | 20,051 | $ | 34,838 | ||||||
|
|
|
|
|
| |||||||
Balance, end of period-specific | $ | 20,816 | $ | 10,243 | $ | 31,059 | ||||||
|
|
|
|
|
| |||||||
Loans receivable: | ||||||||||||
Loans collectively evaluated-general | $ | 1,895,992 | $ | 2,527,816 | $ | 4,423,808 | ||||||
Loans individually evaluated-specific | 61,948 | 12,912 | 74,860 | |||||||||
|
|
|
|
|
| |||||||
Total | $ | 1,957,940 | $ | 2,540,728 | $ | 4,498,668 | ||||||
|
|
|
|
|
| |||||||
The following is a summary of the activity in the allowance for loan losses for the year ended November, 2015 (in thousands):
| ORIGINATED | SECONDARY | TOTAL | ||||||||||
Balance, November 30, 2014 | $ | 10,373 | $ | 17,597 | $ | 27,970 | ||||||
Provision for (recovery of) loan losses-general | 2,243 | (2 | ) | 2,241 | ||||||||
Provision for loan losses-specific | 8,738 | 18,921 | 27,659 | |||||||||
Charge-offs | (3,900 | ) | - | (3,900 | ) | |||||||
|
|
|
|
|
| |||||||
Balance, November 30, 2015 | 17,454 | 36,516 | 53,970 | |||||||||
|
|
|
|
|
| |||||||
Balance, end of period-general | $ | 11,036 | $ | 14,195 | $ | 25,231 | ||||||
|
|
|
|
|
| |||||||
Balance, end of period-specific | $ | 6,418 | $ | 22,321 | $ | 28,739 | ||||||
|
|
|
|
|
| |||||||
Loans receivable: | ||||||||||||
Loans collectively evaluated-general | $ | 2,034,097 | $ | 1,888,245 | $ | 3,922,342 | ||||||
Loans individually evaluated-specific | 38,801 | 43,509 | 82,310 | |||||||||
|
|
|
|
|
| |||||||
Total | $ | 2,072,898 | $ | 1,931,754 | $ | 4,004,652 | ||||||
|
|
|
|
|
| |||||||
14
JEFFERIES FINANCE LLC AND SUBSIDIARIES
Notes to Consolidated Financial Statements
November 30, 2016 and 2015
The following is a summary of the activity in the allowance for loan losses for the year ended November 30, 2014 (in thousands):
| ORIGINATED | SECONDARY | TOTAL | ||||||||||
Balance, November 30, 2013 | $ | 3,755 | $ | 17,873 | $ | 21,628 | ||||||
Provision for loan losses-general | 5,038 | 1,420 | 6,458 | |||||||||
Provision for (recovery of) loan losses-specific | 2,261 | (740 | ) | 1,521 | ||||||||
Transfers to loans held for sale, net | (681 | ) | (956 | ) | (1,637 | ) | ||||||
|
|
|
|
|
| |||||||
Balance, November 30, 2014 | 10,373 | 17,597 | 27,970 | |||||||||
|
|
|
|
|
| |||||||
Balance, end of period-general | $ | 8,793 | $ | 14,197 | $ | 22,990 | ||||||
|
|
|
|
|
| |||||||
Balance, end of period-specific | $ | 1,580 | $ | 3,400 | $ | 4,980 | ||||||
|
|
|
|
|
| |||||||
Loans receivable: | ||||||||||||
Loans collectively evaluated-general | $ | 1,816,276 | $ | 1,532,017 | $ | 3,348,293 | ||||||
Loans individually evaluated-specific | 7,820 | 5,776 | 13,596 | |||||||||
|
|
|
|
|
| |||||||
Total | $ | 1,824,096 | $ | 1,537,793 | $ | 3,361,889 | ||||||
|
|
|
|
|
| |||||||
The reserve balances related to loan losses on unfunded commitments were $5.1 million and $3.6 million as of November 30, 2016 and 2015, respectively. In addition, the Company increased the reserve related to loan losses on unfunded commitments by $1.5 million, $0.1 million and $0.4 million during the years ended November 30, 2016, 2015 and 2014, respectively. The changes in reserve were recognized in General, administrative and other in the Consolidated Statements of Earnings and the reserve was included in Other liabilities on the Consolidated Balance Sheets.
Credit Quality Indicators -As part of the on-going monitoring of the credit quality of the Company's loan portfolio, management tracks credit quality indicators. Management regularly reviews the performance of its loans receivable to evaluate the credit risk.
The Company evaluates each loan using six weighted credit risk grade categories that have both qualitative and quantitative components that differentiate the level of risk. Credit risk categories are assigned weights based on the characteristics of issuers.
For each borrower, the Company evaluates the following credit risk categories:
| ∎ | Industry segment |
| ∎ | Position within the industry |
| ∎ | Earnings / Operating Cash Flows |
| ∎ | Asset / Liability values |
| ∎ | Financial flexibility / debt capacity |
| ∎ | Management and controls |
The Company utilizes a risk grading matrix to assign an internal credit grade ("ICG") to each of its loans. Loans are individually rated on a tiered scale of one to ten, with each rating further divided into three levels of .2, .5 and .8.
A description of the general characteristics of the ICGs is as follows:
| ∎ | Grade 1-Issuers assigned this grade are characterized as substantially risk free and having an extremely strong capacity to meet all financial obligations. |
| ∎ | Grade 2-Issuers assigned this grade are characterized as representing minimal risk. |
| ∎ | Grade 3-Issuers assigned this grade are characterized as representing modest risk. |
| ∎ | Grade 4-Issuers assigned this grade are characterized as representing better than average risk. |
15
JEFFERIES FINANCE LLC AND SUBSIDIARIES
Notes to Consolidated Financial Statements
November 30, 2016 and 2015
| ∎ | Grade 5-Issuers assigned this grade are characterized as representing average risk. |
| ∎ | Grade 6-Issuers assigned this grade are characterized as representing acceptable risk. |
| ∎ | Grade 7-Issuers assigned this grade are currently vulnerable to adverse business, financial and economic conditions and are characterized by increasing credit risk. They possess potential weakness that may, if not checked or corrected, weaken the asset or result in a likelihood of default at some future date. The increasing risk has or may result in discounted pricing levels or decreased trading liquidity. |
| ∎ | Grade 8-Issuers assigned this grade are characterized by inadequate repayment capacity and / or recovery of the obligor or of the collateral pledged resulting in potential loss if deficiencies are not corrected. |
| ∎ | Grade 9-Issuers assigned this grade are in (a) payment default at any level in its debt structure or (b) bankruptcy. In addition, asset weaknesses may make collection or liquidation in full, on the basis of existing facts, highly questionable and improbable. |
| ∎ | Grade 10-Issuers assigned this grade are charged-off. |
The following is a summary of credit risk profile by ICG as of November 30, 2016 (in thousands):
ICG | ORIGINATED | SECONDARY | TOTAL | |||||||||
5.2 | $ | - | $ | 14,863 | $ | 14,863 | ||||||
5.5 | - | 70,043 | 70,043 | |||||||||
5.8 | 23,007 | 264,545 | 287,552 | |||||||||
6.2 | 202,016 | 579,886 | 781,902 | |||||||||
6.5 | 896,859 | 1,022,226 | 1,919,085 | |||||||||
6.8 | 466,248 | 400,933 | 867,181 | |||||||||
7.2 | 119,092 | 131,383 | 250,475 | |||||||||
7.5 | 131,136 | 16,666 | 147,802 | |||||||||
7.8 | 9,840 | 12,102 | 21,942 | |||||||||
8.2 | 89,310 | 16,288 | 105,598 | |||||||||
8.5 | 15,694 | - | 15,694 | |||||||||
9.2 | 4,738 | 11,793 | 16,531 | |||||||||
|
|
|
|
|
| |||||||
Total | $ | 1,957,940 | $ | 2,540,728 | $ | 4,498,668 | ||||||
|
|
|
|
|
| |||||||
The following is a summary of credit risk profile by ICG as of November 30, 2015 (in thousands):
ICG | ORIGINATED | SECONDARY | TOTAL | |||||||||
5.2 | $ | - | $ | 39,209 | $ | 39,209 | ||||||
5.5 | - | 62,460 | 62,460 | |||||||||
5.8 | 30,269 | 166,900 | 197,169 | |||||||||
6.2 | 243,597 | 376,283 | 619,880 | |||||||||
6.5 | 856,837 | 740,159 | 1,596,996 | |||||||||
6.8 | 628,437 | 414,041 | 1,042,478 | |||||||||
7.2 | 186,133 | 57,194 | 243,327 | |||||||||
7.5 | 51,799 | 24,556 | 76,355 | |||||||||
7.8 | 72,851 | 10,026 | 82,877 | |||||||||
8.2 | 2,975 | 27,363 | 30,338 | |||||||||
8.5 | - | 13,563 | 13,563 | |||||||||
|
|
|
|
|
| |||||||
Total | $ | 2,072,898 | $ | 1,931,754 | $ | 4,004,652 | ||||||
|
|
|
|
|
| |||||||
16
JEFFERIES FINANCE LLC AND SUBSIDIARIES
Notes to Consolidated Financial Statements
November 30, 2016 and 2015
Troubled Debt Restructurings (TDRs) -The Company periodically modifies or participates in the modification of the terms of a loan receivable in response to a borrower's difficulties. Modifications that include a significant financial concession(s) to the borrower that likely reflect a current view that the repayment on the original terms is unlikely are accounted for as TDRs. The Company uses a consistent methodology across all loans to determine if a modification granted to a borrower, determined to be in financial difficulty is a TDR.
The Company's policies on TDR identification include the following examples of indicators used to determine whether the borrower is in financial difficulty:
| ∎ | Payment default of principal and/or interest |
| ∎ | Bankruptcy declaration |
| ∎ | Going concern opinion issued by accountants |
| ∎ | Insufficient cash flow to service debt with low likelihood of turnaround in the short term |
| ∎ | Securities (public) are de-listed |
| ∎ | Refinancing sources are unlikely |
| ∎ | Financial covenants breach is unlikely to be amended |
If the borrower is determined to be in financial difficulty, then the Company utilizes the following criteria to determine whether a concession has been granted to the borrower:
| ∎ | Modification of interest rate below market rate |
| ∎ | The borrower does not otherwise have access to funding for debt with similar risk characteristics in the market at the restructured rate and terms |
| ∎ | Capitalization of interest |
| ∎ | Delaying principal and/or interest for a period of year or more |
| ∎ | Forgiveness of some or all of the principal balance |
Below is a summary of the Company's loans which were classified as TDR as of November 30, 2016 (in thousands):
| PRE- MODIFICATION OUTSTANDING RECORDED AMOUNT | POST- MODIFICATION OUTSTANDING RECORDED AMOUNT | INVESTMENT IN TDR SUBSEQUENTLY DEFAULTED | ||||||||||
Primary | $ | 40,613 | $ | 35,889 | $ | - | ||||||
Secondary | $ | 58,340 | $ | 37,660 | $ | - | ||||||
|
|
|
|
|
| |||||||
Total | $ | 98,953 | $ | 73,549 | $ | - | ||||||
|
|
|
|
|
| |||||||
Below is a summary of the Company's loans which were classified as TDR as of November 30, 2015 (in thousands):
| PRE- MODIFICATION OUTSTANDING RECORDED AMOUNT | POST- MODIFICATION OUTSTANDING RECORDED AMOUNT | INVESTMENT IN TDR SUBSEQUENTLY DEFAULTED | ||||||||||
Secondary | $ | 8,660 | $ | 4,911 | $ | - | ||||||
|
|
|
|
|
| |||||||
Total | $ | 8,660 | $ | 4,911 | $ | - | ||||||
|
|
|
|
|
| |||||||
All restructured loans that remain outstanding are on non-accrual status. Because the loans were classified on non-accrual status both before and after restructuring, the modifications did not impact the Company's determination of the allowance for loan losses. There were no payment defaults on loans restructured in troubled debt restructurings during the years ended November 30, 2016 and 2015.
17
JEFFERIES FINANCE LLC AND SUBSIDIARIES
Notes to Consolidated Financial Statements
November 30, 2016 and 2015
Modified loans that are classified as TDRs are individually evaluated and measured for impairment. Modified loans that meet the definition of a TDR are subject to the Company's standard impaired loan policy, namely that non-accrual loans are individually reviewed for impairment.
Other Liabilities -Included in Other liabilities are amounts payable for loans pending settlement. As of November 30, 2016 and 2015 there were $307.4 million and $140.4 million, respectively, of pending purchases.
5. LOANS HELD FOR SALE, NET
Below is a summary of Loans held for sale, net, as of November 30, 2016 and 2015 (in thousands):
| 2016 | 2015 | |||||||
Loans held for sale | $ | 966,425 | $ | 266,155 | ||||
Less: | ||||||||
Original issue discount | (13,124 | ) | (10,979 | ) | ||||
Valuation allowance | (16,041 | ) | (7,756 | ) | ||||
Deferred loan fees, net | (6,798 | ) | 433 | |||||
|
|
|
| |||||
Loans held for sale, net | $ | 930,462 | $ | 247,853 | ||||
|
|
|
| |||||
Included in the Loans held for sale were $739.2 million and $174.1 million of loans that funded prior to but completion of the syndication process occurred after November 30, 2016 and 2015, respectively. As of November 30, 2016 and 2015 loans held for sale of $7.3 million and $65.1 million were pledged as collateral against the Company's credit facilities and secured notes issued by CLOs, respectively. As of November 30, 2016 and 2015, the Company had one impaired / non-accrual loan in the amount of $1.2 million and $2.6 million, respectively, in Loans held for sale, net.
Other Assets -Included in Other assets are amounts receivable for sales of loans pending settlement. As of November 30, 2016 and 2015, there were $60.4 million and $42.7 million, respectively, of pending sales.
6. INVESTMENTS
As of November 30, 2016 and 2015, one of the CLOs held $156.8 million and $215.8 million, respectively, of U.S. Treasury securities which have short-term maturities and are restricted under the terms as stated in the CLO indenture. Also, under the fair value option as of November 30, 2016 and 2015, the Company held investments of $22.4 million and $26.0 million, respectively, in a corporate bond, interest rate swaps, secured and unsecured notes and other investments which were accounted for at fair value.
DERIVATIVE FINANCIAL INSTRUMENTS
As part of certain CLOs' risk management strategy to protect against the effect of fluctuations in London Interbank Offered Rate ("LIBOR") rates associated with its loan commitments, interest rate swaps were purchased and currently have a notional value of $1,184.5 million with remaining maturities ranging from one to five years. On August 14, 2014, JFIN entered into a Total Return Swap ("TRS") with Jefferies Financial Products, LLC ("JFP"), a wholly owned subsidiary of JGL, with the $23.0 million Variable Funding note for one of the CLOs as the underlying asset. The TRS has a remaining maturity of approximately five years.
As of November 30, 2016 and 2015, the interest rate swaps and the TRS had a fair value of $6.1 million and $9.8 million, respectively and were included within Investments on the Consolidated Balance Sheets. The net loss on the interest rate swaps and TRS was $3.3 million, $10.4 million and $6.2 million for the years ended November 30, 2016, 2015 and 2014 and was included in Other losses, net in the Consolidated Statements of Earnings. As of November 30, 2016 and 2015 the counterparty credit quality with respect to the interest rate swaps was between A+ and BBB.
18
JEFFERIES FINANCE LLC AND SUBSIDIARIES
Notes to Consolidated Financial Statements
November 30, 2016 and 2015
The following table sets forth the remaining contractual maturities of the interest rate swaps and total return swap at their notional value as of November 30, 2016 (in thousands):
| 1-5 YEARS | GREATER THAN 5 YEARS | TOTAL | ||||||||||
Interest rate swaps | $ | 1,184,472 | $ | - | $ | 1,184,472 | ||||||
Total return swap | $ | - | $ | 8,723 | $ | 8,723 | ||||||
7. FINANCIAL INSTRUMENTS AT FAIR VALUE
The following table presents the Company's assets and liabilities measured at fair value on a recurring and nonrecurring basis as of November 30, 2016 and 2015 by level within the fair value hierarchy (in thousands):
NOVEMBER 30, 2016 | LEVEL 1 | LEVEL 2 | LEVEL 3 | TOTAL | ||||||||||||
Assets, nonrecurring basis: | ||||||||||||||||
Loans held for sale, net | $ | - | $ | 930,462 | $ | - | $ | 930,462 | ||||||||
|
|
|
|
|
|
|
| |||||||||
Assets, recurring basis: | ||||||||||||||||
Investments | ||||||||||||||||
U.S. treasury securities | $ | 156,780 | $ | - | $ | - | $ | 156,780 | ||||||||
Bonds | - | 4,188 | - | 4,188 | ||||||||||||
Notes | - | - | 2,370 | 2,370 | ||||||||||||
Interest rate swaps | - | 2,741 | - | 2,741 | ||||||||||||
Corporate equity securities | - | 951 | 8,877 | 9,828 | ||||||||||||
Total return swap | - | - | 3,309 | 3,309 | ||||||||||||
|
|
|
|
|
|
|
| |||||||||
Total Investments | $ | 156,780 | $ | 7,880 | $ | 14,556 | $ | 179,216 | ||||||||
|
|
|
|
|
|
|
| |||||||||
NOVEMBER 30, 2015 | LEVEL 1 | LEVEL 2 | LEVEL 3 | TOTAL | ||||||||||||
Assets, nonrecurring basis: | ||||||||||||||||
Loans held for sale, net | $ | - | $ | 192,316 | $ | 55,104 | $ | 247,420 | ||||||||
|
|
|
|
|
|
|
| |||||||||
Assets, recurring basis: | ||||||||||||||||
Investments | ||||||||||||||||
U.S. treasury securities | $ | 215,809 | $ | - | $ | - | $ | 215,809 | ||||||||
Bonds | - | 4,450 | - | 4,450 | ||||||||||||
Interest rate swaps | - | 7,300 | - | 7,300 | ||||||||||||
Corporate equity securities | - | - | 11,675 | 11,675 | ||||||||||||
Total return swap | - | - | 2,544 | 2,544 | ||||||||||||
|
|
|
|
|
|
|
| |||||||||
Total Investments | $ | 215,809 | $ | 11,750 | $ | 14,219 | $ | 241,778 | ||||||||
|
|
|
|
|
|
|
| |||||||||
For loans held for sale, net, the Company uses observable market data, including pricing on recent trades, third party pricing, or when appropriate, the recovery value of underlying collateral. Included within Loans held for sale, net are loans recorded at lower of cost or fair value, where cost approximates fair value.
For bonds, interest rate swaps and other investments, the Company primarily uses broker quotes for non-exchange traded investments and, based upon the observability of the inputs.
19
JEFFERIES FINANCE LLC AND SUBSIDIARIES
Notes to Consolidated Financial Statements
November 30, 2016 and 2015
U.S. Treasury securities are measured based on quoted market prices.
The following table presents the changes in Level 3 assets measured on a recurring and nonrecurring basis as of November 30, 2016 (in thousands):
| BALANCE AT DECEMBER 1, 2015 | PURCHASES/ ADDITIONS | SETTLEMENTS, NET | TOTAL GAINS/ LOSSES (REALIZED AND UNREALIZED) | TRANSFERS IN AND OUT OF LEVEL 3 | BALANCE AT NOVEMBER 30, 2016 | NET CHANGE IN UNREALIZED GAINS/LOSSES RELATING TO INSTRUMENTS STILL HELD AT NOVEMBER 30, 2016 | ||||||||||||||||||||||
Corporate equity securities | $ | 11,675 | $ | 524 | $ | - | $ | (3,322 | ) | $ | - | $ | 8,877 | $ | (3,322 | ) | ||||||||||||
Notes | $ | - | $ | 262,992 | $ | (220,386 | ) | $ | (23,992 | ) | $ | (16,244 | ) | $ | 2,370 | $ | - | |||||||||||
Loans held for sale, net | $ | 55,103 | $ | 560,035 | $ | (483,763 | ) | $ | (49,660 | ) | $ | (81,715 | ) | $ | - | $ | - | |||||||||||
Total return swap | $ | 2,544 | $ | - | $ | 2,280 | $ | (1,515 | ) | $ | - | $ | 3,309 | $ | (1,515 | ) | ||||||||||||
The following table presents the changes in Level 3 assets measured on a recurring and nonrecurring basis as of November 30, 2015 (in thousands):
| BALANCE AT DECEMBER 1, 2014 | PURCHASES/ ADDITIONS | SETTLEMENTS, NET | TOTAL GAINS/ LOSSES (REALIZED AND UNREALIZED) | TRANSFERS IN AND OUT OF LEVEL 3 | BALANCE AT NOVEMBER 30, 2015 | NET CHANGE IN UNREALIZED GAINS/LOSSES RELATING TO INSTRUMENTS STILL HELD AT NOVEMBER 30, 2015 | ||||||||||||||||||||||
Corporate equity securities | $ | - | $ | 3,891 | $ | - | $ | 3,084 | $ | 4,700 | $ | 11,675 | $ | 11,675 | ||||||||||||||
Loans held for sale, net | $ | - | $ | - | $ | - | $ | - | $ | 55,103 | $ | 55,103 | $ | - | ||||||||||||||
Total return swap | $ | - | $ | - | $ | 2,544 | $ | - | $ | - | $ | 2,544 | $ | 2,544 | ||||||||||||||
For the year ended November 30, 2016, $98.0 million was transferred from Level 3 to Level 2 due to increase in the observability of inputs. For the year ended November 30, 2015, $59.8 million was transferred from Level 2 to Level 3 due to the decreased observability of inputs.
The tables below present information on the valuation techniques, significant unobservable inputs and their ranges for the Company's financial assets and liabilities, subject to threshold levels related to the market value of the positions held, measured at fair value on a recurring basis with a significant Level 3 balance. The range of unobservable inputs could differ significantly across different firms given the range of products across different firms in the financial services sector. The inputs are not representative of the inputs that could have been used in the valuation of any one financial instrument (i.e., the input used for valuing one financial instrument within a particular class of financial instruments may not be appropriate for valuing other financial instruments within that given class). Additionally, the ranges of inputs presented below should not be construed to represent uncertainty regarding the fair values of the Company's financial instruments; rather the range of inputs is reflective of the differences in the underlying characteristics of the financial instruments in each category.
20
JEFFERIES FINANCE LLC AND SUBSIDIARIES
Notes to Consolidated Financial Statements
November 30, 2016 and 2015
FINANCIAL INSTRUMENTS OWNED | FAIR VALUE (IN THOUSANDS) | VALUATION | SIGNIFICANT | INPUT RANGE | WEIGHTED AVERAGE | |||||||||||
Corporate equity securities | ||||||||||||||||
Non-exchange traded securities | $ | 8,877 | Market Approach | EBITDA multiple | 5.9x-10.6 | x | 6.9x | |||||||||
Investments | ||||||||||||||||
Notes | $ | 2,370 | Asset Approach | Collateral Liquidation Values | N/A | (1) | N/A | (1) | ||||||||
Derivatives | ||||||||||||||||
Total return swap | $ | 3,309 | Discounted Cash | - | - | - | ||||||||||
| Flows | Constant prepayment rate | 20.0 | % | 20.0 | % | |||||||||||
| Constant default rate | 2.0 | % | 2.0 | % | ||||||||||||
| Loss severity | 25.0 | % | 25.0 | % | ||||||||||||
| Yield | 16.0 | % | 16.0 | % | ||||||||||||
| (1) | There is no meaningful quantitative information to provide as the methods of valuation are investment specific. |
Below is a summary of financial instruments not measured at fair value on a recurring or non-recurring basis as of November 30, 2016 and 2015, but for which fair value is required to be disclosed (in thousands):
| NOVEMBER 30, 2016 | NOVEMBER 30, 2015 | |||||||||||||||
| Carrying Value | Fair Value | Carrying Value | Fair Value | |||||||||||||
Financial assets: | ||||||||||||||||
Cash | $ | 656,556 | $ | 656,556 | $ | 1,491,833 | $ | 1,491,833 | ||||||||
Restricted cash | 975,891 | 975,891 | 1,275,900 | 1,275,900 | ||||||||||||
Loans receivable, net | 4,343,661 | 4,368,982 | 3,861,303 | 3,811,651 | ||||||||||||
|
|
|
|
|
|
|
| |||||||||
Total | $ | 5,976,108 | $ | 6,001,429 | $ | 6,629,036 | $ | 6,579,384 | ||||||||
|
|
|
|
|
|
|
| |||||||||
Financial liabilities: | ||||||||||||||||
Credit facilities | $ | 346,862 | $ | 346,862 | $ | 381,956 | $ | 381,956 | ||||||||
Secured notes payable, net | 3,916,792 | 3,915,716 | 4,034,711 | 3,995,159 | ||||||||||||
Long-term debt | 1,660,829 | 1,613,927 | 1,662,548 | 1,593,656 | ||||||||||||
|
|
|
|
|
|
|
| |||||||||
Total | $ | 5,924,483 | $ | 5,876,505 | $ | 6,079,215 | $ | 5,970,771 | ||||||||
|
|
|
|
|
|
|
| |||||||||
Cash and restricted cash -The carrying value of cash and restricted cash approximates fair value and is considered Level 1 measurement.
Loans receivable, net -A significant portion of the Company's loans receivable are measured primarily using broker quotations and using pricing service data from external providers. When pricing data is unavailable and there are no observable inputs, valuations are based on models involving projected cash flows of the issuer and market prices for comparable issuers and are considered Level 2 measurements since there is no open exchange for loan assets.
Credit facilities -Due to the adjustable rate nature of the borrowings, the fair value of the credit facilities are estimated to be their carrying values and are considered Level 2 measurements. Rates currently are comparable to those offered to the Company for similar debt instruments of comparable maturities by the Company's lenders.
Secured notes payable, net -The Company uses broker quotes for non-exchange traded secured notes payable and are considered Level 2 measurements.
Long-term debt -Fair value of long-term debt is based on broker quotations, which are Level 2 inputs. When broker quotes are not available, values are estimated using a discounted cash flow analysis with a discount rate approximating current market interest rates for issuances of similar term debt.
21
JEFFERIES FINANCE LLC AND SUBSIDIARIES
Notes to Consolidated Financial Statements
November 30, 2016 and 2015
8. VARIABLE INTEREST ENTITIES
VIEs are entities in which equity investors lack the characteristics of a controlling financial interest. VIEs are consolidated by the primary beneficiary. The primary beneficiary is the party who has both (1) the power to direct the activities of a variable interest entity that most significantly impact the entity's economic performance and (2) an obligation to absorb losses of the entity or a right to receive benefits from the entity that could potentially be significant to the entity.
Variable interests in VIEs include debt and equity interests, commitments and management and performance fees. Involvement with VIEs arises from involvement as a portfolio manager of collateralized loan obligations ("CLOs"). The Company also acts as sponsor and funds the underlying loans prior to the close of a CLO and owns notes issued by the CLOs.
The Company determines whether it is the primary beneficiary of a VIE upon initial involvement with the VIE and reassess whether it is the primary beneficiary of a VIE on an ongoing basis. The determination of whether the Company is the primary beneficiary of a VIE is based upon the facts and circumstances for each VIE and requires significant judgment. Considerations in determining the VIE's most significant activities and whether the Company has the power to direct those activities include, but are not limited to, the VIE's purpose and design and the risks passed through to investors, the voting interests of the VIE, management, service and/or other agreements of the VIE, involvement in the VIE's initial design and the existence of explicit or implicit financial guarantees.
Variable interests in a VIE are assessed both individually and in aggregate to determine whether the Company has an obligation to absorb losses of or a right to receive benefits from the VIE that could potentially be significant to the VIE. The determination of whether the Company's variable interest is significant to the VIE requires significant judgment. In determining the significance of the Company's variable interest, the Company considers the terms, characteristics and size of the variable interests, the design and characteristics of the VIE, the Company's involvement in the VIE and the Company's market-making activities related to the variable interests.
The Company is the primary beneficiary of CLOs to which the Company transferred bank loans, securities and participation interests in the form of senior secured loans, second lien loans, unsecured loans, senior secured bonds, senior secured floating notes, unsecured bonds and revolving credit loans to corporate entities. The Company also retained a portion of the secured notes issued by the CLOs. In the creation of the CLOs, the Company was involved in the decisions made during the establishment and design of the entity. The Company acts as the portfolio manager for the CLOs and holds variable interests consisting of the retained notes that could potentially be significant. The assets of the CLOs consist of the loans, bonds and notes to corporate entities, which are available for the benefit of the vehicle's beneficial interest holders. The creditors of the VIEs do not have recourse to the assets of the Company and the assets of the VIEs are not available to satisfy any other debt.
9. CREDIT FACILITIES
As of November 30, 2016 and 2015, the Company had secured credit facilities totaling $1.6 billion and $1.4 billion, respectively, which were used to fund loans. The interest rates related to the credit facilities are primarily variable interest rates based on LIBOR plus a spread as stated in the respective agreements. The credit facilities are secured by the underlying loans funded with the proceeds of the respective facility.
During the years ended November 30, 2016, 2015 and 2014, the Company entered into revolving credit agreements for $0.5 billion, $0.5 billion and $1.7 billion, respectively. During the years ended November 30, 2016, 2015 and 2014, $0.3 billion, $1.8 billion and $0.7 billion of outstanding commitments matured or terminated and any outstanding amounts were repaid.
22
JEFFERIES FINANCE LLC AND SUBSIDIARIES
Notes to Consolidated Financial Statements
November 30, 2016 and 2015
Below is a summary of the Credit Facilities and Fronting Lines as of and for the year ended November 30, 2016 (in millions):
| THIRD PARTY FRONTING LINE | MEMBERS' FRONTING LINE | JFIN CLO 2016-II WH | JFIN CLO 2016 WH | JFIN BUSINESS CREDIT FUND I LLC | JFIN FUND III LLC | TOTAL | ||||||||||||||||||||||
Total availability under the facility | $ | 500.0 | $ | 500.0 | $ | 200.0 | $ | - | $ | 100.0 | $ | 300.0 | $ | 1,600.0 | ||||||||||||||
Outstanding balance | - | - | 124.2 | - | 33.4 | 189.3 | 346.9 | |||||||||||||||||||||
|
|
|
|
|
|
|
|
|
|
|
|
|
| |||||||||||||||
Current availability | $ | 500.0 | $ | 500.0 | $ | 75.8 | $ | - | $ | 66.6 | $ | 110.7 | $ | 1,253.1 | ||||||||||||||
|
|
|
|
|
|
|
|
|
|
|
|
|
| |||||||||||||||
Principal balance of loans pledged as collateral | $ | - | $ | - | $ | 219.4 | $ | - | $ | 45.0 | $ | 312.1 | $ | 576.5 | ||||||||||||||
Largest outstanding amounts during the periods | 218.6 | 300.0 | 124.2 | $ | 227.8 | 50.1 | 247.3 | 1,168.0 | ||||||||||||||||||||
Interest expense incurred | 0.3 | 0.1 | 0.3 | 1.3 | 0.7 | 7.1 | 9.8 | |||||||||||||||||||||
Undrawn facility fees incurred | 4.5 | 2.6 | - | - | 0.2 | 0.4 | 7.7 | |||||||||||||||||||||
Variable interest rate based on LIBOR | 3.88 | % | 4.19 | % | 2.88 | % | 1.95 | % | 2.39 | % | 3.22 | % | - | |||||||||||||||
Maturity Date | 2/25/2017 | (1) | 3/1/2017 | (2) | 6/30/2017 (3) | Terminated | 9/12/2021 | 2/12/2019 | - | |||||||||||||||||||
| (1) | On February 27, 2016, the Third Party Fronting Line was increased to $500.0 million from $481.7 million. |
| (2) | After March 1, 2016, the Members' Fronting Line contains annual automatic one-year extensions, absent a 60-day termination notice by either party. The commitment on the Members' Fronting Line was reduced to $500 million on August 21, 2015. |
| (3) | JFIN CLO 2016-II Warehouse facility relates to a consolidated VIE. |
Below is a summary of the Credit Facilities and Fronting Lines as of and for the year ended November 30, 2015 (in millions):
| THIRD PARTY FRONTING LINE | MEMBERS' FRONTING LINE | JFIN FUND IV 2014 LLC | CLO 2015-II WH | JFIN BUSINESS CREDIT FUND I LLC | JFIN FUND III LLC | TOTAL | ||||||||||||||||||||||
Total availability under the facility | $ | 481.7 | $ | 500.0 | $ | - | $ | - | $ | 100.0 | $ | 300.0 | $ | 1,381.7 | ||||||||||||||
Outstanding balance | 67.2 | 38.6 | - | - | 45.1 | 231.1 | 382.0 | |||||||||||||||||||||
|
|
|
|
|
|
|
|
|
|
|
|
|
| |||||||||||||||
Current availability | $ | 414.5 | $ | 461.4 | $ | - | $ | - | $ | 54.9 | $ | 68.9 | $ | 999.7 | ||||||||||||||
|
|
|
|
|
|
|
|
|
|
|
|
|
| |||||||||||||||
Principal balance of loans pledged as collateral | $ | 67.2 | $ | 38.6 | $ | - | $ | - | $ | 67.2 | $ | 380.5 | $ | 553.5 | ||||||||||||||
Largest outstanding amounts during the periods | 386.7 | 530.0 | 350.2 | 170.9 | 47.2 | 231.1 | 1,716.1 | |||||||||||||||||||||
Interest expense incurred | 1.0 | 1.9 | 1.8 | 0.6 | 0.4 | 5.7 | 11.4 | |||||||||||||||||||||
Undrawn facility fees incurred | 2.0 | 3.0 | - | - | 0.3 | 0.6 | 5.9 | |||||||||||||||||||||
Variable interest rate based on LIBOR | 3.38 | % | 5.36 | % | 2.26 | % | 1.85 | % | 1.83 | % | 2.66 | % | - | |||||||||||||||
Maturity Date | 2/27/2016 | 3/1/2016 | Terminated | Terminated | 9/12/2018 | 2/12/2019 | - | |||||||||||||||||||||
23
JEFFERIES FINANCE LLC AND SUBSIDIARIES
Notes to Consolidated Financial Statements
November 30, 2016 and 2015
Below is a summary of the Credit Facilities and Fronting Lines as of and for the year ended November 30, 2014 (in millions):
| THIRD PARTY FRONTING LINE | MEMBERS' FRONTING LINE | JFIN FUND IV 2014 LLC | JFIN FUND IV LLC | JFIN BUSINESS CREDIT FUND I LLC | JFIN CAPITAL 2013 LLC | JFIN FUND III LLC | JFIN CAPITAL 2014 LLC | TOTAL | ||||||||||||||||||||||||||||
Total availability under the facility | $ | 750.0 | $ | 1,000.0 | $ | 400.0 | $ | - | $ | 100.0 | $ | - | $ | 300.0 | $ | 400.0 | $ | 2,950.0 | ||||||||||||||||||
Outstanding balance | - | - | 279.2 | - | 14.1 | - | 199.9 | - | 493.2 | |||||||||||||||||||||||||||
|
|
|
|
|
|
|
|
|
|
|
|
|
|
|
|
|
| |||||||||||||||||||
Current availability | $ | 750.0 | $ | 1,000.0 | $ | 120.8 | $ | - | $ | 85.9 | $ | - | $ | 100.1 | $ | 400.0 | $ | 2,456.8 | ||||||||||||||||||
|
|
|
|
|
|
|
|
|
|
|
|
|
|
|
|
|
| |||||||||||||||||||
Principal balance of loans pledged as collateral | $ | - | $ | - | $ | 385.1 | $ | - | $ | 21.7 | $ | - | $ | 271.9 | $ | - | $ | 678.7 | ||||||||||||||||||
Largest outstanding amounts during the periods | 250.0 | 940.0 | 279.2 | 302.0 | 21.0 | 320.9 | 199.9 | - | 2,313.0 | |||||||||||||||||||||||||||
Interest expense incurred | 0.1 | 4.1 | 1.2 | 1.0 | 0.1 | 4.3 | 3.6 | - | 14.4 | |||||||||||||||||||||||||||
Undrawn facility fees incurred | 0.6 | 3.2 | - | - | 0.4 | 0.4 | 0.6 | 0.8 | 6.0 | |||||||||||||||||||||||||||
Variable interest rate based on LIBOR | 3.25 | % | 5.88 | % | 1.36 | % | 1.31 | % | 1.73 | % | 2.40 | % | 2.49 | % | - | - | ||||||||||||||||||||
Maturity date | 6-11-15 | 3-1-16 | 1-7-16 | Terminated | 9-12-18 | Terminated | 2-12-19 | 5-20-16 | - | |||||||||||||||||||||||||||
Natixis LC Facility -On August 17, 2011, JFIN entered into a letter of credit and reimbursement agreement with Natixis for a $50.0 million letter of credit commitment (the "LC Facility"). The LC Facility was established for the purpose of issuing letters of credit to borrowers under credit facilities originated by JFIN. In June 2015, the Company extended its availability under the Facility until June 26, 2018. Interest is charged on issued letters of credit at a rate of LIBOR plus a margin of 2.5%. Interest expense for the years ended November 30, 2016, 2015 and 2014 was $1.0 million, $1.1 million and $1.0 million, respectively, and is included in Interest expense in the Consolidated Statements of Earnings.
Wells Fargo LC Facility -On March 10, 2016, the Company's wholly-owned subsidiary JFIN LC Fund LLC ("LC Fund"), which was formed on February 1, 2016, entered into a Standby Letter of Credit Facility with Wells Fargo Bank, National Association ("Wells Fargo"), as issuing bank, pursuant to which the issuing bank has committed to provide a revolving letter of credit facility in an aggregate principal amount of up to $50.0 million. LC Fund's obligations under the facility mature on the third anniversary of the closing date, and are secured by a first lien perfected security interest in a specified segregated deposit account held at Wells Fargo into which the Company is required to deposit 102% of the outstanding face amount of issued letters of credit. The Company guarantees the payment obligations of LC Fund under the facility. Interest expense for the year ended November 30, 2016 was $0.2 million and is included in Interest expense in the Consolidated Statements of Earnings.
Deferred Structuring Fees -Deferred structuring fees in aggregate were $4.0 million and $5.4 million at November 30, 2016, and 2015, respectively, and are included in Other assets on the Consolidated Balance Sheets. Amortization of deferred structuring fees expense for the years ended November, 2016, 2015 and 2014 was $4.8 million, $7.6 million and $3.9 million, respectively, and is included in Interest expense in the Consolidated Statements of Earnings.
24
JEFFERIES FINANCE LLC AND SUBSIDIARIES
Notes to Consolidated Financial Statements
November 30, 2016 and 2015
Undrawn Facility Fees -Undrawn facility fees in aggregate were $7.8 million, $5.9 million and $5.9 million for the years ended November 30, 2016, 2015 and 2014, respectively, and are included in Interest expense in the Consolidated Statements of Earnings.
10. SECURED NOTES PAYABLE, NET
CLOs consolidated by the Company are funded by the issuance of notes, which are included in Secured notes payable, net on the Consolidated Balance Sheets. Each of the CLOs' respective assets are pledged as collateral against the secured notes issued by the respective CLO. The cash held by the CLOs is used first to pay interest due to note holders or to be reinvested in loans as prescribed by the indentures. JFIN is entitled to the residual interest of all CLOs after all claims to note holders have been paid.
Following are the remaining maturities of the secured notes payable, net (in thousands):
| NOVEMBER 30, 2016 | NOVEMBER 30, 2015 | |||||||
Due in 2017 | $ | - | $ | - | ||||
Due in 2018 | - | - | ||||||
Due in 2019 | - | - | ||||||
Due in 2020 | 100,040 | 125,749 | ||||||
Due in 2021 | 315,434 | 487,374 | ||||||
Thereafter | 3,501,318 | 3,421,588 | ||||||
|
|
|
| |||||
Total | $ | 3,916,792 | $ | 4,034,711 | ||||
|
|
|
| |||||
For the years ended November 30, 2016, 2015 and 2014, the Company repaid $454.8 million, $91.3 million and $89.0 million of outstanding secured notes payable.
Interest rates related to the secured notes are variable interest rates based on LIBOR plus a spread as stated in the respective note agreements ranging from 0.240% to 9.000%.
Deferred Structuring Fees -Deferred structuring fees in aggregate were $39.2 million and $44.5 million as of November 30, 2016 and 2015, respectively, and are included in Other assets on the Consolidated Balance Sheets. Deferred structuring fee expense was $9.8 million, $5.9 million and $2.7 million for the years ended November 30, 2016, 2015 and 2014, respectively, and is included in Interest expense in the Consolidated Statements of Earnings.
Original Issue Discount -The unamortized original issue discount of $58.8 million and $61.3 million as of November 30, 2016 and 2015, respectively, was included within Secured notes payable, net on the Consolidated Balance Sheets. The amortization of the original issue discount was $9.2 million, $7.2 million and $4.1 million for the years ended November 30, 2016, 2015 and 2014, respectively, and was included in Interest expense in the Consolidated Statements of Earnings.
25
JEFFERIES FINANCE LLC AND SUBSIDIARIES
Notes to Consolidated Financial Statements
November 30, 2016 and 2015
11. LONG-TERM DEBT
Below is a summary of JFIN's long-term debt as of November 30, 2016 (in millions):
DESCRIPTION | ISSUE | OUTSTANDING PRINCIPAL AMOUNT | MATURITY | INTEREST RATE | INTEREST | REDEMPTION FEATURES | ||||||||||
2020 Notes (1) | 3/26/2013 | $ | 600.0 | April 1, 2020 | 7.375% | April and October 1 | 35% at 105.531% (prior to April 1, 2017) | |||||||||
2021 Notes (1) | 10/14/2014 | $ | 425.0 | April 15, 2021 | 7.500% | April and October 15 | 35% at 107.500% (prior to October 15, 2017) | |||||||||
2022 Notes (1) | 3/31/2014 | $ | 425.0 | April 15, 2022 | 6.875% | April and October 15 | 35% at 106.875% (prior to April 15, 2017) | |||||||||
Secured Term Loan (2) | 5/14/2015 | $ | 212.3 | May 15, 2020 (3) | Libor +3.5% | Last business day of each fiscal quarter | N/A | |||||||||
| (1) | Collectively, the 2020 Notes, 2021 Notes and the 2022 Notes are referred to as the "Senior Notes". |
| (2) | Issued with a Libor floor of 1%. |
| (3) | The Secured Term Loan matures on May 15, 2020, or October 1, 2019 if the 2020 Notes are still outstanding on such date. |
The Senior Notes are not guaranteed by any of the Company's subsidiaries; however, its subsidiaries may be required to guarantee the Senior Notes in the future pursuant to certain covenants as defined in the Senior Notes offering memorandum. At any time prior to April 1, 2017, October 15, 2017 and April 15, 2017, the Company may redeem the Senior Notes, respectively, in whole or in part, at their option, at a redemption price equal to 100% of the principal amount of such Senior Notes, respectively, plus the relevant applicable premium as of, and accrued and unpaid interest, if any, to but not including the applicable redemption date.
The table below summarizes the redemption prices and dates for the Senior Notes:
| 2020 NOTES | 2021 NOTES | 2022 NOTES | ||||||||||
YEAR | PERCENTAGE | |||||||||||
2016 | 105.531 | % | - | - | ||||||||
2017 | 103.688 | % | 105.625 | % | 105.156 | % | ||||||
2018 | 101.844 | % | 103.750 | % | 103.438 | % | ||||||
2019 | 100.000 | % | 101.875 | % | 101.719 | % | ||||||
2020 and thereafter | - | 100.000 | % | 100.000 | % | |||||||
The Company may redeem the Senior Notes with cash proceeds from any equity offering at a redemption price, plus accrued but unpaid interest, if any, to but not including the applicable redemption date, in an aggregate principal amount for all such redemptions not to exceed 35% of the original aggregate principal amount of the Senior Notes, respectively (including any additional notes); provided that (1) in each case the redemption takes place not later than 180 days after the consummation of the related equity offering; and (2) not less than 65% of the original aggregate principal amount of the Senior Notes, respectively (including any additional notes) issued under the indenture remains outstanding immediately after such redemption (excluding the aggregate principal amount of all Senior Notes, respectively then held by the Issuers or any of their restricted subsidiaries).
26
JEFFERIES FINANCE LLC AND SUBSIDIARIES
Notes to Consolidated Financial Statements
November 30, 2016 and 2015
If a change of control occurs, the holders of the Senior Notes will have the right to require the Company to repurchase their Senior Notes, respectively, in whole or in part, at a purchase price of 101% of the principal amount of the Senior Notes, respectively, plus accrued and unpaid interest, if any, to the date of repurchase. If the Company sells certain assets and the net cash proceeds are not applied as permitted under the indenture governing the Senior Notes, the Company may have to use such proceeds to offer to purchase some of the Senior Notes, respectively at 100% of the principal, plus accrued and unpaid interest, if any, to the date of repurchase.
On May 14, 2015, JFIN issued a $215.0 million senior secured term loan. The debt under the five-year term loan is secured by a first lien security interest in unrestricted cash and loan receivables not encumbered by other facilities, and is subject to a collateral value coverage ratio test and other negative covenants. As of November 30, 2016, $1.2 billion of loans were pledged as collateral to the term loan.
Interest expense related to Long-term debt was $114.9 million, $110.7 million and $67.9 million for the years ended November 30, 2016, 2015 and 2014, respectively.
Deferred Structuring Fees -Deferred structuring fees in aggregate were $21.4 million and $26.6 million as of November 30, 2016 and 2015, respectively and are included in Other assets on the Consolidated Balance Sheets. Amortization of deferred structuring fee expense was $5.3 million, $4.9 million and $3.0 million for the years ended November 30, 2016, 2015 and 2014, respectively, and is included in Interest expense in the Consolidated Statements of Earnings.
12. FEE INCOME, NET
The Company presents fee income net of origination, syndication and deferred underwriting fees in the Consolidated Statements of Earnings. The following is a summary of the components of Fee income, net for the years ended November 30, 2016, 2015 and 2014 (in thousands):
| 2016 | 2015 | 2014 | ||||||||||
Underwriting fees | $ | 262,933 | $ | 410,611 | $ | 438,574 | ||||||
Administration fees | 9,508 | 8,745 | 5,307 | |||||||||
Other fees | 52,104 | 44,056 | 31,136 | |||||||||
|
|
|
|
|
| |||||||
| 324,545 | 463,412 | 475,017 | ||||||||||
Less: | ||||||||||||
Deferred underwriting fees | (72,227 | ) | (56,026 | ) | (80,822 | ) | ||||||
Jefferies LLC fees, net (1) | (99,013 | ) | (130,958 | ) | (198,349 | ) | ||||||
Third party fees | (22,949 | ) | (105,749 | ) | (23,532 | ) | ||||||
|
|
|
|
|
| |||||||
Fee income, net | $ | 130,356 | $ | 170,679 | $ | 172,314 | ||||||
|
|
|
|
|
| |||||||
| (1) | Jefferies LLC is a wholly owned subsidiary of JGL. |
27
JEFFERIES FINANCE LLC AND SUBSIDIARIES
Notes to Consolidated Financial Statements
November 30, 2016 and 2015
13. OTHER LOSSES, NET
The following summarizes Other losses, net for the years ended November 30, 2016, 2015 and 2014 (in thousands):
| 2016 | 2015 | 2014 | ||||||||||
Realized (loss) gain on sale of loans held for sale | $ | (34,545 | ) | $ | (9,610 | ) | $ | 5,429 | ||||
Change in fair value of loans held for sale | (8,267 | ) | (1,552 | ) | (8,859 | ) | ||||||
Realized loss on investments | (24,597 | ) | (2,437 | ) | (114 | ) | ||||||
Unrealized loss on investments | (8,139 | ) | (5,218 | ) | (6,455 | ) | ||||||
Dividends | - | 2,177 | - | |||||||||
|
|
|
|
|
| |||||||
Other losses, net | $ | (75,548 | ) | $ | (16,640 | ) | $ | (9,999 | ) | |||
|
|
|
|
|
| |||||||
14. INCOME TAXES
Under current federal and state income tax laws and regulations, the Company is treated as a partnership for tax reporting purposes and is generally not subject to income taxes. Additionally, no provision has been made for federal, state, or local income taxes on the results of operations generated by partnership activities; as such taxes are the responsibility of its Members. However, the Company is subject to certain state and local entity level income taxes, including New York City Unincorporated Business Tax. Amounts provided for income taxes are based on income reported for financial statement purposes and do not necessarily represent amounts currently payable. Deferred tax assets and liabilities are recognized for the future tax consequences attributable to differences between the financial statement carrying amounts of existing assets and liabilities and their respective tax bases and for tax loss carry forwards. Deferred tax assets and liabilities are measured using enacted tax rates expected to apply to taxable income in the years in which those temporary differences are expected to be recovered or settled. The effect on deferred tax assets and liabilities of a change in tax rates is recognized in income in the period that includes the enactment date.
The realization of deferred tax assets is assessed and a valuation allowance is recorded to the extent that it is more likely than not that any portion of the deferred tax asset will not be realized. The Company follows the provisions of accounting for uncertainty in income taxes which prescribes a recognition threshold under which it is determined whether it is more likely than not that a tax position will be sustained on the basis of the technical merits of the position. For those tax positions that meet the more-likely-than-not recognition threshold, the largest amount of the tax benefit that is more than fifty percent likely to be realized upon ultimate settlement with the tax authority is recognized. Income tax (benefit) expense for year ended November 30, 2016, 2015 and 2014 consists of the following (in thousands):
| 2016 | 2015 | 2014 | ||||||||||
Current-local | $ | (1,666 | ) | $ | 4,411 | $ | 7,032 | |||||
Deferred-local | 152 | (990 | ) | (1,490 | ) | |||||||
|
|
|
|
|
| |||||||
Total income tax (benefit) expense | $ | (1,514 | ) | $ | 3,421 | $ | 5,542 | |||||
|
|
|
|
|
| |||||||
Deferred income taxes are provided for temporary differences in reporting certain items, principally the allowance for loan losses and deferred loan fees. The Company had a net deferred tax asset of $5.4 million and $5.5 million at November 30, 2016 and 2015, respectively, included in Other assets on the Consolidated Balance Sheets.
For the years ended November 30, 2016 and 2015, the Company concluded, based upon its assessment of positive and negative evidence, that it is more likely than not that the results of future operations will generate sufficient taxable income to realize its deferred tax assets. Accordingly, the Company did not record a valuation allowance at November 30, 2016 and 2015.
The Company had taxes payable of $14.6 million and $16.4 million at November 30, 2016 and 2015, respectively, included in Other liabilities on the Consolidated Balance Sheets.
28
JEFFERIES FINANCE LLC AND SUBSIDIARIES
Notes to Consolidated Financial Statements
November 30, 2016 and 2015
The Company's effective tax rate was 4.2%, 4.0% and 3.9% for the years ended November 30, 2016, 2015 and 2014 respectively. The Company's effective tax rate for the years ended November 30, 2015 and 2014 differed from the New York City statutory rate of 4.0% primarily due to the exclusion of foreign income and losses not subject to tax in the United States.
The Company accounts for uncertainties in income taxes under ASC 740, Income Taxes. ASC 740 clarifies the accounting for income taxes by prescribing the minimum recognition threshold a tax position is required to meet before being recognized in the financial statements. It also provides guidance on derecognition, measurement, classification, interest, penalties, accounting in interim periods, disclosure and transition. The balance of net unrecognized tax benefits at November 30, 2016 and 2015, was approximately $19.1 million and $20.5 million, respectively.
Interest related to income tax liabilities is recognized in income tax expense. Penalties, if any, are recognized in other expenses. The Company has interest accrued of approximately $2.4 million and $1.7 million at November 30, 2016 and 2015, respectively. No material penalties were accrued.
The Company is currently under examination by New York City for the years 2006 to 2009. The Company does not expect that the resolution of this examination will have a material impact on the consolidated financial statements.
15. RELATED PARTY TRANSACTIONS
JGL -Distributions by JFIN to JGL in respect of taxes were $17.1 million and $40.5 million for the years ended November 30, 2016 and 2015, respectively. The undrawn capital commitment available to JFIN from JGL as of November 30, 2016 and 2015 was $106.1 million and $102.6 million, respectively.
JFIN owed JGL $0.4 million and $0.5 million as of November 30, 2016 and 2015, respectively related to interest payable on the Fronting Line, which was recorded in Due to affiliates on the Consolidated Balance Sheets.
JGL provides a guarantee to one of the consolidated CLOs, whereby Jefferies is required to make certain payments to the CLO in the event that JFIN is unable to meet its obligations. As of November 30, 2016 and 2015 there was $2.9 million and $2.1 million, respectively, outstanding of the maximum amount payable under the guarantee of $21.0 million which matures in January 2021.
Mass Mutual -Distributions by JFIN to Mass Mutual in respect of taxes were $17.1 million and $36.5 million for the years ended November 30, 2016 and 2015, respectively. The undrawn capital commitment available to JFIN from Mass Mutual as of November 30, 2016 and 2015 was $106.1 million and $102.6 million, respectively.
JFIN owed Mass Mutual $0.4 million and $0.5 million as of November 30, 2016 and 2015, respectively, related to interest payable on the Fronting Line, which was recorded in Due to affiliates on the Consolidated Balance Sheets.
Mass Mutual has also provided JFIN's direct lending subsidiary, JFAM access to capital to invest on their behalf and paid $0.2 million in management fees to JFAM.
BCM -Under the Babson Service Agreement, JFIN is required to reimburse BCM for management fees. Management fees paid to BCM are based on a percentage of the consolidated portfolio, excluding the CLOs. BCM is the sub-advisor to certain CLOs and is entitled to receive management fees underlined in the sub-advisor agreement. All management fees earned by BCM are included in General, administrative and other in the Consolidated Statements of Earnings. The Babson Service Agreement was terminated effective March 1, 2015. Additionally, the Company ended all but one of its CLO sub-advisory and CLO services agreements with BCM effective as of August 31, 2015.
29
JEFFERIES FINANCE LLC AND SUBSIDIARIES
Notes to Consolidated Financial Statements
November 30, 2016 and 2015
Below is a summary of management fees earned by BCM for the years ended November 30, 2016, 2015 and 2014 (in thousands):
| 2016 | 2015 | 2014 | ||||||||||
Babson Service Agreement management fees | $ | - | $ | 2,527 | $ | 8,050 | ||||||
Collateral management fees | 1,488 | 5,504 | 6,158 | |||||||||
|
|
|
|
|
| |||||||
Total management fees charged by BCM | $ | 1,488 | $ | 8,031 | $ | 14,208 | ||||||
|
|
|
|
|
| |||||||
JFIN owed BCM approximately $0.2 million at both November 30, 2016 and 2015, which is recorded in Due to affiliates on the Consolidated Balance Sheets.
In April of 2015, JFIN made a distribution in respect of taxes to BCM in the amount of $4.0 million.
Jefferies LLC -Under the Jefferies Service Agreement, Jefferies LLC ("Jefferies"), a wholly owned subsidiary of JGL, is required to provide specifically identified staff for the benefit of the Company. Also, under the agreement, JFIN is required to reimburse Jefferies for administration, rent, taxes and origination fees as well as any other services performed in the support of loan origination activities. During March 2016, the Jefferies Service Agreement was amended in conjunction with the restructuring of personnel. JFIN shifted underwriting staff to Jefferies and modified the cost sharing arrangement in the service agreement. JFIN continues to retain management of the underwriting process for covered financings and the approval of any transaction is subject to JFIN's credit committee.
Below is a summary of expenses paid by Jefferies on behalf of JFIN for the years ended November 30, 2016, 2015 and 2014 (in thousands):
| 2016 | 2015 | 2014 | ||||||||||
Compensation and benefits | $ | 28,919 | $ | 39,121 | $ | 32,165 | ||||||
Administration expenses | 13,935 | 5,827 | 4,440 | |||||||||
Occupancy expenses | 2,999 | 2,670 | 2,160 | |||||||||
New York City Unincorporated Business Tax | 347 | 3,362 | 2,637 | |||||||||
|
|
|
|
|
| |||||||
Expenses charged by Jefferies | $ | 46,200 | $ | 50,980 | $ | 41,402 | ||||||
|
|
|
|
|
| |||||||
The Company's operating costs are paid by Jefferies and are included in Compensation and benefits and General, administrative and other in the Consolidated Statements of Earnings. Compensation and benefit costs include salaries, bonuses, retirement and medical insurance plan costs, of which certain amounts are deferred as direct loan origination costs.
All benefit plans that the employees participate in are provided by Jefferies. Therefore, benefit plan expenses are determined based upon participation and are reflected through an allocation from Jefferies to the Company. Administration and occupancy expenses are included in General, administrative and other. The Company reimburses Jefferies for all compensation, administration, occupancy and other amounts paid by Jefferies on behalf of the Company on a monthly basis.
Under the Jefferies Service Agreement, JFIN receives from and pays to Jefferies fees on certain transactions originated by Jefferies. Net origination fees were $99.0 million, $131.0 million and $198.3 million for the years ended November 30, 2016, 2015 and 2014, respectively, and are recorded in Fee income, net, in the Consolidated Statements of Earnings.
In the regular course of business, JFIN enters into agreements, related to specific transactions, with Jefferies and/or JGL to provide certain operational support, subsidies for loans, reimbursement of expenses, or to mitigate potential losses on transactions.
JFIN owed Jefferies $23.0 million and $7.0 million at November 30, 2016 and 2015, respectively, which were recorded in Due to affiliates on the Consolidated Balance Sheets.
30
JEFFERIES FINANCE LLC AND SUBSIDIARIES
Notes to Consolidated Financial Statements
November 30, 2016 and 2015
At November 30, 2016 and 2015, JGL held securities issued by CLOs managed by JFIN and provided a guarantee whereby they are required to make certain payments to a CLO in the event that JFIN is unable to meet its obligations to the CLO. Additionally, JFP and Jefferies Funding LLC (JFL) have entered into derivative contracts or participation agreements with JFIN whose underlying value is based on certain securities issued by the CLO. Under these contracts, JFIN paid approximately $3.3 million and $3.8 million to JFP and JFL, respectively. Refer to Note 6, Investments, and Note 7, Financial Instruments at Fair Value.
In connection with the issuance of the Senior Notes, Jefferies acted as underwriter. Jefferies also acted as a placement agent for certain CLOs and holds a portion of certain secured notes.
On July 31, 2015, JFIN CLO 2015-II entered into a $300.0 million pre-CLO warehouse financing with Jefferies Leveraged Credit Products LLC. The warehouse was terminated on October 22, 2015 when the assets were contributed into the CLO. Jefferies also acted as underwriter on the closing of JFIN CLO 2015-II. On January 27, 2016, JFIN CLO 2016 entered into a $250.0 million pre-CLO warehouse financing with Jefferies Leveraged Credit Products LLC. The warehouse was terminated on August 10, 2016 when the assets were contributed into the CLO. On September 21, 2016, JFIN CLO 2016-II entered into a $200.0 million pre-CLO warehouse financing with Jefferies Leveraged Credit Products LLC.
16. LOAN COMMITMENTS
From time to time, the Company makes commitments to extend revolving lines of credit and delayed draw term loans to borrowers. These commitments are not recorded on the Consolidated Balance Sheets. Once drawn, the funded amounts can be pledged as collateral under the Company's credit facilities. As of November 30, 2016 and 2015, the Company had undrawn commitments of $1.6 billion and $1.7 billion, respectively, related to loans recorded in Loans receivable, net. As of November 30, 2016, the Company, through the CLOs, had the capacity to fund $0.9 billion of revolving commitments. In addition, $202.7 million of revolving commitments were held in a credit facility subject to equity requirements. As of November 30, 2016 and 2015, these commitments had maturity dates through November 2023 and August 2021, respectively. For the years ended November 30, 2016, 2015 and 2014, the Company earned unfunded fees of $11.5 million, $12.0 million and $9.2 million, respectively. These amounts are included in Fee income, net in the Consolidated Statements of Earnings.
In addition, during the normal course of business, the Company extends commitments to underwrite credit facilities. As of November 30, 2016, the Company had $1.2 billion of commitments to these credit facilities, of which $0.2 billion had been syndicated to third parties. As of November 30, 2015, the Company had $2.7 billion of commitments to lend to such underwritings, of which $0.9 billion had been syndicated to third parties.
17. CONCENTRATIONS OF CREDIT RISK
In the normal course of business, the Company engages in commercial lending activities with borrowers primarily throughout the United States. As of November 30, 2016, there was one borrower whose individual outstanding loan balance represented 7% of all loan balances. As of November 30, 2015, there was no borrower whose individual outstanding loan balances represented 5% of all loan balances. As of November 30, 2016, healthcare, retail, automotive and business services were the largest industry concentrations, which made up approximately 20%, 9%, 9% and 7%, respectively, of all loan balances. As of November 30, 2015, healthcare, retail, high tech industries and business services were the largest industry concentrations, which made up approximately 14%, 10%, 9% and 9%, respectively, of all loan balances. Loans balances include Loans receivable, Loans held for sale and Notes included in Investments.
* * * * * *
31
Table of Contents
Jefferies LoanCore LLC
| ||||
Consolidated Statements of Financial Condition as of November 30, 2016 and 2015 and Related Statements of Operations and Comprehensive Income, Changes in Members' Equity and Cash Flows for the Years Ended November 30, 2016, 2015 and 2014 |
Jefferies LoanCore LLC
Index
| Page(s) | ||||
Independent Auditor's Report | 1–2 | |||
Consolidated Statements of Financial Condition | 3 | |||
Consolidated Statements of Operations and Comprehensive Income | 4 | |||
Consolidated Statement of Changes in Members' Equity | 5 | |||
Consolidated Statements of Cash Flows | 6 | |||
Notes to Consolidated Financial Statements | 7–47 | |||

Report of Independent Auditors
To the Management of Jefferies LoanCore LLC
We have audited the accompanying consolidated financial statements of Jefferies LoanCore LLC and its subsidiaries (the "Company"), which comprise the consolidated statements of financial condition as of November 30, 2016 and 2015, and the related consolidated statements of operations and comprehensive income, of changes in members' equity, and of cash flows for the years then ended.
Management's Responsibility for the Consolidated Financial Statements
Management is responsible for the preparation and fair presentation of the consolidated financial statements in accordance with accounting principles generally accepted in the United States of America; this includes the design, implementation, and maintenance of internal control relevant to the preparation and fair presentation of consolidated financial statements that are free from material misstatement, whether due to fraud or error.
Auditors' Responsibility
Our responsibility is to express an opinion on the consolidated financial statements based on our audits. We conducted our audits in accordance with auditing standards generally accepted in the United States of America. Those standards require that we plan and perform the audit to obtain reasonable assurance about whether the consolidated financial statements are free from material misstatement.
An audit involves performing procedures to obtain audit evidence about the amounts and disclosures in the consolidated financial statements. The procedures selected depend on our judgment, including the assessment of the risks of material misstatement of the consolidated financial statements, whether due to fraud or error. In making those risk assessments, we consider internal control relevant to the Company's preparation and fair presentation of the consolidated financial statements in order to design audit procedures that are appropriate in the circumstances, but not for the purpose of expressing an opinion on the effectiveness of the Company's internal control. Accordingly, we express no such opinion. An audit also includes evaluating the appropriateness of accounting policies used and the reasonableness of significant accounting estimates made by management, as well as evaluating the overall presentation of the consolidated financial statements. We believe that the audit evidence we have obtained is sufficient and appropriate to provide a basis for our audit opinion.
Opinion
In our opinion, the consolidated financial statements referred to above present fairly, in all material respects, the financial position of Jefferies LoanCore LLC and its subsidiaries as of November 30, 2016 and 2015, and the results of their operations and their cash flows for the years then ended in accordance with accounting principles generally accepted in the United States of America.
1

Other Matter
The accompanying consolidated statements of operations and comprehensive income, of changes in members' equity, and of cash flows of Jefferies LoanCore LLC and its subsidiaries for the year ended November 30, 2014, are presented for purposes of complying with Rule 3-09 of SEC Regulation S-X; however, Rule 3-09 does not require the financial statements as of and for the year ended November 30, 2014 to be audited and they are, therefore, not covered by this report.
| /s/ PricewaterhouseCoopers LLP |
| New York, New York |
| January 23, 2017 |
2
Jefferies LoanCore LLC
Consolidated Statements of Financial Condition
November 30, 2016 and November 30, 2015
| (in thousands of dollars) | 2016 | 2015 | ||||||
Assets | ||||||||
Cash and cash equivalents |
$ |
89,128 |
|
$ |
16,954 |
| ||
Restricted cash |
|
17,980 |
|
|
15,632 |
| ||
Loans held for sale, at fair value |
|
768,965 |
|
|
1,979,563 |
| ||
Other investments, at fair value |
|
- |
|
|
19,524 |
| ||
Real estate and related assets, held for sale |
|
7,043 |
|
|
- |
| ||
Real estate debt securities, at fair value |
|
13,761 |
|
|
- |
| ||
Accrued interest receivable |
|
5,367 |
|
|
8,919 |
| ||
Prepaid expenses and other assets |
|
9,715 |
|
|
6,732 |
| ||
Derivative assets, at fair value |
|
13,264 |
|
|
12,911 |
| ||
Deferred financing fees, net |
|
6,600 |
|
|
8,882 |
| ||
Variable interest entity ("VIE") assets, at fair value |
|
895,350
|
|
|
-
|
| ||
|
|
|
| |||||
Total assets |
$
|
1,827,173
|
|
$
|
2,069,117
|
| ||
|
|
|
| |||||
Liabilities and Members' Equity | ||||||||
Bond payable |
$ |
300,000 |
|
$ |
300,000 |
| ||
Accounts payable and accrued expenses |
|
27,846 |
|
|
40,544 |
| ||
Loan participations sold, at fair value |
|
132,515 |
|
|
370,575 |
| ||
Derivative liabilities, at fair value |
|
2,506 |
|
|
2,660 |
| ||
Borrowings under credit facilities |
|
104,035 |
|
|
70,931 |
| ||
Repurchase agreements |
|
68,095 |
|
|
685,066 |
| ||
VIE liabilities, at fair value |
|
869,972
|
|
|
-
|
| ||
|
|
|
| |||||
Total liabilities |
|
1,504,969
|
|
|
1,469,776
|
| ||
|
|
|
| |||||
Commitments and contingencies | ||||||||
Members' equity |
|
322,204
|
|
|
599,341
|
| ||
|
|
|
| |||||
Total liabilities and members' equity |
$
|
1,827,173
|
|
$
|
2,069,117
|
| ||
|
|
|
| |||||
The accompanying notes are an integral part of these consolidated financial statements.
3
Jefferies LoanCore LLC
Consolidated Statements of Operations and Comprehensive Income
Fiscal Years Ended November 30, 2016, 2015 and 2014
| (in thousands of dollars) | 2016 | 2015 | 2014 | |||||||||
|
| (unaudited) | ||||||||||
Net interest income | ||||||||||||
Interest income | $ | 94,422 | $ | 117,501 | $ | 61,080 | ||||||
Interest expense | (51,534) | (58,032) | (31,982) | |||||||||
|
|
|
|
|
| |||||||
Net interest income | 42,888 | 59,469 | 29,098 | |||||||||
Other income and gains (losses) | ||||||||||||
Income from other investments | - | 4,695 | 1,040 | |||||||||
Other income | 11,404 | 22,938 | 6,644 | |||||||||
Change in net assets related to consolidated VIEs | (124) | - | - | |||||||||
Realized gain (loss) on sales of loans and other investments | (792) | 30,780 | 34,572 | |||||||||
Realized and unrealized gain (loss) on derivative instruments | 9,404 | 19,452 | (13,991) | |||||||||
Realized and unrealized gain (loss) on foreign currency, net | 9,368 | 7 | (134) | |||||||||
Unrealized gain (loss) on loans held for sale and other investments | 18,790 | (15,662) | 8,789 | |||||||||
Unrealized gain on loan participations sold | - | - | 307 | |||||||||
Unrealized gain on real estate debt securities | 744 | - | - | |||||||||
|
|
|
|
|
| |||||||
Total other income and gains (losses) | 48,794 | 62,210 | 37,227 | |||||||||
Costs and expenses | ||||||||||||
Compensation and benefits | (19,074) | (30,655) | (20,680) | |||||||||
Administrative expenses | (8,407) | (11,123) | (6,840) | |||||||||
|
|
|
|
|
| |||||||
Net income before income taxes | 64,201 | 79,901 | 38,805 | |||||||||
Income taxes | (501) | (934) | (129) | |||||||||
|
|
|
|
|
| |||||||
Net income from continued operations | $ | 63,700 | $ | 78,967 | $ | 38,676 | ||||||
|
|
|
|
|
| |||||||
Discontinued operations | ||||||||||||
Income from operations of discontinued real estate properties | 1,835 | - | - | |||||||||
Bargain purchase gain upon consolidation | 1,914 | - | - | |||||||||
Realized gain on real estate | 4,355 | - | - | |||||||||
|
|
|
|
|
| |||||||
Net income from discontinued operations | 8,104 | - | - | |||||||||
|
|
|
|
|
| |||||||
|
|
|
|
|
| |||||||
Net income | $ | 71,804 | $ | 78,967 | $ | 38,676 | ||||||
|
|
|
|
|
| |||||||
Other comprehensive loss | ||||||||||||
Foreign currency translation adjustments, net | (28,875) | (3,986) | (515) | |||||||||
|
|
|
|
|
| |||||||
Total comprehensive income | $ | 42,929 | $ | 74,981 | $ | 38,161 | ||||||
|
|
|
|
|
| |||||||
The accompanying notes are an integral part of these consolidated financial statements.
4
Jefferies LoanCore LLC
Consolidated Statements of Changes in Members' Equity
Fiscal Years Ended November 30, 2016, 2015 and 2014
| (in thousands of dollars) | Jefferies JLC Holdings LLC | FineII LLC | LoanCore JLC Holdings LLC and Other Members | Total | ||||||||||||
Members' equity at November 30, 2013 * | $
| 226,447
|
| $
| 226,447
|
| $
| 14,007
|
| $
| 466,901
|
| ||||
|
|
|
|
|
|
|
| |||||||||
Contributions from members | 626,734 | 626,734 | 38,767 | 1,292,235 | ||||||||||||
Distributions to members |
|
(610,615) |
|
|
(610,615) |
|
|
(37,770) |
|
|
(1,259,000) |
| ||||
Net Income |
|
18,758 |
|
|
18,758 |
|
|
1,160 |
|
|
38,676 |
| ||||
Other comprehensive loss |
|
(250)
|
|
|
(250)
|
|
|
(15)
|
|
|
(515)
|
| ||||
|
|
|
|
|
|
|
| |||||||||
Members' equity at December 1, 2014 * | $
| 261,074
|
| $
| 261,074
|
| $
| 16,149
|
| $
| 538,297
|
| ||||
|
|
|
|
|
|
|
| |||||||||
Contributions from members | 975,365 | 975,365 | 60,333 | 2,011,063 | ||||||||||||
Distributions to members |
|
(982,125) |
|
|
(982,125) |
|
|
(60,750) |
|
|
(2,025,000) |
| ||||
Net income |
|
38,299 |
|
|
38,299 |
|
|
2,369 |
|
|
78,967 |
| ||||
Other comprehensive loss |
|
(1,933)
|
|
|
(1,933)
|
|
|
(120)
|
|
|
(3,986)
|
| ||||
|
|
|
|
|
|
|
| |||||||||
Members' equity at December 1, 2015 | $
| 290,680
|
| $
| 290,680
|
| $
| 17,981
|
| $
| 599,341
|
| ||||
|
|
|
|
|
|
|
| |||||||||
Contributions from members | 338,288 | 338,288 | 20,924 | 697,500 | ||||||||||||
Distributions to members |
|
(493,519) |
|
|
(493,519) |
|
|
(30,528) |
|
|
(1,017,566) |
| ||||
Net income |
|
34,825 |
|
|
34,825 |
|
|
2,154 |
|
|
71,804 |
| ||||
Other comprehensive loss |
|
(14,005)
|
|
|
(14,005)
|
|
|
(865)
|
|
|
(28,875)
|
| ||||
|
|
|
|
|
|
|
| |||||||||
Members' equity at November 30, 2016 | $
| 156,269
|
| $
| 156,269
|
| $
| 9,666
|
| $
| 322,204
|
| ||||
|
|
|
|
|
|
|
| |||||||||
* Not covered by the Independent Auditor's Report included herein.
The accompanying notes are an integral part of these consolidated financial statements.
5
Jefferies LoanCore LLC
Consolidated Statements of Cash Flows
Fiscal Years Ended November 30, 2016, 2015 and 2014
| (in thousands of dollars) | November 30, | November 30, 2015 | November 30, 2014 | |||||||||
| (unaudited) | ||||||||||||
Cash flows from operating activities | ||||||||||||
Net income | $ | 71,804 | $ | 78,967 | $ | 38,676 | ||||||
| Adjustments to reconcile net income to net cash provided by (used in) operating activities | ||||||||||||
Realized (gain) loss on sales of loans and other investments | 792 | (30,780) | (34,572) | |||||||||
Realized (gain) loss on derivative instruments | (8,615) | (4,132) | 11,503 | |||||||||
Unrealized (gain) loss on loans held for sale and other investments | (18,790) | 15,662 | (8,789) | |||||||||
Unrealized gain on foreign currency, net | (9,980) | - | - | |||||||||
Unrealized gain on loan participations sold | - | - | (307) | |||||||||
Unrealized (gain) loss on derivative instruments | (789) | (15,320) | 2,488 | |||||||||
Unrealized gain on real estate debt securities | (744) | - | - | |||||||||
Change in net assets related to consolidated VIEs | 377 | - | - | |||||||||
Payment-in-kind interest | - | (893) | (521) | |||||||||
Amortization of deferred financing fees | 7,248 | 7,958 | 3,864 | |||||||||
Accretion of discount on real estate securities | (380) | - | - | |||||||||
Net income from discontinued operations | (8,104) | - | - | |||||||||
Origination discount related to loans and other investments paid down | (4,710) | (3,445) | (3,371) | |||||||||
Purchases and funding of loans held for sale | (1,159,275) | (2,650,528) | (1,770,701) | |||||||||
Purchases of real estate debt securities | (12,638) | - | - | |||||||||
Principal repayments received on loans held for sale | 291,488 | 419,375 | 162,328 | |||||||||
Proceeds from sales of loans | 1,019,396 | 1,683,724 | 1,129,684 | |||||||||
Proceeds from loan participations sold | 84,370 | 329,075 | 41,500 | |||||||||
Payments received on derivative instruments | 23,712 | 17,067 | 13,676 | |||||||||
Payments on settlement of derivative instruments | (12,639) | (13,006) | (25,677) | |||||||||
Changes in operating assets and liabilities | ||||||||||||
Accrued interest receivable | 3,552 | (2,965) | (2,185) | |||||||||
Prepaid expenses and other assets | (2,983) | (3,353) | (2,716) | |||||||||
Accounts payable and accrued expenses | (14,533) | 12,486 | (5,448) | |||||||||
|
|
|
|
|
| |||||||
Net cash provided by (used in) operating activities | 248,559 | (160,108) | (450,568) | |||||||||
|
|
|
|
|
| |||||||
Cash flows from investing activities | ||||||||||||
Principal repayments on loans held for sale | - | - | 32,000 | |||||||||
Purchase of real estate | (143) | - | - | |||||||||
Proceeds from sale of real estate asset | 46,953 | - | - | |||||||||
Purchase of loans by consolidated VIEs | (202,259) | - | - | |||||||||
Distributions of cash from consolidated VIEs | 354 | - | - | |||||||||
Increase in restricted cash | (3,000) | (6,387) | (729) | |||||||||
Contributions to other investments | - | (9,736) | (53,140) | |||||||||
Net decrease in restricted cash at real estate subsidiary | 655 | - | - | |||||||||
Paydowns received on other investments | 618 | 24,661 | 3,670 | |||||||||
Proceeds from sales of other investments | - | 14,925 | - | |||||||||
|
|
|
|
|
| |||||||
Net cash provided by (used in) investing activities | (156,822) | 23,463 | (18,199) | |||||||||
|
|
|
|
|
| |||||||
Cash flows from financing activities | ||||||||||||
Upfront fees received on derivative instruments | 9,816 | 6,545 | - | |||||||||
Payments on settlement of derivative instruments | (13,267) | (6,457) | - | |||||||||
Proceeds from credit facilities | 542,536 | 586,000 | 724,812 | |||||||||
Paydowns on credit facilities | (481,547) | (641,000) | (568,280) | |||||||||
Proceeds from repurchase agreements | 606,456 | 1,872,443 | 1,174,666 | |||||||||
Paydowns on repurchase agreements | (1,223,427) | (1,656,017) | (893,691) | |||||||||
Payment of deferred financing fees | (5,247) | (8,324) | (3,107) | |||||||||
Issuance of debt of consolidated VIEs | 864,927 | - | - | |||||||||
Repayment of debt of consolidated VIEs | (354) | - | - | |||||||||
Contributions from members | 676,576 | 1,954,905 | 1,253,468 | |||||||||
Distributions to members | (994,805) | (1,964,250) | (1,221,413) | |||||||||
|
|
|
|
|
| |||||||
Net cash provided by (used in) financing activities | (18,336) | 143,845 | 466,455 | |||||||||
|
|
|
|
|
| |||||||
Effect of exchange-rate changes on cash and cash equivalents | (1,227) | 552 | (60) | |||||||||
|
|
|
|
|
| |||||||
Net increase in cash and cash equivalents | 72,174 | 7,752 | (2,372) | |||||||||
Cash and cash equivalents | ||||||||||||
Beginning of period | 16,954 | 9,202 | 11,574 | |||||||||
|
|
|
|
|
| |||||||
End of period | $ | 89,128 | $ | 16,954 | $ | 9,202 | ||||||
|
|
|
|
|
| |||||||
Supplemental cash flow information | ||||||||||||
Cash paid for interest | $ | 51,562 | $ | 49,479 | $ | 27,167 | ||||||
Cash paid for income taxes | 261 | 40 | 148 | |||||||||
Change in distributions payable to members | 1,835 | 4,594 | 617 | |||||||||
| Non-cash distributions applied to contributions from members | 20,924 | 56,158 | 38,767 | |||||||||
Non-cash reversal of loan participations sold | 322,430 | - | 17,688 | |||||||||
The accompanying notes are an integral part of these consolidated financial statements.
6
Jefferies LoanCore LLC
Notes to Consolidated Financial Statements - 2014 is not covered by the Independent Auditor's Report included herein
(in thousands – except unit data)
| 1. | Organization |
Jefferies LoanCore LLC (the "Company"), a Delaware limited liability company, was formed on February 23, 2011 ("Inception") and its members are Jefferies JLC Holdings LLC ("Jefferies"), FINEII LLC ("FINEII"), LoanCore JLC Holdings LLC ("LoanCore") and certain other individuals ("LoanCore Investors"). The Company was formed for the purpose of acquiring, originating, syndicating and securitizing real estate related debt. The Company shall remain in existence unless dissolved in accordance with the terms of the Amended and Restated Limited Liability Company Agreement (the "LLC Agreement"). All initially capitalized terms used herein and not otherwise defined have the meanings ascribed to them in the LLC Agreement of the Company dated February 23, 2011 and as subsequently amended.
A board of managers ("Manager") appointed by Jefferies, FINEII and LoanCore, shall have the sole and exclusive right and authority to manage and control the business and affairs of the Company. A three person credit committee ("Credit Committee"), equally represented by Jefferies, FINEII and LoanCore, has been established to review and approve all new investments, material amendments to existing investments, and the securitization or other sales of investments. Any action of the Credit Committee shall be authorized by a majority of the members of the Credit Committee.
Capital commitments had been made to the Company totaling $600,000. On May 31, 2016, the capital commitments made to the Company were reduced to $400,000. Jefferies and FINEII each have a 48.5% membership interest in the Company, LoanCore with a 0.333% interest and LoanCore Investors with a combined 2.667% interest. The interest held by the Members is represented by Units in the form of Preferred Units, Class A Common Units and Class B Common Units. Capital calls may be made at the discretion of the Manager to fund investments and cover expenses, costs, and liabilities incurred in the conduct of Company business as further specified in the LLC Agreement. Subject to certain limitations, capital returned to the members may be recalled.
To increase its funding capacity, the Company has formed various wholly owned subsidiaries that have separately entered into master repurchase agreements with different financial institutions as described in Note 5. The Company also formed JLC Finance Corporation, a wholly owned subsidiary, to co-issue with the Company $300,000 of unsecured senior notes on May 31, 2013 as described in Note 7. To facilitate European loan origination operations, the Company has various wholly owned subsidiaries in foreign countries.
| 2. | Summary of Significant Accounting Policies |
Basis of Presentation
The accompanying consolidated financial statements have been prepared in accordance with accounting principles generally accepted in the United States of America ("GAAP"). The accompanying financial statements are presented on a consolidated basis and include all wholly owned subsidiaries of the Company. All intercompany accounts and transactions have been eliminated in consolidation.
7
Jefferies LoanCore LLC
Notes to Consolidated Financial Statements - 2014 is not covered by the Independent Auditor's Report included herein
(in thousands – except unit data)
Use of Estimates
The preparation of financial statements in accordance with GAAP requires management to make estimates and assumptions. The Company's most significant estimates include the fair value of financial instruments, including loans held for sale, derivatives, other investments, debt securities, loan participations sold, and VIE assets and liabilities that affect the reported amounts of assets and liabilities and disclosure of contingent assets and liabilities at the dates of the financial statements, as well as the reported amounts of revenue and expenses during the reporting periods. The actual results could differ from those estimates.
Cash and Cash Equivalents
The Company considers highly liquid short-term investments denominated in US Dollars ("USD"), British Pound Sterling ("GBP") or Euros ("EUR") with original maturities of less than ninety days from the date of purchase to be cash equivalents. Cash and cash equivalents are comprised of deposits and money market accounts with commercial banks that each may be in excess of depository insurance limits. The Company believes it adequately mitigates this risk by only investing in or through major financial institutions.
Restricted Cash
Restricted cash represents amounts required to be held with the Company's counterparties as collateral under certain requirements of the Company's repurchase agreements, credit facilities and derivative transactions.
Consolidated Statements of Cash Flows
During the year ended November 30, 2012, the Company achieved key strategic objectives and the Commercial Mortgage Backed Securities ("CMBS") secondary markets experienced favorable economic conditions that increased the demand for commercial real estate loans. As a result, the Company began classifying cash flows related to loans that were originated subsequent to November 30, 2011 as operating activities. During the years ended November 30, 2016, 2015 and 2014, $0, $0 and $32,000, respectively, related to the principal repayment of loans originated or acquired in the year ended November 30, 2011 have been classified as investing activities.
The Company classifies cash flows from its economic hedges in the same category as the cash flows from the items subject to the economic hedging relationships. Accordingly, cash flows related to derivative instruments are classified as operating activities. Cash flows related to certain derivative instruments that are used to hedge general credit risk are classified as financing activities as they have a financing element attributed to them at inception.
Loans Held for Sale
The Company originates and purchases its loans with the intent to sell them in the secondary market. Loans held for sale consist primarily of first and mezzanine mortgage loans that are collateralized by commercial, mixed use and multifamily residential real estate throughout the United States and Europe. Loans held for sale are initially recorded at cost, which approximates fair value and are net of purchase or origination discounts and premiums. Subsequent changes in the estimated fair value of loans are recorded as unrealized gains or losses in the accompanying consolidated statements of operations and comprehensive income as the Company has elected the fair value option under ASC 825 for all of its loans. Certain of the Company's loans may include embedded derivatives that are not bifurcated from the related loans, but rather accounted for as one instrument under the fair value option in accordance with ASC 815. Any change to the fair value of the embedded derivatives is recorded in the unrealized gain (loss) on loans held for
8
Jefferies LoanCore LLC
Notes to Consolidated Financial Statements - 2014 is not covered by the Independent Auditor's Report included herein
(in thousands – except unit data)
sale in the Company's accompanying consolidated statements of operations and comprehensive income. The estimated fair value of loans held for sale is determined using current secondary market prices for loans with similar coupons, maturities and credit quality. Of the loans held for sale, $232,442 and $1,015,142 are pledged as collateral under the Company's master repurchase agreements as of November 30, 2016 and November 30, 2015, respectively.
The performance of the underlying collateral is considered a key factor in the valuation process. As of November 30, 2016 and November 30, 2015, all loans were performing. The Company considers a loan to be non-performing if it is delinquent on debt service or maturity, or if the loan to value ratio falls below a certain threshold at which the Company does not believe it will recover its investment.
The Company evaluates the collectability of both interest and principal of each loan on an ongoing basis, at least quarterly, to determine whether they are impaired. A loan is impaired when it is probable that the Company will not be able to collect all amounts due pursuant to the contractual terms of the loan. Because the Company's loans are collateralized either by real property or by equity interests in the borrower, impairment is usually measured by comparing the estimated fair value of the underlying collateral to the Company's investment in the respective loan. The valuation of the underlying collateral requires significant judgment. When a loan is impaired, the amount of the loss accrual is calculated and recorded accordingly in realized gain (loss) on sales of loans and other investments on the consolidated statements of operations and comprehensive income.
The Company has also evaluated, where appropriate, its loans held for sale which may have an element of a lending arrangement collateralized by real estate for accounting treatment as loans or investments as required by sections of ASC 310 governing the accounting for acquisition, development and construction type loans ("ADC loans"). Except as described in Note 12, the Company has concluded that it has no decision making authority or power to direct activity, except normal lender rights as further discussed in Note 9 and that the Company's loans evaluated as ADC loans under ASC 310 should be accounted for as loans rather than investments.
The Company relies substantially on the secondary mortgage market as all of the loans originated are intended to be sold into this market. The secondary mortgage market relies primarily on the CMBS market, into which loans are sold and securitized into CMBS bonds. The CMBS bond market can be very volatile along with other fixed income securities' markets. Fluctuations in values of CMBS bonds will most likely lead to similar fluctuations in the estimated fair value of loans held for sale and could limit the Company's ability to securitize loans.
Real Estate Debt Securities
Investments in real estate debt securities are recorded in accordance with ASC 320 and ASC 325-40. The Company has chosen to elect the fair value option pursuant to ASC 825 for its real estate debt securities. Real estate debt securities are recorded at fair market value on the consolidated statements of financial condition and the periodic change in fair market value is recorded in current period earnings on the consolidated statements of operations and comprehensive income as a component of unrealized gain (loss) on real estate debt securities.
These investments meet the requirements to be classified as available for sale under ASC 320-10-25, which requires the securities to be carried at fair value on the consolidated statements of financial condition with changes in fair value recorded in other comprehensive income, a component of Members' Equity. Electing the fair value option allows the Company to record changes in fair value in the consolidated statements of operations and comprehensive income,
9
Jefferies LoanCore LLC
Notes to Consolidated Financial Statements - 2014 is not covered by the Independent Auditor's Report included herein
(in thousands – except unit data)
which more appropriately reflects the results of operations for a particular reporting period as all of the Company's investments including loans held for sale are recorded in a similar manner.
The Company accounts for its securities under ASC 320 and ASC 325 and evaluates securities for other-than-temporary impairment ("OTTI") on at least a quarterly basis. The determination of whether a security is other-than-temporarily impaired involves judgments and assumptions based on subjective and objective factors. When the estimated fair value of an available-for-sale security is less than the amortized cost, the Company will consider whether there is an other-than-temporary impairment in the value of the security. When a real estate security is impaired, the amount of the loss accrual is calculated and recorded accordingly in realized gain (loss) on real estate debt securities on the consolidated statements of operations and comprehensive income. The Company uses third-party valuations to determine the fair market value of the securities.
The determination as to whether an OTTI exists is subjective, given that such determination is based on information available at the time of assessment as well as the Company's estimate of future performance and cash flow projections for the individual security. As a result, the timing and amount of an OTTI constitutes an accounting estimate that may change materially over time.
Increases in interest income may be recognized on a security on which the Company previously recorded an OTTI charge if the performance of such security subsequently improves and the Company updates estimated yields to calculate interest income accordingly.
Real Estate Held for Sale
Real estate held for sale is carried at the lower of cost or fair value less costs to sell as the Company's real estate meets the requirements to classify as held for sale under ASC 360-10, including a plan to dispose of the real estate within one year. Once a property is determined to be held for sale, depreciation is no longer recorded.
Ordinary repairs and maintenance are expensed as incurred, and major replacements and betterments, which improve or extend the life of the asset, are capitalized over their useful lives or over the extension of the useful life for the existing asset.
The Company follows the purchase method for an acquisition of real estate, where the purchase price is allocated to tangible assets such as land, building, tenant and land improvements and other identified intangibles, such as goodwill. The Company's real estate properties, which have met the criteria to be classified as held for sale, are separately presented on the consolidated statements of financial condition and the results from the Company's real estate properties held for sale are reflected in income from discontinued operations.
Transfer of Financial Assets
For a transfer of financial assets to be considered a sale, the transfer must meet the sale criteria of ASC 860 under which the Company must surrender control over the transferred assets which must qualify as recognized financial assets at the time of transfer. The assets must be isolated from the Company, even in bankruptcy or other receivership; the purchaser must have the right to pledge or sell the assets transferred and the Company may not have an option or obligation to reacquire the assets. If the sale criteria are not met, the transfer is considered to be a secured borrowing, the assets remain on the Company's consolidated statements of financial condition and the sale proceeds are recognized as loan participations sold, a liability.
Loan Participations Sold
Loan participations sold represent senior interests in certain loans that were sold, however, the Company presents such loan participations sold as liabilities because these arrangements do not
10
Jefferies LoanCore LLC
Notes to Consolidated Financial Statements - 2014 is not covered by the Independent Auditor's Report included herein
(in thousands – except unit data)
qualify as sales under ASC 860. These participations are non-recourse and remain on the Company's consolidated statements of financial condition until the loan is repaid. The gross presentation of loan participations sold does not impact member's equity or net income.
Other Investments
At times, the Company may invest in special purpose vehicles structured as limited liability companies for the purpose of investing in commercial real estate debt and preferred equity positions. Some of these entities in which the Company may invest in may qualify as Variable Interest Entities ("VIEs") as discussed in Note 12. A VIE is defined as an entity in which equity investors do not have the characteristics of a controlling financial interest or do not have sufficient equity at risk for the entity to finance its activities without additional subordinated financial support from other parties. A VIE must be consolidated only by its primary beneficiary, which is defined as the party who, along with its related party affiliates and agents, has both the: (i) power to direct the activities that most significantly impact the VIE's economic performance; and (ii) obligation to absorb the losses of the VIE or the right to receive the benefits from the VIE, which could be potentially significant to the VIE. The Company considers the facts and circumstances pertinent to each VIE borrowing under the loan or through the Company's investment, including the relative amount of financing the common equity holders of the VIE are contributing to the overall project cost, decision making rights or control held by the common equity holders, guarantees provided by third parties, and rights to expected residual gains or obligations to absorb expected residual losses that could be significant from the project. If the Company is deemed to be the primary beneficiary of a VIE, consolidation treatment would be required. The Company's exposure to each investment is limited to the fair market value reflected on the consolidated statements of financial condition.
The Company has also evaluated, where appropriate, its loan investments which may have an element of a lending arrangement collateralized by real estate for accounting treatment as investments rather than loans as required by ASC 310. The Company has concluded that it has no decision making authority or power to direct activity, except normal lender rights, which are subordinate to the senior loans on the projects. For each investment described in Note 12, the characteristics, facts and circumstances indicate that investment accounting under the equity method treatment is appropriate.
The Company has elected to account for its other investments at estimated fair value. The fair value option provides an election that allows a company to irrevocably elect fair value for certain financial assets and liabilities on an instrument-by-instrument basis at initial recognition. Under the fair value option, investments are initially recorded at cost which approximates estimated fair value. The estimated fair value of other investments is determined based upon completed or pending transactions involving the underlying investment. In the absence of such evidence, estimated fair value is determined using multiple methodologies, including the market and income approaches.
Income from limited liability companies in which the Company invests is reflected in the accompanying consolidated financial statements as income from other investments and changes in estimated fair value of the investments are reflected as a component of unrealized gain (loss) on loans held for sale and other investments.
Presentation of Variable Interest Entities
The Company acquires unrated, investment grade and non-investment grade rated CMBS. These securities represent interests in securitization structures (commonly referred to as special purpose entities, or "SPEs"). These SPEs are structured as pass through entities that receive principal and interest on the underlying collateral and distribute those payments to the certificate holders. These SPEs typically qualify as VIEs.
11
Jefferies LoanCore LLC
Notes to Consolidated Financial Statements - 2014 is not covered by the Independent Auditor's Report included herein
(in thousands – except unit data)
As the holder of the controlling class of the trust the Company has the right to name and remove the special servicer for the trust, which typically can direct the significant actions of the trust and requires consolidation of these structures pursuant to ASC 810. This results in a presentation on the consolidated statements of financial condition of the gross assets and liabilities of the VIEs. The assets and other instruments held by these VIEs are restricted and can only be used to fulfill the obligations of the entity. Additionally, the obligations of the VIEs do not have any recourse to the general credit of any other consolidated entities, nor to the consolidator of these VIEs.
The Company separately presents the assets and liabilities of consolidated securitization VIEs as individual line items on the consolidated statements of financial condition. The liabilities of consolidated securitization VIEs consist principally of obligations to the bondholders of the related CMBS trusts, and are thus presented as a single line item entitled "VIE liabilities." The assets of consolidated securitization VIEs consist principally of loans. These assets in the aggregate are likewise presented as a single line item entitled "VIE assets."
The Company elects the fair value option for initial and subsequent recognition of the assets and liabilities of the consolidated securitization VIEs. The VIEs are recorded by following the guidance of ASU 2014-13 which values the assets and liabilities utilizing the more observable input. All of the underlying assets, liabilities and equity of the securitization VIE's are recorded on the Company's financial statements, and the initial investment, along with any associated unrealized holding gains and losses, are eliminated in consolidation. Interest income and interest expense associated with these VIEs are no longer relevant on a standalone basis because these amounts are already reflected in the fair value changes. The Company has elected to present these items in a single line its consolidated statements of operations and comprehensive income. All net residual amounts from consolidation are recorded in the "Change in net assets related to consolidated VIEs" which represents the Company's income from its retained beneficial interest in the VIEs.
Other Income
The Company recognizes other income related to origination discounts, termination fees and miscellaneous other fees when loans are paid off per terms of the related loan agreement.
Deferred Financing Fees, Net
Fees and expenses incurred in connection with the Company's repurchase agreements and credit facilities are capitalized and amortized to interest expense over the financing term under the straight-line method. Fees and expenses incurred in connection with Company's bond payable are capitalized and amortized to interest expense over the financing term under the effective interest method.
Derivative Instruments
In the normal course of business, the Company is exposed to the effect of interest rate changes and may undertake a strategy to limit these risks through the use of derivatives. To address exposure to interest rates, the Company uses derivatives primarily to hedge the fair value variability of fixed rate assets caused by interest rate fluctuations. The Company may use a variety of derivative instruments, including interest rate swaps, indices, caps, collars and floors, to manage interest rate and credit risk.
12
Jefferies LoanCore LLC
Notes to Consolidated Financial Statements - 2014 is not covered by the Independent Auditor's Report included herein
(in thousands – except unit data)
To determine the fair value of derivative instruments, the Company uses a variety of methods and assumptions that are based on market conditions and risks existing at each statement of financial condition date. Standard market conventions and techniques such as discounted cash flow analysis, option-pricing models, replacement cost, and termination cost may be used to determine fair value. All such methods of measuring fair value for derivative instruments result in an estimate of fair value, and such value may never actually be realized.
The Company recognizes all derivatives on the consolidated statements of financial condition at estimated fair value. The Company does not designate derivatives as hedges to qualify for hedge accounting. Any net payments under open or terminated derivatives are included in realized gain (loss) on derivative instruments, and fluctuations in the fair value of derivatives held are recognized in unrealized gain (loss) on derivative instruments in the accompanying consolidated statements of operations and comprehensive income.
Initial payments made or received on open derivatives at November 30, 2016 and November 30, 2015 are included in derivative liabilities and derivative assets, at fair value, on the accompanying consolidated statements of financial condition.
As a part of the risk management strategy of the Company, it may enter into Interest Rate Lock Commitments ("IRLCs") in connection with its loan origination activities. The Company accounts for IRLCs as derivative instruments and records them at fair value with changes in fair value recorded in unrealized gains and losses on the consolidated statements of operations and comprehensive income. In estimating the fair value of an IRLC, the Company assigns a probability to the loan commitment based on an expectation that it will be exercised and the loan will be funded. The fair value of the commitments is derived from the fair value of related loans which is based on observable market data and includes the expected net future cash flows of the loans. Changes to the fair value of IRLCs are recognized based on interest rate fluctuations, changes in the probability that the commitment will be exercised and the passage of time. Outstanding IRLCs expose the Company to the risk that the price of the loans underlying the commitments might decline from inception of the rate lock to funding of the loan. To protect against this risk, the Company utilizes other derivative instruments, including interest rate swaps and options to economically hedge the risk of potential changes in the value of the loans that would result from the commitments. The changes in the fair value of these IRLCs are recorded in realized gain (loss) on sales of loans and other investments and unrealized gain (loss) on loans held for sale and other investments on the consolidated statements of operations and comprehensive income. At the time the related loan is funded, any remaining fair value is transferred to the basis of that loan as a discount or premium, as applicable.
The Company enters into foreign currency forward contracts with counterparties primarily as hedges against portfolio positions with each instrument's primary risk exposure being foreign exchange risk. Forward currency contracts are over-the-counter contracts for delayed delivery of currency in which the buyer agrees to buy and the seller agrees to deliver a specified currency at a specified price on a specified date. The Company did not incur an upfront cost to acquire the contracts and all commitments are marked-to-market on each valuation date at the applicable forward exchange rate and adjusted for nonperformance risk of counterparties, as appropriate. Any resulting unrealized appreciation or depreciation is recorded on such date in derivative assets, at fair value or derivative liabilities, at fair value on the Company's consolidated statements of financial condition and reflected as unrealized gain (loss) on the Company's consolidated statements of operations and comprehensive income as the Company does not designate its
13
Jefferies LoanCore LLC
Notes to Consolidated Financial Statements - 2014 is not covered by the Independent Auditor's Report included herein
(in thousands – except unit data)
forward currency contracts as hedges to qualify for hedge accounting, but rather as economic hedges to manage the Company's foreign currency risk related to its European operations. The Company realizes gains and losses at the time forward contracts are extinguished or closed upon entering into an offsetting contract or delivering the foreign currency.
The Company has also entered into other derivatives, including share warrants, related to loans or other investments it has originated in the UK. The Company did not incur an upfront cost to acquire the other derivatives and all other derivatives are marked-to-market on each valuation date. Any resulting unrealized appreciation or depreciation is recorded on such date in derivative assets, at fair value or derivative liabilities, at fair value on the Company's consolidated statements of financial condition and reflected as unrealized gain (loss) on the Company's consolidated statements of operations and comprehensive income. The Company realizes gains and losses at the time the other derivative is either exercised or terminated.
Repurchase Agreements
Loans sold under repurchase agreements are treated as collateralized financing transactions unless they meet sales treatment. Loans financed through a repurchase agreement remain on the Company's consolidated statements of financial condition as an asset and cash received from the purchaser is recorded on the Company's consolidated statements of financial condition as a liability. Interest incurred in accordance with repurchase agreements is recorded in interest expense.
Bond Payable
Bond payable is accounted for on an amortized cost basis. Interest incurred in accordance with the indenture agreement is recorded in interest expense and calculated using the effective interest method.
Credit Facilities
Borrowings under the credit facilities are stated at their outstanding principal amount. Interest incurred in accordance with the credit facilities agreements is recorded in interest expense and accrued interest is included in accounts payable and accrued expenses.
Fair Value Measurement
In accordance with the authoritative guidance on estimated fair value measurements and disclosures under GAAP (Financial Accounting Standards Board - Accounting Standards Codification Topic 820), the methodologies used for valuing such instruments have been categorized into three broad levels as follows:
Level 1 - Quoted prices in active markets for identical instruments.
Level 2 - Valuations based principally on other observable market parameters, including
| • | Quoted prices in active markets for similar instruments, |
| • | Quoted prices in less active or inactive markets for identical or similar instruments, |
| • | Other observable inputs (such as interest rates, yield curves, volatilities, prepayment spreads, loss severities, credit risks and default rates), and |
| • | Market corroborated inputs (derived principally from or corroborated by observable market data). |
14
Jefferies LoanCore LLC
Notes to Consolidated Financial Statements - 2014 is not covered by the Independent Auditor's Report included herein
(in thousands – except unit data)
Level 3 - Valuations based significantly on unobservable inputs.
| • | Valuations based on third party indications (broker quotes, counterparty quotes or pricing services) which are, in turn, based significantly on unobservable inputs or are otherwise not supportable as Level 2 valuations. |
| • | Valuations based on internal models with significant unobservable inputs. |
Pursuant to the authoritative guidance, these levels form a hierarchy. The determination of the classification of financial instruments in Level 2 or Level 3 of the fair value hierarchy is performed at the end of each reporting period. The Company considers all available information, including observable market data, indications of market liquidity and orderliness, and its understanding of the valuation techniques and significant inputs. Based upon the specific facts and circumstances of each instrument or instrument category, judgments are made regarding the significance of the Level 3 inputs into the instruments' fair value measurement in its entirety. If Level 3 inputs are considered significant, the instrument is classified as Level 3. The process for determining fair value using unobservable inputs is generally more subjective and involves a high degree of management judgment and assumptions.
Financial instruments are considered Level 3 when pricing models are used, including discounted cash flow methodologies and at least one significant model assumption or input is unobservable or has significant variability between sources. The tables in Note 14 present a reconciliation for all assets and liabilities that are measured and recognized at fair value on a recurring basis using significant unobservable inputs. When assets and liabilities are transferred between levels, the Company recognizes the transfer as of the end of the period. There were no transfers between levels for the years ended November 30, 2016 and November 30, 2015.
Considerable judgment is necessary to interpret market data and develop estimated fair values. Accordingly, estimated fair values are not necessarily indicative of the amounts the Company could realize upon disposition of the financial instruments. Financial instruments with readily available active quoted prices, or for which an estimated fair value can be measured from actively quoted prices, generally have a higher degree of pricing observability, and therefore, require a lesser degree of judgment to be utilized in measuring estimated fair value. Conversely, financial instruments rarely traded or not quoted will generally have less, or no, pricing observability and require a higher degree of judgment in measuring estimated fair value. Pricing observability is generally affected by such items as the type of financial instrument, whether the financial instrument is new to the market and not yet established, the characteristics specific to the transaction and the overall market conditions. The use of different market assumptions and/or pricing methodologies may have a material effect on estimated fair value amounts.
Electing the fair value option for loans held for sale, real estate debt securities, consolidated securitization VIEs, other investments, and liabilities related to loan participations sold reflects the manner in which the business is managed and often allows for an offset of the changes in the estimated fair value of these instruments and the interest rate derivatives used to hedge against market interest fluctuations. For a further discussion regarding the measurement of financial instruments, see Note 14.
Revenue Recognition
Interest on loans held for sale is recognized as earned under the contractual terms of the loans and included in interest income in the accompanying consolidated statements of operations and comprehensive income. Interest is only accrued if deemed collectible. Interest is generally
15
Jefferies LoanCore LLC
Notes to Consolidated Financial Statements - 2014 is not covered by the Independent Auditor's Report included herein
(in thousands – except unit data)
deemed uncollectible when a loan becomes three months or more delinquent. Delinquency is calculated based on the contractual interest due date of the loan. For the years ended November 30, 2016 and November 30, 2015 the Company had no loans deemed delinquent, respectively.
Upon sale of a loan, the Company will reverse previously recorded unrealized gains and losses and recognize realized gains or losses on the loan sold. Any difference between the initial recorded value of the loan, including any discount, and the sales price is recorded as realized gain or loss. For loans that were originated at a discount that are subsequently paid down by the borrower, the origination discount is recognized in other income.
Interest income on the Company's real estate debt securities is accrued based on the actual coupon rate and the outstanding principal balance of such securities. The Company has elected to record interest in accordance with ASC 835-30-35-2 using the effective interest method for all securities accounted for under the fair value option (ASC 825). As such, premiums and discounts are amortized or accreted into interest income over the lives of the securities in accordance with ASC 310-20, ASC 320-10 or ASC 325-40, as applicable. Total interest income from real estate debt securities is recorded in the interest income line item on the consolidated statements of operations and comprehensive income.
The Company reassesses the cash flows on at least a quarterly basis for securities accounted for under ASC 325-40. In estimating these cash flows, there are a number of assumptions that will be subject to uncertainties and contingencies. These include the rate and timing of principal and interest receipts (including assumptions of prepayments, repurchases, defaults and liquidations), the pass-through or coupon rate and interest rate fluctuations. In addition, interest payment shortfalls due to delinquencies on the underlying mortgage loans have to be judgmentally estimated. Differences between previously estimated cash flows and current actual and anticipated cash flows are recognized prospectively through an adjustment of the yield over the remaining life of the security based on the current amortized cost of the investment as adjusted for credit impairment, if any.
Operating lease income is recognized in income from operations of discontinued real estate properties on a straight-line basis over the respective lease terms. The Company commences recognition of operating lease income at the date the property is ready for its intended use and the tenant takes possession of or controls the physical use of the property. Tenant recoveries related to reimbursement of real estate taxes, insurance, utilities, repairs and maintenance, and other operating expenses are recognized as revenue in the period during which the applicable expenses are incurred in income from operations of discontinued real estate properties.
Certain Risks and Concentrations
Due to the nature of the mortgage lending industry, changes in interest rates and spreads on CMBS may significantly impact the estimated fair value of the Company's investments, revenue from originating mortgages and subsequent sales of loans, which is one of the primary sources of income for the Company.
The Company uses third parties to provide loan servicing on its portfolio of investments. There is a credit risk associated with using these third parties. The Company believes it mitigates this risk by using nationally recognized third parties to service loans and other investments. Management also monitors each loan or other investment independently.
16
Jefferies LoanCore LLC
Notes to Consolidated Financial Statements - 2014 is not covered by the Independent Auditor's Report included herein
(in thousands – except unit data)
Concentration of Credit Risk
The Company invests its cash primarily in demand deposits and money market accounts with commercial banks. At times, cash balances at a limited number of banks and financial institutions may exceed federally insured amounts. The Company believes it mitigates credit risk by depositing cash in or investing through major financial institutions having capital ratios that exceed the regulatory standards defined for a well-capitalized financial institution. To date, there have been no losses from these investments.
In the normal course of its activities, the Company may utilize derivative financial instruments. These derivatives are predominantly used for managing risk associated with the Company's portfolio of investments. Credit risk includes the possibility that a loss may occur from the failure of counterparties or issuers to make payments according to the term of the contract. The Company's exposure to credit risk at any point in time is generally limited to amounts recorded as derivative assets on the consolidated statements of financial condition.
Concentrations of credit risks arise when a number of properties related to the Company's loans and other investments are located in the same geographic region, or have similar economic features that would cause their ability to meet contractual obligations, including those to the Company, to be similarly affected by changes in economic conditions. The Company monitors various segments of its investments to assess potential concentrations of credit risks. Management believes the current investments are reasonably well diversified and do not contain any significant concentration of credit risks. Collateral for all of the Company's loans and other investments is located in Europe at 30.6% and the United States at 69.4%, with New York 10.7%, representing the only state with a concentration greater than 10.0% of the total as of November 30, 2016. As of November 30, 2015, the collateral for all of the Company's loans and other investments is located in Europe at 13.1% and the United States at 86.9%, with the only states with collateral concentration greater than 10.0% of the total being New York 24.2% and California 12.7%.
Income Taxes
No provision has been made in the accompanying consolidated financial statements for federal income taxes as the Company has elected to be treated as a partnership for federal income tax purposes. Each member is responsible for its allocable share of income taxes generated by the activities of the Company.
The Company files various foreign, state and local income tax returns. For the years ended November 30, 2016, 2015 and 2014, tax expenses of $501, $934 and $129 were recorded and included in income taxes, respectively. State withholding payments made on behalf of the Company's members that remain due to the Company as of November 30, 2016 and November 30, 2015 were $106 and $209, respectively.
The Company recognizes tax positions in the consolidated financial statements only when it is more-likely-than-not, based on the technical merits, that the position would be sustained upon examination by the relevant taxing authority. A tax position that meets the more-likely-than-not recognition threshold is measured at the largest amount of tax benefit that is greater than fifty percent likely of being realized upon settlement. As of November 30, 2016 and November 30, 2015, unrecognized tax benefits were $1,061 and $974, respectively.
Interest related to unrecognized tax benefits is recognized in income tax expense. Penalties, if any, are recognized in other expenses. At November 30, 2016 and November 30, 2015, the Company has accrued interest expense of approximately $215 and $424, respectively. No penalties have been accrued for the years ended November 30, 2016, 2015 and 2014.
17
Jefferies LoanCore LLC
Notes to Consolidated Financial Statements - 2014 is not covered by the Independent Auditor's Report included herein
(in thousands – except unit data)
The Company is not under examination by any taxing authorities. The earliest tax year which remains subject to examination by major taxing authorities is 2012.
Foreign Currency
The functional currency of the Company's foreign subsidiaries is GBP. In the normal course of business, the Company enters into transactions not denominated in US dollars in connection with its European loan originations. Foreign exchange gains and losses arising on such transactions are recorded as a gain or loss in the Company's consolidated statements of operations and comprehensive income. As of November 30, 2016 and November 30, 2015, the Company and its wholly owned subsidiaries held 1,023 GBP and 1,323 EUR and 3,898 GBP and 517 EUR in cash and cash equivalents, respectively. In addition, the Company consolidates wholly owned subsidiaries which have non-US dollar functional currency. Non-US dollar denominated assets and liabilities are translated to US dollars at the exchange rate prevailing at the reporting date and income, expenses, gains, and losses at the average rate of exchange prevailing during the period recognized. Cumulative translation adjustments arising from translation of GBP denominated subsidiaries are recorded in other comprehensive income. Certain intercompany transactions between the Company's foreign subsidiaries and the US domiciled parent also create unrealized and realized gains and losses on foreign currency due to those transactions not qualifying as long term advances under ASC 830, Foreign Currency Matters. The Company has recorded $28,875, $3,986 and $515 of other comprehensive loss on foreign currency translation adjustments, respectively, as of November 30, 2016, 2015 and 2014. The Company has entered into various foreign currency forward contracts, as discussed in Note 2, to reduce risk and exposure to foreign currency movements. Substantially all of the Company's foreign currency exposure is hedged.
Indemnifications
The Company enters into contracts that contain a variety of indemnifications under certain representations and warranties, which primarily relate to sales of loans as part of securitization transactions. The Company's maximum exposure under these arrangements is unknown. However, the Company has not had claims or losses pursuant to these contracts and expects the risk of loss to be remote.
Recent Accounting Pronouncements
In August 2014, the FASB issued ASU 2014-15, Presentation of Financial Statements-Going Concern (Subtopic 205-40): Disclosure of Uncertainties about an Entity's Ability to Continue as a Going Concern. The new ASU disclosure requirement explicitly requires management to assess an entity's ability to continue as a going concern, and to provide related footnote disclosures in certain circumstances. In connection with each annual and interim period, management will assess if there is substantial doubt about an entity's ability to continue as a going concern within one year after the issuance date by considering relevant conditions that are known (and reasonably knowable) at the issuance date. If significant doubt exists, management will need to assess if its plans will or will not alleviate substantial doubt in order to determine the specific disclosures. The ASU is effective for annual periods beginning after December 15, 2016. Earlier application is permitted. The Company is currently evaluating the impact of ASU 2014-15 on the consolidated financial statements.
In August 2014, the FASB issued ASU 2014-13, Consolidation (Topic 810): Measuring the Financial Assets and the Financial Liabilities of a Consolidated Collateralized Financing Entity,
18
Jefferies LoanCore LLC
Notes to Consolidated Financial Statements - 2014 is not covered by the Independent Auditor's Report included herein
(in thousands – except unit data)
which establishes a measurement alternative allowing qualifying entities to measure both the collateralized financing entity's, or CFE's, financial assets and financial liabilities based on the fair value of the financial assets or financial liabilities, whichever is more observable. The measurement alternative is available upon initial consolidation of the CFE or adoption of this ASU and can be applied on a CFE-by-CFE basis. The ASU is effective for annual periods, and interim periods therein, beginning after December 15, 2015. Early application is permitted. The Company early adopted the standard as of November 30, 2016 which was the initial consolidation of a CFE as discussed in Note 10.
In April 2015, FASB issued ASU 2015-03, Interest – Imputation of Interest (Subtopic 835-30): Simplifying the Presentation of Debt Issuance Costs ("ASU 2015-03"). The amended guidance requires that debt issuance costs related to a recognized debt liability be presented in the balance sheet as a direct deduction from the carrying amount of that debt liability, consistent with debt discounts. The recognition and measurement guidance for debt issuance costs is not affected by the amendments in this ASU. The amendments in this ASU are effective for financial statements issued for fiscal years beginning after December 15, 2015, and interim periods within those fiscal years. Early adoption of this ASU is permitted for financial statements that have not been previously issued. Entities must apply the new guidance on a retrospective basis, wherein the balance sheet of each individual period presented should be adjusted to reflect the period-specific effects of applying the new guidance. Upon transition, an entity is required to comply with the applicable disclosures for a change in an accounting principle. For the Company's fiscal year starting December 1, 2016 the unamortized debt issuance costs related to its Bond Payable will be reclassified from Deferred financing fees to a direct deduction to the Bond Payable balance. All prior comparative periods will also be reclassified in accordance with adoption on the retrospective basis. The unamortized amount of Deferred financing fees related to the Bond Payable at November 30, 2016 is $4,944.
In January 2016, the FASB issued ASU 2016-01, Financial Instruments-Overall. The amendment provides guidance to improve certain aspects of classification and measurement of financial instruments, including significant revisions in accounting related to the classification and measurement of investments in equity securities and presentation of certain fair value changes for financial liabilities when the fair value option is elected. The guidance also amends certain disclosure requirements associated with the fair value of financial instruments. The Company is required to adopt the new guidance in the first quarter of 2018. Early adoption is permitted. The Company is currently evaluating the potential impact of the new guidance on its consolidated financial statements, as well as available transition methods.
In February 2016, the FASB issued ASU 2016-02, Leases (Topic 842), which establishes a right-of-use model for lessee accounting which results in the recognition of most leased assets and lease liabilities on the balance sheet of the lessee. Lessor accounting was not significantly changed. The ASU is effective for annual periods, and interim periods therein, beginning after December 15, 2019 by applying a modified retrospective approach. Early application is permitted. The Company is currently evaluating the potential impacts of the new guidance on its consolidated financial statements.
In June 2016, the FASB issued ASU 2016-13, Financial Instruments – Credit Losses, an amendment to the guidance on reporting credit losses for assets measured at amortized cost and available-for-sale securities. The Company is required to adopt the new guidance in the first quarter of 2020. Early adoption is permitted. The Company is currently evaluating the potential impacts of the new guidance on its consolidated financial statements, as well as available transition methods.
19
Jefferies LoanCore LLC
Notes to Consolidated Financial Statements - 2014 is not covered by the Independent Auditor's Report included herein
(in thousands – except unit data)
In August 2016, the FASB issued ASU 2016-15, Classification of Certain Cash Receipts and Cash Payments. The guidance adds or clarifies guidance on the classification of certain cash receipts and payments in the statement of cash flows. The guidance is effective in the first quarter of fiscal 2019 and early adoption is permitted. The Company is currently evaluating the impact of the new guidance on the consolidated statements of cash flows.
| 3. | Members' Equity |
As described in Note 1, interests held by the Members are represented by Units in the form of Preferred Units, Class A Common Units and Class B Common Units. Issued at inception and outstanding as of August 31, 2016 were 600 Preferred Units, 10,000 Class A Common Units and 2,195 Class B Common Units, of which 11.5 Preferred Units, 191.668 Class A Common Units and 1,770 Class B Common Units were held by employees.
Class B Common Units were granted at inception to FINEII and one key employee ("Key Employee"). All such Class B Common Units shall become vested units immediately before the consummation of a Company sale that results in an annualized rate of return, realized entirely in cash, on the Preferred Units and Class A Common Units, of at least 15%, an IPO that results in gross proceeds of at least $150,000 and an annualized rate of return, realized entirely in cash, on the Preferred Units and Class A Common Units, of at least 15%, a liquidity event or a transfer, as defined. To the extent the return is not entirely realized in cash in the case of a qualifying IPO, 50% of the Class B Common Units shall become vested and the remainder will vest contingent upon the performance of the Company's stock price over the two years immediately following the IPO. Upon vesting, each Class B Common Unit will convert into one Class A Common Unit. Prior to vesting, Class B Common Units have no voting rights.
In the event that the Company terminates the Key Employee for Cause or he resigns without Good Reason, as defined, all unvested Class B Common Units owned by either party will be forfeited. In the event that the Company terminates the Key Employee without Cause, he resigns for Good Reason, or his employment with the Company ends due to death or disability, the employee and FINEII may retain 20% of the unvested Class B Common Units for each full year the Key Employee was employed by the Company. As of the date of grant, February 23, 2011, the Company has determined the fair value of the Class B Common Units held by the Key Employee to be $3,145, in aggregate. The fair value was determined utilizing a Black-Scholes model, discounted to account for the inherent lack of marketability of the Units. Significant inputs and assumptions utilized in determining the fair value of the Units include the term, expected volatility, dividend yield and risk-free rate.
With respect to Preferred Units and Class A Common Units held by employees, upon termination of employment without Cause or for Good Reason, as defined, the Company shall redeem promptly all Preferred Units and, at the option of such employee, all Class A Common Units held by such employee at Book Value, as defined.
Under the LLC Agreement, as amended, a 7% capital charge ("Capital Charge") accrues as a preference to the Preferred Units on unreturned Capital Contributions and Retained Earnings.
20
Jefferies LoanCore LLC
Notes to Consolidated Financial Statements - 2014 is not covered by the Independent Auditor's Report included herein
(in thousands – except unit data)
On an accumulated basis through November 30, 2016 and November 30, 2015, respectively, the Company called $8,162,281 and $7,464,781 of capital from its members to fund new investment originations, acquisitions and working capital. Cumulatively through November 30, 2016 and November 30, 2015, respectively, the Company distributed $8,162,799 and $7,145,234, of which $145,067 and $108,022 is considered payments of the Capital Charge and Retained Earnings. Of the distributions declared, $7,046 and $5,211 were due and payable to LoanCore and LoanCore Investors at November 30, 2016 and November 30, 2015, respectively, and are included in accounts payable and accrued expenses on the consolidated statements of financial condition.
The total capital commitments of the Company were $400,000 and $600,000 as of November 30, 2016 and November 30, 2015, respectively, as further described in Note 1. Certain amounts of capital previously returned to Members are considered recallable, resulting in net callable, unfunded commitments of $255,452 and $172,431 at November 30, 2016 and November 30, 2015, respectively.
Pursuant to the LLC Agreement, an affiliate of FINEII has the first right to purchase subordinate loans and investments based on market terms. For the years ended November 30, 2016 and November 30, 2015, no loans or investments were sold to FINEII.
Allocation of Net Income and Net Losses
Net income and net losses are allocated to the members in a manner consistent with the LLC Agreement, as amended, which provides for a hypothetical liquidation at net book value of the Company's assets and liabilities as of the date of presentation and as recorded on the accompanying consolidated statement of changes in members' equity.
Distributions
Non-liquidating Distributions
No less often than semi-monthly (or more frequently as requested by FINEII or Jefferies), the Company shall distribute the Company's Available Cash, as defined in the LLC Agreement, as follows:
| 1) | First, to the extent available, to the holders of the Preferred Units, |
| a. | pro rata in accordance with their respective Preferred Percentage Interests until each holder of Preferred Units shall have received an amount equal to, but not in excess of, the unpaid accrued 7% Capital Charge attributable to the Preferred Units; and then |
| b. | pro rata in accordance with their respective Preferred Percentage Interests an amount equal to, but not in excess of, the unpaid accrued 7% Retained Earnings Capital Charge; |
21
Jefferies LoanCore LLC
Notes to Consolidated Financial Statements - 2014 is not covered by the Independent Auditor's Report included herein
(in thousands – except unit data)
| 2) | Second, to the extent available, to the holders of the Preferred Units, pro rata in accordance with their respective Preferred Percentage Interests until each holder of Preferred Units shall have received an amount equal to, but not in excess of, their Unreturned Capital Contribution; and |
| 3) | Third, to the extent available, to the holders of the Class A Common Units, pro rata in accordance with their respective Common Percentage Interests (calculated by excluding from the numerator and the denominator the number of Class B Common Units issued and outstanding). |
Liquidating Distributions
Upon a Liquidity Event, the proceeds of such sale, disposition or liquidation and any other available cash shall be applied and distributed as follows:
| 1) | First, to the extent available, proceeds shall be applied to the payment of liabilities of the Company (including all expenses of the Company incident to the Liquidity Event and all other liabilities that the Company owes to the Members or any Affiliates of a Member in accordance with the terms hereof); |
| 2) | Second, to the extent available, proceeds shall be applied to the setting up of any reserves which are reasonably necessary for contingent, un-matured or unforeseen liabilities or obligations of the Company; |
| 3) | Third, to the extent available, to the holders of the Preferred Units, |
| a. | pro rata in accordance with their respective Preferred Percentage Interests until each holder of Preferred Units shall have received an amount equal to, but not in excess of, their unpaid accrued 7% Capital Charge attributable to the Preferred Units; and then |
| b. | pro rata in accordance with their respective Preferred Percentage Interests until each holder of the Preferred Units shall have received an amount equal to, but not in excess of, their unpaid accrued 7% Retained Earnings Capital Charge; |
| 4) | Fourth, to the extent available, to the holders of the Preferred Units, pro rata in accordance with their respective Preferred Percentage Interests until each holder of Preferred Units shall have received an amount equal to, but not in excess of, their Unreturned Capital Contribution; and |
| 5) | Fifth, to the extent available, to the holders of the Common Units, pro rata in accordance with their respective Common Percentage Interests. |
Per the May 13, 2016 Amendment to the LLC Agreement, to the extent that the sum of the Company's Retained Earnings and the Maximum Contribution Amounts for all Members exceeds $560,000 as of the end of any fiscal quarter, the Company will promptly (and in any event no later than 45 days after the end of such quarter) make a distribution of Available Cash that is treated as a reduction to Retained Earnings.
22
Jefferies LoanCore LLC
Notes to Consolidated Financial Statements - 2014 is not covered by the Independent Auditor's Report included herein
(in thousands – except unit data)
Accumulated Other Comprehensive Income (Loss)
Accumulated other comprehensive income (loss) reflected in the Company's members' equity is comprised of the following:
Balance at November 30, 2014 | $ | (515) | ||
Unrealized loss on translation adjustment | (3,986) | |||
|
| |||
Balance at November 30, 2015 | (4,501) | |||
Unrealized loss on translation adjustment | (28,875) | |||
|
| |||
Balance at November 30, 2016 | $ | (33,376) | ||
|
|
| 4. | Transfers of Financial Assets |
During the years ended November 30, 2016, 2015 and 2014, the Company sold loans to unaffiliated third parties, as part of securitization transactions. The Company received only cash proceeds from these transactions. As discussed in Note 10, in certain transactions the Company purchased CMBS from the same securitization transactions. Some of the purchased CMBS did not preclude sales accounting treatment for the loans sold under ASC 860. The purchased investment securities, for which the company is the holder of the controlling class, are consolidated as discussed on Note 10.
Transfers of loans as part of securitization transactions that qualified as sales, were derecognized from the consolidated statements of financial condition, resulting in the recognition of aggregate realized gains (losses) of $(2,210), $34,811 and $28,417 for the years ended November 30, 2016, 2015 and 2014, respectively.
During the year ended November 30, 2016, twenty-five loans with an aggregate outstanding principal balance of $616,044 were sold to LoanCore Capital Credit REIT LLC ("LCC REIT"), a related party. LCC REIT is a separate investment vehicle managed by LoanCore Capital, LLC that has certain different investors than the Company. The sale of these loans resulted in a net realized gain of $6,711, which is included in realized gain on sales of loans and other investments in the accompanying consolidated statements of operations and comprehensive income. One of the loans sold to LCC REIT, with an aggregate principal balance of $19,370, as of the date of sale, remains on the Company's consolidated statements of financial condition with a corresponding liability for proceeds received as the sale did not qualify as a sale for accounting purposes because the Company retained the B Note related to the same underlying collateral and the B Note does not receive cash flows on a pari-passu basis with the sold notes.
During the year ended November 30, 2016, five loan participations, with a face value of $211,575 that had previously not qualified for a sale for accounting purposes have been derecognized because the junior loan interests were included in the sale to LCC REIT and the Company no longer has interests in the whole loans. Also, in March 2016, as a result of a junior participation loan payoff, the related senior participation with a face value of $39,000 was derecognized as a loan participation sold as it qualified to be treated as a sale under ASC 860. This resulted in a net realized gain of $224, which is included in realized gains on sales of loans and other investments in the accompanying consolidated statements of operations and comprehensive income.
23
Jefferies LoanCore LLC
Notes to Consolidated Financial Statements - 2014 is not covered by the Independent Auditor's Report included herein
(in thousands – except unit data)
Additionally, during the year ended November 30, 2016, one A-1 Note and one whole loan were sold for $48,500 to the DivCore CLO 2013-1, Ltd. (the "CLO"), a related party. The sale of the whole loan to the CLO resulted in a realized gain of $130, which is included in realized gain on sales of loans and other investments in the accompanying consolidated statements of operations and comprehensive income. As of the date of the sale, the A-1 Note sold to the CLO remained on the Company's consolidated statements of financial condition with a corresponding liability for proceeds received as the sale did not qualify as a sale for accounting purposes because the Company retained a B Note related to the same underlying collateral and the B Note did not receive cash flows on a pari-passu basis with the sold A-1 Note. In November 2016, as a result of the B Note payoff, the related A-1 Note and A-2 Note with a combined face value of $65,000 were derecognized as loan participations sold as they qualified to be treated as a sale under ASC 860. This resulted in a net realized gain of $103, which is included in realized gains on sales of loans and other investments in the accompanying consolidated statements of operations and comprehensive income.
During the year ended November 30, 2015, two whole loans, one A-note and six senior participations were sold for an aggregate of $384,375 to the CLO. The sale of the two whole loans to the CLO resulted in a realized gain of $503, which is included in realized gain on sales of loans and other investments in the accompanying consolidated statements of operations and comprehensive income. The A-note and the six senior participations sold to the CLO remain on the Company's statements of financial condition with corresponding liabilities for proceeds received as they did not qualify as a sale for accounting purposes because the Company retained either a subordinate participating note or junior participation related to the same underlying collateral and the subordinate participating note or junior participation does not receive cash flows on a pari-passu basis with the sold note or participation.
Additionally, for the year ended November 30, 2015, one whole loan was sold to an unaffiliated third party for $7,177 resulting in a realized gain of $351, one other investment was sold to an unaffiliated third party for $14,925, resulting in a realized gain of $75 and one mezzanine loan was sold to an unaffiliated third party for $5,481, resulting in a realized gain of $451. All realized gains are included in realized gain on sales of loans and other investments in the accompanying consolidated statements of operations and comprehensive income.
During the year ended November 30, 2014, fourteen whole loans and one senior participation were sold for an aggregate of $474,087 to the CLO. Additionally, two loans were sold for $13,492 to unaffiliated third parties. The sale of these loans resulted in a net realized gain of $4,706, which is included in realized gain on sales of loans and other investments in the accompanying consolidated statements of operations and comprehensive income. The senior participation sold to the CLO remains on the Company's statement of financial condition with a corresponding liability for proceeds received as the sale did not qualify as a sale for accounting purposes because the Company retained a junior participation related to the same underlying collateral and the junior participation does not receive cash flows on a pari-passu basis with the sold participation.
In June 2012, one loan, although legally transferred in connection with its securitization, did not qualify as a sale for accounting purposes because the Company retained a junior participation in the whole loan, and accordingly remained on the Company's consolidated statements of financial condition with a corresponding liability recorded as loan participations sold. In July 2014, as a result of the junior participation loan payoff, the senior participation of the whole loan was qualified and treated as a sale by the Company under ASC 860. This transaction resulted in the Company
24
Jefferies LoanCore LLC
Notes to Consolidated Financial Statements - 2014 is not covered by the Independent Auditor's Report included herein
(in thousands – except unit data)
recognizing a $1,450 realized gain on loans for the year ended November 30, 2014. Consequently, the Company also reversed a $2,071 unrealized gain on fixed rate loans and a $621 unrealized loss on loan participations sold during the year ended November 30, 2014.
At November 30, 2016 and 2015, three loans sold and one A-note and seven senior participations, respectively with an aggregate fair value of $132,515 and $370,575 remain on the Company's consolidated statements of financial condition with a corresponding liability for the proceeds received recorded as loan participations sold, at fair value. The Company has elected to measure these liabilities at fair value, with subsequent changes in fair value reflected as unrealized gain (loss) on loan participations sold in the accompanying consolidated statements of operations and comprehensive income. The estimated fair value of these liabilities is determined using current secondary market prices for loans with similar coupons, maturities, and credit quality, which approximates the estimated fair value of the liability related to the financial asset retained.
| 5. | Repurchase Facilities |
The Company has entered into multiple committed master repurchase agreements in order to finance its lending activities. As of November 30, 2016, the Company has six committed master repurchase agreements, as outlined in the table below, with multiple counterparties totaling $980,000 of credit capacity. Assets pledged as collateral under these facilities include whole mortgage loans, participation interests in mortgage loans collateralized by first liens on commercial properties and subordinate loans. The Company's repurchase facilities include covenants covering net worth requirements, minimum liquidity levels, and maximum leverage ratios including a ratio of total indebtedness to total assets of .83 to 1. The Company believes it is in compliance with all covenants as of November 30, 2016 and November 30, 2015.
The Company's wholly-owned subsidiary, JLC Warehouse II LLC ("JLC WH II") entered into a $300,000 Master Repurchase Agreement on August 25, 2011. This facility was scheduled to terminate on August 25, 2014 with the option to extend for an additional year, subject to certain conditions. On February 14, 2014, this master repurchase agreement was amended. The facility amount was increased to $350,000 and the termination date was extended to February 14, 2017 with an option to extend for up to two one-year extensions, subject to certain conditions.
The Company's wholly-owned subsidiary, JLC Warehouse IV LLC ("JLC WH IV") entered into a $200,000 Master Repurchase Agreement on December 16, 2013. The facility originally terminated on December 16, 2016. On November 18, 2016, this master repurchase agreement was amended. The facility termination date was extended to December 16, 2017, with an option to extend for two additional one-year periods.
The Company's wholly-owned subsidiary, JLC Warehouse V LLC ("JLC WH V") entered into a $350,000 Master Repurchase Agreement on August 25, 2014. On December 20, 2014, the facility amount was increased to $500,000. On June 3, 2016, the facility amount was decreased to $150,000. The facility terminates on August 25, 2017 and has rolling one-year extension options, subject to certain conditions.
The Company's wholly-owned subsidiaries, JLC Warehouse VI LLC and JLC Mezz VI LLC (collectively "JLC WH VI") entered into a $220,000 Master Repurchase Agreement on January 20, 2015 with Jefferies Funding LLC, a related party. On January 19, 2016, this master repurchase agreement was amended. The facility amount was decreased to $200,000 and the termination
25
Jefferies LoanCore LLC
Notes to Consolidated Financial Statements - 2014 is not covered by the Independent Auditor's Report included herein
(in thousands – except unit data)
date was extended to July 18, 2016, with an option to extend for an additional six months, subject to certain conditions. On June 15, 2016, this master repurchase agreement was amended. The facility amount was decreased to $130,000 and the termination date was extended to January 18, 2017.
The Company's wholly-owned subsidiary, JLC Warehouse VII LLC ("JLC WH VII") entered into a $200,000 Master Repurchase Agreement on July 8, 2015. The facility terminates on July 6, 2016 and has two one-year extension options, subject to certain conditions. On July 12, 2016, this master repurchase agreement was amended. The facility amount was decreased to $150,000 and the termination date was extended to January 12, 2017, with six additional one-month extension options, subject to certain conditions. As of November 30, 2016, the Company has exercised four extension options, which extended the termination date to May 12, 2017.
On August 7, 2013, the Company entered into a Master Repurchase Agreement with Jefferies Funding LLC, a related party. The terms of the agreement are negotiable and determinable on a transaction-by-transaction basis. A transaction is an agreement between JLC ("Seller") and Jefferies Funding LLC ("Buyer") in which the Seller agrees to transfer to the Buyer securities or other assets ("Securities") against the transfer of funds by buyer, with a simultaneous agreement by Buyer to transfer to Seller such Securities at a specified date or on demand, against the transfer of funds by Seller. This Agreement may be terminated by either party upon giving written notice to the other, except that this Agreement shall, notwithstanding such notice, remain applicable to any transactions then outstanding.
26
Jefferies LoanCore LLC
Notes to Consolidated Financial Statements - 2014 is not covered by the Independent Auditor's Report included herein
(in thousands – except unit data)
A summary of the Company's repurchase facilities as of November 30, 2016 and November 30, 2015 were as follows:
At November 30, 2016
| ||||||||||||||||||||||||
Name
| Committed Amount
| Outstanding Amount
| Committed but Unfunded
| Average Interest November 30,
| Advance Rate
| Maturity
| Remaining Extension Options
| Current Balance of Collateral Pledged
| ||||||||||||||||
JLC WH II | $350,000 | - | $350,000 | N/A | N/A | 2/14/2017 | Two additional one-year periods at Company's option subject to an extension fee and other certain requirements | - | ||||||||||||||||
JLC WH IV | $200,000 | - | $200,000 | N/A | N/A | 12/16/2017 | Two additional one-year periods at Company's option subject to an extension fee and other certain requirements | - | ||||||||||||||||
JLC WH V | $150,000 | - | $150,000 | N/A | N/A | 8/25/2017 | Rolling one-year extensions at lender and Company's option subject to an extension fee and other certain requirements | $19,770 | ||||||||||||||||
JLC WH VI | $130,000 | $68,095 | $61,905 | 5.41% | 0-51%, depending on loan collateral | 1/18/2017 | None | $212,672 | ||||||||||||||||
JLC WH VII | $150,000 | - | $150,000 | N/A | N/A | 5/12/2017 | Extension options available through July 5, 2017 at lender and Company's option subject to an extension fee and other certain requirements | - | ||||||||||||||||
JLC |
| No maximum commitment amount
|
|
| -
|
|
| No maximum commitment amount
|
| N/A
| N/A
| N/A
| N/A
|
| -
|
| ||||||||
|
|
|
|
|
|
|
| |||||||||||||||||
| $980,000 | $68,095 | $911,905 | $232,442 | |||||||||||||||||||||
|
|
|
|
|
|
|
| |||||||||||||||||
At November 30, 2015
| ||||||||||||||||||||||||
Name
| Committed Amount
| Outstanding Amount
| Committed but Unfunded
| Average Interest Rate(s) at November 30,
| Advance Rate
| Maturity
| Remaining Extension Options
| Current Balance of Collateral Pledged
| ||||||||||||||||
JLC WH II | $350,000 | - | $350,000 | N/A | N/A | 2/14/2017 | Two additional one-year periods at Company's option subject to an extension fee and other certain requirements | - | ||||||||||||||||
JLC WH IV | $200,000 | $44,600 | $155,400 | 2.83% | 50-70%, depending on loan collateral | 12/16/2016 | Rolling one-year extensions at lender and Company's option subject to an extension fee and other certain requirements | $76,000 | ||||||||||||||||
JLC WH V | $500,000 | $324,982 | $175,018 | 2.79% | 60-80%, depending on loan collateral | 8/25/2017 | Rolling one-year extensions at lender and Company's option subject to an extension fee and other certain requirements | $456,262 | ||||||||||||||||
JLC WH VI | $220,000 | $175,063 | $44,937 | 4.86% | 13-85%, depending on loan collateral | 1/19/2016 | None | $292,273 | ||||||||||||||||
JLC WH VII | $200,000 | $140,421 | $59,579 | 2.44% | 73-75%, depending on loan collateral | 7/6/2016 | Two one-year extensions at lender and Company's option subject to an extension fee and other certain requirements | $190,607 | ||||||||||||||||
JLC |
| No maximum commitment amount
|
|
| -
|
|
| No maximum commitment amount
|
| N/A
| N/A
| N/A
| N/A
|
| -
|
| ||||||||
|
|
|
|
|
|
|
| |||||||||||||||||
| $1,470,000 | $685,066 | $784,934 | $1,015,142 | |||||||||||||||||||||
|
|
|
|
|
|
|
| |||||||||||||||||
27
Jefferies LoanCore LLC
Notes to Consolidated Financial Statements - 2014 is not covered by the Independent Auditor's Report included herein
(in thousands – except unit data)
The repurchase agreements require principal repayments on the financings as principal payments are received on loans held for sale or upon sale or transfer of the loans. All principal and interest payments from borrowers on the Company's loans held for sale are collected by the Company's third-party servicers. Under the terms of the Company's repurchase agreements, all such loan payments are applied toward interest and principal due on the repurchase agreements first with any excess remitted to the Company.
Amortization of deferred financing fees for all repurchase facilities is included as interest expense in the accompanying consolidated statements of operations and comprehensive income and was $4,496, $6,009 and $2,465 for the years ended November 30, 2016, 2015 and 2014, respectively.
| 6. | Credit Facilities |
On March 19, 2014, the Company entered into two committed subscription credit agreements, collateralized by the Company's available commitments, in the aggregate principal amount of $60,000. The Credit Facilities are available on a revolving basis to finance the Company's working capital needs and for general corporate purposes. On March 19, 2015, the Company amended the two committed subscription agreements by extending the initial term to April 19, 2016. On April 18, 2016, the Company amended the two committed subscription agreements by extending the stated maturity date to April 18, 2017. The terms of the facilities are for one year through April 18, 2017, with two one-year extension options, subject to an extension fee. The subscription credit facilities have an upfront fee, an unused fee and a stated interest rate based on a spread to LIBOR or a spread to prime. The Company had $0 and $0 of borrowings outstanding under these facilities at November 30, 2016 and November 30, 2015, respectively. The Company incurred interest expense of $486, $488 and $475 respectively, for the years ended November 30, 2016, 2015 and 2014, including the unused fee.
As of November 30, 2016 and for the year ended November 30, 2016, the Company believes it was in compliance with all covenants, which include maintaining leverage policies detailed in the LLC Agreement and maintaining a sufficient borrowing base consisting of uncalled capital commitments of members to collateralize the credit facilities borrowings.
On May 26, 2015, the Company's wholly-owned subsidiary, Jefferies LoanCore (Europe) 2015-1 DAC, entered into a 51,500 GBP credit facility agreement. The facility terminates on January 9, 2017 and has two six-month extension options. The facility was initially collateralized by a 74,541 GBP whole loan that was originated by Jefferies LoanCore (Europe) 2015-1 DAC. At November 30, 2016, the whole loan current balance was 56,389 GBP. The term of the facility is six months longer than the initial term of the whole loan and required an upfront fee to be paid at closing. The Company had 29,570 GBP outstanding under this facility at November 30, 2016. The interest rate on the facility is three-month LIBOR plus 4.50% as of November 30, 2016. The Company incurred interest expense of $2,370 and $1,807, respectively, for the years ended November 30, 2016 and November 30, 2015. Costs incurred related to the facility that were capitalized to deferred financing fees are amortized over the life of the whole loan as that is the expected term of the facility.
On December 16, 2015, the Company's wholly-owned subsidiary, Jefferies LoanCore (Europe) 2015-2 DAC, entered into a 75,475 GBP credit facility agreement. The facility's termination date is bifurcated and is six months after the maturity dates for each of the underlying loans. The facility was initially collateralized by three whole loans with an aggregate original principal balance of
28
Jefferies LoanCore LLC
Notes to Consolidated Financial Statements - 2014 is not covered by the Independent Auditor's Report included herein
(in thousands – except unit data)
107,821 GBP. At November 30, 2016, the current balance of the whole loans collateralizing the facility was 88,280 GBP. The Company had 53,601 GBP outstanding under this facility at November 30, 2016. The interest rate on the facility is three-month LIBOR plus 4.0% as of November 30, 2016. The Company incurred interest expense of $4,107 for the year ended November 30, 2016. Costs incurred related to the facility that were capitalized to deferred financing fees are amortized over the life of the underlying loans, which is the expected term of the facility.
Amortization of deferred financing fees for the credit facilities is included as interest expense in the accompanying consolidated statements of operations and comprehensive income and was $1,556, $837 and $365, respectively, for the years ended November 30, 2016, 2015 and 2014.
| 7. | Bond Payable |
On May 31, 2013, the Company issued $300,000 of unregistered senior unsecured notes maturing on June 1, 2020 and bearing interest at 6.875%.
The Company may redeem the notes in whole or in part on and after June 1, 2016 at a redemption price equal to the respective percentage of the principal amount of any Notes being redeemed set forth below during the twelve-month period beginning on June 1 of the year indicated below, plus accrued but unpaid interest, thereon, to, but not including, the applicable date of redemption as described in Section 3.07 of the indenture agreement.
Year: Percentage
2016: 105.156%
2017: 103.438%
2018: 101.719%
2019 and thereafter: 100.000%
The Company is subject to various financial and operating covenants, including maintaining a non-funding debt to equity ratio of less than 1.75x and a $300,000 minimum GAAP equity requirement, which may be reduced down by subsequent GAAP losses. The Company believes it was in compliance with all of the debt covenants as of November 30, 2016 and November 30, 2015.
Amortization of bond deferred financing fees included as interest expense in the accompanying consolidated statements of operations and comprehensive income for the years ended November 30, 2016, 2015 and 2014 was $1,196, $1,112 and $1,034, respectively.
| 8. | Related Party Transactions |
LoanCore provides management services to the Company and the Company reimburses LoanCore for its costs allocable to such activities. For the years ended November 30, 2016, 2015 and 2014, compensation, benefits and administrative costs allocable to the Company and reimbursable to LoanCore were $18,098, $29,273 and $19,891, respectively. As of November 30, 2016 and 2015, amounts owed to LoanCore, net of any LoanCore expenses paid by the Company, were $15,024 and $25,351, respectively, and are included in accounts payable and accrued expenses in the accompanying consolidated statements of financial condition.
29
Jefferies LoanCore LLC
Notes to Consolidated Financial Statements - 2014 is not covered by the Independent Auditor's Report included herein
(in thousands – except unit data)
As provided for in the LLC Agreement, the Company engages affiliated entities to provide financial advisory, underwriting, investment banking, loan servicing, insurance, real estate, due diligence, accounting or other services.
The Company has an agreement in place with Divco West Services, LLC ("DWS"), an affiliate, related to the provision of administration, accounting, advisory and financial reporting, which is subject to approval by the Manager. Amounts incurred for services provided by DWS were $240, $240 and $240 for the years ended November 30, 2016, 2015 and 2014, respectively. As of November 30, 2016 and 2015 there were $0 and $0 payable to DWS for these services, respectively.
The Company reimburses DWS for amounts paid on the Company's behalf for certain administrative, IT and payroll-related expenses. The total reimbursements paid to DWS were $959, $707 and $361, for the years ended November 30, 2016, 2015 and 2014, respectively. LoanCore reimburses the Company for its allocable share of the total amount owed to DWS. As of November 30, 2016 and 2015, the amount payable to DWS by the Company, net of any DWS expenses paid by the Company, were $34 and $59, respectively, which are recorded in accounts payable and accrued expenses in the consolidated statements of financial condition.
On October 28, 2011, the Company entered into a service agreement with Jefferies & Company, Inc. ("Jefferies & Co"), as amended, an affiliate of Jefferies, to obtain services for facilities operations, legal and compliance, technology and other services ("Jefferies Services"). Amounts incurred for Jefferies Services for the years ended November 30, 2016, 2015 and 2014 were $145, $184 and $129, respectively. As of November 30, 2016 and 2015, amounts owed to Jefferies & Co net of any LoanCore expenses paid by the Company, totaled $9 and $15, respectively, which were recorded in accounts payable and accrued expenses in the consolidated statements of financial condition.
As discussed in Note 4, during the years ended November 30, 2016, 2015 and 2014, the Company sold multiple loans to LCC REIT and the CLO.
During the years ended November 30, 2016, 2015 and 2014, the Company incurred $1,050, $1,162 and $1,225, respectively, in underwriting fees to Jefferies & Co. related to the securitization of loans. As of November 30, 2016, and November 30, 2015, $0 and $300, respectively, were payable to Jefferies & Co., which is recorded in accounts payable and accrued expenses in the consolidated statements of financial condition.
As discussed in Note 5, on August 7, 2013, the Company entered into a master repurchase agreement with Jefferies Funding LLC. For the years ended November 30, 2016, 2015 and 2014, the Company incurred $0, $569 and $1,243 of interest expense related to this master repurchase agreement, respectively. At November 30, 2016 and 2015, there was no balance outstanding on this master repurchase agreement.
As discussed in Note 5, on January 20, 2015, the Company entered into a master repurchase agreement with Jefferies Funding LLC. For the years ended November 30, 2016, and November 30, 2015, the Company incurred $8,364 and $10,156 of interest expense and fees related to this master repurchase agreement, respectively. At November 30, 2016 and November 30, 2015, there was $68,095 and $175,063 outstanding on this master repurchase agreement, respectively.
30
Jefferies LoanCore LLC
Notes to Consolidated Financial Statements - 2014 is not covered by the Independent Auditor's Report included herein
(in thousands – except unit data)
| 9. | Loans Held for Sale |
The Company has originated and purchased loans mainly consisting of first mortgage and mezzanine positions. The loans are collateralized by various asset types such as office, multi-family, hospitality, industrial, and retail properties. A summary of the Company's loans held for sale at November 30, 2016 and November 30, 2015, respectively, is as follows:
| ||||||||||||||||||
Loan Type
|
Initial Maturity Date
|
November 30,
|
November 30,
|
November 30,
|
November 30,
| |||||||||||||
| ||||||||||||||||||
Fixed Rate | Less than 1 year | - | - | - | - | |||||||||||||
Fixed Rate | 1 to 5 years | - | - | - | - | |||||||||||||
Fixed Rate | 6 to 11 years | 112,250 | 107,146 | 366,080 | 361,475 | |||||||||||||
Sub-total Fixed Rate Loans | 112,250 | 107,146 | 366,080 | 361,475 | ||||||||||||||
| ||||||||||||||||||
Adj Rate | Less than 1 year | 228,424 | 226,730 | 761,016 | 748,740 | |||||||||||||
Adj Rate | 1 to 5 years | 293,365 | 288,611 | 642,651 | 636,578 | |||||||||||||
Adj Rate | 6 to 11 years | - | - | - | - | |||||||||||||
Sub-total Adj Rate Loans | 521,789 | 515,341 | 1,403,667 | 1,385,318 | ||||||||||||||
| ||||||||||||||||||
Fixed Rate Mezz and Subordinate | Less than 1 year | 10,050 | 10,050 | - | - | |||||||||||||
Fixed Rate Mezz and Subordinate | 1 to 5 years | 20,598 | 20,132 | 15,060 | 15,050 | |||||||||||||
Fixed Rate Mezz and Subordinate | 6 to 11 years | 68,986 | 60,279 | 66,140 | 58,576 | |||||||||||||
Sub-total Fixed Rate Mezz and Subordinate Loans | 99,634 | 90,461 | 81,200 | 73,626 | ||||||||||||||
| ||||||||||||||||||
Adj Rate Mezz and Subordinate | Less than 1 year | 48,210 | 47,337 | 142,400 | 141,055 | |||||||||||||
Adj Rate Mezz and Subordinate | 1 to 5 years | 8,450 | 7,836 | 18,500 | 17,682 | |||||||||||||
Adj Rate Mezz and Subordinate | 6 to 11 years | 844 | 844 | 865 | 407 | |||||||||||||
Sub-total Adj Rate Mezz and Subordinate Loans | 57,504 | 56,017 | 161,765 | 159,144 | ||||||||||||||
| ||||||||||||||||||
Total Loans Held for Sale | $ | 791,177 | $ | 768,965 | $ | 2,012,712 | $ | 1,979,563 | ||||||||||
| ||||||||||||||||||
At November 30, 2016 and November 30, 2015, the aggregate fair value of loans in non performing status amounted to $0 and $0, respectively.
During the year ended November 30, 2016, the Company realized $1,000 of impairment on a certain loan with an unpaid principal balance of $9,500 and a fair value of $8,675, which is included
31
Jefferies LoanCore LLC
Notes to Consolidated Financial Statements - 2014 is not covered by the Independent Auditor's Report included herein
(in thousands – except unit data)
in realized gain (loss) on sale of loans and other investments on the consolidated statements of operations and comprehensive income. The Company recorded the $1,000 of impairment due to an adverse change in the expected cash flows, including an amendment to the loan agreement to write-down the loan principal by $1,000. The fair value of the loan's collateral was less than the Company's cost basis of the respective loan and the loan was collateral dependent, meaning the repayment of the loan is expected to be provided solely by the underlying collateral.
On October 30, 2015, the Company originated a floating rate loan in the UK in the original principal amount of 51,370 EUR. The borrower's project is considered to be a VIE because the equity at risk is not sufficient to finance the activities without additional subordinated financial support. The Company is not considered to be the primary beneficiary of the VIE and the Company also determined its floating rate loan should be accounted for as a loan rather than an investment under ASC 310 given that the Company has no decision making authority or power to direct activity, except normal lender protective rights. The Company elected to account for its loan under the fair value option.
| 10. | Real Estate Debt Securities |
Commercial mortgage-backed securities are reported at fair value, given the Company has elected the fair value option, with changes in fair value recorded in unrealized gain on real estate debt securities on the consolidated statements of operations and comprehensive income. The following is a summary of the Company's real estate debt securities at November 30, 2016. The Company did not hold any real estate debt securities in the annual periods prior to the year ended November 30, 2016.
Asset Type | Purchase Date | Outstanding Face Amount | Amortized Cost Basis | Unrealized Gain | Fair Value | Number of Securities | Coupon | Yield | Maturity | |||||||||||||||||||||
CMBS 1 | 2/10/2016 | $ | 15,000 | $ | 9,881 | $ | 514 | $ | 10,395 | 1 | 4.15% | 9.39% | 12/10/2025 | |||||||||||||||||
CMBS 2 | 3/16/2016 | 4,826 | 3,136 | 230 | 3,366 | 1 | 3.89% | 8.90% | 2/10/2026 | |||||||||||||||||||||
As discussed in Note 2, the Company evaluates all of its investments and other interests in entities for consolidation, including the Company's investments in CMBS and the Company's retained interests in securitization transactions, all of which are generally considered to be variable interests in VIEs.
Securitization VIEs consolidated in accordance with ASC 810 are structured as pass through entities that receive principal and interest on the underlying collateral and distribute those payments to the certificate holders. The Company's exposure to the obligations of consolidated securitization VIEs is generally limited to the Company's investment in these entities. The Company is not obligated to provide, nor has the Company provided, any financial support for any of these consolidated structures. The consolidation of the assets and liabilities of securitization VIEs in which the Company is deemed the primary beneficiary has no economic effect on the Company except for the direct beneficial interest securities the Company owns represented by the net interest in securitization VIE disclosed below. The Company consolidated one securitization VIE during October 2016 upon the purchase of the controlling classes of securities in the trust.
32
Jefferies LoanCore LLC
Notes to Consolidated Financial Statements - 2014 is not covered by the Independent Auditor's Report included herein
(in thousands – except unit data)
The following is a summary of the Company's consolidated securitization VIEs as of November 30, 2016.
Loans transferred to securitization VIE | $ | 688,423 | ||
Loans purchased by securitization VIE | 202,518 | |||
MTM adjustment | 4,517 | |||
Principal pay downs | (354) | |||
Interest receivable | 246 | |||
|
| |||
VIE assets, at fair value | 895,350 | |||
VIE liabilities, at fair value | (869,972) | |||
Net interest in the securitization VIE | $ | 25,378 | ||
| 11. | Unfunded Lending Commitments |
The Company enters into commitments to extend variable credit that are legally binding conditional agreements having fixed expirations or termination dates and purposes. These commitments generally require customers to maintain certain credit standards. Collateral requirements and loan-to-value ratios are the same as those for funded transactions and are established based on management's credit assessment of the customer. These commitments may expire without being drawn upon. Therefore, the total commitment amount does not necessarily represent future funding requirements. The outstanding unfunded floating rate commitments to extend credit were approximately $0 and $27,832 as of November 30, 2016 and November 30, 2015, respectively.
| 12. | Other Investments |
On September 11, 2014, the Company originated a loan in the UK in the original principal amount of 13,158 GBP, including future funding commitments, to a third-party borrower. The borrower was considered to be a VIE because it is thinly capitalized; however, the Company is not considered to be the primary beneficiary. Accordingly, the investment is not consolidated. At the time of origination, the Company elected to account for its interest therein under the fair value option. On August 11, 2015, the Company refinanced the original loan with a new 12,500 GBP floating rate loan. The borrower was not considered a VIE and qualified for accounting treatment as a loan which the Company elected to account for under the fair value option.
On October 10, 2014, the Company, through its wholly owned subsidiary, JLC AP PE LLC, originated a $28,500 Preferred Equity Investment ("AP PE") by entering into the operating agreement, along with a subsidiary of Atlas Residential ("Atlas"), of P2 Portfolio Investor Holdings, LLC ("P2 LLC"). AP PE was considered to be a VIE; however, initially, the Company was not considered to be the primary beneficiary. Accordingly, the investment was not consolidated. At the time of investment, the Company elected to account for its interest therein under the fair value option. The Company also originated a $20,000 mezzanine loan in conjunction with the origination of AP PE.
P2 LLC was formed for the purpose of originating and holding equity interests in two multi-family properties located in Orlando, Florida. Under the terms of the P2 LLC operating agreement, JLC AP PE LLC is entitled to a 16.0% preferred return per annum based on its unreturned preferred capital amount balance. Pursuant to the P2 LLC operating agreement, the expected repayment date was November 25, 2014. AP PE was not fully repaid on November 25, 2014, triggering a breach in the operating agreement and an increase in the preferred return rate to 36.0%.
33
Jefferies LoanCore LLC
Notes to Consolidated Financial Statements - 2014 is not covered by the Independent Auditor's Report included herein
(in thousands – except unit data)
From May 12, 2015 through December 31, 2015, the Company entered into a series of settlement agreements with the Atlas borrower that resulted in Atlas posting $9,250 in payments, which were applied to AP PE capital, accrued yield on AP PE and fees. In return, the Atlas borrower was given extension options and economic incentives to repay AP PE, including a waiver of exit fees, spread maintenance on the mezzanine loan and breach interest on the AP PE. During this time, the Atlas borrower controlled the rights to sell or refinance P2 LLC, along with the property management function of the properties, therefore the Company concluded it was not the primary beneficiary of P2 LLC, since it did not have the power to direct the activities of the VIE that most significantly impacted the VIE's economic performance.
On February 24, 2016 (the "consolidation date"), JLC AP PE LLC controlled the rights to sell or refinance P2 LLC and the Company replaced the in-place property manager with a property manager selected by the Company. This gave the Company control of the day-to-day operations at the properties, which is viewed as a key consideration to "control," in addition to the right to sell the underlying properties. As of February 24, 2016, JLC AP PE LLC was deemed to have control and to have more than a potentially insignificant economic interest in the residual return of P2 LLC, therefore, JLC AP PE was determined to be the primary beneficiary, which triggered consolidation treatment under the Company's VIE assessment under Topic 810. On September 12, 2016, the Company sold its interests in P2 LLC. See Note 13 for further details. As of November 30, 2015, the fair value of AP PE was $19,524.
On October 30, 2014, the Company, through its wholly owned subsidiary, JLC HS PE LLC, originated a $15,000 Preferred Equity Investment ("HS PE") by entering into the operating agreements of Student Housing JV Preferred 1201, LLC, Student Housing JV Preferred A-B, LLC and Student Housing JV Preferred P-V, LLC (collectively, the "HS Housing JVs"). The HS Housing JVs were formed for the purpose of originating and holding preferred equity interests in five student housing properties located in various locations within the United States. HS PE is not considered to be a VIE. At the time of investment, the Company elected to account for its interest therein under the fair value option. On February 27, 2015, HS PE was sold to an unaffiliated third party for $14,925 and the Company recognized a realized gain of $75.
The Company recognized a realized loss of $138 on the write-off of one other investment during the year ended November 30, 2015. The write-off was a result of the senior mortgage holder foreclosing on the property and taking title to the collateral on March 3, 2015.
34
Jefferies LoanCore LLC
Notes to Consolidated Financial Statements - 2014 is not covered by the Independent Auditor's Report included herein
(in thousands – except unit data)
The following summarizes the activity in other investments for the period from December 1, 2015 to November 30, 2016:
Balance at December 1, 2015, at fair value | $ | 19,524 | ||||
Contributions to other investments
|
|
-
|
| |||
Proceeds from sale of other investments | - | |||||
Pay downs of other investments
|
|
(618)
|
| |||
Consolidated other investments | (18,912) | |||||
Income from other investments
|
|
-
|
| |||
Distributions from other investments | - | |||||
Origination discount related to other investments paid down
|
|
6
|
| |||
Effect of exchange-rate changes | - | |||||
Sales and transfers of investment interests
|
|
-
|
| |||
Realized loss included in statement of operations | - | |||||
Unrealized loss on other investments |
|
- |
| |||
|
| |||||
Balance at November 30, 2016, at fair value | $ | - | ||||
|
|
| 13. | Real Estate Held for Sale |
P2 LLC
During the period ended February 29, 2016, the Company became primary beneficiary related to P2 LLC, the Company's previously sole equity method investment and a VIE as discussed in Note 12. The underlying properties were currently held for sale by the Company and met the held for sale guidance upon consolidation.
At the consolidation date, the Company recorded the real estate at fair value minus costs to sell and recorded all other related operating assets and liabilities of P2 LLC, including a third party senior mortgage loan. The Company eliminated the mezzanine loan and preferred equity interest previously recorded at a fair value of $19,564 and $18,912, respectively. The following table summarizes the consolidation of P2 LLC and the related effects on the Company's consolidated financial statements upon consolidation date:
Real estate, held for sale | $ | 143,950 | ||
P2 LLC operating assets | 5,684 | |||
Senior mortgage loan | 105,000 | |||
P2 LLC operating liabilities | 3,296 | |||
|
| |||
Net real estate assets acquired, held for sale | 41,338 | |||
Elimination of Company interests: | ||||
Mezzanine loan, at fair value | 19,564 | |||
Preferred equity investment, at fair value | 18,912 | |||
Reversal of unrealized loss upon consolidation of real estate | 948 | |||
|
| |||
Bargain purchase gain upon consolidation | $ | 1,914 | ||
For the year ended November 30, 2016, the Company recorded $525 of income, relating to the Company's interests in P2 LLC before the consolidation date and $1,835 of income from operations of discontinued real estate properties relating to the consolidated results of P2 LLC for year ended November 30, 2016, for the post consolidation date. On September 12, 2016, the Company sold its interests in P2 LLC. This resulted in a net realized gain of $4,455, which is included in realized gain on real estate in the accompanying consolidated statements of operations and comprehensive income.
35
Jefferies LoanCore LLC
Notes to Consolidated Financial Statements - 2014 is not covered by the Independent Auditor's Report included herein
(in thousands – except unit data)
JLC Hunters LLC
On August 5, 2016, the Company took ownership of a real estate asset that had previously collateralized a $12,500 first mortgage loan the Company had originated. The underlying property is currently held for sale by the Company and met the held for sale guidance upon purchase.
During the year ended November 30, 2016 and before the purchase of the real estate asset, the Company recognized $1,375 of unrealized loss on loans held for sale, reversed $3,500 of accumulated unrealized loss and recognized $3,500 of impairment on the first mortgage loan with an unpaid principal balance of $12,500, which is included in realized gain (loss) on sale of loans and other investments on the consolidated statements of operations and comprehensive income. The Company previously realized $3,825 of impairment on the first mortgage loan as of November 30, 2015. The Company recorded the impairment due to an adverse change in the expected cash flows, as the fair value of the loan's collateral is less than the Company's cost basis of the respective loan and the loan is collateral dependent, meaning the repayment of the loan is expected to be provided solely by the underlying collateral. Since the purchase of the real estate asset, the Company has recognized $100 of impairment on the real estate, which is included in realized gain on real estate in the accompanying consolidated statements of operations and comprehensive income.
At the date of purchase, the Company recorded the real estate at fair value minus costs to sell and recorded all other related operating assets and liabilities of JLC Hunters LLC. The Company eliminated the first mortgage loan and B-note interest previously recorded at a fair value of $7,000. The following table summarizes the consolidation of JLC Hunters LLC and the related effects on the Company's consolidated financial statements:
Real estate, held for sale | $ | 6,993 | ||
Hunters operating assets | 150 | |||
|
| |||
Net real estate assets acquired, held for sale | 7,143 | |||
Elimination of Company interests: | ||||
Adjustable rate loan, at fair value | $ | 7,000 | ||
The following table presents additional details related to JLC Hunters LLC's real estate held for sale, related assets and liabilities at November 30, 2016:
Buildings | $ | 6,131 | ||
Land | 762 | |||
Cash | 100 | |||
Accounts receivable and other assets | 50 | |||
|
| |||
Real estate and related assets, held for sale | $ | 7,043 | ||
Future scheduled minimum rents on the JLC Hunters LLC property, exclusive of any renewals, include $51 for the year ended November 30, 2017 and $2 for the year ended November 30, 2018.
36
Jefferies LoanCore LLC
Notes to Consolidated Financial Statements - 2014 is not covered by the Independent Auditor's Report included herein
(in thousands – except unit data)
The consolidated assets of JLC Hunters LLC are included on the consolidated statements of financial condition as real estate and related assets, held for sale. The assets of JLC Hunters LLC are restricted for use for the operations of JLC Hunters LLC and cannot be used to settle unrelated JLC Hunters LLC liabilities of the Company. Also, the creditors of JLC Hunters LLC have no recourse to the Company's general credit.
| 14. | Fair Value |
The following table presents the financial instruments carried on the consolidated statements of financial condition by level within the valuation hierarchy as of November 30, 2016:
| Level 1 | Level 2 | Level 3 | Total | |||||||||||||
As of November 30, 2016 | ||||||||||||||||
Fixed rate loans | $ | - | $ | - | $ | 107,146 | $ | 107,146 | ||||||||
Adjustable rate loans | - | - | 515,341 | 515,341 | ||||||||||||
Fixed rate mezz and subordinate loans | - | - | 90,461 | 90,461 | ||||||||||||
Adjustable rate mezz and subordinate loans | - | - | 56,017 | 56,017 | ||||||||||||
|
|
|
|
|
|
|
| |||||||||
Total loans held for sale | - | - | 768,965 | 768,965 | ||||||||||||
Other investments | - | - | - | - | ||||||||||||
|
|
|
|
|
|
|
| |||||||||
Total investments | - | - | 768,965 | 768,965 | ||||||||||||
Derivative assets | - | 7,457 | 5,807 | 13,264 | ||||||||||||
Derivative liabilities | - | (2,506) | - | (2,506) | ||||||||||||
Real estate debt securities | - | 13,761 | - | 13,761 | ||||||||||||
VIE assets, at fair value | - | 895,350 | - | 895,350 | ||||||||||||
VIE liabilities, at fair value | - | (869,972) | - | (869,972) | ||||||||||||
Loan participations sold | - | - | (132,515) | (132,515) | ||||||||||||
|
|
|
|
|
|
|
| |||||||||
| $ | - | $ | 44,090 | $ | 642,257 | $ | 686,347 | |||||||||
|
|
|
|
|
|
|
| |||||||||
The following table presents the financial instruments carried on the consolidated statements of financial condition by level within the valuation hierarchy as of November 30, 2015:
| Level 1 | Level 2 | Level 3 | Total | |||||||||||||
As of November 30, 2015 | ||||||||||||||||
Fixed rate loans | $ | - | $ | - | $ | 361,475 | $ | 361,475 | ||||||||
Adjustable rate loans | - | - | 1,385,318 | 1,385,318 | ||||||||||||
Fixed rate mezz loans | - | - | 73,626 | 73,626 | ||||||||||||
Adjustable rate mezz and subordinate loans | - | - | 159,144 | 159,144 | ||||||||||||
|
|
|
|
|
|
|
| |||||||||
Total loans held for sale | - | - | 1,979,563 | 1,979,563 | ||||||||||||
Other investments | - | - | 19,524 | 19,524 | ||||||||||||
|
|
|
|
|
|
|
| |||||||||
Total investments | - | - | 1,999,087 | 1,999,087 | ||||||||||||
Derivative assets | - | 4,892 | 8,019 | 12,911 | ||||||||||||
Derivative liabilities | - | (2,660) | - | (2,660) | ||||||||||||
Loan participations sold | - | - | (370,575) | (370,575) | ||||||||||||
|
|
|
|
|
|
|
| |||||||||
| $ | - | $ | 2,232 | $ | 1,636,531 | $ | 1,638,763 | |||||||||
|
|
|
|
|
|
|
| |||||||||
37
Jefferies LoanCore LLC
Notes to Consolidated Financial Statements - 2014 is not covered by the Independent Auditor's Report included herein
(in thousands – except unit data)
Level 3 Fair Value Asset and Liability Input Sensitivity
Changes in unobservable inputs may have a significant impact on fair value. Certain of the unobservable inputs will, in isolation, have a directionally consistent impact on the fair value of the instrument for a given change in that input. Alternatively, the fair value may move in the opposite direction for a given change in another input. In general, an increase in the discount rate and credit spreads, in isolation, would result in a decrease in the fair value measurement and a decrease in these same inputs would result in an increase in the fair value measurement.
The following table shows quantitative information about significant unobservable inputs related to the Level 3 fair value measurements at November 30, 2016 and November 30, 2015:
| ||||||||||||||||||||||||||
| At November 30, 2016 | WEIGHTED AVERAGE | |||||||||||||||||||||||||
| ||||||||||||||||||||||||||
OUTSTANDING FACE AMOUNT | COST BASIS | FAIR VALUE | VALUATION TECHNIQUE | PROFIT RANGE | YIELD % | REMAINING MATURITY (YEARS) | ||||||||||||||||||||
| ||||||||||||||||||||||||||
Assets | ||||||||||||||||||||||||||
| ||||||||||||||||||||||||||
Fixed rate loans held for sale | $ | 112,250 | $ | 112,250 | $ | 107,146 | Discounted cash flows (1) | 1.00% - 4.00% (2) | 4.98% | 9.93 | ||||||||||||||||
Mezzanine and subordinate loans held for sale | 157,138 | 141,437 | 146,478 | Discounted cash flows | N/A | 11.90% | 3.99 | |||||||||||||||||||
Adjustable rate loans held for sale - US | 279,760 | 277,647 | 276,422 | Discounted cash flows | 0.00% - 1.00% | 8.91% (4) | 1.23 (4) | |||||||||||||||||||
Adjustable rate loans held for sale - Europe | 242,029 | 238,016 | 238,919 | Discounted cash flows | 0.00% - 1.00% | 10.96% | 0.76 | |||||||||||||||||||
Loan participations sold - floating | (132,515 | ) | (132,107 | ) | (132,515 | ) | Discounted cash flows | 0.00% - 1.00% | N/A | 0.80 | ||||||||||||||||
| ||||||||||||||||||||||||||
| At November 30, 2015 | WEIGHTED AVERAGE | |||||||||||||||||||||||||
| ||||||||||||||||||||||||||
| OUTSTANDING FACE AMOUNT | COST BASIS | FAIR VALUE | VALUATION TECHNIQUE | PROFIT RANGE | YIELD % | REMAINING MATURITY (YEARS) | ||||||||||||||||||||
| ||||||||||||||||||||||||||
Assets | ||||||||||||||||||||||||||
| ||||||||||||||||||||||||||
Fixed rate loans held for sale | $ | 366,080 | $ | 366,225 | $ | 361,475 | Discounted cash flows (1) | 0.75% - 3.00% (2) | 4.70% | 9.93 | ||||||||||||||||
Mezzanine and subordinate loans held for sale | 242,965 | 225,663 | 232,770 | Discounted cash flows | N/A | 11.53% | 2.98 | |||||||||||||||||||
Adjustable rate loans held for sale - US | 1,137,481 | 1,123,150 | 1,122,345 | Discounted cash flows | 0.00% - 1.00% | 6.97% (5) | 1.31 (5) | |||||||||||||||||||
Adjustable rate loans held for sale - Europe | 266,186 | 261,906 | 262,973 | Discounted cash flows | 0.00% - 1.00% | 10.44% | 0.76 | |||||||||||||||||||
Other investments | - | 20,436 | 19,524 | Discounted cash flows (3) | (3) | (3) | N/A | |||||||||||||||||||
Loan participations sold - floating | (370,575 | ) | (368,212 | ) | (370,575 | ) | Discounted cash flows | 0.00% - 1.00% | N/A | 0.90 | ||||||||||||||||
| ||||||||||||||||||||||||||
| (1) | Fixed rate loans held for sale are measured at fair value using a hypothetical securitization model utilizing market data from recent securitization spreads and pricing. |
| (2) | Represents profit margin range on hypothetical securitization scenario on fixed rate loans. |
| (3) | The Company believes fair value approximates the estimated future cash flows the Company will receive from each other investment. |
| (4) | The Company has excluded three A-notes with an aggregate face amount of $132,515 from the calculation of Yield and Remaining Maturity as they were legally transferred in connection with sales, but did not qualify as sales for accounting purposes as described in Note 4, and therefore, still remain on the Company's consolidated statements of financial condition. |
| (5) | The Company has excluded one A-note and seven senior participations, with an aggregate face amount of $370,575 from the calculation of Yield and Remaining Maturity as they were legally transferred in connection with sales, but did not qualify as sales for accounting purposes as described in Note 4, and therefore, still remain on the Company's consolidated statements of financial condition. |
38
Jefferies LoanCore LLC
Notes to Consolidated Financial Statements - 2014 is not covered by the Independent Auditor's Report included herein
(in thousands – except unit data)
The following is a reconciliation of the beginning and ending balances for loans held for sale and other investments, as well as loan participations sold measured at estimated fair value on a recurring basis using significant unobservable inputs (Level 3) during the year ended November 30, 2016 and November 30, 2015:
| Loans held for sale, at fair value | ||||||||
2016 | 2015 | |||||||
Balance at November 30, 2015 and 2014 | $ | 1,979,563 | $ | 1,417,133 | ||||
Purchases and fundings of loans held for sale, including capitalized interest | 1,159,275 | 2,650,528 | ||||||
Principal paydowns on loans held for sale | (291,488) | (419,375) | ||||||
Proceeds from sale of loans held for sale | (1,019,396) | (1,683,724) | ||||||
Origination discount related to loans and other investments paid off | 4,704 | 3,198 | ||||||
Real estate consolidation | (26,566) | - | ||||||
Loans transferred to securitization VIE | (688,423) | - | ||||||
Unrealized gain (loss) on loans included in statement of operations | 17,878 | (14,750) | ||||||
Effect of exchange rate changes | (43,360) | (4,290) | ||||||
Realized gain (loss) included in statement of operations | (792) | 30,843 | ||||||
Reversal of loan participations sold | (315,575) | - | ||||||
Principal paydowns on loan participations sold | (6,855) | - | ||||||
|
|
|
| |||||
Balance at November 30, 2016 and 2015 | $ | 768,965 | $ | 1,979,563 | ||||
|
|
|
| |||||
Loan participations sold, at fair value | ||||||||
2016 | 2015 | |||||||
Balance at November 30, 2015 and 2014 | $ | 370,575 | $ | 41,500 | ||||
Proceeds from loan participations sold | 84,370 | 329,075 | ||||||
Reversal of loan participations sold | (315,575) | - | ||||||
Principal paydowns on loan participations sold | (6,855) | - | ||||||
|
|
|
| |||||
Balance at November 30, 2016 and 2015 | $ | 132,515 | $ | 370,575 | ||||
|
|
|
| |||||
Other investments, at fair value | ||||||||
2016 | 2015 | |||||||
Balance at November 30, 2015 and 2014 | $ | 19,524 | $ | 49,190 | ||||
Contributions to other investments | - | 9,736 | ||||||
Proceeds from sale of other investments | - | (14,925) | ||||||
Real estate consolidation | (18,912) | - | ||||||
Pay downs of other investments | (618) | (24,661) | ||||||
Income from other investments | - | 4,695 | ||||||
Distributions from other investments | - | (3,802) | ||||||
Origination discount related to other investments paid down | 6 | 247 | ||||||
Effect of exchange-rate changes | - | 19 | ||||||
Realized loss included in statement of operations | - | (63) | ||||||
Unrealized loss on other investments | - | (912) | ||||||
|
|
|
| |||||
Balance at November 30, 2016 and 2015 | $ | - | $ | 19,524 | ||||
|
|
|
| |||||
39
Jefferies LoanCore LLC
Notes to Consolidated Financial Statements - 2014 is not covered by the Independent Auditor's Report included herein
(in thousands – except unit data)
The following table presents the Company's investments and loan participations sold carried at estimated fair value on a recurring basis in the consolidated statements of financial condition as of November 30, 2016 and November 30, 2015:
| November 30, 2016 | November 30, 2015 | |||||||||||||||||||||||||||||||
| Asset Type | Outstanding Face Amount | Cost Basis | Unrealized Gain (Loss) | Fair Value | Outstanding Face Amount | Cost Basis | Unrealized Gain (Loss) | Fair Value | ||||||||||||||||||||||||
Fixed rate loans | $ | 112,250 | $ | 112,250 | $ | (5,104) | $ | 107,146 | $ | 366,080 | $ | 366,225 | $ | (4,750) | $ | 361,475 | ||||||||||||||||
Adjustable rate loans | 521,789 | 515,663 | (322) | 515,341 | 1,403,667 | 1,385,056 | 262 | 1,385,318 | ||||||||||||||||||||||||
Fixed rate mezz and subordinate loans | 99,634 | 86,233 | 4,228 | 90,461 | 81,200 | 67,995 | 5,631 | 73,626 | ||||||||||||||||||||||||
Adjustable rate mezz and subordinate loans | 57,504 | 55,204 | 813 | 56,017 | 161,765 | 157,668 | 1,476 | 159,144 | ||||||||||||||||||||||||
|
|
|
|
|
|
|
|
|
|
|
|
|
|
|
| |||||||||||||||||
Total loans held for sale | $ | 791,177 | $ | 769,350 | $ | (385) | $ | 768,965 | $ | 2,012,712 | $ | 1,976,944 | $ | 2,619 | $ | 1,979,563 | ||||||||||||||||
Other investments | - | - | - | - | - | 20,436 | (912) | 19,524 | ||||||||||||||||||||||||
Real estate debt securities | 19,826 | 13,017 | 744 | 13,761 | - | - | - | - | ||||||||||||||||||||||||
Loan participations sold | (132,515) | (132,107) | (408) | (132,515) | (370,575) | (368,212) | (2,363) | (370,575) | ||||||||||||||||||||||||
The following table summarizes the effect of the Company's investments on the consolidated statements of operations and comprehensive income for the years ended November 30, 2016, 2015 and 2014:
| Amount of Gain or | ||||||||||||||
| (Loss) Recognized in Earnings | ||||||||||||||
| Location of | For the Year | For the Year | For the Year | |||||||||||
| Gain or (Loss) | ended | ended | ended | |||||||||||
| Recognized in | November 30, | November 30, | November 30, | |||||||||||
| Asset Type | Earnings | 2016 | 2015 | 2014 | ||||||||||
Fixed rate loans | Unrealized gain (loss) on loans held for sale and other investments | $ | 20,528 | $ | (11,581) | $ | 6,023 | |||||||
Fixed rate loans | Realized gain (loss) on sales of loans and other investments (1) | (2,210) | 34,811 | 29,867 | ||||||||||
Adjustable rate loans | Unrealized gain (loss) on loans held for sale and other investments | (584) | (3,973) | (1,092) | ||||||||||
Adjustable rate loans | Realized gain (loss) on sales of loans and other investments | 625 | (2,971) | 4,500 | ||||||||||
Fixed rate mezz and subordinate loans | Unrealized gain (loss) on loans held for sale and other investments | (1,403) | (100) | 3,549 | ||||||||||
Fixed rate mezz and subordinate loans | Realized gain (loss) on sales of loans and other investments | - | (997) | 205 | ||||||||||
Adjustable rate mezz and subordinate loans | Unrealized gain (loss) on loans held for sale and other investments | (663) | 904 | 309 | ||||||||||
Adjustable rate mezz and subordinate loans | Realized gain on sales of loans and other investments | 793 | - | - | ||||||||||
|
|
|
|
|
| |||||||||
Total loans held for sale | $ | 17,086 | $ | 16,093 | $ | 43,361 | ||||||||
Other investments | Unrealized gain (loss) on loans held for sale and other investments | 912 | (912) | - | ||||||||||
Other investments | Realized loss on sales of loans and other investments | - | (63) | - | ||||||||||
|
|
|
|
|
| |||||||||
Total other investments | $ | 912 | $ | (975) | $ | - | ||||||||
| ||||||||||||||
| (1) | Realized gain on sales of loans and other investments for the year ended November, 30, 2015 includes $404 of realized loss on interest rate locks. |
40
Jefferies LoanCore LLC
Notes to Consolidated Financial Statements - 2014 is not covered by the Independent Auditor's Report included herein
(in thousands – except unit data)
Loans held for sale are measured at estimated fair value based upon a hypothetical securitization model utilizing data from recent securitization spreads and pricing, the application of discount rates to estimated future cash flows using market yields or other valuation methodologies. These valuations are adjusted to consider loan pricing adjustments specific to each loan. Considerable judgment is necessary to interpret market data and develop estimated fair value. Accordingly, estimated fair values are not necessarily indicative of the amount the Company could realize on disposition of the loans. The use of different market assumptions or estimation methodologies could have a material effect on the estimated fair value amounts.
The Company has not elected the fair value option related to its bond payable, repurchase facilities and credit facilities. The amortized cost basis of the repurchase facilities and credit facilities presented on the face of the consolidated statements of financial condition at November 30, 2016 and November 30, 2015 approximates fair value, given the short-term nature and interest rate resets of each facility. The estimated fair value of the liability related to bond payable at November 30, 2016 is based on the "ask" price at the last trading day of the period presented. The "ask" price at November 30, 2016 was 95.75, resulting in a fair value of the bond payable of $287,250. The "ask" price at November 30, 2015 was 98.25, resulting in a fair value of the bond payable of $294,750.
The carrying value of other financial instruments, including cash and cash equivalents, restricted cash, accrued interest receivable and accounts payable, approximate the fair values of the instruments due to their short-term nature.
As discussed above, the Company measures the assets and liabilities of consolidated securitization VIEs at fair value pursuant to the Company's election of the fair value option. The securitization VIEs in which the Company invests are "static"; that is, no reinvestment is permitted, and there is no active management of the underlying assets. In determining the fair value of the assets and liabilities of the securitization VIE, the Company maximizes the use of observable inputs over unobservable inputs. The principal market for selling CMBS assets is the securitization market where the market participant is considered to be a CMBS trust. This methodology results in the fair value of the assets of a static CMBS trust being equal to the fair value of its liabilities.
| 15. | Derivative Instruments |
The Company uses derivatives and interest rate lock commitments primarily to manage the estimated fair value variability of fixed rate loans held for sale caused by market interest rate fluctuations. At times, interest rate swaps are pledged as collateral in the Company's master repurchase agreements. The Company uses foreign currency forwards primarily to manage foreign currency fluctuations.
Goldman Sachs International, Jefferies Derivative Products, LLC, a related party, Jefferies Financial Services, Inc., a related party, Credit Suisse Securities (USA) LLC and Wells Fargo Securities LLC were the counterparties on all of the Company's interest rate swaps, foreign currency forwards and corporate credit index positions as of November 30, 2016 and November 30, 2015 and during the years then ended.
In valuing its derivatives, the Company considers the creditworthiness of both the Company and its counterparties, along with collateral provisions contained in each derivative agreement, from the perspective of both the Company and its counterparties. All of the Company's interest rate swaps,
41
Jefferies LoanCore LLC
Notes to Consolidated Financial Statements - 2014 is not covered by the Independent Auditor's Report included herein
(in thousands – except unit data)
corporate credit index hedges and foreign currency forward contracts are either subject to bilateral collateral arrangements or clearing in accordance with the Dodd-Frank Wall Street Reform and Consumer Protection Act of 2010 (the "Dodd Frank Act"). For its derivatives subject to bilateral collateral arrangements, the Company has netting arrangements in place with all derivative counterparties pursuant to the standard documentation developed by the International Swap and Derivatives Association ("ISDA"). For the swaps and credit derivatives cleared under the Dodd Frank Act, a Central Clearing Party ("CCP") stands between the Company and its over-the-counter derivative counterparties. In order to access clearing, the Company has entered into clearing agreements with Future Commission Merchants ("FCMs"). The Company is permitted to net all exposure with a common CCP and FCM under enforceable netting agreements, where a legal right of offset exists. Consequently, no credit valuation adjustment was made in determining the fair value of the Company's derivatives.
On September 11, 2014, the Company originated a loan in the UK in the original principal amount of 13,158 GBP, including future funding commitments, to a third-party borrower. This loan was refinanced by the Company on August 11, 2015. The new floating rate loan had an original principal amount of 12,500 GBP, including future funding commitments. As part of the underlying loan agreement, the Company was given a share warrant instrument, which enables the Company to subscribe for shares representing 33.3% of the borrower's ordinary issued share capital. This share warrant instrument is freely transferable and is accounted for as a bifurcated derivative, rather than an embedded derivative, given the terms of the agreement. The share warrants have a fair value of $1,519 and $1,700 as of November 30, 2016 and November 30, 2015, respectively. This valuation is based on the Company's internal analysis, which was primarily driven by the net asset value of the share capital at November 30, 2016, assuming a hypothetical liquidation of all assets and liabilities and considering control and liquidity restraints of the instrument.
On January 21, 2015, the Company originated a B-note loan in the UK in the original principal amount of 39,967 GBP, to a third-party borrower. The Company upsized the loan by 13,251 GBP on September 4, 2015, increasing the loan balance to 53,218 GBP. This loan was refinanced by the Company on December 16, 2015. The two new floating rate loans had a combined original principal amount of 96,675 GBP. As part of the original underlying loan agreement, the Company was given a share warrant instrument, which enables the Company to subscribe for shares representing 25.0% of the borrower's ordinary issued share capital. This share warrant instrument is freely transferable and is accounted for as a bifurcated derivative, rather than an embedded derivative, given the terms of the agreement. The share warrants have a fair value of $1,985 and $4,202 as of November 30, 2016 and November 30, 2015, respectively. This valuation is based on the Company's internal analysis, which was primarily driven by the net asset value of the share capital at November 30, 2016, assuming a hypothetical liquidation of all assets and liabilities and considering control and liquidity restraints of the instrument.
On May 26, 2015, the Company originated a floating rate loan in the UK in the original principal amount of 74,542 GBP, to a third-party borrower. As part of the underlying loan agreement, the Company was given a share warrant instrument, which enables the Company to subscribe for shares representing 25.0% of the borrower's ordinary issued share capital. This share warrant instrument is freely transferable and is accounted for as a bifurcated derivative, rather than an embedded derivative, given the terms of the agreement. The share warrants have a fair value of $2,303 and $2,117 as of November 30, 2016 and November 30, 2015, respectively. This valuation is based on the Company's internal analysis, which was primarily driven by the net asset value of the share capital at November 30, 2016, assuming a hypothetical liquidation of all assets and liabilities and considering control and liquidity restraints of the instrument.
42
Jefferies LoanCore LLC
Notes to Consolidated Financial Statements - 2014 is not covered by the Independent Auditor's Report included herein
(in thousands – except unit data)
The following table is a summary of notional amounts and estimated fair values of derivative instruments as of November 30, 2016 and November 30, 2015:
| Notional as of | Fair Value as of November 30, 2016 | Notional as of | Fair Value as of November 30, 2015 | |||||||||||||||||||||
| November 30, | Asset | Liability | November 30, | Asset | Liability | |||||||||||||||||||
| Derivative Contract Type | 2016 | Derivatives | Derivatives | 2015 | Derivatives | Derivatives | ||||||||||||||||||
Interest rate swaps (1) | $ | 119,013 | $ | 5,938 | $ | - | $ | 313,600 | $ | 2,278 | $ | (1,302) | ||||||||||||
|
|
|
|
|
|
|
|
|
|
|
| |||||||||||||
Total swaps | 119,013 | 5,938 | - | 313,600 | 2,278 | (1,302) | ||||||||||||||||||
|
|
|
|
|
|
|
|
|
|
|
| |||||||||||||
Corporate credit index (2) | - | - | - | 141,000 | - | (1,358) | ||||||||||||||||||
|
|
|
|
|
|
|
|
|
|
|
| |||||||||||||
Total index position | - | - | - | 141,000 | - | (1,358) | ||||||||||||||||||
|
|
|
|
|
|
|
|
|
|
|
| |||||||||||||
FX forward contracts (3) | 152,112 | 1,519 | (2,506) | 200,604 | 2,614 | - | ||||||||||||||||||
|
|
|
|
|
|
|
|
|
|
|
| |||||||||||||
Total FX forward contract | 152,112 | 1,519 | (2,506) | 200,604 | 2,614 | - | ||||||||||||||||||
|
|
|
|
|
|
|
|
|
|
|
| |||||||||||||
Other derivatives (4) | - | 5,807 | - | - | 8,019 | - | ||||||||||||||||||
|
|
|
|
|
|
|
|
|
|
|
| |||||||||||||
Total other derivatives | - | 5,807 | - | - | 8,019 | - | ||||||||||||||||||
|
|
|
|
|
|
|
|
|
|
|
| |||||||||||||
Total derivatives | $ | 271,125 | $ | 13,264 | $ | (2,506) | $ | 655,204 | $ | 12,911 | $ | (2,660) | ||||||||||||
|
|
|
|
|
|
|
|
|
|
|
| |||||||||||||
Note:
| 1) | Interest rate swaps are included in derivative assets and derivative liabilities on the consolidated statements of financial condition as of November 30, 2016 and November 30, 2015. |
| 2) | Corporate credit index is included in derivative liabilities on the consolidated statements of financial condition as of November 30, 2016 and November 30, 2015. |
| 3) | FX forward contracts are included in derivative assets and liabilities on the consolidated statements of financial condition as of November 30, 2016 and November 30, 2015, respectively. |
| 4) | Other derivatives are included in derivative assets on the consolidated statements of financial condition as of November 30, 2016 and November 30, 2015. |
43
Jefferies LoanCore LLC
Notes to Consolidated Financial Statements - 2014 is not covered by the Independent Auditor's Report included herein
(in thousands – except unit data)
The effect of the Company's derivative instruments on the consolidated statements of operations and comprehensive income for the years ended November 30, 2016, 2015 and 2014 was as follows:
| Amount of Gain or (Loss) Recognized in Earnings | ||||||||||||||||
| Location of | For the Year | For the Year | For the Year | |||||||||||||
| Gain or (Loss) | ended | ended | ended | |||||||||||||
| Recognized in | November 30, | November 30, | November 30, | |||||||||||||
| Derivative Type | Earnings | 2016 | 2015 | 2014 | ||||||||||||
| Unrealized gain (loss) on | ||||||||||||||||
Interest rate swaps | derivative instruments | $ | 4,962 | $ | 4,956 | $ | (3,305) | |||||||||
| Realized gain (loss) on | ||||||||||||||||
Interest rate swaps | derivative instruments | (10,302) | 1,654 | (8,115) | ||||||||||||
| Unrealized gain (loss) on | ||||||||||||||||
Corporate credit index | derivative instruments | 365 | (180) | 580 | ||||||||||||
| Realized loss on | ||||||||||||||||
Corporate credit index | derivative instruments | (2,458) | (56) | (3,177) | ||||||||||||
| Realized loss on sales of loans | ||||||||||||||||
Interest rate locks | held for sale and other investments (1) | - | (404) | - | ||||||||||||
| Realized loss on | ||||||||||||||||
CMBX | derivative instruments | - | - | (576) | ||||||||||||
| Unrealized gain (loss) on | ||||||||||||||||
FX forward contracts | derivative instruments | (3,601) | 2,377 | 237 | ||||||||||||
| Realized gain on | ||||||||||||||||
FX forward contracts | derivative instruments | 21,375 | 2,406 | 365 | ||||||||||||
| Unrealized gain (loss) on | ||||||||||||||||
Other derivatives | derivative instruments | (937) | 8,167 | - | ||||||||||||
| Realized gain on | ||||||||||||||||
Other derivatives | derivative instruments | - | 128 | - | ||||||||||||
|
|
|
|
|
| |||||||||||
Total derivatives | $ | 9,404 | $ | 19,048 | $ | (13,991) | ||||||||||
|
|
|
|
|
| |||||||||||
| ||||||||||||||||
| (1) | Realized loss on interest rate locks of $404 is reflected in realized gain on sales of loans and other investments in the consolidated statements of operations and comprehensive income. |
| 16. | Offsetting Assets and Liabilities |
Credit Risk-Related Contingent Features
The Company has agreements with certain of its derivative counterparties that contain a provision whereby if the Company defaults on certain of its indebtedness, the Company could also be declared in default on its derivatives, resulting in an acceleration of payment under the derivatives. As of November 30, 2016 and November 30, 2015, the Company was in compliance with these requirements and not in default on its indebtedness. As of November 30, 2016 and November 30, 2015, there was $13,222 and $13,922 of cash collateral held by the derivative counterparties for these derivatives, respectively. No additional cash is required to be posted if the acceleration of payment under the derivatives was triggered.
The following tables present both gross and net information about derivatives and other instruments eligible for offset in the consolidated statements of financial condition as of November 30, 2016 and November 30, 2015. The Company's accounting policy is to record derivative asset and liability positions on a gross basis, therefore the following table presents the gross derivative asset and liability positions recorded on the consolidated statements of financial condition while also disclosing the eligible amounts of financial instruments and cash collateral to the extent those
44
Jefferies LoanCore LLC
Notes to Consolidated Financial Statements - 2014 is not covered by the Independent Auditor's Report included herein
(in thousands – except unit data)
amounts could offset the gross amount of derivative asset and liability positions. The actual amounts of collateral posted by or received from counterparties may be in excess of the amounts disclosed in the following table as the following only discloses amounts eligible to be offset to the extent of the recorded gross derivative positions.
| As of November 30, 2016 | ||||||||||||||||||||||||
| Offsetting of Financial Assets and Derivative Assets | ||||||||||||||||||||||||
| Gross amounts | Gross amounts offset in the | Net amounts of assets presented | Gross amounts not offset in the statement of financial condition | |||||||||||||||||||||
Description | of recognized assets | statement of financial condition | in the statement of financial condition | Financial Instruments | Cash collateral received (2) | Net amount | ||||||||||||||||||
Derivatives | $ | 13,264 | $ | - | $ | 13,264 | $ | - | $ | - | $ | 13,264 | ||||||||||||
|
|
|
|
|
|
|
|
|
|
|
| |||||||||||||
Total | $ | 13,264 | $ | - | $ | 13,264 | $ | - | $ | - | $ | 13,264 | ||||||||||||
|
|
|
|
|
|
|
|
|
|
|
| |||||||||||||
| As of November 30, 2016 | ||||||||||||||||||||||||
| Offsetting of Financial Liabilities and Derivative Liabilities | ||||||||||||||||||||||||
| Gross amounts | Gross amounts offset in the | Net amounts of liabilities presented | Gross amounts not offset in the statement of financial condition | |||||||||||||||||||||
Description | of recognized liabilities | statement of financial condition | in the statement of financial condition | Financial Instruments | Cash collateral posted / (received)(1)(2) | Net amount | ||||||||||||||||||
Derivatives | $ | 2,506 | $ | - | $ | 2,506 | $ | - | $ | 2,506 | $ | - | ||||||||||||
Repurchase Agreements | 68,095 | - | 68,095 | 68,095 | - | - | ||||||||||||||||||
|
|
|
|
|
|
|
|
|
|
|
| |||||||||||||
Total | $ | 70,601 | $ | - | $ | 70,601 | $ | 68,095 | $ | 2,506 | $ | - | ||||||||||||
|
|
|
|
|
|
|
|
|
|
|
| |||||||||||||
| As of November 30, 2015 | ||||||||||||||||||||||||
| Offsetting of Financial Assets and Derivative Assets | ||||||||||||||||||||||||
| Gross amounts | Gross amounts offset in the | Net amounts of assets presented | Gross amounts not offset in the statement of financial condition | |||||||||||||||||||||
Description | of recognized assets | statement of financial condition | in the statement of financial condition | Financial Instruments | Cash collateral received (2) | Net amount | ||||||||||||||||||
Derivatives | $ | 12,911 | $ | - | $ | 12,911 | $ | - | $ | - | $ | 12,911 | ||||||||||||
|
|
|
|
|
|
|
|
|
|
|
| |||||||||||||
Total | $ | 12,911 | $ | - | $ | 12,911 | $ | - | $ | - | $ | 12,911 | ||||||||||||
|
|
|
|
|
|
|
|
|
|
|
| |||||||||||||
| As of November 30, 2015 | ||||||||||||||||||||||||
Offsetting of Financial Liabilities and Derivative Liabilities | ||||||||||||||||||||||||
| Gross amounts | Gross amounts offset in the | Net amounts of liabilities presented | Gross amounts not offset in the statement of financial condition | |||||||||||||||||||||
Description | of recognized liabilities | statement of financial condition | in the statement of financial condition | Financial Instruments | Cash collateral posted / (received)(1)(2) | Net amount | ||||||||||||||||||
Derivatives | $ | 2,660 | $ | - | $ | 2,660 | $ | - | $ | 2,660 | $ | - | ||||||||||||
Repurchase Agreements | 685,066 | - | 685,066 | 685,066 | - | - | ||||||||||||||||||
|
|
|
|
|
|
|
|
|
|
|
| |||||||||||||
Total | $ | 687,726 | $ | - | $ | 687,726 | $ | 685,066 | $ | 2,660 | $ | - | ||||||||||||
|
|
|
|
|
|
|
|
|
|
|
| |||||||||||||
| (1) | Included in restricted cash on consolidated statements of financial condition. |
| (2) | The cash collateral not offset in the consolidated statements of financial condition may exceed any gross derivative liability position balance. In that case, the total amount that is reported as cash collateral not offset in the balance sheet is limited to the gross derivative liability position balance. In the case of a gross derivative asset position balance, no collateral posted by the Company will be shown in the above table. |
Master netting agreements that the Company has entered into with its derivative and repurchase agreement counterparties allow for netting of the same transaction, in the same currency, on the same date. Assets, liabilities, and collateral subject to master netting agreements as of November 30, 2016 and November 30, 2015 are disclosed in the tables above. The Company presents its derivative and repurchase agreements gross on the consolidated statements of financial condition.
45
Jefferies LoanCore LLC
Notes to Consolidated Financial Statements - 2014 is not covered by the Independent Auditor's Report included herein
(in thousands – except unit data)
| 17. | Commitments |
Incentive Compensation
Employees of the Company may be eligible for incentive compensation based upon the performance of the Company per individual employment agreements. The amount of the incentive compensation pool in any fiscal year is based upon a fixed percentage of net income adjusted for certain operating expenses and excess compensation paid in prior periods, subject to Available Cash, as defined. Under these agreements, the Members may approve an increase in the amount of the incentive compensation pool earned in any fiscal year. The amounts of accrued incentive compensation included in compensation and benefits expense for the years ended November 30, 2016, 2015 and 2014 were $9,875, $18,857 and $8,789, respectively.
After allocation of the incentive compensation pool under these arrangements, certain officers are subject to a deferral of 20% of any annual incentive compensation allocated to them in a fiscal year, which vests over a three-year period following the fiscal year that the incentive compensation was earned, subject to additional tenure related provisions that may reduce that three-year deferral period. As of November 30, 2016 all deferred compensation is fully vested due to the aforementioned additional tenure related provisions. Deferred balances accrue a 7% rate of interest during the deferral period. For the years ended November 30, 2016, 2015 and 2014, $321, $413 and $386 of interest was accrued and recognized in interest expense, respectively. Incentive compensation that was deferred for the years ended November 30, 2016, 2015 and 2014 was $415, $1,217 and $0, respectively. For the years ended November 30, 2016, 2015 and 2014, $905, $1,773 and $2,776 were recognized as deferred compensation expense, respectively. The deferred amount of the incentive compensation is recognized in compensation and benefits expense on a straight-line basis over the vesting period. As of November 30, 2016 and 2015, there was $0 and $490 of unamortized deferred compensation expense, respectively.
Obligations under Lease Agreements
The Company is the lessee of office spaces located in Greenwich, Connecticut, Los Angeles, California, Irvine, California, Atlanta, Georgia, Chicago, Illinois and the UK. The following table presents minimum future rental payments under these contractual lease obligations as of November 30, 2016:
| Years Ending November 30: | ||||
2017 | $ | 663 | ||
2018 | 660 | |||
2019 | 643 | |||
2020 | 529 | |||
2021 | 505 | |||
Thereafter | 1,388 | |||
Total minimum lease payments | $ | 4,388 | ||
46
Jefferies LoanCore LLC
Notes to Consolidated Financial Statements - 2014 is not covered by the Independent Auditor's Report included herein
(in thousands – except unit data)
| 18. | Subsequent Events |
On January 10, 2016, the Company's wholly-owned subsidiary, JLC WH VII extended the termination date of its master repurchase agreement to July 5, 2017. On January 18, 2017, the Company's wholly-owned subsidiaries, JLC Warehouse VI terminated its master repurchase agreement in accordance with the terms of the agreement.
The Company has performed an evaluation of events that have occurred subsequent to November 30, 2016 and through January 23, 2017, the date these financial statements were available for release, and has determined that there were no further material subsequent events that occurred during such period requiring recognition and/or disclosure in these financial statements.
47