UNITED STATES
SECURITIES AND EXCHANGE COMMISSION
Washington, D.C. 20549
FORM 10-K
R | ANNUAL REPORT PURSUANT TO SECTION 13 OR 15(d) OF THE SECURITIES EXCHANGE ACT OF 1934 |
| For the fiscal year ended April 30, 2012 |
or
£ | TRANSITION REPORT PURSUANT TO SECTION 13 OR 15(d) OF THE SECURITIES EXCHANGE ACT OF 1934 |
| For the transition period from ____________ to ____________ |
Commission File Number 000-14851
Investors Real Estate Trust
(Exact name of Registrant as specified in its charter)
North Dakota | 45-0311232 |
(State or other jurisdiction of incorporation or organization) | (IRS Employer Identification No.) |
1400 31 st Avenue SW, Suite 60 | |
Post Office Box 1988 | |
Minot, ND 58702-1988 | |
(Address of principal executive offices) (Zip code) | |
701-837-4738
(Registrant's telephone number, including area code)
Securities registered pursuant to Section 12(b) of the Act:
Common Shares of Beneficial Interest (no par value) - NASDAQ Global Select Market
Series A Cumulative Redeemable Preferred Shares of Beneficial Interest (no par value) -
NASDAQ Global Select Market
Securities registered pursuant to Section 12(g) of the Act:
None
________________________________
Indicate by check mark if the Registrant is a well-known seasoned issuer, as defined in Rule 405 of the Securities Act.
o | Yes | ☑ | No |
Indicate by check mark if the Registrant is not required to file reports pursuant to Section 13 or Section 15(d) of the Exchange Act.
o | Yes | ☑ | No |
Indicate by check mark whether the Registrant: (1) has filed all reports required to be filed by Section 13 or 15(d) of the Securities Exchange Act of 1934 during the preceding 12 months (or for such shorter period that the Registrant was required to file such reports), and (2) has been subject to such filing requirements for the past 90 days.
☑ | Yes | o | No |
2012 Annual Report
Indicate by checkmark whether the Registrant has submitted electronically and posted on its corporate Website, if any, every Interactive Data File required to be submitted and posted pursuant to Rule 405 of Regulation S-T (§229.405 of this chapter) during the preceding 12 months (or for such shorter period that the Registrant was required to submit and post such files).
☑ | Yes | o | No |
Indicate by check mark if disclosure of delinquent filers pursuant to Item 405 of Regulation S-K is not contained herein, and will not be contained, to the best of Registrant's knowledge, in definitive proxy or information statements incorporated by reference in Part III of this Form 10-K or any amendment to this Form 10-K. o
Indicate by check mark whether the Registrant is a large accelerated filer, an accelerated filer, a non-accelerated filer, or a smaller reporting company. See the definitions of "large accelerated filer," "accelerated filer" and "smaller reporting company" in Rule 12b-2 of the Exchange Act.
o Large accelerated filer | ☑ Accelerated filer | |
o Non-accelerated filer | o Smaller reporting Company |
Indicate by check mark whether the Registrant is a shell company (as defined in Rule 12b-2 of the Exchange Act).
o | Yes | ☑ | No |
The aggregate market value of the Registrant's outstanding common shares of beneficial interest held by non-affiliates of the Registrant as of October 31, 2011 was $608,961,193 based on the last reported sale price on the NASDAQ Global Select Market on October 31, 2011. For purposes of this calculation, the Registrant has assumed that its trustees and executive officers are affiliates.
The number of common shares of beneficial interest outstanding as of June 25, 2012, was 90,265,194.
References in this Annual Report on Form 10-K to the "Company," "IRET," "we," "us," or "our" include consolidated subsidiaries, unless the context indicates otherwise.
Documents Incorporated by Reference: Portions of IRET's definitive Proxy Statement for its 2012 Annual Meeting of Shareholders to be held on September 18, 2012 are incorporated by reference into Part III (Items 10, 11, 12, 13 and 14) hereof.
2009 Annual Report
INVESTORS REAL ESTATE TRUST
INDEX
PAGE | ||
PART I | ||
Item 1. Business | 5 | |
Item 1A. Risk Factors | 11 | |
Item 1B. Unresolved Staff Comments | 22 | |
Item 2. Properties | 22 | |
Item 3. Legal Proceedings | 34 | |
Item 4. Mine Safety Disclosures | 35 | |
PART II | ||
Item 5. Market for Registrant's Common Equity, Related Stockholder Matters and Issuer Purchases of Equity Securities | 35 | |
Item 6. Selected Financial Data | 37 | |
Item 7. Management's Discussion and Analysis of Financial Condition and Results of Operations | 37 | |
Item 7A. Quantitative and Qualitative Disclosures about Market Risk | 65 | |
Item 8. Financial Statements and Supplementary Data | 66 | |
Item 9. Changes in and Disagreements with Accountants on Accounting and Financial Disclosure | 66 | |
Item 9A. Controls and Procedures | 67 | |
Item 9B. Other Information | 69 | |
PART III | ||
Item 10. Trustees, Executive Officers and Corporate Governance | 69 | |
Item 11. Executive Compensation | 69 | |
Item 12. Security Ownership of Certain Beneficial Owners and Management and Related Stockholder Matters | 69 | |
Item 13. Certain Relationships and Related Transactions, and Trustee Independence | 69 | |
Item 14. Principal Accountant Fees and Services | 69 | |
PART IV | ||
Item 15. Exhibits, Financial Statement Schedules | 70 | |
Exhibit Index | 70 | |
Signatures | 72 | |
Report of Independent Registered Public Accounting Firm and Financial Statements | F-1 to F-44 | |
2012 Annual Report 3
Index
Special Note Regarding Forward Looking Statements
Certain statements included in this Annual Report on Form 10-K and the documents incorporated into this document by reference are "forward-looking statements" within the meaning of Section 27A of the Securities Act of 1933, as amended (the "Securities Act"), and Section 21E of the Securities Exchange Act of 1934, as amended (the "Exchange Act"). Such forward-looking statements include statements about our belief that we have the liquidity and capital resources necessary to meet our known obligations and to make additional real estate acquisitions and capital improvements when appropriate to enhance long term growth; and other statements preceded by, followed by or otherwise including words such as "believe," "expect," "intend," "project," "plan," "anticipate," "potential," "may," "designed," "estimate," "should," "continue" and other similar expressions. These statements indicate that we have used assumptions that are subject to a number of risks and uncertainties that could cause our actual results or performance to differ materially from those projected.
Although we believe that the expectations reflected in such forward-looking statements are based on reasonable assumptions, we can give no assurance that these expectations will prove to have been correct. Important factors that could cause actual results to differ materially from the expectations reflected in the forward-looking statements include:
| • | the economic health of the markets in which we own and operate multi-family and commercial properties, in particular the states of Minnesota and North Dakota, or other markets in which we may invest in the future; |
| • | the economic health of our commercial tenants; |
| • | market rental conditions, including occupancy levels and rental rates, for multi-family residential and commercial properties; |
| • | our ability to identify and secure additional multi-family residential and commercial properties that meet our criteria for investment; |
| • | the level and volatility of prevailing market interest rates and the pricing of our common shares of beneficial interest; |
| • | financing risks, such as our inability to obtain debt or equity financing on favorable terms, or at all; |
| • | compliance with applicable laws, including those concerning the environment and access by persons with disabilities; and |
| • | the availability and cost of casualty insurance for losses. |
Readers should carefully review our financial statements and the notes thereto, as well as the section entitled "Risk Factors" in Item 1A of this Annual Report on Form 10-K and the other documents we file from time to time with the Securities and Exchange Commission ("SEC").
In light of these uncertainties, the events anticipated by our forward-looking statements might not occur. We undertake no obligation to update or revise any forward-looking statements, whether as a result of new information, future events or otherwise. The foregoing review of factors that could cause our actual results to differ materially from those contemplated in any forward-looking statements included in this Annual Report on Form 10-K should not be construed as exhaustive.
2012 Annual Report 4
Index
PART I
Item 1. Business
Overview
Investors Real Estate Trust ("IRET" or the "Company") is a self-advised equity Real Estate Investment Trust ("REIT") organized under the laws of North Dakota. Since our formation in 1970, our business has consisted of owning and operating income-producing real estate properties. We are structured as an Umbrella Partnership Real Estate Investment Trust or UPREIT and we conduct our day-to-day business operations through our operating partnership, IRET Properties, a North Dakota Limited Partnership ("IRET Properties" or the "Operating Partnership"). Our investments consist of multi-family residential properties and commercial office, commercial medical, commercial industrial and commercial retail properties. These properties are located primarily in the upper Midwest states of Minnesota and North Dakota. For the fiscal year ended April 30, 2012, our real estate investments in these two states accounted for 69.0% of our total gross revenue. Our principal executive office is located in Minot, North Dakota. We also have corporate offices in Minneapolis and St. Cloud, Minnesota, and additional property management offices in Kansas, Minnesota, Missouri, Montana, Nebraska, North Dakota and South Dakota.
We seek to diversify our investments among multi-family residential, commercial office, commercial medical, commercial industrial and commercial retail properties. As of April 30, 2012, our real estate portfolio consisted of:
| • | 84 multi-family residential properties containing 9,161 apartment units and having a total real estate investment amount net of accumulated depreciation of $411.0 million; |
| • | 68 commercial office properties containing approximately 5.1 million square feet of leasable space and having a total real estate investment amount net of accumulated depreciation of $483.9 million; |
| • | 65 commercial medical properties (including senior housing) containing approximately 2.9 million square feet of leasable space and having a total real estate investment amount net of accumulated depreciation of $421.5 million; |
| • | 19 commercial industrial properties containing approximately 2.9 million square feet of leasable space and having a total real estate investment amount net of accumulated depreciation of $98.3 million; and |
| • | 30 commercial retail properties containing approximately 1.4 million square feet of leasable space and having a total real estate investment amount net of accumulated depreciation of $103.8 million. |
Our residential leases are generally for a one-year term. Our commercial properties are typically leased to tenants under long-term lease arrangements. As of April 30, 2012, no individual tenant accounted for more than 10% of our total real estate rentals, although affiliated entities of Edgewood Vista together accounted for approximately 12.4% of our total commercial segments' minimum rents.
Structure
We were organized as a REIT under the laws of North Dakota on July 31, 1970.
Since our formation, we have operated as a REIT under Sections 856-858 of the Internal Revenue Code of 1986, as amended (the "Internal Revenue Code"), and since February 1, 1997, we have been structured as an UPREIT. Since restructuring as an UPREIT, we have conducted our daily business operations primarily through IRET Properties. IRET Properties is organized under the laws of North Dakota pursuant to an Agreement of Limited Partnership dated January 31, 1997. IRET Properties is principally engaged in acquiring, owning, operating and leasing multi-family residential and commercial real estate. The sole general partner of IRET Properties is IRET, Inc., a North Dakota corporation and our wholly-owned subsidiary. All of our assets (except for qualified REIT subsidiaries) and liabilities were contributed to IRET Properties, through IRET, Inc., in exchange for the sole general partnership interest in IRET Properties. As of April 30, 2012, IRET, Inc. owned an 81.5% interest in IRET Properties. The remaining ownership of IRET Properties is held by individual limited partners.
2012 Annual Report 5
Index
Investment Strategy and Policies
Our business objective is to increase shareholder value by employing a disciplined investment strategy. This strategy is focused on growing assets in desired geographical markets, achieving diversification by property type and location, and adhering to targeted returns in acquiring properties.
We generally use available cash or short-term floating rate debt to acquire real estate. We then replace such cash or short-term floating rate debt with fixed-rate secured debt. In appropriate circumstances, we also may acquire one or more properties in exchange for our common shares of beneficial interest ("common shares") or for limited partnership units of IRET Properties ("limited partnership units" or "UPREIT Units"), which are convertible, after the expiration of a minimum holding period of one year, into cash or, at our sole discretion, into our common shares on a one-to-one basis.
Our investment strategy is to invest in multi-family residential properties, and in commercial office, commercial medical, commercial industrial and commercial retail properties that are leased to single or multiple tenants, usually for five years or longer, and are located throughout the upper Midwest. We operate mainly within the states of North Dakota and Minnesota, although we also have real estate investments in Colorado, Idaho, Iowa, Kansas, Missouri, Montana, Nebraska, South Dakota, Wisconsin and Wyoming.
In order to implement our investment strategy we have certain investment policies. Our significant investment policies are as follows:
Investments in the securities of, or interests in, entities primarily engaged in real estate activities and other securities. While we are permitted to invest in the securities of other entities engaged in the ownership and operation of real estate, as well as other securities, we currently have no plans to make any investments in other securities.
Any policy, as it relates to investments in other securities, may be changed by a majority of the members of our Board of Trustees at any time without notice to or a vote of our shareholders.
Investments in real estate or interests in real estate. We currently own multi-family residential properties and/or commercial properties in 12 states. We may invest in real estate, or interests in real estate, located anywhere in the United States; however, we currently plan to focus our investments in those states in which we already have property, with specific concentration in Minnesota, North Dakota, Nebraska, Iowa, Colorado, Montana, South Dakota, and Kansas. Similarly, we may invest in any type of real estate or interest in real estate including, but not limited to, office buildings, apartment buildings, shopping centers, industrial and commercial properties, special purpose buildings and undeveloped acreage. Under our Third Restated Trustees' Regulations (Bylaws), however, we may not invest more than 10.0% of our total assets in unimproved real estate, excluding property being developed or property where development will be commenced within one year.
It is not our policy to acquire assets primarily for capital gain through sale in the short term. Rather, it is our policy to acquire assets with an intention to hold such assets for at least a 10-year period. During the holding period, it is our policy to seek current income and capital appreciation through an increase in value of our real estate portfolio, as well as increased revenue as a result of higher rents.
Any policy, as it relates to investments in real estate or interests in real estate may be changed by our Board of Trustees at any time without notice to or a vote of our shareholders.
Investments in real estate mortgages. While not our primary business focus, from time to time we make loans to others that are secured by mortgages, liens or deeds of trust covering real estate. We have no restrictions on the type of property that may be used as collateral for a mortgage loan; provided, however, that except for loans insured or guaranteed by a government or a governmental agency, we may not invest in or make a mortgage loan unless an appraisal is obtained concerning the value of the underlying property. Unless otherwise approved by our Board of Trustees, it is our policy that we will not invest in mortgage loans on any one property if in the aggregate the total indebtedness on the property, including our mortgage, exceeds 85.0% of the property's appraised value. We can invest in junior mortgages without notice to, or the approval of, our shareholders. As of April 30, 2012 and 2011, we had no junior mortgages
2012 Annual Report 6
Index
outstanding. We had no investments in real estate mortgages at April 30, 2012. We had one contract for deed outstanding as of April 30, 2011, with a balance due to us, net of reserves, of approximately $156,000.
Our policies relating to mortgage loans, including second mortgages, may be changed by our Board of Trustees at any time, or from time to time, without notice to, or a vote of, our shareholders.
Policies With Respect to Certain of Our Activities
Our current policies as they pertain to certain of our activities are described as follows:
Distributions to shareholders and holders of limited partnership units. One of the requirements of the Internal Revenue Code for a REIT is that it distribute 90% of its net taxable income, excluding net capital gains, to its shareholders. There is a separate requirement to distribute net capital gains or pay a corporate level tax in lieu thereof. Our general policy has been to make cash distributions to our common shareholders and the holders of limited partnership units of approximately 65.0% to 90.0% of our funds from operations and to use the remaining funds for capital improvements or the purchase of additional properties. This policy may be changed at any time by our Board of Trustees without notice to, or approval of, our shareholders. Distributions to our common shareholders and unitholders in fiscal years 2012 and 2011 totaled approximately 86.4% and 108.9%, respectively, on a per share and unit basis of our funds from operations.
Issuing senior securities. On April 26, 2004, we issued 1,150,000 shares of 8.25% Series A Cumulative Redeemable Preferred Shares of Beneficial Interest (the "Series A preferred shares"). Depending on future interest rate and market conditions, we may issue additional preferred shares or other senior securities which would have dividend and liquidation preference over our common shares.
Borrowing money. We rely on borrowed funds in pursuing our investment objectives and goals. It is generally our policy to seek to borrow up to 65.0% to 75.0% of the appraised value of all new real estate acquired or developed. This policy concerning borrowed funds is vested solely with our Board of Trustees and can be changed by our Board of Trustees at any time, or from time to time, without notice to, or a vote of, our shareholders. Such policy is subject, however, to the limitation in our Bylaws, which provides that unless approved by a majority of the independent members of our Board of Trustees and disclosed to our shareholders in our next quarterly report along with justification for such excess, we may not borrow in excess of 300.0% of our total Net Assets (as such term is used in our Bylaws, which usage is not in accordance with generally accepted accounting principles ("GAAP"), "Net Assets" means our total assets at cost before deducting depreciation or other non-cash reserves, less total liabilities). Our Bylaws do not impose any limitation on the amount that we may borrow against any one particular property. As of April 30, 2012, our ratio of total indebtedness to total real estate investments was 70.7% while our ratio of total indebtedness as compared to our Net Assets (computed in accordance with our Bylaws) was 117.2%.
Offering securities in exchange for property. Our organizational structure allows us to issue shares and to offer limited partnership units of IRET Properties in exchange for real estate. The limited partnership units are convertible into cash, or, at our option, common shares on a one-for-one basis after a minimum one-year holding period. All limited partnership units receive the same cash distributions as those paid on common shares. Limited partners are not entitled to vote on any matters affecting us until they convert their limited partnership units to common shares.
Our declaration of trust, as amended (our "Declaration of Trust"), does not contain any restrictions on our ability to offer limited partnership units of IRET Properties in exchange for property. As a result, any decision to do so is vested solely in our Board of Trustees. This policy may be changed at any time, or from time to time, without notice to, or a vote of, our shareholders. For the three most recent fiscal years ended April 30, we have issued the following limited partnership units of IRET Properties in exchange for properties:
(in thousands) | ||||||||||||
| 2012 | 2011 | 2010 | |||||||||
Limited partnership units issued | 1,024 | 555 | 390 | |||||||||
Value at issuance | $ | 8,055 | $ | 4,996 | $ | 3,897 | ||||||
Acquiring or repurchasing shares. As a REIT, it is our intention to invest only in real estate assets. Our Declaration of Trust does not prohibit the acquisition or repurchase of our common or preferred shares or other securities so long as such activity does not prohibit us from operating as a REIT under the Internal Revenue Code. Any policy
2012 Annual Report 7
Index
regarding the acquisition or repurchase of shares or other securities is vested solely in our Board of Trustees and may be changed at any time, or from time to time, without notice to, or a vote of, our shareholders.
During fiscal year 2012, we did not repurchase any of our outstanding common shares, preferred shares or limited partnership units, except for the redemption of a nominal amount of fractional common shares held by shareholders.
To make loans to other persons. Our organizational structure allows us to make loans to other persons, subject to certain conditions and subject to our election to be taxed as a REIT. All loans must be secured by real property or limited partnership units of IRET Properties. Our mortgage loans receivable (including contracts for deed), net of reserves, totaled $0 as of April 30, 2012, and approximately $156,000 as of April 30, 2011.
To invest in the securities of other issuers for the purpose of exercising control. We have not, for the past three years, engaged in, and we are not currently engaging in, investment in the securities of other issuers for the purpose of exercising control. Our Declaration of Trust does not impose any limitation on our ability to invest in the securities of other issuers for the purpose of exercising control. Any decision to do so is vested solely in our Board of Trustees and may be changed at any time, or from time to time, without notice to, or a vote of, our shareholders.
Information about Segments
We currently operate in five reportable real estate segments: multi-family residential, commercial office, commercial medical (including senior housing), commercial industrial and commercial retail. For further information on these segments and other related information, see Note 11 of our consolidated financial statements, and Management's Discussion and Analysis of Financial Condition and Results of Operations in Item 7 of this Annual Report on Form 10-K.
Executive Officers of the Company
Set forth below are the names, ages, titles and biographies of each of our executive officers as of July 1, 2012.
Name | Age | Title |
Timothy P. Mihalick | 53 | President and Chief Executive Officer |
Thomas A. Wentz, Jr. | 46 | Executive Vice President and Chief Operating Officer |
Diane K. Bryantt | 48 | Executive Vice President and Chief Financial Officer |
Michael A. Bosh | 41 | Executive Vice President and General Counsel |
Mark W. Reiling | 54 | Executive Vice President of Asset Management |
Charles A. Greenberg | 53 | Senior Vice President, Commercial Asset Management |
Ted E. Holmes | 41 | Senior Vice President, Finance |
Andrew Martin | 39 | Senior Vice President, Residential Property Management |
Timothy P. Mihalick joined us as a financial officer in May 1981, after graduating from Minot State University. He has served in various capacities with us over the years and was named Vice President in 1992. Mr. Mihalick served as the Chief Operating Officer from 1997 to 2009, as a Senior Vice President from 2002 to 2009, and as a member of our Board of Trustees since 1999. In September 2009, Mr. Mihalick was named President and Chief Executive Officer.
Thomas A. Wentz, Jr. is a graduate of Harvard College and the University of North Dakota School of Law, and joined us as General Counsel and Vice President in January 2000. He served as Senior Vice President of Asset Management and Finance from 2002 to 2009 and as a member of our Board of Trustees since 1996. In September 2009, Mr. Wentz was named Senior Vice President and Chief Operating Officer, and in June 2012 Mr. Wentz was named Executive Vice President and Chief Operating Officer. Prior to 2000, Mr. Wentz was a shareholder in the law firm of Pringle & Herigstad, P.C. from 1992 to 1999. Mr. Wentz is a member of the American Bar Association and the North Dakota Bar Association, and he is a Director of SRT Communications, Inc.
Diane K. Bryantt is a graduate of Minot State University. Ms. Bryantt joined us in June 1996, and served as our Controller and Corporate Secretary before being appointed to the positions of Senior Vice President and Chief Financial Officer in 2002 and Executive Vice President and Chief Financial Officer in June 2012. Prior to joining us, Ms. Bryantt was employed by First American Bank, Minot, North Dakota.
2012 Annual Report 8
Index
Michael A. Bosh joined us as Associate General Counsel and Secretary in September 2002, and was named General Counsel in September 2003 and Executive Vice President and General Counsel in June 2012. Prior to 2002, Mr. Bosh was a shareholder in the law firm of Pringle & Herigstad, P.C. Mr. Bosh graduated from Jamestown College in 1992 and from Washington & Lee University School of Law in 1995. Mr. Bosh is a member of the American Bar Association and the North Dakota Bar Association.
Mark W. Reiling joined IRET in June 2012 as Executive Vice President of Asset Management. Mr. Reiling holds a Bachelor's in Business Administration degree in Finance from the University of Notre Dame, and has over 30 years of experience in commercial real estate. He was associated with the Towle Real Estate Company and its successors (now Cassidy Turley) in Minneapolis, Minnesota, for approximately 18 years as President of Towle Properties, Inc., providing asset management services to commercial property owners, and as Senior Vice President at Cassidy Turley, responsible for new business development (brokerage and property management services).
Charles A. Greenberg joined IRET in August 2005 as Director of Commercial Asset Management, and was named Senior Vice President, Commercial Asset Management in November 2008. He is a graduate of the University of Wisconsin-Madison and has over 26 years of experience in both asset and property management of institutional-grade real estate investments. From 1989 to 2005, Mr. Greenberg was General Manager at Northco Corporation, a Minneapolis-based real estate investment firm.
Ted E. Holmes joined us in 2009 as Vice President of Finance, and was promoted to Senior Vice President of Finance in December 2010. Mr. Holmes has over 15 years of experience in the finance industry, including the placement of debt and equity as a commercial and multi-family mortgage banker. From 1994 to 2002 Mr. Holmes was an Analyst and Assistant Vice President with Towle Financial Services/Midwest, a privately held mortgage banking company in Minneapolis, and he served as Director with Wells Fargo Bank, NA from 2003 to 2009. He holds a Bachelor of Arts degree in Economics from St. Cloud State University and is a licensed Minnesota Broker.
Andrew Martin joined IRET in December 2009 to lead the Company's Residential Property Management division. In May 2011 Mr. Martin was promoted to Senior Vice President of Residential Property Management. He has over 17 years of experience in the commercial and multi-family property management industry. Prior to his employment with IRET, Mr. Martin was a partner with INH Companies, a property management firm based in St. Cloud, Minnesota, and also worked in Minneapolis, Minnesota for United Properties as a regional property manager. Mr. Martin holds a bachelors degree in Real Estate and a Master's degree in Business Administration from St. Cloud State University, and has earned the designation of Certified Property Manager from the Institute of Real Estate Management.
Employees
As of April 30, 2012, we had 400 employees, of whom 322 were full-time and 78 part-time employees. Of these 400 employees, 55 are corporate staff in our Minot, North Dakota and Minneapolis, Minnesota offices, and 345 are property management employees based at our properties or in local property management offices.
Environmental Matters and Government Regulation
Under various federal, state and local laws, ordinances and regulations relating to the protection of the environment, a current or previous owner or operator of real estate may be liable for the costs of removal or remediation of certain hazardous or toxic substances released at a property, and may be held liable to a governmental entity or to third parties for property damage or personal injuries and for investigation and clean-up costs incurred in connection with any contamination. In addition, some environmental laws create a lien on a contaminated site in favor of the government for damages and costs it incurs in connection with the contamination. These laws often impose liability without regard to whether the current owner was responsible for, or even knew of, the presence of such substances. It is generally our policy to obtain from independent environmental consultants a "Phase I" environmental audit (which involves visual inspection but not soil or groundwater analysis) on all properties that we seek to acquire. We do not believe that any of our properties are subject to any material environmental contamination. However, no assurances can be given that:
| • | a prior owner, operator or occupant of the properties we own or the properties we intend to acquire did not create a material environmental condition not known to us, which might have been revealed by more in-depth study of the properties; and |
2012 Annual Report 9
Index
| • | future uses or conditions (including, without limitation, changes in applicable environmental laws and regulations) will not result in the imposition of environmental liability upon us. |
In addition to laws and regulations relating to the protection of the environment, many other laws and governmental regulations are applicable to our properties, and changes in the laws and regulations, or in their interpretation by agencies and the courts, occur frequently. Under the Americans with Disabilities Act of 1990 (the "ADA"), all places of public accommodation are required to meet certain federal requirements related to access and use by disabled persons. In addition, the Fair Housing Amendments Act of 1988 (the "FHAA") requires apartment communities first occupied after March 13, 1990, to be accessible to the handicapped. Non-compliance with the ADA or the FHAA could result in the imposition of fines or an award of damages to private litigants. We believe that those of our properties to which the ADA and/or FHAA apply are substantially in compliance with present ADA and FHAA requirements.
Competition
Investing in and operating real estate is a very competitive business. We compete with other owners and developers of multi-family and commercial properties to attract tenants to our properties. Ownership of competing properties is diversified among other REITs, financial institutions, individuals and public and private companies who are actively engaged in this business. Our multi-family properties compete directly with other rental apartments, as well as with condominiums and single-family homes that are available for rent or purchase in the areas in which our properties are located. Our commercial properties compete with other commercial properties for tenants. Additionally, we compete with other real estate investors, including other REITs, pension and investment funds, partnerships and investment companies, to acquire properties. This competition affects our ability to acquire properties we want to add to our portfolio and the price we pay for acquisitions. We do not believe we have a dominant position in any of the geographic markets in which we operate, but some of our competitors may be dominant in selected markets. Many of our competitors have greater financial and management resources than we have. We believe, however, that the geographic diversity of our investments, the experience and abilities of our management, the quality of our assets and the financial strength of many of our commercial tenants affords us some competitive advantages that have in the past and will in the future allow us to operate our business successfully despite the competitive nature of our business.
Corporate Governance
Our Board of Trustees has adopted various policies and initiatives to strengthen the Company's corporate governance and increase the transparency of financial reporting. Each of the committees of the Board of Trustees operates under written charters, and the Company's independent trustees meet regularly in executive sessions at which only the independent trustees are present. The Board of Trustees has also adopted a Code of Conduct applicable to trustees, officers and employees, and a Code of Ethics for Senior Financial Officers, and has established processes for shareholder communications with the Board of Trustees.
Additionally, the Company's Audit Committee has established procedures for the receipt, retention and treatment of complaints regarding accounting, internal accounting controls or auditing matters, including procedures for the confidential, anonymous submission by Company employees of concerns regarding accounting or auditing matters. The Audit Committee also maintains a policy requiring Audit Committee approval of all audit and non-audit services provided to the Company by the Company's independent registered public accounting firm.
The Company will disclose any amendment to its Code of Ethics for Senior Financial officers on its website. In the event the Company waives compliance by any of its trustees or officers subject to the Code of Ethics or Code of Conduct, the Company will disclose such waiver in a Form 8-K filed within four business days.
Website and Available Information
Our internet address is www.iret.com. We make available, free of charge, through the "SEC filings" tab under the Investors/Financial Reporting section of our website, our Annual Report on Form 10-K, our quarterly reports on Form 10-Q, our current reports on Form 8-K, and amendments to such reports filed or furnished pursuant to Section 13(a) or 15(d) of the Exchange Act as soon as reasonably practicable after such forms are filed with or furnished to the SEC. Current copies of our Code of Conduct, Code of Ethics for Senior Financial Officers, and Charters for the Audit, Compensation, Executive and Nominating and Governance Committees of our Board of Trustees are also available on our website under the heading "Corporate Governance" in the Investors/Corporate Overview section of
2012 Annual Report 10
Index
our website. Copies of these documents are also available to shareholders upon request addressed to the Secretary at Investors Real Estate Trust, P.O. Box 1988, Minot, North Dakota 58702-1988. Information on our internet website does not constitute part of this Annual Report on Form 10-K.
Item 1A. Risk Factors
Risks Related to Our Properties and Business
Our performance and share value are subject to risks associated with the real estate industry. Our results of operations and financial condition, the value of our real estate assets, and the value of an investment in us are subject to the risks normally associated with the ownership and operation of real estate properties. These risks include, but are not limited to, the following factors which, among others, may adversely affect the income generated by our properties:
| • | downturns in national, regional and local economic conditions (particularly increases in unemployment); |
| • | competition from other commercial and multi-family residential properties; |
| • | local real estate market conditions, such as oversupply or reduction in demand for commercial and multi-family residential space; |
| • | changes in interest rates and availability of attractive financing; |
| • | declines in the economic health and financial condition of our tenants and our ability to collect rents from our tenants; |
| • | vacancies, changes in market rental rates and the need periodically to repair, renovate and re-lease space; |
| • | increased operating costs, including real estate taxes, state and local taxes, insurance expense, utilities, and security costs; |
| • | significant expenditures associated with each investment, such as debt service payments, real estate taxes and insurance and maintenance costs, which are generally not reduced when circumstances cause a reduction in revenues from a property; |
| • | weather conditions, civil disturbances, natural disasters, terrorist acts or acts of war which may result in uninsured or underinsured losses; and |
| • | decreases in the underlying value of our real estate. |
Adverse global market and economic conditions may continue to adversely affect us and could cause us to recognize additional impairment charges or otherwise harm our performance. Market and economic conditions have been challenging for several years, with tighter credit conditions developing at the end of 2008 and continuing in 2009 and 2010, and an uneven economic recovery and persistent high unemployment continuing into 2012. Continued concerns about unemployment and public debt levels, geopolitical issues and declining real estate markets have contributed to increased market instability and diminished expectations for the U.S. economy. The commercial real estate sector in particular has been negatively affected by these market and economic conditions. These conditions may result in our tenants delaying lease commencements, requesting rent reductions, declining to extend or renew leases upon expiration and/or renewing at lower rates. These conditions also have forced some weaker tenants, in some cases, to declare bankruptcy and/or vacate leased premises. We may be unable to re-lease vacated space at attractive rents or at all. We are unable to predict whether, or to what extent or for how long, these adverse market and economic conditions will persist. The continuation and/or intensification of these conditions may impede our ability to generate sufficient operating cash flow to pay expenses, maintain properties, pay distributions and repay debt.
The federal conservatorship of Fannie Mae and Freddie Mac and related efforts, along with any changes in laws and regulations affecting the relationship between Fannie Mae and Freddie Mac and the U.S. Government, may adversely affect our business . We depend on the Federal National Mortgage Association (Fannie Mae) and the Federal Home Loan Mortgage Corporation (Freddie Mac) for financing for the majority of our multi-family
2012 Annual Report 11
Index
residential properties. Fannie Mae and Freddie Mac are U.S. Government-sponsored entities, or GSEs, but their guarantees are not backed by the full faith and credit of the United States. In recent years, Fannie Mae and Freddie Mac have reported substantial losses and a need for substantial amounts of additional capital. In response to the deteriorating financial condition of Fannie Mae and Freddie Mac and credit market disruptions, Congress and the U.S. Treasury have undertaken a series of actions to stabilize these GSEs and the financial markets generally. In September 2008 Fannie Mae and Freddie Mac were placed in federal conservatorship. The problems faced by Fannie Mae and Freddie Mac resulting in their being placed into federal conservatorship have stirred debate among some federal policy makers regarding the continued role of the U.S. Government in providing liquidity for the residential mortgage market. In February 2011, the U.S. Department of the Treasury and the U.S. Department of Housing and Urban Development issued a report entitled "Reforming America's Housing Finance Market." The report outlines recommendations for reforming the U.S. housing system, including the financing of multi-family residential properties, and discusses specifically the roles of Fannie Mae and Freddie Mac in that system. It is unclear how future legislation may impact Fannie Mae and Freddie Mac's involvement in multi-family residential financing. The scope and nature of the actions that the U.S. Government will ultimately undertake with respect to the future of Fannie Mae and Freddie Mac are unknown and will continue to evolve. It is possible that each of Fannie Mae and Freddie Mac could be dissolved and the U.S. Government could decide to stop providing liquidity support of any kind to the multi-family residential mortgage market. Future legislation could further change the relationship between Fannie Mae and Freddie Mac and the U.S. Government, and could also nationalize or eliminate such GSEs entirely. Any law affecting these GSEs may create market uncertainty and have the effect of reducing the credit available for financing multi-family residential properties. The loss or reduction of this important source of credit would be likely to result in higher loan costs for us, and could result in inability to borrow or refinance maturing debt, all of which could materially adversely affect our business, operations and financial condition.
Our property acquisition activities subject us to various risks which could adversely affect our operating results. We have acquired in the past and intend to continue to pursue the acquisition of properties and portfolios of properties, including large portfolios that could increase our size and result in alterations to our capital structure. Our acquisition activities and their success are subject to numerous risks, including, but not limited to:
| • | even if we enter into an acquisition agreement for a property, it is subject to customary closing conditions, including completion of due diligence investigations, and we may be unable to complete that acquisition after making a non-refundable deposit and incurring other acquisition-related costs; |
| • | we may be unable to obtain financing for acquisitions on favorable terms or at all; |
| • | acquired properties may fail to perform as expected; |
| • | the actual costs of repositioning or redeveloping acquired properties may be greater than our estimates; and |
| • | we may be unable to quickly and efficiently integrate new acquisitions into our existing operations. |
These risks could have an adverse effect on our results of operations and financial condition and the amount of cash available for payment of distributions.
Acquired properties may subject us to unknown liabilities which could adversely affect our operating results. We may acquire properties subject to liabilities and without any recourse, or with only limited recourse against prior owners or other third parties, with respect to unknown liabilities. As a result, if liability were asserted against us based upon ownership of these properties, we might have to pay substantial sums to settle or contest it, which could adversely affect our results of operations and cash flows. Unknown liabilities with respect to acquired properties might include liabilities for clean-up of undisclosed environmental contamination; claims by tenants, vendors or other persons against the former owners of the properties; liabilities incurred in the ordinary course of business; and claims for indemnification by general partners, directors, officers and others indemnified by the former owners of the properties.
Our geographic concentration in Minnesota and North Dakota may result in losses due to our significant exposure to the effects of economic and real estate conditions in those markets. For the fiscal year ended April 30, 2012, we received approximately 69.0% of our gross revenue from properties in Minnesota and North Dakota. As a result of this concentration, we are subject to substantially greater risk than if our investments were more geographically dispersed. Specifically, we are more significantly exposed to the effects of economic and real estate conditions in those particular markets, such as building by competitors, local vacancy and rental rates and general levels of
2012 Annual Report 12
Index
employment and economic activity. To the extent that weak economic or real estate conditions affect Minnesota and/or North Dakota more severely than other areas of the country, our financial performance could be negatively impacted.
If we are not able to renew leases or enter into new leases on favorable terms or at all as our existing leases expire, our revenue, operating results and cash flows will be reduced. We may be unable to renew leases with our existing tenants or enter into new leases with new tenants due to economic and other factors as our existing leases expire or are terminated prior to the expiration of their current terms. As a result, we could lose a significant source of revenue while remaining responsible for the payment of our obligations. In addition, even if we were able to renew existing leases or enter into new leases in a timely manner, the terms of those leases may be less favorable to us than the terms of expiring leases, because the rental rates of the renewal or new leases may be significantly lower than those of the expiring leases, or tenant installation costs, including the cost of required renovations or concessions to tenants, may be significant. If we are unable to enter into lease renewals or new leases on favorable terms or in a timely manner for all or a substantial portion of space that is subject to expiring leases, our revenue, operating results and cash flows will be adversely affected. As a result, our ability to make distributions to the holders of our shares of beneficial interest may be adversely affected. As of April 30, 2012, approximately 1.6 million square feet, or 12.6% of our total commercial property square footage, was vacant. Approximately 580 of our 9,161 apartment units, or 6.3%, were vacant. As of April 30, 2012, leases covering approximately 7.9% of our total commercial segments net rentable square footage will expire in fiscal year 2013, 11.7% in fiscal year 2014, 9.6% in fiscal year 2015, 13.3% in fiscal year 2016, and 11.0% in fiscal year 2017.
We face potential adverse effects from commercial tenant bankruptcies or insolvencies. The bankruptcy or insolvency of our commercial tenants may adversely affect the income produced by our properties. If a tenant defaults, we may experience delays and incur substantial costs in enforcing our rights as landlord. If a tenant files for bankruptcy, we cannot evict the tenant solely because of such bankruptcy. A court, however, may authorize the tenant to reject and terminate its lease with us. In such a case, our claim against the tenant for unpaid future rent would be subject to a statutory cap that might be substantially less than the remaining rent actually owed under the lease, and it is unlikely that a bankrupt tenant would pay in full amounts it owes us under a lease. This shortfall could adversely affect our cash flow and results of operations. If a tenant experiences a downturn in its business or other types of financial distress, it may be unable to make timely rental payments. Under some circumstances, we may agree to partially or wholly terminate the lease in advance of the termination date in consideration for a lease termination fee that is less than the agreed rental amount. Additionally, without regard to the manner in which a lease termination occurs, we are likely to incur additional costs in the form of tenant improvements and leasing commissions in our efforts to lease the space to a new tenant, as well as possibly lower rental rates reflective of declines in market rents.
Because real estate investments are generally illiquid, and various factors limit our ability to dispose of assets, we may not be able to sell properties when appropriate. Real estate investments are relatively illiquid and, therefore, we have limited ability to vary our portfolio quickly in response to changes in economic or other conditions. In addition, the prohibitions under the federal income tax laws on REITs holding property for sale and related regulations may affect our ability to sell properties. Our ability to dispose of assets may also be limited by constraints on our ability to utilize disposition proceeds to make acquisitions on financially attractive terms, and the requirement that we take additional impairment charges on certain assets. More specifically, we are required to distribute or pay tax on all capital gains generated from the sale of assets, and, in addition, a significant number of our properties were acquired using limited partnership units of IRET Properties, our operating partnership, and are subject to certain agreements which restrict our ability to sell such properties in transactions that would create current taxable income to the former owners. As a result, we are motivated to structure the sale of these assets as tax-free exchanges. To accomplish this we must identify attractive re-investment opportunities. These considerations impact our decisions on whether or not to dispose of certain of our assets.
Capital markets and economic conditions can materially affect our financial condition and results of operations, the value of our equity securities, and our ability to sustain payment of our distribution at current levels. Many factors affect the value of our equity securities and our ability to make or maintain at current levels distributions to the holders of our shares of beneficial interest, including the state of the capital markets and the economy, which in recent years have negatively affected substantially all businesses, including ours. Demand for office, industrial, and retail space has declined nationwide due to bankruptcies, downsizing, layoffs and cost cutting. The availability of credit has been and may in the future again be adversely affected by illiquid credit markets. Regulatory pressures and the burden of troubled and uncollectible loans led some lenders and institutional investors to reduce, and in
2012 Annual Report 13
Index
some cases, cease to provide funding to borrowers. If these market conditions recur, they may limit our ability and the ability of our tenants to timely refinance maturing liabilities and access the capital markets to meet liquidity needs, which may materially affect our financial condition and results of operations and the value of our equity securities. Declining rental revenues from our properties due to persistent negative economic conditions may have a material adverse effect on our ability to make distributions to the holders of our shares of beneficial interest. In fiscal years 2012 and 2011, distributions to our common shareholders and unitholders of the Operating Partnership in cash and common shares pursuant to our Distribution Reinvestment and Share Purchase Plan (DRIP) totaled approximately 88.7% and 115.1%, respectively, of our net cash provided by operating activities.
Inability to manage rapid growth effectively may adversely affect our operating results. We have experienced significant growth at various times in the past; principally through the acquisition of additional real estate properties. Subject to our continued ability to raise equity capital and issue limited partnership units of IRET Properties and identify suitable investment properties, we intend to continue our acquisition of real estate properties. Effective management of rapid growth presents challenges, including:
| • | the need to expand our management team and staff; |
| • | the need to enhance internal operating systems and controls; and |
| • | the ability to consistently achieve targeted returns on individual properties. |
We may not be able to maintain similar rates of growth in the future, or manage our growth effectively. Additionally, an inability to make accretive property acquisitions may adversely affect our ability to increase our net income. The acquisition of additional real estate properties is critical to our ability to increase our net income. If we are unable to make real estate acquisitions on terms that meet our financial and strategic objectives, whether due to market conditions, a changed competitive environment or unavailability of capital, our ability to increase our net income may be materially and adversely affected. Our failure to do so may have a material adverse effect on our financial condition and results of operations and ability to make distributions to the holders of our shares of beneficial interest.
Competition may negatively impact our earnings. We compete with many kinds of institutions, including other REITs, private partnerships, individuals, pension funds and banks, for tenants and investment opportunities. Many of these institutions are active in the markets in which we invest and have greater financial and other resources that may be used to compete against us. With respect to tenants, this competition may affect our ability to lease our properties, the price at which we are able to lease our properties and the cost of required renovations or tenant improvements. With respect to acquisition and development investment opportunities, this competition may cause us to pay higher prices for new properties than we otherwise would have paid, or may prevent us from purchasing a desired property at all.
High leverage on our overall portfolio may result in losses. As of April 30, 2012, our ratio of total indebtedness to total Net Assets (as that term is used in our Bylaws, which usage is not in accordance with GAAP, "Net Assets" means our total assets at cost before deducting depreciation or other non-cash reserves, less total liabilities) was approximately 117.2%. As of April 30, 2011 and 2010, our percentage of total indebtedness to total Net Assets was approximately 117.9% and 122.9%, respectively. Under our Bylaws we may increase our total indebtedness up to 300.0% of our Net Assets, or by an additional approximately $1.7 billion. There is no limitation on the increase that may be permitted if approved by a majority of the independent members of our Board of Trustees and disclosed to the holders of our securities in the next quarterly report, along with justification for any excess.
This amount of leverage may expose us to cash flow problems if rental income decreases. Under those circumstances, in order to pay our debt obligations we might be required to sell properties at a loss or be unable to make distributions to the holders of our shares of beneficial interest. A failure to pay amounts due may result in a default on our obligations and the loss of the property through foreclosure. Additionally, our degree of leverage could adversely affect our ability to obtain additional financing and may have an adverse effect on the market price of our common shares.
Our inability to renew, repay or refinance our debt may result in losses. We incur a significant amount of debt in the ordinary course of our business and in connection with acquisitions of real properties. In addition, because we have a limited ability to retain earnings as a result of the REIT distribution requirements, we will generally be required to
2012 Annual Report 14
Index
refinance debt that matures with additional debt or equity. We are subject to the normal risks associated with debt financing, including the risk that:
| • | our cash flow will be insufficient to meet required payments of principal and interest; |
| • | we will not be able to renew, refinance or repay our indebtedness when due; and |
| • | the terms of any renewal or refinancing will be less favorable than the terms of our current indebtedness. |
These risks increase when credit markets are tight; in general, when the credit markets are constrained, we may encounter resistance from lenders when we seek financing or refinancing for properties or proposed acquisitions, and the terms of such financing or refinancing are likely to be less favorable to us than the terms of our current indebtedness.
We anticipate that only a small portion of the principal of our debt will be repaid prior to maturity. Therefore, we are likely to need to refinance a significant portion of our outstanding debt as it matures. We cannot guarantee that any refinancing of debt with other debt will be possible on terms that are favorable or acceptable to us. If we cannot refinance, extend or pay principal payments due at maturity with the proceeds of other capital transactions, such as new equity capital, our cash flows may not be sufficient in all years to repay debt as it matures. Additionally, if we are unable to refinance our indebtedness on acceptable terms, or at all, we may be forced to dispose of one or more of our properties on disadvantageous terms, which may result in losses to us. These losses could have a material adverse effect on us, our ability to make distributions to the holders of our shares of beneficial interest and our ability to pay amounts due on our debt. Furthermore, if a property is mortgaged to secure payment of indebtedness and we are unable to meet mortgage payments, the mortgagee could foreclose upon the property, appoint a receiver and receive an assignment of rents and leases or pursue other remedies, all with a consequent loss of our revenues and asset value. Foreclosures could also create taxable income without accompanying cash proceeds, thereby hindering our ability to meet the REIT distribution requirements of the Internal Revenue Code.
As of April 30, 2012, approximately 4.9% of our mortgage debt is due for repayment in fiscal year 2013. As of April 30, 2012, we had approximately $51.1 million of principal payments and approximately $59.9 million of interest payments due in fiscal year 2013 on fixed and variable-rate mortgages secured by our real estate. Additionally, as of April 30, 2012, we had $39.0 million outstanding under our $60.0 million multi-bank line of credit, which has a maturity date of August 12, 2013.
The cost of our indebtedness may increase. Portions of our fixed-rate indebtedness incurred for past property acquisitions come due on a periodic basis. Rising interest rates could limit our ability to refinance this existing debt when it matures, and would increase our interest costs, which could have a material adverse effect on us, our ability to make distributions to the holders of our shares of beneficial interest and our ability to pay amounts due on our debt. In addition, we have incurred, and we expect to continue to incur, indebtedness that bears interest at a variable rate. As of April 30, 2012, $16.2 million, or approximately 1.5%, of the principal amount of our total mortgage indebtedness was subject to variable interest rate agreements. Additionally, our $60.0 million multi-bank line of credit bears interest at a rate of 1.25% over the Wall Street Journal Prime Rate, with a floor of 5.15% and a cap of 8.65%. If short-term interest rates rise, our debt service payments on adjustable rate debt would increase, which would lower our net income and could decrease our distributions to the holders of our shares of beneficial interest.
We depend on distributions and other payments from our subsidiaries that they may be prohibited from making to us, which could impair our ability to make distributions to holders of our shares of beneficial interest. Substantially all of our assets are held through IRET Properties, our operating partnership, and other of our subsidiaries. As a result, we depend on distributions and other payments from our subsidiaries in order to satisfy our financial obligations and make distributions to the holders of our shares of beneficial interest. As an equity investor in our subsidiaries, our right to receive assets upon their liquidation or reorganization effectively will be subordinated to the claims of their creditors. To the extent that we are recognized as a creditor of such subsidiaries, our claims may still be subordinate to any security interest in or other lien on their assets and to any of their debt or other obligations that are senior to our claims.
Our current or future insurance may not protect us against possible losses. We carry comprehensive liability, fire, extended coverage and rental loss insurance with respect to our properties at levels that we believe to be adequate and comparable to coverage customarily obtained by owners of similar properties. However, the coverage limits of our current or future policies may be insufficient to cover the full cost of repair or replacement of all potential losses.
2012 Annual Report 15
Index
Moreover, this level of coverage may not continue to be available in the future or, if available, may be available only at unacceptable cost or with unacceptable terms. Additionally, there may be certain extraordinary losses, such as those resulting from civil unrest, terrorism or environmental contamination, that are not generally, or fully, insured against because they are either uninsurable or not economically insurable. For example, we do not currently carry insurance against losses as a result of environmental contamination. Should an uninsured or underinsured loss occur to a property, we could be required to use our own funds for restoration or lose all or part of our investment in, and anticipated revenues from, the property. In any event, we would continue to be obligated on any mortgage indebtedness on the property. Any loss could have a material adverse effect on us, our ability to make distributions to the holders of our shares of beneficial interest and our ability to pay amounts due on our debt. In addition, in most cases we have to renew our insurance policies on an annual basis and negotiate acceptable terms for coverage, exposing us to the volatility of the insurance markets, including the possibility of rate increases. Any material increase in insurance rates or decrease in available coverage in the future could adversely affect our business and financial condition and results of operations, which could cause a decline in the market value of our securities.
We have significant investments in commercial medical properties and adverse trends in healthcare provider operations may negatively affect our lease revenues from these properties. We have acquired a significant number of specialty medical properties (including senior housing) and may acquire more in the future. As of April 30, 2012, our real estate portfolio consisted of 65 commercial medical properties, with a total real estate investment amount, net of accumulated depreciation, of $421.5 million, or approximately 27.8% of the total real estate investment amount, net of accumulated depreciation, of our entire real estate portfolio. The healthcare industry continues to experience: changes in the demand for, and methods of delivery of, healthcare services; changes in third-party reimbursement policies; significant unused capacity in certain areas, which has created substantial competition for patients among healthcare providers in those areas; continuing pressure by private and governmental payors to reduce payments to providers of services; and increased scrutiny of billing, referral and other practices by federal and state authorities. Sources of revenue for our commercial medical property tenants may include the federal Medicare program, state Medicaid programs, private insurance carriers and health maintenance organizations, among others. Efforts by such payors to reduce healthcare costs will likely continue, which may result in reductions or slower growth in reimbursement for certain services provided by some of our tenants. These factors may adversely affect the economic performance of some or all of our commercial medical services tenants and, in turn, our lease revenues. In addition, if we or our tenants terminate the leases for these properties, or our tenants lose their regulatory authority to operate such properties, we may not be able to locate suitable replacement tenants to lease the properties for their specialized uses. Alternatively, we may be required to spend substantial amounts to adapt the properties to other uses. Any loss of revenues and/or additional capital expenditures occurring as a result could hinder our ability to make distributions to the holders of our shares of beneficial interest.
New federal healthcare reform laws may adversely affect the operators and tenants of our commercial medical (including senior housing) properties. In March 2010, the President signed into law The Patient Protection and Affordable Care Act ("PPACA") and The Health Care and Education and Reconciliation Act of 2010 (the "Reconciliation Act"), which amends the PPACA (collectively, the "Health Reform Acts"). The Health Reform Acts contain various provisions that may affect us directly as an employer, and that may affect the operators and tenants of commercial medical (including senior housing) properties. While some of the provisions of these laws may have a positive impact on operators' or tenants' revenues, by increasing coverage of uninsured individuals, other provisions may have a negative effect on operator or tenant reimbursements, for example by changing the "market basket" adjustments for certain types of healthcare facilities. The Health Reform Acts also enhance certain fraud and abuse penalty provisions that could apply to our operators and tenants in the event of one or more violations of complex federal healthcare laws. Additionally, provisions in the Health Reform Acts may affect the health coverage that we and our operators and tenants provide to our respective employees. We currently cannot predict the impact that this far-reaching, landmark legislation will have on our business and the businesses and operations of our tenants. Any loss of revenues and/or additional expenditures incurred by us or by operators and tenants of our properties as a result of the Health Reform Acts could adversely affect our cash flow and results of operations and have a material adverse effect on our ability to make distributions to the holders of our shares of beneficial interest.
Adverse changes in applicable laws may affect our potential liabilities relating to our properties and operations. Increases in real estate taxes and income, service and transfer taxes cannot always be passed through to all tenants in the form of higher rents. As a result, any increase may adversely affect our cash available for distribution, our ability to make distributions to the holders of our shares of beneficial interest and our ability to pay amounts due on our debt. Similarly, changes in laws that increase the potential liability for environmental conditions existing on
2012 Annual Report 16
Index
properties, that increase the restrictions on discharges or other conditions or that affect development, construction and safety requirements may result in significant unanticipated expenditures that could have a material adverse effect on us, our ability to make distributions to the holders of our shares of beneficial interest and our ability to pay amounts due on our debt. In addition, future enactment of rent control or rent stabilization laws or other laws regulating multi-family residential properties may reduce rental revenues or increase operating costs.
Complying with laws benefiting disabled persons or other safety regulations and requirements may affect our costs and investment strategies. Federal, state and local laws and regulations designed to improve disabled persons' access to and use of buildings, including the Americans with Disabilities Act of 1990, may require modifications to, or restrict renovations of, existing buildings. Additionally, these laws and regulations may require that structural features be added to buildings under construction. Legislation or regulations that may be adopted in the future may impose further burdens or restrictions on us with respect to improved access to, and use of these buildings by, disabled persons. Noncompliance could result in the imposition of fines by government authorities or the award of damages to private litigants. The costs of complying with these laws and regulations may be substantial, and limits or restrictions on construction, or the completion of required renovations, may limit the implementation of our investment strategy or reduce overall returns on our investments. This could have an adverse effect on us, our ability to make distributions to the holders of our shares of beneficial interest and our ability to pay amounts due on our debt. Our properties are also subject to various other federal, state and local regulatory requirements, such as state and local fire and life safety requirements. If we fail to comply with these requirements, we could incur fines or private damage awards. Additionally, in the event that existing requirements change, compliance with future requirements may require significant unanticipated expenditures that may adversely affect our cash flow and results of operations.
We may be responsible for potential liabilities under environmental laws. Under various federal, state and local laws, ordinances and regulations, we, as a current or previous owner or operator of real estate may be liable for the costs of removal of, or remediation of, hazardous or toxic substances in, on, around or under that property. These laws may impose liability without regard to whether we knew of, or were responsible for, the presence of the hazardous or toxic substances. The presence of these substances, or the failure to properly remediate any property containing these substances, may adversely affect our ability to sell or rent the affected property or to borrow funds using the property as collateral. In arranging for the disposal or treatment of hazardous or toxic substances, we may also be liable for the costs of removal of, or remediation of, these substances at that disposal or treatment facility, whether or not we own or operate the facility. In connection with our current or former ownership (direct or indirect), operation, management, development and/or control of real properties, we may be potentially liable for removal or remediation costs with respect to hazardous or toxic substances at those properties, as well as certain other costs, including governmental fines and claims for injuries to persons and property. A finding of liability for an environmental condition as to any one or more properties could have a material adverse effect on us, our ability to make distributions to the holders of our shares of beneficial interest and our ability to pay amounts due on our debt.
Environmental laws also govern the presence, maintenance and removal of asbestos, and require that owners or operators of buildings containing asbestos properly manage and maintain the asbestos; notify and train those who may come into contact with asbestos; and undertake special precautions if asbestos would be disturbed during renovation or demolition of a building. Indoor air quality issues may also necessitate special investigation and remediation. These air quality issues can result from inadequate ventilation, chemical contaminants from indoor or outdoor sources, or biological contaminants such as molds, pollen, viruses and bacteria. Such asbestos or air quality remediation programs could be costly, necessitate the temporary relocation of some or all of the property's tenants or require rehabilitation of an affected property.
It is generally our policy to obtain a Phase I environmental study on each property that we seek to acquire. A Phase I environmental study generally includes a visual inspection of the property and the surrounding areas, an examination of current and historical uses of the property and the surrounding areas and a review of relevant state and federal documents, but does not involve invasive techniques such as soil and ground water sampling. If the Phase I indicates any possible environmental problems, our policy is to order a Phase II study, which involves testing the soil and ground water for actual hazardous substances. However, Phase I and Phase II environmental studies, or any other environmental studies undertaken with respect to any of our current or future properties, may not reveal the full extent of potential environmental liabilities. We currently do not carry insurance for environmental liabilities.
2012 Annual Report 17
Index
We may be unable to retain or attract qualified management. We are dependent upon our senior officers for essentially all aspects of our business operations. Our senior officers have experience in the specialized business segments in which we operate, and the loss of them would likely have a material adverse effect on our operations, and could adversely impact our relationships with lenders, industry personnel and potential tenants. We do not have employment contracts with any of our senior officers. As a result, any senior officer may terminate his or her relationship with us at any time, without providing advance notice. If we fail to manage effectively a transition to new personnel, or if we fail to attract and retain qualified and experienced personnel on acceptable terms, our business and prospects could be harmed. The location of our company headquarters in Minot, North Dakota, may make it more difficult and expensive to attract, relocate and retain current and future officers and employees.
If the level of drilling and production in the Bakken Shale Formation declines substantially near our North Dakota real estate assets, our physical occupancy levels and revenues could decline. We have significant existing real estate assets in our home market of North Dakota, and we are committing additional resources to the development of multi-family residential and commercial real estate in North Dakota in a response to unprecedented demand for office and residential space resulting from the development of the Bakken Shale Formation. We believe that our ability to maintain or increase physical occupancy levels and rental revenues at our commercial and multi-family residential properties in North Dakota will be significantly affected by the level of drilling and production by third parties in the Bakken Shale Formation. Drilling and production are impacted by factors beyond our control, including: the demand for and prices of crude oil and natural gas; environmental regulation and enforcement; producers' finding and development costs of reserves; producers' desire and ability to obtain necessary permits in a timely and economic manner; oil and natural gas field characteristics and production performance; and transportation and capacity constraints on natural gas, crude oil and natural gas liquids pipelines from the producing areas. Oil field activity could decline precipitously and substantially in North Dakota as a result of any or all of these factors, which could have a material adverse effect on us, our ability to make distributions to the holders of our shares of beneficial interest, and our ability to pay amounts due on our debt.
Risks related to properties under construction or development may adversely affect our financial performance. Our development and construction activities involve significant risks that may adversely affect our cash flow and results of operations, and consequently our ability to make distributions to the holders of our shares of beneficial interest and our ability to pay amounts due on our debt. In connection with our renovation, redevelopment, development and related construction activities, we may be unable to obtain, or may suffer delays in obtaining, necessary zoning, land-use, building, occupancy and other required governmental permits and authorizations. These denials or delays could result in increased costs or our abandonment of projects. In addition, we may not be able to obtain financing on favorable terms, which may prevent us from proceeding with our development activities, and we may not be able to complete construction and lease-up of a property on schedule, which could result in increased debt service expense or construction costs. Additionally, the time required for development, construction and lease-up means that we may have to wait years for significant cash returns. Because we are required to make cash distributions to our shareholders, if our cash flow from operations or refinancings is not sufficient, we may be forced to borrow additional money to fund such distributions. Newly developed properties may not produce the cash flow that we expect, which could adversely affect our overall financial performance. In deciding whether to develop a particular property, we make assumptions regarding the expected future performance of that property. In particular, we estimate the return on our investment based on expected occupancy and rental rates. If our financial projections with respect to a new property are inaccurate, and the property is unable to achieve the expected occupancy and rental rates, it may fail to perform as we had expected. Our estimate of the costs of repositioning or redeveloping an acquired property may also prove to be inaccurate, which may result in our failure to meet our profitability goals.
Risks related to joint ventures may adversely affect our financial performance and results of operations. We have entered into, and may continue in the future to enter into, partnerships or joint ventures with other persons or entities. Joint venture investments involve risks that may not be present with other methods of ownership, including the possibility: that our partner might become insolvent, refuse to make capital contributions when due or otherwise fail to meet its obligations, which may result in certain liabilities to us for guarantees and other commitments; that our partner might at any time have economic or other business interests or goals that are or become inconsistent with our interests or goals; that we could become engaged in a dispute with our partner, which could require us to expend additional resources to resolve such disputes and could have an adverse impact on the operations and profitability of the joint venture; and that our partner may be in a position to take action or withhold consent contrary to our instructions or requests. In addition, our ability to transfer our interest in a joint venture to a third party may be restricted. In some instances, we and/or our partner may have the right to trigger a buy-sell arrangement, which could cause us to sell our interest, or acquire our partner's interest, at a time when we otherwise would not have
2012 Annual Report 18
Index
initiated such a transaction. Our ability to acquire our partner's interest may be limited if we do not have sufficient cash, available borrowing capacity or other capital resources. In such event, we may be forced to sell our interest in the joint venture when we would otherwise prefer to retain it. Joint ventures may require us to share decision-making authority with our partners, which could limit our ability to control the properties in the joint ventures. Even when we have a controlling interest, certain major decisions may require partner approval, such as the sale, acquisition or financing of a property.
Risks Related to Our Structure and Organization
We may incur tax liabilities as a consequence of failing to qualify as a REIT. Although our management believes that we are organized and have operated and are operating in such a manner to qualify as a "real estate investment trust," as that term is defined under the Internal Revenue Code, we may not in fact have operated, or may not be able to continue to operate, in a manner to qualify or remain so qualified. Qualification as a REIT involves the application of highly technical and complex Internal Revenue Code provisions for which there are only limited judicial or administrative interpretations. Even a technical or inadvertent mistake could endanger our REIT status. The determination that we qualify as a REIT requires an ongoing analysis of various factual matters and circumstances, some of which may not be within our control. For example, in order to qualify as a REIT, at least 95% of our gross income in any year must come from certain passive sources that are itemized in the REIT tax laws, and we are prohibited from owning specified amounts of debt or equity securities of some issuers. Thus, to the extent revenues from non-qualifying sources, such as income from third-party management services, represent more than five percent of our gross income in any taxable year, we will not satisfy the 95% income test and may fail to qualify as a REIT, unless certain relief provisions contained in the Internal Revenue Code apply. Even if relief provisions apply, however, a tax would be imposed with respect to excess net income. We are also required to make distributions to the holders of our securities of at least 90% of our REIT taxable income, excluding net capital gains. The fact that we hold substantially all of our assets (except for qualified REIT subsidiaries) through IRET Properties, our operating partnership, and its subsidiaries, and our ongoing reliance on factual determinations, such as determinations related to the valuation of our assets, further complicates the application of the REIT requirements for us. Additionally, if IRET Properties, our operating partnership, or one or more of our subsidiaries is determined to be taxable as a corporation, we may fail to qualify as a REIT. Either our failure to qualify as a REIT, for any reason, or the imposition of taxes on excess net income from non-qualifying sources, could have a material adverse effect on us, our ability to make distributions to the holders of our shares of beneficial interest and our ability to pay amounts due on our debt. Furthermore, new legislation, regulations, administrative interpretations or court decisions could change the tax laws with respect to our qualification as a REIT or the federal income tax consequences of our qualification.
If we failed to qualify as a REIT, we would be subject to federal income tax (including any applicable alternative minimum tax) on our taxable income at regular corporate rates, which would likely have a material adverse effect on us, our ability to make distributions to the holders of our shares of beneficial interest and our ability to pay amounts due on our debt. In addition, we could be subject to increased state and local taxes, and, unless entitled to relief under applicable statutory provisions, we would also be disqualified from treatment as a REIT for the four taxable years following the year during which we lost our qualification. This treatment would reduce funds available for investment or distributions to the holders of our securities because of the additional tax liability to us for the year or years involved. In addition, we would no longer be able to deduct, and would not be required to make, distributions to holders of our securities. To the extent that distributions to the holders of our securities had been made in anticipation of qualifying as a REIT, we might be required to borrow funds or to liquidate certain investments to pay the applicable tax.
Failure of our operating partnership to qualify as a partnership would have a material adverse effect on us. We believe that IRET Properties, our operating partnership, qualifies as a partnership for federal income tax purposes. No assurance can be given, however, that the Internal Revenue Service will not challenge its status as a partnership for federal income tax purposes, or that a court would not sustain such a challenge. If the Internal Revenue Service were to be successful in treating IRET Properties as an entity that is taxable as a corporation (such as a publicly-traded partnership taxable as a corporation), we would cease to qualify as a REIT because the value of our ownership interest in IRET Properties would exceed 5% of our assets, and because we would be considered to hold more than 10% of the voting securities and value of the outstanding securities of another corporation. Also, the imposition of a corporate tax on IRET Properties would reduce significantly the amount of cash available for distribution by it.
2012 Annual Report 19
Index
Certain provisions of our Declaration of Trust may limit a change in control and deter a takeover. In order to maintain our qualification as a REIT, our Declaration of Trust provides that any transaction, other than a transaction entered into through the NASDAQ National Market, (renamed the NASDAQ Global Market), or other similar exchange, that would result in our disqualification as a REIT under Section 856 of the Internal Revenue Code, including any transaction that would result in (i) a person owning in excess of the ownership limit of 9.8%, in number or value, of our outstanding securities, (ii) less than 100 people owning our securities, (iii) our being "closely held" within the meaning of Section 856(h) of the Internal Revenue Code, or (iv) 50% or more of the fair market value of our securities being held by persons other than "United States persons," as defined in Section 7701(a)(30) of the Internal Revenue Code, will be void ab initio. If the transaction is not void ab initio, then the securities in excess of the ownership limit, that would cause us to be closely held, that would result in 50% or more of the fair market value of our securities to be held by persons other than United States persons or that otherwise would result in our disqualification as a REIT, will automatically be exchanged for an equal number of excess shares, and these excess shares will be transferred to an excess share trustee for the exclusive benefit of the charitable beneficiaries named by our Board of Trustees. These limitations may have the effect of preventing a change in control or takeover of us by a third party, even if the change in control or takeover would be in the best interests of the holders of our securities.
In order to maintain our REIT status, we may be forced to borrow funds during unfavorable market conditions. In order to maintain our REIT status, we may need to borrow funds on a short-term basis to meet the REIT distribution requirements, even if the then-prevailing market conditions are not favorable for these borrowings. To qualify as a REIT, we generally must distribute to our shareholders at least 90% of our net taxable income each year, excluding net capital gains. In addition, we will be subject to a 4% nondeductible excise tax on the amount, if any, by which certain distributions made by us with respect to the calendar year are less than the sum of 85% of our ordinary income, 95% of our capital gain net income for that year, and any undistributed taxable income from prior periods. We intend to make distributions to our shareholders to comply with the 90% distribution requirement and to avoid the nondeductible excise tax and will rely for this purpose on distributions from our operating partnership. However, we may need short-term debt or long-term debt or proceeds from asset sales or sales of common shares to fund required distributions as a result of differences in timing between the actual receipt of income and the recognition of income for federal income tax purposes, or the effect of non-deductible capital expenditures, the creation of reserves or required debt or amortization payments. The inability of our cash flows to cover our distribution requirements could have an adverse impact on our ability to raise short and long-term debt or sell equity securities in order to fund distributions required to maintain our REIT status.
Complying with REIT requirements may force us to forego otherwise attractive opportunities or liquidate otherwise attractive investments. To qualify and maintain our status as a REIT, we must satisfy certain requirements with respect to the character of our assets. If we fail to comply with these requirements at the end of any quarter, we must correct such failure within 30 days after the end of the quarter (by, possibly, selling assets notwithstanding their prospects as an investment) to avoid losing our REIT status. If we fail to comply with these requirements at the end of any quarter, and the failure exceeds a minimum threshold, we may be able to preserve our REIT status if (a) the failure was due to reasonable cause and not to willful neglect, (b) we dispose of the assets causing the failure within six months after the last day of the quarter in which we identified the failure, (c) we file a schedule with the IRS describing each asset that caused the failure, and (d) we pay an additional tax of the greater of $50,000 or the product of the highest applicable tax rate multiplied by the net income generated on those assets. As a result, compliance with the REIT requirements may require us to liquidate or forego otherwise attractive investments. These actions could have the effect of reducing our income and amounts available for distribution to our shareholders.
Even if we qualify as a REIT, we may face other tax liabilities that reduce our cash flow. Even if we qualify for taxation as a REIT, we may be subject to certain federal, state and local taxes on our income and assets, including taxes on any undistributed income, tax on income from some activities conducted a result of a foreclosure, and state or local income, property and transfer taxes, such as mortgage recording taxes. Any of these taxes would decrease cash available for distribution to our shareholders. In addition, in order to meet the REIT qualification requirements, or to avert the imposition of a 100% tax that applies to certain gains derived by a REIT from dealer property or inventory, we may hold some of our assets through a taxable REIT subsidiary ("TRS"). While the TRS structure would allow the economic benefits of ownership to flow to us, a TRS is subject to tax on its income from the operations of the assisted living facilities at the federal and state level. In addition, a TRS is subject to detailed tax regulations that affect how it may be capitalized and operated.
2012 Annual Report 20
Index
We may be subject to adverse legislative or regulatory tax changes that could reduce the market price of our common shares. At any time, the federal income tax laws governing REITs or the administrative interpretations of those laws may be amended. Any of those new laws or interpretations may take effect retroactively and could adversely affect us or the market price of our common shares of beneficial interest.
The U.S. federal income tax laws governing REITs are complex. We intend to operate in a manner that will qualify us as a REIT under the U.S. federal income tax laws. The REIT qualification requirements are extremely complex, however, and interpretations of the U.S. federal income tax laws governing qualification as a REIT are limited. Accordingly, we cannot be certain that we will be successful in operating so we can continue to qualify as a REIT. At any time, new laws, interpretations, or court decisions may change the federal tax laws or the U.S. federal income tax consequences of our qualification as a REIT.
Our Board of Trustees may make changes to our major policies without approval of the holders of our shares of beneficial interest . Our operating and financial policies, including policies relating to development and acquisition of real estate, financing, growth, operations, indebtedness, capitalization and distributions, are exclusively determined by our Board of Trustees. Our Board of Trustees may amend or revoke those policies, and other policies, without advance notice to, or the approval of, the holders of our shares of beneficial interest. Accordingly, our shareholders do not control these policies, and policy changes could adversely affect our financial condition and results of operations.
Risks Related to the Purchase of our Shares of Beneficial Interest
Our future growth depends, in part, on our ability to raise additional equity capital, which will have the effect of diluting the interests of the holders of our common shares. Our future growth depends upon, among other things, our ability to raise equity capital and issue limited partnership units of IRET Properties. The issuance of additional common shares, and of limited partnership units for which we subsequently issue common shares upon the redemption of the limited partnership units, will dilute the interests of the current holders of our common shares. Additionally, sales of substantial amounts of our common shares or preferred shares in the public market, or issuances of our common shares upon redemption of limited partnership units in our operating partnership, or the perception that such sales or issuances might occur, could adversely affect the market price of our common shares.
We may issue additional classes or series of our shares of beneficial interest with rights and preferences that are superior to the rights and preferences of our common shares. Without the approval of the holders of our common shares, our Board of Trustees may establish additional classes or series of our shares of beneficial interest, and such classes or series may have dividend rights, conversion rights, voting rights, terms of redemption, redemption prices, liquidation preferences or other rights and preferences that are superior to the rights of the holders of our common shares.
Payment of distributions on our shares of beneficial interest is not guaranteed. Our Board of Trustees must approve our payment of distributions and may elect at any time, or from time to time, and for an indefinite duration, to reduce the distributions payable on our shares of beneficial interest or to not pay distributions on our shares of beneficial interest. Our Board of Trustees may reduce distributions for a variety of reasons, including, but not limited to, the following:
| • | operating and financial results below expectations that cannot support the current distribution payment; |
| • | unanticipated costs or cash requirements; or |
| • | a conclusion that the payment of distributions would cause us to breach the terms of certain agreements or contracts, such as financial ratio covenants in our debt financing documents. |
Our distributions are not eligible for the lower tax rate on dividends except in limited situations. The tax rate applicable to qualifying corporate dividends received by shareholders taxed at individual rates has been reduced to a maximum rate of 15%. This special tax rate is generally not applicable to distributions paid by a REIT, unless such distributions represent earnings on which the REIT itself had been taxed. As a result, distributions (other than capital gain distributions) paid by us to shareholders taxed at individual rates will generally be subject to the tax rates that are otherwise applicable to ordinary income which, currently, are as high as 35%. Although the earnings of a REIT that are distributed to its shareholders are still generally subject to less federal income taxation than earnings of a non-REIT C corporation that are distributed to its shareholders net of corporate-level income tax, this law change
2012 Annual Report 21
Index
may make an investment in our securities comparatively less attractive relative to an investment in the shares of other entities which pay dividends but are not formed as REITs.
Changes in market conditions could adversely affect the price of our securities . As is the case with any publicly-traded securities, certain factors outside of our control could influence the value of our common shares, Series A preferred shares and any other securities to be issued in the future. These conditions include, but are not limited to:
| • | market perception of REITs in general; |
| • | market perception of REITs relative to other investment opportunities; |
| • | market perception of our financial condition, performance, distributions and growth potential; |
| • | prevailing interest rates; |
| • | general economic and business conditions; |
| • | government action or regulation, including changes in the tax laws; and |
| • | relatively low trading volumes in securities of REITS. |
Higher market interest rates may adversely affect the market price of our securities, and low trading volume on the NASDAQ Global Select Market may prevent the timely resale of our securities . One of the factors that investors may consider important in deciding whether to buy or sell shares of a REIT is the distribution with respect to such REIT's shares as a percentage of the price of those shares, relative to market interest rates. If market interest rates rise, prospective purchasers of REIT shares may expect a higher distribution rate in order to maintain their investment. Higher market interest rates would likely increase our borrowing costs and might decrease funds available for distribution. Thus, higher market interest rates could cause the market price of our common shares to decline. In addition, although our common shares of beneficial interest are listed on the NASDAQ Global Select Market, the daily trading volume of our shares may be lower than the trading volume for other companies. The average daily trading volume for the period of May 1, 2011 through April 30, 2012 was 345,965 shares and the average monthly trading volume for the period of May 1, 2011 through April 30, 2012 was 7,265,262 shares. As a result of this trading volume, an owner of our common shares may encounter difficulty in selling our shares in a timely manner and may incur a substantial loss.
Item 1B. Unresolved Staff Comments
None.
Item 2. Properties
IRET is organized as a REIT under Section 856-858 of the Internal Revenue Code, and is in the business of owning, leasing, developing and acquiring real estate properties. These real estate investments are managed by our own employees and by third-party professional real estate management companies on our behalf.
Total Real Estate Rental Revenue
As of April 30, 2012, our real estate portfolio consisted of 84 multi-family residential properties and 182 commercial properties, consisting of commercial office, commercial medical, commercial industrial and commercial retail properties, comprising 27.1%, 31.9%, 27.7%, 6.5%, and 6.8%, respectively, of our total real estate portfolio, based on the dollar amount of our original investment plus capital improvements, net of accumulated depreciation, through April 30, 2012. Gross annual rental revenue and percentages of total annual real estate rental revenue by property type for each of the three most recent fiscal years ended April 30, are as follows:
2012 Annual Report 22
Index
Fiscal Year Ended April 30, (in thousands) | Multi- Family Residential Gross Revenue | % | Commercial Office Gross Revenue | % | Commercial Medical Gross Revenue | % | Commercial Industrial Gross Revenue | % | Commercial Retail Gross Revenue | % | All Segments Gross Revenue | |||||||||||||||||||||||||||||||||
2012 | $ | 74,190 | 30.7 | % | $ | 74,334 | 30.7 | % | $ | 65,531 | 27.1 | % | $ | 14,325 | 5.9 | % | $ | 13,408 | 5.6 | % | $ | 241,788 | ||||||||||||||||||||||
2011 | $ | 66,838 | 28.2 | % | $ | 77,747 | 32.8 | % | $ | 66,048 | 27.8 | % | $ | 13,165 | 5.6 | % | $ | 13,156 | 5.6 | % | $ | 236,954 | ||||||||||||||||||||||
2010 | $ | 65,478 | 28.3 | % | $ | 82,079 | 35.5 | % | $ | 57,439 | 24.9 | % | $ | 13,095 | 5.7 | % | $ | 12,852 | 5.6 | % | $ | 230,943 | ||||||||||||||||||||||
Average Effective Annual Rent
The table below sets out the average effective annual rent per square foot or unit for each of the last five fiscal years in each of our five segments:
Average Effective Annual Rent per square foot or unit | ||||||||||||||||||||
As of April 30 | Multi-family Residential (1) | Commercial Office (2) | Commercial Medical (2) | Commercial Industrial (2) | Commercial Retail (2) | |||||||||||||||
2012 | $ | 738 | $ | 13 | $ | 17 | $ | 4 | $ | 8 | ||||||||||
2011 | $ | 688 | $ | 13 | $ | 19 | $ | 4 | $ | 8 | ||||||||||
2010 | $ | 680 | $ | 13 | $ | 18 | $ | 4 | $ | 9 | ||||||||||
2009 | $ | 673 | $ | 13 | $ | 18 | $ | 4 | $ | 8 | ||||||||||
2008 | $ | 654 | $ | 13 | $ | 18 | $ | 3 | $ | 9 | ||||||||||
(1) | Monthly rent per unit, calculated as annualized rental revenue divided by the occupied units as of April 30. |
(2) | Monthly rental rate per square foot calculated as annualized contractual base rental income, net of free rent, divided by the leased square feet as of April 30. |
Physical Occupancy Rates
Physical occupancy levels on a stabilized property and all-property basis are shown below for each property type in each of the three most recent fiscal years ended April 30. Stabilized properties are those properties owned for the entirety of both periods being compared, and, in the case of development or re-development properties, which have achieved a target level of occupancy. In the case of multi-family residential properties, lease arrangements with individual tenants vary from month-to-month to one-year leases. Leases on commercial properties generally vary from month-to-month to 20 years.
Segments | Stabilized Properties | All Properties | |||||
Fiscal Year Ended April 30, | Fiscal Year Ended April 30, | ||||||
2012 | 2011 | 2010 | 2012 | 2011 | 2010 | ||
Multi-Family Residential | 94.2% | 92.8% | 89.7% | 93.7% | 92.8% | 89.7% | |
Commercial Office | 78.4% | 79.5% | 83.9% | 78.6% | 79.7% | 83.4% | |
Commercial Medical | 93.8% | 95.8% | 95.7% | 94.5% | 96.0% | 95.1% | |
Commercial Industrial | 95.4% | 90.0% | 90.6% | 95.5% | 90.1% | 90.7% | |
Commercial Retail | 86.6% | 83.2% | 82.7% | 87.1% | 82.2% | 82.7% | |
Certain Lending Requirements
In certain instances, in connection with the acquisition of investment properties, the lender financing such properties may require, as a condition of the loan, that the properties be owned by a "single asset entity." Accordingly, we have organized a number of wholly-owned subsidiary corporations, and IRET Properties has organized several limited partnerships, for the purpose of holding title in an entity that complies with such lending conditions. All financial statements of these subsidiaries are consolidated into our financial statements.
Management and Leasing of Our Real Estate Assets
We conduct our corporate operations from offices in Minot, North Dakota and Minneapolis and St. Cloud, Minnesota. We also have property management offices in Kansas, Minnesota, Missouri, Montana, Nebraska, North Dakota, and South Dakota. The day-to-day management of our properties is carried out by our own employees and in certain cases by third-party property management companies. In markets where the amount of rentable square footage we own does not justify self-management, when properties acquired have effective pre-existing property management in place, or when for other reasons particular properties are in our judgment not attractive candidates
2012 Annual Report 23
Index
for self-management, we utilize third-party professional management companies for day-to-day management. However, all decisions relating to purchase, sale, insurance coverage, capital improvements, approval of commercial leases, annual operating budgets and major renovations are made exclusively by our employees and implemented by the third-party management companies. The management and leasing of our multi-family residential properties previously was generally handled by locally-based, third-party management companies, but during fiscal year 2010 we began implementing our previously-announced plan to transfer the management of the majority of our commercial and multi-family residential properties to our own employees, and that transfer is now substantially complete. Generally, our management contracts provide for compensation ranging from 2.5% to 6.0% of gross rent collections and, typically, we may terminate these contracts in 60 days or less or upon the property manager's failure to meet certain specified financial performance goals. With respect to multi-tenant commercial properties, we rely almost exclusively on third-party brokers to locate potential tenants. As compensation, brokers may receive a commission that is generally calculated as a percentage of the net rent to be paid over the term of the lease. We believe that the broker commissions paid by us conform to market and industry standards, and accordingly are commercially reasonable.
Summary of Real Estate Investment Portfolio
As of April 30, (in thousands, except percentages) | 2012 | % | 2011 | % | 2010 | % | ||||||||||||||||||
Real estate investments |
|
|
| |||||||||||||||||||||
Property owned | $ | 1,892,009 | $ | 1,770,798 | $ | 1,800,519 | ||||||||||||||||||
Less accumulated depreciation | (373,490 | ) | (328,952 | ) | (308,626 | ) | ||||||||||||||||||
| $ | 1,518,519 | 97.5 | % | $ | 1,441,846 | 98.9 | % | $ | 1,491,893 | 99.4 | % | |||||||||||||
Development in progress | 27,599 | 1.8 | % | 9,693 | 0.7 | % | 2,831 | 0.2 | % | |||||||||||||||
Unimproved land | 10,990 | 0.7 | % | 6,550 | 0.4 | % | 6,007 | 0.4 | % | |||||||||||||||
Mortgage loans receivable | 0 | 0.0 | % | 156 | 0.0 | % | 158 | 0.0 | % | |||||||||||||||
Total real estate investments | $ | 1,557,108 | 100.0 | % | $ | 1,458,245 | 100.0 | % | $ | 1,500,889 | 100.0 | % | ||||||||||||
Summary of Individual Properties Owned as of April 30, 2012
The following table presents information regarding our 266 residential and commercial properties as well as unimproved land and development properties owned as of April 30, 2012. We own the following interests in real estate either through our wholly-owned subsidiaries or by ownership of a controlling interest in an entity owning the real estate. We account for these interests on a consolidated basis. Additional information is included in Schedule III to our financial statements included in the Annual Report on Form 10-K.
* = Real estate not owned in fee; all or a portion is leased under a ground or air rights lease .
Property Name and Location | Units | (in thousands) Investment (initial cost plus improvements less impairment) | Physical Occupancy as of April 30, 2012 | |||||||||
MULTI-FAMILY RESIDENTIAL | ||||||||||||
11th Street 3 Plex - Minot, ND | 3 | $ | 74 | 100.0 | % | |||||||
4th Street 4 Plex - Minot, ND | 4 | 102 | 100.0 | % | ||||||||
Apartments on Main - Minot, ND | 10 | 1,301 | 90.0 | % | ||||||||
Arbors - S Sioux City, NE | 192 | 8,118 | 87.0 | % | ||||||||
Ashland - Grand Forks, ND | 84 | 8,310 | 100.0 | % | ||||||||
Boulder Court - Eagan, MN | 115 | 9,072 | 95.7 | % | ||||||||
Brookfield Village - Topeka, KS | 160 | 8,388 | 96.9 | % | ||||||||
Brooklyn Heights - Minot, ND | 72 | 2,327 | 100.0 | % | ||||||||
Campus Center - St. Cloud, MN | 92 | 2,776 | 88.0 | % | ||||||||
Campus Heights - St. Cloud, MN | 49 | 785 | 40.8 | % | ||||||||
Campus Knoll - St. Cloud, MN | 71 | 1,854 | 87.3 | % | ||||||||
Campus Plaza - St. Cloud, MN | 24 | 404 | 100.0 | % | ||||||||
Campus Side - St. Cloud, MN | 48 | 798 | 83.3 | % | ||||||||
Campus View - St. Cloud, MN | 48 | 788 | 68.8 | % | ||||||||
Candlelight - Fargo, ND | 66 | 1,889 | 87.9 | % | ||||||||
2012 Annual Report 24
Index
Property Name and Location | Units | (in thousands) Investment (initial cost plus improvements less impairment) | Physical Occupancy as of April 30, 2012 | |||||||||
MULTI-FAMILY RESIDENTIAL - continued | ||||||||||||
Canyon Lake - Rapid City, SD | 109 | $ | 5,062 | 96.3 | % | |||||||
Castlerock - Billings, MT | 166 | 7,223 | 98.2 | % | ||||||||
Chateau - Minot, ND (1) | 32 | 2,090 | n/a | |||||||||
Cimarron Hills - Omaha, NE | 234 | 14,557 | 95.7 | % | ||||||||
Colonial Villa - Burnsville, MN | 240 | 17,320 | 75.0 | % | ||||||||
Colton Heights - Minot, ND | 18 | 1,110 | 94.4 | % | ||||||||
Cornerstone - St. Cloud, MN | 24 | 407 | 58.3 | % | ||||||||
Cottage West Twin Homes - Sioux Falls, SD | 50 | 4,763 | 100.0 | % | ||||||||
Cottonwood - Bismarck, ND | 268 | 21,085 | 100.0 | % | ||||||||
Country Meadows - Billings, MT | 133 | 9,367 | 97.0 | % | ||||||||
Crestview - Bismarck, ND | 152 | 5,785 | 100.0 | % | ||||||||
Crown - Rochester, MN | 48 | 3,678 | 97.9 | % | ||||||||
Crown Colony - Topeka, KS | 220 | 12,472 | 97.3 | % | ||||||||
East Park - Sioux Falls, SD | 84 | 3,201 | 98.8 | % | ||||||||
Evergreen - Isanti, MN | 36 | 3,172 | 94.4 | % | ||||||||
Evergreen II - Isanti, MN | 36 | 3,477 | 80.6 | % | ||||||||
Fairmont - Minot, ND | 12 | 408 | 100.0 | % | ||||||||
Forest Park - Grand Forks, ND | 269 | 12,563 | 99.3 | % | ||||||||
Gables Townhomes - Sioux Falls, SD | 24 | 2,293 | 91.7 | % | ||||||||
Grand Gateway - St. Cloud, MN | 116 | 7,914 | 87.1 | % | ||||||||
Greenfield - Omaha, NE | 96 | 5,212 | 100.0 | % | ||||||||
Heritage Manor - Rochester, MN | 182 | 9,515 | 91.2 | % | ||||||||
Indian Hills - Sioux City, IA | 120 | 6,202 | 92.5 | % | ||||||||
Kirkwood Manor - Bismarck, ND | 108 | 4,517 | 100.0 | % | ||||||||
Lancaster - St. Cloud, MN | 83 | 4,056 | 74.7 | % | ||||||||
Landmark - Grand Forks, ND | 90 | 2,543 | 100.0 | % | ||||||||
Legacy - Grand Forks, ND | 361 | 28,536 | 100.0 | % | ||||||||
Mariposa - Topeka, KS | 54 | 5,843 | 100.0 | % | ||||||||
Monticello Village - Monticello, MN | 60 | 4,645 | 100.0 | % | ||||||||
North Pointe - Bismarck, ND | 73 | 4,503 | 98.6 | % | ||||||||
Northern Valley - Rochester, MN | 16 | 769 | 87.5 | % | ||||||||
Oakmont Estates - Sioux Falls, SD | 80 | 5,670 | 97.5 | % | ||||||||
Oakwood Estates - Sioux Falls, SD | 160 | 7,339 | 97.5 | % | ||||||||
Olympic Village - Billings, MT | 274 | 13,882 | 98.5 | % | ||||||||
Olympik Village - Rochester, MN | 140 | 8,494 | 92.9 | % | ||||||||
Oxbow Park - Sioux Falls, SD | 120 | 5,951 | 97.5 | % | ||||||||
Park Meadows - Waite Park, MN | 360 | 14,423 | 85.0 | % | ||||||||
Pebble Springs - Bismarck, ND | 16 | 856 | 93.8 | % | ||||||||
Pinehurst - Billings, MT | 21 | 919 | 95.2 | % | ||||||||
Pines - Minot, ND | 16 | 399 | 100.0 | % | ||||||||
Plaza - Minot, ND | 71 | 15,821 | 98.6 | % | ||||||||
Pointe West - Rapid City, SD | 90 | 4,896 | 98.9 | % | ||||||||
Prairie Winds - Sioux Falls, SD | 48 | 2,393 | 91.7 | % | ||||||||
Prairiewood Meadows - Fargo, ND | 85 | 3,764 | 100.0 | % | ||||||||
Quarry Ridge - Rochester, MN | 156 | 15,255 | 98.7 | % | ||||||||
Regency Park Estates - St. Cloud, MN | 147 | 11,040 | 83.0 | % | ||||||||
Ridge Oaks - Sioux City, IA | 132 | 6,187 | 97.0 | % | ||||||||
Rimrock West - Billings, MT | 78 | 5,175 | 98.7 | % | ||||||||
Rocky Meadows - Billings, MT | 98 | 7,253 | 99.0 | % | ||||||||
Rum River - Isanti, MN | 72 | 5,740 | 88.9 | % | ||||||||
Sherwood - Topeka, KS | 300 | 18,329 | 96.3 | % | ||||||||
2012 Annual Report 25
Index
Property Name and Location | Units | (in thousands) Investment (initial cost plus improvements less impairment) | Physical Occupancy as of April 30, 2012 | |||||||||
MULTI-FAMILY RESIDENTIAL - continued | ||||||||||||
Sierra Vista - Sioux Falls, SD | 44 | $ | 2,394 | 100.0 | % | |||||||
South Pointe - Minot, ND | 196 | 12,237 | 100.0 | % | ||||||||
Southview - Minot, ND | 24 | 949 | 95.8 | % | ||||||||
Southwind - Grand Forks, ND | 164 | 7,807 | 99.4 | % | ||||||||
Summit Park - Minot, ND | 95 | 3,081 | 98.9 | % | ||||||||
Sunset Trail - Rochester, MN | 146 | 15,364 | 95.2 | % | ||||||||
Sycamore Village - Sioux Falls, SD | 48 | 1,875 | 100.0 | % | ||||||||
Temple - Minot, ND | 4 | 226 | 100.0 | % | ||||||||
Terrace Heights - Minot, ND | 16 | 424 | 100.0 | % | ||||||||
Terrace On The Green - Moorhead, MN | 116 | 3,306 | 93.1 | % | ||||||||
The Meadows - Jamestown, ND | 81 | 6,172 | 96.3 | % | ||||||||
Thomasbrook - Lincoln, NE | 264 | 13,659 | 99.2 | % | ||||||||
University Park Place - St. Cloud, MN | 35 | 582 | 42.9 | % | ||||||||
Valley Park - Grand Forks, ND | 168 | 6,912 | 96.4 | % | ||||||||
Village Green - Rochester, MN | 36 | 3,111 | 94.4 | % | ||||||||
West Stonehill - Waite Park, MN | 313 | 15,333 | 80.8 | % | ||||||||
Westridge - Minot, ND | 33 | 2,010 | 97.0 | % | ||||||||
Westwood Park - Bismarck, ND | 65 | 3,621 | 100.0 | % | ||||||||
Williston Garden - Williston, ND | 72 | 9,678 | 98.6 | % | ||||||||
Winchester - Rochester, MN | 115 | 7,807 | 97.4 | % | ||||||||
Woodridge - Rochester, MN | 110 | 8,175 | 98.2 | % | ||||||||
TOTAL MULTI-FAMILY RESIDENTIAL | 9,161 | $ | 539,783 | 93.7 | % | |||||||
Property Name and Location | Approximate Net Rentable Square Footage | (in thousands) Investment (initial cost plus improvements) | Physical Occupancy as of April 30, 2012 | |||||||||
COMMERCIAL OFFICE | ||||||||||||
1st Avenue Building - Minot, ND | 4,427 | $ | 71 | 100.0 | % | |||||||
2030 Cliff Road - Eagan, MN | 13,374 | 1,071 | 100.0 | % | ||||||||
610 Business Center IV - Brooklyn Park, MN | 78,190 | 9,403 | 100.0 | % | ||||||||
7800 West Brown Deer Road - Milwaukee, WI | 175,610 | 12,472 | 98.0 | % | ||||||||
American Corporate Center - Mendota Heights, MN | 138,959 | 21,540 | 87.4 | % | ||||||||
Ameritrade - Omaha, NE | 73,742 | 8,349 | 100.0 | % | ||||||||
Benton Business Park - Sauk Rapids, MN | 30,464 | 1,528 | 70.2 | % | ||||||||
Bismarck 715 East Broadway - Bismarck, ND | 22,187 | 2,778 | 100.0 | % | ||||||||
Bloomington Business Plaza - Bloomington, MN | 121,669 | 8,968 | 55.4 | % | ||||||||
Brenwood - Minnetonka, MN | 176,800 | 17,501 | 59.0 | % | ||||||||
Brook Valley I - La Vista, NE | 30,000 | 2,099 | 50.1 | % | ||||||||
Burnsville Bluffs II - Burnsville, MN | 45,019 | 3,415 | 67.2 | % | ||||||||
Cold Spring Center - St. Cloud, MN | 77,634 | 9,398 | 98.0 | % | ||||||||
Corporate Center West - Omaha, NE | 141,724 | 22,330 | 100.0 | % | ||||||||
Crosstown Centre - Eden Prairie, MN | 181,224 | 19,073 | 66.5 | % | ||||||||
Dewey Hill Business Center - Edina, MN | 73,338 | 5,399 | 35.7 | % | ||||||||
Farnam Executive Center - Omaha, NE | 94,832 | 13,592 | 100.0 | % | ||||||||
Flagship - Eden Prairie, MN | 138,825 | 24,476 | 95.6 | % | ||||||||
Gateway Corporate Center - Woodbury, MN | 59,827 | 9,838 | 33.2 | % | ||||||||
Golden Hills Office Center - Golden Valley, MN | 190,758 | 24,811 | 90.7 | % | ||||||||
Great Plains - Fargo, ND | 122,040 | 15,376 | 100.0 | % | ||||||||
Highlands Ranch I - Highlands Ranch, CO | 71,430 | 11,057 | 100.0 | % | ||||||||
2012 Annual Report 26
Index
Property Name and Location | Approximate Net Rentable Square Footage | (in thousands) Investment (initial cost plus Improvements less impairment) | Physical Occupancy as of April 30, 2012 | |||||||||
COMMERCIAL OFFICE - continued | ||||||||||||
Highlands Ranch II - Highlands Ranch, CO | 81,173 | $ | 12,383 | 88.7 | % | |||||||
Interlachen Corporate Center - Edina, MN | 105,084 | 18,624 | 67.5 | % | ||||||||
Intertech Building - Fenton, MO | 64,749 | 6,603 | 78.1 | % | ||||||||
Mendota Office Center I - Mendota Heights, MN | 59,852 | 7,371 | 71.3 | % | ||||||||
Mendota Office Center II - Mendota Heights, MN | 88,398 | 12,680 | 88.2 | % | ||||||||
Mendota Office Center III - Mendota Heights, MN | 60,776 | 6,962 | 65.3 | % | ||||||||
Mendota Office Center IV - Mendota Heights, MN | 72,231 | 9,283 | 100.0 | % | ||||||||
Minnesota National Bank - Duluth, MN | 18,869 | 1,912 | 100.0 | % | ||||||||
Minot 2505 16th Street SW - Minot, ND | 15,000 | 2,318 | 100.0 | % | ||||||||
Miracle Hills One - Omaha, NE | 83,448 | 13,375 | 76.9 | % | ||||||||
Nicollett VII - Burnsville, MN | 118,125 | 7,790 | 94.1 | % | ||||||||
Northgate I - Maple Grove, MN | 79,297 | 8,252 | 100.0 | % | ||||||||
Northgate II - Maple Grove, MN | 26,000 | 2,447 | 32.7 | % | ||||||||
Northpark Corporate Center - Arden Hills, MN | 146,087 | 17,933 | 33.1 | % | ||||||||
Omaha 10802 Farnam Dr - Omaha, NE | 58,574 | 6,836 | 98.6 | % | ||||||||
Pacific Hills - Omaha, NE | 143,075 | 17,983 | 79.9 | % | ||||||||
Pillsbury Business Center - Bloomington, MN | 42,929 | 2,010 | 61.2 | % | ||||||||
Plaza 16 - Minot, ND | 50,610 | 9,582 | 100.0 | % | ||||||||
Plaza VII - Boise, ID | 28,994 | 3,800 | 32.9 | % | ||||||||
Plymouth 5095 Nathan Lane - Plymouth, MN | 20,528 | 1,939 | 100.0 | % | ||||||||
Plymouth I - Plymouth, MN | 26,186 | 1,705 | 100.0 | % | ||||||||
Plymouth II - Plymouth, MN | 26,186 | 1,672 | 100.0 | % | ||||||||
Plymouth III - Plymouth, MN | 26,186 | 2,361 | 100.0 | % | ||||||||
Plymouth IV & V - Plymouth, MN | 126,930 | 15,705 | 92.1 | % | ||||||||
Prairie Oak Business Center - Eden Prairie, MN | 36,421 | 6,240 | 75.8 | % | ||||||||
Rapid City 900 Concourse Drive - Rapid City, SD | 75,815 | 7,388 | 59.4 | % | ||||||||
Riverport - Maryland Heights, MO | 121,316 | 21,569 | 64.6 | % | ||||||||
Southeast Tech Center - Eagan, MN | 58,300 | 6,475 | 30.4 | % | ||||||||
Spring Valley IV - Omaha, NE | 15,700 | 1,154 | 100.0 | % | ||||||||
Spring Valley V - Omaha, NE | 24,171 | 1,586 | 100.0 | % | ||||||||
Spring Valley X - Omaha, NE | 24,000 | 1,258 | 80.0 | % | ||||||||
Spring Valley XI - Omaha, NE | 24,000 | 1,273 | 100.0 | % | ||||||||
Superior Office Building - Duluth, MN | 20,000 | 2,619 | 100.0 | % | ||||||||
TCA Building - Eagan, MN | 103,640 | 10,005 | 85.2 | % | ||||||||
Three Paramount Plaza - Bloomington, MN | 75,526 | 9,293 | 73.3 | % | ||||||||
Thresher Square - Minneapolis, MN | 117,144 | 12,826 | 38.7 | % | ||||||||
Timberlands - Leawood, KS | 90,388 | 15,342 | 65.1 | % | ||||||||
UHC Office - International Falls, MN | 30,000 | 2,565 | 100.0 | % | ||||||||
US Bank Financial Center - Bloomington, MN | 153,311 | 17,077 | 92.6 | % | ||||||||
Viromed - Eden Prairie, MN | 48,700 | 4,864 | 100.0 | % | ||||||||
Wells Fargo Center - St Cloud, MN | 86,477 | 10,672 | 91.7 | % | ||||||||
West River Business Park - Waite Park, MN | 24,075 | 1,480 | 69.2 | % | ||||||||
Westgate - Boise, ID | 103,342 | 13,529 | 100.0 | % | ||||||||
Whitewater Plaza - Minnetonka, MN | 61,138 | 6,174 | 49.8 | % | ||||||||
Wirth Corporate Center - Golden Valley, MN | 74,568 | 9,561 | 15.7 | % | ||||||||
Woodlands Plaza IV - Maryland Heights, MO | 61,820 | 6,297 | 80.5 | % | ||||||||
TOTAL COMMERCIAL OFFICE | 5,061,212 | $ | 605,318 | 78.6 | % | |||||||
2012 Annual Report 27
Index
Property Name and Location | Approximate Net Rentable Square Footage | (in thousands) Investment (initial cost plus Improvements less impairment) | Physical Occupancy as of April 30, 2012 | |||||||||
COMMERCIAL MEDICAL | ||||||||||||
2800 Medical Building - Minneapolis, MN | 53,750 | $ | 9,523 | 89.2 | % | |||||||
2828 Chicago Avenue - Minneapolis, MN | 56,239 | 17,672 | 100.0 | % | ||||||||
Airport Medical - Bloomington, MN* | 24,218 | 4,678 | 100.0 | % | ||||||||
Barry Pointe Office Park - Kansas City, MO | 18,502 | 2,854 | 76.8 | % | ||||||||
Billings 2300 Grant Road - Billings, MT | 14,705 | 1,865 | 100.0 | % | ||||||||
Burnsville 303 Nicollet Medical (Ridgeview) - Burnsville, MN | 53,896 | 9,307 | 100.0 | % | ||||||||
Burnsville 305 Nicollet Medical (Ridgeview South) - Burnsville, MN | 36,199 | 5,994 | 100.0 | % | ||||||||
Casper 1930 E 12th Street (Park Place) - Casper, WY | 65,160 | 6,381 | 100.0 | % | ||||||||
Casper 3955 E 12th Street (Meadow Wind) - Casper, WY | 57,822 | 10,250 | 100.0 | % | ||||||||
Cheyenne 4010 N College Drive (Aspen Wind) - Cheyenne, WY | 47,509 | 11,160 | 100.0 | % | ||||||||
Cheyenne 4606 N College Drive (Sierra Hills) - Cheyenne, WY | 54,072 | 8,189 | 100.0 | % | ||||||||
Denfeld Clinic - Duluth, MN | 20,512 | 3,099 | 100.0 | % | ||||||||
Eagan 1440 Duckwood Medical - Eagan, MN | 17,640 | 2,587 | 100.0 | % | ||||||||
Edgewood Vista - Belgrade, MT | 5,192 | 814 | 100.0 | % | ||||||||
Edgewood Vista - Billings, MT | 11,800 | 1,882 | 100.0 | % | ||||||||
Edgewood Vista - Bismarck, ND | 74,112 | 9,740 | 100.0 | % | ||||||||
Edgewood Vista - Brainerd, MN | 82,535 | 9,620 | 100.0 | % | ||||||||
Edgewood Vista - Columbus, NE | 5,194 | 867 | 100.0 | % | ||||||||
Edgewood Vista - East Grand Forks, MN | 18,488 | 1,642 | 100.0 | % | ||||||||
Edgewood Vista - Fargo, ND | 167,391 | 21,645 | 100.0 | % | ||||||||
Edgewood Vista - Fremont, NE | 6,042 | 588 | 100.0 | % | ||||||||
Edgewood Vista - Grand Island, NE | 5,185 | 807 | 100.0 | % | ||||||||
Edgewood Vista - Hastings, NE | 6,042 | 606 | 100.0 | % | ||||||||
Edgewood Vista - Hermantown I, MN | 119,349 | 11,660 | 100.0 | % | ||||||||
Edgewood Vista - Hermantown II, MN | 160,485 | 11,269 | 100.0 | % | ||||||||
Edgewood Vista - Kalispell, MT | 5,895 | 644 | 100.0 | % | ||||||||
Edgewood Vista - Minot, ND | 108,503 | 12,635 | 100.0 | % | ||||||||
Edgewood Vista - Missoula, MT | 10,150 | 999 | 100.0 | % | ||||||||
Edgewood Vista - Norfolk, NE | 5,135 | 764 | 100.0 | % | ||||||||
Edgewood Vista - Omaha, NE | 6,042 | 676 | 100.0 | % | ||||||||
Edgewood Vista - Sioux Falls, SD | 11,800 | 1,289 | 100.0 | % | ||||||||
Edgewood Vista - Spearfish, SD | 84,126 | 8,942 | 100.0 | % | ||||||||
Edgewood Vista - Virginia, MN | 147,183 | 12,146 | 100.0 | % | ||||||||
Edina 6363 France Medical - Edina, MN* | 70,934 | 14,202 | 55.7 | % | ||||||||
Edina 6405 France Medical - Edina, MN* | 55,478 | 12,201 | 100.0 | % | ||||||||
Edina 6517 Drew Avenue - Edina, MN | 12,140 | 1,542 | 100.0 | % | ||||||||
Edina 6525 Drew Avenue - Edina, MN | 3,431 | 505 | 88.7 | % | ||||||||
Edina 6525 France SMC II - Edina, MN | 67,409 | 14,754 | 100.0 | % | ||||||||
Edina 6545 France SMC I - Edina MN* | 227,626 | 45,467 | 85.8 | % | ||||||||
Fresenius - Duluth, MN | 9,052 | 1,572 | 100.0 | % | ||||||||
Garden View - St. Paul, MN* | 43,404 | 7,819 | 100.0 | % | ||||||||
Gateway Clinic - Sandstone, MN* | 12,444 | 1,766 | 100.0 | % | ||||||||
Healtheast St John & Woodwinds - Maplewood & Woodbury, MN | 114,316 | 21,601 | 100.0 | % | ||||||||
High Pointe Health Campus - Lake Elmo, MN | 60,364 | 13,462 | 75.4 | % | ||||||||
Laramie 1072 N 22nd Street (Spring Wind) - Laramie, WY | 35,629 | 7,057 | 100.0 | % | ||||||||
Mariner Clinic - Superior, WI* | 28,928 | 3,864 | 100.0 | % | ||||||||
Minneapolis 701 25th Avenue Medical - Minneapolis, MN* | 57,212 | 8,682 | 100.0 | % | ||||||||
Missoula 3050 Great Northern - Missoula, MT | 14,640 | 1,971 | 100.0 | % | ||||||||
Nebraska Orthopedic Hospital - Omaha, NE* | 61,758 | 21,887 | 100.0 | % | ||||||||
Park Dental - Brooklyn Center, MN | 9,998 | 2,952 | 100.0 | % | ||||||||
2012 Annual Report 28
Index
Property Name and Location | Approximate Net Rentable Square Footage | (in thousands) Investment (initial cost plus Improvements less impairment) | Physical Occupancy as of April 30, 2012 | |||||||||
COMMERCIAL MEDICAL – continued | ||||||||||||
Pavilion I - Duluth, MN* | 45,081 | $ | 10,174 | 100.0 | % | |||||||
Pavilion II - Duluth, MN | 73,000 | 19,325 | 100.0 | % | ||||||||
Plaza 16-Trinity - Minot, ND | 24,795 | 9,535 | 100.0 | % | ||||||||
Ritchie Medical Plaza - St Paul, MN | 52,116 | 10,718 | 37.8 | % | ||||||||
Sartell 2000 23rd Street South - Sartell, MN* | 59,760 | 12,716 | 32.3 | % | ||||||||
Spring Creek-American Falls - American Falls, ID | 17,273 | 4,015 | 100.0 | % | ||||||||
Spring Creek-Soda Springs - Soda Springs, ID | 15,571 | 2,233 | 100.0 | % | ||||||||
Spring Creek-Eagle - Eagle, ID | 15,559 | 4,038 | 100.0 | % | ||||||||
Spring Creek-Meridian - Meridian, ID | 31,820 | 7,148 | 100.0 | % | ||||||||
Spring Creek-Overland - Overland, ID | 26,605 | 6,628 | 100.0 | % | ||||||||
Spring Creek-Boise - Boise, ID | 16,311 | 5,004 | 100.0 | % | ||||||||
Spring Creek-Ustick - Meridian, ID | 26,605 | 4,300 | 100.0 | % | ||||||||
St Michael Clinic - St Michael, MN | 10,796 | 2,851 | 100.0 | % | ||||||||
Stevens Point - Stevens Point, WI | 47,950 | 14,825 | 100.0 | % | ||||||||
Wells Clinic - Hibbing, MN | 18,810 | 2,660 | 100.0 | % | ||||||||
TOTAL COMMERCIAL MEDICAL | 2,927,688 | $ | 500,268 | 94.5 | % | |||||||
Property Name and Location | Approximate Net Rentable Square Footage | (in thousands) Investment (initial cost plus Improvements less impairment) | Physical Occupancy as of April 30, 2012 | |||||||||
COMMERCIAL INDUSTRIAL | ||||||||||||
API Building - Duluth, MN | 35,000 | $ | 1,723 | 100.0 | % | |||||||
Bloomington 2000 W 94th Street - Bloomington, MN | 100,850 | 7,337 | 100.0 | % | ||||||||
Bodycote Industrial Building - Eden Prairie, MN | 41,880 | 2,152 | 100.0 | % | ||||||||
Brooklyn Park 7401 Boone Avenue - Brooklyn Park, MN | 322,751 | 15,132 | 87.3 | % | ||||||||
Cedar Lake Business Center - St. Louis Park, MN | 50,400 | 3,771 | 73.8 | % | ||||||||
Clive 2075 NW 94th Street - Clive, IA | 42,510 | 3,067 | 100.0 | % | ||||||||
Dixon Avenue Industrial Park - Des Moines, IA | 606,006 | 13,808 | 100.0 | % | ||||||||
Eagan 2785 & 2795 Highway 55 - Eagan, MN | 198,600 | 5,628 | 74.3 | % | ||||||||
Fargo 1320 45th Street N - Fargo, ND | 42,244 | 4,159 | 100.0 | % | ||||||||
Lexington Commerce Center - Eagan, MN | 90,260 | 6,647 | 79.2 | % | ||||||||
Lighthouse - Duluth, MN | 59,292 | 1,885 | 100.0 | % | ||||||||
Metal Improvement Company - New Brighton, MN | 49,620 | 2,507 | 100.0 | % | ||||||||
Minnetonka 13600 County Road 62 - Minnetonka, MN | 69,984 | 3,702 | 100.0 | % | ||||||||
Roseville 2929 Long Lake Road - Roseville, MN | 172,057 | 10,960 | 100.0 | % | ||||||||
Stone Container - Fargo, ND | 195,075 | 7,141 | 100.0 | % | ||||||||
Stone Container - Roseville, MN | 229,072 | 8,452 | 100.0 | % | ||||||||
Urbandale 3900 106th Street - Urbandale, IA | 528,353 | 14,262 | 98.1 | % | ||||||||
Winsted Industrial Building - Winsted, MN | 41,685 | 1,049 | 100.0 | % | ||||||||
Woodbury 1865 Woodlane - Woodbury, MN | 69,600 | 5,620 | 100.0 | % | ||||||||
TOTAL COMMERCIAL INDUSTRIAL | 2,945,239 | $ | 119,002 | 95.5 | % | |||||||
2012 Annual Report 29
Index
Property Name and Location | Approximate Net Rentable Square Footage | (in thousands) Investment (initial cost plus Improvements less impairment) | Physical Occupancy as of April 30, 2012 | |||||||||
COMMERCIAL RETAIL | ||||||||||||
17 South Main - Minot, ND | 2,454 | $ | 287 | 100.0 | % | |||||||
Anoka Strip Center - Anoka, MN | 10,625 | 750 | 28.2 | % | ||||||||
Burnsville 1 Strip Center - Burnsville, MN | 8,526 | 1,188 | 100.0 | % | ||||||||
Burnsville 2 Strip Center - Burnsville, MN | 8,400 | 974 | 47.5 | % | ||||||||
Champlin South Pond - Champlin, MN | 26,020 | 3,603 | 77.2 | % | ||||||||
Chan West Village - Chanhassen, MN | 137,572 | 21,595 | 92.2 | % | ||||||||
Dakota West Plaza - Minot , ND | 16,921 | 615 | 94.9 | % | ||||||||
Duluth Denfeld Retail - Duluth, MN | 37,770 | 5,097 | 73.6 | % | ||||||||
Duluth NAPA - Duluth, MN | 15,582 | 1,934 | 30.5 | % | ||||||||
Eagan Community - Eagan, MN | 23,187 | 3,167 | 84.5 | % | ||||||||
Fargo Express Community - Fargo, ND | 34,226 | 2,489 | 100.0 | % | ||||||||
Forest Lake Auto - Forest Lake, MN | 6,836 | 509 | 100.0 | % | ||||||||
Forest Lake Westlake Center - Forest Lake, MN | 100,570 | 8,237 | 97.6 | % | ||||||||
Grand Forks Carmike - Grand Forks, ND | 28,528 | 2,546 | 100.0 | % | ||||||||
Grand Forks Medpark Mall - Grand Forks, ND | 59,117 | 5,740 | 91.7 | % | ||||||||
Jamestown Buffalo Mall - Jamestown, ND | 213,271 | 8,640 | 88.4 | % | ||||||||
Jamestown Business Center - Jamestown, ND | 100,249 | 2,654 | 80.9 | % | ||||||||
Kalispell Retail Center - Kalispell, MT | 52,000 | 3,473 | 100.0 | % | ||||||||
Lakeville Strip Center - Lakeville, MN | 9,488 | 2,040 | 76.0 | % | ||||||||
Minot 1400 31st Ave - Minot, ND | 48,960 | 11,425 | 100.0 | % | ||||||||
Minot Arrowhead - Minot, ND (1) | 78,095 | 6,101 | n/a | |||||||||
Minot Plaza - Minot, ND | 10,843 | 650 | 100.0 | % | ||||||||
Monticello C Store - Monticello, MN | 3,575 | 872 | 100.0 | % | ||||||||
Omaha Barnes & Noble - Omaha, NE | 26,985 | 3,699 | 100.0 | % | ||||||||
Pine City C-Store - Pine City, MN | 4,800 | 452 | 100.0 | % | ||||||||
Pine City Evergreen Square - Pine City, MN | 63,225 | 3,382 | 75.2 | % | ||||||||
Rochester Maplewood Square - Rochester, MN | 118,398 | 13,284 | 75.6 | % | ||||||||
St. Cloud Westgate - St. Cloud, MN | 105,446 | 8,099 | 100.0 | % | ||||||||
Weston Retail - Weston, WI | 25,644 | 1,681 | 0.0 | % | ||||||||
Weston Walgreens - Weston, WI | 14,820 | 2,455 | 100.0 | % | ||||||||
TOTAL COMMERCIAL RETAIL | 1,392,133 | $ | 127,638 | 87.1 | % | |||||||
SUBTOTAL | 12,335,433 | $ | 1,892,009 | |||||||||
2012 Annual Report 30
Index
Property Name and Location | (in thousands) Investment (initial cost plus improvements less impairment) | ||||
UNIMPROVED LAND | |||||
Bismarck 2130 S 12th St - Bismarck, ND | $ | 589 | |||
Bismarck 700 E Main - Bismarck, ND | 871 | ||||
Eagan Unimproved Land - Eagan, MN | 423 | ||||
Georgetown Square Undeveloped - Grand Chute, WI | 1,860 | ||||
Kalispell Unimproved Land - Kalispell, MT | 1,424 | ||||
Monticello Unimproved Land - Monticello, MN | 117 | ||||
Renaissance Heights - Williston, ND | 4,600 | ||||
River Falls Unimproved Land - River Falls, WI | 180 | ||||
Urbandale Unimproved Land - Urbandale, IA | 114 | ||||
Weston Unimproved Land - Weston, WI | 812 | ||||
TOTAL UNIMPROVED LAND | $ | 10,990 | |||
DEVELOPMENT IN PROGRESS | |||||
1st Avenue Building - Minot, ND | $ | 321 | |||
Chateau 2nd Floor Renovation - Minot, ND | 1,407 | ||||
Jamestown Medical Office Building - Jamestown, ND* | 1,611 | ||||
Laramie 1072 Expansion - Laramie, WY | 1,810 | ||||
Minot Arrowhead Outlot - Minot, ND | 75 | ||||
Minot IPS - Minot, ND | 2,250 | ||||
Quarry Ridge 2 - Rochester, MN | 15,436 | ||||
Williston Garden - Williston, ND | 4,689 | ||||
TOTAL DEVELOPMENT IN PROGRESS | $ | 27,599 | |||
TOTAL UNITS – RESIDENTIAL SEGMENT | 9,161 | ||||
TOTAL SQUARE FOOTAGE – COMMERCIAL SEGMENTS | 12,326,272 | ||||
TOTAL REAL ESTATE | $ | 1,930,598 | |||
(1) | Property was damaged by flooding and/or fire during fiscal year 2012. See Involuntary Conversion of Assets section in Note 2 of the Notes to Consolidated Financial Statements for more information. |
Mortgages Payable and Line of Credit
As of April 30, 2012, individual first mortgage loans on the above properties totaled $1.0 billion. Of the $1.0 billion total of mortgage indebtedness on April 30, 2012, $16.2 million, or 1.5%, is represented by variable rate mortgages on which the future interest rate will vary based on changes in the interest rate index for each respective loan. Principal payments due on our mortgage indebtedness are as follows:
(in thousands) | ||||
Year Ended April 30, | Mortgage Principal | |||
2013 | $ | 51,162 | ||
2014 | 74,572 | |||
2015 | 106,483 | |||
2016 | 86,464 | |||
2017 | 199,089 | |||
Thereafter | 530,919 | |||
Total | $ | 1,048,689 | ||
As of April 30, 2012, the Company has a multi-bank line of credit with First International Bank & Trust as lead bank. This line of credit has lending commitments of $60.0 million as of April 30, 2012, with a minimum outstanding principal balance requirement of $10.0 million. The Company had $39.0 million in borrowings outstanding under the line as of April 30, 2012. The facility has a maturity date of August 12, 2013, and is secured
2012 Annual Report 31
Index
by mortgages on various properties owned by IRET Properties and its subsidiaries. The interest rate on borrowings under the facility during fiscal year 2012 was Wall Street Journal Prime Rate +1.0%, with a floor of 5.65% and a cap of 8.65%; interest-only payments are due monthly based on the total amount of advances outstanding. The line of credit may be prepaid at par at any time. The facility includes covenants and restrictions requiring the Company to achieve on a calendar quarter basis a debt service coverage ratio on borrowing base collateral of 1.25x in the aggregate and 1.00x on individual assets in the collateral pool, and the Company is also required to maintain minimum depository account(s) totaling $6.0 million with the lead bank, of which $1.5 million is to be held in a non-interest bearing account. As of April 30, 2012, the Company believes it is in compliance with the facility covenants. Subsequent to the end of fiscal year 2012, effective June 15, 2012, IRET Properties agreed to an amendment to the line of credit to increase the interest rate spread on borrowings to the Wall Street Journal Prime Rate +1.25% and to lower the floor interest rate to 5.15%. All other terms of the line of credit remain unchanged.
Future Minimum Lease Receipts
The future minimum lease receipts to be received under leases for commercial properties in place as of April 30, 2012, assuming that no options to renew or buy out the leases are exercised, are as follows:
(in thousands) | ||||
Year Ended April 30, | Lease Payments | |||
2013 | $ | 112,174 | ||
2014 | 102,100 | |||
2015 | 90,119 | |||
2016 | 79,637 | |||
2017 | 65,030 | |||
Thereafter | 206,791 | |||
Total | $ | 655,851 | ||
Capital Expenditures
Each year we review the physical condition of each property we own. In order for our properties to remain competitive, attract new tenants, and retain existing tenants, we plan for a reasonable amount of capital improvements. For the year ended April 30, 2012, we spent approximately $35.2 million on capital improvements, tenant improvements and other capital expenditures.
The following table shows total and weighted average per square foot/unit recurring and non-recurring capital expenditures (excluding capital expenditures recoverable from tenants), and, for our commercial segment properties, tenant improvements (excluding tenant-funded tenant improvements) and leasing costs for the three years ended April 30, 2012, 2011 and 2010. We define recurring capital expenditures as those made on a regular or recurring basis to maintain a property's competitive position within its market, generally with a depreciable life of 5 to 12 years, but excluding (a) capital expenditures made in the year of acquisition and the following two years (i.e., excluding capital expenditures on non-stabilized properties), (b) improvements associated with the expansion or re-development of a building, (c) renovations to a building which change the underlying classification of the building (for example, from industrial to office or Class C office to Class A office) or (d) capital improvements that represent the addition of something new to a property, rather than the replacement of an existing item. We believe that recurring capital expenditures is a useful measure of performance because it provides an indication of the expenses that we can expect to incur on an on-going basis. Non-recurring capital expenditures correspond to major capital expenditures for items such as roof replacements or items that result in something new being added to the property (for example, the addition of a new heating and air conditioning unit that is not replacing one previously there), generally with a depreciable life of 20 to 40 years, and include expenditures completed in the year of acquisition and the following two years (i.e., including capital expenditures on non-stabilized properties).
2012 Annual Report 32
Index
(in thousands except per SF or Unit data) | ||||||||||||||||||||||||
Years Ended April 30, | ||||||||||||||||||||||||
2012 | 2011 | 2010 | ||||||||||||||||||||||
Amount | Rate/SF or Unit | Amount | Rate/SF or Unit | Amount | Rate/SF or Unit | |||||||||||||||||||
Commercial Office Properties: | ||||||||||||||||||||||||
Non-Recoverable Capital Expenditures | ||||||||||||||||||||||||
Recurring Capital Expenditures | $ | 148 | 0.03 | $ | 371 | 0.08 | $ | 361 | 0.07 | |||||||||||||||
Non-Recurring Capital Expenditures | $ | 992 | 0.20 | $ | 985 | 0.19 | $ | 1,853 | 0.37 | |||||||||||||||
Tenant Improvements | $ | 5,179 | 1.02 | $ | 4,547 | 0.90 | $ | 4,877 | 0.97 | |||||||||||||||
Leasing Commissions | $ | 1,683 | 0.33 | $ | 2,097 | 0.41 | $ | 1,801 | 0.36 | |||||||||||||||
Commercial Medical Properties: | ||||||||||||||||||||||||
Non-Recoverable Capital Expenditures | ||||||||||||||||||||||||
Recurring Capital Expenditures | $ | 86 | 0.03 | $ | 78 | 0.03 | $ | 115 | 0.05 | |||||||||||||||
Non-Recurring Capital Expenditures | $ | 562 | 0.19 | $ | 81 | 0.03 | $ | 185 | 0.07 | |||||||||||||||
Tenant Improvements | $ | 3,736 | 1.28 | $ | 2,090 | 0.77 | $ | 4,306 | 1.66 | |||||||||||||||
Leasing Commissions | $ | 557 | 0.19 | $ | 186 | 0.07 | $ | 425 | 0.16 | |||||||||||||||
Commercial Industrial Properties: | ||||||||||||||||||||||||
Non-Recoverable Capital Expenditures | ||||||||||||||||||||||||
Recurring Capital Expenditures | $ | 5 | 0.00 | $ | 0 | 0.00 | $ | 52 | 0.02 | |||||||||||||||
Non-Recurring Capital Expenditures | $ | 256 | 0.09 | $ | 511 | 0.17 | $ | 1,035 | 0.35 | |||||||||||||||
Tenant Improvements | $ | 1,179 | 0.40 | $ | 1,870 | 0.63 | $ | 528 | 0.18 | |||||||||||||||
Leasing Commissions | $ | 317 | 0.11 | $ | 398 | 0.13 | $ | 377 | 0.13 | |||||||||||||||
Commercial Retail Properties: | ||||||||||||||||||||||||
Non-Recoverable Capital Expenditures | ||||||||||||||||||||||||
Recurring Capital Expenditures | $ | 49 | 0.04 | $ | 67 | 0.05 | $ | 131 | 0.09 | |||||||||||||||
Non-Recurring Capital Expenditures | $ | 1,062 | 0.76 | $ | 174 | 0.12 | $ | 33 | 0.02 | |||||||||||||||
Tenant Improvements | $ | 214 | 0.15 | $ | 775 | 0.53 | $ | 420 | 0.29 | |||||||||||||||
Leasing Commissions | $ | 215 | 0.15 | $ | 280 | 0.19 | $ | 228 | 0.16 | |||||||||||||||
Multi-Family Residential Properties: | ||||||||||||||||||||||||
Recurring Capital Expenditures | $ | 6,416 | 752 | $ | 4,997 | 586 | $ | 4,488 | 488 | |||||||||||||||
Non-Recurring Capital Expenditures | $ | 5,001 | 546 | $ | 5,025 | 580 | $ | 5,336 | 551 | |||||||||||||||
Contracts or Options to Purchase
We have granted options to purchase certain of our properties to tenants in these properties, under lease agreements with the tenant. In general, these options grant the tenant the right to purchase the property at the greater of such property's appraised value or an annual compounded increase of a specified percentage of the initial cost to us. As of April 30, 2012, our properties subject to purchase options, the cost, plus improvements, of each such property and its gross rental revenue are as follows:
2012 Annual Report 33
Index
(in thousands) | ||||||||||||||||
Gross Rental Revenue | ||||||||||||||||
Property | Investment Cost | 2012 | 2011 | 2010 | ||||||||||||
Billings 2300 Grant Road - Billings, MT | $ | 2,522 | $ | 291 | $ | 226 | $ | n/a | ||||||||
Fargo 1320 45 th Street N - Fargo, ND | 4,160 | 400 | 333 | n/a | ||||||||||||
Great Plains - Fargo, ND | 15,375 | 1,843 | 1,876 | 1,876 | ||||||||||||
Healtheast St John & Woodwinds - Maplewood & Woodbury, MN | 21,601 | 2,152 | 2,152 | 2,152 | ||||||||||||
Minnesota National Bank - Duluth, MN | 2,272 | 127 | 105 | 164 | ||||||||||||
Missoula 3050 Great Northern - Missoula, MT | 2,723 | 315 | 243 | n/a | ||||||||||||
Sartell 2000 23 rd Street South - Sartell, MN | 12,716 | 868 | 1,209 | 1,173 | ||||||||||||
Spring Creek American Falls- American Falls, ID | 4,070 | 234 | n/a | n/a | ||||||||||||
Spring Creek Boise - Boise, ID | 5,075 | 293 | n/a | n/a | ||||||||||||
Spring Creek Eagle - Eagle, ID | 4,100 | 237 | n/a | n/a | ||||||||||||
Spring Creek Meridian - Meridian, ID | 7,250 | 417 | n/a | n/a | ||||||||||||
Spring Creek Overland - Overland, ID | 6,725 | 387 | n/a | n/a | ||||||||||||
Spring Creek Soda Springs - Soda Springs, ID | 2,262 | 130 | n/a | n/a | ||||||||||||
Spring Creek Ustick - Meridian, ID | 4,300 | 246 | n/a | n/a | ||||||||||||
St. Michael Clinic - St. Michael, MN | 2,851 | 248 | 244 | 241 | ||||||||||||
Stevens Point - Stevens Point, WI | 15,020 | 1,020 | 1,104 | 1,356 | ||||||||||||
Winsted Industrial Building - Winsted, MN | 1,049 | 32 | n/a | n/a | ||||||||||||
Total | $ | 114,071 | $ | 9,240 | $ | 7,492 | $ | 6,962 | ||||||||
Properties by State
The following table presents, as of April 30, 2012, the total amount of property owned, net of accumulated depreciation, by state of each of the five major segments of properties owned by us - multi-family residential, commercial office, commercial medical, commercial industrial and commercial retail:
(in thousands) | ||||||||||||||||||||||||||||
State (1) | Multi-Family Residential | Commercial Office | Commercial Medical | Commercial Industrial | Commercial Retail | All Segments | % of All Segments | |||||||||||||||||||||
Minnesota | $ | 141,553 | $ | 290,160 | $ | 242,428 | $ | 63,259 | $ | 61,093 | $ | 798,493 | 52.6 | % | ||||||||||||||
North Dakota | 129,049 | 24,308 | 49,317 | 8,685 | 34,122 | 245,481 | 16.1 | % | ||||||||||||||||||||
Nebraska | 32,403 | 77,680 | 21,330 | 0 | 2,421 | 133,834 | 8.8 | % | ||||||||||||||||||||
South Dakota | 33,765 | 5,348 | 9,073 | 0 | 0 | 48,186 | 3.2 | % | ||||||||||||||||||||
Kansas | 33,413 | 13,163 | 0 | 0 | 0 | 46,576 | 3.1 | % | ||||||||||||||||||||
Idaho | 0 | 13,303 | 32,828 | 0 | 0 | 46,131 | 3.0 | % | ||||||||||||||||||||
Montana | 30,882 | 0 | 7,312 | 0 | 2,790 | 40,984 | 2.7 | % | ||||||||||||||||||||
Wyoming | 0 | 0 | 40,768 | 0 | 0 | 40,768 | 2.7 | % | ||||||||||||||||||||
Iowa | 9,884 | 0 | 0 | 26,365 | 0 | 36,249 | 2.4 | % | ||||||||||||||||||||
Missouri | 0 | 30,440 | 2,525 | 0 | 0 | 32,965 | 2.2 | % | ||||||||||||||||||||
Wisconsin | 0 | 9,619 | 15,943 | 0 | 3,415 | 28,977 | 1.9 | % | ||||||||||||||||||||
Colorado | 0 | 19,875 | 0 | 0 | 0 | 19,875 | 1.3 | % | ||||||||||||||||||||
Total | $ | 410,949 | $ | 483,896 | $ | 421,524 | $ | 98,309 | $ | 103,841 | $ | 1,518,519 | 100.0 | % | ||||||||||||||
(2) | As of April 30, 2012, we also owned a retail property in Michigan that was classified as held for sale . |
Item 3. Legal Proceedings
In the ordinary course of our operations, we become involved in litigation. At this time, we know of no material pending or threatened legal proceedings, or other proceedings contemplated by governmental authorities, that would have a material impact upon us.
2012 Annual Report 34
Index
Item 4. Mine Safety Disclosures
Not Applicable
PART II
Item 5. Market for Registrant's Common Equity, Related Stockholder Matters and Issuer Purchases of Equity Securities
Quarterly Share and Distribution Data
Our common shares of beneficial interest trade on the NASDAQ Global Select Market under the symbol IRET. On June 25, 2012, the last reported sales price per share of our common shares on the NASDAQ was $7.59. The following table sets forth the quarterly high and low closing sales prices per share of our common shares as reported on the NASDAQ Global Select Market, and the distributions per common share and limited partnership unit declared with respect to each period.
Quarter Ended | High | Low | Distributions Declared (per share and unit) | |||||||||
Fiscal Year 2012 | ||||||||||||
April 30, 2012 | $ | 7.97 | $ | 7.22 | $ | 0.1300 | ||||||
January 31, 2012 | 7.64 | 6.89 | 0.1300 | |||||||||
October 31, 2011 | 8.12 | 6.92 | 0.1300 | |||||||||
July 31, 2011 | 9.69 | 8.07 | 0.1715 | |||||||||
Quarter Ended | High | Low | Distributions Declared (per share and unit) | |||||||||
Fiscal Year 2011 | ||||||||||||
April 30, 2011 | $ | 9.54 | $ | 8.92 | $ | 0.1715 | ||||||
January 31, 2011 | 9.26 | 8.74 | 0.1715 | |||||||||
October 31, 2010 | 8.90 | 7.97 | 0.1715 | |||||||||
July 31, 2010 | 9.20 | 8.25 | 0.1715 | |||||||||
It is IRET's policy to pay quarterly distributions to our common shareholders and unitholders, at the discretion of our Board of Trustees, based on our funds from operations, financial condition and capital requirements, annual distribution requirements under the REIT provisions of the Internal Revenue Code and such other factors as our Board of Trustees deems relevant. Since July 1, 1971, IRET has paid quarterly cash distributions in the months of January, April, July and October.
Shareholders
As of June 25, 2012, the Company had 4,218 common shareholders of record, and 90,265,194 common shares of beneficial interest (plus 21,260,038 limited partnership units potentially convertible into 21,260,038 common shares) were outstanding.
Unregistered Sales of Shares
Sales of Unregistered Securities. During the fiscal years ended April 30, 2012, 2011 and 2010, respectively, we issued an aggregate of 518,019, 221,573 and 431,737 unregistered common shares to holders of limited partnership units of IRET Properties upon redemption and conversion of an aggregate of 518,019, 221,573 and 431,737 limited partnership units of IRET Properties on a one-for-one basis. All such issuances of our common shares were exempt from registration as private placements under Section 4(2) of the Securities Act, including Regulation D promulgated thereunder. We have registered the re-sale of such common shares under the Securities Act.
Issuer Purchases of Equity Securities. The Company did not repurchase any of its equity securities during fiscal year 2012, except for repurchases of nominal amounts of fractional shares, at shareholder request.
2012 Annual Report 35
Index
Comparative Stock Performance
The information contained in this Comparative Stock Performance section shall not be deemed to be "soliciting material" or "filed" or incorporated by reference in future filings with the SEC, or subject to the liabilities of Section 18 of the Exchange Act, except to the extent that we specifically incorporate it by reference into a document filed under the Securities Act or the Exchange Act.
Set forth below is a graph that compares, for the five fiscal years commencing May 1, 2007, and ending April 30, 2012, the cumulative total returns for the Company's common shares with the comparable cumulative total return of two indexes, the Standard & Poor's 500 Index ("S&P 500"), and the FTSE NAREIT Equity REITs Index, which is an index prepared by the FTSE Group for the National Association of Real Estate Investment Trusts, which includes all tax-qualified equity REITs listed on the New York Stock Exchange, the American Stock Exchange and the NASDAQ Market.
The performance graph assumes that at the close of trading on April 30, 2007, the last trading day of fiscal year 2007, $100 was invested in the Company's common shares and in each of the indexes. The comparison assumes the reinvestment of all distributions. Cumulative total shareholder returns for the Company's common shares, the S&P 500 and the FTSE NAREIT Equity REITs Index are based on the Company's fiscal year ending April 30.
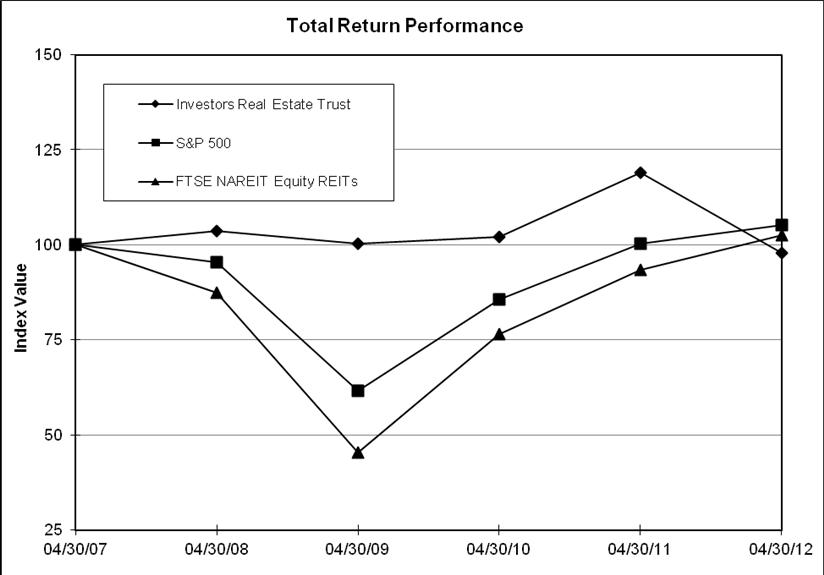
FY07 | FY08 | FY09 | FY10 | FY11 | FY12 | |
Investors Real Estate Trust | 100.00 | 103.55 | 100.36 | 102.15 | 118.95 | 97.85 |
S&P 500 | 100.00 | 95.32 | 61.66 | 85.61 | 100.36 | 105.13 |
FTSE NAREIT Equity REITs | 100.00 | 87.49 | 45.31 | 76.43 | 93.43 | 102.60 |
Source: SNL Financial LC
2012 Annual Report 36
Index
Item 6. Selected Financial Data
Set forth below is selected financial data on a historical basis for the Company for the five most recent fiscal years ended April 30. This information should be read in conjunction with the consolidated financial statements and notes appearing elsewhere in this Annual Report on Form 10-K.
(in thousands, except per share data) | ||||||||||||||||||||
2012 | 2011 | 2010 | 2009 | 2008 | ||||||||||||||||
Consolidated Income Statement Data | ||||||||||||||||||||
Revenue | $ | 241,788 | $ | 236,954 | $ | 230,943 | $ | 227,477 | $ | 208,847 | ||||||||||
Gain on sale of real estate, land, and other investments | $ | 349 | $ | 19,365 | $ | 68 | $ | 54 | $ | 556 | ||||||||||
Income from continuing operations | $ | 9,914 | $ | 4,519 | $ | 6,094 | $ | 10,008 | $ | 14,109 | ||||||||||
(Loss) income from discontinued operations | $ | (208 | ) | $ | 19,832 | $ | (1,509 | ) | $ | 705 | $ | 1,520 | ||||||||
Net income | $ | 9,706 | $ | 24,351 | $ | 4,585 | $ | 10,713 | $ | 15,629 | ||||||||||
Net income attributable to noncontrolling interests – Operating Partnership | $ | (1,359 | ) | $ | (4,449 | ) | $ | (562 | ) | $ | (2,227 | ) | $ | (3,677 | ) | |||||
Net income attributable to Investors Real Estate Trust | $ | 8,212 | $ | 20,082 | $ | 4,001 | $ | 8,526 | $ | 12,088 | ||||||||||
Consolidated Balance Sheet Data | ||||||||||||||||||||
Total real estate investments | $ | 1,557,108 | $ | 1,458,245 | $ | 1,500,889 | $ | 1,472,575 | $ | 1,456,178 | ||||||||||
Total assets | $ | 1,714,367 | $ | 1,615,363 | $ | 1,660,930 | $ | 1,605,091 | $ | 1,618,026 | ||||||||||
Mortgages payable | $ | 1,048,689 | $ | 993,803 | $ | 1,057,619 | $ | 1,070,158 | $ | 1,063,858 | ||||||||||
Revolving lines of credit | $ | 39,000 | $ | 30,000 | $ | 6,550 | $ | 5,500 | $ | 0 | ||||||||||
Total Investors Real Estate Trust shareholders' equity | $ | 432,989 | $ | 411,690 | $ | 409,523 | $ | 333,009 | $ | 344,074 | ||||||||||
Consolidated Per Common Share Data (basic and diluted) | ||||||||||||||||||||
Income from continuing operations - Investors Real Estate Trust | $ | .07 | $ | .02 | $ | .04 | $ | .10 | $ | .16 | ||||||||||
Income (loss) from discontinued operations - Investors Real Estate Trust | $ | .00 | $ | .20 | $ | (.01 | ) | $ | .01 | $ | .02 | |||||||||
Net income | $ | .07 | $ | .22 | $ | .03 | $ | .11 | $ | .18 | ||||||||||
Distributions | $ | .56 | $ | .69 | $ | .68 | $ | .68 | $ | .67 | ||||||||||
CALENDAR YEAR | 2011 | 2010 | 2009 | 2008 | 2007 |
Tax status of distributions | |||||
Capital gain | 37.48% | 0.00% | 0.09% | 0.00% | 1.49% |
Ordinary income | 18.04% | 28.53% | 39.17% | 53.43% | 51.69% |
Return of capital | 44.48% | 71.47% | 60.74% | 46.57% | 46.82% |
For the fiscal year ended April 30, 2012, IRET recognized approximately $1.3 million of net capital gain for federal income tax purposes. IRET designates the entire $1.3 million of net capital gain as capital gain dividends.
Item 7. Management's Discussion and Analysis of Financial Condition and Results of Operations
The following information is provided in connection with, and should be read in conjunction with, the consolidated financial statements included in this Annual Report on Form 10-K. We operate on a fiscal year ending on April 30. The following discussion and analysis is for the fiscal year ended April 30, 2012.
Overview
We are a self-advised equity real estate investment trust engaged in owning and operating income-producing real properties. Our investments include multi-family residential properties and commercial properties located primarily in the upper Midwest states of Minnesota and North Dakota. Our properties are diversified in property type and location. As of April 30, 2012, our real estate portfolio consisted of 84 multi-family residential properties containing 9,161 apartment units and having a total real estate investment amount net of accumulated depreciation of $411.0
2012 Annual Report 37
Index
million, and 182 commercial properties containing approximately 12.3 million square feet of leasable space and having a total real estate investment amount net of accumulated depreciation of $1.5 billion. Our commercial properties consist of:
| • | 68 commercial office properties containing approximately 5.1 million square feet of leasable space and having a total real estate investment amount net of accumulated depreciation of $483.9 million; |
| • | 65 commercial medical properties (including senior housing) containing approximately 2.9 million square feet of leasable space and having a total real estate investment amount net of accumulated depreciation of $421.5 million; |
| • | 19 commercial industrial properties containing approximately 2.9 million square feet of leasable space and having a total real estate investment amount net of accumulated depreciation of $98.3 million; and |
| • | 30 commercial retail properties containing approximately 1.4 million square feet of leasable space and having a total real estate investment amount net of accumulated depreciation of $103.8 million. |
Our primary source of income and cash is rents associated with multi-family residential and commercial leases. Our business objective is to increase shareholder value by employing a disciplined investment strategy. This strategy is focused on growing assets in desired geographical markets, achieving diversification by property type and location, and adhering to targeted returns in acquiring properties.
Total revenues of IRET Properties, our operating partnership, increased by $4.8 million to $241.8 million in fiscal year 2012, compared to $237.0 million in fiscal year 2011. This increase was primarily attributable to the addition of new real estate properties. We estimate that rent concessions offered to tenants during the twelve months ended April 30, 2012 lowered our operating revenues by approximately $5.7 million, compared to $4.5 million for fiscal year 2011.
On an all-property basis, physical occupancy levels in our total commercial property segments increased to 87.4% in fiscal year 2012 from 86.2% in fiscal year 2011. Physical occupancy rates in our commercial industrial and commercial retail segments increased; physical occupancy in our commercial office and commercial medical segments decreased. Physical occupancy in our multi-family residential segment increased to 93.7% in fiscal year 2012 on an all-property basis, from 92.8% in fiscal year 2011.
We continued to experience a challenging market environment in fiscal year 2012. Real estate operating fundamentals remained under pressure in our commercial office segment in particular, as the U.S. economy and local economies in many of our markets continued to be negatively affected by a number of adverse macro conditions. We expect that the ongoing recovery will remain slow and uneven, and that unemployment levels will remain elevated, with consequent challenges to the operating results in our commercial office segment in particular. Our multi-family residential properties continue to perform well, but while we expect to see continued favorable results in this segment in fiscal year 2013, our ability to maintain occupancy levels and selectively raise rents remains dependent on continued economic recovery and employment growth, and many economic forecasts, including those of the Federal Reserve, are predicting lingering high unemployment and slow growth through 2013. We plan during fiscal year 2013 to continue to pursue the selective disposition of assets in non-core markets, and to work to increase our multi-family residential properties in our identified core markets in the Midwest.
Additional information and more detailed discussions of our fiscal year 2012 operating results are found in the following sections of this Management's Discussion and Analysis of Financial Condition and Results of Operations.
Critical Accounting Policies
Set forth below is a summary of the accounting policies that management believes are critical to the preparation of the consolidated financial statements included in this Annual Report on Form 10-K.
Real Estate . Real estate is carried at cost, net of accumulated depreciation, less an adjustment for impairment, if any. Depreciation requires an estimate by management of the useful life of each property as well as an allocation of the costs associated with a property to its various components. As described further below, the process of allocating property costs to its components involves a considerable amount of subjective judgments to be made by Company management. If the Company does not allocate these costs appropriately or incorrectly estimates the useful lives of
2012 Annual Report 38
Index
its real estate, depreciation expense may be misstated. Depreciation is computed on a straight-line basis over the estimated useful lives of the assets. The Company uses a 20-40 year estimated life for buildings and improvements and a 5-12 year estimated life for furniture, fixtures and equipment. Maintenance and repairs are charged to operations as incurred. Renovations and improvements that improve and/or extend the useful life of the asset are capitalized over their estimated useful life, generally five to ten years.
Upon acquisitions of real estate, the Company assesses the fair value of acquired tangible assets (including land, buildings and personal property), which is determined by valuing the property as if it were vacant, and considers whether there were significant intangible assets acquired (for example, above-and below-market leases, the value of acquired in-place leases, and tenant relationships) and acquired liabilities, and allocates the purchase price based on these assessments. The as-if-vacant value is allocated to land, buildings, and personal property based on management's determination of the relative fair value of these assets. The estimated fair value of the property is the amount that would be recoverable upon the disposition of the property. Techniques used to estimate fair value include discounted cash flow analysis and reference to recent sales of comparable properties. Estimates of future cash flows are based on a number of factors including the historical operating results, known trends, and market/economic conditions that may affect the property. Land value is assigned based on the purchase price if land is acquired separately, or based on estimated market value if acquired in a merger or in a portfolio acquisition.
Above-market and below-market in-place lease values for acquired properties are estimated based on the present value of the difference between (i) the contractual amounts to be paid pursuant to the in-place leases and (ii) management's estimate of fair market lease rates for the corresponding in-place leases, measured over a period equal to the remaining non-cancelable term of the lease. The Company performs this analysis on a lease-by-lease basis. The capitalized above-market or below-market intangible is amortized to rental income over the remaining non-cancelable terms of the respective leases.
Other intangible assets acquired include amounts for in-place lease values that are based upon the Company's evaluation of the specific characteristics of the leases. Factors considered in these analyses include an estimate of carrying costs during hypothetical expected lease-up periods, considering current market conditions, and costs to execute similar leases. The Company also considers information about each property obtained during its pre-acquisition due diligence and marketing and leasing activities in estimating the fair value of the tangible and intangible assets acquired.
Property sales or dispositions are recorded when title transfers and sufficient consideration is received by the Company and the Company has no significant continuing involvement with the property sold.
Real Estate Held For Sale. Real estate held for sale is stated at the lower of its carrying amount or estimated fair value less disposal costs. Depreciation is not recorded on assets classified as held for sale.
The application of current accounting principles that govern the classification of any of our properties as held-for-sale on the balance sheet requires management to make certain significant judgments. The Company makes a determination as to the point in time that it is probable that a sale will be consummated. It is not unusual for real estate sales contracts to allow potential buyers a period of time to evaluate the property prior to formal acceptance of the contract. In addition, certain other matters critical to the final sale, such as financing arrangements, often remain pending even upon contract acceptance. As a result, properties under contract may not close within the expected time period, or may not close at all. Due to these uncertainties, it is not likely that the Company can meet the criteria of the current accounting principles governing the classification of properties as held-for-sale prior to a sale formally closing. Therefore, any properties categorized as held-for-sale represent only those properties that management has determined are probable to close within the requirements set forth in current accounting principles.
The Company reports, in discontinued operations, the results of operations and the related gains or losses of a property that has either been disposed of or is classified as held for sale and otherwise meets the classification of a discontinued operation.
Impairment. The Company's long-lived assets are reviewed for impairment quarterly if events or changes in circumstances (such as adverse market conditions, including conditions resulting from an ongoing economic recession) indicate that a long-lived asset might be impaired. Judgments regarding existence of impairment indicators are based on factors such as operational performance, market conditions, expected holding period of each asset and events that occur that affect the financial strength of significant tenants of the assets, including tenants who
2012 Annual Report 39
Index
have filed for bankruptcy. For long-lived assets in which an impairment indicator is present, the Company compares the expected future undiscounted cash flows for the long-lived asset against the carrying amount of the asset, including any associated intangibles, subject to evaluation. The evaluation of undiscounted cash flows is subjective and reflects assumptions regarding current market conditions relative to the long-lived asset being evaluated, such as future occupancy, rental rates and capital requirements that could differ materially from actual results. A worsening real estate market may cause the Company to re-evaluate the assumptions used in our impairment analysis. If there is an indication of impairment based on this evaluation because the expected undiscounted cash flows plus reversion are less than the asset's carrying value, impairment is recorded based on the estimated fair value (typically based on a current independent appraisal) of the long-lived asset in comparison to its carrying value. The results of the Company's evaluation of impairment analysis could be material to the Company's financial statements.
Allowance for Doubtful Accounts. The Company periodically evaluates the collectibility of amounts due from tenants and maintains an allowance for doubtful accounts (approximately $154,000 as of April 30, 2012) for estimated losses resulting from the inability of tenants to make required payments under their respective lease agreements. The Company also maintains an allowance for deferred rents receivable arising from the straight-lining of rents (approximately $1.2 million as of April 30, 2012) and from mortgage loans ($0 as of April 30, 2012). The straight-lining of rents receivable arises from earnings recognized in excess of amounts currently due under lease agreements. Management exercises judgment in establishing these allowances and considers payment history and current credit status in developing these estimates. If estimates differ from actual results this would impact reported results.
Revenue Recognition - The Company has the following revenue sources and revenue recognition policies:
| • | Base Rents - income arising from tenant leases. These rents are recognized over the non-cancelable term of the related leases on a straight-line basis, which includes the effects of rent increases and abated rent under the leases. Certain leases provide for tenant occupancy during periods for which no rent is due or where minimum rent payments increase during the term of the lease. Rental revenue is recorded for the full term of each lease on a straight-line basis. Accordingly, the Company records a receivable from tenants for rents that it expects to collect over the remaining lease term as deferred rents receivable. When the Company acquires a property, the term of the existing leases is considered to commence as of the acquisition date for the purposes of this calculation. Revenue recognition is considered to be critical because the evaluation of the reliability of such deferred rents receivable involves management's assumptions relating to such tenant's viability. |
| • | Percentage Rents - income arising from retail tenant leases which are contingent upon the sales of the tenant exceeding a defined threshold. These rents are recognized only after the contingency has been removed (i.e., sales thresholds have been achieved). |
| • | Expense Reimbursement Income – revenue arising from tenant leases, which provide for the recovery of all or a portion of the operating expenses and real estate taxes of the respective property. This revenue is accrued in the same periods as the expenses are incurred. |
Income Taxes. The Company operates in a manner intended to enable it to continue to qualify as a REIT under Sections 856-860 of the Internal Revenue Code. Under those sections, a REIT which distributes at least 90% of its REIT taxable income as a distribution to its shareholders each year and which meets certain other conditions will not be taxed on that portion of its taxable income which is distributed to its shareholders. The Company intends to distribute to its shareholders 100% of its taxable income. Therefore, no provision for Federal income taxes is required. If the Company fails to distribute the required amount of income to its shareholders, it would fail to qualify as a REIT and substantial adverse tax consequences may result.
The Company's taxable income is affected by a number of factors, including, but not limited to, the following: that the Company's tenants perform their obligations under their leases with the Company and that the Company's tax and accounting positions do not change. These factors, which impact the Company's taxable income, are subject to change, and many are outside the control of the Company. If actual results vary, the Company's taxable income may change.
2012 Annual Report 40
Index
Recent Accounting Pronouncements
For disclosure regarding recent accounting pronouncements and the anticipated impact they will have on our operations, please refer to Note 2 to our Consolidated Financial Statements.
RESULTS OF OPERATIONS
The discussion that follows is based on our consolidated results of operations for the fiscal years ended April 30, 2012, 2011 and 2010.
Revenues
Total revenues for fiscal year 2012 were $241.8 million, compared to $237.0 million in fiscal year 2011 and $230.9 million in fiscal year 2010. Revenues during fiscal year 2012 were $4.8 million greater than revenues in fiscal year 2011 and revenues during fiscal year 2011 were $6.0 million greater than in fiscal year 2010.
For fiscal 2012, the increase in revenue of $4.8 million resulted from:
(in thousands) | ||||
Rent in Fiscal 2012 from 8 properties acquired in fiscal year 2011 in excess of that received in 2011 from the same 8 properties | $ | 2,342 | ||
Rent from 16 properties acquired in fiscal year 2012 | 4,707 | |||
Decrease in rental income on stabilized properties due primarily to a decrease in occupancy | (3,788 | ) | ||
Increase in straight line rent | 2,723 | |||
Increase in tenant concessions | (1,150 | ) | ||
| $ | 4,834 | |||
For fiscal 2011, the increase in revenue of $6.0 million resulted from:
(in thousands) | ||||
Rent in Fiscal 2011 from 10 properties acquired in fiscal year 2010 in excess of that received in 2010 from the same 10 properties | $ | 7,799 | ||
Rent from 8 properties acquired in fiscal year 2011 | 2,356 | |||
Decrease in rental income on stabilized properties due primarily to a decrease in occupancy | (4,144 | ) | ||
| $ | 6,011 | |||
As illustrated above, the majority of the increase in our gross revenue for fiscal years 2012 and 2011 ($7.0 million and $10.2 million respectively) resulted from the addition of new real estate properties to the IRET Properties' portfolio. Rental revenue in fiscal years 2012 and 2011 from stabilized properties decreased $3.8 and $4.1 million, respectively. For the next 12 months, we continue to look to acquisitions and development of new properties and recovery in our stabilized portfolio to be the most significant factors in any increases in our revenues and ultimately our net income. However, identifying attractive acquisition possibilities remains a continuing challenge.
Gain on Sale of Real Estate
The Company realized a gain on sale of real estate, land and other investments for fiscal year 2012 of approximately $349,000. This compares to an approximately $19.4 million gain on sale of real estate recognized in fiscal year 2011 and approximately $68,000 recognized in fiscal year 2010. Properties sold in fiscal years 2012 and 2011 are detailed below in the section captioned "Property Dispositions."
Changes in Expenses and Net Income
Net income available to common shareholders for fiscal year 2012 was $5.8 million, compared to $17.7 million in fiscal year 2011 and $1.6 million in fiscal year 2010. On a per common share basis, net income was $.07 per common share in fiscal year 2012, compared to $.22 per common share in fiscal year 2011 and $.03 in fiscal year 2010.
2012 Annual Report 41
Index
These changes in net income result from the changes in revenues and expenses detailed below:
Changes in net income available to common shareholders for fiscal year 2012 resulted from:
(in thousands) | ||||
An increase in net operating income (defined below in the Net Operating Income section) primarily due to acquisitions (not including gain on involuntary conversion) | $ | 8,358 | ||
A decrease in net income attributable to noncontrolling interests - Operating Partnership | 3,090 | |||
An increase in gain on involuntary conversion | 274 | |||
An increase in other income | 356 | |||
These increases were offset by : | ||||
A decrease in income from discontinued operations | (20,040 | ) | ||
An increase in depreciation/amortization expense related to real estate investments | (1,342 | ) | ||
An increase in interest expense primarily due to the revolving line of credit | (1,293 | ) | ||
An increase in amortization related to non-real estate investments | (537 | ) | ||
A decrease in net loss attributable to noncontrolling interests - consolidated real estate entities | (315 | ) | ||
An increase in other expenses, administrative, advisory and trustee services | (310 | ) | ||
A decrease in interest income | (111 | ) | ||
Total decrease in fiscal 2012 net income available to common shareholders | $ | (11,870 | ) | |
Changes in net income available to common shareholders for fiscal year 2011 resulted from:
(in thousands) | ||||
An increase in income from discontinued operations | $ | 21,341 | ||
A decrease in interest expense primarily due to debt refinancing | 1,622 | |||
An increase in net operating income (defined below in the Net Operating Income section) (not including gain on involuntary conversion) | 351 | |||
An increase in net loss attributable to noncontrolling interests - consolidated real estate entities | 202 | |||
These increases were offset by : | ||||
An increase in net income attributable to noncontrolling interests - Operating Partnership | (3,887 | ) | ||
A decrease in gain on involuntary conversion | (1,660 | ) | ||
An increase in depreciation/amortization expense related to real estate investments | (980 | ) | ||
An increase in amortization related to non-real estate investments | (317 | ) | ||
A decrease in interest income | (280 | ) | ||
An increase in other expenses, administrative, advisory and trustee services | (238 | ) | ||
A decrease in other income | (73 | ) | ||
Total increase in fiscal 2011 net income available to common shareholders | $ | 16,081 | ||
Net Operating Income
Net Operating Income ("NOI") is a non-GAAP measure which we define as total real estate revenues less real estate expenses and real estate taxes (excluding depreciation and amortization related to real estate investments and impairment of real estate investments). We believe that NOI is an important supplemental measure of operating performance for a REIT's operating real estate because it provides a measure of core operations that is unaffected by depreciation, amortization, financing and general and administrative expense. NOI does not represent cash generated by operating activities in accordance with GAAP and should not be considered an alternative to net income, net income available for commons shareholders or cash flow from operating activities as a measure of financial performance.
The following tables show real estate revenues, real estate operating expenses and NOI by reportable operating segment for fiscal years 2012, 2011 and 2010. For a reconciliation of net operating income of reportable segments to net income as reported, see Note 11 of the Notes to Consolidated Financial Statements in this report.
The tables also show net operating income by reportable operating segment on a stabilized property and non-stabilized property basis. Stabilized properties are properties owned for the entirety of the periods being compared, and, in the case of development or re-development properties, which have achieved a target level of occupancy. This comparison allows the Company to evaluate the performance of existing properties and their contribution to net
2012 Annual Report 42
Index
income. Management believes that measuring performance on a stabilized property basis is useful to investors because it enables evaluation of how the Company's properties are performing year over year. Management uses this measure to assess whether or not it has been successful in increasing net operating income, renewing the leases of existing tenants, controlling operating costs and appropriately handling capital improvements. The discussion below focuses on the main factors affecting real estate revenue and real estate expenses from stabilized properties, since changes from one fiscal year to another in real estate revenue and expenses from non-stabilized properties are due to the addition of those properties to the Company's real estate portfolio, and accordingly provide less useful information for evaluating the ongoing operational performance of the Company's real estate portfolio.
Fiscal Year 2012 Compared to Fiscal Year 2011
All Segments
The following table of selected operating data reconciles NOI to net income and provides the basis for our discussion of NOI by segment in fiscal year 2012 compared to fiscal year 2011.
(in thousands, except percentages) | ||||||||||||||||
Years Ended April 30 | ||||||||||||||||
2012 | 2011 | $ Change | % Change | |||||||||||||
All Segments | ||||||||||||||||
Real estate revenue | ||||||||||||||||
Stabilized | $ | 231,735 | $ | 233,942 | $ | (2,207 | ) | (0.9 | )% | |||||||
Non-stabilized (1) | 10,053 | 3,012 | 7,041 | 233.8 | % | |||||||||||
Total | $ | 241,788 | $ | 236,954 | $ | 4,834 | 2.0 | % | ||||||||
Real estate expenses | ||||||||||||||||
Stabilized | $ | 95,832 | $ | 101,191 | $ | (5,359 | ) | (5.3 | )% | |||||||
Non-stabilized (1) | 2,446 | 611 | 1,835 | 300.3 | % | |||||||||||
Total | $ | 98,278 | $ | 101,802 | $ | (3,524 | ) | (3.5 | )% | |||||||
Gain on involuntary conversion | ||||||||||||||||
Stabilized | $ | 274 | $ | 0 | $ | 274 | 100.0 | % | ||||||||
Non-stabilized (1) | 0 | 0 | 0 | n/a | ||||||||||||
Total | $ | 274 | $ | 0 | $ | 274 | 100.0 | % | ||||||||
Net operating income | ||||||||||||||||
Stabilized | $ | 136,177 | $ | 132,751 | $ | 3,426 | 2.6 | % | ||||||||
Non-stabilized (1) | 7,607 | 2,401 | 5,206 | 216.8 | % | |||||||||||
Total | $ | 143,784 | $ | 135,152 | $ | 8,632 | 6.4 | % | ||||||||
Depreciation/amortization | (60,264 | ) | (58,385 | ) | ||||||||||||
Administrative, advisory and trustee services | (7,381 | ) | (7,222 | ) | ||||||||||||
Other expenses | (1,898 | ) | (1,747 | ) | ||||||||||||
Interest expense | (65,113 | ) | (63,820 | ) | ||||||||||||
Interest and other income | 786 | 541 | ||||||||||||||
Income from continuing operations | 9,914 | 4,519 | ||||||||||||||
(Loss) income from discontinued operations (2) | (208 | ) | 19,832 | |||||||||||||
Net income | $ | 9,706 | $ | 24,351 | ||||||||||||
(1) Non-stabilized properties include:
FY2012 - Multi-Family Residential - | Ashland Apartment Homes, Grand Forks, ND; Chateau, Minot, ND; Cottage West Twin Homes, Sioux Falls, SD; Evergreen II, Isanti, MN; Gables Townhomes, Sioux Falls, SD; Grand Gateway Apartment Homes, St Cloud, MN; North Pointe II, Bismarck, ND; Regency Park Estates, St Cloud, MN; Sierra Vista, Sioux Falls, SD and Williston Garden Apartments, Williston, ND. |
Commercial Office - | 1 st Avenue Building, Minot, ND and Omaha 10802 Farnam Drive, Omaha, NE. |
Commercial Medical - | Billings 2300 Grant Road, Billings, MT; Edgewood Vista-Minot, Minot, ND; Edina 6525 Drew Avenue, Edina, MN; Missoula 3050 Great Northern Avenue, Missoula, MT; Spring Creek American Falls, American Falls, ID; Spring Creek Soda Springs, Soda Springs, ID; Spring Creek Eagle, Eagle, ID; Spring Creek Meridian, Meridian, ID; Spring Creek Overland, Boise, ID; Spring Creek Boise, Boise, ID; Spring Creek Ustick, Meridian, ID and Trinity at Plaza 16, Minot, ND. |
Commercial Industrial - | Fargo 1320 45 th Street North, Fargo, ND. |
Commercial Retail - | Minot 1400 31 st Ave, Minot, ND. |
2012 Annual Report 43
Index
FY2011 - Multi-Family Residential - | Chateau, Minot, ND; North Pointe II, Bismarck, ND and Sierra Vista, Sioux Falls, SD. |
Commercial Office - | 1 st Avenue Building, Minot, ND and Omaha 10802 Farnam Drive, Omaha, NE. |
Commercial Medical - | Billings 2300 Grant Road, Billings, MT; Edgewood Vista-Minot, Minot, ND and Missoula 3050 Great Northern Avenue, Missoula, MT . |
Commercial Industrial - | Fargo 1320 45 th Street North, Fargo, ND. |
Commercial Retail - | Minot 1400 31 st Ave, Minot, ND. |
(2) Discontinued operations include gain on disposals and income from operations for:
2012 Dispositions and Properties Held for Sale – Livingston Pamida, East Grand Station, Georgetown Square Condos and Kentwood Thomasville Furniture.
2011 Dispositions – Miramont Apartments, Neighborhood Apartments, Pinecone Apartments, Waconia, Dakota Hill, Edgewood Vista Fargo and Ladysmith Pamida.
An analysis of NOI by segment follows.
Multi-Family Residential
Real estate revenue from stabilized properties in our multi-family residential segment increased by approximately $4.9 million in fiscal year 2012 compared to fiscal year 2011. Approximately $2.9 million of this increase was due to increased occupancy across our multifamily portfolio; increased occupancy in some instances allows for rental rate increases, which accounted for approximately $1.1 million of additional revenue in this segment in fiscal year 2012 compared to fiscal year 2011. The remainder of the real estate revenue increase is attributable to a decrease of $405,000 in allowances and concessions and an increase of $495,000 in other fee revenue items.
Real estate expenses at stabilized properties decreased by $422,000 in fiscal year 2012 compared to fiscal year 2011. The mild winter season permitted overall lower utilities usage for a reduction in expense of approximately $61,000, and reduced snow removal expenses by $529,000. Additionally, of the $422,000 decrease in real estate expenses in this segment in fiscal year 2012 compared to fiscal year 2011, approximately $293,000 was due to lower property management expense, which includes lower fees to third party managers, savings from the Company's internal marketing initiative and less bad debt write-off. These decreases in expenses were offset by an increase in insurance expense of $440,000, in under-deductible losses of $329,000, and in $114,000 of other expense items.
(in thousands, except percentages) | ||||||||||||||||
Years Ended April 30, | ||||||||||||||||
2012 | 2011 | $ Change | % Change | |||||||||||||
Multi-Family Residential | ||||||||||||||||
Real estate revenue | ||||||||||||||||
Stabilized | $ | 70,982 | $ | 66,080 | $ | 4,902 | 7.4 | % | ||||||||
Non-stabilized | 3,208 | 758 | 2,450 | 323.2 | % | |||||||||||
Total | $ | 74,190 | $ | 66,838 | $ | 7,352 | 11.0 | % | ||||||||
Real estate expenses | ||||||||||||||||
Stabilized | $ | 33,371 | $ | 33,793 | $ | (422 | ) | (1.2 | )% | |||||||
Non-stabilized | 1,419 | 336 | 1,083 | 322.3 | % | |||||||||||
Total | $ | 34,790 | $ | 34,129 | $ | 661 | 1.9 | % | ||||||||
Net operating income | ||||||||||||||||
Stabilized | $ | 37,611 | $ | 32,287 | $ | 5,324 | 16.5 | % | ||||||||
Non-stabilized | 1,789 | 422 | 1,367 | 323.9 | % | |||||||||||
Total | $ | 39,400 | $ | 32,709 | $ | 6,691 | 20.5 | % | ||||||||
Occupancy | 2012 | 2011 |
Stabilized | 94.2% | 92.8% |
Non-stabilized | 86.8% | 93.9% |
Total | 93.7% | 92.8% |
2012 Annual Report 44
Index
Commercial Office
Real estate revenue from stabilized properties in our commercial office segment decreased by approximately $4.3 million in fiscal year 2012 compared to fiscal year 2011, due to a continued decrease in occupancy which resulted in a reduction in rental revenue of $1.3 million and in tenant reimbursements of $2.8 million. Allowances and concessions increased by $1.2 million, further reducing revenue. These reductions in revenue were offset by an increase in straight line rents of $615,000 and an increase in lease termination fees of $313,000.
Real estate expenses from stabilized properties decreased by approximately $1.6 million in fiscal year 2012 as compared to fiscal 2011, primarily due to maintenance expense decreasing by $1.4 million, mainly as a result of lower snow removal costs, a reduction in real estate taxes of $267,000 due to successful appeals, and a reduction of $283,000 in third party management fees due to bringing property management in-house; offset by an increase in insurance expense of $405,000 and an increase in other expense items of $55,000.
(in thousands, except percentages) | ||||||||||||||||
Years Ended April 30, | ||||||||||||||||
2012 | 2011 | $ Change | % Change | |||||||||||||
Commercial Office | ||||||||||||||||
Real estate revenue | ||||||||||||||||
Stabilized | $ | 72,995 | $ | 77,257 | $ | (4,262 | ) | (5.5 | )% | |||||||
Non-stabilized | 1,339 | 490 | 849 | 173.3 | % | |||||||||||
Total | $ | 74,334 | $ | 77,747 | $ | (3,413 | ) | (4.4 | )% | |||||||
Real estate expenses | ||||||||||||||||
Stabilized | $ | 34,256 | $ | 35,855 | $ | (1,599 | ) | (4.5 | )% | |||||||
Non-stabilized | 560 | 200 | 360 | 180.0 | % | |||||||||||
Total | $ | 34,816 | $ | 36,055 | $ | (1,239 | ) | (3.4 | )% | |||||||
Net operating income | ||||||||||||||||
Stabilized | $ | 38,739 | $ | 41,402 | $ | (2,663 | ) | (6.4 | )% | |||||||
Non-stabilized | 779 | 290 | 489 | 168.6 | % | |||||||||||
Total | $ | 39,518 | $ | 41,692 | $ | (2,174 | ) | (5.2 | )% | |||||||
Occupancy | 2012 | 2011 |
Stabilized | 78.4% | 79.5% |
Non-stabilized | 98.7% | 98.7% |
Total | 78.6% | 79.7% |
2012 Annual Report 45
Index
Commercial Medical
Real estate revenue from stabilized properties in our commercial medical segment decreased by approximately $3.8 million in fiscal year 2012 compared to fiscal year 2011. The decrease was primarily due to a reduction in revenue of $2.2 million at our Wyoming senior living facilities following the sale of our TRS and a change to a triple net lease structure in December 2011. The decrease was also due to a reduction of $1.9 million in scheduled rent at some assisted living facilities, following amendment of the leases to shorten terms and remove purchase options. Lower occupancy also decreased revenue by approximately $883,000, offset by an increase in straight line rent of $1.5 million and an increase in other revenue items of $298,000.
Real estate expenses from stabilized properties decreased by approximately $2.1 million, primarily due to the operating change from a TRS structure to a triple net lease structure, which reduced real estate expenses by approximately $2.2 million, and to a decrease in maintenance expense of $382,000, primarily due to lower snow removal costs, a reduction in utilities expense of $110,000, and other total expense reductions of $130,000. These expense reductions were offset by an increase in real estate taxes of $234,000 and an increase in insurance expense of $228,000.
(in thousands, except percentages) | ||||||||||||||||
Years Ended April 30, | ||||||||||||||||
2012 | 2011 | $ Change | % Change | |||||||||||||
Commercial Medical | ||||||||||||||||
Real estate revenue | ||||||||||||||||
Stabilized | $ | 61,046 | $ | 64,886 | $ | (3,840 | ) | (5.9 | )% | |||||||
Non-stabilized | 4,485 | 1,162 | 3,323 | 286.0 | % | |||||||||||
Total | $ | 65,531 | $ | 66,048 | $ | (517 | ) | (0.8 | )% | |||||||
Real estate expenses | ||||||||||||||||
Stabilized | $ | 20,342 | $ | 22,428 | $ | (2,086 | ) | (9.3 | )% | |||||||
Non-stabilized | 313 | 23 | 290 | 1,260.9 | % | |||||||||||
Total | $ | 20,655 | $ | 22,451 | $ | (1,796 | ) | (8.0 | )% | |||||||
Net operating income | ||||||||||||||||
Stabilized | $ | 40,704 | $ | 42,458 | $ | (1,754 | ) | (4.1 | )% | |||||||
Non-stabilized | 4,172 | 1,139 | 3,033 | 266.3 | % | |||||||||||
Total | $ | 44,876 | $ | 43,597 | $ | 1,279 | 2.9 | % | ||||||||
Occupancy | 2012 | 2011 |
Stabilized | 93.8% | 95.8% |
Non-stabilized | 99.9% | 100.0% |
Total | 94.5% | 96.0% |
2012 Annual Report 46
Index
Commercial Industrial
Real estate revenue from stabilized properties in our commercial industrial segment increased by approximately $1.1 million in fiscal year 2012 compared to fiscal year 2011. The increase was primarily due to increased occupancy, which provided for additional revenue from rents of $717,000 and additional tenant reimbursements of $599,000, offset by an increase in allowance and concessions of $197,000 and an increase in other revenue items of $19,000.
Real estate expenses from stabilized properties decreased by $778,000 in fiscal 2012 compared to fiscal 2011, primarily due to a recovered bad debt from a former tenant in bankruptcy of approximately $700,000 and reduced utility expense of $325,000, offset by an increase in real estate taxes of $167,000, an increase in insurance expense of $108,000, and an increase in other total expenses of $42,000.
(in thousands, except percentages) | ||||||||||||||||
Years Ended April 30, | ||||||||||||||||
2012 | 2011 | $ Change | % Change | |||||||||||||
Commercial Industrial | ||||||||||||||||
Real estate revenue | ||||||||||||||||
Stabilized | $ | 13,884 | $ | 12,797 | $ | 1,087 | 8.5 | % | ||||||||
Non-stabilized | 441 | 368 | 73 | 19.8 | % | |||||||||||
Total | $ | 14,325 | $ | 13,165 | $ | 1,160 | 8.8 | % | ||||||||
Real estate expenses | ||||||||||||||||
Stabilized | $ | 3,543 | $ | 4,321 | $ | (778 | ) | (18.0 | )% | |||||||
Non-stabilized | 6 | 7 | (1 | ) | (14.3 | )% | ||||||||||
Total | $ | 3,549 | $ | 4,328 | $ | (779 | ) | (18.0 | )% | |||||||
Net operating income | ||||||||||||||||
Stabilized | $ | 10,341 | $ | 8,476 | $ | 1,865 | 22.0 | % | ||||||||
Non-stabilized | 435 | 361 | 74 | 20.5 | % | |||||||||||
Total | $ | 10,776 | $ | 8,837 | $ | 1,939 | 21.9 | % | ||||||||
Occupancy | 2012 | 2011 |
Stabilized | 95.4% | 90.0% |
Non-stabilized | 100.0% | 100.0% |
Total | 95.5% | 90.1% |
|
2012 Annual Report 47
Index
Commercial Retail
Real estate revenue from stabilized properties in our commercial retail segment decreased by approximately $94,000 in fiscal year 2012 compared to fiscal year 2011. Occupancy increased as a percentage of square feet leased; however, lease renewal rates were lower for new or existing tenants.
Real estate expenses from stabilized properties decreased by $474,000, primarily due to decreased maintenance expense of $513,000, mainly as a result of reduced snow removal expense, and to utility expenses decreasing by $68,000, offset by an increase in real estate tax of $83,000, an increase in insurance expense of $106,000 and an increase in other property management expense items of $82,000.
(in thousands, except percentages) | ||||||||||||||||
Years Ended April 30, | ||||||||||||||||
2012 | 2011 | $ Change | % Change | |||||||||||||
Commercial Retail | ||||||||||||||||
Real estate revenue | ||||||||||||||||
Stabilized | $ | 12,828 | $ | 12,922 | $ | (94 | ) | (0.7 | )% | |||||||
Non-stabilized | 580 | 234 | 346 | 147.9 | % | |||||||||||
Total | $ | 13,408 | $ | 13,156 | $ | 252 | 1.9 | % | ||||||||
Real estate expenses | ||||||||||||||||
Stabilized | $ | 4,320 | $ | 4,794 | $ | (474 | ) | (9.9 | )% | |||||||
Non-stabilized | 148 | 45 | 103 | 228.9 | % | |||||||||||
Total | $ | 4,468 | $ | 4,839 | $ | (371 | ) | (7.7 | )% | |||||||
Gain on involuntary conversion | ||||||||||||||||
Stabilized | $ | 274 | $ | 0 | $ | 274 | 100.0 | % | ||||||||
Non-stabilized | 0 | 0 | 0 | n/a | ||||||||||||
Total | $ | 274 | $ | 0 | $ | 274 | 100.0 | % | ||||||||
Net operating income | ||||||||||||||||
Stabilized | $ | 8,782 | $ | 8,128 | $ | 654 | 8.0 | % | ||||||||
Non-stabilized | 432 | 189 | 243 | 128.6 | % | |||||||||||
Total | $ | 9,214 | $ | 8,317 | $ | 897 | 10.8 | % | ||||||||
Occupancy | 2012 | 2011 |
Stabilized | 86.6% | 83.2% |
Non-stabilized | 100.0% | 53.6% |
Total | 87.1% | 82.2% |
2012 Annual Report 48
Index
Fiscal Year 2011 Compared to Fiscal Year 2010
All Segments
The following table of selected operating data reconciles NOI to net income and provides the basis for our discussion of NOI by segment in fiscal year 2011 compared to fiscal year 2010.
(in thousands, except percentages) | ||||||||||||||||
Years Ended April 30 | ||||||||||||||||
2011 | 2010 | $ Change | % Change | |||||||||||||
All Segments | ||||||||||||||||
Real estate revenue | ||||||||||||||||
Stabilized | $ | 222,537 | $ | 226,681 | $ | (4,144 | ) | (1.8 | )% | |||||||
Non-stabilized (1) | 14,417 | 4,262 | 10,155 | 238.3 | % | |||||||||||
Total | $ | 236,954 | $ | 230,943 | $ | 6,011 | 2.6 | % | ||||||||
Real estate expenses | ||||||||||||||||
Stabilized | $ | 93,020 | $ | 93,164 | $ | (144 | ) | (0.2 | )% | |||||||
Non-stabilized (1) | 8,782 | 2,978 | 5,804 | 194.9 | % | |||||||||||
Total | $ | 101,802 | $ | 96,142 | $ | 5,660 | 5.9 | % | ||||||||
Gain on involuntary conversion | ||||||||||||||||
Stabilized | $ | 0 | $ | 1,660 | $ | (1,660 | ) | (100.0 | )% | |||||||
Non-stabilized (1) | 0 | 0 | 0 | n/a | ||||||||||||
Total | $ | 0 | $ | 1,660 | $ | (1,660 | ) | (100.0 | )% | |||||||
Net operating income | ||||||||||||||||
Stabilized | $ | 129,517 | $ | 135,177 | $ | (5,660 | ) | (4.2 | )% | |||||||
Non-stabilized (1) | 5,635 | 1,284 | 4,351 | 338.9 | % | |||||||||||
Total | $ | 135,152 | $ | 136,461 | $ | (1,309 | ) | (1.0 | )% | |||||||
Depreciation/amortization | (58,385 | ) | (57,088 | ) | ||||||||||||
Administrative, advisory and trustee services | (7,222 | ) | (6,218 | ) | ||||||||||||
Other expenses | (1,747 | ) | (2,513 | ) | ||||||||||||
Interest expense | (63,820 | ) | (65,442 | ) | ||||||||||||
Interest and other income | 541 | 894 | ||||||||||||||
Income from continuing operations | 4,519 | 6,094 | ||||||||||||||
Income (loss) from discontinued operations | 19,832 | (1,509 | ) | |||||||||||||
Net income | $ | 24,351 | $ | 4,585 | ||||||||||||
(1) | Non-stabilized properties include: |
FY2011 - Multi-Family Residential - | Crown Apartments, Rochester, MN; Northern Valley Apartments, Rochester, MN; North Pointe II, Bismarck, ND and Sierra Vista, Sioux Falls, SD. |
Commercial Office - | IRET Corporate Plaza, Minot, ND; Minot 2505 16 th St SW, Minot, ND; 1 st Avenue Building, Minot, ND and Omaha 10802 Farnam Drive, Omaha, NE. |
Commercial Medical - | Casper 1930 E 12 th Street (Park Place), Casper, WY; Casper 3955 E 12 th Street (Meadow Wind), Casper, WY; Cheyenne 4010 N College Drive (Aspen Wind), Cheyenne, WY; Cheyenne 4060 N College Drive (Sierra Hills), Cheyenne, WY; Laramie 1072 N 22 nd Street (Spring Wind), Laramie, WY; Billings 2300 Grant Road, Billings, MT; Missoula 3050 Great Northern Avenue, Missoula, MT and Edgewood Vista-Minot, Minot, ND. |
Commercial Industrial - | Clive 2075 NW 94 th St., Clive, IA and Fargo 1320 45 th Street North, Fargo, ND. |
Commercial Retail - | Minot 1400 31 st Ave, Minot, ND. |
FY2010 - Multi-Family Residential - | Crown Apartments, Rochester, MN and Northern Valley Apartments, Rochester, MN. |
Commercial Office - | IRET Corporate Plaza, Minot, ND; Minot 2505 16 th St SW, Minot, ND and 1 st Avenue Building, Minot, ND. |
Commercial Medical - | Casper 1930 E 12 th Street (Park Place), Casper, WY; Casper 3955 E 12 th Street (Meadow Wind), Casper, WY; Cheyenne 4010 N College Drive (Aspen Wind), Cheyenne, WY; Cheyenne 4060 N College Drive (Sierra Hills), Cheyenne, WY; Laramie 1072 N 22 nd Street (Spring Wind), Laramie, WY; Billings 2300 Grant Road, Billings, MT; Missoula 3050 Great Northern Avenue, Missoula, MT and Fox River. |
Commercial Industrial - | Clive 2075 NW 94 th St., Clive, IA. |
2012 Annual Report 49
Index
(1) | Discontinued operations include gain on disposals and income from operations for: |
2012 Dispositions and Properties Held for Sale – Livingston Pamida, East Grand Station, Georgetown Square Condos and Kentwood Thomasville Furniture.
2011 Dispositions – Miramont Apartments, Neighborhood Apartments, Pinecone Apartments, Waconia, Dakota Hill, Edgewood Vista Fargo and Ladysmith Pamida.
2010 Dispositions – 12 South Main and Sweetwater Grafton.
An analysis of NOI by segment follows.
Multi-Family Residential
Real estate revenue from stabilized properties in our multi-family residential segment increased by $818,000 in fiscal year 2011 compared to fiscal year 2010, due to an increase in rent of $723,000 and in other rent income of $548,000, offset by an increase of $379,000 in allowances and concessions.
Real estate expenses from stabilized properties increased by approximately $1.2 million, due to an increase in maintenance expense of $1.1 million, in property management expense of $275,000, in real estate tax expense of $156,000, and in utilities expense of $118,000, offset by a decrease of $470,000 in insurance expense.
(in thousands, except percentages) | ||||||||||||||||
Years Ended April 30, | ||||||||||||||||
2011 | 2010 | $ Change | % Change | |||||||||||||
Multi-Family Residential | ||||||||||||||||
Real estate revenue | ||||||||||||||||
Stabilized | $ | 66,235 | $ | 65,417 | $ | 818 | 1.3 | % | ||||||||
Non-stabilized | 603 | 61 | 542 | 888.5 | % | |||||||||||
Total | $ | 66,838 | $ | 65,478 | $ | 1,360 | 2.1 | % | ||||||||
Real estate expenses | ||||||||||||||||
Stabilized | $ | 33,768 | $ | 32,603 | $ | 1,165 | 3.6 | % | ||||||||
Non-stabilized | 361 | 12 | 349 | 2,908.3 | % | |||||||||||
Total | $ | 34,129 | $ | 32,615 | $ | 1,514 | 4.6 | % | ||||||||
Gain on involuntary conversion | ||||||||||||||||
Stabilized | 0 | $ | 1,660 | $ | (1,660 | ) | (100.0 | )% | ||||||||
Non-stabilized | 0 | 0 | 0 | n/a | ||||||||||||
Total | $ | 0 | $ | 1,660 | $ | (1,660 | ) | (100.0 | )% | |||||||
Net operating income | ||||||||||||||||
Stabilized | $ | 32,467 | $ | 34,474 | $ | (2,007 | ) | (5.8 | )% | |||||||
Non-stabilized | 242 | 49 | 193 | 393.9 | % | |||||||||||
Total | $ | 32,709 | $ | 34,523 | $ | (1,814 | ) | (5.3 | )% | |||||||
Occupancy | 2011 | 2010 |
Stabilized | 92.8% | 89.7% |
Non-stabilized | 91.7% | 95.3% |
Total | 92.8% | 89.7% |
2012 Annual Report 50
Index
Commercial Office
Real estate revenue from stabilized properties in our commercial office segment decreased by approximately $5.1 million in fiscal year 2011 compared to fiscal year 2010, primarily due to a decrease in occupancy which resulted in a reduction in rental revenue of $2.7 million, a decrease in tenant reimbursements of $1.4 million and an increase in allowance and concessions of $1.3 million, offset by an increase in straight line rents of $240,000 and in other rent income of $67,000.
(in thousands, except percentages) | ||||||||||||||||
Years Ended April 30, | ||||||||||||||||
2011 | 2010 | $ Change | % Change | |||||||||||||
Commercial Office | ||||||||||||||||
Real estate revenue | ||||||||||||||||
Stabilized | $ | 76,820 | $ | 81,942 | $ | (5,122 | ) | (6.3 | )% | |||||||
Non-stabilized | 927 | 137 | 790 | 576.6 | % | |||||||||||
Total | $ | 77,747 | $ | 82,079 | $ | (4,332 | ) | (5.3 | )% | |||||||
Real estate expenses | ||||||||||||||||
Stabilized | $ | 35,633 | $ | 36,638 | $ | (1,005 | ) | (2.7 | )% | |||||||
Non-stabilized | 422 | 195 | 227 | 116.4 | % | |||||||||||
Total | $ | 36,055 | $ | 36,833 | $ | (778 | ) | (2.1 | )% | |||||||
Net operating income | ||||||||||||||||
Stabilized | $ | 41,187 | $ | 45,304 | $ | (4,117 | ) | (9.1 | )% | |||||||
Non-stabilized | 505 | (58 | ) | 563 | 970.7 | % | ||||||||||
Total | $ | 41,692 | $ | 45,246 | $ | (3,554 | ) | (7.9 | )% | |||||||
Occupancy | 2011 | 2010 |
Stabilized | 79.2% | 83.9% |
Non-stabilized | 99.4% | 51.0% |
Total | 79.7% | 83.4% |
2012 Annual Report 51
Index
Commercial Medical
Real estate revenue from stabilized properties in our commercial medical segment increased by $475,000 in fiscal year 2011 compared to fiscal year 2010, primarily due to an increase in tenant reimbursements of $1.0 million and in rent of $303,000, and to a decrease in allowance and concessions of $160,000. An increase in occupancy increased revenue by $150,000, offset by a decrease in straight line rents of $558,000 and in other revenue items of $612,000.
Real estate expenses from stabilized properties decreased by $519,000, due to a decrease in property management expense of $1.2 million and in insurance expense of $267,000, offset by an increase in real estate taxes of $636,000, in maintenance expense of $209,000 and in utilities expense of $78,000.
(in thousands, except percentages) | ||||||||||||||||
Years Ended April 30, | ||||||||||||||||
2011 | 2010 | $ Change | % Change | |||||||||||||
Commercial Medical | ||||||||||||||||
Real estate revenue | ||||||||||||||||
Stabilized | $ | 54,128 | $ | 53,653 | $ | 473 | 0.9 | % | ||||||||
Non-stabilized | 11,920 | 3,786 | 8,134 | 214.8 | % | |||||||||||
Total | $ | 66,048 | $ | 57,439 | $ | 8,609 | 15.0 | % | ||||||||
Real estate expenses | ||||||||||||||||
Stabilized | $ | 14,610 | $ | 15,129 | $ | (519 | ) | (3.4 | )% | |||||||
Non-stabilized | 7,841 | 2,700 | 5,141 | 190.4 | % | |||||||||||
Total | $ | 22,451 | $ | 17,829 | $ | 4,622 | 25.9 | % | ||||||||
Net operating income | ||||||||||||||||
Stabilized | $ | 39,518 | $ | 38,524 | $ | 994 | 2.6 | % | ||||||||
Non-stabilized | 4,079 | 1,086 | 2,993 | 275.6 | % | |||||||||||
Total | $ | 43,597 | $ | 39,610 | $ | 3,987 | 10.1 | % | ||||||||
Occupancy | 2011 | 2010 |
Stabilized | 95.3% | 95.7% |
Non-stabilized | 100.0% | 90.0% |
Total | 96.0% | 95.1% |
2012 Annual Report 52
Index
Commercial Industrial
Real estate revenue from stabilized properties in our commercial industrial segment decreased by approximately $385,000 in fiscal year 2011 compared to fiscal year 2010, due to a decrease in scheduled rent of $493,000, an increase in allowance and concessions of $290,000, and a decrease in tenant reimbursements of $141,000, offset by an increase in straight line rents of $380,000 and in other rent income of $159,000.
(in thousands, except percentages) | ||||||||||||||||
Years Ended April 30, | ||||||||||||||||
2011 | 2010 | $ Change | % Change | |||||||||||||
Commercial Industrial | ||||||||||||||||
Real estate revenue | ||||||||||||||||
Stabilized | $ | 12,432 | $ | 12,817 | $ | (385 | ) | (3.0 | )% | |||||||
Non-stabilized | 733 | 278 | 455 | 163.7 | % | |||||||||||
Total | $ | 13,165 | $ | 13,095 | $ | 70 | 0.5 | % | ||||||||
Real estate expenses | ||||||||||||||||
Stabilized | $ | 4,216 | $ | 4,050 | $ | 166 | 4.1 | % | ||||||||
Non-stabilized | 112 | 71 | 41 | 57.7 | % | |||||||||||
Total | $ | 4,328 | $ | 4,121 | $ | 207 | 5.0 | % | ||||||||
Net operating income | ||||||||||||||||
Stabilized | $ | 8,216 | $ | 8,767 | $ | (551 | ) | (6.3 | )% | |||||||
Non-stabilized | 621 | 207 | 414 | 200.0 | % | |||||||||||
Total | $ | 8,837 | $ | 8,974 | $ | (137 | ) | (1.5 | )% | |||||||
Occupancy | 2011 | 2010 |
Stabilized | 89.8% | 90.6% |
Non-stabilized | 100.0% | 100.0% |
Total | 90.1% | 90.7% |
2012 Annual Report 53
Index
Commercial Retail
Real estate revenue from stabilized properties in our commercial retail segment increased by approximately $70,000 in fiscal year 2011 compared to fiscal year 2010, due to an increase in tenant reimbursements of $439,000, an increase in occupancy resulting in an increase in revenue of $230,000, an increase in straight line rents of $96,000 and an increase in other rent income of $42,000, offset by a decrease in scheduled rent of $525,000 due to leasing up space at lower rental rates and an increase in allowances and concessions of $212,000.
Real estate expenses from stabilized properties increased by $49,000 due to an increase in maintenance expense of $338,000, offset by a decrease in insurance expense of $113,000, in real estate taxes of $98,000, in property management expenses of $74,000 and in utilities expense of $4,000.
(in thousands, except percentages) | ||||||||||||||||
Years Ended April 30, | ||||||||||||||||
2011 | 2010 | $ Change | % Change | |||||||||||||
Commercial Retail | ||||||||||||||||
Real estate revenue | ||||||||||||||||
Stabilized | $ | 12,922 | $ | 12,852 | $ | 70 | 0.5 | % | ||||||||
Non-stabilized | 234 | 0 | 234 | 100.0 | % | |||||||||||
Total | $ | 13,156 | $ | 12,852 | $ | 304 | 2.4 | % | ||||||||
Real estate expenses | ||||||||||||||||
Stabilized | $ | 4,793 | $ | 4,744 | $ | 49 | 1.0 | % | ||||||||
Non-stabilized | 46 | 0 | 46 | 100.0 | % | |||||||||||
Total | $ | 4,839 | $ | 4,744 | $ | 95 | 2.0 | % | ||||||||
Net operating income | ||||||||||||||||
Stabilized | $ | 8,129 | $ | 8,108 | $ | 21 | 0.3 | % | ||||||||
Non-stabilized | 188 | 0 | 188 | 100.0 | % | |||||||||||
Total | $ | 8,317 | $ | 8,108 | $ | 209 | 2.6 | % | ||||||||
Occupancy | 2011 | 2010 |
Stabilized | 83.2% | 82.7% |
Non-stabilized | 53.6% | n/a |
Total | 82.2% | 82.7% |
Comparison of Results from Commercial and Residential Properties
The following table presents an analysis of the relative investment in (corresponding to "Property owned" on the balance sheet, i.e., cost), and net operating income of, our commercial and multi-family residential properties over the past three fiscal years:
(in thousands, except percentages) | ||||||||||||||||||||||||
Fiscal Years Ended April 30 | 2012 | % | 2011 | % | 2010 | % | ||||||||||||||||||
Real Estate Investments – (cost before depreciation) | ||||||||||||||||||||||||
Multi-Family Residential | $ | 539,783 | 28.5 | % | $ | 484,815 | 27.4 | % | $ | 556,867 | 30.9 | % | ||||||||||||
Commercial Office | 605,318 | 32.0 | % | 595,491 | 33.6 | % | 582,943 | 32.4 | % | |||||||||||||||
Commercial Medical | 500,268 | 26.4 | % | 447,831 | 25.3 | % | 430,229 | 23.9 | % | |||||||||||||||
Commercial Industrial | 119,002 | 6.3 | % | 117,602 | 6.6 | % | 113,249 | 6.3 | % | |||||||||||||||
Commercial Retail | 127,638 | 6.8 | % | 125,059 | 7.1 | % | 117,231 | 6.5 | % | |||||||||||||||
Total | $ | 1,892,009 | 100.0 | % | $ | 1,770,798 | 100.0 | % | $ | 1,800,519 | 100.0 | % | ||||||||||||
Net Operating Income | ||||||||||||||||||||||||
Multi-Family Residential | $ | 39,400 | 27.4 | % | $ | 32,709 | 24.2 | % | $ | 34,523 | 25.3 | % | ||||||||||||
Commercial Office | 39,518 | 27.5 | % | 41,692 | 30.8 | % | 45,246 | 33.2 | % | |||||||||||||||
Commercial Medical | 44,876 | 31.2 | % | 43,597 | 32.3 | % | 39,610 | 29.0 | % | |||||||||||||||
Commercial Industrial | 10,776 | 7.5 | % | 8,837 | 6.5 | % | 8,974 | 6.6 | % | |||||||||||||||
Commercial Retail | 9,214 | 6.4 | % | 8,317 | 6.2 | % | 8,108 | 5.9 | % | |||||||||||||||
Total | $ | 143,784 | 100.0 | % | $ | 135,152 | 100.0 | % | $ | 136,461 | 100.0 | % | ||||||||||||
2012 Annual Report 54
Index
Analysis of Lease Expirations and Credit Risk
The following table shows the annual lease expiration percentages and base rent of expiring leases for the total commercial segments properties (including real estate held for sale) owned by us as of April 30, 2012, for fiscal years 2013 through 2022, and the leases that will expire during fiscal year 2023 and beyond. Our multi-family residential properties are excluded from this table, since residential leases are generally for a one-year term.
Fiscal Year of Lease Expiration | Square Footage of Expiring Leases | Percentage of Total Commercial Segments Leased Square Footage | Annualized Base Rent of Expiring Leases at Expiration | Percentage of Total Commercial Segments Annualized Base Rent | ||||||||||||
2013 | 971,511 | 9.4 | % | $ | 10,885,609 | 9.0 | % | |||||||||
2014 | 1,449,127 | 14.1 | % | 15,815,281 | 13.1 | % | ||||||||||
2015 | 1,190,948 | 11.6 | % | 12,159,254 | 10.0 | % | ||||||||||
2016 | 1,645,734 | 16.0 | % | 16,623,282 | 13.7 | % | ||||||||||
2017 | 1,360,739 | 13.2 | % | 18,498,152 | 15.3 | % | ||||||||||
2018 | 398,760 | 3.9 | % | 6,600,155 | 5.5 | % | ||||||||||
2019 | 874,526 | 8.5 | % | 10,368,301 | 8.6 | % | ||||||||||
2020 | 429,403 | 4.2 | % | 5,266,278 | 4.3 | % | ||||||||||
2021 | 181,175 | 1.8 | % | 2,504,072 | 2.1 | % | ||||||||||
2022 | 1,428,414 | 13.9 | % | 14,827,636 | 12.3 | % | ||||||||||
Thereafter | 350,872 | 3.4 | % | 7,378,013 | 6.1 | % | ||||||||||
Totals | 10,281,209 | 100.0 | % | $ | 120,926,033 | 100.0 | % | |||||||||
The following table lists our top ten commercial tenants on April 30, 2012, for all commercial properties owned by us, measured by percentage of total commercial segments' minimum rents as of April 1, 2012. Our results of operations are dependent on, among other factors, the economic health of our tenants. We attempt to mitigate tenant credit risk by working to secure creditworthy tenants that meet our underwriting criteria and monitoring our portfolio to identify potential problem tenants. We believe that our credit risk is also mitigated by the fact that no individual tenant accounts for more than approximately 10% of our total real estate rentals, although affiliated entities of Edgewood Vista together accounted for approximately 12.4% of our total commercial segments' minimum rents as of April 1, 2012.
Lessee | % of Total Commercial Segments Minimum Rents as of April 1, 2012 |
Affiliates of Edgewood Vista | 12.4% |
St. Luke's Hospital of Duluth, Inc. | 3.5% |
Fairview Health Services | 3.4% |
Applied Underwriters | 2.2% |
Affiliates of Siemens USA | 1.6% |
HealthEast Care System | 1.6% |
Affiliates of Hewlett Packard | 1.4% |
Nebraska Orthopaedic Hospital | 1.3% |
Microsoft (NASDAQ: MSFT) | 1.3% |
Arcadis Corporate Services, Inc. | 1.2% |
All Others | 70.1% |
Total Monthly Commercial Rent as of April 1, 2012 | 100.0% |
2012 Annual Report 55
Index
Property Acquisitions
IRET Properties paid approximately $97.1 million for real estate properties added to its portfolio during fiscal year 2012, compared to $45.6 million in fiscal year 2011. The fiscal year 2012 and 2011 additions are detailed below.
Fiscal 2012 ( May 1, 2011 to April 30, 2012 )
(in thousands) | |||||||||||||||||
Acquisitions and Development Projects Placed in Service | Date Acquired | Land | Building | Intangible Assets | Acquisition Cost | ||||||||||||
Multi-Family Residential | |||||||||||||||||
147 unit - Regency Park Estates - St. Cloud, MN | 8/1/11 | $ | 702 | $ | 10,198 | $ | 0 | $ | 10,900 | ||||||||
50 unit - Cottage West Twin Homes - Sioux Falls, SD | 10/12/11 | 968 | 3,762 | 0 | 4,730 | ||||||||||||
24 unit - Gables Townhomes - Sioux Falls, SD | 10/12/11 | 349 | 1,921 | 0 | 2,270 | ||||||||||||
36 unit - Evergreen II - Isanti, MN | 11/1/11 | 691 | 2,784 | 0 | 3,475 | ||||||||||||
116 unit - Grand Gateway - St. Cloud MN | 2/16/12 | 814 | 7,086 | 0 | 7,900 | ||||||||||||
84 unit - Ashland - Grand Forks, ND | 3/16/12 | 741 | 7,569 | 0 | 8,310 | ||||||||||||
72 unit - Williston Garden Buildings 1 and 2 - Williston, ND (1) | 4/27/12 | 700 | 8,978 | 0 | 9,678 | ||||||||||||
| 4,965 | 42,298 | 0 | 47,263 | ||||||||||||||
Commercial Medical | |||||||||||||||||
17,273 sq. ft Spring Creek American Falls - American Falls, ID | 9/1/11 | 145 | 3,870 | 55 | 4,070 | ||||||||||||
15,571 sq. ft Spring Creek Soda Springs - Soda Springs, ID | 9/1/11 | 66 | 2,134 | 30 | 2,230 | ||||||||||||
15,559 sq. ft Spring Creek Eagle - Eagle, ID | 9/1/11 | 263 | 3,775 | 62 | 4,100 | ||||||||||||
31,820 sq. ft Spring Creek Meridian - Meridian, ID | 9/1/11 | 424 | 6,724 | 102 | 7,250 | ||||||||||||
26,605 sq. ft Spring Creek Overland - Boise, ID | 9/1/11 | 687 | 5,941 | 97 | 6,725 | ||||||||||||
16,311 sq. ft Spring Creek Boise - Boise, ID | 9/1/11 | 708 | 4,296 | 71 | 5,075 | ||||||||||||
26,605 sq. ft Spring Creek Ustick - Meridian, ID | 9/1/11 | 467 | 3,833 | 0 | 4,300 | ||||||||||||
Meadow Wind Land - Casper, WY | 9/1/11 | 50 | 0 | 0 | 50 | ||||||||||||
24,795 sq. ft Trinity at Plaza 16 - Minot, ND (2) | 9/23/11 | 0 | 5,685 | 0 | 5,685 | ||||||||||||
3,431 sq. ft Edina 6525 Drew Ave S - Edina, MN | 10/13/11 | 388 | 117 | 0 | 505 | ||||||||||||
22,193 sq. ft Meadow Winds Addition - Casper, WY (3) | 12/30/11 | 0 | 3,952 | 0 | 3,952 | ||||||||||||
| 3,198 | 40,327 | 417 | 43,942 | ||||||||||||||
Commercial Retail | |||||||||||||||||
19,037 sq. ft. Jamestown Buffalo Mall - Jamestown, ND (4) | 6/15/11 | 0 | 879 | 0 | 879 | ||||||||||||
Unimproved Land | |||||||||||||||||
Industrial-Office Build-to-Suit - Minot, ND | 9/7/11 | 416 | 0 | 0 | 416 | ||||||||||||
Renaissance Heights - Williston, ND | 4/11/12 | 4,600 | 0 | 0 | 4,600 | ||||||||||||
| 5,016 | 0 | 0 | 5,016 | ||||||||||||||
Total Property Acquisitions | $ | 13,179 | $ | 83,504 | $ | 417 | $ | 97,100 | |||||||||
(1) | Development property placed in service April 27, 2012. Buildings 3 and 4 of this project are expected to be placed in service during the first quarter of fiscal year 2013. |
(2) | Development property placed in service September 23, 2011. Additional costs paid in fiscal year 2011 totaled $3.3 million, for a total project cost at April 30, 2012 of $9.0 million. |
(3) | Expansion project placed in service December 30, 2011. |
(4) | Construction project placed in service June 15, 2011. Additional costs paid in fiscal year 2011 totaled $1.4 million, for a total project cost at April 30, 2012 of $2.3 million. |
|
2012 Annual Report 56
Index
Fiscal 2011 ( May 1, 2010 to April 30, 2011 )
(in thousands) | |||||||||||||||||
Acquisitions and Development Projects Placed in Service | Date Acquired | Land | Building | Intangible Assets | Acquisition Cost | ||||||||||||
Multi-Family Residential | |||||||||||||||||
24 unit - North Pointe 2 - Bismarck, ND | 2/3/11 | $ | 159 | $ | 1,713 | $ | 0 | $ | 1,872 | ||||||||
44 unit - Sierra Vista - Sioux Falls, SD | 2/28/11 | 241 | 2,097 | 0 | 2,338 | ||||||||||||
| 400 | 3,810 | 0 | 4,210 | ||||||||||||||
Commercial Office | |||||||||||||||||
58,574 sq. ft. Omaha 10802 Farnam Dr - Omaha, NE | 12/16/10 | 2,462 | 4,374 | 1,459 | 8,295 | ||||||||||||
Commercial Medical | |||||||||||||||||
14,705 sq. ft. Billings 2300 Grant Road - Billings, MT | 7/15/10 | 649 | 1,216 | 657 | 2,522 | ||||||||||||
14,640 sq. ft. Missoula 3050 Great Northern - Missoula, MT | 7/15/10 | 640 | 1,331 | 752 | 2,723 | ||||||||||||
108,503 sq. ft. Edgewood Vista Minot - Minot, ND | 11/10/10 | 1,046 | 11,590 | 2,545 | 15,181 | ||||||||||||
23,965 sq. ft. Edgewood Vista Spearfish Expansion - Spearfish, SD 1 | 1/10/11 | 0 | 2,777 | 0 | 2,777 | ||||||||||||
| 2,335 | 16,914 | 3,954 | 23,203 | ||||||||||||||
Commercial Industrial | |||||||||||||||||
42,244 sq. ft. Fargo 1320 45th St N - Fargo, ND 2 | 6/22/10 | 0 | 1,634 | 0 | 1,634 | ||||||||||||
Commercial Retail | |||||||||||||||||
47,709 sq. ft. Minot 1400 31st Ave - Minot, ND | 12/10/10 | 1,026 | 6,143 | 1,081 | 8,250 | ||||||||||||
Total Property Acquisitions | $ | 6,223 | $ | 32,875 | $ | 6,494 | $ | 45,592 | |||||||||
(1) | Expansion project placed in service January 10, 2011. Approximately $497,000 of this cost was incurred in the three months ended April 30, 2011. |
(2) | Development property placed in service June 22, 2010. Additional costs incurred in fiscal year 2010 totaled $2.3 million, for a total project cost at April 30, 2011 of $3.9 million. |
Property Dispositions
During fiscal year 2012, the Company disposed of two retail properties for an aggregate sales price of $3.2 million, compared to dispositions totaling $83.3 million in fiscal year 2011. The fiscal year 2012 and 2011 dispositions are detailed below.
Fiscal 2012 ( May 1, 2011 to April 30, 2012 )
(in thousands) | ||||||||||||
Dispositions | Sales Price | Book Value and Sales Cost | Gain/(Loss) | |||||||||
Commercial Retail | ||||||||||||
41,200 sq ft. Livingstone Pamida - Livingston, MT | $ | 2,175 | $ | 1,586 | $ | 589 | ||||||
12,556 sq ft. East Grand Station – East Grand Forks, MN | $ | 1,062 | $ | 1,302 | $ | (240 | ) | |||||
Total Property Dispositions | $ | 3,237 | $ | 2,888 | $ | 349 | ||||||
2012 Annual Report 57
Index
Fiscal 2011 ( May 1, 2010 to April 30, 2011 )
(in thousands) | ||||||||||||
Dispositions | Sales Price | Book Value and Sales Cost | Gain/(Loss) | |||||||||
Multi-Family Residential | ||||||||||||
504 unit - Dakota Hill at Valley Ranch - Irving, TX | $ | 36,100 | $ | 30,909 | $ | 5,191 | ||||||
192 unit - Neighborhood Apartments - Colorado Springs, CO | 11,200 | 9,664 | 1,536 | |||||||||
195 unit - Pinecone Apartments - Fort Collins, CO | 15,875 | 10,422 | 5,453 | |||||||||
210 unit - Miramont Apartments - Fort Collins, CO | 17,200 | 10,732 | 6,468 | |||||||||
| 80,375 | 61,727 | 18,648 | ||||||||||
Commercial Medical | ||||||||||||
1,410 sq. ft. Edgewood Vista Patio Home 4330 - Fargo, ND | 205 | 220 | (15 | ) | ||||||||
Commercial Industrial | ||||||||||||
29,440 sq. ft. Waconia Industrial Building - Waconia, MN | 2,300 | 1,561 | 739 | |||||||||
Commercial Retail | ||||||||||||
41,000 sq. ft. Ladysmith Pamida - Ladysmith, WI | 450 | 457 | (7 | ) | ||||||||
Total Property Dispositions | $ | 83,330 | $ | 63,965 | $ | 19,365 | ||||||
Funds From Operations
IRET considers Funds from Operations ("FFO") a useful measure of performance for an equity REIT. IRET uses the definition of FFO adopted by the National Association of Real Estate Investment Trusts, Inc. ("NAREIT"). NAREIT defines FFO to mean "net income (computed in accordance with generally accepted accounting principles), excluding gains (or losses) from sales of property, plus depreciation and amortization, and after adjustments for unconsolidated partnerships and joint ventures. Adjustments for unconsolidated partnerships and joint ventures will be calculated to reflect funds from operations on the same basis." In addition, in October 2011 NAREIT clarified its computation of FFO so as to exclude impairment charges for all periods presented. Because of limitations of the FFO definition adopted by NAREIT, IRET has made certain interpretations in applying the definition. IRET believes all such interpretations not specifically provided for in the NAREIT definition are consistent with the definition.
IRET management considers that FFO, by excluding depreciation costs, the gains or losses from the sale of operating real estate properties and extraordinary items as defined by GAAP, is useful to investors in providing an additional perspective on IRET's operating results. Historical cost accounting for real estate assets in accordance with GAAP assumes, through depreciation, that the value of real estate assets decreases predictably over time. However, real estate asset values have historically risen or fallen with market conditions. NAREIT's definition of FFO, by excluding depreciation costs, reflects the fact that depreciation charges required by GAAP may not reflect underlying economic realities. Additionally, the exclusion, in NAREIT's definition of FFO, of gains and losses from the sales of previously depreciated operating real estate assets, assists IRET management and investors in identifying the operating results of the long-term assets that form the core of IRET's investments, and assists in comparing those operating results between periods. FFO is used by IRET's management and investors to identify trends in occupancy rates, rental rates and operating costs.
While FFO is widely used by REITs as a primary performance metric, not all real estate companies use the same definition of FFO or calculate FFO in the same way. Accordingly, FFO presented here is not necessarily comparable to FFO presented by other real estate companies.
FFO should not be considered as an alternative to net income as determined in accordance with GAAP as a measure of IRET's performance, but rather should be considered as an additional, supplemental measure, and should be viewed in conjunction with net income as presented in the consolidated financial statements included in this report.
2012 Annual Report 58
Index
FFO does not represent cash generated from operating activities in accordance with GAAP, and is not necessarily indicative of sufficient cash flow to fund all of IRET's needs or its ability to service indebtedness or make distributions.
FFO applicable to common shares and limited partnership units for the fiscal year ended April 30, 2012 was $67.3 million, compared to $62.2 million and $63.2 million for the fiscal years ended April 30, 2011 and 2010, respectively.
Reconciliation of Net Income Attributable to Investors Real Estate Trust to Funds From Operations
For the years ended April 30, 2012, 2011 and 2010:
(in thousands, except per share and unit amounts) | ||||||||||||||||||||||||||||||||||||
Fiscal Years Ended April 30, | 2012 | 2011 | 2010 | |||||||||||||||||||||||||||||||||
Amount | Weighted Avg Shares and Units (2) | Per Share and Unit (3) | Amount | Weighted Avg Shares and Units (2) | Per Share and Unit (3) | Amount | Weighted Avg Shares and Units (2) | Per Share and Unit (3) | ||||||||||||||||||||||||||||
Net income attributable to Investors Real Estate Trust | $ | 8,212 | $ | $ | 20,082 | $ | $ | 4,001 | $ | |||||||||||||||||||||||||||
Less dividends to preferred shareholders | (2,372 | ) | (2,372 | ) | (2,372 | ) | ||||||||||||||||||||||||||||||
Net income available to common shareholders | 5,840 | 83,557 | 0.07 | 17,710 | 78,628 | 0.22 | 1,629 | 69,093 | 0.03 | |||||||||||||||||||||||||||
Adjustments: | ||||||||||||||||||||||||||||||||||||
Noncontrolling interests – Operating Partnership | 1,359 | 19,875 | 4,449 | 20,154 | 562 | 20,825 | ||||||||||||||||||||||||||||||
Depreciation and amortization (1) | 60,057 | 59,402 | 59,383 | |||||||||||||||||||||||||||||||||
Impairment of real estate | 428 | 0 | 1,678 | |||||||||||||||||||||||||||||||||
Gains on depreciable property sales | (349 | ) | (19,365 | ) | (68 | ) | ||||||||||||||||||||||||||||||
Funds from operations applicable to common shares and Units | $ | 67,335 | 103,432 | $ | 0.65 | $ | 62,196 | 98,782 | $ | 0.63 | $ | 63,184 | 89,918 | $ | 0.70 | |||||||||||||||||||||
(1) | Real estate depreciation and amortization consists of the sum of depreciation/amortization related to real estate investments and amortization related to non-real estate investments from the Consolidated Statements of Operations, totaling $60,264, $58,385 and $57,088 and depreciation/amortization from Discontinued Operations of $60, $1,289 and $2,675, less corporate-related depreciation and amortization on office equipment and other assets of $267, $272 and $380 for the fiscal year ended April 30, 2012, 2011 and 2010. |
(2) | UPREIT Units of the Operating Partnership are exchangeable for common shares of beneficial interest on a one-for-one basis. |
(3) | Net income is calculated on a per share basis. FFO is calculated on a per share and unit basis. |
Cash Distributions
The following cash distributions were paid to our common shareholders and UPREIT unitholders during fiscal years 2012, 2011 and 2010:
Fiscal Years | ||||||||||||
Quarters | 2012 | 2011 | 2010 | |||||||||
First | $ | .1715 | $ | .1715 | $ | .1705 | ||||||
Second | .1300 | .1715 | .1710 | |||||||||
Third | .1300 | .1715 | .1715 | |||||||||
Fourth | .1300 | .1715 | .1715 | |||||||||
| $ | .5615 | $ | .6860 | $ | .6845 | |||||||
The fiscal year 2012 cash distributions decreased 18.1% over the cash distributions paid during fiscal year 2011, and fiscal year 2011 cash distributions increased 0.2% over the cash distributions paid during fiscal year 2010.
2012 Annual Report 59
Index
Liquidity and Capital Resources
Overview
The Company's principal liquidity demands are maintaining distributions to the holders of the Company's common and preferred shares of beneficial interest and UPREIT Units, capital improvements and repairs and maintenance to the Company's properties, acquisition of additional properties, property development, tenant improvements and debt service and repayments.
The Company has historically met its short-term liquidity requirements through net cash flows provided by its operating activities, and, from time to time, through draws on its unsecured lines of credit. Management considers the Company's ability to generate cash from property operating activities, cash-out refinancing of existing properties and, from time to time, draws on its line of credit to be adequate to meet all operating requirements and to make distributions to its shareholders in accordance with the REIT provisions of the Internal Revenue Code. Budgeted expenditures for ongoing maintenance and capital improvements and renovations to our real estate portfolio are also generally expected to be funded from existing cash on hand, cash flow generated from property operations, cash-out refinancing of existing properties, and/or new borrowings, and the Company believes it will have sufficient cash to meet its commitments over the next twelve months. However, the commercial and residential real estate markets continue to experience significant challenges including reduced occupancies and rental rates as well as restrictions on the availability of financing. In the event of further deterioration in property operating results, or absent the Company's ability to successfully continue cash-out refinancing of existing properties and/or new borrowings, the Company may need to consider additional cash preservation alternatives, including scaling back development activities, capital improvements and renovations.
For the fiscal year ended April 30, 2012, the Company paid distributions totaling $46.9 million in cash and $10.8 million in common shares pursuant to our DRIP to common shareholders and unitholders of the Operating Partnership, as compared to net cash provided by operating activities of $65.1 million and funds from operations of $67.3 million.
To the extent the Company does not satisfy its long-term liquidity requirements, which consist primarily of maturities under the Company's long-term debt, construction and development activities and potential acquisition opportunities, through net cash flows provided by operating activities and its credit facilities, the Company intends to satisfy such requirements through a combination of funding sources which the Company believes will be available to it, including the issuance of UPREIT Units, additional common or preferred equity, proceeds from the sale of properties, and additional long-term secured or unsecured indebtedness. However, our ability to raise funds through the sale of equity securities, the sale of properties, and additional long-term secured or unsecured borrowings is dependent on, among other things, general economic conditions, general market conditions for REITs, our operating performance, and the current trading price of our common shares, and the capital and debt markets may not consistently be available at all or on terms that we consider attractive. In particular, as a result of the economic downturn and turmoil in the capital markets, the availability of secured and unsecured loans was for a time sharply curtailed. We cannot predict whether these conditions will recur. As a result of general economic conditions in our markets, economic downturns affecting the ability to attract and retain tenants, unfavorable fluctuations in interest rates or our share price, unfavorable changes in the supply of competing properties, or our properties not performing as expected, we may not generate sufficient cash flow from operations or otherwise have access to capital on favorable terms, or at all. If we are unable to obtain capital from other sources, we may not be able to pay the distribution required to maintain our status as a REIT, make required principal and interest payments, make strategic acquisitions or make necessary routine capital improvements or undertake re-development opportunities with respect to our existing portfolio of operating assets. In addition, if a property is mortgaged to secure payment of indebtedness and we are unable to meet mortgage payments, the holder of the mortgage could foreclose on the property, resulting in loss of income and asset values.
Sources and Uses of Cash
As of April 30, 2012, the Company had one secured line of credit with First International Bank and Trust, Watford City, North Dakota, as lead bank. This line of credit matures on August 12, 2013, and had, as of April 30, 2012, lending commitments of $60.0 million. Participants in this secured credit facility as of April 30, 2012 included, in addition to First International Bank, the following financial institutions: The Bank of North Dakota; First Western Bank and Trust; Dacotah Bank; United Community Bank of North Dakota; American State Bank & Trust Company
2012 Annual Report 60
Index
and Town & Country Credit Union. As of April 30, 2012, the Company had advanced $39.0 million under the line of credit. The line of credit has a minimum outstanding principal balance requirement of $10.0 million. The interest rate on borrowings under the facility during fiscal year 2012 was Wall Street Journal Prime Rate +1.0%, with a floor of 5.65% and a cap of 8.65%; interest-only payments are due monthly based on the total amount of advances outstanding. The line of credit may be prepaid at par at any time. The facility includes covenants and restrictions requiring the Company to achieve on a calendar quarter basis a debt service coverage ratio on borrowing base collateral of 1.25x in the aggregate and 1.00x on individual assets in the collateral pool, and the Company is also required to maintain minimum depository account(s) totaling $6.0 million with First International, of which $1.5 million is to be held in a non-interest bearing account. As of April 30, 2012, 23 properties with a total cost of $114.6 million collateralized this line of credit. As of April 30, 2012, the Company believes it is in compliance with the facility covenants. Subsequent to the end of fiscal year 2012, effective June 15, 2012, IRET Properties agreed to an amendment to the line of credit to increase the interest rate spread on borrowings to the Wall Street Journal Prime Rate +1.25% and to lower the floor interest rate to 5.15%. All other terms of the line of credit remain unchanged.
The Company maintains compensating balances, not restricted as to withdrawal, with several financial institutions in connection with financing received from those institutions and/or to ensure future credit availability. At April 30, 2012, the Company's compensating balances consisted of the following: Dacotah Bank, Minot, North Dakota, deposit of $350,000; United Community Bank , Minot, North Dakota, deposit of $275,000; Commerce Bank, A Minnesota Banking Corporation, deposit of $250,000; First International Bank, Watford City, North Dakota, deposit of $6.1 million; Peoples State Bank of Velva, North Dakota, deposit of $225,000; Equity Bank, Minnetonka, Minnesota, deposit of $300,000; Associated Bank, Green Bay, Wisconsin, deposit of $500,000; Venture Bank, Eagan, Minnesota, deposit of $500,000; and American National Bank, Omaha, Nebraska, deposit of $400,000.
The Company has an effective shelf registration statement under which it has registered common and preferred shares of beneficial interest with an aggregate public offering price of up to $150.0 million. On January 20, 2012, the Company entered into a continuous equity offering program under this shelf registration statement with BMO Capital Markets Corp. ("BMO") as sales agent, pursuant to which the Company may from time to time offer and sell its common shares of beneficial interest having an aggregate gross sales price of up to $100.0 million. Sales of common shares, if any, under the program will depend upon market conditions and other factors to be determined by IRET. During fiscal year 2012, IRET issued 3.3 million common shares under this program for gross proceeds of $24.5 million and net proceeds (before offering expenses but after underwriting discounts and commissions) of $24.0 million. We use net proceeds from the sale of common shares under this program for the repayment of borrowings under our line of credit, acquisitions and developments and general corporate purposes. During fiscal year 2011, IRET sold 1.8 million common shares under its previous continuous equity offering program with Robert W. Baird & Co., Incorporated as sales agent, for gross proceeds of $15.3 million and net proceeds of approximately $15.0 million, before offering expenses but after underwriting discounts and commissions. The shelf registration statement under which the Company had reserved shares for issuance under this previous continuous equity offering program expired at the end of its three-year life during the second quarter of fiscal year 2012.
During fiscal year 2012, economic conditions in the United States began to show signs of improvement, but the ongoing recovery has been slow and uneven, and economic forecasters continue to predict lingering high unemployment. Credit markets, however, continued to be stable, with credit availability relatively unconstrained, and benchmark interest rates remaining at or near historic lows. Underwriting on commercial real estate continues to be more conservative compared to the underwriting standards employed prior to the recessionary period, however, and we continue to find recourse security more frequently required, lower amounts of proceeds available, and lenders limiting the amount of financing available to existing relationships in an effort to manage capital allocations and credit risk. While we continue to expect to be able to refinance our maturing debt without significant issues, we also expect lenders to continue to employ conservative underwriting regarding asset quality, occupancy levels and tenant creditworthiness. As we were in regard to fiscal year 2012, we remain cautious regarding our ability in fiscal year 2013 to rely on cash-out refinancing at levels we had achieved in recent years to provide funds for investment opportunities and other corporate purposes. Additionally, while to date there has been no material negative impact on our ability to borrow in our multi-family segment, we continue to closely monitor proposals to modify the roles of the Federal Home Loan Mortgage Corporation (Freddie Mac) and the Federal National Mortgage Association (Fannie Mae) in financing multi-family residential properties; we consider that one of the consequences of a modification in the agencies' roles could potentially be a narrowing of their lending focus away from the smaller secondary or tertiary markets which we generally target, to multi-family residential properties in major metropolitan markets. IRET obtains a majority of its multi-family debt from primarily Freddie Mac, and we continue to plan to refinance a majority of our maturing multi-family debt with these two entities, so any change in
2012 Annual Report 61
Index
their ability or willingness to lend going forward would most likely result in higher loan costs and/or more constricted availability of financing for us. As of April 30, 2012, approximately 13.7%, or $3.0 million of our mortgage debt maturing in the next twelve months is placed on multi-family residential assets, and approximately 86.3%, or $18.5 million, is placed on properties in our four commercial segments. Mortgage debt maturing in the first two quarters of fiscal year 2013 totaled approximately $2.2 million under a mortgage loan secured by a property in Wisconsin; this loan was paid in full by the Company in May 2012.
Despite these market uncertainties, and a continued tightening in credit standards by lenders, IRET during fiscal year 2012 acquired properties with an investment cost totaling $97.1 million. In fiscal year 2012, IRET disposed of two retail properties for sales prices totaling approximately $3.2 million, compared to dispositions totaling $83.3 million in fiscal year 2011.
The Company has a Distribution Reinvestment and Share Purchase Plan ("DRIP"). The DRIP provides shareholders of the Company an opportunity to invest their cash distributions in common shares of the Company at a discount (currently 5%) from the market price, and to purchase additional common shares of the Company with voluntary cash contributions, also at a discount to the market price. The maximum monthly investment permitted without prior Company approval is currently $10,000. The Company can issue waivers to DRIP participants to provide for investments in excess of the $10,000 maximum monthly investment. During fiscal year 2012, the Company issued 2.2 million shares at an average price of $7.21 per share pursuant to such waivers, for total net proceeds to the Company of $15.8 million. During fiscal year 2012, approximately 4.8 million common shares were issued under the DRIP plan, with an additional 1.7 million common shares issued during fiscal year 2011, and 1.4 million common shares issued during fiscal year 2010.
The issuance of UPREIT Units for property acquisitions continues to be a source of capital for the Company. Approximately 1.0 million units were issued in connection with property acquisitions during fiscal year 2012, and approximately 555,000 units and 390,000 units, respectively, were issued in connection with property acquisitions during fiscal years 2011 and 2010.
As a result of the issuance of common shares pursuant to our shelf registration statement and distribution reinvestment plan, net of fractional shares repurchased, the Company's equity capital increased during fiscal 2012 by $59.2 million. Additionally, the equity capital of the Company increased by $8.1 million as a result of contributions of real estate in exchange for UPREIT units, as summarized above, resulting in a total increase in equity capital of $67.3 million from these sources during fiscal year 2012. The Company's equity capital increased by $36.2 million and $122.8 million in fiscal years 2011 and 2010, respectively, as a result of the issuance of common shares pursuant to our shelf registration statement and distribution reinvestment plan, net of fractional shares repurchased, and contributions of real estate in exchange for UPREIT units.
Cash and cash equivalents on April 30, 2012 totaled $40.0 million, compared to $41.2 million and $54.8 million on the same date in 2011 and 2010, respectively. Net cash provided by operating activities increased to $65.1 million in fiscal year 2012 from $58.8 million in fiscal year 2011 due primarily to an increase in net income from continuing operations due to acquisitions and increased occupancy. Net cash provided by operating activities decreased slightly to $58.8 million in fiscal year 2011 from $61.4 million in fiscal year 2010 due primarily to changes in deferred charges and accounts payable, accrued expenses, and other liabilities.
Net cash used by investing activities was $128.3 million in fiscal year 2012, compared to $11.7 million of net cash provided by investing activities in fiscal year 2011. Net cash used by investing activities was $79.0 million in fiscal year 2010. The increase in net cash used by investing activities in fiscal year 2012 compared to fiscal year 2011 was primarily a result of a decrease in proceeds from the sale of real estate coupled with an increase in expenditures for acquisitions and improvements of real estate investments. Net cash provided by financing activities during fiscal year 2012 was $61.9 million, compared to $84.1 million used by financing activities during fiscal year 2011, with the change due primarily to a decrease in principal payments on mortgages payable. Net cash used by financing activities during fiscal year 2011 was $84.1 million, compared to $39.1 million provided by financing activities during fiscal year 2010, with the change due primarily to a decrease in proceeds from the sale of common shares, a decrease in proceeds from mortgages payable and an increase in principal payments on mortgages payable.
2012 Annual Report 62
Index
Financial Condition
Mortgage Loan Indebtedness. Mortgage loan indebtedness increased to $1.0 billion on April 30, 2012 from $993.8 million on April 30, 2011, due to new debt and refinancings, net of principal payments and loan payoffs. Approximately 98.5% of such mortgage debt is at fixed rates of interest, with staggered maturities. This limits the Company's exposure to changes in interest rates, which minimizes the effect of interest rate fluctuations on the Company's results of operations and cash flows. As of April 30, 2012, the weighted average rate of interest on the Company's mortgage debt was 5.78%, compared to 5.92% on April 30, 2011.
Revolving lines of credit. As of April 30, 2012, the Company had one secured line of credit with First International Bank and Trust, Watford City, North Dakota, as lead bank. This line of credit matures on August 12, 2013, and had, as of April 30, 2012, lending commitments of $60.0 million. Participants in this secured credit facility as of April 30, 2012 included, in addition to First International Bank, the following financial institutions: The Bank of North Dakota; First Western Bank and Trust; Dacotah Bank; United Community Bank of North Dakota; American State Bank & Trust Company and Town & Country Credit Union. As of April 30, 2012, the Company had advanced $39.0 million under the line of credit. The line of credit has a minimum outstanding principal balance requirement of $10.0 million. The interest rate on borrowings under the facility during fiscal year 2012 was Wall Street Journal Prime Rate +1.0%, with a floor of 5.65% and a cap of 8.65%; interest-only payments are due monthly based on the total amount of advances outstanding. The line of credit may be prepaid at par at any time. The facility includes covenants and restrictions requiring the Company to achieve on a calendar quarter basis a debt service coverage ratio on borrowing base collateral of 1.25x in the aggregate and 1.00x on individual assets in the collateral pool, and the Company is also required to maintain minimum depository account(s) totaling $6.0 million with First International, of which $1.5 million is to be held in a non-interest bearing account. As of April 30, 2012, 23 properties with a total cost of $114.6 million collateralized this line of credit. As of April 30, 2012, the Company believes it is in compliance with the facility covenants. Subsequent to the end of fiscal year 2012, effective June 15, 2012, IRET Properties agreed to an amendment to the line of credit to increase the interest rate spread on borrowings to the Wall Street Journal Prime Rate +1.25% and to lower the floor interest rate to 5.15%. All other terms of the line of credit remain unchanged.
Mortgage Loans Receivable. Mortgage loans receivable net of allowance decreased to $0 at April 30, 2012, from approximately $156,000 at April 30, 2011.
Property Owned. Property owned was $1.9 billion and $1.8 billion at April 30, 2012 and 2011, respectively. Acquisitions, developments and improvements to existing properties in fiscal year 2012, partially offset by fiscal year 2012 dispositions, resulted in the net increase in property owned as of April 30, 2012 compared to April 30, 2011.
Cash and Cash Equivalents. Cash and cash equivalents on April 30, 2012 totaled $40.0 million, compared to $41.2 million on April 30, 2011. The decrease in cash on hand on April 30, 2012, as compared to April 30, 2011, was due primarily to the acquisition and development of property.
Other Investments. Other investments, consisting of bank certificates of deposit, increased slightly to approximately $634,000 on April 30, 2012, from $625,000 on April 30, 2011.
Operating Partnership Units. Outstanding limited partnership units in the Operating Partnership increased to 20.3 million units on April 30, 2012, compared to 20.1 million units on April 30, 2011. The increase in units outstanding at April 30, 2012 as compared to April 30, 2011, resulted from the issuance of units in exchange for property, net of the conversion of units to shares.
Common and Preferred Shares of Beneficial Interest. Common shares of beneficial interest outstanding on April 30, 2012 totaled 89.5 million compared to 80.5 million common shares outstanding on April 30, 2011. This increase in common shares outstanding from April 30, 2011 to April 30, 2012 was due to the issuance of common shares pursuant to our shelf registration statement and distribution reinvestment plan. During fiscal year 2012, IRET issued 3.3 million common shares under its continuous offering program with BMO Capital Markets Corp. as sales agent. The net proceeds (before offering expenses but after underwriting discounts and commissions) from the offering of $24.0 million were used for general corporate purposes including the acquisition and development of investment properties. The Company issued common shares pursuant to our Distribution Reinvestment and Share Purchase Plan, consisting of approximately 3.3 million common shares issued during fiscal year 2012, for a total value of
2012 Annual Report 63
Index
approximately $23.5 million. Conversions of approximately 759,000 UPREIT Units to common shares during fiscal year 2012, for a total of approximately $3.5 million in IRET shareholders' equity, also increased the Company's common shares of beneficial interest outstanding during the twelve months ended April 30, 2012 compared to the twelve months ended April 30, 2011. Preferred shares of beneficial interest outstanding on April 30, 2012 and 2011 totaled 1.2 million.
Contractual Obligations and Other Commitments
The primary contractual obligations of the Company relate to its borrowings under its line of credit and mortgage notes payable. The Company's line of credit matures in August 2013, and had $39.0 million in loans outstanding at April 30, 2012. The principal and interest payments on the mortgage notes payable for the years subsequent to April 30, 2012, are included in the table below as "Long-term debt." Interest due on variable rate mortgage notes is calculated using rates in effect on April 30, 2012. The "Other Debt" category consists of principal and interest payments on construction loans and an unsecured promissory note issued by the Company to the sellers of an office/warehouse property located in Minnesota (a portion of the purchase price was paid by the Company in the form of a $1.0 million promissory note with a ten-year term; if the tenant defaults in the initial terms of the lease, the then-current balance of the promissory note is forfeited to the Company).
As of April 30, 2012, the Company was a tenant under operating ground or air rights leases on twelve of its properties. The Company pays a total of approximately $500,000 per year in rent under these leases, which have remaining terms ranging from 3 months to 89 years, and expiration dates ranging from July 2012 to October 2100.
Purchase obligations of the Company represent those costs that the Company is contractually obligated to pay in the future. The Company's significant purchase obligations as of April 30, 2012, which the Company expects to finance through debt and operating cash, are summarized in the following table. The significant components in the purchase obligation category are costs for construction and expansion projects and capital improvements at the Company's properties. Purchase obligations that are contingent upon the achievement of certain milestones are not included in the table below, nor are service orders or contracts for the provision of routine maintenance services at our properties, such as landscaping and grounds maintenance, since these arrangements are generally based on current needs, are filled by our service providers within short time horizons, and may be cancelled without penalty. The expected timing of payment of the obligations discussed below is estimated based on current information.
(in thousands) | ||||||||||||||||||||
Total | Less Than 1 Year | 1-3 Years | 3-5 Years | More than 5 Years | ||||||||||||||||
Long-term debt (principal and interest) | $ | 1,381,338 | $ | 111,041 | $ | 288,480 | $ | 366,504 | $ | 615,313 | ||||||||||
Line of credit (principal and interest) (1) | $ | 41,828 | $ | 2,204 | $ | 39,624 | $ | 0 | $ | 0 | ||||||||||
Other Debt (principal and interest) | $ | 16,568 | $ | 883 | $ | 8,176 | $ | 1,239 | $ | 6,270 | ||||||||||
Operating Lease Obligations | $ | 24,459 | $ | 499 | $ | 1,001 | $ | 918 | $ | 22, 041 | ||||||||||
Purchase Obligations | $ | 7,098 | $ | 7,098 | $ | 0 | $ | 0 | $ | 0 | ||||||||||
(1) | The future interest payments on the Company's line of credit were estimated using the outstanding principal balance and interest rate in effect as of April 30, 2012. |
Off-Balance-Sheet Arrangements
As of April 30, 2012, the Company had no significant off-balance-sheet arrangements, as defined in Item 303(a)(4)(ii) of SEC Regulation S-K.
Recent Developments
Common and Preferred Share Distributions. On July 2, 2012, the Company paid a distribution of 51.56 cents per share on the Company's Series A Cumulative Redeemable Preferred Shares, to preferred shareholders of record on June 15, 2012. On July 2, 2012, the Company paid a distribution of 13.00 cents per share on the Company's common shares of beneficial interest, to common shareholders and UPREIT unitholders of record on June 15, 2012.
Completed Acquisitions and Dispositions . Subsequent to the end of fiscal year 2012, on May 8, 2012, the Company closed on its acquisition of a 308-unit multi-family residential property in Topeka, Kansas, for a purchase price totaling $17.7 million, of which approximately $12.5 million consisted of the assumption of existing debt, with the remainder paid in cash. On June 4, 2012, the Company closed on its acquisition of two multi-family residential
2012 Annual Report 64
Index
properties in Lincoln, Nebraska. The 232-unit Colony apartment property was acquired for a purchase price of $17.5 million, of which approximately $14.2 million was paid in cash and the remainder in limited partnership units of the Operating Partnership valued at approximately $3.3 million. The 208-unit Lakeside Village apartment property was acquired for a purchase price of $17.3 million, of which approximately $13.8 million was paid in cash and the remainder in limited partnership units of the Operating Partnership valued at approximately $3.5 million. The Company placed mortgage debt of $14.0 million and $13.8 million, respectively, on these two properties on June 4, 2012.
On June 20, 2012, the Company sold an approximately 16,000 square foot retail property in Kentwood, Michigan, for a sale price of $625,000. On June 21, 2012, the Company sold two condominium units in Grand Chute, Wisconsin, for a sale price of approximately $330,000.
On June 15, 2012 the Company filed a registration statement with the Securities and Exchange Commission to register shares for issuance under the Company's DRIP. This registration statement replaces the previous DRIP registration statement, and all shares remaining unsold under the previous DRIP registration statement were transferred to the new registration statement. On June 29, 2012, the Company filed a registration statement with the Securities and Exchange Commission to enable the Company to offer and sell, from time to time, in one or more offerings, common and preferred shares of beneficial interest with an aggregate public offering price of up to $150.0 million. This shelf registration statement is in addition to the Company's currently-effective registration statement under which the Company registered, in May 2010, common and preferred shares with an aggregate public offering price of up to $150.0 million, of which $100.0 million has been reserved for issuance under the continuous equity offering program with BMO as sales agent.
Item 7A. Quantitative and Qualitative Disclosures About Market Risk
Our exposure to market risk is limited primarily to fluctuations in the general level of interest rates on our current and future fixed and variable rate debt obligations, and secondarily to our deposits with and investments in certain products issued by various financial institutions.
Variable interest rates . Because approximately 98.5% of our mortgage debt, as of April 30, 2012 (99.8% and 97.3% as of April 30, 2011 and 2010, respectively), is at fixed interest rates, we have little exposure to interest rate fluctuation risk on our existing mortgage debt. However, even though our goal is to maintain a fairly low exposure to interest rate risk, we are still vulnerable to significant fluctuations in interest rates on any future repricing or refinancing of our fixed or variable rate debt and on future debt. We primarily use long-term (more than nine years) and medium term (five to seven years) debt as a source of capital. We do not currently use derivative securities, interest-rate swaps or any other type of hedging activity to manage our interest rate risk. As of April 30, 2012, we had the following amount of future principal and interest payments due on mortgages secured by our real estate.
Future Principal Payments (in thousands, except percentages) | ||||||||||||||||||||||||||||||||
Long Term Debt | 2013 | 2014 | 2015 | 2016 | 2017 | Thereafter | Total | Fair Value | ||||||||||||||||||||||||
Fixed Rate | $ | 50,934 | $ | 73,857 | $ | 96,613 | $ | 86,341 | $ | 198,961 | $ | 525,829 | $ | 1,032,535 | $ | 1,070,935 | ||||||||||||||||
Average Fixed Interest Rate | 5.73 | % | 5.68 | % | 5.57 | % | 5.50 | % | 4.96 | % | ||||||||||||||||||||||
Variable Rate | $ | 228 | $ | 715 | $ | 9,870 | $ | 123 | $ | 128 | $ | 5,090 | $ | 16,154 | $ | 16,147 | ||||||||||||||||
Average Variable Interest Rate | 4.71 | % | 4.62 | % | 4.76 | % | 3.34 | % | 3.33 | % | ||||||||||||||||||||||
| $ | 1,048,689 | $ | 1,087,082 | |||||||||||||||||||||||||||||
Future Interest Payments (in thousands) | ||||||||||||||||||||||||||||
Long Term Debt | 2013 | 2014 | 2015 | 2016 | 2017 | Thereafter | Total | |||||||||||||||||||||
Fixed Rate | $ | 59,118 | $ | 55,803 | $ | 50,568 | $ | 44,622 | $ | 35,977 | $ | 84,074 | $ | 330,162 | ||||||||||||||
Variable Rate | 761 | 736 | 318 | 178 | 174 | 320 | 2,487 | |||||||||||||||||||||
| $ | 332,649 | |||||||||||||||||||||||||||
As of April 30, 2012, the weighted-average interest rate on our fixed rate and variable rate loans was 5.80% and 4.67%, respectively. The weighted-average interest rate on all of our mortgage debt as of April 30, 2012, was 5.78%. Any fluctuations in variable interest rates could increase or decrease our interest expenses. For example, an increase of one percent per annum on our $16.2 million of variable rate mortgage indebtedness would increase our annual interest expense by $162,000.
2012 Annual Report 65
Index
Exposure to interest rate fluctuation risk on our $60.0 million secured line of credit is limited by a cap on the interest rate. The interest rate on borrowings under the facility during fiscal year 2012 was Wall Street Journal Prime Rate +1.0%, with a floor of 5.65% and a cap of 8.65%; interest-only payments are due monthly based on the total amount of advances outstanding. The line of credit may be prepaid at par at any time. The line of credit matures in August 2013 and had an outstanding balance of $39.0 million at April 30, 2012. Subsequent to the end of fiscal year 2012, effective June 15, 2012, IRET Properties agreed to an amendment to the line of credit to increase the interest rate spread on borrowings to the Wall Street Journal Prime Rate +1.25% and to lower the floor interest rate to 5.15%. All other terms of the line of credit remain unchanged.
Investments with Certain Financial Institutions . IRET has entered into a cash management arrangement with First Western Bank (the "Bank") with respect to deposit accounts that exceed Federal Deposit Insurance Corporation ("FDIC") coverage. On a daily basis, account balances are swept into a repurchase account. The Bank pledges fractional interests in US Government Securities owned by the Bank at an amount equal to the excess over the uncollected balance in the repurchase account. The amounts deposited by IRET pursuant to the repurchase agreement are not insured by FDIC. At April 30, 2012 and 2011, these amounts totaled $15.1 million and $23.5 million, respectively.
Deposits exceeding FDIC insurance. The Company is potentially exposed to off-balance-sheet risk in respect of cash deposited with FDIC-insured financial institutions in accounts which, at times, may exceed federally insured limits. The Company has not experienced any losses in such accounts.
Item 8. Financial Statements and Supplementary Data
Financial statements required by this item appear with an Index to Financial Statements and Schedules, starting on page F-1 of this report, and are incorporated herein by reference.
| Item 9. Changes in and Disagreements with Accountants on Accounting and Financial Disclosure |
Effective July 16, 2012, the Company dismissed Deloitte & Touche LLP ("Deloitte") as its independent public accounting firm. The Company previously announced that the Audit Committee of the Company's Board of Trustees (the "Audit Committee") had determined on June 26, 2012 that Deloitte would be dismissed as the Company's independent registered public accounting firm effective upon Deloitte's completion of its procedures regarding the financial statements of the Company for the fiscal year ended April 30, 2012 and this Form 10-K in which such financial statements are included. Deloitte completed its procedures on July 16, 2012, coincident with the filing of this Form 10-K.
Deloitte's reports on the financial statements of the Company as of and for the fiscal years ended April 30, 2012 and 2011 did not contain any adverse opinion or disclaimer of opinion, nor were such reports qualified or modified as to uncertainty, audit scope or accounting principles. During the fiscal years ended April 30, 2012 and 2011, and through July 16, 2012, (1) there were no disagreements with Deloitte on any matter of accounting principles or practices, financial statement disclosure or audit scope or procedure, which, if not resolved to the satisfaction of Deloitte, would have caused Deloitte to make reference thereto in connection with its reports on the financial statements of the Company for such years, and (2) there were no "reportable events" as defined in Item 304(a)(1)(v) of Regulation S-K.
Also as previously announced, on June 26, 2012, the Audit Committee selected Grant Thornton LLP ("Grant Thornton") to serve as the Company's independent registered public accounting firm for the fiscal year ending April 30, 2013. This appointment followed a request for proposal and selection process conducted by the Audit Committee. During the fiscal years ended April 30, 2012 and 2011, and through July 16, 2012, the Company did not consult with Grant Thornton regarding any of the matters or events set forth in Item 304(a)(2)(i) or (ii) of Regulation S-K.
2012 Annual Report 66
Index
Item 9A. Controls and Procedures
Disclosure Controls and Procedures: As of April 30, 2012, the end of the period covered by this Annual Report on Form 10-K, our management carried out an evaluation, under the supervision and with the participation of the Company's Chief Executive Officer, Chief Operating Officer and Chief Financial Officer, of the effectiveness of the design and operation of our disclosure controls and procedures (as such term is defined in Rule 13a-15(e) under the Exchange Act). Based upon that evaluation, the Company's Chief Executive Officer, Chief Operating Officer and Chief Financial Officer concluded that our disclosure controls and procedures were effective to ensure that information required to be disclosed by IRET in the reports that it files or submits under the Exchange Act is recorded, processed, summarized and reported within the time periods specified in the Commission's rules and forms, and is accumulated and communicated to management, including the Company's principal executive and principal financial officers, as appropriate to allow timely decisions regarding required disclosure.
Internal Control Over Financial Reporting: There have been no changes in the Company's internal control over financial reporting (as defined in Rule 13a-15(f) under the Exchange Act) during the fourth quarter of the fiscal year to which this report relates that have materially affected, or are reasonably likely to materially affect, the Company's internal control over financial reporting.
2012 Annual Report 67
Index
MANAGEMENT'S REPORT ON INTERNAL CONTROL OVER FINANCIAL REPORTING
Management of Investors Real Estate Trust (together with its consolidated subsidiaries, the "Company"), is responsible for establishing and maintaining adequate internal control over financial reporting. The Company's internal control over financial reporting is a process designed under the supervision of the Company's principal executive and principal financial officers to provide reasonable assurance regarding the reliability of financial reporting and the preparation of the Company's financial statements for external reporting purposes in accordance with United States generally accepted accounting principles.
As of April 30, 2012, management conducted an assessment of the effectiveness of the Company's internal control over financial reporting, based on the framework established in Internal Control – Integrated Framework issued by the Committee of Sponsoring Organizations of the Treadway Commission (COSO). Based on this assessment, management has determined that the Company's internal control over financial reporting as of April 30, 2012, was effective.
The Company's internal control over financial reporting includes policies and procedures that pertain to the maintenance of records that, in reasonable detail, accurately and fairly reflect transactions and acquisitions and dispositions of assets; provide reasonable assurance that transactions are recorded as necessary to permit preparation of financial statements in accordance with United States generally accepted accounting principles, and that receipts and expenditures are being made only in accordance with authorizations of management and the trustees of the Company; and provide reasonable assurance regarding prevention or timely detection of unauthorized acquisition, use or disposition of Company assets that could have a material effect on the Company's financial statements.
The Company's internal control over financial reporting as of April 30, 2012, has been audited by Deloitte & Touche LLP, an independent registered public accounting firm, as stated in their report on page F-2 hereof, which expresses an unqualified opinion on the effectiveness of the Company's internal control over financial reporting as of April 30, 2012.
| (The remainder of this page has been intentionally left blank.) |
2012 Annual Report 68
Index
Item 9B. Other Information
None.
PART III
Item 10. Trustees, Executive Officers and Corporate Governance
Information regarding executive officers required by this Item is set forth in Part I, Item 1 of this Annual Report on Form 10-K pursuant to Instruction 3 to Item 401(b) of Regulation S-K. Other information required by this Item will be included in our definitive Proxy Statement for our 2012 Annual Meeting of Shareholders and such information is incorporated herein by reference. IRET has adopted a Code of Ethics applicable to, among others, IRET's principal executive officer and principal financial and accounting officer. This Code is available on our website at www.iret.com.
Item 11. Executive Compensation
The information required by this Item will be contained in our definitive Proxy Statement for our 2012 Annual Meeting of Shareholders and such information is incorporated herein by reference.
Item 12. Security Ownership of Certain Beneficial Owners and Management and Related Stockholder Matters
The information required by this Item will be contained in our definitive Proxy Statement for our 2012 Annual Meeting of Shareholders and such information is incorporated herein by reference.
The following table provides information as of April 30, 2012 regarding compensation plans (including individual compensation arrangements) under which our common shares of beneficial interest are available for issuance:
Equity Compensation Plan Information | |||
Plan category | Number of securities to be issued upon exercise of outstanding options, warrants and rights (a) | Weighted-average exercise price of outstanding options, warrants and rights (b) | Number of securities remaining available for future issuance under equity compensation plans (excluding securities reflected in column (a)) (c) |
Equity compensation plans approved by security holders (1) | 0 | 0 | 1,900,348 (2) |
Equity compensation plans not approved by security holders | 0 | 0 | 0 |
Total | 0 | 0 | 1,900,348 |
(1) | The 2008 Incentive Award Plan of Investors Real Estate Trust and IRET Properties approved by shareholders on September 16, 2008. |
(2) | All of the shares available for future issuance under the 2008 Incentive Award Plan approved by shareholders may be issued as restricted shares, performance awards or stock payment awards. |
Item 13. Certain Relationships and Related Transactions, and Trustee Independence
The information required by this Item will be contained in our definitive Proxy Statement for our 2012 Annual Meeting of Shareholders and such information is incorporated herein by reference.
Item 14. Principal Accountant Fees and Services
The information required by this Item will be contained in our definitive Proxy Statement for our 2012 Annual Meeting of Shareholders and such information is incorporated herein by reference.
2012 Annual Report 69
Index
PART IV
Item 15. Exhibits, Financial Statement Schedules
(a) | The following documents are filed as part of this report : |
| 1. Financial Statements |
The response to this portion of Item 15 is submitted as a separate section of this report. See the table of contents to Financial Statements and Supplemental Data.
| 2. Financial Statement Schedules |
The response to this portion of Item 15 is submitted as a separate section of this report. The following financial statement schedules should be read in conjunction with the financial statements referenced in Part II, Item 8 of this Annual Report on Form 10-K:
Schedule III Real Estate Owned and Accumulated Depreciation
| 3. Exhibits |
See the list of exhibits set forth in part (b) below.
(b) | The following is a list of Exhibits to this Annual Report on Form 10-K. We will furnish a printed copy of any exhibit listed below to any security holder who requests it upon payment of a fee of 15 cents per page. All Exhibits are either contained in this Annual Report on Form 10-K or are incorporated by reference as indicated below. |
3.1 | Articles of Amendment and Third Restated Declaration of Trust of Investors Real Estate Trust , as amended, incorporated herein by reference to Exhibit 3.1 to the Company's Registration Statement on Form S-3 (Reg. No. 333-182451), filed with the SEC on June 29, 2012. |
3.2 | Third Restated Trustees' Regulations (Bylaws), dated May 16, 2007, and incorporated herein by reference to the Company's Current Report on Form 8-K , filed with the SEC on May 16, 2007. |
3.3 | Agreement of Limited Partnership of IRET Properties, A North Dakota Limited Partnership, dated January 31, 1997, filed as Exhibit 3(ii) to the Registration Statement on Form S-11, effective March 14, 1997 (SEC File No. 333-21945) filed for the Registrant on February 18, 1997 (File No. 0-14851), and incorporated herein by reference. |
4.1 | Loan Agreement dated August 12, 2010 by and among IRET Properties, as borrower, the financial institutions party thereto as lenders, and First International Bank & Trust as lender and lead bank, incorporated herein by reference to the Company's Current Report on Form 8-K, filed with the SEC on August 18, 2010. |
4.2 | Third Amendment to Loan Agreement dated June 15, 2012 by and between IRET Properties, as borrower, and First International Bank & Trust, as lender, incorporated herein by reference to the Company's Current Report on Form 8-K, filed with the SEC on June 22, 2012. |
10.1 | Member Control and Operating Agreement dated September 30, 2002, filed as Exhibit 10 to the Company's Form 8-K filed October 15, 2003, and incorporated herein by reference. |
10.2 | Letter Agreement dated January 31, 2003, filed as Exhibit 10(i) to the Company's Form 8-K filed February 27, 2003, and incorporated herein by reference. |
10.3 | Option Agreement dated January 31, 2003, filed as Exhibit 10(ii) to the Company's Form 8-K filed February 27, 2003, and incorporated herein by reference. |
10.4 | Financial Statements of T.F. James Company filed as Exhibit 10 to the Company's Form 8-K filed January 31, 2003, and incorporated herein by reference. |
2012 Annual Report 70
Index
10.5 | Agreement for Purchase and Sale of Property dated February 13, 2004, by and between IRET Properties and the Sellers specified therein, filed as Exhibit 10.5 to the Company's Form 10-K filed July 20, 2004, and incorporated herein by reference. |
10.6 | Contribution Agreement, filed as Exhibit 10.1 to the Company's Form 8-K filed May 17, 2006, and incorporated herein by reference. |
10.7 | Loan and Security Agreement, filed as Exhibit 10.1 to the Company's Current Report on Form 8-K filed September 18, 2006, and incorporated herein by reference. |
10.8* | Short-Term Incentive Program, filed as Exhibit 10.1 to the Company's Form 8-K filed June 4, 2012 and incorporated herein by reference. |
10.9* | Long-Term Incentive Program, filed as Exhibit 10.2 to the Company's Form 8-K filed June 4, 2012 and incorporated herein by reference. |
10.10* | Description of Compensation of Trustees and Named Executive Officers, as described in 5.02 in the Company's Form 8-K filed June 4, 2012 and incorporated herein by reference. |
12.1 | Computation of Ratio of Earnings to Fixed Charges and Earnings to Combined Fixed Charges and Preferred Share Dividends, filed herewith. |
21.1 | Subsidiaries of Investors Real Estate Trust, filed herewith. |
23.1 | Consent of Independent Registered Public Accounting Firm, filed herewith. |
31.1 | Section 302 Certification of President and Chief Executive Officer, filed herewith. |
31.2 | Section 302 Certification of Executive Vice President and Chief Financial Officer, filed herewith. |
32.1 | Section 906 Certification of the President and Chief Executive Officer, filed herewith. |
32.2 | Section 906 Certification of the Executive Vice President and Chief Financial Officer, filed herewith. |
101 | The following materials from our Annual Report on Form 10-K for the year ended April 30, 2012 formatted in eXtensible Business Reporting Language ("XBRL"): (i) the Consolidated Balance Sheets, (ii) the Consolidated Statements of Operations, (iii) the Consolidated Statements of Equity, (iv) the Consolidated Statements of Cash Flows, and (v) notes to these consolidated financial statements. (1) |
________________________
* | Indicates management compensatory plan, contract or arrangement. |
(1) | Users of this data are advised pursuant to Rule 406T of Regulation S-T that these interactive data files are deemed not filed or part of a registration statement or prospectus for purposes of Sections 11 or 12 of the Securities Act, are deemed not filed for purposes of Section 18 of the Exchange Act, and otherwise are not subject to liability under these sections. |
2012 Annual Report 71
Index
Signatures
Pursuant to the requirements of Section 13 or 15(d) of the Securities Exchange Act of 1934, the Registrant has duly caused this report to be signed on its behalf by the undersigned, thereunto duly authorized.
Date: July 16, 2012 | Investors Real Estate Trust | |
By: | /s/ Timothy P. Mihalick | |
Timothy P. Mihalick | ||
President & Chief Executive Officer | ||
Pursuant to the requirements of the Securities Exchange Act of 1934, this report has been signed below by the following persons on behalf of the Registrant and in the capacities and on the dates indicated:
Signature | Title | Date | ||
/s/ Jeffrey L. Miller | ||||
Jeffrey L. Miller | Trustee & Chairman | June 27, 2012 | ||
/s/ Stephen L. Stenehjem | ||||
Stephen L. Stenehjem | Trustee & Vice Chairman | June 27, 2012 | ||
/s/ Timothy P. Mihalick | ||||
Timothy P. Mihalick | President & Chief Executive Officer (Principal Executive Officer); Trustee | June 27, 2012 | ||
/s/ Thomas A. Wentz, Jr. | ||||
Thomas A. Wentz, Jr. | Trustee, Executive Vice President & Chief Operating Officer | June 27, 2012 | ||
/s/ Diane K. Bryantt | ||||
Diane K. Bryantt | Executive Vice President & Chief Financial Officer (Principal Financial and Accounting Officer) | June 27, 2012 | ||
/s/ John D. Stewart | ||||
John D. Stewart | Trustee | June 27, 2012 | ||
/s/ Linda Hall Keller | ||||
Linda Hall Keller | Trustee | June 27, 2012 | ||
/s/ John T. Reed | ||||
John T. Reed | Trustee | June 27, 2012 | ||
/s/ W. David Scott | ||||
W. David Scott | Trustee | June 27, 2012 | ||
/s/ Jeffrey K. Woodbury | ||||
Jeffrey K. Woodbury | Trustee | June 27, 2012 |
2012 Annual Report 72
Index

INVESTORS REAL ESTATE TRUST
AND SUBSIDIARIES
CONSOLIDATED BALANCE SHEETS AS OF April 30, 2012 AND 2011,
AND THE RELATED CONSOLIDATED STATEMENTS OF OPERATIONS,
EQUITY AND CASH FLOWS FOR EACH OF
THE FISCAL YEARS IN THE THREE YEARS ENDED April 30, 2012.
ADDITIONAL INFORMATION
FOR THE YEAR ENDED
April 30, 2012
and
REPORT OF INDEPENDENT REGISTERED
PUBLIC ACCOUNTING FIRM
1400 31 st Avenue SW, Suite 60
Post Office Box 1988
Minot, ND 58702-1988
701-837-4738
fax: 701-838-7785
www.iret.com
2012 Annual Report
Index
INVESTORS REAL ESTATE TRUST AND SUBSIDIARIES
TABLE OF CONTENTS
PAGE | |
REPORT OF INDEPENDENT REGISTERED PUBLIC ACCOUNTING FIRM | F-2 |
CONSOLIDATED FINANCIAL STATEMENTS | |
Consolidated Balance Sheets | F-4 |
Consolidated Statements of Operations | F-5 |
Consolidated Statements of Equity | F-6 |
Consolidated Statements of Cash Flows | F-7 – F-8 |
Notes to Consolidated Financial Statements | F-9 – F-33 |
ADDITIONAL INFORMATION | |
Schedule III - Real Estate and Accumulated Depreciation | F-34-44 |
Schedules other than those listed above are omitted since they are not required or are not applicable, or the required information is shown in the consolidated financial statements or notes thereon.
2012 Annual Report F-1
Table of Contents
REPORT OF INDEPENDENT REGISTERED PUBLIC ACCOUNTING FIRM
To the Board of Trustees and Shareholders of
Investors Real Estate Trust
Minot, North Dakota
We have audited the accompanying consolidated balance sheets of Investors Real Estate Trust and subsidiaries (the "Company") as of April 30, 2012 and 2011, and the related consolidated statements of operations, equity, and cash flows for each of the three years in the period ended April 30, 2012. Our audits also included the consolidated financial statement schedules listed in the Index at Item 15. We also have audited the Company's internal control over financial reporting as of April 30, 2012 , based on criteria established in Internal Control - Integrated Framework issued by the Committee of Sponsoring Organizations of the Treadway Commission. The Company's management is responsible for these financial statements and financial statement schedules, for maintaining effective internal control over financial reporting, and for its assessment of the effectiveness of internal control over financial reporting, included in the accompanying Management's Report on Internal Control Over Financial Reporting. Our responsibility is to express an opinion on these financial statements and financial statement schedules and an opinion on the Company's internal control over financial reporting based on our audits.
We conducted our audits in accordance with the standards of the Public Company Accounting Oversight Board (United States). Those standards require that we plan and perform the audit to obtain reasonable assurance about whether the financial statements are free of material misstatement and whether effective internal control over financial reporting was maintained in all material respects. Our audits of the financial statements included examining, on a test basis, evidence supporting the amounts and disclosures in the financial statements, assessing the accounting principles used and significant estimates made by management, and evaluating the overall financial statement presentation. Our audit of internal control over financial reporting included obtaining an understanding of internal control over financial reporting, assessing the risk that a material weakness exists, testing and evaluating the design and operating effectiveness of internal control based on the assessed risk. Our audits also included performing such other procedures as we considered necessary in the circumstances. We believe that our audits provide a reasonable basis for our opinions.
A company's internal control over financial reporting is a process designed by, or under the supervision of, the company's principal executive and principal financial officers, or persons performing similar functions, and effected by the company's board of directors, management, and other personnel to provide reasonable assurance regarding the reliability of financial reporting and the preparation of financial statements for external purposes in accordance with generally accepted accounting principles. A company's internal control over financial reporting includes those policies and procedures that (1) pertain to the maintenance of records that, in reasonable detail, accurately and fairly reflect the transactions and dispositions of the assets of the company; (2) provide reasonable assurance that transactions are recorded as necessary to permit preparation of financial statements in accordance with generally accepted accounting principles and that receipts and expenditures of the company are being made only in accordance with authorizations of management and directors of the company; and (3) provide reasonable assurance regarding prevention or timely detection of unauthorized acquisition, use, or disposition of the company's assets that could have a material effect on the financial statements.
Because of the inherent limitations of internal control over financial reporting, including the possibility of collusion or improper management override of controls, material misstatements due to error or fraud may not be prevented or detected on a timely basis. Also, projections of any evaluation of the effectiveness of the internal control over financial reporting to future periods are subject to the risk that the controls may become inadequate because of changes in conditions, or that the degree of compliance with the policies or procedures may deteriorate.
In our opinion, the consolidated financial statements referred to above present fairly, in all material respects, the financial position of Investors Real Estate Trust and subsidiaries as of April 30, 2012 and 2011, and the results of their operations and their cash flows for each of the three years in the period ended April 30, 2012, in conformity with accounting principles generally accepted in the United States of America. Also, in our opinion, such financial
2012 Annual Report F-2
Table of Contents
statement schedules, when considered in relation to the basic consolidated financial statements taken as a whole, present fairly, in all material respects, the information set forth therein. Also, in our opinion, the Company maintained, in all material respects, effective internal control over financial reporting as of April 30, 2012, based on the criteria established in Internal Control - Integrated Framework issued by the Committee of Sponsoring Organizations of the Treadway Commission .
/s/ DELOITTE & TOUCHE LLP
Minneapolis, Minnesota
July 16, 2012
2012 Annual Report F-3
Table of Contents
INVESTORS REAL ESTATE TRUST AND SUBSIDIARIES
CONSOLIDATED BALANCE SHEETS
April 30, 2012 and 2011
(in thousands) | ||||||||
April 30, 2012 | April 30, 2011 | |||||||
ASSETS | ||||||||
Real estate investments | ||||||||
Property owned | $ | 1,892,009 | $ | 1,770,798 | ||||
Less accumulated depreciation | (373,490 | ) | (328,952 | ) | ||||
| 1,518,519 | 1,441,846 | |||||||
Development in progress | 27,599 | 9,693 | ||||||
Unimproved land | 10,990 | 6,550 | ||||||
Mortgage loans receivable, net of allowance of $0 and $3, respectively | 0 | 156 | ||||||
Total real estate investments | 1,557,108 | 1,458,245 | ||||||
Real estate held for sale | 2,067 | 0 | ||||||
Cash and cash equivalents | 39,989 | 41,191 | ||||||
Other investments | 634 | 625 | ||||||
Receivable arising from straight-lining of rents, net of allowance of $1,209 and $996, respectively | 23,273 | 18,933 | ||||||
Accounts receivable, net of allowance of $154 and $317, respectively | 7,052 | 5,646 | ||||||
Real estate deposits | 263 | 329 | ||||||
Prepaid and other assets | 3,703 | 2,351 | ||||||
Intangible assets, net of accumulated amortization of $47,813 and $42,154, respectively | 44,588 | 49,832 | ||||||
Tax, insurance, and other escrow | 11,669 | 15,268 | ||||||
Property and equipment, net of accumulated depreciation of $1,423 and $1,231, respectively | 1,454 | 1,704 | ||||||
Goodwill | 1,120 | 1,127 | ||||||
Deferred charges and leasing costs, net of accumulated amortization of $16,244 and $13,675, respectively | 21,447 | 20,112 | ||||||
TOTAL ASSETS | $ | 1,714,367 | $ | 1,615,363 | ||||
LIABILITIES AND EQUITY | ||||||||
LIABILITIES | ||||||||
Accounts payable and accrued expenses | $ | 47,403 | $ | 37,879 | ||||
Revolving line of credit | 39,000 | 30,000 | ||||||
Mortgages payable | 1,048,689 | 993,803 | ||||||
Other | 14,012 | 8,404 | ||||||
TOTAL LIABILITIES | 1,149,104 | 1,070,086 | ||||||
COMMITMENTS AND CONTINGENCIES (NOTE 15) | ||||||||
REDEEMABLE NONCONTROLLING INTERESTS – CONSOLIDATED REAL ESTATE ENTITIES | 0 | 987 | ||||||
EQUITY | ||||||||
Investors Real Estate Trust shareholders' equity | ||||||||
Preferred Shares of Beneficial Interest (Cumulative redeemable preferred shares, no par value, 1,150,000 shares issued and outstanding at April 30, 2012 and April 30, 2011, aggregate liquidation preference of $28,750,000) | 27,317 | 27,317 | ||||||
Common Shares of Beneficial Interest (Unlimited authorization, no par value, 89,473,838 shares issued and outstanding at April 30, 2012, and 80,523,265 shares issued and outstanding at April 30, 2011) | 684,049 | 621,936 | ||||||
Accumulated distributions in excess of net income | (278,377 | ) | (237,563 | ) | ||||
Total Investors Real Estate Trust shareholders' equity | 432,989 | 411,690 | ||||||
Noncontrolling interests – Operating Partnership (20,332,415 units at April 30, 2012 and 20,067,350 units at April 30, 2011) | 118,710 | 123,627 | ||||||
Noncontrolling interests – consolidated real estate entities | 13,564 | 8,973 | ||||||
Total equity | 565,263 | 544,290 | ||||||
TOTAL LIABILITIES AND EQUITY | $ | 1,714,367 | $ | 1,615,363 | ||||
SEE NOTES TO CONSOLIDATED FINANCIAL STATEMENTS.
2012 Annual Report F-4
Table of Contents
INVESTORS REAL ESTATE TRUST AND SUBSIDIARIES
CONSOLIDATED STATEMENTS OF OPERATIONS
for the years ended April 30, 2012, 2011, and 2010
( in thousands, except per share data) | ||||||||||||
2012 | 2011 | 2010 | ||||||||||
REVENUE | ||||||||||||
Real estate rentals | $ | 198,859 | $ | 192,023 | $ | 186,030 | ||||||
Tenant reimbursement | 42,929 | 44,931 | 44,913 | |||||||||
TOTAL REVENUE | 241,788 | 236,954 | 230,943 | |||||||||
EXPENSES | ||||||||||||
Depreciation/amortization related to real estate investments | 57,048 | 55,706 | 54,726 | |||||||||
Utilities | 17,628 | 18,224 | 17,094 | |||||||||
Maintenance | 26,578 | 29,212 | 26,957 | |||||||||
Real estate taxes | 31,746 | 30,799 | 30,140 | |||||||||
Insurance | 3,550 | 2,299 | 3,612 | |||||||||
Property management expenses | 18,776 | 21,268 | 18,339 | |||||||||
Administrative expenses | 6,694 | 6,617 | 5,716 | |||||||||
Advisory and trustee services | 687 | 605 | 502 | |||||||||
Other expenses | 1,898 | 1,747 | 2,513 | |||||||||
Amortization related to non-real estate investments | 3,216 | 2,679 | 2,362 | |||||||||
TOTAL EXPENSES | 167,821 | 169,156 | 161,961 | |||||||||
Gain on involuntary conversion | 274 | 0 | 1,660 | |||||||||
Interest expense | (65,113 | ) | (63,820 | ) | (65,442 | ) | ||||||
Interest income | 148 | 259 | 539 | |||||||||
Other income | 638 | 282 | 355 | |||||||||
Income from continuing operations | 9,914 | 4,519 | 6,094 | |||||||||
(Loss) income from discontinued operations | (208 | ) | 19,832 | (1,509 | ) | |||||||
NET INCOME | 9,706 | 24,351 | 4,585 | |||||||||
Net income attributable to noncontrolling interests – Operating Partnership | (1,359 | ) | (4,449 | ) | (562 | ) | ||||||
Net (income) loss attributable to noncontrolling interests – consolidated real estate entities | (135 | ) | 180 | (22 | ) | |||||||
Net income attributable to Investors Real Estate Trust | 8,212 | 20,082 | 4,001 | |||||||||
Dividends to preferred shareholders | (2,372 | ) | (2,372 | ) | (2,372 | ) | ||||||
NET INCOME AVAILABLE TO COMMON SHAREHOLDERS | $ | 5,840 | $ | 17,710 | $ | 1,629 | ||||||
Earnings per common share from continuing operations – Investors Real Estate Trust – basic and diluted | $ | .07 | $ | .02 | $ | .04 | ||||||
Earnings (loss) per common share from discontinued operations – Investors Real Estate Trust – basic and diluted | .00 | .20 | (.01 | ) | ||||||||
NET INCOME PER COMMON SHARE – BASIC & DILUTED | $ | .07 | $ | .22 | $ | .03 | ||||||
DIVIDENDS PER COMMON SHARE | $ | .5615 | $ | .6860 | $ | .6845 | ||||||
SEE NOTES TO CONSOLIDATED FINANCIAL STATEMENTS.
2012 Annual Report F-5
Table of Contents
INVESTORS REAL ESTATE TRUST AND SUBSIDIARIES
CONSOLIDATED STATEMENTS OF EQUITY
for the years ended April 30, 2012, 2011, and 2010
(in thousands) | ||||||||||||||||||||||||||||
NUMBER OF PREFERRED SHARES | PREFERRED SHARES | NUMBER OF COMMON SHARES | COMMON SHARES | ACCUMULATED DISTRIBUTIONS IN EXCESS OF NET INCOME | NONCONTROLLING INTERESTS | TOTAL EQUITY | ||||||||||||||||||||||
BALANCE APRIL 30, 2009 | 1,150 | $ | 27,317 | 60,304 | $ | 461,648 | $ | (155,956 | ) | $ | 160,398 | $ | 493,407 | |||||||||||||||
Net income attributable to Investors Real Estate Trust and nonredeemable noncontrolling interests | 4,001 | 524 | 4,525 | |||||||||||||||||||||||||
Distributions - common shares and units | (47,085 | ) | (14,261 | ) | (61,346 | ) | ||||||||||||||||||||||
Distributions - preferred shares | (2,372 | ) | (2,372 | ) | ||||||||||||||||||||||||
Distribution reinvestment and share purchase plan | 1,405 | 11,916 | 11,916 | |||||||||||||||||||||||||
Shares issued | 13,390 | 107,039 | 107,039 | |||||||||||||||||||||||||
Partnership units issued | 3,897 | 3,897 | ||||||||||||||||||||||||||
Redemption of units for common shares | 707 | 3,755 | (3,755 | ) | 0 | |||||||||||||||||||||||
Adjustments to redeemable noncontrolling interests | (192 | ) | (192 | ) | ||||||||||||||||||||||||
Other | (1 | ) | (548 | ) | (1,211 | ) | (1,759 | ) | ||||||||||||||||||||
BALANCE APRIL 30, 2010 | 1,150 | $ | 27,317 | 75,805 | $ | 583,618 | $ | (201,412 | ) | $ | 145,592 | $ | 555,115 | |||||||||||||||
Net income attributable to Investors Real Estate Trust and nonredeemable noncontrolling interests | 20,082 | 4,282 | 24,364 | |||||||||||||||||||||||||
Distributions - common shares and units | (53,861 | ) | (13,803 | ) | (67,664 | ) | ||||||||||||||||||||||
Distributions - preferred shares | (2,372 | ) | (2,372 | ) | ||||||||||||||||||||||||
Distribution reinvestment and share purchase plan | 1,706 | 14,548 | 14,548 | |||||||||||||||||||||||||
Shares issued | 2,004 | 16,676 | 16,676 | |||||||||||||||||||||||||
Partnership units issued | 4,996 | 4,996 | ||||||||||||||||||||||||||
Redemption of units for common shares | 1,009 | 6,905 | (6,905 | ) | 0 | |||||||||||||||||||||||
Adjustments to redeemable noncontrolling interests | 370 | 370 | ||||||||||||||||||||||||||
Other | (1 | ) | (181 | ) | (1,562 | ) | (1,743 | ) | ||||||||||||||||||||
BALANCE APRIL 30, 2011 | 1,150 | $ | 27,317 | 80,523 | $ | 621,936 | $ | (237,563 | ) | $ | 132,600 | $ | 544,290 | |||||||||||||||
Net income attributable to Investors Real Estate Trust and nonredeemable noncontrolling interests | 8,212 | 1,482 | 9,694 | |||||||||||||||||||||||||
Distributions - common shares and units | (46,654 | ) | (11,102 | ) | (57,756 | ) | ||||||||||||||||||||||
Distributions - preferred shares | (2,372 | ) | (2,372 | ) | ||||||||||||||||||||||||
Distribution reinvestment and share purchase plan | 4,796 | 34,345 | 34,345 | |||||||||||||||||||||||||
Shares issued | 3,398 | 24,870 | 24,870 | |||||||||||||||||||||||||
Partnership units issued | 8,055 | 8,055 | ||||||||||||||||||||||||||
Redemption of units for common shares | 759 | 3,454 | (3,454 | ) | 0 | |||||||||||||||||||||||
Other | (2 | ) | (556 | ) | 4,693 | 4,137 | ||||||||||||||||||||||
BALANCE APRIL 30, 2012 | 1,150 | $ | 27,317 | 89,474 | $ | 684,049 | $ | (278,377 | ) | $ | 132,274 | $ | 565,263 | |||||||||||||||
SEE NOTES TO CONSOLIDATED FINANCIAL STATEMENTS.
2012 Annual Report F-6
Table of Contents
INVESTORS REAL ESTATE TRUST AND SUBSIDIARIES
CONSOLIDATED STATEMENTS OF CASH FLOWS
for the years ended April 30, 2012, 2011, and 2010
(in thousands) | ||||||||||||
2012 | 2011 | 2010 | ||||||||||
CASH FLOWS FROM OPERATING ACTIVITIES | ||||||||||||
Net income | $ | 9,706 | $ | 24,351 | $ | 4,585 | ||||||
Adjustments to reconcile net income to net cash provided by operating activities: | ||||||||||||
Depreciation and amortization | 61,954 | 61,344 | 61,184 | |||||||||
Gain on sale of real estate, land and other investments | (349 | ) | (19,365 | ) | (68 | ) | ||||||
Gain on involuntary conversion | (274 | ) | 0 | (1,660 | ) | |||||||
Impairment of real estate assets | 428 | 0 | 1,678 | |||||||||
Donation of real estate assets | 0 | 0 | 450 | |||||||||
Bad debt expense | 298 | 733 | 1,399 | |||||||||
Changes in other assets and liabilities: | ||||||||||||
Increase in receivable arising from straight-lining of rents | (4,831 | ) | (1,732 | ) | (1,443 | ) | ||||||
Decrease (increase) in accounts receivable | 1,542 | (914 | ) | (3,371 | ) | |||||||
Increase in prepaid and other assets | (1,361 | ) | (1,162 | ) | (138 | ) | ||||||
(Increase) decrease in tax, insurance and other escrow | (353 | ) | 1,469 | (2,040 | ) | |||||||
Increase in deferred charges and leasing costs | (6,145 | ) | (6,501 | ) | (4,731 | ) | ||||||
Increase in accounts payable, accrued expenses and other liabilities | 4,522 | 551 | 5,567 | |||||||||
Net cash provided by operating activities | 65,137 | 58,774 | 61,412 | |||||||||
CASH FLOWS FROM INVESTING ACTIVITIES | ||||||||||||
Proceeds from real estate deposits | 2,254 | 2,766 | 2,588 | |||||||||
Payments for real estate deposits | (2,188 | ) | (2,579 | ) | (3,016 | ) | ||||||
Principal proceeds on mortgage loans receivable | 159 | 2 | 2 | |||||||||
Increase in other investments | 0 | (205 | ) | 0 | ||||||||
Decrease in lender holdbacks for improvements | 5,681 | 3,276 | 0 | |||||||||
Increase in lender holdbacks for improvements | (1,730 | ) | (10,712 | ) | 0 | |||||||
Proceeds from sale of discontinued operations | 3,142 | 81,539 | 103 | |||||||||
Proceeds from sale of real estate and other investments | 430 | 74 | 40 | |||||||||
Insurance proceeds received | 5,758 | 347 | 1,395 | |||||||||
Payments for acquisitions and improvements of real estate assets | (141,771 | ) | (62,824 | ) | (80,069 | ) | ||||||
Net cash (used) provided by investing activities | (128,265 | ) | 11,684 | (78,957 | ) | |||||||
CASH FLOWS FROM FINANCING ACTIVITIES | ||||||||||||
Proceeds from mortgages payable | 117,595 | 139,947 | 166,490 | |||||||||
Principal payments on mortgages payable | (77,089 | ) | (213,658 | ) | (180,482 | ) | ||||||
Proceeds from revolving lines of credit and other debt | 31,925 | 56,300 | 15,500 | |||||||||
Principal payments on revolving lines of credit and other debt | (10,060 | ) | (25,650 | ) | (15,567 | ) | ||||||
Proceeds from sale of common shares, net of issue costs | 24,427 | 16,423 | 106,889 | |||||||||
Proceeds from sale of common shares under distribution reinvestment and share purchase program | 23,511 | 3,175 | 1,382 | |||||||||
Repurchase of fractional shares and partnership units | (14 | ) | (10 | ) | (11 | ) | ||||||
Proceeds from noncontrolling partner – consolidated real estate entities | 2,854 | 0 | 0 | |||||||||
Payments for acquisition of noncontrolling interests – consolidated real estate entities | (1,289 | ) | (425 | ) | (475 | ) | ||||||
Distributions paid to common shareholders, net of reinvestment of $10,177, $10,627 and $9,762, respectively | (36,477 | ) | (43,234 | ) | (37,323 | ) | ||||||
Distributions paid to preferred shareholders | (2,372 | ) | (2,372 | ) | (2,372 | ) | ||||||
Distributions paid to noncontrolling interests – Unitholders of the Operating Partnership, net reinvestment of $657, $746 and $772, respectively | (10,445 | ) | (13,057 | ) | (13,489 | ) | ||||||
Distributions paid to noncontrolling interests – consolidated real estate entities | (613 | ) | (1,055 | ) | (1,273 | ) | ||||||
Distributions paid to redeemable noncontrolling interests-consolidated real estate entities | (27 | ) | (442 | ) | (177 | ) | ||||||
Net cash provided (used) by financing activities | 61,926 | (84,058 | ) | 39,092 | ||||||||
NET (DECREASE) INCREASE IN CASH AND CASH EQUIVALENTS | (1,202 | ) | (13,600 | ) | 21,547 | |||||||
CASH AND CASH EQUIVALENTS AT BEGINNING OF YEAR | 41,191 | 54,791 | 33,244 | |||||||||
CASH AND CASH EQUIVALENTS AT END OF YEAR | $ | 39,989 | $ | 41,191 | $ | 54,791 | ||||||
SEE NOTES TO CONSOLIDATED FINANCIAL STATEMENTS.
2012 Annual Report F-7
Table of Contents
INVESTORS REAL ESTATE TRUST AND SUBSIDIARIES
CONSOLIDATED STATEMENTS OF CASH FLOWS (continued)
for the years ended April 30, 2012, 2011, and 2010
(in thousands) | ||||||||||||
2012 | 2011 | 2010 | ||||||||||
SUPPLEMENTARY SCHEDULE OF NON-CASH INVESTING AND FINANCING ACTIVITIES | ||||||||||||
Distribution reinvestment plan | $ | 10,177 | $ | 10,627 | $ | 9,762 | ||||||
Operating partnership distribution reinvestment plan | 657 | 746 | 772 | |||||||||
Operating partnership units converted to shares | 3,454 | 6,905 | 3,755 | |||||||||
Real estate assets acquired through the issuance of operating partnership units | 8,055 | 4,996 | 3,897 | |||||||||
Real estate assets acquired through assumption of indebtedness and accrued costs | 7,190 | 9,895 | 2,569 | |||||||||
Adjustments to accounts payable included within real estate assets | (5,445 | ) | 933 | 324 | ||||||||
Noncontrolling partnership interest | 2,227 | 0 | 0 | |||||||||
Fair value adjustments to redeemable noncontrolling interests | 35 | 370 | (192 | ) | ||||||||
Involuntary conversion of assets due to flood and fire damage | 2,783 | 0 | 0 | |||||||||
Construction debt reclassified to mortgages payable | 7,190 | 0 | 0 | |||||||||
SUPPLEMENTAL DISCLOSURE OF CASH FLOW INFORMATION | ||||||||||||
Cash paid during the year for: | ||||||||||||
Interest on mortgages | $ | 60,604 | $ | 63,163 | $ | 67,234 | ||||||
Interest other | 3,049 | 1,399 | 682 | |||||||||
| $ | 63,653 | $ | 64,562 | $ | 67,916 | |||||||
SEE NOTES TO CONSOLIDATED FINANCIAL STATEMENTS.
2012 Annual Report F-8
Table of Contents
INVESTORS REAL ESTATE TRUST AND SUBSIDIARIES
NOTES TO CONSOLIDATED FINANCIAL STATEMENTS
April 30, 2012, 2011, and 2010
NOTE 1 • ORGANIZATION
Investors Real Estate Trust ("IRET" or the "Company") is a self-advised real estate investment trust engaged in acquiring, owning and leasing multi-family residential and commercial real estate. IRET has elected to be taxed as a Real Estate Investment Trust ("REIT") under Sections 856-860 of the Internal Revenue Code of 1986, as amended. REITs are subject to a number of organizational and operational requirements, including a requirement to distribute 90% of ordinary taxable income to shareholders, and, generally, are not subject to federal income tax on net income, except for taxes on undistributed REIT taxable income. IRET's multi-family residential properties and commercial properties are located mainly in the states of North Dakota and Minnesota, but also in the states of Colorado, Idaho, Iowa, Kansas, Missouri, Montana, Nebraska, South Dakota, Wisconsin and Wyoming. As of April 30, 2012, IRET owned 84 multi-family residential properties with approximately 9,161 apartment units and 182 commercial properties, consisting of commercial office, commercial medical, commercial industrial and commercial retail properties, totaling approximately 12.3 million net rentable square feet. IRET conducts a majority of its business activities through its consolidated operating partnership, IRET Properties, a North Dakota Limited Partnership (the "Operating Partnership"), as well as through a number of other subsidiary entities.
All references to IRET or the Company refer to Investors Real Estate Trust and its consolidated subsidiaries.
NOTE 2 • BASIS OF PRESENTATION AND SIGNIFICANT ACCOUNTING POLICIES
BASIS OF PRESENTATION
The accompanying consolidated financial statements include the accounts of IRET and all subsidiaries in which it maintains a controlling interest. All intercompany balances and transactions are eliminated in consolidation. The Company's fiscal year ends April 30th.
The accompanying consolidated financial statements include the accounts of IRET and its general partnership interest in the Operating Partnership. The Company's interest in the Operating Partnership was 81.5% and 80.1%, respectively, as of April 30, 2012 and 2011, which includes 100% of the general partnership interest. The limited partners have a redemption option that they may exercise. Upon exercise of the redemption option by the limited partners, IRET has the option of redeeming the limited partners' interests ("Units") for IRET common shares of beneficial interest, on a one-for-one basis, or for cash payment to the unitholder. The redemption generally may be exercised by the limited partners at any time after the first anniversary of the date of the acquisition of the Units (provided, however, that not more than two redemptions by a limited partner may occur during each calendar year, and each limited partner may not exercise the redemption for less than 1,000 Units, or, if such limited partner holds less than 1,000 Units, for all of the Units held by such limited partner). Some limited partners have contractually agreed to a holding period of greater than one year.
The consolidated financial statements also reflect the ownership by the Operating Partnership of certain joint venture entities in which the Operating Partnership has a general partner or controlling interest. These entities are consolidated into IRET's other operations with noncontrolling interests reflecting the noncontrolling partners' share of ownership and income and expenses.
RECENT ACCOUNTING PRONOUNCEMENTS
In May 2011, the Financial Accounting Standards Board ("FASB") issued Accounting Standards Update ("ASU") 2011-04, Fair Value Measurement (Topic 820): Amendments to Achieve Common Fair Value Measurement and Disclosure Requirements in U.S. GAAP and IFRS. ASU 2011-04 amended Accounting Standards Codification ("ASC") 820, Fair Value Measurements and Disclosures, to converge the fair value measurement guidance in U.S. GAAP and International Financial Reporting Standards ("IFRS"), and in some limited cases, changes some
2012 Annual Report F-9
Table of Contents
NOTE 2 • continued
principles to achieve convergence between U.S. GAAP and IFRS. ASU 2011-04 results in a consistent definition of fair value and common requirements for measurement of and disclosure about fair value between U.S. GAAP and IFRS. ASU 2011-04 also expands the disclosures for fair value measurements that are estimated using significant unobservable (Level 3) inputs. The amendments are to be applied prospectively for annual and interim periods beginning after December 15, 2011. The adoption of this update on February 1, 2012 did not have a material impact on the Company's operating results or financial position, but resulted in additional fair value measurement disclosures (see Note 16).
In June 2011, the FASB issued ASU 2011-05, Presentation of Comprehensive Income , which requires an entity to present the total of comprehensive income, the components of net income, and the components of other comprehensive income either in a single continuous statement of comprehensive income, or in two separate but consecutive statements. ASU 2011-05 eliminates the option to present components of other comprehensive income as part of the statement of equity. ASU 2011-05 will be effective for annual and interim periods beginning after December 15, 2011. The adoption of this update on February 1, 2012 did not have a material effect on the Company's operating results or financial position. The Company has no items of other comprehensive income for the periods ended April 30, 2012, 2011 and 2010.
In September 2011, the FASB issued ASU 2011-08, Testing Goodwill for Impairment. This standard gives entities testing goodwill for impairment the option of performing a qualitative assessment before calculating the fair value of the reporting unit (step I of the goodwill impairment test). If entities determine, on the basis of qualitative factors, that the fair value of the reporting unit is more likely than not less than its carrying amount, the two-step impairment test would be required. Otherwise, no further testing is required. The ASU does not change how goodwill is calculated or assigned to reporting units, nor does it revise the requirement to test goodwill annually for impairment. The ASU is effective for annual and interim goodwill impairment tests performed for fiscal years beginning after December 15, 2011, with early adoption permitted. The Company plans to adopt this update for fiscal year 2013, but does not intend to use the methodology allowed by the ASU.
USE OF ESTIMATES
The preparation of financial statements in conformity with accounting principles generally accepted in the United States of America ("U.S. GAAP") requires management to make estimates and assumptions that affect the reported amounts of assets and liabilities and disclosure of contingent assets and liabilities at the date of the financial statements and the reported amounts of revenues and expenses during the reporting period. Actual results could differ from those estimates.
RECLASSIFICATIONS
Certain previously reported amounts have been reclassified to conform to the current financial statement presentation. The Company reports, in discontinued operations, the results of operations and the related gains or losses of a property that has either been disposed of or is classified as held for sale and otherwise meets the classification of a discontinued operation. As a result of discontinued operations, retroactive reclassifications that change prior period numbers have been made. See Note 12 for additional information. During fiscal year 2012, the Company sold two retail properties. Eight condominium units in Grand Chute, Wisconsin, and a retail property in Kentwood, Michigan, were classified as held for sale at April 30, 2012. During fiscal year 2011, the Company sold four apartment complexes, one industrial property, one retail property and a patio home. The results of operations for these properties are included in income from discontinued operations in the Consolidated Statements of Operations.
REAL ESTATE INVESTMENTS
Real estate investments are recorded at cost less accumulated depreciation and an adjustment for impairment, if any. Acquisitions of real estate are recorded based upon preliminary allocations of the purchase price which are subject to adjustment as additional information is obtained, but in no case more than one year after the date of acquisition. The Company allocates the purchase price based on the relative fair values of the tangible and intangible assets of an acquired property (which includes the land, building, and personal property) which are determined by valuing the
2012 Annual Report F-10
Table of Contents
NOTE 2 • continued
property as if it were vacant and to fair value of the intangible assets (which include in-place leases.) The as-if-vacant value is allocated to land, buildings, and personal property based on management's determination of the relative fair values of these assets. The estimated fair value of the property is the amount that would be recoverable upon the disposition of the property. Techniques used to estimate fair value include discounted cash flow analysis and reference to recent sales of comparables. A land value is assigned based on the purchase price if land is acquired separately or based on estimated fair value if acquired in a merger or in a single or portfolio acquisition.
Above-market and below-market in-place lease intangibles for acquired properties are recorded at fair value based on the difference between (i) the contractual amounts to be paid pursuant to the in-place leases and (ii) management's estimate of market lease rates for the corresponding in-place leases, measured over a period equal to the remaining non-cancelable term of the lease.
Other intangible assets acquired include amounts for in-place lease values that are based upon the Company's evaluation of the specific characteristics of the leases. Factors considered in the fair value analysis include an estimate of carrying costs and foregone rental income during hypothetical expected lease-up periods, considering current market conditions, and costs to execute similar leases. The Company also considers information about each property obtained during its pre-acquisition due diligence, marketing and leasing activities in estimating the relative fair value of the tangible and intangible assets acquired.
Depreciation is computed on a straight-line basis over the estimated useful lives of the assets. The Company uses a 20-40 year estimated life for buildings and improvements and a 5-12 year estimated life for furniture, fixtures and equipment.
Expenditures for ordinary maintenance and repairs are expensed to operations as incurred. Renovations and improvements that improve and/or extend the useful life of the asset are capitalized and depreciated over their estimated useful life, generally five to ten years. Property sales or dispositions are recorded when title transfers and sufficient consideration has been received by the Company and the Company has no significant involvement with the property sold.
The Company periodically evaluates its long-lived assets, including its real estate investments, for impairment indicators. The judgments regarding the existence of impairment indicators are based on factors such as operational performance, market conditions, expected holding period of each asset and legal and environmental concerns. If indicators exist, the Company compares the expected future undiscounted cash flows for the long-lived asset against the carrying amount of that asset. If the sum of the estimated undiscounted cash flows is less than the carrying amount of the asset, an impairment loss is recorded for the difference between the estimated fair value and the carrying amount of the asset. If our anticipated holding period for properties, the estimated fair value of properties or other factors change based on market conditions or otherwise, our evaluation of impairment charges may be different and such differences could be material to our consolidated financial statements. The evaluation of anticipated cash flows is subjective and is based, in part, on assumptions regarding future occupancy, rental rates and capital requirements that could differ materially from actual results. Plans to hold properties over longer periods decrease the likelihood of recording impairment losses.
During fiscal year 2012, the Company incurred a loss of approximately $428,000 due to impairment of two properties. The $128,000 impairment of the Company's Kentwood, Michigan, retail property was based on receipt of a market offer to purchase and the Company's intention to dispose of the property (a purchase agreement was signed by the Company in the fourth quarter of fiscal year 2012). A related impairment of $7,000 was recorded to write-off goodwill assigned to the Kentwood property. This property was classified as held for sale at April 30, 2012, and the related impairment charge for fiscal year 2012 is in discontinued operations. Also during fiscal year 2012, the Company recognized a $293,000 impairment loss on eight condominium units in Grand Chute, Wisconsin. The impairment of the condominiums was based on receipt of a market offer to purchase two of the units and the Company's intention to dispose of the units (a purchase agreement was signed by the Company in the fourth quarter of fiscal year 2012). The condominiums were classified as held for sale at April 30, 2012, and the related impairment charge for fiscal year 2012 is reported in discontinued operations. See Note 12 for additional information. No impairment losses were recorded in fiscal year 2011.
2012 Annual Report F-11
Table of Contents
NOTE 2 • continued
During fiscal year 2010, the Company incurred a loss of $1.7 million due to impairment of three properties. The Company recorded a charge for impairment of approximately $818,000 on a commercial retail property in Ladysmith, Wisconsin, based upon receipt of a market offer to purchase and the Company's probable intention to dispose of the property. The Company recorded a charge for impairment of approximately $152,000 on its former headquarters building in Minot, North Dakota, based upon receipt and acceptance of a market offer to purchase. These two properties were subsequently sold and the related impairment charges for fiscal year 2010 are reported in discontinued operations. See Note 12 for additional information. The Company also recorded an impairment charge of approximately $708,000 on its retail property located in Kentwood, Michigan, in fiscal year 2010. This property's tenant vacated the premises but continued to pay rent under a lease agreement that expired on October 29, 2010. Broker representations and market data for this commercial retail property provided the basis for the impairment charge. As noted above, this property was further impaired in the third quarter and classified as held for sale in the fourth quarter of fiscal 2012, and the related impairment charges for fiscal years 2012 and 2010 are reported in discontinued operations. See Note 12 for additional information.
REAL ESTATE HELD FOR SALE
Real estate held for sale is stated at the lower of its carrying amount or estimated fair value less disposal costs. The Company's determination of fair value is based on inputs management believes are consistent with those that market participants would use. Estimates are significantly impacted by estimates of sales price, selling velocity, and other factors. Due to uncertainties in the estimation process, actual results could differ from such estimates. Depreciation is not recorded on assets classified as held for sale.
U.S. GAAP requires management to make certain significant judgments as to the classification of any of our properties as held for sale on the balance sheet. The Company makes a determination as to the point in time that it is probable that a sale will be consummated. It is not unusual for real estate sales contracts to allow potential buyers a period of time to evaluate the property prior to formal acceptance of the contract. In addition, certain other matters critical to the final sale, such as financing arrangements, often remain pending even upon contract acceptance. As a result, properties under contract may not close within the expected time period, or may not close at all. Due to these uncertainties, it is not likely that the Company can meet the criteria of the current accounting principles governing the classification of properties as held for sale prior to a sale formally closing. Therefore, any properties categorized as held for sale represent only those properties that management has determined are probable to close within the requirements set forth in current accounting principles. Eight condominium units in Grand Chute, Wisconsin, and a retail property in Kentwood, Michigan, were classified as held for sale at April 30, 2012.
The Company reports, in discontinued operations, the results of operations and the related gains or losses of a property that has either been disposed of or is classified as held for sale and otherwise meets the classification of a discontinued operation.
IDENTIFIED INTANGIBLE ASSETS AND LIABILITIES AND GOODWILL
Upon acquisition of real estate, the Company records the intangible assets and liabilities acquired (for example, if the leases in place for the real estate property acquired carry rents above the market rent, the difference is classified as an intangible asset) at their estimated fair value separate and apart from goodwill. The Company amortizes identified intangible assets and liabilities that are determined to have finite lives based on the period over which the assets and liabilities are expected to affect, directly or indirectly, the future cash flows of the real estate property acquired (generally the life of the lease). In the twelve months ended April 30, 2012 and 2011, respectively, the Company added approximately $416,000 and $6.5 million of new intangible assets and $0 and $32,000 of new intangible liabilities. The weighted average lives of the intangible assets and intangible liabilities acquired in the twelve months ended April 30, 2012 and 2011 are 10.0 years and 9.5 years, respectively. Amortization of intangibles related to above or below-market leases is recorded in real estate rentals in the Consolidated Statements of Operations. Amortization of other intangibles is recorded in depreciation/amortization related to real estate investments in the Consolidated Statements of Operations. Intangible assets subject to amortization are reviewed for impairment whenever events or changes in circumstances indicate that their carrying amount may not be recoverable. An impairment loss is recognized if the carrying amount of an intangible asset is not recoverable and its carrying amount exceeds its estimated fair value.
2012 Annual Report F-12
Table of Contents
NOTE 2 • continued
The excess of the cost of an acquired business over the net of the amounts assigned to assets acquired (including identified intangible assets) and liabilities assumed is recorded as goodwill. The Company's goodwill has an indeterminate life and is not amortized, but is tested for impairment on an annual basis, or more frequently if events or changes in circumstances indicate that the asset might be impaired. Goodwill book value as of April 30, 2012 and 2011 was $1.1 million. The annual reviews of goodwill compared the fair value of the business units that have been assigned goodwill to their carrying value (investment cost less accumulated depreciation), with the results for these periods indicating no impairment. During fiscal year 2012 the impairment of a Kentwood, Michigan, retail property indicated that goodwill assigned to the property was also impaired. Accordingly, an approximately $7,000 impairment to goodwill was recognized. In fiscal year 2011 the Company disposed of four multi-family residential properties that had goodwill assigned, and as result, approximately $261,000 of goodwill was derecognized.
PROPERTY AND EQUIPMENT
Property and equipment consists of the equipment contained at IRET's headquarters in Minot, North Dakota, corporate offices in Minneapolis and St. Cloud, Minnesota, and additional property management offices in Kansas, Minnesota, Missouri, Montana, Nebraska, North Dakota and South Dakota. The balance sheet reflects these assets at cost, net of accumulated depreciation. As of April 30, 2012 and 2011, property and equipment cost was $2.9 million. Accumulated depreciation was $1.4 million and $1.2 million as of April 30, 2012 and 2011, respectively.
MORTGAGE LOANS RECEIVABLE
Mortgage loans receivable (which include contracts for deed) are stated at the outstanding principal balance, net of an allowance for uncollectibility. Interest income is accrued and reflected in the balance sheet. Non-performing loans are recognized as impaired. The Company evaluates the collectibility of both interest and principal of each of its loans, if circumstances warrant, to determine whether the loan is impaired. A loan is considered to be impaired when, based on current information and events, it is probable that the Company will be unable to collect all amounts due according to the existing contractual terms. An allowance is recorded to reduce impaired loans to their estimated fair value. Interest on impaired loans is recognized on a cash basis.
CASH AND CASH EQUIVALENTS
Cash and cash equivalents include all cash and highly liquid investments purchased with maturities of three months or less. Cash and cash equivalents consist of the Company's bank deposits and short-term investment certificates acquired subject to repurchase agreements, and the Company's deposits in a money market mutual fund.
COMPENSATING BALANCES AND OTHER INVESTMENTS; LENDER HOLDBACKS
The Company maintains compensating balances, not restricted as to withdrawal, with several financial institutions in connection with financing received from those institutions and/or to ensure future credit availability. At April 30, 2012, the Company's compensating balances consisted of the following: Dacotah Bank, Minot, North Dakota, deposit of $350,000; United Community Bank , Minot, North Dakota, deposit of $275,000; Commerce Bank, A Minnesota Banking Corporation, deposit of $250,000; First International Bank, Watford City, North Dakota, deposit of $6.1 million; Peoples State Bank of Velva, North Dakota, deposit of $225,000; Equity Bank, Minnetonka, Minnesota, deposit of $300,000; Associated Bank, Green Bay, Wisconsin, deposit of $500,000; Venture Bank, Eagan, Minnesota, deposit of $500,000, and American National Bank, Omaha, Nebraska, deposit of $400,000. The deposits at United Community Bank and Equity Bank and a portion of the deposit at Dacotah Bank are held as certificates of deposit and comprise the $634,000 in other investments on the Consolidated Balance Sheets. The certificates of deposit have remaining terms of less than two years and the Company intends to hold them to maturity.
The Company has a number of mortgage loans under which the lender retains a portion of the loan proceeds for the payment of construction costs or tenant improvements, and additionally has two construction loans (for the Company's Trinity build-to-suit project and Jamestown Theater expansion project) under which the lender held back a portion of the loan proceeds for release against specified construction milestones. The decrease of $5.7 million in lender holdbacks for improvements reflected in the Consolidated Statements of Cash Flows for the fiscal year ended
2012 Annual Report F-13
Table of Contents
NOTE 2 • continued
April 30, 2012 is due primarily to the release of loan proceeds to the Company upon completion of these construction milestones and tenant improvement projects, while the increase of $1.7 million represents additional amounts retained by lenders.
ALLOWANCE FOR DOUBTFUL ACCOUNTS
Management evaluates the appropriate amount of the allowance for doubtful accounts by assessing the recoverability of individual real estate mortgage loans and rent receivables, through a comparison of their carrying amount with their estimated realizable value. Management considers tenant financial condition, credit history and current economic conditions in establishing these allowances. Receivable balances are written off when deemed uncollectible. Recoveries of receivables previously written off, if any, are recorded when received. A summary of the changes in the allowance for doubtful accounts for fiscal years ended April 30, 2012, 2011 and 2010 is as follows:
(in thousands) | ||||||||||||
| 2012 | 2011 | 2010 | |||||||||
Balance at beginning of year | $ | 1,316 | $ | 1,172 | $ | 1,131 | ||||||
Provision | 298 | 733 | 1,399 | |||||||||
Write-off | (251 | ) | (589 | ) | (1,358 | ) | ||||||
Balance at close of year | $ | 1,363 | $ | 1,316 | $ | 1,172 | ||||||
TAX, INSURANCE, AND OTHER ESCROW
Tax, insurance, and other escrow includes funds deposited with a lender for payment of real estate tax and insurance, and reserves for funds to be used for replacement of structural elements and mechanical equipment of certain projects. The funds are under the control of the lender. Disbursements are made after supplying written documentation to the lender.
REAL ESTATE DEPOSITS
Real estate deposits include funds held by escrow agents to be applied toward the purchase of real estate or the payment of loan costs associated with loan placement or refinancing.
DEFERRED LEASING AND LOAN ACQUISITION COSTS
Costs and commissions incurred in obtaining tenant leases are amortized on the straight-line method over the terms of the related leases. Costs incurred in obtaining long-term financing are amortized to interest expense over the life of the loan using the straight-line method, which approximates the effective interest method.
INCOME TAXES
IRET operates in a manner intended to enable it to continue to qualify as a REIT under Sections 856-860 of the Internal Revenue Code of 1986, as amended. Under those sections, a REIT which distributes at least 90% of its REIT taxable income as a dividend to its shareholders each year and which meets certain other conditions will not be taxed on that portion of its taxable income which is distributed to shareholders. For the fiscal years ended April 30, 2012, 2011 and 2010, the Company distributed in excess of 90% of its taxable income and realized capital gains from property dispositions within the prescribed time limits; accordingly, no provision has been made for federal income taxes in the accompanying consolidated financial statements. If the Company fails to qualify as a REIT in any taxable year, the Company will be subject to federal income tax on its taxable income at regular corporate rates (including any alternative minimum tax) and may not be able to qualify as a REIT for the four subsequent taxable years. Even as a REIT, the Company may be subject to certain state and local income and property taxes, and to federal income and excise taxes on undistributed taxable income. In general, however, if the Company qualifies as a REIT, no provisions for federal income taxes are necessary except for taxes on undistributed REIT taxable income and taxes on the income generated by a taxable REIT subsidiary (TRS). The Company currently has no TRS.
2012 Annual Report F-14
Table of Contents
NOTE 2 • continued
IRET conducts its business activity as an Umbrella Partnership Real Estate Investment Trust ("UPREIT") through its Operating Partnership. UPREIT status allows IRET to accept the contribution of real estate in exchange for Units. Generally, such a contribution to a limited partnership allows for the deferral of gain by an owner of appreciated real estate.
Distributions for the calendar year ended December 31, 2011 were characterized, for federal income tax purposes, as 18.04% ordinary income, 37.48% capital gain and 44.48% return of capital. Distributions for the calendar year ended December 31, 2010 were characterized, for federal income tax purposes, as 28.53% ordinary income and 71.47% return of capital.
REVENUE RECOGNITION
Residential rental properties are leased under operating leases with terms generally of one year or less. Commercial properties are leased under operating leases to tenants for various terms generally exceeding one year. Lease terms often include renewal options. Rental revenue is recognized on the straight-line basis, which averages minimum required rents over the terms of the leases. Rents recognized in advance of collection are reflected as receivable arising from straight-lining of rents, net of allowance for doubtful accounts. Rent concessions, including free rent, are amortized on a straight-line basis over the terms of the related leases.
Reimbursements from tenants for real estate taxes and other recoverable operating expenses are recognized as revenue in the period the applicable expenditures are incurred. IRET receives payments for these reimbursements from substantially all of its tenants at multi-tenant commercial properties throughout the year.
A number of the commercial leases provide for a base rent plus a percentage rent based on gross sales in excess of a stipulated amount. These percentage rents are recorded once the required sales level is achieved.
Interest on mortgage loans receivable is recognized in income as it accrues during the period the loan is outstanding. In the case of non-performing loans, income is recognized as discussed above in the Mortgage Loans Receivable section of this Note 2.
NET INCOME PER SHARE
Basic net income per share is computed as net income available to common shareholders divided by the weighted average number of common shares outstanding for the period. The Company has no potentially dilutive financial interests; the potential exchange of Units for common shares will have no effect on net income per share because Unitholders and common shareholders effectively share equally in the net income of the Operating Partnership.
INVOLUNTARY CONVERSION OF ASSETS
As previously reported, Minot, North Dakota, where IRET's corporate headquarters is located, experienced significant flooding in June 2011, resulting in extensive damage to the Arrowhead Shopping Center and to the Chateau Apartments property, which consists of two 32-unit buildings. Additionally, on February 22, 2012, one of the buildings of the Chateau Apartments property, which had been undergoing restoration work following the flood, was completely destroyed by fire. The Company expects to rebuild the destroyed building but has no firm estimates at this time for costs or expected completion date of such rebuilding. The property is insured and the Company expects the losses to be covered under its insurance policy, subject to a deductible of $200,000 for each event. The Company expensed $400,000 in fiscal year 2012 for the flood and fire deductibles. The remaining 32 units in Chateau Apartments were available for leasing in the first quarter of fiscal year 2013. Arrowhead Shopping Center is currently in various stages of re-leasing. Costs related to clean-up, redevelopment and loss of rents for Arrowhead Shopping Center and Chateau Apartments from the June 2011 flood are being reimbursed to the Company by its insurance carrier, less the Company's deductible of $200,000 under the policy. As of April 30, 2012, for the Arrowhead and Chateau flood loss the Company had received or confirmed pending receipt of $5.7 million of insurance proceeds for flood clean-up costs and redevelopment and approximately $666,000 reimbursement for business interruption (loss of rents). Reimbursement for business interruption is included within real estate rentals in the Consolidated Statements of Operations.
2012 Annual Report F-15
Table of Contents
NOTE 2 • continued
In regard to Arrowhead Shopping Center, the total insurance proceeds for redevelopment at April 30, 2012 exceeded the estimated basis in the assets requiring replacement, resulting in the recognition of approximately $274,000 in gain from involuntary conversion in fiscal year 2012. IRET expects final settlement of the Arrowhead insurance claim to occur in the second quarter of fiscal year 2013. The Company is currently unable to estimate whether and to what extent there may be a gain or loss on involuntary conversion due to the Chateau Apartments fire.
NOTE 3 • CREDIT RISK
The Company is potentially exposed to credit risk for cash deposited with FDIC-insured financial institutions in accounts which, at times, may exceed federally insured limits. The Company has not experienced any losses in such accounts.
IRET has entered into a cash management arrangement with First Western Bank (the "Bank") with respect to deposit accounts that exceed FDIC Insurance coverage. On a daily basis, account balances are swept into a repurchase account. The Bank pledges fractional interests in US Government Securities owned by the Bank at an amount equal to the excess over the uncollected balance in the repurchase account. The amounts deposited by IRET pursuant to the repurchase agreement are not insured by FDIC. At April 30, 2012 and 2011, these amounts totaled $15.1 million and $23.5 million, respectively.
NOTE 4 • PROPERTY OWNED
Property, consisting principally of real estate, is stated at cost less accumulated depreciation and totaled $1.5 billion and $1.4 billion as of April 30, 2012, and 2011, respectively.
Construction period interest of approximately $571,000, $152,000, and $19,000 has been capitalized for the years ended April 30, 2012, 2011, and 2010, respectively.
The future minimum lease receipts to be received under non-cancellable leases for commercial properties as of April 30, 2012, assuming that no options to renew or buy out the lease are exercised, are as follows:
Year Ended April 30, | (in thousands) | |||
2013 | $ | 112,174 | ||
2014 | 102,100 | |||
2015 | 90,119 | |||
2016 | 79,637 | |||
2017 | 65,030 | |||
Thereafter | 206,791 | |||
| $ | 655,851 | |||
See Real Estate Investments within Note 2 for information about impairment losses recorded during fiscal years 2012 and 2011.
NOTE 5 • IDENTIFIED INTANGIBLE ASSETS AND LIABILITIES
The Company's identified intangible assets and intangible liabilities at April 30, 2012 and 2011 were as follows:
(in thousands) | ||||||||
| April 30, 2012 | April 30, 2011 | ||||||
Identified intangible assets (included in intangible assets): | ||||||||
Gross carrying amount | $ | 92,401 | $ | 91,986 | ||||
Accumulated amortization | (47,813 | ) | (42,154 | ) | ||||
Net carrying amount | $ | 44,588 | $ | 49,832 | ||||
Indentified intangible liabilities (included in other liabilities): | ||||||||
Gross carrying amount | $ | 1,104 | $ | 1,104 | ||||
Accumulated amortization | (967 | ) | (900 | ) | ||||
Net carrying amount | $ | 137 | $ | 204 | ||||
2012 Annual Report F-16
Table of Contents
NOTE 5 • continued
The effect of amortization of acquired below-market leases and acquired above-market leases on rental income was approximately $(45,000) and $(72,000) for the twelve months ended April 30, 2012 and 2011, respectively. The estimated annual amortization of acquired below-market leases, net of acquired above-market leases for each of the five succeeding fiscal years is as follows:
Year Ended April 30, | (in thousands) | |||
2013 | $ | 32 | ||
2014 | 35 | |||
2015 | 18 | |||
2016 | 14 | |||
2017 | 6 | |||
Amortization of all other identified intangible assets (a component of depreciation/amortization related to real estate investments) was $5.5 million and $7.1 million for the twelve months ended April 30, 2012 and 2011, respectively. The estimated annual amortization of all other identified intangible assets for each of the five succeeding fiscal years is as follows:
Year Ended April 30, | (in thousands) | |||
2013 | $ | 4,588 | ||
2014 | 4,182 | |||
2015 | 3,825 | |||
2016 | 3,608 | |||
2017 | 3,139 | |||
NOTE 6 • NONCONTROLLING INTERESTS
Interests in the Operating Partnership held by limited partners are represented by Units. The Operating Partnership's income is allocated to holders of Units based upon the ratio of their holdings to the total Units outstanding during the period. Capital contributions, distributions, and profits and losses are allocated to noncontrolling interests in accordance with the terms of the Operating Partnership agreement.
IRET reflects noncontrolling interests in consolidated real estate entities on the balance sheet for the portion of properties consolidated by IRET that are not wholly owned by IRET. The earnings or losses from these properties attributable to the noncontrolling interests are reflected as net income attributable to noncontrolling interests – consolidated real estate entities in the Consolidated Statements of Operations. The Company's noncontrolling interests – consolidated real estate entities at April 30, 2012 and 2011 were as follows:
(in thousands) | ||||||||
| April 30, 2012 | April 30, 2011 | ||||||
Mendota Properties LLC | $ | 7,460 | $ | 7,964 | ||||
IRET-1715 YDR, LLC | 958 | 1,009 | ||||||
IRET-Williston Garden Apartments, LLC | 2,295 | 0 | ||||||
IRET - Jamestown Medical Building, LLC | 1,471 | 0 | ||||||
WRH Holding, LLC | 1,380 | 0 | ||||||
Noncontrolling interests – consolidated real estate entities | $ | 13,564 | $ | 8,973 | ||||
2012 Annual Report F-17
Table of Contents
NOTE 7 • LINE OF CREDIT
As of April 30, 2012, the Company had one secured line of credit with First International Bank and Trust, Watford City, North Dakota, as lead bank. This line of credit matures on August 12, 2013, and had, as of April 30, 2012, lending commitments of $60.0 million. Participants in this secured credit facility as of April 30, 2012 included, in addition to First International Bank, the following financial institutions: The Bank of North Dakota; First Western Bank and Trust; Dacotah Bank; United Community Bank of North Dakota; American State Bank & Trust Company and Town & Country Credit Union. As of April 30, 2012, the Company had advanced $39.0 million under the line of credit. The line of credit has a minimum outstanding principal balance requirement of $10.0 million. The interest rate on borrowings under the facility during fiscal year 2012 was the Wall Street Journal Prime Rate +1.0%, with a floor of 5.65% and a cap of 8.65%; interest-only payments are due monthly based on the total amount of advances outstanding. The line of credit may be prepaid at par at any time. The facility includes covenants and restrictions requiring the Company to achieve on a calendar quarter basis a debt service coverage ratio on borrowing base collateral of 1.25x in the aggregate and 1.00x on individual assets in the collateral pool, and the Company is also required to maintain minimum depository account(s) totaling $6.0 million with First International, of which $1.5 million is to be held in a non-interest bearing account. As of April 30, 2012, 23 properties with a total cost of $114.6 million collateralized this line of credit. As of April 30, 2012, the Company believes it is in compliance with the facility covenants. Subsequent to the end of fiscal year 2012, effective June 15, 2012, IRET Properties agreed to an amendment to the line of credit to increase the interest rate spread on borrowings to the Wall Street Journal Prime Rate +1.25% and to lower the floor interest rate to 5.15%. All other terms of the line of credit remain unchanged. This credit facility is summarized in the following table:
(in thousands) | |||||||||||||||||||||
Financial Institution | Amount Available | Amount Outstanding as of April 30, 2012 | Amount Outstanding as of April 30, 2011 | Applicable Interest Rate as of April 30, 2012 | Maturity Date | Weighted Average Int. Rate on Borrowings during fiscal year 2012 | |||||||||||||||
First International Bank & Trust | $ | 60,000 | $ | 39,000 | $ | 30,000 | 5.65 | % | 8/12/13 | 5.65 | % | ||||||||||
NOTE 8 • MORTGAGES PAYABLE
The Company's mortgages payable are collateralized by substantially all of its properties owned. The majority of the Company's mortgages payable are secured by individual properties or groups of properties, and are non-recourse to the Company, other than for standard carve-out obligations such as fraud, waste, failure to insure, environmental conditions and failure to pay real estate taxes. As of April 30, 2012, the management of the Company believes there are no defaults or material compliance issues in regard to any mortgages payable. Interest rates on mortgages payable range from 3.32% to 8.25%, and the mortgages have varying maturity dates from May 1, 2012, through July 1, 2036.
Of the mortgages payable, the balance of fixed rate mortgages totaled $1.0 billion at April 30, 2012 and $992.3 million at April 30, 2011, and the balances of variable rate mortgages totaled $16.2 million and $1.5 million as of April 30, 2012, and 2011, respectively. The Company does not utilize derivative financial instruments to mitigate its exposure to changes in market interest rates. Most of the fixed rate mortgages have substantial pre-payment penalties. As of April 30, 2012, the weighted-average rate of interest on the Company's mortgage debt was 5.78%, compared to 5.92% on April 30, 2011. The aggregate amount of required future principal payments on mortgages payable as of April 30, 2012, is as follows:
Year Ended April 30, | (in thousands) | |||
2013 | $ | 51,162 | ||
2014 | 74,572 | |||
2015 | 106,483 | |||
2016 | 86,464 | |||
2017 | 199,089 | |||
Thereafter | 530,919 | |||
Total payments | $ | 1,048,689 | ||
2012 Annual Report F-18
Table of Contents
NOTE 9 • TRANSACTIONS WITH RELATED PARTIES
BANKING SERVICES
The Company has an ongoing banking relationship with First International Bank and Trust, Watford City, North Dakota ("First International"). Stephen L. Stenehjem, a member of the Company's Board of Trustees, is the President and Chief Executive Officer of First International, and the bank is owned by Mr. Stenehjem and members of his family. During fiscal year 2012, the Company had two mortgage loans outstanding with First International, with original principal balances of $3.2 million (Grand Forks MedPark Mall) and $2.4 million (Georgetown Square/Fox River), respectively, bearing interest at 6.25% and 7.25% per annum. Subsequent to the end of fiscal year 2012, on May 1, 2012, the mortgage loan on Georgetown Square/Fox River was repaid. During fiscal year 2012, the Company entered into a construction loan with First International for $13.7 million to finance the development of a residential property in Williston, North Dakota. The balance drawn on the construction loan at April 30, 2012 was $6.3 million. The Company paid interest on these loans of approximately $195,000, $162,000 and $65,000, respectively, in fiscal year 2012, and paid $102,000 in origination fees and closing costs on the construction loan. The Company has a multi-bank line of credit with a capacity of $60.0 million, of which First International is the lead bank and a participant with a $12.0 million commitment. In fiscal year 2012, the Company paid First International a total of approximately $531,000 in interest on First International's portion of the outstanding balance of this credit line, and paid fees of $70,000. In connection with this multi-bank line of credit, the Company maintains compensating balances with First International totaling $6.0 million, of which $1.5 million is held in a non-interest bearing account, and $4.5 million is held in an account that pays the Company interest on the deposited amount of 0.25% per annum. The Company also maintains a number of checking accounts with First International. In fiscal year 2012, the Company paid less than $500 in total in various bank service and other fees charged on these checking accounts.
In fiscal year 2011, the Company paid First International $212,000 in interest on First International's portion of the multi-bank line of credit and paid fees of $219,000. In fiscal years 2011 and 2010, the Company paid interest of approximately $72,000 and $238,000, respectively, for borrowing under a $14.0 million line of credit that was subsequently terminated in fiscal year 2011, and paid a $10,000 renewal fee for the line of credit in fiscal year 2010. In fiscal year 2011, the Company paid interest and fees on outstanding mortgage loans totaling approximately $390,000, and paid interest in fiscal year 2010 on mortgage loans outstanding of approximately $789,000. In both fiscal years 2011 and 2010, the Company paid under $500 in total in various bank service and other fees charged on checking accounts maintained with First International.
Total payments of interest and fees from the Company to First International Bank were approximately $1.1 million, $893,000 and $1.0 million in fiscal years 2012, 2011 and 2010, respectively.
PROPERTY TRANSACTION
During fiscal year 2012, the Company acquired an apartment property in St. Cloud, Minnesota, for a purchase price of $7.9 million. A limited partnership of which Stephen Stenehjem is the general partner was one of six investors in this property prior to its acquisition by the Company, and the Company's purchase of the property resulted in the issuance to this limited partnership of UPREIT units of the Operating Partnership valued at issuance at approximately $1.0 million.
NOTE 10 • ACQUISITIONS AND DISPOSITIONS
PROPERTY ACQUISITIONS
IRET Properties paid approximately $97.1 million for real estate properties added to its portfolio during fiscal year 2012, compared to $45.6 million in fiscal year 2011. The $97.1 million paid for real estate properties added to the Company's portfolio in fiscal year 2012 consisted of limited partnership units of the Operating Partnership valued at issuance at $8.1 million and $7.2 million in assumed mortgage debt, with the remainder paid in cash. The Company expensed approximately $542,000 of transaction costs related to the acquisitions in fiscal year 2012. Of the $45.6 million paid in fiscal year 2011, approximately $5.0 million was paid in the form of limited partnership units of the Operating Partnership and approximately $9.9 million consisted of the assumption of mortgage debt, with the remainder paid in cash. The Company expensed approximately $179,000 of transaction costs related to the acquisitions in fiscal year 2011. The fiscal year 2012 and 2011 additions are detailed below.
2012 Annual Report F-19
Table of Contents
NOTE 10 • continued
Fiscal 2012 ( May 1, 2011 to April 30, 2012 )
(in thousands) | |||||||||||||||||
Acquisitions and Development Projects Placed in Service | Date Acquired | Land | Building | Intangible Assets | Acquisition Cost | ||||||||||||
Multi-Family Residential | |||||||||||||||||
147 unit - Regency Park Estates - St. Cloud, MN | 8/1/11 | $ | 702 | $ | 10,198 | $ | 0 | $ | 10,900 | ||||||||
50 unit - Cottage West Twin Homes - Sioux Falls, SD | 10/12/11 | 968 | 3,762 | 0 | 4,730 | ||||||||||||
24 unit - Gables Townhomes - Sioux Falls, SD | 10/12/11 | 349 | 1,921 | 0 | 2,270 | ||||||||||||
36 unit - Evergreen II - Isanti, MN | 11/1/11 | 691 | 2,784 | 0 | 3,475 | ||||||||||||
116 unit - Grand Gateway - St. Cloud MN | 2/16/12 | 814 | 7,086 | 0 | 7,900 | ||||||||||||
84 unit - Ashland - Grand Forks, ND | 3/16/12 | 741 | 7,569 | 0 | 8,310 | ||||||||||||
72 unit - Williston Garden Buildings 1 and 2 - Williston, ND (1) | 4/27/12 | 700 | 8,978 | 0 | 9,678 | ||||||||||||
| 4,965 | 42,298 | 0 | 47,263 | ||||||||||||||
Commercial Medical | |||||||||||||||||
17,273 sq. ft Spring Creek American Falls - American Falls, ID | 9/1/11 | 145 | 3,870 | 55 | 4,070 | ||||||||||||
15,571 sq. ft Spring Creek Soda Springs - Soda Springs, ID | 9/1/11 | 66 | 2,134 | 30 | 2,230 | ||||||||||||
15,559 sq. ft Spring Creek Eagle - Eagle, ID | 9/1/11 | 263 | 3,775 | 62 | 4,100 | ||||||||||||
31,820 sq. ft Spring Creek Meridian - Meridian, ID | 9/1/11 | 424 | 6,724 | 102 | 7,250 | ||||||||||||
26,605 sq. ft Spring Creek Overland - Boise, ID | 9/1/11 | 687 | 5,941 | 97 | 6,725 | ||||||||||||
16,311 sq. ft Spring Creek Boise - Boise, ID | 9/1/11 | 708 | 4,296 | 71 | 5,075 | ||||||||||||
26,605 sq. ft Spring Creek Ustick - Meridian, ID | 9/1/11 | 467 | 3,833 | 0 | 4,300 | ||||||||||||
Meadow Wind Land - Casper, WY | 9/1/11 | 50 | 0 | 0 | 50 | ||||||||||||
24,795 sq. ft Trinity at Plaza 16 - Minot, ND (2) | 9/23/11 | 0 | 5,685 | 0 | 5,685 | ||||||||||||
3,431 sq. ft Edina 6525 Drew Ave S - Edina, MN | 10/13/11 | 388 | 117 | 0 | 505 | ||||||||||||
22,193 sq. ft Meadow Winds Addition - Casper, WY (3) | 12/30/11 | 0 | 3,952 | 0 | 3,952 | ||||||||||||
| 3,198 | 40,327 | 417 | 43,942 | ||||||||||||||
Commercial Retail | |||||||||||||||||
19,037 sq. ft. Jamestown Buffalo Mall - Jamestown, ND (4) | 6/15/11 | 0 | 879 | 0 | 879 | ||||||||||||
Unimproved Land | |||||||||||||||||
Industrial-Office Build-to-Suit - Minot, ND | 9/7/11 | 416 | 0 | 0 | 416 | ||||||||||||
Renaissance Heights - Williston, ND | 4/11/12 | 4,600 | 0 | 0 | 4,600 | ||||||||||||
| 5,016 | 0 | 0 | 5,016 | ||||||||||||||
Total Property Acquisitions | $ | 13,179 | $ | 83,504 | $ | 417 | $ | 97,100 | |||||||||
(1) | Development property placed in service April 27, 2012. Buildings 3 and 4 of this project are expected to be placed in service during the first quarter of fiscal year 2013. |
(2) | Development property placed in service September 23, 2011. Additional costs paid in fiscal year 2011 totaled $3.3 million, for a total project cost at April 30, 2012 of $9.0 million. |
(3) | Expansion project placed in service December 30, 2011. |
(4) | Construction project placed in service June 15, 2011. Additional costs paid in fiscal year 2011 totaled $1.4 million, for a total project cost at April 30, 2012 of $2.3 million. |
2012 Annual Report F-20
Table of Contents
NOTE 10 • continued
Fiscal 2011 ( May 1, 2010 to April 30, 2011 )
(in thousands) | |||||||||||||||||
Acquisitions and Development Projects Placed in Service | Date Acquired | Land | Building | Intangible Assets | Acquisition Cost | ||||||||||||
Multi-Family Residential | |||||||||||||||||
24 unit - North Pointe 2 - Bismarck, ND | 2/3/11 | $ | 159 | $ | 1,713 | $ | 0 | $ | 1,872 | ||||||||
44 unit - Sierra Vista - Sioux Falls, SD | 2/28/11 | 241 | 2,097 | 0 | 2,338 | ||||||||||||
| 400 | 3,810 | 0 | 4,210 | ||||||||||||||
Commercial Office | |||||||||||||||||
58,574 sq. ft. Omaha 10802 Farnam Dr - Omaha, NE | 12/16/10 | 2,462 | 4,374 | 1,459 | 8,295 | ||||||||||||
Commercial Medical | |||||||||||||||||
14,705 sq. ft. Billings 2300 Grant Road - Billings, MT | 7/15/10 | 649 | 1,216 | 657 | 2,522 | ||||||||||||
14,640 sq. ft. Missoula 3050 Great Northern - Missoula, MT | 7/15/10 | 640 | 1,331 | 752 | 2,723 | ||||||||||||
108,503 sq. ft. Edgewood Vista Minot - Minot, ND | 11/10/10 | 1,046 | 11,590 | 2,545 | 15,181 | ||||||||||||
23,965 sq. ft. Edgewood Vista Spearfish Expansion - Spearfish, SD 1 | 1/10/11 | 0 | 2,777 | 0 | 2,777 | ||||||||||||
| 2,335 | 16,914 | 3,954 | 23,203 | ||||||||||||||
Commercial Industrial | |||||||||||||||||
42,244 sq. ft. Fargo 1320 45th St N - Fargo, ND 2 | 6/22/10 | 0 | 1,634 | 0 | 1,634 | ||||||||||||
Commercial Retail | |||||||||||||||||
47,709 sq. ft. Minot 1400 31st Ave - Minot, ND | 12/10/10 | 1,026 | 6,143 | 1,081 | 8,250 | ||||||||||||
Total Property Acquisitions | $ | 6,223 | $ | 32,875 | $ | 6,494 | $ | 45,592 | |||||||||
(1) | Expansion project placed in service January 10, 2011. |
(2) | Development property placed in service June 22, 2010. Additional costs incurred in fiscal year 2010 totaled $2.3 million, for a total project cost at April 30, 2011 of $3.9 million. |
Acquisitions in fiscal years 2012 and 2011 are immaterial to our real estate portfolio both individually and in the aggregate, and consequently no proforma information is presented. The results of operations from acquired properties are included in the Consolidated Statements of Operations as of their acquisition date. The revenue and net income of our fiscal year 2012 and 2011 acquisitions (excluding development projects placed in service) are detailed below.
(in thousands) | ||||||||
| April 30, 2012 | April 30, 2011 | ||||||
Total revenue | $ | 4,213 | $ | 1,988 | ||||
Net income | $ | 950 | $ | 332 | ||||
2012 Annual Report F-21
Table of Contents
NOTE 10 • continued
PROPERTY DISPOSITIONS
During fiscal year 2012, the Company disposed of two properties for an aggregate sale price of $3.2 million, compared to six properties and one patio home for an aggregate sale price of $83.3 million during fiscal year 2011. The Company's dispositions during fiscal 2012 and 2011 are detailed below.
Fiscal 2012 ( May 1, 2011 to April 30, 2012 )
(in thousands) | ||||||||||||
Dispositions | Sales Price | Book Value and Sales Cost | Gain/(Loss) | |||||||||
Commercial Retail | ||||||||||||
41,200 sq ft. Livingstone Pamida - Livingston, MT | $ | 2,175 | $ | 1,586 | $ | 589 | ||||||
12,556 sq ft. East Grand Station – East Grand Forks, MN | $ | 1,062 | $ | 1,302 | $ | (240 | ) | |||||
Total Property Dispositions | $ | 3,237 | $ | 2,888 | $ | 349 | ||||||
Fiscal 2011 ( May 1, 2010 to April 30, 2011 )
(in thousands) | ||||||||||||
Dispositions | Sales Price | Book Value and Sales Cost | Gain/(Loss) | |||||||||
Multi-Family Residential | ||||||||||||
504 unit - Dakota Hill at Valley Ranch - Irving, TX | $ | 36,100 | $ | 30,909 | $ | 5,191 | ||||||
192 unit - Neighborhood Apartments - Colorado Springs, CO | 11,200 | 9,664 | 1,536 | |||||||||
195 unit - Pinecone Apartments - Fort Collins, CO | 15,875 | 10,422 | 5,453 | |||||||||
210 unit - Miramont Apartments - Fort Collins, CO | 17,200 | 10,732 | 6,468 | |||||||||
| 80,375 | 61,727 | 18,648 | ||||||||||
Commercial Medical | ||||||||||||
1,410 sq. ft. Edgewood Vista Patio Home 4330 - Fargo, ND | 205 | 220 | (15 | ) | ||||||||
Commercial Industrial | ||||||||||||
29,440 sq. ft. Waconia Industrial Building - Waconia, MN | 2,300 | 1,561 | 739 | |||||||||
Commercial Retail | ||||||||||||
41,000 sq. ft. Ladysmith Pamida - Ladysmith, WI | 450 | 457 | (7 | ) | ||||||||
Total Property Dispositions | $ | 83,330 | $ | 63,965 | $ | 19,365 | ||||||
2012 Annual Report F-22
Table of Contents
NOTE 11 • OPERATING SEGMENTS
IRET reports its results in five reportable segments: multi-family residential, commercial office, commercial medical (including senior housing), commercial industrial and commercial retail properties. The Company's reportable segments are aggregations of similar properties.
Segment information in this report is presented based on net operating income, which we define as total real estate revenues and gain on involuntary conversion less real estate expenses and real estate taxes (excluding depreciation and amortization related to real estate investments and real estate impairment). The following tables present real estate revenues and net operating income for the fiscal years ended April 30, 2012, 2011 and 2010 from our five reportable segments, and reconcile net operating income of reportable segments to net income as reported in the consolidated financial statements. Segment assets are also reconciled to Total Assets as reported in the consolidated financial statements.
(in thousands) | ||||||||||||||||||||||||
Year Ended April 30, 2012 | Multi-Family Residential | Commercial Office | Commercial Medical | Commercial Industrial | Commercial Retail | Total | ||||||||||||||||||
Real estate revenue | $ | 74,190 | $ | 74,334 | $ | 65,531 | $ | 14,325 | $ | 13,408 | $ | 241,788 | ||||||||||||
Real estate expenses | 34,790 | 34,816 | 20,655 | 3,549 | 4,468 | 98,278 | ||||||||||||||||||
Gain on involuntary conversion | 274 | 274 | ||||||||||||||||||||||
Net operating income | $ | 39,400 | $ | 39,518 | $ | 44,876 | $ | 10,776 | $ | 9,214 | 143,784 | |||||||||||||
Depreciation/amortization | (60,264 | ) | ||||||||||||||||||||||
Administrative, advisory and trustee fees | (7,381 | ) | ||||||||||||||||||||||
Other expenses | (1,898 | ) | ||||||||||||||||||||||
Interest expense | (65,113 | ) | ||||||||||||||||||||||
Interest and other income | 786 | |||||||||||||||||||||||
Income from continuing operations | 9,914 | |||||||||||||||||||||||
Loss from discontinued operations | (208 | ) | ||||||||||||||||||||||
Net income | $ | 9,706 | ||||||||||||||||||||||
(in thousands) | ||||||||||||||||||||||||
Year Ended April 30, 2011 | Multi-Family Residential | Commercial- Office | Commercial- Medical | Commercial- Industrial | Commercial- Retail | Total | ||||||||||||||||||
Real estate revenue | $ | 66,838 | $ | 77,747 | $ | 66,048 | $ | 13,165 | $ | 13,156 | $ | 236,954 | ||||||||||||
Real estate expenses | 34,129 | 36,055 | 22,451 | 4,328 | 4,839 | 101,802 | ||||||||||||||||||
Net operating income | $ | 32,709 | $ | 41,692 | $ | 43,597 | $ | 8,837 | $ | 8,317 | 135,152 | |||||||||||||
Depreciation/amortization | (58,385 | ) | ||||||||||||||||||||||
Administrative, advisory and trustee services | (7,222 | ) | ||||||||||||||||||||||
Other expenses | (1,747 | ) | ||||||||||||||||||||||
Interest expense | (63,820 | ) | ||||||||||||||||||||||
Interest and other income | 541 | |||||||||||||||||||||||
Income from continuing operations | 4,519 | |||||||||||||||||||||||
Income from discontinued operations | 19,832 | |||||||||||||||||||||||
Net income | $ | 24,351 | ||||||||||||||||||||||
2012 Annual Report F-23
Table of Contents
NOTE 11 • continued
(in thousands) | ||||||||||||||||||||||||
Year Ended April 30, 2010 | Multi-Family Residential | Commercial- Office | Commercial- Medical | Commercial- Industrial | Commercial- Retail | Total | ||||||||||||||||||
Real estate revenue | $ | 65,478 | $ | 82,079 | $ | 57,439 | $ | 13,095 | $ | 12,852 | $ | 230,943 | ||||||||||||
Real estate expenses | 32,615 | 36,833 | 17,829 | 4,121 | 4,744 | 96,142 | ||||||||||||||||||
Gain on involuntary conversion | 1,660 | 0 | 0 | 0 | 0 | 1,660 | ||||||||||||||||||
Net operating income | $ | 34,523 | $ | 45,246 | $ | 39,610 | $ | 8,974 | $ | 8,108 | 136,461 | |||||||||||||
Depreciation/amortization | (57,088 | ) | ||||||||||||||||||||||
Administrative, advisory and trustee services | (6,218 | ) | ||||||||||||||||||||||
Other expenses | (2,513 | ) | ||||||||||||||||||||||
Interest expense | (65,442 | ) | ||||||||||||||||||||||
Interest and other income | 894 | |||||||||||||||||||||||
Income from continuing operations | 6,094 | |||||||||||||||||||||||
Loss from discontinued operations | (1,509 | ) | ||||||||||||||||||||||
Net income | $ | 4,585 | ||||||||||||||||||||||
Segment Assets and Accumulated Depreciation
(in thousands) | ||||||||||||||||||||||||
As of April 30, 2012 | Multi-Family Residential | Commercial Office | Commercial Medical | Commercial Industrial | Commercial Retail | Total | ||||||||||||||||||
Segment assets | ||||||||||||||||||||||||
Property owned | $ | 539,783 | $ | 605,318 | $ | 500,268 | $ | 119,002 | $ | 127,638 | $ | 1,892,009 | ||||||||||||
Less accumulated depreciation | (128,834 | ) | (121,422 | ) | (78,744 | ) | (20,693 | ) | (23,797 | ) | (373,490 | ) | ||||||||||||
Total property owned | $ | 410,949 | $ | 483,896 | $ | 421,524 | $ | 98,309 | $ | 103,841 | $ | 1,518,519 | ||||||||||||
Real estate held for sale | 2,067 | |||||||||||||||||||||||
Cash and cash equivalents | 39,989 | |||||||||||||||||||||||
Other investments | 634 | |||||||||||||||||||||||
Receivables and other assets | 114,569 | |||||||||||||||||||||||
Development in progress | 27,599 | |||||||||||||||||||||||
Unimproved land | 10,990 | |||||||||||||||||||||||
Total Assets | $ | 1,714,367 | ||||||||||||||||||||||
(in thousands) | ||||||||||||||||||||||||
As of April 30, 2011 | Multi-Family Residential | Commercial Office | Commercial Medical | Commercial Industrial | Commercial Retail | Total | ||||||||||||||||||
Segment assets | ||||||||||||||||||||||||
Property owned | $ | 484,815 | $ | 595,491 | $ | 447,831 | $ | 117,602 | $ | 125,059 | $ | 1,770,798 | ||||||||||||
Less accumulated depreciation | (117,718 | ) | (104,650 | ) | (65,367 | ) | (17,713 | ) | (23,504 | ) | (328,952 | ) | ||||||||||||
Total property owned | $ | 367,097 | $ | 490,841 | $ | 382,464 | $ | 99,889 | $ | 101,555 | $ | 1,441,846 | ||||||||||||
Cash and cash equivalents | 41,191 | |||||||||||||||||||||||
Other investments | 625 | |||||||||||||||||||||||
Receivables and other assets | 115,302 | |||||||||||||||||||||||
Development in progress | 9,693 | |||||||||||||||||||||||
Unimproved land | 6,550 | |||||||||||||||||||||||
Mortgage loans receivable, net of allowance | 156 | |||||||||||||||||||||||
Total Assets | $ | 1,615,363 | ||||||||||||||||||||||
2012 Annual Report F-24
Table of Contents
NOTE 12 • DISCONTINUED OPERATIONS
The Company reports in discontinued operations the results of operations of a property that has either been disposed of or is classified as held for sale. The Company also reports any gains or losses from the sale of a property in discontinued operations. Eight condominium units in Grand Chute, Wisconsin, and a retail property in Kentwood, Michigan, were classified as held for sale at April 30, 2012. There were no properties classified as held for sale as of April 30, 2011 and 2010. The following information shows the effect on net income and the gains or losses from the sale of properties classified as discontinued operations for the fiscal years ended April 30, 2012, 2011 and 2010.
(in thousands) | ||||||||||||
2012 | 2011 | 2010 | ||||||||||
REVENUE | ||||||||||||
Real estate rentals | $ | 142 | $ | 6,278 | $ | 11,684 | ||||||
Tenant reimbursement | 62 | 112 | 148 | |||||||||
TOTAL REVENUE | 204 | 6,390 | 11,832 | |||||||||
EXPENSES | ||||||||||||
Depreciation/amortization related to real estate investments | 60 | 1,285 | 2,667 | |||||||||
Utilities | 39 | 572 | 964 | |||||||||
Maintenance | 22 | 736 | 1,251 | |||||||||
Real estate taxes | 31 | 691 | 1,389 | |||||||||
Insurance | 4 | 115 | 293 | |||||||||
Property management expenses | 9 | 864 | 1,502 | |||||||||
Other expenses | 67 | 28 | 0 | |||||||||
Amortization related to non-real estate investments | 0 | 4 | 8 | |||||||||
Real estate impairment | 428 | 0 | 1,678 | |||||||||
TOTAL EXPENSES | 660 | 4,295 | 9,752 | |||||||||
Interest expense | (117 | ) | (1,633 | ) | (3,664 | ) | ||||||
Interest income | 0 | 5 | 7 | |||||||||
Other income | 16 | 0 | 0 | |||||||||
(Loss) income from discontinued operations before gain on sale | (557 | ) | 467 | (1,577 | ) | |||||||
Gain on sale of discontinued operations | 349 | 19,365 | 68 | |||||||||
(LOSS) INCOME FROM DISCONTINUED OPERATIONS | $ | (208 | ) | $ | 19,832 | $ | (1,509 | ) | ||||
Segment Data | ||||||||||||
Multi-Family Residential | $ | 0 | $ | 19,224 | $ | 437 | ||||||
Commercial Office | 0 | 0 | (169 | ) | ||||||||
Commercial Medical | 455 | (186 | ) | (409 | ) | |||||||
Commercial Industrial | 0 | 726 | (23 | ) | ||||||||
Commercial Retail | (247 | ) | 68 | (1,345 | ) | |||||||
Total | $ | (208 | ) | $ | 19,832 | $ | (1,509 | ) | ||||
(in thousands) | ||||||||||||
| 2012 | 2011 | 2010 | |||||||||
Property Sale Data | ||||||||||||
Sales price | $ | 3,237 | $ | 83,330 | $ | 560 | ||||||
Net book value and sales costs | (2,888 | ) | (63,965 | ) | (492 | ) | ||||||
Gain on sale of discontinued operations | $ | 349 | $ | 19,365 | $ | 68 | ||||||
2012 Annual Report F-25
Table of Contents
NOTE 13 • EARNINGS PER SHARE
Basic earnings per share is computed by dividing net income available to common shareholders by the weighted average number of common shares outstanding during the period. The Company has no outstanding options, warrants, convertible stock or other contractual obligations requiring issuance of additional common shares that would result in a dilution of earnings. Units can be exchanged for shares on a one-for-one basis after a minimum holding period of one year. The following table presents a reconciliation of the numerator and denominator used to calculate basic and diluted earnings per share reported in the consolidated financial statements for the fiscal years ended April 30, 2012, 2011 and 2010:
For Years Ended April 30, | ||||||||||||
(in thousands, except per share data) | ||||||||||||
2012 | 2011 | 2010 | ||||||||||
NUMERATOR | ||||||||||||
Income from continuing operations – Investors Real Estate Trust | $ | 8,375 | $ | 4,216 | $ | 5,164 | ||||||
(Loss) income from discontinued operations – Investors Real Estate Trust | (163 | ) | 15,866 | (1,163 | ) | |||||||
Net income attributable to Investors Real Estate Trust | 8,212 | 20,082 | 4,001 | |||||||||
Dividends to preferred shareholders | (2,372 | ) | (2,372 | ) | (2,372 | ) | ||||||
Numerator for basic earnings per share – net income available to common shareholders | 5,840 | 17,710 | 1,629 | |||||||||
Noncontrolling interests – Operating Partnership | 1,359 | 4,449 | 562 | |||||||||
Numerator for diluted earnings per share | $ | 7,199 | $ | 22,159 | $ | 2,191 | ||||||
DENOMINATOR | ||||||||||||
Denominator for basic earnings per share weighted average shares | 83,557 | 78,628 | 69,093 | |||||||||
Effect of convertible operating partnership units | 19,875 | 20,154 | 20,825 | |||||||||
Denominator for diluted earnings per share | 103,432 | 98,782 | 89,918 | |||||||||
Earnings per common share from continuing operations – Investors Real Estate Trust – basic and diluted | $ | .07 | $ | .02 | $ | .04 | ||||||
Earnings (loss) per common share from discontinued operations – Investors Real Estate Trust – basic and diluted | .00 | .20 | (.01 | ) | ||||||||
NET INCOME PER COMMON SHARE – BASIC & DILUTED | $ | .07 | $ | .22 | $ | .03 | ||||||
NOTE 14 • RETIREMENT PLANS
IRET sponsors a defined contribution profit sharing retirement plan and a defined contribution 401(k) plan. IRET's defined contribution profit sharing retirement plan is available to employees over the age of 21 who have completed one year of service. Participation in IRET's defined contribution 401(k) plan is available to employees over the age of 21 who have completed one year of service and who work at least 1,000 hours per calendar year, and employees participating in the 401(k) plan may contribute up to maximum levels established by the IRS. Employer contributions to the profit sharing and 401(k) plans are at the discretion of the Company's management. IRET expects to contribute not more than 3.5% of the salary of each employee participating in the profit sharing plan, and currently matches, dollar for dollar, employee contributions to the 401(k) plan in an amount equal to up to 4.0% of the salary of each employee participating in the 401(k) plan, for a total expected contribution of not more than 7.5% of the salary of each of the employees participating in both plans. Contributions by IRET to the profit sharing plan are subject to a vesting schedule; contributions by IRET under the 401(k) plan are fully vested when made. IRET's contributions to these plans on behalf of employees totaled approximately $871,000, $598,000 and $400,000 in fiscal years 2012, 2011 and 2010, respectively. The increase in cost from fiscal year 2010 to fiscal year 2012 was due to growth in the number of employees during IRET's transition to internal property management.
2012 Annual Report F-26
Table of Contents
NOTE 15 • COMMITMENTS AND CONTINGENCIES
Ground Leases. As of April 30, 2012, the Company is a tenant under operating ground or air rights leases on twelve of its properties. The Company pays a total of approximately $500,000 per year in rent under these ground leases, which have remaining terms ranging from 3 months to 89 years, and expiration dates ranging from July 2012 to October 2100. The Company has renewal options for six of the twelve ground leases, and rights of first offer or first refusal for the remainder.
The expected timing of ground and air rights lease payments as of April 30, 2012 is as follows:
(in thousands) | ||||
Year Ended April 30, | Lease Payments | |||
2013 | $ | 499 | ||
2014 | 500 | |||
2015 | 501 | |||
2016 | 473 | |||
2017 | 445 | |||
Thereafter | 22,041 | |||
Total | $ | 24,459 | ||
Legal Proceedings . IRET is involved in various lawsuits arising in the normal course of business. Management believes that such matters will not have a material effect on the Company's consolidated financial statements.
Environmental Matters . It is generally IRET's policy to obtain a Phase I environmental assessment of each property that the Company seeks to acquire. Such assessments have not revealed, nor is the Company aware of, any environmental liabilities that IRET believes would have a material adverse effect on IRET's financial position or results of operations. IRET owns properties that contain or potentially contain (based on the age of the property) asbestos or lead, or have underground fuel storage tanks. For certain of these properties, the Company estimated the fair value of the conditional asset retirement obligation and chose not to book a liability, because the amounts involved were immaterial. With respect to certain other properties, the Company has not recorded any related asset retirement obligation, as the fair value of the liability cannot be reasonably estimated, due to insufficient information. IRET believes it does not have sufficient information to estimate the fair value of the asset retirement obligations for these properties because a settlement date or range of potential settlement dates has not been specified by others, and, additionally, there are currently no plans or expectation of plans to sell or to demolish these properties, or to undertake major renovations that would require removal of the asbestos, lead and/or underground storage tanks. These properties are expected to be maintained by repairs and maintenance activities that would not involve the removal of the asbestos, lead and/or underground storage tanks. Also, a need for renovations caused by tenant changes, technology changes or other factors has not been identified.
Tenant Improvements . In entering into leases with tenants, IRET may commit itself to fund improvements or build-outs of the rented space to suit tenant requirements. These tenant improvements are typically funded at the beginning of the lease term, and IRET is accordingly exposed to some risk of loss if a tenant defaults prior to the expiration of the lease term, and the rental income that was expected to cover the cost of the tenant improvements is not received. As of April 30, 2012, the Company is committed to fund approximately $7.1 million in tenant improvements, within approximately the next 12 months.
Purchase Options . The Company has granted options to purchase certain IRET properties to tenants in these properties, under lease agreements. In general, the options grant the tenant the right to purchase the property at the greater of such property's appraised value or an annual compounded increase of a specified percentage of the initial cost of the property to IRET. The property cost and gross rental revenue of these properties are as follows:
2012 Annual Report F-27
Table of Contents
NOTE 15 • continued
| (in thousands) | |||||||||||||||
Gross Rental Revenue | ||||||||||||||||
Property | Investment Cost | 2012 | 2011 | 2010 | ||||||||||||
Billings 2300 Grant Road - Billings, MT | $ | 2,522 | $ | 291 | $ | 226 | $ | n/a | ||||||||
Fargo 1320 45 th Street N - Fargo, ND | 4,160 | 400 | 333 | n/a | ||||||||||||
Great Plains - Fargo, ND | 15,375 | 1,843 | 1,876 | 1,876 | ||||||||||||
Healtheast St John & Woodwinds - Maplewood & Woodbury, MN | 21,601 | 2,152 | 2,152 | 2,152 | ||||||||||||
Minnesota National Bank - Duluth, MN | 2,272 | 127 | 105 | 164 | ||||||||||||
Missoula 3050 Great Northern - Missoula, MT | 2,723 | 315 | 243 | n/a | ||||||||||||
Sartell 2000 23 rd Street South - Sartell, MN | 12,716 | 868 | 1,209 | 1,173 | ||||||||||||
Spring Creek American Falls- American Falls, ID | 4,070 | 234 | n/a | n/a | ||||||||||||
Spring Creek Boise - Boise, ID | 5,075 | 293 | n/a | n/a | ||||||||||||
Spring Creek Eagle - Eagle, ID | 4,100 | 237 | n/a | n/a | ||||||||||||
Spring Creek Meridian - Meridian, ID | 7,250 | 417 | n/a | n/a | ||||||||||||
Spring Creek Overland - Overland, ID | 6,725 | 387 | n/a | n/a | ||||||||||||
Spring Creek Soda Springs - Soda Springs, ID | 2,262 | 130 | n/a | n/a | ||||||||||||
Spring Creek Ustick - Meridian, ID | 4,300 | 246 | n/a | n/a | ||||||||||||
St. Michael Clinic - St. Michael, MN | 2,851 | 248 | 244 | 241 | ||||||||||||
Stevens Point - Stevens Point, WI | 15,020 | 1,020 | 1,104 | 1,356 | ||||||||||||
Winsted Industrial Building - Winsted, MN | 1,049 | 32 | n/a | n/a | ||||||||||||
Total | $ | 114,071 | $ | 9,240 | $ | 7,492 | $ | 6,962 | ||||||||
Restrictions on Taxable Dispositions. Approximately 108 of the Company's properties, consisting of approximately 6.0 million square feet of our combined commercial segment's properties and 3,921 apartment units, are subject to restrictions on taxable dispositions under agreements entered into with some of the sellers or contributors of the properties. The real estate investment amount of these properties (net of accumulated depreciation) was approximately $786.5 million at April 30, 2012. The restrictions on taxable dispositions are effective for varying periods. The terms of these agreements generally prevent us from selling the properties in taxable transactions. The Company does not believe that the agreements materially affect the conduct of its business or its decisions whether to dispose of restricted properties during the restriction period because the Company generally holds these and its other properties for investment purposes, rather than for sale. Historically, however, where the Company has deemed it to be in its shareholders' best interests to dispose of restricted properties, the Company has done so through transactions structured as tax-deferred transactions under Section 1031 of the Internal Revenue Code.
Redemption Value of UPREIT Units . The limited partnership units ("UPREIT Units") of the Company's operating partnership, IRET Properties, are redeemable at the option of the holder for cash, or, at our option, for the Company's common shares of beneficial interest on a one-for-one basis, after a minimum one-year holding period. All UPREIT Units receive the same cash distributions as those paid on common shares. UPREIT Units are redeemable for an amount of cash per Unit equal to the average of the daily market price of an IRET common share for the ten consecutive trading days immediately preceding the date of valuation of the Unit. As of April 30, 2012 and 2011, the aggregate redemption value of the then-outstanding UPREIT Units of the operating partnership owned by limited partners was approximately $147.8 million and $188.0 million, respectively.
Joint Venture Buy/Sell Options. Certain of IRET's joint venture agreements contain buy/sell options in which each party under certain circumstances has the option to acquire the interest of the other party, but do not generally require that the Company buy its partners' interests. During the third quarter of fiscal year 2012, IRET acquired, in an equity transaction for $1.3 million, its joint venture partner's interest in the Company's only joint venture which allowed IRET's unaffiliated partner, at its election, to require that IRET buy its interest at a purchase price to be determined by an appraisal conducted in accordance with the terms of the agreement, or at a negotiated price. The entity will continue to be consolidated in IRET's financial statements. The Company currently has no joint ventures in which its joint venture partner can require the Company to buy the partner's interest.
Development Projects . The Company has various contracts outstanding with third parties in connection with ongoing development projects. As of April 30, 2012, contractual commitments for development projects are as follows:
2012 Annual Report F-28
Table of Contents
NOTE 15 • continued
Multi-Family Conversion, Minot, North Dakota : The Company is converting an existing approximately 15,000 square foot commercial office building in Minot, North Dakota to a 20-unit multi-family residential property, for an estimated total cost of $3.0 million and a projected completion date in the fourth quarter of fiscal year 2013. As of April 30, 2012, the Company had incurred approximately $321,000 of these project costs.
Quarry Ridge Apartment Homes, Rochester, Minnesota : In June 2011, the Company commenced construction on an approximately 159-unit apartment project in Rochester, Minnesota, located adjacent to its existing Quarry Ridge Apartment Homes. The Company currently estimates that construction costs (excluding the value of the land) will total approximately $17.3 million, and that the project will be completed in the first quarter of fiscal 2013. As of April 30, 2012, the Company had incurred approximately $14.5 million of the estimated construction costs.
Williston Apartments, Williston, North Dakota : During the second quarter of fiscal year 2012, the Company formed a joint venture to construct a 144-unit multi-family residential property in Williston, North Dakota. Construction commenced in August 2011, and 72 units were placed in service during the fourth quarter of fiscal year 2012. The Company estimates that the remaining 72 units will be placed in service during the first quarter of fiscal year 2013 at a total project cost to the joint venture entity of approximately $19.5 million, including the value of the land. The Company is the majority member of the joint venture, with a 60% interest; the remaining 40% interest is held by the Company's joint venture partner, a Minnesota limited liability company formed by a developer and a construction company based in St. Cloud, Minnesota. The Company's cash contribution to the project is approximately $3.3 million; the Company's joint venture partner contributed project planning and development services and the land for the project, which together were valued at $2.2 million. The remainder of the project cost is being financed with a construction loan from First International Bank & Trust. As of April 30, 2012, the joint venture entity had incurred approximately $14.4 million of the total estimated project costs.
Senior Housing Memory Care and Assisted Living Units, Laramie, Wyoming : During the second quarter of fiscal year 2012, the Company entered into a contract for the construction of an additional 29 assisted living units at its existing 48-unit Spring Wind senior housing facility in Laramie, Wyoming, and for the conversion of an existing 16 units at the facility to memory care units, for a total, following project completion, of 61 assisted living units and 16 memory care units. The Company estimates that the construction costs for this expansion project will total approximately $3.8 million and that the project will be completed in the first quarter of fiscal year 2013. As of April 30, 2012, the Company had incurred approximately $1.8 million of these project costs.
Industrial-Office Build-to-Suit, Minot, North Dakota : During the second quarter of fiscal year 2012, the Company entered into a 10-year, fully net lease with a provider of production enhancement services to the oil and gas industry, to construct and then lease an approximately 28,000 square foot industrial building to be located in Minot, North Dakota on an approximately 9.6-acre parcel of vacant land. Construction began in October 2011, with completion estimated in the summer of 2012. Total construction costs are currently estimated at $5.8 million (including the cost of the land), subject to tenant requested changes. As of April 30, 2012, the Company had incurred approximately $2.2 million of these estimated construction costs.
Jamestown Medical Office Building, Jamestown, North Dakota : During the fourth quarter of fiscal year 2012, the Company formed a joint venture to construct a one-story, approximately 45,000 square foot medical office building on an approximately 4.9 acre parcel of land adjacent to the Jamestown Regional Medical Center campus in Jamestown, North Dakota, for a total project cost estimated at $9.2 million. The land on which the project is being built is held by the joint venture entity under a pre-paid ground lease with an initial term of 79 years and two 10-year renewals. The Company is the majority member of the joint venture, with a 51% interest; the remaining interest is held by the Company's joint venture partner, a Minnesota limited liability company formed by the principal in a medical leasing and development firm based in Minneapolis, Minnesota. The Company's cash contribution to the project is expected to be approximately $1.5 million, with the remainder of the project cost being provided by the Company's joint venture partner and from the proceeds of the joint venture entity's $6.2 million construction loan with Wells Fargo bank. As of April 30, 2012, the joint venture entity had incurred approximately $1.6 million of the total estimated project costs. Construction of the medical office building began in the fourth quarter of fiscal year 2012, with completion of the project currently expected in the fourth quarter of fiscal year 2013.
2012 Annual Report F-29
Table of Contents
NOTE 16 • FAIR VALUE MEASUREMENTS
ASC 820, Fair Value Measurement and Disclosures defines and establishes a framework for measuring fair value. The objective of fair value is to determine the price that would be received upon the sale of an asset or paid to transfer a liability in an orderly transaction between market participants at the measurement date (the exit price). ASC 820 establishes a fair value hierarchy that prioritizes observable and unobservable inputs used to measure fair value into three levels, as follows:
Level 1: Quoted prices in active markets for identical assets
Level 2: Significant other observable inputs
Level 3: Significant unobservable inputs
There were no transfers in and out of Level 1, Level 2 and Level 3 fair value measurements during fiscal years 2012 and 2011. Fair value estimates may be different than the amounts that may ultimately be realized upon sale or disposition of the assets and liabilities.
Fair Value Measurements on a Recurring Basis
The Company had no assets or liabilities recorded at fair value on a recurring basis at April 30, 2012 and 2011.
Fair Value Measurements on a Nonrecurring Basis
Non-financial assets measured at fair value on a nonrecurring basis at April 30, 2012 consisted of real estate held for sale that was written-down to estimated fair value during fiscal year 2012. See Note 2 for additional information on impairment losses recognized during fiscal year 2012. There were no impairment write-downs in fiscal year 2011. The aggregate fair value of these assets by their levels in the fair value hierarchy are as follows:
(in thousands) | ||||||||||||||||
April 30, 2012 | ||||||||||||||||
Total | Level 1 | Level 2 | Level 3 | |||||||||||||
Real estate held for sale | $ | 2,067 | $ | 0 | $ | 0 | $ | 2,067 | ||||||||
Financial Assets and Liabilities Not Measured at Fair Value
The following methods and assumptions were used to estimate the fair value of each class of financial assets and liabilities. The fair values of our financial instruments approximate their carrying amount in our consolidated financial statements except for debt.
Mortgage Loans Receivable. Fair values are based on the discounted value of future cash flows expected to be received for a loan using current rates at which similar loans would be made to borrowers with similar credit risk and the same remaining maturities. Terms are short term in nature and carrying value approximates the estimated fair value.
Cash and Cash Equivalents. The carrying amount approximates fair value because of the short maturity.
Other Investments. The carrying amount, or cost plus accrued interest, of the certificates of deposit approximates fair value.
Other Debt. The fair value of other debt is estimated based on the discounted cash flows of the loan using current market rates, which are estimated based on recent financing transactions (Level 3).
Lines of Credit. The carrying amount approximates fair value because the variable rate debt re-prices frequently.
Mortgages Payable. For variable rate loans that re-price frequently, fair values are based on carrying values. The fair value of fixed rate loans is estimated based on the discounted cash flows of the loans using current market rates, which are estimated based on recent financing transactions (Level 3).
2012 Annual Report F-30
Table of Contents
NOTE 16 • continued
The estimated fair values of the Company's financial instruments as of April 30, 2012 and 2011 are as follows:
(in thousands) | ||||||||||||||||
2012 | 2011 | |||||||||||||||
Carrying Amount | Fair Value | Carrying Amount | Fair Value | |||||||||||||
FINANCIAL ASSETS | ||||||||||||||||
Mortgage loans receivable | $ | 0 | $ | 0 | $ | 156 | $ | 156 | ||||||||
Cash and cash equivalents | 39,989 | 39,989 | 41,191 | 41,191 | ||||||||||||
Other investments | 634 | 634 | 625 | 625 | ||||||||||||
FINANCIAL LIABILITIES | ||||||||||||||||
Other debt | 13,875 | 13,973 | 8,200 | 7,279 | ||||||||||||
Lines of credit | 39,000 | 39,000 | 30,000 | 30,000 | ||||||||||||
Mortgages payable | 1,048,689 | 1,087,082 | 993,803 | 1,013,713 | ||||||||||||
NOTE 17 • COMMON AND PREFERRED SHARES OF BENEFICIAL INTEREST AND EQUITY
Distribution Reinvestment and Share Purchase Plan. During fiscal years 2012 and 2011, IRET issued 4.8 million and 1.7 million common shares, respectively, pursuant to its distribution reinvestment and share purchase plan, at a total value at issuance of $34.3 million and $14.5 million, respectively. The shares issued under the distribution reinvestment and share purchase plan during fiscal year 2012 consisted of 1.5 million shares valued at issuance at $10.8 million that were issued for reinvested distributions and approximately 3.3 million shares valued at $23.5 million at issuance that were sold for voluntary cash contributions. The shares issued under the distribution reinvestment and share purchase plan during fiscal year 2011 consisted of 1.3 million shares valued at issuance at $11.4 million that were issued for reinvested distributions and approximately 372,000 shares valued at $3.1 million at issuance that were sold for voluntary cash contributions. IRET's distribution reinvestment plan is available to common shareholders of IRET and all limited partners of IRET Properties. Under the distribution reinvestment plan, shareholders or limited partners may elect to have all or a portion of their distributions used to purchase additional IRET common shares, and may elect to make voluntary cash contributions for the purchase of IRET common shares, at a discount (currently 5%) from the market price.
Conversion of Units to Common Shares. During fiscal years 2012 and 2011, respectively, approximately 759,000 and 1.0 million Units were converted to common shares, with a total value of $3.5 million and $6.9 million included in equity.
Issuance of Common Shares . The Company has an effective shelf registration statement under which it has registered common and preferred shares of beneficial interest with an aggregate public offering price of up to $150.0 million. On January 20, 2012, the Company entered into a continuous equity offering program under this shelf registration statement with BMO Capital Markets Corp. ("BMO") as sales agent, pursuant to which the Company may from time to time offer and sell its common shares of beneficial interest having an aggregate gross sales price of up to $100.0 million. Sales of common shares, if any, under the program will depend upon market conditions and other factors to be determined by IRET. During fiscal year 2012, IRET issued 3.3 million common shares under this program for total proceeds (before offering expenses but after underwriting discounts and commissions) of $24.0 million. During fiscal year 2011, IRET sold 1.8 million common shares under its previous continuous equity offering program with Robert W. Baird & Co., Incorporated as sales agent, for net proceeds of approximately $15.0 million, before offering expenses but after underwriting discounts and commissions. The shelf registration statement under which the Company had reserved shares for issuance under this previous continuous equity offering program expired at the end of its three-year life during the second quarter of fiscal year 2012.
Series A Cumulative Redeemable Preferred Shares of Beneficial Interest. During fiscal year 2004, the Company issued 1,150,000 shares of 8.25% Series A Cumulative Redeemable Preferred Shares of Beneficial Interest for total proceeds of $27.3 million, net of selling costs. Holders of the Company's Series A Cumulative Redeemable Preferred Shares of Beneficial Interest are entitled to receive dividends at an annual rate of 8.25% of the liquidation preference of $25 per share, or $2.0625 per share per annum. These dividends are cumulative and payable quarterly in arrears. The shares are not convertible into or exchangeable for any other property or any other securities of the Company at the election of the holders. However, the Company, at its option, may redeem the shares at a redemption price of $25.00 per share, plus any accrued and unpaid distributions through the date of redemption. The shares have no maturity date and will remain outstanding indefinitely unless redeemed by the Company.
2012 Annual Report F-31
Table of Contents
NOTE 18 • QUARTERLY RESULTS OF CONSOLIDATED OPERATIONS (unaudited)
(in thousands, except per share data) | ||||||||||||||||
QUARTER ENDED | July 31, 2011 | October 31, 2011 | January 31, 2012 | April 30, 2012 | ||||||||||||
Revenues | $ | 59,557 | $ | 60,629 | $ | 60,981 | $ | 60,621 | ||||||||
Net income attributable to Investors Real Estate Trust | $ | 1,421 | $ | 1,285 | $ | 2,127 | $ | 3,379 | ||||||||
Net income available to common shareholders | $ | 828 | $ | 692 | $ | 1,534 | $ | 2,786 | ||||||||
Net income per common share - basic & diluted | $ | .01 | $ | .01 | $ | .02 | $ | .03 | ||||||||
(in thousands, except per share data) | ||||||||||||||||
QUARTER ENDED | July 31, 2010 | October 31, 2010 | January 31, 2011 | April 30, 2011 | ||||||||||||
Revenues | $ | 59,042 | $ | 58,765 | $ | 60,121 | $ | 59,026 | ||||||||
Net income attributable to Investors Real Estate Trust | $ | 1,986 | $ | 5,819 | $ | 11,833 | $ | 444 | ||||||||
Net income (loss) available to common shareholders | $ | 1,393 | $ | 5,226 | $ | 11,240 | $ | (149 | ) | |||||||
Net income (loss) per common share - basic & diluted | $ | .02 | $ | .07 | $ | .14 | $ | (.01 | ) | |||||||
The above financial information is unaudited. In the opinion of management, all adjustments (which are of a normal recurring nature) have been included for a fair presentation.
NOTE 19 • REDEEMABLE NONCONTROLLING INTERESTS
Redeemable noncontrolling interests on our Consolidated Balance Sheets represent the noncontrolling interest in a joint venture of the Company in which the Company's unaffiliated partner, at its election, could require the Company to buy its interest at a purchase price to be determined by an appraisal conducted in accordance with the terms of the agreement, or at a negotiated price. Redeemable noncontrolling interests are presented at the greater of their carrying amount or redemption value at the end of each reporting period. Changes in the value from period to period are charged to common shares of beneficial interest on our Consolidated Balance Sheets. The Company acquired this interest from its joint venture partner in the third quarter of fiscal year 2012, and following this acquisition, currently has no redeemable noncontrolling interests in consolidated real estate entities. As of April 30, 2012, 2011 and 2010, the estimated redemption value of the redeemable noncontrolling interests was $0, $987,000 and $1.8 million, respectively. Below is a table reflecting the activity of the redeemable noncontrolling interests.
(in thousands) | ||||||||||||
2012 | 2011 | 2010 | ||||||||||
Balance at beginning of fiscal year | $ | 987 | $ | 1,812 | $ | 1,737 | ||||||
Net income (loss) | 12 | (13 | ) | 60 | ||||||||
Net distributions | (27 | ) | (442 | ) | (177 | ) | ||||||
Mark-to-market adjustments | 35 | (370 | ) | 192 | ||||||||
Acquisition of joint venture partner's interest | (1,007 | ) | 0 | 0 | ||||||||
Balance at close of fiscal year | $ | 0 | $ | 987 | $ | 1,812 | ||||||
NOTE 20 • SUBSEQUENT EVENTS
Common and Preferred Share Distributions. On July 2, 2012, the Company paid a distribution of 51.56 cents per share on the Company's Series A Cumulative Redeemable Preferred Shares to preferred shareholders of record on June 15, 2012. On July 2, 2012, the Company paid a distribution of 13.00 cents per share on the Company's common shares and units, to common shareholders and Unitholders of record on June 15, 2012.
Completed Acquisitions and Dispositions . Subsequent to the end of fiscal year 2012, on May 8, 2012, the Company closed on its acquisition of a 308-unit multi-family residential property in Topeka, Kansas, for a purchase price totaling $17.7 million, of which approximately $12.5 million consisted of the assumption of existing debt, with the remainder paid in cash. On June 4, 2012, the Company closed on its acquisition of two multi-family residential properties in Lincoln, Nebraska. The 232-unit Colony apartment property was acquired for a purchase price of $17.5 million, of which approximately $14.2 million was paid in cash and the remainder in limited partnership units of the Operating Partnership valued at issuance at approximately $3.3 million. The 208-unit Lakeside Village apartment property was acquired for a purchase price of $17.3 million, of which approximately $13.8 million was paid in cash and the remainder in limited partnership units of the Operating Partnership valued at issuance at approximately $3.5 million. The Company placed mortgage debt of $14.0 million and $13.8 million, respectively,
2012 Annual Report F-32
Table of Contents
NOTE 20 • continued
on these two properties on June 4, 2012. The purchase price accounting is incomplete for the acquisitions that closed subsequent to the end of fiscal year 2012.
On June 20, 2012, the Company sold an approximately 16,000 square foot retail property in Kentwood, Michigan, for a sale price of $625,000. On June 21, 2012, the Company sold two condominium units in Grand Chute, Wisconsin, for a sale price of approximately $330,000.
On June 15, 2012 the Company filed a registration statement with the Securities and Exchange Commission to register shares for issuance under the Company's DRIP. This registration statement replaces the previous DRIP registration statement, and all shares remaining unsold under the previous DRIP registration statement were transferred to the new registration statement. On June 29, 2012, the Company filed a registration statement with the Securities and Exchange Commission to enable the Company to offer and sell, from time to time, in one or more offerings, common and preferred shares of beneficial interest with an aggregate public offering price of up to $150.0 million. This shelf registration statement is in addition to the Company's currently-effective registration statement under which the Company registered, in May 2010, common and preferred shares with an aggregate public offering price of up to $150.0 million, of which $100.0 million has been reserved for issuance under the continuous equity offering program with BMO as sales agent.
2012 Annual Report F-33
Table of Contents
INVESTORS REAL ESTATE TRUST AND SUBSIDIARIES
April 30, 2012
Schedule III - REAL ESTATE AND ACCUMULATED DEPRECIATION (in thousands)
Initial Cost to Company | Gross amount at which carried at close of period | ||||||||||||||||||
Description | Encumbrances (a) | Land | Buildings & Improvements | Costs capitalized subsequent to acquisition | Land | Buildings & Improvements | Total | Accumulated Depreciation | Date of Construction or Acquisition | Life on which depreciation in latest income statement is computed | |||||||||
Multi-Family Residential | |||||||||||||||||||
11th Street 3 Plex - Minot, ND | $ | 93 | $ | 11 | $ | 53 | $ | 10 | $ | 16 | $ | 58 | $ | 74 | $ | (6) | 2008 | 40 years | |
4th Street 4 Plex - Minot, ND | 107 | 15 | 74 | 13 | 22 | 80 | 102 | (8) | 2008 | 40 years | |||||||||
Apartments on Main - Minot, ND | 709 | 158 | 1,123 | 20 | 178 | 1,123 | 1,301 | (128) | 1987 | 24-40 years | |||||||||
Arbors - S Sioux City, NE | 4,074 | 350 | 6,625 | 1,143 | 603 | 7,515 | 8,118 | (1,256) | 2006 | 40 years | |||||||||
Ashland - Grand Forks, ND | 5,800 | 741 | 7,569 | 0 | 741 | 7,569 | 8,310 | (37) | 2012 | 40 years | |||||||||
Boulder Court - Eagan, MN | 3,459 | 1,067 | 5,498 | 2,507 | 1,282 | 7,790 | 9,072 | (1,738) | 2003 | 40 years | |||||||||
Brookfield Village - Topeka, KS | 5,463 | 509 | 6,698 | 1,181 | 611 | 7,777 | 8,388 | (1,728) | 2003 | 40 years | |||||||||
Brooklyn Heights - Minot, ND | 848 | 145 | 1,450 | 732 | 204 | 2,123 | 2,327 | (765) | 1997 | 12-40 years | |||||||||
Campus Center - St. Cloud, MN | 1,350 | 395 | 2,244 | 137 | 398 | 2,378 | 2,776 | (319) | 2007 | 40 years | |||||||||
Campus Heights - St. Cloud, MN | 0 | 110 | 628 | 47 | 112 | 673 | 785 | (92) | 2007 | 40 years | |||||||||
Campus Knoll - St. Cloud, MN | 900 | 266 | 1,512 | 76 | 271 | 1,583 | 1,854 | (216) | 2007 | 40 years | |||||||||
Campus Plaza - St. Cloud, MN (1) | 0 | 54 | 311 | 39 | 59 | 345 | 404 | (47) | 2007 | 40 years | |||||||||
Campus Side - St. Cloud, MN (1) | 0 | 107 | 615 | 76 | 114 | 684 | 798 | (93) | 2007 | 40 years | |||||||||
Campus View - St. Cloud, MN (1) | 0 | 107 | 615 | 66 | 109 | 679 | 788 | (91) | 2007 | 40 years | |||||||||
Candlelight - Fargo, ND | 1,274 | 80 | 758 | 1,051 | 223 | 1,666 | 1,889 | (772) | 1992 | 24-40 years | |||||||||
Canyon Lake - Rapid City, SD | 2,989 | 305 | 3,958 | 799 | 343 | 4,719 | 5,062 | (1,199) | 2001 | 40 years | |||||||||
Castlerock - Billings, MT | 6,864 | 736 | 4,864 | 1,623 | 900 | 6,323 | 7,223 | (2,127) | 1998 | 40 years | |||||||||
Chateau - Minot, ND | 0 | 122 | 1,499 | 469 | 122 | 1,968 | 2,090 | (219) | 1998 | 12-40 years | |||||||||
Cimarron Hills - Omaha, NE | 4,947 | 706 | 9,588 | 4,263 | 1,244 | 13,313 | 14,557 | (3,786) | 2001 | 40 years | |||||||||
Colonial Villa - Burnsville, MN | 6,918 | 2,401 | 11,515 | 3,404 | 2,772 | 14,548 | 17,320 | (3,417) | 2003 | 40 years | |||||||||
Colton Heights - Minot, ND | 477 | 80 | 672 | 358 | 114 | 996 | 1,110 | (660) | 1984 | 40 years | |||||||||
Cornerstone - St. Cloud, MN (1) | 0 | 54 | 311 | 42 | 55 | 352 | 407 | (48) | 2007 | 40 years | |||||||||
Cottage West Twin Homes - Sioux Falls, SD | 3,758 | 968 | 3,762 | 33 | 976 | 3,787 | 4,763 | (52) | 2011 | 40 years | |||||||||
Cottonwood - Bismarck, ND | 16,197 | 1,056 | 17,372 | 2,657 | 1,312 | 19,773 | 21,085 | (5,253) | 1997 | 40 years | |||||||||
Country Meadows - Billings, MT | 6,894 | 491 | 7,809 | 1,067 | 534 | 8,833 | 9,367 | (2,970) | 1995 | 33-40 years | |||||||||
Crestview - Bismarck, ND | 4,059 | 235 | 4,290 | 1,260 | 480 | 5,305 | 5,785 | (2,411) | 1994 | 24-40 years | |||||||||
Crown - Rochester, MN | 2,737 | 261 | 3,289 | 128 | 266 | 3,412 | 3,678 | (176) | 2010 | 40 years | |||||||||
Crown Colony - Topeka, KS | 8,473 | 620 | 9,956 | 1,896 | 782 | 11,690 | 12,472 | (3,598) | 1999 | 40 years | |||||||||
East Park - Sioux Falls, SD | 1,497 | 115 | 2,405 | 681 | 156 | 3,045 | 3,201 | (843) | 2002 | 40 years | |||||||||
Evergreen - Isanti, MN | 2,078 | 380 | 2,720 | 72 | 380 | 2,792 | 3,172 | (253) | 2008 | 40 years | |||||||||
Evergreen II - Isanti, MN | 2,185 | 691 | 2,784 | 2 | 691 | 2,786 | 3,477 | (39) | 2011 | 40 years | |||||||||
Fairmont - Minot, ND | 367 | 28 | 337 | 43 | 53 | 355 | 408 | (36) | 2008 | 40 years | |||||||||
Table of Contents
INVESTORS REAL ESTATE TRUST AND SUBSIDIARIES
April 30, 2012
Schedule III - REAL ESTATE AND ACCUMULATED DEPRECIATION (in thousands)
Initial Cost to Company | Gross amount at which carried at close of period | ||||||||||||||||||
Description | Encumbrances (a) | Land | Buildings & Improvements | Costs capitalized subsequent to acquisition | Land | Buildings & Improvements | Total | Accumulated Depreciation | Date of Construction or Acquisition | Life on which depreciation in latest income statement is computed | |||||||||
Multi-Family Residential - continued | |||||||||||||||||||
Forest Park - Grand Forks, ND | $ | 7,934 | $ | 810 | $ | 5,579 | $ | 6,174 | $ | 1,339 | $ | 11,224 | $ | 12,563 | $ | (4,118) | 1993 | 24-40 years | |
Gables Townhomes - Sioux Falls, SD | 1,521 | 349 | 1,921 | 23 | 364 | 1,929 | 2,293 | (27) | 2011 | 40 years | |||||||||
Grand Gateway - St. Cloud, MN | 5,691 | 814 | 7,086 | 14 | 814 | 7,100 | 7,914 | (47) | 2012 | 40 years | |||||||||
Greenfield - Omaha, NE | 3,650 | 578 | 4,122 | 512 | 757 | 4,455 | 5,212 | (504) | 2007 | 40 years | |||||||||
Heritage Manor - Rochester, MN | 4,337 | 403 | 6,968 | 2,144 | 479 | 9,036 | 9,515 | (2,989) | 1998 | 40 years | |||||||||
Indian Hills - Sioux City, IA (1) | 0 | 294 | 2,921 | 2,987 | 375 | 5,827 | 6,202 | (751) | 2007 | 40 years | |||||||||
Kirkwood Manor - Bismarck, ND | 3,408 | 449 | 2,725 | 1,343 | 544 | 3,973 | 4,517 | (1,429) | 1997 | 12-40 years | |||||||||
Lancaster - St. Cloud, MN | 875 | 289 | 2,899 | 868 | 439 | 3,617 | 4,056 | (1,213) | 2000 | 40 years | |||||||||
Landmark - Grand Forks, ND | 1,759 | 184 | 1,514 | 845 | 274 | 2,269 | 2,543 | (818) | 1997 | 40 years | |||||||||
Legacy - Grand Forks, ND | 16,540 | 1,362 | 21,727 | 5,447 | 2,041 | 26,495 | 28,536 | (7,839) | 1995-2005 | 24-40 years | |||||||||
Mariposa - Topeka, KS | 3,067 | 399 | 5,110 | 334 | 420 | 5,423 | 5,843 | (1,033) | 2004 | 40 years | |||||||||
Monticello Village - Monticello, MN | 2,958 | 490 | 3,756 | 399 | 616 | 4,029 | 4,645 | (892) | 2004 | 40 years | |||||||||
North Pointe - Bismarck, ND | 3,522 | 303 | 3,957 | 243 | 324 | 4,179 | 4,503 | (1,089) | 1995-2011 | 24-40 years | |||||||||
Northern Valley - Rochester, MN | 0 | 110 | 610 | 49 | 119 | 650 | 769 | (34) | 2010 | 40 years | |||||||||
Oakmont Estates - Sioux Falls, SD | 2,573 | 423 | 4,838 | 409 | 511 | 5,159 | 5,670 | (1,334) | 2002 | 40 years | |||||||||
Oakwood Estates - Sioux Falls, SD | 4,184 | 543 | 2,784 | 4,012 | 764 | 6,575 | 7,339 | (2,709) | 1993 | 40 years | |||||||||
Olympic Village - Billings, MT | 11,131 | 1,164 | 10,441 | 2,277 | 1,573 | 12,309 | 13,882 | (3,695) | 2000 | 40 years | |||||||||
Olympik Village - Rochester, MN | 4,715 | 1,034 | 6,109 | 1,351 | 1,138 | 7,356 | 8,494 | (1,370) | 2005 | 40 years | |||||||||
Oxbow Park - Sioux Falls, SD | 4,086 | 404 | 3,152 | 2,395 | 557 | 5,394 | 5,951 | (2,304) | 1994 | 24-40 years | |||||||||
Park Meadows - Waite Park, MN | 8,694 | 1,143 | 9,099 | 4,181 | 1,506 | 12,917 | 14,423 | (5,118) | 1997 | 40 years | |||||||||
Pebble Springs - Bismarck, ND | 809 | 7 | 748 | 101 | 42 | 814 | 856 | (276) | 1999 | 40 years | |||||||||
Pinehurst - Billings, MT | 313 | 72 | 687 | 160 | 77 | 842 | 919 | (222) | 2002 | 40 years | |||||||||
Pines - Minot, ND | 136 | 35 | 215 | 149 | 49 | 350 | 399 | (113) | 2002 | 40 years | |||||||||
Plaza - Minot, ND | 5,720 | 793 | 0 | 15,028 | 900 | 14,921 | 15,821 | (1,246) | 2009 | 40 years | |||||||||
Pointe West - Rapid City, SD | 2,780 | 240 | 3,538 | 1,118 | 353 | 4,543 | 4,896 | (1,983) | 1994 | 24-40 years | |||||||||
Prairie Winds - Sioux Falls, SD | 1,488 | 144 | 1,816 | 433 | 225 | 2,168 | 2,393 | (1,059) | 1993 | 24-40 years | |||||||||
Prairiewood Meadows - Fargo, ND | 2,456 | 280 | 2,531 | 953 | 340 | 3,424 | 3,764 | (1,038) | 2000 | 40 years | |||||||||
Quarry Ridge - Rochester, MN | 11,876 | 1,312 | 13,362 | 581 | 1,345 | 13,910 | 15,255 | (1,980) | 2006 | 40 years | |||||||||
Regency Park Estates - St. Cloud, MN | 7,097 | 702 | 10,198 | 140 | 703 | 10,337 | 11,040 | (185) | 2011 | 40 years | |||||||||
Ridge Oaks - Sioux City, IA | 3,516 | 178 | 4,073 | 1,936 | 257 | 5,930 | 6,187 | (1,755) | 2001 | 40 years | |||||||||
Rimrock West - Billings, MT | 3,443 | 330 | 3,489 | 1,356 | 417 | 4,758 | 5,175 | (1,348) | 1999 | 40 years | |||||||||
Rocky Meadows - Billings, MT | 5,338 | 656 | 5,726 | 871 | 767 | 6,486 | 7,253 | (2,575) | 1995 | 40 years | |||||||||
Rum River - Isanti, MN | 3,741 | 843 | 4,823 | 74 | 848 | 4,892 | 5,740 | (619) | 2007 | 40 years | |||||||||
2012 Annual Report F-35
Table of Contents
INVESTORS REAL ESTATE TRUST AND SUBSIDIARIES
April 30, 2012
Schedule III - REAL ESTATE AND ACCUMULATED DEPRECIATION (in thousands)
Initial Cost to Company | Gross amount at which carried at close of period | ||||||||||||||||||
Description | Encumbrances (a) | Land | Buildings & Improvements | Costs capitalized subsequent to acquisition | Land | Buildings & Improvements | Total | Accumulated Depreciation | Date of Construction or Acquisition | Life on which depreciation in latest income statement is computed | |||||||||
Multi-Family Residential - continued | |||||||||||||||||||
Sherwood - Topeka, KS | $ | 12,716 | $ | 1,145 | $ | 14,684 | $ | 2,500 | $ | 1,503 | $ | 16,826 | $ | 18,329 | $ | (5,260) | 1999 | 40 years | |
Sierra Vista - Sioux Falls, SD | 1,477 | 241 | 2,097 | 56 | 251 | 2,143 | 2,394 | (66) | 2011 | 40 years | |||||||||
South Pointe - Minot, ND | 9,109 | 550 | 9,548 | 2,139 | 1,261 | 10,976 | 12,237 | (4,442) | 1995 | 24-40 years | |||||||||
Southview - Minot, ND | 1,105 | 185 | 469 | 295 | 236 | 713 | 949 | (292) | 1994 | 24-40 years | |||||||||
Southwind - Grand Forks, ND | 5,818 | 400 | 5,034 | 2,373 | 714 | 7,093 | 7,807 | (2,757) | 1995 | 24-40 years | |||||||||
Summit Park - Minot, ND | 1,176 | 161 | 1,898 | 1,022 | 266 | 2,815 | 3,081 | (983) | 1995 | 24-40 years | |||||||||
Sunset Trail - Rochester, MN | 8,373 | 336 | 12,814 | 2,214 | 522 | 14,842 | 15,364 | (4,154) | 1999 | 40 years | |||||||||
Sycamore Village - Sioux Falls, SD | 842 | 101 | 1,317 | 457 | 151 | 1,724 | 1,875 | (495) | 2002 | 40 years | |||||||||
Temple - Minot, ND | 83 | 0 | 0 | 226 | 0 | 226 | 226 | (36) | 2006 | 40 years | |||||||||
Terrace Heights - Minot, ND | 196 | 29 | 312 | 83 | 40 | 384 | 424 | (153) | 2006 | 40 years | |||||||||
Terrace On The Green - Moorhead, MN | 2,210 | 24 | 1,490 | 1,792 | 132 | 3,174 | 3,306 | (2,200) | 1970 | 33-40 years | |||||||||
The Meadows - Jamestown, ND (1) | 0 | 590 | 4,519 | 1,063 | 646 | 5,526 | 6,172 | (1,663) | 1998 | 40 years | |||||||||
Thomasbrook - Lincoln, NE | 6,159 | 600 | 10,306 | 2,753 | 1,084 | 12,575 | 13,659 | (3,596) | 1999 | 40 years | |||||||||
University Park Place - St. Cloud, MN (1) | 0 | 78 | 450 | 54 | 78 | 504 | 582 | (66) | 2007 | 40 years | |||||||||
Valley Park - Grand Forks, ND | 4,004 | 294 | 4,137 | 2,481 | 509 | 6,403 | 6,912 | (2,055) | 1999 | 40 years | |||||||||
Village Green - Rochester, MN | 1,324 | 234 | 2,296 | 581 | 349 | 2,762 | 3,111 | (630) | 2003 | 40 years | |||||||||
West Stonehill - Waite Park, MN | 8,935 | 939 | 10,167 | 4,227 | 1,295 | 14,038 | 15,333 | (5,911) | 1995 | 40 years | |||||||||
Westridge - Minot, ND | 1,768 | 68 | 1,887 | 55 | 72 | 1,938 | 2,010 | (196) | 2008 | 40 years | |||||||||
Westwood Park - Bismarck, ND | 2,041 | 116 | 1,909 | 1,596 | 258 | 3,363 | 3,621 | (1,100) | 1998 | 40 years | |||||||||
Williston Garden - Williston, ND | 0 | 700 | 8,978 | 0 | 700 | 8,978 | 9,678 | (113) | 2012 | 40 years | |||||||||
Winchester - Rochester, MN | 3,242 | 748 | 5,622 | 1,437 | 1,000 | 6,807 | 7,807 | (1,601) | 2003 | 40 years | |||||||||
Woodridge - Rochester, MN | 6,700 | 370 | 6,028 | 1,777 | 485 | 7,690 | 8,175 | (2,970) | 1997 | 40 years | |||||||||
Total Multi-Family Residential | $ | 311,153 | $ | 38,410 | $ | 387,390 | $ | 113,983 | $ | 48,952 | $ | 490,831 | $ | 539,783 | $ | (128,834) | |||
Commercial Office | |||||||||||||||||||
1st Avenue Building - Minot, ND | $ | 0 | $ | 30 | $ | 80 | $ | (39) | $ | 33 | $ | 38 | $ | 71 | $ | 270 | 1981 | 33-40 years | |
2030 Cliff Road - Eagan, MN | 995 | 146 | 835 | 90 | 158 | 913 | 1,071 | (246) | 2007 | 40 years | |||||||||
610 Business Center IV - Brooklyn Park, MN | 7,125 | 975 | 5,542 | 2,886 | 980 | 8,423 | 9,403 | (1,363) | 2001 | 19-40 years | |||||||||
7800 West Brown Deer Road - Milwaukee, WI | 10,887 | 1,455 | 8,756 | 2,261 | 1,475 | 10,997 | 12,472 | (2,853) | 2003 | 40 years | |||||||||
American Corporate Center - Mendota Heights, MN | 9,016 | 893 | 16,768 | 3,879 | 893 | 20,647 | 21,540 | (7,061) | 2002 | 40 years | |||||||||
Ameritrade - Omaha, NE | 3,195 | 327 | 7,957 | 65 | 327 | 8,022 | 8,349 | (2,613) | 1999 | 40 years | |||||||||
Benton Business Park - Sauk Rapids, MN | 626 | 188 | 1,261 | 79 | 188 | 1,340 | 1,528 | (326) | 2003 | 40 years | |||||||||
Bismarck 715 East Broadway - Bismarck, ND | 2,398 | 389 | 0 | 2,389 | 422 | 2,356 | 2,778 | (202) | 2008 | 40 years | |||||||||
Table of Contents
INVESTORS REAL ESTATE TRUST AND SUBSIDIARIES
April 30, 2012
Schedule III - REAL ESTATE AND ACCUMULATED DEPRECIATION (in thousands)
Initial Cost to Company | Gross amount at which carried at close of period | ||||||||||||||||||
Description | Encumbrances (a) | Land | Buildings & Improvements | Costs capitalized subsequent to acquisition | Land | Buildings & Improvements | Total | Accumulated Depreciation | Date of Construction or Acquisition | Life on which depreciation in latest income statement is computed | |||||||||
Commercial Office - continued | |||||||||||||||||||
Bloomington Business Plaza - Bloomington, MN | $ | 0 | $ | 1,300 | $ | 6,106 | $ | 1,562 | $ | 1,311 | $ | 7,657 | $ | 8,968 | $ | (2,210) | 2001 | 40 years | |
Brenwood - Minnetonka, MN | 5,250 | 1,688 | 12,138 | 3,675 | 1,697 | 15,804 | 17,501 | (4,695) | 2002 | 40 years | |||||||||
Brook Valley I - La Vista, NE | 1,344 | 347 | 1,671 | 81 | 347 | 1,752 | 2,099 | (304) | 2005 | 40 years | |||||||||
Burnsville Bluffs II - Burnsville, MN | 1,756 | 300 | 2,154 | 961 | 359 | 3,056 | 3,415 | (1,124) | 2001 | 40 years | |||||||||
Cold Spring Center - St. Cloud, MN | 5,822 | 588 | 7,808 | 1,002 | 592 | 8,806 | 9,398 | (2,698) | 2001 | 40 years | |||||||||
Corporate Center West - Omaha, NE | 17,315 | 3,880 | 17,509 | 941 | 4,167 | 18,163 | 22,330 | (2,507) | 2006 | 40 years | |||||||||
Crosstown Centre - Eden Prairie, MN | 13,687 | 2,884 | 14,569 | 1,620 | 2,900 | 16,173 | 19,073 | (3,069) | 2004 | 40 years | |||||||||
Dewey Hill Business Center - Edina, MN | 0 | 985 | 3,507 | 907 | 995 | 4,404 | 5,399 | (1,522) | 2000 | 40 years | |||||||||
Farnam Executive Center - Omaha, NE | 12,160 | 2,188 | 11,404 | 0 | 2,188 | 11,404 | 13,592 | (1,604) | 2006 | 40 years | |||||||||
Flagship - Eden Prairie, MN | 21,565 | 1,899 | 21,638 | 939 | 2,013 | 22,463 | 24,476 | (3,462) | 2006 | 40 years | |||||||||
Gateway Corporate Center - Woodbury, MN | 8,700 | 1,637 | 7,763 | 438 | 1,651 | 8,187 | 9,838 | (1,165) | 2006 | 40 years | |||||||||
Golden Hills Office Center - Golden Valley, MN | 18,251 | 3,018 | 18,544 | 3,249 | 3,018 | 21,793 | 24,811 | (6,388) | 2003 | 40 years | |||||||||
Great Plains - Fargo, ND | 1,947 | 126 | 15,240 | 10 | 126 | 15,250 | 15,376 | (4,845) | 1997 | 40 years | |||||||||
Highlands Ranch I - Highlands Ranch, CO | 8,436 | 2,268 | 8,362 | 427 | 2,268 | 8,789 | 11,057 | (1,268) | 2006 | 40 years | |||||||||
Highlands Ranch II - Highlands Ranch, CO | 8,180 | 1,437 | 9,549 | 1,397 | 1,437 | 10,946 | 12,383 | (2,298) | 2004 | 40 years | |||||||||
Interlachen Corporate Center - Edina, MN | 9,082 | 1,650 | 14,983 | 1,991 | 1,668 | 16,956 | 18,624 | (4,324) | 2001 | 40 years | |||||||||
Intertech Building - Fenton, MO | 4,527 | 2,130 | 3,968 | 505 | 2,147 | 4,456 | 6,603 | (492) | 2007 | 40 years | |||||||||
Mendota Office Center I - Mendota Heights, MN | 3,883 | 835 | 6,169 | 367 | 835 | 6,536 | 7,371 | (1,889) | 2002 | 40 years | |||||||||
Mendota Office Center II - Mendota Heights, MN | 5,737 | 1,121 | 10,085 | 1,474 | 1,121 | 11,559 | 12,680 | (3,777) | 2002 | 40 years | |||||||||
Mendota Office Center III - Mendota Heights, MN | 3,942 | 970 | 5,734 | 258 | 970 | 5,992 | 6,962 | (1,684) | 2002 | 40 years | |||||||||
Mendota Office Center IV - Mendota Heights, MN | 4,687 | 1,070 | 7,635 | 578 | 1,070 | 8,213 | 9,283 | (2,396) | 2002 | 40 years | |||||||||
Minnesota National Bank - Duluth, MN | 850 | 287 | 1,454 | 171 | 288 | 1,624 | 1,912 | (293) | 2004 | 40 years | |||||||||
Minot 2505 16th Street SW - Minot, ND (1) | 0 | 298 | 1,724 | 296 | 298 | 2,020 | 2,318 | (113) | 2009 | 40 years | |||||||||
Miracle Hills One - Omaha, NE | 8,895 | 1,974 | 10,117 | 1,284 | 2,120 | 11,255 | 13,375 | (2,039) | 2006 | 40 years | |||||||||
Nicollett VII - Burnsville, MN | 0 | 429 | 6,931 | 430 | 436 | 7,354 | 7,790 | (1,981) | 2001 | 40 years | |||||||||
Northgate I - Maple Grove, MN | 5,339 | 1,062 | 6,358 | 832 | 1,077 | 7,175 | 8,252 | (1,429) | 2004 | 40 years | |||||||||
Northgate II - Maple Grove, MN | 960 | 359 | 1,944 | 144 | 403 | 2,044 | 2,447 | (675) | 1999 | 40 years | |||||||||
Northpark Corporate Center - Arden Hills, MN | 12,706 | 2,034 | 14,584 | 1,315 | 2,034 | 15,899 | 17,933 | (2,589) | 2006 | 40 years | |||||||||
Omaha 10802 Farnam Dr - Omaha, NE | 5,405 | 2,462 | 4,374 | 0 | 2,462 | 4,374 | 6,836 | (150) | 2010 | 40 years | |||||||||
Pacific Hills - Omaha, NE | 16,770 | 4,220 | 11,988 | 1,775 | 4,478 | 13,505 | 17,983 | (2,129) | 2006 | 40 years | |||||||||
Pillsbury Business Center - Bloomington, MN | 0 | 284 | 1,556 | 170 | 299 | 1,711 | 2,010 | (492) | 2001 | 40 years | |||||||||
Plaza 16 - Minot, ND | 7,591 | 389 | 5,444 | 3,749 | 591 | 8,991 | 9,582 | (925) | 2009 | 40 years | |||||||||
Plaza VII - Boise, ID | 1,052 | 300 | 3,058 | 442 | 351 | 3,449 | 3,800 | (925) | 2003 | 40 years | |||||||||
Plymouth 5095 Nathan Lane - Plymouth, MN | 1,245 | 604 | 1,253 | 82 | 636 | 1,303 | 1,939 | (156) | 2007 | 40 years | |||||||||
Table of Contents
INVESTORS REAL ESTATE TRUST AND SUBSIDIARIES
April 30, 2012
Schedule III - REAL ESTATE AND ACCUMULATED DEPRECIATION (in thousands)
Initial Cost to Company | Gross amount at which carried at close of period | ||||||||||||||||||
Description | Encumbrances (a) | Land | Buildings & Improvements | Costs capitalized subsequent to acquisition | Land | Buildings & Improvements | Total | Accumulated Depreciation | Date of Construction or Acquisition | Life on which depreciation in latest income statement is computed | |||||||||
Commercial Office - continued | |||||||||||||||||||
Plymouth I - Plymouth, MN | $ | 1,197 | $ | 530 | $ | 1,133 | $ | 42 | $ | 530 | $ | 1,175 | $ | 1,705 | $ | (241) | 2004 | 40 years | |
Plymouth II - Plymouth, MN | 1,197 | 367 | 1,264 | 41 | 367 | 1,305 | 1,672 | (269) | 2004 | 40 years | |||||||||
Plymouth III - Plymouth, MN | 1,473 | 507 | 1,495 | 359 | 507 | 1,854 | 2,361 | (417) | 2004 | 40 years | |||||||||
Plymouth IV & V - Plymouth, MN | 7,026 | 1,336 | 12,693 | 1,676 | 1,338 | 14,367 | 15,705 | (4,294) | 2001 | 40 years | |||||||||
Prairie Oak Business Center - Eden Prairie, MN | 3,387 | 531 | 4,069 | 1,640 | 563 | 5,677 | 6,240 | (1,696) | 2003 | 40 years | |||||||||
Rapid City 900 Concourse Drive - Rapid City, SD | 1,609 | 285 | 6,600 | 503 | 321 | 7,067 | 7,388 | (2,040) | 2000 | 40 years | |||||||||
Riverport - Maryland Heights, MO | 19,690 | 1,891 | 18,982 | 696 | 1,917 | 19,652 | 21,569 | (2,692) | 2006 | 40 years | |||||||||
Southeast Tech Center - Eagan, MN | 1,727 | 560 | 5,496 | 419 | 569 | 5,906 | 6,475 | (1,964) | 1999 | 40 years | |||||||||
Spring Valley IV - Omaha, NE | 800 | 178 | 916 | 60 | 186 | 968 | 1,154 | (188) | 2005 | 40 years | |||||||||
Spring Valley V - Omaha, NE | 880 | 212 | 1,123 | 251 | 240 | 1,346 | 1,586 | (249) | 2005 | 40 years | |||||||||
Spring Valley X - Omaha, NE | 816 | 180 | 1,024 | 54 | 189 | 1,069 | 1,258 | (184) | 2005 | 40 years | |||||||||
Spring Valley XI - Omaha, NE | 800 | 143 | 1,094 | 36 | 151 | 1,122 | 1,273 | (189) | 2005 | 40 years | |||||||||
Superior Office Building - Duluth, MN | 1,279 | 336 | 2,200 | 83 | 336 | 2,283 | 2,619 | (443) | 2004 | 40 years | |||||||||
TCA Building - Eagan, MN | 7,536 | 627 | 8,571 | 807 | 684 | 9,321 | 10,005 | (2,324) | 2003 | 40 years | |||||||||
Three Paramount Plaza - Bloomington, MN (1) | 0 | 1,261 | 6,149 | 1,883 | 1,298 | 7,995 | 9,293 | (2,339) | 2002 | 40 years | |||||||||
Thresher Square - Minneapolis, MN | 0 | 1,094 | 10,026 | 1,706 | 1,104 | 11,722 | 12,826 | (3,281) | 2002 | 40 years | |||||||||
Timberlands - Leawood, KS | 13,155 | 2,375 | 12,218 | 749 | 2,495 | 12,847 | 15,342 | (2,179) | 2006 | 40 years | |||||||||
UHC Office - International Falls, MN | 1,084 | 119 | 2,366 | 80 | 119 | 2,446 | 2,565 | (515) | 2004 | 40 years | |||||||||
US Bank Financial Center - Bloomington, MN | 13,728 | 3,117 | 13,350 | 610 | 3,119 | 13,958 | 17,077 | (2,532) | 2005 | 40 years | |||||||||
Viromed - Eden Prairie, MN | 626 | 666 | 4,197 | 1 | 666 | 4,198 | 4,864 | (1,386) | 1999 | 40 years | |||||||||
Wells Fargo Center - St Cloud, MN | 6,400 | 869 | 8,373 | 1,430 | 869 | 9,803 | 10,672 | (1,795) | 2005 | 40 years | |||||||||
West River Business Park - Waite Park, MN | 626 | 235 | 1,195 | 50 | 235 | 1,245 | 1,480 | (291) | 2003 | 40 years | |||||||||
Westgate - Boise, ID | 4,254 | 1,000 | 10,618 | 1,911 | 1,000 | 12,529 | 13,529 | (3,100) | 2003 | 40 years | |||||||||
Whitewater Plaza - Minnetonka, MN | 3,900 | 530 | 4,860 | 784 | 577 | 5,597 | 6,174 | (1,552) | 2002 | 40 years | |||||||||
Wirth Corporate Center - Golden Valley, MN | 3,539 | 970 | 7,659 | 932 | 971 | 8,590 | 9,561 | (2,404) | 2002 | 40 years | |||||||||
Woodlands Plaza IV - Maryland Heights, MO | 4,360 | 771 | 4,609 | 917 | 837 | 5,460 | 6,297 | (847) | 2006 | 40 years | |||||||||
Total Commercial Office | $ | 352,415 | $ | 72,116 | $ | 470,800 | $ | 62,402 | $ | 74,017 | 531,301 | $ | 605,318 | $ | (121,422) | ||||
Commercial Medical | |||||||||||||||||||
2800 Medical Building - Minneapolis, MN | $ | 5,586 | $ | 204 | $ | 7,135 | $ | 2,184 | $ | 229 | $ | 9,294 | $ | 9,523 | $ | (1,962) | 2005 | 40 years | |
2828 Chicago Avenue - Minneapolis, MN | 8,529 | 726 | 11,319 | 5,627 | 729 | 16,943 | 17,672 | (2,141) | 2007 | 40 years | |||||||||
Airport Medical - Bloomington, MN | 1,372 | 0 | 4,678 | 0 | 0 | 4,678 | 4,678 | (1,380) | 2002 | 40 years | |||||||||
Barry Pointe Office Park - Kansas City, MO | 1,466 | 384 | 2,366 | 104 | 392 | 2,462 | 2,854 | (328) | 2007 | 40 years | |||||||||
Table of Contents
INVESTORS REAL ESTATE TRUST AND SUBSIDIARIES
April 30, 2012
Schedule III - REAL ESTATE AND ACCUMULATED DEPRECIATION (in thousands)
Initial Cost to Company | Gross amount at which carried at close of period | ||||||||||||||||||
Description | Encumbrances (a) | Land | Buildings & Improvements | Costs capitalized subsequent to acquisition | Land | Buildings & Improvements | Total | Accumulated Depreciation | Date of Construction or Acquisition | Life on which depreciation in latest income statement is computed | |||||||||
Commercial Medical - continued | |||||||||||||||||||
Billings 2300 Grant Road - Billings, MT | $ | 1,820 | $ | 649 | $ | 1,216 | $ | 0 | $ | 649 | $ | 1,216 | $ | 1,865 | $ | (54) | 2010 | 40 years | |
Burnsville 303 Nicollet Medical (Ridgeview) - Burnsville, MN | 8,610 | 1,071 | 6,842 | 1,394 | 1,071 | 8,236 | 9,307 | (790) | 2008 | 40 years | |||||||||
Burnsville 305 Nicollet Medical (Ridgeview South) - Burnsville, MN | 5,390 | 189 | 5,127 | 678 | 189 | 5,805 | 5,994 | (586) | 2008 | 40 years | |||||||||
Casper 1930 E 12th Street (Park Place) - Casper, WY (1) | 0 | 439 | 5,780 | 162 | 439 | 5,942 | 6,381 | (367) | 2009 | 40 years | |||||||||
Casper 3955 E 12th Street (Meadow Wind) - Casper, WY (1) | 0 | 388 | 8,858 | 1,004 | 388 | 9,862 | 10,250 | (433) | 2009 | 40 years | |||||||||
Cheyenne 4010 N College Drive (Aspen Wind) - Cheyenne, WY (1) | 0 | 628 | 10,272 | 260 | 629 | 10,531 | 11,160 | (625) | 2009 | 40 years | |||||||||
Cheyenne 4606 N College Drive (Sierra Hills) - Cheyenne, WY (1) | 0 | 695 | 7,455 | 39 | 695 | 7,494 | 8,189 | (448) | 2009 | 40 years | |||||||||
Denfeld Clinic - Duluth, MN | 1,760 | 501 | 2,597 | 1 | 501 | 2,598 | 3,099 | (523) | 2004 | 40 years | |||||||||
Eagan 1440 Duckwood Medical - Eagan, MN | 1,854 | 521 | 1,547 | 519 | 521 | 2,066 | 2,587 | (353) | 2008 | 40 years | |||||||||
Edgewood Vista - Belgrade, MT | 0 | 35 | 779 | 0 | 35 | 779 | 814 | (80) | 2008 | 40 years | |||||||||
Edgewood Vista - Billings, MT | 1,967 | 115 | 1,782 | (15) | 115 | 1,767 | 1,882 | (186) | 2008 | 40 years | |||||||||
Edgewood Vista - Bismarck, ND | 5,492 | 511 | 9,193 | 36 | 511 | 9,229 | 9,740 | (1,526) | 2005 | 40 years | |||||||||
Edgewood Vista - Brainerd, MN | 5,427 | 587 | 8,999 | 34 | 587 | 9,033 | 9,620 | (1,494) | 2005 | 40 years | |||||||||
Edgewood Vista - Columbus, NE (1) | 0 | 43 | 824 | 0 | 43 | 824 | 867 | (85) | 2008 | 40 years | |||||||||
Edgewood Vista - East Grand Forks, MN | 2,997 | 290 | 1,383 | (31) | 290 | 1,352 | 1,642 | (143) | 2000 | 40 years | |||||||||
Edgewood Vista - Fargo, ND | 13,310 | 775 | 20,870 | 0 | 775 | 20,870 | 21,645 | (2,152) | 2008 | 40 years | |||||||||
Edgewood Vista - Fremont, NE | 609 | 56 | 490 | 42 | 56 | 532 | 588 | (141) | 2008 | 40 years | |||||||||
Edgewood Vista - Grand Island, NE (1) | 0 | 33 | 773 | 1 | 33 | 774 | 807 | (80) | 2000 | 40 years | |||||||||
Edgewood Vista - Hastings, NE | 628 | 49 | 517 | 40 | 49 | 557 | 606 | (153) | 2008 | 40 years | |||||||||
Edgewood Vista - Hermantown I, MN | 16,836 | 288 | 9,871 | 1,501 | 288 | 11,372 | 11,660 | (3,020) | 2000 | 40 years | |||||||||
Edgewood Vista - Hermantown II, MN | 6,290 | 719 | 10,517 | 33 | 719 | 10,550 | 11,269 | (1,745) | 2005 | 40 years | |||||||||
Edgewood Vista - Kalispell, MT | 629 | 70 | 502 | 72 | 70 | 574 | 644 | (149) | 2001 | 40 years | |||||||||
Edgewood Vista - Minot, ND | 9,674 | 1,045 | 11,590 | 0 | 1,045 | 11,590 | 12,635 | (423) | 2010 | 40 years | |||||||||
Edgewood Vista - Missoula, MT | 894 | 109 | 854 | 36 | 109 | 890 | 999 | (335) | 1996 | 40 years | |||||||||
Edgewood Vista - Norfolk, NE (1) | 0 | 42 | 722 | 0 | 42 | 722 | 764 | (74) | 2008 | 40 years | |||||||||
Edgewood Vista - Omaha, NE | 398 | 89 | 547 | 40 | 89 | 587 | 676 | (156) | 2001 | 40 years | |||||||||
Edgewood Vista - Sioux Falls, SD | 1,127 | 314 | 1,001 | (26) | 314 | 975 | 1,289 | (103) | 2008 | 40 years | |||||||||
Edgewood Vista - Spearfish, SD | 3,419 | 315 | 8,584 | 43 | 317 | 8,625 | 8,942 | (1,054) | 2005 | 40 years | |||||||||
Edgewood Vista - Virginia, MN | 14,322 | 246 | 11,823 | 77 | 246 | 11,900 | 12,146 | (2,758) | 2002 | 40 years | |||||||||
Edina 6363 France Medical - Edina, MN (1) | 0 | 0 | 12,675 | 1,527 | 0 | 14,202 | 14,202 | (1,848) | 2008 | 40 years | |||||||||
Edina 6405 France Medical - Edina, MN | 9,073 | 0 | 12,201 | 0 | 0 | 12,201 | 12,201 | (1,664) | 2008 | 40 years | |||||||||
Table of Contents
INVESTORS REAL ESTATE TRUST AND SUBSIDIARIES
April 30, 2012
Schedule III - REAL ESTATE AND ACCUMULATED DEPRECIATION (in thousands)
Initial Cost to Company | Gross amount at which carried at close of period | Life on which depreciation in latest income statement is computed | |||||||||||||||||
Description | Encumbrances (a) | Land | Buildings & Improvements | Costs capitalized subsequent to acquisition | Land | Buildings & Improvements | Total | Accumulated Depreciation | Date of Construction or Acquisition | ||||||||||
Commercial Medical - continued | |||||||||||||||||||
Edina 6517 Drew Avenue - Edina, MN | $ | 1,164 | $ | 353 | $ | 660 | $ | 529 | $ | 372 | $ | 1,170 | $ | 1,542 | $ | (401) | 2002 | 40 years | |
Edina 6525 Drew Avenue - Edina, MN | 0 | 388 | 117 | 0 | 388 | 117 | 505 | (2) | 2011 | 40 years | |||||||||
Edina 6525 France SMC II - Edina, MN | 10,339 | 755 | 8,054 | 5,945 | 1,003 | 13,751 | 14,754 | (4,603) | 2003 | 40 years | |||||||||
Edina 6545 France SMC I - Edina MN | 31,325 | 3,480 | 30,743 | 11,244 | 3,480 | 41,987 | 45,467 | (12,697) | 2001 | 40 years | |||||||||
Fresenius - Duluth, MN | 780 | 50 | 1,520 | 2 | 50 | 1,522 | 1,572 | (306) | 2004 | 40 years | |||||||||
Garden View - St. Paul, MN | 1,815 | 0 | 7,408 | 411 | 0 | 7,819 | 7,819 | (2,006) | 2002 | 40 years | |||||||||
Gateway Clinic - Sandstone, MN | 1,019 | 66 | 1,699 | 1 | 66 | 1,700 | 1,766 | (342) | 2004 | 40 years | |||||||||
Healtheast St John & Woodwinds - Maplewood & Woodbury, MN | 11,538 | 3,239 | 18,362 | 0 | 3,239 | 18,362 | 21,601 | (5,489) | 2000 | 40 years | |||||||||
High Pointe Health Campus - Lake Elmo, MN | 5,400 | 1,305 | 10,528 | 1,629 | 1,329 | 12,133 | 13,462 | (2,448) | 2004 | 40 years | |||||||||
Laramie 1072 N 22nd Street (Spring Wind) - Laramie, WY (1) | 0 | 406 | 6,634 | 17 | 406 | 6,651 | 7,057 | (396) | 2009 | 40 years | |||||||||
Mariner Clinic - Superior, WI | 2,229 | 0 | 3,781 | 83 | 20 | 3,844 | 3,864 | (768) | 2004 | 40 years | |||||||||
Minneapolis 701 25th Avenue Medical - Minneapolis, MN | 6,442 | 0 | 7,873 | 809 | 0 | 8,682 | 8,682 | (827) | 2008 | 40 years | |||||||||
Missoula 3050 Great Northern - Missoula, MT | 1,920 | 640 | 1,331 | 0 | 640 | 1,331 | 1,971 | (60) | 2010 | 40 years | |||||||||
Nebraska Orthopedic Hospital - Omaha, NE | 12,385 | 0 | 20,272 | 1,615 | 0 | 21,887 | 21,887 | (4,176) | 2004 | 40 years | |||||||||
Park Dental - Brooklyn Center, MN | 787 | 185 | 2,767 | 0 | 185 | 2,767 | 2,952 | (666) | 2002 | 40 years | |||||||||
Pavilion I - Duluth, MN | 5,873 | 1,245 | 8,898 | 31 | 1,245 | 8,929 | 10,174 | (1,767) | 2004 | 40 years | |||||||||
Pavilion II - Duluth, MN | 10,808 | 2,715 | 14,673 | 1,937 | 2,715 | 16,610 | 19,325 | (4,215) | 2004 | 40 years | |||||||||
Ritchie Medical Plaza - St Paul, MN | 6,686 | 1,615 | 7,851 | 1,252 | 1,647 | 9,071 | 10,718 | (1,608) | 2005 | 40 years | |||||||||
Sartell 2000 23rd Street South - Sartell, MN | 3,997 | 0 | 11,781 | 935 | 0 | 12,716 | 12,716 | (3,133) | 2002 | 40 years | |||||||||
Spring Creek-American Falls - American Falls, ID | 2,438 | 145 | 3,870 | 0 | 145 | 3,870 | 4,015 | (68) | 2011 | 40 years | |||||||||
Spring Creek-Soda Springs - Soda Springs, ID | 878 | 66 | 2,134 | 33 | 66 | 2,167 | 2,233 | (38) | 2011 | 40 years | |||||||||
Spring Creek-Eagle - Eagle, ID | 2,243 | 263 | 3,775 | 0 | 263 | 3,775 | 4,038 | (66) | 2011 | 40 years | |||||||||
Spring Creek-Meridian - Meridian, ID | 3,706 | 424 | 6,724 | 0 | 424 | 6,724 | 7,148 | (117) | 2011 | 40 years | |||||||||
Spring Creek-Overland - Overland, ID | 3,448 | 687 | 5,941 | 0 | 687 | 5,941 | 6,628 | (107) | 2011 | 40 years | |||||||||
Spring Creek-Boise - Boise, ID | 3,054 | 708 | 4,296 | 0 | 708 | 4,296 | 5,004 | (80) | 2011 | 40 years | |||||||||
Spring Creek-Ustick - Meridian, ID | 0 | 467 | 3,833 | 0 | 467 | 3,833 | 4,300 | (63) | 2011 | 40 years | |||||||||
St Michael Clinic - St Michael, MN | 1,951 | 328 | 2,259 | 264 | 328 | 2,523 | 2,851 | (321) | 2007 | 40 years | |||||||||
Stevens Point - Stevens Point, WI | 9,797 | 442 | 3,888 | 10,495 | 442 | 14,383 | 14,825 | (1,977) | 2006 | 40 years | |||||||||
Trinity at Plaza 16 - Minot, ND | 5,111 | 568 | 8,270 | 697 | 568 | 8,967 | 9,535 | (137) | 2011 | 40 years | |||||||||
Wells Clinic - Hibbing, MN | 1,554 | 162 | 2,497 | 1 | 162 | 2,498 | 2,660 | (501) | 2004 | 40 years | |||||||||
Total Commercial Medical | $ | 278,166 | $ | 32,828 | $ | 414,128 | $ | 53,312 | $ | 33,210 | 467,058 | $ | 500,268 | $ | (78,744) | ||||
Table of Contents
INVESTORS REAL ESTATE TRUST AND SUBSIDIARIES
April 30, 2012
Schedule III - REAL ESTATE AND ACCUMULATED DEPRECIATION (in thousands)
Initial Cost to Company | Gross amount at which carried at close of period | Life on which depreciation in latest income statement is computed | ||||||||||||||||||
Description | Encumbrances (a) | Land | Buildings & Improvements | Costs capitalized subsequent to acquisition | Land | Buildings & Improvements | Total | Accumulated Depreciation | Date of Construction or Acquisition | |||||||||||
Commercial Industrial | ||||||||||||||||||||
API Building - Duluth, MN | $ | 868 | $ | 115 | $ | 1,605 | $ | 3 | $ | 115 | $ | 1,608 | $ | 1,723 | $ | (323) | 2004 | 40 years | ||
Bloomington 2000 W 94th Street - Bloomington, MN | 3,789 | 2,133 | 4,097 | 1,107 | 2,150 | 5,187 | 7,337 | (748) | 2006 | 40 years | ||||||||||
Bodycote Industrial Building - Eden Prairie, MN | 1,118 | 198 | 1,154 | 800 | 198 | 1,954 | 2,152 | (809) | 1992 | 40 years | ||||||||||
Brooklyn Park 7401 Boone Avenue - Brooklyn Park, MN | 6,172 | 1,368 | 11,643 | 2,121 | 1,368 | 13,764 | 15,132 | (3,367) | 2007 | 40 years | ||||||||||
Cedar Lake Business Center - St. Louis Park, MN | 2,334 | 895 | 2,810 | 66 | 895 | 2,876 | 3,771 | (363) | 2009 | 40 years | ||||||||||
Clive 2075 NW 94th Street - Clive, IA | 2,214 | 408 | 2,611 | 48 | 408 | 2,659 | 3,067 | (180) | 2002 | 40 years | ||||||||||
Dixon Avenue Industrial Park - Des Moines, IA | 7,028 | 1,439 | 10,758 | 1,611 | 1,439 | 12,369 | 13,808 | (3,177) | 2008 | 40 years | ||||||||||
Eagan 2785 & 2795 Highway 55 - Eagan, MN | 0 | 3,058 | 2,570 | 0 | 3,058 | 2,570 | 5,628 | (272) | 1999 | 40 years | ||||||||||
Fargo 1320 45th Street N - Fargo, ND (1) | 0 | 395 | 3,518 | 246 | 395 | 3,764 | 4,159 | (176) | 2010 | 40 years | ||||||||||
Lexington Commerce Center - Eagan, MN | 2,399 | 453 | 4,352 | 1,842 | 480 | 6,167 | 6,647 | (2,200) | 2004 | 40 years | ||||||||||
Lighthouse - Duluth, MN | 911 | 90 | 1,788 | 7 | 90 | 1,795 | 1,885 | (363) | 2002 | 40 years | ||||||||||
Metal Improvement Company - New Brighton, MN | 1,494 | 240 | 2,189 | 78 | 240 | 2,267 | 2,507 | (587) | 2009 | 40 years | ||||||||||
Minnetonka 13600 County Road 62 - Minnetonka, MN | 2,496 | 809 | 434 | 2,459 | 809 | 2,893 | 3,702 | (235) | 2006 | 40 years | ||||||||||
Roseville 2929 Long Lake Road - Roseville, MN | 5,572 | 1,966 | 7,272 | 1,722 | 2,000 | 8,960 | 10,960 | (1,235) | 1995 | 40 years | ||||||||||
Stone Container - Fargo, ND | 1,896 | 440 | 6,597 | 104 | 440 | 6,701 | 7,141 | (2,440) | 2001 | 40 years | ||||||||||
Stone Container - Roseville, MN | 4,500 | 810 | 7,440 | 202 | 830 | 7,622 | 8,452 | (1,952) | 2007 | 40 years | ||||||||||
Urbandale 3900 106th Street - Urbandale, IA | 10,800 | 3,680 | 10,089 | 493 | 3,721 | 10,541 | 14,262 | (1,414) | 2000 | 40 years | ||||||||||
Winsted Industrial Building - Winsted, MN | 394 | 100 | 901 | 48 | 100 | 949 | 1,049 | (320) | 2001 | 40 years | ||||||||||
Woodbury 1865 Woodlane - Woodbury, MN | 2,746 | 1,108 | 2,628 | 1,884 | 1,123 | 4,497 | 5,620 | (532) | 2007 | 40 years | ||||||||||
Total Commercial Industrial | $ | 56,731 | $ | 19,705 | $ | 84,456 | $ | 14,841 | $ | 19,859 | 99,143 | $ | 119,002 | $ | (20,693) | |||||
Commercial Retail | ||||||||||||||||||||
17 South Main - Minot, ND | $ | 83 | $ | 15 | $ | 75 | $ | 197 | $ | 17 | $ | 270 | $ | 287 | $ | (194) | 2000 | 40 years | ||
Anoka Strip Center - Anoka, MN | 0 | 123 | 602 | 25 | 134 | 616 | 750 | (143) | 2003 | 40 years | ||||||||||
Burnsville 1 Strip Center - Burnsville, MN | 393 | 208 | 773 | 207 | 208 | 980 | 1,188 | (229) | 2003 | 40 years | ||||||||||
Burnsville 2 Strip Center - Burnsville, MN | 312 | 291 | 469 | 214 | 294 | 680 | 974 | (172) | 2003 | 40 years | ||||||||||
Champlin South Pond - Champlin, MN | 1,604 | 842 | 2,703 | 58 | 866 | 2,737 | 3,603 | (576) | 2004 | 40 years | ||||||||||
Chan West Village - Chanhassen, MN | 13,396 | 5,035 | 14,665 | 1,895 | 5,606 | 15,989 | 21,595 | (3,846) | 2003 | 40 years | ||||||||||
Dakota West Plaza - Minot , ND | 372 | 92 | 493 | 30 | 106 | 509 | 615 | (80) | 2006 | 40 years | ||||||||||
Duluth Denfeld Retail - Duluth, MN | 2,435 | 276 | 4,699 | 122 | 297 | 4,800 | 5,097 | (976) | 2004 | 40 years | ||||||||||
Duluth NAPA - Duluth, MN | 737 | 130 | 1,800 | 4 | 131 | 1,803 | 1,934 | (362) | 2004 | 40 years | ||||||||||
Eagan Community - Eagan, MN | 1,342 | 702 | 1,588 | 877 | 703 | 2,464 | 3,167 | (564) | 2003 | 40 years | ||||||||||
Fargo Express Community - Fargo, ND | 991 | 374 | 1,420 | 695 | 386 | 2,103 | 2,489 | (354) | 2003-2005 | 40 years | ||||||||||
Forest Lake Auto - Forest Lake, MN (1) | 0 | 50 | 446 | 13 | 50 | 459 | 509 | (109) | 2003 | 40 years | ||||||||||
Table of Contents
INVESTORS REAL ESTATE TRUST AND SUBSIDIARIES
April 30, 2012
Schedule III - REAL ESTATE AND ACCUMULATED DEPRECIATION (in thousands)
Initial Cost to Company | Gross amount at which carried at close of period | ||||||||||||||||||
Description | Encumbrances (a) | Land | Buildings & Improvements | Costs capitalized subsequent to acquisition | Land | Buildings & Improvements | Total | Accumulated Depreciation | Date of Construction or Acquisition | Life on which depreciation in latest income statement is computed | |||||||||
Commercial Retail - continued | |||||||||||||||||||
Forest Lake Westlake Center - Forest Lake, MN | $ | 4,291 | $ | 2,446 | $ | 5,304 | $ | 487 | $ | 2,480 | $ | 5,757 | $ | 8,237 | $ | (1,336) | 2003 | 40 years | |
Grand Forks Carmike - Grand Forks, ND | 1,650 | 184 | 2,360 | 2 | 184 | 2,362 | 2,546 | (1,033) | 1994 | 40 years | |||||||||
Grand Forks Medpark Mall - Grand Forks, ND | 3,045 | 681 | 4,808 | 251 | 722 | 5,018 | 5,740 | (1,547) | 2000 | 40 years | |||||||||
Jamestown Buffalo Mall - Jamestown, ND | 2,710 | 566 | 4,962 | 3,112 | 950 | 7,690 | 8,640 | (1,237) | 2003 | 40 years | |||||||||
Jamestown Business Center - Jamestown, ND | 530 | 297 | 1,023 | 1,334 | 333 | 2,321 | 2,654 | (730) | 2003 | 40 years | |||||||||
Kalispell Retail Center - Kalispell, MT | 1,352 | 250 | 2,250 | 973 | 253 | 3,220 | 3,473 | (682) | 2003 | 40 years | |||||||||
Lakeville Strip Center - Lakeville, MN | 986 | 46 | 1,142 | 852 | 94 | 1,946 | 2,040 | (553) | 2003 | 40 years | |||||||||
Minot 1400 31st Ave - Minot, ND (1) | 0 | 1,026 | 6,143 | 4,256 | 1,026 | 10,399 | 11,425 | (440) | 2010 | 40 years | |||||||||
Minot Arrowhead - Minot, ND | 0 | 100 | 1,690 | 4,311 | 103 | 5,998 | 6,101 | (1,135) | 1973 | 15 1/2-40 years | |||||||||
Minot Plaza - Minot, ND | 812 | 50 | 453 | 147 | 80 | 570 | 650 | (275) | 1993 | 40 years | |||||||||
Monticello C Store - Monticello, MN (1) | 0 | 65 | 770 | 37 | 97 | 775 | 872 | (185) | 2003 | 40 years | |||||||||
Omaha Barnes & Noble - Omaha, NE | 2,559 | 600 | 3,099 | 0 | 600 | 3,099 | 3,699 | (1,278) | 1995 | 40 years | |||||||||
Pine City C-Store - Pine City, MN | 298 | 83 | 357 | 12 | 83 | 369 | 452 | (85) | 2003 | 40 years | |||||||||
Pine City Evergreen Square - Pine City, MN | 1,831 | 154 | 2,646 | 582 | 385 | 2,997 | 3,382 | (792) | 2003 | 40 years | |||||||||
Rochester Maplewood Square - Rochester, MN (1) | 0 | 3,275 | 8,610 | 1,399 | 3,652 | 9,632 | 13,284 | (2,924) | 1999 | 40 years | |||||||||
St. Cloud Westgate - St. Cloud, MN | 3,197 | 950 | 5,535 | 1,614 | 973 | 7,126 | 8,099 | (1,237) | 2004 | 40 years | |||||||||
Weston Retail - Weston, WI | 0 | 79 | 1,575 | 27 | 80 | 1,601 | 1,681 | (369) | 2003 | 40 years | |||||||||
Weston Walgreens - Weston, WI | 3,124 | 66 | 1,718 | 671 | 67 | 2,388 | 2,455 | (354) | 2006 | 40 years | |||||||||
Total Commercial Retail | $ | 48,050 | $ | 19,056 | $ | 84,178 | $ | 24,404 | $ | 20,960 | 106,678 | $ | 127,638 | $ | (23,797) | ||||
Subtotal | $ | 1,046,515 | $ | 182,115 | $ | 1,440,952 | $ | 268,942 | $ | 196,998 | $ | 1,695,011 | $ | 1,892,009 | $ | (373,490) | |||
Table of Contents
INVESTORS REAL ESTATE TRUST AND SUBSIDIARIES
April 30, 2012
Schedule III - REAL ESTATE AND ACCUMULATED DEPRECIATION (in thousands)
Initial Cost to Company | Gross amount at which carried at close of period | ||||||||||||||||||
Description | Encumbrances (a) | Land | Buildings & Improvements | Costs capitalized subsequent to acquisition | Land | Buildings & Improvements | Total | Accumulated Depreciation | Date of Construction or Acquisition | Life on which depreciation in latest income statement is computed | |||||||||
Unimproved Land | |||||||||||||||||||
Bismarck 2130 S 12th St - Bismarck, ND | $ | 0 | $ | 576 | $ | 0 | $ | 13 | $ | 589 | $ | 0 | $ | 589 | $ | 0 | 2008 | ||
Bismarck 700 E Main - Bismarck, ND | 0 | 314 | 0 | 557 | 871 | 0 | 871 | 0 | 2008 | ||||||||||
Eagan Unimproved Land - Eagan, MN | 0 | 423 | 0 | 0 | 423 | 0 | 423 | 0 | 2006 | ||||||||||
Georgetown Square - Grand Chute, WI | 2,174 | 1,860 | 0 | 0 | 1,860 | 0 | 1,860 | 0 | 2006 | ||||||||||
Kalispell Unimproved Land - Kalispell, MT | 0 | 1,400 | 0 | 24 | 1,411 | 13 | 1,424 | 0 | 2003 | ||||||||||
Monticello Unimproved Land - Monticello, MN | 0 | 115 | 0 | 2 | 117 | 0 | 117 | 0 | 2006 | ||||||||||
Renaissance Heights - Williston, ND | 0 | 4,600 | 0 | 0 | 4,600 | 0 | 4,600 | 0 | 2012 | ||||||||||
River Falls Unimproved Land - River Falls, WI | 0 | 176 | 0 | 4 | 179 | 1 | 180 | 0 | 2003 | ||||||||||
Urbandale Unimproved Land - Urbandale, IA | 0 | 5 | 0 | 109 | 114 | 0 | 114 | 0 | 2009 | ||||||||||
Weston Unimproved Land - Weston, WI | 0 | 812 | 0 | 0 | 812 | 0 | 812 | 0 | 2006 | ||||||||||
Total Unimproved Land | $ | 2,174 | $ | 10,281 | $ | 0 | $ | 709 | $ | 10,976 | $ | 14 | $ | 10,990 | $ | 0 | |||
Development in Progress | |||||||||||||||||||
1st Avenue Building - Minot, ND | $ | 0 | $ | 0 | $ | 0 | $ | 321 | $ | 0 | $ | 321 | $ | 321 | $ | 0 | 1981 | ||
Chateau 2nd Floor Renovation - Minot, ND | 0 | 0 | 0 | 1,407 | 0 | 1,407 | 1,407 | 0 | 1998 | ||||||||||
Jamestown Medical Office Building - Jamestown, ND | 0 | 0 | 3 | 1,608 | 0 | 1,611 | 1,611 | 0 | 2012 | ||||||||||
Laramie 1072 Expansion - Laramie, WY | 0 | 0 | 0 | 1,810 | 0 | 1,810 | 1,810 | 0 | 2009 | ||||||||||
Minot Arrowhead Outlot - Minot, ND | 0 | 0 | 75 | 0 | 0 | 75 | 75 | 0 | 2011 | ||||||||||
Minot IPS - Minot, ND | 0 | 416 | 63 | 1,771 | 416 | 1,834 | 2,250 | 0 | 2012 | ||||||||||
Quarry Ridge 2 - Rochester, MN | 0 | 942 | 12,037 | 2,457 | 942 | 14,494 | 15,436 | 0 | 2011 | ||||||||||
Williston Garden - Williston, ND | 0 | 700 | 154 | 3,835 | 700 | 3,989 | 4,689 | 0 | 2011 | ||||||||||
Total Development in Progress | $ | 0 | $ | 2,058 | $ | 12,332 | $ | 13,209 | $ | 2,058 | $ | 25,541 | $ | 27,599 | $ | 0 | |||
Total | $ | 1,048,689 | $ | 194,454 | $ | 1,453,284 | $ | 282,860 | $ | 210,032 | $ | 1,720,566 | $ | 1,930,598 | $ | (373,490) | |||
(a) | Amounts in this column are the mortgages payable balances as of April 30, 2012. These amounts do not include amounts owing under the Company's multi-bank line of credit or under the Company's construction loans. |
(1) | As of April 30, 2012, this property was included in the collateral pool securing the Company's $60.0 million multi-bank line of credit. The Company may add and remove eligible properties from the collateral pool if certain minimum collateral requirements are satisfied. Advances under the facility may not exceed 60% of the value of properties provided as security. |
2012 Annual Report F-43
Table of Contents
INVESTORS REAL ESTATE TRUST AND SUBSIDIARIES
April 30, 2012
Schedule III
REAL ESTATE AND ACCUMULATED DEPRECIATION
Reconciliations of total real estate carrying value for the three years ended April 30, 2012, 2011, and 2010 are as follows:
| (in thousands) | |||||||||||
| 2012 | 2011 | 2010 | |||||||||
Balance at beginning of year | $ | 1,770,798 | $ | 1,800,519 | $ | 1,729,585 | ||||||
Additions during year | ||||||||||||
Multi-Family Residential | 47,433 | 4,210 | 4,270 | |||||||||
Commercial Office | 0 | 6,836 | 2,096 | |||||||||
Commercial Medical | 47,408 | 19,249 | 38,125 | |||||||||
Commercial Industrial | 0 | 3,914 | 3,066 | |||||||||
Commercial Retail | 2,316 | 7,169 | 0 | |||||||||
Improvements and Other | 35,176 | 23,183 | 29,343 | |||||||||
| 1,903,131 | 1,865,080 | 1,806,485 | ||||||||||
Deductions during year | ||||||||||||
Cost of real estate sold | (3,498 | ) | (86,994 | ) | (1,217 | ) | ||||||
Impairment charge | (127 | ) | 0 | (1,678 | ) | |||||||
Other (A) | (7,497 | ) | (7,288 | ) | (3,071 | ) | ||||||
Balance at close of year (B) | $ | 1,892,009 | $ | 1,770,798 | $ | 1,800,519 | ||||||
Reconciliations of accumulated depreciation/amortization for the three years ended April 30, 2012, 2011, and 2010, are as follows:
| (in thousands) | |||||||||||
| 2012 | 2011 | 2010 | |||||||||
Balance at beginning of year | $ | 328,952 | $ | 308,626 | $ | 262,871 | ||||||
Additions during year | ||||||||||||
Provisions for depreciation | 51,093 | 49,375 | 48,152 | |||||||||
Deductions during year | ||||||||||||
Accumulated depreciation on real estate sold | (758 | ) | (25,366 | ) | (737 | ) | ||||||
Other (C) | (5,797 | ) | (3,683 | ) | (1,660 | ) | ||||||
Balance at close of year | $ | 373,490 | $ | 328,952 | $ | 308,626 | ||||||
(A) | Consists of miscellaneous disposed assets and assets moved to Development in Progress. |
(B) | The net basis of the Company's real estate investments for Federal Income Tax purposes was approximately $1.4 billion, $1.2 billion and $1.3 billion at April 30, 2012, 2011 and 2010, respectively. |
(C) | Consists of miscellaneous disposed assets. |
2012 Annual Report F-44
Table of Contents
| Exhibit Index |
3.1 | Articles of Amendment and Third Restated Declaration of Trust of Investors Real Estate Trust , as amended, incorporated herein by reference to Exhibit 3.1 to the Company's Registration Statement on Form S-3 (Reg. No. 333-182451), filed with the SEC on June 29, 2012. |
3.2 | Third Restated Trustees' Regulations (Bylaws), dated May 16, 2007, and incorporated herein by reference to the Company's Current Report on Form 8-K , filed with the SEC on May 16, 2007. |
3.3 | Agreement of Limited Partnership of IRET Properties, A North Dakota Limited Partnership, dated January 31, 1997, filed as Exhibit 3(ii) to the Registration Statement on Form S-11, effective March 14, 1997 (SEC File No. 333-21945) filed for the Registrant on February 18, 1997 (File No. 0-14851), and incorporated herein by reference. |
4.1 | Loan Agreement dated August 12, 2010 by and among IRET Properties, as borrower, the financial institutions party thereto as lenders, and First International Bank & Trust as lender and lead bank, incorporated herein by reference to the Company's Current Report on Form 8-K, filed with the SEC on August 18, 2010. |
4.2 | Third Amendment to Loan Agreement dated June 15, 2012 by and between IRET Properties, as borrower, and First International Bank & Trust, as lender, incorporated herein by reference to the Company's Current Report on Form 8-K, filed with the SEC on June 22, 2012. |
10.1 | Member Control and Operating Agreement dated September 30, 2002, filed as Exhibit 10 to the Company's Form 8-K filed October 15, 2003, and incorporated herein by reference. |
10.2 | Letter Agreement dated January 31, 2003, filed as Exhibit 10(i) to the Company's Form 8-K filed February 27, 2003, and incorporated herein by reference. |
10.3 | Option Agreement dated January 31, 2003, filed as Exhibit 10(ii) to the Company's Form 8-K filed February 27, 2003, and incorporated herein by reference. |
10.4 | Financial Statements of T.F. James Company filed as Exhibit 10 to the Company's Form 8-K filed January 31, 2003, and incorporated herein by reference. |
10.5 | Agreement for Purchase and Sale of Property dated February 13, 2004, by and between IRET Properties and the Sellers specified therein, filed as Exhibit 10.5 to the Company's Form 10-K filed July 20, 2004, and incorporated herein by reference. |
10.6 | Contribution Agreement, filed as Exhibit 10.1 to the Company's Form 8-K filed May 17, 2006, and incorporated herein by reference. |
10.7 | Loan and Security Agreement, filed as Exhibit 10.1 to the Company's Current Report on Form 8-K filed September 18, 2006, and incorporated herein by reference. |
10.8* | Short-Term Incentive Program, filed as Exhibit 10.1 to the Company's Form 8-K filed June 4, 2012 and incorporated herein by reference. |
10.9* | Long-Term Incentive Program, filed as Exhibit 10.2 to the Company's Form 8-K filed June 4, 2012 and incorporated herein by reference. |
10.10* | Description of Compensation of Trustees and Named Executive Officers, as described in 5.02 in the Company's Form 8-K filed June 4, 2012 and incorporated herein by reference. |
12.1 | Computation of Ratio of Earnings to Fixed Charges and Earnings to Combined Fixed Charges and Preferred Share Dividends, filed herewith. |
21.1 | Subsidiaries of Investors Real Estate Trust, filed herewith. |
23.1 | Consent of Independent Registered Public Accounting Firm, filed herewith. |
2012 Annual Report
Table of Contents
31.1 | Section 302 Certification of President and Chief Executive Officer, filed herewith. |
31.2 | Section 302 Certification of Senior Vice President and Chief Financial Officer, filed herewith. |
32.1 | Section 906 Certification of the President and Chief Executive Officer, filed herewith. |
32.2 | Section 906 Certification of the Senior Vice President and Chief Financial Officer, filed herewith. |
101 | The following materials from our Annual Report on Form 10-K for the year ended April 30, 2012 formatted in eXtensible Business Reporting Language ("XBRL"): (i) the Consolidated Balance Sheets, (ii) the Consolidated Statements of Operations, (iii) the Consolidated Statements of Equity, (iv) the Consolidated Statements of Cash Flows, and (v) notes to these consolidated financial statements. (1) |
________________________
* | Indicates management compensatory plan, contract or arrangement. |
(1) | Users of this data are advised pursuant to Rule 406T of Regulation S-T that these interactive data files are deemed not filed or part of a registration statement or prospectus for purposes of Sections 11 or 12 of the Securities Act, are deemed not filed for purposes of Section 18 of the Exchange Act, and otherwise are not subject to liability under these sections. |
2012 Annual Report
Table of Contents