UNITED STATES
SECURITIES AND EXCHANGE COMMISSION
WASHINGTON, D.C. 20549
FORM 10-K
ANNUAL REPORT PURSUANT TO SECTION 13 OR 15(d) OF THE |
SECURITIES EXCHANGE ACT OF 1934 |
For the fiscal year ended December 31, 2017 |
|
OR |
|
TRANSITION REPORT PURSUANT TO SECTION 13 OR 15(d) OF THE |
SECURITIES EXCHANGE ACT OF 1934 |
For the transition period from ________________ to ________________ |
Commission file number: 1-35335
Groupon, Inc.
(Exact name of registrant as specified in its charter)
Delaware |
| 27-0903295 |
(State or other jurisdiction of |
| (I.R.S. Employer |
incorporation or organization) |
| Identification No.) |
|
|
|
600 West Chicago Avenue, Suite 400 Chicago, Illinois |
| 60654 |
(Address of principal executive offices) |
| (Zip Code) |
312-334-1579
(Registrant's telephone number, including area code)
Securities registered pursuant to Section 12(b) of the Act:
Title of each class |
| Name of each exchange on which registered |
Common Stock, par value $0.0001 |
| Nasdaq Global Select Market |
Securities registered pursuant to Section 12(g) of the Act: None
Indicate by check mark if the registrant is a well-known seasoned issuer, as defined in Rule 405 of the Securities Act.
Yes x | No ¨ |
Indicate by check mark if the registrant is not required to file reports pursuant to Section 13 or Section 15(d) of the Act.
Yes ¨ No x
Indicate by check mark whether the registrant (1) has filed all reports required to be filed by Section 13 or 15(d) of the Securities Exchange Act of 1934 during the preceding 12 months (or for such shorter period that the registrant was required to file such reports), and (2) has been subject to such filing requirements for the past 90 days.
Yes x No ¨
Indicate by check mark whether the registrant has submitted electronically and posted on its corporate website, if any, every Interactive Data File required to be submitted and posted pursuant to Rule 405 of Regulation S-T (§ 232.405 of this chapter) during the preceding 12 months (or for such shorter period that the registrant was required to submit and post such files).
Yes x No ¨
Indicate by check mark if disclosure of delinquent filers pursuant to Item 405 of Regulation S-K (§ 229.405 of this chapter) is not contained herein, and will not be contained, to the best of registrant's knowledge, in definitive proxy or information statements incorporated by reference in Part III of this Form 10-K or any amendment to this Form 10-K. o
Indicate by check mark whether the registrant is a large accelerated filer, an accelerated filer, a non-accelerated filer, a smaller reporting company, or an emerging growth company. See the definitions of "large accelerated filer," "accelerated filer," "smaller reporting company," and "emerging growth company" in Rule 12b-2 of the Exchange Act.
Large accelerated filer x Accelerated filer ¨
Non-accelerated filer (Do not check if a smaller reporting company) ¨ Smaller reporting company ¨
Emerging growth company ¨
If an emerging growth company, indicate by check mark if the registrant has elected not to use the extended transition period for complying with any new or revised financial accounting standards provided pursuant to Section 13(a) of the Exchange Act. ☐
Indicate by check mark whether the registrant is a shell company (as defined in Rule 12b-2 of the Exchange Act).
Yes ¨ No x
As of June 30, 2017, the aggregate market value of shares held by non-affiliates of the registrant was $1,597,986,820 based on the number of shares of common stock held by non-affiliates as of June 30, 2017 and based on the last reported sale price of the registrant's common stock on June 30, 2017.
As of February 12, 2018, there were 561,532,375 shares of the registrant's common stock outstanding.
DOCUMENTS INCORPORATED BY REFERENCE
The information required by Part III of this Report, to the extent not set forth herein, is incorporated herein by reference from the registrant's definitive proxy statement relating to the Annual Meeting of Stockholders to be held in 2018 , which definitive proxy statement shall be filed with the Securities and Exchange Commission within 120 days after the end of the fiscal year to which this Report relates.
1
TABLE OF CONTENTS
PART I | Page |
Forward-Looking Statements | 3 |
Item 1. Business | 3 |
Item 1A. Risk Factors | 10 |
Item 1B. Unresolved Staff Comments | 28 |
Item 2. Properties | 28 |
Item 3. Legal Proceedings | 28 |
Item 4. Mine Safety Disclosures | 28 |
PART II |
|
Item 5. Market for Registrant's Common Equity, Related Stockholder Matters and Issuer Purchases of Equity Securities | 29 |
Item 6. Selected Financial Data | 32 |
Item 7. Management's Discussion and Analysis of Financial Condition and Results of Operations | 34 |
Item 7A. Quantitative and Qualitative Disclosure about Market Risk | 70 |
Item 8. Financial Statements and Supplementary Data | 71 |
Item 9. Changes in and Disagreements With Accountants on Accounting and Financial Disclosure | 172 |
Item 9A. Controls and Procedures | 172 |
Item 9B. Other Information | 174 |
PART III |
|
Item 10. Directors, Executive Officers and Corporate Governance | 175 |
Item 11. Executive Compensation | 175 |
Item 12. Security Ownership of Certain Beneficial Owners and Management and Related Stockholder Matters | 175 |
Item 13. Certain Relationships and related Transactions, and Director Independence | 175 |
Item 14. Principal Accountant Fees and Services | 175 |
Part IV |
|
Item 15. Exhibits and Financial Statement Schedule | 176 |
______________________________________________________
2
PART I
FORWARD-LOOKING STATEMENTS
This Annual Report on Form 10-K contains forward-looking statements within the meaning of Section 27A of the Securities Act of 1933, as amended, and Section 21E of the Securities Exchange Act of 1934, as amended, including statements regarding our future results of operations and financial position, business strategy and plans and our objectives for future operations. The words "may," "will," "should," "could," "expect," "anticipate," "believe," "estimate," "intend," "continue" and other similar expressions are intended to identify forward-looking statements. We have based these forward looking statements largely on current expectations and projections about future events and financial trends that we believe may affect our financial condition, results of operations, business strategy, short-term and long-term business operations and objectives, and financial needs. These forward-looking statements involve risks and uncertainties that could cause our actual results to differ materially from those expressed or implied in our forward-looking statements. Such risks and uncertainties include, but are not limited to, risk related to volatility in our operating results; execution of our business and marketing strategies; retaining existing customers and adding new customers; challenges arising from our international operations, including fluctuations in currency exchange rates, legal and regulatory developments and any potential adverse impact from the United Kingdom's likely exit from the European Union; retaining and adding high quality merchants; our voucherless offerings; cybersecurity breaches; competing successfully in our industry; changes to merchant payment terms; providing a strong mobile experience for our customers; maintaining our information technology infrastructure; delivery and routing of our emails; claims related to product and service offerings; managing inventory and order fulfillment risks; litigation; managing refund risks; retaining and attracting members of our executive team; completing and realizing the anticipated benefits from acquisitions, dispositions, joint ventures and strategic investments; lack of control over minority investments; tax liabilities; tax legislation; compliance with domestic and foreign laws and regulations, including the CARD Act, GDPR and regulation of the Internet and e-commerce; classification of our independent contractors; protecting our intellectual property; maintaining a strong brand; customer and merchant fraud; payment-related risks; our ability to raise capital if necessary and our outstanding indebtedness; global economic uncertainty; our common stock, including volatility in our stock price; our senior convertible notes; our ability to realize the anticipated benefits from the hedge and warrant transactions; and those risks and other factors discussed in Item 1A. Risk Factors of this Annual Report on Form 10-K, as well as in our consolidated financial statements, related notes, and the other financial information appearing elsewhere in this report and our other filings with the Securities and Exchange Commission, or the SEC. Moreover, we operate in a very competitive and rapidly changing environment. New risks emerge from time to time. It is not possible for our management to predict all risks, nor can we assess the impact of all factors on our business or the extent to which any factor, or combination of factors, may cause actual results to differ materially from those contained in any forward-looking statements we may make. We do not intend, and undertake no obligation, to update any of our forward-looking statements after the date of this report to reflect actual results or future events or circumstances. Given these risks and uncertainties, readers are cautioned not to place undue reliance on such forward-looking statements.
As used herein, "Groupon," "we," "our," and similar terms include Groupon, Inc. and its subsidiaries, unless the context indicates otherwise.
ITEM 1: BUSINESS
Overview
Groupon is a global leader in local commerce, making it easy for people around the world to search and discover great businesses and merchandise. Our vision is to connect local commerce, increasing consumer buying power while driving more business to merchants through price and discovery. We want Groupon to be the destination that consumers check first when they are out and about; the place they start when they are looking to buy just about anything, anywhere, anytime. We provide consumers with savings and help them discover what to do, eat, see, buy and where to travel. By bringing the brick and mortar world of local commerce onto the Internet, Groupon is helping local merchants to attract customers and sell goods and services.
Groupon operates online local commerce marketplaces throughout the world that connect merchants to consumers by offering goods and services, generally at a discount. Consumers access those marketplaces through our websites, primarily localized groupon.com sites in many countries, and our mobile applications. More than two-thirds of the transactions on our platform are completed on mobile devices.
Our operations are organized into two segments: North America and International. We offer goods and services through our marketplaces in three primary categories: Local Deals ("Local"), Groupon Goods ("Goods") and Groupon Getaways ("Travel").
3
We act as a marketing agent primarily by selling vouchers ("Groupons") that can be redeemed for products or services with third-party merchants. We also sell merchandise inventory directly to customers.
Our results from 2017 were impacted by the strategic initiatives discussed in Item 7, Management's Discussion and Analysis of Financial Condition and Results of Operations . Those results include the following:
• | Gross billings decreased to $5.6 billion in 2017 , as compared to $5.7 billion in 2016 . In 2017 , 69.6% and 30.4% of our gross billings were generated in North America and International, respectively, as compared to 69.2% and 30.8% in 2016 . Gross billings represent the total dollar value of customer purchases of goods and services. Gross billings differs from our revenue, which is presented net of the merchant's share of the transaction price for transactions in which we act as a third-party marketing agent. Gross billings and revenue are the same for transactions in which we sell merchandise inventory directly to customers. |
• | Revenue decreased to $2.8 billion in 2017 , as compared to $3.0 billion in 2016 . In 2017 , 67.3% and 32.7% of our revenue was generated in North America and International, respectively, as compared to 71.4% and 28.6% in 2016 . |
• | Gross profit of $1.3 billion in 2017 was consistent with the prior year. In 2017 , 69.5% and 30.5% of our gross profit was generated in North America and International, respectively, as compared to 69.1% and 30.9% in 2016 . |
• | Income from operations was $29.4 million in 2017 , as compared to a loss from operations of $100.2 million in 2016 . |
• | The number of active customers, which is defined as unique user accounts that have made a purchase within the last 12 months either through one of our online marketplaces or directly with a merchant for which we earned a commission, increased to 49.5 million as o f December 31, 2017 from 47.9 million as of December 31, 2016 . |
We are a Delaware corporation, incorporated on January 15, 2008 under the name "ThePoint.com, Inc." We started Groupon in October 2008 and officially changed our name to Groupon, Inc. by filing an amended certificate of incorporation on June 16, 2009. Our principal executive offices are located at 600 West Chicago Avenue, Suite 400, Chicago, Illinois 60654, and our telephone number at this address is (312) 334-1579. Our investor relations department can be reached through our investor relations hotline, which is (312) 999-3098. Our website is www.groupon.com . Information contained on our website is not a part of this Annual Report on Form 10-K. We completed our initial public offering in November 2011 and our common stock is listed on the Nasdaq Global Select Market under the symbol "GRPN."
GROUPON, the GROUPON logo and other GROUPON-formative marks are trademarks of Groupon, Inc. in the United States or other countries. This Annual Report on Form 10-K also includes other trademarks of Groupon and trademarks of other persons.
Our Strategy
Our goal is to continue to build marketplaces that our customers rely on to discover and save on amazing things to do, eat, see, buy and where to travel. Key elements of our strategy for 2018 include the following:
Grow long-term customer value. Our activities to grow long-term customer value are primarily focused on initiatives to improve the customer experience and marketing activities. We intend to improve the customer experience by continuing to invest in new products and technologies that will create a frictionless experience for our customers and merchants. As we continue to build out our marketplaces, we want our customers to have a superior, frictionless experience when they use our product whether finding, booking, buying or redeeming an offer. For merchants, this includes providing capabilities to manage demand for their goods and services and improving their ability to acquire customers. For consumers, this includes easily finding offers and accessing features that augment the overall experience, as well as seamlessly purchasing and redeeming offers. We are currently investing in initiatives to improve the purchase and redemption experience, such as enhancing our mobile applications, testing offerings with voucherless redemption resulting in cash back directly to customers' credit cards, which we refer to as Groupon+, and adding direct booking tools, including for health and beauty offerings. We believe that those initiatives may ultimately increase customer purchase frequency and drive growth in our business. Our marketing activities are critical to our ability to increase our global active customer base and improve gross profit per customer. We significantly increased our global marketing spend throughout 2016 and 2017 in order to drive customer growth and we expect that trend to continue. Our online marketing campaigns are primarily focused on customer acquisition, customer retention and driving repeat purchase behavior. We are focusing our offline
4
advertising activities on developing our brand strength and increasing awareness of our product and service offerings. We also use order discounts and other promotional initiatives to drive customer acquisition, activation and purchasing activity.
Building out a more extensive local commerce marketplace platform. We ultimately want Groupon to become a daily habit for our customers. In order to achieve that long-term aspiration, we believe that we need to significantly increase the offerings available through our online local commerce marketplaces to ensure that our customers can consistently find what they are looking for. Our initiatives to grow our inventory of deal offerings include entering into commercial agreements with third parties that enable us to feature additional merchant offerings through our marketplaces, identifying new distribution channels through which to sell our marketplace offerings and launching an internal initiative to optimize the activities performed by our sales teams. Additionally, we believe that our efforts to increase our active customer base and improve gross profit per customer may improve the health of our marketplaces, making our marketing and promotional services more effective for the merchants who feature offerings on our platform.
Unlocking the potential of our international markets. From 2015 to 2017, we reduced our global operating footprint from 47 countries to the 15 core countries that we believe have the greatest potential to favorably impact our results of operations. The gross profit generated by our International segment represented only 30.5% of our consolidated gross profit in 2017, and we are maintaining a long-term focus on driving International to ultimately achieve gross profit that is more comparable to North America. Our initiatives to grow International gross profit include increasing our international marketing spending, investing in more technology resources in order to expand and advance its product and service offerings, growing our inventory of deal offerings by entering into commercial agreements with third parties that enable us to feature additional merchant offerings through our marketplaces and other initiatives.
Our Business
We earn revenue from transactions in which we provide marketing services primarily by selling vouchers through our online local marketplaces that can be redeemed for goods or services with third-party merchants. Our third-party revenue from those transactions is reported on a net basis as the purchase price received from the customer for the voucher less an agreed upon portion of the purchase price paid to the merchant. We also earn revenue by selling merchandise inventory directly to customers through our online marketplaces. Our direct revenue from those transactions is the purchase price received from the customer.
Our business model has evolved in recent years from primarily an email-based "push" model with a limited number of deals offered at any given time to more extensive online "pull" marketplaces, where customers can come to Groupon's websites and mobile applications to search and browse for deals on goods and services. We also publish ratings and helpful tips from customers to highlight the unique aspects of local merchants, including merchants that have featured offerings through our marketplaces.
We offer goods and services through our online local marketplaces in three primary categories: Local, Goods and Travel. Collectively, Local and Travel comprise our "Services" offerings and Goods reflects our product offerings.
Local. Our Local category includes offerings from local and national merchants, as well as local events. Local also includes other revenue sources such as commission revenue and advertising revenue, as these revenue sources are primarily generated through our relationships with local and national merchants. Our local offerings comprise multiple subcategories, including events and activities, beauty and spa, health and fitness, food and drink, home and garden and automotive. National merchants also have used our marketplaces as an alternative to traditional marketing and brand advertising. Although our business today is weighted toward offerings from local merchants, we continue to feature offerings from national merchants to build our brand awareness, acquire new customers and generate additional revenue. In addition to local and national deals, we give consumers the ability to access digital coupons from thousands of retailers through our Coupons offering. We also offer deals on concerts, sports, theater and other live entertainment events. We are increasingly featuring offerings on our site from other online marketplaces to further expand local offerings.
Goods. In our Goods category, we earn direct revenue from transactions in which we sell merchandise inventory directly to customers, as well as third-party revenue from transactions in which third-party merchants sell products to customers through our marketplaces. Our Goods category offers customers the ability to find discounted merchandise across multiple product lines, including electronics, sporting goods, jewelry, toys, household items and apparel. We expect that we will continue to add new brands to our platform in order to expand our offerings.
Travel . Through our Travel category, we feature travel offers at both discounted and market rates, including hotels, airfare and package deals covering both domestic and international travel. For many of our travel offerings, the customer must contact
5
the merchant directly to make a travel reservation after purchasing a travel voucher from us. However, for some of our hotel offerings, customers make room reservations directly through our websites.
Distribution
Our customers access our online local commerce marketplaces through our mobile applications and our websites, which primarily consist of localized groupon.com sites in countries throughout the world . We use a variety of marketing channels to direct customers to the deal offerings available through these marketplaces, as described in the Marketing section below.
Consumers predominately access our offerings through our mobile applications and, to a lesser extent, through mobile web browsers. Our applications and mobile websites enable consumers to browse, purchase, manage and redeem deals on their mobile devices. In addition, the mobile experience leverages location in several ways, enabling consumers to filter by distance, discover deals near them and visualize the assortment of Groupon offers through a maps view. In the fourth quarter of 2017 , over 69% of our global transactions were completed on mobile devices.
Marketing
We primarily use marketing to acquire customers and promote awareness of our marketplaces and the services and product offerings available through those marketplaces. Consequently, marketing is an important part of our growth strategy and remains a key element of our business operations. We increased our global marketing spend by $48.7 million , or 13.8% , for the year ended December 31, 2017 as compared to the prior period. We expect to continue to invest in marketing in future periods in connection with our efforts to increase active customers and customer purchase frequency.
We use a variety of marketing channels to make customers aware of the deal offerings on our mobile and web platforms, including search engines, email and push notifications, affiliate channels, social and display advertising and offline marketing, which increased significantly during 2017 .
Search engines. Customers can access our deal offerings indirectly through third-party search engines. We use search engine optimization ("SEO") and marketing ("SEM") to increase the visibility of our offerings in web search results.
Email and push notifications. In North America and most of our international markets, we use targeting technology to determine which deal offerings to communicate to our subscribers based on their locations and personal preferences. A subscriber who clicks on a deal offering within an email or push notification is directed to our website or mobile application to learn more about the deal and be able to make a purchase.
Affiliate channels. We have an affiliate program that utilizes third parties to promote our deal offerings online. Affiliates earn commissions when customers access our deal offerings through links on their websites and make purchases on our platform. We expect to continue to leverage affiliate relationships to extend the distribution of our deals to a broad base of potential customers.
Social and display. We publish deals through various social networks and adapt our notifications to the particular format of each of these social networking platforms. Our websites and mobile application interfaces enable consumers to share deal offerings with their personal social networks. We also promote our deal offerings using display advertising on websites.
Television and other offline. In 2017 , we significantly increased the extent to which we use offline marketing such as television advertising, and to a lesser extent, print and radio advertising.
Our marketing activities also include elements that are not presented as Marketing on our consolidated statements of operations, such as order discounts and free shipping on qualifying merchandise sales.
6
Sales and Operations
Our sales force consists of approximately 2,400 merchant sales representatives and sales support staff, who build merchant relationships and provide local expertise. Our North American merchant sales representatives and support staff are primarily based in our offices in Chicago and Phoenix, and our international merchant sales representatives and support staff are based in their respective local offices. Our global sales and sales support headcount by segment as of December 31, 2017 was as follows:
North America | 872 | |
International | 1,535 | |
Total | 2,407 | |
Other key operational functions include deal managers, editorial, merchant services, customer service, technology, merchandising and logistics. Deal managers work with sales teams to optimize deal structure and pricing, as well as manage the category, discount and geographic mix of deals in their respective markets. Our editorial department is responsible for creating the written and visual content on the deals we offer. Merchant services representatives work with merchants to plan for increased customer traffic before an offering is active and serve as an ongoing point of contact for the merchant over the term of a deal. Our customer service department is responsible for answering questions received via phone, email and on public discussion boards regarding purchases, shipping status, returns and other areas of customer inquiry. Our technology team is focused on the design and development of new features and products, maintenance of our websites and development and maintenance of our internal systems. Merchandising and logistics personnel are responsible for managing inventory and the flow of products from suppliers to our customers.
Our websites are hosted at two U.S. data centers in California and at an international data center in Ireland. Our data centers host our public-facing websites and applications, as well as our back-end business intelligence systems. We employ security practices to protect and maintain the systems located at our data centers. We have invested in intrusion and anomaly detection tools to try to recognize intrusions to our websites. We engage independent third-party Internet security firms to regularly test the security of our websites and identify vulnerabilities. In financial transactions with customers conducted on our websites and mobile applications, we use data encryption protocols to secure information while in transit. See Risk Factors for additional information relating to cyber threats.
Competition
Our business is rapidly evolving and we face competition from a variety of sources. Some of our competitors offer deals as an add-on to their core business, and others have adopted a business model similar to ours. We also compete against companies that offer other types of advertising and promotional services to local businesses. In addition to such competitors, we expect to increasingly compete against other large Internet and technology-based businesses that have launched initiatives that are directly competitive to our core business. Such competitors may be much larger companies who have more resources and significantly greater scale. We also expect to compete against other Internet sites that are focused on specific communities or interests and offer coupons or discount arrangements related to such communities or interests. Further, as our business continues to evolve, we anticipate facing new competition. We believe the principal competitive factors in our markets include the following:
• | quality and performance of our merchants; |
• | size and composition of our customer base; |
• | mobile penetration; |
• | understanding of local business trends; |
• | ability to structure deal offerings to generate a positive return on investment for merchants; |
• | ability to generate large volumes of sales; and |
• | reputation, strength and recognition of brand. |
7
Although we believe that we compete favorably on the factors described above and benefit from scale, we anticipate that larger, more established companies may directly compete with us over time. Many of our current and potential competitors have longer operating histories, significantly greater financial, technical, marketing and other resources and larger customer bases than we do. These factors may allow our competitors to benefit from their existing customer base with lower acquisition costs or to respond more quickly than we can to new or emerging technologies and changes in customer requirements. These competitors may engage in more extensive research and development efforts, undertake more far-reaching marketing campaigns and adopt more aggressive pricing policies, which may allow them to build a larger subscriber base or to monetize that subscriber base more effectively than we do. Our competitors may develop products or services that are similar to our products and services or that achieve greater market acceptance than our products and services.
Seasonality
Some of our offerings experience seasonal buying patterns mirroring that of the larger consumer retail and e-commerce markets, where demand declines during customary summer vacation periods and increases during the fourth quarter holiday season. We believe that this seasonality pattern has affected, and will continue to affect, our business and quarterly sequential revenue growth rates. We recognized 30.7% , 30.0% and 29.7% of our annual revenue during the fourth quarter of 2017 , 2016 and 2015 , respectively.
Regulation
We are subject to a number of foreign and domestic laws and regulations that affect companies conducting business on the Internet. Additionally, those laws and regulations may be interpreted differently across domestic and foreign jurisdictions. As a company in a relatively new and rapidly innovating industry, we are exposed to the risk that many of those laws may evolve or be interpreted by regulators or in the courts in ways that could materially affect our business. Those laws and regulations may involve taxation, unclaimed property, intellectual property, product liability, travel, distribution, electronic contracts and other communications, competition, consumer protection, the provision of various online payment services, employee, merchant and customer privacy and data security or other areas.
The Credit Card Accountability Responsibility and Disclosure Act of 2009 (the "CARD Act"), as well as the laws of most states, contain provisions governing gift cards, gift certificates, stored value or pre-paid cards or coupons ("gift cards"). Groupon vouchers may be included within the definition of "gift cards" under many laws. In addition, certain foreign jurisdictions have laws that govern disclosure and certain product terms and conditions, including restrictions on expiration dates and fees, that may apply to Groupon vouchers. There are also a number of legislative proposals pending before the U.S. Congress, various state legislative bodies and foreign governments that could affect us, and our global operations may be constrained by regulatory regimes and laws in Europe and other jurisdictions outside the United States that may be more restrictive and adversely impact our business.
Various U.S. laws and regulations, such as the Bank Secrecy Act of 1970 (the "Bank Secrecy Act"), the Dodd-Frank Wall Street Reform and Consumer Protection Act, the USA PATRIOT Act and the CARD Act impose certain anti-money laundering requirements on companies that are financial institutions or that provide financial products and services. Those laws and regulations broadly define financial institutions to include money services businesses such as money transmitters, check cashers and sellers or issuers of stored value. Requirements imposed on financial institutions under those laws include customer identification and verification programs, record retention policies and procedures and transaction reporting. We do not believe that we are a financial institution subject to those laws and regulations.
We are subject to a variety of federal, state and international laws and regulations governing consumer data. The General Data Protection Regulation ("GDPR"), which was recently adopted by the European Union and will become effective in May 2018, requires companies to satisfy new requirements regarding the handling of personal and sensitive data, including its collection, use, protection and the ability of persons whose data is stored to correct or delete such data about themselves. Complying with the GDPR is expected to cause us to update certain business practices and systems. Non-compliance with GDPR could result in proceedings against us by governmental entities or others and fines up to the greater of €20 million or 4% of annual global revenues.
Intellectual Property
We protect our intellectual property rights by relying on federal, state and common law rights, as well as contractual restrictions. We control access to our proprietary technology by entering into confidentiality and invention assignment agreements with our employees and contractors, and confidentiality agreements with third parties.
In addition to those contractual arrangements, we also rely on a combination of trade secrets, copyrights, trademarks, service marks, trade dress, domain names and patents to protect our intellectual property. Groupon and its related entities own a
8
number of trademarks and service marks registered or pending in the United States and internationally. In addition, we own a number of issued patents and pending patent applications in the United States and internationally and own and have applied for copyright registrations.
Circumstances outside our control could pose a threat to our intellectual property rights and the efforts we have taken to protect our proprietary rights may not be sufficient or effective or deter independent development of equivalent or superior intellectual property rights by others. Any significant impairment of our intellectual property rights could harm our business or our ability to compete. Also, protecting our intellectual property rights is costly and time-consuming. Any unauthorized disclosure or use of our intellectual property could make it more expensive to do business and harm our operating results.
Companies in the Internet, technology and other industries as well as non-practicing entities may own large numbers of patents, copyrights and trademarks or other intellectual property rights and may request license agreements, threaten litigation or file suit against us based on allegations of infringement or other violations of intellectual property rights. We are currently subject to, and expect to face in the future, lawsuits and allegations that we have infringed the intellectual property rights of third parties. As our business grows, we will likely face more claims of infringement, and may experience an adverse result which could impact our business and/or our operating results.
We have received in the past, and we anticipate we will receive in the future, communications alleging that items offered or sold through our website infringe third-party copyrights, trademarks, patents and trade names or other intellectual property rights or that we have otherwise infringed third parties' past, current or future intellectual property rights. We may be unable to prevent third parties from offering and selling unlawful or infringing goods or goods of disputed authenticity, and we may be subject to allegations of civil or criminal liability for unlawful activities carried out by third parties through our website. We may implement measures in an effort to protect against these potential liabilities that could require us to spend substantial resources and/or to reduce revenues by discontinuing certain service offerings. Any costs incurred as a result of liability or asserted liability relating to the sale of unlawful goods or the unlawful sale of goods could harm our business.
Employees
As of December 31, 2017 , there were 2,639 employees in our North America segment, consisting of 872 sales representatives and 1,767 corporate, operational and customer service representatives, and 4,033 employees in our International segment, consisting of 1,535 sales representatives and 2,498 corporate, operational and customer service representatives.
Executive Officers
The following table sets forth information about our executive officers:
Name |
| Age | Position | ||||||||||
|
|
| |||||||||||
Rich Williams | 43 | Chief Executive Officer and Director | |||||||||||
Michael Randolfi | 45 | Chief Financial Officer | |||||||||||
Steve Krenzer | 59 | Chief Operating Officer | |||||||||||
Dane Drobny | 50 | General Counsel and Corporate Secretary | |||||||||||
Brian Stevens | 43 | Chief Accounting Officer and Treasurer | |||||||||||
Rich Williams has served as our Chief Executive Officer and a member of our Board of Directors since November 2015. Prior to this role, Mr. Williams served as our Chief Operating Officer since June 2015 and President of North America since October 2014. He joined the Company in June 2011 as Senior Vice President of Marketing. Prior to joining Groupon, Mr. Williams served in a variety of marketing leadership roles at Amazon.com, Inc. (NASDAQ: AMZN) from January 2008 to June 2011, most recently as the Director, Paid Traffic leading global advertising. Prior to joining Amazon, he spent nearly seven years in sales and marketing leadership roles at Experian plc (LSE: EXPN), a global information services company.
Michael Randolfi has served as our Chief Financial Officer since April 2016. Prior to joining Groupon, Mr. Randolfi served as the Chief Financial Officer of Orbitz Worldwide, Inc. (NYSE: OWW) from March 2013 until November 2015 (when he departed following its acquisition by Expedia, Inc.). Prior to joining Orbitz, Mr. Randolfi served as Vice President and then as Senior Vice President and Controller at Delta Air Lines (NYSE: DAL) from February 2008 to February 2013. From June 1999 to February 2008, he held various executive positions at Delta Air Lines in financial planning and analysis, controllership and treasury.
9
Prior to his 14-year career at Delta, Mr. Randolfi held positions with Continental Airlines (NYSE: UAL) and Raymond James and Associates (NYSE: RJF). Mr. Randolfi is a CPA and a certified management accountant.
Steve Krenzer has served as our Chief Operating Officer since November 2017. Prior to joining Groupon, Mr. Krenzer was the Chief Executive Officer of Core Digital Media, Inc. from October 2012 to November 2017. From November 1996 to October 2012, Mr. Krenzer held a variety of senior executive positions at Experian (LSE: EXPN), ultimately serving as President of Interactive Media.
Dane Drobny has served as our General Counsel and Corporate Secretary since July 2014. Prior to joining Groupon, Mr. Drobny was Senior Vice President, General Counsel and Corporate Secretary at Sears Holdings Corporation (NASDAQ: SHLD) from May 2010 to June 2014. Prior to joining Sears Holdings, he spent 17 years at the international law firm of Winston & Strawn LLP, most recently as a partner.
Brian Stevens has served as our Chief Accounting Officer and Treasurer since May 2016 and as our Chief Accounting Officer since September 2012. Prior to joining Groupon, Mr. Stevens spent 16 years with KPMG LLP, most recently as a partner. Mr. Stevens spent five years in KPMG's Department of Professional Practice and was a practice fellow at the Financial Accounting Standards Board from 2006 to 2008. Mr. Stevens is a member of the American Institute of Certified Public Accountants and served on its Financial Reporting Executive Committee (FinREC) from November 2013 to January 2018.
Available Information
The Company electronically files reports with the SEC. The public may read and copy any materials the Company has filed with the SEC at the SEC's Public Reference Room at 100 F Street, N.E., Washington, D.C. 20549. The public may obtain information on the operation of the Public Reference Room by calling the SEC at 1-800-SEC-0330. In addition, the SEC maintains an Internet site (www.sec.gov) that contains reports, proxy and information statements and other information regarding issuers that file electronically with the SEC. Copies of the Company's Annual Report on Form 10-K, Quarterly Reports on Form 10-Q and Current Reports on Form 8-K and amendments to those reports filed or furnished pursuant to Section 13(a) or 15(d) of the Securities Exchange Act of 1934 are also available free of charge through the Company's website (www.groupon.com), as soon as reasonably practicable after electronically filing with or otherwise furnishing such information to the SEC, and are available in print to any stockholder who requests them. The Company's Code of Conduct, Corporate Governance Guidelines and committee charters are also posted on the site. The Company uses its Investor Relations website (investor.groupon.com) and its blog (www.groupon.com/blog) as a means of disclosing material non-public information and for complying with its disclosure obligations under Regulation FD. Information contained on our website and blog is not a part of this Annual Report on Form 10-K.
ITEM 1A: RISK FACTORS
Our business, prospects, financial condition, operating results and the trading price of our common stock could be materially adversely affected by the risks described below. In assessing those risks, you should also refer to the other information contained in this Annual Report on Form 10-K, including Part II, Item 7. Management's Discussion and Analysis of Financial Condition and Results of Operations (MD&A) and the consolidated financial statements and the related notes in Part II, Item 8. Financial Statements and Supplementary Data of this Annual Report on Form 10-K.
Risks Related to Our Business
Our operating results may vary significantly from quarter to quarter.
Our operating results may vary significantly from quarter to quarter due to seasonality and other reasons such as the rapidly evolving nature of our business. We believe that our ability to achieve and maintain profitability will depend, among other factors, on our ability to:
• | acquire new customers and retain existing customers; |
• | attract and retain quality merchants; |
• | effectively address and respond to challenges in international markets; |
10
• | expand the number, variety and relevance of products and deals we offer, including through third party business partners and technology integrations, as we attempt to build a more complete local marketplace; |
• | achieve additional mobile adoption to capitalize on customers' continued shift toward mobile device usage; |
• | increase the awareness of our brand; |
• | successfully achieve the anticipated benefits of business combinations or acquisitions, strategic investments, divestitures and restructuring activities; |
• | provide a superior customer service experience for our customers; |
• | avoid interruptions to our services, including as a result of attempted or successful cybersecurity attacks or breaches; |
• | respond to continuous changes in consumer and merchant use of technology; |
• | react to challenges from existing and new competitors; |
• | respond to seasonal changes in supply and demand; and |
• | address challenges from existing and new laws and regulations. |
In addition, our margins and profitability may depend on our product sales mix, our geographic revenue mix and merchant pricing terms. In recent periods, we have shifted the focus of our offerings to our Local category, which tend to have a higher margin and more differentiation than our Goods category. We believe that this shift should provide us with a greater opportunity for long-term gross profit growth. If we are not successful in achieving this objective, our business, financial position and results of operations could be harmed. Further, sales in our Goods category may constitute a greater percentage of our sales in certain periods relative to other categories, which may result in lower margins and profitability during those periods. Accordingly, our profitability may vary significantly from quarter to quarter.
Our strategy to grow our business may not be successful and may expose us to additional risks.
Our strategy to grow our business focuses on several key priorities including increasing customer value, building out a more extensive local commerce marketplace platform, improving the customer experience and unlocking the potential of our international markets. We have undertaken several initiatives as we execute this strategy. For example, we have continued to invest in growth by increasing our marketing investment as we attempt to increase our active customer base, increase customer purchase frequency, improve brand awareness and introduce new products.
In addition, as we focus on building out a more extensive local commerce marketplace platform, we have also devoted significant resources to attracting new merchants, retaining merchants who are willing to run deals on a continuous basis with us and engaging with third-party business partners via technology integrations in order to build a significant inventory for our customers. We have accepted, and expect to continue to accept, a lower portion of the gross billings from some of our merchants and business partners as we expand our marketplaces and introduce new products. In addition, we are continuously refining our process for presenting the most relevant deals to our customers based on their personal preferences and location. We are also continuing our efforts to optimize the mix of products that we offer. If we are not successful in achieving these objectives, our business, financial position and results of operations could be harmed. Further, we have implemented technology integrations with a number of third party business partners that we rely on to support various products (such as Groupon+ and other voucherless offerings) and augment inventory across all categories of our business. Significant disruption in these services, or breakdown of these relationships, could negatively impact our ability to grow.
We also have prioritized building a great product and customer experience. To this end, we have continued to invest in improving the customer experience, from search to purchase to redemption, in removing friction from our websites and mobile applications and in product development. For example, Groupon+, our voucherless card-linked offer product, is a new frictionless offering that we believe will improve the customer experience. Additionally, we have continued to expand our direct booking offerings that allow for seamless mobile redemption. There are no assurances that Groupon+, our booking features, third party offerings and other new products and deal structures will be successful in improving the customer experience, increasing our customer and merchant base, or improving customer purchase frequency in the short term or at all. If we are unable to realize expected outcomes from Groupon+ and other new offerings and deal structures, our business and operating results may be harmed.
11
With respect to our international markets, following the completion of our restructuring plan in 2017, we expect to continue to focus on improving our products and customer experience and applying our North American playbook to our International business. If we are unable to successfully execute these initiatives and unlock the potential of our international markets, our business and operating results may be harmed.
Our efforts to execute our strategy may prove more difficult than we currently anticipate, and we may not succeed in realizing the benefits of these efforts, including increasing gross profit, unit growth or gross profit per customer, in a short time frame or at all.
Our financial results may be adversely affected if we are unable to execute on our marketing strategy.
Our marketing strategy is focused on customer acquisition, activation and conversion, purchase frequency and mobile application downloads, as well as increasing awareness of our brand and online marketplaces and introducing consumers and merchants to new products. In furtherance of this strategy, we increased our marketing expense to $400.9 million during 2017 as compared to $352.2 million during 2016, and we expect our marketing spend to increase in 2018. We also expect to continue to focus on maintaining a payback period on our global marketing spend of approximately 12 to 18 months; however, there are no assurances that we will be able to achieve this result. If any of our assumptions regarding our marketing activities and strategies prove incorrect, including with respect to payback periods and the efficiency of our marketing spend, our ability to generate gross profit from our investments may be less than we anticipated. In such case, we may need to increase marketing expenditures or otherwise alter our strategy and our results of operations could be negatively impacted.
If we fail to retain our existing customers or acquire new customers, our operating results and business will be harmed.
We must continue to retain and acquire customers who make purchases on our platform in order to increase profitability. Further, as our customer base evolves, the composition of our customers may change in a manner that makes it more difficult to generate revenue to offset the loss of existing customers and the costs associated with acquiring and retaining customers and to maintain or increase our customers' purchase frequency. If customers do not perceive our offerings to be attractive or if we fail to introduce new and more relevant deals or increase awareness and understanding of the offerings on our marketplace platform, we may not be able to retain or acquire customers at levels necessary to grow our business and profitability. Further, the organic traffic to our websites and mobile applications, including traffic from consumers responding to our emails, has declined in recent years, such that an increasing proportion of our traffic is generated from paid marketing channels, such as search engine marketing. If we are unable to acquire new customers in numbers sufficient to grow our business and offset the number of existing active customers that have ceased to make purchases, or if new customers do not make purchases at expected levels, our profitability may decrease and our operating results may be adversely affected.
Our international operations are subject to varied and evolving commercial and regulatory challenges, and our inability to adapt to the diverse and changing landscapes of our international markets may adversely affect our business.
Our international operations require management attention and resources and also require us to localize our services to conform to a wide variety of local cultures, business practices, laws and policies. Our international operations are subject to numerous risks, including the following:
• | our ability to maintain merchant and customer satisfaction such that our marketplace will continue to attract high quality merchants; |
• | our ability to successfully respond to macroeconomic challenges, including by optimizing our deal mix to take into account consumer preferences at a particular point in time; |
• | political, economic and civil instability and uncertainty (including acts of terrorism, civil unrest, labor unrest, violence and outbreaks of war); |
• | risks associated with the withdrawal of the United Kingdom from the European Union ("Brexit"), including volatility in worldwide and European financial markets, potential restrictions on the free movement of goods and labor between the United Kingdom and the European Union and other potential impediments to our ability to transact within and between each of the United Kingdom and the European Union; |
• | currency exchange rate fluctuations; |
12
• | strong local competitors, who may better understand the local market and/or have greater resources in the local market; |
• | different regulatory or other legal requirements, including regulation of gift cards and coupon terms, Internet services, professional selling, distance selling, bulk emailing, privacy and data protection (including GDPR, which will become effective in May 2018), cybersecurity, business licenses and certifications, taxation (including the European Union's voucher directive and similar regulations), consumer protection laws including those restricting the types of services we may offer (e.g., medical-related services), banking and money transmitting, that may limit or prevent the offering of our services in some jurisdictions, cause unanticipated compliance expenses or limit our ability to enforce contractual obligations; |
• | our ability to use a common technology platform in our North America and International segments to operate our business without significant business interruptions or delays; |
• | difficulties in integrating with local payment providers, including banks, credit and debit card networks and electronic funds transfer systems; |
• | different employee/employer relationships and the existence and actions of workers' councils and labor unions; |
• | difficulty in staffing, developing and managing foreign operations as a result of distance, language barriers and cultural differences; |
• | shorter payment cycles and greater problems in collecting accounts receivable; |
• | higher Internet service provider costs; |
• | seasonal reductions in business activity; |
• | expenses associated with localizing our products; and |
• | differing intellectual property laws. |
We are subject to complex foreign and U.S. laws and regulations that apply to our international operations, such as data privacy and protection requirements, including GDPR, the Foreign Corrupt Practices Act, the UK Anti-Bribery Act and similar local laws prohibiting certain payments to government officials, banking and payment processing regulations and anti-competition regulations, among others. The cost of complying with these various, and sometimes conflicting, laws and regulations is substantial. We have implemented and continue to implement policies and procedures to ensure compliance with these laws and regulations, however, we cannot ensure that our employees, contractors, or agents will not violate our policies. Changing laws, regulations and enforcement actions in the United States and throughout the world could harm our business. If commercial and regulatory constraints in our international markets restrict our ability to conduct our operations or execute our strategic plan, our business may be adversely affected.
Our future success depends upon our ability to attract and retain high quality merchants.
We must continue to attract and retain high quality merchants in order to increase profitability. We depend on our ability to attract and retain merchants that are prepared to offer products or services on compelling terms through our marketplaces and provide our customers with a good experience. We do not have long-term arrangements to guarantee the availability of deals that offer attractive quality, value and variety to customers or favorable payment terms to us. If merchants decide that utilizing our services no longer provides an effective means of attracting new customers or selling their goods and services, they may stop working with us or negotiate to pay us lower margins or fees. In addition, current or future competitors may accept lower margins, or negative margins, to secure merchants offers that attract attention and acquire new customers. If competitors engage in group buying initiatives in which merchants receive a higher portion of the purchase price than we currently offer, or if we target merchants who will only agree to run deals if they receive a higher portion of the proceeds, we may receive a lower portion of the gross billings on deals offered through our marketplaces. In addition, we may experience attrition in our merchants due to shifts in our business model and the way we pay merchants, or in the ordinary course of business resulting from several factors, including losses to competitors and merchant closures or merchant bankruptcies. If we are unable to attract and retain high quality merchants in numbers sufficient to grow our business, or if merchants are unwilling to offer products or services with compelling terms through our marketplaces or offer favorable payment terms to us, our operating results may be adversely affected.
13
Our business is exposed to risks associated with our voucherless offerings.
We are developing and scaling voucherless offerings, including offers that are linked to customer credit cards, through our Groupon+ product and direct booking deals in our Health, Beauty & Wellness and Things To Do categories. Although we believe that voucherless offerings have the potential to increase customer purchase frequency and generate gross profit growth over the long term, there are no assurances that we will be able to scale our voucherless products or that our voucherless products will be successful in increasing customer purchase frequency or gross profit growth, if and when scaled. If we are unable to grow the number of voucherless products in our marketplaces, our results of operations may be adversely affected. In addition, as we scale our Groupon+ product, including investment in efforts to increase customer awareness of Groupon+ offerings, we may experience a short term negative impact to our financial performance.
Further, we currently depend on third party business partners and technology integrations for many of our voucherless offerings. Specifically, our ability to offer Groupon+ currently depends on our arrangements with card brand networks. In the event any card brand network no longer supports our Groupon+ offerings or significantly changes their fee requirements in connection with this service, Groupon+ may not grow or may fail, and our results of operations and financial condition could be adversely affected.
Further, Groupon+ deals, which offer cash back to customers' payment card statements based on qualifying purchases at participating merchants, involve the Company collecting fees from the merchant, rather than collecting payment from the customer and then remitting a portion of the proceeds to the merchant (as with the sale of vouchers). Accordingly, our gross billings are expected to be reduced if and when Groupon+ offerings (or similarly structured products) become a larger portion of our overall product mix.
We may be subject to breaches of our information technology systems, which could harm our relationships with our customers and merchants, subject us to negative publicity and litigation, and cause substantial harm to our business.
In operating a global online business, we and our third-party service providers maintain significant proprietary information and manage large amounts of personal data and confidential information about our employees, customers and merchants. We and such service providers are at constant risk of cyber-attacks or cyber intrusions via the Internet, computer viruses, break-ins, malware, phishing attacks, hacking, denial-of-service attacks or other attacks and similar disruptions from the unauthorized use of or access to computer systems (including from internal and external sources). These types of incidents have become more prevalent and pervasive across industries, including in our industry, and such attacks on our systems are expected to occur in the future. Further, we believe that we are a compelling target for such attacks as a result of the high profile of our brand and the amount and type of information we maintain relating to our customers and merchants. Any such incident could lead to interruptions, delays or website outages, causing loss of critical data or the unauthorized disclosure or use of personally identifiable or other confidential information.
Any failure to prevent or mitigate cybersecurity breaches or other improper access to, or disclosure of, our data or confidential information, including non-public financial information, could result in the loss or misuse of such data or information, negatively impacting customers' and merchants' confidence in the security of our services and potentially resulting in significant customer or merchant attrition, a decline in customer purchase frequency, litigation and/or regulatory investigations, and/or damage to our brand and reputation.
Our risk and exposure to these matters remains heightened because of, among other things, the evolving nature of these threats, our prominent size and scale, the large number of transactions that we process, our geographic footprint and international presence, our use of open source software, the complexity of our systems, the maturity of our systems, processes and risk management framework, our number of employees, the location of our businesses and data storage facilities, the jurisdictions in which we operate and the various and evolving laws and regulatory schemes governing data and data protection applicable to us, the extent to which our current systems, controls, processes and practices permit us to detect, log and monitor security events, our use of cloud based technologies and the outsourcing of some of our business operations.
Although cybersecurity and the continued development and enhancement of our controls, processes and practices designed to protect our systems, computers, software, data and networks from attack, damage or unauthorized access are a high priority for us, our activities and investment may not be deployed quickly enough or successfully protect our systems against all vulnerabilities, including technologies developed to bypass our security measures or zero day vulnerabilities. In addition, outside parties may attempt to fraudulently induce employees, merchants or customers to disclose access credentials or other sensitive information in order to gain access to our secure systems and networks. We also may be subject to additional vulnerabilities as we integrate the systems, computers, software and data of acquired businesses into our networks and separate the systems, computers, software and data of disposed businesses from our networks.
14
We regularly evaluate and assess our systems and the controls, processes and practices to protect those systems and also conduct penetration testing against our own system. The evaluations, assessments and testing identify areas of potential weakness in, and suggested improvements to, the maturity of our systems, processes, and risk management framework as well as vulnerabilities in those systems, processes, and risk management framework that could be attacked and exploited to access and acquire proprietary and confidential information, including information about our customers and merchants. There are no assurances that our actions and investments to improve the maturity of our systems, processes and risk management framework or remediate vulnerabilities will be sufficient or completed quickly enough to prevent or limit the impact of any cyber intrusion. In addition, in the future we may be required to expend significant additional resources to modify or enhance our protective measures, controls and systems or to improve the maturity of our systems, processes and risk management framework, or investigate or remediate any information security vulnerabilities. These improvements, modifications and enhancements may take significant time to implement. Further, the sophistication of potential attacks or the capabilities of our systems and processes may not permit us to detect the occurrence of cyber incidents until significant data loss has occurred. Moreover, because the techniques used to gain access to or sabotage systems often are not recognized until launched against a target, we may be unable to anticipate the methods necessary to defend against these types of attacks and we cannot predict the extent, frequency or impact these problems may have on us. Any actual breach, the perceived threat of a breach or a perceived breach, could cause our customers, merchants, card brands and payment card processors to cease doing business with us or do business with us less frequently, subject us to lawsuits, investigations, regulatory fines or other action or liability or damage to our brand and reputation, which would harm our business, financial condition and results of operations.
We operate in a highly competitive industry with relatively low barriers to entry and must compete successfully in order to grow our business.
Competition in our industry may increase in future periods. A number of e-commerce sites that attempt to replicate our business model operate around the world. We also compete against companies that offer other types of advertising and promotional services to local businesses. In addition to such competitors, we may experience increased competition from other large businesses who offer deals similar to ours as an add-on to their core business. We also compete with other companies that offer digital coupons and/or card-linking services through their websites or mobile applications. Further, we compete against other e-commerce companies that serve niche markets and interests. In some of our categories, such as Goods and Travel, we compete against much larger companies who have more resources and significantly greater scale. In addition, we compete with traditional offline coupon and discount services, as well as newspapers, magazines and other traditional media companies who provide coupons and discounts on products and services.
We believe that our ability to compete successfully depends upon many factors both within and beyond our control, including the following:
• | the size, composition and retention of our customer base and the number of merchants we feature; |
• | mobile penetration; |
• | understanding local business trends; |
• | ability to structure deals to generate positive return on investment for merchants; |
• | the timing and market acceptance of deals we offer, including the developments and enhancements to those deals offered by us or our competitors; |
• | customer and merchant service and support efforts; |
• | selling and marketing efforts; |
• | ease of use, performance, price and reliability of services offered either by us or our competitors; |
• | our ability to improve customer purchase frequency; |
• | our ability to drive organic traffic to our marketplaces; |
• | the number, quality and reliability of the digital coupons that can be accessed through our platform; |
• | the quality and performance of our merchants; |
15
• | our ability to cost-effectively manage our operations; and |
• | our reputation and brand strength relative to our competitors. |
Many of our current and potential competitors have longer operating histories, greater financial, marketing and other resources and larger customer bases than we do. These factors may allow our competitors to benefit from their existing customer base with lower customer acquisition costs or to respond more quickly than we can to new or emerging technologies and changes in consumer habits. In addition, our competitors may engage in more extensive research and development efforts, undertake more far-reaching marketing campaigns and adopt more aggressive pricing policies, which may allow them to build larger customer and/or merchant bases or generate revenue from their customer bases more effectively than we do. Our competitors may offer deals that are similar to the deals we offer or that achieve greater market acceptance than the deals we offer. This could attract customers away from our websites and mobile applications, reduce our market share and adversely impact our gross profit. In addition, we are dependent on some of our existing or potential competitors for display advertisements and other marketing initiatives to acquire new customers. Our ability to utilize their platforms to acquire new customers may be adversely affected if they choose to compete more directly with us or prevent us from using their services.
Our operating cash flow could be adversely impacted if we change our merchant payment terms.
Our merchant payment terms and revenue growth have historically provided us with operating cash flow to fund our working capital needs. Our merchant arrangements are generally structured such that we collect cash up front when our customers purchase vouchers or products on our website or mobile application and we make payments to merchants or suppliers at a subsequent date, either on a fixed schedule or upon redemption by customers. For Groupon+ deals, we offer cash back on customers' credit card statements based on qualifying purchases with participating merchants. For those offerings, we remit payment to a card brand network at the time of the qualifying purchase for the customer's cash back incentive and then we collect from the merchant both our commission and reimbursement for the customer's cash back incentive, generally on a bi-weekly basis. The working capital impact of Groupon+ offerings is less favorable to us than voucher transactions, for which we collect payment from customers at the time of sale and remit payment to merchants at a later date. We have used the operating cash flow provided by our merchant payment terms and revenue growth to fund our working capital needs. If we offer merchants more favorable or accelerated payment terms and/or scale our Groupon+ offerings, our operating cash flow could be adversely impacted and we may have to seek alternative financing to fund our working capital needs.
Our success is dependent upon our ability to provide a superior mobile experience for our customers and our customers' continued ability to access our offerings through mobile devices.
In the fourth quarter of 2017, over 69% of our global transactions were completed on mobile devices. Additionally, over 170.8 million people have downloaded our mobile applications worldwide as of December 31, 2017. In order to continue to grow our mobile transactions, it is critical that our applications are compatible with a range of mobile technologies, systems, networks and standards. As part of our growth strategy, we have been developing and testing a number of product enhancements that are intended to make our offerings easier to use for both customers and merchants, including voucherless offerings that are linked to customer credit cards. Our business may be adversely affected if our customers choose not to access our offerings on their mobile devices or use mobile devices that do not offer access to our mobile applications or if we fail to develop applications and produce enhancements with adequate functionality on a wide range of mobile devices.
Our business depends on our ability to maintain and improve the technology infrastructure necessary to send our emails and operate our websites, mobile applications and transaction processing systems, and any significant disruption in service on our email network infrastructure, websites, mobile applications or transaction processing systems could result in a loss of customers or merchants.
Customers access our marketplaces through our websites and mobile applications, as well as via emails that are often targeted by location, purchase history and personal preferences. Customers can also access our deal offerings indirectly through third-party search engines. Our reputation and ability to acquire, retain and serve our current and potential customers are dependent upon the reliable performance of our websites, mobile applications, email delivery and transaction processing systems and the underlying network infrastructure. Our systems may not be adequately designed with the necessary reliability and redundancy to avoid performance delays or outages that could be prolonged and harmful to our business. If our websites or mobile applications are unavailable when users attempt to access them, or if they do not load as quickly as expected, users may not return as often in the future, or at all. As our customer base and the amount of information shared on our websites and mobile applications continue to grow, we will need an increasing amount of network capacity and computing power. We have spent and expect to continue to spend substantial amounts on data centers and equipment and related network infrastructure and services to handle the traffic on our websites and mobile applications and to help shorten the time of or prevent system interruptions. The operation of these systems
16
is expensive and complex and could result in operational failures. While resiliency and redundancy are considerations in the design and operation of Groupon's systems, interruptions, delays or failures in these systems, whether due to earthquakes, adverse weather conditions, other natural disasters, power loss, computer viruses, cybersecurity attacks, physical break-ins, terrorism, errors in our software or otherwise, could be prolonged and could affect the security or availability of our websites and applications, and prevent our customers from accessing our services. If we do not maintain or expand our network infrastructure successfully or if we experience operational failures or prolonged disruptions or delays in the availability of our systems or a significant search engine, we could lose current and potential customers and merchants, which could harm our operating results and financial condition.
In addition, a portion of our network infrastructure is hosted by third-party providers. We also rely on a variety of tools and third-party commercial partners to provide certain services and offerings (e.g., booking tools and food delivery offers). Any disruption or failure of these providers, tools and/or other third parties to handle existing or increased traffic and transactions could significantly harm our business. Any financial or other difficulties these providers face may adversely affect our business, and we exercise little control over these providers, which increases our vulnerability to problems with the services they provide.
If our emails are not delivered and accepted, or are routed by email providers less favorably than other emails, or our sites or mobile applications are not accessible, or are treated disadvantageously by Internet service providers, our business may be substantially harmed.
If email providers or Internet service providers ("ISPs") implement new or more restrictive email or content delivery or accessibility policies, including with respect to net neutrality, it may become more difficult to deliver emails to our customers or for customers to access our site and services. For example, certain email providers, including Google, categorize our emails as "promotional," and these emails are directed to an alternate, and less readily accessible, section of a customer's inbox. If email providers materially limit or halt the delivery of our emails, or if we fail to deliver emails to customers in a manner compatible with email providers' email handling or authentication technologies, our ability to contact customers through email could be significantly restricted. In addition, if we are placed on "spam" lists or lists of entities that have been involved in sending unwanted, unsolicited emails, our operating results and financial condition could be substantially harmed. Further, if ISPs prioritize or provide superior access to our competitors' content, our business and results of operations may be negatively impacted.
We purchase and sell some products from indirect suppliers and allow third parties to sell products via our site and services, which increase our risk of litigation and other losses.
We source merchandise both directly from brand owners and indirectly from retailers and third-party distributors, and we often take title to the goods before we offer them for sale to our customers. Further, some brand owners, retailers and third- party distributors may be unwilling to offer products for sale on the Internet or through Groupon in particular, which could have an adverse impact on our ability to source and offer popular products. We also allow third party merchants to sell products to our customers via our marketplace platform. By selling merchandise sourced from parties other than the brand owners, and allowing the sale of merchandise by third parties, we are subject to an increased risk that the merchandise may be damaged or of disputed authenticity, which could result in potential liability under applicable laws, regulations, agreements and orders, and increase the amount of returned merchandise or customer refunds. In addition, brand owners or regulators may take legal action against us. Even if we prevail, any such legal action could result in costly litigation, generate adverse publicity for us, and have a material adverse impact on our business, financial condition and results of operations, brand and reputation. Further, in any such matter, we may not be entitled to indemnification from our supplier or merchant, or able to effectively enforce the supplier's or merchant's contractual indemnification obligations.
We may be subject to substantial liability claims and damage to our brand and reputation if people or property are harmed by the products or services offered through our marketplace.
Some of the products and services offered through our marketplace may expose us to liability claims relating to personal injury, death, negligence, intentional misconduct, assault, abuse or environmental or property damage. Certain merchants and third parties sell products and offer services using our marketplace that based on the type of product or service may increase our exposure to substantial claims and litigation, especially if these sellers do not have sufficient protection from such claims. Although we maintain liability insurance, we cannot be certain that our coverage will apply to the claims at issue, be adequate for liabilities actually incurred or that insurance will continue to be available to us on economically reasonable terms, or at all. In addition, some of our agreements with vendors, merchants and third-party sellers do not indemnify us from certain liability and costs or we may not be able to effectively enforce our contractual indemnification rights. Claims relating to products or services offered through our marketplace also could result in significant damage to our brand and reputation regardless of whether we are ultimately liable for any such claims.
17
Our processes and procedures for onboarding merchants also may expose us to liability claims or damage to our brand and reputation if the processes or procedures are deemed inadequate. Additionally, while we maintain multiple channels through which our customers can submit feedback or complaints about their experiences with merchants and other third-party sellers on our platform, because our customers often deal directly with the sellers, pertinent feedback may not be provided to us. Moreover, our evaluation of any customer feedback or complaints we receive is subjective based on the information, sometimes very limited, that our customers provide, and we may not take action in response to feedback or complaints. If our systems and procedures with respect to any such feedback or complaints are determined to be inadequate or any action or inaction is found to be inadequate, including, by way of example, not discontinuing on a timely basis offers of deals with merchants or sellers that have been the subject of material complaints, we could face substantial additional liability and damage to our brand and reputation for the misconduct of such merchants.
We are subject to inventory management and order fulfillment risks as a result of our Goods category.
We purchase a portion of the merchandise that we offer for sale to our customers. The demand for products can change for a variety of reasons, including customer preference, quality, seasonality, and customers' perception of the value of purchasing the product through us. If we or our third-party suppliers are unable to adequately predict customer demand and efficiently manage inventory, we could have either an excess or a shortage of inventory, either of which would adversely impact our business.
It is important that we fulfill orders on a timely, efficient and cost-effective basis. Many other online retailers have significantly larger inventory balances and therefore are able to rely on past experience and economies of scale to optimize their order fulfillment. Because we rely on third-party logistics providers and third-party sellers for much of our order fulfillment and delivery, many parts of the supply chain are outside our control. Delays or inefficiencies in our processes, or those of our third-party logistics providers or third-party sellers, could subject us to additional costs, as well as customer dissatisfaction, which would adversely affect our business. Additionally, in some cases we assume the risks of inventory damage, theft and obsolescence, as well as risks of price erosion for these products. These risks are especially significant because some of the merchandise we sell is characterized by seasonal trends, fashion trends, obsolescence and price erosion and because we sometimes make large purchases of particular types of inventory. Our success will depend on our ability to sell our inventory rapidly, the ability of our buying staff to purchase inventory at attractive prices relative to its resale value and our ability to manage customer returns and other costs. If we are unsuccessful in any of these areas, we may be forced to sell our inventory at a discount or loss.
We are involved in pending litigation and an adverse resolution of such litigation may adversely affect our business, financial condition, results of operations and cash flows.
We are involved in litigation regarding, among other matters, patent, consumer, privacy and employment issues. Litigation can be expensive, time-consuming and disruptive to normal business operations. The results of complex legal proceedings are often uncertain and difficult to predict. An unfavorable outcome with respect to any of these lawsuits could have a material adverse effect on our business, financial condition, results of operations and cash flows. For additional information regarding these and other lawsuits in which we are involved, see Note 10, Commitments and Contingencies , to the consolidated financial statements.
An increase in our refund rates or estimated liabilities with respect to unredeemed vouchers could adversely affect our profitability or net income.
As we expand our product offerings, our customer refund rates may exceed historical levels. A downturn in general economic conditions may also increase our refund rates. An increase in our refund rates could significantly reduce our liquidity and profitability. We estimate future refunds utilizing a statistical model that incorporates historical refund experience, including the relative risk of refunds based on deal category. Our actual level of refund claims could prove to be greater than the level of refund claims we estimate. If our refund reserves are not adequate to cover future refund claims, this inadequacy could have a material adverse effect on our profitability. Our standard agreements with merchants generally limit the time period during which we may seek reimbursement for customer refunds or claims. Our customers may make claims for refunds with respect to which we are unable to seek reimbursement from merchants. Our inability to obtain reimbursement from merchants for refund claims could have an adverse effect on our liquidity and profitability.
In the third quarter of 2017, we began to increase our use of redemption payment terms with our North America merchants. In addition, the revenue recognition standard that we adopt in 2018 requires us to estimate variable consideration from unredeemed vouchers. As a result, a greater percentage of our transactions in North America than in prior periods will require us to use projections in order to estimate revenue and liabilities associated with unredeemed vouchers. If the estimates that we use in projecting the likelihood of vouchers being redeemed prove to be inaccurate, our liabilities with respect to unredeemed vouchers may be materially higher than the amounts shown in our financial statements, and our net income could be materially and adversely affected.
18
The loss of one or more key members of our management team, or our failure to attract and retain other highly qualified personnel in the future could harm our business.
In order to be successful, we must attract, retain and motivate executives and other key employees, including those in managerial, technical and sales positions. Hiring and retaining qualified executives, engineers and qualified sales representatives are critical to our success, and competition for experienced and well qualified employees can be intense. In order to attract and retain executives and other key employees in a competitive marketplace, we must provide a competitive compensation package, including cash and share-based compensation. Our primary form of share-based incentive award is restricted stock units. If the anticipated value of such share-based incentive awards does not materialize, if our share-based compensation otherwise ceases to be viewed as a valuable benefit or if our total compensation package is not viewed as competitive, our ability to attract, retain and motivate executives and key employees could be weakened. The failure to successfully hire executives and key employees or the loss of any executives and key employees could have a significant impact on our operations.
Acquisitions, dispositions, joint ventures and strategic investments could result in operating difficulties, dilution and other consequences.
We routinely evaluate and consider a wide array of potential strategic transactions, including acquisitions and dispositions of businesses, joint ventures, technologies, services, products and other assets and minority investments. The pursuit and consummation of such transactions can result in operating difficulties, dilution, management distraction and other potentially adverse consequences. We have in the past acquired and divested a number of companies and may complete additional transactions in the future.
Acquisitions involve significant risks and uncertainties, including uncertainties as to the future financial performance of the acquired business and the performance of acquired customers, valuation of the acquired business and integration risks such as difficulties integrating acquired personnel into our business, the potential loss of key employees, customers or suppliers, difficulties in integrating different computer, payment and accounting systems and exposure to unknown or unforeseen liabilities of acquired companies. In addition, the integration of an acquisition could divert management's time and the Company's resources. If we pay for an acquisition or a minority investment in cash, it would reduce our cash available for operations or cause us to incur debt, and if we pay with our stock it could be dilutive to our stockholders. Additionally, we do not have the ability to exert control over our minority investments, and therefore we are dependent on others in order to realize their potential benefits. Dispositions and attempted dispositions also involve significant risks and uncertainties, such as the risk of destabilizing the applicable operations, the loss of key personnel, the terms and timing of any dispositions, the ability to obtain necessary governmental or regulatory approvals, post-disposal disputes and indemnification obligations and risks and uncertainties with respect to the separation of disposed operations, including, for example, transition services, access by purchasers to certain of our systems and tools during transition periods, the migration of data and separation of systems, data privacy matters and misuse of trademarks and intellectual property. We may be unable to successfully complete potential strategic transactions or dispositions on a timely basis or at all, or we may not realize the anticipated benefits of any of our strategic transactions in the time frame expected or at all.
We do not have the ability to exert control over our minority investments, and therefore we are dependent on others in order to realize their potential benefits.
We currently hold non-controlling minority investments in Monster Holdings LP ("Monster LP") and other entities and we may make additional strategic minority investments in the future. Such minority investments inherently involve a lesser degree of control over business operations, thereby potentially increasing the financial, legal, operational and/or compliance risks associated with the investments. Other investors in these entities may have business goals and interests that are not aligned with ours, or may exercise their rights in a manner in which we do not approve. These circumstances could lead to delayed decisions or disputes and litigation with those other investors, all of which could have a material adverse impact on our reputation, business, financial condition and results of operations.
If Monster LP or other investees seek additional financing in order to fund their growth strategies, such financing transactions may result in further dilution of our ownership stakes and such transactions have and in the future may occur at lower valuations than the investment transactions through which we acquired such interests, which could significantly decrease the fair values of our investments in those entities. Additionally, if Monster LP or other investees are unable to obtain any such financing, those entities could need to significantly reduce their spending in order to fund their operations. Such actions likely would result in reduced growth forecasts, which also could significantly decrease the fair values of our investments in those entities.
19
The application of certain laws and regulations, including, among other laws, the CARD Act and similar state and foreign laws, may harm our business and results of operations.
The application of certain laws and regulations to vouchers is uncertain. Vouchers may be considered gift cards, gift certificates, stored value cards or prepaid cards and therefore governed by, among other laws, the CARD Act, and state laws governing gift cards, stored value cards and coupons, and, in certain instances, potentially subject to unclaimed and abandoned property laws. Other foreign jurisdictions have similar laws in place, in particular European jurisdictions where the European E-Money Directive regulates the business of electronic money institutions. Many of these laws contain provisions governing the use of gift cards, gift certificates, stored value cards or prepaid cards, including specific disclosure requirements and prohibitions or limitations on the use of expiration dates and the imposition of certain fees. For example, if vouchers are subject to the CARD Act and are not included in the exemption for promotional programs, it is possible that the purchase value, which is the amount equal to the price paid for the voucher, or the promotional value, which is the add-on value of the voucher in excess of the price paid, or both, may not expire before the later of (i) five years after the date on which the voucher was issued; (ii) the voucher's stated expiration date (if any); or (iii) a later date provided by applicable state law. In the event that it is determined that vouchers sold through our platform are subject to the CARD Act or any similar state or foreign law or regulation, and are not within various exemptions that may be available under the CARD Act or under some of the various state or foreign jurisdictions, our liabilities with respect to unredeemed vouchers may be materially higher than the amounts shown in our financial statements and we may be subject to additional fines and penalties.
In addition, from time to time, we may be notified of additional, or developments in existing, laws and regulations that governmental organizations or others may claim should be applicable to our business, or that otherwise affect our operations. If we are required to alter our business practices, or there are other market changes, as a result of any laws and regulations, our revenue could decrease, our costs could increase and our business could otherwise be harmed. In addition, the costs and expenses associated with defending any actions related to, or otherwise reacting to, such legal or regulatory developments, and any related payments (including penalties, judgments, settlements or fees) could adversely impact our profitability. To the extent that we expand into new lines of business and new geographies, we will become subject to additional laws and regulations.
We may have exposure to greater than anticipated tax liabilities.
We are subject to income taxes in the United States (federal and state) and numerous foreign jurisdictions. Tax laws, regulations, and administrative practices in various jurisdictions may be subject to significant change due to economic, political, and other conditions, and significant judgment is required in evaluating and estimating our provision and accruals for these taxes. Our income tax obligations are based on our corporate operating structure, including the manner in which we develop, value and use our intellectual property and the scope of our international operations.
The tax laws applicable to our domestic and international business activities, including the laws of the United States and other jurisdictions, are subject to interpretation. The taxing authorities of the jurisdictions in which we operate may challenge our methodologies for valuing developed technology or intercompany arrangements, which could potentially increase our worldwide effective tax rate and harm our financial position and results of operations. In addition, there are many transactions that occur during the ordinary course of business for which the ultimate tax determination is uncertain. Our effective tax rates could be adversely affected by earnings being lower than anticipated in jurisdictions where we have lower statutory rates and higher than anticipated in jurisdictions where we have higher statutory rates, losses incurred in jurisdictions for which we are not able to realize the related tax benefits, changes in foreign currency exchange rates, entry into new businesses and geographies and changes to our existing businesses, acquisitions and investments, changes in our deferred tax assets and liabilities and their valuation and changes in the relevant tax, accounting and other laws, regulations, administrative practices, principles and interpretations, including fundamental changes to the tax laws applicable to corporate multinationals. For example, many countries in the European Union and a number of other countries are actively considering changes in this regard. Developments in an audit, litigation or the relevant laws, regulations, administrative practices, principles and interpretations could have a material effect on our financial position, operating results and cash flows in the period or periods for which that development occurs, as well as for prior and subsequent periods.
We also are subject to regular review and audit by both U.S. federal and state and foreign tax authorities. In particular, we currently are, and expect to continue to be, subject to numerous federal, state and international tax audits relating to income, transfer pricing, sales, VAT and other tax liabilities. Some of these pending and future audits could involve significant liabilities and/or penalties. For example, in the fourth quarter 2017, we received an income tax assessment and a notification of potential assessment from the tax authorities in two foreign jurisdictions, totaling $138.1 million in the aggregate. We believe that the assessments, which primarily relate to transfer pricing on transactions occurring from 2011 to 2014, are without merit and we intend to vigorously defend ourselves in those matters. See Note 14, Income Taxes, for additional information. Any adverse outcome of such a review or audit could have a significant negative effect on our financial position and results of operations. In addition,
20
the determination of our worldwide provision for income taxes and other tax liabilities requires significant judgment by management, and there are many transactions where the ultimate tax determination is uncertain. Although we believe that our estimates are reasonable, the ultimate tax outcome may differ from the amounts recorded in our financial statements and may materially affect our financial results in the period or periods for which such determination is made.
The adoption of tax reform policies, including the enactment of legislation or regulations implementing changes in the tax treatment of companies engaged in Internet commerce or the U.S. taxation of international business activities could materially affect our financial position and results of operations.
Further, due to the global nature of the Internet, it is possible that various states or foreign countries might attempt to regulate our transmissions or levy sales, income or other taxes relating to our activities. Tax authorities at the international, federal, state and local levels are currently reviewing the appropriate treatment of companies engaged in Internet commerce. New or revised international, federal, state or local tax regulations may subject us or our customers to additional sales, income and other taxes. We cannot predict the effect of current attempts to impose sales, income or other taxes on commerce over the Internet. New or revised taxes and, in particular, sales taxes, VAT and similar taxes would likely increase the cost of doing business online and decrease the attractiveness of advertising and selling goods and services over the Internet. For example, the voucher directive recently adopted by the European Union or similar regulations could adversely affect our financial results. New taxes could also create significant increases in internal costs necessary to capture data, and collect and remit taxes. Any of these events could have an adverse effect on our business and results of operations.
On December 22, 2017, new legislation was signed into law that revises the Internal Revenue Code of 1986, as amended. The newly enacted federal income tax law contains significant changes to corporate taxation. Although we currently do not expect the new federal tax law to have a significant impact on us in 2018, the overall impact over time is uncertain as the law is interpreted and implemented. In addition, it is uncertain if and to what extent various states will conform to the newly enacted federal tax law.
If we are required to materially increase the liability recorded in our financial statements with respect to unredeemed vouchers our results of operations could be materially and adversely affected
In certain states and foreign jurisdictions, vouchers may be considered a gift card. Some of these states and foreign jurisdictions include gift cards under their unclaimed and abandoned property laws which require companies to remit to the government the full value or a portion of the value of the unredeemed balance on the gift cards after a specified period of time (generally between one and five years) and impose certain reporting and record-keeping obligations. We do not remit any amounts relating to unredeemed vouchers based on our assessment of applicable laws. The analysis of the potential application of the unclaimed and abandoned property laws to vouchers is complex, involving an analysis of constitutional and statutory provisions and factual issues, including our contractual relationship with customers and merchants. In the third quarter of 2017, we began to increase our use of redemption payment terms with our North America merchants, and we expect that trend to continue. The determinations we make with respect to variable consideration that we earn on those transactions may be subject to the laws described above, and we expect the amount of that variable consideration to increase as our use of redemption payment terms increases. In the event that one or more states or foreign jurisdictions successfully challenges our position on the application of its unclaimed and abandoned property laws to vouchers, our liabilities with respect to unredeemed vouchers, including any resulting penalties and interest, may be materially higher than the amounts shown in our financial statements which could have a material adverse impact on our results of operations.
Government regulation of the Internet and e-commerce is evolving, and unfavorable changes or failure by us to comply with these regulations could substantially harm our business and results of operations.
We are subject to general business regulations and laws as well as regulations and laws specifically governing the Internet and e-commerce. Existing and future regulations and laws could impede the growth of the Internet or other online services. These regulations and laws may involve taxation, tariffs, subscriber privacy, anti-spam, data protection, content, reference pricing, copyrights, distribution, electronic contracts and other communications, consumer protection, the provision of online payment services and the characteristics and quality of services. The application of existing laws governing issues such as property ownership, sales and other taxes, libel and personal privacy to the Internet is not clear as the vast majority of these laws were adopted prior to the advent and do not contemplate or address the unique issues raised by the Internet or e-commerce. In addition, it is possible that governments of one or more countries may seek to censor content available on our websites and mobile applications or may even attempt to completely block our emails or access to our websites. Adverse legal or regulatory developments could substantially harm our business. In particular, in the event that we are restricted, in whole or in part, from operating in one or more countries,
21
our ability to retain or increase our customer base may be adversely affected and we may not be able to maintain or grow our gross profit as anticipated.
Failure to comply with federal, state and international privacy laws and regulations, or the expansion of current or the enactment of new privacy laws or regulations, could adversely affect our business.
A variety of federal, state and international laws and regulations govern the collection, use, retention, sharing and security of consumer data. The existing privacy-related laws and regulations are evolving and subject to potentially differing interpretations. In addition, various federal, state and foreign legislative and regulatory bodies may expand current or enact new laws regarding privacy matters. For example, the European Union adopted the GDPR, which will go into effect in May 2018, and requires companies to satisfy new requirements regarding the handling of personal and sensitive data, including its collection, use, protection and the ability of persons whose data is stored to correct or delete such data about themselves. Complying with the GDPR may cause us to incur substantial operational costs or require us to change our business practices. Despite our efforts to bring practices into compliance before the effective date of the GDPR, we may not be successful either due to internal or external factors such as resource allocation limitations or a lack of vendor cooperation. Noncompliance could result in proceedings against us by governmental entities or others and fines up to the greater of €20 million or 4% of annual global revenues and damage to our reputation and brand. We may also experience difficulty retaining or obtaining new European or multi-national customers due to the compliance cost, potential risk exposure, portability of customer data and uncertainty for these entities. We also may find it necessary to establish systems to maintain personal data originating from the European Union in the European Economic Area as a result of changes or restrictions to currently legitimate methods of effectuating cross-border personal data transfers to countries outside of the European Economic Area, which may involve substantial expense and distraction from other aspects of our business. Additionally, there could be uncertainty as to how to comply with other European Union privacy laws, such as country-specific laws that may conflict with or deviate from European Union privacy directives, such as GDPR.
We have posted privacy policies and practices concerning the collection, use and disclosure of subscriber data on our websites and applications. Several Internet companies have incurred substantial penalties for failing to abide by the representations made in their privacy policies and practices. In addition, several states have adopted legislation that requires businesses to implement and maintain reasonable security procedures and practices to protect sensitive personal information and to provide notice to consumers in the event of a security breach resulting in a loss or likely loss of personal information. Any failure, or perceived failure, by us to comply with our posted privacy policies or with any data-related consent orders, Federal Trade Commission requirements or orders or other federal, state or international privacy or consumer protection-related laws, regulations or industry self-regulatory principles could result in claims, proceedings or actions against us by governmental entities or others or other liabilities, which could adversely affect our business. In addition, a failure or perceived failure to comply with industry standards or with our own privacy policies and practices could result in a loss of subscribers or merchants and adversely affect our business. Federal, state and international governmental authorities continue to evaluate the privacy implications inherent in the use of third-party web "cookies" for tracking and behavioral advertising. The regulation of these cookies and other current online advertising practices could adversely affect our business.
Misclassification or reclassification of our independent contractors or employees could increase our costs and adversely impact our business.
Our workers are classified as either employees or independent contractors, and if employees, as either exempt from overtime or non-exempt (and therefore overtime eligible). Regulatory authorities and private parties have recently asserted within several industries that some independent contractors should be classified as employees and that some exempt employees, including those in sales-related positions, should be classified as non-exempt based upon the applicable facts and circumstances and their interpretations of existing rules and regulations. If we are found to have misclassified employees as independent contractors or non-exempt employees as exempt, we could face penalties and have additional exposure under federal and state tax, workers' compensation, unemployment benefits, labor, employment and tort laws, including for prior periods, as well as potential liability for employee overtime and benefits and tax withholdings. Legislative, judicial, or regulatory (including tax) authorities could also introduce proposals or assert interpretations of existing rules and regulations that would change the classification of a significant number of independent contractors doing business with us from independent contractor to employee and a significant number of exempt employees to non-exempt. A reclassification in either case could result in a significant increase in employment-related costs such as wages, benefits and taxes. The costs associated with employee classification, including any related regulatory action or litigation, could have a material adverse effect on our results of operations and our financial position.
22
We may suffer liability as a result of information retrieved from or transmitted over the Internet and claims related to our service offerings.
We may be, and in certain cases have been, sued for defamation, civil rights infringement, negligence, patent, copyright or trademark infringement, invasion of privacy, personal injury, product liability, breach of contract, unfair competition, discrimination, antitrust reference pricing or other legal claims relating to information that is published or made available on our websites or service offerings we make available (including provision of an application programming interface platform for third parties to access our website, mobile device services and geolocation applications). This risk is enhanced in certain jurisdictions outside the United States, where our liability for such third-party actions may be less clear and we may be less protected. In addition, we could incur significant costs in investigating and defending such claims, even if we ultimately are not found liable. If any of these events occurs, our business could be materially and adversely affected.
We are subject to risks associated with information disseminated through our websites and mobile applications, including consumer data, content that is produced by our editorial staff and errors or omissions related to the offerings on our marketplaces. Such information, whether accurate or inaccurate, may result in our being sued by our merchants, subscribers or third parties and as a result our results of operations and our financial position could be materially and adversely affected.
We may not be able to adequately protect our intellectual property rights or may be accused of infringing intellectual property rights of third parties.
We regard our trademarks, service marks, copyrights, patents, trade dress, trade secrets, proprietary technology, merchant lists, subscriber lists, sales methodology and similar intellectual property as critical to our success, and we rely on trademark, copyright and patent law, trade secret protection and confidentiality and/or license agreements with our employees and others to protect our proprietary rights. Effective intellectual property protection may not be available in every country in which our deals are made available. We also may not be able to acquire or maintain appropriate domain names or trademarks in all countries in which we do business. Furthermore, regulations governing domain names may not protect our trademarks and similar proprietary rights. We may be unable to prevent third parties from acquiring and using domain names or trade names that are similar to, infringe upon or diminish the value of our trademarks and other proprietary rights. We may be unable to prevent third parties from using and registering our trademarks, or trademarks that are similar to, or diminish the value of, our trademarks in some countries.
We may not be able to discover or determine the extent of any unauthorized use of our proprietary rights. Third parties that license our intellectual property rights also may take actions that diminish the value of our proprietary rights or reputation. The protection of our intellectual property may require the expenditure of significant financial and managerial resources. Moreover, the steps we take to protect our intellectual property may not adequately protect our rights or prevent third parties from infringing or misappropriating our proprietary rights. We are currently subject to multiple lawsuits and disputes related to our intellectual property and service offerings. We may in the future be subject to additional litigation and disputes. The costs of engaging in such litigation and disputes are considerable, and there can be no assurances that favorable outcomes will be obtained.
We are currently subject to third-party claims that we infringe upon proprietary rights or trademarks and expect to be subject to additional claims in the future. Such claims, whether or not meritorious, may result in the expenditure of significant financial and managerial resources, injunctions against us or the payment of damages by us. We may need to obtain licenses from third parties who allege that we have infringed their rights, but such licenses may not be available on terms acceptable to us or at all. These risks have been amplified by the increase in third parties whose sole or primary business is to assert such claims.
Our business depends on a strong brand, and if we are not able to maintain and enhance our brand, our ability to expand our base of customers and merchants could be impaired and our business and operating results could be harmed.
We believe that the brand identity that we have developed has significantly contributed to the success of our business. We also believe that maintaining and enhancing the "Groupon" brand is critical to expanding our base of customers and merchants. Maintaining and enhancing our brand may require us to make substantial investments and these investments may not be successful. If we fail to promote, maintain and protect the "Groupon" brand, or if we incur excessive expenses in this effort, our business, operating results and financial condition will be materially and adversely affected. We anticipate that, as our market becomes increasingly competitive, maintaining and enhancing our brand may become increasingly difficult and expensive. Maintaining and enhancing our brand will depend largely on our ability to continue to provide reliable, trustworthy and high quality offerings on our online marketplaces, which we may not do successfully.
We receive a high degree of media coverage around the world. Unfavorable publicity or consumer perception of our websites, mobile applications, practices or service offerings, or the offerings of our merchants or their products, could adversely affect our reputation, resulting in difficulties in recruiting, decreased revenue and a negative impact on the number of merchants
23
we feature and the size of our customer base, the loyalty of our customers and the number and variety of deals we offer each day. As a result, our business, financial condition and results of operations could be materially and adversely affected.
Failure to deal effectively with fraudulent transactions and customer disputes would increase our loss rate and harm our business.
Groupon vouchers are issued in the form of redeemable vouchers with unique identifiers. It is possible that consumers or other third parties will seek to create counterfeit vouchers in order to fraudulently purchase discounted goods and services from merchants. While we use advanced anti-fraud technologies, criminals will likely attempt to circumvent our anti-fraud systems using increasingly sophisticated methods. In addition, our service could be subject to employee fraud or other internal security breaches, and we may be required to reimburse customers and/or merchants for any funds stolen or revenue lost as a result of such breaches. Merchants could also request reimbursement, or stop offering goods or services on our marketplaces, if they are affected by buyer fraud or other types of fraud.
Although we have not incurred significant losses from fraud and counterfeit vouchers in the past, we could incur significant losses from such activities in future periods. Additionally, we may incur losses from claims that the customer did not authorize a purchase, from credit card fraud, from merchant fraud, from erroneous transmissions, and from customers who have closed bank accounts or have insufficient funds in them to satisfy payments. We also may incur losses as a result of purchases made with fraudulent credit card information, even if the associated financial institution approved payment of the transaction. In addition to the direct costs of any such losses, if the losses are related to credit card transactions and become excessive, they could potentially result in our losing the right to accept credit cards for payment. If we were unable to accept credit cards for payment, we would suffer substantial reductions in revenue, which would cause our business to suffer. While we have taken measures to detect and reduce the risk of fraud, these measures need continual improvement and may not be effective against new and continually evolving forms of fraud or in connection with new product offerings. If we are unable to effectively combat the use of fraudulent credit cards on our websites or if we otherwise experience increased levels of fraud or disputed credit card payments, our business could materially suffer.
We are subject to payments-related risks.
We accept payments using a variety of methods, including credit cards, debit cards and gift certificates. As we offer new payment options to customers, we may be subject to additional regulations, compliance requirements and fraud. For certain payment methods, including credit and debit cards, we pay interchange and other fees, which may increase over time and raise our operating costs and lower profitability. In addition, our credit card and other payment processors could impose receivable holdback or reserve requirements in the future. We rely on third parties to provide payment processing services, including the processing of credit cards and debit cards, and it could disrupt our business if these companies become unwilling or unable to provide these services to us. We are also subject to payment card association operating rules, certification requirements and rules governing electronic funds transfers, which could change or be reinterpreted to make it difficult or impossible for us to comply. If we fail to comply with these rules or requirements, we may be subject to fines and higher transaction fees and lose our ability to accept credit and debit card payments from customers or facilitate other types of online payments, and our business and operating results could be adversely affected.
We are also subject to or voluntarily comply with a number of other laws and regulations relating to money laundering, international money transfers, privacy and information security and electronic fund transfers. If we were found to be in violation of applicable laws or regulations, we could be subject to civil and criminal penalties. In addition, events affecting our third-party payment processors, including cyber-attacks, Internet or other infrastructure or communications impairment or other events that could interrupt the normal operation of our payment processors or result in unauthorized access to customer information, could have a material adverse effect on our business.
Federal laws and regulations, such as the Bank Secrecy Act and the USA PATRIOT Act and similar foreign laws, could be expanded to include Groupon vouchers or other offerings.
Various federal laws, such as the Bank Secrecy Act and the USA PATRIOT Act and foreign laws and regulations, such as the European Directive on the prevention of the use of the financial system for the purpose of money laundering and terrorist financing, impose certain anti-money laundering requirements on companies that are financial institutions or that provide financial products and services. For these purposes, financial institutions are broadly defined to include money services businesses such as money transmitters, check cashers and sellers or issuers of stored value cards. Examples of anti-money laundering requirements imposed on financial institutions include subscriber identification and verification programs, record retention policies and procedures and transaction reporting. We do not believe that we are a financial institution subject to these laws and regulations based, in part, upon the characteristics of Groupon vouchers and our role with respect to the distribution of Groupon vouchers to
24
customers. For example, the Financial Crimes Enforcement Network ("FinCEN"), a division of the U.S. Treasury Department tasked with implementing the requirements of the Bank Secrecy Act (the "BSA"), has adopted regulations expanding the scope of the BSA and requirements for parties involved in stored value or prepaid access cards, including a proposed expansion of financial institutions to include sellers or issuers of prepaid access cards. While we believe Groupon vouchers are not subject to these regulations, it is possible that FinCEN or a court of law could consider Groupon vouchers (or other Groupon products) a financial product and that we could be a financial institution. In the event that we become subject to the requirements of the Bank Secrecy Act or any other anti-money laundering law or regulation imposing obligations on us as a money services business, our regulatory compliance costs to meet these obligations would likely increase which could adversely impact our operating results.
State and foreign laws regulating money transmission could be expanded to include Groupon vouchers.
Many states and certain foreign jurisdictions impose license and registration obligations on those companies engaged in the business of money transmission, with varying definitions of what constitutes money transmission. We currently believe that we are not a money transmitter given our role and the product terms of Groupon vouchers (or other Groupon products). However, a successful challenge to our position or expansion of state or foreign laws could subject us to increased compliance costs and delay our ability to offer Groupon vouchers (or other products) in certain jurisdictions pending receipt of any necessary licenses or registrations.
Our ability to raise capital in the future may be limited, which could prevent us from growing, and our existing credit agreement could restrict our business activities.
We may in the future be required to raise capital through public or private financing or other arrangements. Such financing may not be available on acceptable terms, or at all, and our failure to raise capital when needed could harm our business. In addition, we are party to a $250.0 million amended and restated credit agreement with JPMorgan Chase Bank, N.A., as Administrative Agent, dated as of June 29, 2016, as amended (the "Credit Agreement"). Our Credit Agreement contains financial and other covenants that may restrict our business activities or our ability to execute our strategic objectives, and our failure to comply with these covenants could result in a default under our Credit Agreement. Furthermore, additional equity financing may dilute the interests of our common stockholders, and debt financing, if available, may involve restrictive covenants that could further restrict our business activities or our ability to execute our strategic objectives and could reduce our profitability. If we cannot raise or borrow funds on acceptable terms, we may not be able to grow our business or respond to competitive pressures.
We may not have the ability to use cash to settle the principal amount of our 3.25% convertible notes due 2022 (the "Notes") upon conversion or to repurchase the Notes upon a fundamental change, which could result in dilution and could adversely affect our financial condition.
The Notes are convertible any time prior to their maturity on April 1, 2022 into cash, stock or a combination of cash and stock at an initial conversion rate set forth in the indenture governing the Notes (the "Indenture"). Notes that are converted in connection with a make-whole fundamental change (as defined in the Indenture) may be entitled to an increase in the conversation rate for such Notes. Upon a conversion event, if we do not have adequate cash available or cannot obtain additional financing, or our use of cash is restricted by applicable law, regulations or agreements governing our current or future indebtedness, we may not be able to use cash to settle the principal amount of the Notes upon conversion. If we settle any portion of the principal amount of the Notes upon conversion in stock, it will result in immediate dilution to the ownership interests of existing stockholders and such dilution could be material.
In addition, holders of the Notes have the right to require us to repurchase their Notes upon the occurrence of a fundamental change (as defined in the Indenture) at a repurchase price equal to 100% of the principal amount of the Notes to be repurchased, plus accrued and unpaid interest, if any. If we do not have adequate cash available or cannot obtain additional financing, or our use of cash is restricted by applicable law, regulations or agreements governing our current or future indebtedness, we may not be able repurchase the Notes when required under the Indenture, which would constitute an event of default under the Indenture. An event of default under the Indenture could also lead to a default under other agreements governing our current and future indebtedness, and if the repayment of such other indebtedness were accelerated, we may not have sufficient funds to repay the indebtedness and repurchase the Notes or make cash payments upon conversion of the Notes.
The terms of the Notes could delay or prevent an attempt to take over our Company.
The terms of the Notes require us to repurchase the Notes in the event of a fundamental change. A takeover of our Company would constitute a fundamental change. This could have the effect of delaying or preventing a takeover of our Company that may otherwise be beneficial to our stockholders.
25
Risks Related to Ownership of Our Common Stock
The trading price of our common stock is highly volatile.
The trading price of our common stock has fluctuated significantly since our initial listing on Nasdaq. We expect that the trading price of our stock will continue to be volatile due to variations in our operating results and also may change in response to other factors, including factors specific to technology and Internet commerce companies, many of which are beyond our control. Among the factors that could affect our stock price are:
• | our financial results; |
• | any financial projections that we provide to the public, any changes in these projections or our failure for any reason to meet these projections or projections made by research analysts; |
• | the number of shares of our common stock that are available for sale; |
• | the relative success of competitive products or services; |
• | the public's response to press releases or other public announcements by us or others, including our filings with the SEC and announcements relating to litigation; |
• | speculation about our business in the press or the investment community; |
• | future sales of our common stock by our significant stockholders, officers and directors; |
• | announcements about our share repurchase program and purchases under the program; |
• | changes in our capital structure, such as future issuances of debt or equity securities; |
• | our entry into new markets or exits from existing markets; |
• | regulatory developments in the United States or foreign countries; |
• | strategic acquisitions, joint ventures or restructurings announced or consummated by us or our competitors; |
• | strategic dispositions of businesses or other assets announced or consummated by us; and |
• | changes in accounting principles. |
We expect the stock price volatility to continue for the foreseeable future as a result of these and other factors.
If securities or industry analysts do not publish research or reports about our business, or publish inaccurate or unfavorable research reports about our business, our share price and trading volume could decline.
The trading market for our common stock depends, in part, on the research and reports that securities or industry analysts publish about us or our business. We do not have any control over these analysts, and in the past, we have had changes in analyst ratings that have affected our stock price. If one or more of the analysts who cover us should downgrade our shares or change their opinion of our shares, industry sector or products, our share price would likely decline. If one or more of these analysts ceases coverage of our company or fails to regularly publish reports on us, we could lose visibility in the financial markets, which could cause our share price or trading volume to decline.
The concentration of our common stock ownership with our founders and their affiliates may limit stockholders' ability to influence corporate matters.
On October 31, 2016, each share of our Class A common stock and Class B common stock automatically converted (the "Conversion") into a single class of common stock. As a result of the Conversion, each holder of our common stock is entitled to one vote per share on any matter that is submitted to a vote of stockholders. Although the voting power of our founders was more concentrated prior to the Conversion, Eric Lefkofsky and Bradley Keywell and their affiliates own over 20% of our common stock as of December 31, 2017. They, therefore, may have significant influence over matters requiring stockholder approval, including
26
the election of directors and significant corporate transactions, such as a merger or other sale of our company or its assets. This concentrated ownership could limit stockholders' ability to influence corporate matters and, as a result, we may take actions that our stockholders do not view as beneficial. As a result, the market price of our common stock could be adversely affected.
We do not intend to pay dividends for the foreseeable future.
We intend to retain all of our earnings for the foreseeable future to finance the operation and expansion of our business and do not anticipate paying cash dividends. As a result, stockholders can expect to receive a return on their investment in our common stock only if the market price of the stock increases.
Provisions in our charter documents and under Delaware law could discourage a takeover that stockholders may consider favorable.
Provisions in our certificate of incorporation and bylaws may have the effect of delaying or preventing a change of control or changes in our management. These provisions include the following:
• | Our Board of Directors has the right to elect directors to fill a vacancy created by the expansion of the Board of Directors or the resignation, death or removal of a director, which prevents stockholders from being able to fill vacancies on our Board of Directors. |
• | Special meetings of our stockholders may be called only by our Chairman of the Board, our Chief Executive Officer, our Board of Directors or holders of not less than the majority of our issued and outstanding common stock. This limits the ability of minority stockholders to take certain actions without an annual meeting of stockholders. |
• | Our stockholders may not act by written consent unless the action to be effected and the taking of such action by written consent is approved in advance by our Board of Directors. As a result, a holder, or holders, controlling a majority of our common stock would generally not be able to take certain actions without holding a stockholders' meeting. |
• | Our certificate of incorporation prohibits cumulative voting in the election of directors. This limits the ability of minority stockholders to elect director candidates. |
• | Stockholders must provide timely notice to nominate individuals for election to the Board of Directors or to propose matters that can be acted upon at an annual meeting of stockholders. These provisions may discourage or deter a potential acquiror from conducting a solicitation of proxies to elect the acquiror's own slate of directors or otherwise attempting to obtain control of our company. |
• | Our Board of Directors may issue, without stockholder approval, shares of undesignated preferred stock. The ability to authorize undesignated preferred stock makes it possible for our Board of Directors to issue preferred stock with voting or other rights or preferences that could impede the success of any attempt to acquire us. |
The convertible note hedge and warrant transactions may affect the value of our common stock.
On May 9, 2016, we purchased convertible note hedges from certain bank counterparties. The convertible note hedges are intended to reduce the potential economic dilution upon conversion of the Notes. On May 9, 2016, we also sold warrants to certain bank counterparties. The warrant transactions would separately have a dilutive effect to the extent that the market price per share of our common stock exceeds the applicable strike price of the warrants.
The bank counterparties or their respective affiliates may modify their initial hedge positions by entering into or unwinding various derivatives contracts with respect to our common stock and/or purchasing or selling our common stock or other securities of ours in secondary market transactions prior to the maturity of the Notes (and are likely to do so during any observation period related to a conversion of Notes or following any repurchase of Notes by us on any fundamental change repurchase date or otherwise). This activity could cause or avoid a significant change in the market price of our common stock.
In addition, in some circumstances, such as an early termination of the convertible note hedge and warrant transactions, the bank counterparties or their respective affiliates may unwind their hedge positions with respect to our common stock, which could adversely affect the value of our common stock.
27
ITEM 1B: UNRESOLVED STAFF COMMENTS
None.
ITEM 2: PROPERTIES
As of December 31, 2017 , the Company owned no property and had leases for approximately 1.3 million square feet of space. Our corporate headquarters and principal executive offices are located in Chicago, Illinois. Other properties are located throughout the world and largely represent local operating facilities. We believe that our properties are in good condition and meet the needs of our business, and that suitable additional or alternative space will be available as needed to accommodate our business operations and future growth.
Description of Use | Segment | Square Feet | Various lease expirations through |
Corporate offices | North America | 624,000 | January 2026 |
Corporate offices | International | 377,000 | February 2027 |
|
|
|
|
Fulfillment and data centers | North America | 337,000 | August 2023 |
Fulfillment and data centers | International | 9,000 | March 2019 |
ITEM 3: LEGAL PROCEEDINGS
For a description of our material pending legal proceedings, please see Note 10, Commitments and Contingencies, to the consolidated financial statements included in Item 8 of this Annual Report on Form 10-K.
ITEM 4: MINE SAFETY DISCLOSURES
Not applicable.
28
PART II
ITEM 5: MARKET FOR REGISTRANT'S COMMON EQUITY, RELATED STOCKHOLDER MATTERS AND ISSUER PURCHASES OF EQUITY SECURITIES
Our Class A common stock or common stock, as applicable, has been listed on the NASDAQ Global Select Market under the symbol "GRPN" since November 4, 2011. On October 31, 2016, each share of our Class A common stock and Class B common stock automatically converted (the "Conversion") into a single class of common stock. The following table sets forth the high and low intraday sales price for our common stock (and Class A common stock prior to the Conversion) as reported by the NASDAQ Global Select Market for each of the quarterly periods listed.
2016 | High | Low | ||||
First Quarter | $ | 5.28 | | $ | 2.15 | |
Second Quarter | $ | 4.72 | | $ | 2.92 | |
Third Quarter | $ | 5.94 | | $ | 3.18 | |
Fourth Quarter | $ | 5.39 | | $ | 3.29 | |
|
|
| ||||
2017 | High | Low | ||||
First Quarter | $ | 4.80 | | $ | 3.27 | |
Second Quarter | $ | 4.05 | | $ | 2.90 | |
Third Quarter | $ | 5.22 | | $ | 3.60 | |
Fourth Quarter | $ | 5.99 | | $ | 4.49 | |
Holders
As of February 12, 2018, there were 173 holders of record of our common stock. As a result of the Conversion, each holder of our common stock is entitled to one vote per share on any matter that is submitted to a vote of stockholders.
Dividend Policy
We currently do not anticipate paying dividends on our common stock in the foreseeable future. Any future determination to declare cash dividends will be made at the discretion of our Board of Directors, subject to applicable laws, and will depend on our financial condition, results of operations, capital requirements, general business conditions and other factors that our Board of Directors may deem relevant. The terms of our amended and restated revolving credit agreement also restrict our ability to declare cash dividends. See Note 9, Financing Arrangements , for additional information.
Equity Compensation Plan Information
Information about the securities authorized for issuance under our compensation plans is incorporated by reference from the Company's Proxy Statement for the 2018 Annual Meeting of Stockholders.
Recent Sales of Unregistered Securities
During the year ended December 31, 2017 , we did not issue any unregistered equity securities.
Issuer Purchases of Equity Securities
The Board has authorized the Company to repurchase up to $700.0 million of its common stock through April 2018 under a share repurchase program. The timing and amount of any share repurchases, if any, will be determined based on market conditions, limitations under the amended and restated credit agreement, share price and other factors, and the program may be terminated at any time. We will fund the repurchases through cash on hand, future cash flows and borrowings under our credit facility. Repurchases will be made in compliance with SEC rules and other legal requirements and may be made in part under a Rule 10b5-1 plan, which permits stock repurchases when the Company might otherwise be precluded from doing so.
29
During the three months ended December 31, 2017, we did not purchase any shares under the share repurchase program. As of December 31, 2017 , up to $135.2 million of common stock remained available for purchase under that program.
From the inception of our share repurchase programs in August 2013 through December 31, 2017 , we have repurchased 188,602,242 shares of our common stock (and Class A common stock prior to the Conversion) for an aggregate purchase price of $867.4 million (including fees and commissions).
The following table provides information about purchases of shares of our common stock during the three months ended December 31, 2017 related to shares withheld upon vesting of restricted stock units for minimum tax withholding obligations:
Date |
| Total Number of Shares Purchased (1) |
| Average Price Paid Per Share |
| Total Number of Shares Purchased as Part of Publicly Announced Program |
| Maximum Number (or Approximate Dollar Value) of Shares that May Yet Be Purchased Under Program | |||||
October 1-31, 2017 |
| 388,062 | |
| $ | 5.12 | |
| - | |
| - | |
November 1-30, 2017 |
| 120,609 | |
| 5.58 | |
| - | |
| - | | |
December 1-31, 2017 |
| 692,794 | |
| 5.42 | |
| - | |
| - | | |
Total |
| 1,201,465 | |
| $ | 5.34 | |
| - | |
| - | |
(1) | Total number of shares delivered to us by employees to satisfy the mandatory tax withholding requirement upon vesting of stock-based compensation awards. |
30
Stock Performance Graph
This performance graph shall not be deemed "filed" for purposes of Section 18 of the Securities Exchange Act of 1934, as amended (the Exchange Act), or incorporated by reference into any filing of Groupon, Inc. under the Securities Act of 1933, as amended, or the Exchange Act, except as shall be expressly set forth by specific reference in such filing. Our stock price performance shown in the graph below is not indicative of our future stock price performance.
The graph set forth below compares the cumulative total return on our common stock (and Class A common stock prior to the Conversion) with the cumulative total return of the Nasdaq Composite Index and the Nasdaq 100 Index, resulting from an initial investment of $100 in each and assuming the reinvestment of any dividends, based on closing prices on the last trading day of each year end period for 2013, 2014, 2015, 2016 and 2017.
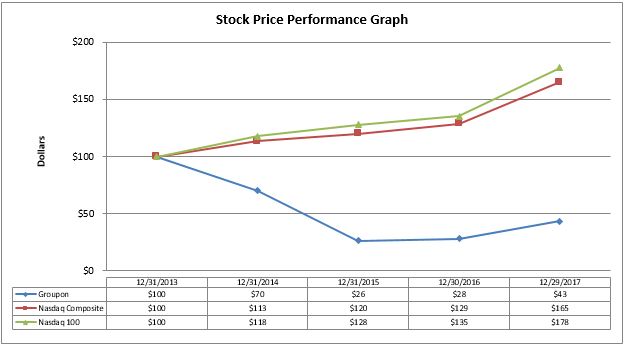
Source: Yahoo! Finance
31
ITEM 6: SELECTED FINANCIAL DATA
| Year Ended December 31, | ||||||||||||||||||
| 2017 | | 2016 | | 2015 | | 2014 | | 2013 | ||||||||||
| (in thousands, except share and per share amounts) | ||||||||||||||||||
Consolidated Statements of Operations Data (1) : |
|
|
|
|
|
|
|
|
| ||||||||||
Revenue: |
|
|
|
|
|
|
|
|
| ||||||||||
Third-party and other | $ | 1,266,452 | |
| $ | 1,206,441 | |
| $ | 1,250,149 | |
| $ | 1,353,948 | |
| $ | 1,453,630 | |
Direct | 1,577,425 | |
| 1,807,174 | |
| 1,704,667 | |
| 1,504,698 | |
| 898,529 | | |||||
Total revenue | 2,843,877 | |
| 3,013,615 | |
| 2,954,816 | |
| 2,858,646 | |
| 2,352,159 | | |||||
Cost of revenue: |
|
|
|
|
|
|
|
|
| ||||||||||
Third-party and other | 160,810 | |
| 150,031 | |
| 158,095 | |
| 173,204 | |
| 173,079 | | |||||
Direct | 1,349,206 | |
| 1,582,931 | |
| 1,508,911 | |
| 1,339,881 | |
| 837,679 | | |||||
Total cost of revenue | 1,510,016 | |
| 1,732,962 | |
| 1,667,006 | |
| 1,513,085 | |
| 1,010,758 | | |||||
Gross profit | 1,333,861 | |
| 1,280,653 | |
| 1,287,810 | |
| 1,345,561 | |
| 1,341,401 | | |||||
Operating expenses: |
|
|
|
|
|
|
|
|
| ||||||||||
Marketing | 400,918 | |
| 352,175 | |
| 241,342 | |
| 227,855 | |
| 194,184 | | |||||
Selling, general and administrative | 901,781 | |
| 994,027 | |
| 1,100,528 | |
| 1,080,199 | |
| 1,048,867 | | |||||
Restructuring charges | 18,828 | |
| 40,438 | |
| 28,464 | |
| - | |
| - | | |||||
Gain on sale of intangible assets | (17,149 | ) |
| - | |
| - | |
| - | |
| - | | |||||
Gains on business dispositions | - | |
| (11,399 | ) |
| (13,710 | ) |
| - | |
| - | | |||||
Acquisition-related expense (benefit), net | 48 | |
| 5,650 | |
| 1,857 | |
| 1,269 | |
| (11 | ) | |||||
Total operating expenses | 1,304,426 | |
| 1,380,891 | |
| 1,358,481 | |
| 1,309,323 | |
| 1,243,040 | | |||||
Income (loss) from operations | 29,435 | |
| (100,238 | ) |
| (70,671 | ) |
| 36,238 | |
| 98,361 | | |||||
Other income (expense), net | 6,710 | |
| (71,289 | ) |
| (25,586 | ) |
| (31,655 | ) |
| (93,319 | ) | |||||
Income (loss) from continuing operations before provision (benefit) for income taxes | 36,145 | |
| (171,527 | ) |
| (96,257 | ) |
| 4,583 | |
| 5,042 | | |||||
Provision (benefit) for income taxes | 7,544 | |
| (5,318 | ) |
| (23,010 | ) |
| 15,308 | |
| 68,980 | | |||||
Income (loss) from continuing operations | 28,601 | |
| (166,209 | ) |
| (73,247 | ) |
| (10,725 | ) |
| (63,938 | ) | |||||
Income (loss) from discontinued operations, net of tax | (1,974 | ) |
| (17,114 | ) |
| 106,926 | |
| (53,194 | ) |
| (25,008 | ) | |||||
Net income (loss) | 26,627 | |
| (183,323 | ) |
| 33,679 | |
| (63,919 | ) | | (88,946 | ) | |||||
Net income attributable to noncontrolling interests | (12,587 | ) |
| (11,264 | ) |
| (13,011 | ) |
| (9,171 | ) |
| (6,447 | ) | |||||
Net income (loss) attributable to Groupon, Inc. | $ | 14,040 | |
| $ | (194,587 | ) |
| $ | 20,668 | |
| $ | (73,090 | ) |
| $ | (95,393 | ) |
|
|
|
|
|
|
|
|
|
| ||||||||||
Basic net income (loss) per share (2) : |
|
|
|
|
|
|
|
|
| ||||||||||
Continuing operations | $ | 0.03 | |
| $ | (0.31 | ) |
| $ | (0.13 | ) |
| $ | (0.03 | ) |
| $ | (0.11 | ) |
Discontinued operations | (0.00 | ) |
| (0.03 | ) |
| 0.16 | |
| (0.08 | ) |
| (0.03 | ) | |||||
Basic net income (loss) per share | $ | 0.03 | |
| $ | (0.34 | ) |
| $ | 0.03 | |
| $ | (0.11 | ) |
| $ | (0.14 | ) |
|
|
|
|
|
|
|
|
|
| ||||||||||
Diluted net income (loss) per share (2) : |
|
|
|
|
|
|
|
|
| ||||||||||
Continuing operations | $ | 0.03 | |
| $ | (0.31 | ) |
| $ | (0.13 | ) |
| $ | (0.03 | ) |
| $ | (0.11 | ) |
Discontinued operations | (0.01 | ) |
| (0.03 | ) |
| 0.16 | |
| (0.08 | ) |
| (0.03 | ) | |||||
Diluted net income (loss) per share | $ | 0.02 | |
| $ | (0.34 | ) |
| $ | 0.03 | |
| $ | (0.11 | ) |
| $ | (0.14 | ) |
|
|
|
|
|
|
|
|
|
| ||||||||||
Weighted average number of shares outstanding (2) |
|
|
|
|
|
|
|
|
| ||||||||||
Basic | 559,367,075 | |
| 576,354,258 | |
| 650,106,225 | |
| 674,832,393 | |
| 663,910,194 | | |||||
Diluted | 568,418,371 | |
| 576,354,258 | |
| 650,106,225 | |
| 674,832,393 | |
| 663,910,194 | | |||||
(1) | The consolidated statements of operations data for prior years has been retrospectively adjusted to reflect discontinued operations. Refer to Note 3, Discontinued Operations and Other Business Dispositions , for additional information. |
(2) | The structure of the Company's common stock changed during the year ended December 31, 2016. Refer to Note 11, Stockholders' Equity , and Note 17, Income (Loss) per Share , for additional information. |
32
| As of December 31, | ||||||||||||||||||
| 2017 |
| 2016 |
| 2015 |
| 2014 |
| 2013 | ||||||||||
| (in thousands) | ||||||||||||||||||
Consolidated Balance Sheet Data: |
|
|
|
|
|
|
|
|
| ||||||||||
Cash and cash equivalents | $ | 880,129 | |
| $ | 862,977 | |
| $ | 824,307 | |
| $ | 982,862 | |
| $ | 1,192,439 | |
Working capital (deficit) | (61,051 | ) |
| (121,115 | ) |
| (128,283 | ) |
| 91,460 | |
| 394,340 | | |||||
Total assets | 1,677,505 | |
| 1,761,377 | |
| 1,796,264 | |
| 2,227,597 | |
| 2,042,010 | | |||||
Total long-term liabilities | 292,161 | |
| 283,264 | |
| 122,152 | |
| 169,055 | |
| 142,550 | | |||||
Total Groupon, Inc. Stockholders' Equity | 250,973 | |
| 264,420 | |
| 469,398 | |
| 762,826 | |
| 713,651 | | |||||
33
ITEM 7. MANAGEMENT'S DISCUSSION AND ANALYSIS OF FINANCIAL CONDITION AND RESULTS OF OPERATIONS
The following discussion and analysis of our financial condition and results of operations should be read together with our consolidated financial statements and related notes included under Item 8 of this Annual Report on Form 10-K. This discussion contains forward-looking statements about our business and operations. Our actual results may differ materially from those we currently anticipate as a result of many factors, including those we describe under "Risk Factors" and elsewhere in this Annual Report.
Overview
Groupon operates online local commerce marketplaces throughout the world that connect merchants to consumers by offering goods and services, generally at a discount. Consumers access those marketplaces through our websites, primarily localized groupon.com sites in many countries, and our mobile applications. Traditionally, local merchants have tried to reach consumers and generate sales through a variety of methods, including online advertising, paid telephone directories, direct mail, newspaper, radio, television and other promotions. By bringing the brick and mortar world of local commerce onto the Internet, Groupon is helping local merchants to attract customers and sell goods and services. We provide consumers with savings and help them discover what to do, eat, see and buy and where to travel.
We offer goods and services through our online local commerce marketplaces in three primary categories: Local, Goods and Travel. During 2017, we began shifting more of the focus on our websites and mobile applications in North America to offerings in our Local category, which we believe provides us with the greatest opportunity for long-term gross profit growth. As part of our growth strategy, we have also been developing and testing a number of product enhancements during the current year that are intended to make our offerings easier to use for both customers and merchants, including voucherless offerings that are linked to customer credit cards.
Our revenue from transactions in which we act as a third-party marketing agent is the purchase price paid by the customer, generally for a Groupon voucher, less the purchase price paid to the merchant. Our direct revenue from transactions in which we sell merchandise inventory in our Goods category is the purchase price paid by the customer. We generated revenue of $2,843.9 million during the year ended December 31, 2017 , as compared to $3,013.6 million during the year ended December 31, 2016 .
In October 2016, we completed a strategic review of our international markets in connection with our efforts to optimize our global footprint and focus on the markets that we believe to have the greatest potential to benefit our long-term financial performance. Based on that review, we decided to focus our business on 15 core countries, which are primarily based in North America and EMEA, and to pursue strategic alternatives for our operations in the remaining 11 countries, which were primarily based in Asia and Latin America. The dispositions of our operations in those 11 countries were completed between November 2016 and March 2017. A business disposition that represents a strategic shift and has (or will have) a major effect on an entity's operations and financial results is reported as a discontinued operation. We determined that the decision reached by our management and Board of Directors to exit those 11 non-core countries, which comprised a substantial majority of our operations outside of North America and EMEA, represented a strategic shift in our business. Based on our review of quantitative and qualitative factors, we also determined that the disposition of the businesses in those 11 countries would have a major effect on our operations and financial results. As such, the financial results of our operations in those countries, including gains and losses on the dispositions, are presented as discontinued operations in our consolidated statements of operations. Unless otherwise stated, all financial information discussed herein represents results from continuing operations.
We previously organized our operations into three operating segments: North America, EMEA and Rest of World. As a result of the dispositions discussed above, which represented a substantial majority of our international operations outside of EMEA and resulted in changes to our internal reporting and leadership structure, we updated our segment disclosures in the first quarter of 2017 to report two operating segments: North America and International. See Note 18, Segment Information, for further information. For the year ended December 31, 2017 , we derived 67.3% of our revenue from our North America segment and 32.7% of our revenue from our International segment .
In September 2015, we commenced a restructuring plan relating primarily to workforce reductions in our international operations. We also undertook workforce reductions in our North America segment. See Note 13, Restructuring , for additional information. In addition to workforce reductions in our ongoing markets, we ceased operations in 17 countries within our International segment from September 2015 through March 2016 in connection with our restructuring actions. Those country exits, which generally comprised our smallest international markets, resulted from a series of separate decisions made at different times during that period that were not part of an overall strategic shift. As a result of the restructuring actions that we have taken,
34
our operating expenses have decreased significantly in recent periods on a year-over-year basis. The actions under our restructuring plan were completed as of September 30, 2017.
How We Measure Our Business
We measure our business with several financial and operating metrics. We use those metrics to assess the progress of our business and make decisions on where to allocate capital, time and technology investments. Certain of the financial metrics are reported in accordance with U.S. GAAP and certain of those metrics are considered non-GAAP financial measures. As our business evolves, we may make changes in future periods to the key financial and operating metrics that we use to measure our business. For further information and reconciliations to the most applicable financial measures under U.S. GAAP, refer to our discussion under Non-GAAP Financial Measures in the Results of Operations section.
Financial Metrics
• | Gross billings. This metric represents the total dollar value of customer purchases of goods and services. For third- party revenue transactions, gross billings differs from third-party revenue reported in our consolidated statements of operations, which is presented net of the merchant's share of the transaction price. For direct revenue transactions, gross billings are equivalent to direct revenue reported in our consolidated statements of operations. We consider this metric to be an important indicator of our growth and business performance as it measures the dollar volume of transactions generated through our marketplaces. Tracking gross billings on third-party revenue transactions also allows us to monitor the percentage of gross billings that we are able to retain after payments to merchants. |
• | Revenue. Third-party revenue, which is earned from transactions in which we act as a marketing agent, is reported on a net basis as the purchase price received from the customer less an agreed upon portion of the purchase price paid to the featured merchant. Direct revenue, which is earned from sales of merchandise inventory directly to customers through our online marketplaces, is reported on a gross basis as the purchase price received from the customer. |
• | Gross profit . Gross profit reflects the net margin earned after deducting our cost of revenue from our revenue. Due to the lack of comparability between third-party revenue, which is presented net of the merchant's share of the transaction price, and direct revenue, which is reported on a gross basis, we believe that gross profit is an important measure for evaluating our performance. |
• | Adjusted EBITDA . Adjusted EBITDA is a non-GAAP financial measure that we define as net income (loss) from continuing operations excluding income taxes, interest and other non-operating items, depreciation and amortization, stock-based compensation, acquisition-related expense (benefit), net and other special charges and credits, including items that are unusual in nature or infrequently occurring. For further information and a reconciliation to Income (loss) from continuing operations, refer to our discussion under Non-GAAP Financial Measures in the Results of Operations section. |
• | Free cash flow. Free cash flow is a non-GAAP financial measure that comprises net cash provided by (used in) operating activities from continuing operations less purchases of property and equipment and capitalized software from continuing operations. For further information and a reconciliation to Net cash provided by (used in) operating activities from continuing operations, refer to our discussion in the Liquidity and Capital Resources section. |
The following table presents the above financial metrics for the years ended December 31, 2017 , 2016 and 2015 (in thousands):
|
| Year Ended December 31, | ||||||||||
|
| 2017 |
| 2016 |
| 2015 | ||||||
Gross billings |
| $ | 5,645,898 | |
| $ | 5,687,714 | |
| $ | 5,738,567 | |
Revenue |
| 2,843,877 | |
| 3,013,615 | |
| 2,954,816 | | |||
Gross profit |
| 1,333,861 | |
| 1,280,653 | |
| 1,287,810 | | |||
Adjusted EBITDA |
| 249,939 | |
| 179,883 | |
| 257,925 | | |||
Free cash flow |
| 78,339 | |
| 60,641 | |
| 234,467 | | |||
35
Operating Metrics
• | Active customers. We have historically defined active customers as unique user accounts that have made a purchase through one of our online marketplaces during the trailing twelve months ("TTM"). As a result of our ongoing development and testing of voucherless offerings that are linked to customer credit cards, we have updated our definition of active customers as follows: unique user accounts that have made a purchase during the TTM either through one of our online marketplaces or directly with a merchant for which we earned a commission. This change in definition did not have a significant impact on our active customer count for the TTM ended December 31, 2017. We consider this metric to be an important indicator of our business performance as it helps us to understand how the number of customers actively purchasing our offerings is trending. Some customers could establish and make purchases from more than one account, so it is possible that our active customer metric may count certain customers more than once in a given period. For entities that we have acquired in a business combination, this metric includes active customers of the acquired entity, including customers who made purchases prior to the acquisition. |
• | Gross billings and gross profit per average active customer. These metrics represent the TTM gross billings and gross profit generated per average active customer. We use these metrics to evaluate average customer spend and the resulting gross profit. |
• | Units . This metric has historically represented the number of purchases made through our online marketplaces, before refunds and cancellations. As a result of our ongoing development and testing of voucherless offerings that are linked to customer credit cards, we have updated our definition of units as follows: purchases during the reporting period, before refunds and cancellations, made either through one of our online marketplaces or directly with a merchant for which we earned a commission. This change in definition did not have a significant impact on our unit count for the year ended December 31, 2017. We consider unit growth to be an important indicator of the total volume of business conducted through our marketplaces. |
Our active customers and gross billings per average active customer for the TTM ended December 31, 2017 , 2016 and 2015 were as follows:
|
| Trailing twelve months ended December 31, | ||||||||||
|
| 2017 |
| 2016 (1) |
| 2015 (1) | ||||||
TTM Active customers (in thousands) |
| 49,536 | |
| 47,881 | |
| 43,663 | | |||
TTM Gross billings per average active customer |
| $ | 115.91 | |
| $ | 124.26 | |
| $ | 133.94 | |
TTM Gross profit per average active customer |
| $ | 27.38 | |
| $ | 27.98 | |
| $ | 30.06 | |
(1) | TTM Active customers has decreased from 52.8 million active customers previously reported to 47.9 million active customers for the year ended December 31, 2016 and from 48.9 million active customers to 43.7 million for the year ended December 31, 2015 due to the exclusion of customers from our operations in 11 countries that have been presented as discontinued operations. The exclusion of those countries' gross billings and active customers increased the TTM gross billings per average active customer from $119.97 previously reported to $124.26 for the year ended December 31, 2016 and from $129.98 previously reported to $133.94 for the year ended December 31, 2015 . |
Our units for the years ended December 31, 2017 , 2016 and 2015 were as follows:
|
| Year Ended December 31, | |||||||
|
| 2017 |
| 2016 (1) |
| 2015 (1) | |||
Units (in thousands) |
| 188,905 | |
| 195,646 | |
| 198,409 | |
(1) | Units have been reduced from 214.3 million to 195.6 million for the year ended December 31, 2016 and from 220.8 million to 198.4 million for the year ended December 31, 2015 due to the exclusion of the units from our operations in 11 countries that have been presented as discontinued operations. |
Factors Affecting Our Performance
Attracting and Retaining Local Merchants. As we seek to build a more complete online local commerce marketplace platform, we depend on our ability to attract and retain merchants who are willing to offer discounted products and services through our marketplaces. Additionally, merchants can generally withdraw their offerings from our marketplaces at any time and their willingness to continue offering products and services through our platform depends on the effectiveness of our marketing and promotional services. We primarily source the deal offerings available on our marketplaces through our sales teams, which comprise a significant portion of our global employee base. We have also entered into commercial agreements with third parties that enable
36
us to feature additional merchant offerings through our marketplaces. We continue to focus much of our sales efforts on sourcing local deal offerings in subcategories that we believe provide us with the best opportunities for high frequency customer purchase behavior. In connection with our efforts to grow our offerings in those high frequency subcategories, which include food and drink, health, beauty and wellness, and events and activities, we may be willing to offer more attractive terms to local merchants that could reduce our deal margins in future periods.
Growing our Active Customer Base and Customer Value. We must continue to acquire and retain customers and improve gross profit per customer in order to grow our business. We significantly increased our marketing spending throughout 2016 and 2017 in order to drive customer growth and we expect that trend to continue. Our marketing spending in those years included significant investments in offline campaigns intended to increase customer awareness and understanding of the Groupon brand and our product and service offerings. The organic traffic to our websites and mobile applications, including organic traffic from consumers responding to our emails, has declined in recent years, such that an increasing proportion of our traffic is generated from paid marketing channels, such as search engine marketing. As such, we are focused on developing sources of organic traffic other than email and on optimizing the efficiency of our marketing spending, which is primarily guided by return on investment thresholds that are currently based on expected months-to-payback targets ranging from 12 to 18 months. Additionally, we consider order discounts and certain other initiatives to drive customer acquisition and activation to be marketing-related activities, even though such activities may not be presented as marketing expenses in our consolidated statements of operations.
Investing in Growth. We have invested significantly in product and technology enhancements intended to support the growth of our online local marketplaces and we intend to continue to do so in the future. We have also invested in business acquisitions to grow our merchant and customer base and advance our product and technology capabilities. We are currently developing and testing a number of product enhancements intended to make our offerings easier to use for both customers and merchants, including voucherless offerings that are linked to customer credit cards, which we refer to as Groupon+, and functionality enabling appointment booking at the time an offering is purchased. While we believe that those initiatives may be important drivers for increasing customer purchase frequency and growing our business over time, they are not expected to significantly impact our performance in the near term, as we are currently focusing our efforts on growing customer awareness of the products and scaling the related merchant base. Additionally, Groupon+ offerings provide cash back on the customer's credit card and involve Groupon collecting a net fee from the merchant, rather than selling a voucher to the customer and then remitting a portion of the proceeds to the merchant. As we report sales of vouchers to customers as gross billings, the growth of Groupon+ transactions in future periods could adversely impact our gross billings trends.
Continuing to Focus on Managing our Operating Efficiency. We are focused on effectively managing our cost structure as we seek to generate and grow our profits in future periods. As a result of numerous divestitures and other exits from countries in which we previously operated, which were completed from 2015 through 2017, we reduced the global footprint of our operations from 47 countries to 15 countries. Additionally, we significantly reduced our global workforce over that period as a result of our restructuring actions. Those restructuring actions and our efforts to automate internal processes, which have allowed us to centralize many of our back office activities in lower cost shared service centers, resulted in significant reductions in our selling, general and administrative expenses during 2017 and 2016. We have primarily used those savings to invest in marketing and product enhancements intended to drive the growth of our business. Our restructuring actions were completed in September 2017. We intend to continue to focus on maintaining our operating efficiency.
Results of Operations
Gross Billings
Gross billings represents the total dollar value of customer purchases of goods and services. Gross billings is presented net of customer refunds, order discounts and sales and related taxes. In our Goods category, we generate gross billings from direct revenue transactions in which we sell merchandise inventory directly to customers, as well as third-party revenue transactions in which third-party merchants sell products through our marketplaces.
37
Comparison of the Years Ended December 31, 2017 and 2016 :
Gross billings for the years ended December 31, 2017 and 2016 were as follows:
| Year Ended December 31, | |||||||||||||
| 2017 |
| 2016 |
| $ Change |
| % Change | |||||||
| (dollars in thousands) | |||||||||||||
Gross billings: |
|
|
|
|
|
|
| |||||||
Third-party | $ | 3,991,579 | |
| $ | 3,798,441 | |
| $ | 193,138 | |
| 5.1 | % |
Direct | 1,577,425 | |
| 1,807,174 | |
| (229,749 | ) |
| (12.7 | ) | |||
Other | 76,894 | |
| 82,099 | |
| (5,205 | ) |
| (6.3 | ) | |||
Total gross billings | $ | 5,645,898 | |
| $ | 5,687,714 | |
| $ | (41,816 | ) |
| (0.7 | ) |
The effect on our gross billings for the year ended December 31, 2017 from changes in exchange rates versus the U.S. dollar was as follows:
|
| Year Ended December 31, 2017 | ||||||||||
|
| At Avg. |
| Exchange |
|
| ||||||
|
| 2016 |
| Rate |
| As | ||||||
|
| Rates (1) |
| Effect (2) |
| Reported | ||||||
|
| (in thousands) | ||||||||||
Gross billings |
| $ | 5,619,119 | |
| $ | 26,779 | |
| $ | 5,645,898 | |
(1) | Represents the financial statement balances that would have resulted had exchange rates in the reporting period been the same as those in effect in the prior year period. |
(2) | Represents the increase or decrease in the reported amount resulting from changes in exchange rates from those in effect in the prior year period. |
The decrease in gross billings for the year ended December 31, 2017 primarily resulted from an $8.7 million decrease in our North America segment and a $33.1 million decrease in our International segment. See below for information about gross billings by segment.
Gross Billings by Segment
Gross billings by segment for the years ended December 31, 2017 and 2016 were as follows:
| Year Ended December 31, | |||||||||||||
| 2017 |
| 2016 |
| $ Change |
| % Change | |||||||
| (dollars in thousands) | |||||||||||||
North America: |
|
|
|
|
|
|
| |||||||
Local - Third-party and other | $ | 2,415,243 | |
| $ | 2,203,514 | |
| $ | 211,729 | |
| 9.6 | % |
Goods: |
|
|
|
|
|
|
| |||||||
Third-party | 114,638 | |
| 42,696 | |
| 71,942 | |
| 168.5 | | |||
Direct | 993,326 | |
| 1,297,810 | |
| (304,484 | ) |
| (23.5 | ) | |||
Travel - Third-party | 404,523 | |
| 392,401 | |
| 12,122 | |
| 3.1 | | |||
Total North America gross billings | 3,927,730 | |
| 3,936,421 | |
| (8,691 | ) |
| (0.2 | ) | |||
|
|
|
|
|
|
|
| |||||||
International: |
|
|
|
|
|
|
| |||||||
Local - Third-party and other | 812,785 | |
| 802,403 | |
| 10,382 | |
| 1.3 | | |||
Goods: |
|
|
|
|
|
|
| |||||||
Third-party | 112,639 | |
| 200,331 | |
| (87,692 | ) |
| (43.8 | ) | |||
Direct | 584,099 | |
| 509,364 | |
| 74,735 | |
| 14.7 | | |||
Travel - Third-party | 208,645 | |
| 239,195 | |
| (30,550 | ) |
| (12.8 | ) | |||
Total International gross billings | 1,718,168 | |
| 1,751,293 | |
| (33,125 | ) |
| (1.9 | ) | |||
Total gross billings | $ | 5,645,898 | |
| $ | 5,687,714 | |
| $ | (41,816 | ) |
| (0.7 | ) |
38
The percentages of gross billings by segment for the years ended December 31, 2017 and 2016 were as follows:
2017 |
| 2016 |
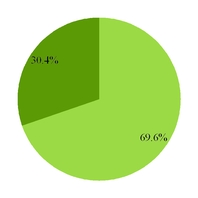
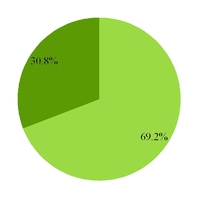
| North America |
|
| International |
North America
North America gross billings for the year ended December 31, 2017 were substantially consistent with the prior year, reflecting a $232.5 million decrease in our Goods category offset by increases of $211.7 million in our Local category and $12.1 million in our Travel category. Factors impacting North America segment gross billings included the following:
• | We shifted more of the focus on our websites and mobile applications toward offerings in our Local category in connection with our efforts to drive gross profit growth, which contributed to the decrease in Goods gross billings and the increase in Local gross billings; |
• | Our active customers increased, driven by our continued investments in customer acquisition marketing; |
• | LivingSocial, which we acquired during the fourth quarter of 2016, generated incremental gross billings of $75.7 million in Local, $12.8 million in Goods, and $11.7 million in Travel for the full year ended December 31, 2017 , as compared to the gross billings generated during the two-month period following its acquisition in the prior year; and |
• | Average customer spend decreased, as gross billings per average active customer were $122.71 for the year ended December 31, 2017 , as compared to $139.94 in the prior year. |
Order discounts, which are presented as a reduction of gross billings and revenue, decreased by $2.5 million to $164.7 million for the year ended December 31, 2017 , as compared to $167.2 million in the prior year.
International
International gross billings decrease d in 2017, reflecting a $13.0 million decrease in our Goods category and a $30.6 million decrease in our Travel category, partially offset by an increase of $10.4 million in our Local category. Factors impacting International segment gross billings included the following:
• | We shifted more of the focus on our websites and mobile applications toward offerings in our Local category in connection with our efforts to drive gross profit growth, which contributed to the decrease in Travel gross billings and the increase in Local gross billings; |
• | We substantially eliminated Goods offerings from our marketplaces in Japan and Poland in connection with our efforts to de-emphasize lower margin product offerings, which resulted in a $13.0 million year-over-year reduction in Goods gross billings; |
• | Our active customers increased, driven by our continued investments in customer acquisition marketing; |
• | Average customer spend was flat, as gross billings per average active customer were $103.29 for the year ended December 31, 2017 , as compared to $103.03 in the prior year; and |
• | There was a $26.4 million favorable impact from year-over-year changes in foreign currency rates. |
Order discounts, which are presented as a reduction of gross billings and revenue, increased by $0.5 million to $43.3 million for the year ended December 31, 2017 , as compared to $42.8 million in the prior year.
39
Comparison of the Years Ended December 31, 2016 and 2015 :
Gross billings for the years ended December 31, 2016 and 2015 were as follows:
| Year Ended December 31, | |||||||||||||
| 2016 |
| 2015 |
| $ Change |
| % Change | |||||||
| (dollars in thousands) | |||||||||||||
Gross billings: |
|
|
|
|
|
|
| |||||||
Third-party | $ | 3,798,441 | |
| $ | 3,977,781 | |
| $ | (179,340 | ) |
| (4.5 | )% |
Direct | 1,807,174 | |
| 1,704,667 | |
| 102,507 | |
| 6.0 | | |||
Other | 82,099 | |
| 56,119 | |
| 25,980 | |
| 46.3 | | |||
Total gross billings | $ | 5,687,714 | |
| $ | 5,738,567 | |
| $ | (50,853 | ) |
| (0.9 | ) |
The effect on our gross billings for the year ended December 31, 2016 from changes in exchange rates versus the U.S. dollar was as follows:
|
| Year Ended December 31, 2016 | ||||||||||
|
| At Avg. |
| Exchange |
|
| ||||||
|
| 2015 |
| Rate |
| As | ||||||
|
| Rates (1) |
| Effect (2) |
| Reported | ||||||
|
| (in thousands) | ||||||||||
Gross billings |
| $ | 5,716,789 | |
| $ | (29,075 | ) |
| $ | 5,687,714 | |
(1) | Represents the financial statement balances that would have resulted had exchange rates in the reporting period been the same as those in effect in the prior year period. |
(2) | Represents the increase or decrease in the reported amount resulting from changes in exchange rates from those in effect in the prior year period. |
The decrease in gross billings for the year ended December 31, 2016 primarily resulted from a $277.5 million decrease in our International segment, partially offset by a $226.6 million increase in our North America segment.
Gross Billings by Segment
Gross billings by segment for the years ended December 31, 2016 and 2015 were as follows:
| Year Ended December 31, | |||||||||||||
| 2016 |
| 2015 |
| $ Change |
| % Change | |||||||
| (dollars in thousands) | |||||||||||||
North America: |
|
|
|
|
|
|
| |||||||
Local - Third-party and other | $ | 2,203,514 | |
| $ | 2,024,698 | |
| $ | 178,816 | |
| 8.8 | % |
Goods: |
|
|
|
|
|
|
| |||||||
Third-party | 42,696 | |
| 36,775 | |
| 5,921 | |
| 16.1 | | |||
Direct | 1,297,810 | |
| 1,257,548 | |
| 40,262 | |
| 3.2 | | |||
Travel - Third-party | 392,401 | |
| 390,776 | |
| 1,625 | |
| 0.4 | | |||
Total North America gross billings | 3,936,421 | |
| 3,709,797 | |
| 226,624 | |
| 6.1 | | |||
|
|
|
|
|
|
|
| |||||||
International: |
|
|
|
|
|
|
| |||||||
Local - Third-party and other | 802,403 | |
| 929,430 | |
| (127,027 | ) |
| (13.7 | ) | |||
Goods: |
|
|
|
|
|
|
| |||||||
Third-party | 200,331 | |
| 368,802 | |
| (168,471 | ) |
| (45.7 | ) | |||
Direct | 509,364 | |
| 447,119 | |
| 62,245 | |
| 13.9 | | |||
Travel - Third-party | 239,195 | |
| 283,419 | |
| (44,224 | ) |
| (15.6 | ) | |||
Total International gross billings | 1,751,293 | |
| 2,028,770 | |
| (277,477 | ) |
| (13.7 | ) | |||
Total gross billings | $ | 5,687,714 | |
| $ | 5,738,567 | |
| $ | (50,853 | ) |
| (0.9 | ) |
40
The percentages of gross billings by segment for the years ended December 31, 2016 and 2015 were as follows:
2016 |
| 2015 |

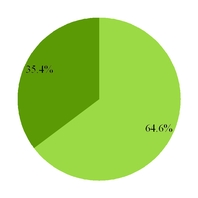
| North America |
|
| International |
North America
The overall increase in North America segment gross billings reflects increases in our Local and Goods categories. Those increases were primarily attributable to the following:
• | our significant incremental marketing spend to accelerate customer growth. North America marketing expense increased by $ 102.3 million , 63.6% , for the year ended December 31, 2016 , as compared to the prior year period, driving a significant increase in active customers during 2016; and |
• | our focus on increasing the coverage of our offerings and improving the quality of offerings available through our marketplaces. |
These items resulted in increases to both active customers and units sold in North America. Those increases were partially offset by increased order discounts and lower gross billings per average active customer. Order discounts increased $42.0 million to $167.2 million for the year ended December 31, 2016 , as compared to $125.2 million for the prior year. Our new customer additions contributed to lower gross billings per average active customer in North America as those new customers did not yet have a full twelve months of purchasing history.
Gross billings in our North America Goods category increased by 3.6% during the year ended December 31, 2016 , as compared to the prior year. This represented a lower rate of growth than our Goods category had historically generated, which we believe resulted, in part, from our strategic initiative to de-emphasize lower margin product offerings in that category.
The gross billings from Living Social were $22.7 million from its October 31, 2016 acquisition date through December 31, 2016 .
International
The overall decrease in International segment gross billings reflects decreases across our Local, Travel and Goods categories. The decrease in International gross billings was primarily attributable to the following:
• | a $182.6 million reduction related to countries that we operated in during the prior year period and have subsequently exited as part of our restructuring plan and the disposition of our operations in Russia, India and Indonesia; |
• | a $28.0 million unfavorable impact from year-over-year changes in foreign currency exchange rates; and |
• | the substantial elimination of Goods offerings from our marketplace in Japan during the second half of 2016, which we undertook in connection with our strategic initiative to de-emphasize lower margin product offerings. |
Additionally, although International active customers increased, units sold and gross billings per average active customer decreased as compared to the year ended December 31, 2015 . Those decreases were driven by the countries we exited as part of our restructuring plan. The overall decrease in International segment gross billings was partially offset by an increase in direct revenue transactions in our Goods category.
41
Revenue
Third-party revenue arises from transactions in which we are acting as a marketing agent primarily by selling vouchers through our online local commerce marketplaces that can be redeemed for goods or services with third-party merchants. Our third-party revenue from those transactions is reported on a net basis as the purchase price received from the customer, less an agreed upon portion of the purchase price paid to the merchant.
Direct revenue arises from transactions in our Goods category in which we sell merchandise inventory directly to customers through our online marketplaces. The direct revenue that we earn from those transactions is reported on a gross basis as the purchase price we receive from the customer.
Other revenue primarily consists of commission revenue earned when customers make purchases with retailers using digital coupons accessed through our websites and mobile applications and advertising revenue. In the current year, other revenue includes commissions from merchants from voucherless offerings that are linked to customer credit cards. In prior periods, other revenue also included payment processing revenue.
Comparison of the Years Ended December 31, 2017 and 2016 :
Revenue for the years ended December 31, 2017 and 2016 was as follows:
| Year Ended December 31, | |||||||||||||
| 2017 |
| 2016 |
| $ Change |
| % Change | |||||||
| ( dollars in thousands) | |||||||||||||
Revenue: |
|
|
|
|
|
|
| |||||||
Third-party | $ | 1,189,558 | |
| $ | 1,124,342 | |
| $ | 65,216 | |
| 5.8 | % |
Direct | 1,577,425 | |
| 1,807,174 | |
| (229,749 | ) |
| (12.7 | ) | |||
Other | 76,894 | |
| 82,099 | |
| (5,205 | ) |
| (6.3 | ) | |||
Total revenue | $ | 2,843,877 | |
| $ | 3,013,615 | |
| $ | (169,738 | ) |
| (5.6 | ) |
The effect on revenue for the year ended December 31, 2017 from changes in exchange rates versus the U.S. dollar was as follows:
| Year Ended December 31, 2017 | ||||||||||
| At Avg. 2016 Rates (1) |
| Exchange Rate Effect (2) |
| As Reported | ||||||
| (in thousands) | ||||||||||
Revenue | $ | 2,825,004 | |
| $ | 18,873 | |
| $ | 2,843,877 | |
(1) | Represents the financial statement balance that would have resulted had exchange rates in the reporting period been the same as those in effect in the prior year period. |
(2) | Represents the increase or decrease in the reported amount resulting from changes in exchange rates from those in effect in the prior year period. |
The decrease in total revenue for the year ended December 31, 2017 resulted from a $237.6 million decrease in our North America segment, partially offset by a $67.9 million increase in our International segment. See below for information about revenue by segment.
42
Revenue by Segment
Revenue by category and segment for the years ended December 31, 2017 and 2016 was as follows:
| Year Ended December 31, | |||||||||||||
| 2017 |
| 2016 |
| $ Change |
| % Change | |||||||
| (dollars in thousands) | |||||||||||||
North America: |
|
|
|
|
|
|
| |||||||
Local - Third-party and other | $ | 825,579 | |
| $ | 762,314 | |
| $ | 63,265 | |
| 8.3 | % |
Goods: |
|
|
|
|
|
|
| |||||||
Third-party | 16,768 | |
| 9,068 | |
| 7,700 | |
| 84.9 | | |||
Direct | 993,326 | |
| 1,297,810 | |
| (304,484 | ) |
| (23.5 | ) | |||
Travel - Third-party | 78,495 | |
| 82,577 | |
| (4,082 | ) |
| (4.9 | ) | |||
Total North America revenue | 1,914,168 | |
| 2,151,769 | |
| (237,601 | ) |
| (11.0 | ) | |||
|
|
|
|
|
|
|
| |||||||
International: |
|
|
|
|
|
|
| |||||||
Local - Third-party and other | 281,466 | |
| 270,045 | |
| 11,421 | |
| 4.2 | | |||
Goods: |
|
|
|
| |
|
| |||||||
Third-party | 20,358 | |
| 32,681 | |
| (12,323 | ) |
| (37.7 | ) | |||
Direct | 584,099 | |
| 509,364 | |
| 74,735 | |
| 14.7 | | |||
Travel - Third-party | 43,786 | |
| 49,756 | |
| (5,970 | ) |
| (12.0 | ) | |||
Total International revenue | 929,709 | |
| 861,846 | |
| 67,863 | |
| 7.9 | | |||
Total revenue | $ | 2,843,877 | |
| $ | 3,013,615 | |
| $ | (169,738 | ) |
| (5.6 | ) |
The percentages of revenue by segment for the years ended December 31, 2017 and 2016 were as follows:
2017 |
| 2016 |
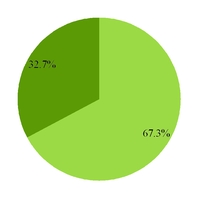
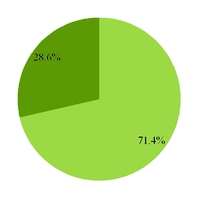
| North America |
|
| International |
43
The percentages of third-party and other gross billings that we retained after deducting the merchant's share for the years ended December 31, 2017 and 2016 were as follows:
North America |
| International |
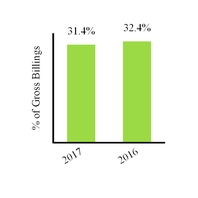
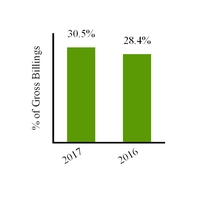
North America
The decrease in North America segment revenue for the year ended December 31, 2017 reflects a $296.8 million decrease in our Goods category. As discussed above, we are increasingly focusing the business on initiatives that are intended to optimize for gross profit to a greater extent than revenue, particularly in our North America segment, including shifting more of the focus on our websites and mobile applications toward offerings in our Local category. The resulting shift in North America gross billings away from our Goods category adversely impacted revenue in the current period, as direct revenue transactions in our Goods category are presented on a gross basis.
The decrease in revenue in our Goods category was partially offset by a $63.3 million increase in third-party and other revenue in our Local category. That increase i n Local revenue was primarily attributable to the increases in Local gross billings as discussed above. Additionally, there was a $5.5 million increase in breakage revenue from customer credits and gift cards for the year ended December 31, 2017 , as compared to the prior year.
The percentage of gross billings that we retained after deducting the merchant's share in third-party and other revenue transactions across our three categories decreased to 31.4% for the year ended December 31, 2017 , as compared to 32.4% in the prior year period. The percentage of gross billings that we retain after deducting the merchant's share reflects the overall results of individual deal-by-deal negotiations with merchants and can vary significantly from period-to-period.
LivingSocial, which we acquired during the fourth quarter of 2016, generated incremental revenue of $32.0 million in Local, $10.9 million in Goods, and $1.0 million in Travel for the full year ended December 31, 2017 , as compared to the revenue generated during the two-month period following its acquisition in the prior year.
International
The increase in International segment revenue for the year ended December 31, 2017 reflects a $62.4 million increase in our Goods category, which was primarily attributable to an increase in the percentage of direct revenue transactions in that category to total International revenue of 62.8% for the year ended December 31, 2017 , as compared to 59.1% in the prior year period. This increase favorably impacted revenue in the current period, as direct revenue transactions in our Goods category are presented on a gross basis.
The $11.4 million increase in our Local category and the $6.0 million decrease in our Travel category were primarily attributable to the related changes in gross billings, as discussed above. Additionally, other revenue transactions in our Local category increased during the current year due to commission revenue earned when customers make purchases with retailers using digital coupons accessed through our websites and mobile applications.
The percentage of gross billings that we retained after deducting the merchant's share on third party and other revenue transactions across our three categories increased to 30.5% for the year ended December 31, 2017 , as compared to 28.4% in the prior year period. The percentage of gross billings that we retain after deducting the merchant's share reflects the overall results of individual deal-by-deal negotiations with merchants and can vary significantly from period-to-period.
44
There was a $19.0 million favorable impact on International segment revenue from year-over-year changes in foreign exchange rates for the year ended December 31, 2017 .
Comparison of the Years Ended December 31, 2016 and 2015 :
Revenue for the years ended December 31, 2016 and 2015 was as follows:
| Year Ended December 31, | |||||||||||||
| 2016 |
| 2015 |
| $ Change |
| % Change | |||||||
| (dollars in thousands) | |||||||||||||
Revenue: |
|
|
|
|
|
|
| |||||||
Third-party | $ | 1,124,342 | |
| $ | 1,194,030 | |
| $ | (69,688 | ) |
| (5.8 | )% |
Direct | 1,807,174 | |
| 1,704,667 | |
| 102,507 | |
| 6.0 | | |||
Other | 82,099 | |
| 56,119 | |
| 25,980 | |
| 46.3 | | |||
Total revenue | $ | 3,013,615 | |
| $ | 2,954,816 | |
| $ | 58,799 | |
| 2.0 | |
The effect on revenue for the year ended December 31, 2016 from changes in exchange rates versus the U.S. dollar was as follows:
| Year Ended December 31, 2016 | ||||||||||
| At Avg. 2015 Rates (1) |
| Exchange Rate Effect (2) |
| As Reported | ||||||
| (in thousands) | ||||||||||
Revenue | $ | 3,024,390 | |
| $ | (10,775 | ) |
| $ | 3,013,615 | |
(1) | Represents the financial statement balance that would have resulted had exchange rates in the reporting period been the same as those in effect in the prior year period. |
(2) | Represents the increase or decrease in the reported amount resulting from changes in exchange rates from those in effect in the prior year period. |
The increase in total revenue for the year ended December 31, 2016 resulted from a $104.0 million increase in our North America segment, partially offset by a $45.2 million decrease in our International segment. See below for information about revenue by segment.
Revenue by Segment
Revenue by category and segment for the years ended December 31, 2016 and 2015 was as follows:
| Year Ended December 31, | |||||||||||||
| 2016 |
| 2015 |
| $ Change |
| % Change | |||||||
| (dollars in thousands) | |||||||||||||
North America: |
|
|
|
|
|
|
| |||||||
Local - Third-party and other | $ | 762,314 | |
| $ | 701,312 | |
| $ | 61,002 | |
| 8.7 | % |
Goods: |
|
|
|
|
|
|
| |||||||
Third-party | 9,068 | |
| 7,151 | |
| 1,917 | |
| 26.8 | | |||
Direct | 1,297,810 | |
| 1,257,548 | |
| 40,262 | |
| 3.2 | | |||
Travel - Third-party | 82,577 | |
| 81,731 | |
| 846 | |
| 1.0 | | |||
Total North America revenue | 2,151,769 | |
| 2,047,742 | |
| 104,027 | |
| 5.1 | | |||
|
|
|
|
|
|
|
| |||||||
International: |
|
|
|
|
|
|
| |||||||
Local - Third-party and other | 270,045 | |
| 335,112 | |
| (65,067 | ) |
| (19.4 | ) | |||
Goods: |
|
|
|
|
|
|
| |||||||
Third-party | 32,681 | |
| 65,361 | |
| (32,680 | ) |
| (50.0 | ) | |||
Direct | 509,364 | |
| 447,119 | |
| 62,245 | |
| 13.9 | | |||
Travel - Third-party | 49,756 | |
| 59,482 | |
| (9,726 | ) |
| (16.4 | ) | |||
Total International revenue | 861,846 | |
| 907,074 | |
| (45,228 | ) |
| (5.0 | ) | |||
Total revenue | $ | 3,013,615 | |
| $ | 2,954,816 | |
| $ | 58,799 | |
| 2.0 | |
45
The percentages of revenue by segment for the years ended December 31, 2016 and 2015 were as follows:
2016 |
| 2015 |


| North America |
|
| International |
The percentages of third-party and other gross billings that we retained after deducting the merchant's share for the years ended December 31, 2016 and 2015 were as follows:
North America |
| International |
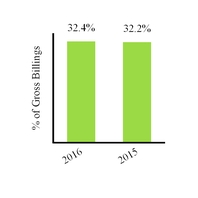
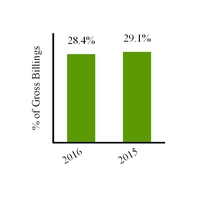
North America
The increase in North America segment revenue reflects increases in our Local and Goods categories. Those revenue increases resulted from the increases in gross billings. As discussed above, those increases were primarily attributable to our significant incremental marketing spend to accelerate customer growth, as well as our focus on increasing the coverage of our offerings and improving the quality of offerings available through our marketplaces. Additionally, other revenue transactions in our Local category increased during the year ended December 31, 2016 , which was primarily attributable to commission revenue earned when customers make purchases with retailers using digital coupons accessed through our websites and mobile applications.
The percentage of gross billings that we retained after deducting the merchant's share on third-party and other revenue transactions was 32.4% , which was consistent with the prior year.
The revenue from Living Social was $9.3 million from its October 31, 2016 acquisition date through December 31, 2016 .
We sell Groupon gift cards that can be used to make purchases through our online marketplaces. Those gift cards have no expiration dates and administrative fees are not charged on unused gift cards. During the fourth quarter of 2016, we concluded that we had developed sufficient historical evidence regarding the pattern of customer redemptions of Groupon gift cards to have the ability to estimate the portion of gift cards that will never be redeemed ("breakage"). As a result, we recorded $6.4 million of gift card breakage revenue for the year ended December 31, 2016, including $4.3 million attributed to third party and other revenue and $2.1 million attributed to direct revenue, which represented our estimate of cumulative gift card breakage through the balance sheet date based on the proportion of customer redemptions to total expected redemptions.
46
International
The decrease in International segment revenue reflects decreases in our Local and Travel categories and in third-party revenue transactions in our Goods category. Those revenue decreases were primarily attributable to the decreases in gross billings as discussed above in addition to the following:
• | the decreases in the percentage of gross billings that we retained after deducting the merchant's share for third-party and other revenue transactions. For the year ended December 31, 2016, that percentage decreased to 28.4% , as compared to 29.1% in the prior year. We have been willing to accept lower deal margins in order to improve the quality and increase the number of deals offered to our customers by offering more attractive terms to merchants; |
• | a $70.7 million reduction related to countries that we operated in during the prior year period and have subsequently exited as part of our restructuring plan and the dispositions of our operations in Russia, India and Indonesia; and |
• | a $10.5 million unfavorable impact on revenue from year-over-year changes in foreign currency exchange rates. |
Those decreases were partially offset by an increase in direct revenue transactions in our Goods category.
Cost of Revenue
For direct revenue transactions, cost of revenue includes the cost of inventory, shipping and fulfillment costs and inventory markdowns. Fulfillment costs are comprised of third-party logistics provider costs, as well as rent, depreciation, personnel costs and other costs of operating our fulfillment center. For third-party revenue transactions, cost of revenue includes estimated refunds for which the merchant's share is not recoverable. Other costs incurred to generate revenue, which include credit card processing fees, editorial costs, compensation expense for technology support personnel who are responsible for maintaining the infrastructure of our websites, amortization of internal-use software relating to customer-facing applications, web hosting and other processing fees, are attributed to cost of third-party revenue, direct revenue and other revenue in proportion to gross billings during the period.
Comparison of the Years Ended December 31, 2017 and 2016 :
Cost of revenue on third-party, direct revenue and other revenue for the years ended December 31, 2017 and 2016 was as follows:
|
| Year Ended December 31, | |||||||||||||
|
| 2017 |
| 2016 |
| $ Change |
| % Change | |||||||
|
| (dollars in thousands) | |||||||||||||
Cost of revenue: |
|
|
|
|
|
|
|
| |||||||
Third-party |
| $ | 159,825 | |
| $ | 142,975 | |
| $ | 16,850 | |
| 11.8 | % |
Direct |
| 1,349,206 | |
| 1,582,931 | |
| (233,725 | ) |
| (14.8 | ) | |||
Other |
| 985 | |
| 7,056 | |
| (6,071 | ) |
| (86.0 | ) | |||
Total cost of revenue |
| $ | 1,510,016 | |
| $ | 1,732,962 | |
| $ | (222,946 | ) |
| (12.9 | ) |
The effect on cost of revenue for the year ended December 31, 2017 from changes in exchange rates versus the U.S. dollar was as follows:
| Year Ended December 31, | ||||||||||
| At Avg. 2016 Rates (1) |
| Exchange Rate Effect (2) |
| As Reported | ||||||
| (in thousands) | ||||||||||
Cost of revenue | $ | 1,496,302 | |
| $ | 13,714 | |
| $ | 1,510,016 | |
(1) | Represents the financial statement balance that would have resulted had exchange rates in the reporting period been the same as those in effect in the prior year period. |
(2) | Represents the increase or decrease in the reported amount resulting from changes in exchange rates from those in effect in the prior year period. |
The decrease in total cost of revenue for the year ended December 31, 2017 resulted from a $279.7 million decrease in our North America segment, partially offset by a $56.8 million increase i n our International segment. See below for information about cost of revenue by segment.
47
Cost of Revenue by Segment
Cost of revenue by category and segment for the years ended December 31, 2017 and 2016 was as follows:
| Year Ended December 31, | |||||||||||||
| 2017 |
| 2016 |
| $ Change |
| % Change | |||||||
| (dollars in thousands) | |||||||||||||
North America: |
|
|
|
|
|
|
| |||||||
Local - Third-party and other | $ | 117,006 | |
| $ | 101,331 | |
| $ | 15,675 | |
| 15.5 | % |
Goods: |
|
|
|
|
|
|
| |||||||
Third-party | 3,839 | |
| 1,598 | |
| 2,241 | |
| 140.2 | | |||
Direct | 847,744 | |
| 1,145,071 | |
| (297,327 | ) |
| (26.0 | ) | |||
Travel - Third-party | 17,901 | |
| 18,222 | |
| (321 | ) |
| (1.8 | ) | |||
Total North America cost of revenue | 986,490 | |
| 1,266,222 | |
| (279,732 | ) |
| (22.1 | ) | |||
|
|
|
|
|
|
|
| |||||||
International: |
|
|
|
|
|
|
| |||||||
Local - Third-party and other | 16,118 | |
| 19,610 | |
| (3,492 | ) |
| (17.8 | ) | |||
Goods: |
|
|
|
|
|
|
| |||||||
Third-party | 2,448 | |
| 4,705 | |
| (2,257 | ) |
| (48.0 | ) | |||
Direct | 501,462 | |
| 437,860 | |
| 63,602 | |
| 14.5 | | |||
Travel - Third-party | 3,498 | |
| 4,565 | |
| (1,067 | ) |
| (23.4 | ) | |||
Total International cost of revenue | 523,526 | |
| 466,740 | |
| 56,786 | |
| 12.2 | | |||
Total cost of revenue | $ | 1,510,016 | |
| $ | 1,732,962 | |
| $ | (222,946 | ) |
| (12.9 | ) |
The percentages of cost of revenue by segment for the years ended December 31, 2017 and 2016 were as follows:
2017 |
| 2016 |
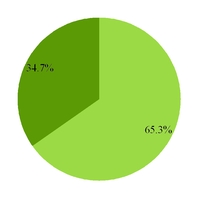

| North America |
|
| International |
North America
The decrease in North America segment cost of revenue for the year ended December 31, 2017 was primarily attributable to the decrease in direct revenue from our Goods category and an increase in margins in that category.
International
The increase in International segment cost of revenue for the year ended December 31, 2017 was primarily attributable to the growth in direct revenue from our Goods category.
There was a $13.7 million unfavorable impact on International segment cost of revenue from year-over-year changes in foreign exchange rates for the year ended December 31, 2017 .
48
Comparison of the Years Ended December 31, 2016 and 2015 :
Cost of revenue on third-party, direct revenue and other revenue for the years ended December 31, 2016 and 2015 was as follows:
|
| Year Ended December 31, | |||||||||||||
|
| 2016 |
| 2015 |
| $ Change |
| % Change | |||||||
|
| (dollars in thousands) | |||||||||||||
Cost of revenue: |
|
|
|
|
|
|
|
| |||||||
Third-party |
| $ | 142,975 | |
| $ | 138,127 | |
| $ | 4,848 | |
| 3.5 | % |
Direct |
| 1,582,931 | |
| 1,508,911 | |
| 74,020 | |
| 4.9 | | |||
Other |
| 7,056 | |
| 19,968 | |
| (12,912 | ) |
| (64.7 | ) | |||
Total cost of revenue |
| $ | 1,732,962 | |
| $ | 1,667,006 | |
| $ | 65,956 | |
| 4.0 | |
The effect on cost of revenue for the year ended December 31, 2016 from changes in exchange rates versus the U.S. dollar was as follows:
| Year Ended December 31, | ||||||||||
| At Avg. 2015 Rates (1) |
| Exchange Rate Effect (2) |
| As Reported | ||||||
| (in thousands) | ||||||||||
Cost of revenue | $ | 1,734,747 | |
| $ | (1,785 | ) |
| $ | 1,732,962 | |
(1) | Represents the financial statement balance that would have resulted had exchange rates in the reporting period been the same as those in effect in the prior year period. |
(2) | Represents the increase or decrease in the reported amount resulting from changes in exchange rates from those in effect in the prior year period. |
The increase in total cost of revenue for the year ended December 31, 2016 resulted from a $20.1 million increase in our North America segment and a $45.9 million increase i n our International segment. See below for information about cost of revenue by segment.
Cost of Revenue by Segment
Cost of revenue by category and segment for the years ended December 31, 2016 and 2015 was as follows:
| Year Ended December 31, | |||||||||||||
| 2016 |
| 2015 |
| $ Change |
| % Change | |||||||
| (dollars in thousands) | |||||||||||||
North America: |
|
|
|
|
|
|
| |||||||
Local - Third-party and other | $ | 101,331 | |
| $ | 100,419 | |
| $ | 912 | |
| 0.9 | % |
Goods: |
|
|
|
|
|
| | |||||||
Third-party | 1,598 | |
| 1,220 | |
| 378 | |
| 31.0 | | |||
Direct | 1,145,071 | |
| 1,129,828 | |
| 15,243 | |
| 1.3 | | |||
Travel - Third-party | 18,222 | |
| 14,704 | |
| 3,518 | |
| 23.9 | | |||
Total North America cost of revenue | 1,266,222 | |
| 1,246,171 | |
| 20,051 | |
| 1.6 | | |||
|
|
|
|
|
|
|
| |||||||
International: |
|
|
|
|
|
|
| |||||||
Local - Third-party and other | 19,610 | |
| 24,270 | |
| (4,660 | ) |
| (19.2 | ) | |||
Goods: |
|
|
|
|
|
|
| |||||||
Third-party | 4,705 | |
| 10,220 | |
| (5,515 | ) |
| (54.0 | ) | |||
Direct | 437,860 | |
| 379,083 | |
| 58,777 | |
| 15.5 | | |||
Travel - Third-party | 4,565 | |
| 7,262 | |
| (2,697 | ) |
| (37.1 | ) | |||
Total International cost of revenue | 466,740 | |
| 420,835 | |
| 45,905 | |
| 10.9 | | |||
Total cost of revenue | $ | 1,732,962 | |
| $ | 1,667,006 | |
| $ | 65,956 | |
| 4.0 | |
49
The percentages of cost of revenue by segment for the years ended December 31, 2016 and 2015 were as follows:
2016 |
| 2015 |
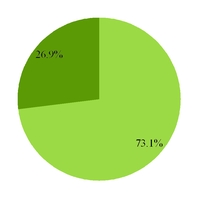
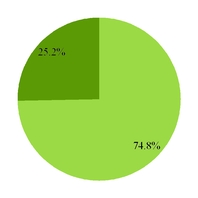
| North America |
|
| International |
North America
The increase in North America cost of revenue was primarily attributable to the growth in direct revenue from our Goods category, partially offset by an increase in margins in that category.
International
The increase in International cost of revenue was primarily attributable to the growth in direct revenue from our Goods category, partially offset by the following:
• | a reduction related to countries that we operated in during the prior period and have subsequently exited as part of our restructuring plan and the dispositions of our operations in Russia, India and Indonesia; and |
• | a $1.8 million favorable impact on cost of revenue from year-over-year changes in foreign currency exchange rates. |
Gross Profit
Comparison of the Years Ended December 31, 2017 and 2016 :
Gross profit for the years ended December 31, 2017 and 2016 was as follows:
|
| Year Ended December 31, | |||||||||||||
|
| 2017 |
| 2016 |
| $ Change |
| % Change | |||||||
|
| (dollars in thousands) | |||||||||||||
Gross profit: |
|
|
|
|
|
|
|
| |||||||
Third-party |
| $ | 1,029,733 | |
| $ | 981,367 | |
| $ | 48,366 | |
| 4.9 | % |
Direct |
| 228,219 | |
| 224,243 | |
| 3,976 | |
| 1.8 | | |||
Other |
| 75,909 | |
| 75,043 | |
| 866 | |
| 1.2 | | |||
Total gross profit |
| $ | 1,333,861 | |
| $ | 1,280,653 | |
| $ | 53,208 | |
| 4.2 | |
50
The effect on gross profit for the year ended December 31, 2017 from changes in exchange rates versus the U.S. dollar was as follows:
| Year Ended December 31, 2017 | ||||||||||
| At Avg. 2016 Rates (1) |
| Exchange Rate Effect (2) |
| As Reported | ||||||
| (in thousands) | ||||||||||
Gross profit | $ | 1,328,702 | |
| $ | 5,159 | |
| $ | 1,333,861 | |
(1) | Represents the financial statement balance that would have resulted had exchange rates in the reporting period been the same as those in effect in the prior year period. |
(2) | Represents the increase or decrease in the reported amount resulting from changes in exchange rates from those in effect in the prior year period. |
The increase in total gross profit for the year ended December 31, 2017 resulte d from a $42.1 million increase in our North America segment and an $11.1 million increase in ou r International segment. See below for information about gross profit by segment.
51
Gross Profit by Segment
Gross profit by category and segment for the years ended December 31, 2017 and 2016 was as follows:
| Year Ended December 31, | |||||||||||||
| 2017 |
| 2016 |
| $ Change |
| % Change | |||||||
| (dollars in thousands) | |||||||||||||
North America: |
|
|
|
|
|
|
| |||||||
Local - Third-party and other | $ | 708,573 | |
| $ | 660,983 | |
| $ | 47,590 | |
| 7.2 | % |
Goods: |
|
|
|
|
|
|
| |||||||
Third-party | 12,929 | |
| 7,470 | |
| 5,459 | |
| 73.1 | | |||
Direct | 145,582 | |
| 152,739 | |
| (7,157 | ) |
| (4.7 | ) | |||
Travel - Third-party | 60,594 | |
| 64,355 | |
| (3,761 | ) |
| (5.8 | ) | |||
Total North America gross profit | 927,678 | |
| 885,547 | |
| 42,131 | |
| 4.8 | | |||
% of gross billings | 23.6 | % |
| 22.5 | % |
|
|
|
| |||||
% of revenue | 48.5 | % |
| 41.2 | % |
|
|
|
| |||||
|
|
|
|
|
|
|
| |||||||
International: |
|
|
|
|
|
|
| |||||||
Local - Third-party and other | 265,348 | |
| 250,435 | |
| 14,913 | |
| 6.0 | | |||
Goods: |
|
|
|
|
|
|
| |||||||
Third-party | 17,910 | |
| 27,976 | |
| (10,066 | ) |
| (36.0 | ) | |||
Direct | 82,637 | |
| 71,504 | |
| 11,133 | |
| 15.6 | | |||
Travel - Third-party | 40,288 | |
| 45,191 | |
| (4,903 | ) |
| (10.8 | ) | |||
Total International gross profit | $ | 406,183 | |
| $ | 395,106 | |
| $ | 11,077 | |
| 2.8 | |
% of gross billings | 23.6 | % |
| 22.6 | % |
|
|
|
| |||||
% of revenue | 43.7 | % |
| 45.8 | % |
|
|
|
| |||||
The percentages of gross profit by segment for the years ended December 31, 2017 and 2016 were as follows:
2017 |
| 2016 |
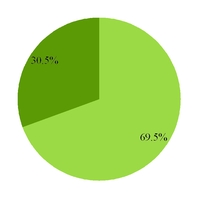

| North America |
|
| International |
North America
The increase in North America segment gross profit for the year ended December 31, 2017 reflects a $47.6 million increase in gross profit from our Local category, which was attributable to the increase in third-party and other re venue from our Local category, as discussed above.
Gross profit from direct revenue transactions in our Goods category declined by 4.7% , as compared to the 23.5% decrease in revenue from those transactions. That difference was attributable to increased gross margins on direct revenue transactions, which were 14.7% in 2017 as compared to 11.8% in the prior year. That improvement resulted from our ongoing efforts to de-emphasize lower margin product offerings and reduce our shipping and fulfillment costs.
52
International
The increase in International segment gross profit for the year ended December 31, 2017 reflects an increase in third-party revenue transactions from our Local category, as discussed above.
There was a $5.3 million favorable impact on International segment gross profit from year-over-year changes in foreign exchange rates for the year ended December 31, 2017 .
Comparison of the Years Ended December 31, 2016 and 2015 :
Gross profit for the years ended December 31, 2016 and 2015 was as follows:
|
| Year Ended December 31, | |||||||||||||
|
| 2016 |
| 2015 |
| $ Change |
| % Change | |||||||
|
| (dollars in thousands) | |||||||||||||
Gross profit: |
|
|
|
|
|
|
|
| |||||||
Third-party |
| $ | 981,367 | |
| $ | 1,055,903 | |
| $ | (74,536 | ) |
| (7.1 | )% |
Direct |
| 224,243 | |
| 195,756 | |
| 28,487 | |
| 14.6 | | |||
Other |
| 75,043 | |
| 36,151 | |
| 38,892 | |
| 107.6 | | |||
Total gross profit |
| $ | 1,280,653 | |
| $ | 1,287,810 | |
| $ | (7,157 | ) |
| (0.6 | ) |
The effect on gross profit for the year ended December 31, 2016 from changes in exchange rates versus the U.S. dollar was as follows:
| Year Ended December 31, 2016 | ||||||||||
| At Avg. 2015 Rates (1) |
| Exchange Rate Effect (2) |
| As Reported | ||||||
| (in thousands) | ||||||||||
Gross profit | $ | 1,289,643 | |
| $ | (8,990 | ) |
| $ | 1,280,653 | |
(1) | Represents the financial statement balance that would have resulted had exchange rates in the reporting period been the same as those in effect in the prior year period. |
(2) | Represents the increase or decrease in the reported amount resulting from changes in exchange rates from those in effect in the prior year period. |
The decrease in total gross profit for the year ended December 31, 2017 resulte d from a $91.1 million decrease in our International segment, partially offset by an $84.0 million increase in ou r North America segment. See below for information about gross profit by segment.
53
Gross Profit by Segment
Gross profit by category and segment for the years ended December 31, 2016 and 2015 was as follows:
| Year Ended December 31, | |||||||||||||
| 2016 |
| 2015 |
| $ Change |
| % Change | |||||||
| (dollars in thousands) | |||||||||||||
North America: |
|
|
|
|
|
|
| |||||||
Local - Third-party and other | $ | 660,983 | |
| $ | 600,893 | |
| $ | 60,090 | |
| 10.0 | % |
Goods: |
|
|
|
|
|
|
| |||||||
Third-party | 7,470 | |
| 5,931 | |
| 1,539 | |
| 25.9 | | |||
Direct | 152,739 | |
| 127,720 | |
| 25,019 | |
| 19.6 | | |||
Travel - Third-party | 64,355 | |
| 67,027 | |
| (2,672 | ) |
| (4.0 | ) | |||
Total North America gross profit | 885,547 | |
| 801,571 | |
| 83,976 | |
| 10.5 | | |||
% of gross billings | 22.5 | % |
| 21.6 | % |
|
|
|
| |||||
% of revenue | 41.2 | % |
| 39.1 | % |
|
|
|
| |||||
|
|
|
|
|
|
|
| |||||||
International: |
|
|
|
|
|
|
| |||||||
Local - Third-party and other | 250,435 | |
| 310,842 | |
| (60,407 | ) |
| (19.4 | ) | |||
Goods: |
|
|
|
|
|
|
| |||||||
Third-party | 27,976 | |
| 55,141 | |
| (27,165 | ) |
| (49.3 | ) | |||
Direct | 71,504 | |
| 68,036 | |
| 3,468 | |
| 5.1 | | |||
Travel - Third-party | 45,191 | |
| 52,220 | |
| (7,029 | ) |
| (13.5 | ) | |||
Total International gross profit | $ | 395,106 | |
| $ | 486,239 | |
| $ | (91,133 | ) |
| (18.7 | ) |
% of gross billings | 22.6 | % |
| 24.0 | % |
|
|
|
| |||||
% of revenue | 45.8 | % |
| 53.6 | % |
|
|
|
| |||||
The percentages of gross profit by segment for the years ended December 31, 2016 and 2015 were as follows:
2016 |
| 2015 |
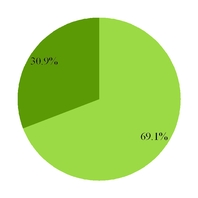
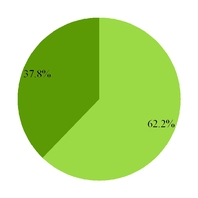
| North America |
|
| International |
North America
The increase in North America gross profit was primarily attributable to the following:
• | a $15.3 million increase from third-party revenue transactions and a $44.8 million increase from other revenue transactions in our Local category. The increase in gross profit from other revenue transactions in our Local category was primarily attributable to commission revenue earned when customers make purchases with retailers using digital coupons accessed through our websites and mobile applications; and |
54
• | a $25.0 million increase from direct revenue transactions in our Goods category, which was primarily driven by an increase in gross profit margin to 11.8% for the year ended December 31, 2016 , as compared to 10.2% for the prior year period. The improvement in our gross margins resulted from our strategic initiative to de-emphasize lower margin product offerings and reduce our shipping and fulfillment costs. |
International
The decrease in International gross profit was primarily attributable to the following:
• | decreases in third-party and other revenue across all three of our categories; |
• | a $37.8 million reduction related to countries that we operated in during the year ended December 31, 2015 and have subsequently exited as part of our restructuring plan and the dispositions of our operations in Russia, India and Indonesia; and |
• | an $8.8 million unfavorable impact on gross profit from year-over-year changes in foreign currency exchange rates. |
Marketing
Marketing expense consists primarily of online marketing costs, such as search engine marketing, advertising on social networking sites and affiliate programs, and offline marketing costs, such as television and radio advertising. Additionally, compensation expense for marketing employees is classified within marketing expense. We record these costs within Marketing on the consolidated statements of operations when incurred. From time to time, we offer deals with well-known national merchants for customer acquisition and activation purposes, for which the amount we owe the merchant for each voucher sold exceeds the transaction price paid by the customer. Our gross billings from those transactions generate no third-party revenue and our net cost (i.e., the excess of the amount owed to the merchant over the amount paid by the customer) is classified as marketing expense. We evaluate marketing expense as a percentage of gross billings and revenue because it gives us an indication of how well our marketing spend is driving gross billings and revenue growth.
Comparison of the Years Ended December 31, 2017 and 2016 :
Marketing expense by segment as a percentage of gross profit for the years ended December 31, 2017 and 2016 was as follows:
|
| Year Ended December 31, | |||||||||||||||||||
|
| 2017 |
| % of Gross Profit |
| 2016 |
| % of Gross Profit |
| $ Change |
| % Change | |||||||||
|
| (dollars in thousands) | |||||||||||||||||||
North America |
| $ | 299,454 | |
| 32.3 | % |
| $ | 263,206 | |
| 29.7 | % |
| $ | 36,248 | |
| 13.8 | % |
International |
| 101,464 | |
| 25.0 | |
| 88,969 | |
| 22.5 | |
| 12,495 | |
| 14.0 | | |||
Total marketing |
| $ | 400,918 | |
| 30.1 | |
| $ | 352,175 | |
| 27.5 | |
| $ | 48,743 | |
| 13.8 | |
The increase in total marketing for the year ended December 31, 2017 resulted from a $36.2 million increase in our North America segment and a $ 12.5 million increase in our International segment. See below for information about marketing by segment.
55
The percentages of marketing expense by segment for the years ended December 31, 2017 and 2016 were as follows:
2017 |
| 2016 |


| North America |
|
| International |
North America
The increases in North America segment marketing expense and marketing expense as a percentage of gross profit for the year ended December 31, 2017 were primarily attributable to an increase in investments in offline marketing to drive customer growth and awareness of the Groupon brand and our product and service offerings.
International
The increases in International segment marketing expense and marketing expense as a percentage of gross profit for the year ended December 31, 2017 were primarily attributable to our ongoing strategic initiative to increase our marketing activities to drive customer growth.
There was a $2.2 million unfavorable impact on International segment marketing expense from year-over-year changes in foreign exchange rates for the year ended December 31, 2017 .
Comparison of the Years Ended December 31, 2016 and 2015 :
Marketing expense by segment as a percentage of gross profit for the years ended December 31, 2016 and 2015 was as follows:
|
| Year Ended December 31, | |||||||||||||||||||
|
| 2016 |
| % of Gross Profit |
| 2015 |
| % of Gross Profit |
| $ Change |
| % Change | |||||||||
|
| (dollars in thousands) | |||||||||||||||||||
North America |
| $ | 263,206 | |
| 29.7 | % |
| $ | 160,878 | |
| 20.1 | % |
| $ | 102,328 | |
| 63.6 | % |
International |
| 88,969 | |
| 22.5 | |
| 80,464 | |
| 16.5 | |
| 8,505 | |
| 10.6 | | |||
Total marketing |
| $ | 352,175 | |
| 27.5 | |
| $ | 241,342 | |
| 18.7 | |
| $ | 110,833 | |
| 45.9 | |
The increase in total marketing for the December 31, 2016 resulted from a $102.3 million increase in our North America segment and an $ 8.5 million increase in our International segment. See below for information about marketing by segment.
56
The percentages of marketing expense by segment for the years ended December 31, 2016 and 2015 were as follows:
2016 |
| 2015 |

| North America |
|
| International |
North America
The increase in North America marketing expense resulted from our strategic initiative to invest in marketing to drive new customer acquisition. In connection with this initiative, which commenced in November 2015, we extended our return on investment thresholds for customer acquisition marketing spending to periods generally ranging from 12 - 18 months, as compared to approximately six months previously. That incremental spending was primarily focused on online marketing channels, such as search engine marketing, display and mobile advertising. In addition, we increased our spend on offline activities such as radio advertising and, beginning in the second quarter 2016, on television advertising. We also increased our spending on affiliate programs that utilize third parties to promote our offerings online.
International
The increase in International marketing expense resulted from our increased investment in marketing to drive new customer acquisition. That increase was partially offset by a reduction related to countries that we operated in during the prior year period and have subsequently exited as part of our restructuring plan and the dispositions of our operations in Russia, India and Indonesia.
Selling, General and Administrative
Selling expenses reported within Selling, general and administrative on the consolidated statements of operations consist of sales commissions and other compensation expenses for sales representatives, as well as costs associated with supporting the sales function such as technology, telecommunications and travel. General and administrative expenses include compensation expense for employees involved in customer service, operations, technology and product development, as well as general corporate functions, such as finance, legal and human resources. Additional costs included in general and administrative include depreciation and amortization, rent, professional fees, litigation costs, travel and entertainment, recruiting, office supplies, maintenance, certain technology costs and other general corporate costs. We evaluate selling, general and administrative expense as a percentage of gross profit because it gives us an indication of our operating efficiency.
Comparison of the Years Ended December 31, 2017 and 2016 :
Selling, general and administrative expense ("SG&A") for the years ended December 31, 2017 and 2016 was as follows:
|
| Year Ended December 31, | |||||||||||||||||||
|
| 2017 |
| % of Gross Profit |
| 2016 |
| % of Gross Profit |
| $ Change |
| % Change | |||||||||
|
| (dollars in thousands) | |||||||||||||||||||
Selling, general and administrative |
| $ | 901,781 | |
| 67.6 | % |
| $ | 994,027 | |
| 77.6 | % |
| $ | (92,246 | ) |
| (9.3 | )% |
57
The decrease in SG&A was primarily attributable to our efforts to improve our cost structure, including a $62.8 million decrease in compensation-related costs, primarily due to headcount reductions as part of our restructuring plan, as well as decreases in facilities costs, systems costs, and other general expenses.
SG&A decreased as a percentage of gross profit for the year ended December 31, 2017 as compared to the prior year period, primarily as a result of the cost savings from our restructuring program and other initiatives.
There was a $0.2 million favorable impact from year-over-year changes in foreign currency exchange rates for the year ended December 31, 2017 .
Comparison of the Years Ended December 31, 2016 and 2015 :
SG&A for the years ended December 31, 2016 and 2015 was as follows:
|
| Year Ended December 31, | |||||||||||||||||||
|
| 2016 |
| % of Gross Profit |
| 2015 |
| % of Gross Profit |
| $ Change |
| % Change | |||||||||
|
| (dollars in thousands) | |||||||||||||||||||
Selling, general and administrative |
| $ | 994,027 | |
| 77.6 | % |
| $ | 1,100,528 | |
| 85.5 | % |
| $ | (106,501 | ) |
| (9.7 | )% |
The decrease in SG&A was primarily attributable to the following:
• | a $58.8 million decrease in compensation-related costs in our ongoing markets due to headcount reductions as part of our restructuring plan; |
• | a $38.3 million reduction related to countries that we operated in during the prior year period and have subsequently exited as part of our restructuring plan and the dispositions of our operations in India, Russia and Indonesia; and |
• | a $37.5 million expense incurred in the prior year relating to our securities litigation matter that has been subsequently settled. |
The favorable impact on SG&A due to year-over-year changes in foreign currency exchange rates was $5.9 million .
Restructuring Charges
Restructuring charges represent severance and benefit costs for workforce reductions, impairments of long-lived assets and other exit costs resulting from our restructuring activities. See Note 13, Restructuring, for information about our restructuring plan.
Gain on Sale of Intangible Assets
During the third quarter of 2017, we sold customer lists and other intangible assets in certain food delivery markets to Grubhub Inc., resulting in a gain of $17.1 million. See Note 6, Goodwill and Other Intangible Assets , for additional information.
Gains on Business Dispositions
During the second quarter of 2016, we sold our subsidiary in Russia and our point of sale business in the United States, resulting in gains of $8.9 million and $0.4 million , respectively. During the third quarter of 2016, we sold our subsidiary in Indonesia resulting in a gain of $2.1 million . During the third quarter of 2015, we sold a controlling stake in our subsidiary in India resulting in a gain of $13.7 million . See Note 3, Discontinued Operations and Other Business Dispositions, for additional information.
The financial results of those entities are presented within income from continuing operations in the accompanying consolidated financial statements through their respective disposition dates. Those financial results were not material for the years ended December 31, 2016 and 2015.
58
Income (Loss) from Operations
Comparison of the Years Ended December 31, 2017 and 2016 :
Income (loss) from operations for the years ended December 31, 2017 and 2016 was as follows:
|
| Year Ended December 31, | |||||||||||||
|
| 2017 |
| 2016 |
| $ Change |
| % Change | |||||||
|
| (dollars in thousands) | |||||||||||||
North America |
| $ | (45 | ) |
| $ | (85,423 | ) |
| $ | 85,378 | |
| 99.9 | % |
International |
| $ | 29,480 | |
| $ | (14,815 | ) |
| $ | 44,295 | |
| 299.0 | |
Income (loss) from operations |
| $ | 29,435 | |
| $ | (100,238 | ) |
| $ | 129,673 | |
| 129.4 | |
North America
The improvement in our income (loss) from operations was attributable to the following:
• | a $56.4 million decrease in SG&A; |
• | a $42.1 million increase in gross profit; |
• | a $17.1 million gain from the sale of customer lists and other intangible assets in certain food delivery markets. See Note 6, Goodwill and Other Intangible Assets, for additional information; and |
• | a $5.6 million decrease in acquisition-related expense. |
The reduction in our loss from operations was partially off set by a $36.2 million increase i n marketing expense.
Income (loss) from operations includes $76.1 million and $104.7 million of stock-based compensation for the years ended December 31, 2017 and 2016 , respectively.
International
The improvement in our income (loss) from operations was primarily attributable to the following:
• | a $35.8 million decrease in SG&A; |
• | a $21.6 million decrease in restructuring charges; and |
• | an $11.1 million increase in gross profit. |
Those items were partially offset by the following:
• | a $12.5 million increase in marketing expense; and |
• | an $11.4 million decrease in gains on business dispositions. |
Income (loss) from operations includes $5.7 million and $9.5 million of stock-based compensation for the years ended December 31, 2017 and 2016 , respectively.
Comparison of the Years Ended December 31, 2016 and 2015 :
Income (loss) from operations for the years ended December 31, 2016 and 2015 was as follows:
|
| Year Ended December 31, |
|
| |||||||||||
|
| 2016 |
| 2015 |
| $ Change |
| % Change | |||||||
|
| (dollars in thousands) | |||||||||||||
North America |
| $ | (85,423 | ) |
| $ | (107,836 | ) |
| $ | 22,413 | |
| 20.8 | % |
International |
| (14,815 | ) |
| 37,165 | |
| (51,980 | ) |
| (139.9 | ) | |||
Total income (loss) from operations |
| $ | (100,238 | ) |
| $ | (70,671 | ) |
| $ | (29,567 | ) |
| 41.8 | |
59
North America
The reduction in our loss from operations was primarily attributable to the following:
• | an $84.0 million increase in gross profit; and |
• | a $45.6 million decrease in SG&A. |
Those items were partially offset by a $102.3 million increase in marketing expense.
Income (loss) from operations includes $104.7 million and $124.1 million of stock-based compensation for the years ended December 31, 2016 and 2015 , respectively.
International
The increase in our loss from operations was primarily attributable to the following:
• | a $91.1 million decrease in gross profit; |
• | an $8.5 million increase in marketing expense; and |
• | a $10.5 million increase in restructuring costs. |
Those items were partially offset by a $60.9 million decrease in SG&A.
Income (loss) from operations includes $9.5 million and $14.3 million of stock-based compensation for the years ended December 31, 2016 and 2015 , respectively.
Other Income (Expense), Net
Other income (expense), net includes interest income, interest expense, gains and losses on fair value option investments, impairments of investments and foreign currency gains and losses, primarily resulting from intercompany balances with our subsidiaries that are denominated in foreign currencies.
Comparison of the Years Ended December 31, 2017 and 2016 :
Other income (expense), net for the years ended December 31, 2017 and 2016 was as follows:
|
| Year Ended December 31, | |||||||||||||
|
| 2017 |
| 2016 |
| $ Change |
| % Change | |||||||
|
| (dollars in thousands) | |||||||||||||
Other income (expense), net |
| $ | 6,710 | |
| $ | (71,289 | ) |
| $ | 77,999 | |
| 109.4 | % |
Other income (expense), net for the year ended December 31, 2017 primarily consisted of the following:
• | $18.6 million in net foreign currency gains, which primarily resulted from intercompany balances with our subsidiaries that are denominated in foreign currencies; and |
• | a $7.6 million gain on the sale of an investment (see Note 7, Investments ). |
Those items were partially offset by $20.7 million of interest expense.
The foreign currency gains on those intercompany balances were primarily driven by the appreciation of the Euro against the U.S. dollar from an exchange rate of 1.0513 on December 31, 2016 to 1.1996 on December 31, 2017 . Interest expense primarily related to interest on our convertible notes.
Other income (expense), net for the year ended December 31, 2016 primarily consisted of the following:
• | $48.1 million of losses on fair value option investments; |
• | $15.9 million of interest expense; and |
• | $6.9 million in foreign currency losses. |
60
The losses on fair value option investments consisted of a $35.4 million loss from our investment in Monster Holdings LP and a $12.8 million loss from our investment in Nearbuy Pte Ltd. ("Nearbuy," formerly named GroupMax Pte Ltd.). See Note 7, Investments, for additional information. The foreign currency losses resulted from intercompany balances with our subsidiaries that are denominated in foreign currencies. Interest expense primarily related to interest on our convertible notes.
Comparison of the Years Ended December 31, 2016 and 2015 :
Other income (expense), net for the years ended December 31, 2016 and 2015 was as follows:
|
| Year Ended December 31, | |||||||||||||
|
| 2016 |
| 2015 |
| $ Change |
| % Change | |||||||
|
| (dollars in thousands) | |||||||||||||
Other income (expense), net |
| $ | (71,289 | ) |
| $ | (25,586 | ) |
| $ | (45,703 | ) |
| (178.6 | )% |
See above for the items reported in Other income (expense), net for the year ended December 31, 2016 . Other income (expense), net for the year ended December 31, 2015 primarily consisted of the following:
• | $20.7 million in net foreign currency transaction losses; |
• | $2.9 million of losses on fair value option investments; and |
• | $2.8 million of interest expense. |
The net foreign currency transaction losses primarily resulted from intercompany balances with our subsidiaries that are denominated in foreign currencies. The net foreign currency transaction losses also included a $4.4 million loss related to the cumulative translation adjustment for our legacy business in the Republic of Korea that was reclassified to earnings as a result of the disposition of all the outstanding equity interests of LivingSocial Korea, Inc., including its subsidiary Ticket Monster Inc. ("Ticket Monster") and a $3.7 million net gain related to the cumulative translation adjustments that were reclassified to earnings for countries that we exited as part of our restructuring plan.
Provision (Benefit) for Income Taxes
Comparison of the Years Ended December 31, 2017 and 2016 :
Provision (benefit) for income taxes for the years ended December 31, 2017 and 2016 was as follows:
|
| Year Ended December 31, | |||||||||||||
|
| 2017 |
| 2016 |
| $ Change |
| % Change | |||||||
|
| (dollars in thousands) | |||||||||||||
Provision (benefit) for income taxes |
| $ | 7,544 | |
| $ | (5,318 | ) |
| $ | 12,862 | |
| 241.9 | % |
Effective tax rate |
| 20.9 | % |
| 3.1 | % |
|
|
|
| |||||
The pretax losses incurred by our operations in jurisdictions that have valuation allowances against their net deferred tax assets, including the United States, was the primary factor impacting our effective tax rate for the years ended December 31, 2017 and 2016.
We are currently under IRS audit for the 2013 and 2014 tax years. Additionally, we are currently under audit by several foreign jurisdictions. It is likely that the examination phase of some of those audits will conclude in the next 12 months. There are many factors, including factors outside of our control, which influence the progress of and completion of those audits. We recognized income tax benefits of $3.0 million and $8.4 million for the years ended December 31, 2017 and 2016, respectively, as a result of new information that impacted our estimates of the amounts that are more likely than not of being realized upon settlement of the related tax positions and due to expirations of the applicable statutes of limitations. During the fourth quarter 2017, we received an income tax assessment and a notification of potential assessment fro m the tax authorities in two foreign jurisdictions, totaling $138.1 million in the aggregate. We believe that the assessments, which primarily relate to transfer pricing on transactions occurring from 2011 to 2014, are without merit and we intend to vigorously defend ourselves in those matters. In addition to any potential increases in our liabilities for uncertain tax positions from the ultimate resolution of those assessments, we believe that it is reasonably possible that reductions of up to $37.9 million in unrecognized tax benefits may occur within the 12 months following December 31, 2017 upon closing of income tax audits or the expiration of applicable statutes of limitations.
61
The Tax Cuts and Jobs Act (the "Jobs Act") was signed into law on December 22, 2017. That tax reform legislation, which included a reduction in the U.S. Federal income tax rate to 21 percent, did not have a material impact on our provision for income taxes for the year ended December 31, 2017 due to the valuation allowance against our net deferred tax assets in the United States. Additionally, we do not expect to incur the deemed repatriation tax established by that legislation due to the aggregate cumulative losses of our foreign operations.
In general, it is our practice and intention to reinvest the earnings of our non-U.S. subsidiaries in those operations. Additionally, while we do not expect to incur the deemed repatriation tax established by the Jobs Act, an actual repatriation from our non-U.S. subsidiaries could be subject to foreign and U.S. state income taxes. Aside from limited exceptions as of December 31, 2017 for which the related deferred tax liabilities recognized are immaterial, we do not intend to distribute earnings of foreign subsidiaries for which we have an excess of the financial reporting basis over the tax basis of our investments and therefore have not recorded any deferred taxes related to such amounts. The actual tax cost resulting from a distribution would depend on income tax laws and circumstances at the time of distribution. Determination of the amount of unrecognized deferred tax liability related to the excess of the financial reporting basis over the tax basis of our foreign subsidiaries is not practical due to the complexities associated with the calculation.
We expect that our consolidated effective tax rate in future periods will continue to differ significantly from the U.S. federal income tax rate as a result of our tax obligations in jurisdictions with profits and valuation allowances in jurisdictions with losses.
Comparison of the Years Ended December 31, 2016 and 2015 :
Provision (benefit) for income taxes for the years ended December 31, 2016 and 2015 was as follows:
|
| Year Ended December 31, | |||||||||||||
|
| 2016 |
| 2015 |
| $ Change |
| % Change | |||||||
|
| (dollars in thousands) | |||||||||||||
Provision (benefit) for income taxes |
| $ | (5,318 | ) |
| $ | (23,010 | ) |
| $ | 17,692 | |
| 76.9 | % |
Effective tax rate |
| 3.1 | % |
| 23.9 | % |
|
|
|
| |||||
The pretax losses incurred by our operations in jurisdictions that have valuation allowances against their net deferred tax assets, including the United States, was the primary factor impacting our effective tax rate for the year ended December 31, 2016 . Significant factors impacting our effective tax rate for the year ended December 31, 2015 included pretax losses incurred by our operations in certain foreign jurisdictions that had valuation allowances against their net deferred tax assets and amortization of the tax effects of intercompany sales of intellectual property.
We decreased our liabilities for uncertain tax positions and recognized income tax benefits of $8.4 million and $25.6 million for the years ended December 31, 2016 and 2015 , respectively, as a result of new information that impacted our estimates of the amounts that are more likely than not of being realized upon settlement of the related tax positions and due to expirations of the applicable statutes of limitations.
Income (Loss) from Discontinued Operations
From November 2016 through March 2017, we exited our operations in 11 non-core countries and their results have been presented as discontinued operations for the years ended December 31, 2017 , 2016 and 2015. In May 2015, we sold a controlling stake in Ticket Monster and the results of this entity have been presented as discontinued operations for the year ended December 31, 2015 . See Note 3, Discontinued Operations and Other Business Dispositions, for additional information.
62
Non-GAAP Financial Measures
In addition to financial results reported in accordance with U.S. GAAP, we have provided the following non-GAAP financial measures: Adjusted EBITDA, free cash flow and foreign currency exchange rate neutral operating results. These non-GAAP financial measures, which are presented on a continuing operations basis, are intended to aid investors in better understanding our current financial performance and prospects for the future as seen through the eyes of management. We believe that these non- GAAP financial measures facilitate comparisons with our historical results and with the results of peer companies who present similar measures (although other companies may define non-GAAP measures differently than we define them, even when similar terms are used to identify such measures). However, these non-GAAP financial measures are not intended to be a substitute for those reported in accordance with U.S. GAAP.
Adjusted EBITDA . Adjusted EBITDA is a non-GAAP performance measure that we define as net income (loss) from continuing operations excluding income taxes, interest and other non-operating items, depreciation and amortization, stock-based compensation, acquisition-related expense (benefit), net and other special charges and credits, including items that are unusual in nature or infrequently occurring. Our definition of Adjusted EBITDA may differ from similar measures used by other companies, even when similar terms are used to identify such measures. Adjusted EBITDA is a key measure used by our management and Board of Directors to evaluate operating performance, generate future operating plans and make strategic decisions for the allocation of capital. Accordingly, we believe that Adjusted EBITDA provides useful information to investors and others in understanding and evaluating our operating results in the same manner as our management and Board of Directors. However, Adjusted EBITDA is not intended to be a substitute for income (loss) from continuing operations.
We exclude stock-based compensation expense and depreciation and amortization because they are primarily non-cash in nature and we believe that non-GAAP financial measures excluding those items provide meaningful supplemental information about our operating performance and liquidity. Acquisition-related expense (benefit), net is comprised of the change in the fair value of contingent consideration arrangements and external transaction costs related to business combinations, primarily consisting of legal and advisory fees. The composition of our contingent consideration arrangements and the impact of those arrangements on our operating results vary over time based on a number of factors, including the terms of our business combinations and the timing of those transactions. For the year ended December 31, 2017 , special charges and credits included charges related to our restructuring plan and a gain from the sale of intangible assets. For the years ended December 31, 2016 and 2015 , special charges and credits included gains from business dispositions and charges related to our restructuring plan. For the year ended December 31, 2015 , special charges and credits also included the write-off of a prepaid asset related to a marketing program that was discontinued because the counterparty ceased operations and the expense related to a significant increase in the contingent liability for a securities litigation matter that has subsequently been settled. We exclude special charges and credits from Adjusted EBITDA because we believe that excluding those items provides meaningful supplemental information about our core operating performance and facilitates comparisons with our historical results.
63
The following is a reconciliation of Adjusted EBITDA to the most comparable U.S. GAAP financial measure, Income (loss) from continuing operations for the years ended December 31, 2017 , 2016 and 2015 (in thousands):
|
| Year Ended December 31, | ||||||||||
|
| 2017 |
| 2016 |
| 2015 | ||||||
Income (loss) from continuing operations |
| $ | 28,601 | |
| $ | (166,209 | ) |
| $ | (73,247 | ) |
Adjustments: |
|
|
|
|
|
| ||||||
Stock-based compensation (1) |
| 80,950 | |
| 109,523 | |
| 138,413 | | |||
Depreciation and amortization |
| 137,827 | |
| 135,909 | |
| 129,382 | | |||
Acquisition-related expense (benefit), net |
| 48 | |
| 5,650 | |
| 1,857 | | |||
Restructuring charges |
| 18,828 | |
| 40,438 | |
| 28,464 | | |||
Gain on sale of intangible assets |
| (17,149 | ) |
| - | |
| - | | |||
Gains on business dispositions |
| - | |
| (11,399 | ) |
| (13,710 | ) | |||
Prepaid marketing write-off |
| - | |
| - | |
| 6,690 | | |||
Securities litigation expense |
| - | |
| - | |
| 37,500 | | |||
Other (income) expense, net |
| (6,710 | ) |
| 71,289 | |
| 25,586 | | |||
Provision (benefit) for income taxes |
| 7,544 | |
| (5,318 | ) |
| (23,010 | ) | |||
Total adjustments |
| 221,338 | |
| 346,092 | |
| 331,172 | | |||
Adjusted EBITDA |
| $ | 249,939 | |
| $ | 179,883 | |
| $ | 257,925 | |
(1) | Represents stock-based compensation expense recorded within Selling, general and administrative, Cost of revenue and Marketing. Restructuring charges include $0.8 million and $4.7 million of additional stock-based compensation for the years ended December 31, 2017 and December 31, 2016 , respectively. Other income (expense), net includes $0.2 million , $0.9 million , and $0.3 million of additional stock-based compensation for the years ended December 31, 2017 , 2016 , and 2015 , respectively. |
Free cash flow . Free cash flow is a non-GAAP liquidity measure that comprises net cash provided by operating activities from continuing operations less purchases of property and equipment and capitalized software from continuing operations. We use free cash flow to conduct and evaluate our business because, although it is similar to cash flow from continuing operations, we believe that it typically represents a more useful measure of cash flows because purchases of fixed assets, software developed for internal use and website development costs are necessary components of our ongoing operations. Free cash flow is not intended to represent the total increase or decrease in our cash balance for the applicable period.
Free cash flow has limitations due to the fact that it does not represent the residual cash flow available for discretionary expenditures. For example, free cash flow does not include cash payments for business acquisitions. In addition, free cash flow reflects the impact of the timing difference between when we are paid by customers and when we pay merchants and suppliers. Therefore, we believe it is important to view free cash flow as a complement to our entire consolidated statements of cash flows. For a reconciliation of free cash flow to the most comparable U.S. GAAP financial measures, see Liquidity and Capital Resources below.
Foreign currency exchange rate neutral operating results. Foreign currency exchange rate neutral operating results show current period operating results as if foreign currency exchange rates had remained the same as those in effect in the prior year period. These measures are intended to facilitate comparisons to our historical performance. For a reconciliation of foreign currency exchange rate neutral operating results to the most comparable U.S. GAAP financial measures, see Results of Operations above.
Liquidity and Capital Resources
Our principal sources of liquidity are cash flows from operations, cash and cash equivalents and available borrowing capacity under our Amended and Restated Credit Agreement. As of December 31, 2017 , we had $880.1 million in cash and cash equivalents, which primarily consisted of bank deposits and government money market funds.
Our net cash flows from operating, investing and financing activities from continuing operations for the years ended December 31, 2017, 2016 and 2015 were as follows (in thousands):
|
| Year Ended December 31, | ||||||||||
|
| 2017 |
| 2016 |
| 2015 | ||||||
Cash provided by (used in): |
|
|
|
|
|
| ||||||
Operating activities |
| $ | 137,497 | |
| $ | 128,928 | |
| $ | 316,413 | |
Investing activities |
| (25,323 | ) |
| (55,586 | ) |
| (175,208 | ) | |||
Financing activities |
| (138,046 | ) |
| (14,665 | ) |
| (515,785 | ) | |||
Free cash flow is a non-GAAP liquidity measure that comprises net cash provided by operating activities from continuing operations, less purchases of property and equipment and capitalized software from continuing operations. Our free cash flow for the years ended December 31, 2017, 2016, and 2015 and reconciliations to the most comparable U.S. GAAP financial measure, Net cash provided by (used in) operating activities from continuing operations, for those periods are as follows (in thousands):
|
| Year Ended December 31, | ||||||||||
|
| 2017 |
| 2016 |
| 2015 | ||||||
Net cash provided by (used in) operating activities from continuing operations |
| $ | 137,497 | |
| $ | 128,928 | |
| $ | 316,413 | |
Purchases of property and equipment and capitalized software from continuing operations |
| (59,158 | ) |
| (68,287 | ) |
| (81,946 | ) | |||
Free cash flow |
| $ | 78,339 | |
| $ | 60,641 | |
| $ | 234,467 | |
Our transactions are primarily structured such that we collect cash up front from customers and pay our merchants at a later date, either based on a fixed payment schedule or upon the customer's redemption of the related voucher. For merchants on fixed payment terms, we remit payments on an ongoing basis, generally bi-weekly, throughout the term of the merchant's offering. For purchases of merchandise inventory, our supplier payment terms generally range from net 30 to net 60 days. We have primarily paid merchants on fixed payment terms in North America and upon voucher redemption internationally. In the third quarter of 2017, we began to increase our use of redemption payment terms with our North America merchants as well and we expect that trend to continue.
Our cash balances fluctuate significantly throughout the year based on many variables, including gross billings growth rates, the timing of payments to merchants and suppliers, seasonality and the mix of transactions between Goods and Local. For example, we typically generate strong cash inflows during the fourth quarter holiday season, driven primarily by our Goods category, followed by significant cash outflows in the following period when payments are made to inventory suppliers. We are currently developing and testing voucherless offerings that are linked to customer credit cards, which we refer to as Groupon+. For Groupon+ deals, we offer cash back on customers' credit card statements based on qualifying purchases with participating merchants. For those offerings, we remit payment to a card brand network at the time of the qualifying purchase for the customer's cash back incentive and then we collect from the merchant both our commission and reimbursement for the customer's cash back incentive, usually on a bi-weekly basis. The working capital impact of Groupon+ offerings is less favorable to us than voucher transactions, for which we collect payment from customers at the time of sale and remit payment to merchants at a later date. As such, we expect that our cash flows will initially be adversely impacted to the extent that Groupon+ offerings begin to scale in future periods.
For the year ended December 31, 2017, our net cash provided by operating activities from continuing operations was $137.5 million , as compared to $28.6 million in net income from continuing operations. That difference was primarily attributable to $209.1 million of non-cash items, including depreciation and amortization, stock-based compensation, and the gain from a sale of intangible assets. The difference between net cash provided by operating activities and our net income from continuing operations due to non-cash items was partially offset by a $100.2 million net decrease from changes in working capital and other assets and liabilities. The working capital impact was primarily related to the timing of payments to merchants and suppliers and payments related to our restructuring activities.
For the year ended December 31, 2016, our net cash provided by operating activities from continuing operations was $128.9 million , as compared to a $166.2 million net loss from continuing operations. That difference was primarily due to $289.1 million of non-cash items, including depreciation and amortization, stock-based compensation and losses from minority investments carried at fair value. During 2016, our working capital did not significantly impact the difference between net cash provided by operating activities and our net income from continuing operations, as benefits related to the timing of payments to merchants and suppliers were offset by a $39.5 million cash payment made upon settlement of a securities litigation matter.
64
For the year ended December 31, 2015, our net cash provided by operating activities from continuing operations was $316.4 million , as compared to a $73.2 million net loss from continuing operations. That difference was due to $253.8 million of non-cash items and a $135.9 million net increase related to changes in working capital and other assets and liabilities. The non-cash items primarily consisted of depreciation and amortization and stock-based compensation. The net increase in working capital and other assets and liabilities reflected the impact of an accrual related to a securities litigation matter that was paid upon settlement in the following year and the timing of payments to merchants and suppliers.
Our net cash used in investing activities from continuing operations was $25.3 million , $55.6 million and $175.2 million for the years ended December 31, 2017, 2016 and 2015, respectively. For the year ended December 31, 2017, our net cash used in investing activities from continuing operations included $59.2 million in capital expenditures and capitalized software, partially offset by $18.3 million of proceeds from a sale of intangible assets and $16.6 million of proceeds from sales and maturities of investments. For the year ended December 31, 2016, our net cash used in investing activities from continuing operations included $68.3 million in capital expenditures and capitalized software, partially offset by $14.5 million in net cash acquired from business combinations. For the year ended December 31, 2015, our net cash used in investing activities from continuing operations included $81.9 million in capital expenditures and capitalized software, $69.9 million in net cash paid for business acquisitions and $25.3 million of minority investment purchases.
Our net cash used in financing activities was $138.0 million , $14.7 million and $515.8 million for the years ended December 31, 2017, 2016 and 2015, respectively. For the year ended December 31, 2017, net cash used in financing activities included $61.2 million in purchases of treasury stock under our share repurchase program, $34.0 million in payments of capital lease obligations and $27.7 million in taxes paid related to net share settlements of stock-based compensation awards. For the year ended December 31, 2016, net cash used in financing activities included $165.4 million in purchases of treasury stock under our share repurchase program, $59.2 million for the purchase of convertible note hedges, $30.6 million in payments of capital lease obligations and $29.8 million in taxes paid related to net share settlements of stock-based compensation awards, partially offset by $250.0 million in proceeds from issuance of our senior convertible notes described below and $35.5 million of proceeds from the issuance of warrants. For the year ended December 31, 2015, net cash used in financing activities included $442.8 million in purchases of treasury stock under our share repurchase program, $40.1 million in taxes paid related to net share settlements of stock-based compensation awards and $24.4 million in payments of capital lease obligations.
Our Amended and Restated Credit Agreement provides for aggregate principal borrowings of up to $250.0 million and matures in July 2019. As of December 31, 2017 , we had no borrowings under our Amended and Restated Credit Agreement and were in compliance with all covenants. See Note 9, Financing Arrangements , for additional information.
In April 2016, we issued convertible notes with an aggregate principal amount of $250.0 million . We received net proceeds of $243.2 million from the issuance of the Notes. We have used the proceeds from the Notes for general corporate purposes, including repurchases of shares of our common stock. Additionally, we entered into note hedge and warrant transactions with certain bank counterparties that are designed to offset, in part, the potential dilution from conversion of the Notes. See Note 9, Financing Arrangements , for additional information.
As of December 31, 2017, we had $321.9 million in cash held by our international subsidiaries, which is primarily denominated in Euros, British Pounds Sterling, Canadian dollars, and, to a lesser extent, Australian dollars and Japanese yen. We consider the undistributed earnings of our foreign subsidiaries as of December 31, 2017 to be indefinitely reinvested. We have not, nor do we anticipate the need to, repatriate funds to the United States to satisfy domestic liquidity needs arising in the ordinary course of business.
The Board of Directors has authorized us to repurchase up to $700.0 million of our common stock through April 2018 under our share repurchase program. During the year ended December 31, 2017 , we purchased 16,906,334 shares of our common stock for an aggregate purchase price of $60.0 million (including fees and commissions) under the share repurchase program. As of December 31, 2017 , up to $135.2 million of our common stock remained available for purchase under that program. The timing and amount of share repurchases, if any, will be determined based on market conditions, limitations under our Amended and Restated Credit Agreement, share price and other factors, and the program may be terminated at any time. Repurchases will be made in compliance with SEC rules and other legal requirements and may be made, in part, under a Rule 10b5-1 plan, which permits share repurchases when we might otherwise be precluded from doing so.
We currently plan to use our cash and cash equivalents and cash flows generated from our operations to fund strategic investments, business acquisitions, working capital needs, investments in technology, marketing and share repurchases. Additionally, we have the ability to borrow funds under the Amended and Restated Credit Agreement. We could also seek to raise additional financing, if available on terms that we believe are favorable, to increase the amount of liquid funds that we can access for share repurchases, future acquisitions or other strategic investment opportunities. Although we can provide no assurances, we
65
believe that our cash and cash equivalents balance and cash generated from operations and available borrowings under our Amended and Restated Credit Agreement should be sufficient to meet our working capital requirements and other capital expenditures for at least the next twelve months.
66
Contractual Obligations and Commitments
The following table summarizes our future contractual obligations and commitments as of December 31, 2017 . The table below excludes $43.7 million of non-current liabilities for unrecognized tax benefits, including interest and penalties, as of December 31, 2017 . We cannot make a reasonable estimate of the period of cash settlement for the tax positions classified as non-current liabilities.
| Payments due by period | ||||||||||||||||||||||||||
| Total |
| 2018 |
| 2019 |
| 2020 |
| 2021 |
| 2022 |
| Thereafter | ||||||||||||||
| (in thousands) | ||||||||||||||||||||||||||
Capital lease obligations (1) | $ | 46,919 | |
| $ | 27,094 | |
| $ | 10,081 | |
| $ | 6,128 | |
| $ | 3,616 | |
| $ | - | |
| $ | - | |
Operating lease obligations (2) | 193,490 | |
| 36,521 | |
| 31,677 | |
| 28,330 | |
| 23,586 | |
| 22,621 | |
| 50,755 | | |||||||
Convertible senior notes (3) | 290,625 | |
| 8,125 | |
| 8,125 | |
| 8,125 | |
| 8,125 | |
| 258,125 | |
| - | | |||||||
Purchase obligations (4) | 24,155 | |
| 13,577 | |
| 9,251 | |
| 1,327 | |
| - | |
| - | |
| - | | |||||||
Total | $ | 555,189 | | | $ | 85,317 | | | $ | 59,134 | | | $ | 43,910 | | | $ | 35,327 | | | $ | 280,746 | | | $ | 50,755 | |
(1) | Capital lease obligations include both principal and interest components of future minimum capital lease payments. |
(2) | Operating lease obligations are primarily for office facilities and are noncancelable. Certain leases contain periodic rent escalation adjustments and renewal and expansion options. Operating lease obligations expire at various dates with the latest maturity in 2027. |
(3) | Represents the principal amount and related interest on our convertible senior notes. |
(4) | Purchase obligations primarily represent noncancelable contractual obligations related to information technology products and services. |
Off-Balance Sheet Arrangements
We did not have any off-balance sheet arrangements as of December 31, 2017 .
67
Critical Accounting Policies and Estimates
Management's Discussion and Analysis of Financial Condition and Results of Operations is based upon our consolidated financial statements, which have been prepared in accordance with U.S. GAAP. Our significant accounting policies are discussed in Note 2, Summary of Significant Accounting Policies, in the notes to the consolidated financial statements.
The preparation of consolidated financial statements requires management to make estimates and assumptions that affect the reported amounts and classifications of assets and liabilities, revenue and expenses, and related disclosure of contingent liabilities. Management bases its estimates on historical experience and on various other assumptions that are believed to be reasonable under the circumstances, the results of which form the basis for making judgments about the carrying values of assets and liabilities that are not readily apparent from other sources. Actual results may differ from those estimates under different assumptions or conditions.
We believe that the estimates and assumptions related to revenue recognition, impairment assessments of goodwill and long-lived assets, income taxes and fair value option investments have the greatest potential impact on our consolidated financial statements. Therefore, we consider these to be our critical accounting policies and estimates.
Revenue Recognition
Refer to Note 2, Summary of Significant Accounting Policies, for information about our revenue recognition accounting policies, including estimates of our refund liabilities.
In May 2014, the Financial Accounting Standards Board ("FASB") issued ASU 2014-09, Revenue from Contracts with Customers (Topic 606) . Since the issuance of ASU 2014-09, the FASB has issued five additional ASUs to clarify certain aspects of the standard's guidance. Those ASUs are effective for annual reporting periods beginning after December 15, 2017 and interim periods within those annual periods. Refer to Note 2, Summary of Significant Accounting Policies , for information about expected changes to our revenue recognition accounting policies as a result of adopting these ASUs.
Impairment Assessments of Goodwill and Long-Lived Assets
Refer to Note 2, Summary of Significant Accounting Policies, and Note 6, Goodwill and Other Intangible Assets, for information about our accounting policies relating to goodwill and impairment of long-lived assets. Additional information about those accounting policies and estimates is set forth in the following paragraphs.
When determining fair values in impairment tests, we use one of the following recognized valuation methods: the income approach (including discounted cash flows), the market approach and the cost approach. Our significant estimates in those fair value measurements include identifying business factors such as size, growth, profitability, risk and return on investment and assessing comparable revenue and earnings multiples. Further, when measuring fair value based on discounted cash flows, we make assumptions about risk-adjusted discount rates; rates of increase in revenue, cost of revenue and operating expenses; weighted average cost of capital; rates of long-term growth; and income tax rates. Valuations are performed by management or third-party valuation specialists under management's supervision, where appropriate. We believe that the estimated fair values used in impairment tests are based on reasonable assumptions that marketplace participants would use. However, such assumptions are inherently uncertain and actual results could differ from those estimates.
Our three reporting units as of October 1, 2017 were North America, EMEA and Asia Pacific. There was no impairment of goodwill for any reporting unit because the fair values of the reporting units exceeded their carrying values.
Future changes in our assumptions or the interrelationship of the assumptions described above may negatively impact future valuations. In future measurements of fair value, adverse changes in assumptions could result in impairments of goodwill or long-lived assets that would require non-cash charges to the consolidated statements of operations and may have a material effect on our financial condition and operating results.
Income Taxes
Refer to Note 2, Summary of Significant Accounting Policies, and Note 14, Income Taxes, for information about our income tax accounting policies.
Fair Value Option Investments
68
Refer to Note 7, Investments, for information about the fair value measurements of our fair value option investments. Additional information about those fair value measurements is set forth in the following paragraphs.
If Monster LP or Nearbuy seek additional financing in order to fund their growth strategies, such financing transactions may result in dilution of our ownership stakes and they may occur at lower valuations, which could significantly decrease the fair values of our investments in those entities. For example, in December 2016, Monster LP issued a new class of partnership units (Class A-1) to its controlling investor group and a new investor for total proceeds of $65.0 million. The fair value of Monster LP implied by the terms of that transaction was lower than its estimated fair value in previous periods, which resulted in a significant decrease in the fair value of our investment for the year ended December 31, 2016. Additionally, if Monster LP or Nearbuy are unable to obtain any such financing, those entities could need to significantly reduce their spending in order to fund their operations. Such actions likely would result in reduced growth forecasts, which also could significantly decrease the fair values of our investments in those entities.
Estimating the fair values of our investments requires significant judgment regarding the assumptions that market participants would use in pricing those assets. As the fair value measurements involve significant unobservable inputs, such as cash flow projections and discount rates, they are classified as Level 3 within the fair value hierarchy. Future changes in judgment about the related fair value inputs, including changes that may result from any subsequent financing transactions undertaken by those investees, could result in significant increases or decreases in fair value that would be recognized in earnings.
Recently Issued Accounting Standards
For a description of recently issued accounting standards, please see Note 2, Summary of Significant Accounting Policies , to the consolidated financial statements included in Item 8 of this Annual Report on Form 10-K.
69
ITEM 7A. QUANTITATIVE AND QUALITATIVE DISCLOSURES ABOUT MARKET RISK
We have operations both within the United States and internationally, and we are exposed to market risks in the ordinary course of our business, including the effect of foreign currency fluctuations, interest rate changes and inflation. Information relating to quantitative and qualitative disclosures about these market risks is set forth below.
Foreign Currency Exchange Risk
We transact business in various foreign currencies other than the U.S. dollar, principally the euro, British pound sterling, Canadian dollar and Australian dollar, which exposes us to foreign currency risk. For the year ended December 31, 2017 , we derived approximately 32.7% of our revenue from our International segment. Revenue and related expenses generated from our international operations are generally denominated in the local currencies of the corresponding countries. The functional currencies of our subsidiaries that either operate or support these markets are generally the same as the corresponding local currencies. However, the results of operations of, and certain of our intercompany balances associated with, our international operations are exposed to foreign currency exchange rate fluctuations. Upon consolidation, as exchange rates vary, our revenue and other operating results may differ materially from expectations, and we may record significant gains or losses on the re-measurement of intercompany balances.
We assess our foreign currency exchange risk based on hypothetical changes in rates utilizing a sensitivity analysis that measures the potential impact on working capital based on a 10% change (increase and decrease) in currency rates. We use a current market pricing model to assess the changes in the value of the U.S. dollar on foreign currency denominated monetary assets and liabilities. The primary assumption used in this model is a hypothetical 10% weakening or strengthening of the U.S. dollar against those currency exposures as of December 31, 2017 and 2016 .
As of December 31, 2017 , our net working capital deficit (defined as current assets less current liabilities) from subsidiaries that are subject to foreign currency translation risk was $21.5 million . The potential increase in this working capital deficit from a hypothetical 10% adverse change in quoted foreign currency exchange rates would be $2.2 million . This compares to a $61.6 million working capital deficit subject to foreign currency exposure as of December 31, 2016 , for which a 10% adverse change would have resulted in a potential increase in this working capital deficit of $6.2 million .
Interest Rate Risk
Our cash and cash equivalents primarily consist of bank deposits and government money market funds. Our exposure to market risk for changes in interest rates is limited because our cash and cash equivalents have a short-term maturity and are used primarily for working capital purposes. In April 2016, we issued convertible notes with an aggregate principal amount of $250.0 million (see Note 9, Financing Arrangements ). The convertible notes bear interest at a fixed rate, so we have no financial statement impact from changes in interest rates. However, changes in market interest rates impact the fair value of the convertible notes along with other variables such as our credit spreads and the market price and volatility of our common stock. In June 2016, we entered into the Amended and Restated Credit Agreement that provides for aggregate principal borrowings of up to $250.0 million . As of December 31, 2017 , there were no borrowings outstanding under the Amended and Restated Credit Agreement. Because the Amended and Restated Credit Agreement bears interest at a variable rate, we are exposed to market risk relating to changes in interest rates if we borrow under the Amended and Restated Credit Agreement. We also have $44.5 million of capital lease obligations and $11.4 million of investments in convertible debt securities issued by nonpublic entities that are classified as available-for-sale. We do not believe that the interest rate risk on the long-term capital lease obligations and investments is significant.
Impact of Inflation
We believe that our results of operations are not materially impacted by moderate changes in the inflation rate. Inflation and changing prices did not have a material effect on our business, financial condition or results of operations for the year ended December 31, 2017 .
70
ITEM 8: FINANCIAL STATEMENTS AND SUPPLEMENTARY DATA
Table of Contents
Groupon, Inc.
Consolidated Financial Statements
As of December 31, 2017 and 2016 and for the Years Ended December 31, 2017 , 2016 and 2015
| Page |
Reports of Independent Registered Public Accounting Firms | 72 |
Consolidated Balance Sheets | 74 |
Consolidated Statements of Operations | 75 |
Consolidated Statements of Comprehensive Income (Loss) | 76 |
Consolidated Statements of Stockholders' Equity | 77 |
Consolidated Statements of Cash Flows | 79 |
Notes to Consolidated Financial Statements | 81 |
Monster Holdings LP
Unaudited Consolidated Financial Statements
As of December 31, 2016 and for the Year Ended December 31, 2016
| Page |
Consolidated Balance Sheet (Unaudited) | 132 |
Consolidated Statement of Operations (Unaudited) | 133 |
Consolidated Statement of Comprehensive Loss (Unaudited) | 134 |
Consolidated Statement of Changes in Partners' Capital (Unaudited) | 135 |
Consolidated Statement of Cash Flows (Unaudited) | 136 |
Notes to Consolidated Financial Statements (Unaudited) | 137 |
Monster Holdings LP
Consolidated Financial Statements
As of December 31, 2015 and for the Period from May 27, 2015 through December 31, 2015
| Page |
Report of Independent Auditors | 153 |
Consolidated Balance Sheet | 154 |
Consolidated Statement of Operations | 155 |
Consolidated Statement of Comprehensive Loss | 156 |
Consolidated Statement of Changes in Partners' Capital | 157 |
Consolidated Statement of Cash Flows | 158 |
Notes to Consolidated Financial Statements | 159 |
71
Report of Independent Registered Public Accounting Firm
To the stockholders and the Board of Directors of Groupon, Inc.
Opinion on the Financial Statements
We have audited the accompanying consolidated balance sheet of Groupon, Inc. and subsidiaries (the "Company") as of December 31, 2017 , the related consolidated statements of operations, comprehensive income (loss), stockholders' equity, and cash flows, for the year ended December 31, 2017 , and the related notes and the schedule listed in the Index at Item 15(2) (collectively referred to as the "financial statements"). In our opinion, the financial statements referred to above present fairly, in all material respects, the financial position of the Company as of December 31, 2017 , and the results of its operations and its cash flows for the year ended December 31, 2017 , in conformity with accounting principles generally accepted in the United States of America.
We have also audited, in accordance with the standards of the Public Company Accounting Oversight Board (United States) (PCAOB), the Company's internal control over financial reporting as of December 31, 2017, based on criteria established in Internal Control - Integrated Framework (2013) issued by the Committee of Sponsoring Organizations of the Treadway Commission and our report dated February 14, 2018 , expressed an unqualified opinion on the Company's internal control over financial reporting.
Basis for Opinion
These financial statements are the responsibility of the Company's management. Our responsibility is to express an opinion on the Company's financial statements based on our audit. We are a public accounting firm registered with the PCAOB and are required to be independent with respect to the Company in accordance with the U.S. federal securities laws and the applicable rules and regulations of the Securities and Exchange Commission and the PCAOB.
We conducted our audit in accordance with the standards of the PCAOB. Those standards require that we plan and perform the audit to obtain reasonable assurance about whether the financial statements are free of material misstatement, whether due to error or fraud. Our audit included performing procedures to assess the risks of material misstatement of the financial statements, whether due to error or fraud, and performing procedures to respond to those risks. Such procedures included examining, on a test basis, evidence regarding the amounts and disclosures in the financial statements. Our audit also included evaluating the accounting principles used and significant estimates made by management, as well as evaluating the overall presentation of the financial statements. We believe that our audit provides a reasonable basis for our opinion.
/s/ Deloitte & Touche LLP
Chicago, Illinois
February 14, 2018
We have served as the Company's auditor since 2017.
72
Report of Independent Registered Public Accounting Firm
The Board of Directors and Stockholders of Groupon, Inc.
We have audited the accompanying consolidated balance sheet of Groupon, Inc. as of December 31, 2016, and the related consolidated statements of operations, comprehensive income (loss), stockholders' equity, and cash flows for each of the two years in the period ended December 31, 2016. Our audits also included the financial statement schedule listed in Item 15(2) for 2016 and 2015. These financial statements and schedule are the responsibility of the Company's management. Our responsibility is to express an opinion on these financial statements and schedule based on our audits.
We conducted our audits in accordance with the standards of the Public Company Accounting Oversight Board (United States). Those standards require that we plan and perform the audit to obtain reasonable assurance about whether the financial statements are free of material misstatement. An audit includes examining, on a test basis, evidence supporting the amounts and disclosures in the financial statements. An audit also includes assessing the accounting principles used and significant estimates made by management, as well as evaluating the overall financial statement presentation. We believe that our audits provide a reasonable basis for our opinion.
In our opinion, the financial statements referred to above present fairly, in all material respects, the consolidated financial position of Groupon, Inc. at December 31, 2016, and the consolidated results of its operations, and its cash flows for each of the two years in the period ended December 31, 2016, in conformity with U.S. generally accepted accounting principles. Also, in our opinion, the related financial statement schedule when considered in relation to the basic consolidated financial statements taken as a whole, presents fairly in all material respects the information set forth therein.
As discussed in Note 2 to the consolidated financial statements, on January 1, 2016, the Company adopted the amendments to the FASB Accounting Standards Codification resulting from Accounting Standards Update No. 2016-09, "Compensation - Stock Compensation (Topic 718) - Improvements to Employee Share-Based Payment Accounting."
/s/ Ernst & Young LLP
Chicago, Illinois
February 15, 2017
except for Notes 1, 3 and 18, as to which the date is May 17, 2017
73
GROUPON, INC.
CONSOLIDATED BALANCE SHEETS
(in thousands, except share and per share amounts)
| December 31, | ||||||
| 2017 |
| 2016 | ||||
Assets |
|
|
| ||||
Current assets: |
|
|
| ||||
Cash and cash equivalents | $ | 880,129 | |
| $ | 862,977 | |
Accounts receivable, net | 98,294 | |
| 71,272 | | ||
Prepaid expenses and other current assets | 94,025 | |
| 94,441 | | ||
Current assets of discontinued operations | - | |
| 63,246 | | ||
Total current assets | 1,072,448 | |
| 1,091,936 | | ||
Property, equipment and software, net | 151,145 | |
| 169,452 | | ||
Goodwill | 286,989 | |
| 274,551 | | ||
Intangible assets, net | 19,196 | |
| 42,915 | | ||
Investments (including $109,751 and $110,066 at December 31, 2017 and December 31, 2016, respectively, at fair value) | 135,189 | |
| 141,882 | | ||
Other non-current assets | 12,538 | |
| 28,635 | | ||
Non-current assets of discontinued operations | - | |
| 12,006 | | ||
Total Assets | $ | 1,677,505 | |
| $ | 1,761,377 | |
Liabilities and Equity |
|
|
| ||||
Current liabilities: |
|
|
| ||||
Accounts payable | $ | 31,968 | |
| $ | 28,551 | |
Accrued merchant and supplier payables | 770,335 | |
| 770,992 | | ||
Accrued expenses and other current liabilities | 331,196 | |
| 366,456 | | ||
Current liabilities held of discontinued operations | - | |
| 47,052 | | ||
Total current liabilities | 1,133,499 | |
| 1,213,051 | | ||
Convertible senior notes, net | 189,753 | |
| 178,995 | | ||
Other non-current liabilities | 102,408 | |
| 101,342 | | ||
Non-current liabilities of discontinued operations | - | |
| 2,927 | | ||
Total Liabilities | 1,425,660 | |
| 1,496,315 | | ||
Commitments and contingencies (see Note 10) | |
| | ||||
Stockholders' Equity |
|
|
| ||||
Common stock, par value $0.0001 per share, 2,010,000,000 shares authorized; 748,541,862 shares issued and 559,939,620 shares outstanding at December 31, 2017; 736,531,771 shares issued and 564,835,863 shares outstanding at December 31, 2016 | 75 | |
| 74 | | ||
Additional paid-in capital | 2,174,708 | |
| 2,112,728 | | ||
Treasury stock, at cost, 188,602,242 shares at December 31, 2017 and 171,695,908 shares at December 31, 2016 | (867,450 | ) |
| (807,424 | ) | ||
Accumulated deficit | (1,088,204 | ) |
| (1,099,010 | ) | ||
Accumulated other comprehensive income (loss) | 31,844 | |
| 58,052 | | ||
Total Groupon, Inc. Stockholders' Equity | 250,973 | |
| 264,420 | | ||
Noncontrolling interests | 872 | |
| 642 | | ||
Total Equity | 251,845 | |
| 265,062 | | ||
Total Liabilities and Equity | $ | 1,677,505 | |
| $ | 1,761,377 | |
See Notes to Consolidated Financial Statements.
74
GROUPON, INC.
CONSOLIDATED STATEMENTS OF OPERATIONS
(in thousands, except share and per share amounts)
|
| Year Ended December 31, | ||||||||||
|
| 2017 |
| 2016 |
| 2015 | ||||||
Revenue: |
|
|
|
|
|
| ||||||
Third-party and other |
| $ | 1,266,452 | |
| $ | 1,206,441 | |
| $ | 1,250,149 | |
Direct |
| 1,577,425 | |
| 1,807,174 | |
| 1,704,667 | | |||
Total revenue |
| 2,843,877 | |
| 3,013,615 | |
| 2,954,816 | | |||
Cost of revenue: |
|
|
|
|
|
| ||||||
Third-party and other |
| 160,810 | |
| 150,031 | |
| 158,095 | | |||
Direct |
| 1,349,206 | |
| 1,582,931 | |
| 1,508,911 | | |||
Total cost of revenue |
| 1,510,016 | |
| 1,732,962 | |
| 1,667,006 | | |||
Gross profit |
| 1,333,861 | |
| 1,280,653 | |
| 1,287,810 | | |||
Operating expenses: |
|
|
|
|
|
| ||||||
Marketing |
| 400,918 | |
| 352,175 | |
| 241,342 | | |||
Selling, general and administrative |
| 901,781 | |
| 994,027 | |
| 1,100,528 | | |||
Restructuring charges |
| 18,828 | | | 40,438 | | | 28,464 | | |||
Gain on sale of intangible assets |
| (17,149 | ) |
| - | |
| - | | |||
Gains on business dispositions |
| - | | | (11,399 | ) | | (13,710 | ) | |||
Acquisition-related expense (benefit), net |
| 48 | |
| 5,650 | |
| 1,857 | | |||
Total operating expenses |
| 1,304,426 | |
| 1,380,891 | |
| 1,358,481 | | |||
Income (loss) from operations |
| 29,435 | |
| (100,238 | ) |
| (70,671 | ) | |||
Other income (expense), net |
| 6,710 | |
| (71,289 | ) |
| (25,586 | ) | |||
Income (loss) from continuing operations before provision (benefit) for income taxes |
| 36,145 | |
| (171,527 | ) |
| (96,257 | ) | |||
Provision (benefit) for income taxes |
| 7,544 | |
| (5,318 | ) |
| (23,010 | ) | |||
Income (loss) from continuing operations |
| 28,601 | |
| (166,209 | ) |
| (73,247 | ) | |||
Income (loss) from discontinued operations, net of tax |
| (1,974 | ) |
| (17,114 | ) |
| 106,926 | | |||
Net income (loss) |
| 26,627 | |
| (183,323 | ) |
| 33,679 | | |||
Net income attributable to noncontrolling interests |
| (12,587 | ) |
| (11,264 | ) |
| (13,011 | ) | |||
Net income (loss) attributable to Groupon, Inc. |
| $ | 14,040 | |
| $ | (194,587 | ) |
| $ | 20,668 | |
|
|
|
|
|
|
| ||||||
Basic net income (loss) per share (1) : |
|
|
|
|
|
| ||||||
Continuing operations |
| $ | 0.03 | |
| $ | (0.31 | ) |
| $ | (0.13 | ) |
Discontinued operations |
| (0.00 | ) |
| (0.03 | ) |
| 0.16 | | |||
Basic net income (loss) per share |
| $ | 0.03 | |
| $ | (0.34 | ) |
| $ | 0.03 | |
|
|
|
|
|
|
| ||||||
Diluted net income (loss) per share (1) : |
|
|
|
|
|
| ||||||
Continuing operations |
| $ | 0.03 | |
| $ | (0.31 | ) |
| $ | (0.13 | ) |
Discontinued operations |
| (0.01 | ) |
| (0.03 | ) |
| 0.16 | | |||
Diluted net income (loss) per share |
| $ | 0.02 | |
| $ | (0.34 | ) |
| $ | 0.03 | |
|
|
|
|
|
|
| ||||||
Weighted average number of shares outstanding (1) |
|
|
|
|
|
| ||||||
Basic |
| 559,367,075 | |
| 576,354,258 | |
| 650,106,225 | | |||
Diluted |
| 568,418,371 | |
| 576,354,258 | |
| 650,106,225 | | |||
(1) | The structure of the Company's common stock changed during the year ended December 31, 2016. Refer to Note 11, Stockholders' Equity , and Note 17, Income (Loss) per Share , for additional information. |
See Notes to Consolidated Financial Statements.
75
GROUPON, INC.
CONSOLIDATED STATEMENTS OF COMPREHENSIVE INCOME (LOSS)
(in thousands)
|
| Year Ended December 31, | ||||||||||
|
| 2017 |
| 2016 |
| 2015 | ||||||
Income (loss) from continuing operations |
| $ | 28,601 | |
| $ | (166,209 | ) |
| $ | (73,247 | ) |
Other comprehensive income (loss) from continuing operations: |
|
|
|
|
|
| ||||||
Foreign currency translation adjustments: |
|
|
|
|
|
| ||||||
Net unrealized gain (loss) during the period |
| (10,589 | ) |
| 15,884 | |
| 8,310 | | |||
Reclassification adjustments included in income (loss) from continuing operations |
| (187 | ) |
| (7,523 | ) |
| (192 | ) | |||
Net change in unrealized gain (loss) |
| (10,776 | ) |
| 8,361 | |
| 8,118 | | |||
Defined benefit pension plan adjustments: |
|
|
|
|
|
| ||||||
Pension liability adjustment |
| - | |
| 830 | |
| (113 | ) | |||
Reclassification adjustments included in income (loss) from continuing operations |
| 585 | |
| 98 | |
| 100 | | |||
Net change in unrealized gain (loss) (net of tax effect of $0, $176 and $3 for the years ended December 31, 2017, 2016 and 2015, respectively) |
| 585 | |
| 928 | |
| (13 | ) | |||
Available-for-sale securities: |
|
|
|
|
|
| ||||||
Net unrealized gain (loss) during the period |
| (1,109 | ) |
| (70 | ) |
| (41 | ) | |||
Reclassification adjustments included in income (loss) from continuing operations |
| 1,603 | |
| - | |
| - | | |||
Net change in unrealized gain (loss) on available-for-sale securities (net of tax effect of $0, $43 and $25 for the years ended December 31, 2017, 2016 and 2015, respectively) |
| 494 | |
| (70 | ) |
| (41 | ) | |||
Other comprehensive income (loss) from continuing operations |
| (9,697 | ) |
| 9,219 | |
| 8,064 | | |||
Comprehensive income (loss) from continuing operations |
| 18,904 | |
| (156,990 | ) |
| (65,183 | ) | |||
|
|
|
|
|
|
| ||||||
Income (loss) from discontinued operations |
| (1,974 | ) |
| (17,114 | ) |
| 106,926 | | |||
Other comprehensive income (loss) from discontinued operations - Foreign currency translation adjustments: |
|
|
|
|
|
| ||||||
Net unrealized gain (loss) during the period |
| (1,793 | ) |
| (9,305 | ) |
| (4,934 | ) | |||
Reclassification adjustment included in income (loss) from discontinued operations |
| (14,718 | ) |
| 6,932 | |
| 12,313 | | |||
Net change in unrealized gain (loss) |
| (16,511 | ) |
| (2,373 | ) |
| 7,379 | | |||
Comprehensive income (loss) from discontinued operations |
| (18,485 | ) |
| (19,487 | ) |
| 114,305 | | |||
|
|
|
|
|
|
| ||||||
Comprehensive income (loss) |
| 419 | |
| (176,477 | ) |
| 49,122 | | |||
Comprehensive income attributable to noncontrolling interests |
| (12,587 | ) |
| (11,264 | ) |
| (13,011 | ) | |||
Comprehensive income (loss) attributable to Groupon, Inc. |
| $ | (12,168 | ) |
| $ | (187,741 | ) |
| $ | 36,111 | |
See Notes to Consolidated Financial Statements.
76
GROUPON, INC.
CONSOLIDATED STATEMENTS OF STOCKHOLDERS' EQUITY
(in thousands, except share amounts)
| Groupon, Inc. Stockholders' Equity |
|
|
|
| ||||||||||||||||||||||||||||||||
| Common Stock (1) |
| Additional Paid-In Capital |
| Treasury Stock |
| Accumulated Deficit |
| Accumulated Other Comprehensive Income |
| Total Groupon Inc. Stockholders' Equity |
| Non-controlling Interests |
| Total Equity | ||||||||||||||||||||||
| Shares |
| Amount | Shares |
| Amount |
| ||||||||||||||||||||||||||||||
Balance at December 31, 2014 | 701,408,060 | |
| $ | 70 | |
| $ | 1,847,420 | |
| (27,239,104 | ) |
| $ | (198,467 | ) |
| $ | (921,960 | ) |
| $ | 35,763 | |
| $ | 762,826 | |
| $ | 2,118 | |
| $ | 764,944 | |
Net income (loss) | - | |
| - | |
| - | |
| - | |
| - | |
| 20,668 | |
| - | |
| 20,668 | |
| 13,011 | |
| 33,679 | | ||||||||
Foreign currency translation | - | |
| - | |
| - | |
| - | |
| - | |
| - | |
| 15,497 | |
| 15,497 | |
| - | |
| 15,497 | | ||||||||
Pension liability adjustment, net of tax | - | |
| - | |
| - | |
| - | |
| - | |
| - | |
| (13 | ) |
| (13 | ) |
| - | |
| (13 | ) | ||||||||
Unrealized gain (loss) on available-for-sale securities, net of tax | - | |
| - | |
| - | |
| - | |
| - | |
| - | |
| (41 | ) |
| (41 | ) |
| - | |
| (41 | ) | ||||||||
Issuance of unvested restricted stock | 2,203,861 | |
| - | |
| - | |
| - | |
| - | |
| - | |
| - | |
| - | |
| - | |
| - | | ||||||||
Exercise of stock options | 673,608 | |
| - | |
| 951 | |
| - | |
| - | |
| - | |
| - | |
| 951 | |
| - | |
| 951 | | ||||||||
Vesting of restricted stock units | 21,306,534 | |
| 3 | |
| (3 | ) |
| - | |
| - | |
| - | |
| - | |
| - | |
| - | |
| - | | ||||||||
Shares issued under employee stock purchase plan | 1,037,198 | |
| - | |
| 4,857 | |
| - | |
| - | |
| - | |
| - | |
| 4,857 | |
| - | |
| 4,857 | | ||||||||
Tax withholdings related to net share settlements of stock-based compensation awards | (6,841,839 | ) |
| (1 | ) |
| (40,818 | ) |
| - | |
| - | |
| - | |
| - | |
| (40,819 | ) |
| - | |
| (40,819 | ) | ||||||||
Stock-based compensation on equity-classified awards | - | |
| - | |
| 156,386 | |
| - | |
| - | |
| - | |
| - | |
| 156,386 | |
| - | |
| 156,386 | | ||||||||
Tax shortfalls, net of excess tax benefits, on stock-based compensation awards | - | |
| - | |
| (4,340 | ) |
| - | |
| - | |
| - | |
| - | |
| (4,340 | ) |
| - | |
| (4,340 | ) | ||||||||
Purchases of treasury stock | - | |
| - | |
| - | |
| (101,229,061 | ) |
| (446,574 | ) |
| - | |
| - | |
| (446,574 | ) |
| - | |
| (446,574 | ) | ||||||||
Distributions to noncontrolling interest holders | - | |
| - | |
| - | |
| - | |
| - | |
| - | |
| - | |
| - | |
| (13,940 | ) |
| (13,940 | ) | ||||||||
Balance at December 31, 2015 | 719,787,422 | |
| $ | 72 | |
| $ | 1,964,453 | |
| (128,468,165 | ) |
| $ | (645,041 | ) |
| $ | (901,292 | ) |
| $ | 51,206 | |
| $ | 469,398 | |
| $ | 1,189 | |
| $ | 470,587 | |
Cumulative effect of change in accounting principle | - | |
| - | |
| - | |
| - | |
| - | |
| (3,131 | ) |
| - | |
| (3,131 | ) |
| - | |
| (3,131 | ) | ||||||||
Net income (loss) | - | |
| - | |
| - | |
| - | |
| - | |
| (194,587 | ) |
| - | |
| (194,587 | ) |
| 11,264 | |
| (183,323 | ) | ||||||||
Foreign currency translation | - | |
| - | |
| - | |
| - | |
| - | |
| - | |
| 5,988 | |
| 5,988 | |
| - | |
| 5,988 | | ||||||||
Pension liability adjustment, net of tax | - | |
| - | |
| - | |
| - | |
| - | |
| - | |
| 928 | |
| 928 | |
| - | |
| 928 | | ||||||||
Unrealized gain (loss) on available-for-sale securities, net of tax | - | |
| - | |
| - | |
| - | |
| - | |
| - | |
| (70 | ) |
| (70 | ) |
| - | |
| (70 | ) | ||||||||
Forfeitures of unvested restricted stock | (196,968 | ) |
| - | |
| - | |
| - | |
| - | |
| - | |
| - | |
| - | |
| - | |
| - | | ||||||||
Exercise of stock options | 491,483 | |
| - | |
| 620 | |
| - | |
| - | |
| - | |
| - | |
| 620 | |
| - | |
| 620 | | ||||||||
Vesting of restricted stock units | 22,698,324 | |
| 3 | |
| (3 | ) |
| - | |
| - | |
| - | |
| - | |
| - | |
| - | |
| - | | ||||||||
Shares issued under employee stock purchase plan | 1,669,782 | |
| - | |
| 4,358 | |
| - | |
| - | |
| - | |
| - | |
| 4,358 | |
| - | |
| 4,358 | | ||||||||
Tax withholdings related to net share settlements of stock-based compensation awards | (7,918,272 | ) |
| (1 | ) |
| (31,160 | ) |
| - | |
| - | |
| - | |
| - | |
| (31,161 | ) |
| - | |
| (31,161 | ) | ||||||||
Stock-based compensation on equity-classified awards | - | |
| - | |
| 131,114 | |
| - | |
| - | |
| - | |
| - | |
| 131,114 | |
| - | |
| 131,114 | | ||||||||
Equity component of the convertible senior notes, net of tax and issuance costs | - | |
| - | |
| 67,014 | |
| - | |
| - | |
| - | |
| - | |
| 67,014 | |
| - | |
| 67,014 | | ||||||||
Purchase of convertible note hedges | - | |
| - | |
| (59,163 | ) |
| - | |
| - | |
| - | |
| - | |
| (59,163 | ) |
| - | |
| (59,163 | ) | ||||||||
Issuance of warrants | - | |
| - | |
| 35,495 | |
| - | |
| - | |
| - | |
| - | |
| 35,495 | |
| - | |
| 35,495 | | ||||||||
Purchases of treasury stock | - | |
| - | |
| - | |
| (43,227,743 | ) |
| (162,383 | ) |
| - | |
| - | |
| (162,383 | ) |
| - | |
| (162,383 | ) | ||||||||
Distributions to noncontrolling interest holders | - | |
| - | |
| - | |
| - | |
| - | |
| - | |
| - | |
| - | |
| (11,811 | ) |
| (11,811 | ) | ||||||||
77
| Groupon, Inc. Stockholders' Equity |
|
|
|
| ||||||||||||||||||||||||||||||||
| Common Stock (1) |
| Additional Paid-In Capital |
| Treasury Stock |
| Accumulated Deficit |
| Accumulated Other Comprehensive Income |
| Total Groupon Inc. Stockholders' Equity |
| Non-controlling Interests |
| Total Equity | ||||||||||||||||||||||
| Shares |
| Amount | Shares |
| Amount |
| ||||||||||||||||||||||||||||||
Balance at December 31, 2016 | 736,531,771 | |
| $ | 74 | |
| $ | 2,112,728 | |
| (171,695,908 | ) |
| $ | (807,424 | ) |
| $ | (1,099,010 | ) |
| $ | 58,052 | |
| $ | 264,420 | |
| $ | 642 | |
| $ | 265,062 | |
Cumulative effect of change in accounting principle | - | |
| - | |
| - | |
| - | |
| - | |
| (3,234 | ) |
| - | |
| (3,234 | ) |
| - | |
| (3,234 | ) | ||||||||
Net income (loss) | - | |
| - | |
| - | |
| - | |
| - | |
| 14,040 | |
| - | |
| 14,040 | |
| 12,587 | |
| 26,627 | | ||||||||
Foreign currency translation | - | |
| - | |
| - | |
| - | |
| - | |
| - | |
| (27,287 | ) |
| (27,287 | ) |
| - | |
| (27,287 | ) | ||||||||
Pension liability adjustment, net of tax | - | |
| - | |
| - | |
| - | |
| - | |
| - | |
| 585 | |
| 585 | |
| - | |
| 585 | | ||||||||
Unrealized gain (loss) on available-for-sale securities, net of tax | - | |
| - | |
| - | |
| - | |
| - | |
| - | |
| 494 | |
| 494 | |
| - | |
| 494 | | ||||||||
Exercise of stock options | 102,803 | |
| - | |
| 230 | |
| - | |
| - | |
| - | |
| - | |
| 230 | |
| - | |
| 230 | | ||||||||
Vesting of restricted stock units and performance share units | 16,596,562 | |
| 2 | |
| (2 | ) |
| - | |
| - | |
| - | |
| - | |
| - | |
| - | |
| - | | ||||||||
Shares issued under employee stock purchase plan | 1,879,656 | |
| - | |
| 5,283 | |
| - | |
| - | |
| - | |
| - | |
| 5,283 | |
| - | |
| 5,283 | | ||||||||
Tax withholdings related to net share settlements of stock-based compensation awards | (6,568,930 | ) |
| (1 | ) |
| (27,187 | ) |
| - | |
| - | |
| - | |
| - | |
| (27,188 | ) |
| - | |
| (27,188 | ) | ||||||||
Stock-based compensation on equity-classified awards | - | |
| - | |
| 83,656 | |
| - | |
| - | |
| - | |
| - | |
| 83,656 | |
| - | |
| 83,656 | | ||||||||
Purchases of treasury stock | - | |
| - | |
| - | |
| (16,906,334 | ) |
| (60,026 | ) |
| - | |
| - | |
| (60,026 | ) |
| - | |
| (60,026 | ) | ||||||||
Distributions to noncontrolling interest holders | - | |
| - | |
| - | |
| - | |
| - | |
| - | |
| - | |
| - | |
| (12,357 | ) |
| (12,357 | ) | ||||||||
Balance at December 31, 2017 | 748,541,862 | |
| $ | 75 | |
| $ | 2,174,708 | |
| (188,602,242 | ) |
| $ | (867,450 | ) |
| $ | (1,088,204 | ) |
| $ | 31,844 | |
| $ | 250,973 | |
| $ | 872 | |
| $ | 251,845 | |
(1) | The structure of the Company's common stock changed during the year ended December 31, 2016. Refer to Note 11, Stockholders' Equity , and Note 17, Income (Loss) per Share , for additional information. |
See Notes to Consolidated Financial Statements.
78
GROUPON, INC.
CONSOLIDATED STATEMENTS OF CASH FLOWS
(in thousands)
| Year Ended December 31, | ||||||||||
| 2017 |
| 2016 |
| 2015 | ||||||
Operating activities |
|
|
|
|
| ||||||
Net income (loss) | $ | 26,627 | |
| $ | (183,323 | ) |
| $ | 33,679 | |
Less: Income (loss) from discontinued operations, net of tax | (1,974 | ) |
| (17,114 | ) |
| 106,926 | | |||
Income (loss) from continuing operations | 28,601 | |
| (166,209 | ) |
| (73,247 | ) | |||
Adjustments to reconcile net income (loss) to net cash provided by operating activities: |
|
|
|
|
| ||||||
Depreciation and amortization of property, equipment and software | 114,795 | |
| 116,961 | |
| 111,072 | | |||
Amortization of acquired intangible assets | 23,032 | |
| 18,948 | |
| 18,310 | | |||
Stock-based compensation | 82,044 | |
| 115,123 | |
| 138,748 | | |||
Restructuring-related long-lived asset impairments | - | |
| 328 | |
| 7,214 | | |||
Gains on business dispositions | - | |
| (11,399 | ) |
| (13,710 | ) | |||
Gain on sale of intangible assets | (17,149 | ) |
| - | |
| - | | |||
Gain on sale of investment | (7,624 | ) |
| - | |
| - | | |||
Impairment of investment | 2,944 | |
| - | |
| - | | |||
Deferred income taxes | 603 | |
| (10,448 | ) |
| (11,042 | ) | |||
(Gain) loss, net from changes in fair value of contingent consideration | 48 | |
| 4,092 | |
| 240 | | |||
(Gain) loss from changes in fair value of investments | (382 | ) |
| 48,141 | |
| 2,943 | | |||
Amortization of debt discount on convertible senior notes | 10,758 | |
| 7,376 | |
| - | | |||
Change in assets and liabilities, net of acquisitions: |
|
|
|
|
| ||||||
Restricted cash | 6,952 | |
| (1,317 | ) |
| 4,556 | | |||
Accounts receivable | (18,793 | ) |
| (16,584 | ) |
| 5,989 | | |||
Prepaid expenses and other current assets | 4,074 | |
| 35,043 | |
| 41,630 | | |||
Accounts payable | (199 | ) |
| 5,121 | |
| 7,898 | | |||
Accrued merchant and supplier payables | (29,823 | ) |
| 26,729 | |
| 40,232 | | |||
Accrued expenses and other current liabilities | (40,361 | ) |
| (32,124 | ) |
| 54,019 | | |||
Other, net | (22,023 | ) |
| (10,853 | ) |
| (18,439 | ) | |||
Net cash provided by (used in) operating activities from continuing operations | 137,497 | |
| 128,928 | |
| 316,413 | | |||
Net cash provided by (used in) operating activities from discontinued operations | (2,418 | ) |
| (11,823 | ) |
| (53,914 | ) | |||
Net cash provided by (used in) operating activities | 135,079 | |
| 117,105 | |
| 262,499 | | |||
Investing activities |
|
|
|
|
| ||||||
Purchases of property and equipment and capitalized software | (59,158 | ) |
| (68,287 | ) |
| (81,946 | ) | |||
Cash derecognized upon dispositions of subsidiaries | - | |
| (1,128 | ) |
| (1,404 | ) | |||
Acquisitions of businesses, net of acquired cash | - | |
| 14,539 | |
| (69,888 | ) | |||
Purchases of investments | - | |
| - | |
| (25,289 | ) | |||
Proceeds from sale of intangible assets | 18,333 | |
| - | |
| - | | |||
Proceeds from sales and maturities of investments | 16,561 | |
| 1,685 | |
| 6,010 | | |||
Acquisitions of intangible assets and other investing activities | (1,059 | ) |
| (2,395 | ) |
| (2,691 | ) | |||
Net cash provided by (used in) investing activities from continuing operations | (25,323 | ) |
| (55,586 | ) |
| (175,208 | ) | |||
Net cash provided by (used in) investing activities from discontinued operations | (9,548 | ) |
| (1,900 | ) |
| 242,428 | | |||
Net cash provided by (used in) investing activities | (34,871 | ) |
| (57,486 | ) |
| 67,220 | | |||
Financing activities |
|
|
|
|
| ||||||
Proceeds from borrowings under revolving credit facility | - | |
| - | |
| 195,000 | | |||
Repayments of borrowings under revolving credit facility | - | |
| - | |
| (195,000 | ) | |||
Proceeds from issuance of convertible senior notes | - | |
| 250,000 | |
| - | | |||
Issuance costs for convertible senior notes and revolving credit agreement | - | |
| (8,147 | ) |
| - | | |||
Purchase of convertible note hedges | - | |
| (59,163 | ) |
| - | | |||
Proceeds from issuance of warrants | - | |
| 35,495 | |
| - | | |||
Payments for purchases of treasury stock | (61,233 | ) |
| (165,357 | ) |
| (442,767 | ) | |||
Taxes paid related to net share settlements of stock-based compensation awards | (27,681 | ) |
| (29,777 | ) |
| (40,101 | ) | |||
Proceeds from stock option exercises and employee stock purchase plan | 5,513 | |
| 4,978 | |
| 5,808 | | |||
Distributions to noncontrolling interest holders | (12,357 | ) |
| (11,811 | ) |
| (13,940 | ) | |||
Payments of contingent consideration related to acquisitions | (7,790 | ) |
| (285 | ) |
| (382 | ) | |||
Payments of capital lease obligations | (34,025 | ) |
| (30,598 | ) |
| (24,403 | ) | |||
79
Other financing activities | (473 | ) |
| - | |
| - | | |||
Net cash provided by (used in) financing activities | (138,046 | ) |
| (14,665 | ) |
| (515,785 | ) | |||
Effect of exchange rate changes on cash and cash equivalents, including cash classified within current assets of discontinued operations | 26,124 | |
| (6,470 | ) |
| (32,485 | ) | |||
Net increase (decrease) in cash and cash equivalents, including cash classified within current assets of discontinued operations | (11,714 | ) |
| 38,484 | |
| (218,551 | ) | |||
Less: Net increase (decrease) in cash classified within current assets of discontinued operations | (28,866 | ) |
| (186 | ) |
| (59,996 | ) | |||
Net increase (decrease) in cash and cash equivalents | 17,152 | |
| 38,670 | |
| (158,555 | ) | |||
Cash and cash equivalents, beginning of period | 862,977 | |
| 824,307 | |
| 982,862 | | |||
Cash and cash equivalents, end of period | $ | 880,129 | |
| $ | 862,977 | |
| $ | 824,307 | |
|
|
|
|
|
| ||||||
Supplemental disclosure of cash flow information |
|
|
|
|
| ||||||
Income tax payments (refunds) for continuing operations | $ | 8,646 | |
| $ | (7,208 | ) |
| $ | (5,461 | ) |
Income tax payments (refunds) for discontinued operations | (56 | ) |
| 2,953 | |
| 15,735 | | |||
Cash paid for interest | 9,425 | |
| 1,185 | |
| 1,032 | | |||
Non-cash investing and financing activities |
|
|
|
|
| ||||||
Continuing operations: |
|
|
|
|
| ||||||
Equipment acquired under capital lease obligations | 28,271 | |
| 21,611 | |
| 44,539 | | |||
Leasehold improvements funded by lessor | 402 | |
| 4,990 | |
| 6,711 | | |||
Liability for purchases of treasury stock | - | |
| 1,207 | |
| 4,181 | | |||
Contingent consideration liabilities incurred in connection with acquisitions | - | |
| - | |
| 9,605 | | |||
Increase (decrease) in liabilities related to purchases of property and equipment and capitalized software | 972 | |
| 3,855 | |
| 2,426 | | |||
Minority investments recognized in connection with business dispositions | - | |
| - | |
| 138,475 | | |||
Cost method investments acquired in connection with business dispositions | 2,022 | |
| 13,507 | |
| - | | |||
See Notes to Consolidated Financial Statements.
80
GROUPON, INC.
NOTES TO CONSOLIDATED FINANCIAL STATEMENTS
1. DESCRIPTION OF BUSINESS AND BASIS OF PRESENTATION
Company Information
Groupon, Inc. and subsidiaries (the "Company"), which commenced operations in October 2008, operates online local commerce marketplaces throughout the world that connect merchants to consumers by offering goods and services, generally at a discount. Customers access those marketplaces through the Company's websites, primarily localized groupon.com sites in many countries, and its mobile applications.
The Company's operations are organized into two segments: North America and International. See Note 18, Segment Information.
In connection with a strategic initiative to optimize its global footprint, the Company sold its operations in 10 countries and ceased operations in another country between November 2016 and March 2017. The financial results of those operations have been presented as discontinued operations in the consolidated financial statements for the years ended December 31, 2017, 2016 and 2015. Additionally, the Company sold a controlling stake in Ticket Monster, Inc. ("Ticket Monster"), a business based in the Republic of Korea, in May 2015. The financial results of Ticket Monster have been presented as discontinued operations in the consolidated financial statements for the year ended December 31, 2015. See Note 3, Discontinued Operations and Other Business Dispositions, for additional information.
2. SUMMARY OF SIGNIFICANT ACCOUNTING POLICIES
Principles of Consolidation
The consolidated financial statements include the accounts of the Company and its subsidiaries. All intercompany accounts and transactions have been eliminated in consolidation. The Company's consolidated financial statements were prepared in accordance with U.S. GAAP and include the assets, liabilities, revenue and expenses of all wholly-owned subsidiaries and majority-owned subsidiaries over which the Company exercises control and variable interest entities for which the Company has determined that it is the primary beneficiary. Outside stockholders' interests in subsidiaries are shown on the consolidated financial statements as Noncontrolling interests. Equity investments in entities in which the Company does not have a controlling financial interest are accounted for under the equity method, the cost method, the fair value option or as available-for-sale securities, as appropriate.
Adoption of New Accounting Standards
The Company adopted the guidance in ASU 2017-01, Business Combinations (Topic 805) - Clarifying the Definition of a Business , on July 1, 2017. This ASU provides clarification on the definition of a business and provides guidance on whether transactions should be accounted for as acquisitions (or disposals) of assets or businesses. The guidance in ASU 2017-01 was applied in determining that the sale of customer lists and other intangible assets in certain food delivery markets, as described in Note 6, Goodwill and Other Intangible Assets, did not meet the definition of a business. The adoption of ASU 2017-01 did not otherwise impact the accompanying consolidated financial statements.
The Company adopted the guidance in ASU 2016-16, Intra-Entity Transfers of Assets Other Than Inventory (Topic 740) , on January 1, 2017. This ASU requires immediate recognition of the income tax consequences of intercompany asset transfers other than inventory. The Company recorded a $3.2 million cumulative effect adjustment to increase its accumulated deficit as of January 1, 2017 to recognize the impact of that change in accounting policy.
The Company adopted the guidance in ASU 2016-09, Compensation - Stock Compensation (Topic 718) - Improvements to Employee Share-Based Payment Accounting , on January 1, 2016. Under this ASU, entities are permitted to make an accounting policy election to either estimate forfeitures on share-based payment awards, as previously required, or to recognize forfeitures as they occur. The Company elected to recognize forfeitures as they occur and the impact of that change in accounting policy was recorded as a $3.1 million cumulative effect adjustment to increase accumulated deficit as of January 1, 2016. Additionally, ASU 2016-09 requires that all income tax effects related to settlements of share-based payment awards be reported in earnings as an
81
GROUPON, INC.
NOTES TO CONSOLIDATED FINANCIAL STATEMENTS (Continued)
increase or decrease to provision (benefit) for income taxes. Previously, income tax benefits at settlement of an award were reported as an increase (or decrease) to additional paid-in capital to the extent that those benefits were greater than (or less than) the income tax benefits reported in earnings during the award's vesting period. The requirement to report those income tax effects in earnings was applied on a prospective basis to settlements occurring on or after January 1, 2016 and the impact of applying that guidance was not material to the consolidated financial statements for the years ended December 31, 2017 and 2016. ASU 2016-09 also requires that all income tax-related cash flows resulting from share-based payment awards be reported as operating activities in the consolidated statement of cash flows. Previously, income tax benefits at settlement of an award were reported as a reduction to operating cash flows and an increase to financing cash flows to the extent that those benefits exceeded the income tax benefits reported in earnings during the award's vesting period. The Company elected to apply that change in cash flow classification on a retrospective basis, which resulted in an increase of $7.6 million to net cash provided by operating activities and a corresponding increase to net cash used in financing activities for the year ended December 31, 2015. The remaining provisions of ASU 2016-09 did not have a material impact on the accompanying consolidated financial statements.
The Company adopted the guidance in ASU 2015-11, Inventory (Topic 330) - Simplifying the Measurement of Inventory , on January 1, 2017. This ASU requires inventory to be measured at the lower of cost or net realizable value, rather than the lower of cost or market. The adoption of ASU 2015-11 did not have a material impact on the accompanying consolidated financial statements.
Reclassifications
Certain reclassifications have been made to the consolidated financial statements of prior periods and the accompanying notes to conform to the current period presentation.
Use of Estimates
The preparation of consolidated financial statements in conformity with U.S. GAAP requires estimates and assumptions that affect the reported amounts and classifications of assets and liabilities, revenue and expenses, and the related disclosures of contingent liabilities in the consolidated financial statements and accompanying notes. Estimates are used for, but not limited to, stock-based compensation, income taxes, valuation of goodwill and intangible assets, investments, customer refunds, contingent liabilities and the useful lives of property, equipment and software and intangible assets. Actual results could differ materially from those estimates.
Cash and Cash Equivalents
The Company considers all highly liquid investments with an original maturity of three months or less from the date of purchase to be cash equivalents.
Accounts Receivable, Net
Accounts receivable primarily represents the net cash due from the Company's credit card and other payment processors and from merchants and performance marketing networks for commissions earned on consumer purchases. The carrying amount of the Company's receivables is reduced by an allowance for doubtful accounts that reflects management's best estimate of amounts that will not be collected. The allowance is based on historical loss experience and any specific risks identified in collection matters. Accounts receivable are charged off against the allowance for doubtful accounts when it is determined that the receivable is uncollectible.
Inventories
Inventories, consisting of merchandise purchased for resale, are accounted for using the first-in, first-out ("FIFO") method of accounting and are valued at the lower of cost or net realizable value. The Company writes down its inventory to the lower of cost or net realizable value based upon assumptions about future demand and market conditions. If actual market conditions are less favorable than those projected by the Company, additional inventory write-downs may be required. Once established, the original cost of the inventory less the related inventory write-down represents a new cost basis.
82
GROUPON, INC.
NOTES TO CONSOLIDATED FINANCIAL STATEMENTS (Continued)
Restricted Cash
Restricted cash primarily represents amounts that the Company is unable to access for operational purposes pursuant to letters of credit with financial institutions. The Company had $4.9 million and $0.4 million of restricted cash recorded within Prepaid expenses and other current assets and Other non-currents assets, respectively, as of December 31, 2017 . The Company had $5.8 million and $6.2 million of restricted cash recorded within Prepaid expenses and other current assets and Other non-currents assets, respectively, as of December 31, 2016 .
Property and Equipment
Property and equipment are stated at cost and assets under capital leases are stated at the lesser of the present value of minimum lease payments or their fair market value. Depreciation and amortization of property and equipment is recorded on a straight-line basis over the estimated useful lives of the assets. Generally, the useful lives are three years for computer hardware and office equipment, five to ten years for furniture and fixtures and warehouse equipment and the shorter of the term of the lease or the asset's useful life for leasehold improvements and assets under capital leases.
Internal-Use Software
The Company incurs costs related to internal-use software and website development, including purchased software and internally-developed software. Costs incurred in the planning and evaluation stage of internally-developed software and website development are expensed as incurred. Costs incurred and accumulated during the application development stage are capitalized and included within Property, equipment and software, net on the consolidated balance sheets. Amortization of internal-use software is recorded on a straight-line basis over the two -year estimated useful life of the assets.
Impairment of Long-Lived Assets
Long-lived assets, such as property, equipment and software and intangible assets, are reviewed for impairment whenever events or changes in circumstances indicate that the carrying amount of an asset or asset group may not be recoverable. If circumstances require that a long-lived asset or asset group to be held and used be tested for possible impairment, the Company first compares the undiscounted cash flows expected to be generated by that long-lived asset or asset group to its carrying amount. If the carrying amount of the long-lived asset or asset group is not recoverable on an undiscounted cash flow basis, an impairment is recognized to the extent that the carrying amount exceeds its fair value.
Long-lived assets or disposal groups classified as held for sale are recorded at the lower of their carrying amount or fair value less estimated selling costs. Long-lived assets are not depreciated or amortized while classified as held for sale.
Goodwill
Goodwill is allocated to the Company's reporting units at the date the goodwill is initially recorded. Once goodwill has been allocated to the reporting units, it no longer retains its identification with a particular acquisition and becomes identified with the reporting unit in its entirety. Accordingly, the fair value of the reporting unit as a whole is available to support the recoverability of its goodwill.
The Company evaluates goodwill for impairment annually on October 1 or more frequently when an event occurs or circumstances change that indicates the carrying value may not be recoverable. The Company has the option to assess goodwill for impairment by first performing a qualitative assessment to determine whether it is more-likely-than-not that the fair value of a reporting unit is less than its carrying amount. If the Company determines that it is not more-likely-than-not that the fair value of a reporting unit is less than its carrying amount, then the two-step goodwill impairment test is not required to be performed. If the Company determines that it is more-likely-than-not that the fair value of a reporting unit is less than its carrying amount, or if the Company does not elect the option to perform an initial qualitative assessment, the Company performs the two-step goodwill impairment test. In the first step, the fair value of the reporting unit is compared to its book value including goodwill. If the fair value of the reporting unit is in excess of its book value, the related goodwill is not impaired and no further analysis is necessary. If the fair value of the reporting unit is less than its book value, there is an indication of potential impairment and a second step is performed. When required, the second step of testing involves calculating the implied fair value of goodwill for the reporting unit. The implied fair value of goodwill is determined in the same manner as goodwill recognized in a business combination, which is the excess of the fair value of the reporting unit determined in step one over the fair value of its net assets, including identifiable
83
GROUPON, INC.
NOTES TO CONSOLIDATED FINANCIAL STATEMENTS (Continued)
intangible assets, as if the reporting unit had been acquired. If the carrying value of the reporting unit's goodwill exceeds the implied fair value of that goodwill, an impairment loss is recognized in an amount equal to that excess. For reporting units with a negative book value (i.e., excess of liabilities over assets), the Company evaluates qualitative factors to determine whether it is necessary to perform the second step of the goodwill impairment test.
Investments
Investments in nonmarketable equity shares with no redemption provisions that are not common stock or in-substance common stock or for which the Company does not have the ability to exercise significant influence are accounted for using the cost method of accounting and are classified within Investments on the consolidated balance sheets. Under the cost method of accounting, investments are carried at cost and are adjusted only for other-than-temporary declines in fair value, certain distributions and additional investments.
Investments in common stock or in-substance common stock for which the Company has the ability to exercise significant influence are accounted for under the equity method, except where the Company has made an irrevocable election to account for the investments at fair value. These investments are classified within Investments on the consolidated balance sheets. The Company's proportionate share of income or loss on equity method investments and changes in the fair values of investments for which the fair value option has been elected are presented within Other income (expense), net on the consolidated statements of operations.
Investments in convertible debt securities and convertible redeemable preferred shares are accounted for as available-for-sale securities, which are classified within Investments on the consolidated balance sheets. Available-for-sale securities are recorded at fair value each reporting period. Unrealized gains and losses, net of the related tax effects, are excluded from earnings and recorded as a separate component within Accumulated other comprehensive income (loss) on the consolidated balance sheets until realized. Interest income from available-for-sale securities is reported within Other income (expense), net on the consolidated statements of operations.
Other-than-Temporary Impairment of Investments
An unrealized loss exists when the current fair value of an investment is less than its cost basis. The Company conducts reviews of its investments with unrealized losses on a quarterly basis to evaluate whether those impairments are other-than-temporary. This evaluation, which is performed at the individual investment level, considers qualitative and quantitative factors regarding the severity and duration of the unrealized loss, as well as the Company's intent and ability to hold the investment for a period of time that is sufficient to allow for an anticipated recovery in value. Evidence considered in this evaluation includes the amount of the impairment, the length of time that the investment has been impaired, the factors contributing to the impairment, the financial condition and near-term prospects of the investee, recent operating trends and forecasted performance of the investee, market conditions in the geographic area or industry in which the investee operates and the Company's strategic plans for holding the investment in relation to the period of time expected for an anticipated recovery in value. Additionally, the Company considers whether it intends to sell the investment or whether it is more likely than not that it will be required to sell the investment before recovery of its amortized cost basis. Investments with unrealized losses that are determined to be other-than-temporary are written down to fair value with a charge to earnings. Unrealized losses that are determined to be temporary in nature are not recorded for cost method investments and equity method investments, while such losses are recorded, net of tax, in accumulated other comprehensive income (loss) for available-for-sale securities.
Income Taxes
The Company accounts for income taxes using the asset and liability method, under which deferred income tax assets and liabilities are recognized based upon anticipated future tax consequences attributable to differences between the financial statement carrying amounts of assets and liabilities and their respective tax bases. The Company regularly reviews deferred tax assets to assess whether it is more likely than not that the deferred tax assets will be realized and, if necessary, establish a valuation allowance for portions of such assets to reduce the carrying value.
For purposes of assessing whether it is more likely than not that deferred tax assets will be realized, the Company considers the following four sources of taxable income for each tax jurisdiction: (a) future reversals of existing taxable temporary differences, (b) projected future earnings, (c) taxable income in carryback years, to the extent that carrybacks are permitted under the tax laws of the applicable jurisdiction, and (d) tax planning strategies, which represent prudent and feasible actions that a company ordinarily might not take, but would take to prevent an operating loss or tax credit carryforward from expiring unused. To the extent that
84
GROUPON, INC.
NOTES TO CONSOLIDATED FINANCIAL STATEMENTS (Continued)
evidence about one or more of these sources of taxable income is sufficient to support a conclusion that a valuation allowance is not necessary, other sources need not be considered. Otherwise, evidence about each of the sources of taxable income is considered in arriving at a conclusion about the need for and amount of a valuation allowance. See Note 14, Income Taxes , for further information about the Company's valuation allowance assessments.
The Company is subject to taxation in the United States, various states and foreign jurisdictions. Significant judgment is required in determining the worldwide provision for income taxes and recording the related income tax assets and liabilities. During the ordinary course of business, there are many transactions and calculations for which the ultimate tax determination is uncertain. For example, the Company's effective tax rate could be adversely affected by earnings being lower than anticipated in countries where it has lower statutory rates and higher than anticipated in countries where it has higher statutory rates, by changes in foreign currency exchange rates, by changes in the valuation of deferred tax assets and liabilities, by changes in the measurement of uncertain tax positions or by changes in the relevant laws, regulations, principles and interpretations. The Company accounts for uncertainty in income taxes by recognizing the financial statement benefit of a tax position only after determining that the relevant tax authority would more likely than not sustain the position following an audit. For tax positions meeting the more-likely-than-not criteria, the amount recognized in the consolidated financial statements is the largest benefit that has a greater than 50 percent likelihood of being realized upon ultimate settlement with the relevant tax authority.
Lease and Asset Retirement Obligations
The Company classifies leases at their inception as either operating or capital leases and may receive renewal or expansion options, rent holidays, and leasehold improvement or other incentives on certain lease agreements. The Company recognizes operating lease costs on a straight-line basis, taking into account adjustments for free or escalating rental payments and deferred payment terms. Additionally, lease incentives are accounted for as a reduction of lease costs over the lease term. Rent expense associated with operating lease obligations is primarily classified within Selling, general and administrative on the consolidated statements of operations. Minimum lease payments made under capital leases are apportioned between interest expense, which is presented within Other income (expense), net on the consolidated statements of operations, and a reduction of the related capital lease obligations, which are classified within Accrued expenses and other current liabilities and Non-current liabilities on the consolidated balance sheets.
The Company establishes assets and liabilities for the present value of estimated future costs to retire long-lived assets at the termination or expiration of a lease. Such assets are amortized over the lease term, and the recorded liabilities are accreted to the future value of the estimated retirement costs. The related amortization and accretion expenses are presented within Selling, general and administrative on the consolidated statements of operations.
Revenue Recognition
The Company recognizes revenue when the following criteria are met: persuasive evidence of an arrangement exists; delivery has occurred; the selling price is fixed or determinable; and collection is reasonably assured.
Third-party revenue
The Company generates third-party revenue from transactions in which it acts as a marketing agent, primarily by selling vouchers ("Groupons") through its online local commerce marketplaces that can be redeemed for goods or services with third-party merchants. The Company's marketplaces include three primary categories of offerings: Local, Goods and Travel.
Third-party revenue is reported on a net basis as the purchase price received from the customer for the voucher less the portion of the purchase price that is payable to the featured merchant. Revenue is presented on a net basis because the Company is acting as a marketing agent of the merchant in those transactions.
Third-party revenue is recognized when the customer purchases a voucher, the voucher has been electronically delivered to the purchaser and a listing of vouchers sold has been made available to the merchant. At that time, the Company's obligations to the merchant, for which it is serving as a marketing agent, are substantially complete. The Company's remaining obligations, which are limited to remitting payment to the merchant and continuing to make available on its website information about vouchers sold that was previously provided to the merchant, are inconsequential and perfunctory administrative activities. For a portion of the hotel offerings available through the Company's online local marketplaces, customers make room reservations directly through
85
GROUPON, INC.
NOTES TO CONSOLIDATED FINANCIAL STATEMENTS (Continued)
its websites. Such reservations are generally cancelable at any time prior to check-in and the Company defers the revenue on those transactions until the customer's stay commences.
For merchant payment arrangements that are structured under a redemption model, merchants are not paid until the customer redeems the voucher that has been purchased. If a customer does not redeem the voucher under this payment model, the Company retains all of the gross billings. The Company recognizes variable consideration from unredeemed vouchers and derecognizes the related accrued merchant payable when its legal obligation to the merchant expires, which the Company believes is shortly after deal expiration in most jurisdictions that have payment arrangements structured under a redemption model.
Direct revenue
The Company generates direct revenue from selling merchandise inventory through its Goods category. Direct revenue is reported on a gross basis as the purchase price received from the customer. The Company is the primary obligor in those transactions, is subject to general inventory risk and has latitude in establishing prices. For Goods transactions in which the Company acts as a marketing agent of a third-party merchant, revenue is recorded on a net basis and is presented within third-party revenue.
Direct revenue, including associated shipping revenue, is recognized when title passes to the customer upon delivery of the product.
Other revenue
Commission revenue is earned when customers make purchases with retailers using digital coupons accessed through the Company's websites and mobile applications. The Company recognizes that commission revenue in the period in which the underlying transactions are completed. Advertising revenue is recognized when the advertiser's logo or website link has been included on the Company's websites or in specified email distributions for the requisite period of time as set forth in the agreement with the advertiser.
Refunds
Estimated refunds are recorded as a reduction of revenue, except for refunds on third-party revenue transactions for which the merchant's share is not recoverable, which are presented as a cost of revenue. The liability for estimated refunds is included within Accrued expenses and other current liabilities on the consolidated balance sheets.
The Company estimates future refunds using a model that incorporates historical refund experience, including the relative risk of refunds based on deal category. The portion of customer refunds for which the merchant's share is not recoverable on third-party revenue deals is estimated based on the refunds that are expected to be issued after expiration of the related vouchers, the refunds that are expected to be issued due to merchant bankruptcies or poor customer experience and whether the payment terms of the related merchant contracts are structured using a redemption payment model or a fixed payment model.
The Company assesses the trends that could affect its estimates on an ongoing basis and makes adjustments to the refund reserve calculations if it appears that changes in circumstances, including changes to the Company's refund policies or general economic conditions, may cause future refunds to differ from its initial estimates. If actual results are not consistent with the estimates or assumptions stated above, the Company may need to change its future estimates, and the effects could be material to the consolidated financial statements.
Discounts
The Company provides discount offers to encourage purchases of goods and services through its marketplaces. The Company records discounts as a reduction of revenue.
Sales and related taxes
Sales, use, value-added and related taxes that are imposed on specific revenue-generating transactions are presented on a net basis and excluded from revenue.
86
GROUPON, INC.
NOTES TO CONSOLIDATED FINANCIAL STATEMENTS (Continued)
Cost of Revenue
Cost of revenue is comprised of direct and certain indirect costs incurred to generate revenue. For direct revenue transactions, cost of revenue includes the cost of inventory, shipping and fulfillment costs and inventory markdowns. Fulfillment costs are comprised of third-party logistics provider costs, as well as rent, depreciation, personnel costs and other costs of operating the Company's fulfillment center. For third-party revenue transactions, cost of revenue includes estimated refunds for which the merchant's share is not recoverable. Other costs incurred to generate revenue, which include credit card processing fees, editorial costs, compensation expense for technology support personnel who are responsible for maintaining the infrastructure of the Company's websites, amortization of internal-use software relating to customer-facing applications, web hosting and other processing fees, are attributed to cost of third-party revenue, direct revenue and other revenue in proportion to gross billings during the period.
Customer Credits
The Company issues credits to customers that can be applied against future purchases through its online local commerce marketplaces. Credits are primarily issued as consideration for refunds. To a lesser extent, credits are issued for relationship purposes. Customer credit liabilities are included within Accrued expenses and other current liabilities on the consolidated balances sheets. Credits issued to satisfy refund requests are applied as a reduction to the refunds reserve and credits issued for relationship purposes are classified within Marketing on the consolidated statements of operations. The Company recognizes revenue when customer credits are used in connection with purchases through its marketplaces or when they expire or are forfeited.
Stock-Based Compensation
The Company measures stock-based compensation cost at fair value. Expense is generally recognized on a straight-line basis over the service period during which awards are expected to vest, except for awards with both performance conditions and a graded vesting schedule, which are recognized using the accelerated method. The Company presents stock-based compensation expense within the consolidated statements of operations based on the classification of the respective employees' cash compensation. See Note 12, Compensation Arrangements .
Foreign Currency
Balance sheet accounts of the Company's operations outside of the United States are translated from foreign currencies into U.S. dollars at exchange rates as of the consolidated balance sheet dates. Revenue and expenses are translated at average exchange rates during the period. Foreign currency translation adjustments and foreign currency gains and losses on intercompany balances that are of a long-term investment nature are included within Accumulated other comprehensive income on the consolidated balance sheets. Foreign currency gains and losses resulting from transactions that are denominated in currencies other than the entity's functional currency, including foreign currency gains and losses on intercompany balances that are not of a long-term investment nature, are included within Other income (expense), net on the consolidated statements of operations.
Recently Issued Accounting Standards
In May 2014, the Financial Accounting Standards Board ("FASB") issued ASU 2014-09, Revenue from Contracts with Customers . That ASU is a comprehensive new revenue recognition model that requires a company to recognize revenue to depict the transfer of goods or services to a customer at an amount that reflects the consideration it expects to receive in exchange for those goods or services. In March 2016, the FASB issued ASU 2016-08, Revenue from Contracts with Customers: Principal versus Agent Considerations (Reporting Gross versus Net) , which is effective upon adoption of ASU 2014-09. That ASU clarifies the implementation guidance in ASU 2014-09 on principal versus agent considerations. Those ASUs are effective for annual reporting periods beginning after December 15, 2017 and interim periods within those annual periods. The ASUs will not significantly impact the Company's presentation of revenue on a gross or net basis. However, the Company expects the following changes as a result of adopting the ASUs:
87
GROUPON, INC.
NOTES TO CONSOLIDATED FINANCIAL STATEMENTS (Continued)
• | For merchant payment arrangements that are structured under a redemption model, variable consideration from vouchers that will not ultimately be redeemed will be estimated and recognized as revenue at the time of sale, rather than when the Company's legal obligation expires. Additionally, that change will reduce the Company's accrued merchant payable liabilities as compared to its current policy. However, that change could increase or decrease revenue in any given period as compared to the Company's current policy depending on the relative amounts of the estimated variable consideration from unredeemed vouchers on current transactions as compared to the actual variable consideration from vouchers that expire unredeemed in that period. |
• | The incremental costs to obtain contracts with customers, such as sales commissions, will be deferred and recognized over the expected period of benefit, rather than expensed as incurred. Additionally, that change will increase the Company's prepaid expense assets as compared to its current policy. However, that change could increase or decrease the Company's selling, general and administrative expenses as compared to the Company's current policy depending on the relative amounts of amortization of deferred commissions as compared to actual commission obligations arising in that period. |
• | Income for customer credits that are not expected to be used will be estimated and recognized as revenue in proportion to the pattern of redemption for customer credits that are used, rather than when they expire or are forfeited. The impact of that change is not expected to be significant to the Company's consolidated financial statements. |
• | Revenue from hotel reservation offerings will be recognized at the time the reservation is made, net of an allowance for estimated cancellations, rather than at check-in. The impact of that change is not expected to be significant to the Company's consolidated financial statements. |
• | Refunds on third-party revenue transactions for which the merchant's share is not recoverable will be recognized as a reduction of revenue, rather than as a cost of revenue. Additionally, credits issued to consumers for relationship purposes will be classified as a reduction of revenue, rather than as marketing expenses. Those income statement classification changes would have reduced revenue by approximately $36.8 million if they had been applied for the year ended December 31, 2017. |
The Company plans to adopt the ASUs using the "modified retrospective" approach, which requires the cumulative effect of initially applying the guidance to be recognized as an adjustment to its accumulated deficit as of the January 1, 2018 adoption date. The items described above that impact the timing of revenue recognition are expected to result in a cumulative effect adjustment to reduce accumulated deficit by an after-tax amount ranging from $85.0 million to $90.0 million as of January 1, 2018.
In January 2016, the FASB issued ASU 2016-01, Financial Instruments (Topic 825-10) - Recognition and Measurement of Financial Assets and Financial Liabilities. That ASU generally requires equity investments to be measured at fair value with changes in fair value recognized through net income and will eliminate the cost method for equity securities. However, for equity investments without readily determinable fair values the ASU permits entities to elect to measure the investments at cost adjusted for observable price changes and impairments, with changes in the measurement recognized through net income. The Company will apply that measurement alternative to its equity investments that are currently accounted for under the cost method, which had an aggregate carrying amount of $25.4 million as of December 31, 2017. The ASU is effective for annual reporting periods beginning after December 15, 2017, and interim periods within those annual periods. The Company believes that the adoption of this guidance will not have a material impact on its consolidated financial statements.
In February 2016, the FASB issued ASU 2016-02, Leases (Topic 842) . The ASU will require assets and liabilities arising from leases, including operating leases, to be recognized on the balance sheet. The ASU is effective for annual reporting periods beginning after December 15, 2018 and interim periods within those annual periods, and requires a modified retrospective transition method. The Company is still assessing the impact of ASU 2016-02. See Note 10, Commitments and Contingencies , for information about the Company's lease commitments.
In June 2016, the FASB issued ASU 2016-13, Financial Instruments - Credit Losses (Topic 326) - Measurement of Credit Losses of Financial Instruments. The ASU requires entities to measure credit losses for financial assets measured at amortized cost based on expected losses rather than incurred losses. For available-for-sale debt securities with unrealized losses, entities will be required to recognize credit losses through an allowance for credit losses. The ASU will be effective for annual reporting periods beginning after December 15, 2019 and interim periods within those annual periods. While the Company is still assessing the impact of ASU 2016-13, it currently believes that the adoption of this guidance will not have a material impact on its consolidated financial statements.
88
GROUPON, INC.
NOTES TO CONSOLIDATED FINANCIAL STATEMENTS (Continued)
In November 2016, the FASB issued ASU 2016-18, Statement of Cash Flows (Topic 230) - Restricted Cash . This ASU requires that companies include amounts generally described as restricted cash and restricted cash equivalents, along with cash and cash equivalents, when reconciling the beginning-of-period and end-of-period amounts shown on the statement of cash flows. The ASU is effective for annual reporting periods beginning after December 15, 2017 and interim periods within those annual periods, and requires a retrospective transition method. The Company had $5.3 million and $12.0 million of restricted cash as of December 31, 2017 and December 31, 2016, respectively.
In January 2017, the FASB issued ASU 2017-04, Intangibles - Goodwill and Other (Topic 350) - Simplifying the Test for Goodwill Impairment. This ASU eliminates Step 2 of the goodwill impairment test and requires a goodwill impairment to be measured as the amount by which a reporting unit's carrying amount exceeds its fair value, not to exceed the carrying amount of its goodwill. The ASU is effective for annual or any interim goodwill impairment tests in fiscal years beginning after December 15, 2019. The Company believes that the adoption of this guidance will not have a material impact on its consolidated financial statements.
In February 2017, the FASB issued ASU 2017-05, Other Income-Gains and Losses from the Derecognition of Nonfinancial Assets (Subtopic 610-20) - Clarifying the Scope of Asset Derecognition Guidance and Accounting for Partial Sales of Nonfinancial Assets. This ASU is meant to clarify the scope of ASC Subtopic 610-20, Other Income-Gains and Losses from the Derecognition of Nonfinancial Assets , and to add guidance for partial sales of nonfinancial assets. The Company is required to adopt ASU 2017-05 at the same time that it adopts the guidance in ASU 2014-09. The Company believes that the adoption of this guidance will not have a material impact on its consolidated financial statements.
In February 2017, the FASB issued ASU 2017-07, Compensation - Retirement Benefits (Topic 715) - Improving the Presentation of Net Periodic Pension Cost and Net Periodic Postretirement Benefit Cost. This ASU requires employers to include only the service cost component of net periodic pension cost in operating expenses, together with other employee compensation costs. The other components of net periodic pension cost, including interest cost, expected return on plan assets, amortization of prior service cost and settlement and curtailment effects, are to be included in non-operating expenses. The ASU is effective for annual reporting periods beginning after December 15, 2017, and interim periods within those annual periods. The Company believes that the adoption of this guidance will not have a material impact on its consolidated financial statements.
In May 2017, the FASB issued ASU 2017-09, Compensation - Stock Compensation (Topic 718) - Scope of Modification Accounting. This ASU clarifies the changes to terms or conditions of a share-based payment award that require an entity to apply modification accounting. The ASU is effective for annual reporting periods beginning after December 15, 2017, and interim periods within those annual periods. The Company believes that the adoption of this guidance will not have a material impact on its consolidated financial statements.
There are no other accounting standards that have been issued but not yet adopted that the Company believes could have a material impact on its consolidated financial position or results of operations.
3. DISCONTINUED OPERATIONS AND OTHER BUSINESS DISPOSITIONS
A business disposition that represents a strategic shift and has (or will have) a major effect on an entity's operations and financial results is reported as a discontinued operation in the period in which the business is disposed of or meets the criteria for held-for-sale classification. The consolidated financial statements reflect discontinued operations presentation for two strategic actions, as described below.
Discontinued Operations - Global Footprint Optimization
In October 2016, the Company completed a strategic review of its international markets in connection with its efforts to optimize its global footprint and focus on the markets that it believes have the greatest potential to benefit the Company's long-term financial performance. Based on that review, the Company decided to focus its business on 15 core countries and to pursue strategic alternatives for its operations in the remaining 11 countries, which were primarily based in Asia and Latin America. As described below, the dispositions of the Company's operations in those 11 countries were completed between November 2016 and March 2017.
The Company determined that the decision reached by its management and Board of Directors to exit those 11 non-core countries, which comprised a substantial majority of its operations outside of North America and EMEA, which is comprised of
89
GROUPON, INC.
NOTES TO CONSOLIDATED FINANCIAL STATEMENTS (Continued)
Europe, the Middle East and Africa, represented a strategic shift in its business. Additionally, based on its review of quantitative and qualitative factors relevant to the dispositions, the Company determined that the disposition of the businesses in those 11 countries would have a major effect on its operations and financial results. As such, the financial position and results of operations and cash flows for its operations in those 11 countries, including the gains and losses on the dispositions and related income tax effects, are presented as discontinued operations in the accompanying consolidated financial statements as of December 31, 2017 and 2016, and for the years ended December 31, 2017, 2016 and 2015.
Dispositions Completed in 2017
Groupon Israel
On March 21, 2017, the Company sold an 83% controlling stake in its subsidiary in Israel. The Company recognized a pretax gain on the disposition of $1.8 million , which represents the excess of (a) the sum of (i) $2.3 million in net consideration received, consisting of the $0.4 million fair value of its retained minority investment and $2.0 million that the acquirer paid into an escrow account that will be settled within 12 months of closing, less $0.1 million in transaction costs, and (ii) a $0.2 million cumulative translation gain, which was reclassified to earnings, over (b) the $0.7 million net book value upon the closing of the transaction. The amount of cash proceeds to be received in connection with this transaction may change due to final working capital adjustments. See Note 7, Investments , for additional information about this transaction.
Groupon Singapore
On March 10, 2017, the Company sold its subsidiary in Singapore in exchange for a convertible debt investment in the acquirer. The Company recognized a pretax loss on the disposition of $0.5 million , which represents the excess of (a) the sum of (i) the $0.5 million net book value upon closing of the transaction and (ii) a $1.1 million cumulative translation loss, which was reclassified to earnings, over (b) $1.1 million in net consideration received, consisting of the $1.6 million fair value of the investment acquired, less $0.5 million in transaction costs. The Company did not receive any cash proceeds in connection with the transaction. See Note 7, Investments , for additional information about this transaction.
Groupon Hong Kong
On March 3, 2017, the Company sold its subsidiary in Hong Kong. The Company recognized a pretax gain on the disposition of $0.3 million , consisting of the $0.2 million negative net book value upon closing of the transaction and $0.1 million in net consideration received, consisting of $0.2 million received in cash, less $0.1 million in transaction costs.
Groupon Latin America
On February 16, 2017 and March 9, 2017, the Company sold its subsidiaries in Argentina, Chile, Colombia, Peru, Mexico, and Brazil in two transactions with the same counterparty. The Company recognized a net pretax loss on the dispositions of $2.9 million , which represents the excess of (a) the sum of (i) a $2.1 million unfavorable contract liability for transition services, (ii) a $5.4 million indemnification liability and (iii) the $13.6 million net book value upon closing of the transactions, over (b) the sum of (i) a $15.7 million cumulative translation gain, which was reclassified to earnings, and (ii) $2.5 million in net consideration received, consisting of $3.2 million in net cash proceeds, less $0.7 million in transaction costs. The amount of net cash proceeds received in connection with these transactions may change due to final working capital adjustments.
Dispositions Completed in 2016
On November 28, 2016, the Company sold its subsidiary in Malaysia ("Groupon Malaysia") in exchange for a minority investment in the acquirer. The Company recognized a pretax gain on the disposition of $0.3 million , which represents the excess of $2.3 million in net consideration received, consisting of the $2.5 million fair value of the investment acquired, less $0.2 million in transaction costs, over the sum of (i) the $0.8 million net book value upon closing of the transaction and (ii) its $1.2 million cumulative translation loss, which was reclassified to earnings. The Company did not receive any cash proceeds in connection with the transaction. See Note 7, Investments , for additional information about this transaction.
The Company also ceased its operations in South Africa in November 2016. The results of the Company's operations in Malaysia and South Africa, including the gain on the disposition of its operations in Malaysia, are presented within discontinued operations in the accompanying consolidated financial statements for the years ended December 31, 2016 and 2015.
90
GROUPON, INC.
NOTES TO CONSOLIDATED FINANCIAL STATEMENTS (Continued)
Discontinued Operations - Ticket Monster
On May 27, 2015, the Company sold a controlling stake in Ticket Monster to an investor group. The Company analyzed the quantitative and qualitative factors relevant to the Ticket Monster disposition transaction and determined the disposal of its controlling stake in Ticket Monster represented a strategic shift in its business and that had a major effect on its operations and financial results. As such, the financial results of Ticket Monster, the gain on disposition and the related income tax effects are presented within discontinued operations in the accompanying consolidated financial statements for the year ended December 31, 2015.
For the year ended December 31, 2015, the Company recognized a pretax gain on the disposition of $202.2 million ( $154.1 million net of tax), which represents the excess of (a) the $398.8 million in net consideration received, consisting of (i) $285.0 million in cash proceeds and (ii) the $122.1 million fair value of its retained minority investment, less (iii) $8.3 million in transaction costs, over (b) the sum of (i) the $184.3 million net book value of Ticket Monster upon the closing of the transaction and (ii) Ticket Monster's $12.3 million cumulative translation loss, which was reclassified to earnings. See Note 7, Investments , for information about this transaction.
The provision for income taxes for the year ended December 31, 2015 includes (i) the $74.8 million current and deferred income tax effects of the Ticket Monster disposition, partially offset by (ii) a $26.8 million tax benefit that resulted from the recognition of a deferred tax asset related to the excess of the tax basis over the financial reporting basis of the Company's investment in Ticket Monster upon meeting the criteria for held-for-sale classification.
Results of Discontinued Operations and Assets and Liabilities of Discontinued Operations
Th e following table summarizes the major classes of line items included in income (loss) from discontinued operations, net of tax, for the years ended December 31, 2017, 2016 and 2015 (in thousands):
| Global Footprint Optimization |
| Ticket Monster |
| Total | ||||||||||||||||||||||||||||||
| Year Ended December 31, |
| Year Ended December 31, |
| Year Ended December 31, | ||||||||||||||||||||||||||||||
| 2017 (1) (2) |
| 2016 (1) |
| 2015 |
| 2017 |
| 2016 |
| 2015 (1) |
| 2017 (1) (2) |
| 2016 (1) |
| 2015 (1) | ||||||||||||||||||
Third-party and other revenue | $ | 12,602 | |
| $ | 97,105 | |
| $ | 122,384 | |
| $ | - | |
| $ | - | |
| $ | 28,145 | |
| $ | 12,602 | |
| $ | 97,105 | |
| $ | 150,529 | |
Direct revenue | 2,962 | |
| 32,634 | |
| 42,316 | |
| - | |
| - | |
| 39,065 | |
| 2,962 | |
| 32,634 | |
| 81,381 | | |||||||||
Third-party and other cost of revenue | (2,557 | ) |
| (21,697 | ) |
| (30,837 | ) |
| - | |
| - | |
| (13,958 | ) |
| (2,557 | ) |
| (21,697 | ) |
| (44,795 | ) | |||||||||
Direct cost of revenue | (3,098 | ) |
| (31,792 | ) |
| (36,608 | ) |
| - | |
| - | |
| (38,031 | ) |
| (3,098 | ) |
| (31,792 | ) |
| (74,639 | ) | |||||||||
Marketing expense | (1,239 | ) |
| (10,776 | ) |
| (12,993 | ) |
| - | |
| - | |
| (8,495 | ) |
| (1,239 | ) |
| (10,776 | ) |
| (21,488 | ) | |||||||||
Selling, general and administrative expense | (12,007 | ) |
| (72,141 | ) |
| (92,264 | ) |
| - | |
| - | |
| (38,102 | ) |
| (12,007 | ) |
| (72,141 | ) |
| (130,366 | ) | |||||||||
Restructuring charges | (778 | ) |
| (3,170 | ) |
| (1,104 | ) |
| - | |
| - | |
| - | |
| (778 | ) |
| (3,170 | ) |
| (1,104 | ) | |||||||||
Other income (expense), net | 3,852 | |
| (4,818 | ) |
| (2,953 | ) |
| - | |
| - | |
| 96 | |
| 3,852 | |
| (4,818 | ) |
| (2,857 | ) | |||||||||
Loss from discontinued operations before gains (losses) on dispositions and provision for income taxes | (263 | ) |
| (14,655 | ) |
| (12,059 | ) |
| - | |
| - | |
| (31,280 | ) |
| (263 | ) |
| (14,655 | ) |
| (43,339 | ) | |||||||||
Gains (losses) on dispositions | (1,630 | ) |
| 312 | |
| - | |
| - | |
| - | |
| 202,158 | |
| (1,630 | ) |
| 312 | |
| 202,158 | | |||||||||
Provision for income taxes | (81 | ) |
| (2,771 | ) |
| (3,865 | ) |
| - | |
| - | |
| (48,028 | ) |
| (81 | ) |
| (2,771 | ) |
| (51,893 | ) | |||||||||
Income (loss) from discontinued operations, net of tax | $ | (1,974 | ) |
| $ | (17,114 | ) |
| $ | (15,924 | ) |
| $ | - | |
| $ | - | |
| $ | 122,850 | |
| $ | (1,974 | ) |
| $ | (17,114 | ) |
| $ | 106,926 | |
(1) | The loss from discontinued operations before gains (losses) on dispositions and provision for income taxes for the years ended December 31, 2017 , 2016 and 2015 includes the results of each business through its respective disposition date. |
(2) | Selling, general and administrative expense from discontinued operations for the year ended December 31, 2017 includes increases to contingent liabilities under indemnification agreements. See Note 10, Commitments and Contingencies , for information about indemnification obligations related to discontinued operations. |
91
GROUPON, INC.
NOTES TO CONSOLIDATED FINANCIAL STATEMENTS (Continued)
The following table summarizes the carrying amounts of the major classes of assets and liabilities classified as discontinued operations in the consolidated balance sheet as of December 31, 2016 (in thousands):
| December 31, 2016 | ||
Cash | $ | 28,866 | |
Accounts receivable, net | 15,386 | | |
Prepaid expenses and other current assets | 18,994 | | |
Property, equipment and software, net | 1,554 | | |
Goodwill | 9,411 | | |
Other non-current assets | 1,041 | | |
Assets of discontinued operations | $ | 75,252 | |
|
| ||
Accounts payable | $ | 722 | |
Accrued merchant and supplier payables | 29,705 | | |
Accrued expenses and other current liabilities | 16,625 | | |
Deferred income taxes | 2,501 | | |
Other non-current liabilities | 426 | | |
Liabilities of discontinued operations | $ | 49,979 | |
Other Business Dispositions
The gains from the transactions below are presented within Gains on business dispositions in the accompanying consolidated statements of operations. The financial results of those entities are presented within income from continuing operations in the accompanying consolidated financial statements through their respective disposition dates. Those financial results were not material for the years ended December 31, 2016 and 2015.
Groupon Russia
On April 12, 2016, the Company sold its subsidiary in Russia ("Groupon Russia"). The Company recognized a pretax gain on the disposition of $8.9 million , consisting of Groupon Russia's $1.6 million negative net book value upon the closing of the transaction and its $7.7 million cumulative translation gain, which was reclassified to earnings, less $0.4 million in transaction costs. The Company did not receive any proceeds in connection with the transaction.
Breadcrumb
On May 9, 2016, the Company sold its point of sale business ("Breadcrumb") in exchange for a minority investment in the acquirer. See Note 7, Investments , for information about this transaction. The Company recognized a pretax gain on the disposition of $0.4 million , which represents the excess of (a) $8.2 million in net consideration received, consisting of the $8.3 million fair value of the investment acquired, less $0.1 million in transaction costs, over (b) the $7.8 million net book value of Breadcrumb upon the closing of the transaction. The Company did not receive any cash proceeds in connection with the transaction.
Groupon Indonesia
On August 5, 2016, the Company sold its subsidiary in Indonesia ("Groupon Indonesia") in exchange for a minority investment in the acquirer. See Note 7, Investments , for information about this transaction. The Company recognized a pretax gain on the disposition of $2.1 million , which represents the excess of $2.4 million in net consideration received, consisting of the $2.7 million fair value of the investment acquired, less $0.3 million in transaction costs, over the sum of (i) the $0.1 million net book value of Groupon Indonesia upon closing of the transaction and (ii) its $0.2 million cumulative translation loss, which was reclassified to earnings. The Company did not receive any cash proceeds in connection with the transaction.
92
GROUPON, INC.
NOTES TO CONSOLIDATED FINANCIAL STATEMENTS (Continued)
Groupon India
On August 6, 2015, the Company's subsidiary in India ("Groupon India") completed an equity financing transaction with a third-party investor that obtained a majority voting interest in the entity. See Note 7, Investments , for information about this transaction. The Company recognized a pretax gain on the disposition of $13.7 million , which represents the excess of (a) the sum of (i) $14.2 million in net consideration received, consisting of the $16.4 million fair value of its retained minority investment, less $1.3 million in transaction costs and a $0.9 million guarantee liability and (ii) Groupon India's $0.9 million cumulative translation gain, which was reclassified to earnings, over (b) the $1.4 million net book value of Groupon India upon the closing of the transaction. The Company did not receive any cash proceeds in connection with the transaction.
4. BUSINESS COMBINATIONS
The Company did not acquire any businesses during the year ended December 31, 2017 .
For each of the years ended December 31, 2016 and 2015 , $1.6 million of external transaction costs related to business combinations, primarily consisting of legal and advisory fees, are classified within Acquisition-related expense (benefit), net on the consolidated statements of operations.
2016 Acquisition Activity
The Company acquired three businesses during the year ended December 31, 2016 and the results of each of those acquired businesses are included in the consolidated financial statements beginning on the respective acquisition dates. The fair value of consideration transferred in business combinations is allocated to the tangible and intangible assets acquired and liabilities assumed at the acquisition date, with the remaining unallocated amount recorded as goodwill. Acquired goodwill represents the premium the Company paid over the fair value of the net tangible and intangible assets acquired. The Company paid these premiums for a number of reasons, including growing the Company's merchant and customer base and acquiring an assembled workforce. The goodwill from these business combinations is generally not deductible for tax purposes.
LivingSocial, Inc.
On October 31, 2016, the Company acquired all of the outstanding equity interests of LivingSocial, Inc. ("LivingSocial"), an e-commerce company that connects merchants to consumers by offering goods and services, generally at a discount. The primary purpose of this acquisition was to grow the Company's customer base. The Company acquired LivingSocial for no consideration.
93
GROUPON, INC.
NOTES TO CONSOLIDATED FINANCIAL STATEMENTS (Continued)
The following table summarizes the assets acquired and liabilities assumed from the LivingSocial acquisition (in thousands):
Cash and cash equivalents | $ | 15,479 | |
Accounts receivable | 3,652 | | |
Prepaid expenses and other current assets | 2,399 | | |
Property, equipment and software | 1,075 | | |
Goodwill | 528 | | |
Intangible assets: (1) |
| ||
Customer relationships | 16,200 | | |
Merchant relationships | 2,700 | | |
Trade name | 1,000 | | |
Developed technology | 2,500 | | |
Other non-current assets | 5,495 | | |
Total assets acquired | $ | 51,028 | |
Accounts payable | $ | 2,184 | |
Accrued merchant and supplier payables | 18,498 | | |
Accrued expenses and other current liabilities | 25,854 | | |
Other non-current liabilities | 4,492 | | |
Total liabilities assumed | $ | 51,028 | |
Total acquisition price | $ | - | |
(1) | The estimated useful lives of the acquired intangible assets are 1 year for developed technology, 4 years for trade name and 3 years for merchant relationships and customer relationships. |
| Year Ended December 31, | ||||||
| 2016 |
| 2015 | ||||
Revenue | $ | 3,070,431 | |
| $ | 3,100,089 | |
Loss from continuing operations | (182,781 | ) |
| (94,756 | ) | ||
The revenue and net loss of LivingSocial included in the Company's consolidated statements of operations were $9.3 million and $4.3 million , respectively, for the period from October 31, 2016 through December 31, 2016.
Other Acquisitions
The Company acquired two other businesses during the year ended December 31, 2016. The acquisition price of those businesses and the assets acquired and liabilities assumed were not material.
2015 Acquisition Activity
The Company acquired seven businesses during the year ended December 31, 2015 and the results of each of those acquired businesses are included in the consolidated financial statements beginning on the respective acquisition dates.
94
GROUPON, INC.
NOTES TO CONSOLIDATED FINANCIAL STATEMENTS (Continued)
OrderUp, Inc.
On July 16, 2015, the Company acquired all of the outstanding equity interests of OrderUp, Inc. ("OrderUp"), an on-demand online and mobile food ordering and delivery marketplace based in the United States. The purpose of this acquisition was to expand the Company's local offerings in the food ordering and delivery sector, acquire an assembled workforce and enhance related technology capabilities. The acquisition-date fair value of the consideration transferred for the OrderUp acquisition totaled $78.4 million , which consisted of the following (in thousands):
Cash | $ | 68,749 | |
Contingent consideration | 9,605 | | |
Total | $ | 78,354 | |
The following table summarizes the allocation of the acquisition price of the OrderUp acquisition (in thousands):
Cash and cash equivalents | $ | 2,264 | |
Accounts receivable | 1,377 | | |
Prepaid expenses and other current assets | 404 | | |
Property, equipment and software | 24 | | |
Goodwill | 60,080 | | |
Intangible assets: (1) |
| ||
Customer relationships | 5,600 | | |
Merchant relationships | 1,100 | | |
Developed technology | 11,300 | | |
Trade name | 900 | | |
Other intangible assets | 1,850 | | |
Other non-current assets | 31 | | |
Total assets acquired | $ | 84,930 | |
Accounts payable | $ | 901 | |
Accrued merchant and supplier payables | 1,021 | | |
Accrued expenses and other current liabilities | 2,918 | | |
Deferred income taxes | 1,715 | | |
Other non-current liabilities | 21 | | |
Total liabilities assumed | $ | 6,576 | |
Total acquisition price | $ | 78,354 | |
(1) | The estimated useful lives of the acquired intangible assets are 5 years for trade name, 4 years for other intangible assets and 3 years for customer relationships, merchant relationships and developed technology. |
See Note 13, Restructuring , for additional discussion of the Company's food delivery offerings.
Other Acquisitions
The Company acquired six other businesses during the year ended December 31, 2015. The primary purpose of those acquisitions was to acquire assembled workforces, expand and advance product offerings and enhance technology capabilities. The acquisition-date fair value of the consideration transferred for those acquisitions totaled $6.0 million , which was paid in cash.
95
GROUPON, INC.
NOTES TO CONSOLIDATED FINANCIAL STATEMENTS (Continued)
The following table summarizes the allocation of the acquisition price of the other acquisitions for the year ended December 31, 2015 (in thousands):
Net working capital deficit (including acquired cash of $2.3 million) | $ | (647 | ) |
Goodwill | 2,898 | | |
Intangible assets: (1) |
| ||
Customer relationships | 1,016 | | |
Merchant relationships | 809 | | |
Developed technology | 1,339 | | |
Brand relationships | 296 | | |
Other intangible assets | 283 | | |
Total acquisition price | $ | 5,994 | |
(1) | The acquired intangible assets have estimated useful lives of between 1 and 5 years. |
Pro forma results of operations for the OrderUp acquisition and these other acquisitions are not presented because the pro forma effects of those acquisitions, individually and in the aggregate, were not material to the Company's consolidated results of operations for the year ended December 31, 2015 .
5. PROPERTY, EQUIPMENT AND SOFTWARE, NET
The following summarizes the Company's property, equipment and software, net as of December 31, 2017 and 2016 (in thousands):
| December 31, | ||||||
| 2017 |
| 2016 | ||||
Warehouse equipment | $ | 4,989 | |
| $ | 4,862 | |
Furniture and fixtures | 11,700 | |
| 14,417 | | ||
Leasehold improvements | 49,605 | |
| 44,235 | | ||
Office equipment | 2,690 | |
| 2,606 | | ||
Purchased software | 32,090 | |
| 35,165 | | ||
Computer hardware (1) | 208,659 | |
| 197,310 | | ||
Internally-developed software (2) | 249,207 | |
| 212,961 | | ||
Total property, equipment and software, gross | 558,940 | |
| 511,556 | | ||
Less: accumulated depreciation and amortization | (407,795 | ) |
| (342,104 | ) | ||
Property, equipment and software, net | $ | 151,145 | |
| $ | 169,452 | |
(1) | Includes computer hardware acquired under capital leases of $132.3 million and $104.3 million as of December 31, 2017 and 2016 , respectively. |
(2) | The net carrying amount of internally-developed software was $64.5 million and $70.5 million as of December 31, 2017 and 2016 , respectively. |
96
GROUPON, INC.
NOTES TO CONSOLIDATED FINANCIAL STATEMENTS (Continued)
Depreciation and amortization expense on property, equipment and software is classified as follows in the accompanying consolidated statements of operations for the years ended December 31, 2017 , 2016 and 2015 (in thousands):
|
| Year Ended December 31, | ||||||||||
|
| 2017 |
| 2016 |
| 2015 | ||||||
Cost of revenue - third-party and other |
| $ | 26,738 | |
| $ | 21,277 | |
| $ | 16,299 | |
Cost of revenue - direct |
| 9,900 | |
| 10,616 | |
| 9,178 | | |||
Selling, general and administrative |
| 78,157 | |
| 85,068 | |
| 85,595 | | |||
Total |
| $ | 114,795 | |
| $ | 116,961 | |
| $ | 111,072 | |
The above amounts include amortization of internally-developed software of $57.0 million , $55.0 million and $50.0 million , respectively, and amortization expense on assets under capital leases of $35.2 million , $29.8 million and $24.2 million , respectively, for the years ended December 31, 2017 , 2016 and 2015 .
6. GOODWILL AND OTHER INTANGIBLE ASSETS
The following table summarizes the Company's goodwill activity by segment for the years ended December 31, 2017 and 2016 (in thousands):
|
| North America |
| EMEA |
| Rest of World |
| International |
| Consolidated | ||||||||||
Balance as of December 31, 2015 |
| $ | 178,746 | |
| $ | 92,998 | |
| $ | 6,411 | |
| $ | - | |
| $ | 278,155 | |
Goodwill related to acquisitions |
| 1,199 | |
| - | |
| - | |
| - | |
| 1,199 | | |||||
Goodwill related to disposition |
| (1,260 | ) |
| - | |
| (324 | ) |
| - | |
| (1,584 | ) | |||||
Foreign currency translation |
| - | |
| (3,251 | ) |
| 32 | |
| - | |
| (3,219 | ) | |||||
Balance as of December 31, 2016 |
| $ | 178,685 | |
| $ | 89,747 | |
| $ | 6,119 | |
| $ | - | |
| $ | 274,551 | |
Reallocation to new segment |
| - | |
| (89,747 | ) |
| (6,119 | ) |
| 95,866 | |
| - | | |||||
Foreign currency translation |
| - | |
| - | |
| - | |
| 12,438 | |
| 12,438 | | |||||
Balance as of December 31, 2017 |
| $ | 178,685 | |
| $ | - | |
| $ | - | |
| $ | 108,304 | |
| $ | 286,989 | |
The Company evaluates goodwill for impairment annually on October 1 or more frequently when an event occurs or circumstances change that indicates the carrying value may not be recoverable. No goodwill impairments were recognized for the years ended December 31, 2017, 2016 and 2015.
As discussed in Note 18, Segment Information , the Company updated its segments in the first quarter of 2017 to report two segments: North America and International. As a result of the change in segments, the Company combined its Northern EMEA, Southern EMEA and Central EMEA reporting units into a single EMEA reporting unit, which is one level below the International segment. As a result of the change in reporting units, the Company performed a qualitative assessment of potential goodwill impairment for the new EMEA reporting unit and performed separate qualitative assessments of potential goodwill impairment for the Northern EMEA, Southern EMEA and Central EMEA previous reporting units immediately prior to the change. The Company also performed a qualitative assessment of potential goodwill impairment for the remainder of its Asia Pacific reporting unit following the dispositions of businesses in that reporting unit during the first quarter of 2017. Based on those assessments, which considered current market conditions, recent business performance and the amounts by which fair values exceeded carrying values in quantitative impairment tests performed as of October 1, 2016, the Company determined that the likelihood of a goodwill impairment did not reach the more-likely-than not threshold specified in U.S. GAAP for any of the reporting units that were evaluated. Accordingly, the Company concluded that goodwill related to those reporting units was not impaired and further quantitative testing was not required to be performed. In addition, the Company sold all of the operations of its Latin America reporting unit in the first quarter of 2017 and the goodwill of that reporting unit was included in the net book value that was derecognized. See Note 3, Discontinued Operations and Other Business Dispositions , for information about the dispositions of operations in Asia and Latin America.
97
GROUPON, INC.
NOTES TO CONSOLIDATED FINANCIAL STATEMENTS (Continued)
The following table summarizes the Company's intangible assets as of December 31, 2017 and 2016 (in thousands):
|
| December 31, 2017 |
| December 31, 2016 | ||||||||||||||||||||
Asset Category |
| Gross Carrying Value |
| Accumulated Amortization |
| Net Carrying Value |
| Gross Carrying Value |
| Accumulated Amortization |
| Net Carrying Value | ||||||||||||
Customer relationships |
| $ | 56,749 | |
| $ | 46,513 | |
| $ | 10,236 | |
| $ | 59,340 | |
| $ | 40,002 | |
| $ | 19,338 | |
Merchant relationships |
| 11,598 | |
| 9,853 | |
| 1,745 | |
| 12,015 | |
| 8,475 | |
| 3,540 | | ||||||
Trade names |
| 12,077 | |
| 10,469 | |
| 1,608 | |
| 11,534 | |
| 8,004 | |
| 3,530 | | ||||||
Developed technology |
| 36,864 | |
| 36,864 | |
| - | |
| 38,388 | |
| 30,197 | |
| 8,191 | | ||||||
Patents |
| 19,031 | |
| 15,204 | |
| 3,827 | |
| 17,259 | |
| 14,020 | |
| 3,239 | | ||||||
Other intangible assets |
| 10,875 | |
| 9,095 | |
| 1,780 | |
| 14,044 | |
| 8,967 | |
| 5,077 | | ||||||
Total |
| $ | 147,194 | |
| $ | 127,998 | |
| $ | 19,196 | |
| $ | 152,580 | |
| $ | 109,665 | |
| $ | 42,915 | |
Amortization of intangible assets is computed using the straight-line method over their estimated useful lives, which range from 1 to 5 years. Amortization expense from continuing operations related to intangible assets was $23.0 million , $18.9 million and $18.3 million for the years ended December 31, 2017 , 2016 and 2015 , respectively. As of December 31, 2017 , the Company's estimated future amortization expense related to intangible assets is as follows (in thousands):
Years Ended December 31, |
| ||
2018 | $ | 10,692 | |
2019 | 6,657 | | |
2020 | 1,147 | | |
2021 | 508 | | |
2022 | 192 | | |
Thereafter | - | | |
Total | $ | 19,196 | |
Sale of Intangible Assets
On September 15, 2017, the Company sold customer lists and other intangible assets in certain food delivery markets to a subsidiary of Grubhub Inc. ("Grubhub"). The Company recognized a pretax gain on the sale of assets of $17.1 million , which represents the excess of the $19.8 million in net proceeds received, consisting of $ 18.5 million received in cash and $1.5 million that the acquirer paid into an escrow account that will be settled within 12 months of closing, less $0.2 million in transaction costs, over the $2.7 million net book value of the assets upon closing of the transaction. See Note 13, Restructuring, for additional information.
98
GROUPON, INC.
NOTES TO CONSOLIDATED FINANCIAL STATEMENTS (Continued)
7. INVESTMENTS
The following table summarizes the Company's investments as of December 31, 2017 and 2016 (dollars in thousands):
| December 31, 2017 |
| Percent Ownership of Voting Stock |
| December 31, 2016 |
| Percent Ownership of Voting Stock | ||||||||||||
Available-for-sale securities |
|
|
|
|
|
|
|
|
|
|
| ||||||||
Convertible debt securities | $ | 11,354 | |
|
|
|
|
| $ | 10,038 | |
|
|
|
| ||||
Redeemable preferred shares | 15,431 | |
| 19 | % | to | 25 | % |
| 17,444 | |
| 19 | % | to | 25 | % | ||
Total available-for-sale securities | 26,785 | |
|
|
|
|
| 27,482 | |
|
|
|
| ||||||
Cost method investments | 25,438 | |
| 1 | % | to | 19 | % |
| 31,816 | |
| 1 | % | to | 19 | % | ||
Fair value option investments | 82,966 | |
| 10 | % | to | 19 | % |
| 82,584 | |
| 41 | % |
| | | ||
Total investments | $ | 135,189 | |
|
|
| $ | 141,882 | |
|
| ||||||||
The following table summarizes the amortized cost, gross unrealized gain, gross unrealized loss and fair value of the Company's available-for-sale securities as of December 31, 2017 and 2016 , respectively (in thousands):
| December 31, 2017 |
| December 31, 2016 | ||||||||||||||||||||||||||||
| Amortized Cost |
| Gross Unrealized Gain |
| Gross Unrealized Loss (1) |
| Fair Value |
| Amortized Cost |
| Gross Unrealized Gain |
| Gross Unrealized Loss (1) |
| Fair Value | ||||||||||||||||
Available-for-sale securities: |
|
|
|
|
|
|
|
|
|
|
|
|
|
|
| ||||||||||||||||
Convertible debt securities | $ | 10,205 | |
| $ | 1,653 | |
| $ | (504 | ) |
| $ | 11,354 | |
| $ | 8,453 | |
| $ | 1,691 | |
| $ | (106 | ) |
| $ | 10,038 | |
Redeemable preferred shares | 15,431 | |
| - | |
| - | |
| 15,431 | |
| 18,375 | |
| - | |
| (931 | ) |
| 17,444 | | ||||||||
Total available-for-sale securities | $ | 25,636 | |
| $ | 1,653 | |
| $ | (504 | ) |
| $ | 26,785 | |
| $ | 26,828 | |
| $ | 1,691 | |
| $ | (1,037 | ) |
| $ | 27,482 | |
(1) | As of December 31, 2017 and 2016, available-for-sale securities with an unrealized loss had been in a loss position for less than 12 months, except for one security in a loss position of $0.5 million and $0.1 million , respectively. |
Fair Value Option Investments
In connection with the dispositions of controlling stakes in Ticket Monster, an entity based in the Republic of Korea, in May 2015 and Groupon India in August 2015, the Company obtained minority investments in Monster Holdings LP and in Nearbuy Pte Ltd. ("Nearbuy," formerly named GroupMax Pte Ltd.), respectively. The Company has made an irrevocable election to account for both of those investments at fair value with changes in fair value reported in earnings. The Company elected to apply fair value accounting to those investments because it believes that fair value is the most relevant measurement attribute for those investments, as well as to reduce operational and accounting complexity.
Monster LP
In May 2015, the Company completed the sale of a controlling stake in Ticket Monster to an investor group, whereby (a) the investor group contributed $350.0 million in cash to Monster LP, a newly-formed limited partnership, in exchange for 70,000,000 Class A units of Monster LP and (b) the Company contributed all of the issued and outstanding share capital of Ticket Monster to Monster LP in exchange for (i) 64,000,000 Class B units of Monster LP and (ii) $285.0 million in cash consideration. Mr. Daniel Shin, the chief executive officer and founder of Ticket Monster, contributed $10.0 million of cash consideration to Monster LP shortly after the closing date in exchange for 2,000,000 Class A units of Monster LP. Additionally, Monster LP was authorized to issue 20,321,839 Class C units to its management, subject to vesting conditions. Under the terms of the Partnership's amended and restated agreement of limited partnership, its general partner established a Board of Directors and irrevocably assigned the rights to carry out any and all of the objectives and purposes of the partnership to its Board. The general partner is not entitled to receive any distributions.
99
GROUPON, INC.
NOTES TO CONSOLIDATED FINANCIAL STATEMENTS (Continued)
During the fourth quarter of 2015, the Company sold 2,515,461 Class B units for $4.8 million to Mr. Daniel Shin and other employees of Ticket Monster, which resulted in a gain of $0.1 million .
In January 2016, all 20,321,839 of the authorized Class C units were granted to Monster LP's employees. Those share-based payment awards are subject to time-based vesting conditions and, for a portion of the Class C units, a performance-based vesting condition.
In December 2016, Monster LP issued a new class of partnership units (Class A-1) to its controlling investor group and a new investor for total proceeds of $65.0 million . The fair value of Monster LP implied by the terms of the $65.0 million equity financing transaction in December 2016 was lower than its estimated fair value in previous periods, which resulted in a significant decrease in the fair value of the Company's investment for the year ended December 31, 2016.
In February 2017, the Company participated in a recapitalization transaction with Monster LP whereby it exchanged all 61,484,539 of its Class B units for 16,609,195 newly issued Class A-1 units. The Class B units previously held by the Company were then distributed from Monster LP to its controlling investor group and certain other existing unit holders. Upon closing of the transaction, the Company owns 57% of the outstanding Class A-1 units, which represents 9% of the total outstanding partnership units.
Following the February 2017 recapitalization transaction, the Class A-1 units are entitled to a $150.0 million liquidation preference, including an $85.0 million liquidation preference attributable to the Class A-1 units held by the Company, which must be paid prior to any distributions to the holders of the Class A-2, Class B and Class C units. Class A-1 unit holders are also entitled to share in distributions between $950.0 million and $1,494.0 million in accordance with the terms of Monster LP's distribution waterfall and in distributions in excess of $1,494.0 million based on their pro rata ownership of total outstanding partnership units. As a result of the February 2017 recapitalization transaction, the Company currently holds an investment in the most senior equity units in Monster LP's capital structure. However, while providing more downside protection, those Class A-1 units provide less opportunity for appreciation than the Class B units previously held by the Company.
To determine the fair value of the Company's investment in Monster LP each period, the first step was to estimate the fair value of Monster LP in its entirety. The Company primarily used the discounted cash flow method, which is an income approach, to estimate the fair value of Monster LP. The key inputs to determining fair value under that approach are cash flow forecasts and discount rates. As of December 31, 2017 and 2016, the Company applied a discount rate of 22% in its discounted cash flow valuation of Monster LP. The Company also used a market approach valuation technique, which is based on market multiples of guideline companies, to determine the fair value of Monster LP as of December 31, 2017 and 2016. The discounted cash flow and market multiple valuations were then evaluated and weighted to determine the amount that is most representative of the fair value of the investee. Once the Company determined the fair value of Monster LP, it then determined the fair value of its specific investment in that entity. Monster LP has a complex capital structure, so the Company applied an option-pricing model that considers the liquidation preferences of the investee's respective classes of ownership interests to determine the fair value of the Company's investment in the entity.
Based on the above procedures, the Company determined that the fair value of its investment in Monster LP was $78.9 million and $78.7 million , respectively, as of December 31, 2017 and 2016. The Company recognized a gain of $0.2 million and losses of $35.4 million and $3.4 million for the years ended December 31, 2017, 2016 and 2015, respectively, from changes in the fair value of its investment.
100
GROUPON, INC.
NOTES TO CONSOLIDATED FINANCIAL STATEMENTS (Continued)
The following tables summarize the condensed financial information for Monster LP as of December 31, 2017 and 2016, for the years ended December 31, 2017 and 2016 and for the period from May 28, 2015 through December 31, 2015 (in thousands):
|
| Year Ended December 31, 2017 |
| Year Ended December 31, 2016 |
| Period from May 28, 2015 through December 31, 2015 (1) | ||||||
Revenue |
| $ | 280,612 | |
| $ | 216,119 | |
| $ | 83,897 | |
Gross profit |
| 37,773 | |
| 24,774 | |
| (18,986 | ) | |||
Loss before income taxes |
| (124,873 | ) |
| (153,882 | ) |
| (107,919 | ) | |||
Net loss |
| (124,873 | ) |
| (153,882 | ) |
| (107,919 | ) | |||
| December 31, 2017 |
| December 31, 2016 | ||||
Current assets | $ | 174,051 | |
| $ | 171,721 | |
Non-current assets | 520,105 | |
| 466,004 | | ||
Current liabilities | 438,988 | |
| 345,469 | | ||
Non-current liabilities | 60,977 | |
| 22,945 | | ||
(1) | The summarized financial information is presented for the period beginning May 28, 2015, after completion of the Ticket Monster disposition transaction that resulted in the Company obtaining its minority limited partner interest in Monster LP. |
Nearbuy
In August 2015, Groupon India completed an equity financing transaction with a third-party investor that obtained a majority voting interest in the entity, whereby (a) the investor contributed $17.0 million in cash to Nearbuy, a newly formed Singapore-based entity, in exchange for Series A Preference Shares and (b) the Company contributed the shares of Groupon India to Nearbuy in exchange for seed preference shares of Nearbuy. In January 2017, Nearbuy issued additional Series A Preference Shares to its controlling investor for total proceeds of $3.0 million . Upon closing of that transaction, the Series A Preference Shares are entitled to a $20.0 million liquidation preference, which must be paid prior to any distributions to other equity holders.
In December 2017, Nearbuy sold its subsidiary Nearbuy India Pte Ltd., which represented substantially all of its business operations, to a third-party investor in exchange for a minority investment in the acquirer.
To determine the fair value of the Company's investment in Nearbuy each period, the first step was to estimate the fair value of Nearbuy in its entirety. The Company used the discounted cash flow method and the market approach to estimate the fair value of Nearbuy. Once the Company determined the fair value of Nearbuy, it then determined the fair value of its specific investment in the entity. Nearbuy has a complex capital structure, so the Company applied an option-pricing model that considers the liquidation preferences of the respective classes of ownership interests in Nearbuy to determine the fair value of its ownership interest in the entity.
The Company determined that the fair value of its investment in Nearbuy was $4.0 million and $3.9 million , respectively, as of December 31, 2017 and 2016. The Company recognized a gain of $0.1 million , a loss of $12.8 million and a gain of $0.3 million for the years ended December 31, 2017, 2016 and 2015, respectively, from changes in the fair value of its investment.
101
GROUPON, INC.
NOTES TO CONSOLIDATED FINANCIAL STATEMENTS (Continued)
The following tables summarize the condensed financial information for Nearbuy as of December 31, 2017 and 2016, for the years ended December 31, 2017 and 2016 and for the period from August 7, 2015 through December 31, 2015 (in thousands):
|
| Year Ended December 31, 2017 |
| Year Ended December 31, 2016 |
| Period from August 7, 2015 through December 31, 2015 (1) | ||||||
Revenue |
| $ | 3,839 | |
| $ | 3,024 | |
| $ | 578 | |
Gross profit |
| 3,405 | |
| 2,570 | |
| 235 | | |||
Income (loss) before income taxes (2) |
| 15,122 | |
| (15,701 | ) |
| (11,479 | ) | |||
Net income (loss) (2) |
| 15,122 | |
| (15,701 | ) |
| (10,019 | ) | |||
| December 31, 2017 |
| December 31, 2016 | ||||
Current assets | $ | 41 | |
| $ | 3,383 | |
Non-current assets | 18,362 | |
| 18,467 | | ||
Current liabilities | - | |
| 10,458 | | ||
Non-current liabilities | - | |
| 2,523 | | ||
(1) | The summarized financial information is presented for the period beginning August 7, 2015, after completion of the Groupon India disposition transaction that resulted in the Company obtaining its minority investment in Nearbuy. |
(2) | Nearbuy's income before income taxes and net income for the year ended December 31, 2017 includes a $22.6 million gain from the sale of its subsidiary Nearbuy India Pte Ltd. |
Other Investments
In March 2017, the Company acquired a convertible debt instrument of a company that connects consumers with fitness, beauty and wellness businesses in Asia , as consideration for the sale of Groupon Singapore. The convertible debt instrument was recorded at its $1.6 million acquisition date fair value and is accounted for as an available-for-sale security. In November 2016 and August 2016, the Company acquired minority investments in the preferred stock of that company, totaling 12% of its outstanding equity shares, as consideration for the sales of Groupon Malaysia and Groupon Indonesia. The preferred stock was recorded at its acquisition date fair values of $2.5 million and $2.7 million , respectively.
In March 2017, in connection with the disposition of Groupon Israel, the Company retained a minority investment in the entity. The investment was recorded at its $0.4 million fair value at initial recognition and is accounted for as a cost method investment.
In May 2016, the Company acquired a 13% minority investment in the preferred stock of a restaurant software provider as consideration for the sale of Breadcrumb. The preferred stock was recorded at its $8.3 million acquisition date fair value and was accounted for as a cost method investment. In July 2017, the Company sold that investment for total consideration of $16.0 million , consisting of $14.7 million received in cash and $1.3 million that the acquirer paid into an escrow account that will be settled within 18 months of closing. The Company recognized a pretax gain on the disposition of $7.6 million , which is classified within Other income (expense), net on the consolidated statement of operations.
In November 2015, the Company acquired convertible redeemable preferred shares in an entity that operates an online local commerce marketplace specializing in live events for $18.4 million . The convertible redeemable preferred shares are accounted for as available-for-sale securities.
During the year ended December 31, 2015, the Company also invested $6.6 million in convertible debt securities of other investees. The convertible debt securities are accounted for as available-for-sale securities.
102
GROUPON, INC.
NOTES TO CONSOLIDATED FINANCIAL STATEMENTS (Continued)
Other-than-Temporary Impairment
For the year ended December 31, 2017, the Company recorded a $2.9 million other-than-temporary impairment of an investment in redeemable preferred stock, which is reported within Other income (expense), net on the consolidated statements of operations.
8. SUPPLEMENTAL CONSOLIDATED BALANCE SHEETS AND STATEMENTS OF OPERATIONS INFORMATION
The following table summarizes the Company's other income (expense), net for the years ended December 31, 2017 , 2016 and 2015 (in thousands):
|
| Year Ended December 31, | ||||||||||
|
| 2017 |
| 2016 |
| 2015 | ||||||
Interest income |
| $ | 3,287 | |
| $ | 1,808 | |
| $ | 863 | |
Interest expense |
| (20,680 | ) |
| (15,912 | ) |
| (2,789 | ) | |||
Gains (losses), net on changes in fair value of investments |
| 382 | |
| (48,141 | ) |
| (2,943 | ) | |||
Gain on sale of investment |
| 7,624 | |
| - | |
| - | | |||
Foreign currency gains (losses), net (1) |
| 18,634 | |
| (6,927 | ) |
| (20,701 | ) | |||
Impairment of investment |
| (2,944 | ) |
| - | |
| - | | |||
Other |
| 407 | |
| (2,117 | ) |
| (16 | ) | |||
Other income (expense), net |
| $ | 6,710 | |
| $ | (71,289 | ) |
| $ | (25,586 | ) |
(1) | Foreign currency gains (losses), net for the years ended December 31, 2017 and 2016 includes $0.2 million and $0.1 million , respectively, of cumulative translation gains that were reclassified to earnings as a result of the Company's exit from certain countries as part of its restructuring plan. Refer to Note 13, Restructuring, for additional information. Foreign currency gains (losses), net for the year ended December 31, 2015 includes a $4.4 million cumulative translation loss from the Company's legacy business in the Republic of Korea that was reclassified to earnings as a result of the Ticket Monster disposition, partially offset by a $3.7 million net cumulative translation gain that was reclassified to earnings as a result of the Company's exit from certain countries as part of its restructuring plan. |
The following table summarizes the Company's prepaid expenses and other current assets as of December 31, 2017 and 2016 (in thousands):
| December 31, | ||||||
| 2017 |
| 2016 | ||||
Merchandise inventories | $ | 25,528 | |
| $ | 31,042 | |
Prepaid expenses | 40,399 | |
| 34,132 | | ||
Income taxes receivable | 10,299 | |
| 11,495 | | ||
Value-added tax receivable | 6,383 | |
| 5,965 | | ||
Other | 11,416 | |
| 11,807 | | ||
Total prepaid expenses and other current assets | $ | 94,025 | |
| $ | 94,441 | |
The following table summarizes the Company's accrued merchant and supplier payables as of December 31, 2017 and 2016 (in thousands):
| December 31, | ||||||
| 2017 |
| 2016 | ||||
Accrued merchant payables | $ | 459,662 | |
| $ | 428,187 | |
Accrued supplier payables (1) | 310,673 | |
| 342,805 | | ||
Total accrued merchant and supplier payables | $ | 770,335 | |
| $ | 770,992 | |
(1) | Amounts include payables to suppliers of inventories and providers of shipping and fulfillment services. |
103
GROUPON, INC.
NOTES TO CONSOLIDATED FINANCIAL STATEMENTS (Continued)
The following table summarizes the Company's accrued expenses and other current liabilities as of December 31, 2017 and 2016 (in thousands):
| December 31, | ||||||
| 2017 |
| 2016 | ||||
Refunds reserve | $ | 31,275 | |
| $ | 33,104 | |
Compensation and benefits | 73,096 | |
| 55,590 | | ||
Customer credits | 28,487 | |
| 42,003 | | ||
Restructuring-related liabilities | 4,121 | |
| 16,395 | | ||
Income taxes payable | 9,645 | |
| 10,847 | | ||
Deferred revenue | 29,539 | |
| 35,890 | | ||
Current portion of capital lease obligations | 25,958 | |
| 28,889 | | ||
Other | 129,075 | |
| 143,738 | | ||
Total accrued expenses and other current liabilities | $ | 331,196 | |
| $ | 366,456 | |
The following table summarizes the Company's other non-current liabilities as of December 31, 2017 and 2016 (in thousands):
| December 31, | ||||||
| 2017 |
| 2016 | ||||
Long-term tax liabilities | $ | 43,699 | |
| $ | 41,611 | |
Capital lease obligations | 18,500 | |
| 19,719 | | ||
Deferred income taxes | 811 | |
| 1,714 | | ||
Other | 39,398 | |
| 38,298 | | ||
Total other non-current liabilities | $ | 102,408 | |
| $ | 101,342 | |
The following table summarizes the activity for the components of accumulated other comprehensive income (loss), net of tax, for the years ended December 31, 2017 , 2016 and 2015 (in thousands):
|
| Foreign currency translation adjustments |
| Unrealized gain (loss) on available-for-sale securities |
| Pension adjustments |
| Total | ||||||||
Balance at December 31, 2014 |
| $ | 36,764 | |
| $ | 499 | |
| $ | (1,500 | ) |
| $ | 35,763 | |
Other comprehensive income (loss) before reclassification adjustments |
| 3,376 | |
| (41 | ) |
| (113 | ) |
| 3,222 | | ||||
Reclassification adjustment included in net income (loss) |
| 12,121 | |
| - | |
| 100 | |
| 12,221 | | ||||
Other comprehensive income (loss) |
| 15,497 | |
| (41 | ) |
| (13 | ) |
| 15,443 | | ||||
Balance as of December 31, 2015 |
| 52,261 | |
| 458 | |
| (1,513 | ) |
| 51,206 | | ||||
Other comprehensive income (loss) before reclassification adjustments |
| 6,579 | |
| (70 | ) |
| 830 | |
| 7,339 | | ||||
Reclassification adjustment included in net income (loss) |
| (591 | ) |
| - | |
| 98 | |
| (493 | ) | ||||
Other comprehensive income (loss) |
| 5,988 | |
| (70 | ) |
| 928 | |
| 6,846 | | ||||
Balance as of December 31, 2016 |
| 58,249 | |
| 388 | |
| (585 | ) |
| 58,052 | | ||||
Other comprehensive income (loss) before reclassification adjustments |
| (12,382 | ) |
| (1,109 | ) |
| - | |
| (13,491 | ) | ||||
Reclassification adjustments included in net income (loss) |
| (14,905 | ) |
| 1,603 | |
| 585 | |
| (12,717 | ) | ||||
Other comprehensive income (loss) |
| (27,287 | ) |
| 494 | |
| 585 | |
| (26,208 | ) | ||||
Balance as of December 31, 2017 |
| $ | 30,962 | |
| $ | 882 | |
| $ | - | |
| $ | 31,844 | |
104
GROUPON, INC.
NOTES TO CONSOLIDATED FINANCIAL STATEMENTS (Continued)
The effects of amounts reclassified from accumulated other comprehensive income (loss) to net income (loss) for the years ended December 31, 2017 , 2016 and 2015 are presented within the following line items in the consolidated statements of operations (in thousands):
|
| Year Ended December 31, |
| Consolidated Statements of Operations Line Item | ||||||||||
|
| 2017 |
| 2016 |
| 2015 |
| |||||||
Foreign currency translation adjustments |
|
|
|
|
|
|
|
| ||||||
Loss (gain) on dispositions - continuing operations |
| $ | - | |
| $ | (7,468 | ) |
| $ | (906 | ) |
| Gains on business dispositions |
Loss (gain) on country exits - continuing operations |
| (187 | ) |
| (55 | ) |
| 714 | |
| Other income (expense), net | |||
Loss (gain) on disposition - discontinued operations |
| (14,718 | ) |
| 6,932 | |
| 12,313 | |
| Income (loss) from discontinued operations, net of tax | |||
Reclassification adjustments |
| (14,905 | ) |
| (591 | ) |
| 12,121 | |
|
| |||
Unrealized gain (loss) on available-for-sale securities |
|
|
|
|
|
|
|
| ||||||
Other-than-temporary impairment of available-for-sale security |
| 2,944 | |
| - | |
| - | |
| Other income (expense), net | |||
Realized gain on investment |
| (1,341 | ) |
| - | |
| - | |
| Other income (expense), net | |||
Reclassification adjustment |
| 1,603 | |
| - | |
| - | |
|
| |||
Pension adjustments |
|
|
|
|
|
|
|
| ||||||
Curtailment gain |
| 583 | |
| - | |
| - | |
| Selling, general and administrative | |||
Amortization of net actuarial loss (gain) |
| 2 | |
| 116 | |
| 119 | |
| Selling, general and administrative | |||
Less: Tax effect |
| - | |
| (18 | ) |
| (19 | ) |
| Provision (benefit) for income taxes | |||
Reclassification adjustment |
| 585 | |
| 98 | |
| 100 | |
|
| |||
Total reclassification adjustments |
| $ | (12,717 | ) |
| $ | (493 | ) |
| $ | 12,221 | |
|
|
9. FINANCING ARRANGEMENTS
Convertible Senior Notes
On April 4, 2016, the Company issued $250.0 million in aggregate principal amount of convertible senior notes (the "Notes") in a private placement to A-G Holdings, L.P. ("Atairos"). Michael Angelakis, the chief executive officer of Atairos, joined the Company's Board of Directors in connection with the issuance of the Notes. The net proceeds from this offering were $243.2 million after deducting issuance costs. The Notes bear interest at a rate of 3.25% per annum, payable annually in arrears on April 1 of each year, beginning on April 1, 2017. The Notes will mature on April 1, 2022, subject to earlier conversion or redemption.
Each $1,000 of principal amount of the Notes initially is convertible into 185.1852 shares of common stock, which is equivalent to an initial conversion price of $5.40 per share, subject to adjustment upon the occurrence of specified events. Upon conversion, the Company can elect to settle the conversion value in cash, shares of its Common Stock, or any combination of cash and shares of its Common Stock. Holders of the Notes may convert their Notes at their option at any time until the close of business on the scheduled trading day immediately preceding the maturity date. In addition, if specified corporate events occur prior to the maturity date, the Company may be required to increase the conversion rate for holders who elect to convert based on the effective date of such event and the applicable stock price attributable to the event, as set forth in a table contained in the indenture governing the Notes (the "Indenture"). Based on the closing price of the Company's Common Stock of $5.10 as of December 31, 2017 , the if-converted value of the Notes was less than the principal amount.
With certain exceptions, upon a fundamental change (as defined in the Indenture), the holders of the Notes may require the Company to repurchase all or a portion of their Notes for cash at a purchase price equal to the principal amount plus accrued and unpaid interest. In addition, the Company may redeem the Notes, at its option, at a purchase price equal to the principal amount plus accrued and unpaid interest on or after April 1, 2020, if the closing sale price of the Common Stock exceeds 150% of the
105
GROUPON, INC.
NOTES TO CONSOLIDATED FINANCIAL STATEMENTS (Continued)
then-current conversion price for 20 or more trading days in the 30 consecutive trading day period preceding the Company's exercise of this redemption right.
The Notes are senior unsecured obligations of the Company that rank equal in right of payment to all senior unsecured indebtedness of the Company and rank senior in right of payment to any indebtedness that is contractually subordinated to the Notes.
The Indenture includes customary events of default. If an event of default, as defined in the Indenture, occurs and is continuing, the principal amount of the Notes and any accrued and unpaid interest may be declared immediately due and payable. In the case of bankruptcy or insolvency, the principal amount of the Notes and any accrued and unpaid interest would automatically become immediately due and payable.
The Company has separated the Notes into their liability and equity components in the accompanying consolidated balance sheet. The carrying amount of the liability component was calculated by measuring the fair value of a similar liability that does not have an associated conversion feature. The carrying amount of the equity component, representing the conversion option, was determined by deducting the fair value of the liability component from the principal amount of the Notes. The difference between the principal amount of the Notes and the liability component (the "debt discount") is amortized to interest expense at an effective interest rate of 9.75% over the term of the Notes. The equity component of the Notes is included in additional paid-in capital in the consolidated balance sheet and is not remeasured as long as it continues to meet the conditions for equity classification.
The Company incurred transaction costs of approximately $6.8 million related to the issuance of the Notes. Those transaction costs have been allocated to the liability and equity components in the same manner as the allocation of the proceeds from the Notes. Transaction costs attributable to the liability component of $4.8 million were recorded as a debt discount in the consolidated balance sheet and are being amortized to interest expense over the term of the Notes. Transaction costs attributable to the equity component of $2.0 million were recorded in stockholders' equity as a reduction of the equity component.
The carrying amount of the Notes consisted of the following as of December 31, 2017 and 2016 (in thousands):
| December 31, | ||||||
| 2017 |
| 2016 | ||||
Liability component: |
|
|
| ||||
Principal amount | $ | 250,000 | |
| $ | 250,000 | |
Less: debt discount | (60,247 | ) |
| (71,005 | ) | ||
Net carrying amount of liability component | $ | 189,753 | |
| $ | 178,995 | |
|
|
|
| ||||
Net carrying amount of equity component | $ | 67,014 | |
| $ | 67,014 | |
The estimated fair value of the Notes as of December 31, 2017 and 2016 was $285.6 million and $237.4 million , respectively, and was determined using a lattice model. The Company classified the fair value of the Notes as a Level 3 measurement due to the lack of observable market data over fair value inputs such as its stock price volatility over the term of the Notes and its cost of debt.
As of December 31, 2017 , the remaining term of the Notes is approximately four years, three months. During the years ended December 31, 2017 and 2016 , the Company recognized interest expense on the Notes as follows (in thousands):
| Year Ended December 31, | ||||||
| 2017 |
| 2016 | ||||
Contractual interest expense (3.25% of the principal amount per annum) | $ | 8,128 | |
| $ | 6,095 | |
Amortization of debt discount | 10,758 | |
| 7,376 | | ||
Total interest expense | $ | 18,886 | |
| $ | 13,471 | |
106
GROUPON, INC.
NOTES TO CONSOLIDATED FINANCIAL STATEMENTS (Continued)
Note Hedges and Warrants
In May 2016, the Company purchased convertible note hedges with respect to its Common Stock for a cost of $59.1 million from certain bank counterparties. The convertible note hedges provide the Company with the right to purchase up to 46.3 million shares of the Company's Common Stock at an initial strike price of $5.40 per share, which corresponds to the initial conversion price of the Notes, and are exercisable by the Company upon conversion of the Notes. The convertible note hedges are intended to reduce the potential economic dilution upon conversion of the Notes. The convertible note hedges are separate transactions and are not part of the terms of the Notes. Holders of the Notes do not have any rights with respect to the convertible note hedges.
In May 2016, the Company also sold warrants for total cash proceeds of $35.5 million to certain bank counterparties. The warrants provide the counterparties with the right to purchase up to 46.3 million shares of the Company's Common Stock at a strike price of $8.50 per share. The warrants expire on various dates between July 1, 2022 and August 26, 2022 and are exercisable on their expiration dates. The warrants are separate transactions and are not part of the terms of the Notes or convertible note hedges. Holders of the Notes and convertible note hedges do not have any rights with respect to the warrants.
The amounts paid and received for the convertible note hedges and warrants have been recorded in additional paid-in capital in the consolidated balance sheets as of December 31, 2017 and 2016. The convertible note hedges and warrants are not remeasured as long as they continue to meet the conditions for equity classification. The amounts paid for the convertible note hedges are tax deductible over the term of the Notes, while the proceeds received from the warrants are not taxable.
Under the if-converted method, the shares of common stock underlying the conversion option in the Notes are included in the diluted earnings per share denominator and the interest expense on the Notes, net of tax, is added to the numerator. However, upon conversion, there will be no economic dilution from the Notes, as exercise of the convertible note hedges eliminates any dilution from the Notes that would have otherwise occurred when the price of the Company's Common Stock exceeds the conversion price. Taken together, the purchase of the convertible note hedges and sale of warrants are intended to offset any actual dilution from the conversion of the Notes and to effectively increase the overall conversion price from $5.40 to $8.50 per share.
Revolving Credit Agreement
The Company's amended and restated senior secured revolving credit agreement (the "Amended and Restated Credit Agreement") provides for aggregate principal borrowings of up to $250.0 million and matures in June 2019. Borrowings under the Amended and Restated Credit Agreement bear interest, at the Company's option, at a rate per annum equal to the Alternate Base Rate or Adjusted LIBO Rate (each as defined in the Amended and Restated Credit Agreement) plus an additional margin ranging between 0.50% and 2.25% . The Company is required to pay quarterly commitment fees ranging from 0.25% to 0.40% per annum of the average daily amount of unused commitments available under the Amended and Restated Credit Agreement. The Amended and Restated Credit Agreement also provides for the issuance of up to $45.0 million in letters of credit, provided that the sum of outstanding borrowings and letters of credit do not exceed the maximum funding commitment of $250.0 million .
The Amended and Restated Credit Agreement is secured by substantially all of the Company's and its subsidiaries' tangible and intangible assets, including a pledge of 100% of the outstanding capital stock of substantially all of its direct and indirect domestic subsidiaries and 65% of the shares or equity interests of first-tier foreign subsidiaries and each U.S. entity whose assets substantially consist of capital stock and/or intercompany debt of one or more foreign subsidiaries, subject to certain exceptions. Certain of the Company's domestic subsidiaries are guarantors under the Amended and Restated Credit Agreement.
The Amended and Restated Credit Agreement contains various customary restrictive covenants that limit the Company's ability to, among other things: incur additional indebtedness; make dividend and other restricted payments, including share repurchases; enter into sale and leaseback transactions; make investments, loans or advances; grant or incur liens on assets; sell assets; engage in mergers, consolidations, liquidations or dissolutions; and engage in transactions with affiliates. The Amended and Restated Credit Agreement requires the Company to maintain compliance with specified financial covenants, comprised of a minimum fixed charge coverage ratio, a maximum leverage ratio, a maximum senior secured indebtedness ratio and a minimum liquidity ratio, each as set forth in the Amended and Restated Credit Agreement. The Company is also required to maintain, as of the last day of each fiscal quarter, unrestricted cash of at least $400.0 million , including $200.0 million in accounts held with lenders under the Amended and Restated Credit Agreement or their affiliates. Non-compliance with these covenants may result in termination of the commitments under the Amended and Restated Credit Agreement and any then outstanding borrowings may be declared due and payable immediately. The Company has the right to terminate the Amended and Restated Credit Agreement or reduce the available commitments at any time.
As of December 31, 2017 and 2016 , the Company had no borrowings under the Amended and Restated Credit Agreement. As of December 31, 2017 and 2016 , the Company had outstanding letters of credit of $22.7 million and $11.1 million , respectively,
107
GROUPON, INC.
NOTES TO CONSOLIDATED FINANCIAL STATEMENTS (Continued)
under the Amended and Restated Credit Agreement.
10. COMMITMENTS AND CONTINGENCIES
Leases
The Company has entered into various non-cancelable operating lease agreements for its offices and data centers throughout the world with lease expirations between 2018 and 2027. Rent expense under operating leases was $42.5 million , $45.4 million and $43.7 million for the years ended December 31, 2017 , 2016 and 2015 , respectively. Sublease income was $7.1 million , $2.7 million and $1.0 million for the years ended December 31, 2017 , 2016 and 2015 , respectively.
The Company leases its headquarters located in Chicago, Illinois ("600 West Chicago"). The Company's lease agreement for 600 West Chicago extends through January 31, 2026 and includes rent escalations that range from one to two percent per year, as well as expansion options and a five-year renewal option. The 600 West Chicago lease represents $92.5 million of the estimated future payments under operating leases shown in the table below. The Company accounts for the 600 West Chicago lease as an operating lease and recognizes rent expense on a straight-line basis, taking into account rent escalations and lease incentives.
Certain of the Company's computer hardware has been acquired under capital lease agreements, with expirations between 2018 and 2021.
The Company is responsible for paying its proportionate share of specified operating expenses and real estate, personal property and lease taxes under certain of its operating and capital leases agreements. Those operating expenses are not included in the table below.
As of December 31, 2017 , the future payments under operating leases and capital leases for each of the next five years and thereafter are as follows (in thousands):
| Capital Leases |
| Operating Leases | ||||
2018 | $ | 27,094 | |
| $ | 36,521 | |
2019 | 10,081 | |
| 31,677 | | ||
2020 | 6,128 | |
| 28,330 | | ||
2021 | 3,616 | |
| 23,586 | | ||
2022 | - | |
| 22,621 | | ||
Thereafter | - | |
| 50,755 | | ||
Total minimum lease payments | 46,919 | |
| $ | 193,490 | | |
Less: Amount representing interest | (2,461 | ) |
|
| |||
Present value of net minimum capital lease payments | 44,458 | |
|
| |||
Less: Current portion of capital lease obligations | (25,958 | ) |
|
| |||
Total long-term capital lease obligations | $ | 18,500 | |
|
| ||
As of December 31, 2017 , the future amounts due to the Company under subleases for each of the next five years and thereafter is as follows (in thousands):
| Subleases | ||
2018 | $ | 6,743 | |
2019 | 5,898 | | |
2020 | 5,492 | | |
2021 | 5,303 | | |
2022 | 5,102 | | |
Thereafter | 9,277 | | |
Total future sublease income | $ | 37,815 | |
108
GROUPON, INC.
NOTES TO CONSOLIDATED FINANCIAL STATEMENTS (Continued)
Purchase Obligations
The Company has entered into non-cancelable arrangements with third-parties, primarily related to cloud computing and other information technology services. As of December 31, 2017 , future payments under these contractual obligations were as follows (in thousands):
2018 | $ | 13,577 | |
2019 | 9,251 | | |
2020 | 1,327 | | |
2021 | - | | |
2022 | - | | |
Thereafter | - | | |
Total purchase obligations | $ | 24,155 | |
Legal Matters and Other Contingencies
From time to time, the Company is party to various legal proceedings incident to the operation of its business. For example, the Company currently is involved in proceedings brought by former employees and merchants, intellectual property infringement suits, customer lawsuits, consumer class actions and suits alleging, among other things, violations of state consumer protection or privacy laws. The following is a brief description of significant legal proceedings.
On March 2, 2016, International Business Machines Corporation ("IBM") filed a complaint in the United States District Court for the District of Delaware against the Company (the "Delaware Action"). In the Delaware Action, IBM alleges that the Company has infringed and continues to willfully infringe certain IBM patents that IBM claims relate to the presentation of applications and advertising in an interactive service, preserving state information in online transactions and single sign-on processes in a computing environment and seeks damages (including a request that the amount of compensatory damages be trebled), injunctive relief and costs and reasonable attorneys' fees. On December 13, 2016, the Company filed a motion to invalidate two of IBM's patents relating to the presentation of applications and advertising on the grounds that such patents are patent-ineligible. The court denied the motion on November 17, 2017. The court issued an order construing disputed terms in the patent claims on August 3, 2017. On March 24, 2017, the Company filed a petition for inter partes review with the United States Patent and Trademark Office seeking to invalidate IBM's asserted patent related to single sign-on processes. IBM filed its preliminary response on July 6, 2017. The Patent Trial and Appeal Board denied the Company's petition for review on October 2, 2017. The Company filed a Request for Rehearing and Reconsideration with the Patent Trial and Appeal Board on November 1, 2017, which was also denied. Trial is scheduled for July 2018 in the Delaware Action. On May 9, 2016, the Company filed a complaint in the United States District Court for the Northern District of Illinois against IBM (the "Illinois Action"). The Company alleges that IBM has infringed and continues to willfully infringe one of the Company's patents relating to location-based services. On December 20, 2016, IBM filed a motion to dismiss this case, and the court denied that motion. The Company intends to seek damages and injunctive relief for IBM's infringement of this patent. The court held a Markman hearing on April 3, 2017, but has not yet construed the claims. On May 18, 2017, IBM filed two petitions for inter partes review with the United States Patent and Trademark Office seeking to invalidate the Company's patent relating to location-based services. The Company filed its preliminary responses on September 6, 2017. The Patent Office denied one petition and instituted a review of the Company's patent in response to the other petition, but such review does not include all claims requested by IBM. A trial date is not yet set in the Illinois Action. The Company plans to vigorously defend against the claims filed by IBM in the Delaware Action and the challenges to the Company's patent in the Illinois Action.
In addition, other third parties have from time to time claimed, and others may claim in the future, that the Company has infringed their intellectual property rights. The Company is subject to intellectual property disputes, including patent infringement claims, and expects that it will increasingly be subject to intellectual property infringement claims as its services expand in scope and complexity. The Company has in the past litigated such claims, and the Company is presently involved in several patent infringement and other intellectual property-related claims, including pending litigation or trademark disputes relating to, for example, the Company's Goods category, some of which could involve potentially substantial claims for damages or injunctive relief. The Company may also become more vulnerable to third-party claims as laws such as the Digital Millennium Copyright Act are interpreted by the courts, and as the Company becomes subject to laws in jurisdictions where the underlying laws with
109
GROUPON, INC.
NOTES TO CONSOLIDATED FINANCIAL STATEMENTS (Continued)
respect to the potential liability of online intermediaries are either unclear or less favorable. The Company believes that additional lawsuits alleging that it has violated patent, copyright or trademark laws will be filed against it. Intellectual property claims, whether meritorious or not, are time consuming and often costly to resolve, could require expensive changes in the Company's methods of doing business or the goods it sells, or could require it to enter into costly royalty or licensing agreements.
The Company also is subject to consumer claims or lawsuits relating to alleged violations of consumer protection or privacy rights and statutes, some of which could involve potentially substantial claims for damages, including statutory or punitive damages. Consumer and privacy related claims or lawsuits, whether meritorious or not, could be time consuming, result in costly litigation, damage awards, fines and penalties, injunctive relief or increased costs of doing business through adverse judgment or settlement, or require the Company to change its business practices, sometimes in expensive ways.
The Company also is subject to, or in the future may become subject to, a variety of regulatory inquiries, audits, and investigations across the jurisdictions where the Company conducts its business, including, for example, inquiries related to consumer protection, employment matters and/or hiring practices, marketing practices, tax, unclaimed property and privacy rules and regulations. Any regulatory actions against the Company, whether meritorious or not, could be time consuming, result in costly litigation, damage awards, fines and penalties, injunctive relief or increased costs of doing business through adverse judgment or settlement, require the Company to change its business practices in expensive ways, require significant amounts of management time, result in the diversion of significant operational resources or otherwise harm the Company's business.
The Company establishes an accrued liability for loss contingencies related to legal and regulatory matters when the loss is both probable and reasonably estimable. These accruals represent management's best estimate of probable losses and, in such cases, there may be an exposure to loss in excess of the amounts accrued. For certain of the matters described above, there are inherent and significant uncertainties based on, among other factors, the stage of the proceedings, developments in the applicable facts of law, or the lack of a specific damage claim. However, the Company believes that the amount of reasonably possible losses in excess of the amounts accrued for these matters would not have a material adverse effect on its business, consolidated financial position, results of operations or cash flows. The Company's accrued liabilities for loss contingencies related to legal and regulatory matters may change in the future as a result of new developments, including, but not limited to, the occurrence of new legal matters, changes in the law or regulatory environment, adverse or favorable rulings, newly discovered facts relevant to the matter, or changes in the strategy for the matter. Regardless of the outcome, litigation and other regulatory matters can have an adverse impact on the Company because of defense and settlement costs, diversion of management resources and other factors.
Indemnifications
In connection with the dispositions of the Company's operations in Latin America (see Note 3, Discontinued Operations and Other Business Dispositions ), the Company agreed to indemnify the buyer for certain tax and other matters. The indemnification liabilities were recorded at their fair value, estimated to be $5.4 million using a probability-weighted expected cash flow approach, upon closing of the transactions as an adjustment to the net loss on the dispositions within discontinued operations. The Company estimates that the total amount of obligations that are reasonably possible of arising under the indemnifications is $25.0 million .
In the normal course of business to facilitate transactions related to its operations, the Company indemnifies certain parties, including employees, lessors, service providers, merchants, and counterparties to investment agreements and asset and stock purchase agreements with respect to various matters. The Company has agreed to hold certain parties harmless against losses arising from a breach of representations or covenants, or other claims made against those parties. These agreements may limit the time within which an indemnification claim can be made and the amount of the claim. The Company is also subject to increased exposure to various claims as a result of its divestitures and acquisitions, particularly in cases where the Company is entering into new businesses in connection with such acquisitions. The Company may also become more vulnerable to claims as it expands the range and scope of its services and is subject to laws in jurisdictions where the underlying laws with respect to potential liability are either unclear or less favorable. In addition, the Company has entered into indemnification agreements with its officers, directors and underwriters, and the Company's bylaws contain similar indemnification obligations that cover officers, directors, employees and other agents.
Except as noted above, it is not possible to determine the maximum potential amount under these indemnification agreements due to the limited history of prior indemnification claims and the unique facts and circumstances involved in each
110
GROUPON, INC.
NOTES TO CONSOLIDATED FINANCIAL STATEMENTS (Continued)
particular agreement. Historically, any payments that the Company has made under these agreements have not had a material impact on the operating results, financial position or cash flows of the Company.
11. STOCKHOLDERS' EQUITY
Preferred Stock
The Company's Board of Directors ("the Board") has the authority, without approval by the stockholders, to issue up to a total of 50,000,000 shares of preferred stock in one or more series. The Board may establish the number of shares to be included in each such series and may fix the designations, preferences, powers and other rights of the shares of a series of preferred stock. The Board could authorize the issuance of preferred stock with voting or conversion rights that could dilute the voting power or rights of the holders of its common stock. As of December 31, 2017 and 2016 , there were no shares of preferred stock outstanding.
Common Stock
Prior to October 31, 2016, the Company's certificate of incorporation, as amended and restated, authorized three classes of common stock: Class A common stock, Class B common stock and common stock. On October 31, 2016, each share of the Company's Class A common stock and Class B common stock automatically converted into a single class of common stock pursuant to the terms of the Company's sixth amended and restated certificate of incorporation. Upon conversion, all shares of Class A common stock and Class B common stock were retired.
Pursuant to the Company's restated certificate of incorporation, the Board has the authority to issue up to a total of 2,010,000,000 shares of common stock. Each holder of common stock shall be entitled to one vote for each such share on any matter that is submitted to a vote of stockholders. In addition, holders of the common stock will vote as a single class of stock on any matter that is submitted to a vote of stockholders.
Prior to October 31, 2016, holders of Class A common stock and Class B common stock had identical rights, except that holders of Class A common stock were entitled to one vote per share and holders of Class B common stock were entitled to 150 votes per share.
Share Repurchase Program
The Board has authorized the Company to repurchase up to $700.0 million of its common stock through April 2018 under a share repurchase program. During the year ended December 31, 2017 , the Company purchased 16,906,334 shares for an aggregate purchase price of $60.0 million (including fees and commissions) under that repurchase program. As of December 31, 2017 , up to $135.2 million of common stock remained available for purchase under that program. The timing and amount of share repurchases, if any, will be determined based on market conditions, limitations under the Amended and Restated Credit Agreement, share price and other factors, and the share repurchase program may be terminated at any time.
12. COMPENSATION ARRANGEMENTS
Groupon, Inc. Stock Plans
In January 2008, the Company adopted the 2008 Stock Option Plan, as amended (the "2008 Plan"), under which options for up to 64,618,500 shares of common stock were authorized to be issued to employees, consultants and directors of the Company. The 2008 Plan was frozen in December 2010. In April 2010, the Company established the Groupon, Inc. 2010 Stock Plan, as amended in April 2011 (the "2010 Plan"), under which options and restricted stock units ("RSUs") for up to 20,000,000 shares of common stock were authorized for future issuance to employees, consultants and directors of the Company. No new awards may be granted under the 2010 Plan following the Company's initial public offering in November 2011. In August 2011, the Company established the Groupon, Inc. 2011 Stock Plan (the "2011 Plan"), as amended in November 2013, May 2014 and June 2016, under which options, RSUs and performance stock units for up to 150,000,000 shares of common stock were authorized for future issuance to employees, consultants and directors of the Company.
The Groupon, Inc. Stock Plans described above (the "Plans") are administered by the Compensation Committee of the Board (the "Compensation Committee"), which determines the number of awards to be issued, the corresponding vesting schedule
111
GROUPON, INC.
NOTES TO CONSOLIDATED FINANCIAL STATEMENTS (Continued)
and the exercise price for options. As of December 31, 2017 , 64,668,722 shares of common stock were available for future issuance under the Plans. Prior to January 2008, the Company issued stock options and RSUs that are governed by employment agreements, some of which are still outstanding.
The Company recognized stock-based compensation expense from continuing operations of $82.0 million , $115.1 million and $138.7 million for the years ended December 31, 2017 , 2016 and 2015 , respectively, related to stock awards issued under the Plans and acquisition-related awards. The Company recognized stock-based compensation expense from discontinued operations of $0.2 million , $3.1 million , and $8.7 million for the years ended December 31, 2017 , 2016 and 2015 , respectively. The Company also capitalized $6.2 million , $9.3 million and $12.2 million of stock-based compensation for the years ended December 31, 2017 , 2016 and 2015 , respectively, in connection with internally-developed software.
As of December 31, 2017 , a total of $101.8 million of unrecognized compensation costs related to unvested employee stock awards and unvested acquisition-related awards are expected to be recognized over a remaining weighted-average period of 1.19 years.
Employee Stock Purchase Plan
The Company is authorized to grant up to 10,000,000 shares of common stock under its employee stock purchase plan ("ESPP"). For the years ended December 31, 2017 , 2016 and 2015 , 1,879,656 , 1,669,782 and 1,037,198 shares of common stock were issued under the ESPP, respectively.
Restricted Stock Units
The restricted stock units granted under the Plans generally have vesting periods between one and four years. The table below summarizes activity regarding unvested restricted stock units under the Plans for the year ended December 31, 2017 :
| Restricted Stock Units |
| Weighted- Average Grant Date Fair Value (per share) | |||
Unvested at December 31, 2016 | 25,407,846 | |
| $ | 5.18 | |
Granted | 26,829,539 | |
| $ | 4.10 | |
Vested | (16,092,827 | ) |
| $ | 5.13 | |
Forfeited | (7,205,448 | ) |
| $ | 4.73 | |
Unvested at December 31, 2017 | 28,939,110 | |
| $ | 4.32 | |
The weighted-average grant date fair value of restricted stock units granted in 2016 and 2015 was $3.93 and $6.01 , respectively. The fair value of restricted stock units that vested during each of the three years ended December 31, 2017 , 2016 and 2015 was $ 67.0 million , $88.2 million and $163.4 million , respectively.
Performance Share Units
During the year ended December 31, 2017, 503,735 shares of the Company's common stock were issued upon vesting of performance share units granted in the previous year upon the Compensation Committee's certification of the Company's financial and operational metrics for the year ended December 31, 2016. The weighted average grant date fair value of those shares was $3.78 per share. The fair value of performance share units that vested during the year ended December 31, 2017 was $1.9 million .
During the year ended December 31, 2017, the Company granted additional performance share units to certain key employees. The vesting of those awards into shares of the Company's common stock was contingent upon the achievement of specified financial and operational targets for the year ended December 31, 2017 and was subject to both continued employment through the performance period and certification by the Compensation Committee that the specified financial and operational targets had been achieved. The maximum number of common shares issuable upon vesting of those performance share units was 2,229,082 shares. Based on the Company's financial and operational results for the year ended December 31, 2017, 278,635 shares became issuable upon vesting of the performance share units following the Compensation Committee's approval in February 2018.
112
GROUPON, INC.
NOTES TO CONSOLIDATED FINANCIAL STATEMENTS (Continued)
Restricted Stock Awards
The Company has previously granted restricted stock awards in connection with business combinations. Compensation expense on those awards was recognized on a straight-line basis over the requisite service periods of the awards.
During the year ended December 31, 2017 , 1.2 million restricted shares with a fair value of $5.2 million vested. The fair value of restricted stock that vested during the years ended December 31, 2016 and 2015 was $2.2 million and $2.6 million , respectively. There were no restricted shares outstanding as of December 31, 2017 .
Performance Bonus Awards
If bonus amounts earned under the Company's primary employee bonus plans exceed targeted bonus amounts because specified financial metrics of the Company exceed the performance conditions set forth in those plans, such excess is required to be settled in the Company's common stock. The Company's obligation to issue shares for employee bonus amounts exceeding the specified bonus targets is accounted for separately as a liability-classified stock-based compensation arrangement with performance conditions. Based on the Company's financial results for the year ended December 31, 2017 and the Company's closing stock price on February 13, 2018, the date of Compensation Committee approval, 1,307,693 shares became issuable to satisfy that bonus obligation.
Stock Options
The exercise price of stock options granted is equal to the fair value of the underlying stock on the date of grant. The contractual term for stock options expires ten years from the grant date. Stock options generally vested over a three or four-year period, with 25% of the awards vesting after one year and the remainder of the awards vesting on a monthly or quarterly basis thereafter.
The table below summarizes the stock option activity for the year ended December 31, 2017 :
|
| Options |
| Weighted- Average Exercise Price |
| Weighted- Average Remaining Contractual Term (in years) |
| Aggregate Intrinsic Value | |||||
Outstanding and exercisable at December 31, 2016 |
| 991,172 | |
| $ | 0.77 | |
| 2.83 |
| $ | 2,527 | |
Exercised |
| (102,803 | ) |
| $ | 2.24 | |
|
|
|
| ||
Forfeited |
| (2,789 | ) |
| $ | 1.99 | |
|
|
|
| ||
Outstanding and exercisable at December 31, 2017 |
| 885,580 | |
| $ | 0.62 | |
| 1.76 |
| $ | 3,967 | |
(1) | The aggregate intrinsic value of options outstanding and exercisable represents the total pretax intrinsic value (the difference between the fair value of the Company's stock on the last day of each period and the exercise price, multiplied by the number of options where the fair value exceeds the exercise price) that would have been received by the option holders had all option holders exercised their options as of December 31, 2017 and 2016 , respectively. |
The Company did not grant any stock options during the years ended December 31, 2017 , 2016 and 2015 . The total intrinsic value of options that were exercised during the years ended December 31, 2017 , 2016 and 2015 was $4.0 million , $1.2 million and $3.0 million , respectively.
Swiss Pension Plan
The Company maintains a pension plan covering employees in Switzerland pursuant to the requirements of Swiss pension law. Contributions to the Swiss pension plan are paid by the employees and the employer. Certain features of the plan require it to be categorized as a defined benefit plan under U.S. GAAP. These features include a minimum interest guarantee on retirement savings accounts, a predetermined factor for converting accumulated savings account balances into a pension, and death and disability benefits. The projected benefit obligation, net unfunded pension liability and net periodic pension cost as of and for the year ended December 31, 2017 were not material due to a significant decrease in plan participants. The projected benefit obligation and net unfunded pension liability as of December 31, 2016 were $4.8 million and $2.1 million , respectively. The net periodic pension cost for the years ended 2016 and 2015 was $1.1 million and $1.2 million , respectively.
113
13. RESTRUCTURING
In September 2015, the Company commenced a restructuring plan relating primarily to workforce reductions in its international operations. The Company has also undertaken workforce reductions in its North America segment. In addition to workforce reductions in its ongoing markets, the Company ceased operations in 17 countries within its International segment as part of the restructuring plan between September 2015 and March 2016. Those country exits, which generally comprised the Company's smallest international markets, resulted from a series of separate decisions made at different times during that period that were not part of an overall strategic shift. Costs related to the restructuring plan are classified as Restructuring charges on the consolidated statements of operations. The actions under the company's restructuring plan were completed as of September 30, 2017.
During the third quarter of 2017, the Company reached a decision to cease most of its food delivery operations and it entered into a long-term commercial agreement with a subsidiary of Grubhub that will allow the Company to provide customers with the ability to order food delivery through the Company's websites and mobile applications in the United States from Grubhub's network of restaurant merchants. See Note 6, Goodwill and Other Intangible Assets , for additional information. For the year ended December 31, 2017 , the Company's restructuring costs associated with ceasing those food delivery operations were $2.6 million , primarily related to employee severance. Additionally, the Company entered into an agreement to sell customer lists and other intangible assets in certain food delivery markets to Grubhub.
The Company incurred cumulative costs for employee severance and benefits and other exit costs of $80.2 million under the plan since its inception in September 2015. In addition to those costs, the Company incurred cumulative long-lived asset impairment charges of $7.5 million resulting from its restructuring activities.
The following tables summarize the costs incurred by segment related to the Company's restructuring plan for the years ended December 31, 2017 , 2016 and 2015 (in thousands):
|
| Year Ended December 31, 2017 | ||||||||||||||
|
| Employee Severance and Benefit Costs (1) |
| Asset Impairments |
| Other Exit Costs |
| Total Restructuring Charges | ||||||||
North America |
| $ | 8,172 | |
| $ | - | |
| $ | 3,826 | |
| $ | 11,998 | |
International |
| 4,814 | |
| - | |
| 2,016 | |
| 6,830 | | ||||
Consolidated |
| $ | 12,986 | |
| $ | - | |
| $ | 5,842 | |
| $ | 18,828 | |
|
| Year Ended December 31, 2016 | ||||||||||||||
|
| Employee Severance and Benefit Costs (1) |
| Asset Impairments (2) |
| Other Exit Costs |
| Total Restructuring Charges | ||||||||
North America |
| $ | 8,548 | |
| $ | 45 | |
| $ | 3,304 | |
| $ | 11,897 | |
International |
| 25,499 | |
| 283 | |
| 2,759 | |
| 28,541 | | ||||
Consolidated |
| $ | 34,047 | |
| $ | 328 | |
| $ | 6,063 | |
| $ | 40,438 | |
|
| Year Ended December 31, 2015 | ||||||||||||||
|
| Employee Severance and Benefit Costs (1) |
| Asset Impairments (2) |
| Other Exit Costs |
| Total Restructuring Charges | ||||||||
North America |
| $ | 2,000 | |
| $ | 6,740 | |
| $ | 1,755 | |
| $ | 10,495 | |
International |
| 16,310 | |
| 474 | |
| 1,185 | |
| 17,969 | | ||||
Consolidated |
| $ | 18,310 | |
| $ | 7,214 | |
| $ | 2,940 | |
| $ | 28,464 | |
(1) | The employee severance and benefit costs for the years ended December 31, 2017, 2016 and 2015 related to the termination of approximately 750 , 900 , and 900 employees, respectively. Substantially all of the remaining cash payments for those costs are expected to be disbursed through April 30, 2018. |
(2) | Asset impairments related to property, equipment and software that were determined to be impaired as a result of the Company's restructuring activities. |
114
The following table summarizes restructuring liability activity for the years ended December 31, 2017, 2016 and 2015 (in thousands):
|
| Employee Severance and Benefit Costs |
| Other Exit Costs |
| Total | ||||||
Balance as of June 30, 2015 |
| $ | - | |
| $ | - | |
| $ | - | |
Charges payable in cash |
| 18,310 | |
| 2,940 | |
| 21,250 | | |||
Cash Payments |
| (8,862 | ) |
| (746 | ) |
| (9,608 | ) | |||
Foreign currency translation |
| (576 | ) |
| 3 | |
| (573 | ) | |||
Balance as of December 31, 2015 |
| $ | 8,872 | |
| $ | 2,197 | |
| $ | 11,069 | |
Charges payable in cash (1) |
| 29,416 | |
| 6,063 | |
| 35,479 | | |||
Cash Payments |
| (23,729 | ) |
| (5,988 | ) |
| (29,717 | ) | |||
Foreign currency translation |
| (424 | ) |
| (12 | ) |
| (436 | ) | |||
Balance as of December 31, 2016 |
| $ | 14,135 | |
| $ | 2,260 | |
| $ | 16,395 | |
Charges payable in cash (1) |
| 12,140 | |
| 5,842 | |
| 17,982 | | |||
Cash payments |
| (23,117 | ) |
| (7,826 | ) |
| (30,943 | ) | |||
Foreign currency translation |
| 659 | |
| 28 | |
| 687 | | |||
Balance as of December 31, 2017 |
| $ | 3,817 | |
| $ | 304 | |
| $ | 4,121 | |
(1) | Excludes stock-based compensation of $0.8 million and $4.7 million for the years ended December 31, 2017 and 2016, respectively, related to accelerated vesting of stock-based compensation awards for certain employees terminated as a result of the Company's restructuring activities. |
14. INCOME TAXES
The components of pretax income (loss) from continuing operations for the years ended December 31, 2017 , 2016 and 2015 were as follows (in thousands):
|
| Year Ended December 31, | ||||||||||
|
| 2017 |
| 2016 |
| 2015 | ||||||
United States |
| $ | 30,095 | |
| $ | (119,095 | ) |
| $ | (98,181 | ) |
International |
| 6,050 | |
| (52,432 | ) |
| 1,924 | | |||
Income (loss) before provision (benefit) for income taxes |
| $ | 36,145 | |
| $ | (171,527 | ) |
| $ | (96,257 | ) |
The provision (benefit) for income taxes for the years ended December 31, 2017 , 2016 and 2015 was allocated between continuing operations and discontinued operations as follows (in thousands):
|
| Year Ended December 31, | ||||||||||
|
| 2017 |
| 2016 |
| 2015 | ||||||
Continuing Operations |
| $ | 7,544 | |
| $ | (5,318 | ) |
| $ | (23,010 | ) |
Discontinued Operations |
| - | |
| 2,771 | |
| 51,893 | | |||
Total |
| $ | 7,544 | |
| $ | (2,547 | ) |
| $ | 28,883 | |
The pretax income from discontinued operations, including the pretax gain resulting from the sale of a controlling stake in Ticket Monster, was considered for purposes of allocating tax benefits to the loss from continuing operations for the year ended December 31, 2015.
115
GROUPON, INC.
NOTES TO CONSOLIDATED FINANCIAL STATEMENTS (Continued)
The provision (benefit) for income taxes from continuing operations for the years ended December 31, 2017 , 2016 and 2015 consisted of the following components (in thousands):
|
| Year Ended December 31, | ||||||||||
|
| 2017 |
| 2016 |
| 2015 | ||||||
Current taxes: |
|
|
|
|
|
| ||||||
U.S. federal |
| $ | (120 | ) |
| $ | (1,093 | ) |
| $ | (23,913 | ) |
State |
| 191 | |
| 912 | |
| (2,613 | ) | |||
International |
| 6,870 | |
| 5,311 | |
| 14,558 | | |||
Total current taxes |
| 6,941 | |
| 5,130 | |
| (11,968 | ) | |||
Deferred taxes: |
|
|
|
|
|
| ||||||
U.S. federal |
| (1,335 | ) |
| (4,262 | ) |
| (8,936 | ) | |||
State |
| 50 | |
| (11 | ) |
| 4,324 | | |||
International |
| 1,888 | |
| (6,175 | ) |
| (6,430 | ) | |||
Total deferred taxes |
| 603 | |
| (10,448 | ) |
| (11,042 | ) | |||
Provision (benefit) for income taxes |
| $ | 7,544 | |
| $ | (5,318 | ) |
| $ | (23,010 | ) |
The items accounting for differences between the income tax provision (benefit) from continuing operations computed at the U.S. federal statutory rate and the provision (benefit) for income taxes for the years ended December 31, 2017 , 2016 and 2015 were as follows (in thousands):
|
| Year Ended December 31, | ||||||||||
|
| 2017 |
| 2016 |
| 2015 | ||||||
U.S. federal income tax provision (benefit) at statutory rate |
| $ | 12,651 | |
| $ | (60,035 | ) |
| $ | (33,690 | ) |
Foreign income and losses taxed at different rates (1) |
| 4,524 | |
| 9,410 | |
| 3,297 | | |||
State income taxes, net of federal benefits, and state tax credits |
| (4,980 | ) |
| (4,694 | ) |
| (16,382 | ) | |||
Change in valuation allowances |
| (36,057 | ) |
| 13,797 | |
| 43,782 | | |||
Effect of income tax rate changes on deferred items (2) |
| 20,466 | |
| 7,135 | |
| (117 | ) | |||
Tax effects of intercompany transactions |
| 3,332 | |
| 853 | |
| 12,448 | | |||
Adjustments related to uncertain tax positions |
| 1,824 | |
| (4,899 | ) |
| (15,032 | ) | |||
Non-deductible stock-based compensation expense |
| 5,002 | |
| 6,724 | |
| 5,143 | | |||
Tax shortfalls on stock-based compensation awards (3) |
| 4,290 | |
| 12,585 | |
| - | | |||
Non-deductible (or non-taxable) change in fair value of investment |
| - | |
| 4,484 | |
| (334 | ) | |||
Federal research and development credits |
| (7,862 | ) |
| (8,547 | ) |
| (14,636 | ) | |||
Tax effects of income (losses) from forgiveness of intercompany liabilities |
| (2,494 | ) |
| 15,187 | |
| - | | |||
Deductions for investments in subsidiaries that have ceased operations |
| - | |
| (645 | ) |
| (4,924 | ) | |||
Non-taxable gains on business dispositions |
| - | |
| (3,481 | ) |
| (5,070 | ) | |||
Non-deductible or non-taxable items |
| 6,848 | |
| 6,808 | |
| 2,505 | | |||
Provision (benefit) for income taxes |
| $ | 7,544 | |
| $ | (5,318 | ) |
| $ | (23,010 | ) |
(1) | Tax rates in foreign jurisdictions were generally lower than the U.S. federal statutory rate through December 31, 2017. This results in an adverse impact to the provision (benefit) for income taxes in this rate reconciliation for the years ended December 31, 2017, 2016 and 2015, prior to the impact of valuation allowances, due to the net pretax losses from continuing operations in certain foreign jurisdictions with lower tax rates. |
(2) | The effect of income tax rate changes on deferred items for the year ended December 31, 2017 is primarily related to the U.S. tax reform legislation that was signed into law on December 22, 2017, which included a reduction of the U.S. Federal income tax rate to 21 percent. That |
116
GROUPON, INC.
NOTES TO CONSOLIDATED FINANCIAL STATEMENTS (Continued)
rate reduction did not impact the Company's provision for income taxes for the year ended December 31, 2017 due to the valuation allowance against the Company's U.S. net deferred tax assets.
(3) | The Company adopted the guidance in ASU 2016-09 on January 1, 2016. Under that guidance, all income tax effects related to settlements of share-based payment awards are reported in earnings as an increase or decrease to income tax expense (benefit), net. |
The deferred income tax assets and liabilities consisted of the following components as of December 31, 2017 and 2016 (in thousands):
| December 31, | ||||||
| 2017 |
| 2016 | ||||
Deferred tax assets: |
|
|
| ||||
Accrued expenses and other liabilities | $ | 36,786 | |
| $ | 47,144 | |
Stock-based compensation | 3,720 | |
| 6,772 | | ||
Net operating loss and tax credit carryforwards | 208,040 | |
| 192,381 | | ||
Intangible assets, net | 23,722 | |
| 11,854 | | ||
Investments | 814 | |
| 1,080 | | ||
Unrealized foreign currency exchange losses | 2,771 | |
| 9,987 | | ||
Other | 687 | |
| 1,155 | | ||
Total deferred tax assets | 276,540 | |
| 270,373 | | ||
Less valuation allowances | (238,702 | ) |
| (220,611 | ) | ||
Deferred tax assets, net of valuation allowance | 37,838 | |
| 49,762 | | ||
Deferred tax liabilities: |
|
|
| ||||
Prepaid expenses and other assets | (10,011 | ) |
| (6,538 | ) | ||
Property, equipment and software, net | (11,315 | ) |
| (22,292 | ) | ||
Convertible senior notes | (2,773 | ) |
| (4,529 | ) | ||
Deferred revenue | (10,436 | ) |
| (12,966 | ) | ||
Total deferred tax liabilities | (34,535 | ) |
| (46,325 | ) | ||
Net deferred tax asset (liability) | $ | 3,303 | |
| $ | 3,437 | |
The Company has incurred significant losses in recent periods and had an accumulated deficit of $1,088.2 million as of December 31, 2017. As a result, the Company maintained valuation allowances against its domestic deferred tax assets and substantially all of its foreign deferred tax assets as of December 31, 2017 and 2016 to reduce their carrying values to amounts that are realizable either through future reversals of existing taxable temporary differences or through taxable income in carryback years for the applicable jurisdictions.
A cumulative loss in the most recent three-year period is a significant piece of negative evidence that is difficult to overcome when assessing the realizability of deferred tax assets. Prior to 2016, the Company's operations in the United States were in a cumulative income position over the preceding three-year period. However, due to the Company's strategic decision in late 2015 to significantly increase marketing spend to accelerate customer growth, the Company forecasted that those operations would be in a three-year cumulative loss position by the end of 2016. Based on that forecasted cumulative three-year pretax loss and its recent financial performance, the Company recorded a valuation allowance against its net deferred tax assets in the United States as of December 31, 2015, which resulted in a $26.0 million charge to income tax expense for the year then ended.
The Company had $220.9 million of federal and $701.9 million of state net operating loss carryforwards as of December 31, 2017, which will begin expiring in 2027 and 2019, respectively. As of December 31, 2017, the Company had $407.9 million of foreign net operating loss carryforwards, a significant portion of which carry forward for an indefinite period.
The Company is subject to taxation in the United States, state jurisdictions and foreign jurisdictions. Significant judgment is required in determining the worldwide provision for income taxes and recording the related income tax assets and liabilities. The Company recognizes the financial statement benefit of a tax position only after determining that the relevant tax authority would more likely than not sustain the position following an audit. For tax positions meeting the more-likely-than-not criterion,
117
GROUPON, INC.
NOTES TO CONSOLIDATED FINANCIAL STATEMENTS (Continued)
the amount recognized in the financial statements is the largest benefit that has a greater than 50 percent likelihood of being realized upon ultimate settlement with the relevant tax authority.
The following table summarizes activity related to the Company's gross unrecognized tax benefits, excluding interest and penalties, for the years ended December 31, 2017, 2016 and 2015 (in thousands):
|
| Year Ended December 31, | ||||||||||
|
| 2017 |
| 2016 |
| 2015 | ||||||
Beginning Balance |
| $ | 80,081 | |
| $ | 79,637 | |
| $ | 98,321 | |
Increases related to prior year tax positions |
| 960 | |
| 1,708 | |
| - | | |||
Decreases related to prior year tax positions |
| (1,196 | ) |
| (3,154 | ) |
| (25,702 | ) | |||
Increases related to current year tax positions |
| 9,571 | |
| 11,443 | |
| 10,590 | | |||
Decreases based on settlements with taxing authorities |
| - | |
| (3,176 | ) |
| - | | |||
Decreases due to lapse of statute limitations |
| (3,777 | ) |
| (4,906 | ) |
| - | | |||
Foreign currency translation |
| 1,720 | |
| (1,471 | ) |
| (3,572 | ) | |||
Ending Balance |
| $ | 87,359 | |
| $ | 80,081 | |
| $ | 79,637 | |
The total amount of unrecognized tax benefits as of December 31, 2017, 2016 and 2015 that, if recognized, would affect the effective tax rate are $37.6 million , $34.5 million and $40.8 million , respectively.
The Company recognized $0.2 million , $1.2 million and $0.1 million of interest and penalties within Provision (benefit) for income taxes on its consolidated statements of operations for the years ended December 31, 2017, 2016 and 2015, respectively. Total accrued interest and penalties as of December 31, 2017, 2016 and 2015 were $4.8 million , $4.6 million and $5.8 million , respectively, and are included within Other non-current liabilities in the consolidated balance sheets.
The Company is currently under IRS audit for the 2013 and 2014 tax years. Additionally, the Company is currently under audit by several foreign jurisdictions. It is likely that the examination phase of some of those audits will conclude in the next 12 months. There are many factors, including factors outside of the Company's control, which influence the progress and completion of those audits. The Company recognized income tax benefits of $3.0 million , $8.4 million and $25.6 million for the years ended December 31, 2017, 2016 and 2015, respectively, as a result of new information that impacted its estimates of the amounts that are more-likely-than not of being realized upon settlement of the related tax positions and due to expirations of the applicable statutes of limitations. During the fourth quarter 2017, the Company received an income tax assessment and a notification of potential assessment from the tax authorities in two foreign jurisdictions, totaling $138.1 million in the aggregate. The Company believes that the assessments, which primarily relate to transfer pricing on transactions occurring from 2011 to 2014, are without merit and it intends to vigorously defend itself in those matters. In addition to any potential increases in its liabilities for uncertain tax positions from the ultimate resolution of those assessments, the Company believes that it is reasonably possible that reductions of up to $37.9 million in unrecognized tax benefits may occur within the 12 months following December 31, 2017 upon closing of income tax audits or the expiration of applicable statutes of limitations.
The Tax Cuts and Jobs Act (the "Jobs Act") was signed into law on December 22, 2017. That tax reform legislation, which included a reduction in the U.S. Federal income tax rate to 21 percent, did not have a material impact on the Company's provision for income taxes for the year ended December 31, 2017 due to the valuation allowance against the Company's net deferred tax assets in the United States. Additionally, the Company does not expect to incur the deemed repatriation tax established by that legislation due to the aggregate cumulative losses of its foreign operations.
In December 2017, the SEC staff issued Staff Accounting Bulletin No. 118 ("SAB 118") to address the application of U.S. GAAP to situations in which an entity does not have the necessary information available, prepared, or analyzed in reasonable detail to complete the accounting for certain income tax effects of the Jobs Act. That guidance specifies that, for income tax effects of the Jobs Act that can be reasonably estimated but for which the accounting and measurement analysis is not yet complete, entities should report provisional amounts in the reporting period that includes the enactment date and those provisional amounts can be adjusted for a measurement period not to exceed one year from the enactment date. Additionally, for income tax effects of
118
GROUPON, INC.
NOTES TO CONSOLIDATED FINANCIAL STATEMENTS (Continued)
the Jobs Act that cannot be reasonably estimated, entities should report provisional amounts for those income tax effects in the first reporting period in which a reasonable estimate can be determined, not to exceed one year from the enactment date.
The Company has made provisional estimates for the impact of the Jobs Act related to the re-measurement of deferred income taxes, valuation allowances, uncertain tax positions, and its assessment of permanently reinvested earnings. Those estimates may be impacted by the need for further analysis and future clarification and guidance regarding available tax accounting methods and elections, earnings and profits computations and state tax conformity to federal tax changes. Additionally, while the Company does not expect to incur the deemed repatriation tax, it has not yet finalized the related calculations. The Jobs Act also establishes global intangible low-taxed income ("GILTI") provisions that impose a tax on foreign income in excess of a deemed return on intangible assets of foreign corporations. The Company is in the process of evaluating the impact of prospective taxes on GILTI and has not yet determined whether its accounting policy will be to recognize deferred taxes for basis differences that are expected to affect the amount of GILTI inclusion upon reversal or to recognize taxes on GILTI as an expense in the period incurred.
In general, it is the practice and intention of the Company to reinvest the earnings of its non-U.S. subsidiaries in those operations. Additionally, while the Company does not expect to incur the deemed repatriation tax established by the Jobs Act, an actual repatriation from its non-U.S. subsidiaries could be subject to foreign and U.S. state income taxes. Aside from limited exceptions as of December 31, 2017 for which the related deferred tax liabilities recognized are immaterial, the Company does not intend to distribute earnings of foreign subsidiaries for which it has an excess of the financial reporting basis over the tax basis of its investments and therefore has not recorded any deferred taxes related to such amounts. The actual tax cost resulting from a distribution would depend on income tax laws and circumstances at the time of distribution. Determination of the amount of unrecognized deferred tax liability related to the excess of the financial reporting basis over the tax basis of the Company's foreign subsidiaries is not practical due to the complexities associated with the calculation.
15. VARIABLE INTEREST ENTITY
In 2011, the Company entered into an arrangement with a strategic partner to offer deals related to live events, and a limited liability company ("LLC") was established to administer that arrangement. The Company and the strategic partner each own 50% of the outstanding LLC interests and income and cash flows of the LLC are allocated based on agreed upon percentages specified in the related LLC agreement.
The Company's obligations associated with its interests in the LLC are primarily administering transactions, contributing intellectual property, identifying deals and promoting the sale of deal offerings, coordinating the distribution of deal offerings and providing the record keeping.
Under the LLC agreement, as amended, the LLC shall be dissolved upon the occurrence of any of the following events: (1) either party becoming a majority owner; (2) July 11, 2019; (3) certain elections of the Company or the strategic partner based on the operational performance of the LLC or other changes to certain terms in the agreement; (4) election of either the Company or the strategic partner in the event of bankruptcy by the other party; (5) sale of the LLC; or (6) a court's dissolution of the LLC.
Variable interest entities ("VIEs") are entities that have either a total equity investment that is insufficient to permit the entity to finance its activities without additional subordinated financial support, or whose equity investors lack the characteristics of a controlling financial interest (i.e., the ability to make significant decisions through voting rights and the right to receive the expected residual returns of the entity or the obligation to absorb the expected losses of the entity). A variable interest holder that has both (a) the power to direct the activities of the VIE that most significantly impact its economic performance and (b) either an obligation to absorb losses or a right to receive benefits that could potentially be significant to the VIE is referred to as the primary beneficiary and must consolidate the VIE.
The Company has determined that the LLC is a VIE and the Company is its primary beneficiary. The Company consolidates the LLC because it has the power to direct the activities of the LLC that most significantly impact the LLC's economic performance. In particular, the Company identifies and promotes the deal offerings, provides all of the operational and back office support, presents the LLC's deal offerings via the Company's websites and mobile applications and provides the editorial resources that create the verbiage for the related deal offers.
119
GROUPON, INC.
NOTES TO CONSOLIDATED FINANCIAL STATEMENTS (Continued)
16. FAIR VALUE MEASUREMENTS
Fair value is defined under U.S. GAAP as the price that would be received to sell an asset or paid to transfer a liability in an orderly transaction between market participants at the measurement date. Fair value is a market-based measurement that is determined based on assumptions that market participants would use in pricing an asset or a liability.
To increase the comparability of fair value measures, the following hierarchy prioritizes the inputs in valuation methodologies used to measure fair value:
Level 1 - Measurements that reflect quoted prices (unadjusted) for identical assets or liabilities in active markets.
Level 2 - Measurements that include other inputs that are directly or indirectly observable in the marketplace.
Level 3 - Measurements derived from valuation techniques in which one or more significant inputs or significant value drivers are unobservable. These fair value measurements require significant judgment.
In determining fair value, the Company uses various valuation approaches within the fair value measurement framework. The valuation methodologies used for the Company's assets and liabilities measured at fair value and their classification in the valuation hierarchy are summarized below:
Cash equivalents - Cash equivalents primarily consist of AAA-rated money market funds. The Company classified cash equivalents as Level 1 due to the short-term nature of these instruments and measured the fair value based on quoted prices in active markets for identical assets.
Fair value option and available-for-sale securities investments - See Note 7, Investments , for discussion of the valuation methodologies used to measure the fair value of the Company's investments in Monster LP and Nearbuy. The Company measures the fair value of those investments using the discounted cash flow method, which is an income approach, and the market approach. The Company also has investments in redeemable preferred shares and convertible debt securities issued by nonpublic entities. The Company measures the fair value of those available-for-sale securities using the discounted cash flow method.
The Company has classified its fair value option investments and its investments in available-for-sale securities as Level 3 due to the lack of observable market data over fair value inputs such as cash flow projections and discount rates. Increases in projected cash flows and decreases in discount rates contribute to increases in the estimated fair values of the fair value option investments and available-for-sale securities, whereas decreases in projected cash flows and increases in discount rates contribute to decreases in their fair values.
Contingent consideration - The Company had contingent obligations to transfer cash to the former owners of acquired businesses if specified financial results were met over future reporting periods (i.e., earn-outs). Liabilities for contingent consideration were measured at fair value each reporting period, with the acquisition-date fair value included as part of the consideration transferred and subsequent changes in fair value recorded in earnings within Acquisition-related expense (benefit), net on the consolidated statements of operations.
The Company used an income approach to value contingent consideration obligations based on the present value of probability-weighted future cash flows. The Company classified the contingent consideration liabilities as Level 3 due to the lack of relevant observable market data over fair value inputs such as probability-weighting of payment outcomes.
120
GROUPON, INC.
NOTES TO CONSOLIDATED FINANCIAL STATEMENTS (Continued)
The following tables summarize the Company's assets and liabilities that are measured at fair value on a recurring basis as of December 31, 2017 and 2016 (in thousands):
|
|
| Fair Value Measurement at Reporting Date Using | ||||||||||||
Description | December 31, 2017 |
| Quoted Prices in Active Markets for |
| Significant Other |
| Significant | ||||||||
Assets: |
|
|
|
|
|
|
| ||||||||
Cash equivalents | $ | 137,975 | |
| $ | 137,975 | |
| $ | - | |
| $ | - | |
Fair value option investments | 82,966 | |
| - | |
| - | |
| 82,966 | | ||||
Available-for-sale securities: |
|
|
|
|
|
|
| ||||||||
Convertible debt securities | 11,354 | |
| - | |
| - | |
| 11,354 | | ||||
Redeemable preferred shares | 15,431 | |
| - | |
| - | |
| 15,431 | | ||||
|
|
| Fair Value Measurement at Reporting Date Using | ||||||||||||
Description | December 31, 2016 |
| Quoted Prices in Active Markets for |
| Significant Other |
| Significant | ||||||||
Assets: |
|
|
|
|
|
|
| ||||||||
Cash equivalents | $ | 202,241 | |
| $ | 202,241 | |
| $ | - | |
| $ | - | |
Fair value option investments | 82,584 | |
| - | |
| - | |
| 82,584 | | ||||
Available-for-sale securities: |
|
|
|
|
|
|
| ||||||||
Convertible debt securities | 10,038 | |
| - | |
| - | |
| 10,038 | | ||||
Redeemable preferred shares | 17,444 | |
| - | |
| - | |
| 17,444 | | ||||
|
|
|
|
|
|
|
| ||||||||
Liabilities: |
|
|
|
|
|
|
| ||||||||
Contingent consideration | 14,588 | |
| - | |
| - | |
| 14,588 | | ||||
121
GROUPON, INC.
NOTES TO CONSOLIDATED FINANCIAL STATEMENTS (Continued)
The following table provides a roll-forward of the fair value of recurring Level 3 fair value measurements for the years ended December 31, 2017 , 2016 and 2015 (in thousands):
|
| Year Ended December 31, | ||||||||||
|
| 2017 |
| 2016 |
| 2015 | ||||||
Assets |
|
|
|
|
|
| ||||||
Fair value option investments: |
|
|
|
|
|
| ||||||
Beginning Balance |
| $ | 82,584 | |
| $ | 130,725 | |
| $ | - | |
Acquisitions of investments |
| - | |
| - | |
| 138,475 | | |||
Sale of investments carried at fair value |
| - | |
| - | |
| (4,807 | ) | |||
Total gains (losses) included in earnings |
| 382 | |
| (48,141 | ) |
| (2,943 | ) | |||
Ending Balance |
| $ | 82,966 | |
| $ | 82,584 | |
| $ | 130,725 | |
Unrealized (losses) gains still held (1) |
| $ | 382 | |
| $ | (48,141 | ) |
| $ | (3,023 | ) |
Available-for-sale securities |
|
|
|
|
|
| ||||||
Convertible debt securities: |
|
|
|
|
|
| ||||||
Beginning Balance |
| $ | 10,038 | |
| $ | 10,116 | |
| $ | 2,527 | |
Purchases and acquisition of convertible debt securities |
| 1,612 | |
| - | |
| 6,635 | | |||
Maturity of convertible debt security |
| (1,843 | ) |
| (1,685 | ) |
| - | | |||
Total gains (losses) included in other comprehensive income (loss) |
| (437 | ) |
| 703 | |
| 385 | | |||
Total gains (losses) included in earnings (2) |
| 1,984 | |
| 904 | |
| 569 | | |||
Ending Balance |
| $ | 11,354 | |
| $ | 10,038 | |
| $ | 10,116 | |
Unrealized gains (losses) still held (1) |
| $ | 1,303 | |
| $ | 1,607 | |
| $ | 954 | |
Redeemable preferred shares: |
|
|
|
|
|
| ||||||
Beginning Balance |
| $ | 17,444 | |
| $ | 22,834 | |
| $ | 4,910 | |
Purchase of redeemable preferred shares |
| - | |
| - | |
| 18,375 | | |||
Total gains (losses) included in other comprehensive income (loss) |
| 931 | |
| (816 | ) |
| (451 | ) | |||
Other-than-temporary impairment included in earnings |
| (2,944 | ) |
| - | |
| - | | |||
Transfer to cost method investment classification upon elimination of redemption feature |
| - | |
| (4,574 | ) |
| - | | |||
Ending Balance |
| $ | 15,431 | |
| $ | 17,444 | |
| $ | 22,834 | |
Unrealized gains (losses) still held (1) |
| $ | (2,013 | ) |
| $ | (816 | ) |
| $ | (451 | ) |
|
|
|
|
|
|
| ||||||
Liabilities |
|
|
|
|
|
| ||||||
Contingent Consideration: |
|
|
|
|
|
| ||||||
Beginning Balance |
| $ | 14,588 | |
| $ | 10,781 | |
| $ | 1,983 | |
Issuance of contingent consideration in connection with acquisitions |
| - | |
| - | |
| 9,605 | | |||
Settlements of contingent consideration liabilities |
| (7,858 | ) |
| - | |
| (716 | ) | |||
Reclass to non-fair value liabilities when no longer contingent |
| (6,778 | ) |
| (285 | ) |
| (331 | ) | |||
Total losses (gains) included in earnings (3) |
| 48 | |
| 4,092 | |
| 240 | | |||
Ending Balance |
| $ | - | |
| $ | 14,588 | |
| $ | 10,781 | |
Unrealized losses (gains) still held (1) |
| $ | - | |
| $ | 3,966 | |
| $ | (148 | ) |
(1) | Represents the unrealized losses or gains recorded in earnings and/or other comprehensive income (loss) during the period for assets and liabilities classified as Level 3 that are still held (or outstanding) at the end of the period. |
(2) | Represents a gain at maturity of a previously impaired convertible debt security, accretion of interest income and changes in the fair value of an embedded derivative. |
(3) | Changes in the fair value of contingent consideration liabilities are classified within Acquisition-related expense (benefit), net on the consolidated statements of operations. |
Assets and Liabilities Measured at Fair Value on a Nonrecurring Basis
Certain assets and liabilities are measured at fair value on a nonrecurring basis, including assets that are written down to fair value as a result of an impairment. For the years ended December 31, 2016 and 2015, the Company recorded $0.3 million and
122
GROUPON, INC.
NOTES TO CONSOLIDATED FINANCIAL STATEMENTS (Continued)
$7.2 million , respectively, of impairment charges related to property, equipment and software as a result of the Company's restructuring activities (refer to Note 13, Restructuring ). Those long-lived assets were written down to their estimated fair values of zero as of December 31, 2016 and 2015. The Company did not record any significant nonrecurring fair value measurements after initial recognition for the year ended December 31, 2017.
Estimated Fair Value of Financial Assets and Liabilities Not Measured at Fair Value
The following table presents the carrying amounts and fair values of financial instruments that are not carried at fair value in the consolidated financial statements as of December 31, 2017 and 2016 (in thousands):
|
| December 31, 2017 |
| December 31, 2016 | ||||||||||||
|
| Carrying Amount |
| Fair Value |
| Carrying Amount |
| Fair Value | ||||||||
Cost method investments |
| $ | 25,438 | |
| $ | 32,792 | |
| $ | 31,816 | |
| $ | 35,369 | |
The fair values of the Company's cost method investments were determined using the market approach or the income approach, depending on the availability of fair value inputs such as financial projections for the investees and market multiples for comparable companies. The Company has classified the fair value measurements of its cost method investments as Level 3 measurements within the fair value hierarchy because they involve significant unobservable inputs such as cash flow projections and discount rates.
The Company's other financial instruments not carried at fair value consist primarily of accounts receivable, restricted cash, accounts payable, accrued merchant and supplier payables and accrued expenses. The carrying values of these assets and liabilities approximate their respective fair values as of December 31, 2017 and 2016 due to their short-term nature.
17. INCOME (LOSS) PER SHARE
Basic net income (loss) per share is computed using the weighted-average number of common shares outstanding during the period. Diluted net income (loss) per share is computed using the weighted-average number of common shares and the effect of potentially dilutive securities outstanding during the period. Potentially dilutive securities include stock options, restricted stock units, performance share units, unvested restricted stock awards, performance bonus awards, ESPP shares, warrants and convertible senior notes. If dilutive, those potentially dilutive securities are reflected in diluted net income (loss) per share by application of the treasury stock method, except for the convertible senior notes, which are subject to the if-converted method.
Each share of the Company's Class A and Class B common stock automatically converted into a single class of common stock on October 31, 2016. Refer to Note 11, Stockholders' Equity, for additional information. Prior to the conversion, the Company computed net income (loss) per share of Class A and Class B common stock using the two class method. Under the two-class method, the undistributed earnings for each period were allocated based on the contractual participation rights of the Class A and Class B common shares as if the earnings for the period had been distributed. As the liquidation and dividend rights were identical for Class A and Class B common shares, the undistributed earnings were allocated on a proportionate basis. Under the two-class method, the computation of diluted net income (loss) per share of Class A common stock would reflect the conversion of Class B common stock, if dilutive, while the computation of diluted net income (loss) per share of Class B common stock would not reflect the conversion of those shares.
123
GROUPON, INC.
NOTES TO CONSOLIDATED FINANCIAL STATEMENTS (Continued)
The following table sets forth the computation of basic and diluted net income (loss) per share of common stock for the year ended December 31, 2017 (in thousands, except share amounts and per share amounts):
| Year Ended December 31, 2017 | ||
Basic and diluted net income (loss) per share: |
| ||
Numerator |
| ||
Net income (loss) - continuing operations | $ | 28,601 | |
Less: Net income (loss) attributable to noncontrolling interests | 12,587 | | |
Net income (loss) attributable to common stockholders - continuing operations | $ | 16,014 | |
Net income (loss) attributable to common stockholders - discontinued operations | (1,974 | ) | |
Net income (loss) attributable to common stockholders | $ | 14,040 | |
Denominator | | | |
Shares used in computation of basic net income (loss) per share | 559,367,075 | | |
Weighted-average effect of diluted securities: |
| ||
Stock Options | 842,047 | | |
Restricted Stock | 488,773 | | |
Restricted Stock Units | 7,153,674 | | |
Employee Stock Purchase Plan | 201,504 | | |
Performance Share Units and Performance Bonus Awards | 365,298 | | |
Shares used in computation of diluted net income (loss) per share | 568,418,371 | | |
|
| ||
Basic net income (loss) per share: |
| ||
Continuing operations | $ | 0.03 | |
Discontinued operations | (0.00 | ) | |
Basic net income (loss) per share | $ | 0.03 | |
|
| ||
Diluted net income (loss) per share (1) : |
| ||
Continuing operations | $ | 0.03 | |
Discontinued operations | (0.01 | ) | |
Diluted net income (loss) per share | $ | 0.02 | |
(1) | The potentially dilutive impact of warrants and convertible senior notes has been excluded from the calculation of diluted net income (loss) per share for the year ended December 31, 2017 as the effect on net income (loss) per share from continuing operations was antidilutive. |
124
GROUPON, INC.
NOTES TO CONSOLIDATED FINANCIAL STATEMENTS (Continued)
The following table sets forth the computation of basic and diluted loss per share of the common stock and the Class A and Class B common stock for the year ended December 31, 2016 (in thousands, except share amounts and per share amounts):
|
| Period from January 1, 2016 through October 31, 2016 (pre-conversion) |
| Period from November 1, 2016 through December 31, 2016 (post-conversion) |
| Year Ended December 31, 2016 (2) | ||||||||||
|
|
|
| |||||||||||||
|
| Class A |
| Class B |
| Common |
| Total | ||||||||
Basic and diluted net income (loss) per share: |
|
|
|
|
|
|
|
| ||||||||
Numerator |
|
|
|
|
|
|
|
| ||||||||
Allocation of net income (loss) - continuing operations |
| $ | (151,284 | ) |
| $ | (632 | ) |
| $ | (14,293 | ) |
| $ | (166,209 | ) |
Less: Allocation of net income (loss) attributable to noncontrolling interests |
| 9,559 | |
| 40 | |
| 1,665 | |
| 11,264 | | ||||
Allocation of net income (loss) attributable to common stockholders - continuing operations |
| $ | (160,843 | ) |
| $ | (672 | ) |
| $ | (15,958 | ) |
| $ | (177,473 | ) |
Allocation of net income (loss) attributable to common stockholders - discontinued operations |
| (7,152 | ) |
| (30 | ) |
| (9,932 | ) |
| (17,114 | ) | ||||
Allocation of net income (loss) attributable to common stockholders |
| $ | (167,995 | ) |
| $ | (702 | ) |
| $ | (25,890 | ) |
| $ | (194,587 | ) |
Denominator |
|
|
|
|
|
|
|
| ||||||||
Weighted-average common shares outstanding |
| 574,755,214 | |
| 2,399,976 | |
| 574,884,987 | |
| 576,354,258 | | ||||
Basic and diluted net income (loss) per share (1) : |
|
|
|
|
|
|
|
| ||||||||
Continuing operations |
| $ | (0.28 | ) |
| $ | (0.28 | ) |
| $ | (0.03 | ) |
| $ | (0.31 | ) |
Discontinued operations |
| (0.01 | ) |
| (0.01 | ) |
| (0.02 | ) |
| (0.03 | ) | ||||
Basic and diluted net income (loss) per share |
| $ | (0.29 | ) |
| $ | (0.29 | ) |
| $ | (0.05 | ) |
| $ | (0.34 | ) |
(1) | The potentially dilutive impacts of a conversion of Class B to Class A shares, outstanding equity awards, warrants and convertible senior notes have been excluded from the calculation of dilutive net income (loss) per share for the years ended December 31, 2016 as their effect on net income (loss) per share from continuing operations was antidilutive. |
(2) | The shares of Class A and Class B common stock had equal dividend rights and converted into shares of common stock on a one-for-one basis on October 31, 2016. This full year column reflects the weighted average Class A and Class B common shares outstanding for the period from January 1, 2016 through the October 31, 2016 conversion date and the weighted average common shares outstanding for the period from November 1, 2016 through December 31, 2016 in the denominator of the basic and diluted loss per share calculations for the year ended December 31, 2016. |
The following table sets forth the computation of basic and diluted loss per share of Class A and Class B common stock for the year ended December 31, 2015 (in thousands, except share amounts and per share amounts):
| Year Ended December 31, 2015 | ||||||
| Class A |
| Class B | ||||
Basic and diluted net income (loss) per share: |
|
|
| ||||
Numerator |
|
|
| ||||
Allocation of net income (loss) - continuing operations | $ | (72,977 | ) |
| $ | (270 | ) |
Less: Allocation of net income (loss) attributable to noncontrolling interests | 12,963 | |
| 48 | | ||
Allocation of net income (loss) attributable to common stockholders - continuing operations | $ | (85,940 | ) |
| $ | (318 | ) |
Allocation of net income (loss) attributable to common stockholders - discontinued operations | 106,531 | |
| 395 | | ||
Allocation of net income (loss) attributable to common stockholders | $ | 20,591 | |
| $ | 77 | |
Denominator |
|
|
| ||||
Weighted-average common shares outstanding | 647,706,249 | |
| 2,399,976 | | ||
Basic and diluted net income (loss) per share (1) : |
|
|
| ||||
Continuing operations | $ | (0.13 | ) |
| $ | (0.13 | ) |
Discontinued operations | 0.16 | |
| 0.16 | | ||
Basic and diluted net income (loss) per share | $ | 0.03 | |
| $ | 0.03 | |
(1) | The potentially dilutive impacts of a conversion of Class B to Class A shares and outstanding equity awards have been excluded from the calculation of dilutive net income (loss) per share for the year ended December 31, 2015 as their effect on net income (loss) per share from |
125
GROUPON, INC.
NOTES TO CONSOLIDATED FINANCIAL STATEMENTS (Continued)
continuing operations was antidilutive.
The following weighted-average outstanding equity awards are not included in the diluted net income (loss) per share calculations above because they would have had an antidilutive effect on the net income (loss) per share from continuing operations:
|
| Year Ended December 31, | |||||||
|
| 2017 |
| 2016 |
| 2015 | |||
Stock options |
| 13,000 | |
| 1,204,512 | |
| 1,884,958 | |
Restricted stock units |
| 8,087,545 | |
| 33,480,458 | |
| 41,079,648 | |
Performance share units |
| - | |
| 125,934 | |
| - | |
Restricted stock |
| - | |
| 1,335,613 | |
| 1,346,447 | |
Employee Stock Purchase Plan |
| - | |
| 1,184,330 | |
| 916,837 | |
Convertible senior notes |
| 46,296,300 | |
| 34,213,474 | |
| - | |
Warrants |
| 46,296,300 | |
| 29,761,907 | |
| - | |
Total |
| 100,693,145 | |
| 101,306,228 | |
| 45,227,890 | |
18. SEGMENT INFORMATION
The segment information reported in the tables below reflects the operating results that are regularly reviewed by the Company's chief operating decision maker to assess performance and make resource allocation decisions. The Company previously organized its operations into three operating segments: North America, EMEA and Rest of World. As a result of the dispositions discussed in Note 3, Discontinued Operations and Other Business Dispositions , which represented a substantial majority of the Company's international operations outside of EMEA and resulted in changes to the Company's internal reporting and leadership structure, the Company updated its segments in the first quarter of 2017 to report two operating segments: North America and International. The Company's operating segments continue to be the same as its reportable segments. In addition, the Company changed its measure of segment profitability in the first quarter of 2017. Historically, segment operating results reflected operating income (loss) excluding stock-based compensation and acquisition-related expense (benefit), net. In connection with the internal reporting changes in the first quarter of 2017, the measure of segment profitability has been changed to operating income (loss), unadjusted. Prior period segment information has been retrospectively adjusted to reflect those changes.
The Company offers goods and services through its online local commerce marketplaces in three primary categories: Local, Goods and Travel. The Company also earns advertising revenue and commission revenue generated when customers make purchases with retailers using digital coupons accessed through the Company's websites and mobile applications. Revenue and gross profit from those other sources, which are primarily generated through the Company's relationships with local and national merchants, are included within the Local category in the tables below.
126
GROUPON, INC.
NOTES TO CONSOLIDATED FINANCIAL STATEMENTS (Continued)
|
| Year Ended December 31, | ||||||||||
|
| 2017 |
| 2016 |
| 2015 | ||||||
North America |
|
|
|
|
|
| ||||||
Local - Third-party and other |
| $ | 825,579 | |
| $ | 762,314 | |
| $ | 701,312 | |
Goods: |
|
|
|
|
|
| ||||||
Third-party |
| 16,768 | |
| 9,068 | |
| 7,151 | | |||
Direct |
| 993,326 | |
| 1,297,810 | |
| 1,257,548 | | |||
Travel - Third-party |
| 78,495 | |
| 82,577 | |
| 81,731 | | |||
Total North America revenue (1) |
| $ | 1,914,168 | |
| $ | 2,151,769 | |
| $ | 2,047,742 | |
|
|
|
|
|
|
| ||||||
International |
|
|
|
|
|
| ||||||
Local - Third-party and other |
| $ | 281,466 | |
| $ | 270,045 | |
| $ | 335,112 | |
Goods: |
|
|
|
|
|
| ||||||
Third-party |
| 20,358 | |
| 32,681 | |
| 65,361 | | |||
Direct |
| 584,099 | |
| 509,364 | |
| 447,119 | | |||
Travel - Third-party |
| 43,786 | |
| 49,756 | |
| 59,482 | | |||
Total International revenue (1) |
| $ | 929,709 | |
| $ | 861,846 | |
| $ | 907,074 | |
(1) | North America includes revenue from the United States of $1,884.7 million , $2,120.3 million and $2,022.5 million for the years ended December 31, 2017 , 2016 , and 2015 , respectively. International includes revenue from the United Kingdom of $343.9 million , $321.9 million , and $336.2 million for the years ended December 31, 2017 , 2016 , and 2015 , respectively. There were no other individual countries that represent more than 10% of consolidated total revenue for the years ended December 31, 2017 , 2016 , and 2015 . In prior periods, revenue was attributed to individual countries based on the domicile of the legal entities within the Company's consolidated group that undertook those transactions. Beginning in the second quarter of 2017, the Company updated its attribution of revenue by country to be based on the location of the customer. Prior period revenue amounts by country have been retrospectively adjusted to reflect that change in attribution. |
The following table summarizes gross profit by reportable segment for the years ended December 31, 2017 , 2016 , and 2015 (in thousands):
|
| Year Ended December 31, | ||||||||||
|
| 2017 |
| 2016 |
| 2015 | ||||||
North America |
|
|
|
|
|
| ||||||
Local - Third-party and other |
| $ | 708,573 | |
| $ | 660,983 | |
| $ | 600,893 | |
Goods: |
|
|
|
|
|
| ||||||
Third-party |
| 12,929 | |
| 7,470 | |
| 5,931 | | |||
Direct |
| 145,582 | |
| 152,739 | |
| 127,720 | | |||
Travel - Third-party |
| 60,594 | |
| 64,355 | |
| 67,027 | | |||
Total North America gross profit |
| $ | 927,678 | |
| $ | 885,547 | |
| $ | 801,571 | |
|
|
|
|
|
|
| ||||||
International |
|
|
|
|
|
| ||||||
Local - Third-party and other |
| $ | 265,348 | |
| $ | 250,435 | |
| $ | 310,842 | |
Goods: |
|
|
|
|
|
| ||||||
Third-party |
| 17,910 | |
| 27,976 | |
| 55,141 | | |||
Direct |
| 82,637 | |
| 71,504 | |
| 68,036 | | |||
Travel - Third-party |
| 40,288 | |
| 45,191 | |
| 52,220 | | |||
Total International gross profit |
| $ | 406,183 | |
| $ | 395,106 | |
| $ | 486,239 | |
127
GROUPON, INC.
NOTES TO CONSOLIDATED FINANCIAL STATEMENTS (Continued)
The following table summarizes operating income by reportable segment for the year ended December 31, 2017 , 2016 , and 2015 (in thousands):
|
| Year Ended December 31, | ||||||||||
|
| 2017 |
| 2016 |
| 2015 | ||||||
Operating income (loss) (1)(2)(3) |
|
|
|
|
|
| ||||||
North America (4) |
| $ | (45 | ) |
| $ | (85,423 | ) |
| $ | (107,836 | ) |
International |
| 29,480 | |
| (14,815 | ) |
| 37,165 | | |||
Total operating income (loss) |
| $ | 29,435 | |
| $ | (100,238 | ) |
| $ | (70,671 | ) |
(1) | Includes stock-based compensation of $76.1 million , $104.7 million , and $124.1 million for North America and $5.7 million , $9.5 million , and $14.3 million for International for the years ended December 31, 2017 , 2016 , and 2015 , respectively. |
(2) | Includes acquisition-related (benefit) expense, net of $5.7 million and $1.9 million for North America for the years ended December 31, 2016 and 2015, respectively. |
(3) | Includes restructuring charges of $12.0 million (which includes $0.8 million of stock-based compensation), $11.9 million (which includes $2.6 million of stock-based compensation), and $10.5 million for North America for the years ended December 31, 2017, 2016 and 2015, respectively. Includes restructuring charges of $6.8 million , $28.5 million (which includes $2.1 million of stock-based compensation), and $18.0 million for International for the years ended December 31, 2017, 2016 and 2015, respectively. |
(4) | Operating income for North America for the year ended December 31, 2015 includes a $37.5 million expense related to an increase in the Company's contingent liability for a securities litigation matter that was subsequently settled. |
The following table summarizes the Company's total assets by reportable segment as of December 31, 2017 and 2016 (in thousands):
| December 31, | ||||||
| 2017 |
| 2016 | ||||
North America (1) | $ | 1,045,072 | |
| $ | 1,122,261 | |
International | 632,433 | |
| 563,864 | | ||
Assets of discontinued operations | - | |
| 75,252 | | ||
Consolidated total assets | $ | 1,677,505 | |
| $ | 1,761,377 | |
(1) | North America contains assets from the United States of $1,006.2 million and $1,057.6 million as of December 31, 2017 and 2016 , respectively. International contains assets from Ireland of $219.7 million and $203.2 million as of December 31, 2017 and 2016, respectively. There were no other individual countries that represented more than 10% of consolidated total assets as of December 31, 2017 and 2016 . |
The following table summarizes the Company's tangible property and equipment, net of accumulated depreciation and amortization, by reportable segment as of December 31, 2017 and 2016 (in thousands):
| December 31, | ||||||
| 2017 |
| 2016 | ||||
North America (1) | $ | 63,402 | |
| $ | 69,577 | |
International (2) | 21,850 | |
| 24,206 | | ||
Consolidated total | $ | 85,252 | |
| $ | 93,783 | |
(1) | Substantially all tangible property and equipment within North America is located in the United States. |
(2) | Tangible property and equipment, net located within Ireland represented approximately 12% and 17% of the Company's consolidated tangible property and equipment, net as of December 31, 2017 and 2016 , respectively. There were no other individual countries located outside of the United States that represented more than 10% of consolidated tangible property and equipment, net as of December 31, 2017 and 2016 . |
128
GROUPON, INC.
NOTES TO CONSOLIDATED FINANCIAL STATEMENTS (Continued)
The following table summarizes depreciation and amortization of property, equipment and software and intangible assets by reportable segment for the years ended December 31, 2017 , 2016 and 2015 (in thousands):
|
| Year Ended December 31, | ||||||||||
|
| 2017 |
| 2016 |
| 2015 | ||||||
North America |
| $ | 121,616 | |
| $ | 116,865 | |
| $ | 108,973 | |
International |
| 16,211 | |
| 19,044 | |
| 20,409 | | |||
Consolidated total |
| $ | 137,827 | |
| $ | 135,909 | |
| $ | 129,382 | |
The following table summarizes the Company's expenditures for additions to tangible long-lived assets by reportable segment for the years ended December 31, 2017 , 2016 and 2015 (in thousands):
|
| Year Ended December 31, | ||||||||||
|
| 2017 |
| 2016 |
| 2015 | ||||||
North America |
| $ | 5,917 | |
| $ | 9,770 | |
| $ | 10,207 | |
International |
| 5,106 | |
| 5,255 | |
| 16,570 | | |||
Consolidated total |
| $ | 11,023 | |
| $ | 15,025 | |
| $ | 26,777 | |
129
GROUPON, INC.
NOTES TO CONSOLIDATED FINANCIAL STATEMENTS (Continued)
19. RELATED PARTY TRANSACTION
On December 28, 2016, the Company entered into a sublease for portions of its office space in Chicago, Illinois to Uptake, Inc. ("Uptake"), a Lightbank LLC ("Lightbank") portfolio company. Brad Keywell, one of the Company's directors at the time it entered into the sublease, is the chief executive officer of Uptake. Eric Lefkofsky, the Company's Chairman of the Board, and Mr. Keywell co-founded Lightbank. They are the majority shareholders of Lightbank, and Mr. Keywell was a managing director of Lightbank until February 2017. The sublease was negotiated on an arm's-length basis and is a market rate transaction on terms that the Company believes are no less favorable than would have been reached with an unrelated third party. The sublease extends through January 31, 2026 and the sublease rentals over that term total approximately $18.2 million . Pursuant to the Company's related party transaction policy, the Company's Audit Committee approved the Company entering into the sublease. For the year ended December 31, 2017, the Company recognized $1.9 million in income from the sublease.
20. QUARTERLY RESULTS (UNAUDITED)
The following table represents data from the Company's unaudited consolidated statements of operations for the most recent eight quarters. This quarterly information has been prepared on the same basis as the consolidated financial statements and includes all normal recurring adjustments necessary to fairly state the information for the periods presented. The results of operations of any quarter are not necessarily indicative of the results that may be expected for any future period (in thousands, except share and per share amounts).
|
| Quarter Ended | ||||||||||||||||||||||||||||||
|
| Dec. 31, |
| Sept. 30, |
| June 30, |
| Mar. 31, |
| Dec. 31, |
| Sept. 30, |
| June 30, |
| Mar. 31, | ||||||||||||||||
|
| 2017 |
| 2017 (1) |
| 2017 (1) |
| 2017 (1) |
| 2016 (1)(2) |
| 2016 (1) |
| 2016 (1) |
| 2016 (1) | ||||||||||||||||
Consolidated Statements of Operations Data: |
|
|
|
|
|
|
|
|
|
|
|
|
|
|
|
| ||||||||||||||||
Revenue |
| $ | 873,166 | |
| $ | 634,466 | |
| $ | 662,619 | |
| $ | 673,626 | |
| $ | 904,865 | |
| $ | 686,555 | |
| $ | 723,760 | |
| $ | 698,435 | |
Cost of revenue |
| 486,248 | |
| 325,041 | |
| 334,552 | |
| 364,175 | |
| 552,959 | |
| 393,287 | |
| 408,383 | |
| 378,333 | | ||||||||
Gross profit |
| 386,918 | |
| 309,425 | |
| 328,067 | |
| 309,451 | |
| 351,906 | |
| 293,268 | |
| 315,377 | |
| 320,102 | | ||||||||
Income (loss) from operations |
| 49,726 | |
| (1,213 | ) |
| (7,398 | ) |
| (11,680 | ) |
| 9,503 | |
| (24,840 | ) |
| (39,753 | ) |
| (45,148 | ) | ||||||||
Income (loss) from continuing operations |
| 51,071 | |
| 3,802 | |
| (5,403 | ) |
| (20,869 | ) |
| (39,455 | ) |
| (34,447 | ) |
| (48,768 | ) |
| (43,539 | ) | ||||||||
Income (loss) from discontinued operations, net of tax |
| (223 | ) |
| (862 | ) |
| (1,376 | ) |
| 487 | |
| (10,749 | ) |
| (1,345 | ) |
| (2,963 | ) |
| (2,057 | ) | ||||||||
Net income (loss) attributable to Groupon, Inc. |
| 47,721 | |
| 59 | |
| (9,326 | ) |
| (24,414 | ) |
| (52,588 | ) |
| (37,976 | ) |
| (54,904 | ) |
| (49,119 | ) | ||||||||
Basic net income (loss) per share (2)(3) : |
|
|
|
|
|
|
|
|
|
|
|
|
|
|
|
| ||||||||||||||||
Continuing operations |
| $ | 0.09 | |
| $ | 0.00 | |
| $ | (0.01 | ) |
| $ | (0.04 | ) |
| $ | (0.07 | ) |
| $ | (0.06 | ) |
| $ | (0.09 | ) |
| $ | (0.08 | ) |
Discontinued operations |
| (0.00 | ) |
| (0.00 | ) |
| (0.01 | ) |
| 0.00 | |
| (0.02 | ) |
| (0.01 | ) |
| (0.01 | ) |
| (0.00 | ) | ||||||||
Basic net income (loss) per share |
| $ | 0.09 | |
| $ | 0.00 | |
| $ | (0.02 | ) |
| $ | (0.04 | ) |
| $ | (0.09 | ) |
| $ | (0.07 | ) |
| $ | (0.10 | ) |
| $ | (0.08 | ) |
Diluted net income (loss) per share (2)(3) : |
|
|
|
|
|
|
|
|
|
|
|
|
|
|
|
| ||||||||||||||||
Continuing operations |
| $ | 0.08 | |
| $ | 0.00 | |
| $ | (0.01 | ) |
| $ | (0.04 | ) |
| $ | (0.07 | ) |
| $ | (0.06 | ) |
| $ | (0.09 | ) |
| $ | (0.08 | ) |
Discontinued operations |
| (0.00 | ) |
| (0.00 | ) |
| (0.01 | ) |
| 0.00 | |
| (0.02 | ) |
| (0.01 | ) |
| (0.01 | ) |
| (0.00 | ) | ||||||||
Diluted net income (loss) per share |
| $ | 0.08 | |
| $ | 0.00 | |
| $ | (0.02 | ) |
| $ | (0.04 | ) |
| $ | (0.09 | ) |
| $ | (0.07 | ) |
| $ | (0.10 | ) |
| $ | (0.08 | ) |
(1) | Income (loss) from continuing operations for the three months ended September 30, 2017, June 30, 2017, March 31, 2017, December 31, 2016, September 30, 2016, June 30, 2016 and March 31, 2016 includes restructuring charges of $11.5 million , $4.6 million , $2.7 million , $12.1 million , $1.2 million , $15.7 million and $11.5 million , respectively. |
(2) | The shares of Class A and Class B common stock had equal dividend rights and converted into shares of common stock on a one-for-one basis on October 31, 2016. The denominator of the basic and diluted loss per share calculations for the three months ended December 31, 2016 reflects the weighted-average Class A and Class B common shares outstanding for the period from October 1, 2016 through the October 31, 2016 conversion date and the weighted average common shares outstanding for the period from November 1, 2016 through December 31, 2016. |
(3) | The sum of per share amounts for quarterly periods may not equal year-to-date amounts due to rounding. |
130
Monster Holdings LP
Unaudited Consolidated Financial Statements
As of and for the Year Ended December 31, 2016
131
Monster Holdings LP
Consolidated Balance Sheet
As of December 31, 2016
(USD in thousands, except unit amounts)
(unaudited)
______________________________________________________________________________________________________
|
| ||||||||
|
|
|
|
|
|
| December 31, 2016 | ||
Assets |
| ||||||||
Current assets: |
| ||||||||
| Cash | $ | 123,696 | | |||||
| Accounts receivable, net | 19,244 | | ||||||
| Prepaid expenses and other current assets | 27,234 | | ||||||
|
|
|
| Total current assets | 170,174 | | |||
Property, equipment and software, net | 19,042 | | |||||||
Goodwill | 349,688 | | |||||||
Intangible assets, net | 89,892 | | |||||||
Other non-current assets | 8,928 | | |||||||
|
|
|
| Total Assets | $ | 637,724 | | ||
Liabilities and Partners' Capital |
| ||||||||
Current liabilities: |
| ||||||||
| Convertible debt | $ | 22,769 | | |||||
| Accounts payable | 32,944 | | ||||||
| Accrued merchant and supplier payables | 260,824 | | ||||||
| Accrued expenses and other current liabilities | 28,932 | | ||||||
|
|
|
| Total current liabilities | 345,469 | | |||
Convertible debt | 16,554 | | |||||||
Other non-current liabilities | 6,391 | | |||||||
|
|
|
| Total Liabilities | 368,414 | | |||
|
|
|
|
|
|
|
| ||
Commitments and contingencies (see Note 9) |
| ||||||||
|
|
|
|
|
|
|
| ||
Partners' Capital |
| ||||||||
Class A-1 units (12,701,148 units authorized, issued and outstanding at December 31, 2016) | 65,000 | | |||||||
Class A-2 units (72,000,000 units authorized, issued and outstanding at December 31, 2016) | 234,362 | | |||||||
Class B units (64,000,000 units authorized, issued and outstanding at December 31, 2016) | - | | |||||||
Class C units (20,321,839 units authorized and 20,030,079 units issued and outstanding at December 31, 2016) | - | | |||||||
Other capital - subsidiary stock option awards | 299 | | |||||||
Accumulated other comprehensive loss | (32,579 | ) | |||||||
|
|
|
|
| Total Monster Holdings Partners' Capital | 267,082 | | ||
Noncontrolling interests | 2,228 | | |||||||
|
|
|
|
| Total Partners' Capital | 269,310 | | ||
|
|
|
|
| Total Liabilities and Partners' Capital | $ | 637,724 | | |
The accompanying notes are an integral part of these consolidated financial statements.
132
Monster Holdings LP
Consolidated Statement of Operations
For the Year Ended December 31, 2016
(USD in thousands)
(unaudited)
______________________________________________________________________________________________________
| Year Ended December 31, 2016 | ||||||||
| |||||||||
Revenue: |
| ||||||||
Third party and other | $ | 92,486 | | ||||||
Direct | 123,633 | | |||||||
Total revenue | 216,119 | | |||||||
Cost of revenue: |
| ||||||||
Third party and other | 37,882 | | |||||||
Direct | 153,463 | | |||||||
Total cost of revenue | 191,345 | | |||||||
Gross profit | 24,774 | | |||||||
Operating expenses: |
| ||||||||
Marketing | 52,965 | | |||||||
Selling, general and administrative | 129,701 | | |||||||
Gain on business disposition | (1,555 | ) | |||||||
Total operating expenses | 181,111 | | |||||||
Loss from operations | (156,337 | ) | |||||||
Other income, net | 2,454 | | |||||||
Net loss before provision (benefit) for income taxes | (153,883 | ) | |||||||
Provision (benefit) for income taxes | - | | |||||||
Net loss | (153,883 | ) | |||||||
Net loss attributable to noncontrolling interests | 84 | | |||||||
Net loss attributable to Monster Holdings LP | $ | (153,799 | ) | ||||||
The accompanying notes are an integral part of these consolidated financial statements.
133
Monster Holdings LP
Consolidated Statement of Comprehensive Loss
For the Year Ended December 31, 2016
(USD in thousands)
(unaudited)
_____________________________________________________________________________________
|
|
|
|
|
| Year Ended | |||
|
|
|
|
|
|
| December 31, 2016 | ||
Net loss | $ | (153,883 | ) | ||||||
Other comprehensive loss: |
| ||||||||
Foreign currency translation adjustments | (5,188 | ) | |||||||
Comprehensive loss | (159,071 | ) | |||||||
Comprehensive loss attributable to noncontrolling interests | 84 | | |||||||
Comprehensive loss attributable to Monster Holdings LP | $ | (158,987 | ) | ||||||
The accompanying notes are an integral part of these consolidated financial statements.
134
Monster Holdings LP
Consolidated Statement of Changes in Partners' Capital
For the Year Ended December 31, 2016
(USD in thousands, except unit amounts)
(unaudited)
___________________________________________________________________________________________________________________
|
| Monster Holdings Partners' Capital |
| Non-controlling Interests |
| Total Partners' Capital | ||||||||||||||||||||||||||||||||||||||||||
|
| Class A-1 |
| Class A-2 |
| Class B |
| Class C |
| Other Capital - Subsidiary Stock Option Awards |
| Accumulated Other Comprehensive Loss |
| Total Monster Holdings Partners' Capital | ||||||||||||||||||||||||||||||||||
|
| Units |
| Amount |
| Units |
| Amount |
| Units |
| Amount |
| Units |
| Amount |
|
|
| |||||||||||||||||||||||||||||
Balance at December 31, 2015 |
| - | |
| $ | - | |
| 72,000,000 | |
| $ | 360,000 | |
| 64,000,000 | |
| $ | 21,024 | |
| - | |
| $ | - | |
| $ | - | |
| $ | (27,391 | ) |
| $ | 353,633 | |
| $ | - | |
| $ | 353,633 | |
Net loss |
| - | |
| - | |
| - | |
| (125,638 | ) |
| - | |
| (21,855 | ) |
| - | |
| (6,306 | ) |
| - | |
| - | |
| (153,799 | ) |
| (84 | ) |
| (153,883 | ) | |||||||||
Cash contributions for Class A-1 units |
| 12,701,148 | |
| 65,000 | |
| - | |
| - | |
| - | |
| - | |
| - | |
| - | |
| - | |
| - | |
| 65,000 | |
| - | |
| 65,000 | | |||||||||
Class C restricted units granted, net of forfeitures |
| - | |
| - | |
| - | |
| - | |
| - | |
| - | |
| 20,030,079 | |
| - | |
| - | |
| - | |
| - | |
| - | |
| - | | |||||||||
Unit-based and share-based compensation on equity-classified awards |
| - | |
| - | |
| - | |
| - | |
| - | |
| 831 | |
| - | |
| 6,306 | |
| 299 | |
| - | |
| 7,436 | |
| - | |
| 7,436 | | |||||||||
Non-controlling interest in a business combination |
| - | |
| - | |
| - | |
| - | |
| - | |
| - | |
| - | |
| - | |
| - | |
| - | |
| - | |
| 2,312 | |
| 2,312 | | |||||||||
Foreign currency translation |
| - | |
| - | |
| - | |
| - | |
| - | |
| - | |
| - | |
| - | |
| - | |
| (5,188 | ) |
| (5,188 | ) |
| - | |
| (5,188 | ) | |||||||||
Balance at December 31, 2016 |
| 12,701,148 | |
| $ | 65,000 | |
| 72,000,000 | |
| $ | 234,362 | |
| 64,000,000 | |
| $ | - | |
| 20,030,079 | |
| $ | - | |
| $ | 299 | |
| $ | (32,579 | ) |
| $ | 267,082 | |
| $ | 2,228 | |
| $ | 269,310 | |
The accompanying notes are an integral part of these consolidated financial statements.
135
Monster Holdings LP
Consolidated Statement of Cash Flows
For the Year Ended December 31, 2016
(USD in thousands)
(unaudited)
_____________________________________________________________________________________
| Year Ended | ||||||||
|
|
|
|
|
|
| December 31, 2016 | ||
Operating activities |
| ||||||||
Net loss | $ | (153,883 | ) | ||||||
Adjustments to reconcile net loss to net cash used in operating activities: |
| ||||||||
| Depreciation and amortization | 26,568 | | ||||||
| Unit-based and share-based compensation | 7,585 | | ||||||
| Change in assets and liabilities, net of acquisition: |
| |||||||
|
| Restricted cash | 8,218 | | |||||
|
| Accounts receivable | 2,095 | | |||||
|
| Prepaid expenses and other current assets | 11,398 | | |||||
|
| Other non-current assets | (2,252 | ) | |||||
|
| Accounts payable | 953 | | |||||
|
| Accrued merchant and supplier payables | 49,404 | | |||||
|
| Accrued expenses and other current liabilities | 8,224 | | |||||
|
| Other, net | (821 | ) | |||||
Net cash used in operating activities | (42,511 | ) | |||||||
|
|
|
|
|
|
|
| ||
Investing activities |
| ||||||||
Purchases of property and equipment and capitalized software | (15,103 | ) | |||||||
Acquisition of business, net of acquired cash | (1,893 | ) | |||||||
Purchase of cost method investment | (1,000 | ) | |||||||
Net cash used in investing activities | (17,996 | ) | |||||||
|
|
|
|
|
|
|
| ||
Financing activities |
| ||||||||
Proceeds from convertible debt | 41,032 | | |||||||
Contributions from Class A-1 limited partners | 65,000 | | |||||||
Net cash provided by financing activities | 106,032 | | |||||||
Effect of exchange rate changes on cash | (3,592 | ) | |||||||
Net increase in cash | 41,933 | | |||||||
Cash, beginning of period | 81,763 | | |||||||
Cash, end of period | $ | 123,696 | | ||||||
Non-cash investing activities: |
| |
Receivable for non-cash consideration in connection with business disposition | 1,551 | |
Issuance of noncontrolling interests in connection with business combination | 2,312 | |
The accompanying notes are an integral part of these consolidated financial statements.
136
Monster Holdings LP
Notes to Consolidated Financial Statements
As of and for the Year Ended December 31, 2016
(unaudited)
____________________________________________________________________________________
1. DESCRIPTION OF BUSINESS AND BASIS OF PRESENTATION
Monster Holdings LP (the "Partnership") is a Delaware Limited Partnership that was formed on April 1, 2015 and had no operations until May 27, 2015, when the Partnership acquired from a wholly-owned subsidiary of Groupon Inc. ("Groupon") all of the outstanding equity interests of LivingSocial Korea, Inc. ("LSK"), a Korean corporation and holding company of Ticket Monster Inc. ("Ticket Monster"). On March 22, 2016, LSK was merged into Ticket Monster. That merger of wholly-owned subsidiaries had no impact on the consolidated financial statements.
Ticket Monster is an e-commerce company based in the Republic of Korea that connects merchants to consumers by offering goods and services, generally at a discount. Ticket Monster acts as a marketing agent by selling vouchers that can be redeemed for products or services with third party merchants. Ticket Monster also sells merchandise inventory directly to customers. Customers can access Ticket Monster's deal offerings directly through its website and mobile application and indirectly using search engines. Ticket Monster also sends emails to its subscribers with deal offerings that are targeted by location and personal preferences.
Liquidity Risks
As of December 31, 2016, the Partnership had $123.7 million of cash and a working capital deficit of $175.3 million. In the normal course of business, the Partnership collects cash from credit card payment processors shortly after a sale occurs and remits payments to merchants and suppliers at a later date in accordance with the related contractual payment terms. This working capital cycle is expected to continue for the foreseeable future. For the year ended December 31, 2016, the Partnership incurred $42.5 million of negative cash flows from operations and $15.1 million of capital expenditures. The Partnership believes that its current liquidity resources will be adequate to meet its obligations as they come due for a period of at least one year from March 22, 2017, the date at which the consolidated financial statements were available to be issued. In the event of any unexpected adverse change in its business, the Partnership has the ability and intent to reduce discretionary spending to increase liquidity and also plans to obtain additional equity or debt financing.
2. SUMMARY OF SIGNIFICANT ACCOUNTING POLICIES
Principles of Consolidation
The consolidated financial statements include the accounts of the Partnership and its subsidiaries. All intercompany accounts and transactions have been eliminated in consolidation. The Partnership's consolidated financial statements were prepared in accordance with U.S. GAAP and include the assets, liabilities, revenue and expenses of all wholly-owned subsidiaries and majority-owned subsidiaries over which the Partnership exercises control and variable interest entities for which the Partnership has determined that it is the primary beneficiary. Outside stockholders' interests in subsidiaries are shown on the consolidated financial statements as "Noncontrolling interests."
Adoption of New Accounting Standards
The Partnership adopted the guidance in Accounting Standards Update ("ASU") 2014-15, Presentation of Financial Statements - Going Concern (Subtopic 205-40) - Disclosure of Uncertainties about an Entity's Ability to Continue as a Going Concern , as of December 31, 2016. This ASU requires management to assess a company's ability to continue as a going concern and to provide related disclosures in certain circumstances. Based on the results of the Partnership's analysis, no additional disclosures were required.
The Partnership adopted the guidance in Accounting Standards Update ("ASU") 2015-17, Balance Sheet Classification of Deferred Taxes , as of December 31, 2016. The guidance requires entities to present all deferred income tax assets and liabilities as non-current on the balance sheet.
137
Monster Holdings LP
Notes to Consolidated Financial Statements
As of and for the Year Ended December 31, 2016
(unaudited)
____________________________________________________________________________________
Use of Estimates
The preparation of consolidated financial statements in conformity with U.S. GAAP requires estimates and assumptions that affect the reported amounts and classifications of assets and liabilities, revenue and expenses, and the related disclosures of contingent liabilities in the consolidated financial statements and accompanying notes. Estimates are utilized for, but not limited to, stock-based compensation, income taxes, valuation of acquired goodwill and intangible assets, investments, customer refunds, contingent liabilities and the useful lives of property, equipment and software and intangible assets. Actual results could differ materially from those estimates.
Accounts Receivable, Net
Accounts receivable primarily represents the net cash due from the Partnership's credit card and other payment processors for cleared transactions. The carrying amount of the Partnership's receivables is reduced by an allowance for doubtful accounts that reflects management's best estimate of amounts that will not be collected. The allowance is based on historical loss experience and any specific risks identified in collection matters. Accounts receivable are charged off against the allowance for doubtful accounts when it is determined that the receivable is uncollectible.
Inventories
Inventories, consisting of merchandise purchased for resale, are accounted for using the weighted average cost method of accounting and are valued at the lower of cost or market value. The Partnership writes down its inventory to the lower of cost or market value based upon assumptions about future demand and market conditions. If actual market conditions are less favorable than those projected by the Partnership, additional inventory write-downs may be required. Once established, the original cost of the inventory less the related inventory write-down represents a new cost basis.
Restricted Cash
Restricted cash primarily represents amounts that the Partnership is unable to access for operational purposes pursuant to contractual arrangements with certain financial institutions. The Partnership had $8.1 million of restricted cash recorded within "Prepaid expenses and other current assets" as of December 31, 2016.
Property and Equipment
Property and equipment are stated at cost. Depreciation of property and equipment is recorded on a straight-line basis over the estimated useful lives of the assets. Generally, the useful lives are three years for computer equipment, office furniture and equipment, software and the shorter of the term of the lease or the asset's useful life for leasehold improvements.
Internal-Use Software
The Partnership incurs costs related to internal-use software and website development, including purchased software and internally-developed software. Costs incurred in the planning and evaluation stage of internally-developed software and website development are expensed as incurred. Costs incurred and accumulated during the application development stage are capitalized and included within "Property, equipment and software, net" on the consolidated balance sheet. Amortization of internal-use software is recorded on a straight-line basis over the estimated useful lives of three years.
Impairment of Long-lived Assets
Long-lived assets, such as property and equipment and intangible assets, are reviewed for impairment whenever events or changes in circumstances indicate that the carrying amount of an asset or asset group may not be recoverable. If circumstances require that a long-lived asset or asset group be tested for possible impairment, the Partnership first compares the undiscounted cash flows expected to be generated by that long-lived asset or asset group to its carrying amount. If the carrying amount of the long-lived asset or asset group is not recoverable on an undiscounted cash flow basis, an impairment is recognized to the extent that the carrying amount exceeds its fair value.
138
Monster Holdings LP
Notes to Consolidated Financial Statements
As of and for the Year Ended December 31, 2016
(unaudited)
____________________________________________________________________________________
Goodwill
Goodwill is allocated to the Partnership's sole reporting unit at the date the goodwill is initially recorded. The Partnership evaluates goodwill for impairment annually or more frequently when an event occurs or circumstances change that indicates the carrying value may not be recoverable. The Partnership has the option to assess goodwill for impairment by first performing a qualitative assessment to determine whether it is more-likely-than-not that the fair value of a reporting unit is less than its carrying amount. If the Partnership determines that it is not more-likely-than-not that the fair value of a reporting unit is less than its carrying amount, then the two-step goodwill impairment test is not required to be performed. If the Partnership determines that it is more-likely-than-not that the fair value of a reporting unit is less than its carrying amount, or if the Partnership does not elect the option to perform an initial qualitative assessment, the Partnership performs the two-step goodwill impairment test. In the first step, the fair value of the reporting unit is compared to its book value including goodwill. If the fair value of the reporting unit is in excess of its book value, the related goodwill is not impaired and no further analysis is necessary. If the fair value of the reporting unit is less than its book value, there is an indication of potential impairment and a second step is performed. When required, the second step of testing involves calculating the implied fair value of goodwill for the reporting unit. The implied fair value of goodwill is determined in the same manner as goodwill recognized in a business combination, which is the excess of the fair value of the reporting unit determined in step one over the fair value of its net assets, including identifiable intangible assets, as if the reporting unit had been acquired. If the carrying value of the reporting unit's goodwill exceeds the implied fair value of that goodwill, an impairment loss is recognized in an amount equal to that excess.
Investments
Investments in nonmarketable equity shares with no redemption provisions that are not common stock or in-substance common stock or for which the Partnership does not have the ability to exercise significant influence are accounted for using the cost method of accounting and are classified within "Other non-current assets" on the consolidated balance sheet. Under the cost method of accounting, investments are carried at cost and are adjusted only for other-than-temporary declines in fair value, certain distributions and additional investments.
Income Taxes
For U.S. Federal income tax purposes, the Partnership is a pass-through entity and all applicable U.S. income taxes are the responsibility of the partners. However, its subsidiaries are subject to income taxes in the Republic of Korea. The Partnership accounts for income taxes of its Korean subsidiaries using the asset and liability method, under which deferred income tax assets and liabilities are recognized based upon anticipated future tax consequences attributable to differences between the financial statement carrying amounts of assets and liabilities and their respective tax bases. The Partnership regularly reviews deferred tax assets to assess whether it is more-likely-than-not that the deferred tax assets will be realized and, if necessary, establishes a valuation allowance for portions of such assets to reduce the carrying value.
For purposes of assessing whether it is more-likely-than-not that deferred tax assets will be realized, the Partnership considers the following four sources of taxable income for each tax jurisdiction: (a) future reversals of existing taxable temporary differences, (b) projected future earnings, (c) taxable income in carryback years, to the extent that carrybacks are permitted under the tax laws of the applicable jurisdiction, and (d) tax planning strategies, which represent prudent and feasible actions that a company ordinarily might not take, but would take to prevent an operating loss or tax credit carryforward from expiring unused. To the extent that evidence about one or more of these sources of taxable income is sufficient to support a conclusion that a valuation allowance is not necessary, other sources need not be considered. Otherwise, evidence about each of the sources of taxable income is considered in arriving at a conclusion about the need for and amount of a valuation allowance. See Note 12, Income Taxes , for further information about the Partnership's valuation allowance assessments.
The Partnership accounts for uncertainty in income taxes by recognizing the financial statement benefit of a tax position only after determining that the relevant tax authority would more-likely-than-not sustain the position following an audit. For tax positions meeting the more-likely-than-not criteria, the amount recognized in the consolidated financial statements is the largest benefit that has a greater than 50 percent likelihood of being realized upon ultimate settlement with the relevant tax authority.
Leases
139
Monster Holdings LP
Notes to Consolidated Financial Statements
As of and for the Year Ended December 31, 2016
(unaudited)
____________________________________________________________________________________
The Partnership classifies leases at their inception as either operating or capital leases and may receive renewal or expansion options, rent holidays, and leasehold improvement or other incentives on certain lease agreements. The Partnership recognizes operating lease costs on a straight-line basis, taking into account adjustments for free or escalating rental payments and deferred payment terms. Additionally, lease incentives are accounted for as a reduction of lease costs over the lease term. Rent expense associated with operating lease obligations is primarily classified within "Selling, general and administrative expenses" on the consolidated statement of operations.
Revenue Recognition
The Partnership recognizes revenue when the following criteria are met: persuasive evidence of an arrangement exists; delivery has occurred; the selling price is fixed or determinable; and collection is reasonably assured.
Third-party revenue
The Partnership generates third-party revenue from transactions in which it acts as a marketing agent, primarily by selling vouchers through its online local commerce marketplaces that can be redeemed for goods or services with third-party merchants.
Third-party revenue is reported on a net basis as the purchase price received from the customer for the voucher less the portion of the purchase price that is payable to the featured merchant. Revenue is presented on a net basis because the Partnership is acting as a marketing agent of the merchant in those transactions.
Third-party revenue is recognized when the customer purchases a voucher, the voucher has been electronically delivered to the purchaser and a listing of vouchers sold has been made available to the merchant. At that time, the Partnership's obligations to the merchant, for which it is serving as a marketing agent, are substantially complete. The Partnership's remaining obligations, which are limited to remitting payment to the merchant and continuing to make available on its website information about vouchers sold that was previously provided to the merchant, are inconsequential and perfunctory administrative activities.
For merchant payment arrangements that are structured under a redemption model, merchants are not paid until the customer redeems the voucher that has been purchased. If a customer does not redeem the voucher under this payment model, the Partnership retains all of the gross billings. The Partnership recognizes incremental revenue from unredeemed vouchers and derecognizes the related accrued merchant payable when its legal obligation to the merchant expires, which the Partnership believes is shortly after deal expiration.
Direct revenue
The Partnership generates direct revenue from selling merchandise inventory in transactions for which it is the merchant of record.
Direct revenue is reported on a gross basis as the purchase price received from the customer. The Partnership is the primary obligor in those transactions, is subject to general inventory risk and has latitude in establishing prices. Direct revenue, including associated shipping revenue, is recognized when title passes to the customer upon delivery of the product.
For merchandise inventory transactions in which the Partnership acts as a marketing agent of a third-party merchant, revenue is recorded on a net basis and is presented within third-party revenue. The Partnership is generally not responsible for fulfillment on third party revenue transactions involving merchandise inventory and revenue is recognized when the Partnership's obligations to the merchant, for which it is serving as a marketing agent, are substantially complete.
Other revenue
The Partnership's other revenues are derived primarily from advertising arrangements with third parties. Revenue from advertising sales is recognized as advertising services are provided to the Partnership's customers.
140
Monster Holdings LP
Notes to Consolidated Financial Statements
As of and for the Year Ended December 31, 2016
(unaudited)
____________________________________________________________________________________
Refunds
At the time revenue is recorded, the Partnership records an accrual for estimated refunds primarily based on the Partnership's historical experience with refunds. Refunds are recorded as a reduction of revenue. The Partnership accrues costs associated with refunds within "Accrued expenses and other current liabilities" on the consolidated balance sheet. The Partnership assesses the trends that could affect its estimates on an ongoing basis and makes adjustments to the refund reserve calculations if it appears that changes in circumstances, including changes to the Partnership's refund policies, may cause future refunds to differ from its original estimates. If actual results are not consistent with the estimates or assumptions stated above, the Partnership may need to change its future estimates, and the effects could be material to the consolidated financial statements.
Discounts
The Partnership provides discount offers to encourage purchases of goods and services through its marketplaces. The Partnership records discounts as a reduction of revenue.
Value-added and related taxes
Value-added and related taxes that are imposed on specific revenue-generating transactions are presented on a net basis and excluded from revenue.
Cost of revenue
Cost of revenue is comprised of direct and certain indirect costs incurred to generate revenue. For direct revenue transactions, cost of revenue includes the cost of inventory, shipping and fulfillment costs and inventory markdowns. Fulfillment
costs are comprised of third party logistics provider costs, as well as rent, depreciation, personnel costs and other costs of operating
the Partnership's fulfillment center. Other costs incurred to generate revenue, which include credit card processing fees, editorial
costs, compensation expense for technology support personnel who are responsible for maintaining the infrastructure of the Partnership's websites, web hosting and other processing fees, are attributed to cost of third-party revenue, direct revenue and other revenue in proportion to gross billings during the period.
Customer Credits
The Partnership issues credits to its customers that can be applied against future purchases through its online local marketplaces for certain qualifying acts, such as referring new customers. The Partnership has recorded its customer credit obligations within "Accrued expenses and other current liabilities" on the consolidated balance sheet (see Note 7, Supplemental Consolidated Balance Sheet Information ). Customer credit obligations incurred for new customer referrals or other qualifying acts are expensed as incurred and are classified within "Marketing" on the consolidated statement of operations.
Unit-Based and Share-Based Compensation
The Partnership measures unit-based and share-based compensation cost at fair value, net of estimated forfeitures. Expense is recognized on a straight-line basis over the service period during which awards are expected to vest, except for awards with both performance conditions and a graded vesting schedule, which are recognized using the accelerated method.
Foreign Currency
Balance sheet accounts of the Partnership's operations outside of the U.S. are translated from foreign currencies into U.S. dollars at the exchange rates as of the consolidated balance sheet dates. Revenue and expenses are translated at average exchange rates during the period. Foreign currency translation adjustments are included within "Accumulated other comprehensive loss" on the consolidated balance sheet. Foreign currency gains and losses resulting from transactions which are denominated in currencies other than the entity's functional currency are included within "Other income, net" on the consolidated statement of operations. The net gains associated with foreign currency transactions were $1.9 million for the year ended December 31, 2016.
141
Monster Holdings LP
Notes to Consolidated Financial Statements
As of and for the Year Ended December 31, 2016
(unaudited)
____________________________________________________________________________________
Fair Value Measurements
The Partnership's financial assets and liabilities include restricted cash, prepaid expenses and other current assets, accounts receivable, accounts payable, accrued merchant and supplier payables, accrued expenses and other current liabilities. The carrying values of those assets and liabilities approximate their fair values due to their short-term nature.
The Partnership had no non-recurring fair value measurements after initial recognition and no recurring fair value measurements for the year ended December 31, 2016.
Recently Issued Accounting Standards
In May 2014, the Financial Accounting Standards Board ("FASB") issued ASU 2014-09, Revenue from Contracts with Customers . This ASU is a comprehensive new revenue recognition model that requires a company to recognize revenue to depict the transfer of goods or services to a customer at an amount that reflects the consideration it expects to receive in exchange for those goods or services. The ASU is effective for annual reporting periods beginning after December 15, 2017 and interim periods within those annual periods. The Partnership is still assessing the impact of ASU 2014-09 on its consolidated financial statements.
In July 2015, the FASB issued ASU 2015-11, Inventory (Topic 330) - Simplifying the Measurement of Inventory . This ASU requires inventory to be measured at the lower of cost or net realizable value, rather than the lower of cost or market. The ASU is effective for annual reporting periods beginning after December 15, 2016 and interim periods within those annual periods. While the Partnership is still assessing the impact of ASU 2015-11, it does not believe that the adoption of this guidance will have a material impact on its consolidated financial statements.
In January 2016, the FASB issued ASU 2016-01, Financial Instruments (Topic 825-10) - Recognition and Measurement of Financial Assets and Financial Liabilities . This ASU requires equity securities to be measured at fair value with changes in fair value recognized through net income and will eliminate the cost method for equity securities without readily determinable fair values. The ASU is effective for annual reporting periods beginning after December 15, 2017 and interim periods within those annual periods. The impact of the ASU on the Partnership's cost method investment will depend on changes in its fair value in periods after the adoption date. While the Partnership is still assessing the impact of ASU 2016-01, it does not expect that the adoption of this guidance will otherwise have a material impact on its consolidated financial statements.
In March 2016, the FASB issued ASU 2016-09, Compensation - Stock Compensation (Topic 718) - Improvements to Employee Share-Based Payment Accounting . Under this ASU, entities are permitted to make an accounting policy election to either estimate forfeitures on share-based payment awards, as previously required, or to recognize forfeitures as they occur. The ASU is effective for annual reporting periods beginning after December 15, 2017 and interim periods within annual periods beginning after December 15, 2018. While the Partnership is still assessing the impact of ASU 2016-09, it does not believe that the adoption of this guidance will have a material impact on its consolidated financial statements.
In February 2016, the FASB issued ASU 2016-02, Leases (Topic 842) . The ASU will require lessees to recognize assets and liabilities arising from leases, including operating leases, to be recognized on the balance sheet. The ASU is effective for annual reporting periods beginning after December 15, 2018 and interim periods within those annual periods. The Partnership is still assessing the impact of adoption on its consolidated financial statements. See Note 9, Commitments and Contingencies , for information about the Partnership's lease commitments.
In November 2016, the FASB issued ASU 2016-18, Statement of Cash Flows (Topic 230) - Restricted Cash . This ASU requires that companies include amounts generally described as restricted cash and restricted cash equivalents, along with cash and cash equivalents, when reconciling the beginning-of-period and end-of-period amounts shown on the statement of cash flows. The ASU is effective for annual reporting periods beginning after December 15, 2017 and interim periods within those annual periods. The Partnership had $8.1 million of restricted cash as of December 31, 2016.
In January 2017, the FASB issued ASU 2017-04, Intangibles - Goodwill and Other (Topic 350) - Simplifying the Test for Goodwill Impairment. This ASU eliminates Step 2 of the goodwill impairment test and requires a goodwill impairment to be measured as the amount by which a reporting unit's carrying amount exceeds its fair value, not to exceed the carrying amount of
142
Monster Holdings LP
Notes to Consolidated Financial Statements
As of and for the Year Ended December 31, 2016
(unaudited)
____________________________________________________________________________________
its goodwill. The ASU is effective for annual or any interim goodwill impairment tests in fiscal years beginning after December 15, 2019. While the Partnership is still assessing the impact of ASU 2017-04, it does not believe that the adoption of this guidance will have a material impact on its consolidated financial statements.
There are no other accounting standards that have been issued but not yet adopted that the Partnership believes could have a material impact on its consolidated financial position or results of operations.
3. INVESTMENTS
On June 15, 2016, the Partnership acquired an 8% minority investment in the preferred stock of a nonpublic e-commerce company for $1.0 million. The preferred stock is accounted for as a cost method investment and its fair value approximates carrying value as of December 31, 2016. The Partnership has classified the fair value measurement of this cost method investment as a Level 3 measurement within the fair value hierarchy because it involves significant unobservable inputs.
On December 23, 2016, the Partnership sold its digital loyalty program business ("TmonPlus") in exchange for convertible redeemable preferred shares in the acquirer, a nonpublic e-commerce company. The Company recognized a pretax gain on the disposition of $1.6 million, which represents the excess of the $1.6 million fair value of the investment acquired over the $0.0 million net book value of TmonPlus upon the closing of the transaction. The convertible redeemable preferred shares were received on January 13, 2017 and the fair value of the receivable for those shares approximates its carrying value as of December 31, 2016. The convertible redeemable preferred shares will be accounted for as available-for-sale securities. The Partnership did not receive any cash proceeds in connection with the transaction.
4. BUSINESS COMBINATION
On September 1, 2016, the Partnership acquired 59.56% of the outstanding equity interests of T Port Inc. ("T-Port"), an e-commerce company based in the Republic of Korea that features travel offers at both discounted and market rates, including hotels, airfare and package deals covering both domestic and international travel. The primary purpose of this acquisition was to enhance the Partnership's technology capabilities and grow its customer base.
The results of the acquired business are included in the consolidated financial statements beginning on the acquisition date. The fair value of consideration transferred in the business combination has been allocated to the tangible and intangible assets acquired and liabilities assumed at the acquisition date, with the remaining unallocated amount recorded as goodwill. The allocation of the acquisition price has been prepared on a preliminary basis, and changes to those allocations may occur as a result of final working capital adjustments and tax return filings. Acquired goodwill represents the premium the Partnership paid over the fair value of the net tangible and intangible assets acquired. The Partnership paid this premium for a number of reasons, including acquiring an assembled workforce and enhancing technology capabilities. The goodwill from the business combination is not deductible for tax purposes.
The aggregate acquisition-date fair value of the consideration transferred for the T-Port acquisition was as follows (in thousands):
Cash |
| $ | 3,585 | |
Noncontrolling interests |
| 2,312 | | |
Total acquisition consideration |
| $ | 5,897 | |
143
Monster Holdings LP
Notes to Consolidated Financial Statements
As of and for the Year Ended December 31, 2016
(unaudited)
____________________________________________________________________________________
The following table summarizes the allocation of the acquisition price of T-Port (in thousands):
Cash |
| $ | 1,692 | |
Net working capital deficit |
| (45 | ) | |
Goodwill |
| 3,967 | | |
Intangible assets: (1) |
|
| ||
Customer relationships |
| 29 | | |
Developed technology |
| 254 | | |
Total acquisition consideration |
| $ | 5,897 | |
(1) | The estimated useful lives of the acquired intangible assets are 3 years for customer relationships and developed technology. |
Pro forma results of operations for the T-Port acquisition are not presented because the pro forma effect of the acquisition is not material to the Partnership's consolidated results for the year ended December 31, 2016.
5. PROPERTY, EQUIPMENT AND SOFTWARE, NET
(in thousands) | December 31, | ||
| 2016 | ||
Purchased software | $ | 5,094 | |
Office furniture and equipment | 8,074 | | |
Internally-developed software | 11,597 | | |
Leasehold improvements | 1,161 | | |
Construction in progress | 743 | | |
Total property, equipment and software, gross | 26,669 | | |
Less: Accumulated depreciation and amortization | (7,627 | ) | |
Total property, equipment and software, net | $ | 19,042 | |
Depreciation and amortization expense on property, equipment and software for the year ended December 31, 2016 was $6.9 million, which includes $2.2 million of internally-developed software amortization, and is primarily included within "Selling, general and administrative expenses" on the consolidated statement of operations.
6. GOODWILL AND INTANGIBLE ASSETS
Goodwill
The following table summarizes the Partnership's goodwill activity for the year ended December 31, 2016:
(in thousands) |
|
| ||
Balance as of December 31, 2015 |
| $ | 355,101 | |
Goodwill related to acquisition |
| 3,967 | | |
Foreign currency translation |
| (9,380 | ) | |
Balance as of December 31, 2016 |
| $ | 349,688 | |
144
Monster Holdings LP
Notes to Consolidated Financial Statements
As of and for the Year Ended December 31, 2016
(unaudited)
____________________________________________________________________________________
The Partnership evaluates goodwill for impairment annually on December 31 or more frequently when an event occurs or circumstances change that indicates the carrying value may not be recoverable. No goodwill impairments were recognized for the year ended December 31, 2016.
Intangible Assets
The carrying amounts of definite lived intangible assets consist of the following:
(in thousands) | December 31, 2016 | ||||||||||
|
|
|
|
|
| ||||||
| Gross |
| Accumulated |
| Net | ||||||
| Carrying Value |
| Amortization |
| Carrying Value | ||||||
Customer relationships | $ | 53,409 | |
| $ | (12,184 | ) |
| $ | 41,225 | |
Merchant relationships | 21,601 | |
| (11,501 | ) |
| 10,100 | | |||
Developed technology | 1,145 | |
| (753 | ) |
| 392 | | |||
Trade name | 44,013 | |
| (5,838 | ) |
| 38,175 | | |||
Total intangible assets | $ | 120,168 | |
| $ | (30,276 | ) |
| $ | 89,892 | |
Amortization of intangible assets is computed using the straight-line method over their estimated useful lives, which range from 2 to 12 years. Amortization expense related to intangible assets was approximately $19.7 million for the year ended December 31, 2016. The weighted average remaining amortization period of intangible assets is 7 years as of December 31, 2016. As of December 31, 2016, the Partnership's estimated future amortization expense related to intangible assets is as follows:
(in thousands) |
|
| ||
Years Ended December 31, |
| Amount | ||
2017 |
| $ | 18,901 | |
2018 |
| 14,268 | | |
2019 |
| 11,339 | | |
2020 |
| 11,281 | | |
2021 |
| 11,281 | | |
Thereafter |
| 22,822 | | |
Total |
| $ | 89,892 | |
7. SUPPLEMENTAL CONSOLIDATED BALANCE SHEET INFORMATION
The following summarizes the Partnership's prepaid expenses and other current assets as of December 31, 2016:
(in thousands) | December 31, | ||
| 2016 | ||
Finished goods inventories | $ | 13,709 | |
Prepaid expenses | 5,474 | | |
Restricted cash | 8,051 | | |
Total prepaid expenses and other current assets | $ | 27,234 | |
The following summarizes the Partnership's accrued expenses and other current liabilities as of December 31, 2016:
145
Monster Holdings LP
Notes to Consolidated Financial Statements
As of and for the Year Ended December 31, 2016
(unaudited)
____________________________________________________________________________________
(in thousands) | December 31, | ||
| 2016 | ||
Refunds | $ | 684 | |
Customer credits | 4,935 | | |
Accrued compensation and benefits | 11,287 | | |
Deferred revenue | 2,671 | | |
Value-added tax payable | 1,793 | | |
Other | 7,562 | | |
Total accrued expenses and other current liabilities | $ | 28,932 | |
8. FINANCING ARRANGEMENTS
Credit Facility
The Partnership has a revolving credit facility (the "credit facility") that provides for aggregate principal borrowings of $8.3 million. The credit facility expires on July 13, 2017. Borrowings under the credit facility bear interest at the Certificate of Deposit Rate for the Republic of Korea plus 3.30%. As of December 31, 2016, the Partnership had no borrowings outstanding under the credit facility.
Convertible Debt
The Partnership's subsidiary, Ticket Monster, issued $41.0 million of convertible debt to a third-party investor on April 8, 2016. On January 2, 2017, $22.8 million of the convertible debt was repaid. The remaining outstanding debt was converted into 9,712 shares of Ticket Monster convertible preferred stock on January 11, 2017.
9. COMMITMENTS AND CONTINGENCIES
Operating Leases
The Partnership has entered into various non-cancelable operating lease agreements, primarily covering certain of its offices in the Republic of Korea, with lease expirations between 2017 and 2018. Rent expense under these operating leases was $4.9 million for the year ended December 31, 2016. Certain of these arrangements have renewal or expansion options and adjustments for market provisions, such as free or escalating base monthly rental payments. The Partnership recognizes rent expense under such arrangements on a straight-line basis over the initial term of the lease. The difference between the straight-line expense and the cash paid for rent has been recorded as deferred rent.
As of December 31, 2016, future payments under non-cancelable operating leases (including rent escalation clauses but excluding a proportionate share of operating expenses) were as follows:
(in thousands) |
| ||||||||
Years Ended December 31, | Operating Leases | ||||||||
2017 | $ | 3,377 | | ||||||
2018 | 4 | | |||||||
Thereafter | - | | |||||||
Total | $ | 3,381 | | ||||||
146
Monster Holdings LP
Notes to Consolidated Financial Statements
As of and for the Year Ended December 31, 2016
(unaudited)
____________________________________________________________________________________
Contingencies
The Partnership recognizes accrued liabilities for loss contingencies when the loss is determined to be both probable and estimable. Such accruals represent the Partnership's best estimate of probable losses and, in some cases, there may be an exposure to loss in excess of the amounts accrued. The Partnership believes that the amount of reasonably possible losses in excess of the amounts accrued for loss contingencies as of December 31, 2016 would not have a material adverse effect on its business, financial position, results of operations or cash flows.
The Partnership has provided customary indemnifications to its unit holders and their affiliates for claims that may arise in connection with their involvement with the Partnership. The indemnifications do not limit the maximum potential future payments that can be made and it is not possible to determine an estimate of those maximum potential future payments due to the absence of historical claim experience.
10. PARTNERS' CAPITAL
In 2016, the Partnership granted 20,841,290 Class C restricted units to employees of Ticket Monster. Those Class C restricted units had a total grant date fair value of $24.4 million, are subject to time-based vesting conditions and, for a portion of the Class C units, a performance-based vesting condition. On December 15, 2016, the Partnership received a $65.0 million capital contribution from certain of its existing Class A unit holders and another investor in exchange for 12,701,148 Class A-1 units of the Partnership. In connection with this transaction, the outstanding Class A units were redesignated as Class A-2 units, which continue to have the same rights and privileges as the former Class A units.
Under the terms of the Partnership's amended and restated agreement of limited partnership, its general partner, Monster Holdings GP LLC, established a Board of Directors (the "Board") and irrevocably assigned the rights to carry out any and all of the objectives and purposes of the Partnership to the Board. The general partner is not entitled to receive any distributions. As of December 31, 2016, holders of Class A-1 units of the Partnership were entitled to a $65.0 million liquidation preference, which must be paid prior to any distributions to the holders of Class A-2, Class B and Class C units. Distributions in excess of $65.0 million and up to $551.0 million would be paid to holders of Class A-2 units. Distributions in excess of $551.0 million and up to $745.0 million would be paid to holders of Class B units. Distributions in excess of $745.0 million and up to $768.0 million would be paid to holders of Class C units. Unit holders would be entitled to share in distributions between $768.0 million and $1,273.0 million in accordance with the terms of the Partnership's distribution waterfall, and distributions in excess of $1,273.0 million would be made pro rata to all unit holders based on their respective ownership interests. See Note 14, Subsequent Events, for information about about a February 2017 recapitalization transaction and its impact on the liquidation preferences of the respective Partnership units. Due to the Class A-1 unit liquidation preference, the Partnership's net loss for the year ended December 31, 2016 has been allocated to the Class A-2, Class B and Class C units in the accompanying consolidated statement of changes in partners' capital. Holders of Class A-1, Class A-2 and Class B units are entitled to one vote per unit and vote together as a single class. Holders of Class C units are not entitled to any voting rights.
11. COMPENSATION ARRANGEMENTS
For the year ended December 31, 2016, the Partnership incurred unit-based and share-based compensation expense of $7.6 million.
Class C Restricted Units
In 2016, the Partnership granted 20,841,290 Class C restricted units to employees of Ticket Monster to compensate them for future service. Those Class C restricted units had a total grant date fair value of approximately $24.4 million, are subject to time-based vesting conditions and, for a portion of the Class C units, a performance-based vesting condition.
147
Monster Holdings LP
Notes to Consolidated Financial Statements
As of and for the Year Ended December 31, 2016
(unaudited)
____________________________________________________________________________________
| Restricted Units |
| Weighted- Average Grant Date Fair Value (per share) | ||||
Unvested at December 31, 2015 |
| - | |
| $ | - | |
Granted |
| 20,841,290 | |
| $ | 1.17 | |
Vested |
| (3,994,319 | ) |
| $ | 1.17 | |
Forfeited |
| (811,211 | ) |
| $ | 1.17 | |
Unvested at December 31, 2016 |
| 16,035,760 | |
| $ | 1.17 | |
The table above includes 4,038,938 awards with performance conditions. The vesting of those awards into Class C units is contingent on the occurrence of a qualifying liquidity event and continued employment with the Partnership. For the year ended December 31, 2016, the Partnership did not recognize any unit-based compensation expense related to the awards with performance conditions as it was not considered probable that the conditions would be met.
Subsidiary Stock Options
The Partnership's subsidiary, Ticket Monster, granted 12,547 stock options to its employees during 2016. Those stock options had a total grant date fair value of approximately $6.2 million, are subject to time-based vesting conditions and a performance-based vesting condition. The exercise price of the stock options is equal to the fair value of the underlying stock on the date of grant. The contractual term for the stock options expires ten years from the grant date. The stock options generally vest over a two-, three- or four-year period, with 50% of the awards vesting after two year and the remainder of the awards vesting on a monthly or quarterly basis thereafter.
The fair value of stock options granted is estimated on the date of grant using the Black-Scholes-Merton option-pricing model. Expected volatility is based on historical volatilities for publicly-traded shares of comparable companies over the estimated expected life of the stock options. The expected term represents the period of time the stock options are expected to be outstanding. The risk-free interest rate is based the yield on U.S. Treasury bonds with maturities similar to the estimated expected life of the stock options. The weighted average assumptions for stock options granted during the year ended December 31, 2016 are outlined in the following table:
|
| 2016 | |
Dividend yield |
| - | % |
Risk-free interest rate |
| 1.01 | % |
Expected term (in years) |
| 4 | |
Expected volatility |
| 60 | % |
The weighted-average grant date fair value of stock options granted during the year ended December 31, 2016 was $491.31 per share.
The table below summarizes the stock option activity for the year ended December 31, 2016:
|
| Options |
| Weighted- Average Exercise Price |
| Weighted- Average Remaining Contractual Term (in years) |
| Aggregate Intrinsic Value | ||||||
Outstanding at December 31, 2015 |
| - | |
| $ | - | |
|
|
|
| |||
Granted |
| 12,547 | |
| $ | 1,973 | |
| 3.11 | |
| $ | - | |
Exercised |
| - | |
| $ | - | |
|
|
|
| |||
Forfeited |
| - | |
| $ | - | |
|
|
|
| |||
Outstanding at December 31, 2016 |
| 12,547 | |
| $ | 1,973 | |
| 3.11 | |
| $ | - | |
148
Monster Holdings LP
Notes to Consolidated Financial Statements
As of and for the Year Ended December 31, 2016
(unaudited)
____________________________________________________________________________________
(1) | The aggregate intrinsic value of options outstanding and exercisable represents the total pretax intrinsic value (the difference between the fair value of the Ticket Monster stock on the last day of each period and the exercise price, multiplied by the number of options where the fair value exceeds the exercise price) that would have been received by the option holders had all option holders exercised their options as of December 31, 2016. |
Groupon Restricted Stock Units
Certain Ticket Monster employees continue to vest in share-based awards granted by Groupon as a result of their employment with Ticket Monster. Those restricted stock units are remeasured to fair value each reporting period. The Partnership has recorded $0.8 million of compensation expense from those awards for the year ended December 31, 2016, which is included within "Selling, general and administrative expenses" on the consolidated statement of operations and within "Unit-based and share-based compensation" on the consolidated statement of cash flows. As of December 31, 2016, 139,852 Groupon restricted stock units are outstanding, which will result in approximately $0.3 million of future compensation expense based on the fair value of the unvested awards at that date and is expected to be recognized over a remaining weighted-average period of 0.8 years.
12. INCOME TAXES
Domestic and foreign components of loss from operations before income taxes are presented below:
(in thousands) |
|
| Year Ended December 31, 2016 | |||
|
|
|
| |||
Earnings before income taxes - U.S. | $ | - | | |||
Loss before income taxes - Korea | (153,883 | ) | ||||
Total loss before income taxes | $ | (153,883 | ) | |||
For U.S. Federal income tax purposes, the Partnership is a pass-through entity and all applicable U.S. income taxes are the responsibility of the partners. However, its subsidiaries are subject to income taxes in the Republic of Korea. The provision for income taxes in the Republic of Korea consists of the following:
(in thousands) |
|
| Year Ended December 31, 2016 | |||
|
|
|
| |||
Current income tax provision (benefit) |
| $ | - | | ||
Deferred income tax provision (benefit) |
| - | | |||
Total provision (benefit) for income taxes |
| $ | - | | ||
149
Monster Holdings LP
Notes to Consolidated Financial Statements
As of and for the Year Ended December 31, 2016
(unaudited)
____________________________________________________________________________________
The items accounting for differences between the income tax provision or benefit computed at the applicable Korean statutory rate of 11% and the provision for income taxes for the year ended December 31, 2016 are as follows:
(in thousands) |
|
|
| Year Ended December 30, 2016 | |||
|
|
|
|
| |||
Income tax benefit at statutory rate | $ | (16,927 | ) | ||||
Change in valuation allowance | 15,593 | | |||||
Unit-based and share-based compensation | 799 | | |||||
Other | 535 | | |||||
Total provision (benefit) for income taxes | $ | - | | ||||
Deferred income tax assets and liabilities of the Partnership's Korean subsidiaries, which include net operating losses generated prior to the Partnership's acquisition of those subsidiaries, consisted of the following:
(in thousands) |
|
| December 31, | |||
|
|
|
| 2016 | ||
Deferred tax assets: |
| |||||
| Accrued expenses and other liabilities | $ | 4,047 | | ||
| Net operating loss and tax credit carryforwards | 40,490 | | |||
| Property, equipment and software, net | 163 | | |||
| Total deferred tax assets | 44,700 | | |||
| Less valuation allowances | (34,738 | ) | |||
Deferred tax assets, net of valuation allowance | 9,962 | | ||||
Deferred tax liabilities: |
| |||||
| Intangible assets, net | 9,885 | | |||
| Other | 77 | | |||
Deferred tax liabilities | 9,962 | | ||||
Net deferred tax asset (liability) | $ | - | | |||
Significant judgment is required in determining the provision for income taxes and recording the related income tax assets and liabilities. The Partnership recognizes the financial statement benefit of a tax position only after determining that the relevant tax authority would more-likely-than-not sustain the position following an audit. For tax positions meeting the more-likely-than-not criterion, the amount recognized in the financial statements is the largest benefit that has a greater than 50 percent likelihood of being realized upon ultimate settlement with the relevant tax authority.
The Partnership has recognized valuation allowances to reduce its deferred tax assets to amounts that are realizable through future reversals of existing taxable temporary differences.
The Partnership is subject to income tax audits in all jurisdictions for which it files tax returns. Tax audits by their very nature are often complex and can require several years to complete. Neither the Partnership nor any of its subsidiaries is currently under audit in any jurisdiction. The years 2014 to 2016 remain open for examination by the tax authorities in the Republic of Korea. There are no uncertain tax positions recorded at December 31, 2016 and there were no interest or penalties recognized related to uncertain tax positions for the year ended December 31, 2016.
As of December 31, 2016, the Partnership's Korean subsidiaries had $368.1 million of net operating loss carryforwards, which begin expiring in 2021.
150
Monster Holdings LP
Notes to Consolidated Financial Statements
As of and for the Year Ended December 31, 2016
(unaudited)
____________________________________________________________________________________
13. RELATED PARTY TRANSACTIONS
The Partnership has entered into an arrangement to receive advisory services from two affiliated companies of its investors, Kohlberg, Kravis Roberts & Co. L.P. and Anchor Equity Partners (Asia) Limited. Under that arrangement, which is cancelable only with the consent of the counterparties, the Partnership will incur advisory costs of approximately $1.5 million per year. The Partnership incurred $1.6 million of advisory costs under this arrangement for the year ended December 31, 2016, which are included within "Selling, general and administrative" in the accompanying consolidated statement of operations. There were $0.6 million of amounts due to the counterparties under this arrangement as of December 31, 2016, which are included within "Accrued expenses and other current liabilities" in the accompanying consolidated balance sheet.
14. SUBSEQUENT EVENT
In February 2017, the Partnership undertook a recapitalization transaction whereby Groupon exchanged all 61,484,539 of its Class B units for 16,609,195 newly issued Class A-1 units. The Class B units previously held by Groupon were then distributed from the Partnership to the Class A-1 unit holders, Class A-2 unit holders and the remaining Class B unit holders. Following that recapitalization transaction, the Class A-1 units are entitled to a $150.0 million liquidation preference, which must be paid prior to any distributions to the holders of the Class A-2, Class B and Class C units. Distributions in excess of $150.0 million and up to $636.0 million are payable to holders of Class A-2 units. Distributions in excess of $636.0 million and up to $830.0 million are payable to holders of Class B units. Distributions in excess of $830.0 million and up to $853.0 million are payable to holders of Class C units. Unit holders are entitled to share in distributions between $853.0 million and $1,494.0 million in accordance with the terms of the Partnership's distribution waterfall, and distributions in excess of $1,494.0 million are made pro rata to all unit holders based on their respective ownership interests.
The Partnership has evaluated subsequent events from the balance sheet date through March 22, 2017, the date at which the consolidated financial statements were available to be issued, and determined that there are no other items to disclose.
151
Monster Holdings LP
Consolidated Financial Statements
For the Period from May 27, 2015 through December 31, 2015
152
Report of Independent Auditors
The Board of Directors and Partners of Monster Holdings LP
We have audited the accompanying consolidated financial statements of Monster Holdings LP, which comprise the consolidated balance sheet as of December 31, 2015, and the related consolidated statement of operations, comprehensive loss, changes in partners' capital and cash flows for the period from May 27, 2015 through December 31, 2015, and the related notes to the consolidated financial statements.
Management's Responsibility for the Financial Statements
Management is responsible for the preparation and fair presentation of these financial statements in conformity with U.S. generally accepted accounting principles; this includes the design, implementation and maintenance of internal control relevant to the preparation and fair presentation of financial statements that are free of material misstatement, whether due to fraud or error.
Auditor's Responsibility
Our responsibility is to express an opinion on these financial statements based on our audit. We conducted our audit in accordance with auditing standards generally accepted in the United States. Those standards require that we plan and perform the audit to obtain reasonable assurance about whether the financial statements are free of material misstatement.
An audit involves performing procedures to obtain audit evidence about the amounts and disclosures in the financial statements. The procedures selected depend on the auditor's judgment, including the assessment of the risks of material misstatement of the financial statements, whether due to fraud or error. In making those risk assessments, the auditor considers internal control relevant to the entity's preparation and fair presentation of the financial statements in order to design audit procedures that are appropriate in the circumstances, but not for the purpose of expressing an opinion on the effectiveness of the entity's internal control. Accordingly, we express no such opinion. An audit also includes evaluating the appropriateness of accounting policies used and the reasonableness of significant accounting estimates made by management, as well as evaluating the overall presentation of the financial statements.
We believe that the audit evidence we have obtained is sufficient and appropriate to provide a basis for our audit opinion.
Opinion
In our opinion, the financial statements referred to above present fairly, in all material respects, the consolidated financial position of Monster Holdings LP at December 31, 2015, and the consolidated results of its operations and its cash flows for the period from May 27, 2015 through December 31, 2015 in conformity with U.S. generally accepted accounting principles.
/s/ Ernst & Young Han Young
Seoul, Republic of Korea
March 30, 2016
153
Monster Holdings LP
Consolidated Balance Sheet
As of December 31, 2015
(USD in thousands, except unit amounts)
______________________________________________________________________________________________________
|
|
| ||||||||
|
|
|
|
|
|
|
| December 31, 2015 | ||
Assets |
|
| ||||||||
Current assets: |
|
| ||||||||
| Cash and cash equivalents |
| $ | 81,763 | | |||||
| Accounts receivable, net |
| 21,821 | | ||||||
| Prepaid expenses and other current assets |
| 48,768 | | ||||||
|
|
|
| Total current assets |
| 152,352 | | |||
Property, equipment and software, net |
| 11,453 | | |||||||
Goodwill |
| 355,101 | | |||||||
Intangible assets, net |
| 111,399 | | |||||||
Other non-current assets |
| 5,943 | | |||||||
|
|
|
| Total Assets |
| $ | 636,248 | | ||
Liabilities and Partners' Capital |
|
| ||||||||
Current liabilities: |
|
| ||||||||
| Accounts payable |
| $ | 37,089 | | |||||
| Accrued merchant and supplier payables |
| 218,947 | | ||||||
| Accrued expenses and other current liabilities |
| 21,454 | | ||||||
|
|
|
| Total current liabilities |
| 277,490 | | |||
Other non-current liabilities |
| 5,125 | | |||||||
|
|
|
| Total Liabilities |
| 282,615 | | |||
|
|
|
|
|
|
|
|
| ||
Commitments and contingencies (see Note 8) |
|
| ||||||||
|
|
|
|
|
|
|
|
| ||
Partners' Capital |
|
| ||||||||
Class A units (72,000,000 units authorized and 72,000,000 units issued and outstanding at December 31, 2015) |
| 360,000 | | |||||||
Class B units (64,000,000 units authorized and 64,000,000 units issued and outstanding at December 31, 2015) |
| 21,024 | | |||||||
Class C units (20,321,839 units authorized and no units issued and outstanding at December 31, 2015) |
| - | | |||||||
Accumulated other comprehensive loss |
| (27,391 | ) | |||||||
|
|
|
|
| Total Partners' Capital |
| 353,633 | | ||
|
|
|
|
| Total Liabilities and Partners' Capital |
| $ | 636,248 | | |
The accompanying notes are an integral part of these consolidated financial statements.
154
Monster Holdings LP
Consolidated Statement of Operations
For the Period from May 27, 2015 through December 31, 2015
(USD in thousands)
_____________________________________________________________________________________
|
| Period from May 27, 2015 through | ||||||||
|
| December 31, 2015 | ||||||||
Revenue: |
|
| ||||||||
Third party and other |
| $ | 20,810 | | ||||||
Direct |
| 63,087 | | |||||||
Total revenue |
| 83,897 | | |||||||
Cost of revenue: |
|
| ||||||||
Third party and other |
| 21,357 | | |||||||
Direct |
| 81,526 | | |||||||
Total cost of revenue |
| 102,883 | | |||||||
Gross profit (loss) |
| (18,986 | ) | |||||||
Operating expenses: |
|
| ||||||||
Marketing |
| 32,537 | | |||||||
Selling, general and administrative |
| 59,855 | | |||||||
Total operating expenses |
| 92,392 | | |||||||
Loss from operations |
| (111,378 | ) | |||||||
Other income, net |
| 3,459 | | |||||||
Net loss before provision (benefit) for income taxes |
| (107,919 | ) | |||||||
Provision (benefit) for income taxes |
| - | | |||||||
Net loss |
| $ | (107,919 | ) | ||||||
The accompanying notes are an integral part of these consolidated financial statements.
155
Monster Holdings LP
Consolidated Statement of Comprehensive Loss
For the Period from May 27, 2015 through December 31, 2015
(USD in thousands)
_____________________________________________________________________________________
|
|
|
|
|
| Period from May 27, 2015 through | |||
|
|
|
|
|
|
| December 31, 2015 | ||
Net loss | $ | (107,919 | ) | ||||||
Other comprehensive loss: |
| ||||||||
Foreign currency translation adjustments | (27,391 | ) | |||||||
Comprehensive loss | $ | (135,310 | ) | ||||||
The accompanying notes are an integral part of these consolidated financial statements.
156
Monster Holdings LP
Consolidated Statement of Changes in Partners' Capital
For the Period from May 27, 2015 through December 31, 2015
(USD in thousands, except unit amounts)
_________________________________________________________________________________________________________________
|
| Partners' capital |
| Accumulated other comprehensive loss |
| Total | |||||||||||||||||||||||
|
| Class A |
| Class B |
| Class C |
| ||||||||||||||||||||||
|
| Units |
| Amount |
| Units |
| Amount |
| Units |
| Amount |
| ||||||||||||||||
Balance at May 27, 2015 |
| 70,000,000 | |
| $ | 350,000 | |
| - | |
| $ | - | |
| - | |
| $ | - | |
| $ | - | |
| $ | 350,000 | |
Cash contributions for Class A units |
| 2,000,000 | |
| 10,000 | |
| - | |
| - | |
| - | |
| - | |
| - | |
| 10,000 | | |||||
Class B units issued in connection with acquisition |
| - | |
| - | |
| 64,000,000 | |
| 128,607 | |
| - | |
| - | |
| - | |
| 128,607 | | |||||
Net loss |
| - | |
| - | |
| - | |
| (107,919 | ) |
| - | |
| - | |
| - | |
| (107,919 | ) | |||||
Expenses funded by Class B unit holder |
| - | |
| - | |
| - | |
| 336 | |
| - | |
| - | |
| - | |
| 336 | | |||||
Foreign currency translation |
| - | |
| - | |
| - | |
| - | |
| - | |
| - | |
| (27,391 | ) |
| (27,391 | ) | |||||
Balance at December 31, 2015 |
| 72,000,000 | |
| $ | 360,000 | |
| 64,000,000 | |
| $ | 21,024 | |
| - | |
| $ | - | |
| $ | (27,391 | ) |
| $ | 353,633 | |
The accompanying notes are an integral part of these consolidated financial statements.
157
Monster Holdings LP
Consolidated Statement of Cash Flows
For the Period from May 27, 2015 through December 31, 2015
(USD in thousands)
(unaudited)
| Period from May 27, 2015 through | ||||||||
|
|
|
|
|
|
| December 31, 2015 | ||
Operating activities |
| ||||||||
Net loss | $ | (107,919 | ) | ||||||
Adjustments to reconcile net loss to net cash used in operating activities: |
| ||||||||
| Depreciation and amortization | 14,378 | | ||||||
| Expenses funded by Class B unit holder | 336 | | ||||||
| Change in assets and liabilities, net of acquisitions: |
| |||||||
|
| Restricted cash | (15,495 | ) | |||||
|
| Accounts receivable | (5,504 | ) | |||||
|
| Prepaid expenses and other current assets | (16,920 | ) | |||||
|
| Other non-current assets | (2,513 | ) | |||||
|
| Accounts payable | 27,022 | | |||||
|
| Accrued merchant and supplier payables | 80,488 | | |||||
|
| Accrued expenses and other current liabilities | 4,296 | | |||||
|
| Other, net | (106 | ) | |||||
Net cash used in operating activities | (21,937 | ) | |||||||
|
|
|
|
|
|
|
| ||
Investing activities |
| ||||||||
Purchases of property and equipment and capitalized software | (6,796 | ) | |||||||
Acquisition of business, net of acquired cash | (247,484 | ) | |||||||
Net cash used in investing activities | (254,280 | ) | |||||||
|
|
|
|
|
|
|
| ||
Financing activities |
| ||||||||
Contributions from Class A limited partners | 10,000 | | |||||||
Net cash provided by financing activities | 10,000 | | |||||||
Effect of exchange rate changes on cash and cash equivalents | (2,020 | ) | |||||||
Net decrease in cash and cash equivalents | (268,237 | ) | |||||||
Cash and cash equivalents, beginning of period | 350,000 | | |||||||
Cash and cash equivalents, end of period | $ | 81,763 | | ||||||
Non-cash financing activities |
| ||||||||
Issuance of Class B units in connection with acquisition of business | $ | 128,607 | | ||||||
The accompanying notes are an integral part of these consolidated financial statements.
158
Monster Holdings LP
Notes to Consolidated Financial Statements
For the Period from May 27, 2015 through December 31, 2015
____________________________________________________________________________________
1. DESCRIPTION OF BUSINESS AND BASIS OF PRESENTATION
Monster Holdings LP (the "Partnership") is a Delaware Limited Partnership that was formed on April 1, 2015 and had no operations until May 27, 2015, when the Partnership acquired from a wholly-owned subsidiary of Groupon Inc. ("Groupon") all of the outstanding equity interests of LivingSocial Korea, Inc. ("LSK"), a Korean corporation and holding company of Ticket Monster Inc. ("Ticket Monster"). The accompanying consolidated financial statements are presented from May 27, 2015, the date on which Groupon sold LSK to the Partnership and recognized its minority interest in that entity.
Ticket Monster is an e-commerce company based in the Republic of Korea that connects merchants to consumers by offering goods and services at a discount. Ticket Monster acts as a marketing agent by selling vouchers that can be redeemed for products or services with third party merchants. Ticket Monster also sells merchandise inventory directly to customers. Customers can access Ticket Monster's deal offerings directly through its website and mobile application and indirectly using search engines. Ticket Monster also sends emails to its subscribers with deal offerings that are targeted by location and personal preferences.
Liquidity Risks
As of December 31, 2015, the Partnership had $81.8 million of cash and cash equivalents and a working capital deficit of $125.1 million. In the normal course of business, the Partnership collects cash from credit card payment processors shortly after a sale occurs and remits payments to merchants and suppliers at a later date in accordance with the related contractual payment terms. This favorable working capital cycle is expected to continue for the foreseeable future. For the period from May 27, 2015 through December 31, 2015, the Partnership incurred $21.9 million of negative cash flows from operations and $6.8 million of capital expenditures. The Partnership believes that its current liquidity resources will be adequate to meet its obligations as they come due for a period of at least one year from March 30, 2016, the date at which the consolidated financial statements were available to be issued. In the event of any unexpected adverse change in its business, the Partnership has the ability and intent to reduce discretionary spending to increase liquidity and also plans to obtain additional equity or debt financing.
2. SUMMARY OF SIGNIFICANT ACCOUNTING POLICIES
Principles of Consolidation
The consolidated financial statements include the accounts of the Partnership and its subsidiaries. All intercompany accounts and transactions have been eliminated in consolidation. The Partnership's consolidated financial statements were prepared in accordance with accounting principles generally accepted in the United States ("U.S. GAAP") and include the assets, liabilities, revenue and expenses of all subsidiaries over which the Partnership exercises control.
Use of Estimates
The preparation of consolidated financial statements in conformity with U.S. GAAP requires estimates and assumptions that affect the reported amounts and classifications of assets and liabilities, revenues and expenses, and the related disclosures of contingent liabilities in the consolidated financial statements and accompanying notes. Estimates are utilized for, but not limited to, income taxes, valuation of acquired goodwill and intangible assets, customer refunds, contingent liabilities and the useful lives of property and equipment and intangible assets. Actual results could differ materially from those estimates.
Cash and Cash Equivalents
The Partnership considers all highly-liquid investments with an original maturity of three months or less from the date of purchase to be cash equivalents.
Accounts Receivable, Net
Accounts receivable primarily represents the net cash due from the Partnership's credit card and other payment processors for cleared transactions. The carrying amount of the Partnership's receivables is reduced by an allowance for doubtful accounts that reflects management's best estimate of amounts that will not be collected. The allowance is based on historical loss experience
159
Monster Holdings LP
Notes to Consolidated Financial Statements
For the Period from May 27, 2015 through December 31, 2015
____________________________________________________________________________________
and any specific risks identified in collection matters. Accounts receivable are charged off against the allowance for doubtful accounts when it is determined that the receivable is uncollectible.
Inventories
Inventories, consisting of merchandise purchased for resale, are accounted for using the weighted average cost method of accounting and are valued at the lower of cost or market value. The Partnership writes down its inventory to the lower of cost or market value based upon assumptions about future demand and market conditions. If actual market conditions are less favorable than those projected by the Partnership , additional inventory write-downs may be required. Once established, the original cost of the inventory less the related inventory write-down represents a new cost basis.
Restricted Cash
Restricted cash primarily represents amounts that the Partnership is unable to access for operational purposes pursuant to contractual arrangements with certain financial institutions. The Partnership had $16.4 million of restricted cash recorded within "Prepaid expenses and other current assets" as of December 31, 2015.
Property and Equipment
Property and equipment are stated at cost. Depreciation of property and equipment is recorded on a straight-line basis over the estimated useful lives of the assets. Generally, the useful lives are three years for computer equipment, office furniture and equipment, software and the shorter of the term of the lease or the asset's useful life for leasehold improvements.
Internal-Use Software
The Partnership incurs costs related to internal-use software and website development, including purchased software and internally-developed software. Costs incurred in the planning and evaluation stage of internally-developed software and website development are expensed as incurred. Costs incurred and accumulated during the application development stage are capitalized and included within "Property, equipment and software, net" on the consolidated balance sheet. Amortization of internal-use software is recorded on a straight-line basis over the estimated useful lives of three years.
Impairment of Long-lived Assets
Long-lived assets, such as property and equipment and intangible assets, are reviewed for impairment whenever events or changes in circumstances indicate that the carrying amount of an asset or asset group may not be recoverable. If circumstances require that a long-lived asset or asset group be tested for possible impairment, the Partnership first compares the undiscounted cash flows expected to be generated by that long-lived asset or asset group to its carrying amount. If the carrying amount of the long-lived asset or asset group is not recoverable on an undiscounted cash flow basis, an impairment is recognized to the extent that the carrying amount exceeds its fair value.
Goodwill
Goodwill is allocated to the Partnership's sole reporting unit at the date the goodwill is initially recorded. Once goodwill has been allocated to the reporting unit, it no longer retains its identification with a particular acquisition and becomes identified with the reporting unit in its entirety. Accordingly, the fair value of the reporting unit as a whole is available to support the recoverability of its goodwill.
The Partnership evaluates goodwill for impairment annually or more frequently when an event occurs or circumstances change that indicates the carrying value may not be recoverable. The Partnership has the option to assess goodwill for impairment by first performing a qualitative assessment to determine whether it is more-likely-than-not that the fair value of a reporting unit is less than its carrying amount. If the Partnership determines that it is not more-likely-than-not that the fair value of a reporting unit is less than its carrying amount, then the two-step goodwill impairment test is not required to be performed. If the Partnership determines that it is more-likely-than-not that the fair value of a reporting unit is less than its carrying amount, or if the Partnership
160
Monster Holdings LP
Notes to Consolidated Financial Statements
For the Period from May 27, 2015 through December 31, 2015
____________________________________________________________________________________
does not elect the option to perform an initial qualitative assessment, the Partnership performs the two-step goodwill impairment test. In the first step, the fair value of the reporting unit is compared to its book value including goodwill. If the fair value of the reporting unit is in excess of its book value, the related goodwill is not impaired and no further analysis is necessary. If the fair value of the reporting unit is less than its book value, there is an indication of potential impairment and a second step is performed. When required, the second step of testing involves calculating the implied fair value of goodwill for the reporting unit. The implied fair value of goodwill is determined in the same manner as goodwill recognized in a business combination, which is the excess of the fair value of the reporting unit determined in step one over the fair value of its net assets, including identifiable intangible assets, as if the reporting unit had been acquired. If the carrying value of the reporting unit's goodwill exceeds the implied fair value of that goodwill, an impairment loss is recognized in an amount equal to that excess.
Income Taxes
For U.S. Federal income tax purposes, the Partnership is a pass-through entity and all applicable U.S. income taxes are the responsibility of the partners. However, its subsidiaries are subject to income taxes in the Republic of Korea. The Partnership accounts for income taxes of its Korean subsidiaries using the asset and liability method, under which deferred income tax assets and liabilities are recognized based upon anticipated future tax consequences attributable to differences between the financial statement carrying amounts of assets and liabilities and their respective tax bases. The Partnership regularly reviews deferred tax assets to assess whether it is more-likely-than-not that the deferred tax assets will be realized and, if necessary, establishes a valuation allowance for portions of such assets to reduce the carrying value.
For purposes of assessing whether it is more-likely-than-not that deferred tax assets will be realized, the Partnership considers the following four sources of taxable income for each tax jurisdiction: (a) future reversals of existing taxable temporary differences, (b) projected future earnings, (c) taxable income in carryback years, to the extent that carrybacks are permitted under the tax laws of the applicable jurisdiction, and (d) tax planning strategies, which represent prudent and feasible actions that a company ordinarily might not take, but would take to prevent an operating loss or tax credit carryforward from expiring unused. To the extent that evidence about one or more of these sources of taxable income is sufficient to support a conclusion that a valuation allowance is not necessary, other sources need not be considered. Otherwise, evidence about each of the sources of taxable income is considered in arriving at a conclusion about the need for and amount of a valuation allowance. See Note 10, " Income Taxes ," for further information about the Partnership's valuation allowance assessments.
The Partnership accounts for uncertainty in income taxes by recognizing the financial statement benefit of a tax position only after determining that the relevant tax authority would more-likely-than-not sustain the position following an audit. For tax positions meeting the more-likely-than-not criteria, the amount recognized in the consolidated financial statements is the largest benefit that has a greater than 50 percent likelihood of being realized upon ultimate settlement with the relevant tax authority.
The Partnership adopted the guidance in Accounting Standards Update ("ASU") 2015-17, Balance Sheet Classification of Deferred Taxes , for the period ended December 31, 2015. The guidance requires entities to present all deferred income tax assets and liabilities as non-current on the balance sheet.
Leases
The Partnership classifies leases at their inception as either operating or capital leases and may receive renewal or expansion options, rent holidays, and leasehold improvement or other incentives on certain lease agreements. The Partnership recognizes operating lease costs on a straight-line basis, taking into account adjustments for free or escalating rental payments and deferred payment terms. Additionally, lease incentives are accounted for as a reduction of lease costs over the lease term. Rent expense associated with operating lease obligations is primarily classified within "Selling, general and administrative expenses" on the consolidated statement of operations.
161
Monster Holdings LP
Notes to Consolidated Financial Statements
For the Period from May 27, 2015 through December 31, 2015
____________________________________________________________________________________
Revenue Recognition
The Partnership recognizes revenue when the following criteria are met: persuasive evidence of an arrangement exists; delivery has occurred; the selling price is fixed or determinable; and collectability is reasonably assured.
Third party revenue recognition
The Partnership generates third party revenue, where it acts as a marketing agent, by selling vouchers through its online local commerce marketplaces that can be redeemed for goods or services with third party merchants.
For transactions involving the sale of vouchers, the revenue recognition criteria are met when the customer purchases the voucher, the voucher has been electronically delivered to the purchaser and a listing of vouchers sold has been made available to the merchant. At that time, the Partnership's obligations to the merchant, for which it is serving as a marketing agent, are substantially complete. The Partnership's remaining obligations, which are limited to remitting payment to the merchant and continuing to make available on its website information about vouchers sold that was previously provided to the merchant, are inconsequential and perfunctory administrative activities.
Third party revenue is reported on a net basis as the purchase price received from the customer for the voucher less the portion of the purchase price that is payable to the featured merchant, excluding applicable taxes and net of estimated refunds for which the merchant's share is recoverable. Revenue is presented on a net basis because the Partnership is acting as a marketing agent of the merchant in the transaction.
For merchant payment arrangements that are structured under a redemption model, merchants are not paid until the customer redeems the voucher that has been purchased. If a customer does not redeem the voucher under this payment model, the Partnership retains the entire voucher purchase price. The Partnership recognizes incremental revenue and derecognizes the related accrued merchant payable when its legal obligation to the merchant expires, which the Partnership believes is shortly after deal expiration.
Direct revenue recognition
The Partnership evaluates whether it is appropriate to record the gross amount of sales and related costs by considering a number of factors, including, among other things, whether the Partnership is the primary obligor under the arrangement, has inventory risk and has latitude in establishing prices.
Direct revenue of the Partnership is derived primarily from selling merchandise inventory in transactions for which it is the merchant of record. The Partnership is the primary obligor in these transactions, is subject to general inventory risk and has latitude in establishing prices. Accordingly, direct revenue is presented on a gross basis, excluding applicable taxes and net of estimated refunds. Direct revenue, including associated shipping revenue, is recognized when title passes to the customer upon delivery of the product.
For merchandise inventory transactions in which the Partnership acts as a marketing agent of a third party merchant, revenue is recorded on a net basis and is presented within third party revenue. The Partnership is generally not responsible for fulfillment on third party revenue transactions involving merchandise inventory and revenue is recognized when the Partnership's obligations to the merchant, for which it is serving as a marketing agent, are substantially complete.
Other revenue recognition
The Partnership's other revenues are derived primarily from advertising arrangements with third parties. Revenue from advertising sales is recognized as advertising services are provided to the Partnership's customers.
Discounts
The Partnership provides discount offers to encourage purchases of goods and services through its marketplaces. The
162
Monster Holdings LP
Notes to Consolidated Financial Statements
For the Period from May 27, 2015 through December 31, 2015
____________________________________________________________________________________
Partnership records discounts as a reduction of revenue.
Cost of revenue
Cost of revenue is comprised of direct and certain indirect costs incurred to generate revenue. For direct revenue transactions, cost of revenue includes the cost of inventory, shipping and fulfillment costs and inventory markdowns. Fulfillment
costs are comprised of third party logistics provider costs, as well as rent, depreciation, personnel costs and other costs of operating
the Partnership's fulfillment center. Other costs incurred to generate revenue, which include credit card processing fees, editorial
costs, certain technology costs, web hosting and other processing fees, are attributed to cost of third party revenue, direct revenue
and other revenue in proportion to gross billings during the period.
Technology costs within cost of revenue consist of compensation expense related to technology support personnel who
are responsible for operating and maintaining the infrastructure of the Partnership's websites.
Customer Credits
The Partnership issues credits to its customers that can be applied against future purchases through its online local marketplaces for certain qualifying acts, such as referring new customers. The Partnership has recorded its customer credit obligations within "Accrued expenses and other current liabilities" on the consolidated balance sheet (Note 6, "Accrued Expenses and Other Current Liabilities" ). Customer credit obligations incurred for new customer referrals or other qualifying acts are expensed as incurred and are classified within "Marketing" on the consolidated statement of operations.
Refunds
At the time revenue is recorded, the Partnership records an accrual for estimated refunds primarily based on the Partnership's historical experience with refunds. Refunds are recorded as a reduction of revenue. The Partnership accrues costs associated with refunds within "Accrued expenses and other current liabilities" on the consolidated balance sheet. The Partnership assesses the trends that could affect its estimates on an ongoing basis and makes adjustments to the refund reserve calculations if it appears that changes in circumstances, including changes to the Partnership's refund policies, may cause future refunds to differ from its original estimates. If actual results are not consistent with the estimates or assumptions stated above, the Partnership may need to change its future estimates, and the effects could be material to the consolidated financial statements.
Unit-Based Compensation
The Partnership's Class C units have been authorized for issuance as unit-based awards to compensate its employees for future service. The Partnership measures unit‑based compensation cost at fair value, net of estimated forfeitures. Expense is recognized on a straight-line basis over the service period during which awards are expected to vest, except for awards with both performance conditions and a graded vesting schedule, which are recognized using the accelerated method. For the period from May 27, 2015 through December 31, 2015, the Partnership did not incur any unit-based compensation expense except for $0.3 million related to Groupon restricted stock units as discussed in Note 11, Related Party Transactions .
Foreign Currency
Balance sheet accounts of the Partnership's operations outside of the U.S. are translated from foreign currencies into U.S. dollars at the exchange rates as of the consolidated balance sheet dates. Revenue and expenses are translated at average exchange rates during the period. Foreign currency translation adjustments are included within "Accumulated other comprehensive loss" on the consolidated balance sheet. Foreign currency gains and losses resulting from transactions which are denominated in currencies other than the entity's functional currency are included within "Other income, net" on the consolidated statement of operations. The gains associated with foreign currency transactions were $3.1 million for the period from May 27, 2015 through December 31, 2015.
163
Monster Holdings LP
Notes to Consolidated Financial Statements
For the Period from May 27, 2015 through December 31, 2015
____________________________________________________________________________________
Fair Value Measurements
The Partnership's financial assets and liabilities include restricted cash, prepaid expenses and other current assets, accounts receivable, accounts payable, accrued merchant and supplier payables, accrued expenses and other current liabilities. The carrying values of these assets and liabilities approximate their fair values due to their short-term nature.
The Partnership had no non-recurring fair value measurements after initial recognition and no recurring fair value measurements for the period from May 27, 2015 through December 31, 2015.
Recently Issued Accounting Standards
In May 2014, the Financial Accounting Standards Board ("FASB") issued ASU 2014-09, Revenue from Contracts with Customers . This ASU is a comprehensive new revenue recognition model that requires a company to recognize revenue to depict the transfer of goods or services to a customer at an amount that reflects the consideration it expects to receive in exchange for those goods or services. The ASU is effective for annual reporting periods beginning after December 15, 2017 and interim periods within those annual periods. The Partnership is still assessing the impact of ASU 2014-09 on its consolidated financial statements.
In April 2015, the FASB issued ASU 2015-05, Intangibles - Goodwill and Other - Internal-Use Software (Subtopic 350-40) - Customer's Accounting for Fees Paid in a Cloud Computing Arrangement . This ASU provides guidance to customers about whether a cloud computing arrangement contains a software license. The ASU is effective for annual reporting periods, beginning after December 15, 2015 and interim periods within those annual periods. While the Partnership is still assessing the impact of ASU 2015-04, it does not expect that the adoption of this guidance will have a material impact on its consolidated financial statements.
In July 2015, the FASB issued ASU 2015-11, Inventory (Topic 330) - Simplifying the Measurement of Inventory . This ASU requires inventory to be measured at the lower of cost or net realizable value, rather than the lower of cost or market. The ASU is effective for annual reporting periods beginning after December 15, 2016 and interim periods within those annual periods. While the Partnership is still assessing the impact of ASU 2015-11, it does not believe that the adoption of this guidance will have a material impact on its consolidated financial statements.
In February 2016, the FASB issued ASU 2016-02, Leases (Topic 842) . The ASU will require lessees to recognize assets and liabilities arising from leases, including operating leases, to be recognized on the balance sheet. The ASU is effective for annual reporting periods beginning after December 15, 2018 and interim periods within those annual periods. The Partnership is still assessing the impact of adoption on its consolidated financial statements.
There are no other accounting standards that have been issued but not yet adopted that the Partnership believes could have a material impact on its consolidated financial position or results of operations.
3. BUSINESS COMBINATIONS
The acquisition of all of the outstanding equity interests of LSK, the holding company of Ticket Monster (the "Ticket Monster acquisition"), was accounted for using the acquisition method, and the results of that business have been included in the consolidated financial statements beginning on the May 27, 2015 acquisition date. The fair value of consideration transferred in the business combination has been allocated to the tangible and intangible assets acquired and liabilities assumed at the acquisition date, with the remaining unallocated amount recorded as goodwill. Acquired goodwill represents the premium the Partnership paid over the fair value of the net tangible and intangible assets acquired. The Partnership paid this premium for a number of reasons, including acquiring an assembled workforce. The goodwill from the business combinations is not deductible for tax purposes.
The aggregate acquisition-date fair value of the consideration transferred for the Ticket Monster acquisition totaled $413.6 million, which consisted of the following (in thousands):
164
Monster Holdings LP
Notes to Consolidated Financial Statements
For the Period from May 27, 2015 through December 31, 2015
____________________________________________________________________________________
Cash |
| $ | 285,000 | |
Issuance of 64,000,000 Class B units |
| 128,607 | | |
Total |
| $ | 413,607 | |
The fair value of the Class B units issued as consideration was measured as of the closing of the transaction on May 27, 2015. The initial fair value was determined using the backsolve valuation method, which is a form of the market approach. Under this method, assumptions are made about the expected time to liquidity, volatility and risk-free rate such that the price paid by a third-party investor in a recent financing round can be used to determine the value of the entity and its other securities using option-pricing methodologies. The fair value of the Class B units was based on the contractual liquidation preferences and the following valuation assumptions: 4-year expected time to a liquidity event, 60% volatility and a 1.3% risk-free rate.
The following table summarizes the allocation of the aggregate acquisition price of the Ticket Monster acquisition (in thousands):
Cash and cash equivalents | $ | 37,516 | |
Accounts receivable | 6,813 | | |
Prepaid expenses and other current assets | 18,866 | | |
Property, equipment and software | 7,884 | | |
Goodwill | 377,001 | | |
Intangible assets: (1) |
| ||
Customer relationships | 58,278 | | |
Merchant relationships | 23,582 | | |
Developed technology | 994 | | |
Trade name | 47,887 | | |
Other non-current assets | 3,193 | | |
Total assets acquired | $ | 582,014 | |
Accounts payable | $ | 9,239 | |
Accrued merchant and supplier payables | 137,167 | | |
Accrued expenses and other current liabilities | 14,942 | | |
Other non-current liabilities | 7,059 | | |
Total liabilities assumed | $ | 168,407 | |
Total acquisition price | $ | 413,607 | |
(1) | The estimated useful lives of the acquired intangible assets are 7 years for customer relationships, 3 years for merchant relationships, 2 years for developed technology and 12 years for trade name. |
165
Monster Holdings LP
Notes to Consolidated Financial Statements
For the Period from May 27, 2015 through December 31, 2015
____________________________________________________________________________________
4. PROPERTY, EQUIPMENT AND SOFTWARE, NET
(in thousands) | December 31, | ||
| 2015 | ||
Purchased software | $ | 2,584 | |
Office furniture and equipment | 5,258 | | |
Internally-developed software | 4,364 | | |
Leasehold improvements | 950 | | |
Construction in progress | 489 | | |
Total property, equipment and software, gross | 13,645 | | |
Less: Accumulated depreciation and amortization | (2,192 | ) | |
Total property, equipment and software, net | $ | 11,453 | |
Depreciation and amortization expense on property, equipment and software for the period from May 27, 2015 through December 31, 2015 was $2.6 million, which includes $0.6 million of internally-developed software amortization, and is primarily included within "Selling, general and administrative expenses" on the consolidated statement of operations.
5. GOODWILL AND INTANGIBLE ASSETS
Goodwill
The following table summarizes the Partnership's goodwill activity for the period from May 27, 2015 through December 31, 2015:
(in thousands) |
|
| ||
Balance as of May 27, 2015 |
| $ | - | |
Goodwill related to acquisition |
| 377,001 | | |
Foreign currency translation |
| (21,900 | ) | |
Balance as of December 31, 2015 |
| $ | 355,101 | |
The Partnership evaluates goodwill for impairment annually on December 31 or more frequently when an event occurs or circumstances change that indicates the carrying value may not be recoverable. No goodwill impairments were recognized for the period from May 27, 2015 through December 31, 2015.
Intangible Assets
The carrying amounts of definite lived intangible assets consist of the following:
(in thousands) | December 31, 2015 | ||||||||||
|
|
|
|
|
| ||||||
| Gross |
| Accumulated |
| Net | ||||||
| Carrying Value |
| Amortization |
| Carrying Value | ||||||
Customer relationships | $ | 54,782 | |
| $ | (4,674 | ) |
| $ | 50,108 | |
Merchant relationships | 22,168 | |
| (4,413 | ) |
| 17,755 | | |||
Developed technology | 934 | |
| (279 | ) |
| 655 | | |||
Trade name | 45,121 | |
| (2,240 | ) |
| 42,881 | | |||
Total intangible assets | $ | 123,005 | |
| $ | (11,606 | ) |
| $ | 111,399 | |
166
Monster Holdings LP
Notes to Consolidated Financial Statements
For the Period from May 27, 2015 through December 31, 2015
____________________________________________________________________________________
Amortization of intangible assets is computed using the straight-line method over their estimated useful lives, which range from 2 to 12 years. Amortization expense related to intangible assets was approximately $11.8 million for the period from May 27, 2015 through December 31, 2015. The weighted average remaining amortization period of intangible assets is 7.7 years as of December 31, 2015. As of December 31, 2015, the Partnership's estimated future amortization expense related to intangible assets is as follows:
(in thousands) |
|
| ||
Years Ended December 31, |
| Amount | ||
2016 |
| $ | 19,541 | |
2017 |
| 19,155 | | |
2018 |
| 14,553 | | |
2019 |
| 11,577 | | |
2020 |
| 11,577 | | |
Thereafter |
| 34,996 | | |
Total |
| $ | 111,399 | |
6. SUPPLEMENTAL CONSOLIDATED BALANCE SHEET INFORMATION
The following summarizes the Partnership's prepaid expenses and other current assets as of December 31, 2015:
(in thousands) | December 31, | ||
| 2015 | ||
Finished goods inventories | $ | 19,113 | |
Prepaid expenses | 13,288 | | |
Restricted cash | 16,367 | | |
Total prepaid expenses and other current assets | $ | 48,768 | |
The following summarizes the Partnership's accrued expenses and other current liabilities as of December 31, 2015:
(in thousands) | December 31, | ||
| 2015 | ||
Customer credits | $ | 2,668 | |
Refunds | 597 | | |
Accrued compensation and benefits | 7,021 | | |
Deferred revenue | 3,545 | | |
Other | 7,623 | | |
Total accrued expenses and other current liabilities | $ | 21,454 | |
7. CREDIT FACILITY
The Partnership has entered into a revolving credit facility (the "credit facility") that provides for aggregate principal borrowings of $8.5 million. The credit facility expires on July 14, 2016 . Borrowings under the credit facility bear interest at the Certificate of Deposit Rate for the Republic of Korea plus 3.30%. As of December 31, 2015, the Partnership had no borrowings outstanding under the credit facility.
167
Monster Holdings LP
Notes to Consolidated Financial Statements
For the Period from May 27, 2015 through December 31, 2015
____________________________________________________________________________________
8. COMMITMENTS AND CONTINGENCIES
Operating Leases
The Partnership has entered into various non-cancelable operating lease agreements, primarily covering certain of its offices in the Republic of Korea, with lease expirations between 2016 and 2017. Rent expense under these operating leases was $2.7 million for the period from May 27, 2015 through December 31, 2015. Certain of these arrangements have renewal or expansion options and adjustments for market provisions, such as free or escalating base monthly rental payments. The Partnership recognizes rent expense under such arrangements on a straight-line basis over the initial term of the lease. The difference between the straight-line expense and the cash paid for rent has been recorded as deferred rent.
As of December 31, 2015, future payments under non-cancelable operating leases (including rent escalation clauses but excluding a proportionate share of operating expenses) were as follows:
(in thousands) |
| ||||||||
Years Ended December 31, | Operating Leases | ||||||||
2016 | $ | 7,055 | | ||||||
2017 | 3,493 | | |||||||
Thereafter | - | | |||||||
Total | $ | 10,548 | | ||||||
Contingencies
The Partnership recognizes accrued liabilities for loss contingencies when the loss is determined to be both probable and estimable. Such accruals represent the Partnership's best estimate of probable losses and, in some cases, there may be an exposure to loss in excess of the amounts accrued. The Partnership believes that the amount of reasonably possible losses in excess of the amounts accrued for loss contingencies as of December 31, 2015 would not have a material adverse effect on its business, financial position, results of operations or cash flows.
The Partnership has provided customary indemnifications to its unit holders and their affiliates for claims that may arise in connection with their involvement with the Partnership. The indemnifications do not limit the maximum potential future payments that can be made and it is not possible to determine an estimate of those maximum potential future payments due to the absence of historical claim experience.
9. PARTNERS' CAPITAL
On May 26, 2015, the Partnership received a $350.0 million capital contribution from Monster Partners LP, an entity jointly owned by affiliates of Kohlberg, Kravis Roberts & Co. L.P. ("KKR") and Anchor Equity Partners (Asia) Limited ("Anchor"), in exchange for 70,000,000 Class A units of the Partnership. On May 27, 2015, a wholly-owned subsidiary of Groupon transferred all of the issued and outstanding share capital of LSK, the holding company of Ticket Monster, to the Partnership in exchange for 64,000,000 Class B units of the Partnership and $285.0 million in cash consideration. Subsequently, an entity affiliated with Mr. Daniel Shin, the founder and current chief executive officer of Ticket Monster, contributed an additional $10.0 million in cash consideration to the Partnership in exchange for 2,000,000 Class A units of the Partnership. The Partnership is authorized to issue 20,321,839 Class C units to its management that will be subject to vesting conditions. No Class C units were issued or granted during the period from May 27, 2015 through December 31, 2015.
Under the terms of the Partnership's amended and restated agreement of limited partnership, its general partner, Monster Holdings GP LLC, established a Board of Directors (the "Board") and irrevocably assigned the rights to carry out any and all of the objectives and purposes of the Partnership to the Board. The general partner is not entitled to receive any distributions. Holders of Class A units of the Partnership are entitled to a $486.0 million liquidation preference, which must be paid prior to any distributions to the holders of Class B and Class C units. All distributions in excess of $486.0 million and up to $680.0 million will be paid to
168
Monster Holdings LP
Notes to Consolidated Financial Statements
For the Period from May 27, 2015 through December 31, 2015
____________________________________________________________________________________
holders of Class B units. Distributions in excess of $680.0 million and up to $703.0 million will be paid to holders of any outstanding Class C units. Unit holders will be entitled to share in distributions between $703.0 million and $1,116.0 million in accordance with the terms of the Partnership's distribution waterfall, and distributions in excess of $1,116.0 million will be made pro rata to all unit holders based on their respective ownership interests. Due to the Class A unit liquidation preference, the Partnership's net loss for the period from May 27, 2015 through December 31, 2015 has been allocated to the Class B units in the accompanying consolidated statement of changes in partners' capital. Holders of Class A and Class B units are entitled to one vote per unit and vote together as a single class. Holders of Class C units will not be entitled to any voting rights.
10. INCOME TAXES
Domestic and foreign components of loss from operations before income taxes are presented below:
(in thousands) |
|
| Period from May 27, 2015 through | |||
|
|
|
| December 31, 2015 | ||
Earnings before income taxes - U.S. | $ | 196 | | |||
Loss before income taxes - Korea | (108,115 | ) | ||||
Total loss before income taxes | $ | (107,919 | ) | |||
For U.S. Federal income tax purposes, the Partnership is a pass-through entity and all applicable U.S. income taxes are the responsibility of the partners. However, its subsidiaries are subject to income taxes in the Republic of Korea. The provision for income taxes in the Republic of Korea consists of the following:
(in thousands) |
|
| Period from May 27, 2015 through | |||
|
|
|
| December 31, 2015 | ||
Current income tax provision (benefit) |
| $ | - | | ||
Deferred income tax provision (benefit) |
| - | | |||
Total provision (benefit) for income taxes |
| $ | - | | ||
The items accounting for differences between the income tax provision or benefit computed at the applicable Korean statutory rate of 11% and the provision for income taxes for the period from May 27, 2015 through December 31, 2015 are as follows:
(in thousands) |
|
|
|
| |||
|
|
|
|
| Period from May 27, 2015 through December 31, 2015 | ||
Income tax benefit at statutory rate | $ | (11,871 | ) | ||||
Change in valuation allowance | 11,834 | | |||||
Other | 37 | | |||||
Total provision (benefit) for income taxes | $ | - | | ||||
Deferred income tax assets and liabilities of the Partnership's Korean subsidiaries, which include net operating losses generated prior to the Partnership's acquisition of those subsidiaries, consisted of the following:
169
Monster Holdings LP
Notes to Consolidated Financial Statements
For the Period from May 27, 2015 through December 31, 2015
____________________________________________________________________________________
(in thousands) |
|
| December 31, | |||
|
|
|
| 2015 | ||
Deferred tax assets: |
| |||||
| Accrued expenses and other liabilities | $ | 2,323 | | ||
| Net operating loss and tax credit carryforwards | 30,183 | | |||
| Property, equipment and software, net | 120 | | |||
| Other | 26 | | |||
| Total deferred tax assets | 32,652 | | |||
| Less valuation allowances | (20,319 | ) | |||
Deferred tax assets, net of valuation allowance | 12,333 | | ||||
Deferred tax liabilities: |
| |||||
| Intangible assets, net | 12,256 | | |||
| Other | 77 | | |||
Deferred tax liabilities | 12,333 | | ||||
Net deferred tax asset (liability) | $ | - | | |||
Significant judgment is required in determining the provision for income taxes and recording the related income tax assets and liabilities. The Partnership recognizes the financial statement benefit of a tax position only after determining that the relevant tax authority would more-likely-than-not sustain the position following an audit. For tax positions meeting the more-likely-than-not criterion, the amount recognized in the financial statements is the largest benefit that has a greater than 50 percent likelihood of being realized upon ultimate settlement with the relevant tax authority.
The Partnership has recognized valuation allowances to reduce its deferred tax assets to amounts that are realizable through future reversals of existing taxable temporary differences.
The Partnership is subject to income tax audits in all jurisdictions for which it files tax returns. Tax audits by their very nature are often complex and can require several years to complete. Neither the Partnership nor any of its subsidiaries is currently under audit in any jurisdiction. The years 2013 to 2015 remain open for examination by the tax authorities in the Republic of Korea. There are no uncertain tax positions recorded at December 31, 2015 and there were no interest or penalties recognized related to uncertain tax positions for the period from May 27, 2015 through December 31, 2015.
As of December 31, 2015, the Partnership's Korean subsidiaries had $274.4 million of net operating loss carryforwards, which begin expiring in 2021.
11. RELATED PARTY TRANSACTIONS
Certain Ticket Monster employees continue to vest in share-based awards granted by Groupon as a result of their employment with Ticket Monster. These restricted stock units are remeasured to fair value each reporting period. The Partnership has recorded $0.3 million of compensation expense within "Selling, general and administrative expenses" on the consolidated statement of operations as a result of that arrangement. As of December 31, 2015, 377,256 Groupon restricted stock units are outstanding, which will result in approximately $1.2 million of future compensation expense based on the fair value of the unvested awards at that date and is expected to be recognized over a remaining weighted average period of 1.7 years.
The Partnership has entered into an arrangement to receive advisory services from KKR and Anchor. Under that arrangement, which is cancelable only with the consent of the counterparties, the Partnership will incur advisory costs of approximately $1.5 million per year. The Partnership incurred $0.9 million of advisory costs under this arrangement for the period from May 27, 2015 through December 31, 2015, which are included within "Selling, general and administrative" in the accompanying consolidated statement of operations. There were $0.6 million of amounts due to the counterparties under this
170
Monster Holdings LP
Notes to Consolidated Financial Statements
For the Period from May 27, 2015 through December 31, 2015
____________________________________________________________________________________
arrangement as of December 31, 2015, which are included within "Accrued expenses and other current liabilities" in the accompanying consolidated balance sheet.
During 2015, Groupon sold 2,529,998 Class B units for $4.8 million to an entity affiliated with Mr. Daniel Shin and other employees of Ticket Monster.
12. SUBSEQUENT EVENTS
On January 4, 2016, the Partnership granted 20,321,839 Class C restricted units to employees of Ticket Monster. Those Class C restricted units had a total grant date fair value of approximately $23.8 million, are subject to time-based vesting conditions and, for a portion of the Class C units, a performance-based vesting condition.
On March 22, 2016, the Partnership's wholly-owned subsidiary LSK was merged into its wholly-owned subsidiary Ticket Monster. This merger of consolidated subsidiaries has no impact on the consolidated financial statements.
The Partnership has evaluated subsequent events from the balance sheet date through March 30, 2016, the date at which the consolidated financial statements were available to be issued, and determined that there are no other items to disclose.
171
ITEM 9: CHANGES IN AND DISAGREEMENTS WITH ACCOUNTANTS ON ACCOUNTING AND FINANCIAL DISCLOSURE
None.
ITEM 9A. CONTROLS AND PROCEDURES
Evaluation of Disclosure Controls and Procedures
Our management, with the participation of our Chief Executive Officer and our Chief Financial Officer, has evaluated the effectiveness of the design and operation of our disclosure controls and procedures pursuant to Rule 13a-15(e) and 15d-15(e) under the Securities Exchange Act of 1934, as amended (the Exchange Act), as of the end of the period covered by this Annual Report on Form 10-K.
Based on this evaluation, our management concluded that, as of December 31, 2017 , our disclosure controls and procedures are effective to provide reasonable assurance that information we are required to disclose in reports that we file or submit under the Exchange Act is recorded, processed, summarized and reported within the time periods specified in the Securities and Exchange Commission's rules and forms, and that such information is accumulated and communicated to our management, including our Chief Executive Officer and Chief Financial Officer, as appropriate, to allow timely decisions regarding required disclosure.
Management's Report on Internal Control over Financial Reporting
Our management is responsible for establishing and maintaining adequate internal control over financial reporting, as defined in Rule 13a-15(f) of the Exchange Act. Our management conducted an evaluation of the effectiveness of our internal control over financial reporting based on the framework in Internal Control-Integrated Framework issued by the Committee of Sponsoring Organizations of the Treadway Commission (2013 framework). Our internal control over financial reporting includes policies and procedures that provide reasonable assurance regarding the reliability of financial reporting and the preparation of financial statements for external reporting purposes in accordance with U.S. generally accepted accounting principles. Based on this evaluation, management concluded that our internal control over financial reporting was effective as of December 31, 2017 . Management reviewed the results of its assessment with our Audit Committee. The effectiveness of our internal control over financial reporting as of December 31, 2017 has been audited by Deloitte & Touche LLP, an independent registered public accounting firm, as stated in its report which is included below.
Changes in Internal Control over Financial Reporting
There was no change in our internal control over financial reporting identified in connection with the evaluation required by Rule 13a-15(d) and 15d-15(d) of the Exchange Act that occurred during the quarter ended December 31, 2017 that has materially affected, or is reasonably likely to materially affect, our internal control over financial reporting.
Limitations on Effectiveness of Controls and Procedures
In designing and evaluating the disclosure controls and procedures, management recognizes that any controls and procedures, no matter how well designed and operated, can provide only reasonable assurance of achieving the desired control objectives. In addition, the design of disclosure controls and procedures must reflect the fact that there are resource constraints and that management is required to apply its judgment in evaluating the benefits of possible controls and procedures relative to their costs.
172
Report of Independent Registered Public Accounting Firm
To the stockholders and the Board of Directors of Groupon, Inc.
Opinion on Internal Control over Financial Reporting
We have audited the internal control over financial reporting of Groupon, Inc. and subsidiaries (the "Company") as of December 31, 2017, based on criteria established in Internal Control - Integrated Framework (2013) issued by the Committee of Sponsoring Organizations of the Treadway Commission (COSO). In our opinion, the Company maintained, in all material respects, effective internal control over financial reporting as of December 31, 2017, based on criteria established in Internal Control - Integrated Framework (2013) issued by COSO.
We have also audited, in accordance with the standards of the Public Company Accounting Oversight Board (United States) (PCAOB), the consolidated financial statements as of and for the year ended December 31, 2017, of the Company and our report dated February 14, 2018, expressed an unqualified opinion on those financial statements.
Basis for Opinion
The Company's management is responsible for maintaining effective internal control over financial reporting and for its assessment of the effectiveness of internal control over financial reporting, included in the accompanying Management's Report on Internal Control over Financial Reporting. Our responsibility is to express an opinion on the Company's internal control over financial reporting based on our audit. We are a public accounting firm registered with the PCAOB and are required to be independent with respect to the Company in accordance with the U.S. federal securities laws and the applicable rules and regulations of the Securities and Exchange Commission and the PCAOB.
We conducted our audit in accordance with the standards of the PCAOB. Those standards require that we plan and perform the audit to obtain reasonable assurance about whether effective internal control over financial reporting was maintained in all material respects. Our audit included obtaining an understanding of internal control over financial reporting, assessing the risk that a material weakness exists, testing and evaluating the design and operating effectiveness of internal control based on the assessed risk, and performing such other procedures as we considered necessary in the circumstances. We believe that our audit provides a reasonable basis for our opinion.
Definition and Limitations of Internal Control over Financial Reporting
A company's internal control over financial reporting is a process designed to provide reasonable assurance regarding the reliability of financial reporting and the preparation of financial statements for external purposes in accordance with generally accepted accounting principles. A company's internal control over financial reporting includes those policies and procedures that (1) pertain to the maintenance of records that, in reasonable detail, accurately and fairly reflect the transactions and dispositions of the assets of the company; (2) provide reasonable assurance that transactions are recorded as necessary to permit preparation of financial statements in accordance with generally accepted accounting principles, and that receipts and expenditures of the company are being made only in accordance with authorizations of management and directors of the company; and (3) provide reasonable assurance regarding prevention or timely detection of unauthorized acquisition, use, or disposition of the company's assets that could have a material effect on the financial statements.
Because of its inherent limitations, internal control over financial reporting may not prevent or detect misstatements. Also, projections of any evaluation of effectiveness to future periods are subject to the risk that controls may become inadequate because of changes in conditions, or that the degree of compliance with the policies or procedures may deteriorate.
/s/ Deloitte & Touche LLP
Chicago, Illinois
February 14, 2018
173
ITEM 9B: OTHER INFORMATION
On February 13, 2018, in connection with its annual compensation review process, the Compensation Committee of the Board (the "Compensation Committee") approved awards of restricted stock units ("RSUs") and performance share units ("PSUs") to certain of the Company's named executive officers and approved the performance terms for the PSUs, which are described below. The awards to the following named executive officers are set forth below:
Name | RSUs | Target PSUs | |
Year | Number | ||
Rich Williams Chief Executive Officer | 815,094 | 2018 | 543,396 (1) |
Mike Randolfi Chief Financial Officer | 283,018 | 2018 | 188,679 (2) |
Dane Drobny General Counsel and Corporate Secretary | 181,132 | 2018 | 120,754 (3) |
Brian Stevens Chief Accounting Officer and Treasurer | 93,962 | 2018 | 62,641 (4) |
(1) | An additional 367,195 target PSUs for 2018 were previously approved and disclosed. |
(2) | An additional 85,702 target PSUs for 2018 were previously approved and disclosed. |
(3) | An additional 30,992 target PSUs for 2018 were previously approved and disclosed. |
(4) | An additional 43,304 target PSUs for 2018 were previously approved and disclosed. |
The RSUs are subject to the Company's standard terms and will vest as follows:
Mr. Williams - 163,018 RSUs will vest on October 31, 2019, and 652,076 RSUs will vest annually in equal installments beginning on October 31, 2020 and ending on October 31, 2023; Mr. Randolfi - 56,603 RSUs will vest on each of March 15, 2019 and March 15, 2020, 113,208 RSUs will vest on March 15, 2021, and 56,604 RSUs will vest on March 15, 2022; Mr. Drobny - 36,226 RSUs will vest on each of March 15, 2019 and March 15, 2020, 72,453 RSUs will vest on March 15, 2021, and 36,227 RSUs will vest on March 15, 2022; and Mr. Stevens - 18,792 RSUs will vest on March 15, 2019, 37,585 RSUs will vest on March 15, 2020, 18,792 RSUs will vest on March 15, 2021, and 18,793 RSUs will vest on March 15, 2022.
All of the PSUs granted for 2018 may be earned, if at all, in an amount ranging from 0% to 200% of the target award depending on the achievement of certain levels of the following equally weighted performance measures in 2018: Net Customers, Gross Profit per Customer, and strategic goals.
The PSUs described in the table above are subject to the Company's standard terms and will vest as follows (based on, and subject in all cases to, the level of attainment of the performance goals in 2018):
Mr. Williams - 20% of the PSUs will vest on the date in the first quarter of 2019 that the Compensation Committee certifies the attainment of the performance measures (the "Initial Vesting Date"), 20% of the PSUs will vest on each of January 2, 2020, January 2, 2021, January 2, 2022, and January 2, 2023; Mr. Randolfi - 20% of the PSUs will vest on the Initial Vesting Date, 20% of the PSUs will vest on January 2, 2020, 40% of the PSUs will vest on January 2, 2021, and 20% of the PSUs will vest on January 2, 2022; Mr. Drobny - 20% of the PSUs will vest on the Initial Vesting Date, 20% of the PSUs will vest on January 2, 2020, 40% of the PSUs will vest on January 2, 2021, and 20% of the PSUs will vest on January 2, 2022; Mr. Stevens - 20% of the PSUs will vest on the Initial Vesting Date, 40% of the PSUs will vest on January 2, 2020, 20% of the PSUs will vest on January 2, 2021, and 20% of the PSUs will vest on January 2, 2022.
174
PART III
ITEM 10: DIRECTORS, EXECUTIVE OFFICERS AND CORPORATE GOVERNANCE
Information regarding the Directors of the Company is incorporated by reference from the information under the captions "Board of Directors" and "Corporate Governance at Groupon" in the Company's Proxy Statement for the 2018 Annual Meeting of Stockholders. Information regarding the Audit Committee and its Financial Experts is incorporated by reference from the information under the captions "Board Committees" and "Audit Committee Report" in the Company's Proxy Statement for the 2018 Annual Meeting of Stockholders, which will be filed with the SEC within 120 days of December 31, 2017 . Information regarding the Executive Officers of the Company can be found in Part I of this Annual Report on Form 10-K. Information regarding compliance with Section 16(a) of the Exchange Act is incorporated by reference from the information under the caption "Section 16(a) Beneficial Ownership Reporting Compliance" in the Company's Proxy Statement for the 2018 Annual Meeting of Stockholders, which will be filed with the SEC within 120 days of December 31, 2017 .
Code of Ethics
We have adopted a Code of Conduct, which is applicable to our chief executive officer, chief financial officer and other principal executive and senior financial officers. Our Code of Conduct is available through our website (www.groupon.com). Information about the Code of Conduct is incorporated by reference from the information under the caption "Corporate Governance at Groupon" in the Company's Proxy Statement for the 2018 Annual Meeting of Stockholders, which will be filed with the SEC within 120 days of December 31, 2017 . We will post any amendment to or waiver from the provisions of the Code of Conduct that applies to the above executive officers on our investor relations website (investor.groupon.com) under the caption "Corporate Governance."
ITEM 11: EXECUTIVE COMPENSATION
Incorporated by reference from the information under the captions "Named Executive Officer Compensation," "Director Compensation," "Compensation Discussion and Analysis," "Compensation Committee Interlocks and Insider Participation" and "Compensation Committee Report" in our Proxy Statement for our 2018 Annual Meeting of Stockholders, which will be filed with the SEC within 120 days of December 31, 2017 .
ITEM 12: SECURITY OWNERSHIP OF CERTAIN BENEFICIAL OWNERS AND MANAGEMENT AND RELATED STOCKHOLDER MATTERS
Incorporated by reference from the information under the captions "Information Regarding Beneficial Ownership of Principal Stockholders, Directors and Management" and "Equity Compensation Plan Information" in our Proxy Statement for our 2018 Annual Meeting of Stockholders, which will be filed with the SEC within 120 days of December 31, 2017 .
ITEM 13: CERTAIN RELATIONSHIPS AND RELATED TRANSACTIONS, AND DIRECTOR INDEPENDEDNCE
Incorporated by reference from the information under the captions "Corporate Governance at Groupon," "Board Independence" and "Certain Relationships and Related Party Transactions" in our Proxy Statement for our 2018 Annual Meeting of Stockholders, which will be filed with the SEC within 120 days of December 31, 2017 .
ITEM 14: PRINCIPAL ACCOUNTANT FEES AND SERVICES
Incorporated by reference from the information under the caption "Ratification of the Independent Registered Public Accounting Firm" in our Proxy Statement for our 2018 Annual Meeting of Stockholders, which will be filed with the SEC within 120 days of December 31, 2017 .
175
PART IV
ITEM 15: EXHIBITS AND FINANCIAL STATEMENT SCHEDULES
(1) We have filed the following documents as part of the Annual Report on Form 10-K
Groupon, Inc.
Consolidated Financial Statements
As of December 31, 2017 and 2016 and for the Years Ended December 31, 2017 , 2016 and 2015
|
Reports of Independent Registered Public Accounting Firms |
Consolidated Balance Sheets |
Consolidated Statements of Operations |
Consolidated Statements of Comprehensive Income (Loss) |
Consolidated Statements of Stockholders' Equity |
Consolidated Statements of Cash Flows |
Notes to Consolidated Financial Statements |
Monster Holdings LP
Unaudited Consolidated Financial Statements
As of December 31, 2016 and for the Year Ended December 31, 2016
|
Consolidated Balance Sheet (Unaudited) |
Consolidated Statement of Operations (Unaudited) |
Consolidated Statement of Comprehensive Loss (Unaudited) |
Consolidated Statement of Changes in Partners' Capital (Unaudited) |
Consolidated Statement of Cash Flows (Unaudited) |
Notes to Consolidated Financial Statements (Unaudited) |
Monster Holdings LP
Consolidated Financial Statements
As of December 31, 2015 and for the Period from May 27, 2015 through December 31, 2015
|
Report of Independent Auditors |
Consolidated Balance Sheet |
Consolidated Statement of Operations |
Consolidated Statement of Comprehensive Loss |
Consolidated Statement of Changes in Partners' Capital |
Consolidated Statement of Cash Flows |
Notes to Consolidated Financial Statements |
(2) Financial Statement Schedules - Groupon, Inc.
Schedule II-Valuation and Qualifying Accounts
176
| Balance at Beginning of Year |
| Charged to Expense (1) |
| Acquisitions and Other |
| Balance at End of Year | ||||
| (in thousands) | ||||||||||
TAX VALUATION ALLOWANCE: |
|
|
|
| |
|
| ||||
Year ended December 31, 2017 | 220,611 | |
| 10,476 | |
| 7,615 | |
| 238,702 | |
Year ended December 31, 2016 | 205,152 | |
| 13,797 | |
| 1,662 | |
| 220,611 | |
Year ended December 31, 2015 | 174,761 | |
| 43,782 | |
| (13,391 | ) |
| 205,152 | |
(1) | The amount charged to expense related to the income tax valuation allowance for the year ended December 31, 2017 reflects a $46.5 million expense from discontinued operations, partially offset by a $36.1 million benefit from continuing operations. The $46.5 million discontinued operations expense reflects the valuation allowance recognized against loss carryforwards relating to tax losses on the stock of subsidiaries that were divested in 2017. |
All other schedules have been omitted because they are either inapplicable or the required information has been provided in the consolidated financial statements or in the notes thereto.
(3) Exhibits
Exhibit Number |
| Description | |
2.1 | |
| Investment Agreement, dated as of April 19, 2015, among Groupon Trailblazer, Inc., Monster Partners LP and Monster Holdings LP (incorporated by reference to the Company's Current Report on Form 8-K filed April 20, 2015). |
3.1 | |
| Restated Certificate of Incorporation of the Company (incorporated by reference to the Company's Registration Statement on Form 8-A/A filed on October 31, 2016). |
3.2* | |
| Amended and Restated By-Laws. |
3.3 | |
| Amendment to the Amended and Restated By-Laws of the Company, dated as of June 10, 2016 (incorporated by reference to the Company's Current Report on Form 8-K filed on June 14, 2016). |
4.1 | |
| Specimen Stock Certificate of Common Stock (incorporated by reference to the Company's Registration Statement on Form 8-A/A filed on October 31, 2016). |
4.2 | |
| Indenture, dated as of April 4, 2016, between the Company and U.S. Bank, National Association, as trustee (incorporated by reference to the Company's Current Report on Form 8-K filed on April 4, 2016). |
10.1* | |
| 2008 Stock Option Plan.** |
10.2* | |
| Form of Notice of Grant of Stock Option under 2008 Stock Option Plan.** |
10.3* | |
| 2010 Stock Plan.** |
10.4* | |
| Form of Notice of Grant of Stock Option under 2010 Stock Plan.** |
10.5* | |
| Form of Notice of Restricted Stock Unit Award under 2010 Stock Plan.** |
10.6* | |
| Form of Indemnification Agreement.** |
10.7 | |
| Form of Notice of Restricted Stock Award under 2011 Incentive Plan (incorporated by reference to the Company's Annual Report on Form 10-K for the year ended December 31, 2012).** |
10.8 | |
| Form of Severance Benefit Agreement as entered into between Groupon, Inc. and its executive officers (incorporated by reference to the Company's Quarterly Report on Form 10-Q for the quarter ended March 31, 2017).** |
10.9 | |
| Severance Benefit Agreement, dated as of April 26, 2016, between the Company and Rich Williams (incorporated by reference to the Company's Quarterly Report on Form 10-Q for the quarter ended March 31, 2016).** |
10.10 | |
| 2011 Incentive Plan, as amended and restated effective as of October 31, 2016 (incorporated by reference to the Company's Current Report on Form 8-K filed on October 31, 2016).** |
10.11 | |
| Non-Employee Directors' Compensation Plan (incorporated by reference to the Company's Annual Report on Form 10-K for the year ended December 31, 2014).** |
10.12 | |
| Form of Notice of Performance Share Unit Award and Form of Performance Share Unit Award Agreement under 2011 Incentive Plan (incorporated by reference to the Company's Annual Report on Form 10-K for the year ended December 31, 2015). |
177
10.13 | |
| Investment Agreement, dated as of April 3, 2016, between the Company and A-G Holdings, L.P. (incorporated by reference to the Company's Current Report on Form 8-K filed on April 4, 2016). |
10.14 | |
| Voting Agreement, dated as of April 4, 2016, among the Company, A-G Holdings, L.P. and the stockholders party thereto (incorporated by reference to the Company's Current Report on Form 8-K filed on April 4, 2016). |
10.15 | |
| Amendment No. 1 to Voting Agreement, dated as of February 13, 2018, by and among Eric Lefkofsky, Green Media, LLC, Bradley Keywell, Rugger Ventures LLC, A-G Holdings, L.P., and Groupon, Inc. |
10.16 | |
| Form of Note Hedge Confirmation, dated as of May 9, 2016, between the Company and each of the counterparties thereto (incorporated by reference to the Company's Current Report on Form 8-K filed on May 9, 2016). |
10.17 | |
| Form of Warrant Confirmation, dated as of May 9, 2016, between the Company and each of the counterparties thereto (incorporated by reference to the Company's Current Report on Form 8-K filed on May 9, 2016). |
10.18 | |
| Amended and Restated Credit Agreement, dated as of June 29, 2016, among the Company, JPMorgan Chase Bank, N.A., as Administrative Agent, and the lenders party thereto (incorporated by reference to the Company's Current Report on Form 8-K filed on July 1, 2016). |
21.1 | |
| Subsidiaries of Groupon, Inc. |
23.1 | |
| Consent of Deloitte & Touche LLP |
23.2 | |
| Consent of Ernst & Young LLP |
23.3 | |
| Consent of Ernst & Young Han Young |
31.1 | |
| Certification of Chief Executive Officer pursuant to Exchange Act Rules 13a-14(a) and 15d-14(a), as adopted pursuant to Section 302 of the Sarbanes-Oxley Act of 2002 |
31.2 | |
| Certification of Chief Financial Officer pursuant to Exchange Act Rules 13a-14(a) and 15d-14(a), as adopted pursuant to Section 302 of the Sarbanes-Oxley Act of 2002 |
32.1 | |
| Certifications of Chief Executive Officer and Chief Financial Officer pursuant to 18 U.S.C. Section 1350, as adopted pursuant to Section 906 of the Sarbanes-Oxley Act of 2002 |
101.INS | |
| XBRL Instance Document |
101.SCH | |
| XBRL Taxonomy Extension Schema Document |
101.CAL | |
| XBRL Taxonomy Extension Calculation Linkbase Document |
101.DEF | |
| XBRL Taxonomy Extension Definition Linkbase Document |
101.LAB | |
| XBRL Taxonomy Extension Label Linkbase Document |
101.PRE | |
| XBRL Taxonomy Extension Presentation Linkbase Document |
_____________________________________
* Incorporated by reference to the Company's registration statement on Form S-1 (registration number 333-174661)
** Management contract or compensatory plan or arrangement.
178
SIGNATURES
Pursuant to the requirements of Section 13 or 15(d) of the Securities Exchange Act of 1934, the registrant has duly caused this report to be signed on its behalf by the undersigned, thereunto duly authorized on this 14th day of February 2018.
GROUPON, INC. | ||||
By: |
| /s/ RICH WILLIAMS | ||
|
| Name: |
| Rich Williams |
|
| Title: |
| Chief Executive Officer |
POWER OF ATTORNEY
KNOWN BY ALL PERSONS BY THESE PRESENTS, that the individuals whose signatures appear below hereby constitute and appoint Rich Williams, Michael Randolfi and Brian C. Stevens, and each of them severally, as his or her true and lawful attorneys-in-fact and agents with full power of substitution and resubstitution for him or her and in his or her name, place and stead in any and all capacities to sign any and all amendments to this Annual Report on Form 10-K and to file the same, with all exhibits thereto, and other documents in connection therewith, with the Securities and Exchange Commission, granting unto said attorneys-in-fact and agents, full power and authority to do or perform each and every act and thing requisite and necessary to be done in connection therewith, as fully to all intents and purposes as he or she might or could do in person, hereby ratifying and confirming all that said attorneys-in-fact and agents or any of them, or of his substitute or substitutes, may lawfully do to cause to be done by virtue hereof. Pursuant to the requirements of the Securities Exchange Act of 1934, this Report has been signed below by the following persons on behalf of the registrant and in the capacities indicated as of February 14, 2018.
179
Pursuant to the requirements of Section 13 or 15(d) of the Securities Exchange Act of 1934, the registrant has duly caused this report to be signed on its behalf by the undersigned, thereunto duly authorized on this 14th day of February 2018.
Signature |
| Title |
|
|
|
/s/ Rich Williams |
| Chief Executive Officer and Director (Principal Executive Officer) |
Rich Williams |
| |
/s/ Michael Randolfi |
| Chief Financial Officer (Principal Financial Officer) |
Michael Randolfi |
| |
/s/ Brian C. Stevens |
| Chief Accounting Officer and Treasurer (Principal Accounting Officer) |
Brian C. Stevens |
| |
/s/ Eric Lefkofsky |
| Director |
Eric Lefkofsky |
| |
/s/ Michael Angelakis |
| Director |
Michael Angelakis |
| |
/s/ Peter J. Barris |
| Director |
Peter J. Barris |
| |
/s/ Robert J. Bass |
| Director |
Robert J. Bass |
| |
/s/ Theodore J. Leonsis |
| Director |
Theodore J. Leonsis |
| |
/s/ Joseph Levin |
| Director |
Joseph Levin |
|
|
/s/ Deborah Wahl |
| Director |
Deborah Wahl |
| |
/s/ Ann E. Ziegler |
| Director |
Ann E. Ziegler |
| |
180