UNITED STATES SECURITIES AND EXCHANGE COMMISSION
WASHINGTON, D.C. 20549
FORM 10-Q
(Mark One)
QUARTERLY REPORT PURSUANT TO SECTION 13 OR 15(d) OF THE SECURITIES EXCHANGE ACT OF 1934
For the quarterly period ended March 31, 2017 OR |
TRANSITION REPORT PURSUANT TO SECTION 13 OR 15(d) OF THE SECURITIES EXCHANGE ACT OF 1934 |
For the transition period from ____ to ____ |
Commission file number 001-00035  GENERAL ELECTRIC COMPANY (Exact name of registrant as specified in its charter) |
New York | 14-0689340 | |
(State or other jurisdiction of incorporation or organization) | (I.R.S. Employer Identification No.) | |
| ||
41 Farnsworth Street, Boston, MA | 02210 | |
(Address of principal executive offices) | (Zip Code) | |
| ||
(Registrant's telephone number, including area code) (617) 443-3000
_______________________________________________ (Former name, former address and former fiscal year, if changed since last report) | ||
Indicate by check mark whether the registrant (1) has filed all reports required to be filed by Section 13 or 15(d) of the Securities Exchange Act of 1934 during the preceding 12 months (or for such shorter period that the registrant was required to file such reports), and (2) has been subject to such filing requirements for the past 90 days. Yes No
Indicate by check mark whether the registrant has submitted electronically and posted on its corporate Web site, if any, every Interactive Data File required to be submitted and posted pursuant to Rule 405 of Regulation S-T (§232.405 of this chapter) during the preceding 12 months (or for such shorter period that the registrant was required to submit and post such files). Yes No
Indicate by check mark whether the registrant is a large accelerated filer, an accelerated filer, a non-accelerated filer, a smaller reporting company or an emerging growth company. See the definitions of "large accelerated filer," "accelerated filer," "smaller reporting company" and "emerging growth company" in Rule 12b-2 of the Exchange Act. (Check one):
Large accelerated filer | Accelerated filer |
Non-accelerated filer | Smaller reporting company |
Emerging growth company | |
If an emerging growth company, indicate by check mark if the registrant has elected not to use the extended transition period for complying with any new or revised financial accounting standards provided pursuant to Section 13(a) of the Exchange Act . | |
Indicate by check mark whether the registrant is a shell company (as defined in Rule 12b-2 of the Exchange Act). Yes No
There were 8,683,963,000 shares of common stock with a par value of $0.06 per share outstanding at March 31, 2017.
TABLE OF CONTENTS
Page | |
Forward Looking Statements | 3 |
Management's Discussion and Analysis of Financial Condition and Results of Operations (MD&A) | 4 |
Key Performance Indicators | 8 |
Consolidated Results | 10 |
Segment Operations | 13 |
Corporate Items and Eliminations | 31 |
Discontinued Operations | 33 |
Other Consolidated Information | 34 |
Statement of Financial Position | 36 |
Financial Resources and Liquidity | 37 |
Critical Accounting Estimates | 44 |
Other Items | 45 |
Supplemental Information | 48 |
Controls and Procedures | 55 |
Other Financial Data | 56 |
Legal Proceedings | 57 |
Financial Statements and Notes | 59 |
Exhibits | 109 |
Form 10-Q Cross Reference Index | 110 |
Signatures | 111 |
FORWARD LOOKING STATEMENTS
This document contains "forward-looking statements" – that is, statements related to future, not past, events. In this context, forward-looking statements often address our expected future business and financial performance and financial condition, and often contain words such as "expect," "anticipate," "intend," "plan," "believe," "seek," "see," "will," "would," "estimate," "forecast" or "target."
Forward-looking statements by their nature address matters that are, to different degrees, uncertain, such as statements about our announced plan to combine our Oil & Gas business with Baker Hughes, including projected revenue and cost synergies, impact on our earnings per share, and the timing and structure of the proposed transaction; the completion of our announced plan to reduce the size of our financial services businesses, including expected cash and non-cash charges associated with this plan and earnings per share of GE Capital Global Holdings, LLC's (GE Capital) retained businesses (Verticals); expected income and Industrial operating profit; earnings per share, including our 2018 target; revenues; organic growth; growth and productivity associated with our Digital and Additive businesses; margins; cost structure and plans to reduce costs; restructuring charges; transaction-related synergies and gains; cash flows, including the impact of working capital, contract assets and pension funding contributions; returns on capital and investment; capital expenditures; capital allocation, including dividends, share repurchases and acquisitions; or capital structure, including leverage.
For us, particular uncertainties that could cause our actual results to be materially different than those expressed in our forward-looking statements include:
| our ability to reduce costs as we execute our announced plan to reduce the size of our financial services businesses; |
| changes in law, economic and financial conditions, including interest and exchange rate volatility, commodity and equity prices and the value of financial assets; |
| the impact of conditions in the financial and credit markets on the availability and cost of GE Capital funding, and GE Capital's exposure to counterparties; |
| pending and future mortgage loan repurchase claims, other litigation claims and the U.S. Department of Justice's investigation under the Financial Institutions Reform, Recovery and Enforcement Act of 1989 and other investigations in connection with WMC, which may affect our estimates of liability, including possible loss estimates; |
| our ability to maintain our current credit rating and the impact on our funding costs and competitive position if we do not do so; |
| our ability to convert Industrial earnings into cash and the amount and timing of our cash flows and earnings and other conditions, which may affect our ability to pay our quarterly dividend at the planned level or to repurchase shares at planned levels; |
| GE Capital's ability to pay dividends to GE at the planned level, which may be affected by GE Capital's cash flows and earnings, claims and investigations relating to WMC and other factors; |
| our ability to launch new products in a cost-effective manner; |
| our ability to increase margins through restructuring and other cost reduction measures; |
| our ability to convert pre-order commitments/wins into orders/bookings; |
| the price we realize on orders/bookings since commitments/wins are stated at list prices; |
| customer actions or developments such as early aircraft retirements or reduced energy demand, changes in economic conditions, including oil prices, and other factors that may affect the level of demand and financial performance of the major industries and customers we serve; |
| the impact of regulation and regulatory, investigative and legal proceedings and legal compliance risks, including the impact of Alstom investigative and legal proceedings; |
| our capital allocation plans, as such plans may change including with respect to the timing and size of share repurchases, acquisitions, joint ventures, dispositions and other strategic actions; |
| our success in completing, including obtaining regulatory approvals and satisfying other closing conditions for, announced transactions, such as our announced plans and transactions to combine our Oil & Gas business with Baker Hughes, to reduce the size of our financial services businesses and to sell our Water and Industrial Solutions businesses; |
| our success in integrating acquired businesses and operating joint ventures, including Baker Hughes; |
| our ability to realize revenue and cost synergies from announced transactions, acquired businesses and joint ventures, including Alstom and Baker Hughes; |
| the impact of potential information technology or data security breaches; and |
| the other factors that are described in the Risk Factors section in our Annual Report on Form 10-K for the year ended December 31, 2016. |
These or other uncertainties may cause our actual future results to be materially different than those expressed in our forward-looking statements. We do not undertake to update our forward-looking statements. This document includes certain forward-looking projected financial information that is based on current estimates and forecasts. Actual results could differ materially .
2017 1Q FORM 10-Q 3
MANAGEMENT'S DISCUSSION AND ANALYSIS OF FINANCIAL CONDITION AND RESULTS OF OPERATIONS (MD&A)
PRESENTATION
The consolidated financial statements of General Electric Company (the Company) combine the industrial manufacturing and services businesses of General Electric Company (GE) with the financial services businesses of GE Capital Global Holdings, LLC (GE Capital or Financial Services) and its predecessor, General Electric Capital Corporation.
We believe that investors will gain a better understanding of our company if they understand how we measure and talk about our results. Because of the diversity in our businesses, we present our financial statements in a three-column format, which allows investors to see our industrial operations separately from our Financial Services operations. We believe that this provides useful information to investors. When used in this report, unless otherwise indicated by the context, we use the terms to mean the following:
| General Electric or the Company – the parent company, General Electric Company. |
| GE – the adding together of all affiliates except GE Capital, whose continuing operations are presented on a one-line basis, giving effect to the elimination of transactions among such affiliates. Transactions between GE and GE Capital have not been eliminated at the GE level. We present the results of GE in the center column of our consolidated statements of earnings, financial position and cash flows. An example of a GE metric is GE cash from operating activities (GE CFOA). |
| General Electric Capital Corporation or GECC – predecessor to GE Capital Global Holdings, LLC. |
| GE Capital Global Holdings, LLC or GECGH – the adding together of all affiliates of GECGH, giving effect to the elimination of transactions among such affiliates. |
| GE Capital or Financial Services – refers to GECGH, or its predecessor GECC, and is the adding together of all affiliates of GE Capital giving effect to the elimination of transactions among such affiliates. We present the results of GE Capital in the right-side column of our consolidated statements of earnings, financial position and cash flows. |
| GE consolidated – the adding together of GE and GE Capital, giving effect to the elimination of transactions between the two. We present the results of GE consolidated in the left-side column of our consolidated statements of earnings, financial position and cash flows. |
| Industrial – GE excluding the continuing operations of GE Capital. We believe that this provides investors with a view as to the results of our industrial businesses and corporate items. An example of an Industrial metric is Industrial CFOA (Non-GAAP), which is GE CFOA excluding the effects of dividends from GE Capital. |
| Industrial segment – the sum of our seven industrial reporting segments, without giving effect to the elimination of transactions among such segments and between these segments and our Financial Services segment. This provides investors with a view as to the results of our industrial segments, without inter-segment eliminations and corporate items. An example of an industrial segment metric is industrial segment revenue growth. |
| Total segment – the sum of our seven industrial segments and one financial services segment, without giving effect to the elimination of transactions between such segments. This provides investors with a view as to the results of all of our segments, without inter-segment eliminations and corporate items. |
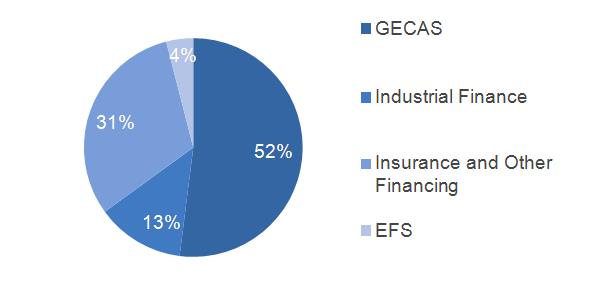
| Verticals or GE Capital Verticals – the adding together of GE Capital businesses that we expect to retain, principally its vertical financing businesses-GE Capital Aviation Services (GECAS), Energy Financial Services (EFS) and Industrial Finance (which includes Healthcare Equipment Finance, Working Capital Solutions and Industrial Financing Solutions)-that relate to the Company's core industrial domain and other operations, including our run-off insurance activities, and allocated corporate costs. |
We integrate acquisitions as quickly as possible. Revenues and earnings from the date we complete the acquisition through the end of the fourth quarter following the acquisition are considered the acquisition effect of such businesses.
2017 1Q FORM 10-Q 4
Discussion of GE Capital's total assets includes deferred income tax liabilities, which are presented within assets for purposes of our consolidated statement of financial position presentations for this filing.
Amounts reported in billions in graphs within this report are computed based on the amounts in millions. As a result, the sum of the components reported in billions may not equal the total amount reported in billions due to rounding. Certain columns and rows within the tables may not add due to the use of rounded numbers. Percentages presented are calculated from the underlying numbers in millions.
Discussions throughout this MD&A are based on continuing operations unless otherwise noted.
The MD&A should be read in conjunction with the Financial Statements and Notes to the consolidated financial statements.
OTHER TERMS USED BY GE
| Backlog – unfilled customer orders for products and product services (expected life of contract sales for product services). |
| Continuing earnings – unless otherwise indicated, we refer to the caption "earnings from continuing operations attributable to GE common shareowners" as continuing earnings or simply as earnings. |
| Continuing earnings per share (EPS) – unless otherwise indicated, when we refer to continuing earnings per share, it is the diluted per-share amount of "earnings from continuing operations attributable to GE common shareowners". |
| Digital revenues – revenues related to internally developed software and associated hardware, including Predix TM and software solutions that improve our customers' asset performance. In 2016, we reassessed the span of our digital product offerings, which now excludes software-enabled product upgrades. These revenues are largely generated from our operating businesses and are included in their segment results. Revenues of "Non-GE Verticals" refer to GE Digital revenues from customers operating in industries where GE does not have a presence. |
| Equipment leased to others (ELTO) – rental equipment we own that is available to rent and is stated at cost less accumulated depreciation. |
| GE Capital Exit Plan – our plan, announced on April 10, 2015, to reduce the size of our financial services businesses through the sale of most of the assets of GE Capital, and to focus on continued investment and growth in our industrial businesses. |
| Industrial margin – GE revenues and other income excluding GE Capital earnings (loss) from continuing operations (Industrial revenues) minus GE total costs and expenses less GE interest and other financial charges divided by Industrial revenues. |
| Industrial operating profit margin (Non-GAAP) – Industrial segment profit plus corporate items and eliminations (excluding gains, restructuring, and non-operating pension cost) divided by industrial segment revenues plus corporate items and eliminations (excluding gains and GE-GE Capital eliminations). |
| Industrial segment gross margin – industrial segment sales less industrial segment cost of sales. |
| Net earnings – unless otherwise indicated, we refer to the caption "net earnings attributable to GE common shareowners" as net earnings. |
| Net earnings per share (EPS) – unless otherwise indicated, when we refer to net earnings per share, it is the diluted per-share amount of "net earnings attributable to GE common shareowners". |
| Non-operating pension cost (Non-GAAP) – comprises the expected return on plan assets, interest cost on benefit obligations and net actuarial gain (loss) amortization for our principal pension plans. |
| Operating earnings (Non-GAAP) – GE earnings from continuing operations attributable to common shareowners excluding the impact of non-operating pension costs. |
| Operating earnings per share (Non-GAAP) – unless otherwise indicated, when we refer to operating earnings per share, it is the diluted per-share amount of "operating earnings". |
| Operating pension cost (Non-GAAP) – comprises the service cost of benefits earned, prior service cost amortization and curtailment gain (loss) for our principal pension plans. |
| Organic revenues (Non-GAAP) – revenues excluding the effects of acquisitions, dispositions and translational foreign currency exchange. |
2017 1Q FORM 10-Q 5
| Product services – for purposes of the financial statement display of sales and costs of sales in our Statement of Earnings, "goods" is required by SEC regulations to include all sales of tangible products, and "services" must include all other sales, including other services activities. In our MD&A section of this report, we refer to sales under product services agreements and sales of both goods (such as spare parts and equipment upgrades) and related services (such as monitoring, maintenance and repairs) as sales of "product services," which is an important part of our operations. We refer to "product services" simply as "services" within the MD&A. |
| Product services agreements – contractual commitments, with multiple-year terms, to provide specified services for products in our Power, Renewable Energy, Oil & Gas, Aviation and Transportation installed base – for example, monitoring, maintenance, service and spare parts for a gas turbine/generator set installed in a customer's power plant. |
| Revenues – unless otherwise indicated, we refer to captions such as "revenues and other income" simply as revenues. |
| Segment profit – refers to the operating profit of the industrial segments and the net earnings of the Financial Services segment. See the Segment Operations section within the MD&A for a description of the basis for segment profits. |
NON-GAAP FINANCIAL MEASURES
In the accompanying analysis of financial information, we sometimes use information derived from consolidated financial data but not presented in our financial statements prepared in accordance with U.S. generally accepted accounting principles (GAAP). Certain of these data are considered "non-GAAP financial measures" under the SEC rules. Specifically, we have referred, in various sections of this report, to:
| Industrial segment organic revenues |
| Operating and non-operating pension cost |
| Adjusted corporate costs (operating) |
| Industrial operating and GE Capital earnings (loss) from continuing operations and EPS |
| Industrial operating + Verticals earnings and EPS |
| Industrial operating profit and operating profit margin (excluding certain items) |
| Industrial cash flows from operating activities (Industrial CFOA) |
The reasons we use these non-GAAP financial measures and the reconciliations to their most directly comparable GAAP financial measures are included in the Supplemental Information section within the MD&A. Non-GAAP financial measures referred to in this report are either labeled as "non-GAAP" or designated as such with an asterisk (*).
2017 1Q FORM 10-Q 6
OUR OPERATING SEGMENTS
We are a global digital industrial company, transforming industry with software-defined machines and solutions that are connected, responsive and predictive, with products and services ranging from aircraft engines, locomotives, power generation and oil and gas production equipment to medical imaging, financing and industrial products. Operational and financial overviews for our operating segments are provided in the "Segment Operations" section within this MD&A.
OUR INDUSTRIAL OPERATING SEGMENTS
 | Power |  | Aviation |  | Energy Connections & Lighting (a) |
 | Renewable Energy |  | Healthcare | ||
 | Oil & Gas |  | Transportation |
OUR FINANCIAL SERVICES OPERATING SEGMENT
 | Capital |
(a) | Beginning in the third quarter of 2016, the former Energy Connections and Appliances & Lighting segments are presented as one reporting segment called Energy Connections & Lighting. This segment includes the historical results of the Appliances business prior to its sale. |
CORPORATE INFORMATION
GE's Internet address a t www.ge.com , Investor Relations website at www.ge.com/investor-relations and our corporate blog at www.gereports.com , as well as GE's Facebook page and Twitter accounts and other social media, including @GE_Reports, contain a significant amount of information about GE, including financial and other information for investors. GE encourages investors to visit these websites from time to time, as information is updated and new information is posted.
2017 1Q FORM 10-Q 7
KEY PERFORMANCE INDICATORS
(Dollars in billions; per-share amounts in dollars)
REVENUES PERFORMANCE |
GE CFOA | |||||
 |
 |
GE Capital Dividend
Industrial CFOA* | ||||
INDUSTRIAL ORDERS |
INDUSTRIAL BACKLOG | |||||
 |
Equipment
Services |
 |
Equipment
Services
| |||
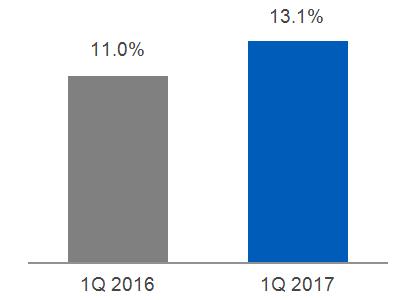
INDUSTRIAL PROFIT & MARGINS | INDUSTRIAL OPERATING PROFIT & MARGINS (NON-GAAP) (a) | |||||
 |
 |
 |
 | |||
(a) Excluded gains on disposals, non-operating pension cost, restructuring and other charges, and noncontrolling interests | ||||||
* Non-GAAP Financial Measure
2017 1Q FORM 10-Q 8
KEY PERFORMANCE INDICATORS
(Dollars in billions; per-share amounts in dollars and diluted; attributable to GE common shareowners)
NET EARNINGS (LOSS) |
NET EARNINGS (LOSS) PER SHARE | |
 |
| |
OPERATING EARNINGS (NON-GAAP) |
OPERATING EARNINGS PER SHARE (NON-GAAP) | |
 |
 | |
INDUSTRIAL OPERATING + VERTICALS EARNINGS (NON-GAAP) |
INDUSTRIAL OPERATING + VERTICALS EPS (NON-GAAP) | |
 |
 |
2017 1Q FORM 10-Q 9
CONSOLIDATED RESULTS
SIGNIFICANT DEVELOPMENTS IN 2017 |
Our consolidated results for 2017 were significantly affected by recent portfolio changes, including the 2015 acquisition of Alstom, the disposal of financial services businesses under the GE Capital Exit Plan initiated in 2015 and the 2016 sale of our Appliances business.
|
2017 SIGNIFICANT TRANSACTIONS Transactions completed in 2017 included the following:
On January 10, 2017, we completed the acquisition of ServiceMax, a leader in cloud-based field service management (FSM) solutions, for $0.9 billion, net of cash acquired. This acquisition is expected to provide enhanced capabilities to advance our Industrial Internet vision, enabling customers to immediately gain more value from their assets and find greater efficiency in their field service processes. On April 20, 2017, we completed the acquisition of LM Wind Power, one of the world's largest wind turbine blade manufacturers for an estimated $1.7 billion.
PLANNED TRANSACTIONS We also announced a number of strategic transactions that we expect to complete in 2017, including the following:
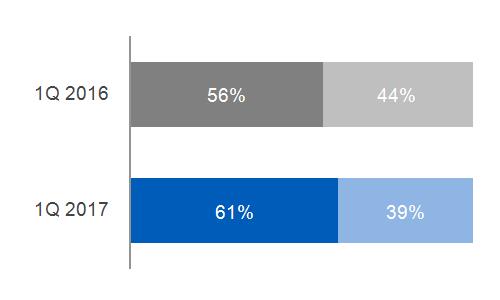
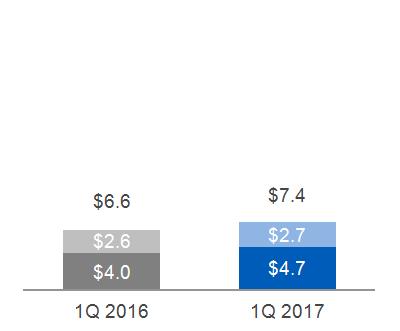
In October 2016, we announced an agreement with Baker Hughes Incorporated (Baker Hughes) to combine our Oil & Gas business and Baker Hughes to create a new company in which GE will hold a 62.5% interest and existing Baker Hughes shareholders will hold a 37.5% interest. Baker Hughes shareholders will also receive a cash dividend funded by a $7.4 billion cash contribution from GE. The transaction is subject to the approval of Baker Hughes shareholders, regulatory approvals and other customary closing conditions. The deal is expected to close mid-2017. In October 2016, we announced our plan to sell our Water & Process Technologies business. In March 2017, we announced an agreement to sell the business for approximately $3.4 billion to Suez Environnement S.A. (Suez), a French-based utility company operating primarily in the water treatment and waste management sectors. The deal is expected to close mid-2017, subject to customary closing conditions and regulatory approval. I n the first quarter of 2017, we classified our Industrial Solutions business within our Energy Connections & Lighting segment as held for sale. We expect to complete the sale of the business within the next twelve months. |
2017 1Q FORM 10-Q 10
CONSOLIDATED RESULTS
THREE MONTHS ENDED MARCH 31
(Dollars in billions)
REVENUES |
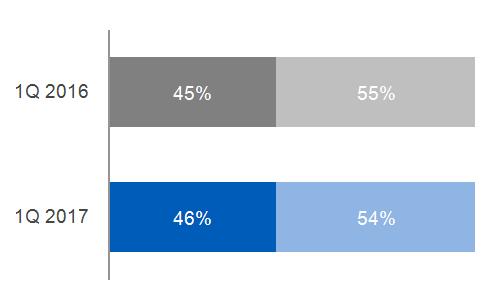
INDUSTRIAL AND FINANCIAL SERVICES REVENUES | ||
 |  |
 | |
COMMENTARY: 2017 - 2016 | ||
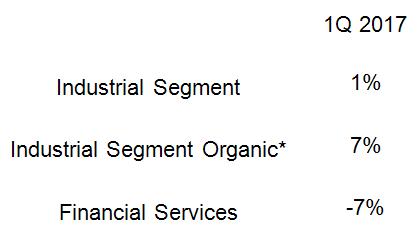
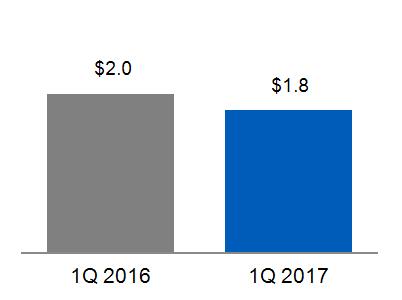
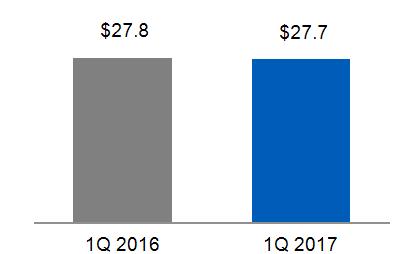
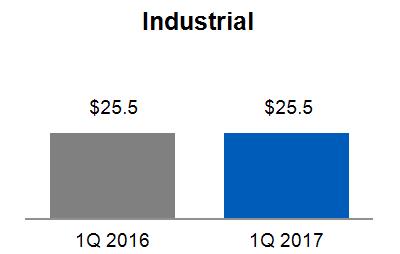
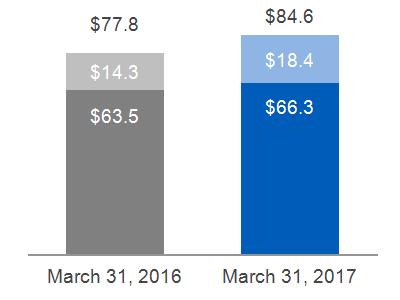
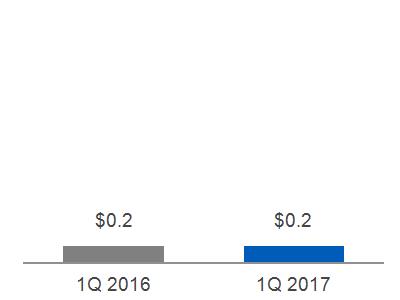
Consolidated revenues decreased $0.2 billion, or 1%. Industrial revenues remained flat due to an increase in industrial segment revenues of approximately $0.1 billion, offset by a decrease at Corporate of $0.1 billion. Industrial segment revenues increased as organic revenue* increases ($1.7 billion) and the net effects of acquisitions ($0.1 billion) were partially offset by the net effects of dispositions ($1.5 billion) and the effects of a stronger U.S. dollar ($0.1 billion). In the first quarter of 2016, the net effects of acquisitions increased industrial revenues $2.8 billion while the net effects of dispositions and a stronger U.S. dollar decreased industrial revenues $0.5 billion and $0.5 billion, respectively. Financial Services revenues decreased by $0.2 billion, or 7%, primarily due to organic revenue declines and lower gains, partially offset by lower impairments.
| ||
*Non-GAAP Financial Measure
2017 1Q FORM 10-Q 11
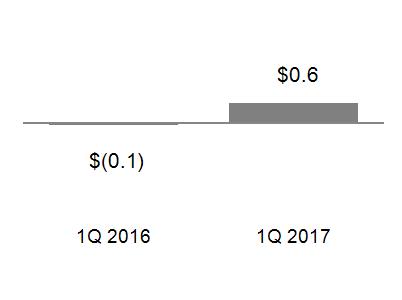
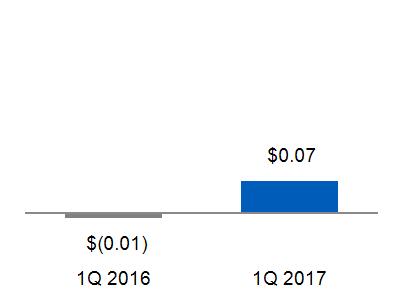
THREE MONTHS ENDED MARCH 31
(Dollars in billions; attributable to GE common shareowners)
CONTINUING EARNINGS (LOSS) |
OPERATING EARNINGS (LOSS)* | |
 |  |
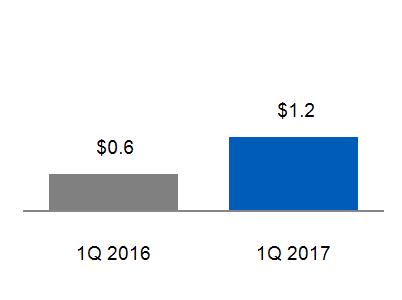
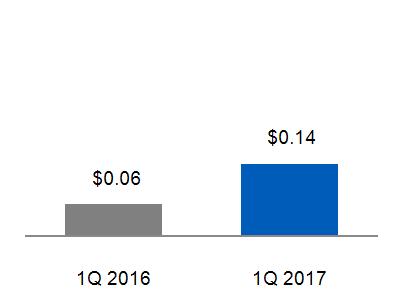
COMMENTARY: 2017 - 2016 |
Consolidated earnings increased $0.6 billion. Financial Services losses decreased $0.8 billion, or 95%, primarily due to lower treasury operation expenses, lower preferred dividend expenses, and lower restructuring expenses associated with the GE Capital Exit Plan. Industrial earnings decreased $0.1 billion, or 3%, due to increased Corporate restructuring charges of $0.3 billion and decreased gains of $0.1 billion, partially offset by an increase in industrial segment profit of $0.3 billion. Industrial segment profit increased $0.3 billion, or 9%, as organic operating increases ($0.5 billion) were partially offset by the net effects of dispositions ($0.1 billion). The net effect of acquisitions on our consolidated operating earnings was an insignificant amount in 2017 and 2016. The net effect of dispositions on consolidated net earnings was a loss of $0.1 billion in 2017 and an insignificant amount in 2016. Foreign exchange adversely affected industrial operating earnings by $0.1 billion as a result of both translational and transactional impacts related to remeasurement and mark-to-market charges on open hedges. Earnings per share amounts for the first quarter of 2017 were positively impacted by the reduction in number of outstanding common shares compared to the first quarter of 2016. The average number of shares outstanding used to calculate first quarter 2017 earnings per share was 6% lower than in the first quarter of 2016 as a result of previously disclosed actions, primarily ongoing share buyback activities over the last 12 months funded in large part by dividends from GE Capital. |
*Non-GAAP Financial Measure
2017 1Q FORM 10-Q 12
SEGMENT OPERATIONS
SUMMARY OF OPERATING SEGMENTS | ||||||||
Three months ended March 31 | ||||||||
(In millions) | 2017 | 2016 | V% | |||||
Revenues | ||||||||
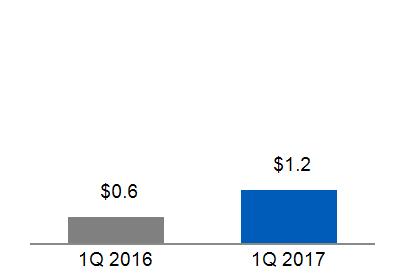
Power | $ | 6,089 | $ | 5,204 | 17 % | |||
Renewable Energy | 2,044 | 1,669 | 22 % | |||||
Oil & Gas | 3,001 | 3,314 | (9)% | |||||
Aviation | 6,804 | 6,262 | 9 % | |||||
Healthcare | 4,291 | 4,183 | 3 % | |||||
Transportation | 1,039 | 981 | 6 % | |||||
Energy Connections & Lighting(a) | 2,747 | 4,256 | (35)% | |||||
Total industrial segment revenues | 26,016 | 25,869 | 1 % | |||||
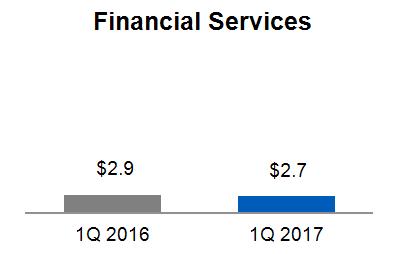
Capital | 2,681 | 2,885 | (7)% | |||||
Total segment revenues | 28,697 | 28,754 | - % | |||||
Corporate items and eliminations | (1,037) | (909) | ||||||
Consolidated revenues | $ | 27,660 | $ | 27,845 | (1)% | |||
Segment profit (loss) | ||||||||
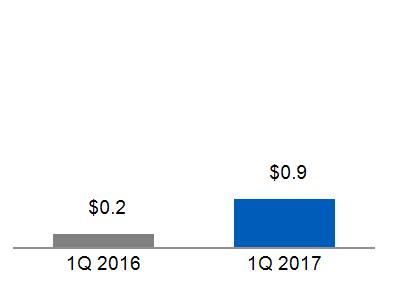
Power | $ | 797 | $ | 573 | 39 % | |||
Renewable Energy | 107 | 83 | 29 % | |||||
Oil & Gas | 207 | 308 | (33)% | |||||
Aviation | 1,684 | 1,524 | 10 % | |||||
Healthcare | 643 | 631 | 2 % | |||||
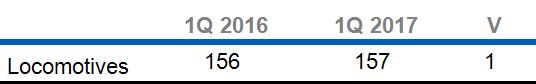
Transportation | 156 | 164 | (5)% | |||||
Energy Connections & Lighting(a) | 28 | 31 | (10)% | |||||
Total industrial segment profit | 3,622 | 3,314 | 9 % | |||||
Capital | (47) | (892) | 95 % | |||||
Total segment profit (loss) | 3,575 | 2,422 | 48 % | |||||
Corporate items and eliminations | (2,009) | (1,571) | ||||||
GE interest and other financial charges | (564) | (440) | ||||||
GE provision for income taxes | (143) | (164) | ||||||
Earnings (loss) from continuing operations attributable to GE common shareowners | 858 | 248 | F | |||||
Earnings (loss) from discontinued operations, net of taxes | (239) | (308) | 22 % | |||||
Less net earnings attributable to | ||||||||
noncontrolling interests, discontinued operations | - | - | - % | |||||
Earnings (loss) from discontinued operations, | ||||||||
net of tax and noncontrolling interest | (239) | (309) | 23 % | |||||
Consolidated net earnings (loss) | ||||||||
attributable to GE common shareowners | $ | 619 | $ | (61) | F | |||
\ | ||||||||
| (a) | Beginning in the third quarter of 2016, the former Energy Connections and Appliances & Lighting segments are presented as one reporting segment called Energy Connections & Lighting. This segment includes the historical results of the Appliances business prior to its sale in June 2016. |
2017 1Q FORM 10-Q 13
REVENUES AND PROFIT
Segment revenues include revenues and other income related to the segment.
Segment profit is determined based on internal performance measures used by the Chief Executive Officer (CEO) to assess the performance of each business in a given period. In connection with that assessment, the CEO may exclude matters, such as charges for restructuring, rationalization and other similar expenses, acquisition costs and other related charges, technology and product development costs, certain gains and losses from acquisitions or dispositions, and litigation settlements or other charges, for which responsibility preceded the current management team. See the Corporate Items and Eliminations section within this MD&A for additional information about costs excluded from segment profit.
Segment profit excludes results reported as discontinued operations and material accounting changes. Segment profit also excludes the portion of earnings or loss attributable to noncontrolling interests of consolidated subsidiaries, and as such only includes the portion of earnings or loss attributable to our share of the consolidated earnings or loss of consolidated subsidiaries.
Segment profit excludes or includes interest and other financial charges, income taxes, and preferred stock dividends according to how a particular segment's management is measured:
| Interest and other financial charges, income taxes and GE preferred stock dividends are excluded in determining segment profit (which we sometimes refer to as "operating profit") for the industrial segments. |
| Interest and other financial charges, income taxes and GE Capital preferred stock dividends are included in determining segment profit (which we sometimes refer to as "net earnings") for the Capital segment. |
Certain corporate costs, such as shared services, employee benefits, and information technology, are allocated to our segments based on usage. A portion of the remaining corporate costs is allocated based on each segment's relative net cost of operations.
With respect to the segment revenue and profit walks, the overall effect of foreign exchange is included within multiple captions as follows:
| The translational foreign exchange impact is included within Foreign Exchange. |
| The transactional impact of foreign exchange hedging is included in operating cost within Productivity and in other income within Other. |
SIGNIFICANT SEGMENT DEVELOPMENTS
SALE OF APPLIANCES
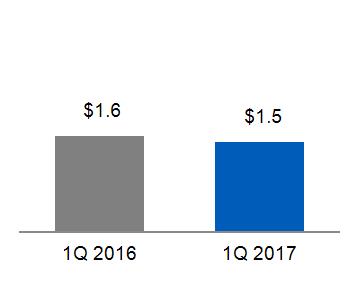
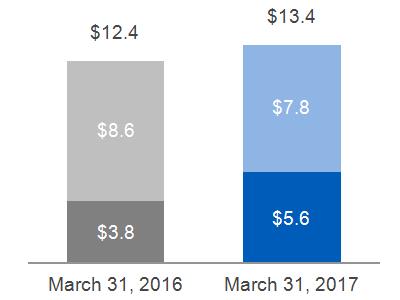
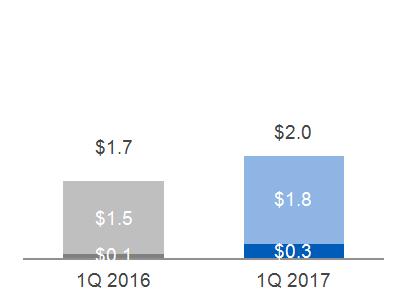
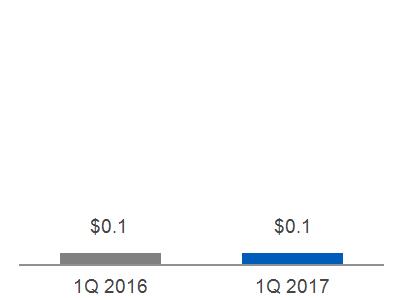
On January 15, 2016, we announced the signing of an agreement to sell our Appliances business to Haier. On June 6, 2016, we completed the sale for proceeds of $5.6 billion (including $0.8 billion from the sale of receivables originated in our Appliances business and sold from GE Capital to Haier) and recognized an after-tax gain of $1.8 billion in 2016. For the three months ended March 31, 2016, Appliances contributed revenues of $1.5 billion and an operating profit of $0.1 billion.
2017 1Q FORM 10-Q 14
SEGMENT RESULTS – THREE MONTHS ENDED MARCH 31
(Dollars in billions)
INDUSTRIAL SEGMENT EQUIPMENT & SERVICES REVENUES |
INDUSTRIAL SEGMENT PROFIT | |
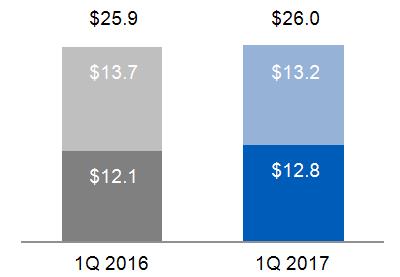 |
Equipment
Services | 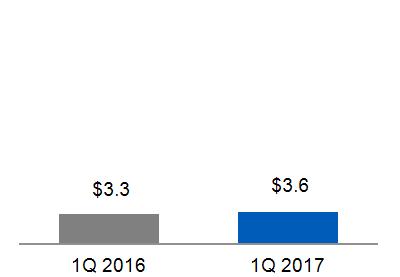 |
2017 – 2016 COMMENTARY |
Industrial segment revenues increased $0.1 billion, or 1%, driven primarily by increases at Power, Renewable Energy and Aviation, partially offset by a decrease at Energy Connections & Lighting primarily due to the sale of the Appliances business in the second quarter of 2016, a decrease at Oil & Gas primarily due to market conditions, and an unfavorable foreign exchange impact. Industrial segment profit increased $0.3 billion, or 9%, driven primarily by higher earnings at Power and Aviation, partially offset by lower earnings at Oil & Gas as well as an unfavorable foreign exchange impact. Industrial segment margin increased 110 bps to 13.9% in 2017 from 12.8% in 2016 d riven by higher cost productivity and simplification, partially offset by negative business mix and the effects of inflation. The increase in industrial segment margin reflects increases at Power, Aviation and Energy Connections & Lighting, offset by decreases at Oil & Gas and Transportation. |
2017 1Q FORM 10-Q 15
 POWER
POWER OPERATIONAL OVERVIEW
(Dollars in billions)
2017 YTD SUB-SEGMENT REVENUES | EQUIPMENT/SERVICES REVENUES | |||
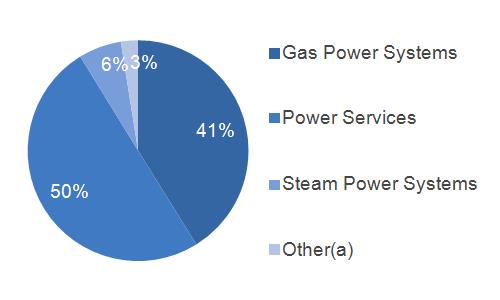 | 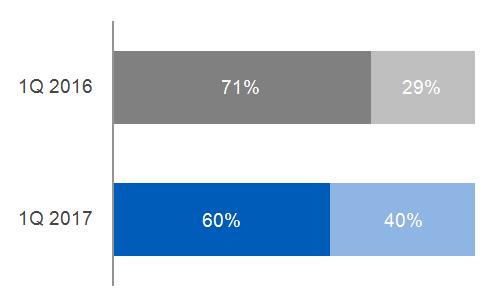 | |||
| (a) Includes Water & Process Technologies, Distributed Power and GE Hitachi Nuclear | Services Equipment
| |||
ORDERS | BACKLOG | |||
|
Equipment
Services
|
 |
Equipment
Services
| |
UNIT SALES | ||||
 | ||||
2017 1Q FORM 10-Q 16
FINANCIAL OVERVIEW
(Dollars in billions)
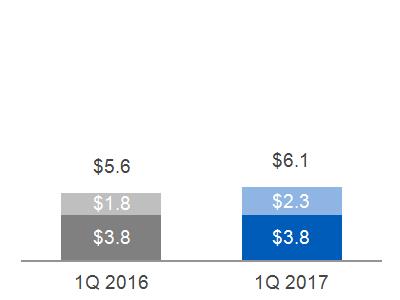
SEGMENT REVENUES | SEGMENT PROFIT | SEGMENT PROFIT MARGIN | ||
 |
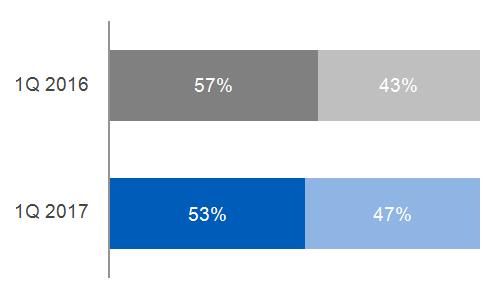
Equipment
Services | 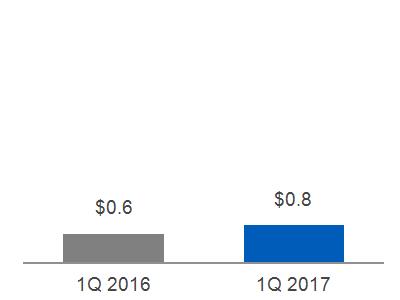
|  |
SEGMENT REVENUES & PROFIT WALK: | COMMENTARY: 2017 - 2016 | |||||
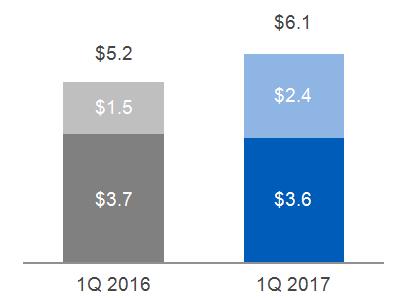
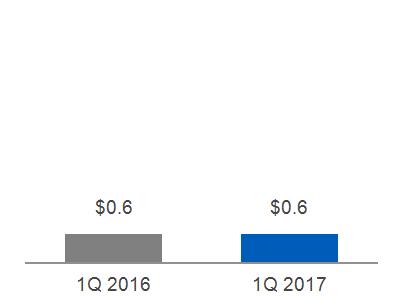
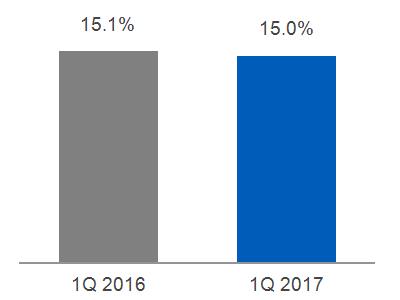
Segment revenues up $0.9 billion (17%); Segment profit up $0.2 billion (39%):
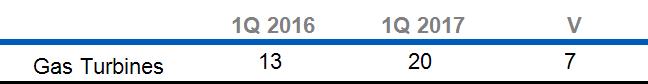
The increase in revenues was driven by higher equipment volume, primarily at Gas Power Systems as a result of 7 more gas turbine shipments and 23 more Heat Recovery Steam Generator shipments than in the prior year. The increase in revenues was partially offset by the effects of a stronger U.S. dollar versus the Euro. The increase in profit was due to higher cost productivity on higher volume, partially offset by an unfavorable business mix due to higher equipment volume versus services volume. | ||||||
Revenues | Profit | |||||
March 31, 2016 | $ | 5.2 | $ | 0.6 | ||
Volume | 0.9 | 0.1 | ||||
Price | - | - | ||||
Foreign Exchange | (0.1) | - | ||||
(Inflation)/Deflation | N/A | - | ||||
Mix | N/A | (0.2) | ||||
Productivity | N/A | 0.3 | ||||
Other | - | - | ||||
March 31, 2017 | $ | 6.1 | $ | 0.8 | ||
2017 1Q FORM 10-Q 17
 RENEWABLE ENERGY
 OPERATIONAL OVERVIEW
(Dollars in billions)
2017 YTD SUB-SEGMENT REVENUES | EQUIPMENT/SERVICES REVENUES | |||
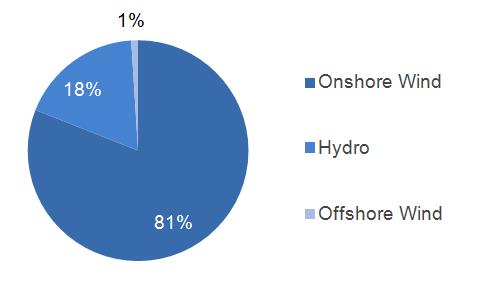
|
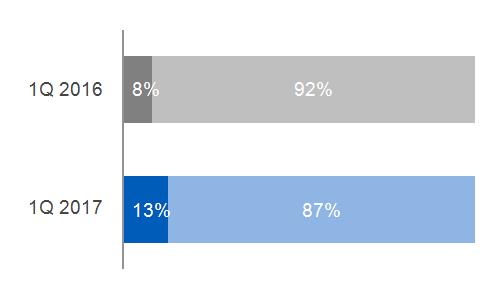 | |||
Services Equipment
| ||||
ORDERS | BACKLOG | |||
|
Equipment
Services |
|
Equipment
Services | |
UNIT SALES | ||||
 | ||||
2017 1Q FORM 10-Q 18
FINANCIAL OVERVIEW
(Dollars in billions)
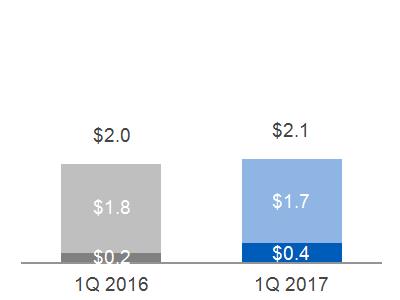
SEGMENT REVENUES | SEGMENT PROFIT | SEGMENT PROFIT MARGIN | ||
 |
Equipment
Services
|  |  |
SEGMENT REVENUES & PROFIT WALK: | COMMENTARY: 2017 - 2016 | |||||
Segment revenues up $0.4 billion (22%); Segment profit up 29%:
The increase in revenues was primarily driven by higher volume due to higher equipment sales at Hydro and increased repowering projects at Onshore Wind, partially offset by 101 fewer wind turbine shipments than in the prior year. Revenue also increased due to the effects of a weaker U.S. dollar versus the Brazilian Real and increased other income including a favorable foreign exchange transactional impact. The increase in profit was due to material deflation and increased other income including a favorable foreign exchange transactional impact. These increases were partially offset by lower cost productivity.
| ||||||
Revenues | Profit | |||||
March 31, 2016 | $ | 1.7 | $ | 0.1 | ||
Volume | 0.3 | - | ||||
Price | - | - | ||||
Foreign Exchange | 0.1 | - | ||||
(Inflation)/Deflation | N/A | 0.1 | ||||
Mix | N/A | - | ||||
Productivity | N/A | (0.1) | ||||
Other | 0.1 | 0.1 | ||||
March 31, 2017 | $ | 2.0 | $ | 0.1 | ||
2017 1Q FORM 10-Q 19
 OIL & GAS
 OPERATIONAL OVERVIEW
(Dollars in billions)
2017 YTD SUB-SEGMENT REVENUES | EQUIPMENT/SERVICES REVENUES | |||
 |
 | |||
Services Equipment
| ||||
ORDERS | BACKLOG | |||
|
Equipment Services |
|
Equipment
Services | |
2017 1Q FORM 10-Q 20
FINANCIAL OVERVIEW
(Dollars in billions)
SEGMENT REVENUES | SEGMENT PROFIT | SEGMENT PROFIT MARGIN | ||
 |
Equipment
Services
|  |  |
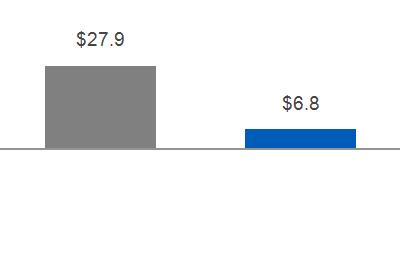
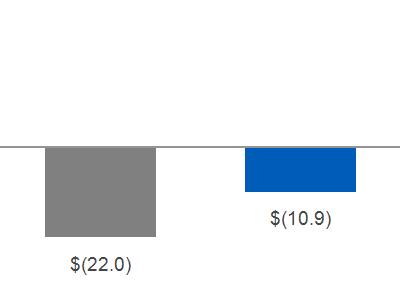
SEGMENT REVENUES & PROFIT WALK: | COMMENTARY: 2017 - 2016 | |||||
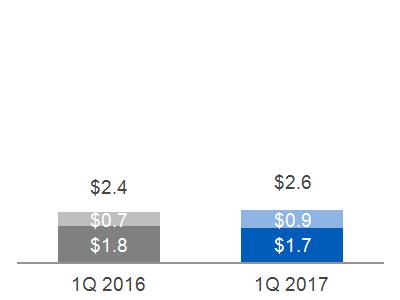
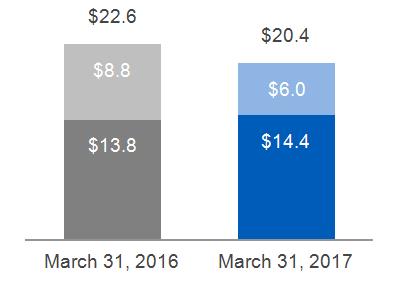
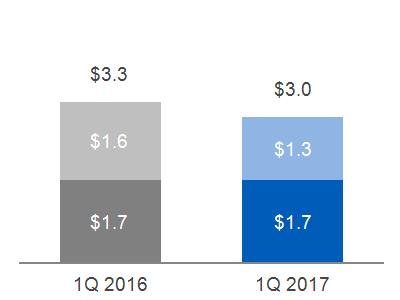
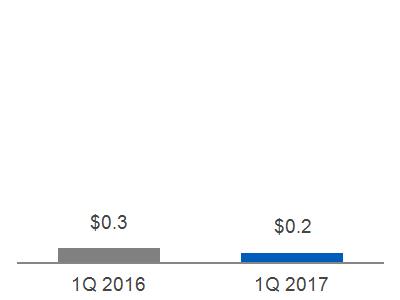
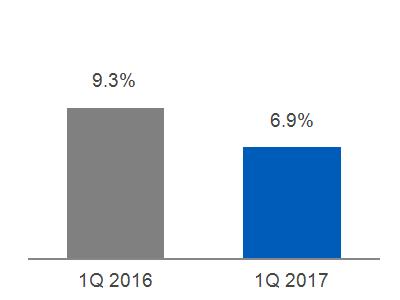
Segment revenues down $0.3 billion (9%); Segment profit down $0.1 billion (33%):
The decrease in revenues was primarily driven by negative market conditions which resulted in lower equipment volume across all sub-segments. Revenues also decreased due to lower prices. The decrease in operating profit was primarily market driven resulting in lower prices and volume. Despite the effects of restructuring actions and an increase in earnings in our long-term service contracts, profit also decreased due to lower cost productivity. | ||||||
Revenues | Profit | |||||
March 31, 2016 | $ | 3.3 | $ | 0.3 | ||
Volume | (0.2) | - | ||||
Price | (0.1) | (0.1) | ||||
Foreign Exchange | - | - | ||||
(Inflation)/Deflation | N/A | - | ||||
Mix | N/A | - | ||||
Productivity | N/A | - | ||||
Other | - | - | ||||
March 31, 2017 | $ | 3.0 | $ | 0.2 | ||
2017 1Q FORM 10-Q 21
 AVIATION
 OPERATIONAL OVERVIEW
(Dollars in billions)
2017 YTD SUB-SEGMENT REVENUES | EQUIPMENT/SERVICES REVENUES | |||
 |  | |||
Services Equipment
| ||||
ORDERS | BACKLOG | |||
 |
Equipment Services |
 |
Equipment
Services | |
UNIT SALES | ||||
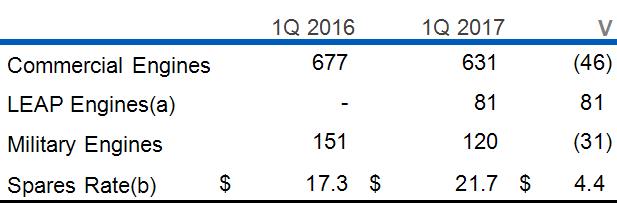 (a) LEAP engines are a subset of commercial engines (b) Commercial externally shipped spares and spares used in time & material shop visits in millions of dollars per day | ||||
2017 1Q FORM 10-Q 22
FINANCIAL OVERVIEW
(Dollars in billions)
SEGMENT REVENUES | SEGMENT PROFIT | SEGMENT PROFIT MARGIN | ||
 |
Equipment
Services
|
 |
 |
SEGMENT REVENUES & PROFIT WALK: | COMMENTARY: 2017 - 2016 | |||||
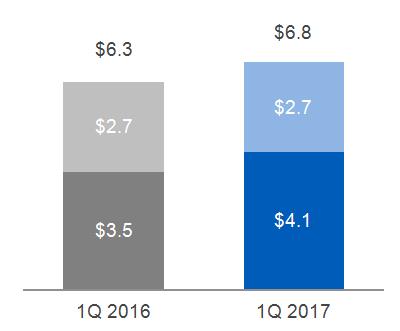
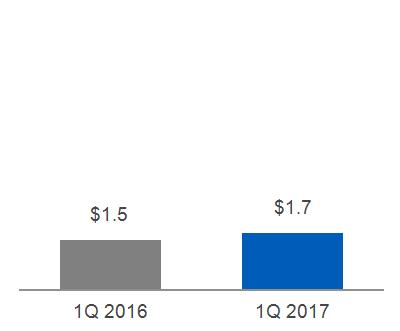
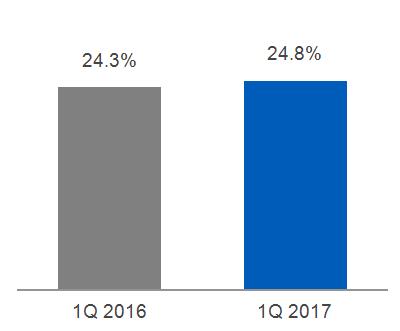
Segment revenues up $0.5 billion (9%); Segment profit up $0.2 billion (10%):
The increase in revenues was primarily due to higher services volume including an increase in the commercial spares shipment rate as well as military spares shipments. Equipment revenue decreased slightly due to 31 fewer Military engine shipments than in the prior year. This was partially offset by higher valued commercial shipments including 81 more LEAP and 16 more GEnx engine shipments than in the prior year. The increase in profit was mainly due to higher services volume and higher prices, partially offset by the unfavorable effects of inflation. | ||||||
Revenues | Profit | |||||
March 31, 2016 | $ | 6.3 | $ | 1.5 | ||
Volume | 0.5 | 0.1 | ||||
Price | 0.1 | 0.1 | ||||
Foreign Exchange | - | - | ||||
(Inflation)/Deflation | N/A | (0.1) | ||||
Mix | N/A | - | ||||
Productivity | N/A | - | ||||
Other | - | - | ||||
March 31, 2017 | $ | 6.8 | $ | 1.7 | ||
2017 1Q FORM 10-Q 23
 HEALTHCARE
 OPERATIONAL OVERVIEW
(Dollars in billions)
2017 YTD SUB-SEGMENT REVENUES | EQUIPMENT/SERVICES REVENUES | |||
 |  | |||
Services Equipment
| ||||
ORDERS | BACKLOG | |||
 |
Equipment Services |
 |
Equipment
Services | |
2017 1Q FORM 10-Q 24
FINANCIAL OVERVIEW
(Dollars in billions)
SEGMENT REVENUES | SEGMENT PROFIT | SEGMENT PROFIT MARGIN | ||
|
Equipment
Services
|  |  |
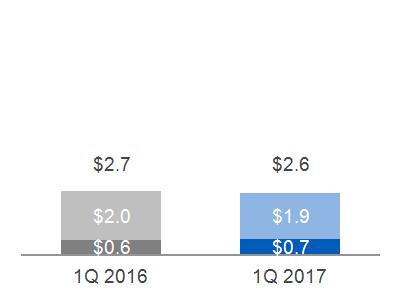
SEGMENT REVENUES & PROFIT WALK: | COMMENTARY: 2017 - 2016 | |||||
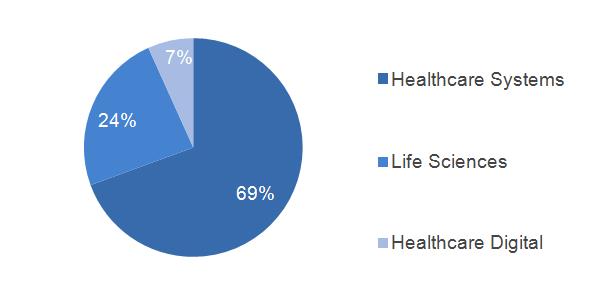
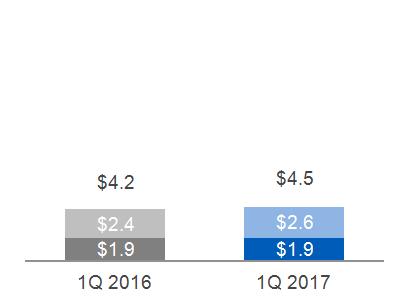
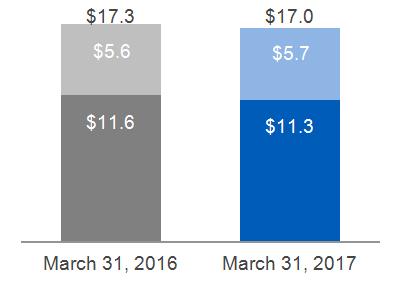
Segment revenues up $0.1 billion (3%); Segment profit up 2%:
The increase in revenues was due to higher services and equipment volume driven by Healthcare Systems and Life Sciences, partially offset by lower prices at Healthcare Systems. The increase in profit was mainly due to higher cost productivity driven by cost savings resulting from previous restructuring actions, partially offset by lower prices at Healthcare Systems. | ||||||
Revenues | Profit | |||||
March 31, 2016 | $ | 4.2 | $ | 0.6 | ||
Volume | 0.2 | - | ||||
Price | (0.1) | (0.1) | ||||
Foreign Exchange | - | - | ||||
(Inflation)/Deflation | N/A | - | ||||
Mix | N/A | - | ||||
Productivity | N/A | 0.1 | ||||
Other | - | - | ||||
March 31, 2017 | $ | 4.3 | $ | 0.6 | ||
2017 1Q FORM 10-Q 25
 TRANSPORTATION
 OPERATIONAL OVERVIEW
(Dollars in billions)
2017 YTD SUB-SEGMENT REVENUES | EQUIPMENT/SERVICES REVENUES | |||
 |  | |||
(a) Includes Digital Solutions and Marine, Stationary & Drilling | Services Equipment
| |||
ORDERS | BACKLOG | |||
 |
Equipment Services |
 |
Equipment
Services | |
UNIT SALES | ||||
2017 1Q FORM 10-Q 26
FINANCIAL OVERVIEW
(Dollars in billions)
SEGMENT REVENUES | SEGMENT PROFIT | SEGMENT PROFIT MARGIN | ||
 |
Equipment
Services
|  |  |
SEGMENT REVENUES & PROFIT WALK: | COMMENTARY: 2017 - 2016 | |||||
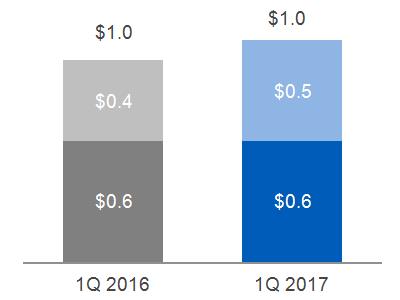
Segment revenues up $0.1 billion (6%); Segment profit down 5%:
The increase in revenues was due to higher locomotive equipment volume as a result of increased international shipments, offset by decreased North America shipments. The increase in equipment volume was partially offset by lower services volume. The decrease in profit was due to unfavorable business mix and decreased other income including an unfavorable foreign exchange transactional impact. These decreases were partially offset by higher volume and higher cost productivity. | ||||||
Revenues | Profit | |||||
March 31, 2016 | $ | 1.0 | $ | 0.2 | ||
Volume | 0.1 | - | ||||
Price | - | - | ||||
Foreign Exchange | - | - | ||||
(Inflation)/Deflation | N/A | - | ||||
Mix | N/A | - | ||||
Productivity | N/A | - | ||||
Other | - | - | ||||
March 31, 2017 | $ | 1.0 | $ | 0.2 | ||
2017 1Q FORM 10-Q 27
 ENERGY CONNECTIONS & LIGHTING
 OPERATIONAL OVERVIEW
(Dollars in billions)
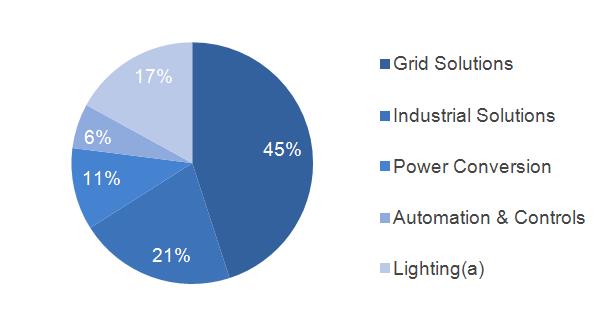
2017 YTD SUB-SEGMENT REVENUES | EQUIPMENT/SERVICES REVENUES | |||
 |
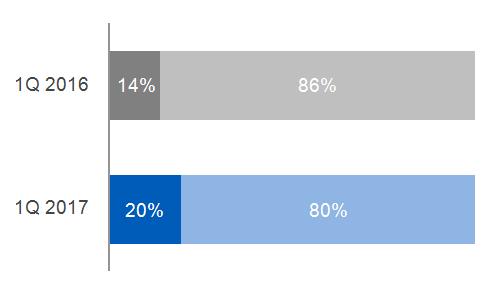 | |||
(a) Includes Current, powered by GE | Services Equipment
| |||
ORDERS | BACKLOG | |||
|
Equipment Services |
|
Equipment
Services | |
2017 1Q FORM 10-Q 28
FINANCIAL OVERVIEW
(Dollars in billions)
SEGMENT REVENUES | SEGMENT PROFIT (LOSS) | SEGMENT PROFIT MARGIN | ||
 |
Equipment
Services
|  |  |
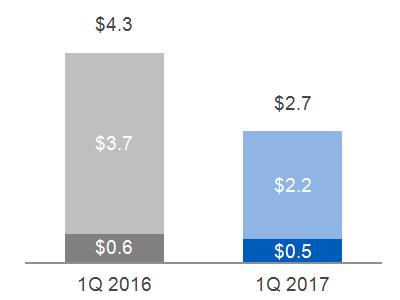
SEGMENT REVENUES & PROFIT WALK: | COMMENTARY: 2017 - 2016 | |||||
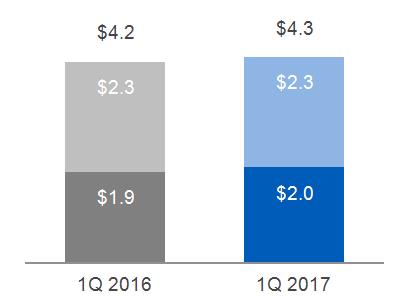
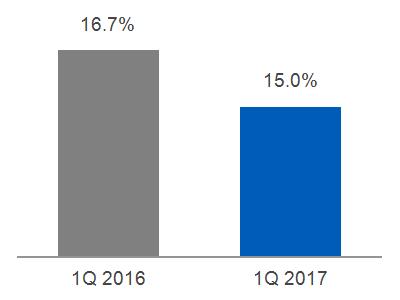
Segment revenues down $1.5 billion (35%); Segment profit down 10%:
The decrease in revenues was mainly due to the Appliances disposition in June 2016 as well as lower Lighting revenues driven by declines in traditional lighting, partially offset by increases in LED and Solar at Current. Energy Connections revenues increased primarily due to increased volume at Grid Solutions, partially offset by a decrease at Power Conversion. The decrease in profit was due to lower volume driven by the Appliances disposition in June 2016, partially offset by increases across Energy Connections, Current, and Lighting due to increased cost productivity. | ||||||
Revenues | Profit | |||||
March 31, 2016 | $ | 4.3 | $ | - | ||
Volume | (1.5) | (0.1) | ||||
Price | - | - | ||||
Foreign Exchange | - | - | ||||
(Inflation)/Deflation | N/A | - | ||||
Mix | N/A | - | ||||
Productivity | N/A | 0.1 | ||||
Other | - | - | ||||
March 31, 2017 | $ | 2.7 | $ | - | ||
2017 1Q FORM 10-Q 29
 CAPITAL
 OPERATIONAL AND FINANCIAL OVERVIEW
(Dollars in billions)
2017 YTD SUB-SEGMENT REVENUES | SEGMENT REVENUES | |||
 |  |
Total Capital Other Continuing
Verticals | ||
SEGMENT PROFIT (LOSS) (a) | ||||
 |
Verticals
Other Continuing
Total Capital | |||
(a) Includes interest and other financial charges and income taxes.
SIGNIFICANT TRENDS & DEVELOPMENTS |
As of March 30, 2017, GE Capital's non-US activities are no longer subject to consolidated supervision by the U.K.'s Prudential Regulation Authority (PRA). This completes GE Capital's global exit from consolidated supervision, having had its designation as a Systemically Important Financial Institution (SIFI) removed in June 2016.
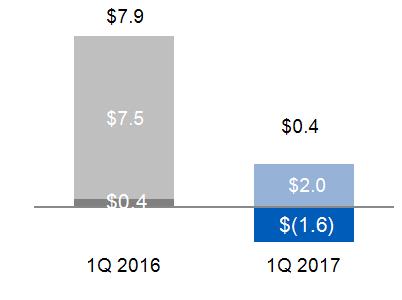
GE Capital paid common dividends of $2.0 billion and $7.5 billion to GE in the three months ended March 31, 2017 and 2016, respectively. In April 2017, GE received an additional $2.0 billion in common dividends from GE Capital.
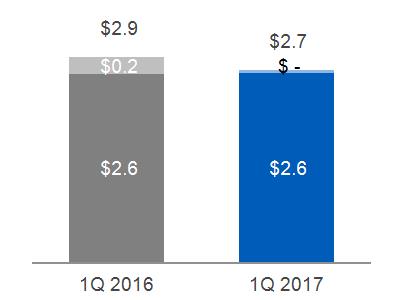
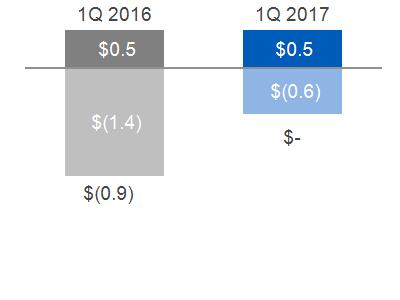
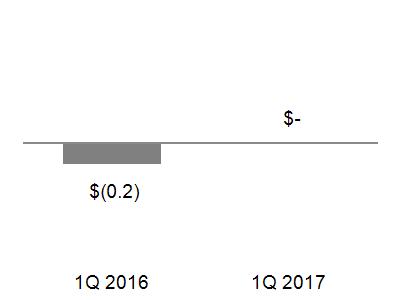
COMMENTARY: 2017 - 2016 |
Capital revenues decreased by $0.2 billion, or 7%, primarily due to organic revenue declines and lower gains, partially offset by lower impairments.
Capital losses decreased $0.8 billion, or 95%, primarily due to lower treasury operation expenses, lower preferred dividend expenses and lower restructuring expenses associated with the GE Capital Exit Plan.
| Within Capital, Verticals net earnings increased due to lower impairments ($0.1 billion) and core increases ($0.1 billion), partially offset by lower gains ($0.1 billion). |
| Other Capital losses decreased by $0.8 billion, or 58%, primarily associated with the GE Capital Exit Plan as follows: |
· | Lower treasury operation expenses of $0.4 billion reflecting lower excess interest expense, including costs associated with the February 2016 hybrid tender and derivative activities that reduce or eliminate interest rate, currency or market risk between financial assets and liabilities. |
· | Lower preferred dividend expenses of $0.3 billion associated with the January 2016 preferred equity exchange. |
· | Lower restructuring expenses of $0.1 billion. |
2017 1Q FORM 10-Q 30
CORPORATE ITEMS AND ELIMINATIONS | ||||||
REVENUES AND OPERATING PROFIT (COST) | ||||||
Three months ended March 31 | ||||||
(In millions) | 2017 | 2016 | ||||
Revenues | ||||||
Gains (losses) on disposals | $ | 2 | $ | 59 | ||
Eliminations and other | (1,039) | (968) | ||||
Total Corporate Items and Eliminations | $ | (1,037) | $ | (909) | ||
Operating profit (cost) | ||||||
Gains (losses) on disposals | 2 | 59 | ||||
Restructuring and other charges | $ | (1,020) | $ | (686) | ||
Principal retirement plans(a) | (534) | (468) | ||||
Eliminations and other | (457) | (476) | ||||
Total Corporate Items and Eliminations | $ | (2,009) | $ | (1,571) | ||
CORPORATE COSTS | ||||||
Three months ended March 31 | ||||||
(In millions) | 2017 | 2016 | ||||
Total Corporate Items and Eliminations | $ | (2,009) | $ | (1,571) | ||
Less non-operating pension cost | (578) | (512) | ||||
Total Corporate costs (operating) * | $ | (1,431) | $ | (1,059) | ||
Less restructuring and other charges | (1,020) | (686) | ||||
Less gains (losses) on disposals | 2 | 59 | ||||
Adjusted total corporate costs (operating)* | $ | (414) | $ | (431) | ||
(a) | Included non-operating pension cost* of $0.6 billion and $0.5 billion in the three months ended March 31, 2017 and 2016, respectively, which includes expected return on plan assets, interest costs and non-cash amortization of actuarial gains and losses. |
2017 – 2016 COMMENTARY
Revenues and other income decreased $0.1 billion, primarily as a result of:
| $0.1 billion of lower gains due to the nonrecurrence of the sale of two floors in 30 Rockefeller Plaza, New York City in the first quarter of 2016, and |
| $0.1 billion increase in inter-segment eliminations. |
Operating costs increased $0.4 billion, primarily as a result of:
• | $0.3 billion higher restructuring and other charges, which included $0.2 billion of increased restructuring and other charges associated with Alstom synergy investments, |
• | $0.1 billion of lower gains due to the nonrecurrence of the sale of two floors in 30 Rockefeller Plaza, New York City in the first quarter of 2016, and |
• | $0.1 billion of higher costs associated with our principal retirement plans, including the effects of lower discount rates |
*Non-GAAP Financial Measure
2017 1Q FORM 10-Q 31
RESTRUCTURING
Restructuring actions are an essential component of our cost improvement efforts to both existing operations and those recently acquired. Restructuring and other charges relate primarily to workforce reductions, facility exit costs associated with the consolidation of sales, service and manufacturing facilities, the integration of recent acquisitions, including Alstom, and other asset write-downs. We continue to closely monitor the economic environment and may undertake further restructuring actions to more closely align our cost structure with earnings goals.
RESTRUCTURING & OTHER CHARGES | |||||
Three months ended March 31 | |||||
(In billions) | 2017 | 2016 | |||
Workforce reductions | $ | 0.5 | $ | 0.2 | |
Plant closures & associated costs and other asset write-downs | 0.3 | 0.1 | |||
Acquisition/disposition net charges | 0.2 | 0.2 | |||
Other | - | 0.1 | |||
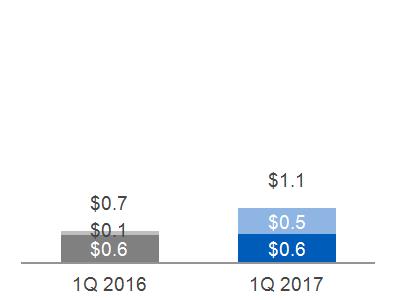
Total | $ | 1.0 | $ | 0.7 | |
For the three months ended March 31, 2017, restructuring and other charges were $1.0 billion of which approximately $0.7 billion was reported in cost of products/services and $0.4 billion was reported in other costs and expenses (SG&A). These activities were primarily at Power, Corporate and Energy Connections & Lighting. Cash expenditures for restructuring and other charges were approximately $0.6 billion for three months ended March 31, 2017.
For the three months ended March 31, 2016, restructuring and other charges were $0.7 billion of which approximately $0.4 billion was reported in cost of products/services and $0.2 billion was reported in other costs and expenses (SG&A). These activities were primarily at Oil & Gas, Power and Healthcare. Cash expenditures for restructuring and other charges were approximately $0.4 billion for the three months ended March 31, 2016.
COSTS NOT INCLUDED IN SEGMENT RESULTS
As discussed in the Segment Operations section within the MD&A, certain amounts are not included in industrial operating segment results because they are excluded from measurement of their operating performance for internal and external purposes. The amount of costs not included in segment results follows.
COSTS | |||||
Three months ended March 31 | |||||
(In billions) | 2017 | 2016 | |||
Power | $ | 0.4 | $ | 0.2 | |
Renewable Energy | - | - | |||
Oil & Gas | 0.1 | 0.2 | |||
Aviation | - | - | |||
Healthcare | 0.1 | 0.1 | |||
Transportation | 0.1 | - | |||
Energy Connections & Lighting | 0.2 | 0.1 | |||
Total | $ | 0.8 | $ | 0.7 | |
2017 1Q FORM 10-Q 32
DISCONTINUED OPERATIONS
Discontinued operations primarily relate to our financial services businesses as a result of the GE Capital Exit Plan and includes our U.S. mortgage business (WMC). All of these operations were previously reported in the Capital segment.
We have entered into Transitional Service Agreements (TSA) with and provided certain indemnifications to buyers of GE Capital's assets. Under the TSAs, GE Capital provides various services for terms generally between 12 and 24 months and receives a level of cost reimbursement from the buyers.
At March 31, 2017 , we provided specific indemnifications to buyers of GE Capital's assets that amounted to $2.6 billion, for which we have recognized related liabilities of $0.3 billion. In addition, in connection with the 2015 public offering and sale of our North American Retail Finance business, Synchrony Financial, GE Capital indemnified Synchrony Financial and its directors, officers, and employees against the liabilities of GECC's businesses other than historical liabilities of the businesses that are part of Synchrony Financial's ongoing operations.
Results of operations, financial position and cash flows for these businesses are reported as discontinued operations for all periods presented.
FINANCIAL INFORMATION FOR DISCONTINUED OPERATIONS | |||||
Three months ended March 31 | |||||
(In millions) | 2017 | 2016 | |||
Earnings (loss) from discontinued operations, net of taxes | $ | (239) | $ | (308) | |
The first quarter 2017 loss from discontinued operations, net of taxes, primarily reflected the following:
| $0.1 billion after-tax loss from operations, and |
| $0.1 billion after-tax loss on disposals. |
The first quarter 2016 loss from discontinued operations, net of taxes, primarily reflected the following:
| $0.4 billion after-tax loss on disposals, and |
| $0.1 billion after-tax earnings from operations. |
See Note 2 to the consolidated financial statements for additional information related to discontinued operations.
2017 1Q FORM 10-Q 33
OTHER CONSOLIDATED INFORMATION
INCOME TAXES
GE pays the income taxes it owes in every country it does business. While GE and GE Capital file a consolidated U.S. federal income tax return, many factors impact our income tax expense and cash tax payments. The most significant factor is that we conduct business in approximately 180 countries and more than half of our revenue is earned outside the U.S., often in countries with lower tax rates than in the U.S. We reinvest most of our foreign earnings overseas to be able to fund our active non-U.S. business operations. Our tax liability is also affected by U.S. and foreign tax incentives designed to encourage certain investments, such as research and development, and by acquisitions, dispositions and tax law changes. Finally, our tax returns are routinely audited, and settlements of issues raised in these audits sometimes affect our tax rates.
GE and GE Capital file a consolidated U.S. federal income tax return. This enables GE and GE Capital to use tax deductions and credits of one member of the group to reduce the tax that otherwise would have been payable by another member of the group. The effective tax rate reflects the benefit of these tax reductions in the consolidated return. GE makes cash payments to GE Capital for tax reductions and GE Capital pays for tax increases at the time GE's tax payments are due.
CONSOLIDATED – THREE MONTHS ENDED MARCH 31
(Dollars in billions)
PROVISION (BENEFIT) FOR INCOME TAXES |
 |
2017 – 2016 COMMENTARY
| The consolidated income tax rate was 2% and a negative 74% for the quarters ended March 31, 2017 and 2016, respectively. |
| The first quarter 2017 consolidated tax rate reflects a 92% tax rate on $0.1 billion of pre-tax loss at GE Capital and a 15% tax rate on $1.0 billion of pre-tax income at GE. |
| The first quarter 2016 consolidated tax rate reflects a 36% tax rate on $0.9 billion of pre-tax loss at GE Capital and a 14% tax rate on $1.2 billion of pre-tax income at GE. |
| Consolidated income tax expense was insignificant in the first quarter of 2017 and a tax benefit of $0.2 billion for the first quarter of 2016. The increase in tax expense is primarily due to a larger adjustment to bring the first quarter rate in-line with the higher projected full-year rate, the increase in pretax income taxed at above the average tax rate, partially offset by a larger benefit from global activities. |
| The consolidated tax provision includes $0.1 billion and $0.2 billion for GE (excluding GE Capital) for the first quarters of 2017 and 2016, respectively. |
| The effective tax rate in future periods is expected to increase as a result of changes in our income profile due to changes in GE Capital earnings as we continue to execute on the GE Capital Exit Plan. We expect the GE effective tax rate to be in the mid-teens for the full year of 2017. |
2017 1Q FORM 10-Q 34
BENEFITS FROM GLOBAL OPERATIONS
Our consolidated income tax provision is reduced because of the benefits of lower-taxed global operations. There is a benefit from global operations as non-U.S. income is subject to local country tax rates that are significantly below the 35% U.S. statutory rate. These non-U.S. earnings have been indefinitely reinvested outside the U.S. and are not subject to current U.S. income tax. Most of these earnings have been reinvested in active non-U.S. business operations and we do not intend to repatriate these earnings to fund U.S. operations. The rate of tax on our indefinitely reinvested non-U.S. earnings is below the 35% U.S. statutory tax rate because we have significant business operations subject to tax in countries where the tax on that income is lower than the U.S. statutory rate and because GE funds certain non-U.S. operations through foreign companies that are subject to low foreign taxes.
A substantial portion of the benefit related to business operations subject to tax in countries where the tax on that income is lower than the U.S. statutory rate is derived from our GECAS aircraft leasing operations located in Ireland, from our Power operations located in Switzerland and Hungary, and our Healthcare operations in Europe.
We expect our ability to benefit from non-U.S. income taxed at less than the U.S. rate to continue, subject to changes in U.S. or foreign law. In addition, since this benefit depends on management's intention to indefinitely reinvest amounts outside the U.S., our tax provision will increase to the extent we no longer indefinitely reinvest foreign earnings .
2017 1Q FORM 10-Q 35
STATEMENT OF FINANCIAL POSITION
Because GE and GE Capital share certain significant elements of their Statements of Financial Position, the following discussion addresses significant captions in the consolidated statement. Within the following discussions, however, we distinguish between GE and GE Capital activities in order to permit meaningful analysis of each individual consolidating statement.
MAJOR CHANGES IN OUR FINANCIAL POSITION FOR THE THREE MONTHS ENDED
MARCH 31, 2017
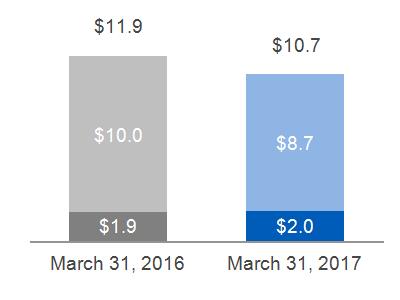
| Cash and equivalents decreased $6.6 billion. GE Cash and equivalents decreased $2.7 billion due to dividends of $2.1 billion, cash used for industrial operating activities of $1.6 billion, treasury stock net purchases of $1.6 billion (cash basis), settlement of the remaining portion of a short-term loan from GE Capital of $1.3 billion, business acquisitions of $1.0 billion and net PP&E additions of $0.6 billion. The decrease was partially offset by long-term intercompany loans from GE Capital of $4.1 billion and common dividends from GE Capital of $2.0 billion. GE Capital Cash and equivalents decreased $3.9 billion primarily driven by $8.2 billion net repayments of debt, long-term intercompany loans to GE of $4.1 billion and $2.0 billion in payments of dividends to shareowners, partially offset by $3.0 billion in net collections of financing receivables, $2.7 billion in maturities of liquidity investments, $1.8 billion of proceeds from borrowings assumed by the buyer in a business disposition, $1.5 billion related to cash collections from discontinued operations and $1.3 billion maturity of a short-term loan to GE. See the Statement of Cash Flows section for additional information. |
| Contract assets increased $2.2 billion , primarily due to adjustments driven by lower forecasted cost to complete the contracts and timing of billings relative to revenue recognition on our long-term equipment and service contracts. |
| Assets of discontinued operations decreased $5.0 billion , primarily due to the disposition of businesses. See Note 2 to the consolidated financial statements for additional information. |
| Borrowings decreased $7.8 billion , primarily due to net repayment of debt at GE Capital. See Note 10 to the consolidated financial statements for additional information. |
| Liabilities of discontinued operations decreased $2.4 billion , primarily driven by the disposition of businesses. See Note 2 to the consolidated financial statements for additional information. |
| Common stock held in treasury increased $1.8 billion, primarily due to treasury stock purchases of $2.3 billion (book basis), partially offset by treasury stock issuances of $0.6 billion. |
2017 1Q FORM 10-Q 36
FINANCIAL RESOURCES AND LIQUIDITY
LIQUIDITY AND BORROWINGS
We maintain a strong focus on liquidity. At both GE and GE Capital we manage our liquidity to help provide access to sufficient funding to meet our business needs and financial obligations throughout business cycles.
Our liquidity and borrowing plans for GE and GE Capital are established within the context of our annual financial and strategic planning processes. At GE, our liquidity and funding plans take into account the liquidity necessary to fund our operating commitments, which include primarily purchase obligations for inventory and equipment, payroll and general expenses (including pension funding). We also take into account our capital allocation and growth objectives, including paying dividends, repurchasing shares, investing in research and development and acquiring industrial businesses. At GE, we rely primarily on cash generated through our operating activities, any dividend payments from GE Capital, and also have historically maintained a commercial paper program, with a balance of $2.0 billion at March 31, 2017, that we regularly use to fund operations in the U.S., principally within the quarters.
During 2017, GE plans to incur new long-term debt to refinance existing unsecured term debt, finance the Baker Hughes transaction, and for other corporate purposes. This new debt may consist of new unsecured term debt issued by GE or intercompany arrangements between GE and GE Capital utilizing GE Capital's excess unsecured term debt. During the first quarter of 2017, GE and GE Capital entered into a series of intercompany loans totaling $4.1 billion, which utilized a portion of GE Capital's excess unsecured term debt. Such intercompany loans collectively have a weighted average interest rate and term of 3.6% and approximately 15 years, respectively. The remaining $1.3 billion short-term intercompany loan balance at December 31, 2016 was paid by GE in January 2017.
Based on asset and liability management actions we have taken, GE Capital does not plan to issue any incremental GE Capital senior unsecured term debt until 2019. GE Capital's global commercial paper balance totaled $5.0 billion at March 31, 2017. GE Capital mainly relies on excess cash positions, cash generated through dispositions, and the cash flow from our Verticals to fund our debt maturities, including the current portion of long-term debt ($16.3 billion at March 31, 2017), and our operating and interest costs. GE Capital's liquidity position is targeted to meet its obligations under both normal and stressed conditions. We expect to maintain an elevated liquidity position as we generate cash from asset sales, returning to more normalized levels in 2019. During this period we expect to continue to have excess interest costs as asset sales have outpaced our debt maturities. While we maintain elevated liquidity levels, we may engage in liability management actions, such as buying back debt, based on market and economic conditions in order to reduce our excess interest costs.
We maintain a detailed liquidity policy for GE Capital that defines GE Capital's liquidity risk tolerance under stress based on its liquidity sources, and a comprehensive framework for managing liquidity risk including metrics to identify and monitor liquidity risk and procedures to escalate and address potential issues.
In 2015, senior unsecured notes and commercial paper were assumed by GE upon its merger with GE Capital resulting in an intercompany receivable and payable between GE and GE Capital. On the GE balance sheet, assumed debt is presented within borrowings with an offsetting receivable from GE Capital and on the GE Capital balance sheet, this is reflected as an intercompany payable to GE within borrowings. The intercompany receivable and payable are further reduced by certain intercompany loans from GE Capital to GE, which bear the right of offset against amounts owed under the assumed debt agreement (see Note 10 for additional information). The following table illustrates total GE and GE Capital external debt and debt assumed by GE as of March 31, 2017.
March 31, 2017 (In billions) | GE | GE Capital | Consolidated(a) | ||||||
External debt | $ | 74.0 | $ | 55.8 | $ | 128.7 | |||
Debt assumed by GE from GE Capital | (54.4) | 54.4 | - | ||||||
Intercompany loans | 4.1 | (4.1) | - | ||||||
Total intercompany payable (receivable) between GE and GE Capital | (50.3) | 50.3 | - | ||||||
Debt adjusted for assumed debt and intercompany loans | $ | 23.7 | $ | 106.1 | $ | 128.7 | |||
(a) Includes $1.2 billion elimination of other intercompany borrowings between GE and GE Capital.
2017 1Q FORM 10-Q 37
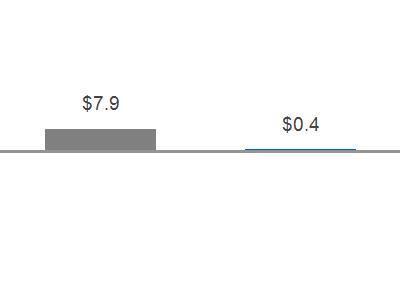
LIQUIDITY SOURCES
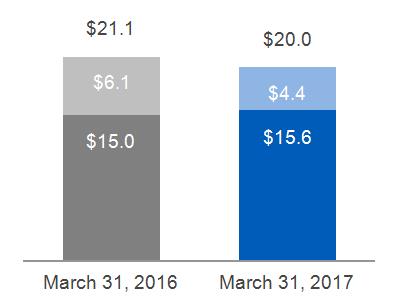
In addition to GE cash of $7.9 billion at March 31, 2017, GE Capital maintained liquidity sources of $43.4 billion that consisted of cash and equivalents of $33.7 billion, high-quality investments of $8.9 billion and cash and equivalents of $0.8 billion classified as discontinued operations. Additionally, at March 31, 2017, GE has $20.0 billion of committed unused credit lines extended by 36 banks in a syndicated credit facility agreement, as well as $5.1 billion of committed unused operating lines extended by nine banks. GE Capital has the right to compel GE to borrow under these credit lines and transfer the proceeds as loans to GE Capital.
CASH AND EQUIVALENTS | |||||||
(In billions) | March 31, 2017 | March 31, 2017 | |||||
GE(a) | $ | 7.9 | U.S. | $ | 6.6 | ||
GE Capital(b) | 33.7 | Non-U.S.(c) | 35.0 | ||||
(a) | At March 31, 2017, $3.5 billion of GE cash and equivalents was held in countries with currency controls that may restrict the transfer of funds to the U.S. or limit our ability to transfer funds to the U.S. without incurring substantial costs. These funds are available to fund operations and growth in these countries and we do not currently anticipate a need to transfer these funds to the U.S. |
(b) | At March 31, 2017, GE Capital cash and equivalents of about $0.3 billion was primarily in insurance entities and was subject to regulatory restrictions. |
(c) | Of this amount at March 31, 2017, $0.7 billion is held outside of the U.S. and is available to fund operations and other growth of non-U.S. subsidiaries; it is also available to fund our needs in the U.S. on a short-term basis through short-term loans, without being subject to U.S. tax. Under the Internal Revenue Code, these loans are permitted to be outstanding for 30 days or less and the total of all such loans is required to be outstanding for less than 60 days during the year. If we were to repatriate this cash, we would be subject to additional U.S. income taxes and foreign withholding taxes. |
During the first quarter of 2017, there were no new senior unsecured debt issuances.
COMMERCIAL PAPER | |||||
(In billions) | GE | GE Capital | |||
Average commercial paper borrowings during the first quarter of 2017 | $ | 14.8 | $ | 5.0 | |
Maximum commercial paper borrowings outstanding during the first quarter of 2017 | 19.7 | 5.2 | |||
GE Capital commercial paper maturities have historically been funded principally through new commercial paper issuances and at GE are substantially repaid before quarter-end using indefinitely reinvested overseas cash, which as discussed above, is available for use in the U.S. on a short-term basis without being subject to U.S. tax.
We securitize financial assets as an alternative source of funding. At March 31, 2017, consolidated non-recourse securitization borrowings were $0.7 billion.
GE GUARANTEE OF CERTAIN GE CAPITAL DEBT
GE provides implicit and explicit support to GE Capital through commitments, capital contributions and operating support. At March 31, 2017, debt assumed by GE from GE Capital in connection with the merger of GE Capital into GE was $54.4 billion, and GE guaranteed $45.3 billion of GE Capital debt. See Note 20 to the consolidated financial statements for further information on the guarantor financial statements.
FOREIGN CURRENCY EXPOSURE
As a result of our global operations, we generate and incur a significant portion of our revenues and expenses in currencies other than the U.S. dollar. Such principal currencies are euro, the pound sterling, the Brazilian real and the Chinese renminbi. The results of operating entities reported in currencies other than U.S. dollar are translated to the U.S. dollar at the applicable exchange rate for inclusion in the financial statements. We use a number of techniques to manage the effects of currency exchange, including selective borrowings in local currencies and selective hedging of significant cross-currency transactions. The foreign currency effect arising from operating activities outside of the U.S., including the remeasurement of derivatives, can result in significant transactional foreign currency fluctuations at points in time, but will generally be offset as the underlying hedged item is recognized in earnings. The effects of foreign currency fluctuations, decreased net earnings by $0.1 billion f or the three months ended March 31, 2017 .
2017 1Q FORM 10-Q 38
See Notes 16 and 21 to the consolidated financial statements for further information about our risk exposures, our use of derivatives, and the effects of this activity on our financial statements.
STATEMENT OF CASH FLOWS - THREE MONTHS ENDED MARCH 31, 2017 VERSUS 2016
CONSOLIDATED CASH FLOWS
We evaluate our cash flow performance by reviewing our industrial (non-GE Capital) businesses and GE Capital businesses separately. Cash from operating activities (CFOA) is the principal source of cash generation for our industrial businesses.
GE CASH FLOWS – THREE MONTHS ENDED MARCH 31
(In billions)
OPERATING CASH FLOWS | INVESTING CASH FLOWS | FINANCING CASH FLOWS | ||||||||
2016 | 2017 | 2016 | 2017 | 2016 | 2017 | |||||
 | 
| 
| ||||||||
With respect to GE CFOA, we believe that it is useful to supplement our GE Statement of Cash Flows and to examine in a broader context the business activities that provide and require cash.
The most significant source of cash in GE CFOA is customer-related activities, the largest of which is collecting cash resulting from product or services sales. The most significant operating use of cash is to pay our suppliers, employees, tax authorities and others for a wide range of material and services. Dividends from GE Capital represent the distribution of a portion of GE Capital retained earnings, and are distinct from cash from continuing operations within the GE Capital businesses.
All other operating activities reflect cash sources and uses as well as non-cash adjustments to net income including those related to taxes, interest, pension, contract assets and gains (losses) on principal business dispositions. See Note 21 to the consolidated financial statements for further information.
See the Intercompany Transactions between GE and GE Capital section within the MD&A and Notes 4 and 19 to the consolidated financial statements for further information regarding certain transactions affecting our consolidated Statement of Cash Flows.
2017 1Q FORM 10-Q 39
2017 – 2016 COMMENTARY
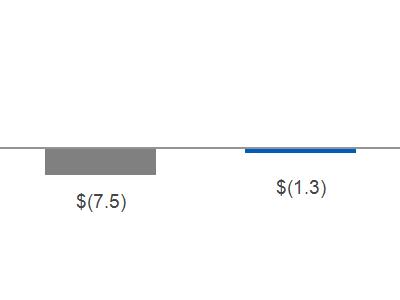
GE cash from operating activities decreased $7.5 billion primarily due to the following:
| GE Capital paid common dividends totaling $2.0 billion and $7.5 billion to GE in the three months ended March 31, 2017 and 2016, respectively. |
| Cash used for industrial operating activities of $1.6 billion in the three months ended March 31, 2017, compared to cash generated of $0.4 billion in the three months ended March 31, 2016, primarily due to the following: |
| Net income plus depreciation of $1.5 billion and $1.8 billion in the three months ended March 31, 2017 and 2016, respectively. |
| Cash used for working capital of $1.3 billion and $1.1 billion in the three months ended March 31, 2017 and 2016, respectively. The increase in cash used for working capital was primarily due to decreases in progress collections, partially offset by a decrease in inventory build. |
| An increase in contract assets of $1.9 billion and $0.7 billion in the three months ended March 31, 2017 and 2016, respectively, primarily due to adjustments driven by lower forecasted cost to complete the contracts and timing of billings relative to revenue recognition on our long-term equipment and service contracts. |
| See Note 21 to the consolidated financial statements for further information regarding cash sources and uses as well as non-cash adjustments to net income reported as All other operating activities. |
GE cash used for investing activities increased $0.5 billion primarily due to the following:
| An increase in business acquisition activities of $1.0 billion, primarily driven by the acquisition of ServiceMax for $0.9 billion (net of cash acquired) in the three months ended March 31, 2017. |
| This is partially offset by the funding of a joint venture at our Aviation business of $0.3 billion in the three months ended March 31, 2016. |
GE cash used for financing activities decreased $6.2 billion primarily due to the following:
| Net repurchases of GE treasury shares of $1.6 billion and $6.3 billion (including $2.0 billion paid under ASR agreements) in the three months ended March 31, 2017 and 2016, respectively. |
| A net increase in borrowings of $1.4 billion, driven by long-term loans from GE Capital to GE of $4.1 billion in the three months ended March 31, 2017, partially offset by the settlement of the remaining balance of a short-term loan from GE Capital to GE of $1.3 billion and a decrease of GE issued unsecured notes of $0.5 billion. |
GE CAPITAL CASH FLOWS – THREE MONTHS ENDED MARCH 31
(In billions)
OPERATING CASH FLOWS | INVESTING CASH FLOWS | FINANCING CASH FLOWS | ||||||||
2016 | 2017 | 2016 | 2017 | 2016 | 2017 | |||||
 |  |
| ||||||||
2017 1Q FORM 10-Q 40
2017 – 2016 COMMENTARY – CONTINUING OPERATIONS:
GE Capital cash from operating activities-continuing operations increased $0.5 billion primarily due to the following:
| Lower income tax payments of $1.8 billion, lower assets originated as held for sale of $0.5 billion and a general increase in cash generated from earnings of continuing operations. |
| These increases were partially offset by a net decrease in cash collateral received from counterparties on derivative contracts of $2.0 billion. |
GE Capital cash from investing activities-continuing operations decreased $21.1 billion primarily due to the following:
| Net proceeds from the sales of our discontinued operations of $0.8 billion compared to $36.5 billion in 2016. |
| Loans originated from GE Capital to GE of $4.1 billion offset by a $1.3 billion settlement of the remaining portion of a 2016 short-term loan from GE Capital to GE. |
| Net cash received from derivative settlements of $0.2 billion compared to $0.7 billion in 2016. |
| These decreases were partially offset by the following increases: |
| Investment in interest bearing deposits of $3.6 billion in 2016. |
| Maturity of liquidity investments of $2.7 billion in 2017. |
| Higher net collections of financing receivables of $1.5 billion in 2017. |
| Reduction in funding related to discontinued operations . |
GE Capital cash used for financing activities-continuing operations decreased $11.1 billion primarily due to the following:
| GE Capital paid common dividends to GE totaling $2.0 billion compared to $7.5 billion in 2016. |
| Lower net repayments of borrowings of $8.2 billion compared to $14.0 billion in 2016. |
GE CAPITAL DISCONTINUED OPERATIONS CASH FLOWS – THREE MONTHS ENDED
MARCH 31
(In billions)
OPERATING CASH FLOWS | INVESTING CASH FLOWS | FINANCING CASH FLOWS | |||||||||||
2016 | 2017 | 2016 | 2017 | 2016 | 2017 |
| |||||||
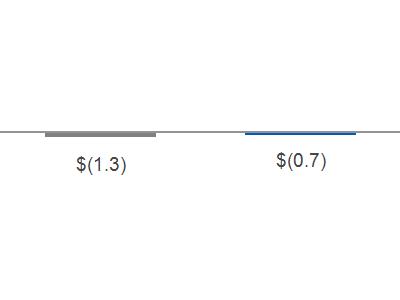 | 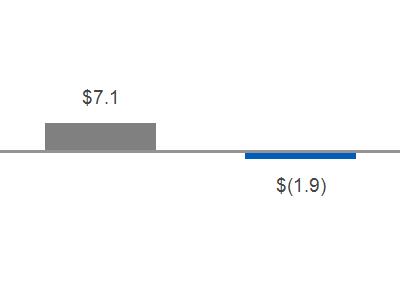 | 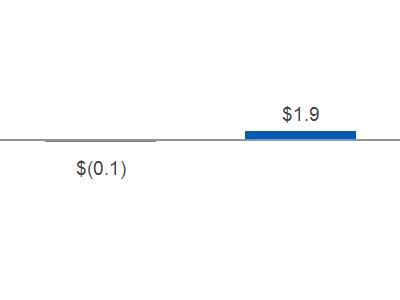 | |||||||||||
2017 – 2016 COMMENTARY – DISCONTINUED OPERATIONS:
GE Capital cash used for operating activities-discontinued operations decreased $0.6 billion primarily due to the following:
| Lower cash paid for income taxes in 2017. |
GE Capital cash from investing activities-discontinued operations decreased $9.0 billion primarily due to the following:
| Lower cash of $5.6 billion primarily related to disposition proceeds retained in discontinued operations in 2016. |
| Reduction in funding from continuing operations (primarily our treasury operations). |
| Sale of bank deposits for $0.5 billion in net cash paid related to our Consumer platform during 2017. |
GE Capital cash used for financing activities-discontinued operations decreased $2.0 billion primarily due to the following:
| Debt issued of $1.8 billion by a discontinued business sold during the first quarter of 2017. |
2017 1Q FORM 10-Q 41
INTERCOMPANY TRANSACTIONS BETWEEN GE AND GE CAPITAL
We are repositioning GE to be the world's best infrastructure and technology company, with a smaller financial services division. Our focus is on driving infrastructure leadership, investing in innovation and achieving a culture of simplification to better serve our customers around the world. Over the last decade, we have made significant strides in transforming our portfolio and focusing on our industrial leadership. We have grown our infrastructure platforms with major portfolio moves, investing in adjacencies and pursuing opportunities that are closely related to our core.
In parallel, we have made a concentrated effort to reduce the size of our GE Capital business and align its growth with Industrial earnings. As a result, GE Capital vertical businesses are now focused on investing financial, human and intellectual capital to promote growth for our industrial businesses and their customers. GE Capital accomplishes this in part through related party transactions with GE that are made on an arms-length basis and are reported in the respective GE and GE Capital columns of our financial statements, but are eliminated in deriving our consolidated financial statements. These transactions include, but are not limited to, the following:
| GE Capital dividends to GE, |
| GE Capital working capital solutions to optimize GE cash management, |
| GE Capital enabled GE industrial orders, and |
| Aircraft engines, power equipment and healthcare equipment manufactured by GE that are installed on GE Capital investments, including leased equipment. |
In addition to the above transactions that primarily enable growth for the GE businesses, there are routine related party transactions, which include, but are not limited to, the following:
| Expenses related to parent-subsidiary pension plans, |
| Buildings and equipment leased between GE and GE Capital, including sale-leaseback transactions, |
| Information technology (IT) and other services sold to GE Capital by GE, and |
| Various investments, loans and allocations of GE corporate overhead costs. |
CASH FLOWS
GE Capital paid $2.0 billion and $7.5 billion of common dividends to GE in the three months ended March 31, 2017 and 2016, respectively. In April 2017, GE received an additional $2.0 billion in common dividends from GE Capital.
In order to manage credit exposure, GE sells current receivables to GE Capital and other third parties in part to fund the growth of our industrial businesses. These transactions can result in cash generation or cash use. During any given period, GE receives cash from the sale of receivables to GE Capital and other third parties. GE also leverages GE Capital for its expertise in receivables collection services and sales of receivables to GE Capital are made on an arm's length basis. The incremental amount of cash received from sales of receivables represents the cash generated or used in the period relating to this activity. The effect of cash generated in GE CFOA from current receivables sold to GE Capital, including current receivables subsequently sold to third parties, decreased GE's CFOA by $3.3 billion and $2.1 billion in the three months ended March 31, 2017 and 2016, respectively.
As of March 31, 2017, GE Capital had approximately $10.0 billion recorded on its balance sheet related to current receivables purchased from GE. Of these amounts, approximately half had been sold by GE to GE Capital with recourse (i.e., the GE business retains the risk of default). The evaluation of whether recourse transactions qualify for accounting derecognition is based, in part, upon the legal jurisdiction of the sale; as such, the majority of recourse transactions outside the U.S. qualify for sale treatment. Claims by GE Capital on receivables sold with recourse to GE have not been significant for the three months ended March 31, 2017 and 2016.
In December 2016, GE Capital entered into a Receivables Facility with members of a bank group, designed to provide extra liquidity to GE. The Receivables Facility allows us to sell eligible current receivables on a non-recourse basis for cash and a deferred purchase price to members of the bank group. The purchase commitment of the bank group remains at $3.0 billion at March 31, 2017. See Note 4 to the consolidated financial statements for further information.
2017 1Q FORM 10-Q 42
ENABLED ORDERS
Enabled orders represent the act of introducing, elevating and influencing customers and prospects that result in an industrial sale, potentially coupled with programmatic captive financing or driving incremental products or services across the GE Store. During the three months ended March 31, 2017 and 2016, GE Capital enabled $2.2 billion and $1.6 billion of GE industrial orders, respectively. March 31, 2017 orders are primarily with our Power ($0.9 billion), Renewable Energy ($0.7 billion) and Healthcare ($0.2 billion) businesses.
AVIATION
During the three months ended March 31, 2017 and 2016, GE Capital acquired 9 aircraft (list price totaling $1.1 billion) and 10 aircraft (list price totaling $1.0 billion), respectively, from third parties that will be leased to others, which are powered by engines that were manufactured by GE Aviation and affiliates. Additionally, GE Capital had $1.6 billion and $1.5 billion of net book value of engines, originally manufactured by GE Aviation and affiliates and subsequently leased back to GE Aviation and affiliates at March 31, 2017 and December 31, 2016, respectively.
POWER AND RENEWABLE ENERGY
GE leverages GE Capital for its expertise in structuring long-term financing arrangements with certain Power and Renewable Energy customers for the purchase of equipment, upgrades and long-term service contracts. These arrangements are made on an arm's length basis and fair value adjustments are recognized within the results of our Power and Renewable Energy segments. Any associated deferred income recorded by GE Capital is eliminated in our consolidated results. In relation to these arrangements, GE Capital had approximately $1.9 billion of long-term financing receivables outstanding, net of deferred income of approximately $0.3 billion reported on its balance sheet at March 31, 2017.
PENSIONS
GE Capital is a member of certain GE Pension Plans. As a result of the GE Capital Exit Plan, GE Capital will have additional funding obligations for these pension plans. These obligations do not relate to the Verticals and are recognized as an expense in GE Capital's other continuing operations when they become probable and estimable. The additional funding obligations recognized by GE Capital were $0.1 billion and $0.2 billion for the three months ended March 31, 2017 and 2016, respectively.
Certain of this additional funding is recorded as a contra pension expense for GE because GE's related future pension obligations will be paid by GE Capital. For certain other pension plan funding obligations triggered by the GE Capital Exit Plan, GE agreed to assume the funding obligation that would have been triggered by GE Capital at the date of exit from the plan in exchange for an assumption fee that GE recorded as Other income. The total cash transferred to GE for the assumption of these GE Capital funding obligations was $0.1 billion for the three months ended March 31, 2016. There were no similar funding obligations assumed by GE from GE Capital in the three months ended March 31, 2017.
On a consolidated basis, the additional required pension funding and any related assumption fees do not affect current period earnings. Any additional required pension funding will be reflected as a reduction of the pension liability when paid.
GE GUARANTEE OF GE CAPITAL THIRD-PARTY TRANSACTIONS
In certain instances, GE provides guarantees to GE Capital transactions with third parties primarily in connection with enabled orders. In order to meet its underwriting criteria, GE Capital may obtain a direct guarantee from GE related to the performance of the third party. GE guarantees can take many forms and may include, but not be limited to, direct performance or payment guarantees, return on investment guarantees, asset value guarantees and loss pool arrangements. As of March 31, 2017, GE had outstanding guarantees to GE Capital on $1.8 billion of funded exposure and $0.5 billion of unfunded commitments. The recorded amount of these contingent liabilities was $0.1 billion as of March 31, 2017 and is dependent upon individual transaction level defaults, losses and/or returns.
2017 1Q FORM 10-Q 43
GE GUARANTEE OF CERTAIN GE CAPITAL DEBT
GE provides implicit and explicit support to GE Capital through commitments, capital contributions and operating support. As previously discussed, debt assumed by GE from GE Capital in connection with the merger of GE Capital into GE was $54.4 billion, and GE guaranteed $45.3 billion of GE Capital debt at March 31, 2017. See Notes 10 and 19 to the consolidated financial statements for additional information.
CRITICAL ACCOUNTING ESTIMATES
We utilized significant estimates in the preparation of the first quarter financial statements.
Please refer to the Critical Accounting Estimates section within MD&A and Note 1, Basis of Presentation and Summary of Significant Accounting Policies, to the consolidated financial statements of our Form 10-K Report filed on February 24, 2017, for a discussion of our accounting policies and the critical accounting estimates we use to: recognize revenue on long-term product services agreements; assess the recoverability of assets such as financing receivables and goodwill; determine the fair value of financial assets; and determine our provision for income taxes and recoverability of deferred tax assets.
2017 1Q FORM 10-Q 44
OTHER ITEMS
NEW ACCOUNTING STANDARDS
ASU NO. 2016-16, ACCOUNTING FOR INCOME TAXES: INTRA-ENTITY ASSET TRANSFERS OF ASSETS OTHER THAN INVENTORY
In October 2016, the Financial Accounting Standards Board (FASB) issued Accounting Standards Update (ASU) No. 2016-16, Accounting for Income Taxes: Intra-Entity Asset Transfers of Assets Other than Inventory . The ASU eliminates the deferral of the tax effects of intra-entity asset transfers other than inventory. As a result, the tax expense from the intercompany sale of assets, other than inventory, and associated changes to deferred taxes will be recognized when the sale occurs even though the pre-tax effects of the transaction have not been recognized. The effect of the adoption of the standard will depend on the nature and amount of future transactions.
ASU NO. 2016-02, LEASES
In February 2016, the FASB issued ASU No. 2016-02, Leases . The new standard establishes a right-of-use (ROU) model that requires a lessee to record a ROU asset and a lease liability on the balance sheet for all leases with terms longer than 12 months. Leases will be classified as either finance or operating, with classification affecting the pattern of expense recognition. Similarly, lessors will be required to classify leases as sales-type, finance or operating, with classification affecting the pattern of income recognition. Classification for both lessees and lessors will be based on an assessment of whether risks and rewards as well as substantive control have been transferred through a lease contract. The new standard is effective for fiscal years beginning after December 15, 2018, including interim periods within those fiscal years, with early adoption permitted. A modified retrospective transition approach is required for leases existing at, or entered into after, the beginning of the earliest comparative period presented in the financial statements, with certain practical expedients available. While we continue to evaluate the effect of the standard on our ongoing financial reporting, we anticipate that the adoption of the ASU may materially affect our Statement of Financial Position.
ASU NO. 2014-09, REVENUE FROM CONTRACTS WITH CUSTOMERS
In May 2014, the FASB issued a new comprehensive set of revenue recognition principles (ASU No. 2014-09, Revenue from Contracts with Customers ) that supersedes most existing U.S. GAAP revenue recognition guidance (including ASC 605-35, Revenue Recognition- Construction-Type and Production-Type Contracts ). The new standard will become effective for annual reporting periods beginning after December 15, 2017. We will adopt the standard on January 1, 2018, will apply it retrospectively to all periods presented and will elect the practical expedient for contract modifications. We chose to adopt retrospectively because we believe that it is the most helpful to our investors. When we adopt the standard in 2018 we will provide investors with a consistent view of historical trends, as 2016 and 2017 will be on a basis consistent with 2018.
Please refer to our 2016 10-K filing for incremental discussion of the expected financial statement effects of the adoption of the standard, including an initial estimate of the non-cash charge to our January 1, 2016 retained earnings, the estimated change to our 2016 reported earnings per share and the expected impact to 2018 earnings per share. As described in our 2016 10-K, these estimates are based on many variables, which are subject to change. As we continue to work through the implementation effort required to adopt the standard, we will continue to refine these initial estimates.
2017 1Q FORM 10-Q 45
GE DIGITAL
In late 2015, we created GE Digital, whose activities are focused on assisting in the market development of our digital product offerings through software design, fulfillment and product management, while also interfacing with our customers. Digital revenues include internally developed software and associated hardware, including Predix and software solutions that improve our customers' asset performance. These revenues are largely generated from our operating businesses and are included in their segment results.
GE Digital revenues were $0.9 billion for the three months ended March 31, 2017, an increase of $0.1 billion, or 16%, compared to revenues of $0.8 billion for the three months ended March 31, 2016 and were principally driven by expansion of our Digital offerings in GE's Power, Oil & Gas and Energy Connections & Lighting segments and non-GE Verticals.
GE Digital orders were $0.9 billion for both the three months ended March 31, 2017 and 2016, respectively. Digital orders increased for GE's Power, Oil & Gas, Renewable Energy and Healthcare segments and for non-GE Verticals. These increases were largely offset by decreases at Transportation and Energy Connections & Lighting.
In addition, on January 10, 2017, we completed the acquisition of ServiceMax, a leader in cloud-based field service management (FSM) solutions, for $0.9 billion, net of cash acquired. This acquisition is expected to provide enhanced capabilities to advance our Industrial Internet vision, enabling customers to immediately gain more value from their assets and find greater efficiency in their field service processes.
.
2017 1Q FORM 10-Q 46
IRAN THREAT REDUCTION AND SYRIA HUMAN RIGHTS ACT OF 2012
The Company is making the following disclosure pursuant to Section 13(r) of the Securities Exchange Act of 1934.
Under Section 13(r) of the Securities Exchange Act of 1934, enacted in 2012, GE is required to disclose in its periodic reports if it or any of its affiliates knowingly engaged in business activities relating to Iran, even if those activities are conducted in accordance with authorizations subsequently issued by the U.S. Government. Reportable activities include investments that significantly enhance Iran's ability to develop petroleum resources valued at $20 million or more in the aggregate during a twelve-month period. Reporting is also required for transactions related to Iran's domestic production of refined petroleum products or Iran's ability to import refined petroleum products valued at $5 million or more in the aggregate during a twelve-month period.
In January 2016, the U.S. Department of Treasury's Office of Foreign Assets Control (OFAC) issued General License H authorizing U.S.-owned or controlled foreign entities to engage in transactions with Iran if these entities meet the requirements of the general license. Pursuant to this authorization, a non-U.S. affiliate of GE's Oil & Gas business received two sets of purchase orders during the first quarter of 2017 for the sale of goods pursuant to General License H that could potentially enhance Iran's ability to develop petroleum resources. The purchase orders cover the sale of spare parts for gas turbine equipment for ultimate end use by Iranian companies in gas production projects in Iran. These purchase orders are valued at €10.0 million ($10.6 million) and €6.4 million ($6.8 million). The non-US affiliate also booked a modification of a previously reported contract to add additional scope valued at €2.0 million ($2.2 million). The non-US affiliate booked three purchase orders during the first quarter of 2017 for which it had received incomplete documentation during prior quarters. These three purchase orders are valued at €0.2 million ($0.2 million), €0.1 million ($0.1 million), and less than €0.1 million (less than $0.1 million). This non-US affiliate has not recognized any revenue as of March 31, 2017 for these or any previously reported transactions, but has incurred €2.7 million ($2.9 million) in costs.
A second non-U.S. affiliate of GE's Oil & Gas business received a purchase order pursuant to General License H valued at €0.3 million ($0.3 million) during the first quarter of 2017 for the sale of services associated with the commissioning of gas compressors in Iran. As of March 31, 2017, gross revenues attributable to this purchase order was €0.3 million ($0.3 million), and net profits attributable to this purchase order was €0.2 million ($0.2 million). This non-U.S. affiliate also attributed gross revenues of €0.2 million ($0.2 million) and net profits of €0.1 million ($0.1 million) during the first quarter of 2017 to a previously reported transaction.
A third non-U.S. affiliate of GE's Oil & Gas business received purchase orders pursuant to General License H valued at €0.3 million ($0.3 million) during the first quarter of 2017 for the sale of production logging equipment and spare parts to an Iranian customer. As of March 31, 2017, the non-US affiliate has not yet recognized revenue or profit associated with this transaction.
All of these non-U.S. affiliates intend to continue the activities described above.
For additional information on business activities related to Iran, please refer to the Other Items section within MD&A in our Annual Report on Form 10-K for the year ended December 31, 2016.
2017 1Q FORM 10-Q 47
SUPPLEMENTAL INFORMATION
FINANCIAL MEASURES THAT SUPPLEMENT U.S. GENERALLY ACCEPTED ACCOUNTING PRINCIPLES MEASURES (NON-GAAP FINANCIAL MEASURES)
We sometimes use information derived from consolidated financial information but not presented in our financial statements prepared in accordance with U.S. generally accepted accounting principles (GAAP). Certain of these data are considered "non-GAAP financial measures" under U.S. Securities and Exchange Commission rules. Specifically, we have referred to:
| Industrial segment organic revenues |
| Operating and non-operating pension cost |
| Adjusted corporate costs (operating) |
| Industrial operating and GE Capital earnings (loss) from continuing operations and EPS |
| Industrial operating + Verticals earnings and EPS |
| Industrial operating profit and operating profit margin (excluding certain items) |
| Industrial cash flows from operating activities (Industrial CFOA) |
The reasons we use these non-GAAP financial measures and the reconciliations to their most directly comparable GAAP financial measures follow.
2017 1Q FORM 10-Q 48
INDUSTRIAL SEGMENT ORGANIC REVENUES | ||||||||
Three months ended March 31 | ||||||||
(Dollars in millions) | 2017 | 2016 | V% | |||||
Industrial segment revenues (GAAP) | 26,016 | 25,869 | 1 % | |||||
Less adjustments: | ||||||||
Acquisitions | 132 | 1 | ||||||
Business dispositions (other than dispositions of businesses acquired for investment) | 10 | 1,556 | ||||||
Currency exchange rates | (108) | - | ||||||
Industrial segment organic revenues (Non-GAAP) | $ | 25,981 | $ | 24,312 | 7 % | |||
Organic revenue growth measures revenue growth excluding the effects of acquisitions, business dispositions and currency exchange rates. We believe that this measure provides management and investors with a more complete understanding of underlying operating results and trends of established, ongoing operations by excluding the effect of acquisitions, dispositions and currency exchange, which activities are subject to volatility and can obscure underlying trends. We also believe that presenting organic revenue growth separately for our industrial businesses provides management and investors with useful information about the trends of our industrial businesses and enables a more direct comparison to other non-financial businesses and companies. Management recognizes that the term "organic revenue growth" may be interpreted differently by other companies and under different circumstances. Although this may have an effect on comparability of absolute percentage growth from company to company, we believe that these measures are useful in assessing trends of the respective businesses or companies and may therefore be a useful tool in assessing period-to-period performance trends.
2017 1Q FORM 10-Q 49
OPERATING AND NON-OPERATING PENSION COST | |||||
Three months ended March 31 | |||||
(In millions) | 2017 | 2016 | |||
Service cost for benefits earned | $ | 289 | $ | 315 | |
Prior service cost amortization | 73 | 76 | |||
Curtailment loss | 43 | - | |||
Operating pension cost (Non-GAAP) | 405 | 391 | |||
Expected return on plan assets | (849) | (834) | |||
Interest cost on benefit obligations | 717 | 734 | |||
Net actuarial loss amortization | 710 | 612 | |||
Non-operating pension cost (Non-GAAP) | 578 | 512 | |||
Total principal pension plans cost (GAAP) | $ | 983 | $ | 903 | |
We have provided the operating and non-operating components of cost for our principal pension plans. Operating pension cost comprises the service cost of benefits earned, prior service cost amortization and curtailment loss for our principal pension plans. Non-operating pension cost comprises the expected return on plan assets, interest cost on benefit obligations and net actuarial loss amortization for our principal pension plans. We believe that the operating components of pension cost better reflect the ongoing service-related cost of providing pension benefits to our employees. We believe that the operating and non-operating components of cost for our principal pension plans, considered along with the corresponding GAAP measure, provide management and investors with additional information for comparison of our pension plan cost and operating results with the pension plan cost and operating results of other companies.
ADJUSTED CORPORATE COSTS (OPERATING) | ||||||
Three months ended March 31 | ||||||
(In millions) | 2017 | 2016 | ||||
Total Corporate Items and Eliminations (GAAP) | $ | (2,009) | $ | (1,571) | ||
Less: non-operating pension cost (Non-GAAP) | (578) | (512) | ||||
Total Corporate costs (operating) (Non-GAAP) | $ | (1,431) | $ | (1,059) | ||
Less: restructuring and other charges, and gains (losses) on disposals | (1,018) | (627) | ||||
Adjusted total corporate costs (operating) (Non-GAAP) | $ | (414) | $ | (431) | ||
Operating corporate costs exclude non-service-related pension cost of our principal pension plans, which comprise interest cost, expected return on plan assets and amortization of actuarial gains/losses. Service cost, prior service cost and curtailment loss components of our principal pension plans are included in operating corporate costs. We believe that these components of pension cost better reflect the ongoing service-related costs of providing pension benefits to our employees. Accordingly, we believe that our measure of operating corporate costs provides management and investors with a useful measure of the operational costs incurred outside of our businesses. We believe that this measure, considered along with the corresponding GAAP measure, provides management and investors with additional information for comparison of our operating corporate costs to the operating corporate costs of other companies.
We also believe that adjusting operating corporate costs to exclude the effects of items that are not closely associated with ongoing corporate operations, such as earnings of previously divested businesses, gains and losses on disposed and held for sale businesses, and restructuring and other charges, provides management and investors with a meaningful measure that increases the period-to-period comparability of our ongoing corporate costs.
2017 1Q FORM 10-Q 50
INDUSTRIAL OPERATING AND GE CAPITAL EARNINGS (LOSS) FROM CONTINUING OPERATIONS AND EPS | |||||||
Three months ended March 31 | |||||||
(Dollars in millions; except per share amounts) | 2017 | 2016 | V% | ||||
Consolidated earnings (loss) from continuing operations attributable to GE common shareowners (GAAP) | $ | 858 | $ | 248 | F | ||
Non-operating pension cost | 578 | 512 | |||||
Tax effect on non-operating pension cost(a) | (202) | (179) | |||||
Adjustment: non-operating pension cost (net of tax) | 376 | 333 | 13% | ||||
Operating earnings (loss) (Non-GAAP) | 1,234 | 581 | |||||
Less: GE Capital earnings (loss) from continuing operations attributable to GE common shareowners | (47) | (892) | |||||
Industrial operating earnings (loss) (Non-GAAP) | $ | 1,281 | $ | 1,473 | (13)% | ||
Earnings (loss) per share – diluted(b) | |||||||
Consolidated EPS from continuing operations attributable to GE common shareowners (GAAP) | $ | 0.10 | $ | 0.03 | F | ||
Adjustment: non-operating pension cost (net of tax) | 0.04 | 0.04 | |||||
Operating EPS (Non-GAAP) | 0.14 | 0.06 | F | ||||
Less: GE Capital EPS from continuing operations attributable to GE common shareowners (GAAP) | (0.01) | (0.10) | 90% | ||||
Industrial operating EPS (Non-GAAP) | $ | 0.14 | $ | 0.16 | (13)% | ||
(a) | The tax effect of non-operating pension cost was calculated using a 35% U.S. federal statutory tax rate, based on its applicability to such cost. |
(b) | Earnings-per-share amounts are computed independently. As a result, the sum of per-share amounts may not equal the total. |
Operating earnings (loss) excludes non-service related pension costs of our principal pension plans, which comprise interest cost, expected return on plan assets and amortization of actuarial gains/losses. Service cost, prior service cost and curtailment loss components of our principal pension plans are included in operating earnings. We believe that these components of pension cost better reflect the ongoing service-related costs of providing pension benefits to our employees. As such, we believe that our measure of operating earnings (loss) provides management and investors with a useful measure of the operational results of our business. Other components of GAAP pension cost are mainly driven by capital allocation decisions and market performance, and we manage these separately from the operational performance of our businesses. Neither GAAP nor operating pension cost are necessarily indicative of the current or future cash flow requirements related to our pension plans. We also believe that this measure, considered along with the corresponding GAAP measure, provides management and investors with additional information for comparison of our operating results to the operating results of other companies. We believe that presenting operating earnings separately for our industrial businesses also provides management and investors with useful information about the relative size of our industrial and financial services businesses in relation to the total company.
2017 1Q FORM 10-Q 51
INDUSTRIAL OPERATING + VERTICALS EARNINGS AND EPS | |||||||
Three months ended March 31 | |||||||
(Dollars in millions; except per share amounts) | 2017 | 2016 | V% | ||||
GE Capital earnings (loss) from continuing operations attributable to GE common shareowners (GAAP) | $ | (47) | $ | (892) | 95% | ||
Less: GE Capital other continuing earnings (loss) (Other Capital) | (582) | (1,389) | |||||
Verticals earnings(a) | 535 | 496 | 8% | ||||
Industrial operating earnings (Non-GAAP) |
| 1,281 |
| 1,473 | (13)% | ||
Industrial operating earnings + Verticals earnings (Non-GAAP) | $ | 1,816 | $ | 1,970 | (8)% | ||
Earnings (loss) per share - diluted(b) | |||||||
GE Capital EPS from continuing operations attributable to GE common shareowners (GAAP) | $ | (0.01) | $ | (0.10) | 90% | ||
Less: GE Capital other continuing EPS (Other Capital) | (0.07) | (0.15) | |||||
Verticals EPS | 0.06 | 0.05 | 20% | ||||
Industrial operating EPS (Non-GAAP) | 0.14 | 0.16 | (13)% | ||||
Industrial operating + Verticals EPS (Non-GAAP) | $ | 0.21 | $ | 0.21 | 0% | ||
(a) | Verticals include businesses expected to be retained (GECAS, Energy Financial Services, Industrial Finance, and run-off insurance activities), including allocated corporate after-tax costs of $25 million in both the three months ended March 31, 2017 and 2016. |
(b) | Earnings-per-share amounts are computed independently. As a result, the sum of per-share amounts may not equal the total. |
As described above, Verticals represents the GE Capital businesses that we expect to retain. We believe that presenting Industrial operating + Verticals earnings-per-share amounts provides management and investors with a useful measure to evaluate the performance of the businesses we expect to retain after the disposition of most of our financial services business.
See below for a graphic presentation of the reconciliation between GAAP EPS from continuing operations to the Industrial operating + Verticals EPS.
INDUSTRIAL OPERATING + VERTICALS EARNINGS AND EPS(a) | |||||
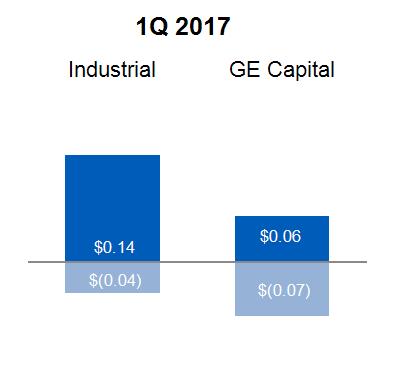
|
Industrial operating & Verticals $0.21
Non-operating pension & other Capital $(0.11) |
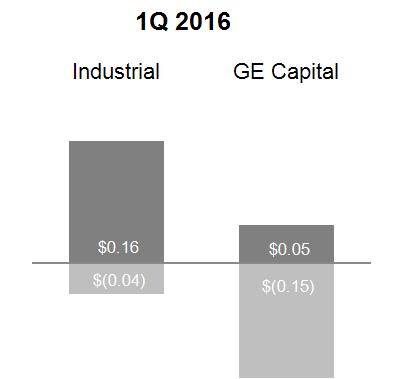 |
Industrial operating & Verticals $0.21
Non-operating pension & other Capital $(0.18) | ||
GAAP Continuing EPS |
| $0.10 | $0.03 | ||
(a) | Earnings-per-share amounts are computed independently. As a result, the sum of per share amounts may not equal the total. |
2017 1Q FORM 10-Q 52
INDUSTRIAL OPERATING PROFIT AND OPERATING PROFIT MARGIN (EXCLUDING CERTAIN ITEMS) | |||||
Three months ended March 31 | |||||
(Dollars in millions) | 2017 | 2016 | |||
Revenues | |||||
GE total revenues and other income | $ | 25,481 | $ | 24,607 | |
Less: GE Capital earnings (loss) from continuing operations | (47) | (892) | |||
GE revenues and other income excluding GE Capital earnings (Industrial revenues) (GAAP) | $ | 25,528 | $ | 25,499 | |
Less: gains on disposals | 2 | 59 | |||
Adjusted Industrial revenues (Non-GAAP) | 25,526 | 25,440 | |||
Costs | |||||
GE total costs and expenses | $ | 24,558 | $ | 24,313 | |
Less: GE interest and other financial charges | 564 | 440 | |||
Industrial costs excluding interest and other financial charges (GAAP) | $ | 23,994 | $ | 23,873 | |
Less: non-operating pension cost | 578 | 512 | |||
Less: restructuring and other charges | 1,020 | 686 | |||
Less: noncontrolling interests | 78 | 117 | |||
Adjusted Industrial costs (Non-GAAP) | $ | 22,318 | $ | 22,558 | |
Industrial profit (GAAP) | $ | 1,534 | $ | 1,626 | |
Industrial margins (GAAP) | 6.0% | 6.4% | |||
Industrial operating profit (Non-GAAP) | $ | 3,208 | $ | 2,883 | |
Industrial operating profit margins (Non-GAAP) | 12.6% | 11.3% | |||
. | |||||
We have presented our Industrial operating profit and operating profit margin excluding gains, non-operating pension cost, restructuring and other, noncontrolling interests, GE Capital preferred stock dividends. We believe that Industrial operating profit and operating profit margin adjusted for these items are meaningful measures because they increase the comparability of period-to-period results.
2017 1Q FORM 10-Q 53
INDUSTRIAL CASH FLOWS FROM OPERATING ACTIVITIES (INDUSTRIAL CFOA) | |||||||
Three months ended March 31 | |||||||
(Dollars in millions) | 2017 | 2016 | V% | ||||
Cash from GE's operating activities (continuing operations), as reported (GAAP) | $ | 370 | $ | 7,902 | (95)% | ||
Adjustments: dividends from GE Capital | 2,000 | 7,500 | |||||
Industrial CFOA (Non-GAAP) | $ | (1,630) | $ | 402 | U | ||
We define "Industrial CFOA" as GE's cash from operating activities (continuing operations) less the amount of dividends received by GE from GE Capital. This reflects the effects of intercompany transactions, which include, but are not limited to, the following: GE Capital working capital solutions to optimize GE cash management; GE Capital enabled GE industrial orders; aircraft engines, power equipment and healthcare equipment manufactured by GE that are installed on GE Capital investments, including leased equipment; expenses related to parent-subsidiary pension plans; buildings and equipment leased between GE and GE Capital, including sale-leaseback transactions; information technology (IT) and other services sold to GE Capital by GE; and various investments, loans and allocations of GE corporate overhead costs.
We believe that investors may find it useful to compare GE's operating cash flows without the effect of GE Capital dividends, since these dividends are not representative of the operating cash flows of our industrial businesses and can vary from period to period based upon the results of the financial services businesses. Management recognizes that these measures may not be comparable to cash flow results of companies which contain both industrial and financial services businesses, but believes that this comparison is aided by the provision of additional information about the amounts of dividends paid by our financial services business and the separate presentation in our financial statements of the GE Capital cash flows. We believe that our measure of Industrial CFOA provides management and investors with useful measures to compare the capacity of our industrial operations to generate operating cash flow with the operating cash flow of other non-financial businesses and companies and as such provides useful measures to supplement the reported GAAP CFOA measure.
2017 1Q FORM 10-Q 54
CONTROLS AND PROCEDURES
Under the direction of our Chief Executive Officer and Chief Financial Officer, we evaluated our disclosure controls and procedures and internal control over financial reporting and concluded that (i) our disclosure controls and procedures were effective as of March 31, 2017, and (ii) no change in internal control over financial reporting occurred during the quarter ended March 31, 2017, that has materially affected, or is reasonably likely to materially affect, such internal control over financial reporting.
2017 1Q FORM 10-Q 55
OTHER FINANCIAL DATA
PURCHASES OF EQUITY SECURITIES BY THE ISSUER AND AFFILIATED PURCHASERS | ||||||||||
Approximate | ||||||||||
dollar value | ||||||||||
Total number | of shares that | |||||||||
of shares | may yet be | |||||||||
purchased | purchased | |||||||||
as part of | under our | |||||||||
Total number | Average | our share | share | |||||||
of shares | price paid | repurchase | repurchase | |||||||
Period | purchased | per share | program(a) | program(a) | ||||||
(Shares in thousands) | ||||||||||
2017 | ||||||||||
January(b) | 28,507 | $ | 30.61 | 28,507 | ||||||
February | 23,399 | 29.81 | 23,399 | |||||||
March | 26,070 | 29.76 | 26,070 | |||||||
Total | 77,976 | $ | 30.09 | 77,976 | $ | 22.3 | billion | |||
| (a) | Shares were repurchased through the 2015 GE Share Repurchase Program (the Program). As of March 31, 2017, we were authorized to repurchase up to $50.0 billion of our common stock through 2018 and we had repurchased a total of approximately $27.7 billion under the Program. The Program is flexible and shares will be acquired with a combination of borrowings and free cash flow from the public markets and other sources, including GE Stock Direct, a stock purchase plan that is available to the public. |
| (b) | Includes 10,773 thousand shares repurchased at an average price of $31.45 per share pursuant to an ASR agreement we entered in the fourth quarter of 2016. For further discussion on ASRs, see Note 15 to the consolidated financial statements of our 2016 annual report on Form 10-K. |
2017 1Q FORM 10-Q 56
LEGAL PROCEEDINGS
The following information supplements and amends our discussion set forth under "Legal Proceedings" in our Annual Report on Form 10-K for the fiscal year ended December 31, 2016.
WMC. There are 11 lawsuits in which our discontinued U.S. mortgage business, WMC, is a party. The adverse parties in 10 of these cases are securitization trustees or parties claiming to act on their behalf. While the alleged claims for relief vary from case to case, the complaints and counterclaims in these actions generally assert claims for breach of contract, indemnification, and/or declaratory judgment, and seek specific performance (repurchase) and/or monetary damages. Beginning in the fourth quarter 2013, WMC entered into settlements that reduced its exposure on claims asserted in certain securitizations, and the claim amounts reported herein reflect the effect of these settlements.
Five WMC cases are pending in the United States District Court for the District of Connecticut. Four of these cases were initiated in 2012, and one was initiated in the third quarter 2013. Deutsche Bank National Trust Company (Deutsche Bank) is the adverse party in four cases, and Law Debenture Trust Company of New York (Law Debenture) is the adverse party in one case. The Deutsche Bank complaints assert claims on approximately $4,300 million of mortgage loans and seek to recover damages in excess of approximately $1,800 million. The Law Debenture complaint asserts claims on approximately $800 million of mortgage loans, and alleges losses on these loans in excess of approximately $425 million. In September 2016, WMC and Deutsche Bank agreed to settle all claims arising out of the four securitizations at issue in the Connecticut lawsuits, subject to judicial approvals. In October 2016, Deutsche Bank filed petitions for instruction in California state court seeking judicial instructions that Deutsche Bank's entry into the settlement agreements was a reasonable exercise of its discretion and approving the distribution of settlement proceeds pursuant to the terms of each trust's governing documents. No bondholder in any of these securitizations has objected to the proposed settlements.
Four cases are pending against WMC in New York State Supreme Court, all of which were initiated by securitization trustees or securities administrators. These cases involve, in the aggregate, claims involving approximately $4,559 million of mortgage loans. One of these lawsuits was initiated by Deutsche Bank in the second quarter 2013 and names as defendants WMC and Barclays Bank PLC. It involves claims against WMC on approximately $1,000 million of mortgage loans and does not specify the amount of damages sought. In September 2016, WMC and Deutsche Bank agreed to settle all claims arising out of the two securitizations at issue in this lawsuit, subject to judicial approvals. In October 2016, Deutsche Bank filed petitions for instruction in California state court seeking judicial instructions that Deutsche Bank's entry into the settlement agreements was a reasonable exercise of its discretion and approving the distribution of settlement proceeds pursuant to the terms of each trust's governing documents. On March 30 and April 2, 2017, bondholders in these two securitizations filed objections to the proposed settlements. The court has set an initial hearing on these objections for July 27, 2017. The second case, in which the plaintiff is The Bank of New York Mellon (BNY), was initiated in the fourth quarter 2012 and names as defendants WMC, J.P. Morgan Mortgage Acquisition Corporation and JPMorgan Chase Bank, N.A. BNY asserts claims on approximately $1,300 million of mortgage loans, and seeks to recover damages in excess of $650 million. The third case was initiated by BNY in November 2013 and names as defendants WMC, J.P. Morgan Mortgage Acquisition Corporation and JPMorgan Chase Bank, N.A. In this case, BNY asserts claims on approximately $1,300 million of mortgage loans, and seeks to recover damages in excess of $600 million. On September 18, 2015, the court granted defendants' motion to dismiss this case on statute of limitations grounds, and the plaintiff filed a notice of appeal on October 21, 2015. The fourth case was filed in October 2014 and names as defendants WMC, J.P. Morgan Mortgage Acquisition Corporation and JPMorgan Chase Bank, N.A. The plaintiff, BNY, asserts claims on approximately $959 million of mortgage loans and seeks to recover damages in excess of $475 million.
2017 1Q FORM 10-Q 57
One case is pending against WMC in the United States District Court for the Southern District of New York. The case was initiated by the Federal Housing Finance Agency (FHFA) in the fourth quarter 2012. In the second quarter 2013, Deutsche Bank, in its role as securitization trustee, intervened as a plaintiff and filed a complaint relating to approximately $1,300 million of loans and alleging losses in excess of approximately $100 million. In December 2013, the District Court issued an order denying WMC's motion to dismiss but, on its own motion, ordered re-briefing on several issues raised by WMC's motion to dismiss in February 2015. On July 10, 2015, the District Court entered an order dismissing the lawsuit as time-barred under the applicable statute of limitations. Deutsche Bank filed a notice of appeal from this order of dismissal on August 13, 2015, and the United States Court of Appeals for the Second Circuit heard oral argument on June 10, 2016. In September 2016, WMC and Deutsche Bank agreed to settle all claims arising out of the securitization at issue in this lawsuit, subject to judicial approval. In October 2016, Deutsche Bank filed a petition for instruction in California state court seeking judicial instructions that Deutsche Bank's entry into the settlement agreement was a reasonable exercise of its discretion and approving the distribution of settlement proceeds pursuant to the terms of the trust's governing documents. No bondholder in this securitization has objected to the proposed settlement. The court has set a hearing on this petition, and the other petitions filed by Deutsche Bank referenced above to which no objection has been filed, for June 16, 2017.
The amounts of the claims at issue in these cases (discussed above) reflect the purchase price or unpaid principal balances of the mortgage loans at issue at the time of purchase and do not give effect to pay downs, accrued interest or fees, or potential recoveries based upon the underlying collateral. All of the mortgage loans involved in these lawsuits are included in WMC's reported claims at March 31, 2017. See Note 18 to the consolidated financial statements for additional information.
On January 23, 2017, the ResCap Liquidating Trust, as successor to Residential Funding Company, LLC (RFC), filed a lawsuit seeking unspecified damages against WMC in the United States District Court for the District of Minnesota arising from alleged breaches in representations and warranties made by WMC in connection with the sale of approximately $840 million in loans to RFC over a period of time preceding RFC's filing for bankruptcy protection in May 2012.
In December 2015, we learned that, as part of continuing industry-wide investigation of subprime mortgages, the Civil Division of the U.S. Department of Justice is investigating potential violations of the Financial Institutions Reform, Recovery, and Enforcement Act of 1989 (FIRREA) by WMC and its affiliates arising out of the origination, purchase or sale of residential mortgage loans between January 1, 2005 and December 31, 2007. The Justice Department subsequently issued subpoenas to WMC and GE Capital, and we are cooperating with the Justice Department's investigation, including providing documents and witnesses for interviews.
Alstom legacy matters. In connection with our acquisition of Alstom's Thermal, Renewables and Grid businesses in November 2015, we are subject to legacy legal proceedings and legal compliance risks that relate to claimed anti-competitive conduct or improper payments by Alstom in the pre-acquisition period. See Note 18 to the consolidated financial statements for additional information. These include legacy matters related to alleged improper payments by Alstom in connection with contracts won in 2006 and 2008 for work on a state-owned power plant in Šoštanj, Slovenia. In January and February 2017, respectively, the power plant owner filed an arbitration claim for damages of approximately $430 million before the International Chamber of Commerce Court of Arbitration in Vienna, Austria, and a government investigation in Slovenia of the same underlying conduct proceeded to an investigative phase overseen by a judge of the Celje District Court.
2017 1Q FORM 10-Q 58
FINANCIAL STATEMENTS AND NOTES
Statement of Earnings (Loss) | 60 | |||
Consolidated Statement of Comprehensive Income (Loss) | 62 | |||
Consolidated Statement of Changes in Shareowners' Equity | 63 | |||
Statement of Financial Position | 64 | |||
Statement of Cash Flows | 66 | |||
Notes to Consolidated Financial Statements | ||||
1 | Basis of Presentation and Summary of Significant Accounting Policies | 68 | ||
2 | Businesses Held for Sale and Discontinued Operations | 69 | ||
3 | Investment Securities | 71 | ||
4 | Current Receivables | 72 | ||
5 | Inventories | 73 | ||
6 | GE Capital Financing Receivables and Allowance for Losses on Financing Receivables | 73 | ||
7 | Property, Plant and Equipment | 74 | ||
8 | Acquisitions, Goodwill and Other Intangible Assets | 74 | ||
9 | Contract Assets | 76 | ||
10 | Borrowings | 77 | ||
11 | Postretirement Benefit Plans | 78 | ||
12 | Income Taxes | 79 | ||
13 | Shareowners' Equity | 80 | ||
14 | Earnings Per Share Information | 84 | ||
15 | Fair Value Measurements | 85 | ||
16 | Financial Instruments | 88 | ||
17 | Variable Interest Entities | 94 | ||
18 | Commitments, Guarantees, Product Warranties and Other Loss Contingencies | 96 | ||
19 | Intercompany Transactions | 99 | ||
20 | Guarantor Financial Information | 101 | ||
21 | Supplemental Information | 106 | ||
2017 1Q FORM 10-Q 59
FINANCIAL STATEMENTS
STATEMENT OF EARNINGS (LOSS) | |||||
(UNAUDITED) | |||||
Three months ended March 31 | |||||
General Electric Company | |||||
and consolidated affiliates | |||||
(In millions; per-share amounts in dollars) | 2017 | 2016 | |||
Revenues and other income | |||||
Sales of goods | $ | 16,812 | $ | 17,208 | |
Sales of services | 8,416 | 8,106 | |||
Other income | 168 | 9 | |||
GE Capital earnings (loss) from continuing operations | - | - | |||
GE Capital revenues from services | 2,264 | 2,522 | |||
Total revenues and other income | 27,660 | 27,845 | |||
Costs and expenses | |||||
Cost of goods sold | 14,490 | 14,588 | |||
Cost of services sold | 5,869 | 5,773 | |||
Selling, general and administrative expenses | 4,506 | 4,608 | |||
Interest and other financial charges | 1,139 | 1,736 | |||
Investment contracts, insurance losses and | |||||
insurance annuity benefits | 634 | 642 | |||
Other costs and expenses | 190 | 259 | |||
Total costs and expenses | 26,829 | 27,606 | |||
Earnings (loss) from continuing operations before income taxes | 832 | 238 | |||
Benefit (provision) for income taxes | (16) | 177 | |||
Earnings (loss) from continuing operations | 816 | 415 | |||
Earnings (loss) from discontinued operations, net of taxes (Note 2) | (239) | (308) | |||
Net earnings (loss) | 577 | 107 | |||
Less net earnings (loss) attributable to noncontrolling interests | (76) | (121) | |||
Net earnings (loss) attributable to the Company | 653 | 228 | |||
Preferred stock dividends | (34) | (289) | |||
Net earnings (loss) attributable to GE common shareowners | $ | 619 | $ | (61) | |
Amounts attributable to GE common shareowners | |||||
Earnings (loss) from continuing operations | $ | 816 | $ | 415 | |
Less net earnings (loss) attributable to noncontrolling interests, | |||||
continuing operations | (76) | (122) | |||
Earnings (loss) from continuing operations attributable to the Company | 892 | 537 | |||
Preferred stock dividends | (34) | (289) | |||
Earnings (loss) from continuing operations attributable | |||||
to GE common shareowners | 858 | 248 | |||
Earnings (loss) from discontinued operations, net of taxes | (239) | (308) | |||
Less net earnings (loss) attributable to | |||||
noncontrolling interests, discontinued operations | - | - | |||
Net earnings (loss) attributable to GE common shareowners | $ | 619 | $ | (61) | |
Per-share amounts (Note 14) | |||||
Earnings (loss) from continuing operations | |||||
Diluted earnings (loss) per share | $ | 0.10 | $ | 0.03 | |
Basic earnings (loss) per share | $ | 0.10 | $ | 0.03 | |
Net earnings (loss) | |||||
Diluted earnings (loss) per share | $ | 0.07 | $ | (0.01) | |
Basic earnings (loss) per share | $ | 0.07 | $ | (0.01) | |
Dividends declared per common share | $ | 0.24 | $ | 0.23 | |
Amounts may not add due to rounding.
See accompanying notes.
2017 1Q FORM 10-Q 60
STATEMENT OF EARNINGS (LOSS) (CONTINUED) | |||||||||||
(UNAUDITED) | |||||||||||
Three months ended March 31 | |||||||||||
GE(a) | Financial Services (GE Capital) | ||||||||||
(In millions; per-share amounts in dollars) | 2017 | 2016 | 2017 | 2016 | |||||||
Revenues and other income | |||||||||||
Sales of goods | $ | 16,838 | $ | 17,213 | $ | 29 | $ | 25 | |||
Sales of services | 8,554 | 8,194 | - | - | |||||||
Other income | 137 | 92 | - | - | |||||||
GE Capital earnings (loss) from continuing operations | (47) | (892) | - | - | |||||||
GE Capital revenues from services | - | - | 2,652 | 2,860 | |||||||
Total revenues and other income | 25,481 | 24,607 | 2,681 | 2,885 | |||||||
Costs and expenses | |||||||||||
Cost of goods sold | 14,522 | 14,597 | 23 | 20 | |||||||
Cost of services sold | 5,452 | 5,293 | 562 | 568 | |||||||
Selling, general and administrative expenses | 4,020 | 3,982 | 574 | 874 | |||||||
Interest and other financial charges | 564 | 440 | 812 | 1,430 | |||||||
Investment contracts, insurance losses and | |||||||||||
insurance annuity benefits | - | - | 636 | 671 | |||||||
Other costs and expenses | - | - | 214 | 268 | |||||||
Total costs and expenses | 24,558 | 24,313 | 2,820 | 3,833 | |||||||
Earnings (loss) from continuing operations before income taxes | 923 | 294 | (139) | (948) | |||||||
Benefit (provision) for income taxes | (143) | (164) | 128 | 341 | |||||||
Earnings (loss) from continuing operations | 780 | 130 | (11) | (608) | |||||||
Earnings (loss) from discontinued operations, net of taxes (Note 2) | (239) | (309) | (242) | (308) | |||||||
Net earnings (loss) | 541 | (178) | (253) | (916) | |||||||
Less net earnings (loss) attributable to noncontrolling interests | (78) | (117) | 2 | (4) | |||||||
Net earnings (loss) attributable to the Company | 619 | (61) | (256) | (912) | |||||||
Preferred stock dividends | - | - | (34) | (289) | |||||||
Net earnings (loss) attributable to GE common shareowners | $ | 619 | $ | (61) | $ | (290) | $ | (1,201) | |||
Amounts attributable to GE common shareowners: | |||||||||||
Earnings (loss) from continuing operations | $ | 780 | $ | 130 | $ | (11) | $ | (608) | |||
Less net earnings (loss) attributable to noncontrolling interests, | |||||||||||
continuing operations | (78) | (117) | 2 | (4) | |||||||
Earnings (loss) from continuing operations attributable to the Company | 858 | 248 | (13) | (603) | |||||||
Preferred stock dividends | - | - | (34) | (289) | |||||||
Earnings (loss) from continuing operations attributable | |||||||||||
to GE common shareowners | 858 | 248 | (47) | (892) | |||||||
Earnings (loss) from discontinued operations, net of taxes | (239) | (309) | (242) | (308) | |||||||
Less net earnings (loss) attributable to | |||||||||||
noncontrolling interests, discontinued operations | - | - | - | - | |||||||
Net earnings (loss) attributable to GE common shareowners | $ | 619 | $ | (61) | $ | (290) | $ | (1,201) | |||
(a) | Represents the adding together of all affiliated companies except GE Capital, which is presented on a one-line basis. See Note 1. |
Amounts may not add due to rounding.
In the consolidating data on this page, "GE" means the basis of consolidation as described in Note 1 to the consolidated financial statements; "GE Capital" means GE Capital Global Holdings, LLC (GECGH) and its predecessor General Electric Capital Corporation (GECC) and all of their affiliates and associated companies. Separate information is shown for "GE" and "Financial Services (GE Capital)." Transactions between GE and GE Capital have been eliminated from the "General Electric Company and consolidated affiliates" columns on the prior page.
2017 1Q FORM 10-Q 61
GENERAL ELECTRIC COMPANY AND CONSOLIDATED AFFILIATES | |||||
CONSOLIDATED STATEMENT OF COMPREHENSIVE INCOME (LOSS) | |||||
(UNAUDITED) | |||||
Three months ended March 31 | |||||
(In millions) | 2017 | 2016 | |||
Net earnings (loss) | $ | 577 | $ | 107 | |
Less net earnings (loss) attributable to noncontrolling interests | (76) | (121) | |||
Net earnings (loss) attributable to the Company | $ | 653 | $ | 228 | |
Other comprehensive income (loss) | |||||
Investment securities | $ | (52) | $ | 220 | |
Currency translation adjustments | 815 | 1 | |||
Cash flow hedges | 20 | 55 | |||
Benefit plans | 1,049 | 550 | |||
Other comprehensive income (loss) | 1,833 | 826 | |||
Less other comprehensive income (loss) attributable to noncontrolling interests | 6 | 2 | |||
Other comprehensive income (loss) attributable to the Company | $ | 1,827 | $ | 824 | |
Comprehensive income (loss) | $ | 2,410 | $ | 933 | |
Less comprehensive income (loss) attributable to noncontrolling interests | (70) | (119) | |||
Comprehensive income (loss) attributable to the Company | $ | 2,479 | $ | 1,052 | |
Amounts presented net of taxes.
Amounts may not add due to rounding.
See accompanying notes.
2017 1Q FORM 10-Q 62
GENERAL ELECTRIC COMPANY AND CONSOLIDATED AFFILIATES | |||||
CONSOLIDATED STATEMENT OF CHANGES IN SHAREOWNERS' EQUITY | |||||
(UNAUDITED) | |||||
Three months ended March 31 | |||||
(In millions) | 2017 | 2016 | |||
Shareowners' equity balance at January 1 | $ | 75,828 | $ | 98,274 | |
Net earnings (loss) attributable to the Company | 653 | 228 | |||
Dividends and other transactions with shareowners | (2,128) | (2,429) | |||
Redemption value adjustment for redeemable noncontrolling interests | (73) | (32) | |||
Other comprehensive income (loss) attributable to the Company | 1,827 | 824 | |||
Net sales (purchases) of shares for treasury | (1,795) | (5,503) | |||
Changes in other capital | 224 | (274) | |||
Ending balance at March 31 | 74,534 | 91,088 | |||
Noncontrolling interests | 1,639 | 1,667 | |||
Total equity balance at March 31 | $ | 76,173 | $ | 92,755 | |
Amounts may not add due to rounding.
See accompanying notes.
2017 1Q FORM 10-Q 63
STATEMENT OF FINANCIAL POSITION | |||||
General Electric Company | |||||
and consolidated affiliates | |||||
(In millions, except share amounts) | March 31, 2017 | December 31, 2016 | |||
(Unaudited) | |||||
Assets | |||||
Cash and equivalents | $ | 41,564 | $ | 48,129 | |
Investment securities (Note 3) | 41,949 | 44,313 | |||
Current receivables (Note 4) | 21,675 | 24,076 | |||
Inventories (Note 5) | 22,701 | 22,354 | |||
Financing receivables – net (Note 6) | 12,243 | 12,242 | |||
Other GE Capital receivables | 5,804 | 5,944 | |||
Property, plant and equipment – net (Note 7) | 49,016 | 50,518 | |||
Receivable from GE Capital (debt assumption) | - | - | |||
Investment in GE Capital | - | - | |||
Goodwill (Note 8) | 70,313 | 70,438 | |||
Other intangible assets – net (Note 8) | 16,515 | 16,436 | |||
Contract assets (Note 9) | 27,382 | 25,162 | |||
All other assets | 27,668 | 27,176 | |||
Deferred income taxes (Note 12) | 953 | 1,833 | |||
Assets of businesses held for sale (Note 2) | 4,076 | 1,745 | |||
Assets of discontinued operations (Note 2) | 9,786 | 14,815 | |||
Total assets(a) | $ | 351,643 | $ | 365,183 | |
Liabilities and equity | |||||
Short-term borrowings (Note 10) | $ | 28,324 | $ | 30,714 | |
Accounts payable, principally trade accounts | 13,698 | 14,435 | |||
Progress collections and price adjustments accrued | 16,583 | 16,760 | |||
Dividends payable | 2,109 | 2,107 | |||
Other GE current liabilities | 17,097 | 17,564 | |||
Non-recourse borrowings of consolidated securitization entities (Note 10) | 668 | 417 | |||
Long-term borrowings (Note 10) | 99,674 | 105,080 | |||
Investment contracts, insurance liabilities and insurance annuity benefits | 26,301 | 26,086 | |||
Non-current compensation and benefits | 43,035 | 43,780 | |||
All other liabilities | 22,041 | 22,912 | |||
Liabilities of businesses held for sale (Note 2) | 1,144 | 656 | |||
Liabilities of discontinued operations (Note 2) | 1,741 | 4,158 | |||
Total liabilities(a) | 272,416 | 284,668 | |||
Redeemable noncontrolling interests (Note 13) | 3,054 | 3,025 | |||
Preferred stock (5,944,250 shares outstanding at both March 31, 2017 | |||||
and December 31, 2016) | 6 | 6 | |||
Common stock (8,683,963,000 and 8,742,614,000 shares outstanding | |||||
at March 31, 2017 and December 31, 2016, respectively) | 702 | 702 | |||
Accumulated other comprehensive income (loss) – net attributable to GE(b) | |||||
Investment securities | 622 | 674 | |||
Currency translation adjustments | (6,004) | (6,816) | |||
Cash flow hedges | 32 | 12 | |||
Benefit plans | (11,421) | (12,469) | |||
Other capital | 37,448 | 37,224 | |||
Retained earnings | 137,983 | 139,532 | |||
Less common stock held in treasury | (84,833) | (83,038) | |||
Total GE shareowners' equity | 74,534 | 75,828 | |||
Noncontrolling interests(c) (Note 13) | 1,639 | 1,663 | |||
Total equity (Note 13) | 76,173 | 77,491 | |||
Total liabilities, redeemable noncontrolling interests and equity | $ | 351,643 | $ | 365,183 | |
(a) | Our consolidated assets at March 31, 2017 included total assets of $5,917 million of certain variable interest entities (VIEs) that can only be used to settle the liabilities of those VIEs. These assets included current receivables and net financing receivables of $1,512 million and investment securities of $976 million within continuing operations and assets of discontinued operations of $677 million. Our consolidated liabilities at March 31, 2017 included liabilities of certain VIEs for which the VIE creditors do not have recourse to GE. These liabilities included non-recourse borrowings of consolidated securitization entities (CSEs) of $(668) million within continuing operations. See Note 17. |
(b) | The sum of accumulated other comprehensive income (loss) (AOCI) attributable to the Company was $(16,771) million and $(18,598) million at March 31, 2017 and December 31, 2016, respectively. |
(c) | Included AOCI attributable to noncontrolling interests of $(272) million and $(278) million at March 31, 2017 and December 31, 2016, respectively. |
Amounts may not add due to rounding.
See accompanying notes.
2017 1Q FORM 10-Q 64
STATEMENT OF FINANCIAL POSITION (CONTINUED) | |||||||||||
GE(a) | Financial Services (GE Capital) | ||||||||||
(In millions, except share amounts) | March 31, 2017 | December 31, 2016 | March 31, 2017 | December 31, 2016 | |||||||
(Unaudited) | (Unaudited) | ||||||||||
Assets | |||||||||||
Cash and equivalents | $ | 7,875 | $ | 10,525 | $ | 33,689 | $ | 37,604 | |||
Investment securities (Note 3) | 200 | 137 | 41,754 | 44,180 | |||||||
Current receivables (Note 4) | 12,646 | 12,715 | - | - | |||||||
Inventories (Note 5) | 22,615 | 22,263 | 86 | 91 | |||||||
Financing receivables – net (Note 6) | - | - | 23,853 | 26,041 | |||||||
Other GE Capital receivables | - | - | 14,825 | 15,576 | |||||||
Property, plant and equipment – net (Note 7) | 18,955 | 19,103 | 30,962 | 32,225 | |||||||
Receivable from GE Capital (debt assumption) (b) | 50,317 | 58,780 | - | - | |||||||
Investment in GE Capital | 22,792 | 24,677 | - | - | |||||||
Goodwill (Note 8) | 67,946 | 68,070 | 2,368 | 2,368 | |||||||
Other intangible assets – net (Note 8) | 16,225 | 16,131 | 290 | 305 | |||||||
Contract assets (Note 9) | 27,382 | 25,162 | - | - | |||||||
All other assets | 12,049 | 12,007 | 15,202 | 14,608 | |||||||
Deferred income taxes (Note 12) | 6,426 | 6,666 | (5,473) | (4,833) | |||||||
Assets of businesses held for sale (Note 2) | 3,812 | 1,629 | - | - | |||||||
Assets of discontinued operations (Note 2) | - | 9 | 9,786 | 14,806 | |||||||
Total assets | $ | 269,240 | $ | 277,874 | $ | 167,341 | $ | 182,970 | |||
Liabilities and equity | |||||||||||
Short-term borrowings(b) (Note 10) | $ | 16,860 | $ | 20,482 | $ | 21,654 | $ | 23,443 | |||
Accounts payable, principally trade accounts | 19,766 | 20,876 | 2,047 | 1,605 | |||||||
Progress collections and price adjustments accrued | 16,657 | 16,838 | - | - | |||||||
Dividends payable | 2,109 | 2,107 | - | - | |||||||
Other GE current liabilities | 17,097 | 17,564 | - | - | |||||||
Non-recourse borrowings of consolidated securitization entities (Note 10) | - | - | 668 | 417 | |||||||
Long-term borrowings(b) (Note 10) | 57,142 | 58,810 | 83,824 | 93,443 | |||||||
Investment contracts, insurance liabilities and insurance annuity benefits | - | - | 26,880 | 26,546 | |||||||
Non-current compensation and benefits | 42,053 | 42,770 | 973 | 1,001 | |||||||
All other liabilities | 17,446 | 17,506 | 6,500 | 7,430 | |||||||
Liabilities of businesses held for sale (Note 2) | 1,144 | 656 | - | - | |||||||
Liabilities of discontinued operations (Note 2) | 23 | 35 | 1,718 | 4,123 | |||||||
Total liabilities | 190,298 | 197,644 | 144,264 | 158,008 | |||||||
Redeemable noncontrolling interests (Note 13) | 3,054 | 3,025 | - | - | |||||||
Preferred stock (5,944,250 shares outstanding at both December 31, 2016 | |||||||||||
and December 31, 2015) | 6 | 6 | 6 | 6 | |||||||
Common stock (8,683,963,000 and 8,742,614,000 shares outstanding | |||||||||||
at March 31, 2017 and December 31, 2016, respectively) | 702 | 702 | - | - | |||||||
Accumulated other comprehensive income (loss) – net attributable to GE | |||||||||||
Investment securities | 622 | 674 | 577 | 656 | |||||||
Currency translation adjustments | (6,004) | (6,816) | (338) | (740) | |||||||
Cash flow hedges | 32 | 12 | 30 | 43 | |||||||
Benefit plans | (11,421) | (12,469) | (560) | (622) | |||||||
Other capital | 37,448 | 37,224 | 12,703 | 12,669 | |||||||
Retained earnings | 137,983 | 139,532 | 10,375 | 12,664 | |||||||
Less common stock held in treasury | (84,833) | (83,038) | - | - | |||||||
Total GE shareowners' equity | 74,534 | 75,828 | 22,792 | 24,677 | |||||||
Noncontrolling interests (Note 13) | 1,354 | 1,378 | 285 | 285 | |||||||
Total equity (Note 13) | 75,888 | 77,205 | 23,077 | 24,962 | |||||||
Total liabilities, redeemable noncontrolling interests and equity | $ | 269,240 | $ | 277,874 | $ | 167,341 | $ | 182,970 | |||
(a) | Represents the adding together of all affiliated companies except GE Capital, which is presented on a one-line basis. See Note 1. |
(b) | In 2015, senior unsecured notes and commercial paper were assumed by GE upon its merger with GE Capital, resulting in an intercompany receivable and payable between GE and GE Capital. See Note 10. |
Amounts may not add due to rounding.
In the consolidating data on this page, "GE" means the basis of consolidation as described in Note 1 to the consolidated financial statements; "GE Capital" means GE Capital Global Holdings, LLC (GECGH) and its predecessor General Electric Capital Corporation (GECC) and all of their affiliates and associated companies. Separate information is shown for "GE" and "Financial Services (GE Capital)." Transactions between GE and GE Capital have been eliminated from the "General Electric Company and consolidated affiliates" columns on the prior page.
2017 1Q FORM 10-Q 65
STATEMENT OF CASH FLOWS | |||||
(UNAUDITED) | |||||
Three months ended March 31 | |||||
General Electric Company | |||||
and consolidated affiliates | |||||
(In millions) | 2017 | 2016 | |||
Cash flows – operating activities | |||||
Net earnings (loss) | $ | 577 | $ | 107 | |
Less net earnings (loss) attributable to noncontrolling interests | (76) | (121) | |||
Net earnings (loss) attributable to the Company | 653 | 228 | |||
(Earnings) loss from discontinued operations | 239 | 308 | |||
Adjustments to reconcile net earnings (loss) attributable to the | |||||
Company to cash provided from operating activities | |||||
Depreciation and amortization of property, plant and equipment | 1,193 | 1,210 | |||
(Earnings) loss from continuing operations retained by GE Capital | - | - | |||
Deferred income taxes | (29) | (158) | |||
Decrease (increase) in GE current receivables | 2,356 | 1,013 | |||
Decrease (increase) in inventories | (818) | (1,491) | |||
Increase (decrease) in accounts payable | (292) | 258 | |||
Increase (decrease) in GE progress collections | (276) | 632 | |||
All other operating activities | (2,060) | (103) | |||
Cash from (used for) operating activities – continuing operations | 967 | 1,897 | |||
Cash from (used for) operating activities – discontinued operations | (658) | (1,252) | |||
Cash from (used for) operating activities | 309 | 644 | |||
Cash flows – investing activities | |||||
Additions to property, plant and equipment | (1,470) | (1,556) | |||
Dispositions of property, plant and equipment | 812 | 316 | |||
Net decrease (increase) in GE Capital financing receivables | 306 | (11) | |||
Proceeds from sale of discontinued operations | 789 | 36,478 | |||
Proceeds from principal business dispositions | 81 | 39 | |||
Net cash from (payments for) principal businesses purchased | (967) | - | |||
All other investing activities | 4,970 | (10,593) | |||
Cash from (used for) investing activities – continuing operations | 4,520 | 24,672 | |||
Cash from (used for) investing activities – discontinued operations | (1,871) | 7,112 | |||
Cash from (used for) investing activities | 2,649 | 31,783 | |||
Cash flows – financing activities | |||||
Net increase (decrease) in borrowings (maturities of 90 days or less) | 777 | 983 | |||
Newly issued debt (maturities longer than 90 days) | 326 | 459 | |||
Repayments and other debt reductions (maturities longer than 90 days) | (8,666) | (14,381) | |||
Net dispositions (purchases) of GE shares for treasury | (1,578) | (6,326) | |||
Dividends paid to shareowners | (2,084) | (2,234) | |||
All other financing activities | (959) | (508) | |||
Cash from (used for) financing activities – continuing operations | (12,185) | (22,007) | |||
Cash from (used for) financing activities – discontinued operations | 1,907 | (112) | |||
Cash from (used for) financing activities | (10,278) | (22,119) | |||
Effect of currency exchange rate changes on cash and equivalents | 133 | 31 | |||
Increase (decrease) in cash and equivalents | (7,187) | 10,340 | |||
Cash and equivalents at beginning of year | 49,558 | 90,878 | |||
Cash and equivalents at March 31 | 42,372 | 101,217 | |||
Less cash and equivalents of discontinued operations at March 31 | 808 | 26,143 | |||
Cash and equivalents of continuing operations at March 31 | $ | 41,564 | $ | 75,075 | |
Amounts may not add due to rounding.
See accompanying notes.
2017 1Q FORM 10-Q 66
STATEMENT OF CASH FLOWS (CONTINUED) | |||||||||||
(UNAUDITED) | |||||||||||
Three months ended March 31 | |||||||||||
GE(a) | Financial Services (GE Capital) | ||||||||||
(In millions) | 2017 | 2016 | 2017 | 2016 | |||||||
Cash flows – operating activities | |||||||||||
Net earnings (loss) | $ | 541 | $ | (178) | $ | (253) | $ | (916) | |||
Less net earnings (loss) attributable to noncontrolling interests | (78) | (117) | 2 | (4) | |||||||
Net earnings (loss) attributable to the Company | 619 | (61) | (256) | (912) | |||||||
(Earnings) loss from discontinued operations | 239 | 309 | 242 | 308 | |||||||
Adjustments to reconcile net earnings (loss) attributable to the | |||||||||||
Company to cash provided from operating activities | |||||||||||
Depreciation and amortization of property, plant and equipment | 589 | 626 | 595 | 602 | |||||||
(Earnings) loss from continuing operations retained by GE Capital(b) | 2,047 | 8,393 | - | - | |||||||
Deferred income taxes | (116) | 229 | 87 | (387) | |||||||
Decrease (increase) in GE current receivables | 157 | (39) | - | - | |||||||
Decrease (increase) in inventories | (822) | (1,486) | 5 | 7 | |||||||
Increase (decrease) in accounts payable | (394) | (200) | 8 | 207 | |||||||
Increase (decrease) in GE progress collections | (280) | 632 | - | - | |||||||
All other operating activities | (1,669) | (502) | (562) | (176) | |||||||
Cash from (used for) operating activities – continuing operations | 370 | 7,902 | 119 | (351) | |||||||
Cash from (used for) operating activities – discontinued operations | - | - | (658) | (1,252) | |||||||
Cash from (used for) operating activities | 369 | 7,901 | (538) | (1,603) | |||||||
Cash flows – investing activities | |||||||||||
Additions to property, plant and equipment | (992) | (1,041) | (688) | (647) | |||||||
Dispositions of property, plant and equipment | 355 | 257 | 619 | 170 | |||||||
Net decrease (increase) in GE Capital financing receivables | - | - | 2,967 | 1,466 | |||||||
Proceeds from sale of discontinued operations | - | - | 789 | 36,478 | |||||||
Proceeds from principal business dispositions | 81 | 39 | - | - | |||||||
Net cash from (payments for) principal businesses purchased | (967) | - | - | - | |||||||
All other investing activities | (309) | (614) | 3,124 | (9,592) | |||||||
Cash from (used for) investing activities – continuing operations | (1,832) | (1,360) | 6,811 | 27,875 | |||||||
Cash from (used for) investing activities – discontinued operations | - | - | (1,871) | 7,111 | |||||||
Cash from (used for) investing activities | (1,832) | (1,359) | 4,940 | 34,987 | |||||||
Cash flows – financing activities | |||||||||||
Net increase (decrease) in borrowings (maturities of 90 days or less) | (86) | 1,289 | 132 | (169) | |||||||
Newly issued debt (maturities longer than 90 days) | 4,118 | 76 | 292 | 384 | |||||||
Repayments and other debt reductions (maturities longer than 90 days) | (1,411) | (150) | (8,594) | (14,231) | |||||||
Net dispositions (purchases) of GE shares for treasury | (1,578) | (6,326) | - | - | |||||||
Dividends paid to shareowners | (2,084) | (2,170) | (2,000) | (7,565) | |||||||
All other financing activities | (217) | (228) | (737) | (415) | |||||||
Cash from (used for) financing activities – continuing operations | (1,259) | (7,508) | (10,907) | (21,996) | |||||||
Cash from (used for) financing activities – discontinued operations | - | - | 1,907 | (112) | |||||||
Cash from (used for) financing activities | (1,259) | (7,508) | (8,999) | (22,108) | |||||||
Effect of currency exchange rate changes on cash and equivalents | 71 | (108) | 61 | 139 | |||||||
Increase (decrease) in cash and equivalents | (2,650) | (1,075) | (4,536) | 11,415 | |||||||
Cash and equivalents at beginning of year | 10,525 | 10,372 | 39,033 | 80,506 | |||||||
Cash and equivalents at March 31 | 7,875 | 9,297 | 34,497 | 91,921 | |||||||
Less cash and equivalents of discontinued operations at March 31 | - | - | 808 | 26,143 | |||||||
Cash and equivalents of continuing operations at March 31 | $ | 7,875 | $ | 9,297 | $ | 33,689 | $ | 65,778 | |||
| (a) | Represents the adding together of all affiliated companies except GE Capital, which is presented on a one-line basis. |
| (b) | Represents GE Capital earnings/loss from continuing operations attributable to the Company, net of GE Capital dividends paid to GE. |
Amounts may not add due to rounding.
In the consolidating data on this page, "GE" means the basis of consolidation as described in Note 1 to the consolidated financial statements; "GE Capital" means GE Capital Global Holdings, LLC (GECGH) and its predecessor General Electric Capital Corporation (GECC) and all of their affiliates and associated companies. Separate information is shown for "GE" and "Financial Services (GE Capital)." Transactions between GE and GE Capital have been eliminated from the "Consolidated" columns and are discussed in Note 19.
2017 1Q FORM 10-Q 67
NOTES TO CONSOLIDATED FINANCIAL STATEMENTS
NOTE 1. BASIS OF PRESENTATION AND SUMMARY OF SIGNIFICANT ACCOUNTING POLICIES
BASIS OF PRESENTATION
The accompanying consolidated financial statements represent the consolidation of General Electric Company (the Company) and all companies that we directly or indirectly control, either through majority ownership or otherwise. See Note 1 to the consolidated financial statements in our Annual Report on Form 10-K for the year ended December 31, 2016 that discusses our consolidation and financial statement presentation. As used in this report on Form 10-Q (Report), "GE" represents the adding together of all affiliated companies except GE Capital (GE Capital or Financial Services), whose continuing operations are presented on a one-line basis; GE Capital consists of General Capital Global Holdings, LLC (GECGH) and all of its affiliates; and "Consolidated" represents the adding together of GE and GE Capital with the effects of transactions between the two eliminated. Unless otherwise indicated, we refer to the caption revenues and other income simply as "revenues" throughout this Form 10-Q.
We have reclassified certain prior-period amounts to conform to the current-period presentation. Certain columns and rows may not add due to the use of rounded numbers. Percentages presented are calculated from the underlying numbers in millions. Unless otherwise indicated, information in these notes to the consolidated financial statements relates to continuing operations.
INTERIM PERIOD PRESENTATION
The consolidated financial statements and notes thereto are unaudited. These statements include all adjustments (consisting of normal recurring accruals) that we considered necessary to present a fair statement of our results of operations, financial position and cash flows. The results reported in these consolidated financial statements should not be regarded as necessarily indicative of results that may be expected for the entire year. It is suggested that these consolidated financial statements be read in conjunction with the financial statements and notes thereto included in our 2016 consolidated financial statements of our Annual Report on Form 10-K for the year ended December 31, 2016.
SUMMARY OF SIGNIFICANT ACCOUNTING POLICIES
Please refer to Note 1, Basis of Presentation and Summary of Significant Accounting Policies, to the consolidated financial statements of our 2016 Annual Report on Form 10-K for further discussion of our significant accounting policies.
ACCOUNTING CHANGES
On January 1, 2017, we adopted ASU 2015-11, Simplifying the Measurement of Inventory , which was intended to simplify the subsequent measurement of inventory held by an entity not measured using last-in, first-out (LIFO) or retail inventory method. The amendments eliminated the requirement that entities consider the replacement cost of inventory and the net realizable value less a normal profit margin, which was historically used to establish a floor and ceiling for an assessment of market value. The adoption of this standard was immaterial to our financial statements.
On September 30, 2016, we adopted ASU 2016-09, Improvements to Employee Share-Based Payment Accounting , which was intended to simplify several aspects of the accounting for employee share-based payment transactions including the accounting for income taxes, forfeitures, and statutory tax withholding requirements, as well as classification in the statement of cash flows.
We adopted the standard on a prospective basis with the effect of adoption reflected for the interim periods after the year beginning January 1, 2016 as required by the standard. The primary effects of adoption were the recognition of excess tax benefits in our provision for income taxes rather than paid-in capital and the reclassification of cash flows related to excess tax benefits from a financing activity to an operating activity for the periods beginning January 1, 2016. We will continue to estimate the number of awards that are expected to vest in our determination of the related periodic compensation cost.
2017 1Q FORM 10-Q 68
As a result of the adoption, our provision for income taxes decreased by $97 million for the nine months ended September 30, 2016 for the excess tax benefits related to share-based payments in its provision for income taxes. Application of the cash flow presentation requirements from January 1, 2016, resulted in an increase to cash from operating activities and a decrease to cash from financing activities of $137 million for the nine months ended September 30, 2016.
Additionally, as the adoption of the standard was reflected as of the beginning of 2016, the benefit for income taxes increased $38 million and cash flow from operating activities increased by $46 million with an offsetting decrease in cash from financing activities for the three months ended March 31, 2016 .
NOTE 2. BUSINESSES HELD FOR SALE AND DISCONTINUED OPERATIONS
ASSETS AND LIABILITIES OF BUSINESSES HELD FOR SALE
In the first quarter of 2017, we classified our Industrial Solutions business within our Energy Connections & Lighting segment with assets of $2,160 million and liabilities of $510 million, as held for sale. We expect to complete the sale of the business within the next twelve months.
In the fourth quarter of 2016, we classified our Water business within our Power segment with assets of $1,651 million and liabilities of $634 million, as held for sale. In March 2017, we signed an agreement with Suez Environnement S.A. (Suez) to sell the business for $3,415 million. The deal is expected to close mid- 2017, subject to customary closing conditions and regulatory approval.
FINANCIAL INFORMATION FOR ASSETS AND LIABILITIES OF BUSINESSES HELD FOR SALE | |||||
(In millions) | March 31, 2017 |
| December 31, 2016 | ||
| |||||
Assets | |||||
Current receivables(a) | $ | 687 | $ | 366 | |
Inventories | 576 | 211 | |||
Property, plant, and equipment – net | 1,002 | 632 | |||
Goodwill | 1,290 | 212 | |||
Other intangible assets – net | 238 | 123 | |||
Contract assets | 192 | 125 | |||
Other |
| 91 |
|
| 76 |
Assets of businesses held for sale | $ | 4,076 |
| $ | 1,745 |
|
|
|
| ||
Liabilities |
|
|
| ||
Accounts payable | $ | 367 | $ | 190 | |
Progress collections and price adjustments accrued | 167 | 141 | |||
Other current liabilities | 226 | 133 | |||
Non-current compensation and benefits | 221 | 82 | |||
Other | 164 | 110 | |||
Liabilities of businesses held for sale | $ | 1,144 | $ | 656 | |
| (a) | Included transactions in our industrial businesses that were made on an arms-length basis with GE Capital, consisting of GE customer receivables sold to GE Capital of $264 million and $117 million at March 31, 2017 and December 31, 2016, respectively. These intercompany balances included within our held for sale businesses are reported in the GE and GE Capital columns of our financial statements, but are eliminated in deriving our consolidated financial statements. |
2017 1Q FORM 10-Q 69
DISCONTINUED OPERATIONS
Discontinued operations primarily relate to our financial services businesses as a result of the GE Capital Exit Plan and includes our U.S. mortgage business (WMC). All of these operations were previously reported in the Capital segment. Results of operations, financial position and cash flows for these businesses are reported as discontinued operations for all periods presented.
We have entered into Transitional Service Agreements (TSA) with and provided certain indemnifications to buyers of GE Capital's assets. Under the TSAs, GE Capital provides various services for terms generally between 12 and 24 months and receives a level of cost reimbursement from the buyers. See Note 18 for further information about indemnifications.
FINANCIAL INFORMATION FOR DISCONTINUED OPERATIONS | |||||
Three months ended March 31 | |||||
(In millions) | 2017 | 2016 | |||
Operations | |||||
Total revenues and other income | $ | 79 | $ | 1,292 | |
Earnings (loss) from discontinued operations before income taxes | $ | (196) | $ | 80 | |
Benefit (provision) for income taxes(a) | 62 | 12 | |||
Earnings (loss) from discontinued operations, net of taxes | $ | (134) | $ | 92 | |
Disposals | |||||
Gain (loss) on disposals before income taxes | $ | (27) | $ | (246) | |
Benefit (provision) for income taxes(a) | (78) | (155) | |||
Gain (loss) on disposals, net of taxes | $ | (105) | $ | (400) | |
Earnings (loss) from discontinued operations, net of taxes(b)(c) | $ | (239) | $ | (308) | |
| (a) | GE Capital's total tax benefit (provision) for discontinued operations and disposals included current tax benefit (provision) of $(576) million and $(834) million for the three months ended March 31, 2017 and 2016, respectively, including current U.S. Federal tax benefit (provision) of $(587) million and $(501) million for the three months ended March 31, 2017 and 2016, respectively, and deferred tax benefit (provision) of $560 million and $691 million for the three months ended March 31, 2017 and 2016, respectively. |
| (b) | The sum of GE industrial earnings (loss) from discontinued operations, net of taxes, and GE Capital earnings (loss) from discontinued operations, net of taxes, after adjusting for earnings (loss) attributable to noncontrolling interests related to discontinued operations, is reported within GE industrial earnings (loss) from discontinued operations, net of taxes, on the Consolidated Statement of Earnings (Loss). |
| (c) | Earnings (loss) from discontinued operations attributable to the Company, before income taxes, was $(223) million and $(166) million for the three months ended March 31, 2017 and 2016, respectively. |
(In millions) | March 31, 2017 | December 31, 2016 | |||
Assets | |||||
Cash and equivalents | $ | 808 | $ | 1,429 | |
Investment securities | 2,105 | 2,626 | |||
Deferred income taxes | 988 | 487 | |||
Financing receivables held for sale | 4,281 | 8,547 | |||
Valuation allowance on disposal group classified as discontinued operations | (79) | (726) | |||
Other assets | 1,682 | 2,453 | |||
Assets of discontinued operations | $ | 9,786 | $ | 14,815 | |
Liabilities | |||||
Accounts payable | $ | 122 | $ | 164 | |
Borrowings | - | 2,076 | |||
Other liabilities | 1,619 | 1,918 | |||
Liabilities of discontinued operations | $ | 1,741 | $ | 4,158 | |
2017 1Q FORM 10-Q 70
NOTE 3. INVESTMENT SECURITIES
Substantially all of our investment securities are classified as available-for-sale and comprise mainly investment-grade debt securities supporting obligations to annuitants and policyholders in our run-off insurance operations. We do not have any securities classified as held-to-maturity.
March 31, 2017 | December 31, 2016 | ||||||||||||||||||||||
Gross | Gross | Gross | Gross | ||||||||||||||||||||
Amortized | unrealized | unrealized | Estimated | Amortized | unrealized | unrealized | Estimated | ||||||||||||||||
(In millions) | cost | gains | losses | fair value (a) | cost | gains | losses | fair value (a) | |||||||||||||||
Debt | |||||||||||||||||||||||
U.S. corporate | 20,197 | 3,165 | (84) | 23,279 | 20,049 | 3,081 | (85) | 23,046 | |||||||||||||||
Non-U.S. corporate | 9,468 | 89 | (22) | 9,535 | 11,917 | 98 | (27) | 11,987 | |||||||||||||||
State and municipal | 3,921 | 432 | (80) | 4,274 | 3,916 | 412 | (92) | 4,236 | |||||||||||||||
Mortgage and asset-backed | 2,723 | 102 | (28) | 2,797 | 2,787 | 111 | (37) | 2,861 | |||||||||||||||
Government and agencies | 1,744 | 86 | (27) | 1,803 | 1,842 | 160 | (26) | 1,976 | |||||||||||||||
Equity | 167 | 95 | (1) | 262 | 154 | 55 | (1) | 208 | |||||||||||||||
Total | 38,220 | 3,971 | (242) | 41,949 | 40,665 | 3,917 | (269) | 44,313 | |||||||||||||||
(a) | Includes $200 million and $137 million of investment securities held by GE at March 31, 2017 and December 31, 2016, respectively, of which $145 million and $86 million are equity securities. |
ESTIMATED FAIR VALUE AND GROSS UNREALIZED LOSSES OF AVAILABLE-FOR-SALE INVESTMENT SECURITIES | ||||||||||||
In loss position for | ||||||||||||
Less than 12 months | 12 months or more | |||||||||||
Gross | Gross | |||||||||||
Estimated | unrealized | Estimated | unrealized | |||||||||
(In millions) | fair value | losses | fair value | losses | ||||||||
March 31, 2017 | ||||||||||||
Debt | ||||||||||||
U.S. corporate | $ | 1,586 | $ | (57) | $ | 337 | $ | (26) | ||||
Non-U.S. corporate | 5,020 | (21) | 14 | (1) | ||||||||
State and municipal | 480 | (21) | 161 | (59) | ||||||||
Mortgage and asset-backed | 830 | (20) | 92 | (8) | ||||||||
Government and agencies | 553 | (27) | - | - | ||||||||
Equity | 3 | (1) | - | - | ||||||||
Total | $ | 8,472 | $ | (148) | $ | 605 | $ | (95) | ||||
December 31, 2016 | ||||||||||||
Debt | ||||||||||||
U.S. corporate | $ | 1,692 | $ | (55) | $ | 359 | $ | (30) | ||||
Non-U.S. corporate | 5,352 | (26) | 14 | (1) | ||||||||
State and municipal | 674 | (27) | 158 | (64) | ||||||||
Mortgage and asset-backed | 822 | (21) | 132 | (16) | ||||||||
Government and agencies | 549 | (26) | - | - | ||||||||
Equity | 9 | (1) | - | - | ||||||||
Total | $ | 9,098 | $ | (157) | $ | 663 | $ | (111) | ||||
Unrealized losses are not indicative of the amount of credit loss that would be recognized and at March 31, 2017 are primarily due to increases in market yields subsequent to our purchase of the securities. We presently do not intend to sell the vast majority of our debt securities that are in unrealized loss positions and believe that it is not more likely than not that we will be required to sell the vast majority of these securities before anticipated recovery of our amortized cost. The methodologies and significant inputs used to measure the amount of credit loss for our investment securities during 2017 have not changed.
Total pre-tax, other-than-temporary impairments on investment securities recognized in earnings were an insignificant amount and $16 million for the three months ended March 31, 2017 and 2016, respectively.
2017 1Q FORM 10-Q 71
CONTRACTUAL MATURITIES OF INVESTMENT IN AVAILABLE-FOR-SALE DEBT SECURITIES | |||||
(EXCLUDING MORTGAGE AND ASSET-BACKED SECURITIES) | |||||
Amortized | Estimated | ||||
(In millions) | cost | fair value | |||
Due | |||||
Within one year | $ | 7,446 | $ | 7,446 | |
After one year through five years | 5,029 | 5,215 | |||
After five years through ten years | 5,134 | 5,556 | |||
After ten years | 17,721 | 20,673 | |||
We expect actual maturities to differ from contractual maturities because borrowers have the right to call or prepay certain obligations.
Although we generally do not have the intent to sell any specific securities at the end of the period, in the ordinary course of managing our investment securities portfolio, we may sell securities prior to their maturities for a variety of reasons, including diversification, credit quality, yield and liquidity requirements and the funding of claims and obligations to policyholders. Gross realized gains on available-for-sale investment securities were $106 million and $6 million, and gross realized losses were $(2) million and $(29) million in the three months ended March 31, 2017 and 2016, respectively.
Proceeds from investment securities sales and early redemptions by issuers totaled $1,073 million and $243 million in the three months ended March 31, 2017 and 2016, respectively primarily from sales of Government and agencies and U.S. corporate securities.
NOTE 4. CURRENT RECEIVABLES
Consolidated(a)(b) | GE(c) | ||||||||||
(In millions) | March 31, 2017 | December 31, 2016 | March 31, 2017 | December 31, 2016 | |||||||
Current receivables | 22,560 | 24,935 | 13,525 | 13,562 | |||||||
Allowance for losses | (886) | (858) | (879) | (847) | |||||||
Total | $ | 21,675 | $ | 24,076 | $ | 12,646 | $ | 12,715 | |||
(a) | Included GE industrial customer receivables sold to a GE Capital affiliate and recorded on GE Capital's balance sheet of $9,965 million and $12,304 million at March 31, 2017 and December 31, 2016, respectively. The consolidated total included a deferred purchase price receivable of $415 million and $483 million at March 31, 2017 and December 31, 2016, respectively, related to our Receivables Facility. |
(b) | In order to manage the credit exposure, the Company sells additional current receivables to third parties outside the Receivables Facility, substantially all of which are serviced by the Company. The outstanding balance of these current receivables was $2,131 million and $3,821 million at March 31, 2017 and December 31, 2016, respectively. Of these balances, $905 million and $2,504 million was sold by GE to GE Capital prior to the sale to third parties at March 31, 2017 and December 31, 2016, respectively. At March 31, 2017 and December 31, 2016, our maximum exposure to loss under the limited recourse arrangements is $96 million and $215 million, respectively. |
(c) | GE current receivables balances at March 31, 2017 and December 31, 2016, before allowance for losses, included $8,465 million and $8,927 million, respectively, from sales of goods and services to customers. The remainder of the balances primarily relates to supplier advances, revenue sharing programs and other non-income based tax receivables. |
RECEIVABLES FACILITY
The Company has a $3,000 million revolving Receivables Facility under which receivables are sold directly to third-party purchasers. The third-party purchasers have no recourse to other assets of the Company in the event of non-payment by the debtors. Where the purchasing entity is a bank multi-seller commercial paper conduit, assets transferred by other parties to that entity form a majority of the entity's assets. Upon sale of the receivables, we receive proceeds of cash and a deferred purchase price (DPP). The DPP is an interest in specified assets of the purchasers (the receivables sold by GE Capital) that entitles GE Capital to the residual cash flows of those specified assets.
During the three months ended March 31, 2017, GE sold current receivables of $4,736 million to GE Capital, which GE Capital sold immediately to third parties under the Receivables Facility. GE Capital continues to service the current receivables for the purchasers. The Company received total cash collections of $4,313 million on previously sold current receivables owed to the purchasing entities. The purchasing entities reinvested $3,645 million of those collections to purchase newly originated current receivables from the Company and paid $224 million to reduce their DPP obligation to the Company.
2017 1Q FORM 10-Q 72
At March 31, 2017, GE Capital, under the Receivables Facility, serviced $2,999 million of transferred receivables that remain outstanding.
Given the short-term nature of the underlying receivables, discount rates and prepayments are not factors in determining the value of the DPP. Collections on the DPP are presented within Cash flows from operating activities in the consolidated column in the Statement of Cash Flows. As the performance of the transferred current receivables is similar to the performance of our other current receivables, delinquencies are not expected to be significant.
NOTE 5. INVENTORIES
(In millions) | March 31, 2017 | December 31, 2016 | |||
Raw materials and work in process | $ | 13,256 | $ | 12,636 | |
Finished goods | 8,548 | 8,798 | |||
Unbilled shipments | 442 | 536 | |||
22,245 | 21,971 | ||||
Revaluation to LIFO | 456 | 383 | |||
Total inventories | $ | 22,701 | $ | 22,354 | |
NOTE 6. GE CAPITAL FINANCING RECEIVABLES AND ALLOWANCE FOR LOSSES ON FINANCING RECEIVABLES
FINANCING RECEIVABLES – NET | |||||
(In millions) | March 31, 2017 | December 31, 2016 | |||
Loans, net of deferred income | $ | 18,882 | $ | 21,101 | |
Investment in financing leases, net of deferred income | 5,032 | 4,998 | |||
23,914 | 26,099 | ||||
Allowance for losses | (61) | (58) | |||
Financing receivables – net | $ | 23,853 | $ | 26,041 | |
We manage our financing receivables portfolio using delinquency and nonaccrual data as key performance indicators. At March 31, 2017, $790 million (3.3%), $341 million (1.4%) and $169 million (0.7%) of financing receivables were over 30 days past due, over 90 days past due and on nonaccrual, respectively. Of the $169 million of nonaccrual financing receivables at March 31, 2017, the vast majority are secured by collateral and $25 million are currently paying in accordance with the contractual terms. At December 31, 2016, $811 million (3.1%), $407 million (1.6%) and $322 million (1.2%) of financing receivables were over 30 days past due, over 90 days past due and on nonaccrual, respectively.
The recorded investment in impaired loans at March 31, 2017 and December 31, 2016 was $212 million and $262 million, respectively. The method used to measure impairment for these loans is primarily based on collateral value. At March 31, 2017, troubled debt restructurings included in impaired loans were $172 million.
2017 1Q FORM 10-Q 73
NOTE 7. PROPERTY, PLANT AND EQUIPMENT
(In millions) | March 31, 2017 | December 31, 2016 | |||
Original cost | $ | 84,140 | $ | 85,875 | |
Less accumulated depreciation and amortization | (35,124) | (35,356) | |||
Property, plant and equipment – net | $ | 49,016 | $ | 50,518 | |
Consolidated depreciation and amortization was $1,193 million and $1,210 million in the three months ended March 31, 2017 and 2016, respectively.
NOTE 8. ACQUISITIONS, GOODWILL AND OTHER INTANGIBLE ASSETS
ACQUISITIONS
On October 11, 2016, we announced a plan to acquire LM Wind Power, the Danish maker of rotor blades for approximately $1,700 million. The transaction closed on April 20, 2017.
In the first quarter of 2017, we acquired the remaining 96% of ServiceMax, a leader in cloud-based field service management solutions, for $866 million, net of cash acquired of approximately $91 million. Upon gaining control, we fair valued the business including our previously held 4% equity interest. The preliminary purchase price allocation resulted in goodwill of approximately $670 million and amortizable intangible assets of approximately $280 million. The allocation of the purchase price will be finalized upon completion of post-closing procedures.
On October 31, 2016, we announced an agreement with Baker Hughes Incorporated (Baker Hughes) to combine GE's Oil & Gas business and Baker Hughes to create a new company. The transaction will be executed using a partnership structure, pursuant to which GE Oil & Gas and Baker Hughes will each contribute their operating assets to a newly formed partnership. GE will have a 62.5% interest in this partnership and existing Baker Hughes shareholders will have a 37.5% interest through a newly NYSE listed corporation. Baker Hughes shareholders will also receive a special one-time cash dividend of $17.50 per share at closing. GE will contribute $7.4 billon to the new partnership to fund the cash dividend to existing Baker Hughes shareholders. The transaction is subject to the approval of Baker Hughes shareholders, regulatory approvals and other customary closing conditions. The deal is expected to close mid-2017.
On May 10, 2016, we announced the pending acquisition of the heat recovery steam generator (HRSG) business from Doosan Engineering & Construction (Doosan) for $250 million. On August 16, 2016, we acquired 80% of the HRSG business for approximately $220 million. The remaining 20% of the HRSG business continues to be subject to local regulatory requirements and we expect a staggered close beginning in the second quarter of 2017 and completed by the end of 2017. The preliminary purchase price allocation resulted in goodwill of approximately $170 million and amortizable intangible assets of approximately $35 million. The allocation of the purchase price will be finalized upon completion of post-closing procedures.
2017 1Q FORM 10-Q 74
GOODWILL
CHANGES IN GOODWILL BALANCES | |||||||||||
Dispositions, | |||||||||||
currency | |||||||||||
Balance at | exchange | Balance at | |||||||||
(In millions) | January 1, 2017 | Acquisitions | and other | March 31, 2017 | |||||||
Power | $ | 19,816 | $ | (6) | $ | (14) | $ | 19,796 | |||
Renewable Energy | 2,507 | - | 63 | 2,571 | |||||||
Oil & Gas | 10,363 | - | 6 | 10,369 | |||||||
Aviation | 9,455 | 10 | 114 | 9,578 | |||||||
Healthcare | 17,424 | 37 | (4) | 17,457 | |||||||
Transportation | 899 | - | 7 | 906 | |||||||
Energy Connections & Lighting | 6,868 | - | (1,046) | 5,822 | |||||||
Capital | 2,368 | - | - | 2,368 | |||||||
Corporate | 739 | 689 | 19 | 1,446 | |||||||
Total | $ | 70,438 | $ | 731 | $ | (856) | $ | 70,313 | |||
Goodwill balances decreased by $125 million in 2017, primarily as a result of the reclassification of goodwill associated with Industrial Solutions to assets of businesses held for sale, partially offset by the acquisition of ServiceMax and the currency exchange effects of a weaker U.S. dollar against other major currencies.
OTHER INTANGIBLE ASSETS
OTHER INTANGIBLE ASSETS - NET | |||||
(In millions) | March 31, 2017 | December 31, 2016 | |||
Intangible assets subject to amortization | $ | 16,417 | $ | 16,336 | |
Indefinite-lived intangible assets(a) | 98 | 100 | |||
Total | $ | 16,515 | $ | 16,436 | |
| (a) | Indefinite-lived intangible assets principally comprise trademarks and in-process research and development. |
INTANGIBLE ASSETS SUBJECT TO AMORTIZATION | |||||||||||||||||
March 31, 2017 | December 31, 2016 | ||||||||||||||||
Gross | Gross | ||||||||||||||||
carrying | Accumulated | carrying | Accumulated | ||||||||||||||
(In millions) | amount | amortization | Net | amount | amortization | Net | |||||||||||
Customer-related | $ | 9,238 | $ | (2,533) | $ | 6,706 | $ | 9,172 | $ | (2,408) | $ | 6,764 | |||||
Patents and technology | 8,965 | (3,383) | 5,582 | 8,693 | (3,325) | 5,368 | |||||||||||
Capitalized software | 7,654 | (4,601) | 3,053 | 7,652 | (4,538) | 3,114 | |||||||||||
Trademarks | 1,175 | (333) | 842 | 1,165 | (307) | 858 | |||||||||||
Lease valuations | 143 | (64) | 79 | 143 | (59) | 84 | |||||||||||
Present value of future profits(a) | 693 | (693) | - | 684 | (684) | - | |||||||||||
All other | 277 | (123) | 154 | 273 | (124) | 149 | |||||||||||
Total | $ | 28,145 | $ | (11,729) | $ | 16,417 | $ | 27,781 | $ | (11,444) | $ | 16,336 | |||||
| (a) | Balances at March 31, 2017 and December 31, 2016 reflect adjustments of $234 million and $241 million, respectively, to the present value of future profits in our run-off insurance operation to reflect the effects that would have been recognized had the related unrealized investment securities holding net gains actually been realized. |
Intangible assets subject to amortization increased by $81 million in the three months ended March 31, 2017, primarily as a result of the acquisition of ServiceMax, partially offset by amortization.
GE amortization expense related to intangible assets subject to amortization was $404 million and $445 million in the three months ended March 31, 2017 and 2016, respectively. GE Capital amortization expense related to intangible assets subject to amortization was $20 million and $33 million in the three months ended March 31, 2017 and 2016, respectively.
2017 1Q FORM 10-Q 75
NOTE 9. CONTRACT ASSETS
(In millions) | March 31, 2017 | December 31, 2016 | |||
GE | |||||
Revenue in excess of billings | |||||
Long-term product service agreements(a) | $ | 14,194 | $ | 12,752 | |
Long-term equipment contract revenue(b) | 6,190 | 5,859 | |||
Total revenue in excess of billings | 20,384 | 18,611 | |||
Deferred inventory costs(c) | 3,709 | 3,349 | |||
Non-recurring engineering costs(d) | 2,253 | 2,185 | |||
Other | 1,036 | 1,018 | |||
Contract assets | $ | 27,382 | $ | 25,162 | |
| (a) | Long-term product service agreement balances are presented net of related billings in excess of revenues of $3,171 million and $3,750 million at March 31, 2017 and December 31, 2016, respectively. |
| (b) | Reflects revenues earned in excess of billings on our long-term contracts to construct technically complex equipment (such as gas power systems). |
| (c) | Represents cost deferral for shipped goods (such as components for wind turbine assembly within our Renewable Energy segment) and other costs for which the criteria for revenue recognition has not yet been met. |
| (d) | Included costs incurred prior to production (e.g., requisition engineering) for long-term equipment production contracts, primarily within our Aviation segment, which are allocated ratably to each unit produced. |
2017 1Q FORM 10-Q 76
NOTE 10. BORROWINGS
(In millions) | March 31, 2017 | December 31, 2016 | |||
Short-term borrowings | |||||
GE | |||||
Commercial paper | $ | 2,000 | $ | 1,500 | |
Current portion of long-term borrowings | 13,229 | 17,109 | |||
Other | 1,631 | 1,874 | |||
Total GE short-term borrowings(a) | 16,860 | 20,482 | |||
GE Capital | |||||
U.S. Commercial paper | 5,017 | 5,002 | |||
Current portion of long-term borrowings(b) | 7,186 | 6,517 | |||
Intercompany payable to GE(c) | 9,110 | 11,696 | |||
Other | 340 | 229 | |||
Total GE Capital short-term borrowings | 21,654 | 23,443 | |||
Eliminations (c) | (10,190) | (13,212) | |||
Total short-term borrowings | $ | 28,324 | $ | 30,714 | |
Long-term borrowings | |||||
GE | |||||
Senior notes | $ | 52,649 | $ | 54,396 | |
Subordinated notes | 2,767 | 2,768 | |||
Subordinated debentures(e) | 723 | 719 | |||
Other | 1,002 | 928 | |||
Total GE long-term borrowings(a) | 57,142 | 58,810 | |||
GE Capital | |||||
Senior notes | 40,940 | 44,131 | |||
Subordinated notes | 225 | 236 | |||
Intercompany payable to GE(d) | 41,207 | 47,084 | |||
Other(b) | 1,451 | 1,992 | |||
Total GE Capital long-term borrowings | 83,824 | 93,443 | |||
Eliminations (d) | (41,292) | (47,173) | |||
Total long-term borrowings | $ | 99,674 | $ | 105,080 | |
Non-recourse borrowings of consolidated securitization entities(f) | $ | 668 | $ | 417 | |
Total borrowings | $ | 128,667 | $ | 136,210 | |
(a) | Excluding assumed debt of GE Capital, the total amount of GE borrowings was $23,685 million and $20,512 million at March 31, 2017 and December 31, 2016, respectively. |
(b) | Included $1,891 million and $2,665 million of funding secured by aircraft and other collateral at March 31, 2017 and December 31, 2016, respectively, of which $682 million and $1,419 million is non-recourse to GE Capital at March 31, 2017 and December 31, 2016, respectively. |
(c) | Included a reduction of zero and $1,329 million for short-term intercompany loans from GE Capital to GE at March 31, 2017 and December 31, 2016, respectively, which bear the right of offset against amounts owed under the assumed debt agreement. Excluding intercompany loans, total short-term assumed debt was $9,110 million and $13,024 million at March 31, 2017 and December 31, 2016, respectively. The remaining short-term loan balance was paid in January 2017. |
(d) | Included a reduction of $4,075 million and zero for long-term intercompany loans from GE Capital to GE at March 31, 2017 and December 31, 2016, respectively, which bear the right of offset against amounts owed under the assumed debt agreement. Excluding intercompany loans, total long-term assumed debt was $45,282 million and $47,084 million at March 31, 2017 and December 31, 2016, respectively. The $4,075 million of intercompany loans collectively have a weighted average interest rate of 3.6% and term of approximately 15 years . |
(e) | Comprises subordinated debentures which constitute the sole assets of trusts that have issued trust preferred securities and where GE owns 100% of the common securities of the trusts. Obligations associated with these trusts are unconditionally guaranteed by GE. |
(f) | Included $521 million and $320 million of current portion of long-term borrowings at March 31, 2017 and December 31, 2016, respectively. See Note 17. |
2017 1Q FORM 10-Q 77
On April 10, 2015, GE provided a full and unconditional guarantee on the payment of the principal and interest on all tradable senior and subordinated outstanding long-term debt securities and all commercial paper issued or guaranteed by GE Capital. $92,537 million of such debt was assumed by GE on December 2, 2015 upon its merger with GE Capital resulting in an intercompany payable to GE. At March 31, 2017, the Guarantee applies to $45,315 million of GE Capital debt.
See Notes 16 and 21 for additional information about borrowings and associated swaps.
NOTE 11. POSTRETIREMENT BENEFIT PLANS
We sponsor a number of pension and retiree health and life insurance benefit plans. Principal pension plans are the GE Pension Plan and the GE Supplementary Pension Plan. Principal retiree benefit plans provide health and life insurance benefits to certain eligible participants and these participants share in the cost of the healthcare benefits. Other pension plans include U.S. and non-U.S. pension plans with pension assets or obligations greater than $50 million. Smaller pension plans and other retiree benefit plans are not material individually or in the aggregate.
EFFECT ON OPERATIONS OF PENSION PLANS | |||||
Principal pension plans | |||||
Three months ended March 31 | |||||
(In millions) | 2017 | 2016 | |||
Service cost for benefits earned | $ | 289 | $ | 315 | |
Prior service cost amortization | 73 | 76 | |||
Expected return on plan assets | (849) | (834) | |||
Interest cost on benefit obligations | 717 | 734 | |||
Net actuarial loss amortization | 710 | 612 | |||
Curtailment loss | 43 | (a) | - | ||
Pension plans cost | $ | 983 | $ | 903 | |
(a) Curtailment loss resulting from our intent to sell the Industrial Solutions business.
Other pension plans | |||||
Three months ended March 31 | |||||
(In millions) | 2017 | 2016 | |||
Service cost for benefits earned | $ | 151 | $ | 113 | |
Prior service credit amortization | (1) | (1) | |||
Expected return on plan assets | (294) | (263) | |||
Interest cost on benefit obligations | 142 | 172 | |||
Net actuarial loss amortization | 103 | 64 | |||
Pension plans cost | $ | 101 | $ | 85 | |
EFFECT ON OPERATIONS OF PRINCIPAL RETIREE BENEFIT PLANS | |||||
Principal retiree benefit plans | |||||
Three months ended March 31 | |||||
(In millions) | 2017 | 2016 | |||
Service cost for benefits earned | $ | 26 | $ | 25 | |
Prior service credit amortization | (43) | (41) | |||
Expected return on plan assets | (9) | (11) | |||
Interest cost on benefit obligations | 57 | 63 | |||
Net actuarial gain amortization | (21) | (13) | |||
Curtailment loss | 3 | (a) | - | ||
Retiree benefit plans cost | $ | 13 | $ | 23 | |
| (a) | Curtailment loss resulting from our intent to sell the Industrial Solutions business. |
2017 1Q FORM 10-Q 78
NOTE 12. INCOME TAXES
UNRECOGNIZED TAX BENEFITS | |||||
(In millions) | March 31, 2017 | December 31, 2016 | |||
Unrecognized tax benefits | $ | 4,732 | $ | 4,692 | |
Portion that, if recognized, would reduce tax expense and effective tax rate(a) | 2,872 | 2,886 | |||
Accrued interest on unrecognized tax benefits | 645 | 615 | |||
Accrued penalties on unrecognized tax benefits | 119 | 118 | |||
Reasonably possible reduction to the balance of unrecognized tax benefits | |||||
in succeeding 12 months | 0-600 | 0-600 | |||
Portion that, if recognized, would reduce tax expense and effective tax rate(a) | 0-500 | 0-500 | |||
| (a) | Some portion of such reduction may be reported as discontinued operations. |
The Internal Revenue Service (IRS) is currently auditing our consolidated U.S. income tax returns for 2012-2013. In addition, certain other U.S. tax deficiency issues and refund claims for previous years are still unresolved. It is reasonably possible that a portion of the unresolved items could be resolved during the next 12 months, which could result in a decrease in our balance of "unrecognized tax benefits" – that is, the aggregate tax effect of differences between tax return positions and the benefits recognized in our financial statements. We believe that there are no other jurisdictions in which the outcome of unresolved issues or claims is likely to be material to our results of operations, financial position or cash flows. We further believe that we have made adequate provision for all income tax uncertainties.
2017 1Q FORM 10-Q 79
NOTE 13. SHAREOWNERS' EQUITY
ACCUMULATED OTHER COMPREHENSIVE INCOME (LOSS) | |||||
Three months ended March 31 | |||||
(In millions) | 2017 | 2016 | |||
Investment securities | |||||
Beginning balance | $ | 674 | $ | 460 | |
Other comprehensive income (loss) (OCI) before reclassifications – | |||||
net of deferred taxes of $13 and $81 | 18 | 159 | |||
Reclassifications from OCI – net of deferred taxes of $(36) and $40 | (69) | 60 | |||
Other comprehensive income (loss)(a) | (52) | 220 | |||
Less OCI attributable to noncontrolling interests | - | - | |||
Ending balance | $ | 622 | $ | 680 | |
Currency translation adjustments (CTA) | |||||
Beginning balance | $ | (6,816) | $ | (5,499) | |
OCI before reclassifications – net of deferred taxes of $(33) and $266 | 262 | 115 | |||
Reclassifications from OCI – net of deferred taxes of $(540) and $119 | 554 | (114) | |||
Other comprehensive income (loss)(a) | 815 | 1 | |||
Less OCI attributable to noncontrolling interests | 4 | 3 | |||
Ending balance | $ | (6,004) | $ | (5,500) | |
Cash flow hedges | |||||
Beginning balance | $ | 12 | $ | (80) | |
OCI before reclassifications – net of deferred taxes of $5 and $(8) | 20 | (25) | |||
Reclassifications from OCI – net of deferred taxes of $1 and $5 | - | 79 | |||
Other comprehensive income (loss)(a) | 20 | 55 | |||
Less OCI attributable to noncontrolling interests | - | - | |||
Ending balance | $ | 32 | $ | (26) | |
Benefit plans | |||||
Beginning balance | $ | (12,469) | $ | (11,410) | |
Prior service credit (costs) - net of deferred taxes of $0 and $5 | - | 23 | |||
Net actuarial gain (loss) – net of deferred taxes of $101 and $22 | 476 | 68 | |||
Net curtailment/settlement - net of deferred taxes of $16 and $0 | 30 | - | |||
Prior service cost amortization – net of deferred taxes of $19 and $21 | 11 | 16 | |||
Net actuarial loss amortization – net of deferred taxes of $253 and $216 | 533 | 443 | |||
Other comprehensive income (loss)(a) | 1,049 | 550 | |||
Less OCI attributable to noncontrolling interests | 2 | (1) | |||
Ending balance | $ | (11,421) | $ | (10,859) | |
Accumulated other comprehensive income (loss) at March 31 | $ | (16,771) | $ | (15,705) | |
| (a) | Total other comprehensive income (loss) was $1,833 million and $826 million in the three months ended March 31, 2017 and 2016, respectively. |
2017 1Q FORM 10-Q 80
RECLASSIFICATION OUT OF AOCI | |||||||
Three months ended March 31 | |||||||
(In millions) | 2017 | 2016 | Statement of Earnings caption | ||||
Available-for-sale securities | |||||||
Realized gains (losses) on | |||||||
sale/impairment of securities | $ | 105 | $ | (100) | Total revenues and other income(a) | ||
Income taxes | (36) | 40 | Benefit (provision) for income taxes(b) | ||||
Net of tax | $ | 69 | $ | (60) | |||
Currency translation adjustments | |||||||
Gains (losses) on dispositions | $ | (14) | $ | (6) | Total revenues and other income(c) | ||
Income taxes | (540) | 119 | Benefit (provision) for income taxes(d) | ||||
Net of tax | $ | (554) | $ | 114 | |||
Cash flow hedges | |||||||
Gains (losses) on interest rate derivatives | $ | (9) | $ | (30) | Interest and other financial charges | ||
Foreign exchange contracts | 12 | (41) | (e) | ||||
Other | (4) | (13) | (f) | ||||
Total before tax | (1) | (84) | |||||
Income taxes | 1 | 5 | Benefit (provision) for income taxes | ||||
Net of tax | $ | - | $ | (79) | |||
Benefit plan items | |||||||
Curtailment gain (loss) | $ | (46) | $ | - | (g) | ||
Amortization of prior service costs | (30) | (37) | (g) | ||||
Amortization of actuarial gains (losses) | (786) | (659) | (g) | ||||
Total before tax | (862) | (696) | |||||
Income taxes | 288 | 237 | Benefit (provision) for income taxes | ||||
Net of tax | $ | (574) | $ | (459) | |||
Total reclassification adjustments (net of tax) | $ | (1,058) | $ | (485) | |||
(a) | Included an insignificant amount and $(78) million for the three months ended March 31, 2017 and 2016, respectively in earnings (loss) from discontinued operations, net of taxes. |
(b) | Included an insignificant amount and $32 million for the three months ended March 31, 2017 and 2016, respectively in earnings (loss) from discontinued operations, net of taxes. |
(c) | Included $30 million and $(5) for the three months ended March 31, 2017 and 2016, respectively in earnings (loss) from discontinued operations, net of taxes. |
(d) | Included $(540) million and $119 for the three months ended March 31, 2017 and 2016, respectively in earnings (loss) from discontinued operations, net of taxes. |
(e) | Included $25 million and $(22) million in GE Capital revenues from services and $(12) million and $(19) million in interest and other financial charges in the three months ended March 31, 2017 and 2016, respectively. |
(f) | Primarily recorded in costs and expenses. |
(g) | Curtailment gain (loss), amortization of prior service costs and actuarial gains and losses out of AOCI are included in the computation of net periodic pension costs. See Note 11 for further information. |
2017 1Q FORM 10-Q 81
SHARES OF GE PREFERRED STOCK
On January 20, 2016, we issued $5,694 million of GE Series D preferred stock following an exchange offer for existing GE Series A, B and C preferred stock that had been issued as part of the GE Capital Exit Plan. The Series D preferred stock bear a fixed interest rate of 5.00% through January 21, 2021 and a floating rate equal to three-month LIBOR plus 3.33% thereafter. The Series D preferred stock are callable on January 21, 2021. Following the exchange offer, $250 million of Series A, B and C preferred stock remain outstanding with an initial average fixed dividend rate of 4.07%. The total carrying value of the GE preferred stock at March 31, 2017 was $5,317 million and will increase to $5,944 million through periodic accretion to the respective call dates of each series. Principal and accretion for the preferred stock is recorded in other capital in the consolidated Statement of Financial Position and dividends and accretion are presented under the caption "Preferred stock dividends" in the Statement of Earnings (Loss). Dividends on GE preferred stock are payable semi-annually, in June and December and accretion is recorded on a quarterly basis. Dividends on GE preferred stock totaled $34 million and $289 million, including cash dividends of zero and $65 million in the three months ended March 31, 2017 and 2016, respectively. Prior year dividend amount included deemed dividend of $232 million on GE preferred stock, including $195 million for the amount by which the fair value of the Series D preferred stock exceeded the existing Series A, B and C preferred stock and a cash payment of $37 million to the existing preferred shareholders. In conjunction with the issuance of GE preferred stock, GE Capital issued preferred stock to GE for which the amount and terms mirror the GE preferred stock held by external investors ( $5,317 million carrying value at March 31, 2017).
NONCONTROLLING INTERESTS
Noncontrolling interests in equity of consolidated affiliates includes common shares in consolidated affiliates and preferred stock issued by our affiliates.
CHANGES TO NONCONTROLLING INTERESTS | |||||
Three months ended March 31 | |||||
(In millions) | 2017 | 2016 | |||
Beginning balance at January 1 | $ | 1,663 | $ | 1,864 | |
Net earnings (loss) | 5 | (69) | |||
Dividends | (9) | (7) | |||
Dispositions | (13) | (42) | |||
Other (including AOCI)(a)(b) | (7) | (79) | |||
Ending balance at March 31 | $ | 1,639 | $ | 1,667 | |
(a) Includes research & development partner funding arrangements, acquisitions and eliminations.
| (b) | 2016 included $(123) million for deconsolidation of investment funds managed by GE Asset Management (GEAM) upon the adoption of ASU 2015-02, Amendments to the Consolidation Analysis , and prior to the July 1, 2016 sale of GEAM. |
REDEEMABLE NONCONTROLLING INTEREST
Redeemable noncontrolling interest presented in our statement of financial position includes common shares issued by our affiliates that are redeemable at the option of the holder of those interests.
As part of the Alstom acquisition, we formed three joint ventures with Alstom in grid technology, renewable energy, and global nuclear and French steam power. Noncontrolling interests in these joint ventures hold certain redemption rights. These joint ventures and the associated redemption rights are discussed below. Our retained earnings is adjusted for subsequent changes in the redemption value of the noncontrolling interest in these entities to the extent that the redemption value exceeds the carrying amount of the noncontrolling interest.
2017 1Q FORM 10-Q 82
Alstom holds redemption rights with respect to its interest in the grid technology and renewable energy joint ventures, which, if exercised, would require us to purchase all of their interest during September 2018 or September 2019. Alstom also holds similar redemption rights for the global nuclear and French steam power joint venture that are exercisable during the first full calendar quarter immediately following the fifth or sixth anniversary of the acquisition date. The redemption price would generally be equal to Alstom's initial investment plus annual accretion of 3% for the grid technology and renewable energy joint ventures and plus annual accretion of 2% for the nuclear and French steam power joint venture, with potential upside sharing based on an EBITDA multiple. Alstom also holds additional redemption rights in other limited circumstances as well as a call option to require GE to sell all of its interests in the renewable energy joint venture at the higher of fair value or Alstom's initial investment plus annual accretion of 3% during the month of May in the years 2017 through 2019 and also upon a decision to IPO the joint venture.
GE holds a call option on Alstom's interest in the global nuclear and French steam power joint venture at the same amount as Alstom's redemption price in the event that Alstom exercises its put option in the grid technology or renewable energy joint ventures. GE also has call options on Alstom's interest in the three joint ventures in other limited circumstances. In addition, the French Government holds a preferred interest in the global nuclear and French steam power joint venture, giving it certain protective rights.
CHANGES TO REDEEMABLE NONCONTROLLING INTERESTS | |||||
Three months ended March 31 | |||||
(In millions) | 2017 | 2016 | |||
Beginning balance at January 1 | $ | 3,025 | $ | 2,972 | |
Net earnings (loss) | (81) | (53) | |||
Dividends | (10) | (9) | |||
Redemption value adjustment | 73 | 32 | |||
Other | 47 | 94 | |||
Ending balance at March 31(a) | $ | 3,054 | $ | 3,036 | |
(a) Included $2,760 and $2,928 million related to the Alstom joint ventures at March 31, 2017 and 2016, respectively.
OTHER
Common dividends from GE Capital to GE totaled $2,000 million and $7,500 million in the three months ended March 31, 2017 and 2016, respectively. In April 2017, GE received an additional $2,000 million in common dividends from GE Capital.
2017 1Q FORM 10-Q 83
NOTE 14. EARNINGS PER SHARE INFORMATION
Three months ended March 31 | |||||||||||
2017 | 2016 | ||||||||||
(In millions; per-share amounts in dollars) | Diluted | Basic | Diluted | Basic | |||||||
Amounts attributable to the Company: | |||||||||||
Consolidated | |||||||||||
Earnings from continuing operations for | |||||||||||
per-share calculation(a)(b) | $ | 886 | $ | 886 | $ | 533 | $ | 533 | |||
Preferred stock dividends | (34) | (34) | (289) | (289) | |||||||
Earnings from continuing operations attributable to | |||||||||||
common shareowners for per-share calculation(a)(b) | $ | 852 | $ | 852 | $ | 244 | $ | 244 | |||
Earnings (loss) from discontinued operations | |||||||||||
for per-share calculation(a)(b) | (243) | (243) | (311) | (311) | |||||||
Net earnings attributable to GE common | |||||||||||
shareowners for per-share calculation(a)(b) | $ | 613 | $ | 613 | $ | (64) | $ | (64) | |||
Average equivalent shares | |||||||||||
Shares of GE common stock outstanding | 8,714 | 8,714 | 9,288 | 9,288 | |||||||
Employee compensation-related shares (including | |||||||||||
stock options) | 98 | - | 95 | - | |||||||
Total average equivalent shares | 8,811 | 8,714 | 9,383 | 9,288 | |||||||
Per-share amounts | |||||||||||
Earnings from continuing operations | $ | 0.10 | $ | 0.10 | $ | 0.03 | $ | 0.03 | |||
Earnings (loss) from discontinued operations | (0.03) | (0.03) | (0.03) | (0.03) | |||||||
Net earnings | 0.07 | 0.07 | (0.01) | (0.01) | |||||||
(a) | Our unvested restricted stock unit awards that contain non-forfeitable rights to dividends or dividend equivalents are considered participating securities. For the periods ended March 31, 2017 and 2016, pursuant to the two-class method, as a result of the excess of dividends in respect to current period earnings, losses were not allocated to the participating securities. |
(b) | Included an insignificant amount of dividend equivalents in each of the periods presented. |
For the three months ended March 31, 2017, approximately 15 million of outstanding stock awards were not included in the computation of diluted earnings (loss) per share because their effect was antidilutive. As a result of the loss from continuing operations for the three months ended March 31, 2016, all of the outstanding stock awards, approximately 33 million, were not included in the computation of diluted earnings (loss) per share because their effect was antidilutive.
Earnings-per-share amounts are computed independently for earnings (loss) from continuing operations, earnings (loss) from discontinued operations and net earnings (loss). As a result, the sum of per-share amounts from continuing operations and discontinued operations may not equal the total per-share amounts for net earnings (loss).
2017 1Q FORM 10-Q 84
NOTE 15. FAIR VALUE MEASUREMENTS
RECURRING FAIR VALUE MEASUREMENTS
Our assets and liabilities measured at fair value on a recurring basis include investment securities mainly supporting obligations to annuitants and policyholders in our run-off insurance operations and derivatives.
ASSETS AND LIABILITIES MEASURED AT FAIR VALUE ON A RECURRING BASIS | ||||||||||||||
Netting | ||||||||||||||
(In millions) | Level 1 | (a) | Level 2 | (a) | Level 3 | (b) | adjustment | Net balance (c) | ||||||
March 31, 2017 | ||||||||||||||
Assets | ||||||||||||||
Investment securities | $ | 241 | $ | 37,740 | $ | 3,967 | $ | - | $ | 41,949 | ||||
Derivatives | - | 4,311 | 21 | (3,869) | 463 | |||||||||
Total | $ | 241 | $ | 42,051 | $ | 3,988 | $ | (3,869) | $ | 42,412 | ||||
Liabilities | ||||||||||||||
Derivatives | $ | - | $ | 3,713 | $ | 4 | $ | (2,935) | $ | 782 | ||||
Other(d) | - | 1,179 | - | - | 1,179 | |||||||||
Total | $ | - | $ | 4,892 | $ | 4 | $ | (2,935) | $ | 1,961 | ||||
December 31, 2016 | ||||||||||||||
Assets | ||||||||||||||
Investment securities | $ | 188 | $ | 39,719 | $ | 4,406 | $ | - | $ | 44,313 | ||||
Derivatives | - | 5,444 | 23 | (5,121) | 345 | |||||||||
Total | $ | 188 | $ | 45,163 | $ | 4,429 | $ | (5,121) | $ | 44,658 | ||||
Liabilities | ||||||||||||||
Derivatives | $ | - | $ | 4,880 | $ | 2 | $ | (4,449) | $ | 434 | ||||
Other(d) | - | 1,143 | - | - | 1,143 | |||||||||
Total | $ | - | $ | 6,024 | $ | 2 | $ | (4,449) | $ | 1,577 | ||||
| (a) | There were no significant transfers between Level 1 and Level 2 for the three months ended March 31, 2017 and 2016. |
| (b) | Includes debt securities classified within Level 3 of $3,407 million of U.S. corporate and $240 million of Non-U.S. corporate at March 31, 2017, and $3,399 million of U.S. corporate and $688 million of Non-U.S. corporate. securities at December 31, 2016. |
| (c) | See Notes 3, 16 and 21 for additional information on the composition of our investment securities and derivative portfolios. |
| (d) | Primarily represents the liabilities associated with certain of our deferred incentive compensation plans. |
2017 1Q FORM 10-Q 85
LEVEL 3 INSTRUMENTS
The majority of our Level 3 balances consist of investment securities classified as available-for-sale with changes in fair value recorded in shareowners' equity.
CHANGES IN LEVEL 3 INSTRUMENTS FOR THE THREE MONTHS ENDED | |||||||||||||||||||||||||
Net realized/ | Net realized/ | ||||||||||||||||||||||||
unrealized | unrealized | ||||||||||||||||||||||||
gains | gains | ||||||||||||||||||||||||
(losses) | (losses) | Transfers | Transfers | ||||||||||||||||||||||
Balance at | included in | included | into | out of | Balance at | ||||||||||||||||||||
(In millions) | January 1 | earnings(a) | in AOCI | Purchases(b) | Sales | Settlements | Level 3 | Level 3 | March 31 | ||||||||||||||||
2017 | |||||||||||||||||||||||||
Investment securities | $ | 4,406 | $ | 9 | $ | 6 | $ | 92 | $ | - | $ | (88) | $ | 11 | $ | (470) | $ | 3,967 | |||||||
Derivatives | 21 | 1 | (1) | (1) | - | (2) | - | (1) | 17 | ||||||||||||||||
Other | - | - | - | - | - | - | - | - | - | ||||||||||||||||
Total | $ | 4,427 | $ | 10 | $ | 5 | $ | 91 | $ | - | $ | (90) | $ | 12 | $ | (471) | $ | 3,985 | |||||||
2016 | |||||||||||||||||||||||||
Investment securities | $ | 3,695 | $ | (12) | $ | 64 | $ | 60 | $ | (5) | $ | (9) | $ | - | $ | (15) | $ | 3,777 | |||||||
Derivatives | 88 | 4 | - | - | - | 1 | (11) | (1) | 82 | ||||||||||||||||
Other | 259 | - | - | - | - | - | - | (259) | - | ||||||||||||||||
Total | $ | 4,042 | $ | (8) | $ | 63 | $ | 60 | $ | (5) | $ | (8) | $ | (11) | $ | (275) | $ | 3,859 | |||||||
(a) | Earnings effects are primarily included in the "GE Capital revenues from services" and "Interest and other financial charges" captions in the Statement of Earnings. |
(b) | Includes $91 million of U.S. corporate for the three months ended March 31, 2017. |
The following table represents non-recurring fair value amounts (as measured at the time of the adjustment) for those assets remeasured to fair value on a non-recurring basis during the fiscal year and still held at March 31, 2017 and December 31, 2016.
Remeasured during the three months ended March 31, 2017 | Remeasured during the year ended December 31, 2016 | ||||||||||
(In millions) | Level 2 | Level 3 | Level 2 | Level 3 | |||||||
Financing receivables and financing receivables held for sale | $ | - | $ | - | $ | - | $ | 30 | |||
Cost and equity method investments | - | - | - | 103 | |||||||
Long-lived assets | - | 358 | 17 | 1,055 | |||||||
Total | $ | - | $ | 358 | $ | 17 | $ | 1,189 | |||
The following table represents the fair value adjustments to assets measured at fair value on a non-recurring basis and still held at March 31, 2017 and 2016.
Three months ended March 31 | |||||
(In millions) | 2017 | 2016 | |||
Financing receivables and financing receivables held for sale | $ | - | $ | (23) | |
Cost and equity method investments | (9) | (115) | |||
Long-lived assets | (35) | (58) | |||
Total | $ | (44) | $ | (197) | |
2017 1Q FORM 10-Q 86
LEVEL 3 MEASUREMENTS - SIGNIFICANT UNOBSERVABLE INPUTS | |||||||||||
Range | |||||||||||
(Dollars in millions) | Fair value | Valuation technique | Unobservable inputs | (weighted-average) | |||||||
March 31, 2017 | |||||||||||
Recurring fair value measurements | |||||||||||
Investment securities (b) | $ | 974 | Income approach | Discount rate(a) | 1.8%-24.2% (7.4%) | ||||||
Non-recurring fair value measurements | |||||||||||
Long-lived assets | 57 | Income approach | Discount rate(a) | 2.5%-12.1% (6.5%) | |||||||
December 31, 2016 | |||||||||||
Recurring fair value measurements | |||||||||||
Investment securities (b) | $ | 830 | Income approach | Discount rate(a) | 1.4%-17.4% (7.9%) | ||||||
Non-recurring fair value measurements | |||||||||||
Financing receivables and | |||||||||||
financing receivables held for sale | $ | 30 | Income approach | Discount rate(a) | 2.5%-30.0% (20.3%) | ||||||
Cost and equity method investments | 94 | Income approach | Discount rate(a) | 9.0%-30.0% (11.8%) | |||||||
Long-lived assets | 683 | Income approach | Discount rate(a) | 2.5%-20.0% (10.4%) | |||||||
(a) | Discount rates are determined based on inputs that market participants would use when pricing investments, including credit and liquidity risk. An increase in the discount rate would result in a decrease in the fair value. |
(b) | Comprises substantially all of U.S. corporate securities. |
At March 31, 2017 and December 31, 2016, other Level 3 recurring fair value measurements of $3,011 million and $3,598 million, respectively, and non-recurring measurements of $301 million and $379 million, respectively, are valued using non-binding broker quotes or other third-party sources. At March 31, 2017 and December 31, 2016, other recurring and non-recurring fair value measurements were individually insignificant and utilize a number of different unobservable inputs not subject to meaningful aggregation.
2017 1Q FORM 10-Q 87
NOTE 16. FINANCIAL INSTRUMENTS
The following table provides information about assets and liabilities not carried at fair value. The table excludes finance leases and non-financial assets and liabilities. Substantially all of the assets discussed below are considered to be Level 3. The vast majority of our liabilities' fair values can be determined based on significant observable inputs and thus considered Level 2. Few of the instruments are actively traded and their fair values must often be determined using financial models. Realization of the fair value of these instruments depends upon market forces beyond our control, including marketplace liquidity.
March 31, 2017 | December 31, 2016 | |||||||||||
Carrying | Carrying | |||||||||||
amount | Estimated | amount | Estimated | |||||||||
(In millions) | (net) | fair value | (net) | fair value | ||||||||
GE | ||||||||||||
Assets | ||||||||||||
Investments and notes receivable | $ | 1,283 | $ | 1,352 | $ | 1,526 | $ | 1,595 | ||||
Liabilities | ||||||||||||
Borrowings(a)(b) | 19,610 | 20,472 | 19,184 | 19,923 | ||||||||
Borrowings (debt assumed)(a)(c) | 54,392 | 61,307 | 60,109 | 66,998 | ||||||||
GE Capital | ||||||||||||
Assets | ||||||||||||
Loans | 18,837 | 18,833 | 21,060 | 20,830 | ||||||||
Other commercial mortgages | 1,420 | 1,493 | 1,410 | 1,472 | ||||||||
Loans held for sale | 740 | 740 | 473 | 473 | ||||||||
Other financial instruments(d) | 118 | 163 | 121 | 150 | ||||||||
Liabilities | ||||||||||||
Borrowings(a)(e)(f)(g) | 55,828 | 59,709 | 58,523 | 62,024 | ||||||||
Investment contracts | 2,724 | 3,164 | 2,813 | 3,277 | ||||||||
(a) See Note 10.
(b) Included $187 million and $115 million of accrued interest in estimated fair value at March 31, 2017 and December 31, 2016, respectively.
| (c) | Included $599 million and $803 million of accrued interest in estimated fair value at March 31, 2017 and December 31, 2016, respectively. |
| (d) | Principally comprises cost method investments. |
| (e) | Fair values exclude interest rate and currency derivatives designated as hedges of borrowings. Had they been included, the fair value of borrowings at March 31, 2017 and December 31, 2016 would have been reduced by $2,309 million and $2,397 million, respectively. |
| (f) | Included $611 million and $775 million of accrued interest in estimated fair value at March 31, 2017 and December 31, 2016, respectively. |
| (g) | Excluded $50,317 million and $58,780 million of net intercompany payable to GE at March 31, 2017 and December 31, 2016 respectively. |
NOTIONAL AMOUNTS OF LOAN COMMITMENTS | |||||
(In millions) | March 31, 2017 | December 31, 2016 | |||
Ordinary course of business lending commitments(a) | $ | 956 | $ | 687 | |
Unused revolving credit lines | 236 | 238 | |||
| (a) | Excluded investment commitments of $555 million and $522 million at March 31, 2017 and December 31, 2016, respectively. |
SECURITIES REPURCHASE AND REVERSE REPURCHASE ARRANGEMENTS
We enter into reverse securities repurchase agreements, primarily for short-term investment with maturities of 90 days or less. At March 31, 2017, we were party to reverse repurchase agreements totaling $2,950 million, which were reported in cash and equivalents on the financial statements. Under these reverse securities repurchase agreements, we typically lend available cash at a specified rate of interest and hold U.S. or highly-rated European government securities as collateral during the term of the agreement. Collateral value is in excess of amounts loaned under the agreements.
2017 1Q FORM 10-Q 88
DERIVATIVES AND HEDGING
In this section, we explain how we use derivatives to manage our risks and how these financial instruments are reflected in our financial statements. Our use of derivatives relates solely to risk management; we do not use derivatives for speculation. As discussed elsewhere in this report, we are executing a plan to reduce the size and scope of our financial services business, with the intention of principally retaining those activities that support our industrial businesses. The affected businesses have either been sold or are held for sale and are presented as discontinued operations in our financial statements as of March 31, 2017. As a result of these actions, the significance of financial services hedging activity will diminish significantly in the future.
RISK MANAGEMENT STRATEGY
In our industrial businesses, we buy, manufacture and sell components and products across global markets. These activities expose us to changes in foreign currency exchange rates and commodity prices, which can adversely affect revenues earned and costs of operating our industrial businesses. When the currency in which we sell equipment differs from the primary currency of one of our industrial businesses (known as its functional currency) and the exchange rate fluctuates, it will affect the revenue we earn on the sale. These sales and purchase transactions also create receivables and payables denominated in foreign currencies, which expose us to foreign currency gains and losses based on changes in exchange rates. Changes in the price of a raw material that we use in manufacturing can affect the cost of manufacturing. We use derivatives to mitigate or eliminate these exposures.
With respect to our ongoing financial services activities, our key exposures relate to interest rate and currency risk. To the extent feasible, we seek to ensure that the characteristics of the debt we have issued align with the assets being funded. The form (fixed rate or floating rate) and currency denomination of the debt we issue depends on a number of considerations, the most important of which are market factors (demand, pricing, etc.) that affect the economics of the issuance. If the form and currency denomination of the debt does not match the assets being funded, we typically execute derivatives to meet this objective within defined limits.
FORMS OF HEDGING
In this section we explain the hedging methods we use and their effects on our financial statements.
Cash flow hedges – We use cash flow hedging primarily to reduce or eliminate the effects of foreign exchange rate changes on purchase and sale contracts in our industrial businesses and to convert foreign currency debt that we have issued in our financial services business back to our functional currency. Accordingly, the vast majority of our derivative activity in this category consists of currency exchange contracts. As a result of acquisitions in our industrial businesses, we expect to significantly expand our foreign currency hedging activity related to long-term contracts. We also use commodity derivatives to reduce or eliminate price risk on raw materials purchased for use in manufacturing.
Under hedge accounting, the derivative carrying amount is measured at fair value each period and any resulting gain or loss is recorded in a separate component of shareowners' equity. Differences between the derivative and the hedged item may cause changes in their fair values to not offset completely, which is referred to as ineffectiveness. When the hedged transaction occurs, these amounts are released from shareowners' equity, in order that the transaction will be reflected in earnings at the rate locked in by the derivative. The effect of the hedge is reported in the same financial statement line item as the earnings effects of the hedged transaction. The table below summarizes how the derivative is reflected in the balance sheet and in earnings under hedge accounting. The effect of the hedged forecasted transaction is not presented in this table but offsets the earnings effect of the derivative.
2017 1Q FORM 10-Q 89
As part of our ongoing effort to reduce borrowings, we may repurchase debt that was in a cash flow hedge accounting relationship. At the time of determining that the debt cash flows are probable of not occurring, any related OCI will be released to earnings.
FINANCIAL STATEMENT EFFECTS - CASH FLOW HEDGES | |||||
Three months ended March 31 | |||||
(In millions) | 2017 | 2016 | |||
Balance sheet changes | |||||
Fair value of derivatives increase (decrease) | $ | 22 | $ | (56) | |
Shareowners' equity (increase) decrease | (22) | 57 | |||
Earnings (loss) related to ineffectiveness | - | 1 | |||
Earnings (loss) effect of derivatives(a) | (1) | (84) | |||
(a) Offsets earnings effect of the hedged forecasted transaction | |||||
The following table explains the effect of changes in market rates on the fair value of derivatives we use most commonly in cash flow hedging arrangements.
Interest rate forwards/swaps | Interest rate increases | Interest rate decreases | ||
Pay fixed rate/receive floating rate | Fair value increases | Fair value decreases | ||
Currency forwards/swaps | U.S. dollar strengthens | U.S. dollar weakens | ||
Pay U.S. dollars/receive foreign currency | Fair value decreases | Fair value increases | ||
Commodity derivatives | Price increases | Price decreases | ||
Receive commodity/ pay fixed price | Fair value increases | Fair value decreases | ||
Fair value hedges – These derivatives are used to hedge the effects of interest rate and currency exchange rate changes on debt that we have issued. We have issued mostly fixed rate debt that is used to fund both fixed and floating rate assets. In instances where fixed rate debt is funding floating rate assets, we have an exposure to changes in interest rates. We enter into interest rate swaps that receive a fixed rate and pay a floating rate of interest to align with that portion of our debt which funds floating rate assets. These swaps typically match the maturity of the associated debt being hedged.
Under hedge accounting, the derivative is measured at fair value and the carrying amount of the hedged debt is adjusted for the change in value related to the exposure being hedged, with both adjustments offset to earnings as interest expense. For example, the earnings effect of an increase in the fair value of the derivative will be largely offset by the earnings effect of an increase in the carrying amount of the hedged debt. Differences between the terms of the derivative and the hedged debt may cause changes in their fair values to not offset completely, which is referred to as ineffectiveness. The table below summarizes how the derivative and the hedged debt are reflected in the balance sheet and in earnings under hedge accounting. The effect on interest expense of changing from the fixed rate on the debt to the floating rate on the swap is not shown in this table.
2017 1Q FORM 10-Q 90
FINANCIAL STATEMENT EFFECTS - FAIR VALUE HEDGES | |||||
Three months ended March 31 | |||||
(In millions) | 2017 | 2016 | |||
Balance sheet changes | |||||
Fair value of derivative increase (decrease) | $ | (225) | $ | 1,723 | |
Adjustment to carrying amount of hedged debt (increase) decrease | 163 | (1,754) | |||
Earnings (loss) related to hedge ineffectiveness | (62) | (32) | |||
The effect of changes in market interest rates on the fair value of derivatives we use most commonly in fair value hedging arrangements is presented below.
Interest rate forwards/swaps | Interest rate increases | Interest rate decreases | ||
Pay floating rate/receive fixed rate | Fair value decreases | Fair value increases | ||
Net investment hedges – We invest in foreign operations that conduct their financial services activities in currencies other than the U.S. dollar. We hedge the currency risk associated with those investments primarily using short-term currency exchange contracts under which we receive U.S. dollars and pay foreign currency and non-derivatives instruments such as debt denominated in a foreign currency.
Under hedge accounting, the portion of the fair value change of the derivative or debt instrument that relates to changes in spot currency exchange rates is offset in a separate component of shareowners' equity. For example, an increase in the fair value of the derivative related to changes in spot exchange rates will be offset by a corresponding increase in the currency translation component of shareowners' equity. The portion of the fair value change of the derivative related to differences between spot and forward rates, which primarily relates to the interest component, is recorded in earnings each period as interest expense. As a result of this hedging strategy, the investments in foreign operations of our financial services business are largely unaffected by changes in currency exchange rates. The amounts recorded in shareowners' equity only affect earnings if the hedged investment is sold, substantially liquidated, or control is lost.
FINANCIAL STATEMENT EFFECTS - NET INVESTMENT HEDGES | |||||
Three months ended March 31 | |||||
(In millions) | 2017 | 2016 | |||
Balance sheet changes | |||||
Fair value of derivatives increase (decrease) | $ | (92) | $ | 329 | |
Fair value of non-derivatives (increase) decrease | (471) | 273 | |||
Shareowners' equity (increase) decrease | 573 | (569) | |||
Earnings (loss) related to spot-forward differences and ineffectiveness | 10 | 32 | |||
Earnings (loss) related to reclassification upon sale or liquidation(a) | 60 | (693) | |||
| (a) | Included $60 million and $(693) million recorded in discontinued operations in the three months ended March 31, 2017 and 2016, respectively. |
The effect of changes in currency exchange rates on the fair value of derivatives we use in net investment hedging arrangements is presented below .
Currency forwards/swaps | U.S. dollar strengthens | U.S. dollar weakens | ||
Receive U.S. dollars/pay foreign currency | Fair value increases | Fair value decreases |
2017 1Q FORM 10-Q 91
Economic Hedges - These derivatives are not designated as hedges from an accounting standpoint (and therefore we do not apply hedge accounting to the relationship) but otherwise serve the same economic purpose as other hedging arrangements. Economic hedges are used when changes in the carrying amount of the hedged item are already recorded in earnings in the same period as the derivative, making hedge accounting unnecessary. For example, in our industrial businesses we record the effects of spot exchange rate changes on our foreign currency payables and receivables in earnings each period along with the fair value changes on the foreign currency forward contracts used as economic hedges. In these cases, the earnings effects of the derivative and hedged item largely offset. We also use economic hedges when we have exposures to currency exchange risk for which we are unable to meet the requirements for hedge accounting. For example, we use currency forwards as an economic hedge of forecasted foreign currency cash flows under long-term contracts. In this case, the forecast period is so long that it is difficult to meet the hedge accounting requirement that the occurrence of the hedged transactions is probable. For these types of economic hedges, changes in the fair value of the derivative are recorded in earnings currently but changes in the value of the forecasted foreign currency cash flows are only recognized in earnings when they occur. As a result, even though the derivative is an effective economic hedge, there is a net effect on earnings in each period due to differences in the timing of earnings recognition between the derivative and the hedged item.
The table below provides information about the earnings effects of all derivatives that serve as economic hedges. These derivatives are marked to fair value through earnings each period. For our financial services business, these gains and losses are reported in "GE Capital revenues from services". For our industrial businesses, the effects are reported in "Other income" or "Other costs and expenses". The offsetting earnings effects associated with hedged assets and liabilities are also displayed in the table below. In general, the earnings effects of the hedged item are recorded in the same financial statement line as the derivative. The earnings effect of economic hedges, after considering offsets related to earnings effects of hedged assets and liabilities, is substantially offset by changes in the fair value of forecasted transactions that have not yet affected earnings.
FINANCIAL STATEMENT EFFECTS - ECONOMIC HEDGES | |||||
Three months ended March 31 | |||||
(In millions) | 2017 | 2016 | |||
Balance sheet changes | |||||
Change in fair value of economic hedge increase (decrease) | $ | (339) | $ | (278) | |
Change in carrying amount of item being hedged increase (decrease) | 224 | 87 | |||
Earnings (loss) effect of economic hedges(a) | (115) | (191) | |||
(a) Offset by the future earnings effects of economically hedged item.
The table below explains the effects of market rate changes on the fair value of derivatives we use most commonly as economic hedges.
Interest rate forwards/swaps interest rate | Interest rate increases | Interest rate decreases | ||
Pay floating rate/receive fixed rate | Fair value decreases | Fair value increases | ||
Currency forwards/swaps | U.S. dollar strengthens | U.S. dollar weakens | ||
Pay U.S. dollars/receive foreign currency | Fair value decreases | Fair value increases | ||
Receive U.S. dollars/pay foreign currency | Fair value increases | Fair value decreases | ||
Commodity derivatives | Price increases | Price decreases | ||
Receive commodity/ pay fixed price | Fair value increases | Fair value decreases | ||
NOTIONAL AMOUNT OF DERIVATIVES
The notional amount of a derivative is the number of units of the underlying (for example, the notional principal amount of the debt in an interest rate swap). The notional amount is used to compute interest or other payment streams to be made under the contract and is a measure of our level of activity. We generally disclose derivative notional amounts on a gross basis. A substantial majority of the outstanding notional amount of $161 billion at March 31, 2017 is related to managing interest rate and currency risk between financial assets and liabilities in our financial services business. The remaining derivative notional amount primarily relates to hedges of anticipated sales and purchases in foreign currency, commodity purchases and contractual terms in contracts that are considered embedded derivatives.
2017 1Q FORM 10-Q 92
The table below provides additional information about how derivatives are reflected in our financial statements. Derivative assets and liabilities are recorded at fair value exclusive of interest earned or owed on interest rate derivatives, which is presented separately on our Statement of Financial Position. Cash collateral and securities held as collateral represent assets that have been provided by our derivative counterparties as security for amounts they owe us (derivatives that are in an asset position).
CARRYING AMOUNTS RELATED TO DERIVATIVES | |||||
(In millions) | March 31, 2017 | December 31, 2016 | |||
Derivative assets | $ | 4,332 | $ | 5,467 | |
Derivative liabilities | (3,717) | (4,883) | |||
Accrued interest | 352 | 792 | |||
Cash collateral & credit valuation adjustment | (934) | (672) | |||
Net Derivatives | 33 | 703 | |||
Securities held as collateral | (323) | (442) | |||
Net amount | $ | (291) | $ | 262 | |
EFFECTS OF DERIVATIVES ON EARNINGS
All derivatives are marked to fair value on our balance sheet, whether they are designated in a hedging relationship for accounting purposes or are used as economic hedges. As discussed in the previous sections, each type of hedge affects the financial statements differently. In fair value and economic hedges, both the hedged item and the hedging derivative largely offset in earnings each period. In cash flow and net investment hedges, the effective portion of the hedging derivative is offset in separate components of shareowners' equity and ineffectiveness is recognized in earnings. The table below summarizes these offsets and the net effect on pre-tax earnings.
Three months ended March 31 | ||||||||
(In millions) | Effect on hedging instrument | Effect on underlying | Effect on earnings | |||||
2017 | ||||||||
Cash flow hedges | $ | 22 | $ | (22) | $ | - | ||
Fair value hedges | (225) | 163 | (62) | |||||
Net investment hedges(a) | (563) | 573 | 10 | |||||
Economic hedges(b) | (339) | 224 | (115) | |||||
Total | $ | (167) | ||||||
2016 | ||||||||
Cash flow hedges | $ | (56) | $ | 57 | $ | 1 | ||
Fair value hedges | 1,723 | (1,754) | (32) | |||||
Net investment hedges(a) | 602 | (569) | 32 | |||||
Economic hedges(b) | (278) | 87 | (191) | |||||
Total | $ | (190) | ||||||
The amounts in the table above generally do not include associated derivative accruals in income or expense.
(a) Both derivatives and non-derivatives hedging instruments are included.
(b) Net effect is substantially offset by the change in fair value of the hedged item that will affect earnings in future periods.
See Note 13 for additional information about changes in shareowners' equity related to hedging and amounts released to earnings. See Note 21 for other supplemental information about derivatives and hedging.
2017 1Q FORM 10-Q 93
NOTE 17. VARIABLE INTEREST ENTITIES
A VIE is an entity that has one of three characteristics: (1) it is controlled by someone other than its shareowners or partners, (2) its shareowners or partners are not economically exposed to the entity's earnings (for example, they are protected against losses), or (3) it was thinly capitalized when it was formed.
In the normal course of our business we become involved with VIEs either because we help create them or we invest in them. Our VIEs either provide goods and services to customers or provide financing to third parties for the purchase of GE goods and services. If we control the VIE, we consolidate it and provide disclosures below. However, if the VIE is a business and use of its assets is not limited to settling its liabilities, ongoing disclosures are not required.
CONSOLIDATED VARIABLE INTEREST ENTITIES
Our most significant consolidated VIEs are the three joint ventures that were formed as part of the Alstom acquisition. These joint ventures include grid technology, renewable energy, and global nuclear and French steam power and have combined assets, liabilities and redeemable noncontrolling interest as of March 31, 2017 and December 31, 2016 of $15,519 million, $8,266 million and $2,760 million and $14,460 million, $9,922 million and $2,709 million, respectively. These joint ventures are considered VIEs because the equity held by Alstom does not participate fully in the earnings of the ventures due to the contractual features allowing Alstom to sell their interests back to GE. We consolidate these ventures because we control all their significant activities. These joint ventures are in all other respects regular businesses and are therefore exempt from ongoing disclosure requirements for VIEs provided below.
The table below provides information about VIEs that are subject to ongoing disclosure requirements. Substantially all of these entities were created to help our customers finance the purchase of GE goods and services or to purchase GE current and customer notes receivable originating from sales of goods and services. These entities have no features that could expose us to losses that would significantly exceed the difference between the consolidated assets and liabilities.
2017 1Q FORM 10-Q 94
ASSETS AND LIABILITIES OF CONSOLIDATED VIEs | |||||||||||
GE Capital | |||||||||||
Customer | |||||||||||
(In millions) | GE | Notes receivables(a) | Other | Total | |||||||
March 31, 2017 | |||||||||||
Assets | |||||||||||
Financing receivables, net | $ | - | $ | - | $ | 948 | $ | 948 | |||
Current receivables | 63 | 554 | - | 617 | |||||||
Investment securities | - | - | 976 | 976 | |||||||
Other assets | 477 | 1,145 | 1,530 | 3,152 | |||||||
Total | $ | 540 | $ | 1,699 | $ | 3,454 | $ | 5,693 | |||
Liabilities | |||||||||||
Borrowings | $ | - | $ | - | $ | 754 | $ | 754 | |||
Non-recourse borrowings | - | 652 | 16 | 668 | |||||||
Other liabilities | 449 | 1,022 | 1,790 | 3,261 | |||||||
Total | $ | 449 | $ | 1,674 | $ | 2,560 | $ | 4,683 | |||
December 31, 2016 | |||||||||||
Assets | |||||||||||
Financing receivables, net | $ | - | $ | - | $ | 1,035 | $ | 1,035 | |||
Current receivables | 57 | 670 | - | 727 | |||||||
Investment securities | - | - | 982 | 982 | |||||||
Other assets | 492 | 1,122 | 1,747 | 3,361 | |||||||
Total | $ | 549 | $ | 1,792 | $ | 3,764 | $ | 6,105 | |||
Liabilities | |||||||||||
Borrowings | $ | 1 | $ | - | $ | 818 | $ | 819 | |||
Non-recourse borrowings | - | 401 | 16 | 417 | |||||||
Other liabilities | 457 | 1,378 | 1,482 | 3,317 | |||||||
Total | $ | 458 | $ | 1,779 | $ | 2,316 | $ | 4,553 | |||
| (a) | Two funding vehicles established to purchase customer notes receivable from GE, one of which is partially funded by third-party debt. |
Total revenues from our consolidated VIEs were $252 million and $355 million for the three months ended March 31, 2017 and 2016, respectively. Related expenses consisted primarily of cost of goods and services of $95 million and $344 million for the three months ended March 31, 2017 and 2016, respectively.
Where we provide servicing for third-party investors, we are contractually permitted to commingle cash collected from customers on financing receivables sold to third-party investors with our own cash prior to payment to third-party investors, provided our short-term credit rating does not fall below A-1/P1. These third-party investors also owe us amounts for purchased financial assets and scheduled interest and principal payments. At March 31, 2017 and December 31, 2016, the amounts of commingled cash owed to the third-party investors were $923 million and $1,117 million, respectively, and the amounts owed to us by third-party investors were $163 million and $5 million, respectively.
UNCONSOLIDATED VARIABLE INTEREST ENTITIES
We become involved with unconsolidated VIEs primarily through assisting in the formation and financing of the entity. We do not consolidate these entities because we do not have power over decisions that significantly affect their economic performance. Our investments in unconsolidated VIEs, at March 31, 2017 and December 31, 2016 were $6,271 million and $6,346 million, respectively. Substantially all of these investments are held by Energy Financial Services. Obligations to make additional investments in these entities are not significant.
2017 1Q FORM 10-Q 95
NOTE 18. COMMITMENTS, GUARANTEES, PRODUCT WARRANTIES AND OTHER LOSS CONTINGENCIES
COMMITMENTS
The GE Capital Aviation Services (GECAS) business in GE Capital had placed multiple-year orders for various Boeing, Airbus and other aircraft manufacturers with list prices approximating $32,523 million and secondary orders with airlines for used aircraft of approximately $2,403 million at March 31, 2017. In our Aviation segment, we had committed to provide financing assistance of $1,891 million of future customer acquisitions of aircraft equipped with our engines.
GUARANTEES
Our guarantees are provided in the ordinary course of business. We underwrite these guarantees considering economic, liquidity and credit risk of the counterparty. We believe that the likelihood is remote that any such arrangements could have a significant adverse effect on our financial position, results of operations or liquidity. We record liabilities for guarantees at estimated fair value, generally the amount of the premium received, or if we do not receive a premium, the amount based on appraisal, observed market values or discounted cash flows. Any associated expected recoveries from third parties are recorded as other receivables, not netted against the liabilities.
At March 31, 2017, we were committed under the following guarantee arrangements beyond those provided on behalf of VIEs. See Note 17.
Credit Support. We have provided $1,620 million of credit support on behalf of certain customers or associated companies, predominantly joint ventures and partnerships, using arrangements such as standby letters of credit and performance guarantees. These arrangements enable these customers and associated companies to execute transactions or obtain desired financing arrangements with third parties. Should the customer or associated company fail to perform under the terms of the transaction or financing arrangement, we would be required to perform on their behalf. Under most such arrangements, our guarantee is secured, usually by the asset being purchased or financed, or possibly by certain other assets of the customer or associated company. The length of these credit support arrangements parallels the length of the related financing arrangements or transactions. The liability for such credit support was $42 million at March 31, 2017.
Indemnification Agreements – Continuing Operations. We have agreements that require us to fund up to $232 million at March 31, 2017 under residual value guarantees on a variety of leased equipment. Under most of our residual value guarantees, our commitment is secured by the leased asset. The liability for these indemnification agreements was $7 million at March 31, 2017.
At March 31, 2017, we also had $1,044 million of other indemnification commitments, substantially all of which relate to representations and warranties in sales of businesses or assets. The liability for these indemnification commitments was $227 million at March 31, 2017.
Indemnification Agreements – Discontinued Operations. At March 31, 2017 , we provided specific indemnifications to buyers of GE Capital's assets that amounted to $2,550 million, for which we have recognized related liabilities of $297 million. In addition, in connection with the 2015 public offering and sale of our North American Retail Finance business, Synchrony Financial, GE Capital indemnified Synchrony Financial and its directors, officers, and employees against the liabilities of GECC's businesses other than historical liabilities of the businesses that are part of Synchrony Financial's ongoing operations.
Contingent Consideration. These are agreements to provide additional consideration to a buyer or seller in a business combination if contractually specified conditions related to the acquisition or disposition are achieved. The amount of contingent consideration was insignificant at March 31, 2017.
2017 1Q FORM 10-Q 96
PRODUCT WARRANTIES
We provide for estimated product warranty expenses when we sell the related products. Because warranty estimates are forecasts that are based on the best available information – mostly historical claims experience – claims costs may differ from amounts provided. An analysis of changes in the liability for product warranties follows.
Three months ended March 31 | |||||
(In millions) | 2017 | 2016 | |||
Balance at January 1 | $ | 1,920 | $ | 1,723 | |
Current-year provisions | 158 | 167 | |||
Expenditures | (211) | (179) | |||
Other changes | 17 | 53 | |||
Balance at March 31 | $ | 1,884 | $ | 1,764 | |
OTHER LOSS CONTINGENCIES
LEGAL MATTERS
WMC. During the fourth quarter of 2007, we completed the sale of WMC, our U.S. mortgage business. WMC substantially discontinued all new loan originations by the second quarter of 2007, and is not a loan servicer. In connection with the sale, WMC retained certain representation and warranty obligations related to loans sold to third parties prior to the disposal of the business and contractual obligations to repurchase previously sold loans that had an early payment default. All claims received by WMC for early payment default have either been resolved or are no longer being pursued.
The remaining active claims have been brought by securitization trustees or administrators seeking recovery from WMC for alleged breaches of representations and warranties on mortgage loans that serve as collateral for residential mortgage-backed securities (RMBS). At March 31, 2017 and December 31, 2016, such claims consisted of $1,060 million of individual claims generally submitted before the filing of a lawsuit and $5,456 million of additional claims asserted against WMC in litigation without making a prior claim (Litigation Claims). The total amount of these claims, $6,516 million, reflects the purchase price or unpaid principal balances of the loans at the time of purchase and does not give effect to pay downs or potential recoveries based upon the underlying collateral, which in many cases are substantial, nor to accrued interest or fees. WMC believes that repurchase claims brought based upon representations and warranties made more than six years before WMC was notified of the claim would be disallowed in legal proceedings under applicable law and the June 11, 2015 decision of the New York Court of Appeals in ACE Securities Corp. v. DB Structured Products, Inc., on the statute of limitations period governing such claims.
Reserves related to repurchase claims made against WMC were $626 million at March 31, 2017. The reserve estimate takes into account recent settlement activity and is based upon WMC's evaluation of the remaining exposures as a percentage of estimated lifetime mortgage loan losses within the pool of loans supporting each securitization for which timely claims have been asserted in litigation against WMC. Settlements in prior periods reduced WMC's exposure on claims asserted in certain securitizations and the claim amounts reported above give effect to these settlements .
ROLLFORWARD OF THE RESERVE | |||||
Three months ended March 31 | |||||
(In millions) | 2017 | 2016 | |||
Balance, beginning of period | $ | 626 | $ | 875 | |
Provision | - | 57 | |||
Claim resolutions / rescissions | - | (99) | |||
Balance, end of period | $ | 626 | $ | 833 | |
2017 1Q FORM 10-Q 97
Given the significant litigation activity and WMC's continuing efforts to resolve the lawsuits involving claims made against WMC, it is difficult to assess whether future losses will be consistent with WMC's past experience. Adverse changes to WMC's assumptions supporting the reserve may result in an increase to these reserves. WMC estimates a range of reasonably possible loss from $0 to approximately $500 million over its recorded reserve at March 31, 2017. This estimate involves significant judgment and may not reflect the range of uncertainties and unpredictable outcomes inherent in litigation, including the matters discussed in Legal Proceedings and potential changes in WMC's legal strategy. This estimate excludes any possible loss associated with an adverse court decision on the applicable statute of limitations or an adverse outcome in the Financial Institutions Reform, Recovery, and Enforcement Act of 1989 (FIRREA) investigation discussed in Legal Proceedings, as WMC is unable at this time to develop such a meaningful estimate.
At March 31, 2017, there were 10 lawsuits involving claims made against WMC arising from alleged breaches of representations and warranties on mortgage loans included in 11 securitizations. The adverse parties in these cases are securitization trustees or parties claiming to act on their behalf. On January 23, 2017, the ResCap Liquidating Trust, as successor to Residential Funding Company, LLC (RFC), filed a lawsuit against WMC in the United States District Court for the District of Minnesota arising from alleged breaches in representations and warranties made by WMC in connection with the sale of approximately $840 million in loans to RFC over a period of time preceding RFC's filing for bankruptcy protection in May 2012. Although the alleged claims for relief vary from case to case, the complaints and counterclaims in these actions generally assert claims for breach of contract, indemnification, and/or declaratory judgment, and seek specific performance (repurchase of defective mortgage loan) and/or money damages. Adverse court decisions, including in cases not involving WMC, could result in new claims and lawsuits on additional loans. However, WMC continues to believe that it has defenses to the claims asserted in litigation, including, for example, based on causation and materiality requirements and applicable statutes of limitations. It is not possible to predict the outcome or impact of these defenses and other factors, any of which could materially affect the amount of any loss ultimately incurred by WMC on these claims.
WMC has also received indemnification demands, nearly all of which are unspecified, from depositors/underwriters/sponsors of RMBS in connection with lawsuits brought by RMBS investors concerning alleged misrepresentations in the securitization offering documents to which WMC is not a party or, in two cases, involving mortgage loan repurchase claims made against RMBS sponsors. WMC believes that it has defenses to these demands.
To the extent WMC is required to repurchase loans, WMC's loss also would be affected by several factors, including pay downs, accrued interest and fees, and the value of the underlying collateral. The reserve and estimate of possible loss reflect judgment, based on currently available information, and a number of assumptions, including economic conditions, claim and settlement activity, pending and threatened litigation, court decisions regarding WMC's legal defenses, indemnification demands, government activity, and other variables in the mortgage industry. Actual losses arising from claims against WMC could exceed these amounts and additional claims and lawsuits could result if actual claim rates, governmental actions, litigation and indemnification activity, adverse court decisions, actual settlement rates or losses WMC incurs on repurchased loans differ from its assumptions .
Alstom legacy matters . On November 2, 2015, we acquired the Thermal, Renewables and Grid businesses from Alstom. Prior to the acquisition, the seller was the subject of two significant cases involving anti-competitive activities and improper payments: (1) in January 2007, Alstom was fined €65 million by the European Commission for participating in a gas insulated switchgear cartel that operated from 1988 to 2004 (that fine was later reduced to €59 million), and (2) in December 2014, Alstom pled guilty in the United States to multiple violations of the Foreign Corrupt Practices Act and paid a criminal penalty of $772 million. As part of GE's accounting for the acquisition, we established a reserve amounting to $858 million for legal and compliance matters related to the legacy business practices that were the subject of these and related cases in various jurisdictions.
2017 1Q FORM 10-Q 98
Regardless of jurisdiction, the allegations relate to claimed anti-competitive conduct or improper payments in the pre-acquisition period as the source of legal violations and/or damages. Given the significant litigation and compliance activity related to these matters and our ongoing efforts to resolve them, it is difficult to assess whether the disbursements will ultimately be consistent with the reserve established. The estimation of this reserve involved significant judgment and may not reflect the full range of uncertainties and unpredictable outcomes inherent in litigation and investigations of this nature. Damages sought may include disgorgement of profits on the underlying business transactions, fines and/or penalties, interest, or other forms of resolution. Factors that can affect the ultimate amount of losses associated with these matters include the way cooperation is assessed and valued, prosecutorial discretion in the determination of damages, formulas for determining fines and penalties, the duration and amount of legal and investigative resources applied, and political and social influences within each jurisdiction, among other considerations. Actual losses arising from claims in these matters could exceed the amount provided. At this time, we are unable to develop a meaningful estimate of the range of reasonably possible additional losses for this exposure.
ENVIRONMENTAL MATTERS
Our operations, like operations of other companies engaged in similar businesses, involve the use, disposal and cleanup of substances regulated under environmental protection laws. We are involved in numerous remediation actions to clean up hazardous wastes as required by federal and state laws. Liabilities for remediation costs exclude possible insurance recoveries and, when dates and amounts of such costs are not known, are not discounted. When there appears to be a range of possible costs with equal likelihood, liabilities are based on the low end of such range. It is reasonably possible that our environmental remediation exposure will exceed amounts accrued. However, due to uncertainties about the status of laws, regulations, technology and information related to individual sites, such amounts are not reasonably estimable. For further information, see our Annual Report on Form 10-K for the fiscal year ended December 31, 2016.
NOTE 19. INTERCOMPANY TRANSACTIONS
Transactions between related companies are made on an arms-length basis and are reported in the respective GE and GE Capital columns of our financial statements, but are eliminated in deriving our consolidated financial statements. These transactions include, but are not limited to, the following:
| GE Capital dividends to GE, |
| GE Capital working capital solutions to optimize GE cash management, |
| GE Capital enabled GE industrial orders, and |
| Aircraft engines, power equipment and healthcare equipment manufactured by GE that are installed on GE Capital investments, including leased equipment. |
In addition to the above transactions that primarily enable growth for the GE businesses, there are routine related party transactions, which include, but are not limited to, the following:
| Expenses related to parent-subsidiary pension plans, |
| Buildings and equipment leased between GE and GE Capital, including sale-leaseback transactions, |
| Information technology (IT) and other services sold to GE Capital by GE, and |
| Various investments, loans and allocations of GE corporate overhead costs. |
2017 1Q FORM 10-Q 99
Presented below is a walk of intercompany eliminations from the combined GE and GE Capital totals to the consolidated cash flows.
Three months ended March 31 | |||||
(In millions) | 2017 | 2016 | |||
Cash from (used for) operating activities-continuing operations | |||||
Combined | $ | 489 | $ | 7,551 | |
GE current receivables sold to GE Capital | 2,182 | 886 | |||
GE Capital dividends to GE | (2,000) | (7,500) | |||
Other reclassifications and eliminations(a) | 297 | 960 | |||
Total cash from (used for) operating activities-continuing operations | $ | 967 | $ | 1,897 | |
Cash from (used for) investing activities-continuing operations | |||||
Combined | $ | 4,979 | $ | 26,515 | |
GE current receivables sold to GE Capital | (2,471) | (888) | |||
GE Capital long-term loans to GE | 4,075 | - | |||
GE Capital short-term loan to GE | (1,329) | - | |||
Other reclassifications and eliminations(a) | (734) | (955) | |||
Total cash from (used for) investing activities-continuing operations | $ | 4,520 | $ | 24,672 | |
Cash from (used for) financing activities-continuing operations | |||||
Combined | $ | (12,166) | $ | (29,504) | |
GE current receivables sold to GE Capital | 289 | 2 | |||
GE Capital dividends to GE | 2,000 | 7,500 | |||
GE Capital long-term loans to GE | (4,075) | - | |||
GE Capital short-term loan to GE | 1,329 | - | |||
Other reclassifications and eliminations(a) | 438 | (5) | |||
Total cash from (used for) financing activities-continuing operations | $ | (12,185) | $ | (22,007) | |
| (a) | Includes eliminations of other cash flows activities including those related to GE Capital enabled GE industrial orders, various investments, loans and allocations of GE corporate overhead costs. |
2017 1Q FORM 10-Q 100
NOTE 20. GUARANTOR FINANCIAL INFORMATION
GUARANTOR AND NON-GUARANTOR CONDENSED CONSOLIDATING FINANCIAL INFORMATION
On October 26, 2015, GE Capital International Funding Company Unlimited Company, formerly GE Capital International Funding Company (the Issuer), then a finance subsidiary of General Electric Capital Corporation, settled its previously announced private offers to exchange (the Exchange Offers) the Issuer's new senior unsecured notes for certain outstanding debt securities of General Electric Capital Corporation.
The new notes that were issued were fully and unconditionally, jointly and severally guaranteed by both the Company and GE Capital International Holdings Limited (GECIHL) (each a Guarantor, and together, the Guarantors).
Under the terms of a registration rights agreement entered into in connection with the Exchange Offers, the Issuer and the Company agreed to file a registration statement with the U.S. Securities and Exchange Commission (SEC) for an offer to exchange new senior notes of the Issuer registered with the SEC and guaranteed by the Guarantors for certain of the Issuer's outstanding unregistered senior notes. This exchange was completed in July 2016.
PRESENTATION
In connection with the registration of the senior notes, the Company is required to provide certain financial information regarding the Issuer and the Guarantors of the registered securities. Included are the Condensed Consolidating Statements of Earnings and Comprehensive Income for the three months ended March 31, 2017 and 2016, Condensed Consolidating Statements of Financial Position as of March 31, 2017 and December 31, 2016 and Condensed Consolidating Statements of Cash Flows for the three months ended March 31, 2017 and 2016 for:
| General Electric Company (the Parent Company Guarantor) - prepared with investments in subsidiaries accounted for under the equity method of accounting and excluding any inter-segment eliminations. The equity basis earnings (losses) of subsidiaries are reflected in the captions "Equity in earnings (losses) of affiliates" and "Earnings (loss) from discontinued operations, net of taxes"; |
| GE Capital International Funding Company Unlimited Company (the Subsidiary Issuer) – incorporated in May 2015 as a finance subsidiary for debt and reflects activity subsequent to the issuance of new notes on October 26, 2015; |
| GE Capital International Holdings Limited (GECIHL) (the Subsidiary Guarantor) - prepared with investments in non-guarantor subsidiaries accounted for under the equity method of accounting and reflects activity subsequent to the GE Capital Reorganization on December 3, 2015. The equity basis earnings (losses) of subsidiaries are reflected in the captions "Equity in earnings (losses) of affiliates" and "Earnings (loss) from discontinued operations, net of taxes"; |
| Non-Guarantor Subsidiaries - prepared on an aggregated basis excluding any elimination or consolidation adjustments and includes predominantly all non-cash adjustments for cash flows; |
| Consolidating Adjustments - adjusting entries necessary to consolidate the Parent Company Guarantor with the Subsidiary Issuer, the Subsidiary Guarantor and Non-Guarantor Subsidiaries; and |
| Consolidated - prepared on a consolidated basis. |
2017 1Q FORM 10-Q 101
CONDENSED CONSOLIDATING STATEMENT OF EARNINGS (LOSS) AND COMPREHENSIVE INCOME (LOSS) | ||||||||||||
FOR THE THREE MONTHS ENDED MARCH 31, 2017 (UNAUDITED) | ||||||||||||
Parent | Non- | |||||||||||
Company | Subsidiary | Subsidiary | Guarantor | Consolidating | ||||||||
(in millions) | Guarantor | Issuer | Guarantor | Subsidiaries | Adjustments | Consolidated | ||||||
Revenues and other income | ||||||||||||
Sales of goods and services | $ | 8,792 | $ | - | $ | - | $ | 36,090 | $ | (19,654) | $ | 25,228 |
Other income | 54 | - | - | 4,620 | (4,507) | 168 | ||||||
Equity in earnings (loss) of affiliates | 2,444 | - | 242 | 36,682 | (39,368) | - | ||||||
GE Capital revenues from services | - | 156 | 186 | 2,270 | (347) | 2,264 | ||||||
Total revenues and other income | 11,289 | 156 | 428 | 79,662 | (63,875) | 27,660 | ||||||
Costs and expenses | ||||||||||||
Interest and other financial charges | 910 | 150 | 455 | 1,082 | (1,457) | 1,139 | ||||||
Investment contracts, insurance losses and | - | - | - | 636 | (2) | 634 | ||||||
insurance annuity benefits | ||||||||||||
Other costs and expenses | 9,629 | - | 13 | 35,305 | (19,892) | 25,055 | ||||||
Total costs and expenses | 10,539 | 150 | 468 | 37,023 | (21,351) | 26,829 | ||||||
Earnings (loss) from continuing | 751 | 6 | (40) | 42,640 | (42,525) | 832 | ||||||
operations before income taxes | ||||||||||||
Benefit (provision) for income taxes | 144 | (1) | 115 | (469) | 195 | (16) | ||||||
Earnings (loss) from continuing operations | 895 | 5 | 74 | 42,171 | (42,330) | 816 | ||||||
Earnings (loss) from discontinued | ||||||||||||
operations, net of taxes | (242) | - | 283 | 1 | (280) | (239) | ||||||
Net earnings (loss) | 653 | 5 | 357 | 42,172 | (42,610) | 577 | ||||||
Less net earnings (loss) attributable to | ||||||||||||
noncontrolling interests | - | - | - | (48) | (28) | (76) | ||||||
Net earnings (loss) attributable to | ||||||||||||
the Company | 653 | 5 | 357 | 42,220 | (42,582) | 653 | ||||||
Other comprehensive income (loss) | 1,827 | - | 617 | (1,457) | 840 | 1,827 | ||||||
Comprehensive income (loss) attributable | ||||||||||||
to the Company | $ | 2,479 | $ | 5 | $ | 974 | $ | 40,763 | $ | (41,742) | $ | 2,479 |
CONDENSED CONSOLIDATING STATEMENT OF EARNINGS (LOSS) AND COMPREHENSIVE INCOME (LOSS) | |||||||||||||
FOR THE THREE MONTHS ENDED MARCH 31, 2016 (UNAUDITED) | |||||||||||||
Parent | Non- | ||||||||||||
Company | Subsidiary | Subsidiary | Guarantor | Consolidating | |||||||||
(in millions) | Guarantor | Issuer | Guarantor | Subsidiaries | Adjustments | Consolidated | |||||||
Revenues and other income | |||||||||||||
Sales of goods and services | $ | 10,013 | $ | - | $ | - | $ | 33,759 | $ | (18,458) | $ | 25,314 | |
Other income | 226 | - | - | 3,441 | (3,659) | 9 | |||||||
Equity in earnings (loss) of affiliates | 908 | - | 669 | 13,623 | (15,200) | - | |||||||
GE Capital revenues from services | - | 396 | 297 | 4,585 | (2,756) | 2,522 | |||||||
Total revenues and other income | 11,146 | 396 | 967 | 55,407 | (40,072) | 27,845 | |||||||
Costs and expenses | |||||||||||||
Interest and other financial charges | 811 | 373 | 931 | 1,759 | (2,137) | 1,736 | |||||||
Investment contracts, insurance losses and | - | - | - | 672 | (30) | 642 | |||||||
insurance annuity benefits | |||||||||||||
Other costs and expenses | 10,455 | - | 36 | 35,166 | (20,429) | 25,228 | |||||||
Total costs and expenses | 11,266 | 373 | 968 | 37,597 | (22,597) | 27,606 | |||||||
Earnings (loss) from continuing | (120) | 24 | (1) | 17,811 | (17,475) | 238 | |||||||
operations before income taxes | |||||||||||||
Benefit (provision) for income taxes | 619 | (3) | (3) | (485) | 49 | 177 | |||||||
Earnings (loss) from continuing operations | 499 | 21 | (4) | 17,325 | (17,425) | 415 | |||||||
Earnings (loss) from discontinued | |||||||||||||
operations, net of taxes | (308) | - | (475) | (426) | 901 | (308) | |||||||
Net earnings (loss) | 191 | 21 | (479) | 16,899 | (16,524) | 107 | |||||||
Less net earnings (loss) attributable to | |||||||||||||
noncontrolling interests | - | - | - | (26) | (96) | (121) | |||||||
Net earnings (loss) attributable to | |||||||||||||
the Company | 191 | 21 | (479) | 16,925 | (16,429) | 228 | |||||||
Other comprehensive income (loss) | 824 | (12) | (182) | 268 | (74) | 824 | |||||||
Comprehensive income (loss) attributable | |||||||||||||
to the Company | $ | 1,015 | $ | 9 | $ | (662) | $ | 17,193 | $ | (16,502) | $ | 1,052 | |
2017 1Q FORM 10-Q 102
CONDENSED CONSOLIDATING STATEMENT OF FINANCIAL POSITION | |||||||||||||
MARCH 31, 2017 (UNAUDITED) | |||||||||||||
Parent | Non- | ||||||||||||
Company | Subsidiary | Subsidiary | Guarantor | Consolidating | |||||||||
(In millions) | Guarantor | Issuer | Guarantor | Subsidiaries | Adjustments | Consolidated | |||||||
Assets | |||||||||||||
Cash and equivalents | $ | 628 | $ | - | $ | 3 | $ | 41,718 | $ | (786) | $ | 41,564 | |
Investment securities | 1 | - | - | 44,414 | (2,466) | 41,949 | |||||||
Receivables - net | 56,401 | 17,374 | 30,656 | 73,347 | (138,057) | 39,721 | |||||||
Inventories | 4,995 | - | - | 21,820 | (4,114) | 22,701 | |||||||
Property, plant and equipment - net | 5,885 | - | - | 45,148 | (2,017) | 49,016 | |||||||
Investment in subsidiaries(a) | 277,214 | - | 80,038 | 499,436 | (856,687) | - | |||||||
Goodwill and intangible assets | 8,238 | - | - | 46,386 | 32,204 | 86,828 | |||||||
All other assets | 14,413 | 44 | 38 | 196,989 | (151,405) | 60,079 | |||||||
Assets of discontinued operations | - | - | - | - | 9,786 | 9,786 | |||||||
Total assets | $ | 367,777 | $ | 17,419 | $ | 110,734 | $ | 969,258 | $ | (1,113,544) | $ | 351,643 | |
Liabilities and equity | |||||||||||||
Short-term borrowings | $ | 164,741 | $ | - | $ | 45,341 | $ | 23,469 | $ | (205,226) | $ | 28,324 | |
Accounts payable | 2,335 | - | - | 48,182 | (36,819) | 13,698 | |||||||
Other current liabilities | 11,920 | 34 | 3 | 23,802 | 30 | 35,789 | |||||||
Long-term and non-recourse borrowings | 70,390 | 16,418 | 34,330 | 54,840 | (75,636) | 100,342 | |||||||
All other liabilities | 43,857 | 790 | 513 | 54,799 | (7,438) | 92,522 | |||||||
Liabilities of discontinued operations | - | - | - | - | 1,741 | 1,741 | |||||||
Total Liabilities | 293,242 | 17,242 | 80,186 | 205,092 | (323,347) | 272,416 | |||||||
Redeemable noncontrolling interests | - | - | - | 2,282 | 772 | 3,054 | |||||||
GE shareowners' equity | 74,534 | 177 | 30,547 | 760,205 | (790,929) | 74,534 | |||||||
Noncontrolling interests | - | - | - | 1,678 | (39) | 1,639 | |||||||
Total equity | 74,534 | 177 | 30,547 | 761,883 | (790,968) | 76,173 | |||||||
Total liabilities, redeemable | |||||||||||||
noncontrolling interests and equity | $ | 367,777 | $ | 17,419 | $ | 110,734 | $ | 969,258 | $ | (1,113,544) | $ | 351,643 | |
| (a) | Included within the subsidiaries of the Subsidiary Guarantor are cash and cash equivalent balances of $27,108 million and net assets of discontinued operations of $4,042 million. |
2017 1Q FORM 10-Q 103
CONDENSED CONSOLIDATING STATEMENT OF FINANCIAL POSITION | ||||||||||||
DECEMBER 31, 2016 | ||||||||||||
Parent | Non- | |||||||||||
Company | Subsidiary | Subsidiary | Guarantor | Consolidating | ||||||||
(In millions) | Guarantor | Issuer | Guarantor | Subsidiaries | Adjustments | Consolidated | ||||||
Assets | ||||||||||||
Cash and equivalents | $ | 2,558 | $ | - | $ | 3 | $ | 46,994 | $ | (1,426) | $ | 48,129 |
Investment securities | 1 | - | - | 47,394 | (3,082) | 44,313 | ||||||
Receivables - net | 63,620 | 17,157 | 30,470 | 79,401 | (148,385) | 42,263 | ||||||
Inventories | 4,654 | - | - | 21,076 | (3,377) | 22,354 | ||||||
Property, plant and equipment - net | 5,768 | - | - | 46,366 | (1,615) | 50,518 | ||||||
Investment in subsidiaries(a) | 272,685 | - | 80,481 | 492,674 | (845,840) | - | ||||||
Goodwill and intangible assets | 8,128 | - | - | 42,074 | 36,673 | 86,875 | ||||||
All other assets | 14,692 | 44 | 39 | 201,276 | (160,134) | 55,917 | ||||||
Assets of discontinued operations | - | - | - | - | 14,815 | 14,815 | ||||||
Total assets | $ | 372,107 | $ | 17,202 | $ | 110,992 | $ | 977,255 | $ | (1,112,372) | $ | 365,183 |
Liabilities and equity | ||||||||||||
Short-term borrowings | $ | 167,089 | $ | 1 | $ | 46,432 | $ | 25,919 | $ | (208,727) | $ | 30,714 |
Accounts payable | 5,412 | - | - | 47,366 | (38,343) | 14,435 | ||||||
Other current liabilities | 11,072 | 33 | 117 | 25,095 | 114 | 36,431 | ||||||
Long-term and non-recourse borrowings | 68,983 | 16,486 | 34,389 | 68,912 | (83,273) | 105,496 | ||||||
All other liabilities | 43,722 | 511 | 481 | 58,376 | (9,656) | 93,434 | ||||||
Liabilities of discontinued operations | - | - | - | - | 4,158 | 4,158 | ||||||
Total Liabilities | 296,279 | 17,030 | 81,419 | 225,667 | (335,727) | 284,668 | ||||||
Redeemable noncontrolling interests | - | - | - | 2,223 | 802 | 3,025 | ||||||
GE shareowners' equity | 75,828 | 171 | 29,573 | 747,719 | (777,463) | 75,828 | ||||||
Noncontrolling interests | - | - | - | 1,647 | 16 | 1,663 | ||||||
Total equity | 75,828 | 171 | 29,573 | 749,366 | (777,447) | 77,491 | ||||||
Total liabilities, redeemable | ||||||||||||
noncontrolling interests and equity | $ | 372,107 | $ | 17,202 | $ | 110,992 | $ | 977,255 | $ | (1,112,372) | $ | 365,183 |
| (a) | Included within the subsidiaries of the Subsidiary Guarantor are cash and cash equivalent balances of $28,516 million and net assets of discontinued operations of $6,012 million. |
2017 1Q FORM 10-Q 104
CONDENSED CONSOLIDATING STATEMENT OF CASH FLOWS | ||||||||||||
THREE MONTHS ENDED MARCH 31, 2017 (UNAUDITED) | ||||||||||||
Parent | Non- | |||||||||||
Company | Subsidiary | Subsidiary | Guarantor | Consolidating | ||||||||
(In millions) | Guarantor | Issuer | Guarantor | Subsidiaries | adjustments | Consolidated | ||||||
Cash flows – operating activities | ||||||||||||
Cash from (used for) operating activities - | ||||||||||||
continuing operations | $ | (9,060) | $ | 13 | $ | 628 | $ | 76,854 | $ | (67,468) | $ | 967 |
Cash from (used for) operating activities - | ||||||||||||
discontinued operations | (242) | - | - | (419) | 3 | (658) | ||||||
Cash from (used for) operating activities | (9,302) | 13 | 628 | 76,435 | (67,465) | 309 | ||||||
Cash flows – investing activities | ||||||||||||
Cash from (used for) investing activities – | ||||||||||||
continuing operations | 3,660 | (13) | 584 | (69,441) | 69,730 | 4,520 | ||||||
Cash from (used for) investing activities – | ||||||||||||
discontinued operations | - | - | - | (1,871) | - | (1,871) | ||||||
Cash from (used for) investing activities | 3,660 | (13) | 584 | (71,312) | 69,730 | 2,649 | ||||||
Cash flows – financing activities | ||||||||||||
Cash from (used for) financing activities – | ||||||||||||
continuing operations | 3,713 | - | (1,212) | (13,062) | (1,624) | (12,185) | ||||||
Cash from (used for) financing activities – | ||||||||||||
discontinued operations | - | - | - | 1,907 | - | 1,907 | ||||||
Cash from (used for) financing activities | 3,713 | - | (1,212) | (11,155) | (1,624) | (10,278) | ||||||
Effect of currency exchange rate changes | ||||||||||||
on cash and equivalents | - | - | - | 133 | - | 133 | ||||||
Increase (decrease) in cash and equivalents | (1,930) | - | - | (5,897) | 640 | (7,187) | ||||||
Cash and equivalents at beginning of year | 2,558 | - | 3 | 48,423 | (1,426) | 49,558 | ||||||
Cash and equivalents at March 31 | 628 | - | 3 | 42,527 | (786) | 42,372 | ||||||
Less cash and equivalents of discontinued | ||||||||||||
operations at March 31 | - | - | - | 808 | - | 808 | ||||||
Cash and equivalents of continuing operations | ||||||||||||
at March 31 | $ | 628 | $ | - | $ | 3 | $ | 41,718 | $ | (786) | $ | 41,564 |
CONDENSED CONSOLIDATING STATEMENT OF CASH FLOWS | ||||||||||||
THREE MONTHS ENDED MARCH 31, 2016 (UNAUDITED) | ||||||||||||
Parent | Non- | |||||||||||
Company | Subsidiary | Subsidiary | Guarantor | Consolidating | ||||||||
(In millions) | Guarantor | Issuer | Guarantor | Subsidiaries | adjustments | Consolidated | ||||||
Cash flows – operating activities | ||||||||||||
Cash from (used for) operating activities - | ||||||||||||
continuing operations | $ | (18,151) | $ | 352 | $ | (924) | $ | (17,005) | $ | 37,625 | $ | 1,897 |
Cash from (used for) operating activities - | ||||||||||||
discontinued operations | (308) | - | 682 | (1,370) | (256) | (1,252) | ||||||
Cash from (used for) operating activities | (18,459) | 352 | (242) | (18,376) | 37,369 | 644 | ||||||
Cash flows – investing activities | ||||||||||||
Cash from (used for) investing activities – | ||||||||||||
continuing operations | 12,177 | (517) | 1,192 | 76,560 | (64,741) | 24,672 | ||||||
Cash from (used for) investing activities – | ||||||||||||
discontinued operations | - | - | - | 7,112 | - | 7,112 | ||||||
Cash from (used for) investing activities | 12,177 | (517) | 1,192 | 83,672 | (64,741) | 31,783 | ||||||
Cash flows – financing activities | ||||||||||||
Cash from (used for) financing activities – | ||||||||||||
continuing operations | 4,866 | 165 | (944) | (47,916) | 21,823 | (22,007) | ||||||
Cash from (used for) financing activities – | ||||||||||||
discontinued operations | - | - | - | (112) | - | (112) | ||||||
Cash from (used for) financing activities | 4,866 | 165 | (944) | (48,028) | 21,823 | (22,119) | ||||||
Effect of currency exchange rate changes | ||||||||||||
on cash and equivalents | - | - | - | 31 | - | 31 | ||||||
Increase (decrease) in cash and equivalents | (1,416) | - | 6 | 17,300 | (5,550) | 10,340 | ||||||
Cash and equivalents at beginning of year | 4,137 | - | - | 107,350 | (20,609) | 90,878 | ||||||
Cash and equivalents at March 31 | 2,721 | - | 6 | 124,649 | (26,158) | 101,217 | ||||||
Less cash and equivalents of discontinued | ||||||||||||
operations at March 31 | - | - | - | 26,143 | - | 26,143 | ||||||
Cash and equivalents of continuing operations | ||||||||||||
at March 31 | $ | 2,721 | $ | - | $ | 6 | $ | 98,506 | $ | (26,158) | $ | 75,075 |
2017 1Q FORM 10-Q 105
NOTE 21. SUPPLEMENTAL INFORMATION
CASH FLOWS INFORMATION
Amounts reported in the "All other operating activities" line in the Statement of Cash Flows consist primarily of adjustments to current and noncurrent accruals, deferrals of costs and expenses and adjustments to assets. Certain supplemental information related to our cash flows is shown below.
Three months ended March 31 | |||||
(In millions) | 2017 | 2016 | |||
GE | |||||
All other operating activities | |||||
(Gains) losses on purchases and sales of business interests | $ | (2) | $ | (59) | |
Contract assets (net)(a) | (1,894) | (722) | |||
Income taxes(b) | (415) | (635) | |||
Interest charges(c) | 198 | 116 | |||
Principal pension plans(d) | 929 | 853 | |||
Other | (485) | (56) | |||
$ | (1,669) | $ | (502) | ||
Net dispositions (purchases) of GE shares for treasury | |||||
Open market purchases under share repurchase program(e) | $ | (1,888) | $ | (6,412) | |
Other purchases | - | (309) | |||
Dispositions | 309 | 394 | |||
$ | (1,578) | $ | (6,326) | ||
| (a) | Contract assets are presented net of related billings in excess of revenues on our long-term product service agreements. See Note 9. |
| (b) | Reflected the effects of current tax expense (benefit) of $259 million and $(65) million and net cash paid during the year for income taxes of $(674) million and $(570) million for the three months ended March 31, 2017 and 2016, respectively. Cash flows effects of deferred tax provisions (benefits) are shown separately within cash flows from operating activities. |
| (c) | Reflected the effects of interest expense of $564 million and $440 million and cash paid for interest of $(368) million and $(325) million for the three months ended March 31, 2017 and 2016, respectively. |
| (d) | Reflected the effects of pension costs of $983 million and $903 million and employer contributions of $(54) million and $(50) million for the three months ended March 31, 2017 and 2016, respectively. See Note 11. |
| (e) | Included $(2,000) million paid under ASR agreements in the three months ended March 31, 2016. |
DERIVATIVES AND HEDGING
See Note 16 for the primary information related to our derivatives and hedging activity. This section provides certain supplemental information about this topic.
Changes in the fair value of derivatives are recorded in a separate component of equity (referred to below as Accumulated Other Comprehensive Income, or AOCI) and are recorded in earnings in the period in which the hedged transaction occurs. The table below summarizes this activity by hedging instrument.
2017 1Q FORM 10-Q 106
FAIR VALUE OF DERIVATIVES | |||||||||||
March 31, 2017 | December 31, 2016 | ||||||||||
(in millions) | Assets | Liabilities | Assets | Liabilities | |||||||
Derivatives accounted for as hedges | |||||||||||
Interest rate contracts | $ | 2,818 | $ | 161 | $ | 3,106 | $ | 210 | |||
Currency exchange contracts | 108 | 360 | 402 | 624 | |||||||
Other contracts | - | - | - | - | |||||||
2,926 | 521 | 3,508 | 834 | ||||||||
Derivatives not accounted for as hedges | |||||||||||
Interest rate contracts | 51 | 14 | 62 | 20 | |||||||
Currency exchange contracts | 1,244 | 3,164 | 1,778 | 4,011 | |||||||
Other contracts | 110 | 17 | 119 | 17 | |||||||
1,406 | 3,195 | 1,958 | 4,048 | ||||||||
Gross derivatives recognized in statement of | |||||||||||
financial position | |||||||||||
Gross derivatives | 4,332 | 3,717 | 5,467 | 4,883 | |||||||
Gross accrued interest | 330 | (22) | 768 | (24) | |||||||
4,662 | 3,695 | 6,234 | 4,859 | ||||||||
Amounts offset in statement of financial position | |||||||||||
Netting adjustments(a) | (2,169) | (2,165) | (3,097) | (3,094) | |||||||
Cash collateral(b) | (1,700) | (770) | (2,025) | (1,355) | |||||||
(3,869) | (2,935) | (5,121) | (4,449) | ||||||||
Net derivatives recognized in statement of | |||||||||||
financial position | |||||||||||
Net derivatives | 793 | 760 | 1,113 | 410 | |||||||
Amounts not offset in statement of | |||||||||||
financial position | |||||||||||
Securities held as collateral(c) | (323) | - | (442) | - | |||||||
Net amount | $ | 470 | $ | 760 | $ | 671 | $ | 410 | |||
Derivatives are classified in the captions "All other assets" and "All other liabilities" and the related accrued interest is classified in "Other GE Capital receivables" and "All other liabilities" in our Statement of Financial Position.
(a) The netting of derivative receivables and payables is permitted when a legally enforceable master netting agreement exists. Amounts include fair value adjustments related to our own and counterparty non-performance risk. At March 31, 2017 and December 31, 2016, the cumulative adjustment for non-performance risk was $(3) million and $(3) million, respectively.
(b) Excluded excess cash collateral received and posted of $151 million and $317 million at March 31, 2017, respectively, and $6 million and $177 million at December 31, 2016, respectively.
(c) Excluded excess securities collateral received of $35 million and zero at March 31, 2017 and December 31, 2016, respectively.
2017 1Q FORM 10-Q 107
CASH FLOW HEDGE ACTIVITY | |||||||||||
Gain (loss) reclassified | |||||||||||
Gain (loss) recognized in AOCI | from AOCI into earnings | ||||||||||
for the three months ended March 31 | for the three months ended March 31 | ||||||||||
(In millions) | 2017 | 2016 | 2017 | 2016 | |||||||
Interest rate contracts | $ | (2) | $ | 19 | $ | (9) | $ | (30) | |||
Currency exchange contracts | 22 | (77) | 8 | (53) | |||||||
Commodity contracts | 2 | 1 | - | (2) | |||||||
Total(a) | $ | 22 | $ | (57) | $ | (1) | $ | (84) | |||
| (a) | Gain (loss) is recorded in "GE Capital revenues from services", "Interest and other financial charges", and "Other costs and expenses" in our Statement of Earnings when reclassified. |
The total pre-tax amount in AOCI related to cash flow hedges of forecasted transactions was a $66 million gain at March 31, 2017. We expect to transfer $40 million loss to earnings as an expense in the next 12 months contemporaneously with the earnings effects of the related forecasted transactions. In both the three months ended 2017 and 2016, we recognized insignificant gains and losses related to hedged forecasted transactions and firm commitments that did not occur by the end of the originally specified period. At March 31, 2017 and 2016, the maximum term of derivative instruments that hedge forecasted transactions was 16 years and 17 years, respectively. See Note 13 for additional information about reclassifications out of AOCI.
For cash flow hedges, the amount of ineffectiveness in the hedging relationship and amount of the changes in fair value of the derivatives that are not included in the measurement of ineffectiveness were insignificant for each reporting period.
COUNTERPARTY CREDIT RISK
Fair values of our derivatives can change significantly from period to period based on, among other factors, market movements and changes in our positions. We manage counterparty credit risk (the risk that counterparties will default and not make payments to us according to the terms of our agreements) on an individual counterparty basis. Where we have agreed to netting of derivative exposures with a counterparty, we net our exposures with that counterparty and apply the value of collateral posted to us to determine the exposure. We actively monitor these net exposures against defined limits and take appropriate actions in response, including requiring additional collateral.
As discussed above, we have provisions in certain of our master agreements that require counterparties to post collateral (typically, cash or U.S. Treasury securities) when our receivables due from the counterparties, measured at current market value, exceeds specified limits. The fair value of such collateral was $2,024 million at March 31, 2017, of which $1,700 million was cash and $323 million was in the form of securities held by a custodian for our benefit. Under certain of these same agreements, we post collateral to our counterparties for our derivative obligations, the fair value of which was $770 million at March 31, 2017. At March 31, 2017, our exposure to counterparties (including accrued interest), net of collateral we hold, was $331 million. This excludes exposures related to embedded derivatives.
Additionally, our master agreements typically contain mutual downgrade provisions that provide the ability of each party to require termination if the long-term credit rating of the counterparty were to fall below A-/A3 or other ratings levels agreed upon with the counterparty. In certain of these master agreements, each party also has the ability to require termination if the short-term rating of the counterparty were to fall below A-1/P-1. Our master agreements also typically contain provisions that provide termination rights upon the occurrence of certain other events, such as a bankruptcy or events of default by one of the parties. If an agreement was terminated under any of these circumstances, the termination amount payable would be determined on a net basis and could also take into account any collateral posted. The net amount of our derivative liability, after consideration of collateral posted by us and outstanding interest payments was $714 million at March 31, 2017. This excludes exposure related to embedded derivatives.
2017 1Q FORM 10-Q 108
EXHIBITS
Exhibit 2(a) | Amendment to Transaction Agreement and Plan of Merger dated March 27, 2017 between General Electric Company, Baker Hughes Incorporated, Bear Newco, Inc., Bear MergerSub, Inc., BHI Newco, Inc., and Bear MergerSub 2, Inc. (Incorporated by reference to Bear Newco, Inc.'s Registration Statement on Form S-4, pages A-II-I through G-16 (Commission file number 333-216991)). https://www.sec.gov/Archives/edgar/data/1701605/000119312517100176/d535234ds4.htm | |
Exhibit 11 Exhibit 12(a) Exhibit 12(b) | Computation of Per Share Earnings.* Computation of Ratio of Earnings to Fixed Charges. Computation of Ratio of Earnings to Fixed Charges and Ratio of Earnings to Combined Fixed Charges and Preferred Stock Dividends. | |
Exhibit 31(a) | Certification Pursuant to Rules 13a14(a) or 15d14(a) under the Securities Exchange Act of 1934, as Amended. | |
Exhibit 31(b) | Certification Pursuant to Rules 13a14(a) or 15d14(a) under the Securities Exchange Act of 1934, as Amended. | |
Exhibit 32 | Certification Pursuant to 18 U.S.C. Section 1350. | |
Exhibit 101 | The following materials from General Electric Company's Quarterly Report on Form 10-Q for the quarter ended March 31, 2017, formatted in XBRL (eXtensible Business Reporting Language); (i) Statement of Earnings (Loss) for the three months ended March 31, 2017 and 2016, (ii) Consolidated Statement of Comprehensive Income (Loss) for the three months ended March 31, 2017 and 2016, (iii) Consolidated Statement of Changes in Shareowners' Equity for the three months ended March 31, 2017 and 2016, (iv) Statement of Financial Position at March 31, 2017 and December 31, 2016, (v) Statement of Cash Flows for the three months ended March 31, 2017 and 2016, and (vi) Notes to Consolidated Financial Statements. | |
* | Data required by Financial Accounting Standards Board Accounting Standards Codification 260, Earnings Per Share , is provided in Note 14 to the Consolidated Financial Statements in this Report. | |
2017 1Q FORM 10-Q 109
FORM 10-Q CROSS REFERENCE INDEX
Item Number |
| Page(s) | ||
Part I – FINANCIAL INFORMATION | ||||
Item 1. | Financial Statements | 59-108 | ||
Item 2. | Management's Discussion and Analysis of Financial Condition and Results of Operations | 4-54 | ||
Item 3. | Quantitative and Qualitative Disclosures About Market Risk | Not applicable(a) | ||
Item 4. | Controls and Procedures | 55 | ||
Part II – OTHER INFORMATION | ||||
Item 1. | Legal Proceedings | 57-58 | ||
Item 1A. | Risk Factors | Not applicable(b) | ||
Item 2. | Unregistered Sales of Equity Securities and Use of Proceeds | 56 | ||
Item 3. | Defaults Upon Senior Securities | Not applicable | ||
Item 4. | Mine Safety Disclosures | Not applicable | ||
Item 5. | Other Information | Not applicable | ||
Item 6. | Exhibits | 109 | ||
Signatures | 111 | |||
(a) | There have been no significant changes to our market risk since December 31, 2016. For a discussion of our exposure to market risk, refer to our Annual Report on Form 10-K for the year ended December 31, 2016. |
(b) | There have been no significant changes to our risk factors since December 31, 2016. For a discussion of our risk factors, refer to our Annual Report on Form 10-K for the year ended December 31, 2016. |
2017 1Q FORM 10-Q 110
SIGNATURES
Pursuant to the requirements of the Securities Exchange Act of 1934, the registrant has duly caused this report to be signed on its behalf by the undersigned thereunto duly authorized.
General Electric Company | |||
May 5, 2017 | /s/ Jan R. Hauser | ||
Date | Jan R. Hauser Vice President and Controller Duly Authorized Officer and Principal Accounting Officer |
2017 1Q FORM 10-Q 111