United States Securities and Exchange Commission
WASHINGTON, D.C. 20549
FORM 10-K
(Mark One) |
R Annual Report Pursuant to Section 13 or 15(d) of the Securities Exchange Act of 1934 |
For the fiscal year ended December 31, 2014 |
or |
r Transition Report pursuant to Section 13 or 15(d) of the Securities Exchange Act of 1934 |
For the transition period from ___________to ___________ |
Commission file number 001-00035 |
General Electric Company
|
New York | 14-0689340 | |||
(State or other jurisdiction of incorporation or organization) | (I.R.S. Employer Identification No.) | |||
| ||||
3135 Easton Turnpike, Fairfield, CT | 06828-0001 | 203/373-2211 | ||
(Address of principal executive offices) | (Zip Code) | (Telephone No.) | ||
Securities Registered Pursuant to Section 12(b) of the Act: | ||||
Title of each class | Name of each exchange on which registered | |||
Common stock, par value $0.06 per share | New York Stock Exchange | |||
Securities Registered Pursuant to Section 12(g) of the Act: |
(Title of class) |
Indicate by check mark if the registrant is a well-known seasoned issuer, as defined in Rule 405 of the Securities Act. Yes R No r
Indicate by check mark if the registrant is not required to file reports pursuant to Section 13 or Section 15(d) of the Act. Yes r No R
Indicate by check mark whether the registrant (1) has filed all reports required to be filed by Section 13 or 15(d) of the Securities Exchange Act of 1934 during the preceding 12 months (or for such shorter period that the registrant was required to file such reports), and (2) has been subject to such filing requirements for the past 90 days. Yes R No r
Indicate by check mark whether the registrant has submitted electronically and posted on its corporate Web site, if any, every Interactive Data File required to be submitted and posted pursuant to Rule 405 of Regulation S-T during the preceding 12 months (or for such shorter period that the registrant was required to submit and post such files). Yes R No r
Indicate by check mark if disclosure of delinquent filers pursuant to Item 405 of Regulation S-K is not contained herein, and will not be contained, to the best of registrant's knowledge, in definitive proxy or information statements incorporated by reference in Part III of this Form 10-K or any amendment to this Form 10K. r
Indicate by check mark whether the registrant is a large accelerated filer, an accelerated filer, a non-accelerated filer, or a smaller reporting company. See definitions of "large accelerated filer," "accelerated filer" and "smaller reporting company" in Rule 12b-2 of the Exchange Act. (Check one):
Large accelerated filer R | Accelerated filer r |
Non-accelerated filer r | Smaller reporting company r |
Indicate by check mark whether the registrant is a shell company (as defined in Rule 12b-2 of the Act). Yes r No R
The aggregate market value of the outstanding common equity of the registrant not held by affiliates as of the last business day of the registrant's most recently completed second fiscal quarter was at least $261.1 billion. There were 10,064,909,484 shares of voting common stock with a par value of $0.06 outstanding at January 31, 2015.
DOCUMENTS INCORPORATED BY REFERENCE
The definitive proxy statement relating to the registrant's Annual Meeting of Shareowners, to be held April 22, 2015, is incorporated by reference into Part III to the extent described therein.


ABOUT GENERAL ELECTRIC |
 ABOUT GENERAL ELECTRIC
 OUR BUSINESS AND HOW WE TALK ABOUT IT
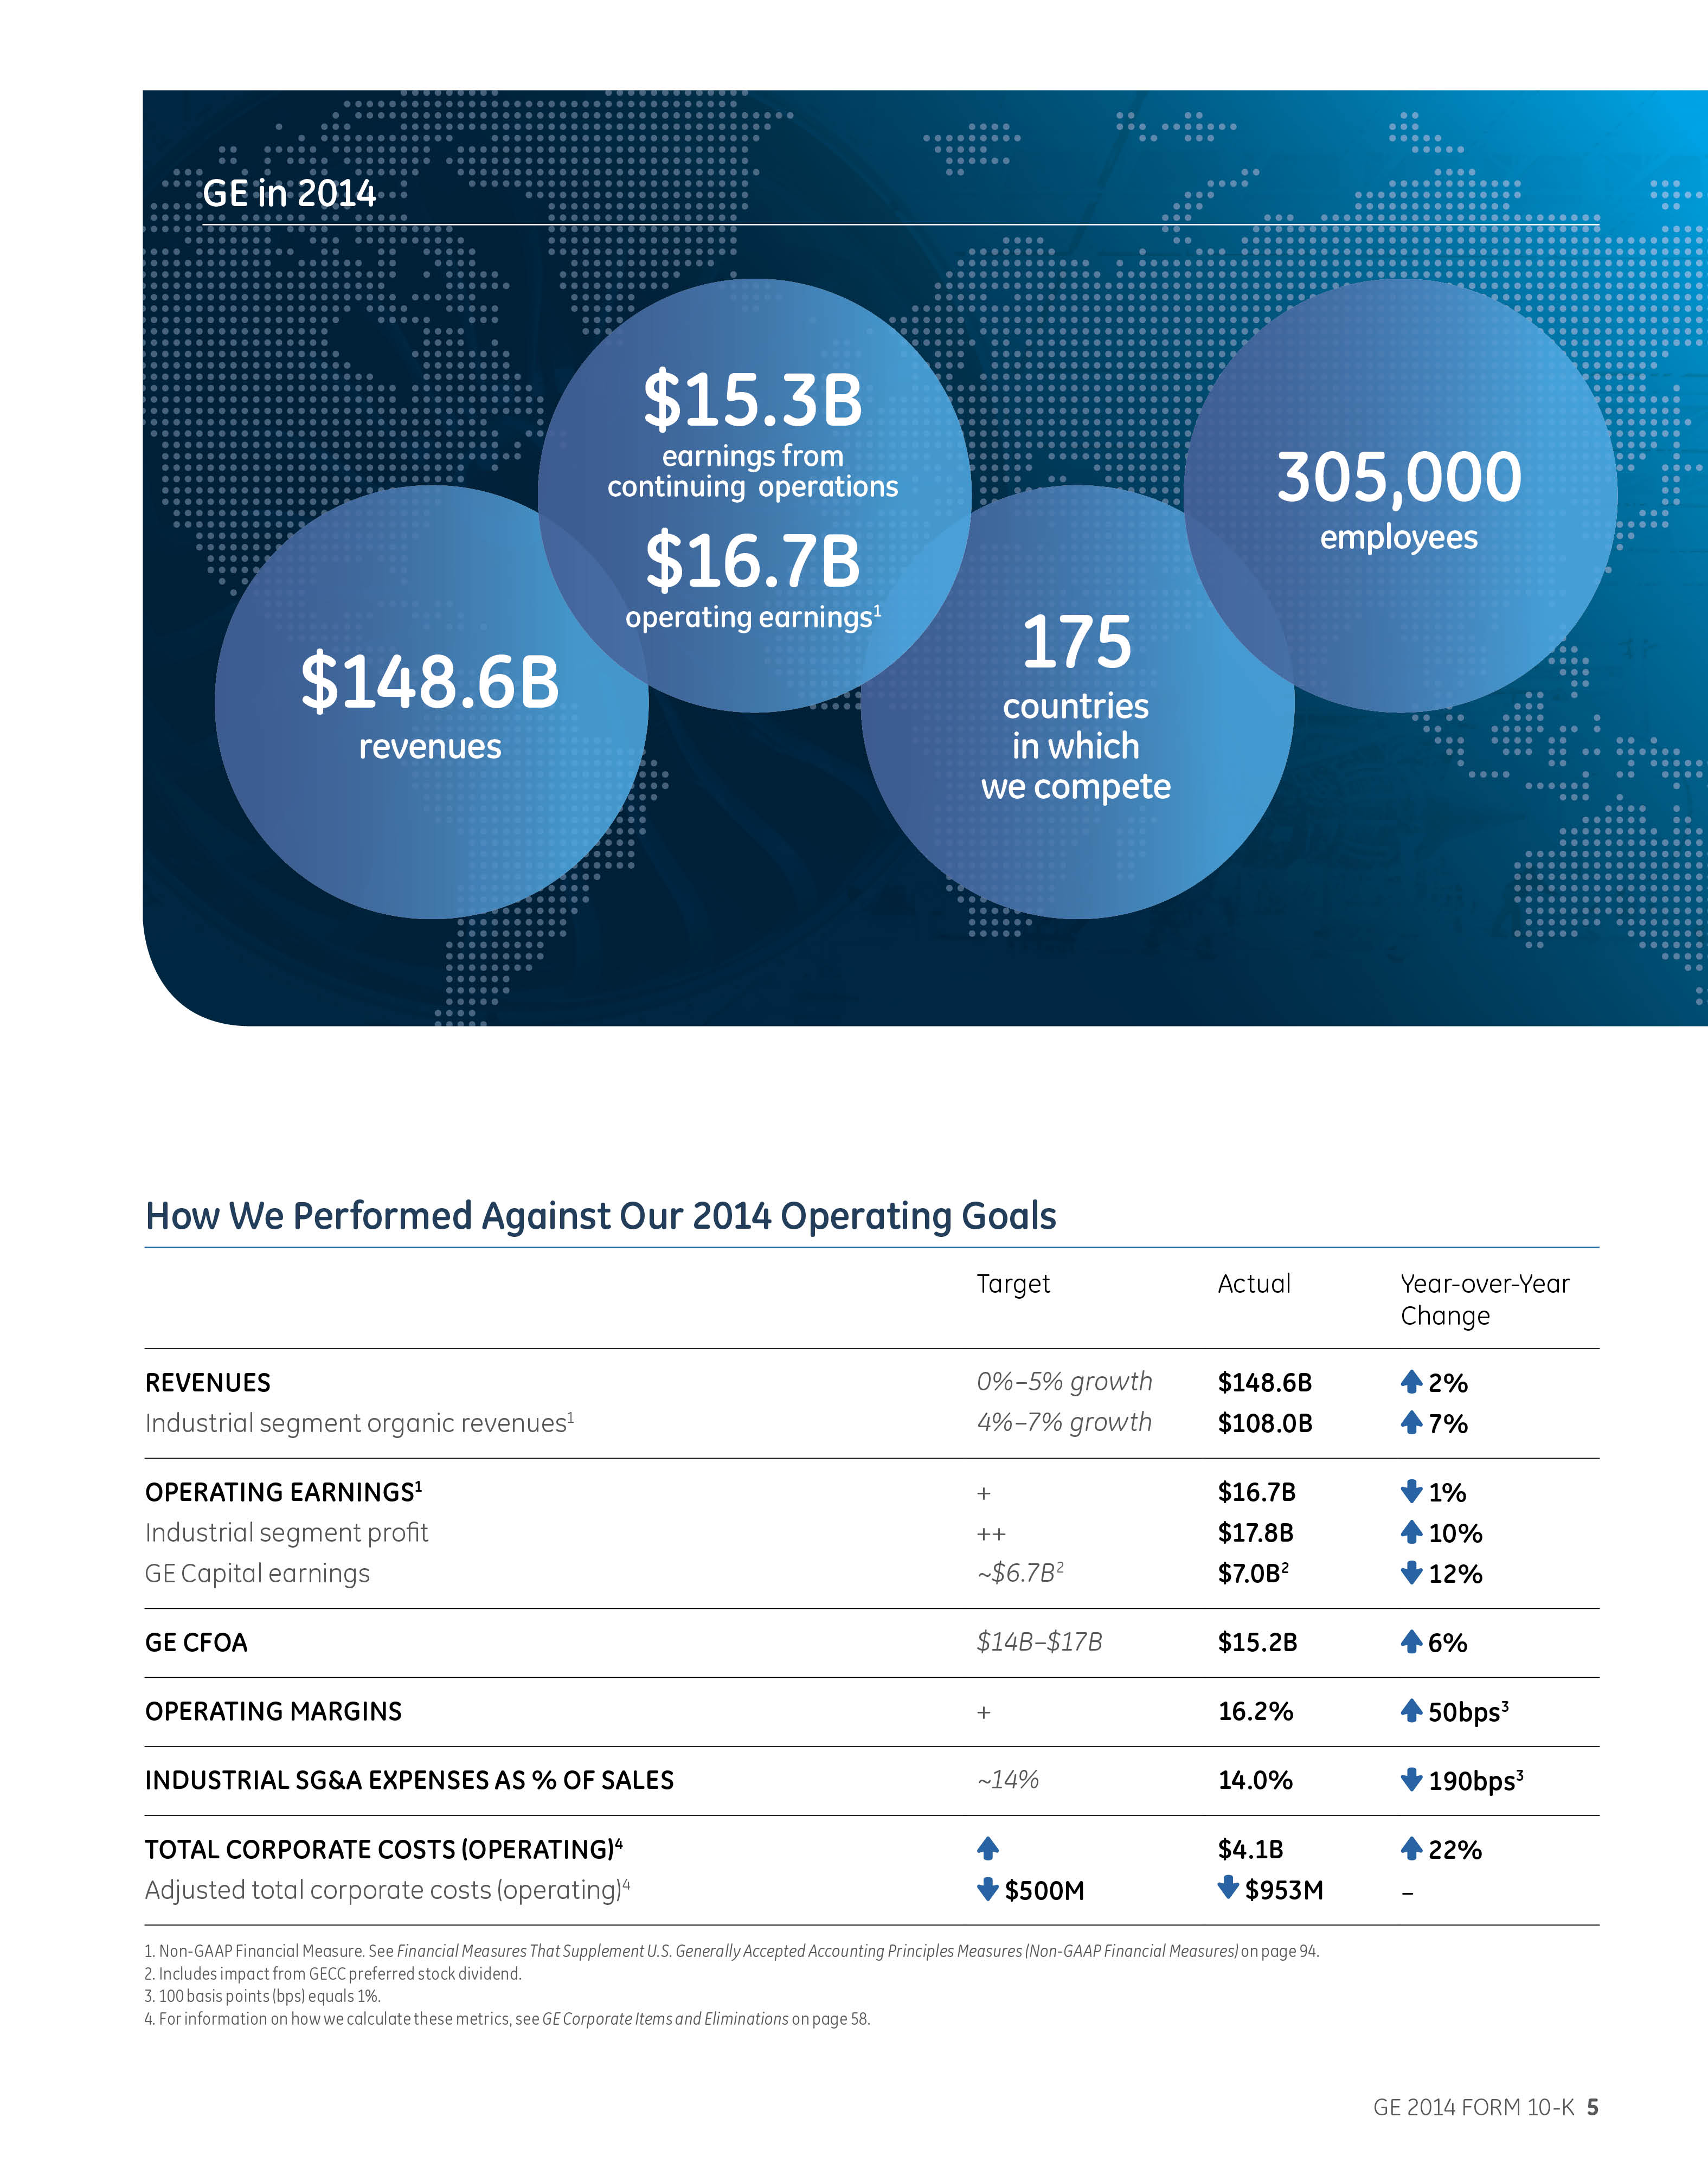
We are one of the largest and most diversified infrastructure and financial services corporations in the world. With products and services ranging from aircraft engines, power generation, oil and gas production equipment, and household appliances to medical imaging, business and consumer financing and industrial products, we serve customers in approximately 175 countries and employ approximately 305,000 people worldwide. Since our incorporation in 1892, we have developed or acquired new technologies and services that have considerably broadened and changed the scope of our activities.
We believe that investors will gain a better understanding of our company if they understand how we measure and talk about our results. Because of the diversity in our businesses, we present our financial statements in a three- column format, which allows investors to see our industrial operations separately from our financial services operations. We believe that this provides useful information to investors. When used in this report, unless otherwise indicated by the context, we use the terms to mean the following:
| General Electric or the Company - the parent company, General Electric Company. |
| GE - the adding together of all affiliates other than General Electric Capital Corp., whose continuing operations are presented on a one-line basis, giving effect to the elimination of transactions among such affiliates. Transactions between GE and GECC have not been eliminated at the GE level. We present the results of GE in the center columns of our consolidated statements of earnings, financial position and cash flows. An example of a GE metric is GE cash from operating activities (GE CFOA). |
| General Electric Capital Corporation or GECC or Financial Services – the adding together of all affiliates of GECC, giving effect to the elimination of transactions among such affiliates. We present the results of GECC in the right- side columns of our consolidated statements of earnings, financial position and cash flows. It should be noted that GECC is sometimes referred to as GE Capital or Capital, when not in the context of discussing segment results. |
| GE consolidated – the adding together of GE and GECC, giving effect to the elimination of transactions between GE and GECC. We present the results of GE consolidated in the left side columns of our consolidated statements of earnings, financial position and cash flows. |
| Industrial – GE excluding GECC. We believe that this provides investors with a view as to the results of our industrial businesses and corporate items. An example of an Industrial metric is Industrial CFOA, which is GE CFOA excluding the effects of dividends from GECC. |
| Industrial segment – the sum of our seven industrial reporting segments shown below, without giving effect to the elimination of transactions among such segments. We believe that this provides investors with a view as to the results of our industrial segments, without inter-segment eliminations and corporate items. An example of an industrial segment metric is industrial segment revenue growth. |
| Total segment – the sum of our seven industrial segments and one financial services segment, without giving effect to the elimination of transactions among such segments. We believe that this provides investors with a view as to the results of all of our segments, without inter-segment eliminations and corporate items. |
GE 2014 FORM 10-K 19
ABOUT GENERAL ELECTRIC |
OUR INDUSTRIAL OPERATING SEGMENTS
 | Power & Water |  | Aviation |  | Transportation |
 | Oil & Gas |  | Healthcare |  | Appliances & Lighting |
 | Energy Management |
OUR FINANCIAL SERVICES OPERATING SEGMENT
 | GE Capital |
Business, operation and financial overviews for our operating segments are provided in the "Segment Operations" section within "Management's Discussion and Analysis of Financial Condition and Results of Operations" section of this Form 10-K Report.
OTHER TERMS USED BY GE
| Revenues – unless otherwise indicated, we refer to captions such as "revenues and other income", simply as revenues. |
| Organic revenues – revenues excluding the effects of acquisitions, dispositions and foreign currency exchange. |
| Earnings – unless otherwise indicated, we refer to captions such as "earnings from continuing operations attributable to the company" simply as earnings |
| Earnings per share – unless otherwise indicated, we refer to earnings per share as "earnings from continuing operations attributable to the company" simply as earnings per share |
| Operating earnings – GE earnings from continuing operations attributable to the company excluding the impact of non-operating pension costs. |
| Segment profit – refers to the operating profit of the industrial segments and the net earnings of the financial services segment. See page 30 for a description of the basis for segment profits. |
| Operating pension costs – comprise the service cost of benefits earned, prior service cost amortization and curtailment loss for our principal pension plans. |
| Non-operating pension costs – comprise the expected return on plan assets, interest cost on benefit obligations and net actuarial loss amortization for our principal pension plans. |
| Social cost – include the costs of our pension and healthcare costs for employees and retirees. |
GE 2014 FORM 10-K 20
ABOUT GENERAL ELECTRIC |
NON-GAAP FINANCIAL MEASURES
In the accompanying analysis of financial information, we sometimes use information derived from consolidated financial data but not presented in our financial statements prepared in accordance with U.S. generally accepted accounting principles (GAAP). Certain of these data are considered "non-GAAP financial measures" under the SEC rules. Specifically, we have referred, in various sections of this Form 10-K Report, to:
| Operating earnings and operating EPS |
| Industrial operating earnings |
| Industrial segment organic revenue growth |
| Industrial cash flows from operating activities (Industrial CFOA) |
| Operating and non-operating pension costs (income) |
| GE pre-tax earnings from continuing operations, excluding GECC earnings from continuing operations and the corresponding effective tax rates |
| GE Capital ending net investment (ENI), excluding liquidity |
| GECC Tier 1 common ratio estimate |
The reasons we use these non-GAAP financial measures and the reconciliations to their most directly comparable GAAP financial measures are included in the "Supplemental Information" section within the MD&A of this Form 10-K Report. Non-GAAP financial measures referred to in this Form 10-K Report are designated with an asterisk (*).
COMPETITIVE CONDITIONS AND ENVIRONMENT
In virtually all of our global business activities, we encounter aggressive and able competition. In many instances, the competitive climate is characterized by changing technology that requires continuing research and development. With respect to manufacturing operations, we believe that, in general, we are one of the leading firms in most of the major industries in which we participate. The businesses in which General Electric Capital Corporation (GECC) engages are subject to competition from various types of financial institutions, including commercial banks, thrifts, investment banks, broker-dealers, credit unions, leasing companies, consumer loan companies, independent finance companies, finance companies associated with manufacturers and insurance and reinsurance companies.
As a diverse global company, we are affected by world economies, instability in certain regions, commodity prices, such as the price of oil, and foreign currency volatility. Other factors impacting our business include:
| product development cycles for many of our products are long and product quality and efficiency are critical to success, |
| research and development expenditures are important to our business and |
| many of our products are subject to a number of regulatory standards. |
These factors are discussed throughout Management's Discussion and Analysis of Financial Condition and Results of Operations.
GE 2014 FORM 10-K 21
ABOUT GENERAL ELECTRIC |
OUR EMPLOYEES AND EMPLOYEE RELATIONS
At year-end 2014, General Electric Company and consolidated affiliates employed approximately 305,000 persons, of whom approximately 136,000 were employed in the United States. For further information about employees, see the "Other Financial Data" section of this Form 10K Report.
Approximately 16,400 GE manufacturing and service employees in the United States are represented for collective bargaining purposes by one of 11 unions (approximately 82 different locals within such unions). A majority of such employees are represented by union locals that are affiliated with the IUE-CWA, The Industrial Division of the Communication Workers of America, AFL-CIO, CLC. During 2011, we negotiated four-year agreements with most of our U.S. unions. Most of these contracts will terminate in June 2015, and we will be engaged in negotiations to attain new agreements. While results of 2015 union negotiations cannot be predicted, our recent past negotiations have resulted in agreements that increased costs.
Other GE affiliates are parties to labor contracts with various labor unions, also with varying terms and expiration dates that cover approximately 3,800 employees.
PROPERTIES
Manufacturing operations are carried out at approximately 227 manufacturing plants located in 39 states in the United States and Puerto Rico and at approximately 275 manufacturing plants located in 39 other countries.
CORPORATE INFORMATION AND WEBSITES
General Electric's address is 1 River Road, Schenectady, NY, 12345-6999; we also maintain executive offices at 3135 Easton Turnpike, Fairfield, CT 06828-0001.
The Company's Internet address is www.ge.com . Our annual report on Form 10-K, quarterly reports on Form 10-Q,
current reports on Form 8-K, and amendments to those reports are available, without charge, on our website, www.ge.com/investor-relations/investor-services/personal-investing/sec-filing , as soon as reasonably practicable after they are filed electronically with the U.S. Securities and Exchange Commission (SEC). Copies are also available, without charge, from GE Corporate Investor Communications, 3135 Easton Turnpike, Fairfield, CT 06828-0001. Reports filed with the SEC may be viewed at www.sec.gov or obtained at the SEC Public Reference Room in Washington, D.C. Information regarding the operation of the Public Reference Room may be obtained by calling the SEC at 1-800-SEC-0330. References to our website addressed in this report are provided as a convenience and do not constitute, and should not be viewed as, an incorporation by reference of the information contained on, or available through, the website. Therefore, such information should not be considered part of this report.
General Electric Capital Corporation filed a Form 10-K Report with the SEC, and this can also be viewed at www.ge.com/investor-relations/investor-services/personal-investing/sec-filing .
GE's Investor Relations website at www.ge.com/investor-relations and our corporate blog at www.gereports.com , as well as GE's Facebook page and Twitter accounts, including @GE_Reports, contain a significant amount of information about GE, including financial and other information for investors. GE encourages investors to visit these websites from time to time, as information is updated and new information is posted.
GE 2014 FORM 10-K 22
MD&A |
MANAGEMENT'S DISCUSSION AND ANALYSIS OF FINANCIAL CONDITION AND RESULTS OF OPERATIONS (MD&A)
PRESENTATION
The consolidated financial statements of General Electric Company (the Company) combine the industrial manufacturing and services businesses of General Electric Company (GE) with the financial services businesses of General Electric Capital Corporation (GECC or financial services). Unless otherwise indicated by the context, we use the terms "GE" and "GECC" on the basis of consolidation described in Note 1 to the consolidated financial statements in this Form 10-K Report.
Net earnings of GECC and the effect of transactions between segments are eliminated to arrive at total consolidated data.
Prior to January 28, 2011, we operated a media company, NBC Universal, Inc. (NBCU). Effective January 28, 2011, we held a 49% interest in a media entity that included the NBC Universal businesses (NBCU LLC). On March 19, 2013, we completed the sale of our remaining 49% common equity interest to Comcast Corporation.
We integrate acquisitions as quickly as possible. Revenues and earnings from the date we complete the acquisition through the end of the following fourth quarter are considered the acquisition effect of such businesses.
Discussion of GECC's total assets excludes deferred income tax liabilities, which are presented within assets for purposes of our consolidating statement of financial position presentations for this filing.
See the Glossary section of this Form 10-K for a definition of equipment and services sales as used in this Form 10-K Report as compared to the product and services split on the Statement of Earnings.
Amounts reported in billions in graphs and tables within this Form 10-K report are computed based on the amounts in millions. As a result, the sum of the components reported in billions may not equal the total amount reported in billions due to rounding.
Discussions throughout this MD&A are based on continuing operations unless otherwise noted.
REFERENCES
The MD&A should be read in conjunction with the Financial Statements and Notes to the consolidated financial statements.
For additional information related to GE Capital segment operations and the portfolio quality of financing receivables, refer to the General Electric Capital Corporation annual report on Form 10-K for the year ended December 31, 2014.
NON-GAAP FINANCIAL MEASURES
As discussed in the "About GE" section of this Form 10-K, we use certain "non-GAAP financial measures" throughout the MD&A. The reasons we use these non-GAAP financial measures and the reconciliations to their most directly comparable GAAP financial measures are included in the "Supplemental Information" section within the MD&A of this Form 10-K Report.
Non-GAAP financial measures referred to in this Form 10-K Report are designated with an asterisk (*).
GE 2014 FORM 10-K 23
MD&A | KEY PERFORMANCE INDICATORS |
KEY PERFORMANCE INDICATORS
(Dollars in billions; per-share amounts in dollars)
REVENUES PERFORMANCE | EARNINGS PER SHARE | ||||
- - Earnings - - Operating Earnings *  | |||||
2013 | 2014 | ||||
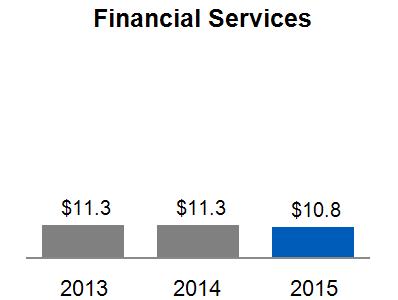
Industrial Segment | 1% | 6% | |||
Industrial Segment Organic * | Flat | 7% | |||
Financial Services |
(3)% |
(3)% | |||
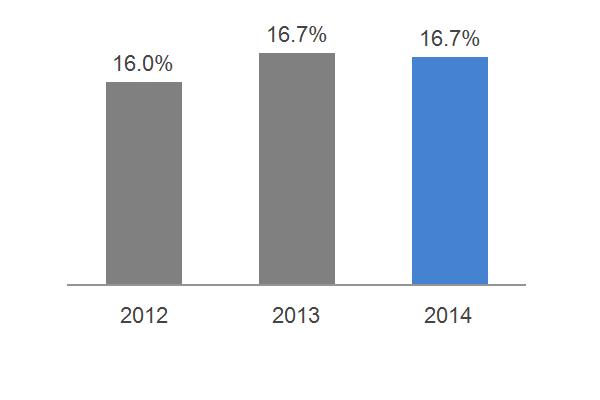
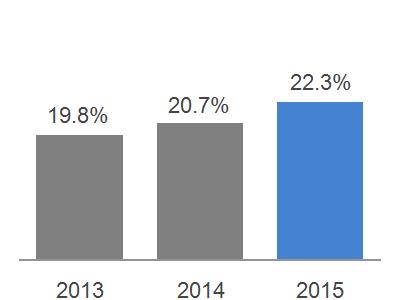
INDUSTRIAL SEGMENT PROFIT |
INDUSTRIAL SEGMENT MARGIN | ||||
 |  | ||||
INDUSTRIAL ORDERS |
INDUSTRIAL BACKLOG | ||||
 |
Equipment
Services |  | Equipment
Services | ||
*Non-GAAP Financial Measure
GE 2014 FORM 10-K 24
MD&A | KEY PERFORMANCE INDICATORS |
KEY PERFORMANCE INDICATORS
(Dollars in billions)
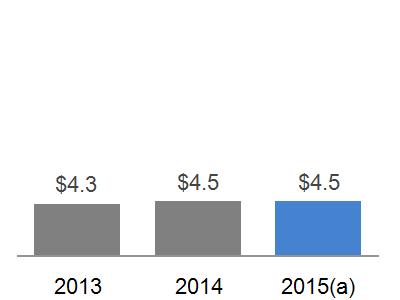
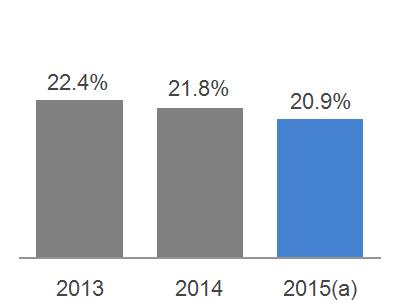
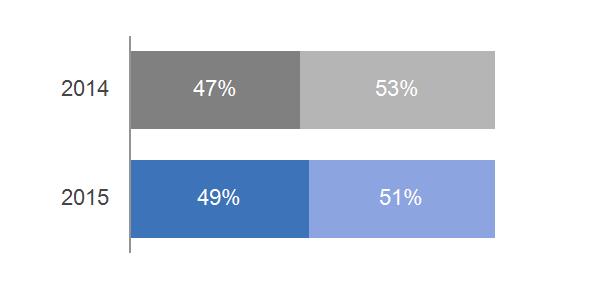
INDUSTRIAL/GE CAPITAL OPERATING EARNINGS* | |||
2014 Actual*  |
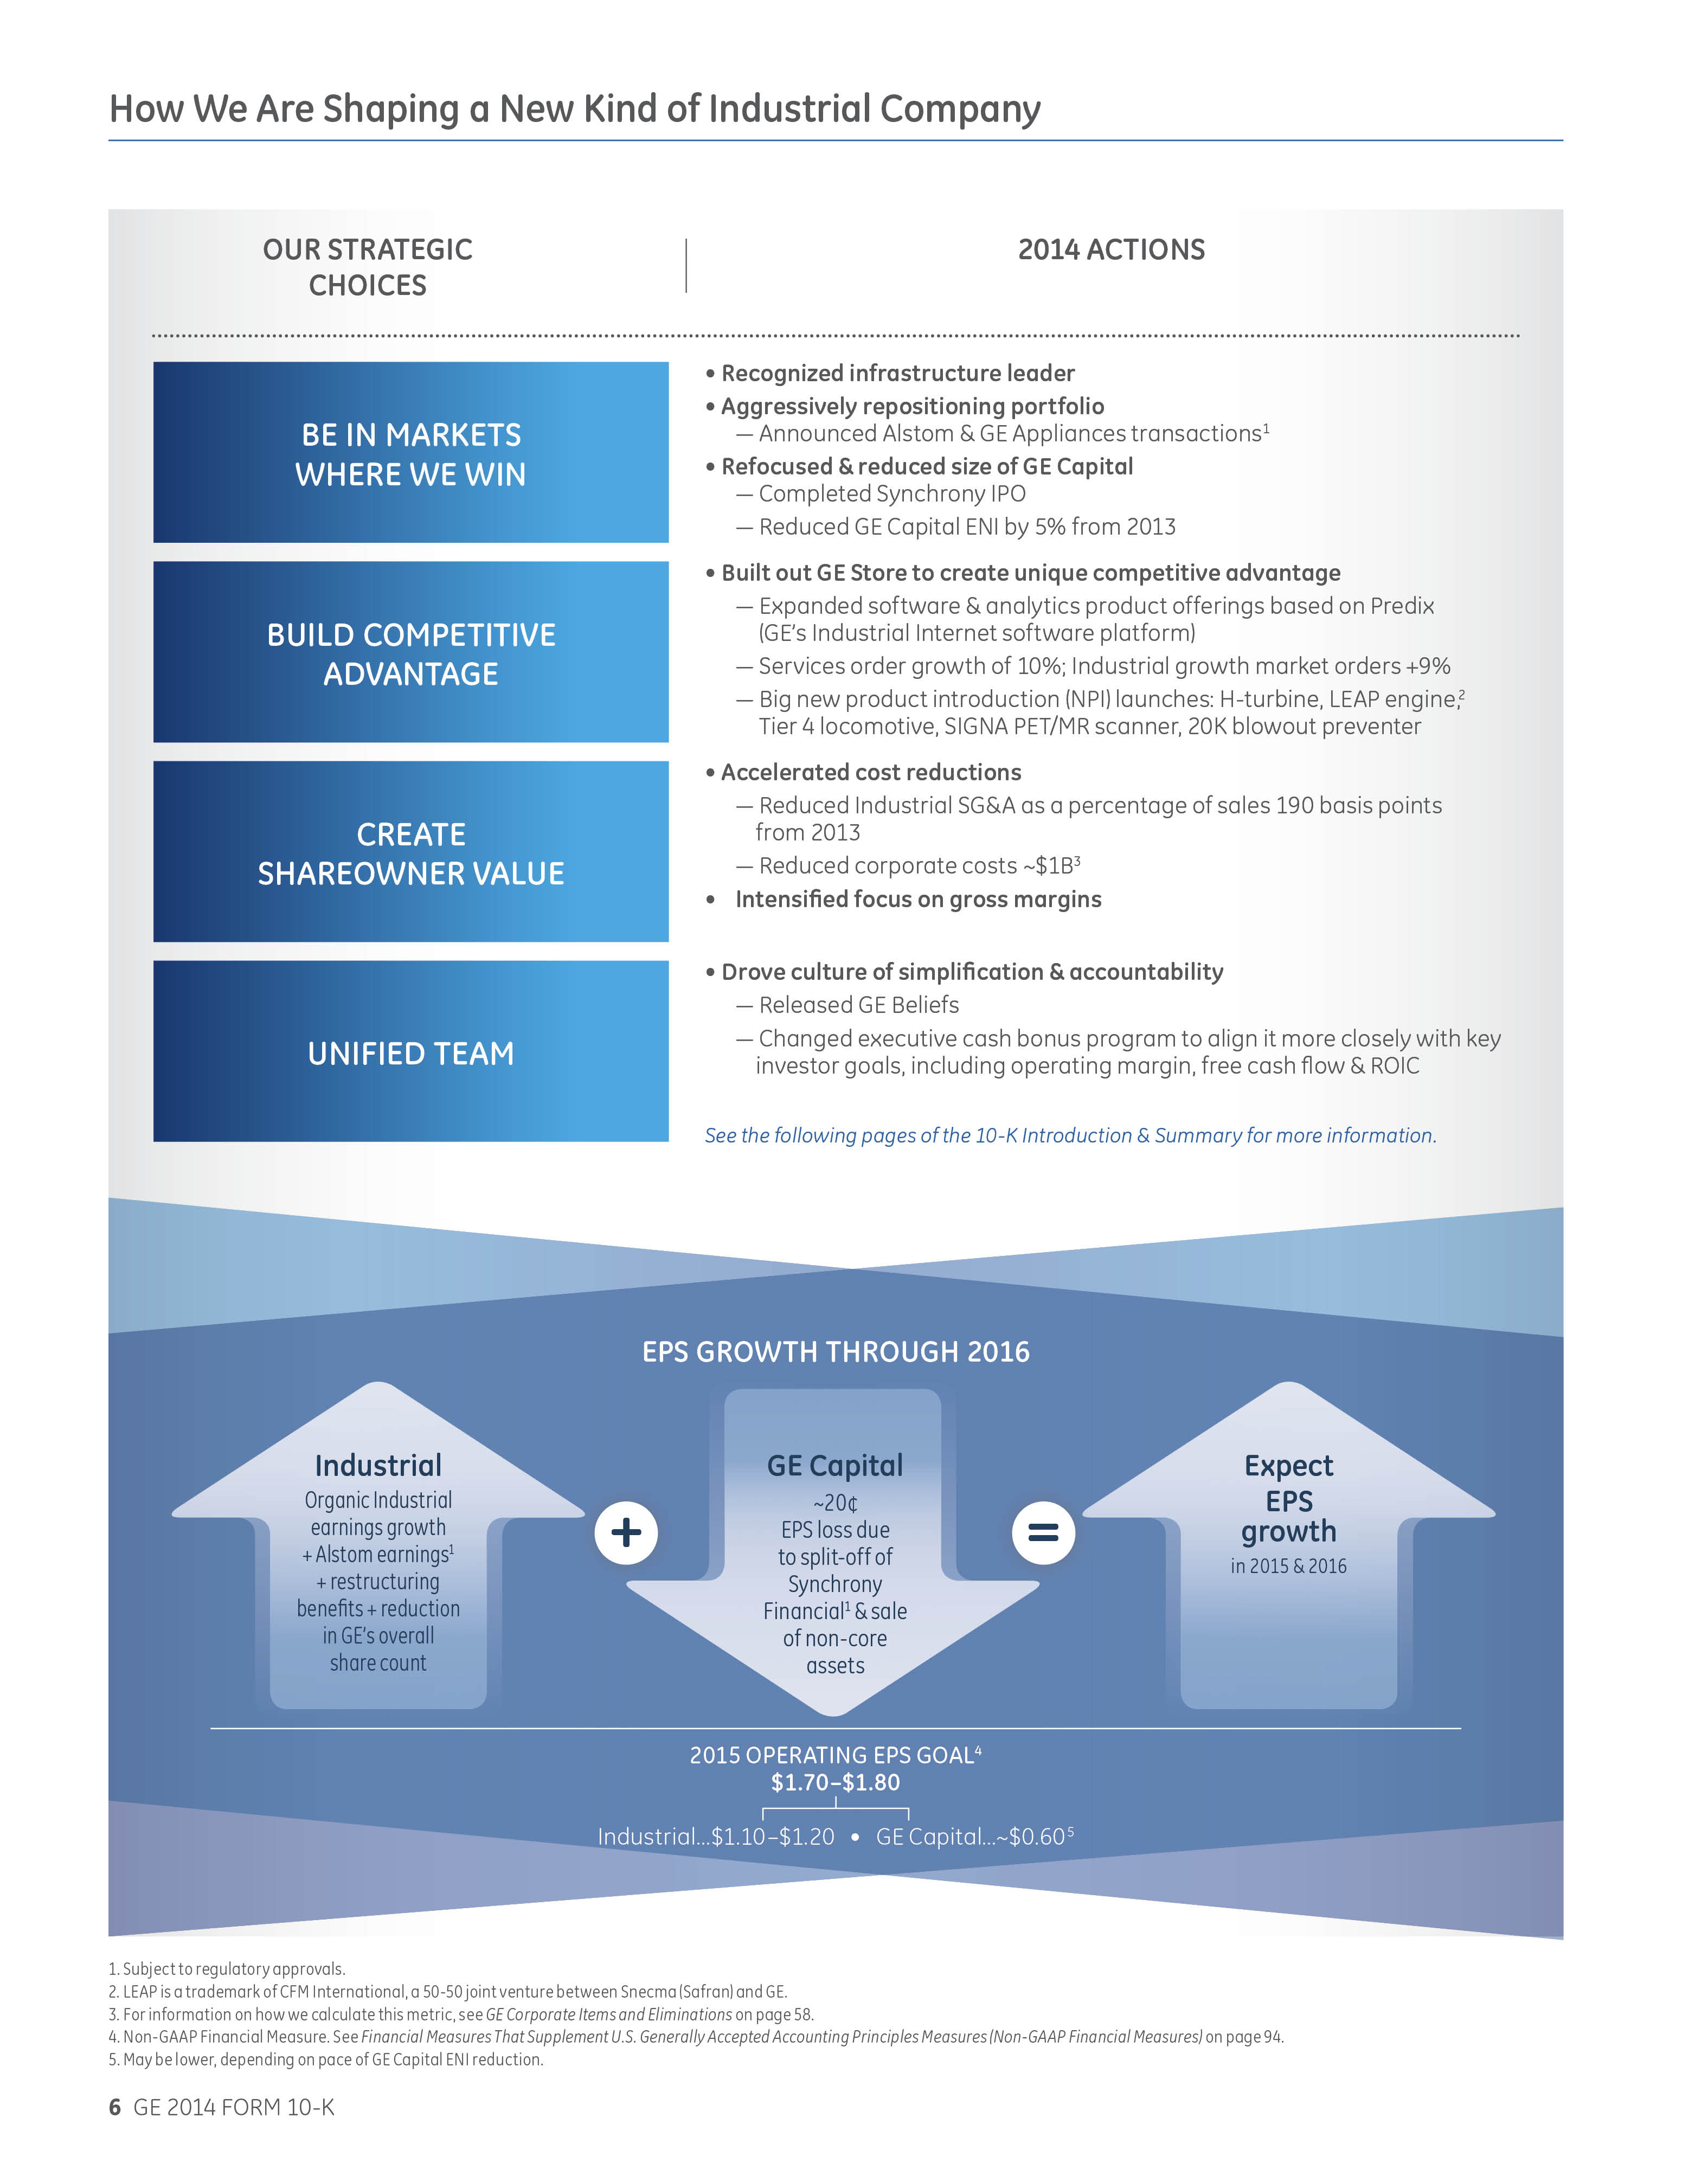
GE IS EXECUTING ON ITS STRATEGY TO ACHIEVE 75% OF ITS OPERATING EARNINGS FROM ITS INDUSTRIAL BUSINESSES BY 2016 .
The effects of the Synchrony Financial split-off and the Alstom acquisition and alliances will result in progression towards this target. | ||
2016 Goal  | |||
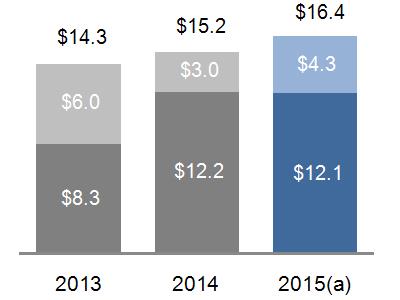
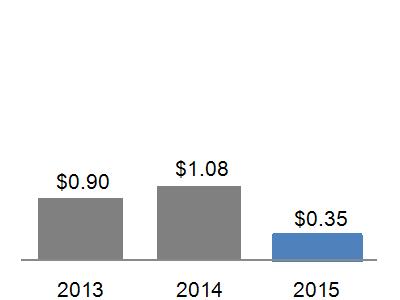
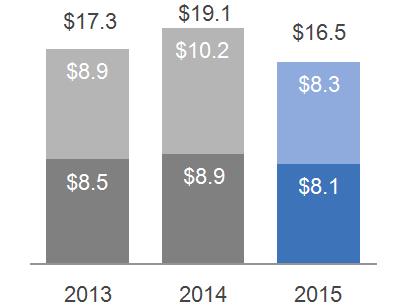
GE CFOA | SHAREHOLDER INFORMATION | ||
 |
GECC Dividend
Industrial CFOA* |
RETURNED $10.8 BILLION TO SHAREOWNERS IN 2014
Dividends $8.9 billion Stock buyback $1.9 billion
ANNUAL MEETING
General Electric's 2015 Annual Meeting of Shareowners will be held on April 22, 2015, in Oklahoma City, Oklahoma. | |
2013 GE CFOA excluding NBC Universal deal-related taxes was $17.4 billion* | |||
*Non-GAAP Financial Measure
GE 2014 FORM 10-K 25
MD&A | KEY PERFORMANCE INDICATORS |
KEY PERFORMANCE INDICATORS
(Amounts in dollars)
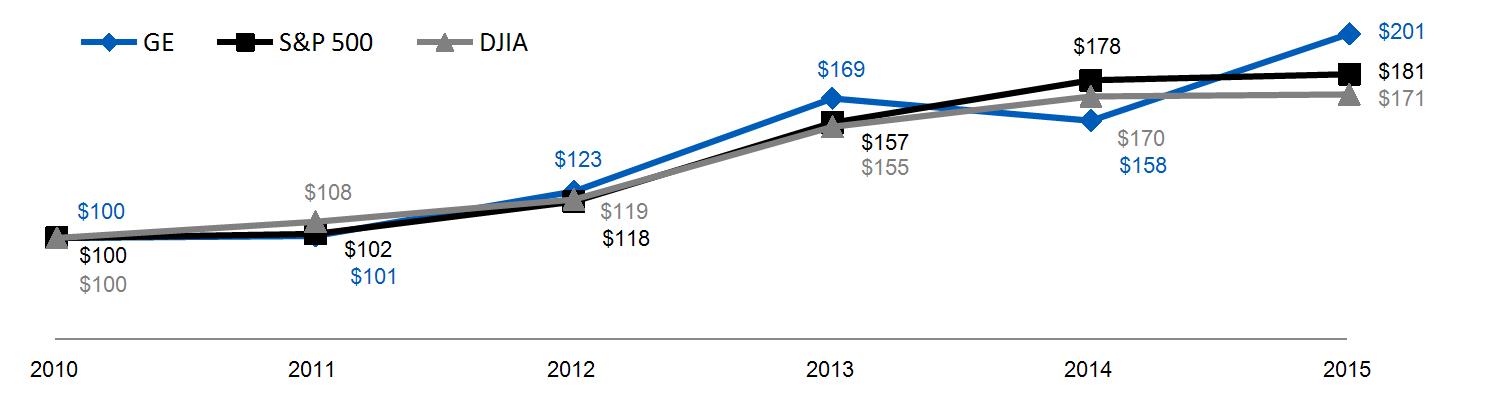
FIVE-YEAR PERFORMANCE GRAPH |
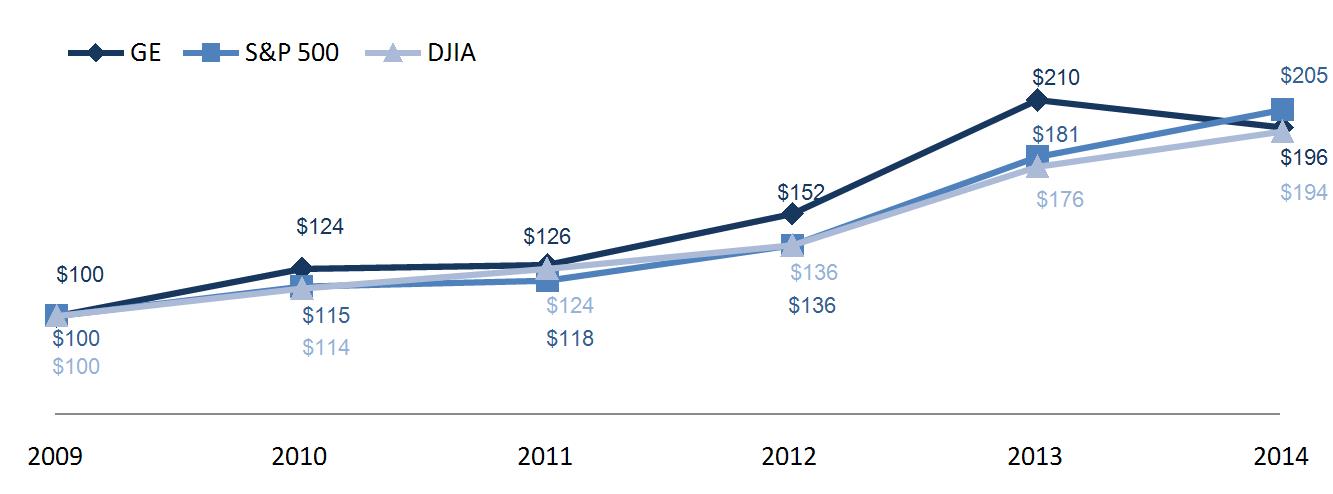 |
The annual changes for the five-year period shown in the graph on this page are based on the assumption that $100 had been invested in General Electric common stock, the Standard & Poor's 500 Stock Index (S&P 500) and the Dow Jones Industrial Average (DJIA) on December 31, 2009, and that all quarterly dividends were reinvested. The total cumulative dollar returns shown on the graph represent the value that such investments would have had on December 31, 2014.
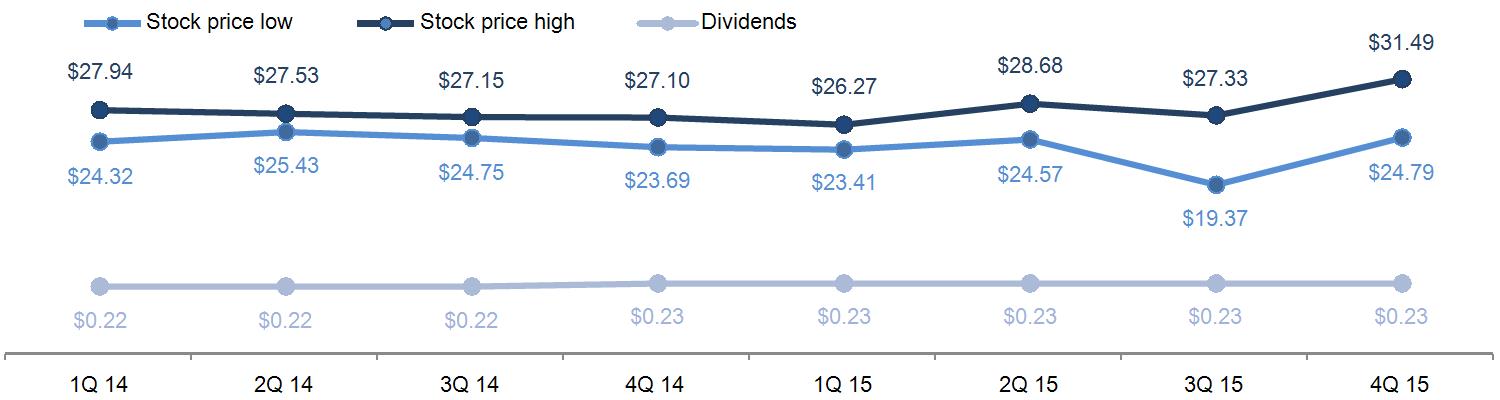
STOCK PRICE RANGE AND DIVIDENDS |
 |
With respect to "Market Information," in the United States, General Electric common stock is listed on the New York Stock Exchange (its principal market). General Electric common stock is also listed on the London Stock Exchange and the Frankfurt Stock Exchange. The chart above shows trading prices, as reported on the New York Stock Exchange, Inc., Composite Transactions Tape.
As of January 31, 2015, there were approximately 480,000 shareowner accounts of record.
On February 6, 2015, our Board of Directors approved a quarterly dividend of $0.23 per share of common stock, which is payable April 27, 2015, to shareowners of record at close of business on February 23, 2015.
GE 2014 FORM 10-K 26
MD&A | CONSOLIDATED RESULTS |
CONSOLIDATED RESULTS
(Dollars in billions)
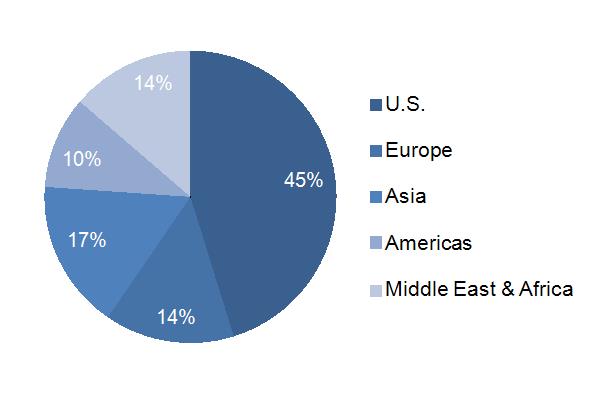
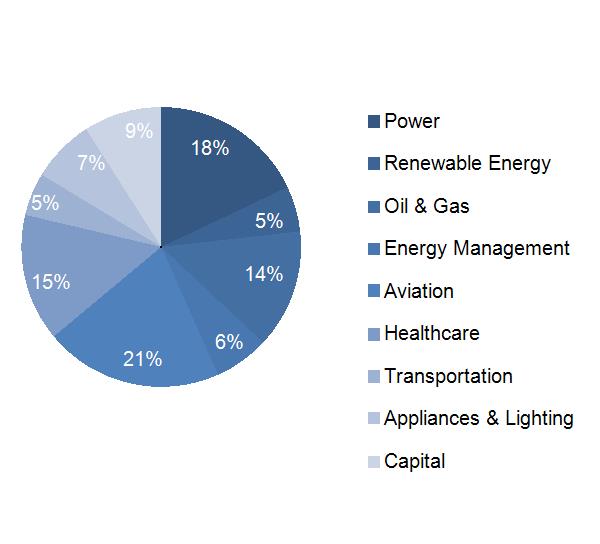
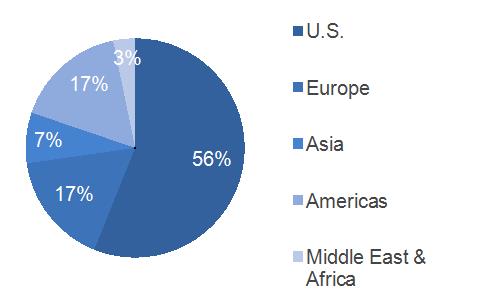
2014 GEOGRAPHIC REVENUES |
2014 SEGMENT REVENUES | |
 |  |
SIGNIFICANT DEVELOPMENTS IN 2014 | |||
 |
We completed the initial public offering of our North American Retail Finance business, Synchrony Financial, resulting in proceeds of $2.8 billion and target to complete the exit through a split-off transaction.
We sold GE Money Bank AB, our consumer finance business in Sweden, Denmark and Norway to Santander for $2.3 billion.
We acquired Milestone Aviation Group for $1.8 billion on January 30, 2015.
We signed an agreement to sell our consumer finance business in Hungary (Budapest Bank) to Hungary's government.
| ||
| |
We agreed to sell our Appliances business to Electrolux for $3.3 billion; targeted to close in mid-2015.
| ||
| |
We acquired Cameron's Reciprocating Compression division for $0.6 billion.
| ||
| |
We acquired API Healthcare for $0.3 billion and certain Thermo Fisher Scientific Inc. life-science businesses for $1.1 billion.
| ||
| |
We signed an agreement to sell our Signaling business to Alstom for approximately $0.8 billion.
| ||
 |
We offered to acquire the Thermal, Renewables and Grid businesses of Alstom. The proposed transaction is targeted to close in 2015. See the "Segment Operations" section within the MD&A of this Form 10-K for additional information related to the proposed transaction.
| ||
GE 2014 FORM 10-K 27
MD&A | CONSOLIDATED RESULTS |
CONSOLIDATED RESULTS
(Dollars in billions)
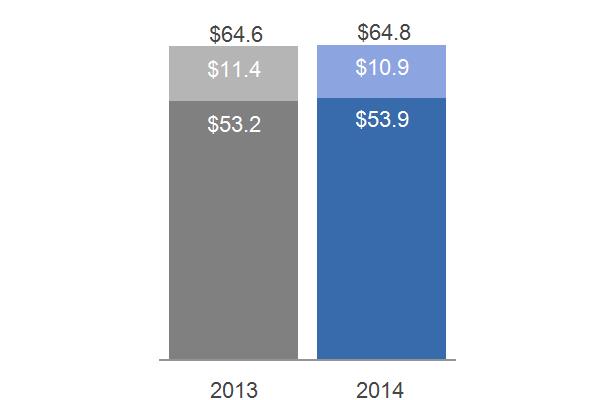
REVENUES | INDUSTRIAL SEGMENT EQUIPMENT & SERVICES REVENUES | ||
 |  |
Equipment
Services | |
COMMENTARY: 2014 – 2013 |
2013 – 2012 | ||
Consolidated revenues increased $2.5 billion, or 2%.
Industrial segment revenues increased 6%, reflecting organic growth* of 7% and the effects of acquisitions (primarily Lufkin Industries, Inc. (Lufkin), Avio S.p.A. (Avio) and certain Thermo Fisher Scientific Inc. businesses).
Financial Services revenues decreased 3% as a result of the effects of dispositions, organic revenue declines, primarily due to lower ending net investment (ENI)* and lower gains, partially offset by lower impairments.
Other income decreased $2.3 billion, primarily due to the sale of our remaining 49% common equity interest in NBCU LLC in 2013 ($1.6 billion).
The effects of acquisitions increased consolidated revenues $1.7 billion and $1.6 billion in 2014 and 2013, respectively. Dispositions affected our ongoing results through lower revenues of $4.1 billion and $0.1 billion in 2014 and 2013, respectively.
The effects of a stronger U.S. dollar compared to mainly the Japanese yen, Canadian dollar and Brazilian real, partially offset by the British pound, decreased consolidated revenues by $0.9 billion. |
Consolidated revenues decreased $0.6 billion, or less than 1%.
Industrial segment revenues increased 1%. Organic revenue growth* was flat.
Financial Services revenues decreased 3%, as a result of organic revenue declines, primarily due to lower ENI* and higher impairments, partially offset by higher gains.
Other income increased $0.5 billion, primarily due to gains related to the sale of NBCU LLC.
The effects of acquisitions increased consolidated revenues $1.6 billion and $2.0 billion in 2013 and 2012, respectively. Dispositions affected our ongoing results through lower revenues of $0.1 billion and $5.1 billion in 2013 and 2012, respectively.
The effects of a stronger U.S. dollar compared to mainly the Japanese yen and Brazilian real, partially offset by the euro, decreased consolidated revenues by $0.5 billion. | ||
* Non-GAAP Financial Measure
GE 2014 FORM 10-K 28
MD&A | CONSOLIDATED RESULTS |
CONSOLIDATED RESULTS
(Dollars in billions)
EARNINGS | INDUSTRIAL SELLING, GENERAL & ADIMINSTRATIVE (SG&A) AS A % OF SALES | |
- - Earnings - - Operating Earnings * 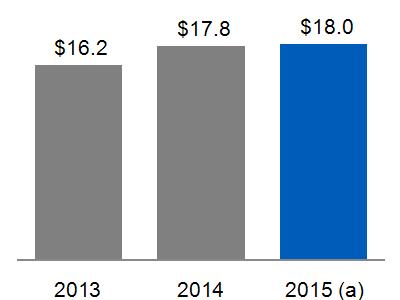 | 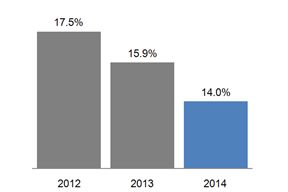 | |
COMMENTARY: 2014 – 2013 |
2013 – 2012 | |
Consolidated earnings increased 1% primarily due to an increase in the operating profit of the industrial segments, partially offset by lower financial services income and the absence of the NBCU LLC related income.
Industrial segment profit increased 10% with growth driven by Aviation, Oil & Gas and Power & Water.
Industrial segment margin increased 50 basis points (bps) driven by higher productivity and pricing, partially offset by negative business mix and the effects of inflation.
Financial Services earnings decreased 12% as a result of the effects of dispositions, core decreases and lower gains, partially offset by lower impairments and lower provisions for losses on financing receivables.
The effects of acquisitions on our consolidated net earnings were increases of $0.2 billion and $0.1 billion in 2014 and 2013, respectively. The effects of dispositions on net earnings were a decrease of $2.6 billion in 2014 and an increase of $1.4 billion in 2013.
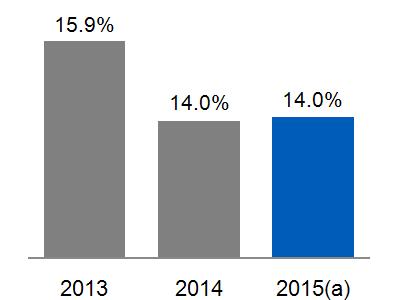
Industrial SG&A as a percentage of total sales decreased to 14.0% as a result of global cost reduction initiatives, primarily at Power & Water and Healthcare. This was partially offset by higher acquisition-related costs. |
Consolidated earnings increased 4% on strong industrial segment growth and continued stabilization in financial services.
Industrial segment profit increased 5% with growth driven by Aviation and Oil & Gas.
Industrial segment margin increased 60 bps driven by higher pricing and favorable business mix, partially offset by the effects of inflation.
Financial Services earnings increased 10%, as a result of the effects of dispositions and higher gains, partially offset by higher impairments and higher provisions for losses on financing receivables.
The effects of acquisitions on our consolidated net earnings were increases of $0.1 billion in both 2013 and 2012. The effects of dispositions on net earnings were an increase of $1.4 billion in 2013 and a decrease of $0.3 billion in 2012.
Industrial SG&A as a percentage of total sales decreased to 15.9% as a result of global cost reduction initiatives related to simplification efforts both in the industrial segments and corporate. This was partially offset by increased acquisition-related costs and higher restructuring. |
See the "Other Consolidated Information" section within the MD&A of this Form 10-K for a discussion of postretirement benefit plans costs, income taxes and geographic data.
*Non-GAAP Financial Measure
GE 2014 FORM 10-K 29
MD&A | SEGMENT OPERATIONS |
SEGMENT OPERATIONS
SEGMENT REVENUES AND PROFIT
Segment revenues include both revenues and other income related to the segment.
Segment profit is determined based on internal performance measures used by the Chief Executive Officer (CEO) to assess the performance of each business in a given period. In connection with that assessment, the CEO may exclude matters such as charges for restructuring; rationalization and other similar expenses; acquisition costs and other related charges; technology and product development costs; certain gains and losses from acquisitions or dispositions; and litigation settlements or other charges, for which responsibility preceded the current management team.
Segment profit excludes results reported as discontinued operations and accounting changes. Segment profit also excludes the portion of earnings or loss attributable to noncontrolling interests of consolidated subsidiaries, and as such only includes the portion of earnings or loss attributable to our share of the consolidated earnings or loss of consolidated subsidiaries.
Segment profit excludes or includes interest and other financial charges and income taxes according to how a particular segment's management is measured:
| Interest and other financial charges and income taxes are excluded in determining segment profit (which we sometimes refer to as "operating profit") for the industrial segments. |
| Interest and other financial charges and income taxes are included in determining segment profit (which we sometimes refer to as "net earnings") for the GE Capital segment. |
Certain corporate costs, such as shared services, employee benefits and information technology are allocated to our segments based on usage. A portion of the remaining corporate costs are allocated based on each segment's relative net cost of operations.
Effective in the second quarter of 2014, we began including the effects of the GECC preferred stock dividends in our GE Capital segment. Previously, such dividends had been reported in the caption "Corporate items and eliminations" in the Company's Summary of Operating Segments table. Presenting GE Capital segment results including the effects of the GECC preferred stock dividends is consistent with the way management measures the results of our financial services business. Prior-period segment information has been recast to be consistent with how we currently evaluate the performance of the GE Capital segment.
POTENTIAL ACQUISITIONS IMPACTING MULTIPLE SEGMENTS
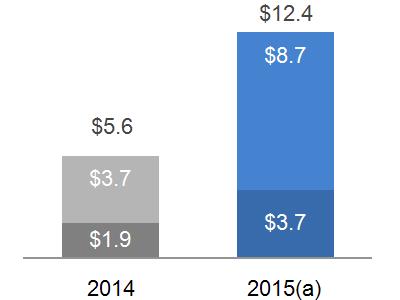
GE's offer to acquire the Thermal, Renewables and Grid businesses of Alstom for approximately €12.4 billion (to be adjusted for the assumed net cash or liability at closing) was positively recommended by Alstom's board of directors. In addition, GE, Alstom and the French Government signed a memorandum of understanding for the formation of three joint ventures in grid technology, renewable energy, and global nuclear and French steam power and Alstom will invest approximately €2.6 billion in these joint ventures. In the fourth quarter of 2014, Alstom completed its review of the proposed transaction with the works council and obtained approval from its shareholders. Also in the fourth quarter of 2014, GE and Alstom entered into an amendment to the original agreement where GE has agreed to pay Alstom a net amount of approximately €0.3 billion of additional consideration at closing. In exchange for this funding, Alstom has agreed to extend the trademark licensing of the Alstom name from 5 years to 25 years as well as other contractual amendments. The proposed transaction continues to be subject to regulatory approvals. The transaction is targeted to close in 2015. The acquisition and alliances will impact our Power & Water and Energy Management segments.
GE 2014 FORM 10-K 30
MD&A | SEGMENT OPERATIONS |
SUMMARY OF OPERATING SEGMENTS | ||||||||||||||
General Electric Company and consolidated affiliates | ||||||||||||||
(In millions) | 2014 | 2013 | 2012 | 2011 | 2010 | |||||||||
Revenues | ||||||||||||||
Power & Water | $ | 27,564 | $ | 24,724 | $ | 28,299 | $ | 25,675 | $ | 24,779 | ||||
Oil & Gas | 18,676 | 16,975 | 15,241 | 13,608 | 9,433 | |||||||||
Energy Management | 7,319 | 7,569 | 7,412 | 6,422 | 5,161 | |||||||||
Aviation | 23,990 | 21,911 | 19,994 | 18,859 | 17,619 | |||||||||
Healthcare | 18,299 | 18,200 | 18,290 | 18,083 | 16,897 | |||||||||
Transportation | 5,650 | 5,885 | 5,608 | 4,885 | 3,370 | |||||||||
Appliances & Lighting | 8,404 | 8,338 | 7,967 | 7,693 | 7,957 | |||||||||
Total industrial segment revenues | 109,902 | 103,602 | 102,811 | 95,225 | 85,216 | |||||||||
GE Capital | 42,725 | 44,067 | 45,364 | 48,324 | 49,163 | |||||||||
Total segment revenues | 152,627 | 147,669 | 148,175 | 143,549 | 134,379 | |||||||||
Corporate items and eliminations | (4,038) | (1,624) | (1,491) | 2,993 | 14,496 | |||||||||
Consolidated revenues | $ | 148,589 | $ | 146,045 | $ | 146,684 | $ | 146,542 | $ | 148,875 | ||||
Segment profit | ||||||||||||||
Power & Water | $ | 5,352 | $ | 4,992 | $ | 5,422 | $ | 5,021 | $ | 5,804 | ||||
Oil & Gas | 2,585 | 2,178 | 1,924 | 1,660 | 1,406 | |||||||||
Energy Management | 246 | 110 | 131 | 78 | 156 | |||||||||
Aviation | 4,973 | 4,345 | 3,747 | 3,512 | 3,304 | |||||||||
Healthcare | 3,047 | 3,048 | 2,920 | 2,803 | 2,741 | |||||||||
Transportation | 1,130 | 1,166 | 1,031 | 757 | 315 | |||||||||
Appliances & Lighting | 431 | 381 | 311 | 237 | 404 | |||||||||
Total industrial segment profit | 17,764 | 16,220 | 15,486 | 14,068 | 14,130 | |||||||||
GE Capital | 7,019 | 7,960 | 7,222 | 6,480 | 3,083 | |||||||||
Total segment profit | 24,783 | 24,180 | 22,708 | 20,548 | 17,213 | |||||||||
Corporate items and eliminations | (6,225) | (6,002) | (4,718) | (288) | (1,012) | |||||||||
GE interest and other financial charges | (1,579) | (1,333) | (1,353) | (1,299) | (1,600) | |||||||||
GE provision for income taxes | (1,634) | (1,668) | (2,013) | (4,839) | (2,024) | |||||||||
Earnings from continuing operations | ||||||||||||||
attributable to the Company | 15,345 | 15,177 | 14,624 | 14,122 | 12,577 | |||||||||
Earnings (loss) from discontinued | ||||||||||||||
operations, net of taxes | (112) | (2,120) | (983) | 29 | (933) | |||||||||
Consolidated net earnings | ||||||||||||||
attributable to the Company | $ | 15,233 | $ | 13,057 | $ | 13,641 | $ | 14,151 | $ | 11,644 | ||||
GE 2014 FORM 10-K 31
MD&A | SEGMENT OPERATIONS | POWER & WATER |
 POWER & WATER
 BUSINESS OVERVIEW
Leader: Steve Bolze
| Headquarters & Operations
| |||
| Senior Vice President (SVP) and President & CEO, GE Power & Water Over 20 years of service with General Electric | 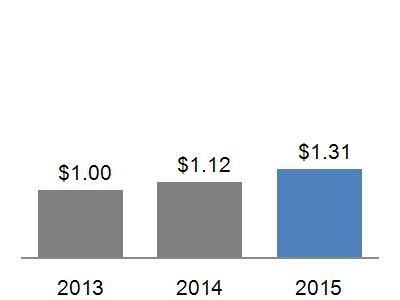 | 18% of segment revenues in 2014 25% of industrial segment revenues 30% of industrial segment profit Headquarters: Schenectady, NY Serving customers in125+ countries Employees: approximately 38,000 | |
Products & Services | |||
|
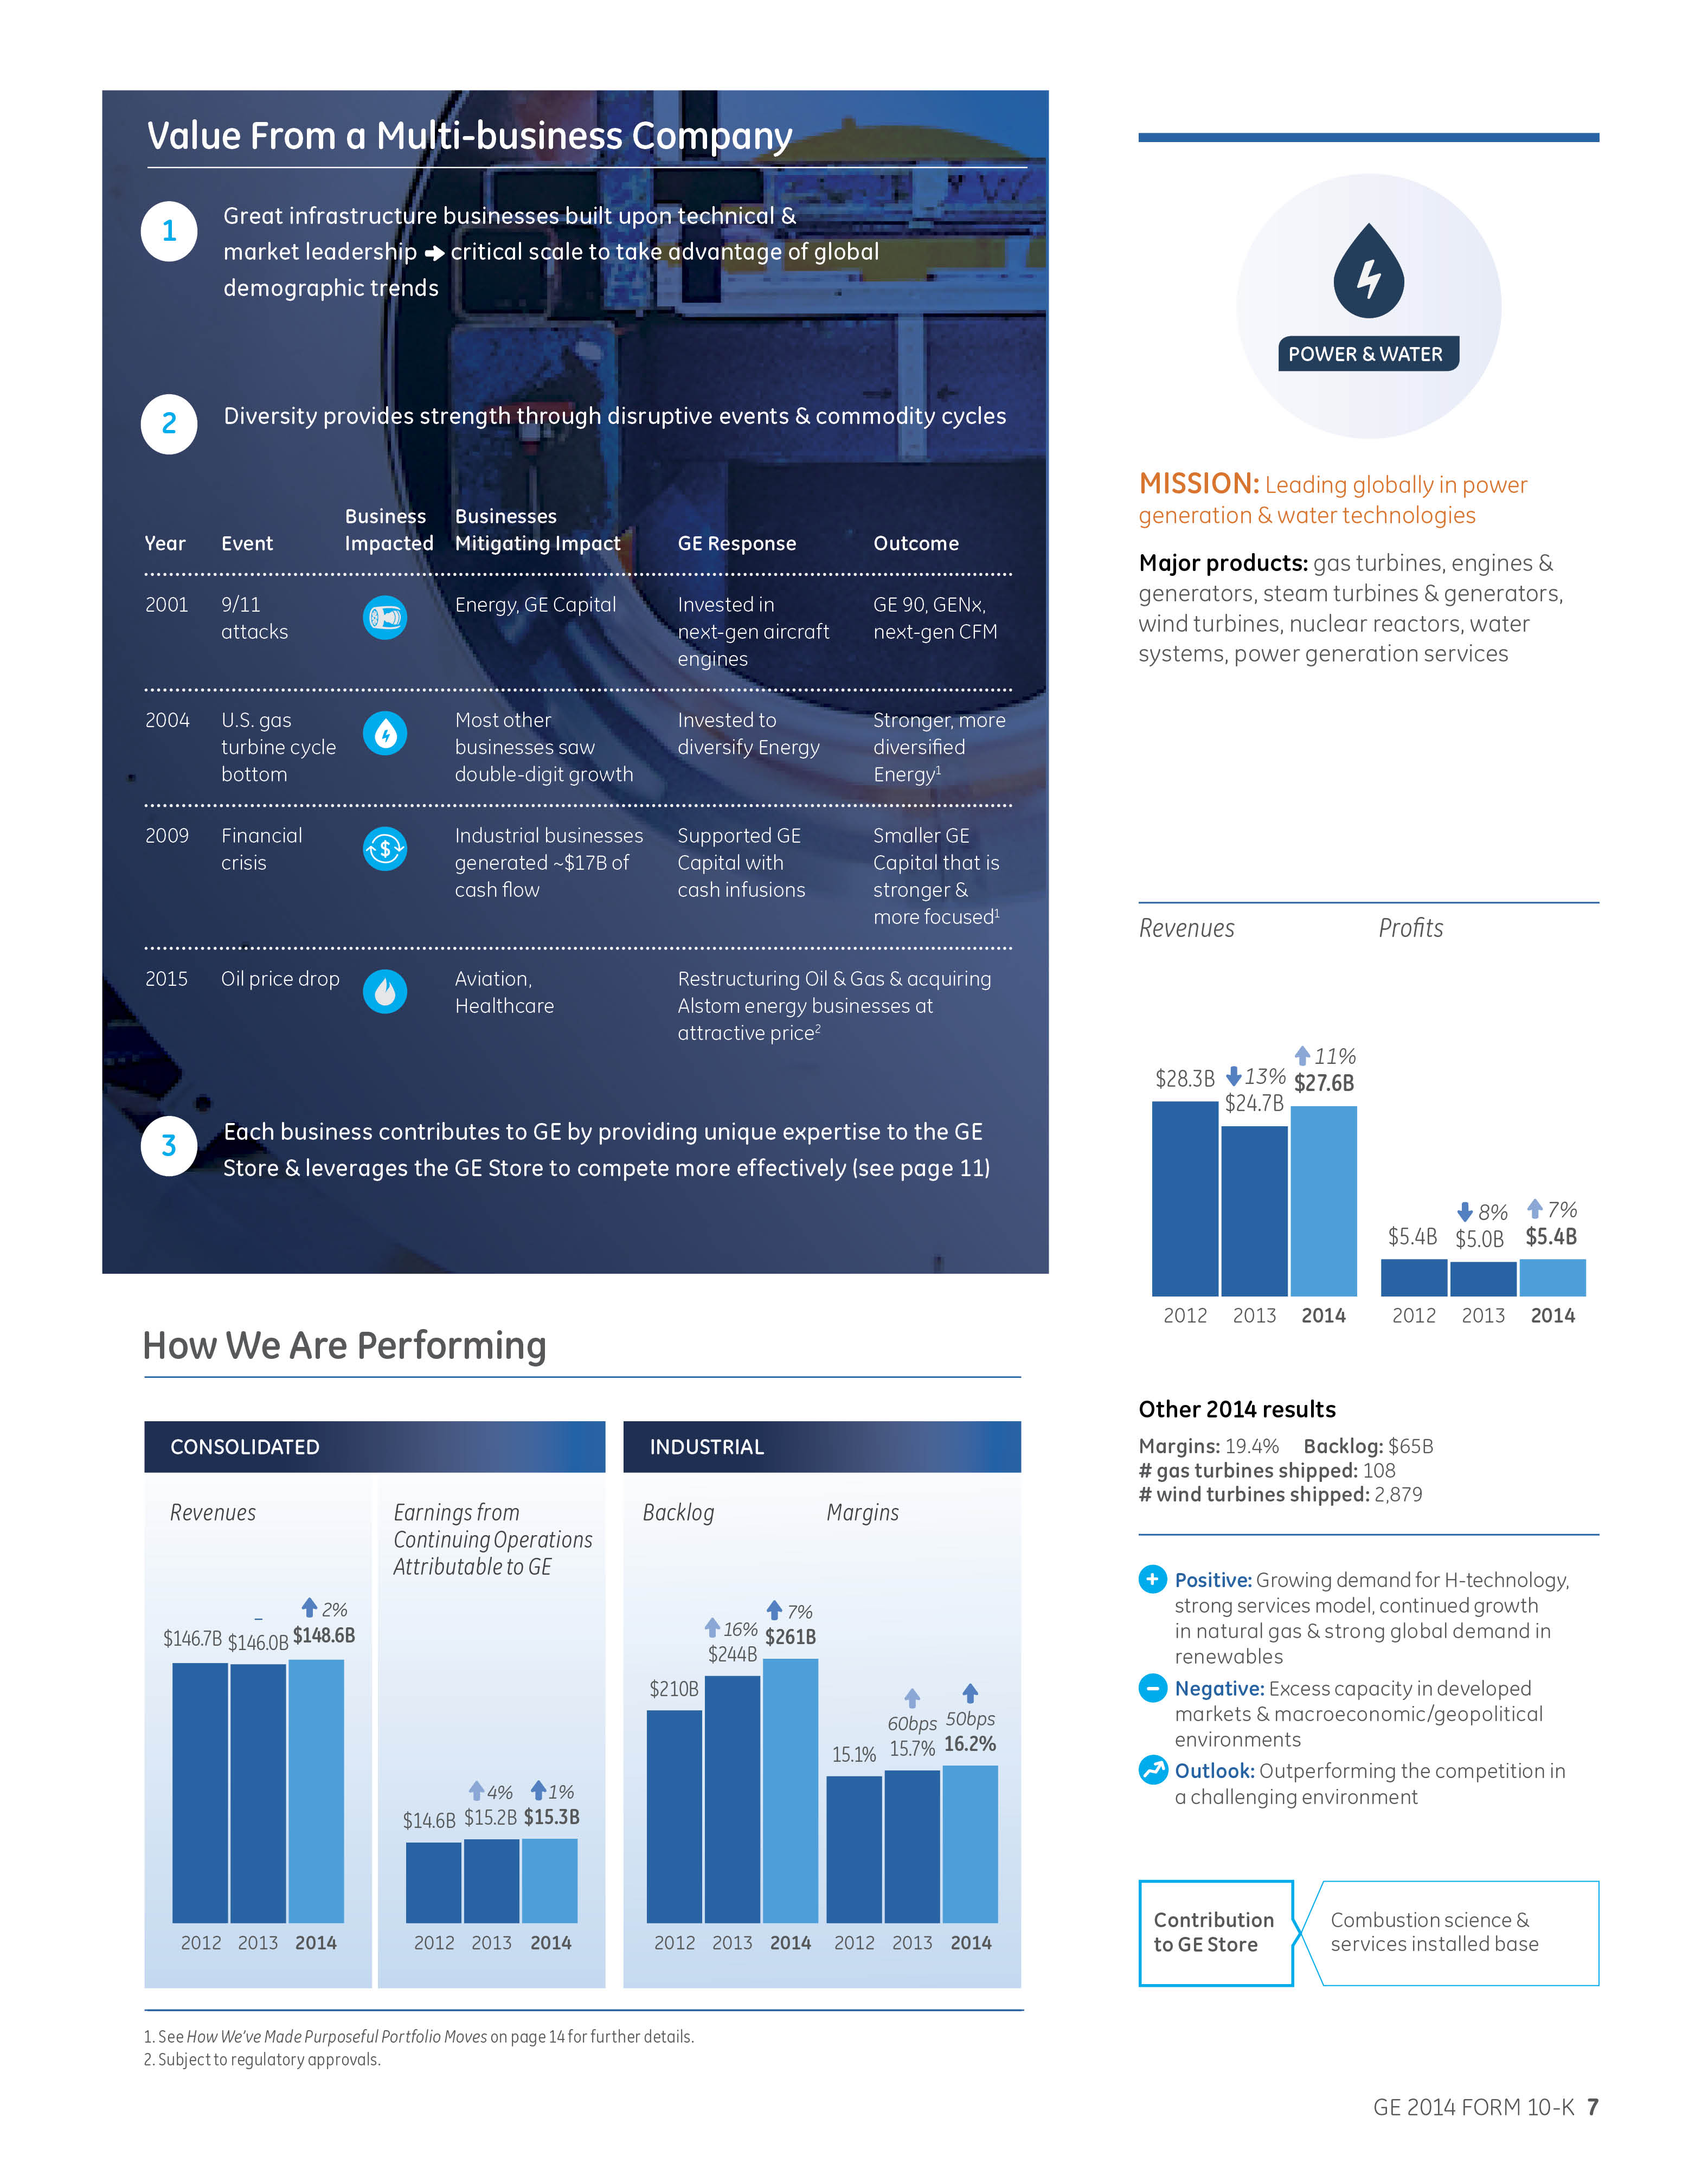
Power & Water serves power generation, industrial, government and other customers worldwide with products and services related to energy production and water reuse. Our products and technologies harness resources such as wind, oil, gas, diesel, nuclear and water to produce electric power.
| ||
| Power Generation Products and Services (PGP and PGS) – offers a wide spectrum of heavy-duty gas turbines and supplies machines and services for utilities, independent power producers, and industrial application, from pure power generation to cogeneration and district heating. |
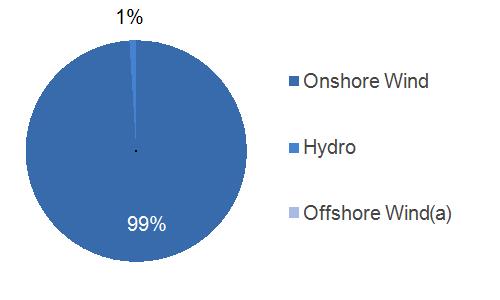
| Renewable Energy – primarily our Wind business, which manufactures wind turbines and provides support services ranging from development assistance to operation and maintenance. |
| Distributed Power – provides technology-based products to generate reliable and efficient power at or near the point of use. The product portfolio features aero derivative gas turbines, Jenbacher gas engines, and Waukesha gas engines. |
| Water Process Technologies – provides water treatment, wastewater treatment and process system solutions. |
| Nuclear – offers advanced reactor technologies solutions, including reactors, fuels and support services for boiling water reactors, and is offered through joint ventures with Hitachi and Toshiba, for safety, reliability and performance for nuclear fleets. |
Competition & Regulation |
Worldwide competition for power generation products and services is intense. Demand for power generation is global and, as a result, is sensitive to the economic and political environments of each country in which we do business.
Our Wind business is subject to certain global policies and regulation including the U.S. Production Tax Credit and incentive structures in China and various European countries. Changes in such policies may create unknown impacts or opportunities for the business.
GE 2014 FORM 10-K 32
MD&A | SEGMENT OPERATIONS | POWER & WATER |
OPERATIONAL OVERVIEW
(Dollars in billions)
2014 GEOGRAPHIC REVENUES: $27.6 BILLION | ORDERS | ||
 |
 |
Equipment
Services | |
2014 SUB-SEGMENT REVENUES | BACKLOG | ||
 |
 |
Equipment
Services | |
EQUIPMENT/SERVICES REVENUES | UNIT SALES | ||
 |  | ||
Services Equipment | |||
SIGNIFICANT TRENDS & DEVELOPMENTS |
| The Alstom transaction is expected to advance our strategic priorities and industrial growth. Alstom's Thermal and Renewables businesses are complementary in technology, operations and geography to our business. We expect the integration to yield efficiencies in supply chain, service infrastructure, new product development and SG&A. |
| The business continues to invest in new product development, such as our new H-Turbine, larger wind turbines and advanced upgrades, to expand our equipment and services offerings. |
| Excess capacity in developed markets and macroeconomic and geopolitical environments result in uncertainty for the industry and business. |
|
|
GE 2014 FORM 10-K 33
MD&A | SEGMENT OPERATIONS | POWER & WATER |
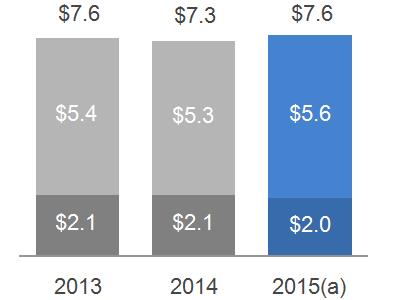
FINANCIAL OVERVIEW
(Dollars in billions)
SEGMENT REVENUES & PROFIT | SEGMENT PROFIT MARGIN | |||||
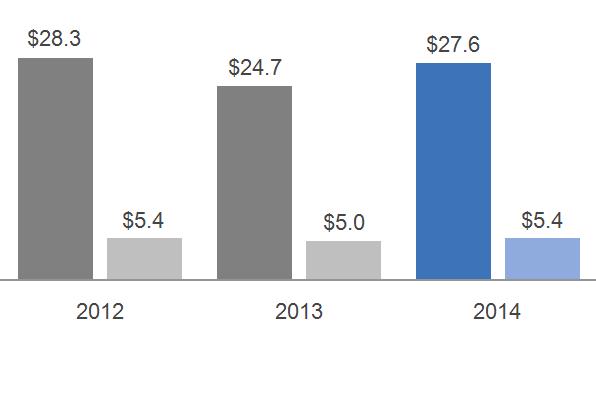 |  | |||||
- - Revenue - - Profit
| ||||||
SEGMENT REVENUES & PROFIT WALK: | COMMENTARY: | |||||
2014 – 2013 | 2014 – 2013 | |||||
Segment revenues up $2.8 billion (11%); Segment profit up $0.4 billion (7%) as a result of:
The increase in revenues was driven by higher volume, primarily higher equipment sales at PGP and Renewables, partially offset by lower prices at PGP and Renewables and the impact of a stronger U.S. dollar.
The increase in profit was mainly due to the higher volume at PGP and Renewables, and higher productivity reflecting a 10% reduction in SG&A cost, partially offset by negative business mix with equipment revenue up 20% and lower prices. | ||||||
Revenues | Profit | |||||
2013 | $ | 24.7 | $ | 5.0 | ||
Volume | 3.7 | 0.7 | ||||
Price | (0.4) | (0.4) | ||||
Foreign Exchange | (0.2) | - | ||||
(Inflation)/Deflation | N/A | 0.1 | ||||
Mix | N/A | (0.5) | ||||
Productivity | N/A | 0.7 | ||||
Other | (0.2) | (0.2) | ||||
2014 | $ | 27.6 | $ | 5.4 | ||
2013 – 2012 | 2013 – 2012 | |||||
Segment revenues down $3.6 billion (13%); Segment profit down $0.4 billion (8%) as a result of:
The decrease in revenues was driven by lower volume, primarily equipment sales at PGP and Renewables, and the impact of a stronger U.S. dollar. These decreases were partially offset by higher prices and higher other income related to a sale of assets.
The decrease in profit was mainly due to lower volume, primarily equipment sales at PGP and Renewables, and lower productivity despite decreases in SG&A cost. These decreases were partially offset by positive business mix, the effects of deflation, higher prices and higher other income. | ||||||
Revenues | Profit | |||||
2012 | $ | 28.3 | $ | 5.4 | ||
Volume | (3.9) | (0.7) | ||||
Price | 0.2 | 0.2 | ||||
Foreign Exchange | (0.1) | - | ||||
(Inflation)/Deflation | N/A | 0.2 | ||||
Mix | N/A | 0.3 | ||||
Productivity | N/A | (0.6) | ||||
Other | 0.2 | 0.2 | ||||
2013 | $ | 24.7 | $ | 5.0 | ||
GE 2014 FORM 10-K 34
MD&A | SEGMENT OPERATIONS | OIL & GAS |
 OIL & GAS
 BUSINESS OVERVIEW
Leader: Lorenzo Simonelli
| Headquarters & Operations
| |||||
| President & CEO, GE Oil & Gas 20 years of service with General Electric | 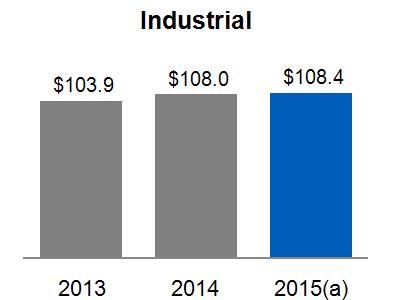 | 12% of segment revenues in 2014 17% of industrial segment revenues 15% of industrial segment profit HQ: London, UK Serving customers in 150+ countries Employees: approximately 44,000 | |||
Products & Services | ||||||
 | Oil & Gas serves all segments of the oil and gas industry, from drilling, completion, production and oil field operations, to transportation via liquefied natural gas (LNG) and pipelines. In addition, Oil & Gas provides industrial power generation and compression solutions to the refining and petrochemicals segments. Oil & Gas also delivers pipeline integrity solutions and a wide range of sensing, inspection and monitoring technologies. Oil & Gas exploits technological innovation from other GE businesses, such as Aviation and Healthcare, to continuously improve oil and gas industry performance, output and productivity. |
| Turbomachinery Solutions (TMS) – provides equipment and related services for mechanical-drive, compression and power-generation applications across the oil and gas industry. Our designs deliver high capacities and efficiencies, increase product flow and decrease both operational and environmental risks in the most extreme conditions, pressures and temperatures. Our portfolio includes drivers (aero-derivative gas turbines, heavy-duty gas turbines and synchronous and induction electric motors), compressors (centrifugal and axial, direct drive high speed, integrated, subsea compressors and turbo expanders), and turn-key solutions (industrial modules and waste heat recovery). |
| Drilling & Surface (D&S) – provides drilling, completion and production products and services for onshore & offshore oil & gas wells, and manufactures artificial lift equipment for well production and gears. The products & services portfolio includes blowout preventers, choke valves, drilling systems, drill stem valves, elastomers, pulsation dampeners wellheads, and surface production equipment. |
| Measurement & Controls (M&C) – provides equipment and services for a wide range of industries, including oil & gas, power generation, aerospace, metals, and transportation. The offerings include sensor-based measurement; non-destructive testing and inspection; flow and process control; turbine, generator and plant controls and condition monitoring, as well as pipeline integrity solutions. |
| Subsea Systems (SS) – offers our customers equipment and services for subsea well completion and production and integrated systems for enhanced recovery and comprehensive well lifecycle support. From new subsea field design and installation to mature field intervention and enhancement, SS offers all the equipment and expertise needed to safely and reliably maximize long-term resource value and overall efficiency. Specific products include flow control valves (known as "Christmas trees"), pressure control systems, wellheads, manifolds, integrated work over control systems and flexible subsea risers. |
| Downstream Technology Solutions (DTS) – provides products and services to serve the downstream segments of the industry including refining, petrochemical, distributed gas, and other industrial applications. Products include steam turbines, reciprocating and centrifugal compressors, blowers, pumps, valves, and compressed natural gas (CNG) and small-scale LNG solutions used primarily for shale oil and gas field development. |
Competition & Regulation |
GE 2014 FORM 10-K 35
MD&A | SEGMENT OPERATIONS | OIL & GAS |
OPERATIONAL OVERVIEW
(Dollars in billions)
2014 GEOGRAPHIC REVENUES: $18.7 BILLION | ORDERS | ||
 |  |
Equipment
Services | |
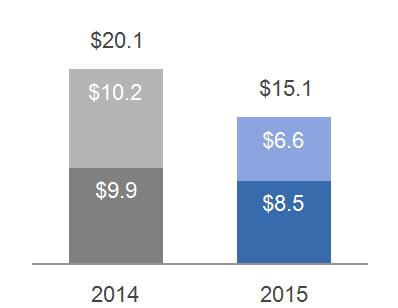
2014 SUB-SEGMENT REVENUES | BACKLOG | ||
 |  |
Equipment
Services | |
EQUIPMENT/SERVICES REVENUES | |||
 Services Equipment | |||
SIGNIFICANT TRENDS & DEVELOPMENTS |
| On June 2, 2014, we acquired Cameron's Reciprocating Compression division for $0.6 billion. The division provides reciprocating compression equipment and aftermarket services for oil and gas production, gas processing, gas distribution and independent power industries. |
| In July 2013, we completed the acquisition of Lufkin, a leading provider of artificial lift technologies for the oil and gas industry and a manufacturer of gears, for $3.3 billion. Revenues for Lufkin are included in the D&S sub-segment. |
| Relatively lower oil prices leading to reductions in customers' forecasted capital expenditures create industry challenges, the effects of which are uncertain. |
| We are impacted by volatility in foreign currency exchange rates mainly due to a high concentration of non-U.S. dollar denominated business as well as long-term contracts denominated in multiple currencies. |
GE 2014 FORM 10-K 36
MD&A | SEGMENT OPERATIONS | OIL & GAS |
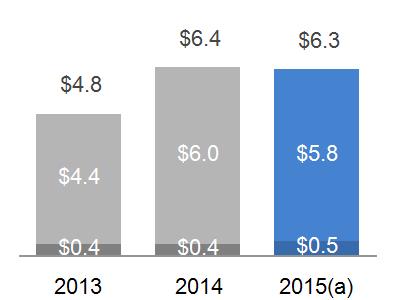
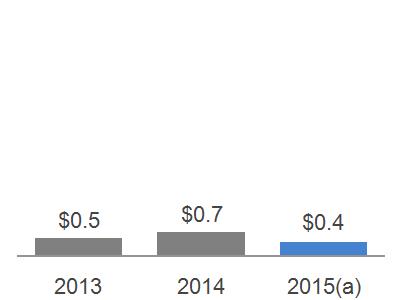
FINANCIAL OVERVIEW
(Dollars in billions)
SEGMENT REVENUES & PROFIT | SEGMENT PROFIT MARGIN | |||||
 - - Revenue - - Profit
|  | |||||
SEGMENT REVENUES & PROFIT WALK: | COMMENTARY: | |||||
2014 – 2013 | 2014 – 2013 | |||||
Segment revenues up $1.7 billion (10%); Segment profit up $0.4 billion (19%) as a result of:
The increase in revenues was primarily due to higher volume, mainly driven by higher equipment sales at SS, D&S and TMS, as well as the $0.3 billion net impact of acquisitions, primarily Lufkin, and dispositions, primarily Wayne. Higher prices primarily at SS also increased revenues. These increases were partially offset by the effects of a stronger U.S. dollar.
The increase in profit was primarily due to higher productivity, higher volume and higher prices. These increases were partially offset by negative business mix. | ||||||
Revenues | Profit | |||||
2013 | $ | 17.0 | $ | 2.2 | ||
Volume | 1.7 | 0.2 | ||||
Price | 0.1 | 0.1 | ||||
Foreign Exchange | (0.1) | - | ||||
(Inflation)/Deflation | N/A | - | ||||
Mix | N/A | (0.2) | ||||
Productivity | N/A | 0.4 | ||||
Other | - | - | ||||
2014 | $ | 18.7 | $ | 2.6 | ||
2013 – 2012 | 2013 – 2012 | |||||
Segment revenues up $1.7 billion (11%); Segment profit up $0.3 billion (13%) as a result of:
The increase in revenues was primarily due to higher volume, mainly driven by increased equipment sales as well as the impact of acquisitions ($0.7 billion), higher prices at TMS, and the effects of a weaker U.S. dollar.
The increase in profit was due to higher volume, which was positively impacted by acquisitions and organic growth in the SS and D&S business, as well as higher prices at TMS. This was partially offset by lower cost productivity. | ||||||
Revenues | Profit | |||||
2012 | $ | 15.2 | $ | 1.9 | ||
Volume | 1.5 | 0.2 | ||||
Price | 0.2 | 0.2 | ||||
Foreign Exchange | 0.1 | - | ||||
(Inflation)/Deflation | N/A | - | ||||
Mix | N/A | - | ||||
Productivity | N/A | (0.1) | ||||
Other | - | - | ||||
2013 | $ | 17.0 | $ | 2.2 | ||
GE 2014 FORM 10-K 37
MD&A | SEGMENT OPERATIONS | ENERGY MANAGEMENT |
 ENERGY MANAGEMENT
 BUSINESS OVERVIEW
Leader: Mark W. Begor
| Headquarters & Operations
| ||||||||
| President & CEO, GE Energy Management Over 30 years of service with General Electric |  | 5% of segment revenues in 2014 7% of industrial segment revenues 1% of industrial segment profit Headquarters: Atlanta, GA Serving customers in 150+ countries Employees: approximately 30,000 | ||||||
Products & Services | |||||||||
|
Energy Management designs, manufactures and services leading technology solutions for the delivery, management, conversion and optimization of electrical power. Our energy solutions allow customers across multiple energy-intensive industries such as oil & gas, marine, data centers, metals and mining to efficiently manage electricity from the point of generation to the point of consumption. | ||||||||
| Industrial Solutions – creates advanced technologies that safely, reliably and efficiently distribute and control electricity to protect people, property and equipment. We provide high performance software and control solutions and offer products such as circuit breakers, relays, arresters, switchgear, panel boards and repair for the commercial, data center, healthcare, mining, renewables, oil & gas, water and telecom markets. |
| Digital Energy – maximizes the reliability, efficiency and resiliency of the grid by preventing and detecting grid power failures, digitizing substations, and reducing outages. We provide advanced products and services that modernize the grid, from the power plant to the power consumer, such as protection and control, industrial strength communications, smart meters, monitoring & diagnostics, visualization software and advanced analytics. We provide high voltage and medium voltage (HV/MV) equipment, smart controls and sensors, software solutions and power projects for industries such as generation, transmission, distribution, oil and gas, telecommunication, mining and water. We currently have several strategic partnership ventures, primarily in Mexico and China, which allow us to support our customers through various product and service offerings. |
| Power Conversion – applies the science and systems of power conversion to help drive the electric transformation of the world's energy infrastructure. Our product portfolio includes motors, generators, automation & control equipment & drives for energy intensive industries such as marine, oil & gas, renewable energy, mining, rail, metals, test systems and water. |
Competition & Regulation |
Energy Management faces competition from businesses operating with global presence and with deep energy domain expertise. Our products and services sold to end customers are often subject to a number of regulatory specification and performance standards under different federal, state, foreign and energy industry standards.
GE 2014 FORM 10-K 38
MD&A | SEGMENT OPERATIONS | ENERGY MANAGEMENT |
OPERATIONAL OVERVIEW
(Dollars in billions)
2014 GEOGRAPHIC REVENUES: $7.3 BILLION | ORDERS | ||
 |  |
Equipment
Services | |
2014 SUB-SEGMENT REVENUES | BACKLOG | ||
 |  |
Equipment
Services | |
EQUIPMENT/SERVICES REVENUES | |||
 Services Equipment | |||
SIGNIFICANT TRENDS & DEVELOPMENTS |
| We are seeing growth in the liquefied natural gas, onshore electrification, offshore marine, and wind & solar industries, which is driving demand in our Power Conversion business for equipment and services. |
| While we see signs of growth in the North American electrical distribution market, the European economic recovery is slow, and demand remains soft in other parts of the developed world. |
| The U.S. electrical grid capacity is high and load growth is expected to be slow in the near term; spending by utilities in the U.S. continues to be focused more heavily on sustaining operations versus capital investment. |
| We plan to complement and expand the Digital Energy business with the acquisition of Alstom's Grid business. |
| We expect continued reinvestment in our key products to drive growth and continued margin accretion in 2015 and beyond. |
GE 2014 FORM 10-K 39
MD&A | SEGMENT OPERATIONS | ENERGY MANAGEMENT |
|
|
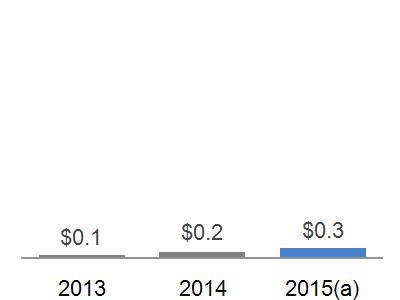
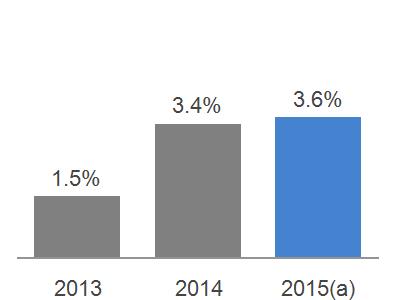
FINANCIAL OVERVIEW
(Dollars in billions)
SEGMENT REVENUES & PROFIT | SEGMENT PROFIT MARGIN
 | |
 - - Revenue - - Profit
|
COMMENTARY: 2014 – 2013 |
2013 – 2012 | |
Segment revenues down $0.3 billion (3%) as a result of: Lower volume ($0.2 billion) from weakness in North American utility and electrical distribution markets, partially offset by higher sales in Power Conversion.
Segment profit up $0.1 billion as a result of : Higher productivity ($0.1 billion) reflecting an 8% reduction in SG&A cost.
|
Segment revenues up $0.2 billion (2%) as a result of: Higher volume ($0.2 billion), partially offset by the effects of the stronger U.S. dollar ($0.1 billion).
Segment profit down 16% as a result of : Lower productivity ($0.1 billion).
|
GE 2014 FORM 10-K 40
MD&A | SEGMENT OPERATIONS | AVIATION |
 AVIATION
 BUSINESS OVERVIEW
Leader: David Joyce
| Headquarters & Operations
| ||||||||
| SVP and President & CEO, GE Aviation Over 30 years of service with General Electric | 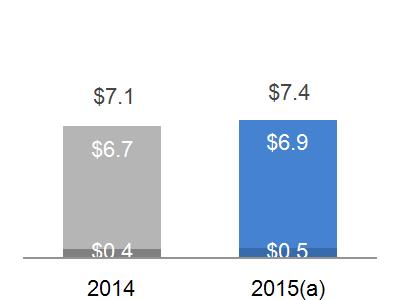 | 16% of segment revenues in 2014 22% of industrial segment revenues 28% of industrial segment profit Headquarters: Cincinnati, OH Serving customers in 125+ countries Employees: approximately 44,000 | ||||||
Products & Services | |||||||||
|
Aviation designs and produces commercial and military aircraft engines, integrated digital components, electric power and mechanical aircraft systems. We also provide aftermarket services to support our products.
| ||||||||
| Commercial Engines (CEO) – manufactures jet engines and turboprops for commercial airframes. Our commercial engines power aircraft in all categories; regional, narrowbody and widebody. We also manufacture for Business and General Aviation segments. |
| Commercial Services – provides maintenance, component repair and overhaul services (MRO), including sales of replacement parts. |
| Military – manufactures jet engines for military airframes. Our military engines power a wide variety of military aircraft including fighters, bombers, tankers, helicopters and surveillance aircraft, as well as marine applications. We provide maintenance, component repair and overhaul services (MRO), including sales of replacement parts. |
| Systems – provides components, systems and services for commercial and military segments. This includes avionics systems, aviation electric power systems, flight efficiency and intelligent operation services, aircraft structures and Avio Aero. |
| We also produce and market engines through CFM International, a company jointly owned by GE and Snecma, a subsidiary of SAFRAN of France, and Engine Alliance, LLC, a company jointly owned by GE and the Pratt & Whitney division of United Technologies Corporation. New engines are also being designed and marketed in a joint venture with Honda Aero, Inc., a division of Honda Motor Co., Ltd. |
Competition & Regulation |
The global businesses for aircraft jet engines, maintenance component repair and overhaul services (including parts sales) are highly competitive. Both U.S. and non-U.S. markets are important to the growth and success of the business. Product development cycles are long and product quality and efficiency are critical to success. Research and development expenditures are important in this business, as are focused intellectual property strategies and protection of key aircraft engine design, manufacture, repair and product upgrade technologies. Aircraft engine orders and systems tend to follow military and airline procurement transactions.
Our product, services and activities are subject to a number of regulators such as by the U.S. Federal Aviation Administration (FAA), European Aviation Safety Agency (EASA) and other regulatory bodies.
GE 2014 FORM 10-K 41
MD&A | SEGMENT OPERATIONS | AVIATION |
OPERATIONAL OVERVIEW
(Dollars in billions)
2014 GEOGRAPHIC REVENUES: $24.0 BILLION | ORDERS | ||||
 |
 |
Equipment
Services | |||
2014 SUB-SEGMENT REVENUES | BACKLOG | ||||
 |  |
Equipment
Services | |||
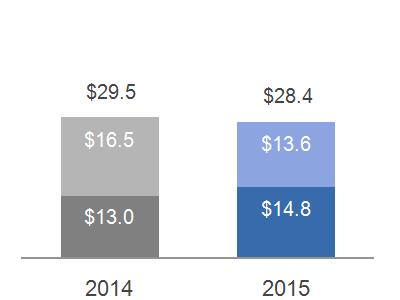
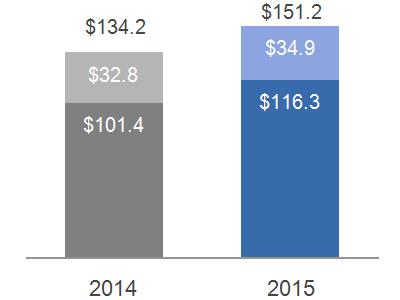
EQUIPMENT/SERVICES REVENUES | UNIT SALES | ||||
 Services Equipment
|  (a) GEnx engines are a subset of commercial engines (b) Commercial spares shipment rate in millions of dollars per day | ||||
SIGNIFICANT TRENDS & DEVELOPMENTS | |||||
| On August 1, 2013, we completed the acquisition of the aviation business of Avio, a manufacturer of aviation propulsion components and systems for $4.4 billion. |
| We expect military shipments to be lower due to continued pressure on the U.S. military budget. |
| The installed base continues to grow with new product launches. |
| Lower fuel costs are expected to result in increased airline profitability and continued growth in passenger traffic and freight. |
| Revenue sharing programs are a standard form of cooperation for specific product programs in the aviation industry. These programs are controlled by Aviation, but counterparties (with interests ranging from 1% to 39%) have an agreed share of revenues as well as development and component production responsibilities. |
|
|
GE 2014 FORM 10-K 42
MD&A | SEGMENT OPERATIONS | AVIATION |
FINANCIAL OVERVIEW
(Dollars in billions)
SEGMENT REVENUES & PROFIT | SEGMENT PROFIT MARGIN | |||||
 - - Revenue - - Profit
|  | |||||
SEGMENT REVENUES & PROFIT WALK: | COMMENTARY: | |||||
2014 – 2013 | 2014 – 2013 | |||||
Segment revenues up $2.1 billion (9%); Segment profit up $0.6 billion (14%) as a result of:
The increase in revenues was due to higher volume and higher prices driven by Commercial Engines volume, spare parts volume and the third-quarter 2013 acquisition of Avio.
The increase in profit was mainly due to higher prices in our Commercial Engines and Commercial Services businesses and higher volume discussed above. These increases were partially offset by effects of inflation and negative business mix. | ||||||
Revenues | Profit | |||||
2013 | $ | 21.9 | $ | 4.3 | ||
Volume | 1.2 | 0.2 | ||||
Price | 0.8 | 0.8 | ||||
Foreign Exchange | - | - | ||||
(Inflation)/Deflation | N/A | (0.3) | ||||
Mix | N/A | (0.2) | ||||
Productivity | N/A | - | ||||
Other | 0.1 | 0.1 | ||||
2014 | $ | 24.0 | $ | 5.0 | ||
2013 – 2012 | 2013 – 2012 | |||||
Segment revenues up $1.9 billion (10%) (including $0.5 billion from acquisitions); Segment profit up $0.6 billion (16%) as a result of:
The increase in revenues was primarily due to higher volume and higher prices. Higher volume and prices were driven by increased services revenues ($0.7 billion) and equipment ($1.2 billion). The increase in service revenue was primarily due to higher commercial spares sales, while the increase in equipment was primarily due to increased Commercial Engine shipments.
The increase in profit was due to higher prices, higher volume and increased other income, partially offset by the effects of inflation and lower cost productivity. | ||||||
Revenues | Profit | |||||
2012 | $ | 20.0 | $ | 3.7 | ||
Volume | 1.4 | 0.2 | ||||
Price | 0.6 | 0.6 | ||||
Foreign Exchange | - | - | ||||
(Inflation)/Deflation | N/A | (0.2) | ||||
Mix | N/A | - | ||||
Productivity | N/A | (0.1) | ||||
Other | - | 0.1 | ||||
2013 | $ | 21.9 | $ | 4.3 | ||
GE 2014 FORM 10-K 43
MD&A | SEGMENT OPERATIONS | HEALTHCARE |
 HEALTHCARE
 BUSINESS OVERVIEW
Leader: John L. Flannery
| Headquarters & Operations
| ||||||||
| President & CEO, GE Healthcare Over 25 years of service with General Electric | 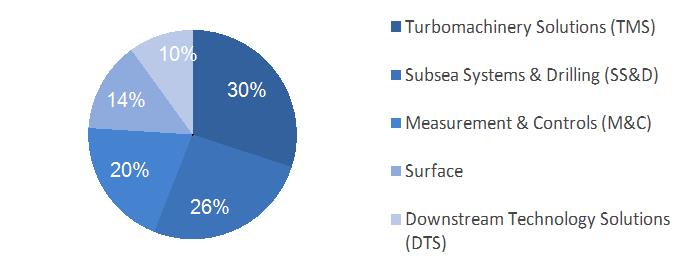 | 12% of segment revenues in 2014 17% of industrial segment revenues 17% of industrial segment profit Headquarters: Little Chalfont, UK Serving customers in 140+ countries Employees: approximately 51,000 | ||||||
Products & Services | |||||||||
|
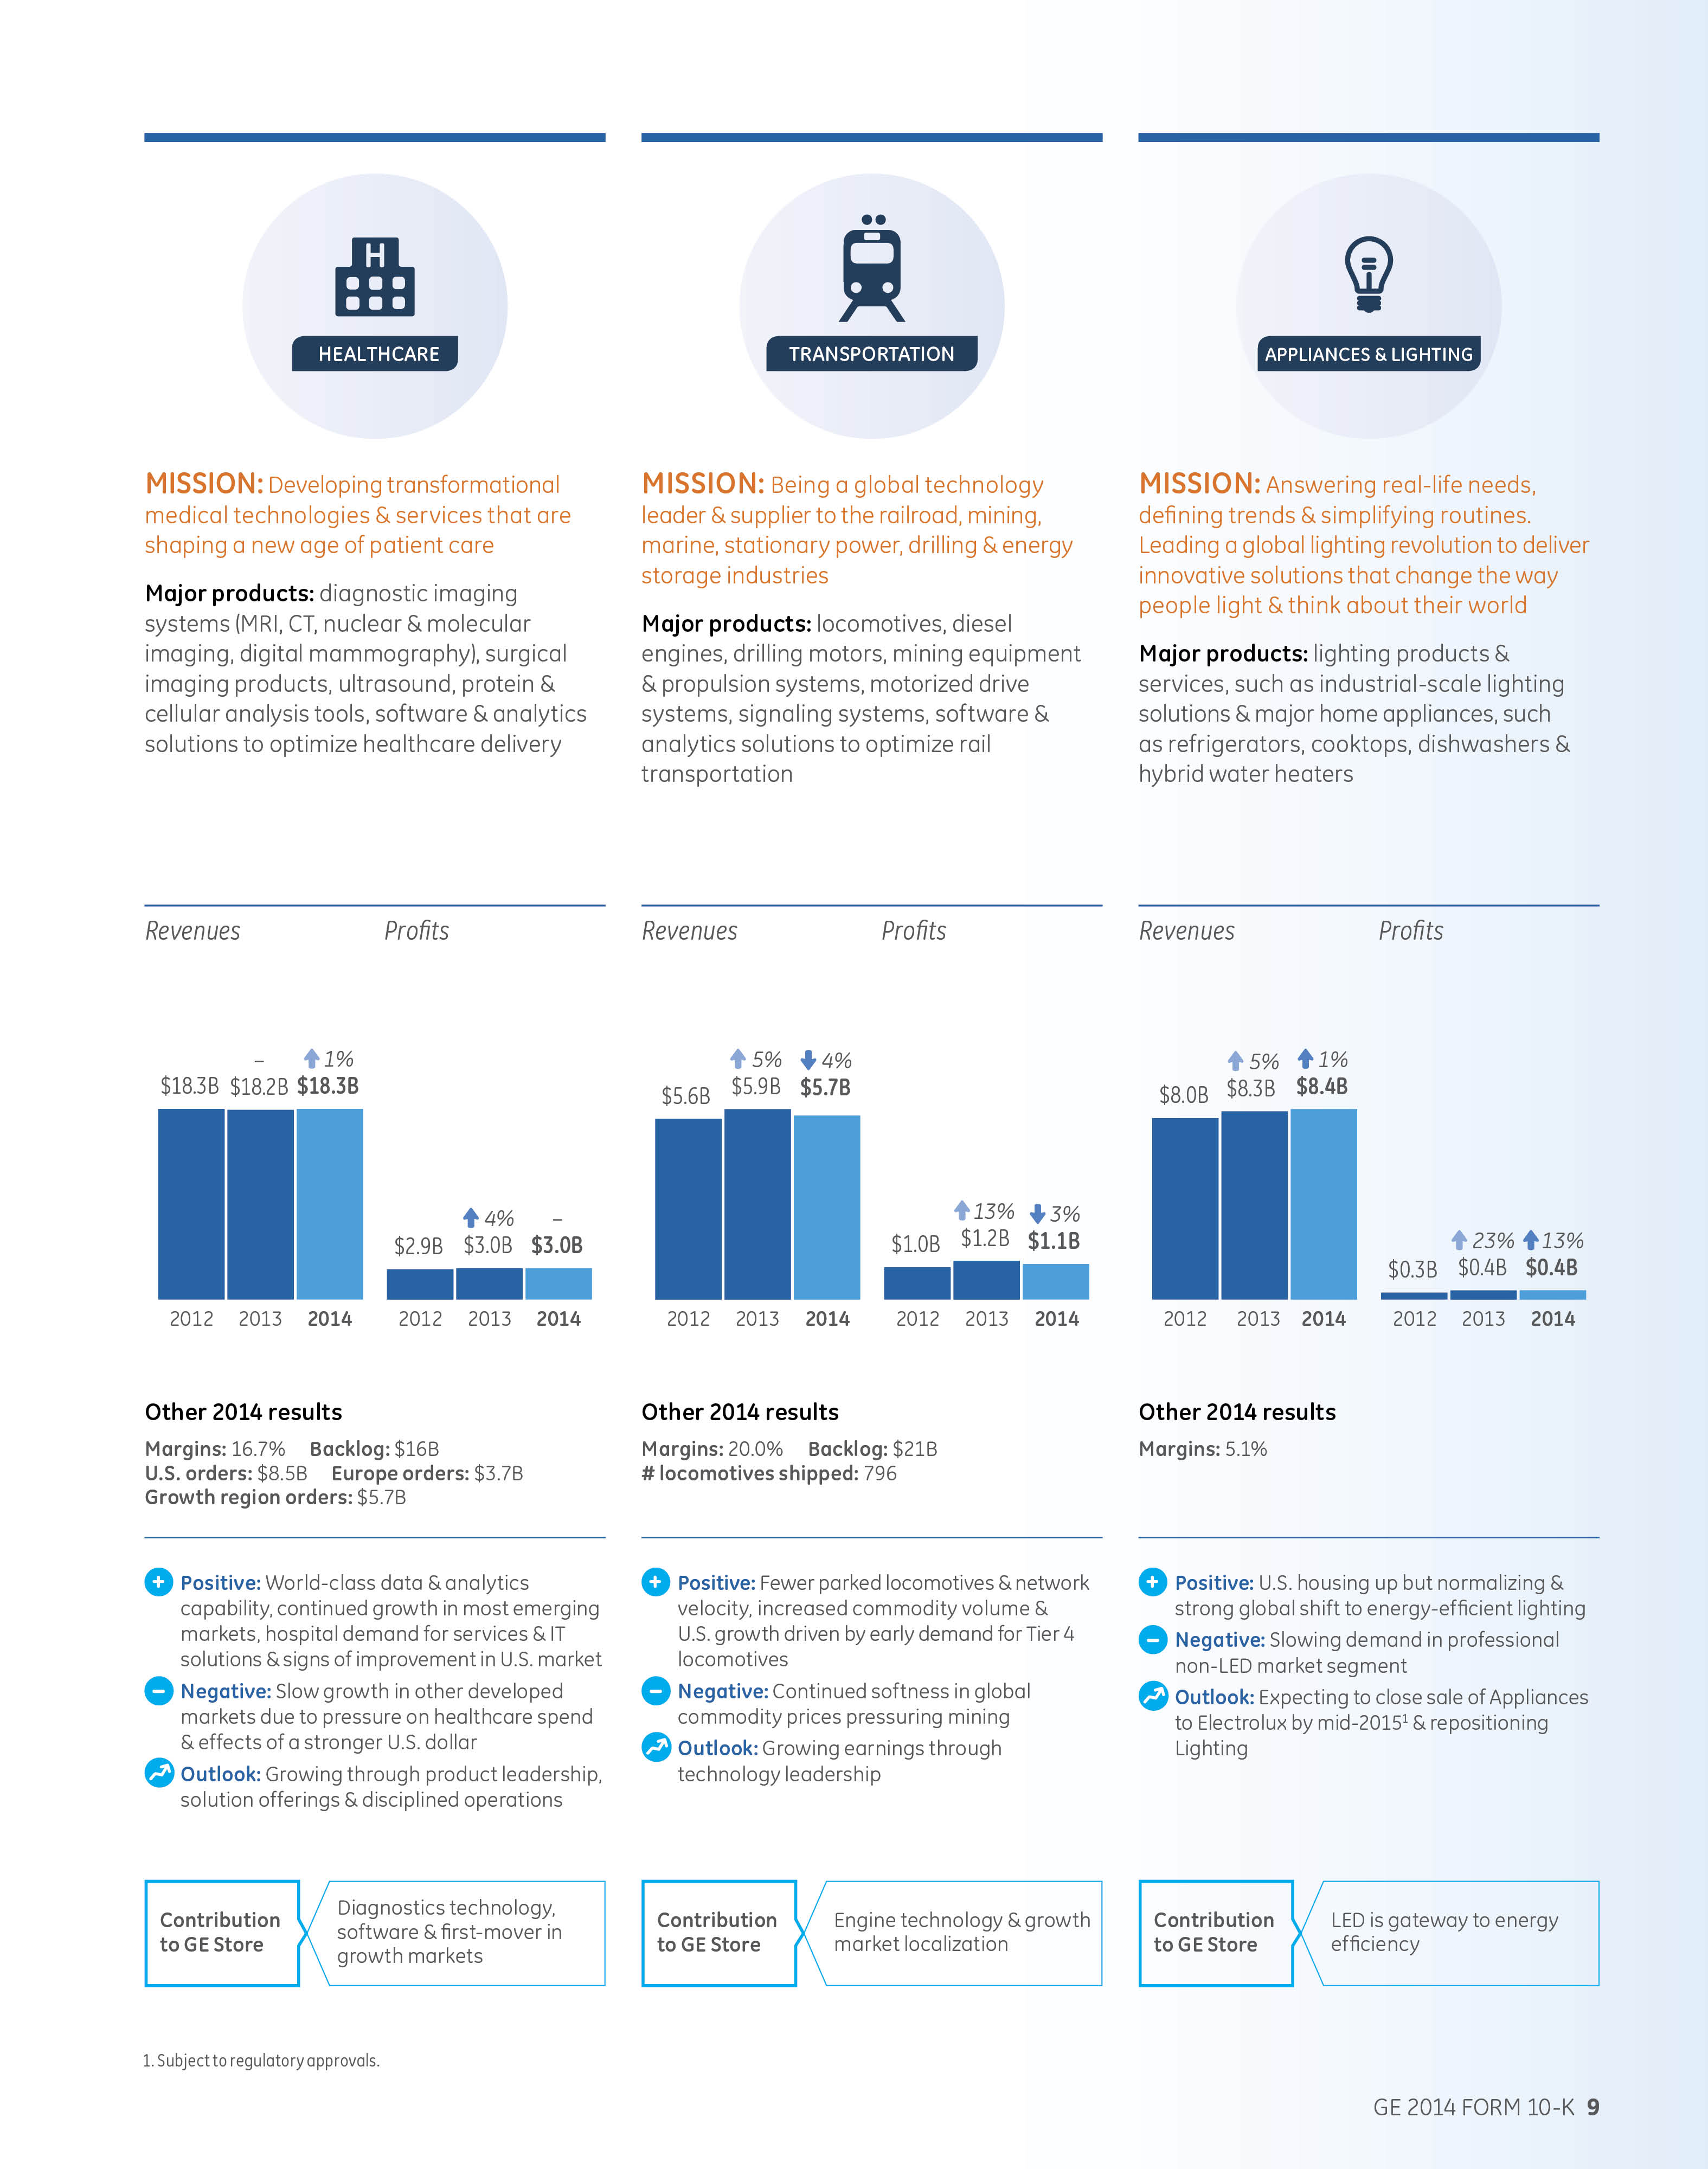
Healthcare provides essential healthcare technologies to developed and emerging markets and has expertise in medical imaging, software and information technology (IT), patient monitoring and diagnostics, drug discovery, biopharmaceutical manufacturing technologies and performance improvement solutions. Products and services are sold worldwide primarily to hospitals, medical facilities, pharmaceutical and biotechnology companies, and to the life science research market. | ||||||||
| Healthcare Systems – provides a wide range of technologies and services that include diagnostic imaging and clinical systems. Diagnostic imaging systems such as X-ray, digital mammography, computed tomography (CT), magnetic resonance (MR), interventional imaging and molecular imaging technologies allow clinicians to see inside the human body more clearly. Clinical systems such as ultrasound, electrocardiography (ECG), bone densitometry, patient monitoring, incubators and infant warmers, respiratory care, and anesthesia management that enable clinicians to provide better care for patients every day - from wellness screening to advanced diagnostics to life-saving treatment. Healthcare systems also offers product services that include remote diagnostic and repair services for medical equipment manufactured by GE and by others. |
| Life Sciences – delivers products and services for drug discovery, biopharmaceutical manufacturing and cellular technologies, so scientists and specialists discover new ways to predict, diagnose and treat disease. It also researches, manufactures and markets innovative imaging agents used during medical scanning procedures to highlight organs, tissue and functions inside the human body, to aid physicians in the early detection, diagnosis and management of disease through advanced in-vivo and in-vitro diagnostics. |
| Healthcare IT – provides IT solutions including enterprise and departmental Information Technology products, Picture Archiving System (PACS), Radiology Information System (RIS), Cardiovascular Information System (CVIS), revenue cycle management and practice applications, to help customers streamline healthcare costs and improve the quality of care. |
Competition & Regulation |
Healthcare competes with a variety of U.S. and non-U.S. manufacturers and services providers. Customers require products and services that allow them to provide better access to healthcare, improve the affordability of care, and improve the quality of patient outcomes. Technology innovation to provide products that improve these customer requirements and competitive pricing are among the key factors affecting competition for these products and services. New technologies could make our products and services obsolete unless we continue to develop new and improved products and services.
Our products are subject to regulation by numerous government agencies, including the U.S. Food and Drug Administration (U.S. FDA), as well as various laws that apply to claims submitted under Medicare, Medicaid or other government funded healthcare programs.
GE 2014 FORM 10-K 44
MD&A | SEGMENT OPERATIONS | HEALTHCARE |
OPERATIONAL OVERVIEW
(Dollars in billions)
2014 GEOGRAPHIC REVENUES: $18.3 BILLION | ORDERS | ||
 |  |
Equipment
Services | |
2014 SUB-SEGMENT REVENUES | BACKLOG | ||
 |  |
Equipment
Services | |
EQUIPMENT/SERVICES REVENUES | |||
 Services Equipment | |||
SIGNIFICANT TRENDS & DEVELOPMENTS |
| We continue to lead in technology innovation with greater focus on productivity based technology, services, and IT solutions as healthcare providers seek greater productivity and efficiency. |
| The U.S. market is improving but uncertainty remains regarding the impact of the Affordable Care Act. Emerging markets are expected to grow long-term with short-term volatility. |
| API Healthcare (API), a healthcare workforce management software and analytics solutions provider, was acquired in February 2014 for $0.3 billion. |
| Life Sciences is expanding its business through bioprocess growth and the acquisition of certain Thermo Fisher Scientific Inc. life-science businesses, which were acquired in March 2014 for $1.1 billion. |
GE 2014 FORM 10-K 45
MD&A | SEGMENT OPERATIONS | HEALTHCARE |
FINANCIAL OVERVIEW
(Dollars in billions)
SEGMENT REVENUES & PROFIT | SEGMENT PROFIT MARGIN | |||||
 - - Revenue - - Profit
|  | |||||
SEGMENT REVENUES & PROFIT WALK: | COMMENTARY: | |||||
2014 – 2013 | 2014 – 2013 | |||||
Segment revenues up $0.1 billion (1%); Segment profit flat as a result of:
The increase in revenues was due to higher volume, driven by the higher sales in Life Sciences. This increase was partially offset by lower prices mainly at Healthcare Systems and the effects of a stronger U.S. dollar.
Profit was flat as higher productivity, driven by SG&A cost reductions, and higher volume, were offset by lower prices, mainly at Healthcare Systems, inflation and effects of a stronger U.S. dollar. | ||||||
Revenues | Profit | |||||
2013 | $ | 18.2 | $ | 3.0 | ||
Volume | 0.6 | 0.1 | ||||
Price | (0.3) | (0.3) | ||||
Foreign Exchange | (0.2) | (0.1) | ||||
(Inflation)/Deflation | N/A | (0.2) | ||||
Mix | N/A | - | ||||
Productivity | N/A | 0.5 | ||||
Other | - | - | ||||
2014 | $ | 18.3 | $ | 3.0 | ||
2013 – 2012 | 2013 – 2012 | |||||
Segment revenues down $0.1 billion; Segment profit up $0.1 billion (4%) as a result of:
The decrease in revenues was driven by lower prices mainly at Healthcare Systems, effects of a stronger U.S. dollar and lower other income, partially offset by higher volume.
The increase in profit was mainly driven by higher productivity resulting from SG&A cost reductions and higher volume, partially offset by lower prices mainly at Healthcare Systems, the effects of inflation and the stronger U.S. dollar. | ||||||
Revenues | Profit | |||||
2012 | $ | 18.3 | $ | 2.9 | ||
Volume | 0.5 | 0.1 | ||||
Price | (0.3) | (0.3) | ||||
Foreign Exchange | (0.2) | (0.1) | ||||
(Inflation)/Deflation | N/A | (0.2) | ||||
Mix | N/A | - | ||||
Productivity | N/A | 0.6 | ||||
Other | - | - | ||||
2013 | $ | 18.2 | $ | 3.0 | ||
GE 2014 FORM 10-K 46
MD&A | SEGMENT OPERATIONS | TRANSPORTATION |
 TRANSPORTATION
 BUSINESS OVERVIEW
Leader: Russell Stokes
| Headquarters & Operations
| ||||
| President & CEO, GE Transportation Over 15 years of service with General Electric | 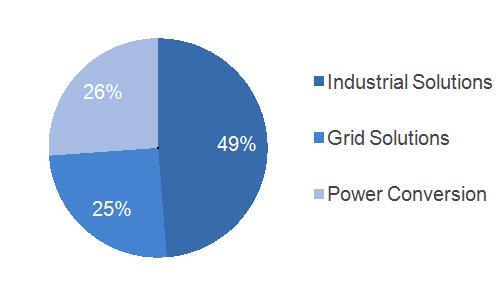 | 4% of segment revenues in 2014 5% of industrial segment revenues 6% of industrial segment profit Headquarters: Chicago, IL Serving customers in 60+ countries Employees: approximately 13,000 | ||
Products & Services | |||
|
Transportation is a global technology leader and supplier to the railroad, marine, drilling and mining industries. Products and services offered by Transportation include: | ||
| Locomotives – we provide freight and passenger locomotives, signaling and communications systems as well as rail services to help solve rail challenges. We manufacture high-horsepower, diesel-electric locomotives including the Evolution Series TM , which meets or exceeds the U.S. Environmental Protection Agency's (EPA) Tier 4 requirements for freight and passenger applications. |
| Locomotive Services & Solutions – we develop partnerships that support advisory services, parts, integrated software solutions and data analytics. Our comprehensive offerings include tailored service programs, high-quality parts for GE and other locomotive platforms, overhaul, repair and upgrade services, and wreck repair. Our portfolio provides the people, partnerships and leading software to optimize operations and asset utilization. |
| Mining – we provide mining equipment and services. The portfolio includes drive systems for off-highway vehicles, mining equipment, mining power and productivity. |
| Marine, Stationary & Drilling – we offer motors for land and offshore drilling rigs, marine diesel engines and stationary power diesel engines. |
Competition & Regulation |
The competitive environment for locomotives and mining equipment and services consists of large global competitors and a number of smaller competitors that compete in a limited-size product range, and or geographic region. North America will be of particular focus for the rail industry in 2015 as the EPA Tier 4 emissions standards are implemented. We are positioned with the only locomotive currently available that meets the Tier 4 standards.
GE 2014 FORM 10-K 47
MD&A | SEGMENT OPERATIONS | TRANSPORTATION |
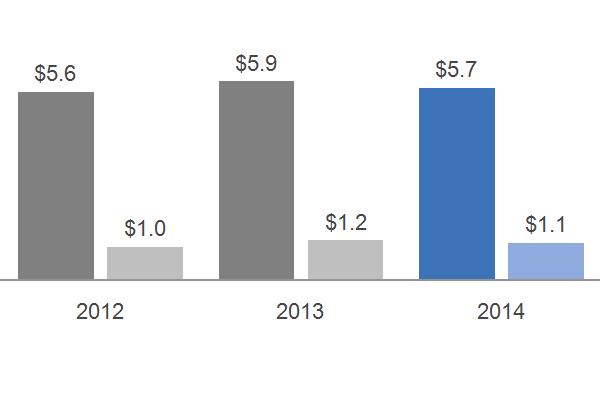
OPERATIONAL OVERVIEW
(Dollars in billions)
2014 GEOGRAPHIC REVENUES: $5.7 BILLION | ORDERS | ||
 |  |
Equipment
Services | |
2014 SUB-SEGMENT REVENUES | BACKLOG | ||
 |  |
Equipment
Services | |
EQUIPMENT/SERVICES REVENUES | UNIT SALES | ||
 Services Equipment
| 
| ||
SIGNIFICANT TRENDS & DEVELOPMENTS |
| Rail volume, especially in North America, continues to climb and the number of parked locomotives remains low. |
| North American locomotives competition remains strong, but GE is positioned with the only locomotive currently available meeting the U.S. EPA's highest (Tier 4) emission standards. We expect U.S. growth to be driven by early demand for Tier 4 locomotives. |
| Continued global mining softness has resulted in delayed capital expenditures in the mining industry. |
| During the fourth quarter of 2014, we signed an agreement to sell our Signaling business to Alstom for approximately $0.8 billion. |
GE 2014 FORM 10-K 48
MD&A | SEGMENT OPERATIONS | TRANSPORTATION |
FINANCIAL OVERVIEW
(Dollars in billions)
SEGMENT REVENUES & PROFIT | SEGMENT PROFIT MARGIN | |
 - - Revenue - - Profit
|  | |
COMMENTARY: | ||
2014 – 2013 | 2013 – 2012 | |
Segment revenues down $0.2 billion (4%) as a result of: Lower volume ($0.2 billion), primarily in Mining reflecting weakness in the industry, partially offset by an increase in volume in the locomotive services business.
Segment profit down 3% as a result of: Lower volume, primarily in Mining as discussed above, was partially offset by deflation and cost productivity.
|
Segment revenues up $0.3 billion (5%) as a result of: Higher volume ($0.3 billion), due to 2012 acquisitions (primarily Industrea).
Segment profit up $0.1 billion (13%) as a result of: Material deflation ($0.1 billion), higher volume and productivity. |
GE 2014 FORM 10-K 49
MD&A | SEGMENT OPERATIONS | APPLIANCES & LIGHTING |
 APPLIANCES & LIGHTING
 BUSINESS OVERVIEW
Leaders: Chip Blankenship & Maryrose Sylvester |
Headquarters & Operations | |||

| President & CEO, Appliances Over 20 years of service with General Electric
President & CEO, Lighting Over 25 years of service with General Electric | 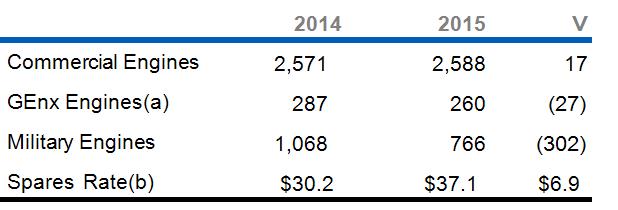 | 5% of segment revenues in 2014 7% of industrial segment revenues 2% of industrial segment profit Appliances HQ: Louisville, KY Lighting HQ: East Cleveland, OH Serving customers in 100+ countries Employees: approximately 24,000 | |
Products & Services | |||
| Appliances & Lighting products, such as major appliances and a subset of lighting products, are primarily directed to consumer applications, while other lighting products are directed towards commercial and industrial applications. We also invest in the development of differentiated, premium products such as energy efficient solutions for both consumers and businesses.
| ||
| Appliances – sells and services major home appliances including refrigerators, freezers, electric and gas ranges, cooktops, dishwashers, clothes washers and dryers, microwave ovens, room air conditioners, residential water systems for filtration, softening and heating and hybrid water heaters. Our brands include GE Monogram®, GE Café™, GE Profile™, GE®, GE Artistry™, and Hotpoint®. We also manufacture certain products and source finished product and component parts from third-party global manufacturers. A large portion of appliances sales are through a variety of retail outlets for replacement of installed units. Residential building contractors installing units in new construction is the second major U.S. channel. We offer one of the largest original equipment manufacturer (OEM) service organizations in the appliances industry, providing in-home repair and aftermarket parts. |
| Lighting – manufactures, sources and sells a variety of energy-efficient solutions for commercial, industrial, municipal and consumer applications across the globe, utilizing light-emitting diode (LED), fluorescent, halogen and high-intensity discharge (HID) technologies. In addition to growing our LED breadth, the business is focused on building lighting connected by state-of-the-art software that will unleash a whole new potential for how we light our world. The business sells products under the reveal® and Energy Smart® consumer brands, and Evolve™, GTx™, Immersion™, Infusion™, Lumination™, Albeo™, TriGain™, and Tetra® commercial brands. GE Lighting offers a full range of solutions and services to outfit entire properties with lighting, from ceilings, parking lots, signage, displays, roadways, sports arenas and other areas. |
Competition & Regulation |
Cost control, including productivity, is key in the highly competitive marketplace in which Appliances & Lighting competes. GE Lighting operates in a complex, global marketplace. Energy regulations impacting traditional lighting technologies are moving demand to energy-saving products that last longer and cost less to operate over time. Evolving these technologies, as well as cost control, is key in the global arena in which the business operates.
GE 2014 FORM 10-K 50
MD&A | SEGMENT OPERATIONS | APPLIANCES & LIGHTING |
OPERATIONAL OVERVIEW
(Dollar in billions)
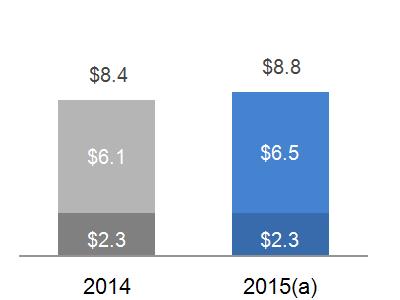
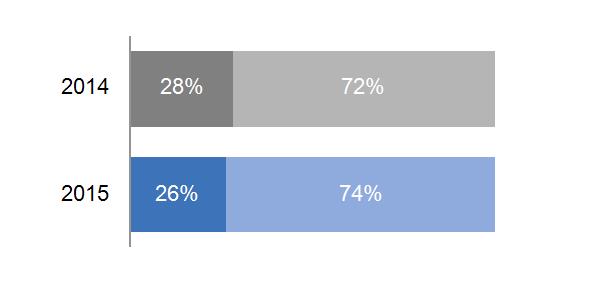
2014 GEOGRAPHIC REVENUES: $8.4 BILLION | 2014 SUB-SEGMENT REVENUES | ||
 |  | ||
SIGNIFICANT TRENDS & DEVELOPMENTS | |||
During the third quarter of 2014, GE signed an agreement to sell its Appliances business to Electrolux for $3.3 billion. The transaction has been approved by the boards of directors of GE and Electrolux and remains subject to customary closing conditions and regulatory approvals, and is targeted to close in mid-2015. While the demand in the professional non-LED market segment is slowing, there is a strong global shift to energy efficient lighting including continued growth in LED products.
FINANCIAL OVERVIEW
| |||
SEGMENT REVENUES & PROFIT | SEGMENT PROFIT MARGIN | ||
 - - Revenue - - Profit
|  | ||
COMMENTARY: 2014 – 2013 |
2013 – 2012 | ||
Segment revenues up $0.1 billion (1% ) as a result of: Higher volume ($0.1 billion) driven by higher sales at Appliances.
Segment profit up $0.1 billion (13%) as a result of : Improved productivity ($0.1 billion) including the effects of classifying Appliances as a business held for sale in the third quarter of 2014. |
Segment revenues up $0.4 billion (5%) as a result of: Higher volume ($0.4 billion) driven by higher sales at Appliances.
Segment profit up $0.1 billion (23%) as a result of : Improved productivity ($0.1 billion) and higher prices. | ||
GE 2014 FORM 10-K 51
MD&A | SEGMENT OPERATIONS | GE CAPITAL |
 GE CAPITAL
 BUSINESS OVERVIEW
Leader: Keith Sherin | Headquarters & Operations | ||||

| Vice Chairman GE, and Chairman & CEO, GE Capital Over 30 years of service with General Electric | 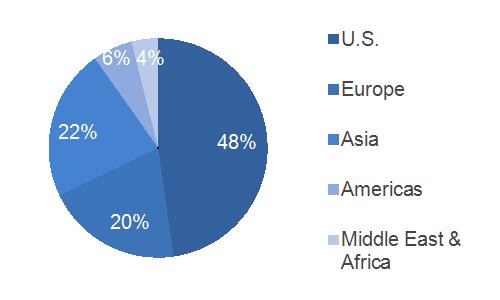 | 28% of segment revenues in 2014 Headquarters: Norwalk, CT Serving customers in 70+ countries Employees: approximately 47,000 | ||
Products & Services | |||||
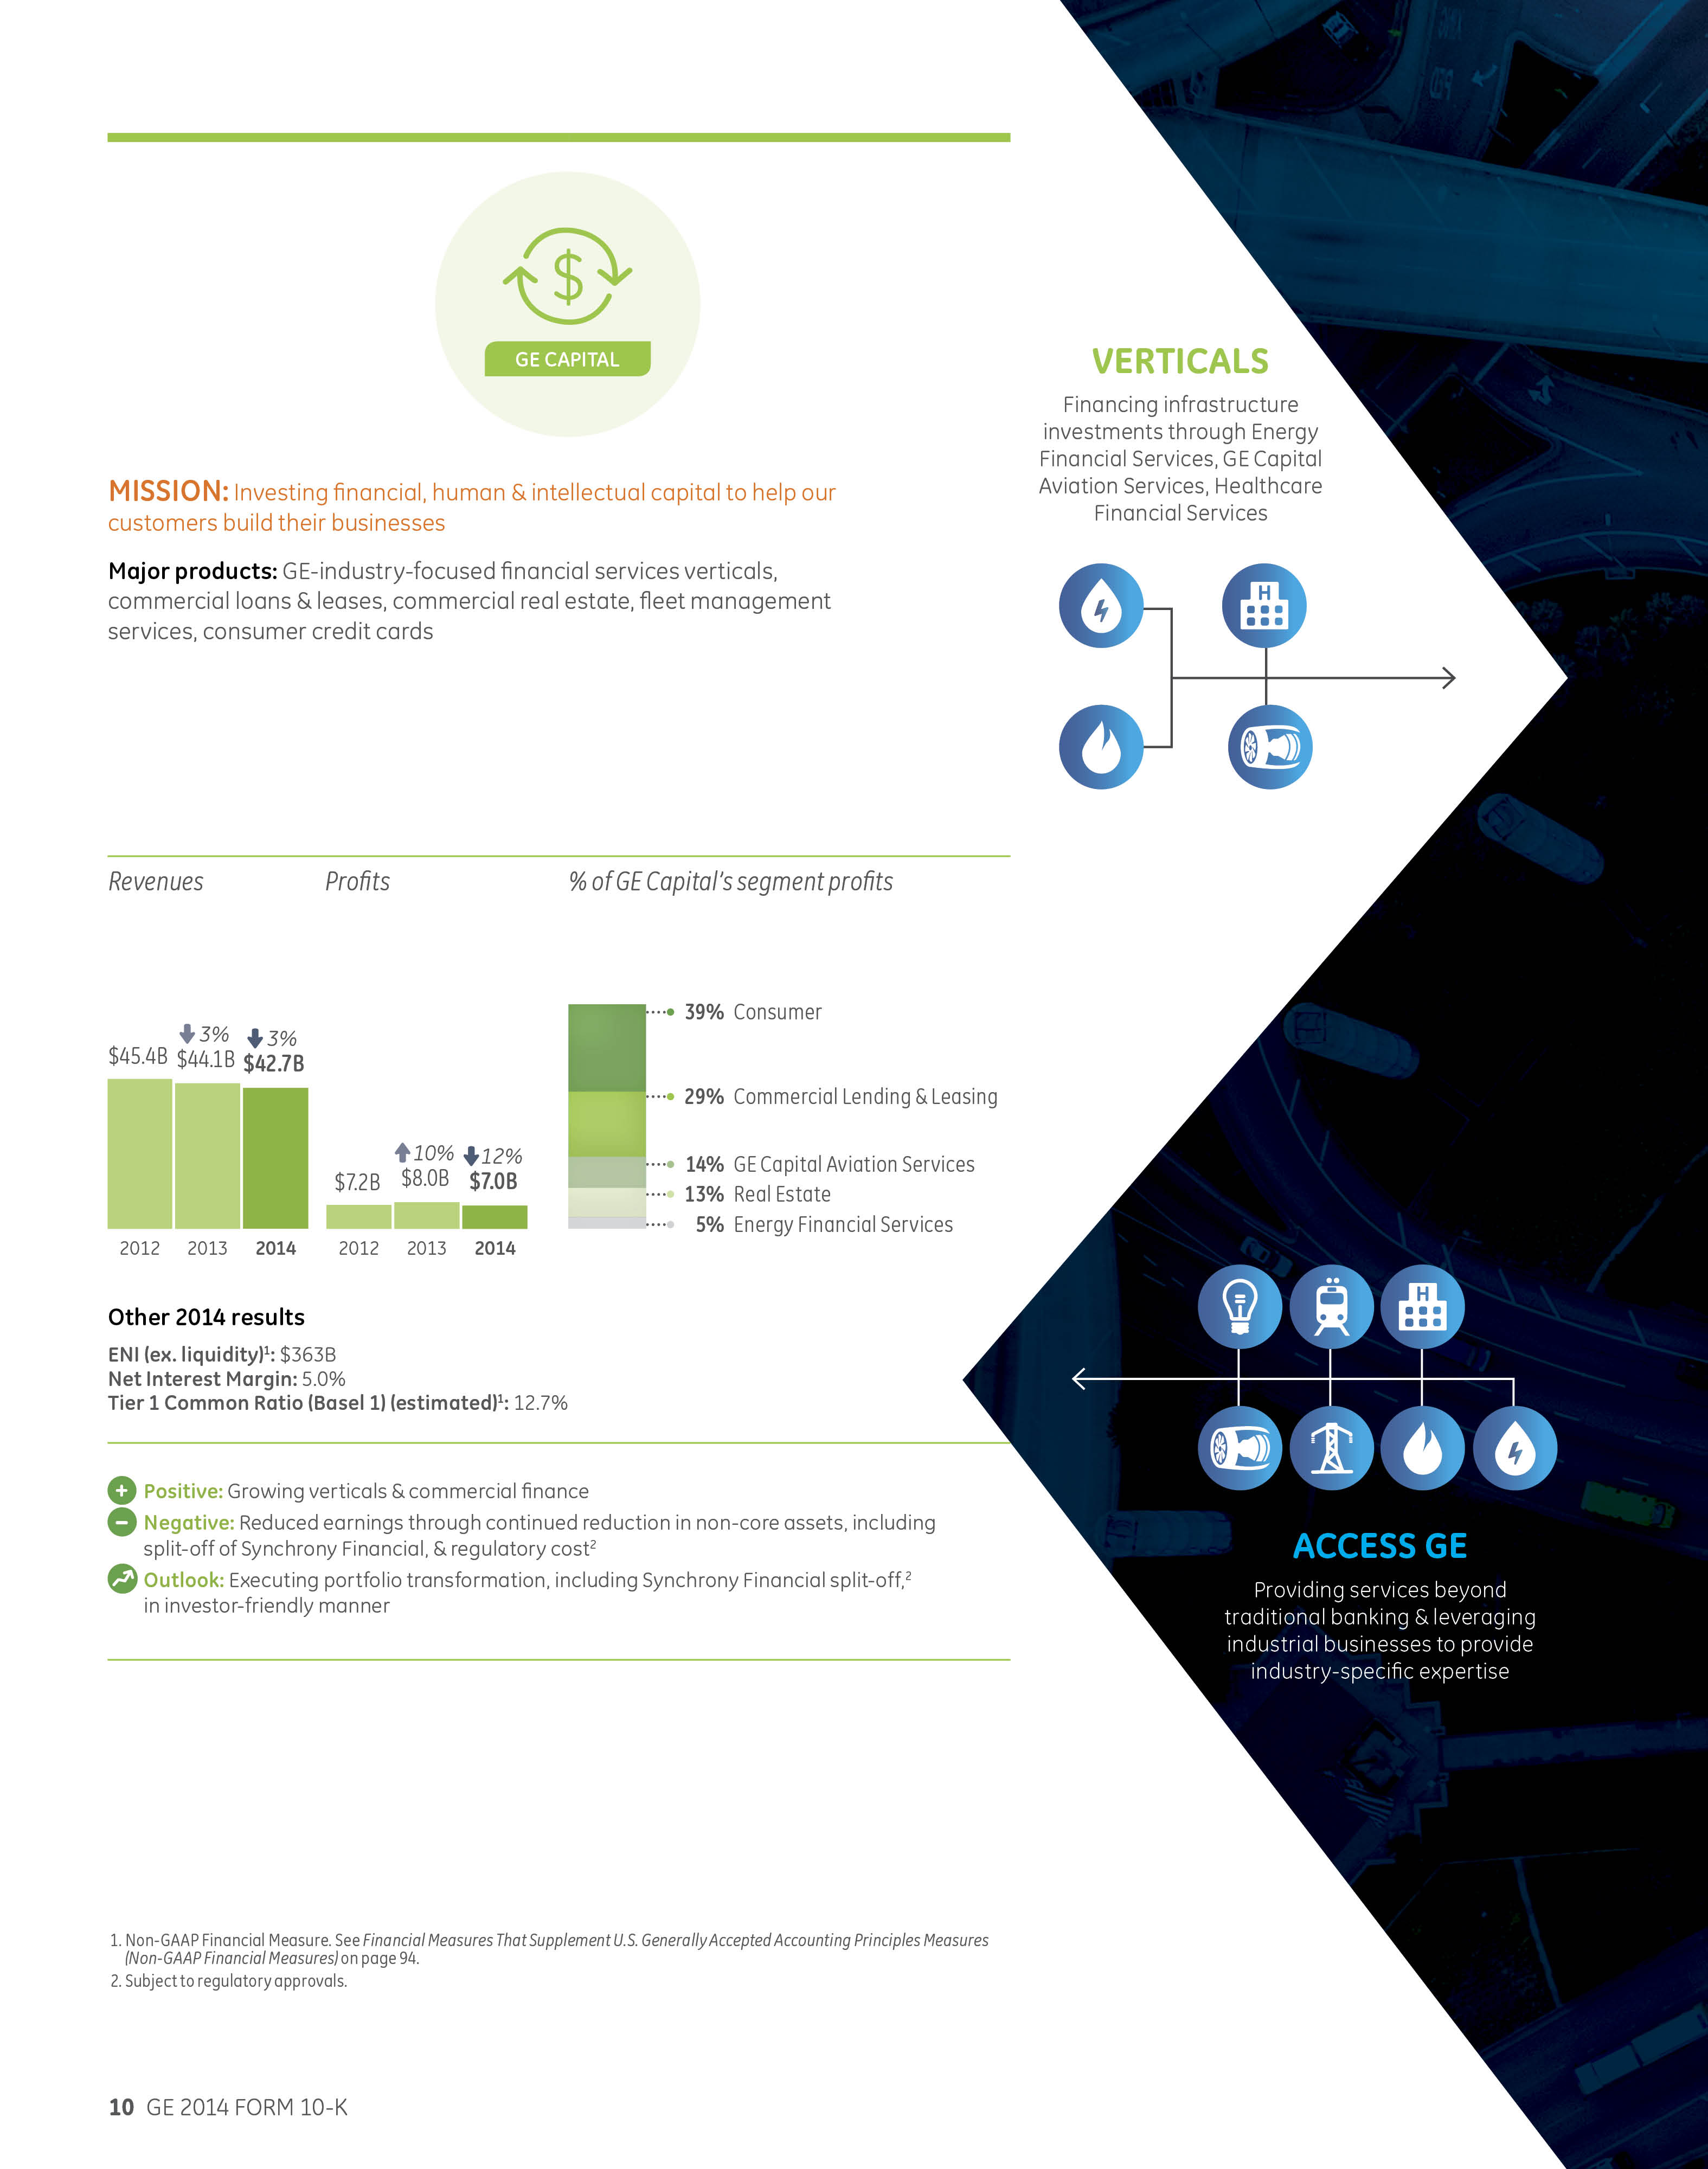
GE Capital businesses offer a broad range of financial services and products worldwide for businesses of all sizes. Services include commercial loans and leases, fleet management, financial programs, credit cards, personal loans and other financial services. GE Capital also develops strategic partnerships and joint ventures that utilize GE's industry-specific expertise in aviation, energy, infrastructure and healthcare to capitalize on market-specific opportunities. Products and services are offered through the following businesses: | |||||
| Commercial Lending and Leasing ( CLL) – has particular mid-market expertise, and primarily offers secured commercial loans, equipment financing and other financial services to companies across a wide range of industries including construction, retail, manufacturing, transportation, media, communications, technology and healthcare. Equipment financing activities include industrial, medical, fleet vehicles, construction, office imaging and many other equipment types. |
| Consumer – offers a full range of financial products including private-label credit cards; personal loans; bank cards; auto loans and leases; mortgages; debt consolidation; home equity loans; deposit and other savings products; and small and medium enterprise lending on a global basis. |
| Real Estate – offers a range of capital and investment solutions, including fixed and floating rate mortgages for new acquisitions or re-capitalizations of commercial real estate worldwide. Our business finances with loan structures; the acquisition, refinancing and renovation of office buildings, apartment buildings, retail facilities, hotels, warehouses and industrial properties. |
| Energy Financial Services – invests in long-lived, capital intensive energy projects and companies by providing structured equity, debt, leasing, partnership financing, project finance and broad-based commercial finance. |
| GE Capital Aviation Services (GECAS) – our commercial aircraft financing and leasing business, offers a wide range of aircraft types and financing options, including operating leases and secured debt financing, and also provides productivity solutions including spare engine leasing, airport and airline consulting services, and spare parts financing and management. |
Competition & Regulation |
The businesses in which we engage are subject to competition from various types of financial institutions, including commercial banks, thrifts, investment banks, broker-dealers, credit unions, leasing companies, consumer loan companies, independent finance companies, finance companies associated with manufacturers and insurance and reinsurance companies.
GECC is a regulated savings and loan holding company under U.S. law, subject to Federal Reserve Board (FRB) supervision. In 2013, the U.S. Financial Stability Oversight Council (FSOC) designated GECC as a nonbank systemically important financial institution (nonbank SIFI) under the Dodd-Frank Wall Street Reform and Consumer Protection Act (See Regulations and Supervision for additional information).
GE 2014 FORM 10-K 52
MD&A | SEGMENT OPERATIONS | GE CAPITAL |
OPERATIONAL OVERVIEW
(Dollars in billions)
2014 GEOGRAPHIC REVENUES: $42.7 BILLION | NET INTEREST MARGIN | ||
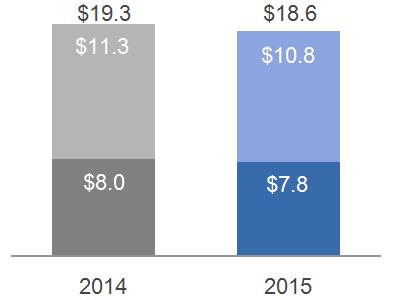 | 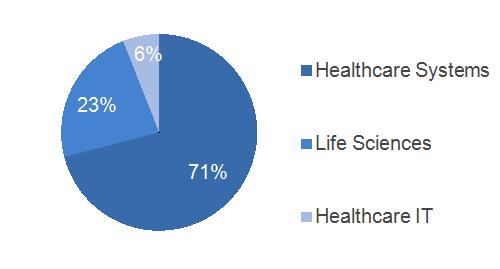 | ||
2014 SUB-SEGMENT REVENUES | TIER 1 COMMON RATIO ESTIMATE* | ||
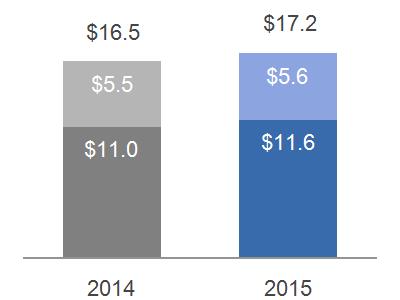 | 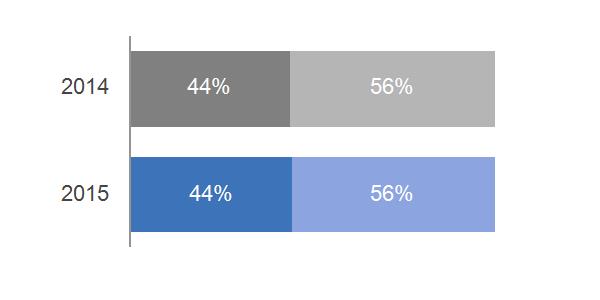 | ||
ENDING NET INVESTMENT, EXCLUDING LIQUIDITY* |
DIVIDENDS RETURNED TO PARENT IN 2014 | ||
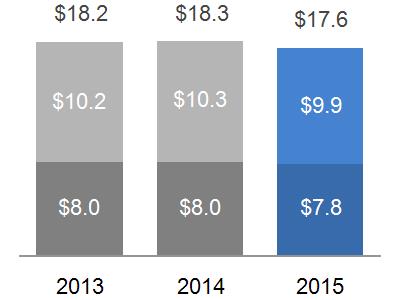 |
Quarterly Dividends $2.0 billion
Special Dividends $1.0 billion
Total $3.0 billion | ||
* Non-GAAP Financial Measure
GE 2014 FORM 10-K 53
MD&A | SEGMENT OPERATIONS | GE CAPITAL |
SIGNIFICANT TRENDS & DEVELOPMENTS |
ENDING NET INVESTMENT
We have communicated our goal of reducing GE Capital's ENI, excluding liquidity, most recently targeting a balance of less than $300 billion. ENI is a metric used by us to measure the total capital we have invested in our financial services business. GE Capital's ENI (excluding liquidity) was $363 billion at December 31, 2014. To achieve this goal, we are more aggressively focusing our businesses on selective financial services products where we have deep domain experience, broad distribution, the ability to earn a consistent return on capital and are competitively advantaged, while managing our overall balance sheet size and risk. We have a strategy of exiting those businesses that are deemed to be non-strategic or that are underperforming. We have completed a number of dispositions in our businesses in the past and will continue to evaluate options going forward.
Accordingly, in the short-term, as we reduce our ENI through exiting non-core businesses, the overall level of our net earnings may be reduced, which potentially could include impairments, restructurings and other non-cash charges. However, over the long-term, we believe that this strategy will improve our long-term performance through higher returns as we will have a larger concentration of assets in our core businesses, as opposed to the underperforming or non-strategic assets we will be exiting; reduce liquidity risk as we pay down outstanding debt and diversify our sources of funding (with less reliance on the global commercial paper markets and an increase in alternative sources of funding such as deposits); and reduce capital requirements while strengthening capital ratios. Additional information about our liquidity and how we manage this risk can be found in the Financial Resources and Liquidity section of this Form 10-K Report.
The actions below are consistent with our strategy of reducing GECC ENI and investing in our core businesses.
OTHER TRENDS & DEVELOPMENTS
| Milestone Aviation – On January 30, 2015, GECAS acquired Milestone Aviation Group, a helicopter leasing business, for approximately $1.8 billion. |
| Budapest Bank – During the fourth quarter of 2014, we signed an agreement to sell our consumer finance business Budapest Bank to Hungary's government. |
| GEMB – Nordic – During the fourth quarter of 2014, we completed the sale of GE Money Bank AB, our consumer finance business in Sweden, Denmark and Norway (GEMB – Nordic) to Santander for proceeds of $2.3 billion. |
| Synchrony Financial – On August 5, 2014, we completed the initial public offering (IPO) of our North American Retail Finance business, Synchrony Financial, as a first step in a planned, staged exit from that business. Synchrony Financial closed the IPO of 125 million shares of common stock at a price to the public of $23.00 per share and on September 3, 2014, Synchrony Financial issued an additional 3.5 million shares of common stock pursuant to an option granted to the underwriters in the IPO (Underwriters' Option). We received net proceeds from the IPO and the Underwriters' Option of $2.8 billion, which remain at Synchrony Financial. Following the closing of the IPO and the Underwriters' Option, we currently own approximately 85% of Synchrony Financial and as a result, GECC continues to consolidate the business. The 15% is presented as noncontrolling interests. In addition, in August 2014, Synchrony Financial completed issuances of $3.6 billion of senior unsecured debt with maturities up to 10 years and $8.0 billion of unsecured term loans maturing in 2019, and in October 2014 completed issuances of $0.8 billion unsecured term loans maturing in 2019 under the New Bank Term Loan Facility with third party lenders. Subsequent to December 31, 2014 through February 13, 2015, Synchrony Financial issued an additional $1.0 billion of senior unsecured debt maturing in 2020. |
We are targeting to complete our exit from Synchrony Financial through a split-off transaction, by making a tax-free distribution of our remaining interest in Synchrony Financial to electing GE stockholders in exchange for shares of GE's common stock. The split-off transaction would be subject to obtaining required bank regulatory approvals. We may also decide to exit by selling or otherwise distributing or disposing of all or a portion of our remaining interest in the Synchrony Financial shares.
GE 2014 FORM 10-K 54
MD&A | SEGMENT OPERATIONS | GE CAPITAL |
| Cembra – During the fourth quarter of 2013, we completed the sale of 68.5% of our Swiss consumer finance bank, Cembra Money Bank AG (Cembra), through an IPO. |
| CLL Trailer Services – During the fourth quarter of 2013, we also completed the sale of our CLL trailer services business in Europe (CLL Trailer Services). |
| Consumer – During the fourth quarter of 2013, we completed the sale of our remaining equity interest in the Bank of Ayudhya (Bay Bank). We also committed to sell our consumer banking business in Russia (Consumer Russia) and completed the transaction in the first quarter of 2014. |
| MetLife Bank – During the first quarter of 2013, we acquired the deposit business of MetLife Bank, N.A., which is an online banking platform with approximately $6.4 billion in U.S. retail deposits that is now part of Synchrony Financial. |
| Real Estate – During 2013 and 2014, in conjunction with our initiative to increase our overall real estate lending portfolio and reduce our exposure to real estate equity investments, we acquired certain loan portfolios and sold real estate equity investments when economically advantageous for us to do, including the 2013 sale of real estate comprising certain floors located at 30 Rockefeller Center, New York. |
| Business Property – During 2012, we completed the sale of a portion of our Real Estate Business Properties portfolio (Business Property), including certain commercial loans, the origination and servicing platforms and the servicing rights on loans previously securitized by GECC. The portion that we retained comprises our owner-occupied/credit tenant portfolio. |
| Consumer Ireland – During 2012, we completed the sale of our consumer mortgage lending business in Ireland (Consumer Ireland) and sold our remaining equity interest in Garanti Bank, which was classified as an available-for-sale security. |
| U.S. Customer Base – During 2014, GE Capital provided approximately $116 billion of new financings in the U.S. to various companies, infrastructure projects and municipalities. Additionally, we extended approximately $115 billion of credit to approximately 64 million U.S. consumers. GE Capital provided credit to approximately 29,700 new commercial customers and 33,700 new small businesses in the U.S. during 2014, ending the year with outstanding credit to more than 250,000 commercial customers and 220,000 small businesses through retail programs in the U.S. |
GE 2014 FORM 10-K 55
MD&A | SEGMENT OPERATIONS | GE CAPITAL |
FINANCIAL OVERVIEW
(Dollars in billions)
SEGMENT REVENUES & PROFIT(a) | ||
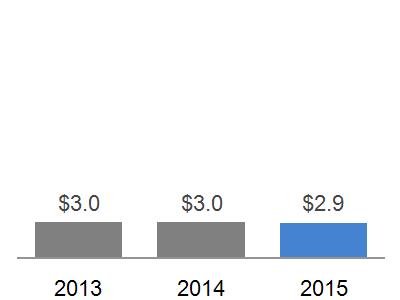 | ||
- - Revenue - - Profit
| ||
(a) Interest and other financial charges and income taxes are included in determining segment profit for the GE Capital segment. | ||
COMMENTARY: 2014 – 2013 | ||
Revenues decreased 3% as a result of the effects of dispositions, organic revenue declines, primarily due to lower ENI, and lower gains, partially offset by lower impairments.
| CLL 2014 revenues increased by $0.3 billion, or 2%, as a result of lower impairments ($0.8 billion), partially offset by organic revenue declines ($0.3 billion) and the effects of dispositions ($0.2 billion). |
| Consumer 2014 revenues decreased by $0.7 billion, or 5%, as a result of lower gains ($0.6 billion) and the effects of dispositions ($0.3 billion), partially offset by organic revenue growth ($0.2 billion) and lower impairments ($0.1 billion). |
| Real Estate 2014 revenues decreased by $0.9 billion, or 24%, as a result of decreases in net gains on property sales ($0.6 billion) mainly due to the 2013 sale of real estate comprising certain floors located at 30 Rockefeller Center, New York, organic revenue declines ($0.2 billion) and higher impairments ($0.1 billion). |
| Energy Financial Services 2014 revenues increased by $0.2 billion, or 11% as a result of organic revenue growth ($0.4 billion) and higher gains ($0.1 billion), partially offset by the effects of dispositions ($0.2 billion) and higher impairments ($0.2 billion). |
| GECAS 2014 revenues decreased by $0.1 billion, or 2%, as a result of organic revenue declines ($0.2 billion), partially offset by higher gains ($0.1 billion). |
Segment profit decreased 12% as a result of the effects of dispositions, core decreases and lower gains, partially offset by lower impairments and lower provisions for losses on financing receivables.
| CLL 2014 net earnings increased by $0.3 billion, or 16%, reflecting lower impairments ($0.7 billion) and lower provisions for losses on financing receivables ($0.2 billion), partially offset by core decreases ($0.4 billion) and the effects of dispositions ($0.2 billion). |
| Consumer 2014 net earnings decreased by $1.3 billion, or 30%, as a result of the effects of dispositions ($0.8 billion) reflecting the 2013 sale of a portion of Cembra and the 2014 sale of GEMB-Nordic, core decreases ($0.5 billion) and lower gains ($0.4 billion) reflecting the 2013 sale of our remaining equity interest in Bay Bank, partially offset by higher provisions for losses on financing receivables ($0.3 billion) and lower impairments ($0.1 billion). |
| Real Estate 2014 net earnings decreased by $0.7 billion, or 42%, as a result of core decreases ($0.7 billion) including lower tax benefits ($0.4 billion) and lower gains on property sales ($0.3 billion). |
GE 2014 FORM 10-K 56
MD&A | SEGMENT OPERATIONS | GE CAPITAL |
|
|
| Energy Financial Services 2014 net earnings decreased slightly as a result of higher impairments ($0.1 billion) and the effects of dispositions ($0.1 billion) offset by core increases ($0.1 billion) and higher gains ($0.1 billion). |
| GECAS 2014 net earnings increased by $0.2 billion, or 17%, as a result of lower equipment leased to others (ELTO) impairments ($0.2 billion) related to our operating lease portfolio of commercial aircraft, and higher gains, partially offset by core decreases ($0.1 billion). |
COMMENTARY: 2013 – 2012 |
Revenues decreased 3% as a result of organic revenue declines, primarily due to lower ENI, and higher impairments, partially offset by higher gains.
| CLL 2013 revenues decreased by $2.1 billion, or 13%, as a result of organic revenue declines ($1.2 billion), primarily due to lower ENI ($0.8 billion), higher impairments ($0.7 billion) and the effects of dispositions ($0.1 billion). |
| Consumer 2013 revenues increased by $0.4 billion, or 3%, as a result of higher gains ($0.5 billion), the effects of dispositions ($0.3 billion) and the effects of acquisitions ($0.1 billion), partially offset by organic revenue declines ($0.4 billion). |
| Real Estate 2013 revenues increased by $0.3 billion, or 7%, as a result of increases in net gains on property sales ($1.1 billion) mainly due to the sale of real estate comprising certain floors located at 30 Rockefeller Center, New York, partially offset by organic revenue declines ($0.7 billion), primarily due to lower ENI ($0.6 billion). |
| Energy Financial Services 2013 revenues increased slightly, or 1%, as a result of dispositions ($0.1 billion) and organic revenue growth ($0.1 billion), partially offset by lower gains ($0.1 billion) and higher impairments. |
| GECAS 2013 revenues increased by $0.1 billion, or 1%, as a result of lower finance lease impairments and higher gains. |
Segment profit increased 10% as a result of dispositions, primarily related to the sale of a portion of Cembra through an IPO and higher gains primarily related to the sale of our remaining equity interest in Bay Bank, partially offset by higher impairments and higher provisions for losses on financing receivables.
| CLL 2013 net earnings decreased by $0.4 billion, or 18%, reflecting higher impairments ($0.6 billion), partially offset by the effects of dispositions ($0.1 billion). |
| Consumer 2013 net earnings increased by $1.1 billion, or 35%, as a result of the sale of a portion of Cembra ($1.2 billion), higher gains ($0.3 billion) related to the sale of Bay Bank and core increases ($0.1 billion). These increases were partially offset by higher provisions for losses on financing receivables ($0.5 billion) reflecting the use of a more granular portfolio segmentation approach, by loss type, in determining the incurred loss period and projected net write-offs over the next 12 months in our installment and revolving credit portfolios. |
| Real Estate 2013 net earnings increased favorably as a result of core increases ($0.9 billion) including increases in net gains on property sales ($0.7 billion) and higher tax benefits ($0.3 billion). |
| Energy Financial Services 2013 net earnings decreased slightly, or 5%, as a result of lower gains ($0.1 billion), partially offset by core increases and dispositions. |
| GECAS 2013 net earnings decreased by $0.3 billion, or 27%, as a result of ELTO impairments ($0.3 billion) related to our operating lease portfolio of commercial aircraft, and core decreases, partially offset by higher gains. |
For additional information related to GE Capital segment operations, refer to the General Electric Capital Corporation annual report on Form 10-K for the year ended December 31, 2014.
GE 2014 FORM 10-K 57
MD&A | CORPORATE ITEMS AND ELIMINATIONS |
GE CORPORATE ITEMS AND ELIMINATIONS
GE Corporate Items and Eliminations is a caption used in the segment table on page 31 to reconcile the aggregated results of our segments to the consolidated results of the Company. As such, it includes corporate activities and the elimination of inter-segment activities. Specifically, the GE Corporate Items and Eliminations amounts related to revenues and earnings include the results of disposed businesses (such as NBCU LLC, which we sold in 2013), certain amounts not included in GE industrial operating segment results because they are excluded from measurement of their operating performance for internal and external purposes and the elimination of inter-segment activities. In addition, the GE Corporate Items and Eliminations amounts related to earnings include certain costs of our principal retirement plans, restructuring and other costs reported in corporate, and the unallocated portion of certain corporate costs (such as research and development spending and costs related to our Global Growth & Operations organization).
REVENUES AND OPERATING PROFIT (COST) | |||||||||
(In millions) | 2014 | 2013 | 2012 | ||||||
Revenues | |||||||||
NBCU LLC | $ | - | $ | 1,528 | $ | 1,615 | |||
Gains (losses) on disposed or held for sale businesses | 91 | 453 | 186 | ||||||
Eliminations and other | (4,129) | (3,605) | (3,292) | ||||||
Total Corporate Items and Eliminations | $ | (4,038) | $ | (1,624) | $ | (1,491) | |||
Operating profit (cost) | |||||||||
NBCU LLC | $ | - | $ | 1,528 | $ | 1,615 | |||
Gains (losses) on disposed or held for sale businesses | 91 | 447 | 186 | ||||||
Principal retirement plans(a) | (2,313) | (3,222) | (3,098) | ||||||
Restructuring and other charges | (1,788) | (1,992) | (732) | ||||||
Eliminations and other | (2,215) | (2,763) | (2,689) | ||||||
Total Corporate Items and Eliminations | $ | (6,225) | $ | (6,002) | $ | (4,718) | |||
CORPORATE COSTS | |||||||||
(In millions) | 2014 | 2013 | 2012 | ||||||
Total Corporate Items and Eliminations | $ | (6,225) | $ | (6,002) | $ | (4,718) | |||
Less non-operating pension cost | (2,120) | (2,624) | (2,132) | ||||||
Total Corporate costs (operating) * | $ | (4,105) | $ | (3,378) | $ | (2,586) | |||
Less NBCU LLC, restructuring and other, and gains | (1,697) | (17) | 1,069 | ||||||
Adjusted total Corporate costs (operating) * | $ | (2,408) | $ | (3,361) | $ | (3,655) | |||
(a) | Included non-operating pension income (cost) for our principal pension plans (non-GAAP) of $(2.1) billion, $(2.6) billion and $(2.1) billion in 2014, 2013 and 2012, respectively, which includes expected return on plan assets, interest costs and non-cash amortization of actuarial gains and losses. |
.
*Non-GAAP Financial Measure
GE 2014 FORM 10-K 58
MD&A | CORPORATE ITEMS AND ELIMINATIONS |
2014 – 2013 COMMENTARY
Revenues and other income decreased $2.4 billion, primarily a result of:
| $1.5 billion lower revenues and other income related to NBCU LLC, which was disposed of in the first quarter of 2013, |
| $0.4 billion of lower gains from disposed businesses, and |
| $0.5 billion of higher eliminations and other, which was driven by $0.4 billion of higher inter-segment eliminations. Also contributing to the decrease in revenues and other income was a $0.2 billion impairment related to an investment security in 2014 compared with a $0.1 billion impairment of an investment in a Brazilian company in 2013. |
Operating costs increased $0.2 billion, primarily as a result of:
| $1.5 billion lower NBCU LLC related income, and |
| $0.4 billion of lower gains from disposed businesses. |
These increases to operating costs were partially offset by the following:
| $0.9 billion of lower costs of our principal retirement plans, |
| $0.2 billion of lower restructuring and other charges. Restructuring and other charges in 2014 included $0.2 billion of impairment related to an investment security at Power & Water, $0.1 billion of asset write-offs at a consolidated nuclear joint venture in which we hold a 51% interest at Power & Water and $0.1 billion curtailment loss on the principal retirement plans resulting from our agreement with Electrolux to sell the Appliances business, and |
| $0.5 billion of lower eliminations and other, which was driven by $0.4 billion of lower corporate costs, which include research and development and functional spending in 2014. In 2013, eliminations and other costs included $0.1 billion impairment of an investment in a Brazilian company. |
2013 – 2012 COMMENTARY
Revenues decreased $0.1 billion primarily as a result of:
| $0.1 billion lower revenue and other income related to the operations and disposition of NBCU LLC, |
| $0.3 billion of higher gains from disposed businesses, which reflects the net effect of $0.5 billion of gains from industrial business dispositions in 2013 compared with a $0.3 billion gain on joint venture formation and a $0.1 billion loss on sale of a plant in 2012, and |
| $0.3 billion of higher eliminations and other, which reflects a $0.1 billion pre-tax loss related to the impairment of an investment in a Brazilian company and $0.2 billion of lower revenues related to a plant that was sold in 2012. |
Operating costs increased $1.3 billion primarily as a result of:
| $0.1 billion of lower NBCU LLC related income, |
| $0.1 billion of higher principal retirement plan costs, |
| $1.3 billion of higher restructuring and other charges, and |
| $0.1 billion of higher eliminations and other, which reflects the $0.1 billion of impairment referred to above. |
These increases to operating costs were partially offset by $0.3 billion of higher gains on disposed businesses.
GE 2014 FORM 10-K 59
MD&A | CORPORATE ITEMS AND ELIMINATIONS |
COSTS AND GAINS NOT INCLUDED IN SEGMENT RESULTS
As discussed in the "Segment Operations" section within the MD&A of this Form 10-K Report, certain amounts are not included in industrial operating segment results because they are excluded from measurement of their operating performance for internal and external purposes. These amounts are included in GE Corporate Items & Eliminations and may include matters such as charges for restructuring; rationalization and other similar expenses; acquisition costs and related charges; technology and product development cost; certain gains and losses from acquisitions or dispositions; and litigation settlements or other charges, for which responsibility preceded the current management team. The amount of costs and gains not included in segment results follows.
COSTS | ||||||||
(In billions) | 2014 | 2013 | 2012 | |||||
Power & Water | $ | 0.6 | $ | 0.4 | $ | 0.2 | ||
Oil & Gas | 0.3 | 0.3 | 0.1 | |||||
Energy Management | 0.2 | 0.2 | 0.2 | |||||
Aviation | 0.3 | 0.6 | 0.3 | |||||
Healthcare | 0.5 | 0.6 | 0.5 | |||||
Transportation | - | 0.1 | 0.1 | |||||
Appliances & Lighting | 0.1 | 0.2 | 0.1 | |||||
Total | $ | 2.1 | $ | 2.4 | $ | 1.5 | ||
GAINS | ||||||||
(In billions) | 2014 | 2013 | 2012 | |||||
Power & Water(a) | $ | - | $ | 0.1 | $ | - | ||
Oil & Gas(b) | 0.1 | 0.1 | - | |||||
Energy Management | - | - | - | |||||
Aviation(c) | - | - | 0.3 | |||||
Healthcare(a) | - | 0.2 | - | |||||
Transportation | - | - | - | |||||
Appliances & Lighting | - | - | - | |||||
Total | $ | 0.1 | $ | 0.5 | $ | 0.3 | ||
(a) | Related to business dispositions. |
(b) | Related to business dispositions including a fuel dispenser business disposition in 2014. |
(c) | Related to formation of a joint venture. |
GE 2014 FORM 10-K 60
MD&A | DISCONTINUED OPERATIONS |
DISCONTINUED OPERATIONS
Discontinued operations primarily comprises GE Money Japan (our Japanese personal loan business, Lake, and our Japanese mortgage and card businesses, excluding our investment in GE Nissen Credit Co., Ltd.), our U.S. mortgage business (WMC), our CLL trailer services business in Europe (CLL Trailer Services), our Consumer banking business in Russia (Consumer Russia) and our Consumer mortgage lending business in Ireland (Consumer Ireland). All of these operations were previously reported in the GE Capital segment.
Associated results of operations, financial position and cash flows are separately reported as discontinued operations for all periods presented.
FINANCIAL INFORMATION FOR DISCONTINUED OPERATIONS | ||||||||
(In millions) | 2014 | 2013 | 2012 | |||||
Earnings (loss) from discontinued operations, net of taxes | $ | (112) | $ | (2,120) | $ | (983) | ||
The 2014 loss from discontinued operations, net of taxes, primarily reflected the following:
| $0.2 billion after-tax effect of incremental reserves related to retained representation and warranty obligations to repurchase previously sold loans on the 2007 sale of WMC. |
| 2014 losses were partially offset by a $0.1 billion tax benefit related to the extinguishment of our loss-sharing arrangement for excess interest claims associated with the 2008 sale of GE Money Japan. |
The 2013 loss from discontinued operations, net of taxes, primarily reflected the following:
| $1.6 billion after-tax effect of incremental reserves, primarily related to an agreement to extinguish our loss-sharing arrangement for excess interest claims associated with the 2008 sale of GE Money Japan, |
| $0.2 billion after-tax effect of incremental reserves related to retained representation and warranty obligations to repurchase previously sold loans on the 2007 sale of WMC, and |
| $0.2 billion after-tax loss on the planned disposal of Consumer Russia. |
The 2012 loss from discontinued operations, net of taxes, primarily reflected the following:
| $0.6 billion after-tax effect of incremental reserves for excess interest claims related to our loss-sharing arrangement on the 2008 sale of GE Money Japan, |
| $0.3 billion after-tax effect of incremental reserves related to retained representation and warranty obligations to repurchase previously sold loans on the 2007 sale of WMC, and |
| $0.2 billion loss (including a $0.1 billion loss on disposal) related to Consumer Ireland. |
| 2012 losses were partially offset by a $0.1 billion tax benefit related to the resolution with the Internal Revenue Service regarding the tax treatment of the 2007 sale of our Plastics business. |
For additional information related to discontinued operations, see Note 2 to the consolidated financial statements in this Form 10-K Report.
GE 2014 FORM 10-K 61
MD&A | OTHER CONSOLIDATED INFORMATION |
OTHER CONSOLIDATED INFORMATION
INTEREST AND OTHER FINANCIAL CHARGES
Interest on borrowings and other financial charges amounted to $9.5 billion, $10.1 billion and $12.4 billion in 2014, 2013 and 2012, respectively. Substantially all of our borrowings are in financial services, where interest expense was $8.4 billion, $9.3 billion and $11.6 billion in 2014, 2013 and 2012, respectively. GECC average borrowings declined from 2013 to 2014 and from 2012 to 2013, in line with changes in average GECC assets. Interest rates have decreased over the three-year period primarily attributable to declining global benchmark interest rates. GECC average borrowings were $364.4 billion, $379.5 billion and $420.0 billion in 2014, 2013 and 2012, respectively. The GECC average composite effective interest rate was 2.3% in 2014, 2.4% in 2013 and 2.8% in 2012. In 2014, GECC average assets of $507.2 billion were 3.0% lower than in 2013, which in turn were 7% lower than in 2012. See the "Liquidity and Borrowings" section within the MD&A of this Form 10-K for a discussion of liquidity, borrowings and interest rate risk management.
POSTRETIREMENT BENEFIT PLANS
Postretirement benefit plans costs were $4.8 billion, $6.0 billion and $5.5 billion in 2014, 2013 and 2012, respectively. Costs decreased in 2014 primarily due to the effects of higher discount rates (principal pension plans' discount rate increased from 3.96% at December 31, 2012 to 4.85% at December 31, 2013) and lower loss amortization related to our principal pension plans, partially offset by lower expected investment return on pension plan assets. Costs increased in 2013 primarily due to the continued amortization of 2008 investment losses and the effects of lower discount rates (principal pension plans' discount rate decreased from 4.21% at December 31, 2011 to 3.96% at December 31, 2012).
Postretirement benefit actuarial assumptions are significant inputs to the actuarial models that measure benefit obligations and their related effects on operations:
| Our discount rate for our principal pension plans at December 31, 2014 was 4.02%, which reflected current interest rates. |
| The Society of Actuaries recently issued new mortality tables projecting longer life expectancies that will result in higher postretirement benefit obligations for U.S. companies. We updated our mortality assumptions at December 31, 2014. The new mortality assumptions increased principal postretirement benefit obligations by approximately $4.6 billion at year end. |
| Considering the current and target asset allocations, as well as historical and expected returns on various categories of assets in which our plans are invested, we have assumed that the long-term return on our principal pension plan assets will be 7.5% for cost recognition in 2015, compared to 7.5% in 2014 and 8.0% in both 2013 and 2012. |
GAAP provides for recognition of differences between assumed and actual experience over a period no longer than the average future service of employees. See the "Critical Accounting Estimates" section within the MD&A of this Form 10-K for additional information.
We expect the costs of our postretirement benefits to increase in 2015 by approximately $0.6 billion as compared to 2014, primarily because of the effects of lower discount rates and new mortality assumptions, which are partially offset by lower loss amortization related to our principal pension plans.
GAAP AND NON-GAAP PENSION COSTS | ||||||||
(In billions) | 2014 | 2013 | 2012 | |||||
GAAP principal pension plans' cost | $ | 3.6 | $ | 4.4 | $ | 3.8 | ||
Non-GAAP operating pension costs* | 1.5 | 1.8 | 1.7 | |||||
* Non-GAAP Financial Measure
GE 2014 FORM 10-K 62
MD&A | OTHER CONSOLIDATED INFORMATION |
Operating earnings include service cost and prior service cost amortization for our principal pension plans as these costs represent expenses associated with employee service. Operating earnings exclude non-operating pension costs/income such as interest cost, expected return on plan assets and non-cash amortization of actuarial gains and losses. We expect operating pension costs for these plans will be about $1.7 billion in 2015. The expected increase in operating pension costs is attributable primarily to the effects of lower discount rates and new mortality assumptions.
The GE Pension Plan was underfunded by $15.8 billion at the end of 2014 as compared to $4.7 billion at December 31, 2013. The GE Supplementary Pension Plan, which is an unfunded plan, had projected benefit obligations (PBO) of $6.6 billion and $5.2 billion at December 31, 2014 and 2013, respectively. Our underfunding at year-end 2014 was significantly higher compared to 2013 primarily due to lower discount rates and new mortality assumptions. The decrease in our principal pension plans' discount rate increased the PBO at year-end 2014 by approximately $7.7 billion. The new mortality assumptions increased our PBO by approximately $4.0 billion at December 31, 2014. Our GE Pension Plan assets were $48.3 billion at the end of both 2014 and 2013 as 2014 investment returns and participant contributions were offset by benefit payments made during the year. Assets of the GE Pension Plan are held in trust, solely for the benefit of Plan participants, and are not available for general company operations.
In August 2014, the U.S. Government enacted the "Highway and Transportation Funding Act "(HATFA), which contained provisions that changed the interest rate methodology used to calculate Employee Retirement Income Security Act (ERISA) minimum pension funding requirements in the U.S. This change reduced our near-term annual cash funding requirements for the GE Pension Plan. We did not contribute to the GE Pension Plan in either 2014 or 2013. On an ERISA basis, our preliminary estimate is that the GE Pension Plan was approximately 104% funded at January 1, 2015. The ERISA funded status is higher than the GAAP funded status primarily because the ERISA prescribed interest rate in HATFA is calculated using an average interest rate. As a result, the ERISA interest rate is higher than the year-end GAAP discount rate. The higher ERISA interest rate lowers pension liabilities for ERISA funding purposes. Our current estimate projects that we will not be required to make minimum pension funding contributions to the GE Pension Plan in 2015 or 2016.
At December 31, 2014, the fair value of assets for our other pension plans was $3.2 billion less than the respective projected benefit obligations. The comparable amount at December 31, 2013, was $2.5 billion. This increase was primarily attributable to lower discount rates, which were partially offset by investment returns. We expect to contribute $0.5 billion to our other pension plans in 2015, as compared to $0.7 billion in both 2014 and 2013.
The unfunded liability for our principal retiree health and life plans was $9.9 billion and $9.0 billion at December 31, 2014 and 2013, respectively. This increase was primarily attributable to the effects of lower discount rates (retiree health and life plans' discount rate decreased from 4.61% at December 31, 2013 to 3.89% at December 31, 2014) and new mortality assumptions, which were partially offset by an amendment to our post-65 retiree health coverage. We fund our retiree health benefits on a pay-as-you-go basis. We expect to contribute $0.5 billion to these plans in 2015 compared with actual contributions of $0.5 billion in both 2014 and 2013.
The funded status of our postretirement benefits plans and future effects on operating results depend primarily on economic conditions and investment performance. For additional information about funded status, components of earnings effects and actuarial assumptions, see Note 12 to the consolidated financial statements in this Form 10-K Report.
INCOME TAXES
Income taxes have a significant effect on our net earnings. As a global commercial enterprise, our tax rates are affected by many factors, including our global mix of earnings, the extent to which those global earnings are indefinitely reinvested outside the United States, legislation, acquisitions, dispositions and tax characteristics of our income. Our tax rates are also affected by tax incentives introduced in the U.S. and other countries in furtherance of policies to encourage and support certain types of activity. Our tax returns are routinely audited and settlements of issues raised in these audits sometimes affect our tax provisions.
GE 2014 FORM 10-K 63
MD&A | OTHER CONSOLIDATED INFORMATION |
GE and GECC file a consolidated U.S. federal income tax return. This enables GE to use GECC tax deductions and credits to reduce the tax that otherwise would have been payable by GE. The GECC effective tax rate for each period reflects the benefit of these tax reductions in the consolidated return. GE makes cash payments to GECC for these tax reductions at the time GE's tax payments are due.
CONSOLIDATED
(Dollars in billions)
EFFECTIVE TAX RATE (ETR) | PROVISION FOR INCOME TAXES | CASH INCOME TAXES PAID | ||
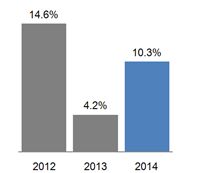
| 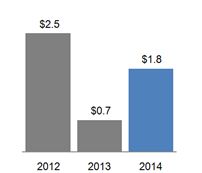 | 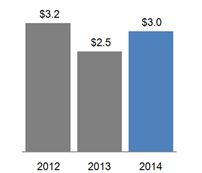 |
2014 – 2013 COMMENTARY
| The increase in the consolidated provision for income taxes was attributable in part to decreased benefits from lower-taxed global operations including the absence of the 2013 benefits related to the sale of 68.5% of our Swiss consumer finance bank, Cembra Money Bank AG (Cembra), through an IPO, partially offset by the benefits from the 2014 tax efficient disposition of GEMB-Nordic. |
| The income tax provision also increased due to the non-repeat of the favorable resolution of audit matters in 2013. |
| The higher income tax provision also reflects an increase in income taxed at rates above the average tax rate. |
2013 – 2012 COMMENTARY
| The decrease in the consolidated provision for income taxes was primarily attributable to an increase in tax benefits on lower-taxed global operations, including the tax benefit on the sale of a portion of Cembra. |
| The income tax provision was also lower due to favorable resolution of audit matters and lower income taxed at rates above the average tax rate. |
| These decreases were partially offset by the absence of the 2012 benefit attributable to the high tax basis in the entity sold in the Business Property disposition. |
On January 2, 2013, the American Taxpayer Relief Act of 2012 was enacted and the law extended several provisions, including a two-year extension of the U.S. tax provision deferring tax on active financial services income and certain U.S. business credits, retroactive to January 1, 2012. Under accounting rules, a tax law change is taken into account in calculating the income tax provision in the period enacted. Because the extension was enacted into law in 2013, tax expense in 2013 reflected retroactive extension of the previously expired provisions.
BENEFITS FROM GLOBAL OPERATIONS
Our consolidated income tax rate is lower than the U.S. statutory rate primarily because of benefits from lower-taxed global operations, including the use of global funding structures. There is a benefit from global operations as non-U.S. income is subject to local country tax rates that are significantly below the 35% U.S. statutory rate. These non-U.S. earnings have been
GE 2014 FORM 10-K 64
MD&A | OTHER CONSOLIDATED INFORMATION |
indefinitely reinvested outside the U.S. and are not subject to current U.S. income tax. The rate of tax on our indefinitely reinvested non-U.S. earnings is below the 35% U.S. statutory rate because we have significant business operations subject to tax in countries where the tax on that income is lower than the U.S. statutory rate and because GE funds the majority of its non-U.S. operations through foreign companies that are subject to low foreign taxes.
The most significant portion of these benefits depends on the provision of U.S. law deferring the tax on active financial services income, which, as discussed below, is subject to expiration. A substantial portion of the remaining benefit related to business operations subject to tax in countries where the tax on that income is lower than the U.S. statutory rate is derived from our GECAS aircraft leasing operations located in Ireland. No other operation in any one country accounts for a material portion of the remaining balance of the benefit.
We expect our ability to benefit from non-U.S. income taxed at less than the U.S. rate to continue, subject to changes in U.S. or foreign law, including the expiration of the U.S. tax law provision deferring tax on active financial services income, as discussed in Note 14 to the consolidated financial statements in this Form 10-K Report . In addition, since this benefit depends on management's intention to indefinitely reinvest amounts outside the U.S., our tax provision will increase to the extent we no longer indefinitely reinvest foreign earnings.
BENEFITS FROM LOWER-TAXED GLOBAL OPERATIONS | ||||||||
(In billions) | 2014 | 2013 | 2012 | |||||
Benefit of lower foreign tax rate on indefinitely reinvested non-U.S. earnings | $ | 2.3 | $ | 2.5 | $ | 1.3 | ||
Benefit of audit resolutions | 0.1 | 0.4 | 0.1 | |||||
Other | 0.8 | 1.1 | 0.8 | |||||
Total | $ | 3.2 | $ | 4.0 | $ | 2.2 | ||
2014 – 2013 COMMENTARY
Our benefits from lower-taxed global operations decreased in 2014 principally because of the absence of the 2013 benefits, previously discussed, on the sale of a portion of Cembra, lower benefits from the realization of prior-year losses and from the resolution of Internal Revenue Service (IRS) audits, partially offset by larger benefits from other indefinitely reinvested earnings including from the 2014 disposition of GEMB-Nordic.
2013 – 2012 COMMENTARY
Our benefits from lower-taxed global operations increased in 2013 principally because of the realization of benefits related to the sale of a portion of Cembra, the realization of benefits for prior-year losses, and the resolution of IRS audits.
OTHER INFORMATION
To the extent global interest rates and non-U.S. operating income increase, we would expect tax benefits to increase, subject to management's intention to indefinitely reinvest those earnings. Included in 2014 is the benefit from the indefinite reinvestment of the eligible earnings from the sale of GEMB-Nordic. Included in 2013 is the benefit from the indefinite reinvestment of the eligible earnings from the sale of a portion of Cembra.
The tax benefit from non-U.S. income taxed at a local country rather than the U.S. statutory tax rate is reported in the caption "Tax on global activities including exports" in the effective tax rate reconciliation in Note 14 to the consolidated financial statements in this Form 10-K Report.
A more detailed analysis of differences between the U.S. federal statutory rate and the consolidated effective rate, as well as other information about our income tax provisions, is provided in the "Critical Accounting Estimates" section within the MD&A and Note 14 to the consolidated financial statements in this Form 10-K Report. The nature of business activities and
GE 2014 FORM 10-K 65
MD&A | OTHER CONSOLIDATED INFORMATION |
associated income taxes differ for GE and for GECC; therefore, a separate analysis of each is presented in the paragraphs that follow.
GE EFFECTIVE TAX RATE (EXCLUDING GECC EARNINGS)*
(Dollars in billions)
We believe that the GE effective tax rate and provision for income taxes are best analyzed in relation to GE earnings before income taxes excluding the GECC net earnings from continuing operations, as GE tax expense does not include taxes on GECC earnings. For further information on this calculation, see the "Supplemental Information" section within the MD&A of this Form 10-K.
GE ETR, EXCLUDING GECC EARNINGS* | GE PROVISION (BENEFIT) FOR INCOME TAXES | |

| 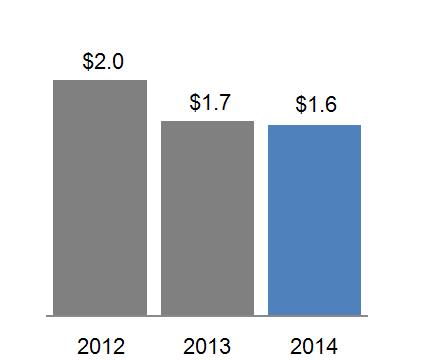 |
2014 – 2013 COMMENTARY
| The GE provision for income taxes decreased in 2014 primarily because of increased benefits from lower taxed global operations ($0.8 billion). |
| That decrease was partially offset by the decrease in the benefit of audit resolutions ($0.3 billion) shown below, an increase in income taxed at rates above the average tax rate ($0.3 billion), and the non-repeat of the 2013 benefit from the enactment of the extension of certain U.S. business credits ($0.1 billion), disclosed above. |
2013 – 2012 COMMENTARY
| The GE provision for income taxes decreased in 2013 primarily because of the benefit of audit resolutions ($0.2 billion) shown below. |
Resolution of audit matters reduced the GE provision for income taxes by $0.1 billion, $0.4 billion and $0.1 billion in 2014, 2013 and 2012, respectively. The effects of such resolutions are included in the following captions in Note 14 to the consolidated financial statements in this Form 10-K Report.
AUDIT RESOLUTIONS - EFFECT ON GE TAX RATE, EXCLUDING GECC EARNINGS | ||||||
2014 | 2013 | 2012 | ||||
Tax on global activities including exports | (0.2) | % | (2.4) | % | (0.7) | % |
U.S. business credits | - | (0.6) | - | |||
All other - net | (0.7) | (1.0) | (0.9) | |||
Total | (0.9) | % | (4.0) | % | (1.6) | % |
* Non-GAAP Financial Measure
GE 2014 FORM 10-K 66
MD&A | OTHER CONSOLIDATED INFORMATION |
GECC EFFECTIVE TAX RATE
(Dollars in billions)
GECC ETR | GECC PROVISION (BENEFIT) FOR INCOME TAXES | ||||||||
2012 | 2013 | 2014 | 2012 | 2013 | 2014 |
| |||
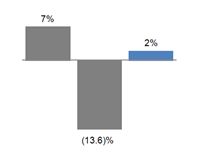
| 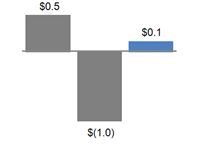 | ||||||||
2014 – 2013 COMMENTARY
| The increase in GECC provision for income taxes of $1.1 billion was primarily attributable to the absence of the significant tax benefit related to the 2013 sale of a portion of Cembra ($1.0 billion). |
| The income tax provision also increased due to decreased benefits from lower-taxed global operations including the absence of the 2013 benefits from enactment of the extension of the U.S. tax provision deferring tax on active financial services income ($0.6 billion). |
| The increase also reflects higher income taxed at rates above the average rate ($0.1 billion). |
| The items increasing tax expense were partially offset by the benefits from the tax efficient disposition of GEMB-Nordic ($0.3 billion), which is reported in the caption "Tax on global activities including exports" in the effective tax rate reconciliation in Note 14 to the consolidated financial statements in this Form 10-K Report. |
2013 – 2012 COMMENTARY
| The decrease in GECC provision for income taxes of $1.5 billion was primarily attributable to increased benefits from lower-taxed global operations ($1.7 billion), including the significant tax benefit related to the sale of a portion of Cembra ($1.0 billion), and the 2013 tax benefits related to the extension of the U.S. tax provision deferring tax on active financial services income ($0.3 billion). |
| The income tax provision also lower due to benefit from the resolution of the IRS audit of the 2008-2009 tax years and items for other years ($0.1 billion), which is reported partially in the caption "Tax on global activities including exports" and partially in the caption "All other-net" in the effective tax rate reconciliation in Note 14 to the consolidated financial statements in this Form 10-K Report. |
| The items lowering the expense were partially offset by the absence of the 2012 benefit attributable to the high tax basis in the entity sold in the Business Property disposition ($0.3 billion). |
GE 2014 FORM 10-K 67
MD&A | OTHER CONSOLIDATED INFORMATION |
GEOGRAPHIC DATA
Our global activities span all geographic regions and primarily encompass manufacturing for local and export markets, import and sale of products produced in other regions, leasing of aircraft, sourcing for our plants domiciled in other global regions and provision of financial services within these regional economies. Thus, when countries or regions experience currency and/or economic stress, we often have increased exposure to certain risks, but also often have new opportunities that include, among other things, expansion of industrial and financial services activities through purchases of companies or assets at reduced prices and lower U.S. debt financing costs.
Financial results of our non-U.S. activities reported in U.S. dollars are affected by currency exchange. We use a number of techniques to manage the effects of currency exchange, including selective borrowings in local currencies and selective hedging of significant cross-currency transactions. Such principal currencies are the euro, the pound sterling, the Canadian dollar, the Japanese yen, the Australian dollar and the Brazilian real.
REVENUES
Revenues are classified according to the region to which products and services are sold. For purposes of this analysis, the U.S. is presented separately from the remainder of the Americas.
GEOGRAPHIC REVENUES | ||||||||
(Dollars in billions) | 2014 | 2013 | 2012 | |||||
U.S. | $ | 70.6 | $ | 68.6 | $ | 70.5 | ||
Non-U.S. | ||||||||
Europe | 25.3 | 25.3 | 26.7 | |||||
Asia | 24.0 | 25.5 | 24.4 | |||||
Americas | 13.1 | 13.1 | 13.2 | |||||
Middle East and Africa | 15.6 | 13.5 | 11.9 | |||||
Total Non-U.S. | 78.0 | 77.4 | 76.2 | |||||
Total | $ | 148.6 | $ | 146.0 | $ | 146.7 | ||
Non-U.S. Revenues as a % of Consolidated Revenues | 52% | 53% | 52% | |||||
NON-U.S. REVENUES | |||||||||||||
V% | |||||||||||||
(Dollars in billions) | 2014 | 2013 | 2012 | 2014-2013 | 2013-2012 | ||||||||
GE, excluding GECC | $ | 61.4 | $ | 59.0 | $ | 57.3 | 4 | % | 3 | % | |||
GECC | 16.6 | 18.4 | 19.0 | (10) | % | (3) | % | ||||||
Total | $ | 78.0 | $ | 77.4 | $ | 76.2 | 1 | % | 2 | % | |||
GE, EXCLUDING GECC, NON-U.S. REVENUES
The increase in GE non-U.S. revenues, excluding GECC, in 2014 was primarily due to increases in growth markets of 15% in Middle East, North Africa and Turkey (MENAT), 29% in sub-Sahara, and 7% in Latin America, partially offset by a decrease of 18% in Australia & New Zealand (ANZ).
The increase in 2013 was primarily due to increases in growth markets of 72% in Algeria, 38% in Sub-Sahara and 7% in China offset by a decrease of 9% in Europe. These revenues as a percentage of GE total revenues, excluding GECC, were 58% in both 2014 and 2013, compared with 57% in 2012.
GE 2014 FORM 10-K 68
MD&A | OTHER CONSOLIDATED INFORMATION |
The effects of currency fluctuations on reported results were as follows:
| Decreased revenues by $0.5 billion in 2014, primarily driven by the Brazilian real ($0.2 billion), Canadian dollar ($0.1 billion) and Japanese yen ($0.1 billion). |
| Decreased revenues by $0.3 billion in 2013, primarily driven by the Japanese yen ($0.3 billion) and Brazilian real ($0.2 billion), partially offset by the euro ($0.4 billion). |
| Decreased revenues by $1.9 billion in 2012, primarily driven by the euro ($1.4 billion) and Brazilian real ($0.2 billion). |
The effects of foreign currency fluctuations on earnings were minimal, with no single currency having a significant impact.
GECC NON-U.S. REVENUES
The decreases in GECC non-U.S. revenues in 2014 and 2013 were primarily a result of decreases in Asia and Europe, respectively. Non-U.S. revenues as a percentage of total revenues were 39% in 2014, and 42% in both 2013 and 2012.
The effects of currency fluctuations on reported results were as follows:
| Decreased revenues by $0.3 billion in 2014, primarily driven by the Australian dollar ($0.1 billion), Japanese yen ($0.1 billion), and Canadian dollar ($0.1 billion). |
| Decreased revenues by $0.2 billion in 2013, primarily driven by the Japanese yen ($0.2 billion). |
| Decreased revenues by $0.7 billion in 2012, primarily driven by the euro ($0.3 billion), Polish zloty ($0.1 billion), Hungarian forint ($0.1 billion) and Czech koruna ($0.1 billion). |
The effects of foreign currency fluctuations on earnings were minimal, with no single currency having a significant impact.
ASSETS
We classify certain assets that cannot meaningfully be associated with specific geographic areas as "Other Global" for this purpose.
TOTAL ASSETS (CONTINUING OPERATIONS) | |||||
December 31 (In billions) | 2014 | 2013 | |||
U.S. | $ | 344.9 | $ | 325.4 | |
Non-U.S. | |||||
Europe | 180.0 | 195.1 | |||
Asia | 45.7 | 51.8 | |||
Americas | 28.2 | 32.9 | |||
Other Global | 48.3 | 49.0 | |||
Total Non-U.S. | 302.2 | 328.8 | |||
Total | $ | 647.1 | $ | 654.2 |
The decrease in total assets of non-U.S. operations on a continuing basis reflected declines in Europe, Asia and Americas due to the strengthening of the U.S. dollar against most major currencies, primarily the euro, the pound sterling and the Japanese yen and dispositions at various businesses.
GE 2014 FORM 10-K 69
MD&A | STATEMENT OF FINANCIAL POSITION |
STATEMENT OF FINANCIAL POSITION
Because GE and GECC share certain significant elements of their Statements of Financial Position, the following discussion addresses significant captions in the consolidated statement. Within the following discussions, however, we distinguish between GE and GECC activities in order to permit meaningful analysis of each individual consolidating statement.
MAJOR CHANGES IN OUR FINANCIAL POSITION DURING 2014
| GE Cash increased $2.2 billion driven by the following: |
- | $15.2 billion of GE cash flows from operating activities |
- | $3.0 billion senior unsecured debt issuance |
- | $0.6 billion from business dispositions |
- | $(8.9) billion dividends to shareowners |
- | $(2.2) billion used to buyback treasury stock under our share repurchase program |
- | $(2.1) billion used to acquire businesses |
For additional information on GE Cash, see the Statement of Cash Flows section within the MD&A of this Form 10-K.
| Investment securities increased $3.9 billion reflecting purchases of U.S. government and federal agency securities at Synchrony Financial and higher net unrealized gains in U.S. Corporate and State and Municipal securities driven by lower interest rates in the U.S. See Note 3 to the consolidated financial statements in this Form 10-K Report. |
- | Pre-tax, other-than-temporary impairment losses (OTTI) recognized in earnings were $0.4 billion and $0.8 billion in 2014 and 2013, respectively. The 2014 amount primarily relates to other-than temporary impairments on equity securities, corporate debt securities, commercial and residential mortgage-backed securities (CMBS), residential mortgage-backed securities (RMBS) and asset-backed securities (ABS). The 2013 amount primarily related to credit losses on corporate debt securities and other-than-temporary impairment on equity securities. |
- | Pre-tax, OTTI recognized in accumulated other comprehensive income were insignificant amounts in both 2014 and 2013. |
| GECC Financing receivables-net decreased $16.0 billion . See the following Financing Receivables section for additional information. |
| GE All other assets increased $1.0 billion primarily due to an increase in contract costs and estimated earnings at our Power & Water and Aviation businesses of $1.5 billion, partially offset by the reclassification of Appliances and Signaling balances to assets of businesses held for sale of $0.5 billion. |
| GECC All other assets decreased $3.5 billion as a result of sales of certain real estate investments of $3.4 billion, a net decrease in equity and cost method investments of $1.5 billion and a net decrease in advances to suppliers of $0.9 billion, partially offset by a net increase in assets held for sale of $2.3 billion. |
| Deferred income taxes increased $2.3 billion primarily due to an increased deferred tax asset as a result of the increased postretirement benefit liabilities, partially offset by the impact of the adoption of a new accounting standard, which reduced our deferred tax asset balance. See Note 1 to the consolidated financial statements in this Form 10-K Report. |
| GE borrowings increased $3.0 billion. GE completed issuances of $3.0 billion of senior unsecured debt with maturities up to 30 years and reclassified $2.0 billion of long-term borrowings to short-term borrowings during the year. |
| GECC borrowings decreased $31.0 billion. GECC had net repayments on these borrowings of $24.9 billion during the year, along with a net $9.1 billion reduction in the balances driven by the strengthening of the U.S. dollar against all major currencies. |
| Bank deposits increased $9.5 billion primarily due to increases at our banks of $12.6 billion, including Synchrony Financial of $9.2 billion, partially offset by the reclassification of Budapest Bank deposits to liabilities of businesses held for sale of $1.9 billion. |
GE 2014 FORM 10-K 70
MD&A | STATEMENT OF FINANCIAL POSITION |
|
|
| GE All other liabilities increased $13.7 billion primarily due to an increase in the postretirement benefit liabilities of $13.9 billion primarily due to lower discount rate and new mortality assumptions. The impact of these changes was the primary driver for the decrease in accumulated other comprehensive income (loss) – benefit plans of $7.3 billion . See Notes 12 and 15 to the consolidated financial statements in this Form 10-K Report. |
| Accumulated other comprehensive income (loss) – currency translation adjustments decreased $2.6 billion driven by the strengthening U.S. dollar against all major currencies at December 31, 2014 compared with December 31, 2013. This decrease coincides with general decreases in balances of our major asset and liability categories, including: Financing receivables; Property, plant and equipment; Goodwill; Intangible assets; Short-term borrowings and Long-term borrowings. |
FINANCING RECEIVABLES
Financing receivables is our largest category of assets and represents one of our primary sources of revenues. Our portfolio of financing receivables is diverse and not directly comparable to major U.S. banks. A discussion of the quality of certain elements of the financing receivables portfolio follows.
Our commercial portfolio primarily comprises senior secured positions with comparatively low loss history. The secured receivables in this portfolio are collateralized by a variety of asset classes, which for our CLL business primarily include: industrial-related facilities and equipment, vehicles, corporate aircraft, and equipment used in many industries, including the construction, manufacturing, transportation, media, communications, entertainment, and healthcare industries. The portfolios in our Real Estate, GECAS and Energy Financial Services businesses are collateralized by commercial real estate, commercial aircraft and operating assets in the global energy and water industries, respectively. We are in a secured position for substantially all of our commercial portfolio.
Our consumer portfolio is composed primarily of non-U.S. mortgage, sales finance, auto and personal loans in various European and Asian countries and U.S. consumer credit card and sales finance receivables.
During the first quarter of 2014, we combined our CLL Europe and CLL Asia portfolios into CLL International and we transferred our CLL Other portfolio to the CLL Americas portfolio. During the fourth quarter of 2014, we combined our Consumer Non-U.S. auto portfolio into our Consumer Non-U.S. installment and revolving credit portfolio. Prior-period amounts were reclassified to conform to the current-period presentation.
Our risk management process includes standards and policies for reviewing major risk exposures and concentrations, and evaluates relevant data either for individual loans or financing leases, or on a portfolio basis, as appropriate.
Loans acquired in a business acquisition are recorded at fair value, which incorporates our estimate at the acquisition date of the credit losses over the remaining life of the portfolio. As a result, the allowance for losses is not carried over at acquisition. This may have the effect of causing lower reserve coverage ratios for those portfolios.
For purposes of the discussion that follows, "delinquent" receivables are those that are 30 days or more past due based on their contractual terms. Loans purchased at a discount are initially recorded at fair value and accrete interest income over the estimated life of the loan based on reasonably estimable cash flows even if the underlying loans are contractually delinquent at acquisition. "Nonaccrual" financing receivables are those on which we have stopped accruing interest. We stop accruing interest at the earlier of the time at which collection of an account becomes doubtful or the account becomes 90 days past due, with the exception of consumer credit card accounts, for which we continue to accrue interest until the accounts are written off in the period that the account becomes 180 days past due. Recently restructured financing receivables are not considered delinquent when payments are brought current according to the restructured terms, but may remain classified as nonaccrual until there has been a period of satisfactory payment performance by the borrower and future payments are reasonably assured of collection.
GE 2014 FORM 10-K 71
MD&A | STATEMENT OF FINANCIAL POSITION |
FINANCING RECEIVABLES AND ALLOWANCE FOR LOSSES | ||||||||||||
December 31 (Dollars in millions) | 2014 | 2013 | ||||||||||
Financing receivables | $ | 242,093 | $ | 258,207 | ||||||||
Nonaccrual receivables | 5,225 | (a) | 7,915 | |||||||||
Allowance for losses | 5,075 | 5,178 | ||||||||||
Nonaccrual financing receivables as a percent of financing receivables | 2.2 | % | 3.1 | % | ||||||||
Allowance for losses as a percent of nonaccrual financing receivables | 97.1 | 65.4 | ||||||||||
Allowance for losses as a percent of total financing receivables | 2.1 | 2.0 | ||||||||||
(a) | Of our $5.2 billion of nonaccrual loans at December 31, 2014, $2.7 billion are currently paying in accordance with the contractual terms. |
Financing receivables, before allowance for losses, decreased $16.1 billion from December 31, 2013, primarily as a result of the stronger U.S. dollar ($7.7 billion), the reclassification of Budapest Bank to assets of businesses held for sale and the sale of GEMB-Nordic ($5.3 billion), write-offs ($5.1 billion) and transfers to assets held for sale and equipment leased to others ($3.1 billion), partially offset by originations exceeding collections (which includes sales) ($5.7 billion).
Nonaccrual receivables decreased $2.7 billion from December 31, 2013 primarily due to payoffs, collections and write-offs in our Real Estate and CLL portfolios and asset sales and resolutions in Consumer, primarily in our U.K. portfolio.
Allowance for losses decreased $0.1 billion from December 31, 2013. Allowance for losses decreased at Commercial and Real Estate, primarily as a result of write-offs and resolutions. These decreases were offset by increases at Consumer, primarily as a result of an increase in the projected net write-offs over the next 12 months in the U.S. consistent with the growth of related financing receivables, partially offset by the reclassification of Budapest Bank to assets of business held for sale and the sale of GEMB-Nordic. The allowance for losses as a percent of total financing receivables increased from 2.0% at December 31, 2013 to 2.1% at December 31, 2014 reflecting decreases in both the allowance for losses and the overall financing receivables balance as discussed above.
For additional information related to the portfolio of financing receivables, refer to the General Electric Capital Corporation annual report on Form 10-K for the year ended December 31, 2014.
GE 2014 FORM 10-K 72
MD&A | FINANCIAL RESOURCES AND LIQUIDITY |
FINANCIAL RESOURCES AND LIQUIDITY
LIQUIDITY AND BORROWINGS
We maintain a strong focus on liquidity. At both GE and GECC we manage our liquidity to help provide access to sufficient funding to meet our business needs and financial obligations throughout business cycles.
Our liquidity and borrowing plans for GE and GECC are established within the context of our annual financial and strategic planning processes. At GE, our liquidity and funding plans take into account the liquidity necessary to fund our operating commitments, which include primarily purchase obligations for inventory and equipment, payroll and general expenses (including pension funding). We also take into account our capital allocation and growth objectives, including paying dividends, repurchasing shares, investing in research and development and acquiring industrial businesses. At GE, we rely primarily on cash generated through our operating activities, any dividend payments from GECC, and also have historically maintained a commercial paper program that we regularly use to fund operations in the U.S., principally within fiscal quarters.
GECC's liquidity position is targeted to meet its obligations under both normal and stressed conditions. GECC establishes a funding plan annually that is based on the projected asset size and cash needs of the Company, which, over the past few years, has incorporated our strategy to reduce our ending net investment in GE Capital. GECC relies on a diversified source of funding, including the unsecured term debt markets, the global commercial paper markets, deposits, secured funding, retail funding products, bank borrowings and securitizations to fund its balance sheet. We also rely on cash generated through collection of principal, interest and other payments on our existing portfolio of loans and leases to fund its operating and interest expense costs.
Our 2015 GECC funding plan anticipates repayment of principal on outstanding short-term borrowings, including the current portion of long-term debt ($38.0 billion at December 31, 2014), through issuance of long-term debt and reissuance of commercial paper, cash on hand, dispositions, asset sales, and deposits and other alternative sources of funding. Long-term maturities and early redemptions were $41.3 billion in 2014. Interest on borrowings is primarily repaid through interest earned on existing financing receivables. During 2014, GECC earned interest income on financing receivables of $18.7 billion, which more than offset interest and other financial charges of $8.4 billion.
We maintain a detailed liquidity policy for GECC that requires GECC to maintain a contingency funding plan. The liquidity policy defines GECC's liquidity risk tolerance under different stress scenarios based on its liquidity sources and also establishes procedures to escalate potential issues. We actively monitor GECC's access to funding markets and its liquidity profile through tracking external indicators and testing various stress scenarios. The contingency funding plan provides a framework for handling market disruptions and establishes escalation procedures in the event that such events or circumstances arise.
GE 2014 FORM 10-K 73
MD&A | FINANCIAL RESOURCES AND LIQUIDITY |
LIQUIDITY SOURCES
We maintain liquidity sources that consist of cash and equivalents of $90.2 billion, committed unused credit lines of $44.9 billion and high-quality, liquid investments of $1.2 billion.
CONSOLIDATED CASH AND EQUIVALENTS | |||||||
December 31 (In billions) | 2014 | 2014 | |||||
GE(a) | $ | 15.9 | U.S. | $ | 29.1 | ||
GECC(b) | 74.3 | Non-U.S.(c) | 61.1 | ||||
Total | $ | 90.2 | Total | $ | 90.2 | ||
(a) | At December 31, 2014, $2.8 billion of GE cash and equivalents was held in countries with currency controls that may restrict the transfer of funds to the U.S. or limit our ability to transfer funds to the U.S. without incurring substantial costs. These funds are available to fund operations and growth in these countries and we do not currently anticipate a need to transfer these funds to the U.S. |
(b) | At December 31, 2014, GECC cash and equivalents of about $20.0 billion were in regulated banks and insurance entities and were subject to regulatory restrictions. |
(c) | Of this amount at December 31, 2014, $12.2 billion was considered indefinitely reinvested. Indefinitely reinvested cash held outside of the U.S. is available to fund operations and other growth of non-U.S. subsidiaries; it is also available to fund our needs in the U.S. on a short-term basis through short-term loans, without being subject to U.S. tax. Under the Internal Revenue Code, these loans are permitted to be outstanding for 30 days or less and the total of all such loans is required to be outstanding for less than 60 days during the year. If we were to repatriate indefinitely reinvested cash held outside the U.S., we would be subject to additional U.S. income taxes and foreign withholding taxes. |
COMMITTED UNUSED CREDIT LINES | ||
December 31 (In billions) | 2014 | |
Revolving credit agreements (exceeding one year) | $ | 25.1 |
Revolving credit agreements (364-day line)(a) | 19.8 | |
Total(b) | $ | 44.9 |
(a) | Included $19.3 billion that contains a term-out feature that allows us to extend borrowings for two years from the date on which such borrowings would otherwise be due. |
(b) | Total committed unused credit lines were extended to us by 50 financial institutions. GECC can borrow up to $44.4 billion under these credit lines. GE can borrow up to $14.2 billion under certain of these credit lines. |
FUNDING PLAN
We reduced our GE Capital ENI, excluding liquidity, to $363 billion at December 31, 2014.
During 2014, GE completed issuances of $3.0 billion of senior unsecured debt with maturities up to 30 years. GECC completed issuances of $9.5 billion of senior unsecured debt (excluding securitizations described below) with maturities up to 40 years (and subsequent to December 31, 2014 through February 13, 2015, an additional $8.1 billion). In addition, in August 2014, Synchrony Financial completed issuances of $3.6 billion of senior unsecured debt with maturities up to 10 years and $8.0 billion of unsecured term loans maturing in 2019, and in October 2014 completed issuances of $0.8 billion unsecured term loans maturing in 2019 under the New Bank Term Loan Facility with third party lenders. Subsequent to December 31, 2014 through February 13, 2015, Synchrony Financial issued an additional $1.0 billion of senior unsecured debt maturing in 2020.
COMMERCIAL PAPER | |||||
(In billions) | GE | GECC | |||
Average commercial paper borrowings during the fourth quarter of 2014 | $ | 8.1 | $ | 25.0 | |
Maximum commercial paper borrowings outstanding during the fourth quarter of 2014 | 10.6 | 25.1 | |||
GE 2014 FORM 10-K 74
MD&A | FINANCIAL RESOURCES AND LIQUIDITY |
GECC commercial paper maturities are funded principally through new commercial paper issuances and at GE are substantially repaid before quarter-end using indefinitely reinvested overseas cash, which as discussed above, is available for use in the U.S. on a short-term basis without being subject to U.S. tax.
We securitize financial assets as an alternative source of funding. During 2014, we completed $11.1 billion of non-recourse issuances and $11.3 billion of non-recourse borrowings matured. At December 31, 2014, consolidated non-recourse securitization borrowings were $29.9 billion.
We have nine deposit-taking banks outside of the U.S. and two deposit-taking banks in the U.S. – Synchrony Bank (formerly GE Capital Retail Bank), a Federal Savings Bank (FSB), and GE Capital Bank, an industrial bank (IB). The FSB and IB currently issue certificates of deposit (CDs) in maturity terms up to 10 years.
ALTERNATIVE FUNDING | |||
(In billions) | |||
Total alternative funding at December 31, 2013 | $ | 107.5 | |
Total alternative funding at December 31, 2014 | 117.8 | ||
Bank deposits | 62.8 | ||
Non-recourse securitization borrowings | 29.9 | ||
Funding secured by real estate, aircraft and other collateral | 6.0 | ||
GE Interest Plus notes (including $0.1 billion of current long-term debt) | 5.6 | ||
Bank unsecured | 13.5 | ||
As a matter of general practice, we routinely evaluate the economic impact of calling debt instruments where GECC has the right to exercise a call. In determining whether to call debt, we consider the economic benefit to GECC of calling debt, the effect of calling debt on GECC's liquidity profile and other factors. During 2014, we called $0.4 billion of long-term debt.
EXCHANGE RATE AND INTEREST RATE RISKS
Exchange rate and interest rate risks are managed with a variety of techniques, including match funding and selective use of derivatives. We use derivatives to mitigate or eliminate certain financial and market risks because we conduct business in diverse markets around the world and local funding is not always efficient. In addition, we use derivatives to adjust the debt we are issuing to match the fixed or floating nature of the assets we are originating. We apply strict policies to manage each of these risks, including prohibitions on speculative activities. Following is an analysis of the potential effects of changes in interest rates and currency exchange rates using so-called "shock" tests that seek to model the effects of shifts in rates. Such tests are inherently limited based on the assumptions used (described further below) and should not be viewed as a forecast; actual effects would depend on many variables, including market factors and the composition of the Company's assets and liabilities at that time.
| It is our policy to minimize exposure to interest rate changes. We fund our financial investments using debt or a combination of debt and hedging instruments so that the interest rates of our borrowings match the expected interest rate profile on our assets. To test the effectiveness of our hedging actions, we assumed that, on January 1, 2015, interest rates decreased by 100 basis points across the yield curve (a "parallel shift" in that curve) and further assumed that the decrease remained in place for the next 12 months. Based on the year-end 2014 portfolio and holding all other assumptions constant, we estimated that our consolidated net earnings for the next 12 months, starting in January 2015, would decline by less than $0.1 billion as a result of this parallel shift in the yield curve. |
GE 2014 FORM 10-K 75
MD&A | FINANCIAL RESOURCES AND LIQUIDITY |
|
|
| It is our policy to minimize currency exposures and to conduct operations either within functional currencies or using the protection of hedge strategies. We analyzed year-end 2014 consolidated currency exposures, including derivatives designated and effective as hedges, to identify assets and liabilities denominated in other than their relevant functional currencies. For such assets and liabilities, we then evaluated the effects of a 10% shift in exchange rates between those currencies and the U.S. dollar, holding all other assumptions constant. This analysis indicated that our 2015 consolidated net earnings would decline by less than $0.1 billion as a result of such a shift in exchange rates. This analysis excludes any translation impact from changes in exchange rates on our financial results. |
DEBT AND DERIVATIVE INSTRUMENTS, GUARANTEES AND COVENANTS
CREDIT RATINGS
As of December 31, 2014, GE's and GECC's long-term unsecured debt ratings from Standard and Poor's Ratings Service (S&P) were AA+ with a stable outlook and their short-term funding ratings from S&P were A-1+. We are disclosing these ratings to enhance understanding of our sources of liquidity and the effects of our ratings on our costs of funds. Although we currently do not expect a downgrade in the credit ratings, our ratings may be subject to a revision or withdrawal at any time by the assigning rating organization, and each rating should be evaluated independently of any other rating.
PRINCIPAL DEBT AND DERIVATIVE CONDITIONS
Certain of our derivative instruments can be terminated if specified credit ratings are not maintained and certain debt and derivatives agreements of other consolidated entities have provisions that are affected by these credit ratings.
Fair values of our derivatives can change significantly from period to period based on, among other factors, market movements and changes in our positions. We manage counterparty credit risk (the risk that counterparties will default and not make payments to us according to the terms of our standard master agreements) on an individual counterparty basis. Where we have agreed to netting of derivative exposures with a counterparty, we offset our exposures with that counterparty and apply the value of collateral posted to us to determine the net exposure. We actively monitor these net exposures against defined limits and take appropriate actions in response, including requiring additional collateral.
Swap, forward and option contracts are executed under standard master agreements that typically contain mutual downgrade provisions that provide the ability of the counterparty to require termination if the long-term credit ratings of the applicable GE entity were to fall below A-/A3. In certain of these master agreements, the counterparty also has the ability to require termination if the short-term ratings of the applicable GE entity were to fall below A-1/P-1. The net derivative liability after consideration of netting arrangements, outstanding interest payments and collateral posted by us under these master agreements was estimated to be $0.5 billion at December 31, 2014. See Note 22 to the consolidated financial statements in this Form 10-K Report.
Other debt and derivative agreements of consolidated entities include Trinity, which comprises two entities that hold investment securities, the majority of which are investment grade, and were funded by the issuance of guaranteed investment contracts (GICs). These GICs include conditions under which certain holders could require immediate repayment of their investment should the long-term credit ratings of GECC fall below AA-/Aa3 or the short-term credit ratings fall below A-1+/P-1, and are reported in investment contracts, insurance liabilities and insurance annuity benefits. The Trinity assets and liabilities are disclosed in note (a) on our Statement of Financial Position in the consolidated financial statements of this Form 10-K Report. Another consolidated entity also had issued GICs where proceeds are loaned to GECC. These GICs included conditions under which certain holders could require immediate repayment of their investment should the long-term credit ratings of GECC fall below AA-/Aa3. These obligations are included in the caption "long-term borrowings" on our Statement of Financial Position in the consolidated financial statements in this Form 10-K Report. These three consolidated entities ceased issuing GICs in 2010.
GE 2014 FORM 10-K 76
MD&A | FINANCIAL RESOURCES AND LIQUIDITY |
RATIO OF EARNINGS TO FIXED CHARGES, INCOME MAINTENANCE AGREEMENT AND SUBORDINATED DEBENTURES
GE provides implicit and explicit support to GECC through commitments, capital contributions and operating support. For example, and as discussed below, GE has committed to keep GECC's ratio of earnings to fixed charges above a minimum level. GECC's credit rating is higher than it would be on a stand-alone basis as a result of this financial support. GECC currently does not pay GE for this support.
Under an agreement between GE and GECC, GE will make payments to GECC, constituting additions to pre-tax income under the agreement (which increases equity), to the extent necessary to cause the ratio of earnings to fixed charges of GECC and consolidated affiliates (determined on a consolidated basis) to be not less than 1.10:1 for the period, as a single aggregation, of each GECC fiscal year commencing with fiscal year 1991. GECC's ratio of earnings to fixed charges was 1.84:1 for 2014. No payment for 2014 was required pursuant to this agreement. On February 24, 2015, GE and GECC amended this agreement, effective beginning in 2015, to exclude non-cash charges attributable to goodwill and intangibles (which are excluded from regulatory capital calculations) for purposes of calculating GECC's ratio of earnings to fixed charges. The amended agreement is filed as Exhibit 10(y) hereto and is hereby incorporated by reference.
In addition, in connection with certain subordinated debentures of GECC that may be classified as equity (hybrid debt), during events of default or interest deferral periods under such subordinated debentures, GECC has agreed not to declare or pay any dividends or distributions or make certain other payments with respect to its capital stock, and GE has agreed to promptly return any payments made to GE in violation of this agreement. There were $7.1 billion of such debentures outstanding at December 31, 2014. See Note 10 to the consolidated financial statements in this Form 10-K Report.
GE 2014 FORM 10-K 77
MD&A | FINANCIAL RESOURCES AND LIQUIDITY |
STATEMENT OF CASH FLOWS – OVERVIEW FROM 2012 THROUGH 2014
CONSOLIDATED CASH FLOWS
We evaluate our cash flow performance by reviewing our industrial (non-financial services) businesses and financial services businesses separately. Cash from operating activities (CFOA) is the principal source of cash generation for our industrial businesses. The industrial businesses also have liquidity available via the public capital markets. Our financial services businesses use a variety of financial resources to meet our capital needs. Cash for financial services businesses is primarily provided from the issuance of term debt and commercial paper in the public and private markets and deposits, as well as financing receivables collections, sales and securitizations.
GE CASH FLOWS
OPERATING CASH FLOWS | INVESTING CASH FLOWS | FINANCING CASH FLOWS | ||||||||
2012 | 2013 | 2014 | 2012 | 2013 | 2014 | 2012 | 2013 | 2014 | ||
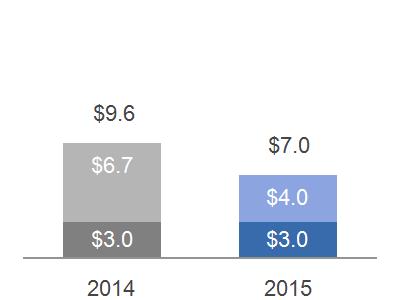 |
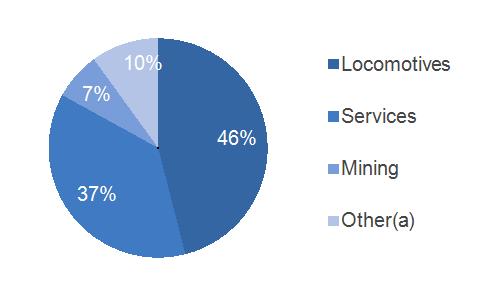 |
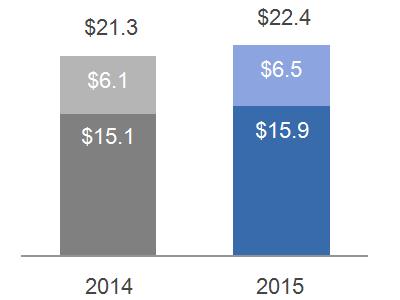 | ||||||||
With respect to GE CFOA, we believe that it is useful to supplement our GE Statement of Cash Flows and to examine in a broader context the business activities that provide and require cash.
The most significant source of cash in GE CFOA is customer-related activities, the largest of which is collecting cash resulting from product or services sales. See the Intercompany Transactions and Eliminations section for information related to transactions between GE and GECC. The most significant operating use of cash is to pay our suppliers, employees, tax authorities and others for a wide range of material and services. Dividends from GECC, including special dividends, represent the distribution of a portion of GECC retained earnings, and are distinct from cash from continuing operations within the financial services businesses. The amounts included in GE CFOA are the total dividends, including special dividends from excess capital.
GE 2014 FORM 10-K 78
MD&A | FINANCIAL RESOURCES AND LIQUIDITY |
2014–2013 COMMENTARY
GE cash from operating activities increased $0.9 billion primarily due to the following:
| An increase of operating cash collections of $4.9 billion to $109.7 billion in 2014. This increase is consistent with comparable GE segment revenue increases from sales of goods and services and higher collections on current receivables. These increases were partially offset by a decrease in progress collections. |
| This increase is partially offset by an increase of operating cash payments of $1.0 billion to $97.5 billion in 2014 consistent with cost and expense increases, which was partially offset by the non-recurrence of payments made in 2013, including NBCU LLC deal-related tax payments, and payouts under our long-term incentive plan. |
| Further, GECC paid dividends totaling $3.0 billion and $6.0 billion to GE, including special dividends of $1.0 billion and $4.1 billion in 2014 and 2013, respectively. |
GE cash used for investing activities was $5.9 billion in 2014, compared with cash from investing activities of $4.8 billion in 2013, a decrease of $10.7 billion primarily due to the following:
| 2013 proceeds of $16.7 billion from the sale of our remaining 49% common equity interest in NBCU LLC to Comcast Corporation. |
| This was partially offset by lower business acquisition activity of $5.9 billion primarily driven by the 2014 acquisitions of Thermo Fisher for $1.1 billion, Cameron's Reciprocating Compression Division for $0.6 billion, and API for $0.3 billion compared with the 2013 acquisitions of Avio for $4.4 billion and Lufkin for $3.3 billion. |
GE cash used for financing activities decreased $14.2 billion primarily due to the following:
| A decrease in net repurchases of GE shares for treasury in accordance with our share repurchase program of $8.1 billion. |
| The 2013 repayment of $5.0 billion of GE unsecured notes compared with the issuance of $3.0 billion of unsecured notes in 2014. |
| These decreases were partially offset by an increase in the dividends paid to shareowners of $1.0 billion. |
2013–2012 COMMENTARY
GE cash from operating activities decreased $3.5 billion primarily due to the following:
| A decrease of operating cash collections of $0.6 billion to $104.8 billion in 2013. The decrease is consistent with a decrease in collections on long-term contracts and increases in current receivables, partially offset by increased progress collections and improved segment revenues. |
| GE operating cash payments increased by $2.5 billion to $96.5 billion in 2013. The increase is consistent with NBCU deal-related tax payments and payouts under our long-term incentive plan, partially offset by the non-recurrence of principal pension plan funding in 2012. |
| Additionally, GECC paid dividends totaling $6.0 billion and $6.4 billion to GE, including special dividends of $4.1 billion and $4.5 billion in 2013 and 2012, respectively. |
GE cash from investing activities of $4.8 billion in 2013, compared with cash used for investing activities of $5.4 billion in 2012, an increase of $10.2 billion primarily due to the following:
| 2013 proceeds of $16.7 billion from the sale of our remaining 49% common equity interest in NBCU LLC to Comcast. |
| This was partially offset by the 2013 acquisitions of Avio for $4.4 billion and Lufkin for $3.3 billion. |
GE cash used for financing activities increased $15.6 billion primarily due to the following:
| The 2013 repayment of $5.0 billion of GE unsecured notes compared with an issuance of $7.0 billion of unsecured notes in 2012. |
| An increase in net repurchases of GE shares for treasury in accordance with our share repurchase program of $5.1 billion. |
| An increase in dividends paid to shareowners of $0.6 billion in 2013. |
GE 2014 FORM 10-K 79
MD&A | FINANCIAL RESOURCES AND LIQUIDITY |
GECC CASH FLOWS
OPERATING CASH FLOWS | INVESTING CASH FLOWS | FINANCING CASH FLOWS | ||||||||
2012 | 2013 | 2014 | 2012 | 2013 | 2014 | 2012 | 2013 | 2014 | ||
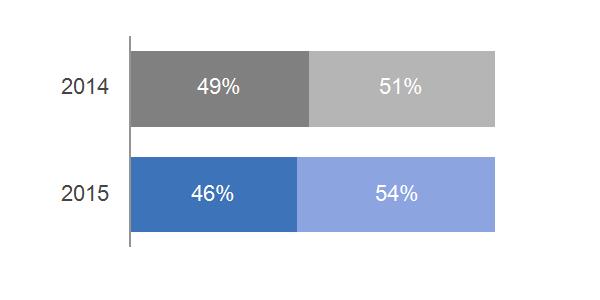 | 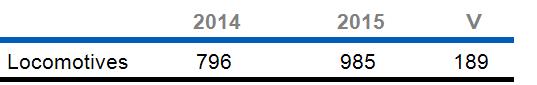 |
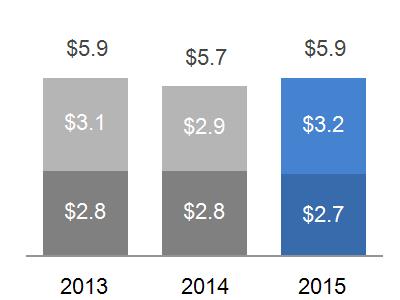 | ||||||||
2014–2013 COMMENTARY
GECC cash from operating activities decreased $2.1 billion primarily due to the following:
| A net decrease in tax activity of $3.9 billion driven by net tax payments in 2014 compared with net tax refunds in 2013. |
| A decrease in cash generated from lower net earnings from continuing operations of $0.9 billion. |
| These decreases were partially offset by a $3.0 billion increase in net cash collateral activity with counterparties on derivative contracts. |
GECC cash used for investing activities was $0.8 billion in 2014, compared with cash from investing activities of $23.4 billion in 2013, a decrease of $24.2 billion primarily due to the following:
| A net decrease in financing receivables activity of $9.3 billion driven by net originations of financing receivables in 2014 of $5.7 billion, compared with net collections (which includes sales) of financing receivables of $3.6 billion in 2013. |
| The 2013 acquisition of MetLife Bank, N.A., resulting in net cash provided of $6.4 billion. |
| Lower proceeds from sales of real estate properties of $4.8 billion. |
| A net decrease in investment securities activity of $2.8 billion driven by net purchases of $1.1 billion in 2014, compared with net sales of $1.7 billion in 2013. |
GECC cash used for financing activities decreased $15.8 billion primarily due to the following:
| A net increase in deposits at our banks of $11.1 billion. |
| Lower dividends paid to GE driven by dividends totaling $3.0 billion and $6.0 billion, including special dividends of $1.0 billion and $4.1 billion in 2014 and 2013, respectively. |
| 2014 proceeds received from the initial public offering of Synchrony Financial of $2.8 billion. |
GE 2014 FORM 10-K 80
MD&A | FINANCIAL RESOURCES AND LIQUIDITY |
2013–2012 COMMENTARY
GECC cash from operating activities decreased $1.9 billion primarily due to the following:
| A decrease in net cash collateral activity with counterparties on derivative contracts of $5.2 billion. |
| This decrease was partially offset by an increase in net tax activity of $2.5 billion driven by net tax refunds in 2013, compared with net tax payments in 2012 and increased cash generated from higher net earnings from continuing operations of $0.9 billion. |
GECC cash from investing activities increased $8.7 billion primarily due to the following:
| Higher proceeds from sales of real estate properties of $7.3 billion. |
| The 2013 acquisition of MetLife Bank, N.A., resulting in net cash provided of $6.4 billion. |
| Lower net loan repayments from our equity method investments of $4.9 billion. |
| Lower collections (which includes sales) exceeding originations of financing receivables of $1.9 billion. |
GECC cash used for financing activities decreased $23.0 billion primarily due to the following:
| Lower net repayments of borrowings, consisting primarily of net reductions in long-term borrowings and commercial paper of $24.0 billion. |
| Lower redemptions of guaranteed investment contracts of $2.3 billion. |
| Beginning in the second quarter of 2012, GECC restarted its dividend to GE. GECC paid dividends totaling $6.0 billion and $6.4 billion to GE, including special dividends of $4.1 billion and $4.5 billion in 2013 and 2012, respectively. |
| These decreases were partially offset by lower proceeds from the issuance of preferred stock of $3.0 billion. |
INTERCOMPANY TRANSACTIONS AND ELIMINATIONS
Effects of transactions between related companies are made on an arms-length basis, are eliminated and consist primarily of GECC dividends to GE; GE customer receivables sold to GECC; GECC services for trade receivables management and material procurement; buildings and equipment (including automobiles) leased between GE and GECC; information technology (IT) and other services sold to GECC by GE; aircraft engines manufactured by GE that are installed on aircraft purchased by GECC from third-party producers for lease to others; and various investments, loans and allocations of GE corporate overhead costs.
GE sells customer receivables to GECC in part to fund the growth of our industrial businesses. These transactions can result in cash generation or cash use. During any given period, GE receives cash from the sale of receivables to GECC. It also foregoes collection of cash on receivables sold. The incremental amount of cash received from sales of receivables in excess of the cash GE would have otherwise collected had those receivables not been sold, represents the cash generated or used in the period relating to this activity. The incremental cash generated in GE CFOA from selling these receivables to GECC increased GE's CFOA by $2.2 billion, $0.1 billion and $1.9 billion in 2014, 2013 and 2012, respectively.
See Note 26 to the consolidated financial statements in this Form 10-K Report for additional information about the eliminations of intercompany transactions between GE and GECC.
GE 2014 FORM 10-K 81
MD&A | FINANCIAL RESOURCES AND LIQUIDITY |
CONTRACTUAL OBLIGATIONS
As defined by reporting regulations, our contractual obligations for future payments as of December 31, 2014, follow.
Payments due by period | ||||||||||||||
2020 and | ||||||||||||||
(In billions) | Total | 2015 | 2016-2017 | 2018-2019 | thereafter | |||||||||
Borrowings and bank deposits (Note 10) | $ | 365.0 | $ | 118.9 | $ | 93.6 | $ | 51.8 | $ | 100.7 | ||||
Interest on borrowings and bank deposits | 83.6 | 8.2 | 13.1 | 10.6 | 51.7 | |||||||||
Purchase obligations(a)(b) | 55.7 | 27.6 | 9.5 | 9.0 | 9.6 | |||||||||
Insurance liabilities (Note 11)(c) | 12.6 | 1.3 | 2.2 | 1.6 | 7.5 | |||||||||
Operating lease obligations (Note 19) | 4.1 | 0.8 | 1.3 | 0.9 | 1.1 | |||||||||
Other liabilities(d) | 84.2 | 17.1 | 7.8 | 6.9 | 52.4 | |||||||||
Contractual obligations of discontinued operations(e) | 1.2 | 1.2 | - | - | - | |||||||||
| (a) | Included all take-or-pay arrangements, capital expenditures, contractual commitments to purchase equipment that will be leased to others, contractual commitments related to factoring agreements, software acquisition/license commitments, contractual minimum programming commitments and any contractually required cash payments for acquisitions. |
| (b) | Excluded funding commitments entered into in the ordinary course of business by our financial services businesses. Further information on these commitments and other guarantees is provided in Note 24 to the consolidated financial statements in this Form 10-K Report. |
| (c) | Included contracts with reasonably determinable cash flows such as structured settlements, guaranteed investment contracts, and certain property and casualty contracts, and excluded long-term care, variable annuity and other life insurance contracts. |
| (d) | Included an estimate of future expected funding requirements related to our postretirement benefit plans and included liabilities for unrecognized tax benefits. Because their future cash outflows are uncertain, the following non-current liabilities are excluded from the table above: deferred taxes, derivatives, deferred revenue and other sundry items. For further information on certain of these items, see Notes 14 and 22 to the consolidated financial statements in this Form 10-K Report. |
| (e) | Included payments for other liabilities. |
GE 2014 FORM 10-K 82
MD&A | EXPOSURES |
EXPOSURES
GECC SELECTED EUROPEAN EXPOSURES
At December 31, 2014, we had $65.4 billion in financing receivables to consumer and commercial customers in Europe. The GECC financing receivables portfolio in Europe is well diversified across European geographies and customers. Approximately 92% of the portfolio is secured by collateral and represents approximately 500,000 commercial customers. Several European countries, including Spain, Portugal, Ireland, Italy, Greece and Hungary (focus countries), have been subject to credit deterioration due to weaknesses in their economic and fiscal situations. The carrying value of GECC funded exposures in these focus countries and in the rest of Europe comprised the following at December 31, 2014.
Rest of | Total | ||||||||||||||||||||||
December 31, 2014 (In millions) | Spain | Portugal | Ireland | Italy | Greece | Hungary | Europe | Europe | |||||||||||||||
Financing receivables, before allowance | |||||||||||||||||||||||
for losses on financing receivables | $ | 1,290 | $ | 206 | $ | 401 | $ | 6,089 | $ | 3 | $ | 491 | $ | 57,800 | $ | 66,280 | |||||||
Allowance for losses on | |||||||||||||||||||||||
financing receivables | (72) | (16) | (41) | (149) | - | - | (616) | (894) | |||||||||||||||
Financing receivables, net of allowance | |||||||||||||||||||||||
for losses on financing receivables(a)(b) | 1,218 | 190 | 360 | 5,940 | 3 | 491 | 57,184 | 65,386 | |||||||||||||||
Investments(c)(d) | 3 | - | - | 411 | - | - | 1,707 | 2,121 | |||||||||||||||
Cost and equity method investments(e) | - | - | 478 | 56 | 32 | - | 1,579 | 2,145 | |||||||||||||||
Derivatives, net of collateral(c)(f) | 2 | - | - | 49 | - | - | 220 | 271 | |||||||||||||||
Equipment leased to others (ELTO)(g) | 493 | 210 | 62 | 665 | 230 | 231 | 9,840 | 11,731 | |||||||||||||||
Real estate held for investment(g) | 539 | - | - | 385 | - | - | 3,138 | 4,062 | |||||||||||||||
Total funded exposures(h)(i)(j) | $ | 2,255 | $ | 400 | $ | 900 | $ | 7,506 | $ | 265 | $ | 722 | $ | 73,668 | $ | 85,716 | |||||||
Unfunded commitments(j)(k) | $ | 19 | $ | 8 | $ | 100 | $ | 234 | $ | 3 | $ | - | $ | 4,450 | $ | 4,814 | |||||||
(a) | Financing receivable amounts are classified based on the location or nature of the related obligor. |
(b) | Substantially all relates to non-sovereign obligors. Included residential mortgage loans of approximately $24.7 billion before consideration of purchased credit protection. We have third-party mortgage insurance for less than 10% of these residential mortgage loans, which were primarily originated in France and the U.K. |
(c) | Investments and derivatives are classified based on the location of the parent of the obligor or issuer. |
(d) | Included $0.6 billion related to financial institutions, $0.2 billion related to non-financial institutions and $1.3 billion related to sovereign issuers. Sovereign issuances totaled $0.1 billion related to Italy. We held no investments issued by sovereign entities in the other focus countries. |
(e) | Substantially all is non-sovereign. |
(f) | Net of cash collateral; entire amount is non-sovereign. |
(g) | These assets are held under long-term investment and operating strategies, and our ELTO strategies contemplate an ability to redeploy assets under lease should default by the lessee occur. The values of these assets could be subject to decline or impairment in the current environment. |
(h) | Excluded $33.7 billion of cash and equivalents, which is composed of $25.3 billion of cash on short-term placement with highly rated global financial institutions based in Europe, sovereign central banks and agencies or supranational entities, of which $1.1 billion is in focus countries, and $8.4 billion of cash and equivalents placed with highly rated European financial institutions on a short-term basis, secured by U.S. Treasury securities ($4.1 billion) and sovereign bonds of non-focus countries ($4.3 billion), where the value of our collateral exceeds the amount of our cash exposure. |
(i) | Rest of Europe included $1.9 billion and $0.1 billion of exposure for Russia and Ukraine, respectively, substantially all ELTO and financing receivables related to commercial aircraft in our GECAS portfolio. |
(j) | Excludes assets held for sale and unfunded commitments related to Budapest Bank for Hungary. |
(k) | Includes ordinary course of business lending commitments, commercial and consumer unused revolving credit lines, inventory financing arrangements and investment commitments. |
GE 2014 FORM 10-K 83
MD&A | EXPOSURES |
|
|
We manage counterparty exposure, including credit risk, on an individual counterparty basis. We place defined risk limits around each obligor and review our risk exposure on the basis of both the primary and parent obligor, as well as the issuer of securities held as collateral. These limits are adjusted on an ongoing basis based on our continuing assessment of the credit risk of the obligor or issuer. In setting our counterparty risk limits, we focus on high-quality credits and diversification through spread of risk in an effort to actively manage our overall exposure. We actively monitor each exposure against these limits and take appropriate action when we believe that risk limits have been exceeded or there are excess risk concentrations. Our collateral position and ability to work out problem accounts have historically mitigated our actual loss experience. Delinquency experience has been relatively stable in our European commercial and consumer platforms in the aggregate, and we actively monitor and take action to reduce exposures where appropriate. Uncertainties surrounding European markets could have an impact on the judgments and estimates used in determining the carrying value of these assets.
VENEZUELA
Our activities related to Venezuela generated revenues of approximately $0.6 billion in 2014, consisting of both exports to and operations within the country. Substantially all of these revenues are denominated in U.S. dollars and euro but we also transact in bolivars for certain businesses.
Determining the appropriate exchange rate for remeasurement of bolivar-denominated monetary assets and liabilities into U.S. dollars continues to be subject to uncertainty. During 2014, Venezuela operated three different exchange mechanisms: CENCOEX (the official exchange mechanism), SICAD1 and SICAD2. In 2014, we became eligible to access the SICAD1 exchange mechanism to settle certain future transactions, including the payment of dividends. In light of this development, we concluded the SICAD1 rate is the most appropriate for measuring a majority of our monetary assets and recorded pre-tax charges of $66 million during 2014. We continued to access CENCOEX for certain of our qualifying imports and measure the associated bolivar-denominated net monetary assets at that rate. In February 2015, the Venezuelan government eliminated SICAD2 and introduced a new open market exchange mechanism (SIMADI). We will reevaluate the determination of the appropriate exchange rates for remeasurement in light of current developments, including the potential for a devaluation of the bolivar. Net monetary assets subject to remeasurement were approximately $78 million at December 31, 2014, including approximately $19 million in bolivar-denominated cash and cash equivalents and approximately $41 million related to a non-consolidated investment.
We also continue to monitor other effects of the economic and operating environment in Venezuela on our activities, including the impact on non-bolivar credit exposures and recoverable amounts of bolivar denominated non-monetary assets.
OIL & GAS INDUSTRY
The recent sharp decline in oil prices and the prospect of lower oil prices has mixed implications for the industries and countries in which we compete. In general, lower oil prices are expected to stimulate growth in oil importing countries while causing negative economic effects in many energy-exporting countries. Certain parts of our Oil & Gas business will experience declines in orders and pricing pressures, while we expect that other parts will be largely unaffected. In response to this uncertain industry outlook, we have implemented cost actions and increased our focus on productivity. We expect that low oil prices will benefit our other businesses through lower direct material and other variable costs as well as through the expected stimulus-effect on growth in the U.S. and in other economies that rely on energy imports, including Europe, Japan, and India.
EMPLOYEE MATTERS
Approximately 16,400 GE manufacturing and service employees in the United States are represented for collective bargaining purposes by one of 11 unions (approximately 82 different locals within such unions). A majority of such employees are represented by union locals that are affiliated with the IUE-CWA, The Industrial Division of the Communication Workers of America, AFL-CIO, CLC. During 2011, we negotiated four-year agreements with most of our U.S. unions. Most of these contracts will terminate in June 2015, and we will be engaged in negotiations to attain new agreements. While results of 2015 union negotiations cannot be predicted, our recent past negotiations have resulted in agreements that increased costs.
GE 2014 FORM 10-K 84
MD&A | CRITICAL ACCOUNTING ESTIMATES |
CRITICAL ACCOUNTING ESTIMATES
Accounting estimates and assumptions discussed in this section are those that we consider to be the most critical to an understanding of our financial statements because they involve significant judgments and uncertainties. Many of these estimates include determining fair value. All of these estimates reflect our best judgment about current, and for some estimates future, economic and market conditions and their potential effects based on information available as of the date of these financial statements. If these conditions change from those expected, it is reasonably possible that the judgments and estimates described below could change, which may result in future impairments of investment securities, goodwill, intangibles and long-lived assets, incremental losses on financing receivables, increases in reserves for contingencies, establishment of valuation allowances on deferred tax assets and increased tax liabilities, among other effects. Also see Note 1 to the consolidated financial statements in this Form 10-K Report, which discusses our most significant accounting policies.
LOSSES ON FINANCING RECEIVABLES
Losses on financing receivables are recognized when they are incurred, which requires us to make our best estimate of probable losses inherent in the portfolio. The method for calculating the best estimate of losses depends on the size, type and risk characteristics of the related financing receivable. Such an estimate requires consideration of historical loss experience, adjusted for current conditions, and judgments about the probable effects of relevant observable data, including present economic conditions such as delinquency rates, financial health of specific customers and market sectors, collateral values (including housing price indices, as applicable), and the present and expected future levels of interest rates. The underlying assumptions, estimates and assessments we use to provide for losses are updated to reflect our view of current conditions and are subject to the regulatory examination process, which can result in changes to our assumptions. Changes in such estimates can significantly affect the allowance and provision for losses. It is possible that we will experience credit losses that are different from our current estimates. Write-offs in both our consumer and commercial portfolios can also reflect both losses that are incurred subsequent to the beginning of a fiscal year and information becoming available during that fiscal year that may identify further deterioration on exposures existing prior to the beginning of that fiscal year, and for which reserves could not have been previously recognized. Our risk management process includes standards and policies for reviewing major risk exposures and concentrations, and evaluates relevant data either for individual loans or financing leases, or on a portfolio basis, as appropriate.
Further information is provided in the Global Risk Management section and Statement of Financial Position – Financing Receivables section within the MD&A of this Form 10-K, the Asset Impairment section that follows and in Notes 1 and 6 to the consolidated financial statements in this Form 10-K Report.
REVENUE RECOGNITION ON LONG-TERM PRODUCT SERVICES AGREEMENTS
Revenue recognition on long-term product services agreements requires estimates of profits over the multiple-year terms of such agreements, considering factors such as the frequency and extent of future monitoring, maintenance and overhaul events; the amount of personnel, spare parts and other resources required to perform the services; and future billing rate, cost changes and customers' utilization of assets. We routinely review estimates under product services agreements and regularly revise them to adjust for changes in outlook.
GE 2014 FORM 10-K 85
MD&A | CRITICAL ACCOUNTING ESTIMATES |
We also regularly assess customer credit risk inherent in the carrying amounts of receivables and contract costs and estimated earnings, including the risk that contractual penalties may not be sufficient to offset our accumulated investment in the event of customer termination. We gain insight into future utilization and cost trends, as well as credit risk, through our knowledge of the installed base of equipment and the close interaction with our customers that comes with supplying critical services and parts over extended periods. Revisions may affect a product services agreement's total estimated profitability resulting in an adjustment of earnings; such adjustments increased earnings by $1.0 billion, $0.3 billion and $0.4 billion in 2014, 2013 and 2012, respectively. We provide for probable losses when they become evident.
Further information is provided in Notes 1 and 9 to the consolidated financial statements in this Form 10-K Report.
ASSET IMPAIRMENT
Asset impairment assessment involves various estimates and assumptions as follows:
INVESTMENTS
We regularly review investment securities for impairment using both quantitative and qualitative criteria. For debt securities, if we do not intend to sell the security and it is not more likely than not that we will be required to sell the security before recovery of our amortized cost, we evaluate other qualitative criteria to determine whether a credit loss exists, such as the financial health of and specific prospects for the issuer, including whether the issuer is in compliance with the terms and covenants of the security. Quantitative criteria include determining whether there has been an adverse change in expected future cash flows. For equity securities, our criteria include the length of time and magnitude of the amount that each security is in an unrealized loss position. Our other-than-temporary impairment reviews involve our finance, risk and asset management functions as well as the portfolio management and research capabilities of our internal and third-party asset managers. See Note 1 to the consolidated financial statements in this Form 10-K Report, which discusses the determination of fair value of investment securities.
Further information about actual and potential impairment losses is provided in Notes 1, 3 and 9 to the consolidated financial statements in this Form 10-K Report.
LONG-LIVED ASSETS
We review long-lived assets for impairment whenever events or changes in circumstances indicate that the related carrying amounts may not be recoverable. Determining whether an impairment has occurred typically requires various estimates and assumptions, including determining which undiscounted cash flows are directly related to the potentially impaired asset, the useful life over which cash flows will occur, their amount, and the asset's residual value, if any. In turn, measurement of an impairment loss requires a determination of fair value, which is based on the best information available. We derive the required undiscounted cash flow estimates from our historical experience and our internal business plans. To determine fair value, we use quoted market prices when available, our internal cash flow estimates discounted at an appropriate interest rate and independent appraisals, as appropriate.
Our operating lease portfolio of commercial aircraft is a significant concentration of assets in GE Capital, and is particularly subject to market fluctuations. Therefore, we test recoverability of each aircraft in our operating lease portfolio at least annually. Additionally, we perform quarterly evaluations in circumstances such as when aircraft are re-leased, current lease terms have changed or a specific lessee's credit standing changes. We consider market conditions, such as global demand for commercial aircraft. Estimates of future rentals and residual values are based on historical experience and information received routinely from independent appraisers. Estimated cash flows from future leases are reduced for expected downtime between leases and for estimated technical costs required to prepare aircraft to be redeployed. Fair value used to measure impairment is based on management's best estimate. In determining its best estimate, management evaluates average current
GE 2014 FORM 10-K 86
MD&A | CRITICAL ACCOUNTING ESTIMATES |
market values (obtained from third parties) of similar type and age aircraft, which are adjusted for the attributes of the specific aircraft under lease.
We recognized impairment losses on our operating lease portfolio of commercial aircraft of $0.4 billion and $0.7 billion in 2014 and 2013, respectively. Impairment losses in 2014 primarily related to regional jets and older technology aircraft. The average age of aircraft we impaired in 2014 was 17 years compared with 7 years for our total fleet. Provisions for losses on financing receivables related to commercial aircraft were an insignificant amount for both 2014 and 2013.
Further information on impairment losses and our exposure to the commercial aviation industry is provided in Notes 7 and 24 to the consolidated financial statements in this Form 10-K Report.
REAL ESTATE
We review the estimated value of our commercial real estate investments annually, or more frequently as conditions warrant. The cash flow estimates used for both estimating value and the recoverability analysis are inherently judgmental, and reflect current and projected lease profiles, available industry information about expected trends in rental, occupancy and capitalization rates and expected business plans, which include our estimated holding period for the asset. Our portfolio is diversified, both geographically and by asset type. However, the global real estate market is subject to periodic cycles that can cause significant fluctuations in market values. Based on the most recent valuation estimates available, the carrying value of our Real Estate investments exceeded their estimated value by about $1.2 billion. This amount is subject to variation dependent on the assumptions described above, changes in economic and market conditions and composition of our portfolio, including sales. Commercial real estate valuations have shown signs of improved stability and liquidity in certain markets, primarily in the U.S. and Japan; however, the pace of improvement varies significantly by asset class and market. Accordingly, there continues to be risk and uncertainty surrounding commercial real estate values. Declines in the estimated value of real estate below carrying amount result in impairment losses when the aggregate undiscounted cash flow estimates used in the estimated value measurement are below the carrying amount. As such, estimated losses in the portfolio will not necessarily result in recognized impairment losses. When we recognize an impairment, the impairment is measured using the estimated fair value of the underlying asset, which is based upon cash flow estimates that reflect current and projected lease profiles and available industry information about capitalization rates and expected trends in rents and occupancy and is corroborated by external appraisals. Real Estate recognized pre-tax impairments of $0.3 billion in its real estate held for investment in both 2014 and 2013. Deterioration in economic conditions or prolonged market illiquidity may result in further impairments being recognized. Furthermore, significant judgment and uncertainty related to forecasted valuation trends, especially in illiquid markets, result in inherent imprecision in real estate value estimates.
Further information is provided in the Risk Management section and in Note 9 to the consolidated financial statements in this Form 10-K Report.
GOODWILL AND OTHER IDENTIFIED INTANGIBLE ASSETS
We test goodwill for impairment annually in the third quarter of each year using data as of July 1 of that year. The impairment test consists of two steps: in step one, the carrying value of the reporting unit is compared with its fair value; in step two, which is applied when the carrying value is more than its fair value, the amount of goodwill impairment, if any, is derived by deducting the fair value of the reporting unit's assets and liabilities from the fair value of its equity, and comparing that amount with the carrying amount of goodwill. We determined fair values for each of the reporting units using the market approach, when available and appropriate, or the income approach, or a combination of both. We assess the valuation methodology based upon the relevance and availability of the data at the time we perform the valuation. If multiple valuation methodologies are used, the results are weighted appropriately.
GE 2014 FORM 10-K 87
MD&A | CRITICAL ACCOUNTING ESTIMATES |
Valuations using the market approach are derived from metrics of publicly traded companies or historically completed transactions of comparable businesses. The selection of comparable businesses is based on the markets in which the reporting units operate giving consideration to risk profiles, size, geography, and diversity of products and services. A market approach is limited to reporting units for which there are publicly traded companies that have the characteristics similar to our businesses.
Under the income approach, fair value is determined based on the present value of estimated future cash flows, discounted at an appropriate risk-adjusted rate. We use our internal forecasts to estimate future cash flows and include an estimate of long-term future growth rates based on our most recent views of the long-term outlook for each business. Actual results may differ from those assumed in our forecasts. We derive our discount rates using a capital asset pricing model and analyzing published rates for industries relevant to our reporting units to estimate the cost of equity financing. We use discount rates that are commensurate with the risks and uncertainty inherent in the respective businesses and in our internally developed forecasts. Discount rates used in our reporting unit valuations ranged from 9.0% to 16.0%.
During the third quarter of 2014, as noted above, we performed our annual impairment test of goodwill for all of our reporting units. Based on the results of our step one testing, the fair values of each of the GE reporting units exceeded their carrying values; therefore, the second step of the impairment test was not required to be performed for any of our reporting units and no goodwill impairment was recognized.
While all of our reporting units passed step one of our annual impairment testing, we identified one reporting unit for which the fair value was not substantially in excess of its carrying value. Within our Energy Management operating segment, the Power Conversion reporting unit was determined to have a fair value in excess of its carrying value by approximately 10%. The goodwill associated with the Power Conversion reporting unit was $1.5 billion at December 31, 2014, representing approximately 2% of our total goodwill. While the goodwill of the reporting unit is not currently impaired, there could be an impairment in the future as a result of changes in certain estimates and assumptions. For example, the reporting unit's fair value could be adversely affected and result in an impairment of goodwill if actual cash flows are below estimated cash flows, the estimated cash flows are discounted at a higher risk-adjusted rate or market multiples decrease.
As of December 31, 2014, we believe that the goodwill is recoverable for all of the reporting units; however, there can be no assurances that the goodwill will not be impaired in future periods.
In 2013, while the Real Estate reporting unit's book value was within the range of its fair value, we further substantiated our Real Estate goodwill balance by performing the second step analysis in which the implied fair value of goodwill exceeded its carrying value by approximately $3.7 billion. In the current year, it was determined that the second step was not required, as the results of step one indicated that the fair value of the Real Estate reporting unit exceeded its book value.
Estimating the fair value of reporting units requires the use of estimates and significant judgments that are based on a number of factors including actual operating results. It is reasonably possible that the judgments and estimates described above could change in future periods.
We review identified intangible assets with defined useful lives and subject to amortization for impairment whenever events or changes in circumstances indicate that the related carrying amounts may not be recoverable. Determining whether an impairment loss occurred requires comparing the carrying amount to the sum of undiscounted cash flows expected to be generated by the asset. We test intangible assets with indefinite lives annually for impairment using a fair value method such as discounted cash flows. For our insurance activities remaining in continuing operations, we periodically test for impairment our deferred acquisition costs and present value of future profits.
GE 2014 FORM 10-K 88
MD&A | CRITICAL ACCOUNTING ESTIMATES |
PENSION ASSUMPTIONS
Pension assumptions are significant inputs to the actuarial models that measure pension benefit obligations and related effects on operations. Two assumptions – discount rate and expected return on assets – are important elements of plan expense and asset/liability measurement. We evaluate these critical assumptions at least annually on a plan and country-specific basis. We periodically evaluate other assumptions involving demographic factors such as retirement age, mortality and turnover, and update them to reflect our experience and expectations for the future. Actual results in any given year will often differ from actuarial assumptions because of economic and other factors.
Accumulated and projected benefit obligations are measured as the present value of expected payments. We discount those cash payments using the weighted average of market-observed yields for high-quality fixed-income securities with maturities that correspond to the payment of benefits. Lower discount rates increase present values and subsequent-year pension expense; higher discount rates decrease present values and subsequent-year pension expense.
Our discount rates for principal pension plans at December 31, 2014, 2013 and 2012 were 4.02%, 4.85% and 3.96%, respectively, reflecting market interest rates.
To determine the expected long-term rate of return on pension plan assets, we consider current and target asset allocations, as well as historical and expected returns on various categories of plan assets. In developing future long-term return expectations for our principal benefit plans' assets, we formulate views on the future economic environment, both in the U.S. and abroad. We evaluate general market trends and historical relationships among a number of key variables that impact asset class returns such as expected earnings growth, inflation, valuations, yields and spreads, using both internal and external sources. We also take into account expected volatility by asset class and diversification across classes to determine expected overall portfolio results given current and target allocations. Assets in our principal pension plans earned 5.9% in 2014, and had average annual returns of 9.0%, 5.9%, and 8.4% per year in the 5-, 10- and 25-year periods ended December 31, 2014, respectively. The average historical 10- and 25- returns were significantly affected by investment losses in 2008. Based on our analysis of future expectations of asset performance, past return results, and our current and target asset allocations, we have assumed a 7.5% long-term expected return on those assets for cost recognition in 2015 compared to 7.5% in 2014 and 8.0% in 2013 and 2012.
Changes in key assumptions for our principal pension plans would have the following effects.
| Discount rate – A 25 basis point increase in discount rate would decrease pension cost in the following year by $0.2 billion and would decrease the pension benefit obligation at year-end by about $2.3 billion. |
| Expected return on assets – A 50 basis point decrease in the expected return on assets would increase pension cost in the following year by $0.2 billion. |
GE 2014 FORM 10-K 89
MD&A | CRITICAL ACCOUNTING ESTIMATES |
INCOME TAXES
Our annual tax rate is based on our income, statutory tax rates and tax planning opportunities available to us in the various jurisdictions in which we operate. Tax laws are complex and subject to different interpretations by the taxpayer and respective governmental taxing authorities. Significant judgment is required in determining our tax expense and in evaluating our tax positions, including evaluating uncertainties. We review our tax positions quarterly and adjust the balances as new information becomes available. Our income tax rate is significantly affected by the tax rate on our global operations. In addition to local country tax laws and regulations, this rate depends on the extent earnings are indefinitely reinvested outside the United States. Indefinite reinvestment is determined by management's judgment about and intentions concerning the future operations of the Company. At December 31, 2014 and 2013, approximately $119 billion and $110 billion of earnings, respectively, have been indefinitely reinvested outside the United States. Most of these earnings have been reinvested in active non-U.S. business operations, and we do not intend to repatriate these earnings to fund U.S. operations. Because of the availability of U.S. foreign tax credits, it is not practicable to determine the U.S. federal income tax liability that would be payable if such earnings were not reinvested indefinitely.
Deferred income tax assets represent amounts available to reduce income taxes payable on taxable income in future years. Such assets arise because of temporary differences between the financial reporting and tax bases of assets and liabilities, as well as from net operating loss and tax credit carryforwards. We evaluate the recoverability of these future tax deductions and credits by assessing the adequacy of future expected taxable income from all sources, including reversal of taxable temporary differences, forecasted operating earnings and available tax planning strategies. These sources of income rely heavily on estimates. We use our historical experience and our short- and long-range business forecasts to provide insight. Further, our global and diversified business portfolio gives us the opportunity to employ various prudent and feasible tax planning strategies to facilitate the recoverability of future deductions. Amounts recorded for deferred tax assets related to non-U.S. net operating losses, net of valuation allowances, were $5.5 billion at both December 31, 2014 and 2013, including $0.6 billion and $0.8 billion at December 31, 2014 and 2013, respectively, of deferred tax assets, net of valuation allowances, associated with losses reported in discontinued operations, primarily related to our loss on the sale of GE Money Japan. Such year-end 2014 amounts are expected to be fully recoverable within the applicable statutory expiration periods. To the extent we do not consider it more likely than not that a deferred tax asset will be recovered, a valuation allowance is established.
Further information on income taxes is provided in the Other Consolidated Information – Income Taxes section within the MD&A and in Note 14 to the consolidated financial statements in this Form 10-K Report.
DERIVATIVES AND HEDGING
We use derivatives to manage a variety of risks, including risks related to interest rates, foreign exchange and commodity prices. Accounting for derivatives as hedges requires that, at inception and over the term of the arrangement, the hedged item and related derivative meet the requirements for hedge accounting. The rules and interpretations related to derivatives accounting are complex. Failure to apply this complex guidance correctly will result in all changes in the fair value of the derivative being reported in earnings, without regard to the offsetting changes in the fair value of the hedged item.
In evaluating whether a particular relationship qualifies for hedge accounting, we test effectiveness at inception and each reporting period thereafter by determining whether changes in the fair value of the derivative offset, within a specified range, changes in the fair value of the hedged item. If fair value changes fail this test, we discontinue applying hedge accounting to that relationship prospectively. Fair values of both the derivative instrument and the hedged item are calculated using internal valuation models incorporating market-based assumptions, subject to third-party confirmation, as applicable.
GE 2014 FORM 10-K 90
MD&A | CRITICAL ACCOUNTING ESTIMATES |
FAIR VALUE MEASUREMENTS
Assets and liabilities measured at fair value every reporting period include investments in debt and equity securities and derivatives. Assets that are not measured at fair value every reporting period but that are subject to fair value measurements in certain circumstances include loans and long-lived assets that have been reduced to fair value when they are held for sale, impaired loans that have been reduced based on the fair value of the underlying collateral, cost and equity method investments and long-lived assets that are written down to fair value when they are impaired and the remeasurement of retained investments in formerly consolidated subsidiaries upon a change in control that results in deconsolidation of a subsidiary, if we sell a controlling interest and retain a noncontrolling stake in the entity. Assets that are written down to fair value when impaired and retained investments are not subsequently adjusted to fair value unless further impairment occurs.
A fair value measurement is determined as the price we would receive to sell an asset or pay to transfer a liability in an orderly transaction between market participants at the measurement date. In the absence of active markets for the identical assets or liabilities, such measurements involve developing assumptions based on market observable data and, in the absence of such data, internal information that is consistent with what market participants would use in a hypothetical transaction that occurs at the measurement date. The determination of fair value often involves significant judgments about assumptions such as determining an appropriate discount rate that factors in both risk and liquidity premiums, identifying the similarities and differences in market transactions, weighting those differences accordingly and then making the appropriate adjustments to those market transactions to reflect the risks specific to our asset being valued.
Further information on fair value measurements is provided in Notes 1, 21 and 22 to the consolidated financial statements in this Form 10-K Report.
OTHER LOSS CONTINGENCIES
Other loss contingencies are uncertain and unresolved matters that arise in the ordinary course of business and result from events or actions by others that have the potential to result in a future loss. Such contingencies include, but are not limited to environmental obligations, litigation, regulatory proceedings, product quality and losses resulting from other events and developments.
When a loss is considered probable and reasonably estimable, we record a liability in the amount of our best estimate for the ultimate loss. When there appears to be a range of possible costs with equal likelihood, liabilities are based on the low-end of such range. However, the likelihood of a loss with respect to a particular contingency is often difficult to predict and determining a meaningful estimate of the loss or a range of loss may not be practicable based on the information available and the potential effect of future events and decisions by third parties that will determine the ultimate resolution of the contingency. Moreover, it is not uncommon for such matters to be resolved over many years, during which time relevant developments and new information must be continuously evaluated to determine both the likelihood of potential loss and whether it is possible to reasonably estimate a range of possible loss. When a loss is probable but a reasonable estimate cannot be made, disclosure is provided.
Disclosure also is provided when it is reasonably possible that a loss will be incurred or when it is reasonably possible that the amount of a loss will exceed the recorded provision. We regularly review all contingencies to determine whether the likelihood of loss has changed and to assess whether a reasonable estimate of the loss or range of loss can be made. As discussed above, development of a meaningful estimate of loss or a range of potential loss is complex when the outcome is directly dependent on negotiations with or decisions by third parties, such as regulatory agencies, the court system and other interested parties. Such factors bear directly on whether it is possible to reasonably estimate a range of potential loss and boundaries of high and low estimates.
Further information is provided in Notes 2, 13 and 24 to the consolidated financial statements in this Form 10-K Report .
GE 2014 FORM 10-K 91
MD&A | OTHER ITEMS |
OTHER ITEMS
NEW ACCOUNTING STANDARDS
In May 2014, the Financial Accounting Standards Board (FASB) issued Accounting Standards Update (ASU) 2014-09, Revenue from Contracts with Customers , which requires an entity to recognize the amount of revenue to which it expects to be entitled for the transfer of promised goods or services to customers. The ASU will replace most existing revenue recognition guidance in GAAP when it becomes effective. The new standard is effective on January 1, 2017. Early application is not permitted. The standard permits the use of either the retrospective or modified retrospective (cumulative effect) transition method. We are evaluating the effect that ASU 2014-09 will have on our consolidated financial statements and related disclosures. We have not yet selected a transition method nor have we determined the effect of the standard on our ongoing financial reporting.
In February 2015, the FASB issued ASU 2015-02, Amendments to the Consolidation Analysis . The ASU amends the consolidation guidance for VIEs and general partners' investments in limited partnerships and modifies the evaluation of whether limited partnerships and similar legal entities are VIEs or voting interest entities. The ASU is effective for interim and annual reporting periods beginning after December 15, 2015, with early adoption permitted. We are currently evaluating the effect of the ASU on our consolidated financial statements and related disclosures.
ENVIRONMENTAL MATTERS
Our operations, like operations of other companies engaged in similar businesses, involve the use, disposal and cleanup of substances regulated under environmental protection laws. We are involved in a number of remediation actions to clean up hazardous wastes as required by federal and state laws. Such statutes require that responsible parties fund remediation actions regardless of fault, legality of original disposal or ownership of a disposal site. Expenditures for site remediation actions amounted to approximately $0.4 billion in each of the years 2014, 2013 and 2012. We presently expect that such remediation actions will require average annual expenditures of about $0.4 billion in 2015 and $0.3 billion in 2016.
In 2006, we entered into a consent decree with the Environmental Protection Agency (EPA) to dredge PCB-containing sediment from the upper Hudson River. The consent decree provided that the dredging would be performed in two phases. Phase 1 was completed in May through November of 2009. Between Phase 1 and Phase 2 there was an intervening peer review by an independent panel of national experts. The panel evaluated the performance of Phase 1 dredging operations with respect to Phase 1 Engineering Performance Standards and recommended proposed changes to the standards. On December 17, 2010, EPA issued its decision setting forth the final performance standards for Phase 2 of the Hudson River dredging project, incorporating aspects of the recommendations from the independent peer review panel and from GE. In December 2010, we agreed to perform Phase 2 of the project in accordance with the final performance standards set by EPA and increased our reserve by $0.8 billion in the fourth quarter of 2010 to account for the probable and estimable costs of completing Phase 2. In 2012, we completed the first year of Phase 2 dredging and commenced work on planned upgrades to the Hudson River wastewater processing facility. Over the past four years we have dredged 2.2 million cubic yards from the river and, based upon that result and our best professional engineering judgment, we believe that our current reserve continues to reflect our probable and estimable costs for the remainder of Phase 2 of the dredging project.
GE 2014 FORM 10-K 92
MD&A | OTHER ITEMS |
RESEARCH AND DEVELOPMENT
(In millions) | 2014 | 2013 | 2012 | |||||
Total R&D | $ | 5,273 | $ | 5,461 | $ | 5,200 | ||
Less customer funded R&D (principally the U.S. Government) | (721) | (711) | (680) | |||||
Less partner funded R&D | (319) | (107) | (6) | |||||
GE funded R&D | $ | 4,233 | $ | 4,643 | $ | 4,514 | ||
Aviation accounts for the largest share of GE's research and development expenditures with funding from both GE and external funds. Power & Water and Healthcare also made significant expenditures funded primarily by GE.
OTHER
We own, or hold licenses to use, numerous patents. New patents are continuously being obtained through our research and development activities as existing patents expire. Patented inventions are used both within the Company and are licensed to others.
GE is a trademark and service mark of General Electric Company.
Because of the diversity of our products and services, as well as the wide geographic dispersion of our production facilities, we use numerous sources for the wide variety of raw materials needed for our operations. We have not been adversely affected by the inability to obtain raw materials.
Sales of goods and services to agencies of the U.S. Government as a percentage of revenues follow.
2014 | 2013 | 2012 | ||||||
Total sales to U.S. Government agencies | 3 | % | 3 | % | 3 | % | ||
Aviation segment defense-related sales | 2 | 2 | 3 | |||||
GE 2014 FORM 10-K 93
MD&A | SUPPLEMENTAL INFORMATION |
SUPPLEMENTAL INFORMATION
FINANCIAL MEASURES THAT SUPPLEMENT U.S. GENERALLY ACCEPTED ACCOUNTING PRINCIPLES MEASURES (NON-GAAP FINANCIAL MEASURES)
We sometimes use information derived from consolidated financial information but not presented in our financial statements prepared in accordance with U.S. generally accepted accounting principles (GAAP). Certain of these data are considered "non-GAAP financial measures" under U.S. Securities and Exchange Commission rules. Specifically, we have referred, in various sections of this Form 10-K Report, to:
| Operating earnings, operating EPS and operating EPS excluding the effects of the 2011 preferred stock redemption, and Industrial operating earnings |
| Industrial segment organic revenue growth |
| Industrial cash flows from operating activities (Industrial CFOA) and GE CFOA excluding the effects of NBCU deal-related taxes |
| Free cash flow |
| Operating and non-operating pension costs (income) |
| Average GE shareowners' equity, excluding effects of discontinued operations |
| Industrial return on total capital (Industrial ROTC) |
| Ratio of adjusted debt to equity at GECC, net of liquidity |
| GE pre-tax earnings from continuing operations, excluding GECC earnings from continuing operations and the corresponding effective tax rates, and the reconciliation of the U.S. federal statutory income tax rate to GE effective tax rate, excluding GECC earnings |
| GE Capital ending net investment (ENI), excluding liquidity |
| GECC Tier 1 Common Ratio Estimate |
GE 2014 FORM 10-K 94
MD&A | SUPPLEMENTAL INFORMATION |
OPERATING EARNINGS, OPERATING EPS AND OPERATING EPS EXCLUDING THE EFFECTS OF THE 2011 PREFERRED STOCK REDEMPTION | ||||||||||||||
(In millions; except earnings per share) | 2014 | 2013 | 2012 | 2011 | 2010 | |||||||||
Earnings from continuing operations attributable to GE | $ | 15,345 | $ | 15,177 | $ | 14,624 | $ | 14,122 | $ | 12,577 | ||||
Adjustment (net of tax): non-operating pension costs (income) | 1,378 | 1,705 | 1,386 | 688 | (204) | |||||||||
Operating earnings | $ | 16,723 | $ | 16,882 | $ | 16,010 | $ | 14,810 | $ | 12,373 | ||||
Earnings per share – diluted(a) | ||||||||||||||
Continuing earnings per share | $ | 1.51 | $ | 1.47 | $ | 1.38 | $ | 1.23 | $ | 1.15 | ||||
Adjustment (net of tax): non-operating pension costs (income) | 0.14 | 0.16 | 0.13 | 0.06 | (0.02) | |||||||||
Operating earnings per share | 1.65 | 1.64 | 1.51 | 1.30 | 1.13 | |||||||||
Adjustment: effects of the 2011 preferred stock redemption | - | - | - | 0.08 | - | |||||||||
Operating EPS excluding the effects of the 2011 | ||||||||||||||
preferred stock redemption | $ | 1.65 | $ | 1.64 | $ | 1.51 | $ | 1.37 | $ | 1.13 | ||||
(a) | Earnings-per-share amounts are computed independently. As a result, the sum of per-share amounts may not equal the total. |
INDUSTRIAL OPERATING EARNINGS | |||||
(Dollars in millions) | 2014 | 2013 | |||
Earnings from continuing operations attributable to GE | $ | 15,345 | $ | 15,177 | |
Adjustments (net of tax): non-operating pension costs (income) | 1,378 | 1,705 | |||
Operating earnings | 16,723 | 16,882 | |||
Less GECC earnings from continuing operations attributable to the Company | 7,341 | 8,258 | |||
Less effect of GECC preferred stock dividends | (322) | (298) | |||
Operating earnings excluding GECC earnings from continuing operations | |||||
and the effect of GECC preferred stock dividends (Industrial operating earnings) | $ | 9,704 | $ | 8,922 | |
| |||||
Industrial operating earnings as a percentage of operating earnings | 58% | 53% | |||
GE 2014 FORM 10-K 95
MD&A | SUPPLEMENTAL INFORMATION |
INDUSTRIAL SEGMENT ORGANIC REVENUE GROWTH | ||||||||
(Dollars in millions) | 2014 | 2013 | V% | |||||
Segment revenues: | ||||||||
Power & Water | $ | 27,564 | $ | 24,724 | ||||
Oil & Gas | 18,676 | 16,975 | ||||||
Energy Management | 7,319 | 7,569 | ||||||
Aviation | 23,990 | 21,911 | ||||||
Healthcare | 18,299 | 18,200 | ||||||
Transportation | 5,650 | 5,885 | ||||||
Appliances & Lighting | 8,404 | 8,338 | ||||||
Industrial segment revenues | 109,902 | 103,602 | 6% | |||||
Less the effects of: | ||||||||
Acquisitions, business dispositions (other than dispositions of businesses acquired | ||||||||
for investment) and currency exchange rates | 1,871 | 2,175 | ||||||
Industrial segment revenues excluding effects of acquisitions, business dispositions | ||||||||
(other than dispositions of businesses acquired for investment) and currency exchange | ||||||||
rates (Industrial segment organic revenues) | $ | 108,031 | $ | 101,427 | 7% | |||
(Dollars in millions) | 2013 | 2012 | V% | |||||
Segment revenues: | ||||||||
Power & Water | $ | 24,724 | $ | 28,299 | ||||
Oil & Gas | 16,975 | 15,241 | ||||||
Energy Management | 7,569 | 7,412 | ||||||
Aviation | 21,911 | 19,994 | ||||||
Healthcare | 18,200 | 18,290 | ||||||
Transportation | 5,885 | 5,608 | ||||||
Appliances & Lighting | 8,338 | 7,967 | ||||||
Industrial segment revenues | 103,602 | 102,811 | 1% | |||||
Less the effects of: | ||||||||
Acquisitions, business dispositions (other than dispositions of businesses acquired | ||||||||
for investment) and currency exchange rates | 1,566 | 842 | ||||||
Industrial segment revenues excluding effects of acquisitions, business dispositions | ||||||||
(other than dispositions of businesses acquired for investment) and currency exchange | ||||||||
rates (Industrial segment organic revenues) | $ | 102,036 | $ | 101,969 | -% | |||
GE 2014 FORM 10-K 96
MD&A | SUPPLEMENTAL INFORMATION |
INDUSTRIAL CASH FLOWS FROM OPERATING ACTIVITIES (INDUSTRIAL CFOA) AND GE CFOA EXCLUDING THE EFFECTS OF NBCU DEAL-RELATED TAXES | ||||||||||||||
(In millions) | 2014 | 2013 | 2012 | 2011 | 2010 | |||||||||
Cash from GE's operating activities, as reported | $ | 15,171 | $ | 14,255 | $ | 17,826 | $ | 12,057 | $ | 14,746 | ||||
Less dividends from GECC | 3,000 | 5,985 | 6,426 | - | - | |||||||||
Cash from GE's operating activities, excluding dividends | ||||||||||||||
from GECC (Industrial CFOA) | $ | 12,171 | $ | 8,270 | $ | 11,400 | $ | 12,057 | $ | 14,746 | ||||
Cash from GE's operating activities, as reported | $ | 15,171 | $ | 14,255 | ||||||||||
Adjustment: effects of NBCU deal-related taxes | - | 3,184 | ||||||||||||
GE CFOA excluding effects of NBCU deal-related taxes | $ | 15,171 | $ | 17,439 | ||||||||||
We refer to cash generated by our industrial businesses as "Industrial CFOA," which we define as GE's cash from continuing operating activities less the amount of dividends received by GE from GECC. This includes the effects of intercompany transactions, including GE customer receivables sold to GECC; GECC services for trade receivables management and material procurement; buildings and equipment (including automobiles) leased between GE and GECC; information technology (IT) and other services sold to GECC by GE; aircraft engines manufactured by GE that are installed on aircraft purchased by GECC from third-party producers for lease to others; and various investments, loans and allocations of GE corporate overhead costs. We believe that investors may find it useful to compare GE's operating cash flows without the effect of GECC dividends, since these dividends are not representative of the operating cash flows of our industrial businesses and can vary from period-to-period based upon the results of the financial services businesses. We also believe that investors may find it useful to compare Industrial CFOA excluding the effects of taxes paid related to the NBCU transaction. Management recognizes that these measures may not be comparable to cash flow results of companies that contain both industrial and financial services businesses, but believes that this comparison is aided by the provision of additional information about the amounts of dividends paid by our financial services business and the separate presentation in our financial statements of the Financial Services (GECC) cash flows. We believe that our measures of Industrial CFOA and CFOA excluding NBCU deal-related taxes provide management and investors with useful measures to compare the capacity of our industrial operations to generate operating cash flows with the operating cash flows of other non-financial businesses and companies and as such provide useful measures to supplement the reported GAAP CFOA measure.
FREE CASH FLOW | |||||||||||||||
(Dollars in millions) | 2014 | 2013 | V% | ||||||||||||
Cash from GE's operating activities (continuing operations) | $ | 15,171 | $ | 14,255 | 6% | ||||||||||
Less GE additions to property, plant and equipment | 3,970 | 3,680 | |||||||||||||
Free cash flow | 11,201 | 10,575 | 6% | ||||||||||||
We define free cash flow as GE's cash from operating activities (continuing operations) less GE additions to property, plant and equipment, which are included in cash flows from investing activities. We believe that free cash flow is a useful financial metric to assess our ability to pursue opportunities to enhance our growth. We also believe that presenting free cash flow separately for our industrial businesses provides management and investors with useful information about the trends of our industrial businesses and enables a more direct comparison to other non-financial businesses and companies. Management recognizes that the term free cash flow may be interpreted differently by other companies and under different circumstances. Although this may have an effect on comparability of absolute percentage growth from company to company, we believe that these measures are useful in assessing trends of the respective businesses or companies and may therefore be a useful tool in assessing period-to-period performance trends.
GE 2014 FORM 10-K 97
MD&A | SUPPLEMENTAL INFORMATION |
OPERATING AND NON-OPERATING PENSION COSTS (INCOME) | ||||||||
(In millions) | 2014 | 2013 | 2012 | |||||
Service cost for benefits earned | $ | 1,205 | $ | 1,535 | $ | 1,387 | ||
Prior service cost amortization | 214 | 246 | 279 | |||||
Curtailment loss | 65 | - | - | |||||
Operating pension costs | 1,484 | 1,781 | 1,666 | |||||
Expected return on plan assets | (3,190) | (3,500) | (3,768) | |||||
Interest cost on benefit obligations | 2,745 | 2,460 | 2,479 | |||||
Net actuarial loss amortization | 2,565 | 3,664 | 3,421 | |||||
Non-operating pension costs (income) | 2,120 | 2,624 | 2,132 | |||||
Total principal pension plans costs | $ | 3,604 | $ | 4,405 | $ | 3,798 | ||
We have provided the operating and non-operating components of cost for our principal pension plans. Operating pension costs comprise the service cost of benefits earned, prior service cost amortization and curtailment loss for our principal pension plans. Non-operating pension costs (income) comprise the expected return on plan assets, interest cost on benefit obligations and net actuarial loss amortization for our principal pension plans. We believe that the operating components of pension costs better reflects the ongoing service-related costs of providing pension benefits to our employees. We believe that the operating and non-operating components of cost for our principal pension plans, considered along with the corresponding GAAP measure, provide management and investors with additional information for comparison of our pension plan costs and operating results with the pension plan costs and operating results of other companies.
AVERAGE GE SHAREOWNERS' EQUITY, EXCLUDING EFFECTS OF DISCONTINUED OPERATIONS(a) | ||||||||||||||
December 31 (In millions) | 2014 | 2013 | 2012 | 2011 | 2010 | |||||||||
Average GE shareowners' equity(a) | $ | 131,914 | $ | 124,501 | $ | 120,411 | $ | 122,289 | $ | 116,179 | ||||
Less the effects of the average net investment | ||||||||||||||
in discontinued operations | (167) | (167) | (478) | 4,924 | 13,819 | |||||||||
Average GE shareowners' equity, excluding | ||||||||||||||
effects of discontinued operations(b) | $ | 132,081 | $ | 124,668 | $ | 120,889 | $ | 117,365 | $ | 102,360 | ||||
(a) | On an annual basis, calculated using a five-point average. |
(b) | Used for computing return on average GE shareowners' equity and return on average total capital invested (ROTC). |
Our ROTC calculation excludes earnings (losses) of discontinued operations from the numerator because GAAP requires us to display those earnings (losses) in the Statement of Earnings. Our calculation of average GE shareowners' equity may not be directly comparable to similarly titled measures reported by other companies. We believe that it is a clearer way to measure the ongoing trend in return on total capital for the continuing operations of our businesses given the extent that discontinued operations have affected our reported results. We believe that this results in a more relevant measure for management and investors to evaluate performance of our continuing operations, on a consistent basis, and to evaluate and compare the performance of our continuing operations with the ongoing operations of other businesses and companies.
GE 2014 FORM 10-K 98
MD&A | SUPPLEMENTAL INFORMATION |
INDUSTRIAL RETURN ON TOTAL CAPITAL (INDUSTRIAL ROTC) | |||||||
December 31 (In millions) | 2014 | 2013 | |||||
Earnings from continuing operations | $ | 15,457 | $ | 15,475 | |||
Less GECC earnings from continuing operations | 7,503 | 8,311 | |||||
Plus GE after-tax interest(a) | 1,026 | 866 | |||||
Adjusted Industrial return | $ | 8,980 | $ | 8,030 | |||
Average GE shareholders' equity, excluding effects of discontinued operations(b) | $ | 132,081 | $ | 124,668 | |||
Less average GECC shareholders' equity, excluding effects of discontinued operations(b) | 85,403 | 83,450 | |||||
Average Industrial shareholders' equity, excluding effects of discontinued operations | 46,678 | 41,218 | |||||
Plus average debt (b) | 15,770 | 13,665 | |||||
Plus other, net(c) | 1,743 | 1,367 | |||||
Adjusted Industrial capital | $ | 64,191 | $ | 56,250 | |||
Industrial ROTC | 14.0 | % | 14.3 | % | |||
(a) | GE interest at a 35% tax rate. |
(b) | On an annual basis, calculated using a five-point average. |
(c) | Includes average noncontrolling interests, calculated using a five-point average partially offset by the estimated value of assets held by GE to support GECC. |
Our Industrial ROTC calculation excludes earnings (losses) of discontinued operations from the numerator. We believe that this is a clearer way to measure the ongoing trend in return on Industrial capital for the continuing operations of the business to the extent that discontinued operations have affected our reported results. Our Industrial shareowners' equity used in the denominator is adjusted for debt, noncontrolling interests and the estimated value of assets held by the GE parent to support GECC. We believe that these adjustments provide a more meaningful denominator in measuring the return on our industrial businesses. Industrial ROTC was 14.0% in 2014 versus 14.3% in 2013. In 2014, a 12% increase in the adjusted Industrial return was more than offset by a 14% increase in the adjusted Industrial capital. This increase in capital was principally driven by an increase in year-end 2013 discount rates, which reduced the pension deficit. Our calculation of the return on Industrial capital may not be directly comparable to similarly titled measures reported by other companies. We believe that the adjustments described above result in a more relevant measure for management and investors to evaluate performance of our Industrial continuing operations, on a consistent basis, and to evaluate and compare the performance of our Industrial continuing operations with the continuing operations of other businesses and companies.
GE 2014 FORM 10-K 99
MD&A | SUPPLEMENTAL INFORMATION |
RATIO OF ADJUSTED DEBT TO EQUITY AT GECC, NET OF LIQUIDITY | |||||||||||||||||
December 31 (Dollars in millions) | 2014 | 2013 | 2012 | 2011 | 2010 | 2008 | |||||||||||
GECC debt | $ | 349,548 | $ | 371,062 | $ | 397,039 | $ | 442,830 | $ | 470,363 | $ | 512,744 | |||||
Add debt of businesses held for sale | |||||||||||||||||
and discontinued operations | 2,366 | 316 | 403 | 527 | 575 | 1,859 | |||||||||||
Adjusted GECC debt | 351,914 | 371,378 | 397,442 | 443,357 | 470,938 | 514,603 | |||||||||||
Less liquidity(a) | 75,544 | 74,873 | 61,853 | 76,641 | 60,231 | 37,677 | |||||||||||
Less cash of businesses held for | |||||||||||||||||
sale and discontinued operations | 808 | 236 | 265 | 332 | 222 | 24 | |||||||||||
$ | 275,562 | $ | 296,269 | $ | 335,324 | $ | 366,384 | $ | 410,485 | $ | 476,902 | ||||||
GECC equity | $ | 87,499 | $ | 82,694 | $ | 81,890 | $ | 77,110 | $ | 68,984 | $ | 53,279 | |||||
Ratio | 3.15:1 | 3.58:1 | 4.09:1 | 4.75:1 | 5.95:1 | 8.95:1 | |||||||||||
(a) | Liquidity includes cash and equivalents and $1.2 billion of debt obligations of the U.S Treasury at December 31, 2014. |
GE 2014 FORM 10-K 100
MD&A | SUPPLEMENTAL INFORMATION |
GE PRE-TAX EARNINGS FROM CONTINUING OPERATIONS, EXCLUDING GECC EARNINGS FROM CONTINUING | |||||||||||||||
OPERATIONS AND THE CORRESPONDING EFFECTIVE TAX RATES | |||||||||||||||
(Dollars in millions) | 2014 | 2013 | 2012 | ||||||||||||
GE earnings from continuing operations before income taxes | $ | 16,929 | $ | 17,090 | $ | 16,797 | |||||||||
Less GECC earnings from continuing operations attributable to the Company | 7,341 | 8,258 | 7,345 | ||||||||||||
Total | $ | 9,588 | $ | 8,832 | $ | 9,452 | |||||||||
GE provision for income taxes | $ | 1,634 | $ | 1,668 | $ | 2,013 | |||||||||
GE effective tax rate, excluding GECC earnings | 17.0 | % | 18.9 | % | 21.3 | % | |||||||||
RECONCILIATION OF U.S. FEDERAL STATUTORY INCOME TAX RATE TO GE EFFECTIVE TAX RATE, EXCLUDING GECC EARNINGS | |||||||||||||||
2014 | 2013 | 2012 | |||||||||||||
U.S. federal statutory income tax rate | 35.0 | % | 35.0 | % | 35.0 | % | |||||||||
Reduction in rate resulting from | |||||||||||||||
Tax on global activities including exports | (13.9) | (7.9) | (7.6) | ||||||||||||
U.S. business credits | (1.1) | (2.8) | (1.2) | ||||||||||||
All other – net | (3.0) | (5.4) | (4.9) | ||||||||||||
(18.0) | (16.1) | (13.7) | |||||||||||||
GE effective tax rate, excluding GECC earnings | 17.0 | % | 18.9 | % | 21.3 | % | |||||||||
We believe that the GE effective tax rate is best analyzed in relation to GE earnings before income taxes excluding the GECC net earnings from continuing operations, as GE tax expense does not include taxes on GECC earnings. Management believes that in addition to the Consolidated and GECC tax rates shown in Note 14 to the consolidated financial statements in this Form 10-K Report, this supplemental measure provides investors with useful information as it presents the GE effective tax rate that can be used in comparing the GE results to other non-financial services businesses.
GE 2014 FORM 10-K 101
MD&A | SUPPLEMENTAL INFORMATION |
GE CAPITAL ENDING NET INVESTMENT (ENI), EXCLUDING LIQUIDITY | ||||||||
December 31 (In billions) | 2014 | 2013 | 2008(a) | |||||
Financial Services (GECC) total assets | $ | 494.0 | $ | 512.0 | $ | 661.0 | ||
Adjustment: deferred income taxes | 6.2 | 4.8 | - | |||||
GECC total assets | 500.2 | 516.8 | 661.0 | |||||
Less assets of discontinued operations | 1.2 | 2.3 | 25.1 | |||||
Less non-interest bearing liabilities | 60.5 | 59.3 | 85.4 | |||||
GE Capital ENI | 438.5 | 455.2 | 550.5 | |||||
Less liquidity(b) | 75.5 | 74.9 | 37.7 | |||||
GE Capital ENI, excluding liquidity | $ | 363.0 | $ | 380.3 | $ | 512.8 | ||
(a) | As of January 1, 2009, as originally reported. |
(b) | Liquidity includes cash and equivalents and $1.2 billion of debt obligations of the U.S. Treasury at December 31, 2014 . |
We use ENI to measure the size of our GE Capital segment. We believe that this measure is a useful indicator of the capital (debt or equity) required to fund a business as it adjusts for non-interest bearing current liabilities generated in the normal course of business that do not require a capital outlay. We also believe that by excluding liquidity, we provide a meaningful measure of assets requiring capital to fund our GE Capital segment as a substantial amount of liquidity resulted from debt issuances to pre-fund future debt maturities and will not be used to fund additional assets. Liquidity consists of cash and equivalents and certain debt obligations of the U.S. Treasury. As a general matter, investments included in liquidity are expected to be highly liquid, giving us the ability to readily convert them to cash. Providing this measure will help investors measure how we are performing against our previously communicated goal to reduce the size of our financial services segment. We also believe that presenting our 2008 ENI provides investors with information to better understand the progress we have made toward the goal of making GECC a smaller, more focused finance company.
GECC TIER 1 COMMON RATIO ESTIMATE(a) | ||||||||
December 31 (In billions) | 2014 | 2013 | 2008 | |||||
Shareowners' equity(b) | $ | 87.5 | $ | 82.7 | $ | 53.3 | ||
Adjustments: | ||||||||
Preferred equity | (4.9) | (4.9) | - | |||||
Goodwill and other intangible assets | (26.3) | (27.4) | (29.0) | |||||
Unrealized gain (loss) on investments and hedges | (0.3) | - | 6.2 | |||||
Other additions (deductions) | (0.5) | (0.3) | (0.8) | |||||
GECC Tier 1 common | 55.5 | 50.1 | 29.7 | |||||
Estimated risk-weighted assets(c) | 438.1 | 447.2 | 632.9 | |||||
GECC Tier 1 common ratio estimate | 12.7% | 11.2% | 4.7% | |||||
(a) | Includes discontinued operations for all periods. |
(b) | Total equity excluding noncontrolling interests. |
(c) | Based on Basel 1 risk-weighted assets estimates. |
GE 2014 FORM 10-K 102
OTHER FINANCIAL DATA |
OTHER FINANCIAL DATA
SELECTED FINANCIAL DATA
(Dollars in millions; per-share amounts in dollars) | 2014 | 2013 | 2012 | 2011 | 2010 | ||||||||||||||
General Electric Company and Consolidated Affiliates | |||||||||||||||||||
Revenues and other income | $ | 148,589 | $ | 146,045 | $ | 146,684 | $ | 146,542 | $ | 148,875 | |||||||||
Earnings from continuing operations attributable to the Company | 15,345 | 15,177 | 14,624 | 14,122 | 12,577 | ||||||||||||||
Earnings (loss) from discontinued operations, net of taxes | (112) | (2,120) | (983) | 29 | (933) | ||||||||||||||
Net earnings attributable to the Company | 15,233 | 13,057 | 13,641 | 14,151 | 11,644 | ||||||||||||||
Dividends declared(a) | 8,949 | 8,060 | 7,372 | 7,498 | 5,212 | ||||||||||||||
Return on average GE shareowners' equity(b) | 11.6 | % | 12.2 | % | 12.1 | % | 12.1 | % | 12.3 | % | |||||||||
Per common share | |||||||||||||||||||
Earnings from continuing operations – diluted | $ | 1.51 | $ | 1.47 | $ | 1.38 | $ | 1.23 | $ | 1.15 | |||||||||
Earnings (loss) from discontinued operations – diluted | (0.01) | (0.21) | (0.09) | - | (0.09) | ||||||||||||||
Net earnings – diluted | 1.50 | 1.27 | 1.29 | 1.23 | 1.06 | ||||||||||||||
Earnings from continuing operations – basic | 1.53 | 1.48 | 1.39 | 1.23 | 1.15 | ||||||||||||||
Earnings (loss) from discontinued operations – basic | (0.01) | (0.21) | (0.09) | - | (0.09) | ||||||||||||||
Net earnings – basic | 1.51 | 1.28 | 1.29 | 1.24 | 1.06 | ||||||||||||||
Dividends declared | 0.89 | 0.79 | 0.70 | 0.61 | 0.46 | ||||||||||||||
Stock price range | 27.94-23.69 | 28.09-20.68 | 23.18-18.02 | 21.65-14.02 | 19.70-13.75 | ||||||||||||||
Year-end closing stock price | 25.27 | 28.03 | 20.99 | 17.91 | 18.29 | ||||||||||||||
Cash and equivalents | 90,208 | 88,555 | 77,268 | 84,440 | 78,917 | ||||||||||||||
Total assets of continuing operations | 647,114 | 654,221 | 681,684 | 714,018 | 729,895 | ||||||||||||||
Total assets | 648,349 | 656,560 | 684,999 | 718,003 | 745,426 | ||||||||||||||
Long-term borrowings | 200,414 | 221,665 | 236,084 | 243,459 | 293,323 | ||||||||||||||
Common shares outstanding – average (in thousands) | 10,044,995 | 10,222,198 | 10,522,922 | 10,591,146 | 10,661,078 | ||||||||||||||
Common shareowner accounts – average | 490,000 | 512,000 | 537,000 | 570,000 | 588,000 | ||||||||||||||
Employees at year end(c) | |||||||||||||||||||
United States | 136,000 | 135,000 | 134,000 | 131,000 | 121,000 | ||||||||||||||
Other countries | 169,000 | 172,000 | 171,000 | 170,000 | 152,000 | ||||||||||||||
Total employees(c) | 305,000 | 307,000 | 305,000 | 301,000 | 273,000 | ||||||||||||||
GE data | |||||||||||||||||||
Short-term borrowings | $ | 3,872 |
| $ | 1,841 | $ | 6,041 |
| $ | 2,184 |
| $ | 456 | ||||||
Long-term borrowings | 12,468 |
| 11,515 | 11,428 |
| 9,405 |
| 9,656 | |||||||||||
Noncontrolling interests | 825 |
| 836 | 777 |
| 1,006 |
| 4,098 | |||||||||||
GE shareowners' equity | 128,159 |
| 130,566 | 123,026 |
| 116,438 |
| 118,936 |
| ||||||||||
Total capital invested | $ | 145,324 |
| $ | 144,758 | $ | 141,272 |
| $ | 129,033 |
| $ | 133,146 |
| |||||
Return on average total capital invested(b)* | 10.6 | % | 11.3 | % | 11.7 | % | 11.7 | % | 12.0 | % | |||||||||
Borrowings as a percentage of total capital invested(b) | 11.2 | % | 9.2 | % | 12.4 | % | 9.0 | % | 7.6 | % | |||||||||
GECC data | |||||||||||||||||||
Revenues | $ | 42,725 |
| $ | 44,067 | $ | 45,364 |
| $ | 48,324 |
| $ | 49,163 |
| |||||
Earnings from continuing operations attributable to GECC | 7,341 |
| 8,258 | 7,345 |
| 6,480 |
| 3,083 |
| ||||||||||
Earnings (loss) from discontinued operations, net of taxes, | |||||||||||||||||||
attributable to GECC | (107) | (2,054) | (1,130) | 30 | (928) | ||||||||||||||
Net earnings attributable to GECC | 7,234 |
| 6,204 | 6,215 |
| 6,510 |
| 2,155 |
| ||||||||||
Net earnings attributable to GECC common shareowner | 6,912 | 5,906 | 6,092 | 6,510 | 2,155 | ||||||||||||||
GECC shareowners' equity | 87,499 |
| 82,694 | 81,890 |
| 77,110 |
| 68,984 |
| ||||||||||
Total borrowings and bank deposits | 349,548 | 371,062 | 397,039 |
| 442,830 |
| 470,363 | ||||||||||||
Ratio of debt to equity at GECC(d)* | 3.99:1 | 4.49:1 | 4.85:1 | 5.74:1 | 6.82:1 | ||||||||||||||
Total assets(e) | $ | 500,216 | $ | 516,829 | $ | 539,351 |
| $ | 584,643 |
| $ | 605,365 | |||||||
Transactions between GE and GECC have been eliminated from the consolidated information.
| (a) | Included $1,031 million of preferred stock dividends ($806 million related to our preferred stock redemption) in 2011 and $300 million in 2010. |
| (b) | Indicates terms are defined in the Glossary. |
| (c) | Excludes NBC Universal employees of 14,000 in 2010. |
| (d) | Ratios of 3.15:1, 3.58:1, 4.09:1, 4.75:1, and 5.95:1 for 2014, 2013, 2012, 2011 and 2010, respectively, net of liquidity. For purposes of these ratios, cash and debt balances have been adjusted to include amounts classified as assets and liabilities of businesses held for sale and discontinued operations. |
| (e) | GECC's total assets excludes deferred income tax liabilities, which are presented as assets for purposes of our consolidating balance sheet presentation. |
GE 2014 FORM 10-K 103
>
OTHER FINANCIAL DATA |
PURCHASES OF EQUITY SECURITIES BY THE ISSUER AND AFFILIATED PURCHASERS
Approximate | |||||||||||
dollar value | |||||||||||
Total number | of shares that | ||||||||||
of shares | may yet be | ||||||||||
purchased | purchased | ||||||||||
as part of | under our | ||||||||||
Total number | Average | our share | share | ||||||||
of shares | price paid | repurchase | repurchase | ||||||||
Period(a) | purchased | (a)(b) | per share | program | (a)(c) | program | |||||
(Shares in thousands) | |||||||||||
2014 | |||||||||||
October | 897 | $ | 25.21 | 831 | |||||||
November | 1,900 | $ | 26.23 | 1,820 | |||||||
December | 3,042 | $ | 25.03 | 2,972 | |||||||
Total | 5,839 | $ | 25.45 | 5,623 | $ | 10.4 | billion | ||||
| (a) | Information is presented on a fiscal calendar basis, consistent with our quarterly financial reporting. |
| (b) | This category included 216 thousand shares repurchased from our various benefit plans. |
| (c) | Shares are repurchased through the 2007 GE Share Repurchase Program (the Program). As of December 31, 2014, we were authorized to repurchase up to $35 billion of our common stock through 2015 and we had repurchased a total of approximately $24.6 billion under the Program. The Program is flexible and shares are acquired with a combination of borrowings and free cash flow from the public markets and other sources, including GE Stock Direct, a stock purchase plan that is available to the public . |
GE 2014 FORM 10-K 104
REGULATIONS AND SUPERVISION |
REGULATIONS AND SUPERVISION
GECC is a regulated savings and loan holding company and in 2011 became subject to Federal Reserve Board (FRB) supervision under the Dodd-Frank Wall Street Reform and Consumer Protection Act (DFA). In 2013, the U.S. Financial Stability Oversight Council (FSOC) designated GECC as a nonbank systemically important financial institution (nonbank SIFI) under the DFA. As a result of this change in supervision and designation, stricter prudential regulatory standards and supervision apply to GECC. On November 25, 2014 the FRB proposed for comment enhanced prudential standards that would apply to GECC as a nonbank SIFI. This proposal would, among other items, require GECC to comply with rules on capital and liquidity adequacy that apply to large bank holding companies, market terms requirements for intercompany transactions and enhanced risk management and governance requirements. The proposed standards would also apply stress testing and capital planning requirements to GECC under the FRB's comprehensive capital analysis and review (CCAR) regulations. The comment period for the proposed standards closed on February 2, 2015, and the exact application of the proposed standards will not be known until after the final rule is published.
While the proposed enhanced prudential standards do not subject GECC to the Federal Reserve's capital plan rule applicable to large bank holding companies until the capital planning cycle beginning January 1, 2016, GECC does undertake an annual review of their capital adequacy prior to establishing a plan for dividends to us, the parent. This review is based on a forward-looking assessment of their material enterprise risks and involves the consideration of a number of factors. This analysis also includes an assessment of their capital and liquidity levels, as well as incorporating risk management and governance considerations. The most recent capital adequacy review was approved by the GECC board of directors and the GE Board of Directors Risk Committee in 2014. While a savings and loan holding company and nonbank SIFI like GECC is currently not required to obtain FRB approval to pay a dividend, it may not, under FRB regulations, conduct its operations in an unsafe or unsound manner. The FRB has articulated factors that it expects boards of directors of bank holding companies and savings and loan holding companies to consider in determining whether to pay a dividend.
In addition to the proposed enhanced prudential standards, as a non-bank SIFI GECC is also required to submit an annual resolution plan to the FRB and Federal Deposit Insurance Corporation (FDIC). GECC submitted its first resolution plan to the FRB and FDIC on June 30, 2014. GECC's resolution plan describes how they could be resolved under existing insolvency regimes in a manner that mitigates potential disruption to the U.S. financial system and the global financial markets without the use of government support or taxpayer funds. If the FRB and FDIC determine that their resolution plan is deficient, the Dodd-Frank Act authorizes the FRB and FDIC to impose more stringent capital, leverage or liquidity requirements on GECC or restrict their growth or activities until they submit a plan remedying the deficiencies. If the FRB and FDIC ultimately determine that GECC has not adequately addressed the deficiencies, they could order GECC to divest assets or operations in order to facilitate their orderly resolution in the event of their failure.
GE 2014 FORM 10-K 105
>
REGULATIONS AND SUPERVISION |
GE Money Bank, Czech Republic (GEMB CZ) is a full-service retail bank in the Czech Republic and a subsidiary of General Electric Capital Corporation. GEMB CZ maintains a $7.5 million line of credit and three cash accounts for DF DeutscheForfait s.r.o., a Czech company (DF Sub), which purchases receivables from imports and exports in Central and Eastern Europe. DF Sub is a subsidiary of DF Deutsche Forfait AG, a German company (DF Parent). On February 6, 2014, DF Parent was added to the specially designated nationals and blocked persons (SDN List) of the Office of Foreign Assets Control (OFAC) pursuant to E.O. 13382. The accounts at GEMB CZ for DF Sub pre-date this designation. Following the designation, GEMB CZ terminated its relationship with DF Sub. We believe that the transactions with DF Sub were permissible and do not violate U.S. law.
GE 2014 FORM 10-K 106
RISK MANAGEMENT |
RISK MANAGEMENT
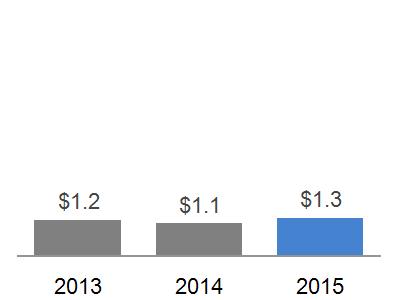
GE 2014 FORM 10-K 107
RISK MANAGEMENT |
RESPONSIBILITIES
GE BOARD OF DIRECTORS
The GE Board of Directors (Board) has oversight for risk management with a focus on the most significant risks facing the Company, including strategic, operational, financial and legal and compliance risks. At the end of each year, management and the Board jointly develop a list of major risks that GE plans to prioritize in the next year. Throughout the year, the Board and the committees to which it has delegated responsibility dedicate a portion of their meetings to review and discuss specific risk topics in greater detail. Strategic, operational and reputational risks are presented and discussed in the context of the CEO's report on operations to the Board at regularly scheduled Board meetings and at presentations to the Board and its committees by the vice chairmen, GE and GECC Chief Risk Officers (CROs), general counsel and other employees.
COMMITTEES
The Board has delegated responsibility for the oversight of specific risks to Board committees as follows:
THE AUDIT COMMITTEE oversees GE's and GE Capital's policies and processes relating to the financial statements, the financial reporting process, compliance and auditing. The Audit Committee, in coordination with the GE Risk Committee, discusses with management the Company's risk assessment and risk management practices and, when reviewing and approving the annual audit plan for the internal audit functions, prioritizes audit focus areas based on their potential risk to the Company. The Audit Committee oversees the Company's cybersecurity program and related risks, and monitors ongoing compliance issues and matters. The Audit Committee jointly meets with the GECC Board once a year, which is in addition to an annual joint meeting of the GE Risk Committee and Audit Committee.
THE GOVERNANCE & PUBLIC AFFAIRS COMMITTEE oversees risk related to the Company's governance structure and processes and risks arising from related-person transactions, reviews and discusses with management risks related to GE's public policy initiatives and activities, and monitors the Company's environmental, health and safety compliance and related risks.
T HE MANAGEMENT DEVELOPMENT & COMPENSATION COMMITTEE oversees the risk management associated with management resources, structure, succession planning, management development and selection processes, and includes separate reviews of incentive compensation arrangements at GE and GE Capital to confirm that incentive pay does not encourage unnecessary and excessive risk taking and to review and discuss, at least annually, the relationship between risk management policies and practices, corporate strategy and senior executive compensation. The Management Development and Compensation Committee also incentivizes leaders to improve the Company's competitive position.
THE SCIENCE & TECHNOLOGY COMMITTEE oversees the direction and effectiveness of the company's R&D operations. They also review the company's technology and innovation strategies and approaches, including the impact on the company's performance, growth and competitive position. The Science & Technology Committee assist the Board in overseeing GE's investments and initiatives in science, technology and software. In addition, they review science and technology trends that could significantly affect the company and the industries in which it operates.
THE GE RISK COMMITTEE oversees risks related to GE Capital and jointly meets throughout the year with the GECC Board of Directors (GECC Board). The GE Risk Committee also oversees the Company's most critical enterprise risks and how management is mitigating these risks. These risks may be discussed during Risk Committee meetings, as well as full Board updates, Audit Committee updates, and/or during Director business visits.
GE 2014 FORM 10-K 108
RISK MANAGEMENT |
SENIOR MANAGEMENT
The GE Board's risk oversight process builds upon management's risk assessment and mitigation processes, which include standardized reviews of long-term strategic and operational planning; executive development and evaluation; code of conduct compliance under the Company's The Spirit & The Letter; regulatory compliance; health, safety and environmental compliance; financial reporting and controllership; and information technology and security.
A vice-chairman of GE and GE's CRO are responsible for overseeing and coordinating risk assessment and mitigation on an enterprise-wide basis. They lead the Corporate Risk Function and are responsible for the identification of key business risks, providing for appropriate management of these risks within GE Board guidelines, and enforcement through policies and procedures.
OPERATING REVIEWS
CORPORATE AUDIT STAFF & GE CAPITAL AUDIT are responsible for reviewing the governance, processes, controls and accuracy of GE's and GE Capital's financial and compliance reporting.
POLICY COMPLIANCE REVIEW BOARD is a management-level committee that further assists in assessing and mitigating risk. The Policy Compliance Review Board, which conducted 9 compliance operating reviews and met 3 times in 2014, is chaired by the Company's general counsel and includes the Chief Financial Officer and other senior-level functional leaders. It has principal responsibility for monitoring compliance matters across the Company.
GE BLUEPRINT REVIEWS are integrated business planning reviews across GE that evaluate strategic objectives, operating and organizational performance, and enterprise risks. Blueprint reviews are held at least 4 times per year and include the most senior GE business leaders.
GE CAPITAL ENTERPRISE RISK MANAGEMENT COMMITTEE oversees the implementation of GE Capital's risk appetite, and senior management's establishment of appropriate systems to ensure enterprise risks are effectively identified, measured, monitored, and controlled. Additional information on GE Capital's Enterprise Risk Management Committee can be found in the GE Capital Risk Management and Mitigation section below.
RISK MANAGERS
Risk assessment and risk management are the responsibility of management and are carried out through risk managers who are operationally integrated into each of our businesses. These risk managers have acquired deep domain expertise through their long careers and proximity to the business' operations and core processes. Both risk managers and the business leadership teams have specific, enterprise risk focused goals and objectives that are aligned with our overall risk framework.
RISK MITIGATION & COMMUNICATION
Risks identified through our risk management processes are prioritized and, depending on the probability and severity of the risk, escalated to the CRO. These risks are discussed and responsibility for them is assigned to the business or functional leader most suited to manage the risk in connection with the quarterly operating reviews. Assigned owners are required to continually monitor, evaluate and report on risks for which they bear responsibility. Enterprise risk leaders within each business and corporate function are responsible to present to the CRO risk assessments and key risks at least annually. We have general response strategies for managing risks, which categorize risks according to whether the Company will avoid, transfer, reduce or accept the risk. These response strategies are tailored to ensure that risks are within acceptable GE Board general guidelines.
GE 2014 FORM 10-K 109
RISK MANAGEMENT |
Depending on the nature of the risk involved and the particular business or function affected, we use a wide variety of risk mitigation strategies, including delegation of authorities, standardized processes and strategic planning reviews, operating reviews, insurance, and hedging. As a matter of policy, we generally hedge the risk of fluctuations in foreign currency exchange rates, interest rates and commodity prices. Our service businesses employ a comprehensive tollgate process leading up to and through the execution of a contractual service agreement to mitigate legal, financial and operational risks. Furthermore, we centrally manage some risks by purchasing insurance, the amount of which is determined by balancing the level of risk retained or assumed with the cost of transferring risk to others. We manage the risk of fluctuations in economic activity and customer demand by monitoring industry dynamics and responding accordingly, including by adjusting capacity, implementing cost reductions and engaging in mergers, acquisitions and dispositions.
GE CAPITAL RISK MANAGEMENT & MITIGATION
GE Capital acknowledges risk-taking as a fundamental characteristic of providing financial services. It is inherent to its business and arises in lending, leasing and investment transactions undertaken by GE Capital.
GE Capital's philosophy is to have a strong culture of risk management, combined with a sound risk framework that effectively supports appropriate risk awareness, behaviors and sound risk-based decision making. GE Capital recognizes that effective and comprehensive risk management must include three distinct lines of defense including Business Units, Corporate Risk Management and Internal Audit.
Business Units own and manage risk as a first line of defense with deep risk expertise. The GECC Corporate Risk Management function provides independent oversight and challenge as a second line of defense. Those responsible for risk management activities across GECC, including staff in both the first and second lines of defense, are referred to collectively as "global risk management." The senior risk professionals have, on average, over 30 years of experience. Internal Audit provides the third line of defense.
Corporate Risk Management leverages the risk infrastructure in each of our Business Units, which have adopted an approach that corresponds to GE Capital's overall risk policies, guidelines and review mechanisms. GE Capital's risk infrastructure is designed to manage all risks relevant to its business environment, which if materialized, could prevent GE Capital from achieving its risk objectives and/or result in losses. These risks are defined as GE Capital's Enterprise Risk Universe, which includes the following risks: strategic, liquidity, credit and investment, market, compliance and operational (including financial, information technology, human resources and legal). Reputational risk is considered and managed across each of the categories.
GE Capital continues to make significant investments to enhance its risk management infrastructure and processes consistent with heightened supervisory expectation befitting a nonbank SIFI. As a result, GE Capital is executing on strategic programs and an extensive number of deliverables to improve data and reporting systems, risk and governance processes, and other large scale, critical initiatives including capital planning, models, valuations and regulatory reporting. During 2014, GE Capital increased the number of risk professionals by 12%.
The GE Risk Committee and GECC Board oversee GE Capital's risk appetite, risk assessment and management processes.
The GE Risk Committee and the GECC Board oversee the GE Capital risk management framework, with the GECC Board approving all significant acquisitions and dispositions as well as significant borrowings and investments. The GE Risk Committee and the GECC Board exercise oversight of investment activities in the Business Units through delegations of authority. All participants in the GE Capital risk management process must comply with approval limits established by the GE Risk Committee and the GECC Board.
GE 2014 FORM 10-K 110
RISK MANAGEMENT |
The Enterprise Risk Management Committee (ERMC), which comprises the most senior leaders in GE Capital as well as the GE CRO, oversees the implementation of GE Capital's risk appetite, and senior management's establishment of appropriate systems (including policies, procedures, and management committees) to ensure enterprise risks are effectively identified, measured, monitored, and controlled. The ERMC has delegated management of specific risks to various sub-committees, including the Operational Risk Management Committee, Asset-Liability Committee, Capital Planning Committee, Allowance and Valuation Risk Committee, Credit Risk Committee and Compliance Committee. A similar committee structure, where appropriate, is replicated at the Business Unit level.
Key risk management policies are approved by the GECC Board and the GE Risk Committee at least annually. GE Capital senior management meets with the GE Risk Committee and the GECC Board throughout the year. At these meetings, GE Capital senior management focuses on the risk issues, strategy and governance of the business.
GE Capital's Corporate Risk function, in consultation with the ERMC, updates the Enterprise Risk Appetite Statement annually. This document articulates the enterprise risk objectives, its key universe of risks and the supporting limit structure. GE Capital's risk appetite is determined relative to its desired risk objectives, including, but not limited to, credit ratings, capital levels, liquidity management, regulatory assessments, earnings, dividends and compliance. GE Capital determines its risk appetite through consideration of portfolio analytics, including stress testing and economic capital measurement, experience and judgment of senior risk officers, current portfolio levels, strategic planning, and regulatory and rating agency expectations.
The Enterprise Risk Appetite Statement is presented to the GECC Board and the GE Risk Committee for review and approval at least annually. On a quarterly basis, the status of GE Capital's performance against these limits is reviewed by the GE Risk Committee and GECC Board.
GE Capital monitors its capital adequacy including through economic capital, regulatory capital and enterprise stress testing methodologies. GE Capital's economic capital methodology uses internal models to estimate potential unexpected losses across different portfolios with a confidence level equivalent to an AA agency rating. Although GE Capital is not currently subject to consolidated risk-based capital standards, GE Capital estimates capital adequacy based on the Basel 1 and Basel 3 U.S. frameworks. GE Capital uses stress testing for risk, liquidity and capital adequacy assessment and management purposes, and as an integral part of GE Capital's overall planning processes. Stress testing results inform key strategic portfolio decisions such as the amount of capital required to maintain minimum expected regulatory capital levels in severe but plausible stresses, capital allocation, assist in developing the risk appetite and limits, and help in assessing product specific risk to guide the development and modification of product structures. The GE Risk Committee and the GECC Board review stress test results and their expected impact on capital levels and metrics. The GE Risk Committee and the GECC Board are responsible for overseeing overall capital adequacy, and the capital adequacy process, as well as approving GE Capital's annual capital plan and capital actions. Under enhanced prudential standards for GE Capital as a nonbank SIFI that the Federal Reserve Board proposed in November 2014, GE Capital would also be subject to regulatory capital, liquidity, stress testing, capital planning, risk management and other requirements.
For additional information about our risks, see the "Risk Factors," "Regulations and Supervision" and "Critical Accounting Estimates" sections within the MD&A of this Form 10-K report.
GE 2014 FORM 10-K 111
RISK FACTORS |
RISK FACTORS
The following discussion of risk factors contains "forward-looking statements," as discussed in the Forward-Looking Statements section of this Form 10-K Report. These risk factors may be important to understanding any statement in this Annual Report on Form 10-K or elsewhere. The following information should be read in conjunction with the Management's Discussion and Analysis of Financial Condition and Results of Operations (MD&A) section and the consolidated financial statements and related notes of this Form 10-K Report.
GE's Corporate Risk Function leverages the risk framework in each of our businesses, which have adopted an approach that corresponds to the Company's overall risk policies, guidelines and review mechanisms. Our risk framework operates at the business and functional levels and is designed to identify, evaluate and mitigate risks within each of the risk categories below.
Our businesses routinely encounter and address risks, some of which will cause our future results to be different – sometimes materially different – than we presently anticipate. Below, we describe certain important strategic, operational, financial, and legal and compliance risks. Our reactions to material future developments as well as our competitors' reactions to those developments will affect our future results.
STRATEGIC RISKS
Strategic risk relates to the Company's future business plans and strategies, including the risks associated with: the global macro-environment in which we operate; mergers and acquisitions and restructuring activity; intellectual property; and other risks, including the demand for our products and services, competitive threats, technology and product innovation, and public policy.
Global macro-environment - Our growth is subject to global economic and political risks.
We operate in virtually every part of the world and serve customers in approximately 175 countries. In 2014, approximately 50% of our revenue was attributable to activities outside the United States. Our operations are subject to the effects of global competition and geopolitical risks. They are also affected by local economic environments, including inflation, recession, currency volatility, currency controls and actual or anticipated default on sovereign debt. Political changes, some of which may be disruptive, can interfere with our supply chain, our customers and all of our activities in a particular location. While some of these global economic and political risks can be hedged using derivatives or other financial instruments and some are insurable, such attempts to mitigate these risks are costly and not always successful, and our ability to engage in such mitigation may decrease or become even more costly as a result of more volatile market conditions.
M&A/restructuring - The success of our business depends on achieving our strategic objectives, including through acquisitions, joint ventures, dispositions and restructurings.
With respect to acquisitions, joint ventures and restructuring actions, we may not achieve expected returns and other benefits as a result of various factors, including integration and collaboration challenges, such as personnel and technology. In addition, we may not achieve anticipated cost savings from restructuring actions, which could result in lower margin rates. We also participate in a number of joint ventures with other companies or government enterprises in various markets around the world, including joint ventures where we may have a lesser degree of control over the business operations, which may expose us to additional operational, financial, legal or compliance risks. We also continue to evaluate the potential disposition of assets and businesses that may no longer help us meet our objectives. When we decide to sell assets or a business, we may encounter difficulty in finding buyers or executing alternative exit strategies on acceptable terms in a timely manner, which could delay the accomplishment of our strategic objectives. For example, delays in obtaining tax rulings and regulatory approvals or clearances, and disruptions or volatility in the capital markets may impact our ability to complete the staged exit from our North American Retail Finance business, Synchrony Financial, as planned. Alternatively, we may dispose of a business at a price or on terms that are less than we had anticipated. After reaching an agreement with a buyer or seller for
GE 2014 FORM 10-K 112
RISK FACTORS |
Intellectual property - Our intellectual property portfolio may not prevent competitors from independently developing products and services similar to or duplicative to ours.
Our patents and other intellectual property may not prevent competitors from independently developing or selling products and services similar to or duplicative of ours, and there can be no assurance that the resources invested by us to protect our intellectual property will be sufficient or that our intellectual property portfolio will adequately deter misappropriation or improper use of our technology. We could also face competition in some countries where we have not invested in an intellectual property portfolio. We also face attempts to gain unauthorized access to our IT systems or products for the purpose of improperly acquiring our trade secrets or confidential business information. The theft or unauthorized use or publication of our trade secrets and other confidential business information as a result of such an incident could adversely affect our competitive position and the value of our investment in research and development. We may be unable to secure or retain ownership or rights to use data in certain software analytics or services offerings. In addition, we may be the target of aggressive and opportunistic enforcement of patents by third parties, including non-practicing entities. Regardless of the merit of such claims, responding to infringement claims can be expensive and time-consuming. If GE is found to infringe any third-party rights, we could be required to pay substantial damages or we could be enjoined from offering some of our products and services. Also, there can be no assurances that we will be able to obtain or renew from third parties the licenses we need in the future, and there is no assurance that such licenses can be obtained on reasonable terms.
OPERATIONAL RISKS
Operational risk relates to risks arising from systems, processes, people and external events that affect the operation of our businesses. It includes product life cycle and execution; product safety and performance; information management and data protection and security, including cyber security; supply chain and business disruption; and other risks, including human resources and reputation.
Operations - We may face operational challenges that could have a material adverse effect on our business, reputation, financial position and results of operations, and we are dependent on maintenance of existing product lines, market acceptance of new product and service introductions and product and service innovations for continued revenue and earnings growth.
We produce highly sophisticated products and provide specialized services for both our and third-party products that incorporate or use leading-edge technology, including both hardware and software. While we have built extensive operational processes to ensure that the design, manufacture and servicing of such products meet the most rigorous quality standards, there can be no assurance that we or our customers or other third parties will not experience operational process failures or other problems, including through cyber attacks and other intentional acts, that could result in potential product, safety, regulatory or environmental risks. Despite the existence of crisis management or business continuity plans, operational failures or quality issues, including as a result of organizational changes or labor relations, could have a material adverse effect on our business, reputation, financial position and results of operations. In addition, the markets in which we operate are subject to technological change and require skilled talent. Our long-term operating results depend substantially upon our ability to continually develop, introduce, and market new and innovative products and services, to modify existing products and services, to customize products and services, to respond to technological change and to execute our product and service development in line with our projected performance and/or cost estimates.
GE 2014 FORM 10-K 113
RISK FACTORS |
Increased global cybersecurity vulnerabilities, threats and more sophisticated and targeted cyber-related attacks pose a risk to the security of GE's and its customers', partners', suppliers' and third-party service providers' products, systems and networks and the confidentiality, availability and integrity of GE's and its customers' data. While we attempt to mitigate these risks by employing a number of measures, including employee training, monitoring and testing, and maintenance of protective systems and contingency plans, we remain potentially vulnerable to additional known or unknown threats. We also may have access to sensitive, confidential or personal data or information in certain of our businesses that is subject to privacy and security laws, regulations and customer-imposed controls. Despite our efforts to protect sensitive, confidential or personal data or information, we may be vulnerable to material security breaches, theft, misplaced or lost data, programming errors, employee errors and/or malfeasance that could potentially lead to the compromising of sensitive, confidential or personal data or information, improper use of our systems, software solutions or networks, unauthorized access, use, disclosure, modification or destruction of information, defective products, production downtimes and operational disruptions. In addition, a cyber-related attack could result in other negative consequences, including damage to our reputation or competitiveness, remediation or increased protection costs, litigation or regulatory action.
Supply chain - Significant raw material shortages, supplier capacity constraints, supplier production disruptions, supplier quality and sourcing issues or price increases could increase our operating costs and adversely impact the competitive positions of our products.
Our reliance on third-party suppliers, contract manufacturers and service providers, and commodity markets to secure raw materials, parts, components and sub-systems used in our products exposes us to volatility in the prices and availability of these materials, parts, components, systems and services. Some of these suppliers or their sub-suppliers are limited- or sole-source suppliers. A disruption in deliveries from our third-party suppliers, contract manufacturers or service providers, capacity constraints, production disruptions, price increases, or decreased availability of raw materials or commodities, including as a result of catastrophic events, could have an adverse effect on our ability to meet our commitments to customers or increase our operating costs. Quality and sourcing issues experienced by third-party providers can also adversely affect the quality and effectiveness of our products and services and result in liability and reputational harm.
FINANCIAL RISKS
Financial risk relates to our ability to meet financial obligations and mitigate exposure to broad market risks, including volatility in foreign currency exchange rates and interest rates and commodity prices; credit risk; and liquidity risk, including risk related to our credit ratings and our availability and cost of funding. Credit risk is the risk of financial loss arising from a customer or counterparty failure to meet its contractual obligations. We face credit risk in our industrial businesses, as well as in our GE Capital investing, lending and leasing activities and derivative financial instruments activities. Liquidity risk refers to the potential inability to meet contractual or contingent financial obligations (whether on- or off-balance sheet) as they arise, and could potentially impact an institution's financial condition or overall safety and soundness.
Economy/counter-parties - A deterioration of conditions in the global economy, the major industries we serve or the financial markets, or the soundness of financial institutions and governments we deal with, may adversely affect our business and results of operations.
The business and operating results of our industrial businesses have been, and will continue to be, affected by worldwide economic conditions, including conditions in the air and rail transportation, power generation, oil and gas, healthcare, home building and other major industries we serve. Existing or potential customers may delay or cancel plans to purchase our products and services, including large infrastructure projects, and may not be able to fulfill their obligations to us in a timely fashion as a result of business deterioration, cash flow shortages, and difficulty obtaining financing due to slower global economic growth and other challenges affecting the global economy. In particular, the airline industry is highly cyclical, and the level of demand for air travel is correlated to the strength of the U.S. and international economies. An extended period of slow growth in the U.S. or internationally that results in the loss of business and leisure traffic could have a material adverse effect on our airline customers and the viability of their business. Service contract cancellations or customer dynamics such as early aircraft retirements or reduced electricity demand in our Power & Water business could affect our ability to fully recover our
GE 2014 FORM 10-K 114
RISK FACTORS |
contract costs and estimated earnings. Further, our vendors may be experiencing similar conditions, which may impact their ability to fulfill their obligations to us. If slower growth in the global economy continues for a significant period or there is significant deterioration in the global economy, our results of operations, financial position and cash flows could be materially adversely affected.
If conditions in the financial markets deteriorate, there can be no assurance that we will be able to recover fully the value of certain assets, including real estate, goodwill, intangibles and tax assets. Deterioration in the economy and in default and recovery rates could require us to increase allowances for loan losses, impairments or write-offs, which, depending on the amount of the increase, could have a material adverse effect on our business, financial position and results of operations.
In addition, GE Capital has exposure to many different industries and counterparties, including sovereign governments, and routinely executes transactions with counterparties in the financial services industry, including brokers and dealers, commercial banks, investment banks and other institutional clients. Many of these transactions expose GE Capital to credit risk in the event of default of its counterparty or client. In addition, GE Capital's credit risk may be increased when the value of collateral held cannot be realized through sale or is liquidated at prices insufficient to recover the full amount of the loan or derivative exposure due to it. GE Capital also has exposure to these financial institutions in the form of cash on deposit and unsecured debt instruments held in its investment portfolios. GE Capital has policies relating to credit rating requirements and to exposure limits to counterparties (as described in Note 22 to the consolidated financial statements in this Form 10-K Report), which are designed to limit credit and liquidity risk. There can be no assurance, however, that any losses or impairments to the carrying value of financial assets would not materially and adversely affect GE's or GE Capital's business, financial position and results of operations.
Credit ratings - Failure to maintain our credit ratings could adversely affect our cost of funds and related margins, liquidity, competitive position and access to capital markets.
The major debt rating agencies routinely evaluate our debt. This evaluation is based on a number of factors, which include financial strength as well as transparency with rating agencies and timeliness of financial reporting. As of December 31, 2014, GE and GECC's long-term unsecured debt credit rating from Standard and Poor's Ratings Service (S&P) was AA+ (the second highest of 22 rating categories) with a stable outlook. The long-term unsecured debt credit rating from Moody's Investors Service (Moody's) for GE was Aa3 (the fourth highest of 21 rating categories) and for GECC was A1 (the fifth highest of 21 credit ratings), both with stable outlooks. As of December 31, 2014, GE and GECC's short-term credit rating from S&P was A-1+ (the highest rating category of six categories) and from Moody's was P-1 (the highest rating category of four categories). There can be no assurance that we will be able to maintain our credit ratings and failure to do so could adversely affect our cost of funds and related margins, liquidity, competitive position and access to capital markets. Various debt and derivative instruments, guarantees and covenants would require posting additional capital or collateral in the event of a ratings downgrade, which, depending on the extent of the downgrade, could have a material adverse effect on our liquidity and capital position.
Funding access/costs - Conditions in the financial and credit markets may affect the availability and cost of funding.
As disclosed in more detail in the Liquidity and Borrowings section of this Form 10-K Report, a portion of our borrowings is in the form of commercial paper and long-term debt. We continue to rely on the availability of the unsecured debt markets to access funding for term and commercial paper maturities for 2014 and beyond and to fund our operations without incurring additional U.S. tax. In addition, we rely on the availability of the commercial paper markets to refinance maturing commercial paper debt throughout the year. In order to further diversify our funding sources, GE Capital continues to expand its reliance on alternative sources of funding, including bank deposits, securitizations and other asset-based funding. There can be no assurance that we will succeed in increasing the diversification of our funding sources or that the short and long-term credit markets will be available or, if available, that the cost of funding will not substantially increase and affect our overall profitability. Factors that may affect the availability of funding or cause an increase in our funding costs include: a decreased reliance on short-term funding, such as commercial paper, in favor of longer-term funding arrangements; decreased capacity and increased competition among debt issuers; increased competition for deposits in our affiliate banks' markets; and potential market disruptions or other impacts arising in the United States or Europe from developments in sovereign debt situations. If
GE 2014 FORM 10-K 115
RISK FACTORS |
Social costs - Sustained increases in pension and healthcare benefits costs may reduce our profitability.
Our results of operations may be positively or negatively affected by the amount of income or expense we record for our defined benefit pension plans. GAAP requires that we calculate income or expense for the plans using actuarial valuations. These valuations reflect assumptions about financial market and other economic conditions, which may change based on changes in key economic indicators. The most significant year-end assumptions we use to estimate pension expense for 2015 are the discount rate and the expected long-term rate of return on the plan assets. In addition, we are required to make an annual measurement of plan assets and liabilities, which may result in a significant reduction or increase to equity. At the end of 2014, the GE Pension Plan was underfunded, on a GAAP basis, by $15.8 billion, and the GE Supplementary Pension Plan, an unfunded plan, had a projected benefit obligation of $6.6 billion. Although GAAP expense and pension funding contributions are not directly related, key economic factors that affect GAAP expense would also likely affect the amount of cash we would contribute to pension plans as required under the Employee Retirement Income Security Act (ERISA). Failure to achieve expected returns on plan assets driven by various factors, which could include a continued environment of low interest rates or sustained market volatility, could also result in an increase to the amount of cash we would be required to contribute to pension plans. In addition, upward pressure on the cost of providing healthcare benefits to current employees and retirees may increase future funding obligations. Although we have actively sought to control increases in these costs, there can be no assurance that we will succeed in limiting cost increases, and continued upward pressure could reduce our profitability. For a discussion regarding how our financial statements can be affected by our pension and healthcare benefit obligations, see the Other Consolidated Information – Postretirement Benefit Plans section and Note 12 to the consolidated financial statements in this Form 10-K Report. See also the Critical Accounting Estimates – Pension Assumptions section of this Form 10-K Report for a discussion regarding how our financial statements can be affected by our pension plan accounting policies.
LEGAL & COMPLIANCE RISKS
Legal and compliance risk relates to risks arising from the government and regulatory environment and action, including resulting from the Dodd-Frank Wall Street Reform and Consumer Protection Act (DFA); and legal proceedings and compliance with integrity policies and procedures, including those relating to financial reporting, environmental health and safety. Government and regulatory risk includes the risk that the government or regulatory actions will impose additional cost on us or cause us to have to change our business models or practices.
Regulatory - We are subject to a wide variety of laws, regulations and government policies that may change in significant ways.
Our businesses are subject to regulation under a wide variety of U.S. federal and state and non-U.S. laws, regulations and policies. There can be no assurance that laws, regulations and policies will not be changed in ways that will require us to modify our business models and objectives or affect our returns on investments by restricting existing activities and products, subjecting them to escalating costs or prohibiting them outright. In particular, substantial revisions that U.S. and non-U.S. governments are undertaking or considering in areas such as the regulation and supervision of bank and non-bank financial institutions, consumer lending, foreign exchange intervention in response to currency volatility, trade controls, the over-the-counter derivatives market and tax laws and regulations may have an effect on GE's and GE Capital's structure, operations, sales, liquidity, capital requirements, effective tax rate and performance. For example, GE's effective tax rate is reduced because active business income earned and indefinitely reinvested outside the United States is taxed at less than the U.S. rate. A significant portion of this reduction depends upon a provision of U.S. tax law that defers the imposition of U.S. tax on certain active financial services income until that income is repatriated to the United States as a dividend. This provision is consistent with international tax norms and permits U.S. financial services companies to compete more effectively with non-U.S. financial institutions in global markets. This provision, which had expired at the end of 2013, was reinstated in December 2014 retroactively for one year through the end of 2014. This provision also had been scheduled to expire and had been extended by Congress on seven previous occasions, but there can be no assurance that it will continue to be extended. In the
GE 2014 FORM 10-K 116
RISK FACTORS |
Dodd-Frank - Under the Dodd-Frank Wall Street Reform and Consumer Protection Act, we are subject to prudential oversight by the Federal Reserve, including as a result of GECC's designation as a nonbank systemically important financial institution (nonbank SIFI), which subjects us to increased and evolving regulatory requirements.
GECC is a regulated savings and loan holding company and in 2011 became subject to Federal Reserve Board (FRB) supervision under the DFA. In 2013, the U.S. Financial Stability Oversight Council (FSOC) designated GECC as a nonbank SIFI under the DFA. As a result of this change in supervision and designation, stricter prudential regulatory standards and supervision apply to GECC. On November 25, 2014 the FRB proposed for comment enhanced prudential standards that would apply to GECC as a nonbank SIFI. This proposal would, among other items, require GECC to comply with rules on capital and liquidity adequacy that apply to large bank holding companies, market terms requirements for intercompany transactions and enhanced risk management and governance requirements. In addition, while GECC's capital adequacy as a savings and loan holding company, including planned capital distributions such as dividend payments, is currently subject to review by the FRB, the proposed standards would apply stress testing and capital planning requirements to GECC under the FRB's more formal comprehensive capital analysis and review (CCAR) regulations. The comment period for the proposed standards closed on February 2, 2015, and the exact application of the proposed standards will not be known until after the final rule is published. For additional information, see the Regulations and Supervision and Liquidity and Borrowings sections of this Form 10-K Report.
Legal proceedings - We are subject to legal proceedings and legal compliance risks.
GE 2014 FORM 10-K 117
LEGAL PROCEEDINGS |
LEGAL PROCEEDINGS
There are 15 lawsuits relating to pending mortgage loan repurchase claims in which WMC, our U.S. mortgage business that we sold in 2007, is a party. The adverse parties in these cases are securitization trustees or parties claiming to act on their behalf. While the alleged claims for relief vary from case to case, the complaints and counterclaims in these actions generally assert claims for breach of contract, indemnification, and/or declaratory judgment, and seek specific performance (repurchase) and/or monetary damages. Beginning in the fourth quarter 2013, WMC entered into settlements that reduced its exposure on claims asserted in certain securitizations, and the claim amounts reported herein reflect the effect of these settlements.
Five WMC cases are pending in the United States District Court for the District of Connecticut. Four of these cases were initiated in 2012, and one was initiated in the third quarter 2013. Deutsche Bank National Trust Company (Deutsche Bank) is the adverse party in four cases, and Law Debenture Trust Company of New York (Law Debenture) is the adverse party in one case. The Deutsche Bank complaints assert claims on approximately $4,300 million of mortgage loans and seek to recover damages in excess of approximately $1,800 million. The Law Debenture complaint asserts claims on approximately $800 million of mortgage loans, and alleges losses on these loans in excess of approximately $425 million. On March 31, 2014, the District Court denied WMC's motions to dismiss these cases.
Four WMC cases are pending in the United States District Court for the District of Minnesota against US Bank National Association (US Bank), one of which was initiated by WMC seeking declaratory judgment. Three of these cases were filed in 2012, and one was filed in 2011. The Minnesota cases involve claims on approximately $800 million of mortgage loans and do not specify the amount of damages sought. In September 2013, the District Court granted in part and denied in part WMC's motions to dismiss or for summary judgment in these cases. On September 8, 2014, US Bank filed a petition for instructions in the administration of trusts in Minnesota state court seeking authorization and instruction for US Bank to implement the terms of a settlement agreement reached with WMC to compromise, settle, and release all claims arising out of the securitizations at issue in these four lawsuits. In February 2015, two bondholders filed objections to the proposed settlement, and in response the court has scheduled an evidentiary hearing for June 2015. In light of the state court action seeking approval of the proposed settlement, the District Court has entered orders on September 18, 2014 staying further proceedings in the four cases until April 15, 2015.
Four cases are pending against WMC in New York State Supreme Court, all of which were initiated by securitization trustees or securities administrators. These cases involve, in the aggregate, claims involving approximately $4,559 million of mortgage loans. One of these lawsuits was initiated by Deutsche Bank in the second quarter 2013 and names as defendants WMC and Barclays Bank PLC. It involves claims against WMC on approximately $1,000 million of mortgage loans and does not specify the amount of damages sought. The second case, in which the plaintiff is The Bank of New York Mellon (BNY), was initiated in the fourth quarter 2012 and names as defendants WMC, J.P. Morgan Mortgage Acquisition Corporation and JPMorgan Chase Bank, N.A. BNY asserts claims on approximately $1,300 million of mortgage loans, and seeks to recover damages in excess of $650 million. The third case was initiated by BNY in November 2013 and names as defendants WMC, J.P. Morgan Mortgage Acquisition Corporation and JPMorgan Chase Bank, N.A. In this case, BNY asserts claims on approximately $1,300 million of mortgage loans, and seeks to recover damages in excess of $600 million. The fourth case was filed in October 2014 and names as defendants WMC, J.P. Morgan Mortgage Acquisition Corporation and JPMorgan Chase Bank, N.A. The plaintiff, BNY, asserts claims on approximately $959 million of mortgage loans and seeks to recover damages in excess of $475 million.
Two cases are pending against WMC in the United States District Court for the Southern District of New York. One case, in which the plaintiff is BNY, was filed in the third quarter 2012. In the second quarter 2013, BNY filed an amended complaint in which it asserts claims on approximately $900 million of mortgage loans, and seeks to recover damages in excess of $378 million. In September 2013, the District Court denied WMC's motion to dismiss. On September 18, 2014, the District Court issued an order directing the parties to participate in settlement discussions before a private mediator or the assigned
GE 2014 FORM 10-K 118
LEGAL PROCEEDINGS |
The amounts of the claims at issue in these cases (discussed above) reflect the purchase price or unpaid principal balances of the mortgage loans at issue at the time of purchase and do not give effect to pay downs, accrued interest or fees, or potential recoveries based upon the underlying collateral. All of the mortgage loans involved in these lawsuits are included in WMC's reported claims at December 31, 2014. See Note 2 to the consolidated financial statements in this Form 10-K Report for additional information.
The company is reporting the following matter in compliance with SEC requirements to disclose environmental proceedings where the government is a party potentially involving monetary sanctions of $100,000 or greater. In October 2014, the U.S. Federal Government informed the company that it was seeking penalties under the Clean Air and Resource and Conservation Recovery Acts in connection with a facility sold to Momentive Performance Materials, Inc. in 2006. The allegations relate to improper operation of pollution control monitoring equipment by incinerator operators.
GE 2014 FORM 10-K 119
GLOSSARY |
GLOSSARY
Backlog Unfilled customer orders for products and product services (expected life of contract sales for product services).
Borrowing Financial liability (short or long-term) that obligates us to repay cash or another financial asset to another entity.
Borrowings as a percentage of total capital invested For GE, the sum of borrowings and mandatorily redeemable preferred stock, divided by the sum of borrowings, mandatorily redeemable preferred stock, noncontrolling interests and total shareowners' equity.
Cash equivalents Highly liquid debt instruments with original maturities of three months or less, such as commercial paper. Typically included with cash for reporting purposes, unless designated as available-for-sale and included with investment securities.
Cash flow hedges Qualifying derivative instruments that we use to protect ourselves against exposure to variability in future cash flows. The exposure may be associated with an existing asset or liability, or with a forecasted transaction. See "Hedge."
Commercial paper Unsecured, unregistered promise to repay borrowed funds in a specified period ranging from overnight to 270 days.
Comprehensive income The sum of Net Income and Other Comprehensive Income. See "Other Comprehensive Income."
Derivative instrument A financial instrument or contract with another party (counterparty) that is designed to meet any of a variety of risk management objectives, including those related to fluctuations in interest rates, currency exchange rates or commodity prices. Options, forwards and swaps are the most common derivative instruments we employ. See "Hedge."
Discontinued operations Certain businesses we have sold or committed to sell within the next year and therefore will no longer be part of our ongoing operations. The net earnings, assets and liabilities, and cash flows of such businesses are separately classified on our Statement of Earnings, Statement of Financial Position and Statement of Cash Flows, respectively, for all periods presented. In the second quarter of 2014, we adopted a new standard for accounting for discontinued operations as described in Note 1 to the consolidated financial statements. There were no disposals that qualified as discontinued operations under the revised definition in 2014.
Effective tax rate Provision for income taxes as a percentage of earnings from continuing operations before income taxes and accounting changes. Does not represent cash paid for income taxes in the current accounting period. Also referred to as "actual tax rate" or "tax rate."
Ending Net Investment (ENI) The total capital we have invested in the financial services business. It is the sum of short-term borrowings, long-term borrowings and equity (excluding noncontrolling interests) adjusted for unrealized gains and losses on investment securities and hedging instruments. Alternatively, it is the amount of assets of continuing operations less the amount of non-interest-bearing liabilities.
Equipment leased to others (ELTO) Rental equipment we own that is available to rent and is stated at cost less accumulated depreciation.
GE 2014 FORM 10-K 120
GLOSSARY |
Fair value hedge Qualifying derivative instruments that we use to reduce the risk of changes in the fair value of assets, liabilities or certain types of firm commitments. Changes in the fair values of derivative instruments that are designated and effective as fair value hedges are recorded in earnings, but are offset by corresponding changes in the fair values of the hedged items. See "Hedge."
Financing receivables Investment in contractual loans and leases due from customers (not investment securities).
Forward contract Fixed price contract for purchase or sale of a specified quantity of a commodity, security, currency or other financial instrument with delivery and settlement at a specified future date. Commonly used as a hedging tool. See "Hedge."
Goodwill The premium paid for acquisition of a business. Calculated as the purchase price less the fair value of net assets acquired (net assets are identified tangible and intangible assets, less liabilities assumed).
Guaranteed investment contracts (GICs) Deposit-type products that guarantee a minimum rate of return, which may be fixed or floating.
Hedge A technique designed to eliminate risk. Often refers to the use of derivative financial instruments to offset changes in interest rates, currency exchange rates or commodity prices, although many business positions are "naturally hedged" – for example, funding a U.S. fixed-rate investment with U.S. fixed-rate borrowings is a natural interest rate hedge.
Intangible asset A non-financial asset lacking physical substance, such as goodwill, patents, licenses, trademarks and customer relationships.
Interest rate swap Agreement under which two counterparties agree to exchange one type of interest rate cash flow for another. In a typical arrangement, one party periodically will pay a fixed amount of interest, in exchange for which that party will receive variable payments computed using a published index. See "Hedge."
Investment securities Generally, an instrument that provides an ownership position in a corporation (a stock), a creditor relationship with a corporation or governmental body (a bond), rights to contractual cash flows backed by pools of financial assets or rights to ownership such as those represented by options, subscription rights and subscription warrants.
Match funding A risk control policy that provides funding for a particular financial asset having the same currency, maturity and interest rate characteristics as that asset. Match funding is executed directly, by issuing debt, or synthetically, through a combination of debt and derivative financial instruments. For example, when we lend at a fixed interest rate in the U.S., we can borrow those U.S. dollars either at a fixed rate of interest or at a floating rate executed concurrently with a pay-fixed interest rate swap. See "Hedge."
Monetization Sale of financial assets to a third party for cash. For example, we sell certain loans, credit card receivables and trade receivables to third-party financial buyers, typically providing at least some credit protection and often agreeing to provide collection and processing services for a fee. Monetization normally results in gains on interest-bearing assets and losses on non-interest-bearing assets. See "Securitization" and "Variable interest entity."
Net Interest Margin A measure of the yield on interest earning assets relative to total interest expense. It is the amount of interest income less interest expense, divided by average interest earning assets.
Noncontrolling interest Portion of shareowner's equity in a subsidiary that is not attributable to GE.
Operating profit GE earnings from continuing operations before interest and other financial charges, income taxes and effects of accounting changes.
GE 2014 FORM 10-K 121
GLOSSARY |
Option The right, not the obligation, to execute a transaction at a designated price, generally involving equity interests, interest rates, currencies or commodities. See "Hedge."
Other Comprehensive Income Changes in assets and liabilities that do not result from transactions with shareowners and are not included in net income but are recognized in a separate component of shareowners' equity. Other Comprehensive Income includes the following components:
- | Investment securities – Unrealized gains and losses on securities classified as available-for-sale. |
- | Currency translation adjustments – The result of translating into U.S. dollars those amounts denominated or measured in a different currency. |
- | Cash flow hedges – The effective portion of the fair value of cash flow hedges. Such hedges relate to an exposure to variability in the cash flows of recognized assets, liabilities or forecasted transactions that are attributable to a specific risk. |
- | Benefit plans – Unamortized prior service costs and net actuarial losses (gains) related to pension and retiree health and life benefits. |
- | Reclassification adjustments – Amounts previously recognized in Other Comprehensive Income that are included in net income in the current period. |
Product services For purposes of the financial statement display of sales and costs of sales in our Statement of Earnings, "goods" is required by U.S. Securities and Exchange Commission regulations to include all sales of tangible products, and "services" must include all other sales, including other services activities. In our Management's Discussion and Analysis of Operations section of this Form 10-K, we refer to sales under product services agreements and sales of both goods (such as spare parts and equipment upgrades) and related services (such as monitoring, maintenance and repairs) as sales of "product services," which is an important part of our operations.
Product services agreements Contractual commitments, with multiple-year terms, to provide specified services for products in our Power & Water, Oil & Gas, Aviation and Transportation installed base – for example, monitoring, maintenance, service and spare parts for a gas turbine/generator set installed in a customer's power plant.
Productivity The rate of increased output for a given level of input, with both output and input measured in constant currency.
Progress collections Billings and payments received on customer contracts before the related revenue is recognized.
Retained interest A portion of a transferred financial asset retained by the transferor that provides rights to receive portions of the cash inflows from that asset.
Return on average GE shareowners' equity Earnings from continuing operations before accounting changes divided by average GE shareowners' equity, excluding effects of discontinued operations (on an annual basis, calculated using a five-point average). Average GE shareowners' equity, excluding effects of discontinued operations, as of the end of each of the years in the five-year period ended December 31 of the year for which the ratio is calculated is described in the Supplemental Information section.
GE 2014 FORM 10-K 122
GLOSSARY |
Securitization A process whereby loans or other receivables are packaged, underwritten and sold to investors. In a typical transaction, assets are sold to a special purpose entity, which purchases the assets with cash raised through issuance of beneficial interests (usually debt instruments) to third-party investors. Whether or not credit risk associated with the securitized assets is retained by the seller depends on the structure of the securitization. See "Monetization" and "Variable interest entity."
Subprime For purposes of Consumer-related discussion, subprime includes consumer finance products like mortgage, auto, cards, sales finance and personal loans to U.S. and global borrowers whose credit score implies a higher probability of default based upon GECC's proprietary scoring models and definitions, which add various qualitative and quantitative factors to a base credit score such as a FICO score or global bureau score. Although FICO and global bureau credit scores are a widely accepted rating of individual consumer creditworthiness, the internally modeled scores are more reflective of the behavior and default risks in the portfolio compared with stand-alone generic bureau scores.
GE 2014 FORM 10-K 123
REPORTS |
MANAGEMENT AND AUDITOR'S REPORTS
MANAGEMENT'S DISCUSSION OF FINANCIAL RESPONSIBILITY
We believe that great companies are built on a foundation of reliable financial information and compliance with the spirit and letter of the law. For General Electric Company, that foundation includes rigorous management oversight of, and an unyielding dedication to, controllership. The financial disclosures in this report are one product of our commitment to high-quality financial reporting. In addition, we make every effort to adopt appropriate accounting policies, we devote our full resources to ensuring that those policies are applied properly and consistently and we do our best to fairly present our financial results in a manner that is complete and understandable.
Members of our corporate leadership team review each of our businesses routinely on matters that range from overall strategy and financial performance to staffing and compliance. Our business leaders monitor financial and operating systems, enabling us to identify potential opportunities and concerns at an early stage and positioning us to respond rapidly. Our Board of Directors oversees management's business conduct, and our Audit Committee, which consists entirely of independent directors, oversees our internal control over financial reporting. We continually examine our governance practices in an effort to enhance investor trust and improve the Board's overall effectiveness. The Board and its committees annually conduct a performance self-evaluation and recommend improvements. Our lead director chaired three meetings of our independent directors this year, helping us sharpen our full Board meetings to better cover significant topics. Compensation policies for our executives are aligned with the long-term interests of GE investors.
We strive to maintain a dynamic system of internal controls and procedures-including internal control over financial reporting-designed to ensure reliable financial recordkeeping, transparent financial reporting and disclosure, and protection of physical and intellectual property. We recruit, develop and retain a world-class financial team. Our internal audit function, including members of our Corporate Audit Staff, conducts thousands of financial, compliance and process improvement audits each year. Our Audit Committee oversees the scope and evaluates the overall results of these audits, and members of that Committee regularly attend GE Capital Board of Directors, Corporate Audit Staff and Controllership Council meetings. Our global integrity policies-"The Spirit & The Letter"-require compliance with law and policy, and pertain to such vital issues as upholding financial integrity and avoiding conflicts of interest. These integrity policies are available in 31 languages, and are provided to all of our employees, holding each of them accountable for compliance. Our strong compliance culture reinforces these efforts by requiring employees to raise any compliance concerns and by prohibiting retribution for doing so. To facilitate open and candid communication, we have designated ombudspersons throughout the Company to act as independent resources for reporting integrity or compliance concerns. We hold our directors, consultants, agents and independent contractors to the same integrity standards.
We are keenly aware of the importance of full and open presentation of our financial position and operating results, and rely for this purpose on our disclosure controls and procedures, including our Disclosure Committee, which comprises senior executives with detailed knowledge of our businesses and the related needs of our investors. We ask this committee to review our compliance with accounting and disclosure requirements, to evaluate the fairness of our financial and non-financial disclosures, and to report their findings to us. In 2014, we further ensured strong disclosure by holding approximately 70 analyst and investor meetings with GE leadership present.
We welcome the strong oversight of our financial reporting activities by our independent registered public accounting firm, KPMG LLP, engaged by and reporting directly to the Audit Committee. U.S. legislation requires management to report on internal control over financial reporting and for auditors to render an opinion on such controls. Our report and the KPMG LLP report for 2014 follow.
GE 2014 FORM 10-K 124
REPORTS |
MANAGEMENT'S ANNUAL REPORT ON INTERNAL CONTROL OVER FINANCIAL REPORTING
Management is responsible for establishing and maintaining adequate internal control over financial reporting for the Company. With our participation, an evaluation of the effectiveness of our internal control over financial reporting was conducted as of December 31, 2014, based on the framework and criteria established in Internal Control – Integrated Framework (2013) issued by the Committee of Sponsoring Organizations of the Treadway Commission.
Based on this evaluation, our management has concluded that our internal control over financial reporting was effective as of December 31, 2014.
Our independent registered public accounting firm has issued an audit report on our internal control over financial reporting. Their report follows.
/s/ Jeffrey R. Immelt |
| /s/ Jeffrey S. Bornstein |
Jeffrey R. Immelt |
| Jeffrey S. Bornstein |
Chairman of the Board and Chief Executive Officer
February 27, 2015 |
| Senior Vice President and Chief Financial Officer |
DISCLOSURE CONTROLS
GE 2014 FORM 10-K 125
REPORTS |
REPORT OF INDEPENDENT REGISTERED PUBLIC ACCOUNTING FIRM
To Shareowners and Board of Directors
of General Electric Company:
We have audited the accompanying statement of financial position of General Electric Company and consolidated affiliates (the "Company") as of December 31, 2014 and 2013, and the related statements of earnings, comprehensive income, changes in shareowners' equity and cash flows for each of the years in the three-year period ended December 31, 2014. We also have audited the Company's internal control over financial reporting as of December 31, 2014, based on criteria established in Internal Control – Integrated Framework (2013) issued by the Committee of Sponsoring Organizations of the Treadway Commission ("COSO"). The Company's management is responsible for these consolidated financial statements, for maintaining effective internal control over financial reporting, and for its assessment of the effectiveness of internal control over financial reporting. Our responsibility is to express an opinion on these consolidated financial statements and an opinion on the Company's internal control over financial reporting based on our audits.
We conducted our audits in accordance with the standards of the Public Company Accounting Oversight Board (United States). Those standards require that we plan and perform the audits to obtain reasonable assurance about whether the financial statements are free of material misstatement and whether effective internal control over financial reporting was maintained in all material respects. Our audits of the consolidated financial statements included examining, on a test basis, evidence supporting the amounts and disclosures in the financial statements, assessing the accounting principles used and significant estimates made by management, and evaluating the overall financial statement presentation. Our audit of internal control over financial reporting included obtaining an understanding of internal control over financial reporting, assessing the risk that a material weakness exists, and testing and evaluating the design and operating effectiveness of internal control based on the assessed risk. Our audits also included performing such other procedures as we considered necessary in the circumstances. We believe that our audits provide a reasonable basis for our opinions.
A company's internal control over financial reporting is a process designed to provide reasonable assurance regarding the reliability of financial reporting and the preparation of financial statements for external purposes in accordance with generally accepted accounting principles. A company's internal control over financial reporting includes those policies and procedures that (1) pertain to the maintenance of records that, in reasonable detail, accurately and fairly reflect the transactions and dispositions of the assets of the company; (2) provide reasonable assurance that transactions are recorded as necessary to permit preparation of financial statements in accordance with generally accepted accounting principles, and that receipts and expenditures of the company are being made only in accordance with authorizations of management and directors of the company; and (3) provide reasonable assurance regarding prevention or timely detection of unauthorized acquisition, use, or disposition of the company's assets that could have a material effect on the financial statements.
Because of its inherent limitations, internal control over financial reporting may not prevent or detect misstatements. Also, projections of any evaluation of effectiveness to future periods are subject to the risk that controls may become inadequate because of changes in conditions, or that the degree of compliance with the policies or procedures may deteriorate.
In our opinion, the consolidated financial statements present fairly, in all material respects, the financial position of General Electric Company and consolidated affiliates as of December 31, 2014 and 2013, and the results of their operations and their cash flows for each of the years in the three-year period ended December 31, 2014, in conformity with U.S. generally accepted accounting principles. Also in our opinion, the Company maintained, in all material respects, effective internal control over financial reporting as of December 31, 2014, based on criteria established in Internal Control – Integrated Framework (2013) issued by COSO.
Our audits of the consolidated financial statements were made for the purpose of forming an opinion on the consolidated financial statements taken as a whole. The accompanying consolidating information appearing on pages 129, 133 and 135 is presented for purposes of additional analysis of the consolidated financial statements rather than to present the financial position, results of operations and cash flows of the individual entities. The consolidating information has been subjected to the auditing procedures applied in the audits of the consolidated financial statements and, in our opinion, is fairly stated in all material respects in relation to the consolidated financial statements taken as a whole.
/s/ KPMG LLP |
KPMG LLP
Stamford, Connecticut
February 27, 2015
GE 2014 FORM 10-K 126
FINANCIAL STATEMENTS |
AUDITED FINANCIAL STATEMENTS AND NOTES
Statement of Earnings | 128 | |||
Consolidated Statement of Comprehensive Income | 130 | |||
Consolidated Statement of Changes in Shareowners' Equity | 131 | |||
Statement of Financial Position | 132 | |||
Statement of Cash Flows | 134 | |||
Notes to Consolidated Financial Statements | ||||
1 | Basis of Presentation and Summary of Significant Accounting Policies | 136 | ||
2 | Assets and Liabilities of Businesses Held for Sale and Discontinued Operations | 149 | ||
3 | Investment Securities | 154 | ||
4 | Current Receivables | 158 | ||
5 | Inventories | 158 | ||
6 | GECC Financing Receivables and Allowance for Losses on Financing Receivables | 159 | ||
7 | Property, Plant and Equipment | 163 | ||
8 | Acquisitions, Goodwill and Other Intangible Assets | 164 | ||
9 | All Other Assets | 168 | ||
10 | Borrowings and Bank Deposits | 169 | ||
11 | Investment Contracts, Insurance Liabilities and Insurance Annuity Benefits | 170 | ||
12 | Postretirement Benefit Plans | 171 | ||
13 | All Other Liabilities | 181 | ||
14 | Income Taxes | 182 | ||
15 | Shareowners' Equity | 186 | ||
16 | Other Stock-related Information | 191 | ||
17 | Other Income | 193 | ||
18 | GECC Revenues from Services | 194 | ||
19 | Supplemental Cost Information | 194 | ||
20 | Earnings Per Share Information | 196 | ||
21 | Fair Value Measurements | 196 | ||
22 | Financial Instruments | 201 | ||
23 | Variable Interest Entities | 206 | ||
24 | Commitments, Product Warranties and Guarantees | 209 | ||
25 | Supplemental Cash Flows Information | 211 | ||
26 | Intercompany Transactions | 212 | ||
27 | Supplemental Information About the Credit Quality of Financing Receivables and Allowance for Losses on Financing Receivables | 213 | ||
28 | Operating Segments | 221 | ||
29 | Quarterly Information (unaudited) | 224 | ||
GE 2014 FORM 10-K 127
FINANCIAL STATEMENTS |
FINANCIAL STATEMENTS
STATEMENT OF EARNINGS | |||||||||||||
General Electric Company | |||||||||||||
and consolidated affiliates | |||||||||||||
For the years ended December 31 (In millions; per-share amounts in dollars) | 2014 | 2013 | 2012 | ||||||||||
Revenues and other income | |||||||||||||
Sales of goods | $ | 76,568 | $ | 71,873 | $ | 72,991 | |||||||
Sales of services | 30,190 | 28,669 | 27,158 | ||||||||||
Other income (Note 17) | 778 | 3,108 | 2,563 | ||||||||||
GECC earnings from continuing operations | - | - | - | ||||||||||
GECC revenues from services (Note 18) | 41,053 | 42,395 | 43,972 | ||||||||||
Total revenues and other income | 148,589 | 146,045 | 146,684 | ||||||||||
Costs and expenses (Note 19) | |||||||||||||
Cost of goods sold | 61,257 | 57,867 | 56,785 | ||||||||||
Cost of services sold | 20,054 | 19,274 | 17,525 | ||||||||||
Interest and other financial charges | 9,482 | 10,116 | 12,407 | ||||||||||
Investment contracts, insurance losses and | |||||||||||||
insurance annuity benefits | 2,548 | 2,676 | 2,857 | ||||||||||
Provision for losses on financing receivables (Note 6) | 3,993 | 4,818 | 3,832 | ||||||||||
Other costs and expenses | 34,026 | 35,143 | 35,897 | ||||||||||
Total costs and expenses | 131,360 | 129,894 | 129,303 | ||||||||||
Earnings from continuing operations | |||||||||||||
before income taxes | 17,229 | 16,151 | 17,381 | ||||||||||
Benefit (provision) for income taxes (Note 14) | (1,772) | (676) | (2,534) | ||||||||||
Earnings from continuing operations | 15,457 | 15,475 | 14,847 | ||||||||||
Earnings (loss) from discontinued operations, | |||||||||||||
net of taxes (Note 2) | (112) | (2,120) | (983) | ||||||||||
Net earnings | 15,345 | 13,355 | 13,864 | ||||||||||
Less net earnings (loss) attributable to noncontrolling interests | 112 | 298 | 223 | ||||||||||
Net earnings attributable to the Company | 15,233 | 13,057 | 13,641 | ||||||||||
Preferred stock dividends declared | - | - | - | ||||||||||
Net earnings attributable to GE common shareowners | $ | 15,233 | $ | 13,057 | $ | 13,641 | |||||||
Amounts attributable to GE common shareowners | |||||||||||||
Earnings from continuing operations | $ | 15,457 | $ | 15,475 | $ | 14,847 | |||||||
Less net earnings (loss) attributable to | |||||||||||||
noncontrolling interests | 112 | 298 | 223 | ||||||||||
Earnings from continuing operations attributable | |||||||||||||
to the Company | 15,345 | 15,177 | 14,624 | ||||||||||
GECC preferred stock dividends declared | - | - | - | ||||||||||
Earnings from continuing operations attributable | |||||||||||||
to GE common shareowners | 15,345 | 15,177 | 14,624 | ||||||||||
Earnings (loss) from discontinued operations, net of taxes | (112) | (2,120) | (983) | ||||||||||
Net earnings attributable to GE common shareowners | $ | 15,233 | $ | 13,057 | $ | 13,641 | |||||||
Per-share amounts (Note 20) | |||||||||||||
Earnings from continuing operations | |||||||||||||
Diluted earnings per share | $ | 1.51 | $ | 1.47 | $ | 1.38 | |||||||
Basic earnings per share | $ | 1.53 | $ | 1.48 | $ | 1.39 | |||||||
Net earnings | |||||||||||||
Diluted earnings per share | $ | 1.50 | $ | 1.27 | $ | 1.29 | |||||||
Basic earnings per share | $ | 1.51 | $ | 1.28 | $ | 1.29 | |||||||
Dividends declared per common share | $ | 0.89 | $ | 0.79 | $ | 0.70 | |||||||
See Note 3 for other-than-temporary impairment amounts.
See accompanying notes .
GE 2014 FORM 10-K 128
FINANCIAL STATEMENTS |
STATEMENT OF EARNINGS (CONTINUED) | |||||||||||||||||
For the years ended December 31 | GE(a) | Financial Services (GECC) | |||||||||||||||
(In millions; per-share amounts in dollars) | 2014 | 2013 | 2012 | 2014 | 2013 | 2012 | |||||||||||
Revenues and other income | |||||||||||||||||
Sales of goods | $ | 76,714 | $ | 71,951 | $ | 73,304 | $ | 121 | $ | 126 | $ | 119 | |||||
Sales of services | 30,594 | 29,063 | 27,571 | - | - | - | |||||||||||
Other income (Note 17) | 707 | 2,886 | 2,657 | - | - | - | |||||||||||
GECC earnings from continuing operations | 7,341 | 8,258 | 7,345 | - | - | - | |||||||||||
GECC revenues from services (Note 18) | - | - | - | 42,604 | 43,941 | 45,245 | |||||||||||
Total revenues and other income | 115,356 | 112,158 | 110,877 | 42,725 | 44,067 | 45,364 | |||||||||||
Costs and expenses (Note 19) | |||||||||||||||||
Cost of goods sold | 61,420 | 57,962 | 57,118 | 104 | 108 | 99 | |||||||||||
Cost of services sold | 20,457 | 19,668 | 17,938 | - | - | - | |||||||||||
Interest and other financial charges | 1,579 | 1,333 | 1,353 | 8,397 | 9,267 | 11,596 | |||||||||||
Investment contracts, insurance losses and | |||||||||||||||||
insurance annuity benefits | - | - | - | 2,678 | 2,779 | 2,984 | |||||||||||
Provision for losses on financing receivables (Note 6) | - | - | - | 3,993 | 4,818 | 3,832 | |||||||||||
Other costs and expenses | 14,971 | 16,105 | 17,671 | 19,912 | 19,776 | 18,924 | |||||||||||
Total costs and expenses | 98,427 | 95,068 | 94,080 | 35,084 | 36,748 | 37,435 | |||||||||||
Earnings from continuing operations | |||||||||||||||||
before income taxes | 16,929 | 17,090 | 16,797 | 7,641 | 7,319 | 7,929 | |||||||||||
Benefit (provision) for income taxes (Note 14) | (1,634) | (1,668) | (2,013) | (138) | 992 | (521) | |||||||||||
Earnings from continuing operations | 15,295 | 15,422 | 14,784 | 7,503 | 8,311 | 7,408 | |||||||||||
Earnings (loss) from discontinued operations, | |||||||||||||||||
net of taxes (Note 2) | (112) | (2,120) | (983) | (107) | (2,054) | (1,130) | |||||||||||
Net earnings | 15,183 | 13,302 | 13,801 | 7,396 | 6,257 | 6,278 | |||||||||||
Less net earnings (loss) attributable to noncontrolling interests | (50) | 245 | 160 | 162 | 53 | 63 | |||||||||||
Net earnings attributable to the Company | 15,233 | 13,057 | 13,641 | 7,234 | 6,204 | 6,215 | |||||||||||
Preferred stock dividends declared | - | - | - | (322) | (298) | (123) | |||||||||||
Net earnings attributable to GE common shareowners | $ | 15,233 | $ | 13,057 | $ | 13,641 | $ | 6,912 | $ | 5,906 | $ | 6,092 | |||||
Amounts attributable to GE common shareowners: | |||||||||||||||||
Earnings from continuing operations | $ | 15,295 | $ | 15,422 | $ | 14,784 | $ | 7,503 | $ | 8,311 | $ | 7,408 | |||||
Less net earnings (loss) attributable to | |||||||||||||||||
noncontrolling interests | (50) | 245 | 160 | 162 | 53 | 63 | |||||||||||
Earnings from continuing operations attributable | |||||||||||||||||
to the Company | 15,345 | 15,177 | 14,624 | 7,341 | 8,258 | 7,345 | |||||||||||
GECC preferred stock dividends declared | - | - | - | (322) | (298) | (123) | |||||||||||
Earnings from continuing operations attributable | |||||||||||||||||
to GE common shareowners | 15,345 | 15,177 | 14,624 | 7,019 | 7,960 | 7,222 | |||||||||||
Earnings (loss) from discontinued operations, net of taxes | (112) | (2,120) | (983) | (107) | (2,054) | (1,130) | |||||||||||
Net earnings attributable to GE common shareowners | $ | 15,233 | $ | 13,057 | $ | 13,641 | $ | 6,912 | $ | 5,906 | $ | 6,092 | |||||
(a) | Represents the adding together of all affiliated companies except General Electric Capital Corporation (GECC or Financial Services), which is presented on a one-line basis. See Note 1. |
In the consolidating data on this page, "GE" means the basis of consolidation as described in Note 1 to the consolidated financial statements; "GECC" means General Electric Capital Corporation and all of its affiliates and associated companies. Separate information is shown for "GE" and "GECC." Transactions between GE and GECC have been eliminated from the "General Electric Company and consolidated affiliates" columns on the prior page.
GE 2014 FORM 10-K 129
FINANCIAL STATEMENTS |
GENERAL ELECTRIC COMPANY AND CONSOLIDATED AFFILIATES | |||||||||||||
CONSOLIDATED STATEMENT OF COMPREHENSIVE INCOME | |||||||||||||
For the years ended December 31 (In millions) | 2014 | 2013 | 2012 | ||||||||||
Net earnings | $ | 15,345 | $ | 13,355 | $ | 13,864 | |||||||
Less net earnings (loss) attributable to noncontrolling interests | 112 | 298 | 223 | ||||||||||
Net earnings attributable to the Company | $ | 15,233 | $ | 13,057 | $ | 13,641 | |||||||
Other comprehensive income (loss) | |||||||||||||
Investment securities | $ | 708 | $ | (374) | $ | 705 | |||||||
Currency translation adjustments | (2,729) | (308) | 300 | ||||||||||
Cash flow hedges | 234 | 467 | 453 | ||||||||||
Benefit plans | (7,279) | 11,300 | 2,299 | ||||||||||
Other comprehensive income (loss) | (9,066) | 11,085 | 3,757 | ||||||||||
Less other comprehensive income (loss) attributable to noncontrolling interests | (14) | (25) | 13 | ||||||||||
Other comprehensive income (loss) attributable to the Company | $ | (9,052) | $ | 11,110 | $ | 3,744 | |||||||
Comprehensive income | $ | 6,279 | $ | 24,440 | $ | 17,621 | |||||||
Less comprehensive income (loss) attributable to noncontrolling interests | 98 | 273 | 236 | ||||||||||
Comprehensive income attributable to the Company | $ | 6,181 | $ | 24,167 | $ | 17,385 | |||||||
Amounts presented net of taxes. See Note 15 for further information about other comprehensive income and noncontrolling interests.
See accompanying notes.
GE 2014 FORM 10-K 130
>
FINANCIAL STATEMENTS |
GENERAL ELECTRIC COMPANY AND CONSOLIDATED AFFILIATES | ||||||||||||
CONSOLIDATED STATEMENT OF CHANGES IN SHAREOWNERS' EQUITY | ||||||||||||
(In millions) | 2014 | 2013 | 2012 | |||||||||
GE shareowners' equity balance at January 1 | $ | 130,566 | $ | 123,026 | $ | 116,438 | ||||||
Increases from net earnings attributable to the Company | 15,233 | 13,057 | 13,641 | |||||||||
Dividends and other transactions with shareowners | (8,951) | (8,061) | (7,372) | |||||||||
Other comprehensive income (loss) attributable to the Company | (9,052) | 11,110 | 3,744 | |||||||||
Net sales (purchases) of shares for treasury | (32) | (7,990) | (2,802) | |||||||||
Changes in other capital | 395 | (576) | (623) | |||||||||
Ending balance at December 31 | 128,159 | 130,566 | 123,026 | |||||||||
Noncontrolling interests | 8,674 | 6,217 | 5,444 | |||||||||
Total equity balance at December 31 | $ | 136,833 | $ | 136,783 | $ | 128,470 | ||||||
See Note 15 for further information about changes in shareowners' equity.
See accompanying notes.
GE 2014 FORM 10-K 131
FINANCIAL STATEMENTS |
STATEMENT OF FINANCIAL POSITION | ||||||
General Electric Company | ||||||
and consolidated affiliates | ||||||
At December 31 (In millions, except share amounts) | 2014 | 2013 | ||||
Assets | ||||||
Cash and equivalents | $ | 90,208 | $ | 88,555 | ||
Investment securities (Note 3) | 47,907 | 43,981 | ||||
Current receivables (Note 4) | 23,237 | 21,388 | ||||
Inventories (Note 5) | 17,689 | 17,325 | ||||
Financing receivables – net (Note 6 and 27) | 224,816 | 241,940 | ||||
Other GECC receivables | 9,095 | 9,114 | ||||
Property, plant and equipment – net (Note 7) | 66,387 | 68,827 | ||||
Investment in GECC | - | - | ||||
Goodwill (Note 8) | 76,553 | 77,648 | ||||
Other intangible assets – net (Note 8) | 14,156 | 14,310 | ||||
All other assets (Note 9) | 68,225 | 70,808 | ||||
Deferred income taxes (Note 14) | 2,541 | 275 | ||||
Assets of businesses held for sale (Note 2) | 6,300 | 50 | ||||
Assets of discontinued operations (Note 2) | 1,235 | 2,339 | ||||
Total assets(a) | $ | 648,349 | $ | 656,560 | ||
Liabilities and equity | ||||||
Short-term borrowings (Note 10) | $ | 71,789 | $ | 77,890 | ||
Accounts payable, principally trade accounts | 16,338 | 16,471 | ||||
Progress collections and price adjustments accrued | 12,537 | 13,125 | ||||
Dividends payable | 2,317 | 2,220 | ||||
Other GE current liabilities | 12,682 | 13,381 | ||||
Non-recourse borrowings of consolidated securitization entities (Note 10) | 29,938 | 30,124 | ||||
Bank deposits (Note 10) | 62,839 | 53,361 | ||||
Long-term borrowings (Note 10) | 200,414 | 221,665 | ||||
Investment contracts, insurance liabilities and insurance annuity benefits (Note 11) | 27,578 | 26,544 | ||||
All other liabilities (Note 13) | 70,484 | 61,057 | ||||
Liabilities of businesses held for sale (Note 2) | 3,375 | 6 | ||||
Liabilities of discontinued operations (Note 2) | 1,225 | 3,933 | ||||
Total liabilities(a) | 511,516 | 519,777 | ||||
GECC preferred stock (50,000 shares outstanding at both year-end 2014 and 2013) | - | - | ||||
Common stock (10,057,380,000 and 10,060,881,000 shares outstanding at year-end 2014 and 2013, respectively) | 702 | 702 | ||||
Accumulated other comprehensive income (loss) – net attributable to GE(b) | ||||||
Investment securities | 1,013 | 307 | ||||
Currency translation adjustments | (2,427) | 126 | ||||
Cash flow hedges | (180) | (257) | ||||
Benefit plans | (16,578) | (9,296) | ||||
Other capital | 32,889 | 32,494 | ||||
Retained earnings | 155,333 | 149,051 | ||||
Less common stock held in treasury | (42,593) | (42,561) | ||||
Total GE shareowners' equity | 128,159 | 130,566 | ||||
Noncontrolling interests(c) | 8,674 | 6,217 | ||||
Total equity (Note 15 and 16) | 136,833 | 136,783 | ||||
Total liabilities and equity | $ | 648,349 | $ | 656,560 | ||
| (a) | Our consolidated assets at December 31, 2014 included total assets of $50,453 million of certain variable interest entities (VIEs) that can only be used to settle the liabilities of those VIEs. These assets included net financing receivables of $43,620 million and investment securities of $3,374 million. Our consolidated liabilities at December 31, 2014 included liabilities of certain VIEs for which the VIE creditors do not have recourse to GE. These liabilities included non-recourse borrowings of consolidated securitization entities (CSEs) of $28,664 million. See Note 23. |
| (b) | The sum of accumulated other comprehensive income (loss) (AOCI) attributable to the Company was $(18,172) million and $(9,120) million at December 31, 2014 and 2013, respectively. |
| (c) | Included AOCI attributable to noncontrolling interests of $(194) million and $(180) million at December 31, 2014 and 2013, respectively. |
GE 2014 FORM 10-K 132
FINANCIAL STATEMENTS |
STATEMENT OF FINANCIAL POSITION (CONTINUED) | |||||||||||
GE(a) | Financial Services (GECC) | ||||||||||
At December 31 (In millions, except share amounts) | 2014 | 2013 | 2014 | 2013 | |||||||
Assets | |||||||||||
Cash and equivalents | $ | 15,916 | $ | 13,682 | $ | 74,292 | $ | 74,873 | |||
Investment securities (Note 3) | 84 | 323 | 47,827 | 43,662 | |||||||
Current receivables (Note 4) | 11,513 | 10,970 | - | - | |||||||
Inventories (Note 5) | 17,639 | 17,257 | 50 | 68 | |||||||
Financing receivables – net (Note 6 and 27) | - | - | 237,018 | 253,029 | |||||||
Other GECC receivables | - | - | 16,683 | 16,513 | |||||||
Property, plant and equipment – net (Note 7) | 17,207 | 17,574 | 49,570 | 51,607 | |||||||
Investment in GECC | 82,549 | 77,745 | - | - | |||||||
Goodwill (Note 8) | 51,527 | 51,453 | 25,026 | 26,195 | |||||||
Other intangible assets – net (Note 8) | 12,984 | 13,180 | 1,176 | 1,136 | |||||||
All other assets (Note 9) | 24,680 | 23,708 | 43,875 | 47,366 | |||||||
Deferred income taxes | 8,772 | 5,061 | (6,231) | (4,786) | |||||||
Assets of businesses held for sale (Note 2) | 2,805 | - | 3,474 | 50 | |||||||
Assets of discontinued operations (Note 2) | 10 | 9 | 1,225 | 2,330 | |||||||
Total assets | $ | 245,686 | $ | 230,962 | $ | 493,985 | $ | 512,043 | |||
Liabilities and equity | |||||||||||
Short-term borrowings (Note 10) | $ | 3,872 | $ | 1,841 | $ | 68,780 | $ | 77,298 | |||
Accounts payable, principally trade accounts | 16,511 | 16,353 | 6,177 | 6,549 | |||||||
Progress collections and price adjustments accrued | 12,550 | 13,152 | - | - | |||||||
Dividends payable | 2,317 | 2,220 | - | - | |||||||
Other GE current liabilities | 12,681 | 13,381 | - | - | |||||||
Non-recourse borrowings of consolidated securitization entities (Note 10) | - | - | 29,938 | 30,124 | |||||||
Bank deposits (Note 10) | - | - | 62,839 | 53,361 | |||||||
Long-term borrowings (Note 10) | 12,468 | 11,515 | 187,991 | 210,279 | |||||||
Investment contracts, insurance liabilities and insurance annuity benefits (Note 11) | - | - | 28,027 | 26,979 | |||||||
All other liabilities (Note 13) | 54,662 | 40,955 | 16,313 | 20,531 | |||||||
Liabilities of businesses held for sale (Note 2) | 1,504 | - | 2,434 | 6 | |||||||
Liabilities of discontinued operations (Note 2) | 137 | 143 | 1,088 | 3,790 | |||||||
Total liabilities | 116,702 | 99,560 | 403,587 | 428,917 | |||||||
GECC preferred stock (50,000 shares outstanding at year-end both 2014 and 2013) | - | - | - | - | |||||||
Common stock (10,057,380,000 and 10,060,881,000 | |||||||||||
shares outstanding at year-end both 2014 and 2013, respectively) | 702 | 702 | - | - | |||||||
Accumulated other comprehensive income (loss) - net attributable to GE | |||||||||||
Investment securities | 1,013 | 307 | 1,010 | 309 | |||||||
Currency translation adjustments | (2,427) | 126 | (838) | (687) | |||||||
Cash flow hedges | (180) | (257) | (172) | (293) | |||||||
Benefit plans | (16,578) | (9,296) | (577) | (363) | |||||||
Other capital | 32,889 | 32,494 | 32,999 | 32,563 | |||||||
Retained earnings | 155,333 | 149,051 | 55,077 | 51,165 | |||||||
Less common stock held in treasury | (42,593) | (42,561) | - | - | |||||||
Total GE shareowners' equity | 128,159 | 130,566 | 87,499 | 82,694 | |||||||
Noncontrolling interests | 825 | 836 | 2,899 | 432 | |||||||
Total equity (Note 15 and 16) | 128,984 | 131,402 | 90,398 | 83,126 | |||||||
Total liabilities and equity | $ | 245,686 | $ | 230,962 | $ | 493,985 | $ | 512,043 | |||
| (a) | Represents the adding together of all affiliated companies except General Electric Capital Corporation (GECC or Financial Services), which is presented on a one-line basis. See Note 1. |
In the consolidating data on this page, "GE" means the basis of consolidation as described in Note 1 to the consolidated financial statements; "GECC" means General Electric Capital Corporation and all of its affiliates and associated companies. Separate information is shown for "GE" and "GECC." Transactions between GE and GECC have been eliminated from the "General Electric Company and consolidated affiliates" columns on the prior page.
GE 2014 FORM 10-K 133
FINANCIAL STATEMENTS |
STATEMENT OF CASH FLOWS | General Electric Company | |||||||
and consolidated affiliates | ||||||||
For the years ended December 31 (In millions) | 2014 | 2013 | 2012 | |||||
Cash flows – operating activities | ||||||||
Net earnings | $ | 15,345 | $ | 13,355 | $ | 13,864 | ||
Less net earnings (loss) attributable to noncontrolling interests | 112 | 298 | 223 | |||||
Net earnings attributable to the Company | 15,233 | 13,057 | 13,641 | |||||
(Earnings) loss from discontinued operations | 112 | 2,120 | 983 | |||||
Adjustments to reconcile net earnings attributable to the | ||||||||
Company to cash provided from operating activities | ||||||||
Depreciation and amortization of property, | ||||||||
plant and equipment | 9,283 | 9,762 | 9,192 | |||||
Earnings from continuing operations retained by GECC | - | - | - | |||||
Deferred income taxes | (1,186) | (3,295) | (1,152) | |||||
Decrease (increase) in GE current receivables | (1,913) | (485) | (879) | |||||
Decrease (increase) in inventories | (872) | (1,368) | (1,274) | |||||
Increase (decrease) in accounts payable | 305 | 360 | (437) | |||||
Increase (decrease) in GE progress collections | (515) | 1,893 | (920) | |||||
Provision for losses on GECC financing receivables | 3,993 | 4,818 | 3,832 | |||||
All other operating activities | 3,075 | 2,175 | 8,029 | |||||
Cash from (used for) operating activities – continuing operations | 27,515 | 29,037 | 31,015 | |||||
Cash from (used for) operating activities – discontinued operations | 195 | (458) | 316 | |||||
Cash from (used for) operating activities | 27,710 | 28,579 | 31,331 | |||||
Cash flows – investing activities | ||||||||
Additions to property, plant and equipment | (13,727) | (13,458) | (15,119) | |||||
Dispositions of property, plant and equipment | 6,262 | 5,883 | 6,184 | |||||
Net decrease (increase) in GECC financing receivables | (4,267) | 2,715 | 6,979 | |||||
Proceeds from sale of discontinued operations | 232 | 528 | 227 | |||||
Proceeds from principal business dispositions | 2,950 | 3,324 | 3,618 | |||||
Proceeds from sale of equity interest in NBCU LLC | - | 16,699 | - | |||||
Net cash from (payments for) principal businesses purchased | (2,639) | (1,642) | (1,456) | |||||
All other investing activities | 6,447 | 14,625 | 11,157 | |||||
Cash from (used for) investing activities – continuing operations | (4,742) | 28,674 | 11,590 | |||||
Cash from (used for) investing activities – discontinued operations | (288) | 443 | (288) | |||||
Cash from (used for) investing activities | (5,030) | 29,117 | 11,302 | |||||
Cash flows – financing activities | ||||||||
Net increase (decrease) in borrowings (maturities of | ||||||||
90 days or less) | (6,112) | (14,230) | (2,231) | |||||
Net increase (decrease) in bank deposits | 13,286 | 2,197 | 2,450 | |||||
Newly issued debt (maturities longer than 90 days) | 37,548 | 45,392 | 63,019 | |||||
Repayments and other reductions (maturities longer than 90 days) | (53,380) | (61,461) | (103,942) | |||||
Proceeds from issuance of GECC preferred stock | - | 990 | 3,960 | |||||
Net dispositions (purchases) of GE shares for treasury | (1,218) | (9,278) | (4,164) | |||||
Dividends paid to shareowners | (8,851) | (7,821) | (7,189) | |||||
Proceeds from initial public offering of Synchrony Financial | 2,842 | - | - | |||||
All other financing activities | (1,067) | (1,418) | (2,958) | |||||
Cash from (used for) financing activities – continuing operations | (16,952) | (45,629) | (51,055) | |||||
Cash from (used for) financing activities – discontinued operations | (6) | 56 | (19) | |||||
Cash from (used for) financing activities | (16,958) | (45,573) | (51,074) | |||||
Effect of currency exchange rate changes on cash and equivalents | (3,492) | (795) | 1,278 | |||||
Increase (decrease) in cash and equivalents | 2,230 | 11,328 | (7,163) | |||||
Cash and equivalents at beginning of year | 88,787 | 77,459 | 84,622 | |||||
Cash and equivalents at end of year | 91,017 | 88,787 | 77,459 | |||||
Less cash and equivalents of discontinued operations | ||||||||
at end of year | 133 | 232 | 191 | |||||
Cash and equivalents of continuing operations at end of year | $ | 90,884 | $ | 88,555 | $ | 77,268 | ||
Supplemental disclosure of cash flows information | ||||||||
Cash paid during the year for interest | $ | (9,560) | $ | (8,988) | $ | (12,717) | ||
Cash recovered (paid) during the year for income taxes | (2,955) | (2,487) | (3,237) | |||||
GE 2014 FORM 10-K 134
FINANCIAL STATEMENTS |
STATEMENT OF CASH FLOWS (CONTINUED) | ||||||||||||||||||||
GE(a) | Financial Services (GECC) | |||||||||||||||||||
For the years ended December 31 (In millions) | 2014 | 2013 | 2012 | 2014 | 2013 | 2012 | ||||||||||||||
Cash flows – operating activities | ||||||||||||||||||||
Net earnings | $ | 15,183 | $ | 13,302 | $ | 13,801 | $ | 7,396 | $ | 6,257 | $ | 6,278 | ||||||||
Less net earnings (loss) attributable to noncontrolling interests | (50) | 245 | 160 | 162 | 53 | 63 | ||||||||||||||
Net earnings attributable to the Company | 15,233 | 13,057 | 13,641 | 7,234 | 6,204 | 6,215 | ||||||||||||||
(Earnings) loss from discontinued operations | 112 | 2,120 | 983 | 107 | 2,054 | 1,130 | ||||||||||||||
Adjustments to reconcile net earnings attributable to the | ||||||||||||||||||||
Company to cash provided from operating activities | ||||||||||||||||||||
Depreciation and amortization of property, | ||||||||||||||||||||
plant and equipment | 2,508 | 2,449 | 2,291 | 6,859 | 7,313 | 6,901 | ||||||||||||||
Earnings from continuing operations retained by GECC(b) | (4,341) | (2,273) | (919) | - | - | - | ||||||||||||||
Deferred income taxes | (476) | (2,571) | (294) | (710) | (724) | (858) | ||||||||||||||
Decrease (increase) in GE current receivables | (473) | (1,432) | 1,105 | - | - | - | ||||||||||||||
Decrease (increase) in inventories | (877) | (1,351) | (1,204) | 27 | 33 | (27) | ||||||||||||||
Increase (decrease) in accounts payable | 884 | 809 | 158 | (2) | 73 | (880) | ||||||||||||||
Increase (decrease) in GE progress collections | (528) | 1,919 | (920) | - | - | - | ||||||||||||||
Provision for losses on GECC financing receivables | - | - | - | 3,993 | 4,818 | 3,832 | ||||||||||||||
All other operating activities | 3,129 | 1,528 | 2,985 | 240 | 99 | 5,418 | ||||||||||||||
Cash from (used for) operating activities – continuing operations | 15,171 | 14,255 | 17,826 | 17,748 | 19,870 | 21,731 | ||||||||||||||
Cash from (used for) operating activities – discontinued operations | (2) | (2) | - | 197 | (456) | 316 | ||||||||||||||
Cash from (used for) operating activities | 15,169 | 14,253 | 17,826 | 17,945 | 19,414 | 22,047 | ||||||||||||||
Cash flows – investing activities | ||||||||||||||||||||
Additions to property, plant and equipment | (3,970) | (3,680) | (3,937) | (10,410) | (9,978) | (11,879) | ||||||||||||||
Dispositions of property, plant and equipment | - | - | - | 6,284 | 5,883 | 6,184 | ||||||||||||||
Net decrease (increase) in GECC financing receivables | - | - | - | (5,689) | 3,589 | 5,490 | ||||||||||||||
Proceeds from sale of discontinued operations | - | - | - | 232 | 528 | 227 | ||||||||||||||
Proceeds from principal business dispositions | 602 | 1,316 | 540 | 2,320 | 1,983 | 2,863 | ||||||||||||||
Proceeds from sale of equity interest in NBCU LLC | - | 16,699 | - | - | - | - | ||||||||||||||
Net cash from (payments for) principal businesses purchased | (2,091) | (8,026) | (1,456) | (548) | 6,384 | - | ||||||||||||||
All other investing activities | (447) | (1,488) | (564) | 6,997 | 14,972 | 11,794 | ||||||||||||||
Cash from (used for) investing activities – continuing operations | (5,906) | 4,821 | (5,417) | (814) | 23,361 | 14,679 | ||||||||||||||
Cash from (used for) investing activities – discontinued operations | 2 | 2 | - | (290) | 441 | (288) | ||||||||||||||
Cash from (used for) investing activities | (5,904) | 4,823 | (5,417) | (1,104) | 23,802 | 14,391 | ||||||||||||||
Cash flows – financing activities | ||||||||||||||||||||
Net increase (decrease) in borrowings (maturities of | ||||||||||||||||||||
90 days or less) | 243 | 949 | (890) | (6,781) | (13,892) | (1,401) | ||||||||||||||
Net increase (decrease) in bank deposits | - | - | - | 13,286 | 2,197 | 2,450 | ||||||||||||||
Newly issued debt (maturities longer than 90 days) | 3,084 | 512 | 6,961 | 34,464 | 44,888 | 55,841 | ||||||||||||||
Repayments and other reductions (maturities longer than 90 days) | (323) | (5,032) | (34) | (53,057) | (56,429) | (103,908) | ||||||||||||||
Proceeds from issuance of GECC preferred stock | - | - | - | - | 990 | 3,960 | ||||||||||||||
Net dispositions (purchases) of GE shares for treasury | (1,218) | (9,278) | (4,164) | - | - | - | ||||||||||||||
Dividends paid to shareowners | (8,851) | (7,821) | (7,189) | (3,322) | (6,283) | (6,549) | ||||||||||||||
Proceeds from initial public offering of Synchrony Financial | - | - | - | 2,842 | - | - | ||||||||||||||
All other financing activities | 346 | (211) | 32 | (1,091) | (909) | (2,867) | ||||||||||||||
Cash from (used for) financing activities – continuing operations | (6,719) | (20,881) | (5,284) | (13,659) | (29,438) | (52,474) | ||||||||||||||
Cash from (used for) financing activities – discontinued operations | - | - | - | (6) | 56 | (19) | ||||||||||||||
Cash from (used for) financing activities | (6,719) | (20,881) | (5,284) | (13,665) | (29,382) | (52,493) | ||||||||||||||
Effect of currency exchange rate changes on cash and equivalents | (312) | (22) | 2 | (3,180) | (773) | 1,276 | ||||||||||||||
Increase (decrease) in cash and equivalents | 2,234 | (1,827) | 7,127 | (4) | 13,061 | (14,779) | ||||||||||||||
Cash and equivalents at beginning of year | 13,682 | 15,509 | 8,382 | 75,105 | 62,044 | 76,823 | ||||||||||||||
Cash and equivalents at end of year | 15,916 | 13,682 | 15,509 | 75,101 | 75,105 | 62,044 | ||||||||||||||
Less cash and equivalents of discontinued operations | ||||||||||||||||||||
at end of year | - | - | - | 133 | 232 | 191 | ||||||||||||||
Cash and equivalents of continuing operations at end of year | $ | 15,916 | $ | 13,682 | $ | 15,509 | $ | 74,968 | $ | 74,873 | $ | 61,853 | ||||||||
Supplemental disclosure of cash flows information | ||||||||||||||||||||
Cash paid during the year for interest | $ | (1,215) | $ | (1,132) | $ | (1,182) | $ | (8,910) | $ | (8,146) | $ | (12,172) | ||||||||
Cash recovered (paid) during the year for income taxes | (1,337) | (4,753) | (2,987) | (1,618) | 2,266 | (250) | ||||||||||||||
| (a) | Represents the adding together of all affiliated companies except General Electric Capital Corporation (GECC or Financial Services), which is presented on a one-line basis. |
| (b) | Represents GECC earnings from continuing operations attributable to the Company, net of GECC dividends paid to GE. |
In the consolidating data on this page, "GE" means the basis of consolidation as described in Note 1 to the consolidated financial statements; "GECC" means General Electric Capital Corporation and all of its affiliates and associated companies. Separate information is shown for "GE" and "GECC." Transactions between GE and GECC have been eliminated from the "General Electric Company and consolidated affiliates" columns on the prior page and are discussed in Note 26.
See Note 25 for supplemental information regarding the Statement of Cash Flows
GE 2014 FORM 10-K 135
FINANCIAL STATEMENTS | PRESENTATION & POLICIES |
NOTES TO CONSOLIDATED FINANCIAL STATEMENTS
NOTE 1. BASIS OF PRESENTATION AND SUMMARY OF SIGNIFICANT ACCOUNTING POLICIES
ACCOUNTING PRINCIPLES
Our financial statements are prepared in conformity with U.S. generally accepted accounting principles (GAAP).
CONSOLIDATION
Our financial statements consolidate all of our affiliates – entities in which we have a controlling financial interest, most often because we hold a majority voting interest. To determine if we hold a controlling financial interest in an entity, we first evaluate if we are required to apply the variable interest entity (VIE) model to the entity, otherwise the entity is evaluated under the voting interest model.
Where we hold current or potential rights that give us the power to direct the activities of a VIE that most significantly impact the VIE's economic performance combined with a variable interest that gives us the right to receive potentially significant benefits or the obligation to absorb potentially significant losses, we have a controlling financial interest in that VIE. Rights held by others to remove the party with power over the VIE are not considered unless one party can exercise those rights unilaterally. When changes occur to the design of an entity, we reconsider whether it is subject to the VIE model. We continuously evaluate whether we have a controlling financial interest in a VIE.
We hold a controlling financial interest in other entities where we currently hold, directly or indirectly, more than 50% of the voting rights or where we exercise control through substantive participating rights or as a general partner. Where we are a general partner, we consider substantive removal rights held by other partners in determining if we hold a controlling financial interest. We reevaluate whether we have a controlling financial interest in these entities when our voting or substantive participating rights change.
Associated companies are unconsolidated VIEs and other entities in which we do not have a controlling financial interest, but over which we have significant influence, most often because we hold a voting interest of 20% to 50%. Associated companies are accounted for as equity method investments. Results of associated companies are presented on a one-line basis. Investments in, and advances to, associated companies are presented on a one-line basis in the caption "All other assets" in our Statement of Financial Position, net of allowance for losses, which represents our best estimate of probable losses inherent in such assets.
SYNCHRONY FINANCIAL INITIAL PUBLIC OFFERING
On August 5, 2014, we completed the initial public offering (IPO) of our North American Retail Finance business, Synchrony Financial, as a first step in a planned, staged exit from that business. Synchrony Financial closed the IPO of 125 million shares of common stock at a price to the public of $23.00 per share and on September 3, 2014, Synchrony Financial issued an additional 3.5 million shares of common stock pursuant to an option granted to the underwriters in the IPO (Underwriters' Option). We received net proceeds from the IPO and the Underwriters' Option of $2,842 million, which remain at Synchrony Financial. Following the closing of the IPO and the Underwriters' Option, we currently own approximately 85% of Synchrony Financial and as a result, GECC continues to consolidate the business. The 15% is presented as noncontrolling interests. In addition, in August 2014, Synchrony Financial completed issuances of $3,593 million of senior unsecured debt with maturities up to 10 years and $8,000 million of unsecured term loans maturing in 2019, and in October 2014 completed issuances of $750 million of unsecured term loans maturing in 2019 under the New Bank Term Loan Facility with third party lenders. Subsequent to December 31, 2014 through February 13, 2015, Synchrony Financial issued an additional $1,000 million of senior unsecured debt maturing in 2020.
GE 2014 FORM 10-K 136
FINANCIAL STATEMENTS | PRESENTATION & POLICIES |
FINANCIAL STATEMENT PRESENTATION
We have reclassified certain prior-year amounts to conform to the current-year's presentation.
Financial data and related measurements are presented in the following categories:
GE. This represents the adding together of all affiliates other than General Electric Capital Corporation (GECC), whose continuing operations are presented on a one-line basis, giving effect to the elimination of transactions among such affiliates.
GECC . This represents the adding together of all affiliates of GECC, giving effect to the elimination of transactions among such affiliates.
Consolidated . This represents the adding together of GE and GECC, giving effect to the elimination of transactions between GE and GECC.
Operating Segments . These comprise our eight businesses, focused on the broad markets they serve: Power & Water, Oil & Gas, Energy Management, Aviation, Healthcare, Transportation, Appliances & Lighting and GE Capital.
Unless otherwise indicated, information in these notes to consolidated financial statements relates to continuing operations. Certain of our operations have been presented as discontinued. See Note 2.
The effects of translating to U.S. dollars the financial statements of non-U.S. affiliates whose functional currency is the local currency are included in shareowners' equity. Asset and liability accounts are translated at year-end exchange rates, while revenues and expenses are translated at average rates for the respective periods.
Preparing financial statements in conformity with GAAP requires us to make estimates based on assumptions about current, and for some estimates future, economic and market conditions (for example, unemployment, market liquidity, the real estate market, etc.), which affect reported amounts and related disclosures in our financial statements. Although our current estimates contemplate current conditions and how we expect them to change in the future, as appropriate, it is reasonably possible that in 2015 actual conditions could be worse than anticipated in those estimates, which could materially affect our results of operations and financial position. Among other effects, such changes could result in future impairments of investment securities, goodwill, intangibles and long-lived assets, incremental losses on financing receivables, establishment of valuation allowances on deferred tax assets and increased tax liabilities.
SALES OF GOODS AND SERVICES
We record all sales of goods and services only when a firm sales agreement is in place, delivery has occurred or services have been rendered and collectability of the fixed or determinable sales price is reasonably assured.
Arrangements for the sale of goods and services sometimes include multiple components. Most of our multiple component arrangements involve the sale of goods and services in the Healthcare segment. Our arrangements with multiple components usually involve an upfront deliverable of large machinery or equipment and future service deliverables such as installation, commissioning, training or the future delivery of ancillary products. In most cases, the relative values of the undelivered components are not significant to the overall arrangement and are typically delivered within three to six months after the core product has been delivered. In such agreements, selling price is determined for each component and any difference between the total of the separate selling prices and total contract consideration (i.e., discount) is allocated pro rata across each of the components in the arrangement. The value assigned to each component is objectively determined and obtained primarily from sources such as the separate selling price for that or a similar item or from competitor prices for similar items. If such evidence is not available, we use our best estimate of selling price, which is established consistent with the pricing strategy of the business and considers product configuration, geography, customer type, and other market specific factors.
GE 2014 FORM 10-K 137
FINANCIAL STATEMENTS | PRESENTATION & POLICIES |
Except for goods sold under long-term agreements, we recognize sales of goods under the provisions of U.S. Securities and Exchange Commission (SEC) Staff Accounting Bulletin (SAB) 104, Revenue Recognition . We often sell consumer products and computer hardware and software products with a right of return. We use our accumulated experience to estimate and provide for such returns when we record the sale. In situations where arrangements include customer acceptance provisions based on seller or customer-specified objective criteria, we recognize revenue when we have reliably demonstrated that all specified acceptance criteria have been met or when formal acceptance occurs, respectively. In arrangements where we provide goods for trial and evaluation purposes, we only recognize revenue after customer acceptance occurs. Unless otherwise noted, we do not provide for anticipated losses before we record sales.
We recognize revenue on agreements for sales of goods and services under power generation unit and uprate contracts, nuclear fuel assemblies, larger oil drilling equipment projects, aeroderivative unit contracts, military development contracts, locomotive production contracts, and long-term construction projects, using long-term construction and production contract accounting. We estimate total long-term contract revenue net of price concessions as well as total contract costs. For goods sold under power generation unit and uprate contracts, nuclear fuel assemblies, aeroderivative unit contracts, military development contracts and locomotive production contracts, we recognize sales as we complete major contract-specified deliverables, most often when customers receive title to the goods or accept the services as performed. For larger oil drilling equipment projects and long-term construction projects, we recognize sales based on our progress toward contract completion measured by actual costs incurred in relation to our estimate of total expected costs. We measure long-term contract revenues by applying our contract-specific estimated margin rates to incurred costs. We routinely update our estimates of future costs for agreements in process and report any cumulative effects of such adjustments in current operations. We provide for any loss that we expect to incur on these agreements when that loss is probable.
We recognize revenue upon delivery for sales of aircraft engines, military propulsion equipment and related spare parts not sold under long-term product services agreements. Delivery of commercial engines, non-U.S. military equipment and all related spare parts occurs on shipment; delivery of military propulsion equipment sold to the U.S. government or agencies thereof occurs upon receipt of a Material Inspection and Receiving Report, DD Form 250 or Memorandum of Shipment. Commercial aircraft engines are complex equipment manufactured to customer order under a variety of sometimes complex, long-term agreements. We measure sales of commercial aircraft engines by applying our contract-specific estimated margin rates to incurred costs. We routinely update our estimates of future revenues and costs for commercial aircraft engine agreements in process and report any cumulative effects of such adjustments in current operations. Significant components of our revenue and cost estimates include price concessions and performance-related guarantees as well as material, labor and overhead costs. We measure revenue for military propulsion equipment and spare parts not subject to long-term product services agreements based on the specific contract on a specifically measured output basis. We provide for any loss that we expect to incur on these agreements when that loss is probable; consistent with industry practice, for commercial aircraft engines, we make such provision only if such losses are not recoverable from future highly probable sales of spare parts and services for those engines.
We sell product services under long-term product maintenance or extended warranty agreements in our Aviation, Power & Water, Oil & Gas and Transportation segments, where costs of performing services are incurred on other than a straight-line basis. We also sell product services in our Healthcare segment, where such costs generally are expected to be on a straight-line basis. For the Aviation, Power & Water, Oil & Gas and Transportation agreements, we recognize related sales based on the extent of our progress toward completion measured by actual costs incurred in relation to total expected costs. We routinely update our estimates of future costs for agreements in process and report any cumulative effects of such adjustments in current operations. For the Healthcare agreements, we recognize revenues on a straight-line basis and expense related costs as incurred. We provide for any loss that we expect to incur on any of these agreements when that loss is probable.
GE 2014 FORM 10-K 138
FINANCIAL STATEMENTS | PRESENTATION & POLICIES |
GECC REVENUES FROM SERVICES (EARNED INCOME)
We use the interest method to recognize income on loans. Interest on loans includes origination, commitment and other non-refundable fees related to funding (recorded in earned income on the interest method). We stop accruing interest at the earlier of the time at which collection of an account becomes doubtful or the account becomes 90 days past due, with the exception of consumer credit card accounts. Beginning in the fourth quarter of 2013, we continue to accrue interest on consumer credit cards until the accounts are written off in the period the account becomes 180 days past due. Previously, we stopped accruing interest on consumer credit cards when the account became 90 days past due. Previously recognized interest income that was accrued but not collected from the borrower is reversed, unless the terms of the loan agreement permit capitalization of accrued interest to the principal balance. Although we stop accruing interest in advance of payments, we recognize interest income as cash is collected when appropriate, provided the amount does not exceed that which would have been earned at the historical effective interest rate; otherwise, payments received are applied to reduce the principal balance of the loan.
We resume accruing interest on nonaccrual, non-restructured commercial loans only when (a) payments are brought current according to the loan's original terms and (b) future payments are reasonably assured. When we agree to restructured terms with the borrower, we resume accruing interest only when it is reasonably assured that we will recover full contractual payments, and such loans pass underwriting reviews equivalent to those applied to new loans. We resume accruing interest on nonaccrual consumer loans when the customer's account is less than 90 days past due and collection of such amounts is probable. Interest accruals on modified consumer loans that are not considered to be troubled debt restructurings (TDRs) may return to current status (re-aged) only after receipt of at least three consecutive minimum monthly payments or the equivalent cumulative amount, subject to a re-aging limitation of once a year, or twice in a five-year period.
We recognize financing lease income on the interest method to produce a level yield on funds not yet recovered. Estimated unguaranteed residual values are based upon management's best estimates of the value of the leased asset at the end of the lease term. We use various sources of data in determining this estimate, including information obtained from third parties, which is adjusted for the attributes of the specific asset under lease. Guarantees of residual values by unrelated third parties are considered part of minimum lease payments. Significant assumptions we use in estimating residual values include estimated net cash flows over the remaining lease term, anticipated results of future remarketing, and estimated future component part and scrap metal prices, discounted at an appropriate rate.
We recognize operating lease income on a straight-line basis over the terms of underlying leases.
Fees include commitment fees related to loans that we do not expect to fund and line-of-credit fees. We record these fees in earned income on a straight-line basis over the period to which they relate. We record syndication fees in earned income at the time related services are performed, unless significant contingencies exist.
DEPRECIATION AND AMORTIZATION
The cost of GE manufacturing plant and equipment is depreciated over its estimated economic life. U.S. assets are depreciated using an accelerated method based on a sum-of-the-years digits formula; non-U.S. assets are generally depreciated on a straight-line basis.
The cost of GECC equipment leased to others on operating leases is depreciated on a straight-line basis to estimated residual value over the lease term or over the estimated economic life of the equipment.
The cost of GECC acquired real estate investments is depreciated on a straight-line basis to the estimated salvage value over the expected useful life or the estimated proceeds upon sale of the investment at the end of the expected holding period if that approach produces a higher measure of depreciation expense.
GE 2014 FORM 10-K 139
FINANCIAL STATEMENTS | PRESENTATION & POLICIES |
LOSSES ON FINANCING RECEIVABLES
Losses on financing receivables are recognized when they are incurred, which requires us to make our best estimate of probable losses inherent in the portfolio. The method for calculating the best estimate of losses depends on the size, type and risk characteristics of the related financing receivable. Such an estimate requires consideration of historical loss experience, adjusted for current conditions, and judgments about the probable effects of relevant observable data, including present economic conditions such as delinquency rates, financial health of specific customers and market sectors, collateral values (including housing price indices as applicable), and the present and expected future levels of interest rates. The underlying assumptions, estimates and assessments we use to provide for losses are updated periodically to reflect our view of current conditions and are subject to the regulatory examination process, which can result in changes to our assumptions. Changes in such estimates can significantly affect the allowance and provision for losses. It is possible that we will experience credit losses that are different from our current estimates. Write-offs are deducted from the allowance for losses when we judge the principal to be uncollectible and subsequent recoveries are added to the allowance at the time cash is received on a written-off account.
"Impaired" loans are defined as larger-balance or restructured loans for which it is probable that the lender will be unable to collect all amounts due according to the original contractual terms of the loan agreement.
The vast majority of our Consumer and a portion of our Commercial Lending and Leasing (CLL) nonaccrual receivables are excluded from this definition, as they represent smaller-balance homogeneous loans that we evaluate collectively by portfolio for impairment.
Impaired loans include nonaccrual receivables on larger-balance or restructured loans, loans that are currently paying interest under the cash basis and loans paying currently that had been previously restructured.
Specific reserves are recorded for individually impaired loans to the extent we have determined that it is probable that we will be unable to collect all amounts due according to original contractual terms of the loan agreement. Certain loans classified as impaired may not require a reserve because we believe that we will ultimately collect the unpaid balance (through collection or collateral repossession).
"Troubled debt restructurings" (TDRs) are those loans for which we have granted a concession to a borrower experiencing financial difficulties where we do not receive adequate compensation. Such loans are classified as impaired, and are individually reviewed for specific reserves.
"Nonaccrual financing receivables" are those on which we have stopped accruing interest. We stop accruing interest at the earlier of the time at which collection of an account becomes doubtful or the account becomes 90 days past due, with the exception of consumer credit card accounts, for which we continue to accrue interest until the accounts are written off in the period that the account becomes 180 days past due. Although we stop accruing interest in advance of payments, we recognize interest income as cash is collected when appropriate provided the amount does not exceed that which would have been earned at the historical effective interest rate. Recently restructured financing receivables are not considered delinquent when payments are brought current according to the restructured terms, but may remain classified as nonaccrual until there has been a period of satisfactory payment performance by the borrower and future payments are reasonably assured of collection.
"Delinquent" receivables are those that are 30 days or more past due based on their contractual terms.
GE 2014 FORM 10-K 140
FINANCIAL STATEMENTS | PRESENTATION & POLICIES |
Our consumer loan portfolio consists of smaller-balance, homogeneous loans, including credit card receivables, installment loans, auto loans and leases and residential mortgages. We collectively evaluate each portfolio for impairment quarterly. The allowance for losses on these receivables is established through a process that estimates the probable losses inherent in the portfolio based upon statistical analyses of portfolio data. These analyses include migration analysis, in which historical delinquency and credit loss experience is applied to the current aging of the portfolio, together with other analyses that reflect current trends and conditions. We also consider our historical loss experience to date based on actual defaulted loans and overall portfolio indicators including nonaccrual loans, trends in loan volume and lending terms, credit policies and other observable environmental factors such as unemployment rates and home price indices.
Our commercial loan and lease portfolio consists of a variety of loans and leases, including both larger-balance, non-homogeneous loans and leases and smaller-balance homogeneous loans and leases. Losses on such loans and leases are recorded when probable and estimable. We routinely evaluate our entire portfolio for potential specific credit or collection issues that might indicate an impairment.
For larger-balance, non-homogeneous loans and leases, we consider the financial status, payment history, collateral value, industry conditions and guarantor support related to specific customers. Any delinquencies or bankruptcies are indications of potential impairment requiring further assessment of collectability. We routinely receive financial as well as rating agency reports on our customers, and we elevate for further attention those customers whose operations we judge to be marginal or deteriorating. We also elevate customers for further attention when we observe a decline in collateral values for asset-based loans. While collateral values are not always available, when we observe such a decline, we evaluate relevant markets to assess recovery alternatives – for example, for real estate loans, relevant markets are local; for commercial aircraft loans, relevant markets are global.
Measurement of the loss on our impaired commercial loans is based on the present value of expected future cash flows discounted at the loan's effective interest rate or the fair value of collateral, net of expected selling costs, if the loan is determined to be collateral dependent. We determine whether a loan is collateral dependent if the repayment of the loan is expected to be provided solely by the underlying collateral. Our review process can often result in reserves being established in advance of a modification of terms or designation as a TDR. After providing for specific incurred losses, we then determine an allowance for losses that have been incurred in the balance of the portfolio but cannot yet be identified to a specific loan or lease. This estimate is based upon various statistical analyses considering historical and projected default rates and loss severity and aging, as well as our view on current market and economic conditions. It is prepared by each respective line of business. For Real Estate, this includes assessing the probability of default and the loss given default based on loss history of our portfolio for loans with similar loan metrics and attributes.
We consider multiple factors in evaluating the adequacy of our allowance for losses on Real Estate financing receivables, including loan-to-value ratios, collateral values at the individual loan level, debt service coverage ratios, delinquency status, and economic factors including interest rate and real estate market forecasts. In addition to these factors, we evaluate a Real Estate loan for impairment classification if its projected loan-to-value ratio at maturity is in excess of 100%, even if the loan is currently paying in accordance with its contractual terms. Substantially all of the loans in the Real Estate portfolio are considered collateral dependent and are measured for impairment based on the fair value of collateral. If foreclosure is deemed probable or if repayment is dependent solely on the sale of collateral, we also include estimated selling costs in our reserve. Collateral values for our Real Estate loans are determined based upon internal cash flow estimates discounted at an appropriate rate and corroborated by external appraisals, as appropriate. Collateral valuations are routinely monitored and updated annually, or more frequently for changes in collateral, market and economic conditions. Further discussion on determination of fair value is in the Fair Value Measurements section below.
GE 2014 FORM 10-K 141
FINANCIAL STATEMENTS | PRESENTATION & POLICIES |
Experience is not available for new products; therefore, while we are developing that experience, we set loss allowances based on our experience with the most closely analogous products in our portfolio.
Our loss mitigation strategy intends to minimize economic loss and, at times, can result in rate reductions, principal forgiveness, extensions, forbearance or other actions, which may cause the related loan to be classified as a TDR.
We utilize certain loan modification programs for borrowers experiencing temporary financial difficulties in our Consumer loan portfolio. These loan modification programs are primarily concentrated in our non-U.S. residential mortgage and non-U.S. installment and revolving portfolios and include short-term (three months or less) interest rate reductions and payment deferrals, which were not part of the terms of the original contract. We sold our U.S. residential mortgage business in 2007 and, as such, do not participate in the U.S. government-sponsored mortgage modification programs.
Our allowance for losses on financing receivables on these modified consumer loans is determined based upon a formulaic approach that estimates the probable losses inherent in the portfolio based upon statistical analyses of the portfolio. Data related to redefault experience is also considered in our overall reserve adequacy review. Once the loan has been modified, it returns to current status (re-aged) only after receipt of at least three consecutive minimum monthly payments or the equivalent cumulative amount, subject to a re-aging limitation of once a year, or twice in a five-year period in accordance with the Federal Financial Institutions Examination Council guidelines on Uniform Retail Credit Classification and Account Management policy issued in June 2000. We believe that the allowance for losses would not be materially different had we not re-aged these accounts.
For commercial loans, we evaluate changes in terms and conditions to determine whether those changes meet the criteria for classification as a TDR on a loan-by-loan basis. In CLL, these changes primarily include: changes to covenants, short-term payment deferrals and maturity extensions. For these changes, we receive economic consideration, including additional fees and/or increased interest rates, and evaluate them under our normal underwriting standards and criteria. Changes to Real Estate ' s loans primarily include maturity extensions, principal payment acceleration, changes to collateral terms, and cash sweeps, which are in addition to, or sometimes in lieu of, fees and rate increases. The determination of whether these changes to the terms and conditions of our commercial loans meet the TDR criteria includes our consideration of all of the relevant facts and circumstances. When the borrower is experiencing financial difficulty, we carefully evaluate these changes to determine whether they meet the form of a concession. In these circumstances, if the change is deemed to be a concession, we classify the loan as a TDR.
When we repossess collateral in satisfaction of a loan, we write down the receivable against the allowance for losses. Repossessed collateral is included in the caption "All other assets" in the Statement of Financial Position and carried at the lower of cost or estimated fair value less costs to sell.
For Consumer loans, we write off unsecured closed-end installment loans when they are 120 days contractually past due and unsecured open-ended revolving loans at 180 days contractually past due. We write down consumer loans secured by collateral other than residential real estate when such loans are 120 days past due. Consumer loans secured by residential real estate (both revolving and closed-end loans) are written down to the fair value of collateral, less costs to sell, no later than when they become 180 days past due. Unsecured consumer loans in bankruptcy are written off within 60 days of notification of filing by the bankruptcy court or within contractual write-off periods, whichever occurs earlier.
GE 2014 FORM 10-K 142
FINANCIAL STATEMENTS | PRESENTATION & POLICIES |
Write-offs on larger-balance impaired commercial loans are based on amounts deemed uncollectible and are reviewed quarterly. Write-offs are determined based on the consideration of many factors, such as expectations of the workout plan or restructuring of the loan, valuation of the collateral and the prioritization of our claim in bankruptcy. Write-offs are recognized against the allowance for losses at the earlier of transaction confirmation (for example, discounted pay-off, restructuring, foreclosure, etc.) or not later than 360 days after initial recognition of a specific reserve for a collateral dependent loan. If foreclosure is probable, the write-off is determined based on the fair value of the collateral less costs to sell. Smaller-balance, homogeneous commercial loans are written off at the earlier of when deemed uncollectible or at 180 days past due.
PARTIAL SALES OF BUSINESS INTERESTS
Gains or losses on sales of affiliate shares where we retain a controlling financial interest are recorded in equity. Gains or losses on sales that result in our loss of a controlling financial interest are recorded in earnings along with remeasurement gains or losses on any investments in the entity that we retained.
CASH AND EQUIVALENTS
Debt securities and money market instruments with original maturities of three months or less are included in cash equivalents unless designated as available-for-sale and classified as investment securities.
INVESTMENT SECURITIES
We report investments in debt and marketable equity securities, and certain other equity securities, at fair value. See Note 21 for further information on fair value. Unrealized gains and losses on available-for-sale investment securities are included in shareowners ' equity, net of applicable taxes and other adjustments. We regularly review investment securities for impairment using both quantitative and qualitative criteria.
For debt securities, if we do not intend to sell the security or it is not more likely than not that we will be required to sell the security before recovery of our amortized cost, we evaluate other qualitative criteria to determine whether we do not expect to recover the amortized cost basis of the security, such as the financial health of and specific prospects for the issuer, including whether the issuer is in compliance with the terms and covenants of the security. We also evaluate quantitative criteria including determining whether there has been an adverse change in expected future cash flows. If we do not expect to recover the entire amortized cost basis of the security, we consider the security to be other-than-temporarily impaired, and we record the difference between the security ' s amortized cost basis and its recoverable amount in earnings and the difference between the security ' s recoverable amount and fair value in other comprehensive income. If we intend to sell the security or it is more likely than not we will be required to sell the security before recovery of its amortized cost basis, the security is also considered other-than-temporarily impaired and we recognize the entire difference between the security ' s amortized cost basis and its fair value in earnings. For equity securities, we consider the length of time and magnitude of the amount that each security is in an unrealized loss position. If we do not expect to recover the entire amortized cost basis of the security, we consider the security to be other-than-temporarily impaired, and we record the difference between the security's amortized cost basis and its fair value in earnings.
Realized gains and losses are accounted for on the specific identification method. Unrealized gains and losses on investment securities classified as trading and certain retained interests are included in earnings.
INVENTORIES
All inventories are stated at the lower of cost or realizable values. Cost for a significant portion of GE U.S. inventories is determined on a last-in, first-out (LIFO) basis. Cost of other GE inventories is determined on a first-in, first-out (FIFO) basis. LIFO was used for 40% and 39% of GE inventories at 2014 and 2013, respectively.
GE 2014 FORM 10-K 143
FINANCIAL STATEMENTS | PRESENTATION & POLICIES |
GOODWILL AND OTHER INTANGIBLE ASSETS
We do not amortize goodwill, but test it at least annually for impairment at the reporting unit level. A reporting unit is the operating segment, or one level below that operating segment (the component level) if discrete financial information is prepared and regularly reviewed by segment management. However, components are aggregated as a single reporting unit if they have similar economic characteristics. We recognize an impairment charge if the carrying amount of a reporting unit exceeds its fair value and the carrying amount of the reporting unit's goodwill exceeds the implied fair value of that goodwill. We use a market approach, when available and appropriate, or the income approach, or a combination of both to establish fair values. When a portion of a reporting unit is disposed, goodwill is allocated to the gain or loss on disposition based on the relative fair values of the business or businesses disposed and the portion of the reporting unit that will be retained.
We amortize the cost of other intangibles over their estimated useful lives unless such lives are deemed indefinite. The cost of intangible assets is generally amortized on a straight-line basis over the asset's estimated economic life, except that individually significant customer-related intangible assets are amortized in relation to total related sales. Amortizable intangible assets are reviewed for impairment whenever events or changes in circumstances indicate that the related carrying amounts may not be recoverable. In these circumstances, they are tested for impairment based on undiscounted cash flows and, if impaired, written down to fair value based on either discounted cash flows or appraised values. Intangible assets with indefinite lives are tested annually for impairment and written down to fair value as required.
GECC INVESTMENT CONTRACTS, INSURANCE LIABILITIES AND INSURANCE ANNUITY BENEFITS
Certain entities that we consolidate provide guaranteed investment contracts, primarily to states, municipalities and municipal authorities.
Our insurance activities include providing insurance and reinsurance for life and health risks and providing certain annuity products. Two primary product groups are provided: traditional insurance contracts and investment contracts. Insurance contracts are contracts with significant mortality and/or morbidity risks, while investment contracts are contracts without such risks.
For short-duration insurance contracts, including accident and health insurance, we report premiums as earned income over the terms of the related agreements, generally on a pro-rata basis. For traditional long-duration insurance contracts including long-term care, term, whole life and annuities payable for the life of the annuitant, we report premiums as earned income when due.
Premiums received on investment contracts (including annuities without significant mortality risk) are not reported as revenues but rather as deposit liabilities. We recognize revenues for charges and assessments on these contracts, mostly for mortality, contract initiation, administration and surrender. Amounts credited to policyholder accounts are charged to expense.
Liabilities for traditional long-duration insurance contracts represent the present value of such benefits less the present value of future net premiums based on mortality, morbidity, interest and other assumptions at the time the policies were issued or acquired. Liabilities for investment contracts equal the account value, that is, the amount that accrues to the benefit of the contract or policyholder including credited interest and assessments through the financial statement date. For guaranteed investment contracts, the liability is also adjusted as a result of fair value hedging activity.
Liabilities for unpaid claims and estimated claim settlement expenses represent our best estimate of the ultimate obligations for reported and incurred-but-not-reported claims and the related estimated claim settlement expenses. Liabilities for unpaid claims and estimated claim settlement expenses are continually reviewed and adjusted through current operations.
GE 2014 FORM 10-K 144
FINANCIAL STATEMENTS | PRESENTATION & POLICIES |
For financial assets and liabilities measured at fair value on a recurring basis, fair value is the price we would receive to sell an asset or pay to transfer a liability in an orderly transaction with a market participant at the measurement date. In the absence of active markets for the identical assets or liabilities, such measurements involve developing assumptions based on market observable data and, in the absence of such data, internal information that is consistent with what market participants would use in a hypothetical transaction that occurs at the measurement date.
Observable inputs reflect market data obtained from independent sources, while unobservable inputs reflect our market assumptions. Preference is given to observable inputs. These two types of inputs create the following fair value hierarchy:
| Level 1 – | Quoted prices for identical instruments in active markets. |
| Level 2 – | Quoted prices for similar instruments in active markets; quoted prices for identical or similar instruments in markets that are not active; and model-derived valuations whose inputs are observable or whose significant value drivers are observable. |
| Level 3 – | Significant inputs to the valuation model are unobservable. |
We maintain policies and procedures to value instruments using the best and most relevant data available. In addition, we have risk management teams that review valuation, including independent price validation for certain instruments. With regard to Level 3 valuations (including instruments valued by third parties), we perform a variety of procedures to assess the reasonableness of the valuations. Such reviews, which may be performed quarterly, monthly or weekly, include an evaluation of instruments whose fair value change exceeds predefined thresholds (and/or does not change) and consider the current interest rate, currency and credit environment, as well as other published data, such as rating agency market reports and current appraisals. These reviews are performed within each business by the asset and risk managers, pricing committees and valuation committees. A detailed review of methodologies and assumptions is performed by individuals independent of the business for individual measurements with a fair value exceeding predefined thresholds. This detailed review may include the use of a third-party valuation firm.
RECURRING FAIR VALUE MEASUREMENTS
The following sections describe the valuation methodologies we use to measure different financial instruments at fair value on a recurring basis.
Investments in Debt and Equity Securities. When available, we use quoted market prices to determine the fair value of investment securities, and they are included in Level 1. Level 1 securities primarily include publicly traded equity securities.
For large numbers of investment securities for which market prices are observable for identical or similar investment securities but not readily accessible for each of those investments individually (that is, it is difficult to obtain pricing information for each individual investment security at the measurement date), we obtain pricing information from an independent pricing vendor. The pricing vendor uses various pricing models for each asset class that are consistent with what other market participants would use. The inputs and assumptions to the model of the pricing vendor are derived from market observable sources including: benchmark yields, reported trades, broker/dealer quotes, issuer spreads, benchmark securities, bids, offers, and other market-related data. Since many fixed income securities do not trade on a daily basis, the methodology of the pricing vendor uses available information as applicable such as benchmark curves, benchmarking of like securities, sector groupings, and matrix pricing. The pricing vendor considers available market observable inputs in determining the evaluation for a security. Thus, certain securities may not be priced using quoted prices, but rather determined from market observable information. These investments are included in Level 2 and primarily comprise our portfolio of corporate fixed income, and government, mortgage and asset-backed securities. In infrequent circumstances, our pricing vendors may provide us with valuations that are based on significant unobservable inputs, and in those circumstances we classify the investment securities in Level 3.
GE 2014 FORM 10-K 145
FINANCIAL STATEMENTS | PRESENTATION & POLICIES |
We use non-binding broker quotes and other third-party pricing services as our primary basis for valuation when there is limited, or no, relevant market activity for a specific instrument or for other instruments that share similar characteristics. We have not adjusted the prices we have obtained. Investment securities priced using non-binding broker quotes and other third-party pricing services are included in Level 3. As is the case with our primary pricing vendor, third-party brokers and other third-party pricing services do not provide access to their proprietary valuation models, inputs and assumptions. Accordingly, our risk management personnel conduct reviews of vendors, as applicable, similar to the reviews performed of our primary pricing vendor. In addition, we conduct internal reviews of pricing for all such investment securities quarterly to ensure reasonableness of valuations used in our financial statements. These reviews are designed to identify prices that appear stale, those that have changed significantly from prior valuations, and other anomalies that may indicate that a price may not be accurate. Based on the information available, we believe that the fair values provided by the brokers and other third-party pricing services are representative of prices that would be received to sell the assets at the measurement date (exit prices).
Derivatives. We use closing prices for derivatives included in Level 1, which are traded either on exchanges or liquid over-the-counter markets.
The majority of our derivatives are valued using internal models. The models maximize the use of market observable inputs including interest rate curves and both forward and spot prices for currencies and commodities. Derivative assets and liabilities included in Level 2 primarily represent interest rate swaps, cross-currency swaps and foreign currency and commodity forward and option contracts.
Derivative assets and liabilities included in Level 3 primarily represent equity derivatives and interest rate products that contain embedded optionality or prepayment features.
NON-RECURRING FAIR VALUE MEASUREMENTS
Certain assets are measured at fair value on a non-recurring basis. These assets are not measured at fair value on an ongoing basis, but are subject to fair value adjustments only in certain circumstances. These assets can include loans and long-lived assets that have been reduced to fair value when they are held for sale, impaired loans that have been reduced based on the fair value of the underlying collateral, cost and equity method investments and long-lived assets that are written down to fair value when they are impaired and the remeasurement of retained investments in formerly consolidated subsidiaries upon a change in control that results in deconsolidation of a subsidiary, if we sell a controlling interest and retain a noncontrolling stake in the entity. Assets that are written down to fair value when impaired and retained investments are not subsequently adjusted to fair value unless further impairment occurs.
The following sections describe the valuation methodologies we use to measure financial and non-financial instruments accounted for at fair value on a non-recurring basis and for certain assets within our pension plans and retiree benefit plans at each reporting period, as applicable.
GE 2014 FORM 10-K 146
FINANCIAL STATEMENTS | PRESENTATION & POLICIES |
Cost and Equity Method Investments. Cost and equity method investments are valued using market observable data such as quoted prices when available. When market observable data is unavailable, investments are valued using a discounted cash flow model, comparative market multiples or a combination of both approaches as appropriate and other third-party pricing sources. These investments are generally included in Level 3.
Investments in private equity, real estate and collective funds are valued using net asset values. The net asset values are determined based on the fair values of the underlying investments in the funds. Investments in private equity and real estate funds are generally included in Level 3 because they are not redeemable at the measurement date. Investments in collective funds are included in Level 2.
Long-lived Assets, including Real Estate . Fair values of long-lived assets, including aircraft and real estate, are primarily derived internally and are based on observed sales transactions for similar assets. In other instances, for example, collateral types for which we do not have comparable observed sales transaction data, collateral values are developed internally and corroborated by external appraisal information. Adjustments to third-party valuations may be performed in circumstances where market comparables are not specific to the attributes of the specific collateral or appraisal information may not be reflective of current market conditions due to the passage of time and the occurrence of market events since receipt of the information. For real estate, fair values are based on discounted cash flow estimates that reflect current and projected lease profiles and available industry information about capitalization rates and expected trends in rents and occupancy and are corroborated by external appraisals. These investments are generally included in Level 2 or Level 3.
Retained Investments in Formerly Consolidated Subsidiaries. Upon a change in control that results in deconsolidation of a subsidiary, the fair value measurement of our retained noncontrolling stake is valued using market observable data such as quoted prices when available, or if not available, an income approach, a market approach, or a combination of both approaches as appropriate. In applying these methodologies, we rely on a number of factors, including actual operating results, future business plans, economic projections, market observable pricing multiples of similar businesses and comparable transactions, and possible control premium. These investments are generally included in Level 1 or Level 3, as appropriate, determined at the time of the transaction.
ACCOUNTING CHANGES
In the second quarter of 2014, the Company elected to early adopt Accounting Standards Update (ASU) 2014-08, Presentation of Financial Statements (Topic 205) and Property, Plant, and Equipment (Topic 360): Reporting Discontinued Operations and Disclosures of Disposals of Components of an Entity . This ASU changes the criteria for reporting discontinued operations. To be classified as a discontinued operation, the disposal of a component or group of components must represent a strategic shift that has, or will have, a major effect on an entity's operations and financial results. The ASU also expands the disclosure requirements for those transactions that meet the new criteria to be classified as discontinued operations. The revised accounting guidance applies prospectively to all disposals (or classifications as held for sale) of components of an entity and for businesses that, upon acquisition, are classified as held for sale on or after adoption. Early adoption is permitted for disposals (or classifications as held for sale) that have not been previously reported in financial statements. The effects of applying the revised guidance will vary based upon the nature and size of future disposal transactions. It is expected that fewer disposal transactions will meet the new criteria to be reported as discontinued operations.
GE 2014 FORM 10-K 147
FINANCIAL STATEMENTS | PRESENTATION & POLICIES |
On January 1, 2014, we adopted ASU 2013-05, Foreign Currency Matters (Topic 830): Parent's Accounting for the Cumulative Translation Adjustment upon Derecognition of Certain Subsidiaries or Groups of Assets within a Foreign Entity or of an Investment in a Foreign Entity . Under the revised guidance, the entire amount of the cumulative translation adjustment associated with the foreign entity will be released into earnings in the following circumstances: (a) the sale of a subsidiary or group of net assets within a foreign entity that represents a complete or substantially complete liquidation of that entity, (b) the loss of a controlling financial interest in an investment in a foreign entity, or (c) when the accounting for an investment in a foreign entity changes from the equity method to full consolidation. The revised guidance applies prospectively to transactions or events occurring on or after January 1, 2014.
On January 1, 2014, we adopted ASU 2013-11, Presentation of an Unrecognized Tax Benefit When a Net Operating Loss Carryforward, a Similar Tax Loss, or a Tax Credit Carryforward Exists . Under the new guidance, an unrecognized tax benefit is required to be presented as a reduction to a deferred tax asset if the disallowance of the tax position would reduce the available tax loss or tax credit carryforward instead of resulting in a cash tax liability. The ASU applies prospectively to all unrecognized tax benefits that exist as of the adoption date and reduced both deferred tax assets and income tax liabilities by $1,224 million as of January 1, 2014.
On January 1, 2012, we adopted ASU 2011-05, an amendment to Accounting Standards Codification (ASC) 220, Comprehensive Income . ASU 2011-05 introduced a new statement, the Consolidated Statement of Comprehensive Income. The amendments affect only the display of those components of equity categorized as other comprehensive income and do not change existing recognition and measurement requirements that determine net earnings.
On January 1, 2012, we adopted ASU 2011-04, an amendment to ASC 820, Fair Value Measurements . ASU 2011-04 clarifies or changes the application of existing fair value measurements, including: that the highest and best use valuation premise in a fair value measurement is relevant only when measuring the fair value of nonfinancial assets; that a reporting entity should measure the fair value of its own equity instrument from the perspective of a market participant that holds that instrument as an asset; to permit an entity to measure the fair value of certain financial instruments on a net basis rather than based on its gross exposure when the reporting entity manages its financial instruments on the basis of such net exposure; that in the absence of a Level 1 input, a reporting entity should apply premiums and discounts when market participants would do so when pricing the asset or liability consistent with the unit of account; and that premiums and discounts related to size as a characteristic of the reporting entity's holding are not permitted in a fair value measurement. Adopting these amendments had no effect on the financial statements.
GE 2014 FORM 10-K 148
FINANCIAL STATEMENTS | HELD FOR SALE & DISCONTINUED OPERATIONS |
NOTE 2. ASSETS AND LIABILITIES OF BUSINESSES HELD FOR SALE AND DISCONTINUED OPERATIONS
In the fourth quarter of 2014, we signed an agreement to sell our Signaling business at Transportation, with assets of $267 million and liabilities of $148 million to Alstom for approximately $800 million, and our consumer finance business Budapest Bank, with assets of $3,474 million and liabilities of $2,434 million to Hungary's government. The transactions remain subject to customary closing conditions and regulatory approvals, and are targeted to close in 2015.
In the third quarter of 2014, we signed an agreement to sell our Appliances business with assets of $2,538 million and liabilities of $1,356 million to Electrolux for approximately $3,300 million. The transaction remains subject to customary closing conditions and regulatory approvals, and is targeted to close in 2015.
In the second quarter of 2014, we committed to sell GE Money Bank AB, our consumer finance business in Sweden, Denmark and Norway (GEMB-Nordic). We completed the sale on November 6, 2014 for proceeds of $2,320 million.
In the first quarter of 2013, we committed to sell certain of our machining & fabrication businesses at Aviation and our Consumer auto and personal loan business in Portugal. We completed the sale of our machining & fabrication business on December 2, 2013 for proceeds of $108 million. We completed the sale of our Consumer auto and personal loan business in Portugal on July 15, 2013 for proceeds of $83 million.
FINANCIAL INFORMATION FOR ASSETS AND LIABILITIES OF BUSINESSES HELD FOR SALE | |||||
December 31 (In millions) | 2014 |
| 2013 | ||
| |||||
Assets | |||||
Cash and equivalents | $ | 676 |
| $ | 5 |
Investment securities | 448 | 7 | |||
Current receivables(a) | 180 | - | |||
Inventories | 588 | - | |||
Financing receivables – net |
| 2,144 |
|
| - |
Property, plant, and equipment – net | 1,015 | - | |||
Goodwill | 539 | 24 | |||
Intangible assets – net | 170 | 2 | |||
Other |
| 540 |
|
| 12 |
Assets of businesses held for sale | $ | 6,300 |
| $ | 50 |
|
|
|
| ||
Liabilities |
|
|
| ||
Accounts payable(a) | $ | 510 | $ | 1 | |
Other current liabilities | 348 | - | |||
Bank deposits | 1,931 | - | |||
Other | 586 | 5 | |||
Liabilities of businesses held for sale | $ | 3,375 | $ | 6 | |
| (a) | Certain transactions at our Appliances and Signaling businesses are made on an arms-length basis with GECC, consisting primarily of GE customer receivables sold to GECC and GECC services for material procurement. These intercompany balances included within our held for sale businesses are reported in the GE and GECC columns of our financial statements, but are eliminated in deriving our consolidated financial statements. |
GE 2014 FORM 10-K 149
FINANCIAL STATEMENTS | HELD FOR SALE & DISCONTINUED OPERATIONS |
NBCU
On March 19, 2013, we closed a transaction to sell our remaining 49% common equity interest in NBCUniversal LLC (NBCU LLC) to Comcast Corporation (Comcast) for total consideration of $16,722 million, consisting of $11,997 million in cash, $4,000 million in Comcast guaranteed debt and $725 million in preferred stock. The $4,000 million of debt and the $725 million of preferred shares were both issued by a wholly-owned subsidiary of Comcast. During the three months ended March 31, 2013, both of these instruments were sold at approximately par value. In addition, Comcast is obligated to share with us potential tax savings associated with Comcast's purchase of our NBCU LLC interest, if realized. We did not recognize these potential future payments as consideration for the sale, but are recording such payments in income as they are received. GECC also sold real estate comprising certain floors located at 30 Rockefeller Center, New York and the CNBC property located in Englewood Cliffs, New Jersey to affiliates of NBCU LLC for $1,430 million in cash.
In the first quarter of 2013, as a result of the transactions, we recognized pre-tax gains of $1,096 million ($825 million after tax) on the sale of our 49% common equity interest in NBCU LLC and $921 million ($564 million after tax) on the sale of GECC's real estate properties.
DISCONTINUED OPERATIONS
Discontinued operations primarily comprised GE Money Japan (our Japanese personal loan business, Lake, and our Japanese mortgage and card businesses, excluding our investment in GE Nissen Credit Co., Ltd.), our U.S. mortgage business (WMC), our Commercial Lending and Leasing (CLL) trailer services business in Europe (CLL Trailer Services), our Consumer banking business in Russia (Consumer Russia) and our Consumer mortgage lending business in Ireland (Consumer Ireland). Results of operations, financial position and cash flows for these businesses are separately reported as discontinued operations for all periods presented.
FINANCIAL INFORMATION FOR DISCONTINUED OPERATIONS | ||||||||
(In millions) | 2014 | 2013 | 2012 | |||||
Operations | ||||||||
Total revenues and other income (loss) | $ | (268) | $ | 186 | $ | 191 | ||
Earnings (loss) from discontinued operations before income taxes | $ | (351) | $ | (494) | $ | (586) | ||
Benefit (provision) for income taxes | 224 | 155 | 198 | |||||
Earnings (loss) from discontinued operations, net of taxes | $ | (127) | $ | (339) | $ | (388) | ||
Disposal | ||||||||
Gain (loss) on disposal before income taxes | $ | 14 | $ | (2,027) | $ | (792) | ||
Benefit (provision) for income taxes | 1 | 246 | 197 | |||||
Gain (loss) on disposal, net of taxes | $ | 15 | $ | (1,781) | $ | (595) | ||
Earnings (loss) from discontinued operations, net of taxes(a) | $ | (112) | $ | (2,120) | $ | (983) | ||
| (a) | The sum of GE industrial earnings (loss) from discontinued operations, net of taxes, and GECC earnings (loss) from discontinued operations, net of taxes, is reported as GE industrial earnings (loss) from discontinued operations, net of taxes, on the Consolidated Statement of Earnings . |
GE 2014 FORM 10-K 150
FINANCIAL STATEMENTS | HELD FOR SALE & DISCONTINUED OPERATIONS |
December 31 (In millions) | 2014 | 2013 | |||||||||
Assets | |||||||||||
Cash and equivalents | $ | 133 | $ | 232 | |||||||
Financing receivables – net | - | 711 | |||||||||
Other | 1,102 | 1,396 | |||||||||
Assets of discontinued operations | $ | 1,235 | $ | 2,339 | |||||||
Liabilities | |||||||||||
Deferred income taxes | $ | 237 | $ | 248 | |||||||
Other | 988 | 3,685 | |||||||||
Liabilities of discontinued operations | $ | 1,225 | $ | 3,933 | |||||||
Other assets at December 31, 2014 and 2013 primarily comprised a deferred tax asset for a loss carryforward, which expires principally in 2017 and in part in 2019, related to the sale of our GE Money Japan business.
GE MONEY JAPAN
During the third quarter of 2008, we completed the sale of GE Money Japan, which included our Japanese personal loan business. Under the terms of the sale, we reduced the proceeds from the sale for estimated refund claims in excess of the statutory interest rate. Proceeds from the sale were to be increased or decreased based on the actual claims experienced in accordance with loss-sharing terms specified in the sale agreement, with all claims in excess of 258 billion Japanese yen (approximately $3,000 million) remaining our responsibility. On February 26, 2014, we reached an agreement with the buyer to pay 175 billion Japanese yen (approximately $1,700 million) to extinguish this obligation. We have no remaining amount payable under the February 26, 2014 agreement as our reserve for refund claims of $1,836 million at December 31, 2013 was fully paid in the six months ended June 30, 2014.
FINANCIAL INFORMATION FOR GE MONEY JAPAN | ||||||||
(In millions) | 2014 | 2013 | 2012 | |||||
Earnings (loss) from discontinued operations, net of taxes | $ | 59 | $ | (1,636) | $ | (649) | ||
WMC
During the fourth quarter of 2007, we completed the sale of WMC, our U.S. mortgage business. WMC substantially discontinued all new loan originations by the second quarter of 2007, and is not a loan servicer. In connection with the sale, WMC retained certain representation and warranty obligations related to loans sold to third parties prior to the disposal of the business and contractual obligations to repurchase previously sold loans that had an early payment default. All claims received by WMC for early payment default have either been resolved or are no longer being pursued.
GE 2014 FORM 10-K 151
FINANCIAL STATEMENTS | HELD FOR SALE & DISCONTINUED OPERATIONS |
ROLLFORWARD OF THE RESERVE | ||||||
December 31 (In millions) | 2014 | 2013 | ||||
Balance, beginning of period | $ | 800 | $ | 633 | ||
Provision | 365 | 354 | ||||
Claim resolutions / rescissions | (356) | (187) | ||||
Balance, end of period | $ | 809 | $ | 800 | ||
Given the significant litigation activity and WMC's continuing efforts to resolve the lawsuits involving claims made against WMC, it is difficult to assess whether future losses will be consistent with WMC's past experience. Adverse changes to WMC's assumptions supporting the reserve may result in an increase to these reserves. Taking into account both recent settlement activity and the potential variability of settlements, WMC estimates a range of reasonably possible loss from $0 to approximately $500 million over its recorded reserve at December 31, 2014. This estimate excludes any possible loss associated with an adverse court decision on the applicable statute of limitations, as WMC is unable at this time to develop such a meaningful estimate.
At December 31, 2014, there were 15 lawsuits involving claims made against WMC arising from alleged breaches of representations and warranties on mortgage loans included in 14 securitizations. The adverse parties in these cases are securitization trustees or parties claiming to act on their behalf. Although the alleged claims for relief vary from case to case, the complaints and counterclaims in these actions generally assert claims for breach of contract, indemnification, and/or declaratory judgment, and seek specific performance (repurchase of defective mortgage loan) and/or money damages. Adverse court decisions, including in cases not involving WMC (such as the New York Court of Appeals' decision on statute of limitations, expected in 2015), could result in new claims and lawsuits on additional loans. However, WMC continues to believe that it has defenses to the claims asserted in litigation, including, for example, based on causation and materiality requirements and applicable statutes of limitations. It is not possible to predict the outcome or impact of these defenses and other factors, any of which could materially affect the amount of any loss ultimately incurred by WMC on these claims.
WMC has also received indemnification demands, nearly all of which are unspecified, from depositors/underwriters/sponsors of RMBS in connection with lawsuits brought by RMBS investors concerning alleged misrepresentations in the securitization offering documents to which WMC is not a party or, in two cases, involving mortgage loan repurchase claims made against RMBS sponsors. WMC believes that it has defenses to these demands.
To the extent WMC is required to repurchase loans, WMC's loss also would be affected by several factors, including pay downs, accrued interest and fees, and the value of the underlying collateral. The reserve and estimate of possible loss reflect judgment, based on currently available information, and a number of assumptions, including economic conditions, claim and settlement activity, pending and threatened litigation, court decisions regarding WMC's legal defenses, indemnification demands, government activity, and other variables in the mortgage industry. Actual losses arising from claims against WMC could exceed these amounts and additional claims and lawsuits could result if actual claim rates, governmental actions, litigation and indemnification activity, adverse court decisions, actual settlement rates or losses WMC incurs on repurchased loans differ from its assumptions .
FINANCIAL INFORMATION FOR WMC | ||||||||
(In millions) | 2014 | 2013 | 2012 | |||||
Total revenues and other income (loss) | $ | (291) | $ | (346) | $ | (500) | ||
Earnings (loss) from discontinued operations, net of taxes | $ | (199) | $ | (232) | $ | (337) | ||
GE 2014 FORM 10-K 152
FINANCIAL STATEMENTS | HELD FOR SALE & DISCONTINUED OPERATIONS |
OTHER FINANCIAL SERVICES
During the fourth quarter of 2013, we announced the planned disposition of Consumer Russia and classified the business as discontinued operations. We completed the sale in the first quarter of 2014 for proceeds of $232 million.
FINANCIAL INFORMATION FOR CONSUMER RUSSIA | ||||||||
(In millions) | 2014 | 2013 | 2012 | |||||
Total revenues and other income (loss) | $ | 24 | $ | 260 | $ | 276 | ||
Gain (loss) on disposal, net of taxes | $ | 4 | $ | (170) | $ | - | ||
Earnings (loss) from discontinued operations, net of taxes | $ | (2) | $ | (193) | $ | 33 | ||
During the first quarter of 2013, we announced the planned disposition of CLL Trailer Services and classified the business as discontinued operations. We completed the sale in the fourth quarter of 2013 for proceeds of $528 million.
FINANCIAL INFORMATION FOR CLL TRAILER SERVICES | ||||||||
(In millions) | 2014 | 2013 | 2012 | |||||
Total revenues and other income (loss) | $ | 1 | $ | 271 | $ | 399 | ||
Gain (loss) on disposal, net of taxes | $ | 12 | $ | 18 | $ | - | ||
Earnings (loss) from discontinued operations, net of taxes | $ | 37 | $ | (2) | $ | 22 | ||
During the first quarter of 2012, we announced the planned disposition of Consumer Ireland and classified the business as discontinued operations. We completed the sale in the third quarter of 2012 for proceeds of $227 million.
FINANCIAL INFORMATION FOR CONSUMER IRELAND | ||||||||
(In millions) | 2014 | 2013 | 2012 | |||||
Total revenues and other income (loss) | $ | - | $ | - | $ | 7 | ||
Gain (loss) on disposal, net of taxes | $ | 1 | $ | 6 | $ | (121) | ||
Earnings (loss) from discontinued operations, net of taxes | $ | 1 | $ | 6 | $ | (195) | ||
GE INDUSTRIAL
During the fourth quarter of 2013, we recorded an increase to our tax reserve related to Spanish taxes for the years prior to our 2007 disposition of our Plastics business. During the third quarter of 2012, we resolved with the Internal Revenue Service the tax treatment of the 2007 disposition of our Plastics business, resulting in a tax benefit of $148 million. The sum of GE industrial earnings (loss) from discontinued operations, net of taxes, and GECC earnings (loss) from discontinued operations, net of taxes, is reported as GE industrial earnings (loss) from discontinued operations, net of taxes, on the Statement of Earnings.
FINANCIAL INFORMATION FOR GE INDUSTRIAL | ||||||||
(In millions) | 2014 | 2013 | 2012 | |||||
Earnings (loss) from discontinued operations, net of taxes | $ | (5) | $ | (66) | $ | 147 | ||
GE 2014 FORM 10-K 153
FINANCIAL STATEMENTS | INVESTMENT SECURITIES |
NOTE 3. INVESTMENT SECURITIES
Substantially all of our investment securities are classified as available-for-sale. These comprise mainly investment-grade debt securities supporting obligations to annuitants, policyholders in our run-off insurance operations and supporting obligations to holders of guaranteed investment contracts (GICs) in Trinity and investments held in our CLL business collateralized by senior secured loans of high-quality, middle-market companies in a variety of industries. We do not have any securities classified as held-to-maturity.
2014 | 2013 | ||||||||||||||||||||||
Gross | Gross | Gross | Gross | ||||||||||||||||||||
Amortized | unrealized | unrealized | Estimated | Amortized | unrealized | unrealized | Estimated | ||||||||||||||||
December 31 (In millions) | cost | gains | losses | fair value | cost | gains | losses | fair value | |||||||||||||||
GE | |||||||||||||||||||||||
Debt | |||||||||||||||||||||||
U.S. corporate | $ | 12 | $ | - | $ | - | $ | 12 | $ | 21 | $ | 14 | $ | - | $ | 35 | |||||||
Corporate – non-U.S. | 1 | - | - | 1 | 13 | - | (1) | 12 | |||||||||||||||
Equity | |||||||||||||||||||||||
Available-for-sale | 69 | 4 | (2) | 71 | 302 | 9 | (41) | 270 | |||||||||||||||
Trading | - | - | - | - | 6 | - | - | 6 | |||||||||||||||
82 | 4 | (2) | 84 | 342 | 23 | (42) | 323 | ||||||||||||||||
GECC | |||||||||||||||||||||||
Debt | |||||||||||||||||||||||
U.S. corporate | 19,889 | 3,967 | (69) | 23,787 | 19,600 | 2,323 | (217) | 21,706 | |||||||||||||||
State and municipal | 5,181 | 624 | (56) | 5,749 | 4,245 | 235 | (191) | 4,289 | |||||||||||||||
Residential mortgage-backed(a) | 1,578 | 153 | (6) | 1,725 | 1,819 | 139 | (48) | 1,910 | |||||||||||||||
Commercial mortgage-backed | 2,903 | 170 | (10) | 3,063 | 2,929 | 188 | (82) | 3,035 | |||||||||||||||
Asset-backed | 8,084 | 9 | (175) | 7,918 | 7,373 | 60 | (46) | 7,387 | |||||||||||||||
Corporate – non-U.S. | 1,380 | 126 | (30) | 1,476 | 1,741 | 103 | (86) | 1,758 | |||||||||||||||
Government – non-U.S. | 1,646 | 152 | (2) | 1,796 | 2,336 | 81 | (7) | 2,410 | |||||||||||||||
U.S. government and federal | |||||||||||||||||||||||
agency | 1,957 | 56 | - | 2,013 | 752 | 45 | (27) | 770 | |||||||||||||||
Retained interests | 20 | 4 | - | 24 | 64 | 8 | - | 72 | |||||||||||||||
Equity | |||||||||||||||||||||||
Available-for-sale | 197 | 58 | (1) | 254 | 203 | 51 | (3) | 251 | |||||||||||||||
Trading | 22 | - | - | 22 | 74 | - | - | 74 | |||||||||||||||
42,857 | 5,319 | (349) | 47,827 | 41,136 | 3,233 | (707) | 43,662 | ||||||||||||||||
Eliminations | (4) | - | - | (4) | (4) | - | - | (4) | |||||||||||||||
Total | $ | 42,935 | $ | 5,323 | $ | (351) | $ | 47,907 | $ | 41,474 | $ | 3,256 | $ | (749) | $ | 43,981 | |||||||
| (a) | Substantially collateralized by U.S. mortgages. At December 31, 2014, $1,191 million related to securities issued by government-sponsored entities and $534 million related to securities of private-label issuers. Securities issued by private-label issuers are collateralized primarily by pools of individual direct mortgage loans of financial institutions. |
GE 2014 FORM 10-K 154
FINANCIAL STATEMENTS | INVESTMENT SECURITIES |
ESTIMATED FAIR VALUE AND GROSS UNREALIZED LOSSES OF AVAILABLE-FOR-SALE INVESTMENT | ||||||||||||
SECURITIES | ||||||||||||
In loss position for | ||||||||||||
Less than 12 months | 12 months or more | |||||||||||
Gross | Gross | |||||||||||
Estimated | unrealized | Estimated | unrealized | |||||||||
December 31 (In millions) | fair value(a) | losses(a)(b) | fair value | losses(b) | ||||||||
2014 | ||||||||||||
Debt | ||||||||||||
U.S. corporate | $ | 554 | $ | (16) | $ | 836 | $ | (53) | ||||
State and municipal | 81 | (1) | 348 | (55) | ||||||||
Residential mortgage-backed | 30 | - | 159 | (6) | ||||||||
Commercial mortgage-backed | 165 | (1) | 204 | (9) | ||||||||
Asset-backed | 7,493 | (158) | 77 | (17) | ||||||||
Corporate – non-U.S. | 42 | (1) | 237 | (29) | ||||||||
Government – non-U.S. | 677 | (2) | 14 | - | ||||||||
U.S. government and federal agency | 705 | - | 1 | - | ||||||||
Equity | 18 | (3) | - | - | ||||||||
Total | $ | 9,765 | $ | (182) | $ | 1,876 | $ | (169) | (c) | |||
2013 | ||||||||||||
Debt | ||||||||||||
U.S. corporate | $ | 2,170 | $ | (122) | $ | 598 | $ | (95) | ||||
State and municipal | 1,076 | (82) | 367 | (109) | ||||||||
Residential mortgage-backed | 232 | (11) | 430 | (37) | ||||||||
Commercial mortgage-backed | 396 | (24) | 780 | (58) | ||||||||
Asset-backed | 112 | (2) | 359 | (44) | ||||||||
Corporate – non-U.S. | 108 | (4) | 454 | (83) | ||||||||
Government – non-U.S. | 1,479 | (6) | 42 | (1) | ||||||||
U.S. government and federal agency | 229 | (27) | 254 | - | ||||||||
Retained interests | 2 | - | - | - | ||||||||
Equity | 253 | (44) | - | - | ||||||||
Total | $ | 6,057 | $ | (322) | $ | 3,284 | $ | (427) | ||||
| (a) | Includes the estimated fair value of and gross unrealized losses on Corporate-non-U.S. and Equity securities held by GE. At December 31, 2014, there were no Corporate-non-U.S. securities held by GE in a loss position. At December 31, 2014, the estimated fair value of and gross unrealized losses on Equity securities were $4 million and $(2) million, respectively. At December 31, 2013, the estimated fair value of and gross unrealized losses on Corporate-non-U.S. securities were $12 million and $(1) million, respectively. At December 31, 2013 the estimated fair value of and gross unrealized losses on Equity securities were $222 million and $(41) million, respectively. |
| (b) | Included gross unrealized losses related to securities that had other-than-temporary impairments previously recognized of $29 million at December 31, 2014. |
| (c) | The majority relate to debt securities held to support obligations to holders of GICs and more than 70% are debt securities that were considered to be investment-grade by the major rating agencies at December 31, 2014. |
We regularly review investment securities for other-than-temporary impairment (OTTI) using both qualitative and quantitative criteria. For debt securities, our qualitative review considers our ability and intent to hold the security and the financial condition of and near-term prospects for the issuer, including whether the issuer is in compliance with the terms and covenants of the security. Our quantitative review considers whether there has been an adverse change in expected future cash flows. Unrealized losses are not indicative of the amount of credit loss that would be recognized and at December 31, 2014 are primarily due to increases in market yields subsequent to our purchase of the securities. We presently do not intend to sell the vast majority of our debt securities that are in an unrealized loss position and believe that it is not more likely than not that we will be required to sell the vast majority of these securities before anticipated recovery of our amortized cost. The methodologies and significant inputs used to measure the amount of credit loss for our investment securities during 2014 have not changed. For equity securities, we consider the duration and the severity of the unrealized loss. We believe that the unrealized loss associated with our equity securities will be recovered within the foreseeable future.
Our corporate debt portfolio comprises securities issued by public and private corporations in various industries, primarily in the U.S. Substantially all of our corporate debt securities are rated investment grade by the major rating agencies.
GE 2014 FORM 10-K 155
FINANCIAL STATEMENTS | INVESTMENT SECURITIES |
Our commercial mortgage-backed securities (CMBS) portfolio is collateralized by both diversified pools of mortgages that were originated for securitization (conduit CMBS) and pools of large loans backed by high-quality properties (large loan CMBS), a majority of which were originated in 2007 and prior. The vast majority of the securities in our CMBS portfolio have investment-grade credit ratings.
Our asset-backed securities (ABS) portfolio is collateralized by senior secured loans of high-quality, middle-market companies in a variety of industries, as well as a variety of diversified pools of assets such as student loans and credit cards. The vast majority of the securities in our ABS portfolio are in a senior position in the capital structure of the deals.
PRE-TAX, OTHER-THAN-TEMPORARY IMPAIRMENTS ON INVESTMENT SECURITIES | |||||||||
(In millions) | 2014 | 2013 | 2012 | ||||||
Total pre-tax, OTTI recognized | $ | 407 | $ | 798 | $ | 193 | |||
Pre-tax, OTTI recognized in AOCI | (16) | (31) | (52) | ||||||
Pre-tax, OTTI recognized in earnings(a) | $ | 391 | $ | 767 | $ | 141 | |||
| (a) | Included pre-tax, other-than-temporary impairments recorded in earnings related to equity securities of $221 million, $15 million and $39 million in 2014, 2013, and 2012, respectively. |
CHANGES IN CUMULATIVE CREDIT LOSS IMPAIRMENTS RECOGNIZED ON DEBT SECURITIES STILL HELD | ||||||||
(In millions) | 2014 | 2013 | 2012 | |||||
Cumulative credit loss impairments recognized, beginning of period | $ | 1,193 | $ | 588 | $ | 747 | ||
Credit loss impairments recognized on securities not previously impaired | 4 | 389 | 27 | |||||
Incremental credit loss impairments recognized | ||||||||
on securities previously impaired | 77 | 336 | 40 | |||||
Less credit loss impairments previously recognized on securities sold | ||||||||
during the period or that we intend to sell | 304 | 120 | 226 | |||||
Cumulative credit loss impairments recognized, end of period | $ | 970 | $ | 1,193 | $ | 588 | ||
GE 2014 FORM 10-K 156
FINANCIAL STATEMENTS | INVESTMENT SECURITIES |
CONTRACTUAL MATURITIES OF INVESTMENT IN AVAILABLE-FOR-SALE DEBT SECURITIES | ||||||||
(EXCLUDING MORTGAGE-BACKED AND ASSET-BACKED SECURITIES) | ||||||||
Amortized | Estimated | |||||||
(In millions) | cost | fair value | ||||||
Due | ||||||||
Within one year | $ | 2,478 | $ | 2,492 | ||||
After one year through five years | 3,521 | 3,768 | ||||||
After five years through ten years | 5,285 | 5,686 | ||||||
After ten years | 18,782 | 22,888 | ||||||
We expect actual maturities to differ from contractual maturities because borrowers have the right to call or prepay certain obligations.
GROSS REALIZED GAINS AND LOSSES ON AVAILABLE-FOR-SALE INVESTMENT SECURITIES | |||||||||
(In millions) | 2014 | 2013 | 2012 | ||||||
GE | |||||||||
Gains | $ | 3 | $ | 1 | $ | - | |||
Losses, including impairments | (218) | (20) | (1) | ||||||
Net | (215) | (19) | (1) | ||||||
GECC | |||||||||
Gains | 169 | 239 | 177 | ||||||
Losses, including impairments | (186) | (762) | (211) | ||||||
Net | (17) | (523) | (34) | ||||||
Total | $ | (232) | $ | (542) | $ | (35) | |||
Although we generally do not have the intent to sell any specific securities at the end of the period, in the ordinary course of managing our investment securities portfolio, we may sell securities prior to their maturities for a variety of reasons, including diversification, credit quality, yield and liquidity requirements and the funding of claims and obligations to policyholders. In some of our bank subsidiaries, we maintain a certain level of purchases and sales volume principally of non-U.S. government debt securities. In these situations, fair value approximates carrying value for these securities.
Proceeds from investment securities sales and early redemptions by issuers totaled $6,549 million, $19,276 million and $12,745 million in 2014, 2013 and 2012 respectively, principally from sales of short-term government securities in our bank subsidiaries and redemptions of non-U.S. corporate and asset-backed securities in our CLL business. The 2013 amount also included proceeds from the sale of Comcast guaranteed debt and short-term securities in our Treasury operations.
GE 2014 FORM 10-K 157
FINANCIAL STATEMENTS | CURRENT RECEIVABLES & INVENTORIES |
NOTE 4. CURRENT RECEIVABLES
Consolidated(a) | GE(b) | ||||||||||
December 31 (In millions) | 2014 | 2013 | 2014 | 2013 | |||||||
Power & Water | $ | 4,984 | $ | 3,895 | $ | 2,783 | $ | 2,335 | |||
Oil & Gas | 5,775 | 5,444 | 3,215 | 3,134 | |||||||
Energy Management | 1,655 | 1,540 | 731 | 686 | |||||||
Aviation | 4,656 | 4,307 | 1,997 | 2,260 | |||||||
Healthcare | 4,350 | 4,398 | 2,241 | 2,029 | |||||||
Transportation | 454 | 526 | 351 | 318 | |||||||
Appliances & Lighting | 1,468 | 1,337 | 216 | 273 | |||||||
Corporate items and eliminations | 390 | 388 | 464 | 377 | |||||||
23,732 | 21,835 | 11,998 | 11,412 | ||||||||
Less Allowance for Losses | (495) | (447) | (485) | (442) | |||||||
Total | $ | 23,237 | $ | 21,388 | $ | 11,513 | $ | 10,970 | |||
(a) | Includes GE industrial customer receivables factored through a GECC affiliate and reported as financing receivables by GECC. See Note 26. |
(b) | GE current receivables of $254 million and $127 million at December 31, 2014 and 2013, respectively, arose from sales, principally of Aviation goods and services, on open account to various agencies of the U.S. government. As a percentage of GE revenues, approximately 3% of GE sales of goods and services were to the U.S. government in 2014, compared with 4% in 2013 and 2012. |
GE current receivables balances at December 31, 2014 and 2013, before allowance for losses, included $7,808 million and $7,441 million, respectively, from sales of goods and services to customers, and $22 million and $37 million at December 31, 2014 and 2013, respectively, from transactions with associated companies. The remainder of the balances primarily relate to revenue sharing programs and other non-income taxes.
NOTE 5. INVENTORIES
December 31 (In millions) | 2014 | 2013 | |||
GE | |||||
Raw materials and work in process | $ | 9,820 | $ | 9,760 | |
Finished goods | 7,126 | 7,161 | |||
Unbilled shipments | 755 | 609 | |||
17,701 | 17,530 | ||||
Less revaluation to LIFO | (62) | (273) | |||
Total GE | 17,639 | 17,257 | |||
GECC | |||||
Finished goods | 50 | 68 | |||
Total consolidated | $ | 17,689 | $ | 17,325 | |
GE 2014 FORM 10-K 158
FINANCIAL STATEMENTS | FINANCING RECEIVABLES |
NOTE 6. GECC FINANCING RECEIVABLES AND ALLOWANCE FOR LOSSES ON FINANCING RECEIVABLES
FINANCING RECEIVABLES, NET | |||||
December 31 (In millions) | 2014 | 2013 | |||
Loans, net of deferred income | $ | 217,614 | $ | 231,268 | |
Investment in financing leases, net of deferred income | 24,479 | 26,939 | |||
242,093 | 258,207 | ||||
Allowance for losses | (5,075) | (5,178) | |||
Financing receivables – net(a) | $ | 237,018 | $ | 253,029 | |
| (a) | Financing receivables at December 31, 2014 and 2013 included $264 million and $544 million, respectively, relating to loans that had been acquired in a transfer but have been subject to credit deterioration since origination . |
GECC financing receivables include both loans and financing leases. Loans represent transactions in a variety of forms, including revolving charge and credit, mortgages, installment loans, intermediate-term loans and revolving loans secured by business assets. The portfolio includes loans carried at the principal amount on which finance charges are billed periodically, and loans carried at gross book value, which includes finance charges.
Investment in financing leases consists of direct financing and leveraged leases of aircraft, railroad rolling stock, autos, other transportation equipment, data processing equipment, medical equipment, commercial real estate and other manufacturing, power generation, and commercial equipment and facilities.
For federal income tax purposes, the leveraged leases and the majority of the direct financing leases are leases in which GECC depreciates the leased assets and is taxed upon the accrual of rental income. Certain direct financing leases are loans for federal income tax purposes. For these transactions, GECC is taxed only on the portion of each payment that constitutes interest, unless the interest is tax-exempt (e.g., certain obligations of state governments).
Investment in direct financing and leveraged leases represents net unpaid rentals and estimated unguaranteed residual values of leased equipment, less related deferred income. GECC has no general obligation for principal and interest on notes and other instruments representing third-party participation related to leveraged leases; such notes and other instruments have not been included in liabilities but have been offset against the related rentals receivable. The GECC share of rentals receivable on leveraged leases is subordinate to the share of other participants who also have security interests in the leased equipment. For federal income tax purposes, GECC is entitled to deduct the interest expense accruing on non-recourse financing related to leveraged leases.
NET INVESTMENT IN FINANCING LEASES | |||||||||||||||||
Total financing leases | Direct financing leases(a) | Leveraged leases(b) | |||||||||||||||
December 31 (In millions) | 2014 | 2013 | 2014 | 2013 | 2014 | 2013 | |||||||||||
Total minimum lease payments receivable | $ | 26,701 | $ | 29,970 | $ | 22,133 | $ | 24,571 | $ | 4,568 | $ | 5,399 | |||||
Less principal and interest on third-party | |||||||||||||||||
non-recourse debt | (2,812) | (3,480) | - | - | (2,812) | (3,480) | |||||||||||
Net rentals receivables | 23,889 | 26,490 | 22,133 | 24,571 | 1,756 | 1,919 | |||||||||||
Estimated unguaranteed residual value | |||||||||||||||||
of leased assets | 4,268 | 5,073 | 2,529 | 3,067 | 1,739 | 2,006 | |||||||||||
Less deferred income | (3,678) | (4,624) | (2,759) | (3,560) | (919) | (1,064) | |||||||||||
Investment in financing leases, net of | |||||||||||||||||
deferred income | 24,479 | 26,939 | 21,903 | 24,078 | 2,576 | 2,861 | |||||||||||
Less amounts to arrive at net investment | |||||||||||||||||
Allowance for losses | (181) | (202) | (166) | (192) | (15) | (10) | |||||||||||
Deferred taxes | (4,046) | (4,075) | (2,250) | (1,783) | (1,796) | (2,292) | |||||||||||
Net investment in financing leases | $ | 20,252 | $ | 22,662 | $ | 19,487 | $ | 22,103 | $ | 765 | $ | 559 | |||||
(a) | Included $284 million and $317 million of initial direct costs on direct financing leases at December 31, 2014 and 2013, respectively. |
(b) | Included pre-tax income of $112 million and $31 million and income tax of $43 million and $11 million during 2014 and 2013, respectively. Net investment credits recognized on leveraged leases during 2014 and 2013 were insignificant. |
GE 2014 FORM 10-K 159
FINANCIAL STATEMENTS | FINANCING RECEIVABLES |
CONTRACTUAL MATURITIES | |||||
Total | Net rentals | ||||
(In millions) | loans | receivable | |||
Due in | |||||
2015 | $ | 52,175 | $ | 8,012 | |
2016 | 18,663 | 5,440 | |||
2017 | 19,712 | 3,752 | |||
2018 | 14,034 | 2,564 | |||
2019 | 13,097 | 1,513 | |||
2020 and later | 35,069 | 2,608 | |||
152,750 | 23,889 | ||||
Consumer revolving loans | 64,864 | - | |||
Total | $ | 217,614 | $ | 23,889 | |
We expect actual maturities to differ from contractual maturities.
FINANCING RECEIVABLES BY PORTFOLIO AND ALLOWANCE FOR LOSSES
During the first quarter of 2014, we combined our CLL Europe and CLL Asia portfolios into CLL International and we transferred our CLL Other portfolio to the CLL Americas portfolio. During the fourth quarter of 2014, we combined our Consumer Non-U.S. auto portfolio into our Consumer Non-U.S. installment and revolving credit portfolio. Prior-period amounts were reclassified to conform to the current-period presentation.
FINANCING RECEIVABLES | |||||
(In millions) | 2014 | 2013 | |||
Commercial | |||||
CLL | |||||
Americas | $ | 67,096 | $ | 69,036 | |
International | 43,407 | 47,431 | |||
Total CLL | 110,503 | 116,467 | |||
Energy Financial Services | 2,580 | 3,107 | |||
GE Capital Aviation Services (GECAS) | 8,263 | 9,377 | |||
Other | 130 | 318 | |||
Total Commercial | 121,476 | 129,269 | |||
Real Estate | 19,797 | 19,899 | |||
Consumer | |||||
Non-U.S. residential mortgages | 24,893 | 30,501 | |||
Non-U.S. installment and revolving credit | 10,400 | 15,731 | |||
U.S. installment and revolving credit | 59,863 | 55,854 | |||
Other | 5,664 | 6,953 | |||
Total Consumer | 100,820 | 109,039 | |||
Total financing receivables | 242,093 | 258,207 | |||
Allowance for losses | (5,075) | (5,178) | |||
Total financing receivables – net | $ | 237,018 | $ | 253,029 | |
GE 2014 FORM 10-K 160
FINANCIAL STATEMENTS | FINANCING RECEIVABLES |
ALLOWANCE FOR LOSSES ON FINANCING RECEIVABLES | ||||||||||||||||||
Provision | ||||||||||||||||||
Balance at | charged to | Gross | Balance at | |||||||||||||||
(In millions) | January 1 | operations | Other | (a) | write-offs | (b) | Recoveries | (b) | December 31 | |||||||||
2014 | ||||||||||||||||||
Commercial | ||||||||||||||||||
CLL | ||||||||||||||||||
Americas | $ | 473 | $ | 307 | $ | (3) | $ | (422) | $ | 100 | $ | 455 | ||||||
International | 505 | 159 | (37) | (351) | 100 | 376 | ||||||||||||
Total CLL | 978 | 466 | (40) | (773) | 200 | 831 | ||||||||||||
Energy Financial Services | 8 | 30 | (1) | (17) | 6 | 26 | ||||||||||||
GECAS | 17 | 39 | - | (10) | - | 46 | ||||||||||||
Other | 2 | - | (2) | - | - | - | ||||||||||||
Total Commercial | 1,005 | 535 | (43) | (800) | 206 | 903 | ||||||||||||
Real Estate | 192 | (86) | (1) | (59) | 115 | 161 | ||||||||||||
Consumer | ||||||||||||||||||
Non-U.S. residential mortgages | 358 | 256 | (151) | (207) | 69 | 325 | ||||||||||||
Non-U.S. installment and revolving credit | 650 | 338 | (260) | (787) | 458 | 399 | ||||||||||||
U.S. installment and revolving credit | 2,823 | 2,875 | 19 | (3,138) | 607 | 3,186 | ||||||||||||
Other | 150 | 75 | (33) | (151) | 60 | 101 | ||||||||||||
Total Consumer | 3,981 | 3,544 | (425) | (4,283) | 1,194 | 4,011 | ||||||||||||
Total | $ | 5,178 | $ | 3,993 | $ | (469) | $ | (5,142) | $ | 1,515 | $ | 5,075 | ||||||
2013 | ||||||||||||||||||
Commercial | ||||||||||||||||||
CLL | ||||||||||||||||||
Americas | $ | 496 | $ | 289 | $ | (1) | $ | (425) | $ | 114 | $ | 473 | ||||||
International | 525 | 445 | 1 | (556) | 90 | 505 | ||||||||||||
Total CLL | 1,021 | 734 | - | (981) | 204 | 978 | ||||||||||||
Energy Financial Services | 9 | (1) | - | - | - | 8 | ||||||||||||
GECAS | 8 | 9 | - | - | - | 17 | ||||||||||||
Other | 3 | (1) | - | (2) | 2 | 2 | ||||||||||||
Total Commercial | 1,041 | 741 | - | (983) | 206 | 1,005 | ||||||||||||
Real Estate | 320 | 28 | (4) | (163) | 11 | 192 | ||||||||||||
Consumer | ||||||||||||||||||
Non-U.S. residential mortgages | 480 | 269 | 10 | (458) | 57 | 358 | ||||||||||||
Non-U.S. installment and revolving credit | 649 | 647 | (106) | (1,093) | 553 | 650 | ||||||||||||
U.S. installment and revolving credit | 2,282 | 3,006 | (51) | (2,954) | 540 | 2,823 | ||||||||||||
Other | 172 | 127 | 11 | (236) | 76 | 150 | ||||||||||||
Total Consumer | 3,583 | 4,049 | (136) | (4,741) | 1,226 | 3,981 | ||||||||||||
Total | $ | 4,944 | $ | 4,818 | $ | (140) | $ | (5,887) | $ | 1,443 | $ | 5,178 | ||||||
(a) | Other primarily included the 2014 reclassifications of Budapest Bank and GEMB-Nordic to held for sale, dispositions and the effects of currency exchange. GEMB-Nordic was subsequently sold in the fourth quarter of 2014. |
(b) | Net write-offs (gross write-offs less recoveries) in certain portfolios may exceed the beginning allowance for losses as a result of losses that are incurred subsequent to the beginning of the fiscal year due to information becoming available during the current year, which may identify further deterioration on existing financing receivables. |
GE 2014 FORM 10-K 161
FINANCIAL STATEMENTS | FINANCING RECEIVABLES |
ALLOWANCE FOR LOSSES ON FINANCING RECEIVABLES | |||||||||||||||||
Provision | |||||||||||||||||
Balance at | charged to | Gross | Balance at | ||||||||||||||
(In millions) | January 1 | operations | Other | (a) | write-offs | (b) | Recoveries | (b) | December 31 | ||||||||
2012 | |||||||||||||||||
Commercial | |||||||||||||||||
CLL | |||||||||||||||||
Americas | $ | 893 | $ | 122 | $ | (52) | $ | (578) | $ | 111 | $ | 496 | |||||
International | 557 | 411 | (6) | (524) | 87 | 525 | |||||||||||
Total CLL | 1,450 | 533 | (58) | (1,102) | 198 | 1,021 | |||||||||||
Energy Financial Services | 26 | 4 | - | (24) | 3 | 9 | |||||||||||
GECAS | 17 | 4 | - | (13) | - | 8 | |||||||||||
Other | 37 | 1 | (20) | (17) | 2 | 3 | |||||||||||
Total Commercial | 1,530 | 542 | (78) | (1,156) | 203 | 1,041 | |||||||||||
Real Estate | 1,089 | 72 | (44) | (810) | 13 | 320 | |||||||||||
Consumer | |||||||||||||||||
Non-U.S. residential mortgages | 545 | 112 | 8 | (261) | 76 | 480 | |||||||||||
Non-U.S. installment and revolving credit | 791 | 308 | 20 | (1,120) | 650 | 649 | |||||||||||
U.S. installment and revolving credit | 2,008 | 2,666 | (24) | (2,906) | 538 | 2,282 | |||||||||||
Other | 199 | 132 | 18 | (257) | 80 | 172 | |||||||||||
Total Consumer | 3,543 | 3,218 | 22 | (4,544) | 1,344 | 3,583 | |||||||||||
Total | $ | 6,162 | $ | 3,832 | $ | (100) | $ | (6,510) | $ | 1,560 | $ | 4,944 | |||||
(a) | Other primarily included transfers to held for sale and the effects of currency exchange. |
(b) | Net write-offs (gross write-offs less recoveries) in certain portfolios may exceed the beginning allowance for losses as a result of losses that are incurred subsequent to the beginning of the fiscal year due to information becoming available during the current year, which may identify further deterioration on existing financing receivables . |
GE 2014 FORM 10-K 162
FINANCIAL STATEMENTS | PROPERTY, PLANT AND EQUIPMENT |
NOTE 7. PROPERTY, PLANT AND EQUIPMENT
Depreciable | ||||||||||||||||
lives-new | Original Cost | Net Carrying Value | ||||||||||||||
December 31 (Dollars in millions) | (in years) | 2014 | 2013 | 2014 | 2013 | |||||||||||
GE | ||||||||||||||||
Land and improvements | 8 | (a) | $ | 700 | $ | 707 | $ | 689 | $ | 671 | ||||||
Buildings, structures and related equipment | 8-40 | 7,683 | 8,910 | 3,048 | 4,205 | |||||||||||
Machinery and equipment | 4-20 | 23,437 | 25,323 | 9,085 | 9,701 | |||||||||||
Leasehold costs and manufacturing plant under construction | 1-10 | 4,731 | 3,309 | 4,385 | 2,997 | |||||||||||
36,551 | 38,249 | 17,207 | 17,574 | |||||||||||||
GECC(b) | ||||||||||||||||
Land and improvements, buildings, structures and related equipment | 1-35 | (a) | 2,233 | 2,504 | 952 | 1,025 | ||||||||||
Equipment leased to others | ||||||||||||||||
Aircraft(c) | 20 | 49,280 | 50,337 | 32,795 | 34,938 | |||||||||||
Vehicles | 1-20 | 14,251 | 14,656 | 8,144 | 8,312 | |||||||||||
Railroad rolling stock | 4-50 | 4,379 | 4,636 | 2,998 | 3,129 | |||||||||||
Construction and manufacturing | 1-20 | 3,411 | 2,916 | 2,321 | 1,955 | |||||||||||
All other | 6-25 | 3,678 | 3,518 | 2,360 | 2,248 | |||||||||||
77,232 | 78,567 | 49,570 | 51,607 | |||||||||||||
Eliminations | (462) | (419) | (390) | (354) | ||||||||||||
Total | $ | 113,321 | $ | 116,397 | $ | 66,387 | $ | 68,827 | ||||||||
| (a) | Depreciable lives exclude land. |
| (b) | Included $1,845 million and $1,353 million of original cost of assets leased to GE with accumulated amortization of $560 million and $342 million at December 31, 2014 and 2013, respectively. |
| (c) | The GECAS business of GE Capital recognized impairment losses of $445 million and $732 million in 2014 and 2013, respectively. These losses are recorded in the caption "Other costs and expenses" in the Statement of Earnings to reflect adjustments to fair value based on an evaluation of average current market values (obtained from third parties) of similar type and age aircraft, which are adjusted for the attributes of the specific aircraft under lease . |
Consolidated depreciation and amortization related to property, plant and equipment was $9,283 million, $9,762 million and $9,192 million in 2014, 2013 and 2012, respectively. Amortization of GECC equipment leased to others was $6,245 million, $6,696 million and $6,097 million in 2014, 2013 and 2012, respectively.
Noncancellable future rentals due from customers for equipment on operating leases at December 31, 2014, are as follows:
(In millions) | ||
Due in | ||
2015 | $ | 6,953 |
2016 | 5,731 | |
2017 | 4,658 | |
2018 | 3,652 | |
2019 | 2,886 | |
2020 and later | 7,375 | |
Total | $ | 31,255 |
GE 2014 FORM 10-K 163
FINANCIAL STATEMENTS | ACQUISITIONS & INTANGIBLE ASSETS |
NOTE 8. ACQUISITIONS, GOODWILL AND OTHER INTANGIBLE ASSETS
ACQUISITIONS
Upon closing an acquisition, we estimate the fair values of assets and liabilities acquired and consolidate the acquisition as quickly as possible. Given the time it takes to obtain pertinent information to finalize the acquired company's balance sheet, then to adjust the acquired company's accounting policies, procedures, and books and records to our standards, it is often several quarters before we are able to finalize those initial fair value estimates. Accordingly, it is not uncommon for our initial estimates to be subsequently revised.
On June 20, 2014, GE's offer to acquire the Thermal, Renewables and Grid businesses of Alstom for approximately €12,350 million (to be adjusted for the assumed net cash or liability at closing) was positively recommended by Alstom's board of directors. In addition, GE, Alstom and the French Government signed a memorandum of understanding for the formation of three joint ventures in grid technology, renewable energy, and global nuclear and French steam power and Alstom will invest approximately €2,600 million in these joint ventures. In the fourth quarter of 2014, Alstom completed its review of the proposed transaction with the works council and obtained approval from its shareholders. Also in the fourth quarter of 2014, GE and Alstom entered into an amendment to the original agreement where GE has agreed to pay Alstom a net amount of approximately €260 million of additional consideration at closing. In exchange for this funding, Alstom has agreed to extend the trademark licensing of the Alstom name from 5 years to 25 years as well as other contractual amendments. The proposed transaction continues to be subject to regulatory approvals. The transaction is targeted to close in 2015.
On June 2, 2014, we acquired Cameron's Reciprocating Compression division for $550 million. The division provides reciprocating compression equipment and aftermarket services for oil and gas production, gas processing, gas distribution and independent power industries. The division is included in our Oil & Gas segment. The preliminary purchase price allocation resulted in goodwill of approximately $250 million and amortizable intangible assets of approximately $100 million. The allocation of the purchase price will be finalized upon completion of post-closing procedures.
In the first quarter of 2014, we acquired several businesses in our Healthcare segment. On February 12, 2014, we acquired API Healthcare (API) for $340 million in cash. API is a healthcare workforce management software and analytics solutions provider. The preliminary purchase price allocation resulted in goodwill of approximately $280 million and amortizable intangible assets of approximately $125 million. On March 21, 2014, we acquired certain Thermo Fisher Scientific Inc. life-science businesses for $1,065 million in cash. The primary business acquired, Hyclone, is a leading manufacturer of products used to support biopharmaceutical research and production. The preliminary purchase price allocation resulted in goodwill of approximately $700 million and amortizable intangible assets of approximately $320 million. The allocation of purchase prices will be finalized upon completion of post-closing procedures.
In August 2013, we acquired the aviation business of Avio S.p.A. (Avio) for $4,449 million in cash. We recorded a pre-tax acquisition-related charge of $96 million related to the effective settlement of Avio's pre-existing contractual relationships with GE. Avio is a manufacturer of aviation propulsion components and systems and is included in our Aviation segment. The purchase price allocation resulted in goodwill of $3,230 million and amortizable intangible assets of $1,817 million.
In July 2013, we acquired Lufkin Industries, Inc. (Lufkin) for $3,309 million in cash. Lufkin is a leading provider of artificial lift technologies for the oil and gas industry and a manufacturer of industrial gears and is included in our Oil & Gas segment. The purchase price allocation resulted in goodwill of $2,120 million and amortizable intangible assets of $997 million .
GE 2014 FORM 10-K 164
FINANCIAL STATEMENTS | ACQUISITIONS & INTANGIBLE ASSETS |
GOODWILL
CHANGES IN GOODWILL BALANCES | |||||||||||||||||||||||
2014 | 2013 | ||||||||||||||||||||||
Dispositions, | Dispositions, | ||||||||||||||||||||||
currency | currency | ||||||||||||||||||||||
Balance at | exchange | Balance at | Balance at | exchange | Balance at | ||||||||||||||||||
(In millions) | January 1 | Acquisitions | and other | December 31 | January 1 | Acquisitions | and other | December 31 | |||||||||||||||
Power & Water | $ | 8,822 | $ | 21 | $ | (89) | $ | 8,754 | $ | 8,821 | $ | - | $ | 1 | $ | 8,822 | |||||||
Oil & Gas | 10,516 | 276 | (220) | 10,572 | 8,365 | 2,217 | (66) | 10,516 | |||||||||||||||
Energy Management | 4,748 | - | (178) | 4,570 | 4,610 | 7 | 131 | 4,748 | |||||||||||||||
Aviation | 9,103 | - | (151) | 8,952 | 5,975 | 3,043 | 85 | 9,103 | |||||||||||||||
Healthcare | 16,643 | 1,004 | (115) | 17,532 | 16,762 | 45 | (164) | 16,643 | |||||||||||||||
Transportation | 1,012 | 2 | (127) | 887 | 999 | - | 13 | 1,012 | |||||||||||||||
Appliances & Lighting | 606 | - | (380) | 226 | 611 | - | (5) | 606 | |||||||||||||||
GE Capital | 26,195 | - | (1,169) | 25,026 | 26,971 | 17 | (793) | 26,195 | |||||||||||||||
Corporate | 3 | 31 | - | 34 | - | 4 | (1) | 3 | |||||||||||||||
Total | $ | 77,648 | $ | 1,334 | $ | (2,429) | $ | 76,553 | $ | 73,114 | $ | 5,333 | $ | (799) | $ | 77,648 | |||||||
Goodwill balances decreased by $(1,095) million in 2014, primarily as a result of currency exchange effects of a stronger U.S. dollar, the reclassification of goodwill associated with Appliances and Budapest Bank to assets of businesses held for sale, and the sale of GEMB-Nordic and other dispositions, partially offset by acquisitions at Healthcare and Oil & Gas.
Goodwill balances increased $4,534 million in 2013, primarily as a result of the acquisitions of Avio and Lufkin, partially offset by dispositions.
We test goodwill for impairment annually in the third quarter of each year using data as of July 1 of that year. The impairment test consists of two steps: in step one, the carrying value of the reporting unit is compared with its fair value; in step two, which is applied when the carrying value is more than its fair value, the amount of goodwill impairment, if any, is derived by deducting the fair value of the reporting unit's assets and liabilities from the fair value of its equity, and comparing that amount with the carrying amount of goodwill. We determined fair values for each of the reporting units using the market approach, when available and appropriate, or the income approach, or a combination of both. We assess the valuation methodology based upon the relevance and availability of the data at the time we perform the valuation. If multiple valuation methodologies are used, the results are weighted appropriately.
Valuations using the market approach are derived from metrics of publicly traded companies or historically completed transactions of comparable businesses. The selection of comparable businesses is based on the markets in which the reporting units operate giving consideration to risk profiles, size, geography, and diversity of products and services. A market approach is limited to reporting units for which there are publicly traded companies that have the characteristics similar to our businesses.
Under the income approach, fair value is determined based on the present value of estimated future cash flows, discounted at an appropriate risk-adjusted rate. We use our internal forecasts to estimate future cash flows and include an estimate of long-term future growth rates based on our most recent views of the long-term outlook for each business. Actual results may differ from those assumed in our forecasts. We derive our discount rates using a capital asset pricing model and analyzing published rates for industries relevant to our reporting units to estimate the cost of equity financing. We use discount rates that are commensurate with the risks and uncertainty inherent in the respective businesses and in our internally developed forecasts. Discount rates used in our reporting unit valuations ranged from 9.0% to 16.0%.
GE 2014 FORM 10-K 165
FINANCIAL STATEMENTS | ACQUISITIONS & INTANGIBLE ASSETS |
While all of our reporting units passed step one of our annual impairment testing, we identified one reporting unit for which the fair value was not substantially in excess of its carrying value. Within our Energy Management operating segment, the Power Conversion reporting unit was determined to have a fair value in excess of its carrying value by approximately 10%. The goodwill associated with the Power Conversion reporting unit was $1.5 billion at December 31, 2014, representing approximately 2% of our total goodwill. While the goodwill of the reporting unit is not currently impaired, there could be an impairment in the future as a result of changes in certain estimates and assumptions. For example, the reporting unit's fair value could be adversely affected and result in an impairment of goodwill if actual cash flows are below estimated cash flows, the estimated cash flows are discounted at a higher risk-adjusted rate or market multiples decrease.
As of December 31, 2014, we believe that the goodwill is recoverable for all of the reporting units; however, there can be no assurances that the goodwill will not be impaired in future periods.
In 2013, while the Real Estate reporting unit's book value was within the range of its fair value, we further substantiated our Real Estate goodwill balance by performing the second step analysis in which the implied fair value of goodwill exceeded its carrying value by approximately $3.7 billion. In the current year, it was determined that the second step was not required, as the results of step one indicated that the fair value of the Real Estate reporting unit exceeded its book value.
Estimating the fair value of reporting units requires the use of estimates and significant judgments that are based on a number of factors including actual operating results. It is reasonably possible that the judgments and estimates described above could change in future periods.
OTHER INTANGIBLE ASSETS
OTHER INTANGIBLE ASSETS - NET | |||||
(In millions) | 2014 | 2013 | |||
Intangible assets subject to amortization | $ | 14,026 | $ | 14,150 | |
Indefinite-lived intangible assets(a) | 130 | 160 | |||
Total | $ | 14,156 | $ | 14,310 | |
| (a) | Indefinite-lived intangible assets principally comprise trademarks and in-process research and development. |
GE 2014 FORM 10-K 166
FINANCIAL STATEMENTS | ACQUISITIONS & INTANGIBLE ASSETS |
INTANGIBLE ASSETS SUBJECT TO AMORTIZATION | |||||||||||||||||
2014 | 2013 | ||||||||||||||||
Gross | Gross | ||||||||||||||||
carrying | Accumulated | carrying | Accumulated | ||||||||||||||
December 31 (In millions) | amount | amortization | Net | amount | amortization | Net | |||||||||||
Customer-related | $ | 8,484 | $ | (2,617) | $ | 5,867 | $ | 7,938 | $ | (2,312) | $ | 5,626 | |||||
Patents and technology | 6,772 | (2,977) | 3,795 | 6,602 | (2,621) | 3,981 | |||||||||||
Capitalized software | 8,269 | (4,973) | 3,296 | 8,256 | (5,252) | 3,004 | |||||||||||
Trademarks | 1,159 | (271) | 888 | 1,356 | (295) | 1,061 | |||||||||||
Lease valuations | 485 | (377) | 108 | 703 | (498) | 205 | |||||||||||
Present value of future profits(a) | 614 | (614) | - | 574 | (574) | - | |||||||||||
All other | 503 | (431) | 72 | 632 | (359) | 273 | |||||||||||
Total | $ | 26,286 | $ | (12,260) | $ | 14,026 | $ | 26,061 | $ | (11,911) | $ | 14,150 | |||||
| (a) | Balances at December 31, 2014 and 2013 reflect adjustments of $293 million and $322 million, respectively, to the present value of future profits in our run-off insurance operation to reflect the effects that would have been recognized had the related unrealized investment securities holding gains and losses actually been realized . |
During 2014, we recorded additions to intangible assets subject to amortization of $2,090 million. The components of finite-lived intangible assets acquired during 2014 and their respective weighted average amortizable period follow.
COMPONENTS OF FINITE-LIVED INTANGIBLE ASSETS ACQUIRED DURING 2014 | ||||||
Weighted-average | ||||||
Gross | amortizable period | |||||
(In millions) | carrying value | (in years) | ||||
Customer-related | $ | 731 | 14.1 | |||
Patents and technology | 178 | 10.8 | ||||
Capitalized software | 1,123 | 5.7 | ||||
Trademarks | 52 | 17.2 | ||||
Lease valuations | 1 | 7.0 | ||||
All other | 6 | 2.5 | ||||
Consolidated amortization expense related to intangible assets subject to amortization was $1,789 million, $1,711 million and $1,612 million in 2014, 2013 and 2012, respectively. Estimated annual pre-tax amortization for intangible assets over the next five calendar years follows.
ESTIMATED 5 YEAR CONSOLIDATED AMORTIZATION | ||||||||||||||
(In millions) | 2015 | 2016 | 2017 | 2018 | 2019 | |||||||||
Estimated annual pre-tax amortization | $ | 1,725 | $ | 1,566 | $ | 1,414 | $ | 1,249 | $ | 1,077 | ||||
GE 2014 FORM 10-K 167
FINANCIAL STATEMENTS | ALL OTHER ASSETS |
NOTE 9. ALL OTHER ASSETS
December 31 (in millions) | 2014 | 2013 | |||
GE | |||||
Investments | |||||
Associated companies | $ | 3,384 | $ | 3,937 | |
Other | 613 | 626 | |||
3,997 | 4,563 | ||||
Contract costs and estimated earnings(a) | 13,990 | 12,522 | |||
Long-term receivables, including notes | 766 | 993 | |||
Derivative instruments | 783 | 623 | |||
Other | 5,144 | 5,007 | |||
24,680 | 23,708 | ||||
GECC | |||||
Investments | |||||
Associated companies | 16,747 | 17,348 | |||
Real estate(b)(c) | 10,891 | 16,163 | |||
Assets held for sale(d) | 5,549 | 2,571 | |||
Cost method(c) | 566 | 1,462 | |||
Other | 1,621 | 930 | |||
35,374 | 38,474 | ||||
Derivative instruments | 1,794 | 1,117 | |||
Advances to suppliers | 1,406 | 2,328 | |||
Deferred borrowing costs | 849 | 867 | |||
Deferred acquisition costs(e) | 17 | 29 | |||
Other | 4,435 | 4,551 | |||
43,875 | 47,366 | ||||
Eliminations | (330) | (266) | |||
Total | $ | 68,225 | $ | 70,808 | |
| (a) | Contract costs and estimated earnings reflect revenues earned in excess of billings on our long-term contracts to construct technically complex equipment (such as power generation, aircraft engines and aeroderivative units) and long-term product maintenance or extended warranty arrangements. These amounts are presented net of related billings in excess of revenues relating to long-term product maintenance or extended warranty arrangements of $2,329 million and $1,842 million at December 31, 2014 and 2013, respectively. |
| (b) | GECC investments in real estate consisted principally of two categories: real estate held for investment and equity method investments. Both categories contained a wide range of properties including the following at December 31, 2014: office buildings (57%), retail facilities (9%), apartment buildings (5%), industrial properties (3%), franchise properties (3%) and other (23%). At December 31, 2014, investments were located in the Americas (46%), Europe (37%) and Asia (17%). |
| (c) | The fair value of and unrealized loss on cost method investments in a continuous loss position for less than 12 months at December 31, 2014, were $5 million and $1 million, respectively. The fair value of and unrealized loss on cost method investments in a continuous loss position for 12 months or more at December 31, 2014, were an insignificant amount and $1 million, respectively. The fair value of and unrealized loss on cost method investments in a continuous loss position for less than 12 months at December 31, 2013, were $17 million and an insignificant amount, respectively. There were no cost method investments in a continuous loss position for 12 months or more at December 31, 2013. |
| (d) | Assets were classified as held for sale on the date a decision was made to dispose of them through sale or other means. At December 31, 2014 and 2013, such assets consisted primarily of loans, aircraft, equipment and real estate properties, and were accounted for at the lower of carrying amount or estimated fair value less costs to sell. These amounts are net of valuation allowances of $142 million and $127 million at December 31, 2014 and 2013, respectively. Assets held for sale increased $2,978 million from December 31, 2013 as a result of net increases in held for sale loans and aircraft, partially offset by net decreases in held for sale real estate, primarily due to sales. |
| (e) | Balances at December 31, 2014 and 2013 reflect adjustments of $624 million and $700 million, respectively, to deferred acquisition costs in our run-off insurance operations to reflect the effects that would have been recognized had the related unrealized investment securities holding gains and losses actually been realized. |
GE 2014 FORM 10-K 168
FINANCIAL STATEMENTS | BORROWINGS AND BANK DEPOSITS |
NOTE 10. BORROWINGS AND BANK DEPOSITS
December 31 (Dollars in millions) | 2014 | 2013 | ||||||||||
Short-term borrowings | Amount | Average Rate(a) | Amount | Average Rate(a) | ||||||||
GE | ||||||||||||
Commercial paper | $ | 500 | 0.10 | % | $ | - | - | % | ||||
Payable to banks | 343 | 1.32 | 346 | 3.38 | ||||||||
Current portion of long-term borrowings | 2,068 | 1.05 | 70 | 5.65 | ||||||||
Other | 961 | 1,425 | ||||||||||
Total GE short-term borrowings | 3,872 | 1,841 | ||||||||||
GECC | ||||||||||||
Commercial paper | ||||||||||||
U.S. | 22,019 | 0.19 | 24,877 | 0.18 | ||||||||
Non-U.S. | 2,993 | 0.25 | 4,168 | 0.33 | ||||||||
Current portion of long-term borrowings(b)(c)(f) | 37,989 | 2.54 | 39,215 | 2.70 | ||||||||
GE Interest Plus notes(d) | 5,467 | 1.01 | 8,699 | 1.11 | ||||||||
Other(c) | 312 | 339 | ||||||||||
Total GECC short-term borrowings | 68,780 | 77,298 | ||||||||||
Eliminations | (863) | (1,249) | ||||||||||
Total short-term borrowings | $ | 71,789 | $ | 77,890 | ||||||||
Long-term borrowings | Maturities | Amount | Average Rate(a) | Amount | Average Rate(a) | |||||||
GE | ||||||||||||
Senior notes | 2017-2044 | $ | 11,945 | 4.25 | % | $ | 10,968 | 3.63 | % | |||
Payable to banks | 2016-2019 | 5 | 0.89 | 10 | 1.10 | |||||||
Other | 518 | 537 | ||||||||||
Total GE long-term borrowings | 12,468 | 11,515 | ||||||||||
GECC | ||||||||||||
Senior unsecured notes(b)(e) | 2016-2055 | 162,629 | 2.72 | 186,433 | 2.97 | |||||||
Subordinated notes(f) | 2021-2037 | 4,804 | 3.36 | 4,821 | 3.93 | |||||||
Subordinated debentures(g) | 2066-2067 | 7,085 | 5.88 | 7,462 | 5.64 | |||||||
Other(c)(h) | 13,473 | 11,563 | ||||||||||
Total GECC long-term borrowings | 187,991 | 210,279 | ||||||||||
Eliminations | (45) | (129) | ||||||||||
Total long-term borrowings | $ | 200,414 | $ | 221,665 | ||||||||
Non-recourse borrowings of | ||||||||||||
consolidated securitization entities(i) | 2015-2019 | $ | 29,938 | 1.04 | % | $ | 30,124 | 1.05 | % | |||
Bank deposits(j) | $ | 62,839 | $ | 53,361 | ||||||||
Total borrowings and bank deposits | $ | 364,980 | $ | 383,040 | ||||||||
(a) | Based on year-end balances and year-end local currency effective interest rates, including the effects from hedging. |
(b) | Included $439 million and $481 million of obligations to holders of GICs at December 31, 2014 and 2013, respectively. These obligations included conditions under which certain GIC holders could require immediate repayment of their investment should the long-term credit ratings of GECC fall below AA-/Aa3. The remaining outstanding GICs will continue to be subject to their scheduled maturities and individual terms, which may include provisions permitting redemption upon a downgrade of one or more of GECC's ratings, among other things. |
(c) | Included $6,017 million and $9,468 million of funding secured by real estate, aircraft and other collateral at December 31, 2014 and 2013, respectively, of which $2,312 million and $2,868 million is non-recourse to GECC at December 31, 2014 and 2013, respectively. |
(d) | Entirely variable denomination floating-rate demand notes. |
(e) | Included $700 million of debt at both December 31, 2014 and 2013 raised by a funding entity related to Penske Truck Leasing Co., L.P. (PTL). GECC, as co-issuer and co-guarantor of the debt, reports this amount as borrowings in its financial statements. GECC has been indemnified by the other limited partners of PTL for their proportionate share of the debt obligation. Also included $3,593 million related to Synchrony Financial. See Note 1. |
(f) | Included $300 million of subordinated notes guaranteed by GE at both December 31, 2014 and 2013. |
(g) | Subordinated debentures receive rating agency equity credit. |
(h) | Included $8,245 million related to Synchrony Financial. See Note 1. |
(i) | Included $7,442 million and $9,047 million of current portion of long-term borrowings at December 31, 2014 and 2013, respectively. See Note 23. |
| (j) | Included $10,258 million and $13,614 million of deposits in non-U.S. banks at December 31, 2014 and 2013, respectively, and $22,848 million and $18,275 million of certificates of deposits with maturities greater than one year at December 31, 2014 and 2013, respectively. |
GE 2014 FORM 10-K 169
FINANCIAL STATEMENTS | INVESTMENT CONTRACTS & INSURANCE |
In the first quarter of 2014, GE issued $3,000 million senior unsecured debt, composed of $ 750 million aggregate principal amount of 3.375% Notes due 2024 and $2,250 million aggregate principal amount of 4.500% Notes due 2044 .
Additional information about borrowings and associated swaps can be found in Note 22.
Liquidity is affected by debt maturities and our ability to repay or refinance such debt. Long-term debt maturities over the next five years follow.
(In millions) | 2015 | 2016 | 2017 | 2018 | 2019 | |||||||||
GE | $ | 2,068 | $ | 194 | $ | 4,052 | $ | 28 | $ | 29 | ||||
GECC | 37,989 | (a) | 31,707 | 27,041 | 19,011 | 21,956 | ||||||||
| (a) | Fixed and floating rate notes of $474 million contain put options with exercise dates in 2015, and which have final maturity beyond 2019. |
Committed credit lines totaling $44.9 billion had been extended to us by 50 banks at year-end 2014. GECC can borrow up to $44.4 billion under these credit lines. GE can borrow up to $14.2 billion under certain of these credit lines. The GECC lines include $25.1 billion of revolving credit agreements under which we can borrow funds for periods exceeding one year. Additionally, $19.3 billion are 364-day lines that contain a term-out feature that allows us to extend the borrowings for two years from the date on which such borrowings would otherwise be due.
NOTE 11. INVESTMENT CONTRACTS, INSURANCE LIABILITIES AND INSURANCE ANNUITY BENEFITS
Investment contracts, insurance liabilities and insurance annuity benefits comprise mainly obligations to annuitants and policyholders in our run-off insurance operations and holders of guaranteed investment contracts.
December 31 (In millions) | 2014 | 2013 | |||
Investment contracts | $ | 2,970 | $ | 3,144 | |
Guaranteed investment contracts | 1,000 | 1,471 | |||
Total investment contracts | 3,970 | 4,615 | |||
Life insurance benefits(a) | 20,688 | 18,959 | |||
Other(b) | 3,369 | 3,405 | |||
28,027 | 26,979 | ||||
Eliminations | (449) | (435) | |||
Total | $ | 27,578 | $ | 26,544 | |
(a) | Life insurance benefits are accounted for mainly by a net-level-premium method using estimated yields generally ranging from 3.0% to 8.5% in both 2014 and 2013. |
(b) | Substantially all unpaid claims and claims adjustment expenses and unearned premiums . |
When insurance affiliates cede insurance risk to third parties, such as reinsurers, they are not relieved of their primary obligation to policyholders. When losses on ceded risks give rise to claims for recovery, we establish allowances for probable losses on such receivables from reinsurers as required. Reinsurance recoverables are included in the caption "Other GECC receivables" on our Statement of Financial Position, and amounted to $1,759 million and $1,685 million at December 31, 2014 and 2013, respectively.
We recognize reinsurance recoveries as a reduction of the Statement of Earnings caption "Investment contracts, insurance losses and insurance annuity benefits." Reinsurance recoveries were $240 million, $250 million and $234 million in December 31, 2014, 2013 and 2012, respectively.
GE 2014 FORM 10-K 170
FINANCIAL STATEMENTS | POSTRETIREMENT BENEFIT PLANS |
NOTE 12. POSTRETIREMENT BENEFIT PLANS
PENSION BENEFITS
We sponsor a number of pension plans. Principal pension plans, together with affiliate and certain other pension plans (other pension plans) detailed in this note, represent about 99% of our total pension assets. We use a December 31 measurement date for our plans.
Principal Pension Plans are the GE Pension Plan and the GE Supplementary Pension Plan.
The GE Pension Plan provides benefits to certain U.S. employees based on the greater of a formula recognizing career earnings or a formula recognizing length of service and final average earnings. Certain benefit provisions are subject to collective bargaining. Salaried employees who commence service on or after January 1, 2011 and any employee who commences service on or after January 1, 2012 will not be eligible to participate in the GE Pension Plan, but will participate in a defined contribution retirement program.
The GE Supplementary Pension Plan is an unfunded plan providing supplementary retirement benefits primarily to higher-level, longer-service U.S. employees.
Other Pension Plans in 2014 included 40 U.S. and non-U.S. pension plans with pension assets or obligations greater than $50 million. These defined benefit plans generally provide benefits to employees based on formulas recognizing length of service and earnings.
PENSION PLAN PARTICIPANTS | |||||
Principal | Other | ||||
pension | pension | ||||
December 31, 2014 | Total | plans | plans | ||
Active employees | 117,000 | 86,000 | 31,000 | ||
Vested former employees | 225,000 | 179,000 | 46,000 | ||
Retirees and beneficiaries | 267,000 | 232,000 | 35,000 | ||
Total | 609,000 | 497,000 | 112,000 | ||
COST OF PENSION PLANS | |||||||||||||||||||||||||||
Total | Principal pension plans | Other pension plans | |||||||||||||||||||||||||
(In millions) | 2014 | 2013 | 2012 | 2014 | 2013 | 2012 | 2014 | 2013 | 2012 | ||||||||||||||||||
Service cost for benefits earned | $ | 1,608 | $ | 1,970 | $ | 1,779 | $ | 1,205 | $ | 1,535 | $ | 1,387 | $ | 403 | $ | 435 | $ | 392 | |||||||||
Prior service cost amortization | 220 | 253 | 287 | 214 | 246 | 279 | 6 | 7 | 8 | ||||||||||||||||||
Expected return on plan assets | (3,979) | (4,163) | (4,394) | (3,190) | (3,500) | (3,768) | (789) | (663) | (626) | ||||||||||||||||||
Interest cost on benefit obligations | 3,332 | 2,983 | 2,993 | 2,745 | 2,460 | 2,479 | 587 | 523 | 514 | ||||||||||||||||||
Net actuarial loss amortization | 2,770 | 4,007 | 3,701 | 2,565 | 3,664 | 3,421 | 205 | 343 | 280 | ||||||||||||||||||
Curtailment loss | 65 | - | - | 65 | (a) | - | - | - | - | - | |||||||||||||||||
Pension plans cost | $ | 4,016 | $ | 5,050 | $ | 4,366 | $ | 3,604 | $ | 4,405 | $ | 3,798 | $ | 412 | $ | 645 | $ | 568 | |||||||||
(a) | Loss resulting from our agreement with Electrolux to sell the GE Appliances business. |
GE 2014 FORM 10-K 171
FINANCIAL STATEMENTS | POSTRETIREMENT BENEFIT PLANS |
ACTUARIAL ASSUMPTIONS
The actuarial assumptions at December 31 are used to measure the year-end benefit obligations and the pension costs for the subsequent year.
Principal pension plans | Other pension plans (weighted average) | ||||||||||||||||
December 31 | 2014 | 2013 | 2012 | 2011 | 2014 | 2013 | 2012 | 2011 | |||||||||
Discount rate | 4.02 | % | 4.85 | % | 3.96 | % | 4.21 | % | 3.53 | % | 4.39 | % | 3.92 | % | 4.42 | % | |
Compensation increases | 4.10 | 4.00 | 3.90 | 3.75 | 3.60 | 3.76 | 3.30 | 4.31 | |||||||||
Expected return on assets | 7.50 | 7.50 | 8.00 | 8.00 | 6.95 | 6.92 | 6.82 | 7.09 | |||||||||
To determine the expected long-term rate of return on pension plan assets, we consider current and target asset allocations, as well as historical and expected returns on various categories of plan assets. In developing future return expectations for our principal pension plans' assets, we formulate views on the future economic environment, both in the U.S. and abroad. We evaluate general market trends and historical relationships among a number of key variables that impact asset class returns such as expected earnings growth, inflation, valuations, yields and spreads, using both internal and external sources. We also take into account expected volatility by asset class and diversification across classes to determine expected overall portfolio results given current and target allocations. Based on our analysis of future expectations of asset performance, past return results, and our current and target asset allocations, we have assumed a 7.5% long-term expected return on those assets for cost recognition in 2015. For the principal pension plans, we apply our expected rate of return to a market-related value of assets, which stabilizes variability in the amounts to which we apply that expected return.
The Society of Actuaries recently issued new mortality tables projecting longer life expectancies that will result in higher postretirement benefit obligations for U.S. companies. We updated our mortality assumptions at December 31, 2014. The new mortality assumptions increased our principal pension plans' benefit obligations by $3,953 million at December 31, 2014.
We amortize experience gains and losses, as well as the effects of changes in actuarial assumptions and plan provisions, over a period no longer than the average future service of employees.
FUNDING POLICY
The funding policy for the GE Pension Plan is to contribute amounts sufficient to meet minimum funding requirements as set forth in employee benefit and tax laws plus such additional amounts as we may determine to be appropriate. We did not make contributions to the GE Pension Plan in 2014 and 2013. The ERISA minimum funding requirements do not require a contribution in 2015. We expect to pay approximately $265 million for benefit payments under our GE Supplementary Pension Plan and administrative expenses of our principal pension plans and expect to contribute approximately $540 million to other pension plans in 2015. In 2014, comparative amounts were $236 million and $726 million, respectively.
BENEFIT OBLIGATIONS
GE 2014 FORM 10-K 172
FINANCIAL STATEMENTS | POSTRETIREMENT BENEFIT PLANS |
PROJECTED BENEFIT OBLIGATION | ||||||||||||
Principal pension plans | Other pension plans | |||||||||||
(In millions) | 2014 | 2013 | 2014 | 2013 | ||||||||
Balance at January 1 | $ | 58,113 | $ | 63,502 | $ | 13,535 | $ | 13,584 | ||||
Service cost for benefits earned | 1,205 | 1,535 | 403 | 435 | ||||||||
Interest cost on benefit obligations | 2,745 | 2,460 | 587 | 523 | ||||||||
Participant contributions | 153 | 156 | 9 | 14 | ||||||||
Plan amendments | - | - | (29) | 11 | ||||||||
Actuarial loss (gain) | 11,718 | (a) | (6,406) | (b) | 2,170 | (b) | (575) | (b) | ||||
Benefits paid | (3,199) | (3,134) | (493) | (477) | ||||||||
Acquisitions (dispositions) / other - net | - | - | 48 | 46 | ||||||||
Exchange rate adjustments | - | - | (641) | (26) | ||||||||
Balance at December 31(c) | $ | 70,735 | $ | 58,113 | $ | 15,589 | $ | 13,535 | ||||
(a) | Principally associated with discount rate and mortality assumption changes. |
(b) | Principally associated with discount rate changes. |
(c) | The PBO for the GE Supplementary Pension Plan, which is an unfunded plan, was $6,632 million and $5,162 million at year-end 2014 and 2013, respectively. |
ACCUMULATED BENEFIT OBLIGATION | |||||
December 31 (In millions) | 2014 | 2013 | |||
GE Pension Plan | $ | 61,631 | $ | 50,967 | |
GE Supplementary Pension Plan | 5,070 | 3,946 | |||
Other pension plans | 14,790 | 12,629 | |||
PLANS WITH ASSETS LESS THAN ABO | |||||
December 31 (In millions) | 2014 | 2013 | |||
Funded plans with assets less than ABO | |||||
Plan assets | $ | 53,126 | $ | 57,430 | |
Accumulated benefit obligations | 67,676 | 60,715 | |||
Projected benefit obligations | 70,354 | 63,532 | |||
Unfunded plans(a) | |||||
Accumulated benefit obligations | 6,719 | 5,243 | |||
Projected benefit obligations | 8,342 | 6,512 | |||
| (a) | Primarily related to the GE Supplementary Pension Plan. |
GE 2014 FORM 10-K 173
FINANCIAL STATEMENTS | POSTRETIREMENT BENEFIT PLANS |
PLAN ASSETS
The fair value of the classes of the pension plans' investments is presented below. The inputs and valuation techniques used to measure the fair value of the assets are consistently applied and described in Note 1.
FAIR VALUE OF PLAN ASSETS | |||||||||||
Principal pension plans | Other pension plans | ||||||||||
(In millions) | 2014 | 2013 | 2014 | 2013 | |||||||
Balance at January 1 | $ | 48,297 | $ | 44,738 | $ | 11,059 | $ | 9,702 | |||
Actual gain on plan assets | 2,793 | 6,312 | 1,537 | 1,212 | |||||||
Employer contributions | 236 | 225 | 726 | 673 | |||||||
Participant contributions | 153 | 156 | 9 | 14 | |||||||
Benefits paid | (3,199) | (3,134) | (493) | (477) | |||||||
Acquisitions (dispositions) / other - net | - | - | - | (31) | |||||||
Exchange rate adjustments | - | - | (452) | (34) | |||||||
Balance at December 31 | $ | 48,280 | $ | 48,297 | $ | 12,386 | $ | 11,059 | |||
ASSET ALLOCATION | |||||||||||
Other pension plans | |||||||||||
Principal pension plans | (weighted average) | ||||||||||
2014 | 2014 | 2014 | 2014 | ||||||||
Target | Actual | Target | Actual | ||||||||
allocation | allocation | allocation | allocation | ||||||||
Equity securities(a) | 17 - 57 | % (b) | 45 | % (c) | 39 | % | 48 | % | |||
Debt securities (including cash equivalents) | 13 - 53 | 31 | 35 | 38 | |||||||
Private equities | 8 - 18 | 11 | 7 | 2 | |||||||
Real estate | 2 - 12 | 7 | 9 | 6 | |||||||
Other investments(d) | 3 - 13 | 6 | 10 | 6 | |||||||
(a) | Includes investment funds that primarily hold this type of asset. |
(b) | Target equally divided between U.S. equity securities and non-U.S. equity securities. |
(c) | Actual allocations were 25% for U.S. equity securities and 20% for non-U.S. equity securities. |
(d) | Substantially all represented hedge fund investments . |
Plan fiduciaries of the GE Pension Plan set investment policies and strategies for the GE Pension Trust and oversee its investment allocation, which includes selecting investment managers, commissioning periodic asset-liability studies and setting long-term strategic targets. Long-term strategic investment objectives take into consideration a number of factors, including the funded status of the plan, a balance between risk and return and the plan's liquidity needs. Target allocation percentages are established at an asset class level by plan fiduciaries. Target allocation ranges are guidelines, not limitations, and occasionally plan fiduciaries will approve allocations above or below a target range.
Plan fiduciaries monitor the GE Pension Plan's liquidity position in order to meet the near-term benefit payment and other cash needs. The GE Pension Plan holds short-term debt securities to meet its liquidity needs.
GE Pension Trust assets are invested subject to the following additional guidelines:
| Short-term securities purchased must generally be rated A-1/P-1 or better, except for 15% of such securities that may be rated A-2/P-2 and other short-term securities as may be approved by the plan fiduciaries. |
| Real estate investments may not exceed 25% of total assets. |
| Investments in restricted securities (excluding real estate investments) that are not freely tradable may not exceed 30% of total assets (actual was 17% of trust assets at December 31, 2014). |
GE 2014 FORM 10-K 174
FINANCIAL STATEMENTS | POSTRETIREMENT BENEFIT PLANS |
|
|
According to statute, the aggregate holdings of all qualifying employer securities (e.g., GE common stock) and qualifying employer real property may not exceed 10% of the fair value of trust assets at the time of purchase. GE securities represented 3.8% and 4.5% of trust assets at year-end 2014 and 2013, respectively.
The GE Pension Plan has a broadly diversified portfolio of investments in equities, fixed income, private equities, real estate and hedge funds; these investments are both U.S. and non-U.S. in nature. As of December 31, 2014, U.S. government direct and indirect obligations represented 16% of total GE Pension Plan assets. No other sector concentration of assets exceeded 15% of total GE Pension Plan assets.
The following tables present GE Pension Plan investments measured at fair value.
(In millions) | Level 1 | Level 2 | Level 3 | Total | |||||||
December 31, 2014 | |||||||||||
Equity securities | |||||||||||
U.S. equity securities(a) | $ | 11,493 | $ | 1,463 | $ | - | $ | 12,956 | |||
Non-U.S. equity securities(a) | 7,021 | 2,132 | - | 9,153 | |||||||
Debt securities | |||||||||||
Fixed income and cash investment funds | 245 | 4,255 | - | 4,500 | |||||||
U.S. corporate(b) | - | 5,153 | 2 | 5,155 | |||||||
Residential mortgage-backed | - | 1,118 | 1 | 1,119 | |||||||
Non-U.S. Corporate | - | 1,097 | 3 | 1,100 | |||||||
U.S. government and federal agency | - | 2,468 | - | 2,468 | |||||||
Other debt securities(c) | - | 1,042 | - | 1,042 | |||||||
Private equities(a) | - | 32 | 5,217 | 5,249 | |||||||
Real estate(a) | - | - | 3,129 | 3,129 | |||||||
Other investments(d) | - | 70 | 2,248 | 2,318 | |||||||
Total investments | $ | 18,759 | $ | 18,830 | $ | 10,600 | $ | 48,189 | |||
Other(e) | 91 | ||||||||||
Total assets | $ | 48,280 | |||||||||
December 31, 2013 | |||||||||||
Equity securities | |||||||||||
U.S. equity securities(a) | $ | 11,067 | $ | 1,568 | $ | - | $ | 12,635 | |||
Non-U.S. equity securities(a) | 7,832 | 1,292 | - | 9,124 | |||||||
Debt securities | |||||||||||
Fixed income and cash investment funds | - | 2,078 | - | 2,078 | |||||||
U.S. corporate(b) | - | 4,555 | - | 4,555 | |||||||
Residential mortgage-backed | - | 1,093 | - | 1,093 | |||||||
Non-U.S. Corporate | - | 1,269 | - | 1,269 | |||||||
U.S. government and federal agency | - | 5,253 | - | 5,253 | |||||||
Other debt securities(c) | - | 1,048 | - | 1,048 | |||||||
Private equities(a) | - | - | 6,269 | 6,269 | |||||||
Real estate(a) | - | - | 3,354 | 3,354 | |||||||
Other investments(d) | - | 169 | 1,622 | 1,791 | |||||||
Total investments | $ | 18,899 | $ | 18,325 | $ | 11,245 | $ | 48,469 | |||
Other(e) | (172) | ||||||||||
Total assets | $ | 48,297 | |||||||||
| (a) | Included direct investments and investment funds. |
| (b) | Primarily represented investment-grade bonds of U.S. issuers from diverse industries. |
| (c) | Primarily represented investments in state and municipal debt, non-U.S. government bonds and commercial mortgage-backed securities. |
| (d) | Substantially all represented hedge fund investments. |
| (e) | Primarily represented net unsettled transactions related investment activity and cash balances. |
GE 2014 FORM 10-K 175
FINANCIAL STATEMENTS | POSTRETIREMENT BENEFIT PLANS |
The following tables present the changes in Level 3 investments for the GE Pension Plan.
CHANGES IN LEVEL 3 INVESTMENTS FOR THE YEAR ENDED DECEMBER 31, 2014 | |||||||||||||||||
Purchases, | Transfers | ||||||||||||||||
issuances | in and/or | ||||||||||||||||
January 1, | Net realized | Net unrealized | and | out of | December 31, | ||||||||||||
(In millions) | 2014 | gains (losses) | (a) | gains (losses) | (a) | settlements | Level 3 | (b) | 2014 | ||||||||
Debt securities | $ | - | $ | (9) | $ | 11 | $ | 4 | $ | - | $ | 6 | |||||
Private equities | 6,269 | 592 | (54) | (1,565) | (25) | 5,217 | |||||||||||
Real estate | 3,354 | 36 | 334 | (595) | - | 3,129 | |||||||||||
Other investments | 1,622 | 47 | 86 | 194 | 299 | 2,248 | |||||||||||
$ | 11,245 | $ | 666 | $ | 377 | $ | (1,962) | $ | 274 | $ | 10,600 | ||||||
(a) | The realized/unrealized gains (losses) include $899 million related to assets still held and $144 million for assets no longer held. |
(b) | Transfers in and out of Level 3 are considered to occur at the beginning of the period. |
CHANGES IN LEVEL 3 INVESTMENTS FOR THE YEAR ENDED DECEMBER 31, 2013 | |||||||||||||||||
Purchases, | Transfers | ||||||||||||||||
issuances | in and/or | ||||||||||||||||
January 1, | Net realized | Net unrealized | and | out of | December 31, | ||||||||||||
(In millions) | 2013 | gains (losses) | (a) | gains (losses) | (a) | settlements | Level 3 | (b) | 2013 | ||||||||
Debt securities | $ | 75 | $ | (7) | $ | - | $ | (65) | $ | (3) | $ | - | |||||
Private equities | 6,878 | 525 | 588 | (1,675) | (47) | 6,269 | |||||||||||
Real estate | 3,356 | 23 | 330 | (355) | - | 3,354 | |||||||||||
Other investments | 1,694 | (1) | 200 | (77) | (194) | 1,622 | |||||||||||
$ | 12,003 | $ | 540 | $ | 1,118 | $ | (2,172) | $ | (244) | $ | 11,245 | ||||||
(a) | The realized/unrealized gains (losses) include $1,616 million related to assets still held and $42 million for assets no longer held. |
(b) | Transfers in and out of Level 3 are considered to occur at the beginning of the period. |
GE 2014 FORM 10-K 176
FINANCIAL STATEMENTS | POSTRETIREMENT BENEFIT PLANS |
PENSION ASSET (LIABILITY) | |||||||||||
Principal pension plans | Other pension plans | ||||||||||
December 31 (In millions) | 2014 | 2013 | 2014 | 2013 | |||||||
Funded status(a)(b) | $ | (22,455) | $ | (9,816) | $ | (3,203) | $ | (2,476) | |||
Pension asset (liability) recorded in the | |||||||||||
Statement of Financial Position | |||||||||||
Pension asset | $ | - | $ | - | $ | 295 | $ | 325 | |||
Pension liabilities | |||||||||||
Due within one year(c) | (190) | (170) | (72) | (67) | |||||||
Due after one year | (22,265) | (9,646) | (3,426) | (2,734) | |||||||
Net amount recognized | $ | (22,455) | $ | (9,816) | $ | (3,203) | $ | (2,476) | |||
Amounts recorded in shareowners' | |||||||||||
equity (unamortized) | |||||||||||
Prior service cost (credit) | $ | 881 | $ | 1,160 | $ | (23) | $ | 9 | |||
Net actuarial loss | 21,105 | 11,555 | 3,533 | 2,459 | |||||||
Total | $ | 21,986 | $ | 12,715 | $ | 3,510 | $ | 2,468 | |||
| (a) | Fair value of assets less PBO, as shown in the preceding tables. |
| (b) | The GE Pension Plan was underfunded by $15.8 billion and $4.7 billion at December 31, 2014 and 2013, respectively. |
| (c) | For principal pension plans, represents the GE Supplementary Pension Plan liability . |
In 2015, we estimate that we will amortize $210 million of prior service cost and $3,300 million of net actuarial loss for the principal pension plans from shareowners' equity into pension cost. For other pension plans, the estimated prior service cost and net actuarial loss to be amortized in 2015 will be $5 million and $305 million, respectively. Comparable amortized amounts in 2014, respectively, were $214 million and $2,565 million for the principal pension plans and $6 million and $205 million for other pension plans.
ESTIMATED FUTURE BENEFIT PAYMENTS | |||||||||||||||||
2020 - | |||||||||||||||||
(In millions) | 2015 | 2016 | 2017 | 2018 | 2019 | 2024 | |||||||||||
Principal pension plans | $ | 3,225 | $ | 3,300 | $ | 3,380 | $ | 3,465 | $ | 3,560 | $ | 19,430 | |||||
Other pension plans | $ | 505 | $ | 510 | $ | 520 | $ | 530 | $ | 540 | $ | 2,925 | |||||
RETIREE HEALTH AND LIFE BENEFITS
We sponsor a number of retiree health and life insurance benefit plans (retiree benefit plans). Principal retiree benefit plans are discussed below; other such plans are not significant individually or in the aggregate. We use a December 31 measurement date for our plans.
GE 2014 FORM 10-K 177
FINANCIAL STATEMENTS | POSTRETIREMENT BENEFIT PLANS |
COST OF PRINCIPAL RETIREE BENEFIT PLANS | ||||||||
(In millions) | 2014 | 2013 | 2012 | |||||
Service cost for benefits earned | $ | 164 | $ | 229 | $ | 219 | ||
Prior service cost amortization | 353 | 393 | 518 | |||||
Expected return on plan assets | (50) | (60) | (73) | |||||
Interest cost on benefit obligations | 424 | 410 | 491 | |||||
Net actuarial loss (gain) amortization | (150) | (45) | 32 | |||||
Net curtailment/settlement loss (gain) | 48 | (a) | - | (101) | ||||
Retiree benefit plans cost | $ | 789 | $ | 927 | $ | 1,086 | ||
| (a) | Loss resulting from our agreement with Electrolux to sell the GE Appliances business. |
ACTUARIAL ASSUMPTIONS
The actuarial assumptions at December 31 are used to measure the year-end benefit obligations and the retiree benefit plan costs for the subsequent year.
December 31 | 2014 | 2013 | 2012 | 2011 | ||||
Discount rate | 3.89 | % | 4.61 | %(a) | 3.74 | %(a) | 4.09 | %(a) |
Compensation increases | 4.10 | 4.00 | 3.90 | 3.75 | ||||
Expected return on assets | 7.00 | 7.00 | 7.00 | 7.00 | ||||
Initial healthcare trend rate(b) | 6.00 | 6.00 | 6.50 | 7.00 | ||||
(a) | Weighted average discount rates of 4.47%, 3.77%, and 3.94% were used for determination of costs in 2014, 2013 and 2012, respectively. |
(b) | For 2014, ultimately declining to 5% for 2030 and thereafter . |
To determine the expected long-term rate of return on retiree life plan assets, we consider current and target asset allocations, historical and expected returns on various categories of plan assets, as well as expected benefit payments and resulting asset levels. In developing future return expectations for retiree benefit plan assets, we formulate views on the future economic environment, both in the U.S. and abroad. We evaluate general market trends and historical relationships among a number of key variables that impact asset class returns such as expected earnings growth, inflation, valuations, yields and spreads, using both internal and external sources. We also take into account expected volatility by asset class and diversification across classes to determine expected overall portfolio results given current and target allocations. Based on our analysis of future expectations of asset performance, past return results, our current and target asset allocations as well as a shorter time horizon for retiree life plan assets, we have assumed a 7.0% long-term expected return on those assets for cost recognition in 2015. We apply our expected rate of return to a market-related value of assets, which stabilizes variability in the amounts to which we apply that expected return.
The Society of Actuaries recently issued new mortality tables projecting longer life expectancies that will result in higher postretirement obligations for U.S. companies. We updated our mortality assumptions at December 31, 2014. The new mortality assumptions increased our principal retiree benefit plans' benefit obligations by $612 million at December 31, 2014.
We amortize experience gains and losses, as well as the effects of changes in actuarial assumptions and plan provisions, over a period no longer than the average future service of employees.
FUNDING POLICY
GE 2014 FORM 10-K 178
FINANCIAL STATEMENTS | POSTRETIREMENT BENEFIT PLANS |
Changes in the accumulated postretirement benefit obligation for retiree benefit plans follow.
ACCUMULATED POSTRETIREMENT BENEFIT OBLIGATION (APBO) | ||||||
(In millions) | 2014 | 2013 | ||||
Balance at January 1 | $ | 9,913 | $ | 11,804 | ||
Service cost for benefits earned | 164 | 229 | ||||
Interest cost on benefit obligations | 424 | 410 | ||||
Participant contributions | 52 | 52 | ||||
Plan amendments | (586) | - | ||||
Actuarial loss (gain) | 1,440 | (a) | (1,836) | (b) | ||
Benefits paid | (704) | (746) | ||||
Balance at December 31(c) | $ | 10,703 | $ | 9,913 | ||
(a) | Primarily associated with discount rate and mortality assumption changes. |
(b) | Primarily associated with discount rate change and lower costs from new healthcare supplier contracts. |
(c) | The APBO for the retiree health plans was $8,445 million and $7,626 million at year-end 2014 and 2013, respectively. |
A one percentage point change in the assumed healthcare cost trend rate would have the following effects.
1% | 1% | ||||
(In millions) | Increase | Decrease | |||
APBO at December 31, 2014 | $ | 977 | $ | (810) | |
Service and interest cost in 2014 | 56 | (47) | |||
PLAN ASSETS
The fair value of the classes of retiree benefit plans' investments is presented below. The inputs and valuation techniques used to measure the fair value of assets are consistently applied and described in Note 1.
FAIR VALUE OF PLAN ASSETS | |||||
(In millions) | 2014 | 2013 | |||
Balance at January 1 | $ | 903 | $ | 946 | |
Actual gain on plan assets | 44 | 118 | |||
Employer contributions | 518 | 533 | |||
Participant contributions | 52 | 52 | |||
Benefits paid | (704) | (746) | |||
Balance at December 31 | $ | 813 | $ | 903 | |
ASSET ALLOCATION | ||||
2014 | 2014 | |||
Target | Actual | |||
December 31 | allocation | allocation | ||
Equity securities(a) | 35 - 75 | %(b) | 50 | %(c) |
Debt securities (including cash equivalents) | 11 - 46 | 26 | ||
Private equities | 0 - 25 | 13 | ||
Real estate | 0 - 12 | 9 | ||
Other investments(d) | 0 - 10 | 2 | ||
(a) | Includes investment funds that primarily hold this type of asset. |
(b) | Target allocations were 18-38% for U.S. equity securities and 17-37% for non-U.S. equity securities. |
(c) | Actual allocations were 29% for U.S. equity securities and 21% for non-U.S. equity securities. |
(d) | Substantially all represented hedge fund investments. |
GE 2014 FORM 10-K 179
FINANCIAL STATEMENTS | POSTRETIREMENT BENEFIT PLANS |
Plan fiduciaries set investment policies and strategies for the trust and oversee its investment allocation, which includes selecting investment managers and setting long-term strategic targets. The primary strategic investment objectives are balancing investment risk and return and monitoring the plan's liquidity position in order to meet the near-term benefit payment and other cash needs. Target allocation percentages are established at an asset class level by plan fiduciaries. Target allocation ranges are guidelines, not limitations, and occasionally plan fiduciaries will approve allocations above or below a target range.
Short-term securities purchased must generally be rated A-1/P-1 or better, except for 15% of such securities that may be rated A-2/P-2 and other short-term securities as may be approved by the plan fiduciaries. According to statute, the aggregate holdings of all qualifying employer securities (e.g., GE common stock) and qualifying employer real property may not exceed 10% of the fair value of trust assets at the time of purchase. GE securities represented 3.9% and 4.0% of trust assets at year-end 2014 and 2013, respectively.
Retiree life plan assets were $813 million and $903 million at December 31, 2014 and 2013, respectively. Public equity and debt securities amounting to $615 million and $727 million represented approximately 78% and 77% of total investments at December 31, 2014 and 2013, respectively. The plans' investments were classified as 37% Level 1, 41% Level 2 and 22% Level 3 at December 31, 2014. The plans' investments were classified as 33% Level 1, 43% Level 2 and 24% Level 3 at December 31, 2013. The changes in Level 3 investments were insignificant for the years ended December 31, 2014 and 2013.
RETIREE BENEFIT ASSET(LIABILITY) | |||||
December 31 (In millions) | 2014 | 2013 | |||
Funded status(a) | $ | (9,890) | $ | (9,010) | |
Liability recorded in the Statement of Financial Position | |||||
Retiree health plans | |||||
Due within one year | $ | (518) | $ | (531) | |
Due after one year | (7,927) | (7,095) | |||
Retiree life plans | (1,445) | (1,384) | |||
Net liability recognized | $ | (9,890) | $ | (9,010) | |
Amounts recorded in shareowners' equity (unamortized) | |||||
Prior service cost (credit) | $ | (24) | $ | 963 | |
Net actuarial gain | (71) | (1,667) | |||
Total | $ | (95) | $ | (704) | |
| (a) | Fair value of assets less APBO, as shown in the preceding tables. |
In 2015, we estimate that we will amortize $125 million of prior service cost and $5 million of net actuarial loss from shareowners' equity into retiree benefit plans cost. Comparable amortized amounts in 2014 were $353 million of prior service cost and $150 million of net actuarial gain.
ESTIMATED FUTURE BENEFIT PAYMENTS | ||||||||||||||||||
2020 - | ||||||||||||||||||
(In millions) | 2015 | 2016 | 2017 | 2018 | 2019 | 2024 | ||||||||||||
$ | 680 | $ | 665 | $ | 670 | $ | 675 | $ | 685 | $ | 3,285 | |||||||
GE 2014 FORM 10-K 180
FINANCIAL STATEMENTS | ALL OTHER LIABILITIES |
POSTRETIREMENT BENEFIT PLANS | |||||||||||
2014 COST OF POSTRETIREMENT BENEFIT PLANS AND CHANGES IN OTHER COMPREHENSIVE INCOME | |||||||||||
Total | Principal | Other | Retiree | ||||||||
postretirement | pension | pension | benefit | ||||||||
(In millions) | benefit plans | plans | plans | plans | |||||||
Cost of postretirement benefit plans | $ | 4,805 | $ | 3,604 | $ | 412 | $ | 789 | |||
Changes in other comprehensive income | |||||||||||
Prior service cost – current year | (615) | - | (29) | (586) | |||||||
Net actuarial loss – current year(a) | 14,843 | 12,115 | 1,282 | 1,446 | |||||||
Net curtailment/settlement | (113) | (65) | - | (48) | |||||||
Prior service cost amortization | (573) | (214) | (6) | (353) | |||||||
Net actuarial gain (loss) amortization | (2,620) | (2,565) | (205) | 150 | |||||||
Total changes in other comprehensive income | 10,922 | 9,271 | 1,042 | 609 | |||||||
Cost of postretirement benefit plans and | |||||||||||
changes in other comprehensive income | $ | 15,727 | $ | 12,875 | $ | 1,454 | $ | 1,398 | |||
(a) | Principally associated with discount rate and mortality assumption changes. |
NOTE 13. ALL OTHER LIABILITIES
This caption includes liabilities for various items including non-current compensation and benefits, deferred income, interest on tax liabilities, unrecognized tax benefits, environmental remediation, asset retirement obligations, derivative instruments, product warranties and a variety of sundry items.
Accruals for non-current compensation and benefits amounted to $42,354 million and $27,853 million at December 31, 2014 and 2013, respectively. These amounts include compensation and benefit liabilities, such as postretirement benefits and deferred incentive compensation. See Note 12.
GE 2014 FORM 10-K 181
FINANCIAL STATEMENTS | INCOME TAXES |
NOTE 14. INCOME TAXES
GE and GECC file a consolidated U.S. federal income tax return. This enables GE to use GECC tax deductions and credits to reduce the tax that otherwise would have been payable by GE. The GECC effective tax rate for each period reflects the benefit of these tax reductions in the consolidated return. GE makes cash payments to GECC for these tax reductions at the time GE's tax payments are due.
(BENEFIT) PROVISION FOR INCOME TAXES | ||||||||
(In millions) | 2014 | 2013 | 2012 | |||||
GE | ||||||||
Current tax expense | $ | 2,110 | $ | 4,239 | $ | 2,307 | ||
Deferred tax expense (benefit) from temporary differences | (476) | (2,571) | (294) | |||||
1,634 | 1,668 | 2,013 | ||||||
GECC | ||||||||
Current tax expense (benefit) | 848 | (268) | 1,379 | |||||
Deferred tax expense (benefit) from temporary differences | (710) | (724) | (858) | |||||
138 | (992) | 521 | ||||||
Consolidated | ||||||||
Current tax expense | 2,958 | 3,971 | 3,686 | |||||
Deferred tax expense (benefit) from temporary differences | (1,186) | (3,295) | (1,152) | |||||
Total | $ | 1,772 | $ | 676 | $ | 2,534 | ||
CONSOLIDATED EARNINGS FROM CONTINUING OPERATIONS BEFORE INCOME TAXES | ||||||||
(In millions) | 2014 | 2013 | 2012 | |||||
U.S. earnings | $ | 5,421 | $ | 6,099 | $ | 8,309 | ||
Non-U.S. earnings | 11,808 | 10,052 | 9,072 | |||||
Total | $ | 17,229 | $ | 16,151 | $ | 17,381 | ||
CONSOLIDATED (BENEFIT) PROVISION FOR INCOME TAXES | |||||||||
(In millions) | 2014 | 2013 | 2012 | ||||||
U.S. Federal | |||||||||
Current(a) | $ | 51 | $ | 85 | $ | 685 | |||
Deferred | (177) | (2,315) | (414) | ||||||
Non - U.S. | |||||||||
Current | 2,978 | 3,659 | 2,871 | ||||||
Deferred | (849) | (1,038) | (773) | ||||||
Other | (231) | 285 | 165 | ||||||
Total | $ | 1,772 | $ | 676 | $ | 2,534 | |||
(a) | Includes the benefit from GECC deductions and credits applied against GE's current U.S. tax expense. |
GE 2014 FORM 10-K 182
FINANCIAL STATEMENTS | INCOME TAXES |
Our businesses are subject to regulation under a wide variety of U.S. federal, state and foreign tax laws, regulations and policies. Changes to these laws or regulations may affect our tax liability, return on investments and business operations. For example, GE's effective tax rate is reduced because active business income earned and indefinitely reinvested outside the United States is taxed at less than the U.S. rate. A significant portion of this reduction depends upon a provision of U.S. tax law that defers the imposition of U.S. tax on certain active financial services income until that income is repatriated to the United States as a dividend. This provision is consistent with international tax norms and permits U.S. financial services companies to compete more effectively with non-U.S. financial institutions in global markets. This provision, which had expired at the end of 2013, was reinstated in December 2014 retroactively for one year through the end of 2014. The provision also had been scheduled to expire and had been extended by Congress on seven previous occasions, but there can be no assurance that it will continue to be extended. In the event the provision is not extended after 2014, the current U.S. tax imposed on active financial services income earned outside the United States would increase, making it more difficult for U.S. financial services companies to compete in global markets. If this provision is not extended, we expect our effective tax rate to increase significantly after 2015.
RECONCILIATION OF U.S. FEDERAL STATUTORY INCOME TAX RATE TO ACTUAL INCOME TAX RATE | ||||||||||||||||||
Consolidated | GE | GECC | ||||||||||||||||
2014 | 2013 | 2012 | 2014 | 2013 | 2012 | 2014 | 2013 | 2012 | ||||||||||
U.S. federal statutory income tax rate | 35.0 | % | 35.0 | % | 35.0 | % | 35.0 | % | 35.0 | % | 35.0 | % | 35.0 | % | 35.0 | % | 35.0 | % |
Increase (reduction) in rate resulting from | ||||||||||||||||||
inclusion of after-tax earnings of GECC in | ||||||||||||||||||
before-tax earnings of GE | - | - | - | (15.2) | (16.9) | (15.3) | - | - | - | |||||||||
Tax on global activities including exports(a) | (18.4) | (24.7) | (12.5) | (7.9) | (4.1) | (4.3) | (24.1) | (45.0) | (18.4) | |||||||||
U.S. business credits(b) | (2.6) | (3.6) | (2.6) | (0.6) | (1.5) | (0.7) | (4.6) | (4.6) | (4.3) | |||||||||
Business Property disposition | - | - | (1.9) | - | - | - | - | - | (4.2) | |||||||||
All other – net | (3.7) | (2.5) | (3.4) | (1.6) | (2.7) | (2.7) | (4.5) | 1.0 | (1.5) | |||||||||
(24.7) | (30.8) | (20.4) | (25.3) | (25.2) | (23.0) | (33.2) | (48.6) | (28.4) | ||||||||||
Actual income tax rate | 10.3 | % | 4.2 | % | 14.6 | % | 9.7 | % | 9.8 | % | 12.0 | % | 1.8 | % | (13.6) | % | 6.6 | % |
(a) | Included (1.7)% and (3.8)% in consolidated and GECC, respectively, related to the sale of GEMB-Nordic in 2014 and (6.0)% and (13.3)% in consolidated and GECC, respectively, related to the sale of 68.5% of our Swiss consumer finance bank, Cembra Money Bank AG (Cembra), through an initial public offering in 2013. |
(b) | U.S. general business credits, primarily the credit for manufacture of energy efficient appliances, the credit for energy produced from renewable sources, the advanced energy project credit, the low-income housing credit and the credit for research performed in the U.S. |
UNRECOGNIZED TAX POSITIONS
Annually, we file over 5,500 income tax returns in over 250 global taxing jurisdictions. We are under examination or engaged in tax litigation in many of these jurisdictions. During 2013, the Internal Revenue Service (IRS) completed the audit of our consolidated U.S. income tax returns for 2008-2009, except for certain issues that remain under examination. At December 31, 2014, the IRS was auditing our consolidated U.S. income tax returns for 2010-2011. In addition, certain other U.S. tax deficiency issues and refund claims for previous years were unresolved. The IRS has disallowed the tax loss on our 2003 disposition of ERC Life Reinsurance Corporation. We have contested the disallowance of this loss. It is reasonably possible that the unresolved items could be resolved during the next 12 months, which could result in a decrease in our balance of "unrecognized tax benefits" – that is, the aggregate tax effect of differences between tax return positions and the benefits recognized in our financial statements. We believe that there are no other jurisdictions in which the outcome of unresolved issues or claims is likely to be material to our results of operations, financial position or cash flows. We further believe that we have made adequate provision for all income tax uncertainties. Resolution of audit matters, including the IRS audit of our consolidated U.S. income tax returns for 2008-2009, reduced our 2013 consolidated income tax rate by 2.8 percentage points.
GE 2014 FORM 10-K 183
FINANCIAL STATEMENTS | INCOME TAXES |
The balance of unrecognized tax benefits, the amount of related interest and penalties we have provided and what we believe to be the range of reasonably possible changes in the next 12 months were:
UNRECOGNIZED TAX BENEFITS | |||||
December 31 (In millions) | 2014 | 2013 | |||
Unrecognized tax benefits | $ | 5,619 | $ | 5,816 | |
Portion that, if recognized, would reduce tax expense and effective tax rate(a) | 4,059 | 4,307 | |||
Accrued interest on unrecognized tax benefits | 807 | 975 | |||
Accrued penalties on unrecognized tax benefits | 103 | 164 | |||
Reasonably possible reduction to the balance of unrecognized tax benefits in succeeding 12 months | 0-900 | 0-900 | |||
Portion that, if recognized, would reduce tax expense and effective tax rate(a) | 0-300 | 0-350 | |||
| (a) | Some portion of such reduction may be reported as discontinued operations. |
UNRECOGNIZED TAX BENEFITS RECONCILIATION | |||||
(In millions) | 2014 | 2013 | |||
Balance at January 1, | $ | 5,816 | $ | 5,445 | |
Additions for tax positions of the current year | 234 | 771 | |||
Additions for tax positions of prior years | 673 | 872 | |||
Reductions for tax positions of prior years | (761) | (1,140) | |||
Settlements with tax authorities | (305) | (98) | |||
Expiration of the statute of limitations | (38) | (34) | |||
Balance at December 31 | $ | 5,619 | $ | 5,816 | |
We classify interest on tax deficiencies as interest expense; we classify income tax penalties as provision for income taxes. For the years ended December 31, 2014, 2013 and 2012, $(68) million, $22 million and $(45) million of interest expense (income), respectively, and $(45) million, an insignificant amount and $33 million of tax expense (income) related to penalties, respectively, were recognized in the Statement of Earnings.
DEFERRED INCOME TAXES
Deferred income tax balances reflect the effects of temporary differences between the carrying amounts of assets and liabilities and their tax bases, as well as from net operating loss and tax credit carryforwards, and are stated at enacted tax rates expected to be in effect when taxes are actually paid or recovered. Deferred income tax assets represent amounts available to reduce income taxes payable on taxable income in future years. We evaluate the recoverability of these future tax deductions and credits by assessing the adequacy of future expected taxable income from all sources, including reversal of taxable temporary differences, forecasted operating earnings and available tax planning strategies. To the extent we do not consider it more likely than not that a deferred tax asset will be recovered, a valuation allowance is established.
GE 2014 FORM 10-K 184
FINANCIAL STATEMENTS | INCOME TAXES |
Aggregated deferred income tax amounts are summarized below.
December 31 (In millions) | 2014 | 2013 | |||
Assets | |||||
GE | $ | 19,942 | $ | 15,284 | |
GECC | 12,546 | 13,224 | |||
32,488 | 28,508 | ||||
Liabilities | |||||
GE | (11,170) | (10,223) | |||
GECC | (18,777) | (18,010) | |||
(29,947) | (28,233) | ||||
Net deferred income tax asset (liability) | $ | 2,541 | $ | 275 | |
COMPONENTS OF THE NET DEFERRED INCOME TAX ASSET (LIABILITY) | |||||
December 31 (In millions) | 2014 | 2013 | |||
GE | |||||
Principal pension plans | $ | 7,859 | $ | 3,436 | |
Provision for expenses(a) | 6,192 | 5,934 | |||
Retiree insurance plans | 3,462 | 3,154 | |||
Non-U.S. loss carryforwards(b) | 738 | 874 | |||
Contract costs and estimated earnings | (3,996) | (3,550) | |||
Intangible assets | (2,364) | (2,268) | |||
Depreciation | (1,226) | (1,079) | |||
Investment in global subsidiaries | (979) | (1,077) | |||
Other – net | (914) | (363) | |||
8,772 | 5,061 | ||||
GECC | |||||
Operating leases | (6,351) | (6,284) | |||
Financing leases | (4,046) | (4,075) | |||
Intangible assets | (1,963) | (1,943) | |||
Net unrealized gains (losses) on securities | (507) | (145) | |||
Cash flow hedges | (162) | (163) | |||
Non-U.S. loss carryforwards(b) | 4,094 | 3,791 | |||
Allowance for losses | 2,186 | 2,640 | |||
Investment in global subsidiaries | 1,935 | 1,883 | |||
Other – net | (1,417) | (490) | |||
(6,231) | (4,786) | ||||
Net deferred income tax asset (liability) | $ | 2,541 | $ | 275 | |
| (a) | Represented the tax effects of temporary differences related to expense accruals for a wide variety of items, such as employee compensation and benefits, other pension plan liabilities, interest on tax liabilities, product warranties and other sundry items that are not currently deductible. |
| (b) | Net of valuation allowances of $2,015 million and $2,089 million for GE and $880 million and $862 million for GECC, for 2014 and 2013, respectively. Of the net deferred tax asset as of December 31, 2014, of $4,832 million, $47 million relates to net operating loss carryforwards that expire in various years ending from December 31, 2015 through December 31, 2017; $166 million relates to net operating losses that expire in various years ending from December 31, 2018 through December 31, 2034 and $4,619 million relates to net operating loss carryforwards that may be carried forward indefinitely . |
GE 2014 FORM 10-K 185
FINANCIAL STATEMENTS | SHAREOWNER'S EQUITY |
NOTE 15. SHAREOWNERS' EQUITY
(In millions) | 2014 | 2013 | 2012 | |||||
Preferred stock issued | $ | - | $ | - | $ | - | ||
Common stock issued | $ | 702 | $ | 702 | $ | 702 | ||
Accumulated other comprehensive income | ||||||||
Balance at January 1 | $ | (9,120) | $ | (20,230) | $ | (23,974) | ||
Other comprehensive income before reclassifications | (12,087) | 8,844 | 841 | |||||
Reclassifications from other comprehensive income | 3,035 | 2,266 | 2,903 | |||||
Other comprehensive income, net, attributable to GE | (9,052) | 11,110 | 3,744 | |||||
Balance at December 31 | $ | (18,172) | $ | (9,120) | $ | (20,230) | ||
Other capital | ||||||||
Balance at January 1 | $ | 32,494 | $ | 33,070 | $ | 33,693 | ||
Gains (losses) on treasury stock dispositions and other(a) | 395 | (576) | (623) | |||||
Balance at December 31 | $ | 32,889 | $ | 32,494 | $ | 33,070 | ||
Retained earnings | ||||||||
Balance at January 1 | $ | 149,051 | $ | 144,055 | $ | 137,786 | ||
Net earnings attributable to the Company | 15,233 | 13,057 | 13,641 | |||||
Dividends and other transactions with shareowners | (8,951) | (8,061) | (7,372) | |||||
Balance at December 31 | $ | 155,333 | $ | 149,051 | $ | 144,055 | ||
Common stock held in treasury | ||||||||
Balance at January 1 | $ | (42,561) | $ | (34,571) | $ | (31,769) | ||
Purchases | (1,950) | (10,466) | (5,295) | |||||
Dispositions | 1,918 | 2,476 | 2,493 | |||||
Balance at December 31 | $ | (42,593) | $ | (42,561) | $ | (34,571) | ||
Total equity | ||||||||
GE shareowners' equity balance at December 31 | $ | 128,159 | $ | 130,566 | $ | 123,026 | ||
Noncontrolling interests balance at December 31 | 8,674 | 6,217 | 5,444 | |||||
Total equity balance at December 31 | $ | 136,833 | $ | 136,783 | $ | 128,470 | ||
| (a) | 2014 included $440 million related to the excess of the net proceeds from the Synchrony Financial IPO over the carrying value of the interest sold. |
SHARES OF GE PREFERRED STOCK
On October 16, 2008, we issued 30,000 shares of 10% cumulative perpetual preferred stock (par value $1.00 per share) having an aggregate liquidation value of $3,000 million, and warrants to purchase 134,831,460 shares of common stock (par value $0.06 per share) to Berkshire Hathaway Inc. (Berkshire Hathaway) for net proceeds of $2,965 million in cash. The proceeds were allocated to the preferred shares ($2,494 million) and the warrants ($471 million) on a relative fair value basis and recorded in other capital. The warrants were exercisable through October 16, 2013, at an exercise price of $22.25 per share of common stock and were to be settled through physical share issuance. The terms of the warrants were amended in January 2013 to allow for net share settlement where the total number of issued shares is based on the amount by which the average market price of GE common stock over the 20 trading days preceding the date of exercise exceeds the exercise price of $22.25. On October 16, 2013, Berkshire Hathaway Inc. (Berkshire Hathaway) exercised in full their warrants to purchase shares of GE common stock and on October 17, 2013, GE delivered 10.7 million shares to Berkshire Hathaway. The transaction had equal and offsetting effects on other capital and common stock held in treasury.
The preferred stock was redeemable at our option three years after issuance at a price of 110% of liquidation value plus accrued and unpaid dividends. On September 13, 2011, we provided notice to Berkshire Hathaway that we would redeem the shares for the stated redemption price of $3,300 million, plus accrued and unpaid dividends. In connection with this notice, we recognized a preferred dividend of $806 million (calculated as the difference between the carrying value and redemption value of the preferred stock), which was recorded as a reduction to earnings attributable to common shareowners and common shareowners' equity. The preferred shares were redeemed on October 17, 2011.
GE has 50 million authorized shares of preferred stock ($1.00 par value). No shares were issued and outstanding as of December 31, 2014 and 2013.
GE 2014 FORM 10-K 186
>
FINANCIAL STATEMENTS | SHAREOWNER'S EQUITY |
SHARES OF GE COMMON STOCK
On December 14, 2012, we increased the existing authorization by $10 billion to $25 billion for our share repurchase program and extended the program (which would have otherwise expired on December 31, 2013) through 2015. On February 12, 2013, we increased the existing authorization by an additional $10 billion resulting in authorization to repurchase up to a total of $35 billion of our common stock through 2015. Under this program, on a book basis, we repurchased shares of 73.6 million, 432.6 million and 248.6 million for a total of $1,901 million, $10,375 million and $5,185 million for the years ended 2014, 2013 and 2012 respectively.
GE's authorized common stock consists of 13,200,000,000 shares having a par value of $0.06 each.
Common shares issued and outstanding are summarized in the following table.
December 31 (In thousands) | 2014 | 2013 | 2012 | |||
Issued | 11,693,841 | 11,693,841 | 11,693,841 | |||
In treasury | (1,636,461) | (1,632,960) | (1,288,216) | |||
Outstanding | 10,057,380 | 10,060,881 | 10,405,625 |
GE 2014 FORM 10-K 187
FINANCIAL STATEMENTS | SHAREOWNER'S EQUITY |
| |||||||||
ACCUMULATED OTHER COMPREHENSIVE INCOME (LOSS) | |||||||||
(In millions) | 2014 | 2013 | 2012 | ||||||
Investment securities | |||||||||
Balance at January 1 | $ | 307 | $ | 677 | $ | (30) | |||
Other comprehensive income (loss) (OCI) before reclassifications – | |||||||||
net of deferred taxes of $353, $(407) and $387 (a) | 562 | (692) | 683 | ||||||
Reclassifications from OCI – net of deferred taxes | |||||||||
of $84, $222 and $13 | 146 | 318 | 22 | ||||||
Other comprehensive income (loss)(b) | 708 | (374) | 705 | ||||||
Less OCI attributable to noncontrolling interests | 2 | (4) | (2) | ||||||
Balance at December 31 | $ | 1,013 | $ | 307 | $ | 677 | |||
Currency translation adjustments (CTA) | |||||||||
Balance at January 1(c) | $ | 283 | $ | 412 | $ | 133 | |||
OCI before reclassifications – net of deferred taxes | (2,600) | 510 | 474 | ||||||
of $(129), $(613) and $(266) | |||||||||
Reclassifications from OCI – net of deferred taxes | |||||||||
of $213, $793 and $54 | (129) | (818) | (174) | ||||||
Other comprehensive income (loss)(b) | (2,729) | (308) | 300 | ||||||
Less OCI attributable to noncontrolling interests | (19) | (22) | 21 | ||||||
Balance at December 31 | $ | (2,427) | $ | 126 | $ | 412 | |||
Cash flow hedges | |||||||||
Balance at January 1(c) | $ | (414) | $ | (722) | $ | (1,176) | |||
OCI before reclassifications – net of deferred taxes | (610) | 738 | 385 | ||||||
of $23, $250 and $392 | |||||||||
Reclassifications from OCI – net of deferred taxes | |||||||||
of $34, $(177) and $(245) | 844 | (271) | 68 | ||||||
Other comprehensive income (loss)(b) | 234 | 467 | 453 | ||||||
Less OCI attributable to noncontrolling interests | - | 2 | (1) | ||||||
Balance at December 31 | $ | (180) | $ | (257) | $ | (722) | |||
Benefit plans | |||||||||
Balance at January 1 | $ | (9,296) | $ | (20,597) | $ | (22,901) | |||
Prior service credit (costs) - net of deferred taxes | |||||||||
of $219, $(5) and $304 | 396 | (6) | 534 | ||||||
Net actuarial gain (loss) – net of deferred taxes | |||||||||
of $(5,332), $4,506 and $(574) | (9,849) | 8,269 | (1,396) | ||||||
Net curtailment/settlement - net of deferred taxes | |||||||||
of $41, $0 and $123 | 72 | - | 174 | ||||||
Prior service cost amortization – net of deferred taxes | |||||||||
of $241, $267 and $326 | 349 | 397 | 497 | ||||||
Net actuarial loss amortization – net of deferred taxes | |||||||||
of $859, $1,343 and $1,278 | 1,753 | 2,640 | 2,490 | ||||||
Other comprehensive income (loss)(b) | (7,279) | 11,300 | 2,299 | ||||||
Less OCI attributable to noncontrolling interests | 3 | (1) | (5) | ||||||
Balance at December 31 | $ | (16,578) | $ | (9,296) | $ | (20,597) | |||
Accumulated other comprehensive income (loss) at December 31 | $ | (18,172) | $ | (9,120) | $ | (20,230) | |||
| (a) | Includes adjustments of $960 million, $(1,171) million and $527 million in 2014, 2013 and 2012, respectively, to deferred acquisition costs, present value of future profits, and investment contracts, insurance liabilities and insurance annuity benefits in our run-off insurance operations to reflect the effects that would have been recognized had the related unrealized investment securities holding gains and losses actually been realized. |
| (b) | Total other comprehensive income (loss) was $(9,066) million, $11,085 million and $3,757 million in 2014, 2013 and 2012, respectively. |
| (c) | Includes a $157 million reclassification between 2014 opening balances in Currency Translation Adjustments and Cash Flow Hedges. |
GE 2014 FORM 10-K 188
FINANCIAL STATEMENTS | SHAREOWNER'S EQUITY |
RECLASSIFICATION OUT OF AOCI | ||||||||||
(In millions) | 2014 | 2013 | 2012 | Statement of Earnings Caption | ||||||
Available-for-sale securities | ||||||||||
Realized gains (losses) on | ||||||||||
sale/impairment of securities | $ | (230) | $ | (540) | $ | (35) | Other income | |||
84 | 222 | 13 | Benefit (provision) for income taxes | |||||||
$ | (146) | $ | (318) | $ | (22) | Net of tax | ||||
Currency translation adjustments | ||||||||||
Gains (losses) on dispositions | $ | (84) | $ | 25 | $ | 120 | Costs and expenses | |||
213 | 793 | 54 | Benefit (provision) for income taxes | |||||||
$ | 129 | $ | 818 | $ | 174 | Net of tax | ||||
Cash flow hedges | ||||||||||
Gains (losses) on interest rate derivatives | $ | (234) | $ | (364) | $ | (499) | Interest and other financial charges | |||
Foreign exchange contracts | (666) | 564 | 792 | (a) | ||||||
Other | 22 | 248 | (116) | (b) | ||||||
(878) | 448 | 177 | Total before tax | |||||||
34 | (177) | (245) | Benefit (provision) for income taxes | |||||||
$ | (844) | $ | 271 | $ | (68) | Net of tax | ||||
Benefit plan items | ||||||||||
Curtailment loss | $ | (113) | $ | - | $ | - | (c) | |||
Amortization of prior service costs | (590) | (664) | (823) | (c) | ||||||
Amortization of actuarial gains (losses) | (2,612) | (3,983) | (3,768) | (c) | ||||||
(3,315) | (4,647) | (4,591) | Total before tax | |||||||
1,141 | 1,610 | 1,604 | Benefit (provision) for income taxes | |||||||
$ | (2,174) | $ | (3,037) | $ | (2,987) | Net of tax | ||||
Total reclassification adjustments | $ | (3,035) | $ | (2,266) | $ | (2,903) | Net of tax | |||
(a) | Included $(607) million, $608 million and $894 million in GECC revenues from services and $(59) million, $(44) million and $(102) million in interest and other financial charges in 2014, 2013 and 2012, respectively. |
(b) | Primarily recorded in costs and expenses. |
(c) | Curtailment loss, amortization of prior service costs and actuarial gains and losses out of AOCI are included in the computation of net periodic pension costs. See Note 12 for further information. |
NONCONTROLLING INTERESTS
Noncontrolling interests in equity of consolidated affiliates includes common shares in consolidated affiliates and preferred stock issued by our affiliates.
GECC preferred stock is presented as noncontrolling interests in the GE consolidated Statement of Financial Position. GECC preferred stock dividends are presented as noncontrolling interests in the GE consolidated Statement of Earnings. The balance is summarized as follows.
December 31 (In millions) | 2014 | 2013 | |||
|
|
|
|
|
|
GECC preferred stock | $ | 4,950 |
| $ | 4,950 |
Synchrony Financial | 2,531 | - | |||
Other noncontrolling interests in consolidated affiliates(a) |
| 1,193 |
|
| 1,267 |
Total | $ | 8,674 |
| $ | 6,217 |
| (a) | Consisted of a number of individually insignificant noncontrolling interests in partnerships and consolidated affiliates. |
GE 2014 FORM 10-K 189
FINANCIAL STATEMENTS | SHAREOWNER'S EQUITY |
CHANGES TO NONCONTROLLING INTERESTS | |||||||||
(In millions) | 2014 | 2013 | 2012 | ||||||
Beginning balance | $ | 6,217 | $ | 5,444 | $ | 1,696 | |||
Net earnings | 183 | 298 | 223 | ||||||
GECC issuance of preferred stock | - | 990 | 3,960 | ||||||
GECC preferred stock dividend | (322) | (298) | (123) | ||||||
Dividends | (74) | (80) | (42) | ||||||
Dispositions | (81) | (175) | - | ||||||
Synchrony Financial IPO | 2,393 | - | - | ||||||
Other (including AOCI) (a) | 358 | 38 | (270) | ||||||
Ending balance | $ | 8,674 | $ | 6,217 | $ | 5,444 | |||
(a) | Includes research & development partner funding arrangements, acquisitions and eliminations. |
OTHER
During the second quarter of 2013, GECC issued 10,000 shares of non-cumulative perpetual preferred stock with a $0.01 par value for proceeds of $990 million. The preferred shares bear an initial fixed interest rate of 5.25% through June 15, 2023, bear a floating rate equal to three-month LIBOR plus 2.967% thereafter and are callable on June 15, 2023. Dividends on the GECC preferred stock are payable semiannually, in June and December, with the first payment on this issuance made in December 2013.
During 2012, GECC issued 40,000 shares of non-cumulative perpetual preferred stock with a $0.01 par value for proceeds of $3,960 million. Of these shares, 22,500 bear an initial fixed interest rate of 7.125% through June 15, 2022, bear a floating rate equal to three-month LIBOR plus 5.296% thereafter and are callable on June 15, 2022, and 17,500 shares bear an initial fixed interest rate of 6.25% through December 15, 2022, bear a floating rate equal to three-month LIBOR plus 4.704% thereafter and are callable on December 15, 2022. Dividends on the GECC preferred stock are payable semi-annually, in June and December, with the first payment made in December 2012.
GE 2014 FORM 10-K 190
FINANCIAL STATEMENTS | OTHER STOCK-RELATED INFORMATION |
NOTE 16. OTHER STOCK-RELATED INFORMATION
We grant stock options, restricted stock units (RSUs) and performance share units (PSUs) to employees under the 2007 Long-Term Incentive Plan. This plan replaced the 1990 Long-Term Incentive Plan. In addition, we grant options and RSUs in limited circumstances to consultants, advisors and independent contractors under a plan approved by our Board of Directors in 1997 (the Consultants' Plan). Share requirements for all plans may be met from either unissued or treasury shares. Stock options expire 10 years from the date they are granted and vest over service periods that range from one to five years. RSUs give the recipients the right to receive shares of our stock upon the vesting of their related restrictions. Restrictions on RSUs vest in various increments and at various dates, beginning after one year from date of grant through grantee retirement. Although the plan permits us to issue RSUs settleable in cash, we have only issued RSUs settleable in shares of our stock. PSUs give recipients the right to receive shares of our stock upon the achievement of certain performance targets.
All grants of GE options under all plans must be approved by the Management Development and Compensation Committee, which consists entirely of independent directors.
STOCK COMPENSATION PLANS | ||||||||
Securities | ||||||||
to be | Weighted | Securities | ||||||
issued | average | available | ||||||
upon | exercise | for future | ||||||
December 31, 2014 (Shares in thousands) | exercise | price | issuance | |||||
Approved by shareowners | ||||||||
Options | 500,948 | $ | 20.92 | (a) | ||||
RSUs | 14,896 | (b) | (a) | |||||
PSUs | 1,000 | (b) | (a) | |||||
Not approved by shareowners (Consultants' Plan) | ||||||||
Options | 338 | 25.32 | (c) | |||||
RSUs | - | (b) | (c) | |||||
Total | 517,182 | $ | 20.92 | 327,525 | ||||
| (a) | In 2007, the Board of Directors approved the 2007 Long-Term Incentive Plan (the Plan), which replaced the 1990 Long-Term Incentive Plan. During 2012, an amendment was approved to increase the number of shares authorized for issuance under the Plan from 500 million shares to 925 million shares. No more than 230 million of the total number of authorized shares may be available for awards granted in any form provided under the Plan other than options or stock appreciation rights. Total shares available for future issuance under the Plan amounted to 299.3 million shares at December 31, 2014. |
| (b) | Not applicable. |
| (c) | Total shares available for future issuance under the Consultants' Plan amount to 28.2 million shares. |
GE 2014 FORM 10-K 191
>
FINANCIAL STATEMENTS | OTHER STOCK-RELATED INFORMATION |
The following table summarizes information about stock options outstanding at December 31, 2014.
STOCK OPTIONS OUTSTANDING | ||||||||||||||
Outstanding | Exercisable | |||||||||||||
Average | Average | |||||||||||||
Shares | Average | exercise | Shares | exercise | ||||||||||
Exercise price range | (In thousands) | life(a) | price | (In thousands) | price | |||||||||
Under $10.00 | 28,484 | 3.9 | $ | 9.57 | 28,484 | $ | 9.57 | |||||||
10.01-15.00 | 46,905 | 4.2 | 11.98 | 46,905 | 11.98 | |||||||||
15.01-20.00 | 158,534 | 5.7 | 17.46 | 113,286 | 17.32 | |||||||||
20.01-25.00 | 132,295 | 7.9 | 22.55 | 50,587 | 22.25 | |||||||||
25.01-30.00 | 100,668 | 8.5 | 26.51 | 19,039 | 28.22 | |||||||||
30.01-35.00 | 21,712 | 1.2 | 34.10 | 21,712 | 34.10 | |||||||||
Over $35.00 | 12,688 | 2.4 | 38.67 | 12,688 | 38.57 | |||||||||
Total | 501,286 | 6.3 | $ | 20.92 | 292,701 | $ | 19.44 | |||||||
| (a) | Weighted average contractual life remaining in years. |
At year-end 2013, options with a weighted average exercise price of $20.15 were exercisable on 254 million shares.
STOCK OPTION ACTIVITY | |||||||||||
Weighted | |||||||||||
Weighted | average | Aggregate | |||||||||
average | remaining | intrinsic | |||||||||
Shares | exercise | contractual | value | ||||||||
(In thousands) | price | term (In years) | (In millions) | ||||||||
Outstanding at January 1, 2014 | 473,611 | $ | 20.02 | ||||||||
Granted | 82,142 | 26.11 | |||||||||
Exercised | (30,433) | 14.42 | |||||||||
Forfeited | (7,414) | 21.89 | |||||||||
Expired | (16,620) | 32.40 | |||||||||
Outstanding at December 31, 2014 | 501,286 | $ | 20.92 | 6.3 | $ | 2,668 | |||||
Exercisable at December 31, 2014 | 292,701 | $ | 19.44 | 4.9 | $ | 2,124 | |||||
Options expected to vest | 189,186 | $ | 22.97 | 8.3 | $ | 496 | |||||
We measure the fair value of each stock option grant at the date of grant using a Black-Scholes option pricing model. The weighted average grant-date fair value of options granted during 2014, 2013 and 2012 was $5.26, $4.52 and $3.80, respectively. The following assumptions were used in arriving at the fair value of options granted during 2014, 2013 and 2012, respectively: risk-free interest rates of 2.3%, 2.5% and 1.3%; dividend yields of 3.1%, 4.0% and 4.0%; expected volatility of 26%, 28% and 29%; and expected lives of 7.3 years, 7.5 years and 7.8 years. Risk-free interest rates reflect the yield on zero-coupon U.S. Treasury securities. Expected dividend yields presume a set dividend rate and we used a historical five-year average for the dividend yield. Expected volatilities are based on implied volatilities from traded options and historical volatility of our stock. The expected option lives are based on our historical experience of employee exercise behavior.
The total intrinsic value of options exercised during 2014, 2013 and 2012 amounted to $360 million, $392 million and $265 million, respectively. As of December 31, 2014, there was $739 million of total unrecognized compensation cost related to non-vested options. That cost is expected to be recognized over a weighted average period of 2 years, of which approximately $185 million after tax is expected to be recognized in 2015.
Stock option expense recognized in net earnings during 2014, 2013 and 2012 amounted to $215 million, $231 million and $220 million, respectively. Cash received from option exercises during 2014, 2013 and 2012 was $439 million, $490 million and $355 million, respectively. The tax benefit realized from stock options exercised during 2014, 2013 and 2012 was $118 million, $128 million and $88 million, respectively.
GE 2014 FORM 10-K 192
FINANCIAL STATEMENTS | OTHER INCOME |
OTHER STOCK-BASED COMPENSATION | |||||||||||
Weighted | |||||||||||
Weighted | average | Aggregate | |||||||||
average | remaining | intrinsic | |||||||||
Shares | grant date | contractual | value | ||||||||
(In thousands) | fair value | term (In years) | (In millions) | ||||||||
RSUs outstanding at January 1, 2014 | 13,572 | $ | 22.58 | ||||||||
Granted | 5,016 | 26.08 | |||||||||
Vested | (3,305) | 21.70 | |||||||||
Forfeited | (387) | 22.31 | |||||||||
RSUs outstanding at December 31, 2014 | 14,896 | $ | 24.00 | 2.5 | $ | 376 | |||||
RSUs expected to vest | 13,667 | $ | 21.94 | 2.2 | $ | 345 | |||||
The fair value of each restricted stock unit is the market price of our stock on the date of grant. The weighted average grant date fair value of RSUs granted during 2014, 2013 and 2012 was $26.08, $24.54 and $20.79, respectively. The total intrinsic value of RSUs vested during 2014, 2013 and 2012 amounted to $86 million, $109 million and $116 million, respectively. As of December 31, 2014, there was $233 million of total unrecognized compensation cost related to non-vested RSUs. That cost is expected to be recognized over a weighted average period of 2 years, of which approximately $54 million after tax is expected to be recognized in 2015. As of December 31, 2014, 1 million PSUs with a weighted average remaining contractual term of 1.5 years, an aggregate intrinsic value of $25 million and $9 million of unrecognized compensation cost were outstanding. Other share-based compensation expense for RSUs and PSUs recognized in net earnings amounted to $56 million, $62 million and $79 million in 2014, 2013 and 2012, respectively.
The income tax benefit recognized in earnings based on the compensation expense recognized for all share-based compensation arrangements amounted to $147 million, $145 million and $153 million in 2014, 2013 and 2012, respectively. The excess of actual tax deductions over amounts assumed, which are recognized in shareowners' equity, were $86 million $86 million and $53 million in 2014, 2013 and 2012, respectively.
When stock options are exercised and restricted stock vests, the difference between the assumed tax benefit and the actual tax benefit must be recognized in our financial statements. In circumstances in which the actual tax benefit is lower than the estimated tax benefit, that difference is recorded in equity, to the extent there are sufficient accumulated excess tax benefits. At December 31, 2014, our accumulated excess tax benefits are sufficient to absorb any future differences between actual and estimated tax benefits for all of our outstanding option and restricted stock grants.
NOTE 17. OTHER INCOME
(In millions) | 2014 | 2013 | 2012 | |||||
GE | ||||||||
Licensing and royalty income | $ | 288 | $ | 320 | $ | 290 | ||
Purchases and sales of business interests(a) | 188 | 1,750 | 574 | |||||
Associated companies(b) | 176 | 40 | 1,545 | |||||
Net interest and investment income(c) | (77) | 116 | 196 | |||||
Other items(d) | 132 | 660 | 52 | |||||
707 | 2,886 | 2,657 | ||||||
Eliminations | 71 | 222 | (94) | |||||
Total | $ | 778 | $ | 3,108 | $ | 2,563 | ||
| (a) | Included a pre-tax gain of $1,096 million on the sale of our 49% common equity interest in NBCU LLC in 2013. See Note 2. |
| (b) | Included income of $1,416 million from our former equity method investment in NBCU LLC in 2012. |
| (c) | Included other-than-temporary impairments on investment securities of $217 million in 2014. |
| (d) | Included net gains on asset sales of $127 million in 2014 and $357 million in 2013. |
GE 2014 FORM 10-K 193
FINANCIAL STATEMENTS | GECC REVENUES & SUPPLEMENTAL COST INFORMATION |
NOTE 18. GECC REVENUES FROM SERVICES
(In millions) | 2014 | 2013 | 2012 | |||||
Interest on loans | $ | 17,324 | $ | 17,951 | $ | 18,843 | ||
Equipment leased to others | 9,940 | 9,804 | 10,456 | |||||
Fees | 4,618 | 4,720 | 4,709 | |||||
Investment income(a) | 2,271 | 1,809 | 2,630 | |||||
Financing leases | 1,416 | 1,667 | 1,888 | |||||
Associated companies(b) | 1,182 | 1,809 | 1,538 | |||||
Premiums earned by insurance activities | 1,509 | 1,573 | 1,715 | |||||
Real estate investments(c) | 1,727 | 2,528 | 1,709 | |||||
Other items(a)(d) | 2,617 | 2,080 | 1,757 | |||||
42,604 | 43,941 | 45,245 | ||||||
Eliminations | (1,551) | (1,546) | (1,273) | |||||
Total | $ | 41,053 | $ | 42,395 | $ | 43,972 | ||
| (a) | Included net other-than-temporary impairments on investment securities of $(173) million, $(747) million and $(140) million in 2014, 2013 and 2012, respectively, of which $96 million related to the impairment of an investment in a Brazilian company that was fully offset by the benefit of a guarantee provided by GE reflected as a component in other items for 2013. See Note 3. |
| (b) | During 2013, we sold our remaining equity interest in the Bank of Ayudhya (Bay Bank) and recorded a pre-tax gain of $641 million. During 2012, we sold our remaining equity interest in Garanti Bank, which was classified as an available-for-sale security. |
| (c) | During 2013, we sold real estate comprising certain floors located at 30 Rockefeller Center, New York for a pre-tax gain of $902 million. |
| (d) | During 2014, we sold GEMB-Nordic and recorded a pre-tax gain of $473 million. During 2013, we sold a portion of Cembra through an initial public offering and recorded a pre-tax gain of $351 million. |
NOTE 19. SUPPLEMENTAL COST INFORMATION
RESEARCH & DEVELOPMENT
We conduct research and development (R&D) activities to continually enhance our existing products and services, develop new product and services to meet our customer's changing needs and requirements, and address new market opportunities.
Research and development expenses are classified in cost of goods sold in the Statement of Earnings. In addition, research and development funding from customers, principally the U.S. government, is recorded as an offset to cost of goods sold. We also enter into research and development arrangements with unrelated investors, which are generally formed through partnerships. Research and development funded by investors is classified within net earnings/loss attributable to noncontrolling interests.
(In millions) | 2014 | 2013 | 2012 | |||||
Total R&D | $ | 5,273 | $ | 5,461 | $ | 5,200 | ||
Less customer funded R&D (principally the U.S. Government) | (721) | (711) | (680) | |||||
Less partner funded R&D | (319) | (107) | (6) | |||||
GE funded R&D | $ | 4,233 | $ | 4,643 | $ | 4,514 | ||
GE 2014 FORM 10-K 194
FINANCIAL STATEMENTS | SUPPLEMENTAL COST INFORMATION |
CONSOLIDATED OTHER COSTS AND EXPENSES
Consolidated other costs and expenses consists of selling, general and administrative costs (SG&A), depreciation and amortization and other operating costs.
CONSOLIDATED OTHER COSTS AND EXPENSES | ||||||||
(In millions) | 2014 | 2013 | 2012 | |||||
GE SG&A | $ | 14,971 | $ | 16,105 | $ | 17,671 | ||
GECC operating and administrative costs | 13,053 | 12,463 | 12,023 | |||||
GECC depreciation and amortization | 6,859 | 7,313 | 6,901 | |||||
34,883 | 35,881 | 36,595 | ||||||
Eliminations | (857) | (738) | (698) | |||||
Total | $ | 34,026 | $ | 35,143 | $ | 35,897 | ||
COLLABORATIVE ARRANGEMENTS
Our businesses enter into collaborative arrangements primarily with manufacturers and suppliers of components used to build and maintain certain engines, under which GE and these participants share in risks and rewards of these product programs. GE's payments to participants are recorded as cost of services sold ($873 million, $820 million and $594 million for the years 2014, 2013 and 2012, respectively) or as cost of goods sold ($2,660 million, $2,613 million and $2,507 million for the years 2014, 2013 and 2012, respectively).
RENTAL EXPENSE
Rental expense under operating leases is shown below.
(In millions) | 2014 | 2013 | 2012 | |||||
GE | $ | 1,186 | $ | 1,220 | $ | 1,134 | ||
GECC | 382 | 428 | 539 | |||||
1,568 | 1,648 | 1,673 | ||||||
Eliminations | (149) | (135) | (142) | |||||
Total | $ | 1,419 | $ | 1,513 | $ | 1,531 | ||
At December 31, 2014, minimum rental commitments under noncancellable operating leases aggregated $2,870 million and $1,420 million for GE and GECC, respectively. Amounts payable over the next five years follow.
(In millions) | 2015 | 2016 | 2017 | 2018 | 2019 | |||||||||
GE | $ | 634 | $ | 528 | $ | 432 | $ | 371 | $ | 337 | ||||
GECC | 238 | 203 | 177 | 141 | 120 | |||||||||
872 | 731 | 609 | 512 | 457 | ||||||||||
Eliminations | (73) | (44) | (28) | (20) | (18) | |||||||||
Total | $ | 799 | $ | 687 | $ | 581 | $ | 492 | $ | 439 | ||||
GE 2014 FORM 10-K 195
FINANCIAL STATEMENTS | EARNINGS PER SHARE & FAIR VALUE MEASUREMENTS |
NOTE 20. EARNINGS PER SHARE INFORMATION
2014 | 2013 | 2012 | |||||||||||||||
(In millions; per-share amounts in dollars) | Diluted | Basic | Diluted | Basic | Diluted | Basic | |||||||||||
Amounts attributable to the Company: | |||||||||||||||||
Consolidated | |||||||||||||||||
Earnings from continuing operations attributable to | |||||||||||||||||
common shareowners for per-share calculation(a)(b) | $ | 15,325 | $ | 15,324 | $ | 15,145 | $ | 15,157 | $ | 14,604 | $ | 14,603 | |||||
Earnings (loss) from discontinued operations | |||||||||||||||||
for per-share calculation(a)(b) | (111) | (111) | (2,128) | (2,116) | (980) | (980) | |||||||||||
Net earnings attributable to GE common | |||||||||||||||||
shareowners for per-share calculation(a)(b) | $ | 15,213 | $ | 15,212 | $ | 13,028 | $ | 13,040 | $ | 13,622 | $ | 13,622 | |||||
Average equivalent shares | |||||||||||||||||
Shares of GE common stock outstanding | 10,045 | 10,045 | 10,222 | 10,222 | 10,523 | 10,523 | |||||||||||
Employee compensation-related shares (including | |||||||||||||||||
stock options) and warrants | 78 | - | 67 | - | 41 | - | |||||||||||
Total average equivalent shares | 10,123 | 10,045 | 10,289 | 10,222 | 10,564 | 10,523 | |||||||||||
Per-share amounts | |||||||||||||||||
Earnings from continuing operations | $ | 1.51 | $ | 1.53 | $ | 1.47 | $ | 1.48 | $ | 1.38 | $ | 1.39 | |||||
Earnings (loss) from discontinued operations | (0.01) | (0.01) | (0.21) | (0.21) | (0.09) | (0.09) | |||||||||||
Net earnings | 1.50 | 1.51 | 1.27 | 1.28 | 1.29 | 1.29 | |||||||||||
Our unvested restricted stock unit awards that contain non-forfeitable rights to dividends or dividend equivalents are considered participating securities and, therefore, are included in the computation of earnings per share pursuant to the two-class method. Application of this treatment has an insignificant effect.
(a) | Included an insignificant amount of dividend equivalents in each of the three years presented. |
(b) | Included in 2013 is a dilutive adjustment for the change in income for forward purchase contracts that may be settled in stock. |
For the years ended December 31, 2014, 2013 and 2012, there were approximately 98 million, 121 million and 292 million, respectively, of outstanding stock awards that were not included in the computation of diluted earnings per share because their effect was antidilutive.
Earnings-per-share amounts are computed independently for earnings from continuing operations, earnings (loss) from discontinued operations and net earnings. As a result, the sum of per-share amounts from continuing operations and discontinued operations may not equal the total per-share amounts for net earnings.
NOTE 21. FAIR VALUE MEASUREMENTS
RECURRING FAIR VALUE MEASUREMENTS
GE 2014 FORM 10-K 195
FINANCIAL STATEMENTS | FAIR VALUE MEASUREMENTS |
ASSETS AND LIABILITIES MEASURED AT FAIR VALUE ON A RECURRING BASIS | ||||||||||||||
Netting | ||||||||||||||
(In millions) | Level 1 | (a) | Level 2 | (a) | Level 3 | adjustment | (b) | Net balance | ||||||
December 31, 2014 | ||||||||||||||
Assets | ||||||||||||||
Investment securities | ||||||||||||||
Debt | ||||||||||||||
U.S. corporate | $ | - | $ | 20,659 | $ | 3,140 | $ | - | $ | 23,799 | ||||
State and municipal | - | 5,171 | 578 | - | 5,749 | |||||||||
Residential mortgage-backed | - | 1,709 | 16 | - | 1,725 | |||||||||
Commercial mortgage-backed | - | 3,054 | 9 | - | 3,063 | |||||||||
Asset-backed(c) | - | 343 | 7,575 | - | 7,918 | |||||||||
Corporate – non-U.S. | - | 681 | 796 | - | 1,477 | |||||||||
Government – non-U.S. | 56 | 1,738 | 2 | - | 1,796 | |||||||||
U.S. government and federal agency | - | 1,747 | 266 | - | 2,013 | |||||||||
Retained interests | - | - | 24 | - | 24 | |||||||||
Equity | ||||||||||||||
Available-for-sale | 293 | 19 | 9 | - | 321 | |||||||||
Trading | 20 | 2 | - | - | 22 | |||||||||
Derivatives(d) | - | 10,038 | 144 | (7,605) | 2,577 | |||||||||
Other(e) | - | - | 324 | - | 324 | |||||||||
Total | $ | 369 | $ | 45,161 | $ | 12,883 | $ | (7,605) | $ | 50,808 | ||||
Liabilities | ||||||||||||||
Derivatives | $ | - | $ | 4,971 | $ | 18 | $ | (4,407) | $ | 582 | ||||
Other(f) | - | 1,180 | - | - | 1,180 | |||||||||
Total | $ | - | $ | 6,151 | $ | 18 | $ | (4,407) | $ | 1,762 | ||||
December 31, 2013 | ||||||||||||||
Assets | ||||||||||||||
Investment securities | ||||||||||||||
Debt | ||||||||||||||
U.S. corporate | $ | - | $ | 18,788 | $ | 2,953 | $ | - | $ | 21,741 | ||||
State and municipal | - | 4,193 | 96 | - | 4,289 | |||||||||
Residential mortgage-backed | - | 1,824 | 86 | - | 1,910 | |||||||||
Commercial mortgage-backed | - | 3,025 | 10 | - | 3,035 | |||||||||
Asset-backed(c) | - | 489 | 6,898 | - | 7,387 | |||||||||
Corporate – non-U.S. | 61 | 645 | 1,064 | - | 1,770 | |||||||||
Government – non-U.S. | 1,590 | 789 | 31 | - | 2,410 | |||||||||
U.S. government and federal agency | - | 545 | 225 | - | 770 | |||||||||
Retained interests | - | - | 72 | - | 72 | |||||||||
Equity | ||||||||||||||
Available-for-sale | 475 | 31 | 11 | - | 517 | |||||||||
Trading | 78 | 2 | - | - | 80 | |||||||||
Derivatives(d) | - | 8,304 | 175 | (6,739) | 1,740 | |||||||||
Other(e) | - | - | 494 | - | 494 | |||||||||
Total | $ | 2,204 | $ | 38,635 | $ | 12,115 | $ | (6,739) | $ | 46,215 | ||||
Liabilities | ||||||||||||||
Derivatives | $ | - | $ | 5,409 | $ | 20 | $ | (4,355) | $ | 1,074 | ||||
Other(f) | - | 1,170 | - | - | 1,170 | |||||||||
Total | $ | - | $ | 6,579 | $ | 20 | $ | (4,355) | $ | 2,244 | ||||
| (a) | Included $487 million of Government – non-U.S. and $13 million of Corporate – non-U.S. available-for-sale debt securities transferred from Level 1 to Level 2 primarily attributable to changes in market observable data during 2014. The fair value of securities transferred between Level 1 and Level 2 was $2 million during 2013. |
| (b) | The netting of derivative receivables and payables (including the effects of any collateral posted or received) is permitted when a legally enforceable master netting agreement exists. |
| (c) | Includes investments in our CLL business in asset-backed securities collateralized by senior secured loans of high-quality, middle-market companies in a variety of industries. |
| (d) | The fair value of derivatives includes an adjustment for non-performance risk. The cumulative adjustment was a gain (loss) of $9 million and $(7) million at December 31, 2014 and 2013, respectively. See Note 22 for additional information on the composition of our derivative portfolio. |
| (e) | Includes private equity investments and loans designated under the fair value option. |
| (f) | Primarily represented the liability associated with certain of our deferred incentive compensation plans . |
GE 2014 FORM 10-K 196
FINANCIAL STATEMENTS | FAIR VALUE MEASUREMENTS |
LEVEL 3 INSTRUMENTS
The majority of our Level 3 balances consist of investment securities classified as available-for-sale with changes in fair value recorded in shareowners' equity.
CHANGES IN LEVEL 3 INSTRUMENTS FOR THE YEARS ENDED DECEMBER 31, 2014 AND 2013 | ||||||||||||||||||||||||||||
Balance at January 1 | Net realized/ unrealized gains (losses) Included in earnings(a) | Net realized/ unrealized gains (losses) included in AOCI | Purchases | Sales | Settlements | Transfers into Level 3(b) | Transfers out of Level 3(b) | Balance at December 31 | Net change in unrealized gains (losses) relating to instruments still held at December 31(c) | |||||||||||||||||||
(In millions) | ||||||||||||||||||||||||||||
2014 | ||||||||||||||||||||||||||||
Investment securities | ||||||||||||||||||||||||||||
Debt | ||||||||||||||||||||||||||||
U.S. corporate | $ | 2,953 | $ | 22 | $ | 121 | $ | 550 | $ | (234) | $ | (284) | $ | 175 | $ | (163) | $ | 3,140 | $ | - | ||||||||
State and municipal | 96 | - | 38 | 18 | (36) | (10) | 472 | - | 578 | - | ||||||||||||||||||
RMBS | 86 | - | 2 | - | (16) | (9) | - | (47) | 16 | - | ||||||||||||||||||
CMBS | 10 | - | - | - | - | (3) | 2 | - | 9 | - | ||||||||||||||||||
ABS | 6,898 | 3 | (206) | 2,249 | - | (1,359) | - | (10) | 7,575 | - | ||||||||||||||||||
Corporate – non-U.S. | 1,064 | 30 | 3 | 1,019 | (269) | (1,033) | 1 | (19) | 796 | - | ||||||||||||||||||
Government – non-U.S. | 31 | - | - | - | - | - | 2 | (31) | 2 | - | ||||||||||||||||||
U.S. government and | ||||||||||||||||||||||||||||
federal agency | 225 | - | 34 | - | - | - | 9 | (2) | 266 | - | ||||||||||||||||||
Retained interests | 72 | 29 | (4) | 3 | (66) | (10) | - | - | 24 | - | ||||||||||||||||||
Equity | ||||||||||||||||||||||||||||
Available-for-sale | 11 | - | - | 2 | (2) | - | - | (2) | 9 | - | ||||||||||||||||||
Derivatives(d)(e) | 164 | 60 | 1 | 5 | - | (93) | 2 | (1) | 138 | (26) | ||||||||||||||||||
Other | 494 | 86 | - | 646 | (617) | (6) | - | (279) | 324 | 73 | ||||||||||||||||||
Total | $ | 12,104 | $ | 230 | $ | (11) | $ | 4,492 | $ | (1,240) | $ | (2,807) | $ | 663 | $ | (554) | $ | 12,877 | $ | 47 | ||||||||
2013 | ||||||||||||||||||||||||||||
Investment securities | ||||||||||||||||||||||||||||
Debt | ||||||||||||||||||||||||||||
U.S. corporate | $ | 3,591 | $ | (497) | $ | 135 | $ | 380 | $ | (424) | $ | (231) | $ | 108 | $ | (109) | $ | 2,953 | $ | - | ||||||||
State and municipal | 77 | - | (7) | 21 | - | (5) | 10 | - | 96 | - | ||||||||||||||||||
RMBS | 100 | - | (5) | - | (2) | (7) | - | - | 86 | - | ||||||||||||||||||
CMBS | 6 | - | - | - | - | (6) | 10 | - | 10 | - | ||||||||||||||||||
ABS | 5,023 | 5 | 32 | 2,632 | (4) | (795) | 12 | (7) | 6,898 | - | ||||||||||||||||||
Corporate – non-U.S. | 1,218 | (103) | 49 | 5,814 | (3) | (5,874) | 21 | (58) | 1,064 | - | ||||||||||||||||||
Government – non-U.S. | 42 | 1 | (12) | - | - | - | - | - | 31 | - | ||||||||||||||||||
U.S. government and | ||||||||||||||||||||||||||||
federal agency | 277 | - | (52) | - | - | - | - | - | 225 | - | ||||||||||||||||||
Retained interests | 83 | 3 | 1 | 6 | - | (21) | - | - | 72 | - | ||||||||||||||||||
Equity | ||||||||||||||||||||||||||||
Available-for-sale | 13 | - | - | - | - | - | - | (2) | 11 | - | ||||||||||||||||||
Derivatives(d)(e) | 416 | 43 | 2 | (2) | - | (335) | 37 | 3 | 164 | (30) | ||||||||||||||||||
Other | 799 | (68) | 12 | 538 | (779) | - | 4 | (12) | 494 | (102) | ||||||||||||||||||
Total | $ | 11,645 | $ | (616) | $ | 155 | $ | 9,389 | $ | (1,212) | $ | (7,274) | $ | 202 | $ | (185) | $ | 12,104 | $ | (132) | ||||||||
(a) | Earnings effects are primarily included in the "GECC revenues from services" and "Interest and other financial charges" captions in the Statement of Earnings. |
(b) | Transfers in and out of Level 3 are considered to occur at the beginning of the period. Transfers out of Level 3 were primarily a result of increased use of quotes from independent pricing vendors based on recent trading activity. |
(c) | Represents the amount of unrealized gains or losses for the period included in earnings. |
(d) | Represents derivative assets net of derivative liabilities and included cash accruals of $12 million and $9 million not reflected in the fair value hierarchy table during 2014 and 2013, respectively. |
(e) | Gains (losses) included in net realized/unrealized gains (losses) included in earnings were offset by the earnings effects from the underlying items that were economically hedged. See Note 22. |
GE 2014 FORM 10-K 197
FINANCIAL STATEMENTS | FAIR VALUE MEASUREMENTS |
NON-RECURRING FAIR VALUE MEASUREMENTS
The following table represents non-recurring fair value amounts (as measured at the time of the adjustment) for those assets remeasured to fair value on a non-recurring basis during the fiscal year and still held at December 31, 2014 and 2013.
Remeasured during the years ended December 31 | |||||||||||
2014 | 2013 | ||||||||||
(In millions) | Level 2 | Level 3 | Level 2 | Level 3 | |||||||
Financing receivables and loans held for sale | $ | 49 | $ | 1,430 | $ | 210 | $ | 2,986 | |||
Cost and equity method investments(a) | 11 | 404 | - | 690 | |||||||
Long-lived assets, including real estate | 364 | 1,253 | 2,050 | 1,088 | |||||||
Total | $ | 424 | $ | 3,087 | $ | 2,260 | $ | 4,764 | |||
The following table represents the fair value adjustments to assets measured at fair value on a non-recurring basis and still held at December 31, 2014 and 2013.
Years ended December 31 | |||||||||||
(In millions) | 2014 | 2013 | |||||||||
Financing receivables and loans held for sale | $ | (317) | $ | (361) | |||||||
Cost and equity method investments | (388) | (484) | |||||||||
Long-lived assets, including real estate | (794) | (1,188) | |||||||||
Total | $ | (1,499) | $ | (2,033) | |||||||
GE 2014 FORM 10-K 198
FINANCIAL STATEMENTS | FAIR VALUE MEASUREMENTS |
LEVEL 3 MEASUREMENTS - SIGNIFICANT UNOBSERVABLE INPUTS | |||||||||||||
Range | |||||||||||||
(Dollars in millions) | Fair value | Valuation technique | Unobservable inputs | (weighted average) | |||||||||
December 31, 2014 | |||||||||||||
Recurring fair value measurements | |||||||||||||
Investment securities – Debt | |||||||||||||
U.S. corporate | $ | 980 | Income approach | Discount rate(a) | 1.5%-14.8% (6.6%) | ||||||||
State and municipal | 481 | Income approach | Discount rate(a) | 1.9%-5.9% (2.8%) | |||||||||
Asset-backed | 7,554 | Income approach | Discount rate(a) | 2.2%-12.4% (5.0%) | |||||||||
Corporate – non-U.S. | 724 | Income approach | Discount rate(a) | 0.4%-14.7% (7.6%) | |||||||||
Other financial assets | 165 | Income approach, | EBITDA multiple | 5.4X-9.1X (7.7X) | |||||||||
Market comparables | Discount rate(a) | 4.2%-4.7% (4.3%) | |||||||||||
Capitalization rate(b) | 6.5%-7.8% (7.7%) | ||||||||||||
Non-recurring fair value measurements | |||||||||||||
Financing receivables and | $ | 666 | Income approach, | Capitalization rate(b) | 6.9%-11.0% (7.8%) | ||||||||
loans held for sale | Business enterprise | EBITDA multiple | 4.3X-6.5X (6.2X) | ||||||||||
value | |||||||||||||
Cost and equity method investments | 346 | Income approach, | Discount rate(a) | 8.0%-10.0% (9.4%) | |||||||||
Business enterprise | Capitalization rate(b) | 6.4%-6.4% (6.4%) | |||||||||||
value, Market comparables | EBITDA multiple | 1.8X-10.5X (7.0X) | |||||||||||
Long-lived assets, including real estate | 932 | Income approach | Capitalization rate(b) | 6.3%-15.3% (6.8%) | |||||||||
Discount rate(a) | 2.0%-19.0% (6.8%) | ||||||||||||
December 31, 2013 | |||||||||||||
Recurring fair value measurements | |||||||||||||
Investment securities – Debt | |||||||||||||
U.S. corporate | $ | 898 | Income approach | Discount rate(a) | 1.5%-13.3% (6.5%) | ||||||||
Asset-backed | 6,854 | Income approach | Discount rate(a) | 1.2%-10.5%(3.7%) | |||||||||
Corporate – non-U.S. | 819 | Income approach | Discount rate(a) | 1.4%-46.0%(15.1%) | |||||||||
Other financial assets | 381 | Income approach, | WACC(c) | 9.3%-9.3% (9.3%) | |||||||||
Market comparables | EBITDA multiple | 5.4X-12.5X(9.5X) | |||||||||||
Discount rate(a) | 5.2%-8.8%(5.3%) | ||||||||||||
Capitalization rate(b) | 6.3%-7.5%(7.2%) | ||||||||||||
Non-recurring fair value measurements | |||||||||||||
Financing receivables and | $ | 1,937 | Income approach, | Capitalization rate(b) | 5.5%-16.7%(8.0%) | ||||||||
loans held for sale | Business enterprise | EBITDA multiple | 4.3X-5.5X(4.8X) | ||||||||||
value | Discount rate(a) | 6.6%-6.6% (6.6%) | |||||||||||
Cost and equity method investments | 102 | Income approach, | Discount rate(a) | 5.7%-5.9%(5.8%) | |||||||||
Market comparables | Capitalization rate(b) | 8.5%-10.6% (10.0%) | |||||||||||
WACC(c) | 9.3%-9.6%(9.4%) | ||||||||||||
EBITDA multiple | 7.1X-14.5X(11.3X) | ||||||||||||
Revenue multiple | 2.2X-12.6X(9.4X) | ||||||||||||
Long-lived assets, including real estate | 694 | Income approach | Capitalization rate(b) | 5.4%-14.5%(7.8%) | |||||||||
Discount rate(a) | 4.0%-23.0%(9.0%) | ||||||||||||
(a) | Discount rates are determined based on inputs that market participants would use when pricing investments, including credit and liquidity risk. An increase in the discount rate would result in a decrease in the fair value. |
(b) | Represents the rate of return on net operating income that is considered acceptable for an investor and is used to determine a property's capitalized value. An increase in the capitalization rate would result in a decrease in the fair value. |
(c) | Weighted average cost of capital (WACC). |
GE 2014 FORM 10-K 199
FINANCIAL STATEMENTS | FINANCIAL INSTRUMENTS |
NOTE 22. FINANCIAL INSTRUMENTS
The following table provides information about assets and liabilities not carried at fair value. The table excludes finance leases and non-financial assets and liabilities. Substantially all of the assets discussed below are considered to be Level 3. The vast majority of our liabilities' fair value can be determined based on significant observable inputs and thus considered Level 2. Few of the instruments are actively traded and their fair values must often be determined using financial models. Realization of the fair value of these instruments depends upon market forces beyond our control, including marketplace liquidity.
2014 | 2013 | ||||||||||||||||
Assets (liabilities) | Assets (liabilities) | ||||||||||||||||
Carrying | Carrying | ||||||||||||||||
Notional | amount | Estimated | Notional | amount | Estimated | ||||||||||||
December 31 (In millions) | amount | (net) | fair value | amount | (net) | fair value | |||||||||||
GE | |||||||||||||||||
Assets | |||||||||||||||||
Investments and notes | |||||||||||||||||
receivable | $ | (a) | $ | 502 | $ | 551 | $ | (a) | $ | 488 | $ | 512 | |||||
Liabilities | |||||||||||||||||
Borrowings(b) | (a) | (16,340) | (17,503) | (a) | (13,356) | (13,707) | |||||||||||
GECC | |||||||||||||||||
Assets | |||||||||||||||||
Loans | (a) | 212,719 | 217,662 | (a) | 226,293 | 230,792 | |||||||||||
Other commercial mortgages | (a) | 3,520 | 3,600 | (a) | 2,270 | 2,281 | |||||||||||
Loans held for sale | (a) | 1,801 | 1,826 | (a) | 512 | 512 | |||||||||||
Other financial instruments(c) | (a) | 691 | 1,015 | (a) | 1,622 | 2,203 | |||||||||||
Liabilities | |||||||||||||||||
Borrowings and bank | |||||||||||||||||
deposits(b)(d) | (a) | (349,548) | (366,256) | (a) | (371,062) | (386,823) | |||||||||||
Investment contract benefits | (a) | (2,970) | (3,565) | (a) | (3,144) | (3,644) | |||||||||||
Guaranteed investment contracts | (a) | (1,000) | (1,031) | (a) | (1,471) | (1,459) | |||||||||||
Insurance – credit life(e) | 1,843 | (90) | (77) | 2,149 | (108) | (94) | |||||||||||
| ( a) | These financial instruments do not have notional amounts. |
| (b) | See Note 10. |
| (c) | Principally comprises cost method investments. |
| (d) | Fair values exclude interest rate and currency derivatives designated as hedges of borrowings. Had they been included, the fair value of borrowings at December 31, 2014 and 2013 would have been reduced by $5,020 million and $2,284 million, respectively. |
| (e) | Net of reinsurance of $964 million and $1,250 million at December 31, 2014 and 2013, respectively . |
A description of how we estimate fair values follows:
Loans. Based on a discounted future cash flows methodology, using current market interest rate data adjusted for inherent credit risk or quoted market prices and recent transactions, if available.
Borrowings and bank deposits. Based on valuation methodologies using current market interest rate data that are comparable to market quotes adjusted for our non-performance risk.
Investment contract benefits. Based on expected future cash flows, discounted at currently offered rates for immediate annuity contracts or the income approach for single premium deferred annuities.
Guaranteed investment contracts. Based on valuation methodologies using current market interest rate data, adjusted for our non-performance risk.
Insurance – credit life. Certain insurance affiliates, primarily in Consumer, issue credit life insurance designed to pay the balance due on a loan if the borrower dies before the loan is repaid. As part of our overall risk management process, we cede to third parties a portion of this associated risk, but are not relieved of our primary obligation to the policy holders.
GE 2014 FORM 10-K 200
FINANCIAL STATEMENTS | FINANCIAL INSTRUMENTS |
Assets and liabilities that are reflected in the accompanying financial statements at fair value are not included in the above disclosures; such items include cash and equivalents, investment securities and derivative financial instruments.
Additional information about Notional Amounts of Loan Commitments follows.
NOTIONAL AMOUNTS OF LOAN COMMITMENTS | |||||||||||
December 31 (In millions) | 2014 | 2013 | |||||||||
Ordinary course of business lending commitments(a) | $ | 4,282 | $ | 4,756 | |||||||
Unused revolving credit lines(b) | |||||||||||
Commercial(c) | 14,681 | 16,570 | |||||||||
Consumer – principally credit cards | 306,188 | 290,662 | |||||||||
(a) | Excluded investment commitments of $980 million and $1,395 million at December 31, 2014 and 2013, respectively. |
(b) | Excluded amounts related to inventory financing arrangements, which may be withdrawn at our option, of $15,041 million and $13,502 million at December 31, 2014 and 2013, respectively. |
(c) | Included amounts related to commitments of $10,509 million and $11,629 million at December 31, 2014 and 2013, respectively, associated with secured financing arrangements that could have increased to a maximum of $12,353 million and $14,590 million at December 31, 2014 and 2013, respectively, based on asset volume under the arrangement . |
SECURITIES REPURCHASE AND REVERSE REPURCHASE ARRANGEMENTS
Our issuances of securities repurchase agreements are insignificant and are limited to activities at certain of our foreign banks primarily for purposes of liquidity management. At December 31, 2014, we were party to repurchase agreements totaling $169 million, which were reported in short-term borrowings on the financial statements. No repurchase agreements were accounted for as off-book financing and we do not engage in securities lending transactions.
We also enter into reverse securities repurchase agreements, primarily for short-term investment with maturities of 90 days or less. At December 31, 2014, we were party to reverse repurchase agreements totaling $11.5 billion, which were reported in cash and equivalents on the financial statements. Under these reverse securities repurchase agreements, we typically lend available cash at a specified rate of interest and hold U.S. or highly-rated European government securities as collateral during the term of the agreement. Collateral value is in excess of amounts loaned under the agreements.
DERIVATIVES AND HEDGING
As a matter of policy, we use derivatives for risk management purposes and we do not use derivatives for speculative purposes. A key risk management objective for our financial services businesses is to mitigate interest rate and currency risk by seeking to ensure that the characteristics of the debt match the assets they are funding. If the form (fixed versus floating) and currency denomination of the debt we issue do not match the related assets, we typically execute derivatives to adjust the nature and tenor of funding to meet this objective within pre-defined limits. The determination of whether we enter into a derivative transaction or issue debt directly to achieve this objective depends on a number of factors, including market related factors that affect the type of debt we can issue.
GE 2014 FORM 10-K 201
FINANCIAL STATEMENTS | FINANCIAL INSTRUMENTS |
The notional amounts of derivative contracts represent the basis upon which interest and other payments are calculated and are reported gross, except for offsetting foreign currency forward contracts that are executed in order to manage our currency risk of net investment in foreign subsidiaries. Of the outstanding notional amount of $297,000 million, approximately 87% or $258,000 million, is associated with reducing or eliminating the interest rate, currency or market risk between financial assets and liabilities in our financial services businesses. The remaining derivative activities primarily relate to hedging against adverse changes in currency exchange rates and commodity prices related to anticipated sales and purchases and contracts containing certain clauses that meet the accounting definition of a derivative. The instruments used in these activities are designated as hedges when practicable. When we are not able to apply hedge accounting, or when the derivative and the hedged item are both recorded in earnings concurrently, the derivatives are deemed economic hedges and hedge accounting is not applied. This most frequently occurs when we hedge a recognized foreign currency transaction (e.g., a receivable or payable) with a derivative. Since the effects of changes in exchange rates are reflected concurrently in earnings for both the derivative and the transaction, the economic hedge does not require hedge accounting.
FAIR VALUE OF DERIVATIVES | |||||||||||
2014 | 2013 | ||||||||||
December 31 (In millions) | Assets | Liabilities | Assets | Liabilities | |||||||
Derivatives accounted for as hedges | |||||||||||
Interest rate contracts | $ | 5,859 | $ | 461 | $ | 3,837 | $ | 1,989 | |||
Currency exchange contracts | 2,579 | 884 | 1,830 | 984 | |||||||
Other contracts | - | 2 | 1 | - | |||||||
8,438 | 1,347 | 5,668 | 2,973 | ||||||||
Derivatives not accounted for as hedges | |||||||||||
Interest rate contracts | 276 | 137 | 270 | 169 | |||||||
Currency exchange contracts | 1,212 | 3,450 | 2,257 | 2,245 | |||||||
Other contracts | 256 | 55 | 284 | 42 | |||||||
1,744 | 3,642 | 2,811 | 2,456 | ||||||||
Gross derivatives recognized in statement of | |||||||||||
financial position | |||||||||||
Gross derivatives | 10,182 | 4,989 | 8,479 | 5,429 | |||||||
Gross accrued interest | 1,401 | (18) | 1,227 | 241 | |||||||
11,583 | 4,971 | 9,706 | 5,670 | ||||||||
Amounts offset in statement of financial position | |||||||||||
Netting adjustments(a) | (3,896) | (3,905) | (4,120) | (4,113) | |||||||
Cash collateral(b) | (3,709) | (502) | (2,619) | (242) | |||||||
(7,605) | (4,407) | (6,739) | (4,355) | ||||||||
Net derivatives recognized in statement of | |||||||||||
financial position | |||||||||||
Net derivatives | 3,978 | 564 | 2,967 | 1,315 | |||||||
Amounts not offset in statement of | |||||||||||
financial position | |||||||||||
Securities held as collateral(c) | (3,361) | - | (1,962) | - | |||||||
Net amount | $ | 617 | $ | 564 | $ | 1,005 | $ | 1,315 | |||
Derivatives are classified in the captions "All other assets" and "All other liabilities" and the related accrued interest is classified in "Other GECC receivables" and "All other liabilities" in our financial statements.
(a) | The netting of derivative receivables and payables is permitted when a legally enforceable master netting agreement exists. Amounts include fair value adjustments related to our own and counterparty non-performance risk. At December 31, 2014 and 2013, the cumulative adjustment for non-performance risk was a gain (loss) of $9 million and $(7) million, respectively. |
(b) | Excluded excess cash collateral received and posted of $63 million and $211 million, and $160 million and $37 million at December 31, 2014 and 2013, respectively. |
(c) | Excluded excess securities collateral received of $224 million and $363 million at December 31, 2014 and 2013, respectively. |
GE 2014 FORM 10-K 202
FINANCIAL STATEMENTS | FINANCIAL INSTRUMENTS |
FAIR VALUE HEDGES
We use interest rate and currency exchange derivatives to hedge the fair value effects of interest rate and currency exchange rate changes on local and non-functional currency denominated fixed-rate debt. For relationships designated as fair value hedges, changes in fair value of the derivatives are recorded in earnings within interest and other financial charges, along with offsetting adjustments to the carrying amount of the hedged debt.
EARNINGS EFFECTS OF FAIR VALUE HEDGING RELATIONSHIPS | |||||||||||
2014 | 2013 | ||||||||||
Gain (loss) | Gain (loss) | Gain (loss) | Gain (loss) | ||||||||
on hedging | on hedged | on hedging | on hedged | ||||||||
(In millions) | derivatives | items | derivatives | items | |||||||
Interest rate contracts | $ | 3,898 | $ | (3,973) | $ | (5,258) | $ | 5,180 | |||
Currency exchange contracts | (19) | 17 | (7) | 6 | |||||||
Fair value hedges resulted in $(77) million and $(79) million of ineffectiveness in 2014 and 2013, respectively. In both 2014 and 2013, there were insignificant amounts excluded from the assessment of effectiveness.
CASH FLOW HEDGES
We use interest rate, currency exchange and commodity derivatives to reduce the variability of expected future cash flows associated with variable rate borrowings and commercial purchase and sale transactions, including commodities. For derivatives that are designated in a cash flow hedging relationship, the effective portion of the change in fair value of the derivative is reported as a component of AOCI and reclassified into earnings contemporaneously and in the same caption with the earnings effects of the hedged transaction.
Gain (loss) reclassified | |||||||||||
Gain (loss) recognized in AOCI | from AOCI into earnings | ||||||||||
(In millions) | 2014 | 2013 | 2014 | 2013 | |||||||
Interest rate contracts | $ | (1) | $ | (26) | $ | (234) | $ | (364) | |||
Currency exchange contracts | (541) | 941 | (641) | 817 | |||||||
Commodity contracts | (4) | (6) | (3) | (5) | |||||||
Total(a) | $ | (546) | $ | 909 | $ | (878) | $ | 448 | |||
| (a) | Gain (loss) is recorded in GECC revenues from services, interest and other financial charges, and other costs and expenses when reclassified to earnings. |
The total pre-tax amount in AOCI related to cash flow hedges of forecasted transactions was a $213 million loss at December 31, 2014. We expect to transfer $212 million to earnings as an expense in the next 12 months contemporaneously with the earnings effects of the related forecasted transactions. In both 2014 and 2013, we recognized insignificant gains and losses related to hedged forecasted transactions and firm commitments that did not occur by the end of the originally specified period. At December 31, 2014 and 2013, the maximum term of derivative instruments that hedge forecasted transactions was 18 years and 19 years, respectively. See Note15 for additional information about reclassifications out of AOCI.
GE 2014 FORM 10-K 203
FINANCIAL STATEMENTS | FINANCIAL INSTRUMENTS |
NET INVESTMENT HEDGES IN FOREIGN OPERATIONS
We use currency exchange derivatives to protect our net investments in global operations conducted in non-U.S. dollar currencies. For derivatives that are designated as hedges of net investment in a foreign operation, we assess effectiveness based on changes in spot currency exchange rates. Changes in spot rates on the derivative are recorded as a component of AOCI until such time as the foreign entity is substantially liquidated or sold, or upon the loss of a controlling interest in a foreign entity. The change in fair value of the forward points, which reflects the interest rate differential between the two countries on the derivative, is excluded from the effectiveness assessment.
GAINS (LOSSES) RECOGNIZED THROUGH CTA | |||||||||||
Gain (loss) recognized in CTA | Gain (loss) reclassified from CTA | ||||||||||
(In millions) | 2014 | 2013 | 2014 | 2013 | |||||||
Currency exchange contracts(a) | $ | 5,741 | $ | 2,322 | $ | 88 | $ | (1,525) | |||
| (a) | Gain (loss) is recorded in GECC revenues from services when reclassified out of AOCI. |
The amounts related to the change in the fair value of the forward points that are excluded from the measure of effectiveness were $(549) million and $(678) million for the years ended December 31, 2014 and 2013, respectively, and were recorded in interest and other financial charges.
FREE-STANDING DERIVATIVES
Changes in the fair value of derivatives that are not designated as hedges are recorded in earnings each period. As discussed above, these derivatives are typically entered into as economic hedges of changes in interest rates, currency exchange rates, commodity prices and other risks. Gains or losses related to the derivative are typically recorded in GECC revenues from services or other income, based on our accounting policy. In general, the earnings effects of the item that represent the economic risk exposure are recorded in the same caption as the derivative. Gains (losses) for the year ended December 31, 2014 on derivatives not designated as hedges were $(2,045) million composed of amounts related to interest rate contracts of $(58) million, currency exchange contracts of $(2,034) million, and other derivatives of $47 million. These losses were more than offset by the earnings effects from the underlying items that were economically hedged. Gains (losses) for the year ended December 31, 2013 on derivatives not designated as hedges were $(449) million composed of amounts related to interest rate contracts of $(111) million, currency exchange contracts of $(595) million, and other derivatives of $257 million. These losses were more than offset by the earnings effects from the underlying items that were economically hedged.
COUNTERPARTY CREDIT RISK
Fair values of our derivatives can change significantly from period to period based on, among other factors, market movements and changes in our positions. We manage counterparty credit risk (the risk that counterparties will default and not make payments to us according to the terms of our agreements) on an individual counterparty basis. Where we have agreed to netting of derivative exposures with a counterparty, we net our exposures with that counterparty and apply the value of collateral posted to us to determine the exposure. We actively monitor these net exposures against defined limits and take appropriate actions in response, including requiring additional collateral.
As discussed above, we have provisions in certain of our master agreements that require counterparties to post collateral (typically, cash or U.S. Treasury securities) when our receivable due from the counterparty, measured at current market value, exceeds a specified limit. The fair value of such collateral was $7,070 million at December 31, 2014, of which $3,709 million was cash and $3,361 million was in the form of securities held by a custodian for our benefit. Under certain of these same agreements, we post collateral to our counterparties for our derivative obligations, the fair value of which was $502 million at December 31, 2014. At December 31, 2014, our exposure to counterparties (including accrued interest), net of collateral we hold, was $487 million. This excludes exposure related to embedded derivatives.
GE 2014 FORM 10-K 204
FINANCIAL STATEMENTS | VARIABLE INTEREST ENTITIES |
NOTE 23. VARIABLE INTEREST ENTITIES
We use variable interest entities primarily to securitize financial assets and arrange other forms of asset-backed financing in the ordinary course of business. Except as noted below, investors in these entities only have recourse to the assets owned by the entity and not to our general credit. We do not have implicit support arrangements with any VIE. We did not provide non-contractual support for previously transferred financing receivables to any VIE in 2014 or 2013.
In evaluating whether we have the power to direct the activities of a VIE that most significantly impact its economic performance, we consider the purpose for which the VIE was created, the importance of each of the activities in which it is engaged and our decision-making role, if any, in those activities that significantly determine the entity's economic performance as compared to other economic interest holders. This evaluation requires consideration of all facts and circumstances relevant to decision-making that affects the entity's future performance and the exercise of professional judgment in deciding which decision-making rights are most important.
In determining whether we have the right to receive benefits or the obligation to absorb losses that could potentially be significant to the VIE, we evaluate all of our economic interests in the entity, regardless of form (debt, equity, management and servicing fees, and other contractual arrangements). This evaluation considers all relevant factors of the entity's design, including: the entity's capital structure, contractual rights to earnings (losses), subordination of our interests relative to those of other investors, contingent payments, as well as other contractual arrangements that have the potential to be economically significant. The evaluation of each of these factors in reaching a conclusion about the potential significance of our economic interests is a matter that requires the exercise of professional judgment.
GE 2014 FORM 10-K 205
FINANCIAL STATEMENTS | VARIABLE INTEREST ENTITIES |
CONSOLIDATED VARIABLE INTEREST ENTITIES
We consolidate VIEs because we have the power to direct the activities that significantly affect the VIE's economic performance, typically because of our role as either servicer or manager for the VIE. Our consolidated VIEs fall into three main groups, which are further described below:
| Trinity comprises two consolidated entities that hold investment securities, the majority of which are investment-grade, and were funded by the issuance of GICs. The GICs include conditions under which certain holders could require immediate repayment of their investment should the long-term credit ratings of GECC fall below AA-/Aa3 or the short-term credit ratings fall below A-1+/P-1. The outstanding GICs are subject to their scheduled maturities and individual terms, which may include provisions permitting redemption upon a downgrade of one or more of GECC's ratings, among other things, and are reported in investment contracts, insurance liabilities and insurance annuity benefits. |
| Consolidated Securitization Entities (CSEs) were created to facilitate securitization of financial assets and other forms of asset-backed financing that serve as an alternative funding source by providing access to variable funding notes and term markets. The securitization transactions executed with these entities are similar to those used by many financial institutions and all are non-recourse. We provide servicing for substantially all of the assets in these entities. |
The financing receivables in these entities have similar risks and characteristics to our other financing receivables and were underwritten to the same standard. Accordingly, the performance of these assets has been similar to our other financing receivables; however, the blended performance of the pools of receivables in these entities reflects the eligibility criteria that we apply to determine which receivables are selected for transfer. Contractually the cash flows from these financing receivables must first be used to pay third-party debt holders as well as other expenses of the entity. Excess cash flows are available to GE. The creditors of these entities have no claim on other assets of GE.
| Other remaining assets and liabilities of consolidated VIEs relate primarily to three categories of entities: (1) joint ventures that lease equipment with $1,598 million of assets and $686 million of liabilities; (2) other entities that are involved in power generating and leasing activities with $667 million of assets and no liabilities; and (3) insurance entities that, among other lines of business, provide property and casualty and workers' compensation coverage for GE with $1,162 million of assets and $541 million of liabilities. |
GE 2014 FORM 10-K 206
FINANCIAL STATEMENTS | VARIABLE INTEREST ENTITIES |
ASSETS AND LIABILITIES OF CONSOLIDATED VIEs | |||||||||||||||||
Consolidated Securitization Entities | |||||||||||||||||
Trade | |||||||||||||||||
(In millions) | Trinity(a) | Credit cards | (b) | Equipment | (b) | receivables | Other | Total | |||||||||
December 31, 2014 | |||||||||||||||||
Assets(c) | |||||||||||||||||
Financing receivables, net | $ | - | $ | 25,645 | $ | 12,843 | $ | - | $ | 3,064 | $ | 41,552 | |||||
Current receivables | - | - | - | 3,028 | (d) | 509 | 3,537 | ||||||||||
Investment securities | 2,369 | - | - | - | 1,005 | 3,374 | |||||||||||
Other assets | 17 | 1,059 | 766 | 2 | 2,814 | 4,658 | |||||||||||
Total | $ | 2,386 | $ | 26,704 | $ | 13,609 | $ | 3,030 | $ | 7,392 | $ | 53,121 | |||||
Liabilities(c) | |||||||||||||||||
Borrowings | $ | - | $ | - | $ | - | $ | - | $ | 523 | $ | 523 | |||||
Non-recourse borrowings | - | 14,967 | 10,359 | 2,692 | 646 | 28,664 | |||||||||||
Other liabilities | 1,022 | 332 | 593 | 26 | 1,548 | 3,521 | |||||||||||
Total | $ | 1,022 | $ | 15,299 | $ | 10,952 | $ | 2,718 | $ | 2,717 | $ | 32,708 | |||||
December 31, 2013 | |||||||||||||||||
Assets(c) | |||||||||||||||||
Financing receivables, net | $ | - | $ | 24,766 | $ | 12,928 | $ | - | $ | 2,044 | $ | 39,738 | |||||
Current receivables | - | - | - | 2,509 | 349 | 2,858 | |||||||||||
Investment securities | 2,786 | - | - | - | 1,044 | 3,830 | |||||||||||
Other assets | 213 | 20 | 557 | - | 2,081 | 2,871 | |||||||||||
Total | $ | 2,999 | $ | 24,786 | $ | 13,485 | $ | 2,509 | $ | 5,518 | $ | 49,297 | |||||
Liabilities(c) | |||||||||||||||||
Borrowings | $ | - | $ | - | $ | - | $ | - | $ | 598 | $ | 598 | |||||
Non-recourse borrowings | - | 15,363 | 10,982 | 2,180 | 49 | 28,574 | |||||||||||
Other liabilities | 1,482 | 228 | 248 | 25 | 1,351 | 3,334 | |||||||||||
Total | $ | 1,482 | $ | 15,591 | $ | 11,230 | $ | 2,205 | $ | 1,998 | $ | 32,506 | |||||
(a) | Excluded intercompany advances from GECC to Trinity, which were eliminated in consolidation of $1,565 million and $1,837 million at December 31, 2014 and 2013, respectively. |
(b) | We provide servicing to the CSEs and are contractually permitted to commingle cash collected from customers on financing receivables sold to CSE investors with our own cash prior to payment to a CSE, provided our short-term credit rating does not fall below A-1/P-1. These CSEs also owe us amounts for purchased financial assets and scheduled interest and principal payments. At December 31, 2014 and 2013, the amounts of commingled cash owed to the CSEs were $2,809 million and $6,314 million, respectively, and the amounts owed to us by CSEs were $2,913 million and $5,540 million, respectively. |
(c) | Asset amounts exclude intercompany receivables for cash collected on behalf of the entities by GECC as servicer, which are eliminated in consolidation. Such receivables provide the cash to repay the entities' liabilities. If these intercompany receivables were included in the table above, assets would be higher. In addition, other assets, borrowings and other liabilities exclude intercompany balances that are eliminated in consolidation. |
(d) | Included $686 million of receivables originated by Appliances. We require third party debt holder consent to sell these assets. The receivables will be included in assets of businesses held for sale when the consent is received. |
Total revenues from our consolidated VIEs were $8,012 million, $7,540 million and $7,127 million in 2014, 2013 and 2012, respectively. Related expenses consisted primarily of provisions for losses of $1,186 million, $1,247 million and $1,171 million in 2014, 2013 and 2012, respectively, and interest and other financial charges of $358 million, $355 million and $541 million in 2014, 2013 and 2012, respectively. These amounts do not include intercompany revenues and costs, principally fees and interest between GE and the VIEs, which are eliminated in consolidation.
GE 2014 FORM 10-K 207
FINANCIAL STATEMENTS | COMMITMENTS, PRODUCT WARRANTIES AND GUARANTEES |
INVESTMENTS IN UNCONSOLIDATED VARIABLE INTEREST ENTITIES
Our involvement with unconsolidated VIEs consists of the following activities: assisting in the formation and financing of the entity; providing recourse and/or liquidity support; servicing the assets; and receiving variable fees for services provided. We are not required to consolidate these entities because the nature of our involvement with the activities of the VIEs does not give us power over decisions that significantly affect their economic performance.
Our largest exposure to any single unconsolidated VIE at December 31, 2014 is a $8,612 million investment in asset-backed securities issued by the Senior Secured Loan Program ("SSLP"), a fund that invests in high-quality senior secured debt of various middle-market companies. Other significant unconsolidated VIEs include investments in real estate entities ($1,564 million), which generally consist of passive limited partnership investments in tax-advantaged, multi-family real estate and investments in various European real estate entities; and exposures to joint ventures that purchase factored receivables ($2,166 million).
The classification of our variable interests in these entities in our financial statements is based on the nature of the entity and the type of investment we hold. Variable interests in partnerships and corporate entities are classified as either equity method or cost method investments. In the ordinary course of business, we also make investments in entities in which we are not the primary beneficiary but may hold a variable interest such as limited partner interests or mezzanine debt investments. These investments are classified in two captions in our financial statements: "All other assets" for investments accounted for under the equity method, and "Financing receivables – net" for debt financing provided to these entities.
INVESTMENTS IN UNCONSOLIDATED VIEs | |||||||||||
December 31 (In millions) | 2014 | 2013 | |||||||||
Other assets and investment securities | $ | 9,500 | $ | 9,129 | |||||||
Financing receivables – net | 2,942 | 3,346 | |||||||||
Total investments | 12,442 | 12,475 | |||||||||
Contractual obligations to fund investments or guarantees | 2,218 | 2,741 | |||||||||
Revolving lines of credit | 168 | 31 | |||||||||
Total | $ | 14,828 | $ | 15,247 | |||||||
In addition to the entities included in the table above, we also hold passive investments in RMBS, CMBS and ABS issued by VIEs. Such investments were, by design, investment-grade at issuance and held by a diverse group of investors. Further information about such investments is provided in Note 3.
NOTE 24. COMMITMENTS, PRODUCT WARRANTIES AND GUARANTEES
COMMITMENTS
In our Aviation segment, we had committed to provide financing assistance on $2,887 million of future customer acquisitions of aircraft equipped with our engines, including commitments made to airlines in 2014 for future sales under our GE90 and GEnx engine campaigns. The GECAS business of GE Capital had placed multiple-year orders for various Boeing, Airbus and other aircraft with list prices approximating $25,232 million and secondary orders with airlines for used aircraft of approximately $2,144 million at December 31, 2014.
GE 2014 FORM 10-K 208
FINANCIAL STATEMENTS | COMMITMENTS, PRODUCT WARRANTIES AND GUARANTEES |
PRODUCT WARRANTIES
We provide for estimated product warranty expenses when we sell the related products. Because warranty estimates are forecasts that are based on the best available information – mostly historical claims experience – claims costs may differ from amounts provided. An analysis of changes in the liability for product warranties follows.
(In millions) | 2014 | 2013 | 2012 | |||||
Balance at January 1 | $ | 1,370 | $ | 1,429 | $ | 1,553 | ||
Current-year provisions | 593 | 798 | 645 | |||||
Expenditures | (714) | (867) | (757) | |||||
Other changes | (50) | 10 | (12) | |||||
Balance at December 31 | $ | 1,199 | $ | 1,370 | $ | 1,429 | ||
GUARANTEES
Our guarantees are provided in the ordinary course of business. We underwrite these guarantees considering economic, liquidity and credit risk of the counterparty. We believe that the likelihood is remote that any such arrangements could have a significant adverse effect on our financial position, results of operations or liquidity. We record liabilities for guarantees at estimated fair value, generally the amount of the premium received, or if we do not receive a premium, the amount based on appraisal, observed market values or discounted cash flows. Any associated expected recoveries from third parties are recorded as other receivables, not netted against the liabilities.
At December 31, 2014, we were committed under the following guarantee arrangements beyond those provided on behalf of VIEs. See Note 23.
Credit Support. We have provided $2,531 million of credit support on behalf of certain customers or associated companies, predominantly joint ventures and partnerships, using arrangements such as standby letters of credit and performance guarantees. These arrangements enable these customers and associated companies to execute transactions or obtain desired financing arrangements with third parties. Should the customer or associated company fail to perform under the terms of the transaction or financing arrangement, we would be required to perform on their behalf. Under most such arrangements, our guarantee is secured, usually by the asset being purchased or financed, or possibly by certain other assets of the customer or associated company. The length of these credit support arrangements parallels the length of the related financing arrangements or transactions. The liability for such credit support was $38 million at December 31, 2014.
Indemnification Agreements. We have agreements that require us to fund up to $28 million at December 31, 2014 under residual value guarantees on a variety of leased equipment. Under most of our residual value guarantees, our commitment is secured by the leased asset. The liability for these indemnification agreements was $10 million at December 31, 2014.
At December 31, 2014, we also had $923 million of other indemnification commitments, substantially all of which relate to representations and warranties in sales of businesses or assets.
GE 2014 FORM 10-K 209
FINANCIAL STATEMENTS | SUPPLEMENTAL CASH FLOWS INFORMATION |
NOTE 25. SUPPLEMENTAL CASH FLOWS INFORMATION
Changes in operating assets and liabilities are net of acquisitions and dispositions of principal businesses.
Amounts reported in the "Proceeds from sales of discontinued operations" and "Proceeds from principal business dispositions" lines in the Statement of Cash Flows are net of cash disposed and included certain deal-related costs. Amounts reported in the "Net cash from (payments for) principal businesses purchased" line is net of cash acquired and included certain deal-related costs and debt assumed and immediately repaid in acquisitions. Amounts reported in the "Proceeds from sale of equity interest in NBCU LLC" line included certain deal-related costs.
Amounts reported in the "All other operating activities" line in the Statement of Cash Flows consist primarily of adjustments to current and noncurrent accruals, deferrals of costs and expenses and adjustments to assets. GECC had non-cash transactions related to foreclosed properties and repossessed assets totaling $218 million, $482 million and $839 million in 2014, 2013 and 2012, respectively. Certain supplemental information related to our cash flows is shown below.
For the years ended December 31 (In millions) | 2014 | 2013 | 2012 | |||||
GE | ||||||||
Net dispositions (purchases) of GE shares for treasury | ||||||||
Open market purchases under share repurchase program | $ | (2,211) | $ | (10,225) | $ | (5,005) | ||
Other purchases | (49) | (91) | (110) | |||||
Dispositions | 1,042 | 1,038 | 951 | |||||
$ | (1,218) | $ | (9,278) | $ | (4,164) | |||
GECC | ||||||||
All other operating activities | ||||||||
Amortization of intangible assets | $ | 408 | $ | 425 | $ | 447 | ||
Net realized losses on investment securities | 17 | 523 | 34 | |||||
Cash collateral on derivative contracts | 745 | (2,271) | 2,900 | |||||
Increase (decrease) in other liabilities | (1,771) | 2,334 | 560 | |||||
Other | 841 | (912) | 1,477 | |||||
$ | 240 | $ | 99 | $ | 5,418 | |||
Net decrease (increase) in GECC financing receivables | ||||||||
Increase in loans to customers | $ | (323,050) | $ | (311,860) | $ | (308,156) | ||
Principal collections from customers - loans | 302,618 | 307,849 | 307,250 | |||||
Investment in equipment for financing leases | (8,120) | (8,652) | (9,192) | |||||
Principal collections from customers - financing leases | 8,421 | 9,646 | 10,976 | |||||
Net change in credit card receivables | (5,571) | (8,058) | (8,030) | |||||
Sales of financing receivables | 20,013 | 14,664 | 12,642 | |||||
$ | (5,689) | $ | 3,589 | $ | 5,490 | |||
All other investing activities | ||||||||
Purchases of investment securities | $ | (10,346) | $ | (16,422) | $ | (15,666) | ||
Dispositions and maturities of investment securities | 9,289 | 18,139 | 17,010 | |||||
Decrease (increase) in other assets - investments | (476) | 1,089 | 4,338 | |||||
Proceeds from sales of real estate properties | 5,920 | 10,680 | 3,381 | |||||
Other | 2,610 | 1,486 | 2,731 | |||||
$ | 6,997 | $ | 14,972 | $ | 11,794 | |||
Newly issued debt (maturities longer than 90 days) | ||||||||
Short-term (91 to 365 days) | $ | 29 | $ | 55 | $ | 59 | ||
Long-term (longer than one year) | 34,435 | 44,833 | 55,782 | |||||
$ | 34,464 | $ | 44,888 | $ | 55,841 | |||
Repayments and other reductions (maturities longer than 90 days) | ||||||||
Short-term (91 to 365 days) | $ | (47,694) | $ | (52,553) | $ | (94,114) | ||
Long-term (longer than one year) | (4,909) | (3,291) | (9,368) | |||||
Principal payments - non-recourse, leveraged leases | (454) | (585) | (426) | |||||
$ | (53,057) | $ | (56,429) | $ | (103,908) | |||
All other financing activities | ||||||||
Proceeds from sales of investment contracts | $ | 322 | $ | 491 | $ | 2,697 | ||
Redemption of investment contracts | (1,113) | (980) | (5,515) | |||||
Other | (300) | (420) | (49) | |||||
$ | (1,091) | $ | (909) | $ | (2,867) | |||
GE 2014 FORM 10-K 210
FINANCIAL STATEMENTS | INTERCOMPANY TRANSACTIONS |
NOTE 26. INTERCOMPANY TRANSACTIONS
Transactions between related companies are made on an arms-length basis, are eliminated and consist primarily of GECC dividends to GE; GE customer receivables sold to GECC; GECC services for trade receivables management and material procurement; buildings and equipment (including automobiles) leased between GE and GECC; information technology (IT) and other services sold to GECC by GE; aircraft engines manufactured by GE that are installed on aircraft purchased by GECC from third-party producers for lease to others; and various investments, loans and allocations of GE corporate overhead costs.
These intercompany transactions are reported in the GE and GECC columns of our financial statements, but are eliminated in deriving our consolidated financial statements. Effects of these eliminations on our consolidated cash flows from operating, investing and financing activities are $(5,404) million, $1,978 million and $3,426 million for 2014, $(5,088) million, $492 million and $4,690 million for 2013 and $(8,542) million, $2,328 million and $6,703 million for 2012, respectively. Details of these eliminations are shown below.
(In millions) | 2014 | 2013 | 2012 | ||||||
Cash from (used for) operating activities-continuing operations | |||||||||
Combined | $ | 32,919 | $ | 34,125 | $ | 39,557 | |||
GE customer receivables sold to GECC | (1,918) | 360 | (1,809) | ||||||
GECC dividends to GE | (3,000) | (5,985) | (6,426) | ||||||
Other reclassifications and eliminations | (486) | 537 | (307) | ||||||
$ | 27,515 | $ | 29,037 | $ | 31,015 | ||||
Cash from (used for) investing activities-continuing operations | |||||||||
Combined | $ | (6,720) | $ | 28,182 | $ | 9,262 | |||
GE customer receivables sold to GECC | 1,766 | 262 | 2,005 | ||||||
Other reclassifications and eliminations | 212 | 230 | 323 | ||||||
$ | (4,742) | $ | 28,674 | $ | 11,590 | ||||
Cash from (used for) financing activities-continuing operations | |||||||||
Combined | $ | (20,378) | $ | (50,319) | $ | (57,758) | |||
GE customer receivables sold to GECC | 152 | (622) | (196) | ||||||
GECC dividends to GE | 3,000 | 5,985 | 6,426 | ||||||
Other reclassifications and eliminations | 274 | (673) | 473 | ||||||
$ | (16,952) | $ | (45,629) | $ | (51,055) | ||||
GE 2014 FORM 10-K 211
FINANCIAL STATEMENTS | FINANCING RECEIVABLES - SUPPLEMENTAL INFORMATION |
NOTE 27. SUPPLEMENTAL INFORMATION ABOUT THE CREDIT QUALITY OF FINANCING RECEIVABLES AND ALLOWANCE FOR LOSSES ON FINANCING RECEIVABLES
CREDIT QUALITY INDICATORS
Detailed information about the credit quality of our Commercial, Real Estate and Consumer financing receivables portfolios is provided below. For each portfolio, we describe the characteristics of the financing receivables and provide information about collateral, payment performance, credit quality indicators and impairment. We manage these portfolios using delinquency and nonaccrual data as key performance indicators. The categories used within this section such as impaired loans, troubled debt restructuring (TDR) and nonaccrual financing receivables are defined by the authoritative guidance and we base our categorization on the related scope and definitions contained in the related standards. The categories of nonaccrual and delinquent are used in our process for managing our financing receivables.
PAST DUE AND NONACCRUAL FINANCING RECEIVABLES | ||||||||||||||||||
2014 | 2013 | |||||||||||||||||
Over 30 days | Over 90 days | Over 30 days | Over 90 days | |||||||||||||||
December 31 (In millions) | past due | past due | Nonaccrual | past due | past due | Nonaccrual | ||||||||||||
Commercial | ||||||||||||||||||
CLL | ||||||||||||||||||
Americas | $ | 503 | $ | 284 | $ | 1,054 | $ | 755 | $ | 359 | $ | 1,275 | ||||||
International | 1,483 | 749 | 946 | 1,490 | 820 | 1,459 | ||||||||||||
Total CLL | 1,986 | 1,033 | 2,000 | 2,245 | 1,179 | 2,734 | ||||||||||||
Energy Financial Services | - | - | 68 | - | - | 4 | ||||||||||||
GECAS | - | - | 419 | - | - | - | ||||||||||||
Other | - | - | - | - | - | 6 | ||||||||||||
Total Commercial | 1,986 | 1,033 | 2,487 | (a) | 2,245 | 1,179 | 2,744 | (a) | ||||||||||
Real Estate | 242 | 183 | 1,254 | (b) | 247 | 212 | 2,551 | (b) | ||||||||||
Consumer | ||||||||||||||||||
Non-U.S. residential mortgages | 2,171 | 1,195 | 1,262 | 3,406 | 2,104 | 2,161 | ||||||||||||
Non-U.S. installment and revolving credit | 333 | 89 | 53 | 601 | 159 | 106 | ||||||||||||
U.S. installment and revolving credit | 2,492 | 1,147 | 2 | 2,442 | 1,105 | 2 | ||||||||||||
Other | 141 | 64 | 167 | 172 | 99 | 351 | ||||||||||||
Total Consumer | 5,137 | 2,495 | (c) | 1,484 | (d) | 6,621 | 3,467 | (c) | 2,620 | (d) | ||||||||
Total | $ | 7,365 | $ | 3,711 | $ | 5,225 | $ | 9,113 | $ | 4,858 | $ | 7,915 | ||||||
Total as a percent of financing receivables | 3.0 | % | 1.5 | % | 2.2 | % | 3.5 | % | 1.9 | % | 3.1 | % | ||||||
(a) | Included $1,549 million and $1,397 million at December 31, 2014 and 2013, respectively, that are currently paying in accordance with their contractual terms. |
(b) | Included $1,018 million and $2,308 million at December 31, 2014 and 2013, respectively, that are currently paying in accordance with their contractual terms. |
(c) | Included $1,231 million and $1,197 million of Consumer loans at December 31, 2014 and 2013, respectively, that are over 90 days past due and continue to accrue interest until the accounts are written off in the period that the account becomes 180 days past due. |
(d) | Included $179 million and $324 million at December 31, 2014 and 2013, respectively, that are currently paying in accordance with their contractual terms. |
GE 2014 FORM 10-K 212
FINANCIAL STATEMENTS | FINANCING RECEIVABLES - SUPPLEMENTAL INFORMATION |
IMPAIRED LOANS AND RELATED RESERVES | ||||||||||||||||||||
With no specific allowance | With a specific allowance | |||||||||||||||||||
Recorded | Unpaid | Average | Recorded | Unpaid | Average | |||||||||||||||
investment | principal | investment | investment | principal | Associated | investment | ||||||||||||||
December 31 (In millions) | in loans | balance | in loans | in loans | balance | allowance | in loans | |||||||||||||
2014 | ||||||||||||||||||||
Commercial | ||||||||||||||||||||
CLL | ||||||||||||||||||||
Americas | $ | 1,352 | $ | 1,897 | $ | 1,626 | $ | 126 | $ | 160 | $ | 28 | $ | 254 | ||||||
International(a) | 940 | 2,500 | 1,099 | 280 | 965 | 105 | 463 | |||||||||||||
Total CLL | 2,292 | 4,397 | 2,725 | 406 | 1,125 | 133 | 717 | |||||||||||||
Energy Financial Services | 53 | 54 | 26 | 15 | 15 | 12 | 24 | |||||||||||||
GECAS | 329 | 337 | 88 | - | - | - | 15 | |||||||||||||
Other | - | - | - | - | - | - | 1 | |||||||||||||
Total Commercial(b) | 2,674 | 4,788 | 2,839 | 421 | 1,140 | 145 | 757 | |||||||||||||
Real Estate(c) | 1,555 | 1,854 | 2,285 | 317 | 443 | 25 | 686 | |||||||||||||
Consumer(d) | 138 | 179 | 120 | 2,042 | 2,092 | 408 | 2,547 | |||||||||||||
Total | $ | 4,367 | $ | 6,821 | $ | 5,244 | $ | 2,780 | $ | 3,675 | $ | 578 | $ | 3,990 | ||||||
2013 | ||||||||||||||||||||
Commercial | ||||||||||||||||||||
CLL | ||||||||||||||||||||
Americas | $ | 1,670 | $ | 2,187 | $ | 2,154 | $ | 417 | $ | 505 | $ | 96 | $ | 509 | ||||||
International(a) | 1,104 | 3,082 | 1,136 | 691 | 1,059 | 231 | 629 | |||||||||||||
Total CLL | 2,774 | 5,269 | 3,290 | 1,108 | 1,564 | 327 | 1,138 | |||||||||||||
Energy Financial Services | - | - | - | 4 | 4 | 1 | 2 | |||||||||||||
GECAS | - | - | - | - | - | - | 1 | |||||||||||||
Other | 2 | 3 | 9 | 4 | 4 | - | 5 | |||||||||||||
Total Commercial(b) | 2,776 | 5,272 | 3,299 | 1,116 | 1,572 | 328 | 1,146 | |||||||||||||
Real Estate(c) | 2,615 | 3,036 | 3,058 | 1,245 | 1,507 | 74 | 1,688 | |||||||||||||
Consumer(d) | 109 | 153 | 98 | 2,879 | 2,948 | 567 | 3,058 | |||||||||||||
Total | $ | 5,500 | $ | 8,461 | $ | 6,455 | $ | 5,240 | $ | 6,027 | $ | 969 | $ | 5,892 | ||||||
(a) | Write-offs to net realizable value are recognized against the allowance for losses primarily in the reporting period in which management has deemed all or a portion of the financing receivable to be uncollectible, but not later than 360 days after initial recognition of a specific reserve for a collateral dependent loan. However, in accordance with regulatory standards that are applicable in Italy, commercial loans are considered uncollectible when there is demonstrable evidence of the debtor's insolvency, which may result in write-offs occurring beyond 360 days after initial recognition of a specific reserve. |
(b) | We recognized $178 million and $218 million of interest income, including none and $60 million on a cash basis, at December 31, 2014 and 2013, respectively, principally in our CLL Americas business. The total average investment in impaired loans at December 31, 2014 and 2013 was $3,596 million and $4,445 million, respectively. |
(c) | We recognized $56 million and $187 million of interest income, including none and $135 million on a cash basis, at December 31, 2014 and 2013, respectively. The total average investment in impaired loans at December 31, 2014 and 2013 was $2,971 million and $4,746 million, respectively. |
(d) | We recognized $126 million and $221 million of interest income, including $5 million, and $3 million on a cash basis, at December 31, 2014 and 2013, respectively, principally in our Consumer-U.S. installment and revolving credit portfolios. The total average investment in impaired loans at December 31, 2014 and 2013 was $2,667 million and $3,156 million, respectively. |
GE 2014 FORM 10-K 213
FINANCIAL STATEMENTS | FINANCING RECEIVABLES - SUPPLEMENTAL INFORMATION |
December 31 (In millions) | Non-impaired financing receivables | General reserves | Impaired loans | Specific reserves | |||||||
2014 | |||||||||||
Commercial | $ | 118,381 | $ | 758 | $ | 3,095 | $ | 145 | |||
Real Estate | 17,925 | 136 | 1,872 | 25 | |||||||
Consumer | 98,640 | 3,603 | 2,180 | 408 | |||||||
Total | $ | 234,946 | $ | 4,497 | $ | 7,147 | $ | 578 | |||
2013 | |||||||||||
Commercial | $ | 125,377 | $ | 677 | $ | 3,892 | $ | 328 | |||
Real Estate | 16,039 | 118 | 3,860 | 74 | |||||||
Consumer | 106,051 | 3,414 | 2,988 | 567 | |||||||
Total | $ | 247,467 | $ | 4,209 | $ | 10,740 | $ | 969 | |||
We regularly review our Real Estate loans for impairment using both quantitative and qualitative factors, such as debt service coverage and loan-to-value ratios. We evaluate a Real Estate loan for impairment when the most recent valuation reflects a projected loan-to-value ratio at maturity in excess of 100%, even if the loan is currently paying in accordance with its contractual terms.
Of our $1,872 million of impaired loans at Real Estate at December 31, 2014, $1,641 million are currently paying in accordance with the contractual terms of the loan and are typically loans where the borrower has adequate debt service coverage to meet contractual interest obligations. Impaired loans at CLL primarily represent senior secured lending positions.
IMPAIRED LOAN BALANCE CLASSIFIED BY THE METHOD USED TO MEASURE IMPAIRMENT | |||||||||||
December 31 (In millions) | 2014 | 2013 | |||||||||
Discounted cash flow | $ | 3,994 | $ | 5,558 | |||||||
Collateral value | 3,153 | 5,182 | |||||||||
Total | $ | 7,147 | $ | 10,740 | |||||||
Our loss mitigation strategy is intended to minimize economic loss and, at times, can result in rate reductions, principal forgiveness, extensions, forbearance or other actions, which may cause the related loan to be classified as a troubled debt restructuring (TDR), and also as impaired. The determination of whether these changes to the terms and conditions of our commercial loans meet the TDR criteria includes our consideration of all relevant facts and circumstances. At December 31, 2014, TDRs included in impaired loans were $5,806 million, primarily relating to Consumer ($2,132 million), CLL ($1,869 million) and Real Estate ($1,757 million).
GE 2014 FORM 10-K 214
FINANCIAL STATEMENTS | FINANCING RECEIVABLES - SUPPLEMENTAL INFORMATION |
Real Estate TDRs decreased from $3,625 million at December 31, 2013 to $1,757 million at December 31, 2014, primarily driven by resolution of TDRs through paydowns. For borrowers with demonstrated operating capabilities, we work to restructure loans when the cash flow and projected value of the underlying collateral support repayment over the modified term. We deem loan modifications to be TDRs when we have granted a concession to a borrower experiencing financial difficulty and we do not receive adequate compensation in the form of an effective interest rate that is at current market rates of interest given the risk characteristics of the loan or other consideration that compensates us for the value of the concession. The limited liquidity and higher return requirements in the real estate market for loans with higher loan-to-value (LTV) ratios has typically resulted in the conclusion that the modified terms are not at current market rates of interest, even if the modified loans are expected to be fully recoverable. For the year ended December 31, 2014, we modified $672 million of loans classified as TDRs. Changes to these loans primarily included forbearance, maturity extensions and changes to collateral or covenant terms or other actions, which are in addition to, or sometimes in lieu of, fees and rate increases. We received the same or additional compensation in the form of rate increases and fees for the majority of these TDRs. Of our $672 million and $1,595 million of modifications classified as TDRs during 2014 and 2013, respectively, $252 million and $197 million have subsequently experienced a payment default in 2014 and 2013, respectively.
The substantial majority of the Real Estate TDRs have reserves determined based upon collateral value. Our specific reserves on Real Estate TDRs were $25 million and $70 million and were 1.4% and 1.9%, of Real Estate TDRs, respectively, at December 31, 2014 and 2013. In many situations these loans did not require a specific reserve as collateral value adequately covered our recorded investment in the loan. While these modified loans had adequate collateral coverage, we were still required to complete our TDR classification evaluation on each of the modifications without regard to collateral adequacy.
Impaired loans in our Consumer business represent restructured smaller balance homogeneous loans meeting the definition of a TDR, and are therefore subject to the disclosure requirement for impaired loans, and commercial loans in our Consumer–Other portfolio. The recorded investment of these impaired loans totaled $2,180 million (with an unpaid principal balance of $2,271 million) and comprised $138 million with no specific allowance, primarily all in our Consumer–Other portfolio, and $2,042 million with a specific allowance of $408 million at December 31, 2014. The impaired loans with a specific allowance included $70 million with a specific allowance of $7 million in our Consumer–Other portfolio and $1,972 million with a specific allowance of $401 million across the remaining Consumer business and had an unpaid principal balance and average investment of $2,092 million and $2,547 million, respectively, at December 31, 2014.
GE 2014 FORM 10-K 215
FINANCIAL STATEMENTS | FINANCING RECEIVABLES - SUPPLEMENTAL INFORMATION |
We also utilize certain short-term (three months or less) loan modification programs for borrowers experiencing temporary financial difficulties in our Consumer loan portfolio, which are not classified as TDRs. These loan modification programs are primarily concentrated in our non-U.S. residential mortgage and non-U.S. installment and revolving portfolios. We sold our U.S. residential mortgage business in 2007 and, as such, do not participate in the U.S. government-sponsored mortgage modification programs. For the year ended December 31, 2014, we provided short-term modifications of $45 million of consumer loans for borrowers experiencing financial difficulties, substantially all in our non-U.S. residential mortgage, credit card and personal loan portfolios. For these modified loans, we provided insignificant interest rate reductions and payment deferrals, which were not part of the terms of the original contract. We expect borrowers whose loans have been modified under these short-term programs to continue to be able to meet their contractual obligations upon the conclusion of the short-term modification.
SUPPLEMENTAL CREDIT QUALITY INFORMATION
COMMERCIAL
Substantially all of our Commercial financing receivables portfolio is secured lending and we assess the overall quality of the portfolio based on the potential risk of loss measure. The metric incorporates both the borrower's credit quality along with any related collateral protection.
Our internal risk ratings process is an important source of information in determining our allowance for losses and represents a comprehensive approach to evaluate risk in our financing receivables portfolios. In deriving our internal risk ratings, we stratify our Commercial portfolios into 21 categories of default risk and/or six categories of loss given default to group into three categories: A, B and C. Our process starts by developing an internal risk rating for our borrowers, which is based upon our proprietary models using data derived from borrower financial statements, agency ratings, payment history information, equity prices and other commercial borrower characteristics. We then evaluate the potential risk of loss for the specific lending transaction in the event of borrower default, which takes into account such factors as applicable collateral value, historical loss and recovery rates for similar transactions, and our collection capabilities. Our internal risk ratings process and the models we use are subject to regular monitoring and internal controls. The frequency of rating updates is set by our credit risk policy, which requires annual Risk Committee approval.
GE 2014 FORM 10-K 216
FINANCIAL STATEMENTS | FINANCING RECEIVABLES - SUPPLEMENTAL INFORMATION |
COMMERCIAL FINANCING RECEIVABLES BY RISK CATEGORY | |||||||||||
Secured | |||||||||||
December 31 (In millions) | A | B | C | Total | |||||||
2014 | |||||||||||
CLL | |||||||||||
Americas | $ | 63,754 | $ | 1,549 | $ | 1,443 | $ | 66,746 | |||
International | 41,476 | 474 | 891 | 42,841 | |||||||
Total CLL | 105,230 | 2,023 | 2,334 | 109,587 | |||||||
Energy Financial Services | 2,479 | 60 | 16 | 2,555 | |||||||
GECAS | 7,908 | 237 | 118 | 8,263 | |||||||
Other | 130 | - | - | 130 | |||||||
Total | $ | 115,747 | $ | 2,320 | $ | 2,468 | $ | 120,535 | |||
2013 | |||||||||||
CLL | |||||||||||
Americas | $ | 65,545 | $ | 1,587 | $ | 1,554 | $ | 68,686 | |||
International | 44,930 | 619 | 1,237 | 46,786 | |||||||
Total CLL | 110,475 | 2,206 | 2,791 | 115,472 | |||||||
Energy Financial Services | 2,969 | 9 | - | 2,978 | |||||||
GECAS | 9,175 | 50 | 152 | 9,377 | |||||||
Other | 318 | - | - | 318 | |||||||
Total | $ | 122,937 | $ | 2,265 | $ | 2,943 | $ | 128,145 | |||
For our secured financing receivables portfolio, our collateral position and ability to work out problem accounts mitigate our losses. Our asset managers have deep industry expertise that enables us to identify the optimum approach to default situations. We price risk premiums for weaker credits at origination, closely monitor changes in creditworthiness through our risk ratings and watch list process, and are engaged early with deteriorating credits to minimize economic loss. Secured financing receivables within risk Category C are predominantly in our CLL businesses and are primarily composed of senior term lending facilities and factoring programs secured by various asset types including inventory, accounts receivable, cash, equipment and related business facilities as well as franchise finance activities secured by underlying equipment.
Loans within Category C are reviewed and monitored regularly, and classified as impaired when it is probable that they will not pay in accordance with contractual terms. Our internal risk rating process identifies credits warranting closer monitoring; and as such, these loans are not necessarily classified as nonaccrual or impaired.
Our unsecured Commercial financing receivables portfolio is primarily attributable to our Interbanca S.p.A. and GE Sanyo Credit acquisitions in CLL International. At December 31, 2014 and 2013, these financing receivables included $332 million and $313 million rated A, $408 million and $580 million rated B, and $201 million and $231 million rated C, respectively.
REAL ESTATE
Due to the primarily non-recourse nature of our Debt portfolio, loan-to-value ratios (the ratio of the outstanding debt on a property to the re-indexed value of that property) provide the best indicators of the credit quality of the portfolio.
Loan-to-value ratio | |||||||||||||||||
2014 | 2013 | ||||||||||||||||
Less than | 80% to | Greater than | Less than | 80% to | Greater than | ||||||||||||
December 31 (In millions) | 80% | 95% | 95% | 80% | 95% | 95% | |||||||||||
Debt | $ | 16,915 | $ | 1,175 | $ | 958 | $ | 15,576 | $ | 1,300 | $ | 2,111 | |||||
GE 2014 FORM 10-K 217
FINANCIAL STATEMENTS | FINANCING RECEIVABLES - SUPPLEMENTAL INFORMATION |
The credit quality of the owner occupied/credit tenant portfolio is primarily influenced by the strength of the borrower's general credit quality, which is reflected in our internal risk rating process, consistent with the process we use for our Commercial portfolio. As of December 31, 2014, the balances of our owner occupied/credit tenant portfolio with an internal risk rating of A, B and C approximated $589 million, $70 million and $90 million, respectively, as compared to the December 31, 2013, balances of $571 million, $179 million and $162 million, respectively.
The financing receivables within our Debt portfolio are primarily concentrated in our North American and European Lending platforms and are secured by various property types. A substantial majority of our Debt financing receivables with loan-to-value ratios greater than 95% are paying in accordance with contractual terms. Substantially all of these loans and the majority of our owner occupied/credit tenant financing receivables included in Category C are impaired loans that are subject to the specific reserve evaluation process. The ultimate recoverability of impaired loans is driven by collection strategies that do not necessarily depend on the sale of the underlying collateral and include full or partial repayments through third-party refinancing and restructurings.
CONSUMER
At December 31, 2014, our U.S. consumer financing receivables included private-label credit card and sales financing for approximately 64 million customers across the U.S. with no metropolitan area accounting for more than 6% of the portfolio. Of the total U.S. consumer financing receivables, approximately 67% relate to credit card loans that are often subject to profit and loss sharing arrangements with the retailer (which are recorded in revenues), and the remaining 33% are sales finance receivables that provide financing to customers in areas such as electronics, recreation, medical and home improvement.
Our Consumer financing receivables portfolio comprises both secured and unsecured lending. Secured financing receivables comprise residential loans and lending to small and medium-sized enterprises predominantly secured by auto and equipment, inventory finance, and cash flow loans. Unsecured financing receivables include private-label credit card financing. A substantial majority of these cards are not for general use and are limited to the products and services sold by the retailer. The private-label portfolio is diverse with no metropolitan area accounting for more than 5% of the related portfolio.
Non-U.S. residential mortgages
For our secured non-U.S. residential mortgage book, we assess the overall credit quality of the portfolio through loan-to-value ratios (the ratio of the outstanding debt on a property to the value of that property at origination). In the event of default and repossession of the underlying collateral, we have the ability to remarket and sell the properties to eliminate or mitigate the potential risk of loss.
Loan-to-value ratio | |||||||||||||||||
2014 | 2013 | ||||||||||||||||
80% or | Greater than | Greater than | 80% or | Greater than | Greater than | ||||||||||||
December 31 (In millions) | less | 80% to 90% | 90% | less | 80% to 90% | 90% | |||||||||||
Non-U.S. residential mortgages | $ | 13,964 | $ | 4,187 | $ | 6,742 | $ | 17,224 | $ | 5,130 | $ | 8,147 | |||||
The majority of these financing receivables are in our U.K. and France portfolios and have re-indexed loan-to-value ratios of 70% and 55%, respectively. Re-indexed loan-to-value ratios may not reflect actual realizable values of future repossessions. We have third-party mortgage insurance for about 21% of the balance of Consumer non-U.S. residential mortgage loans with loan-to-value ratios greater than 90% at December 31, 2014. Such loans were primarily originated in France and the U.K.
2014 FORM 10-K 218
FINANCIAL STATEMENTS | FINANCING RECEIVABLES - SUPPLEMENTAL INFORMATION |
We assess overall credit quality using internal and external credit scores. For our U.S. installment and revolving credit portfolio we use Fair Isaac Corporation ("FICO") scores. FICO scores are generally obtained at origination of the account and are refreshed at a minimum quarterly, but could be as often as weekly, to assist in predicting customer behavior. We categorize these credit scores into the following three categories; (a) 661 or higher, which are considered the strongest credits; (b) 601 to 660, which are considered moderate credit risk; and (c) 600 or less, which are considered weaker credits.
Refreshed FICO score | |||||||||||||||||
2014 | 2013 | ||||||||||||||||
661 or | 601 to | 600 or | 661 or | 601 to | 600 or | ||||||||||||
December 31 (In millions) | higher | 660 | less | higher | 660 | less | |||||||||||
U.S. installment and | |||||||||||||||||
revolving credit | $ | 43,466 | $ | 11,865 | $ | 4,532 | $ | 40,079 | $ | 11,142 | $ | 4,633 | |||||
For our non-U.S. installment and revolving credit, our internal credit scores imply a probability of default that we consistently translate into three approximate credit bureau equivalent credit score categories, including (a) 671 or higher, which are considered the strongest credits; (b) 626 to 670, which are considered moderate credit risk; and (c) 625 or less, which are considered weaker credits.
Internal ratings translated to approximate credit bureau equivalent score | |||||||||||||||||
2014 | 2013 | ||||||||||||||||
671 or | 626 to | 625 or | 671 or | 626 to | 625 or | ||||||||||||
December 31 (In millions) | higher | 670 | less | higher | 670 | less | |||||||||||
Non-U.S. installment and | |||||||||||||||||
revolving credit | $ | 6,599 | $ | 2,045 | $ | 1,756 | $ | 9,705 | $ | 3,228 | $ | 2,798 | |||||
U.S. installment and revolving credit accounts with FICO scores of 600 or less and non U.S. installment and revolving credit accounts with credit bureau equivalent scores of 625 or less have an average outstanding balance less than one thousand U.S. dollars and are primarily concentrated in our retail card and sales finance receivables in the U.S. and closed-end loans outside the U.S., which minimizes the potential for loss in the event of default. For lower credit scores, we adequately price for the incremental risk at origination and monitor credit migration through our risk ratings process. We continuously adjust our credit line underwriting management and collection strategies based on customer behavior and risk profile changes.
Consumer – Other
We develop our internal risk ratings for this portfolio in a manner consistent with the process used to develop our Commercial credit quality indicators, described above. We use the borrower's credit quality and underlying collateral strength to determine the potential risk of loss from these activities.
GE 2014 FORM 10-K 219
FINANCIAL STATEMENTS | OPERATING SEGMENTS |
NOTE 28. OPERATING SEGMENTS
BASIS FOR PRESENTATION
Our operating businesses are organized based on the nature of markets and customers. Segment accounting policies are the same as described in Note 1. Segment results for our financial services businesses reflect the discrete tax effect of transactions.
Results of our formerly consolidated subsidiary, NBCU, and our equity method investment in NBCU LLC, which we sold in the first quarter of 2013 are reported in the Corporate items and eliminations line on the Summary of Operating Segments.
A description of our operating segments as of December 31, 2014, can be found below, and details of segment profit by operating segment can be found in the Summary of Operating Segments table in "Management's Discussion and Analysis of Financial Condition and Results of Operations" section in this Form 10-K Report.
POWER & WATER
Power plant products and services, including design, installation, operation and maintenance services are sold into global markets. Gas, steam and aeroderivative turbines, nuclear reactors, generators, combined cycle systems, controls and related services, including total asset optimization solutions, equipment upgrades and long-term maintenance service agreements are sold to power generation and other industrial customers. Renewable energy solutions include wind turbines. Water treatment services and equipment include specialty chemical treatment programs, water purification equipment, mobile treatment systems and desalination processes.
OIL & GAS
Oil & Gas supplies mission critical equipment for the global oil and gas industry, used in applications spanning the entire value chain from drilling and completion through production, liquefied natural gas (LNG) and pipeline compression, pipeline inspection, and including downstream processing in refineries and petrochemical plants. The business designs and manufactures surface and subsea drilling and production systems, equipment for floating production platforms, compressors, turbines, turboexpanders, high pressure reactors, industrial power generation and a broad portfolio of auxiliary equipment.
ENERGY MANAGEMENT
Energy Management is GE's electrification business. Global teams design leading technology solutions for the delivery, management, conversion and optimization of electrical power for customers across multiple energy-intensive industries. GE has invested in our Energy Management capabilities, with strategic acquisitions and joint ventures that enable GE to increase its offerings to the utility, industrial, renewables, oil and gas, marine, metals and mining industries. Plant automation hardware, software and embedded computing systems including controllers, embedded systems, advanced software, motion control, operator interfaces and industrial computers are also provided by Energy Management.
AVIATION
Aviation products and services include jet engines, aerospace systems and equipment, replacement parts and repair and maintenance services for all categories of commercial aircraft; for a wide variety of military aircraft, including fighters, bombers, tankers and helicopters; for marine applications; and for executive and regional aircraft. Products and services are sold worldwide to airframe manufacturers, airlines and government agencies.
GE 2014 FORM 10-K 220
FINANCIAL STATEMENTS | OPERATING SEGMENTS |
HEALTHCARE
Healthcare products include diagnostic imaging systems such as magnetic resonance (MR), computed tomography (CT) and positron emission tomography (PET) scanners, X-ray, nuclear imaging, digital mammography and molecular imaging technologies. Healthcare-manufactured technologies include patient and resident monitoring, diagnostic cardiology, ultrasound, bone densitometry, anesthesiology and oxygen therapy, and neonatal and critical care devices. Related services include equipment monitoring and repair, information technologies and customer productivity services. Products also include diagnostic imaging agents used in medical scanning procedures, drug discovery, biopharmaceutical manufacturing and purification, and tools for protein and cellular analysis for pharmaceutical and academic research, including a pipeline of precision molecular diagnostics in development for neurology, cardiology and oncology applications. Products and services are sold worldwide to hospitals, medical facilities, pharmaceutical and biotechnology companies, and to the life science research market.
TRANSPORTATION
Transportation is a global technology leader and supplier to the railroad, mining, marine and drilling industries. GE provides freight and passenger locomotives, diesel engines for rail, marine and stationary power applications, railway signaling and communications systems, underground mining equipment, motorized drive systems for mining trucks, information technology solutions, high-quality replacement parts and value added services.
APPLIANCES & LIGHTING
Products include major appliances and related services for products such as refrigerators, freezers, electric and gas ranges, cooktops, dishwashers, clothes washers and dryers, microwave ovens, room air conditioners, residential water systems for filtration, softening and heating, and hybrid water heaters. These products are distributed both to retail outlets and direct to consumers, mainly for the replacement market, and to building contractors and distributors for new installations. Lighting products include a wide variety of lamps and lighting fixtures, including light-emitting diodes. Products and services are sold in North America and in global markets under various GE and private-label brands.
GE CAPITAL
GE Capital businesses offer a broad range of financial services and products worldwide for businesses of all sizes. Services include commercial loans and leases, fleet management, financial programs, credit cards, personal loans and other financial services. GE Capital also develops strategic partnerships and joint ventures that utilize GE's industry-specific expertise in aviation, energy, infrastructure and healthcare to capitalize on market-specific opportunities. Products and services are offered in North America and in global markets through the following businesses: CLL, Consumer, Real Estate, Energy Financial Services and GECAS.
GE 2014 FORM 10-K 221
FINANCIAL STATEMENTS | OPERATING SEGMENTS |
REVENUES | ||||||||||||||||||||||||||
Total revenues(a) | Intersegment revenues(b) | External revenues | ||||||||||||||||||||||||
(In millions) | 2014 | 2013 | 2012 | 2014 | 2013 | 2012 | 2014 | 2013 | 2012 | |||||||||||||||||
Power & Water | $ | 27,564 | $ | 24,724 | $ | 28,299 | $ | 969 | $ | 947 | $ | 1,119 | $ | 26,595 | $ | 23,777 | $ | 27,180 | ||||||||
Oil & Gas | 18,676 | 16,975 | 15,241 | 401 | 360 | 314 | 18,275 | 16,615 | 14,927 | |||||||||||||||||
Energy Management | 7,319 | 7,569 | 7,412 | 890 | 848 | 487 | 6,429 | 6,721 | 6,925 | |||||||||||||||||
Aviation | 23,990 | 21,911 | 19,994 | 692 | 500 | 672 | 23,298 | 21,411 | 19,322 | |||||||||||||||||
Healthcare | 18,299 | 18,200 | 18,290 | 6 | 14 | 37 | 18,293 | 18,186 | 18,253 | |||||||||||||||||
Transportation | 5,650 | 5,885 | 5,608 | (2) | 12 | 11 | 5,652 | 5,873 | 5,597 | |||||||||||||||||
Appliances & Lighting | 8,404 | 8,338 | 7,967 | 22 | 25 | 23 | 8,382 | 8,313 | 7,944 | |||||||||||||||||
Total industrial | 109,902 | 103,602 | 102,811 | 2,978 | 2,706 | 2,663 | 106,924 | 100,896 | 100,148 | |||||||||||||||||
GE Capital | 42,725 | 44,067 | 45,364 | 1,348 | 1,150 | 1,037 | 41,377 | 42,917 | 44,327 | |||||||||||||||||
Corporate items | ||||||||||||||||||||||||||
and eliminations(c) | (4,038) | (1,624) | (1,491) | (4,326) | (3,856) | (3,700) | 288 | 2,232 | 2,209 | |||||||||||||||||
Total | $ | 148,589 | $ | 146,045 | $ | 146,684 | $ | - | $ | - | $ | - | $ | 148,589 | $ | 146,045 | $ | 146,684 | ||||||||
| (a) | Revenues of GE businesses include income from sales of goods and services to customers and other income. |
| (b) | Sales from one component to another generally are priced at equivalent commercial selling prices. |
| (c) | Includes the results of NBCU (our formerly consolidated subsidiary) and our former equity method investment in NBCUniversal LLC. |
Revenues from customers located in the United States were $70,622 million, $68,617 million and $70,466 million in 2014, 2013 and 2012, respectively. Revenues from customers located outside the United States were $77,967 million, $77,428 million and $76,218 million in 2014, 2013 and 2012, respectively.
Property, plant and | ||||||||||||||||||||||||||
Assets(a)(b) | equipment additions(c) | Depreciation and amortization | ||||||||||||||||||||||||
At December 31 | For the years ended December 31 | For the years ended December 31 | ||||||||||||||||||||||||
(In millions) | 2014 | 2013 | 2012 | 2014 | 2013 | 2012 | 2014 | 2013 | 2012 | |||||||||||||||||
Power & Water | $ | 30,338 | $ | 29,494 | $ | 27,143 | $ | 622 | $ | 714 | $ | 661 | $ | 678 | $ | 668 | $ | 647 | ||||||||
Oil & Gas | 27,260 | 26,193 | 20,111 | 653 | 1,185 | 467 | 583 | 479 | 426 | |||||||||||||||||
Energy Management | 10,976 | 10,305 | 9,594 | 176 | 137 | 155 | 313 | 323 | 287 | |||||||||||||||||
Aviation | 33,716 | 32,273 | 25,145 | 1,197 | 1,178 | 781 | 824 | 677 | 644 | |||||||||||||||||
Healthcare | 29,227 | 27,858 | 28,369 | 405 | 316 | 322 | 843 | 861 | 879 | |||||||||||||||||
Transportation | 4,449 | 4,418 | 4,335 | 128 | 282 | 724 | 168 | 167 | 90 | |||||||||||||||||
Appliances & Lighting | 4,560 | 4,306 | 4,201 | 359 | 405 | 485 | 235 | 300 | 265 | |||||||||||||||||
GE Capital | 500,216 | 516,829 | 539,351 | 10,410 | 9,978 | 11,879 | 7,262 | 7,738 | 7,348 | |||||||||||||||||
Corporate items | ||||||||||||||||||||||||||
and eliminations(d) | 7,607 | 4,884 | 26,750 | (110) | 194 | (99) | 166 | 260 | 218 | |||||||||||||||||
Total | $ | 648,349 | $ | 656,560 | $ | 684,999 | $ | 13,840 | $ | 14,389 | $ | 15,375 | $ | 11,072 | $ | 11,473 | $ | 10,804 | ||||||||
| (a) | Assets of discontinued operations, NBCU (our formerly consolidated subsidiary) and our former equity method investment in NBCUniversal LLC are included in Corporate items and eliminations for all periods presented. |
| (b) | Total assets of Power & Water, Oil & Gas, Energy Management, Aviation, Healthcare, Transportation, Appliances & Lighting and GE Capital operating segments at December 31, 2014, include investment in and advances to associated companies of $357 million, $146 million, $824 million, $1,378 million, $511 million, $6 million, $57 million and $16,747 million, respectively. Investments in and advances to associated companies contributed approximately $(7) million, $20 million, $29 million, $94 million, $(33) million, an insignificant amount , $70 million and $1,182 million to segment pre-tax income of Power & Water, Oil & Gas, Energy Management, Aviation, Healthcare, Transportation, Appliances & Lighting and GE Capital operating segments, respectively, for the year ended December 31, 2014. Aggregate summarized financial information for significant associated companies assuming a 100% ownership interest at December 31, 2014 included: total assets of $93,624 million, primarily financing receivables of $46,481 million; total liabilities of $64,872 million, primarily debt of $40,244 million; revenues totaled $46,087 million; and net loss totaled $(1,295) million. |
| (c) | Additions to property, plant and equipment include amounts relating to principal businesses purchased. |
| (d) | Includes deferred income taxes that are presented as assets for purposes of our consolidating balance sheet presentation. |
GE 2014 FORM 10-K 222
FINANCIAL STATEMENTS | QUARTERLY INFORMATION |
Interest and other financial charges | Provision (benefit) for income taxes | ||||||||||||||||
(In millions) | 2014 | 2013 | 2012 | 2014 | 2013 | 2012 | |||||||||||
GE Capital | $ | 8,397 | $ | 9,267 | $ | 11,596 | $ | 138 | $ | (992) | $ | 521 | |||||
Corporate items and eliminations(a) | 1,085 | 849 | 811 | 1,634 | 1,668 | 2,013 | |||||||||||
Total | $ | 9,482 | $ | 10,116 | $ | 12,407 | $ | 1,772 | $ | 676 | $ | 2,534 | |||||
| (a) | Included amounts for Power & Water, Oil & Gas, Energy Management, Aviation, Healthcare, Transportation and Appliances & Lighting, for which our measure of segment profit excludes interest and other financial charges and income taxes. |
Property, plant and equipment – net associated with operations based in the United States were $28,186 million, $28,657 million and $27,192 million at year-end 2014, 2013 and 2012, respectively. Property, plant and equipment – net associated with operations based outside the United States were $38,201 million, $40,170 million and $41,441 million at year-end 2014, 2013 and 2012, respectively.
NOTE 29. QUARTERLY INFORMATION (UNAUDITED)
First quarter | Second quarter | Third quarter | Fourth quarter | ||||||||||||||||||||
(In millions; per-share amounts in dollars) | 2014 | 2013 | 2014 | 2013 | 2014 | 2013 | 2014 | 2013 | |||||||||||||||
Consolidated operations | |||||||||||||||||||||||
Earnings from continuing operations | $ | 2,940 | $ | 3,631 | $ | 3,586 | $ | 3,423 | $ | 3,452 | $ | 3,272 | $ | 5,479 | $ | 5,149 | |||||||
Earnings (loss) from discontinued | |||||||||||||||||||||||
operations | 12 | (120) | (41) | (124) | 57 | (91) | (140) | (1,785) | |||||||||||||||
Net earnings | 2,952 | 3,511 | 3,545 | 3,299 | 3,509 | 3,181 | 5,339 | 3,364 | |||||||||||||||
Less net earnings (loss) attributable to | |||||||||||||||||||||||
noncontrolling interests | (47) | (16) | - | 166 | (28) | (10) | 187 | 158 | |||||||||||||||
Net earnings attributable to | |||||||||||||||||||||||
the Company | $ | 2,999 | $ | 3,527 | $ | 3,545 | $ | 3,133 | $ | 3,537 | $ | 3,191 | $ | 5,152 | $ | 3,206 | |||||||
Per-share amounts – earnings from | |||||||||||||||||||||||
continuing operations | |||||||||||||||||||||||
Diluted earnings per share | $ | 0.29 | $ | 0.35 | $ | 0.35 | $ | 0.31 | $ | 0.34 | $ | 0.32 | $ | 0.52 | $ | 0.49 | |||||||
Basic earnings per share | 0.30 | 0.35 | 0.36 | 0.32 | 0.35 | 0.32 | 0.53 | 0.49 | |||||||||||||||
Per-share amounts – earnings (loss) | |||||||||||||||||||||||
from discontinued operations | |||||||||||||||||||||||
Diluted earnings per share | - | (0.01) | - | (0.01) | 0.01 | (0.01) | (0.01) | (0.18) | |||||||||||||||
Basic earnings per share | - | (0.01) | - | (0.01) | 0.01 | (0.01) | (0.01) | (0.18) | |||||||||||||||
Per-share amounts – net earnings | |||||||||||||||||||||||
Diluted earnings per share | 0.30 | 0.34 | 0.35 | 0.30 | 0.35 | 0.31 | 0.51 | 0.32 | |||||||||||||||
Basic earnings per share | 0.30 | 0.34 | 0.35 | 0.30 | 0.35 | 0.31 | 0.51 | 0.32 | |||||||||||||||
Selected data | |||||||||||||||||||||||
GE | |||||||||||||||||||||||
Sales of goods and services | $ | 24,011 | $ | 22,303 | $ | 26,226 | $ | 24,623 | $ | 26,025 | $ | 25,262 | $ | 31,046 | $ | 28,826 | |||||||
Gross profit from sales | 5,326 | 4,867 | 6,090 | 6,006 | 6,148 | 5,691 | 7,867 | 6,820 | |||||||||||||||
GECC | |||||||||||||||||||||||
Total revenues | 10,515 | 11,468 | 10,247 | 10,916 | 10,451 | 10,606 | 11,512 | 11,077 | |||||||||||||||
Earnings from continuing operations | |||||||||||||||||||||||
attributable to the Company | 1,933 | 1,938 | 1,864 | 1,924 | 1,492 | 1,903 | 2,052 | 2,493 | |||||||||||||||
For GE, gross profit from sales is sales of goods and services less costs of goods and services sold.
Earnings-per-share amounts are computed independently each quarter for earnings from continuing operations, earnings (loss) from discontinued operations and net earnings. As a result, the sum of each quarter's per-share amount may not equal the total per-share amount for the respective year; and the sum of per-share amounts from continuing operations and discontinued operations may not equal the total per-share amounts for net earnings for the respective quarters.
GE 2014 FORM 10-K 223
OTHER INFORMATION |
DIRECTORS, EXECUTIVE OFFICERS AND CORPORATE GOVERNANCE
Executive Officers of the Registrant (As of February 1, 2015)
| Date assumed | |||||
Executive | ||||||
Name |
| Position |
| Age | Officer Position | |
Jeffrey R. Immelt | Chairman of the Board & Chief Executive Officer | 58 | January 1997 | |||
Jeffrey S. Bornstein | Senior Vice President & Chief Financial Officer | 49 | July 2013 | |||
Elizabeth J. Comstock | Senior Vice President, Chief Marketing Officer | 54 | April 2013 | |||
Brackett B. Denniston III | Senior Vice President & General Counsel | 67 | February 2004 | |||
Jan R. Hauser | Vice President, Controller & Chief Accounting Officer | 55 | April 2013 | |||
Daniel C. Heintzelman | Vice Chairman, Enterprise Risk & Operations | 57 | October 2013 | |||
Susan Peters | Senior Vice President, Human Resources | 61 | August 2013 | |||
John G. Rice | Vice Chairman of General Electric Company; | |||||
President & CEO, Global Growth & Operations | 58 | September 1997 | ||||
Keith S. Sherin | Vice Chairman of General Electric Company; CEO, GE Capital | 56 | January 1999 |
All Executive Officers are elected by the Board of Directors for an initial term that continues until the Board meeting immediately preceding the next annual statutory meeting of shareowners, and thereafter are elected for one-year terms or until their successors have been elected. All Executive Officers have been executives of General Electric Company for the last five years except for Ms. Hauser. Prior to joining GE in March 2013, Ms. Hauser served as a partner, Accounting Services, National Professional Services Group at PricewaterhouseCoopers LLP.
The remaining information called for by this item is incorporated by reference to "Election of Directors," "Section 16(a) Beneficial Ownership Reporting Compliance," "Other Governance Policies and Practices" and "Board Committees" in our definitive proxy statement for our 2015 Annual Meeting of Shareowners to be held April 22, 2015, which will be filed within 120 days of the end of our fiscal year ended December 31, 2014 (the 2015 Proxy Statement).
GE 2014 FORM 10-K 224
OTHER INFORMATION |
EXHIBITS AND FINANCIAL STATEMENT SCHEDULES
(a)1. Financial Statements
Included in the "Financial Statements and Supplementary Data" section of this report:
Management's Annual Report on Internal Control Over Financial Reporting
Report of Independent Registered Public Accounting Firm
Statement of Earnings for the years ended December 31, 2014, 2013 and 2012
Consolidated Statement of Comprehensive Income for the years ended December 31, 2014, 2013 and 2012
Consolidated Statement of Changes in Shareowners' Equity for the years ended December 31, 2014, 2013 and 2012
Statement of Financial Position at December 31, 2014 and 2013
Statement of Cash Flows for the years ended December 31, 2014, 2013 and 2012
Notes to consolidated financial statements
Management's Discussion and Analysis of Financial Condition and Results of Operations - Summary of Operating Segments
(a)2. Financial Statement Schedules
The schedules listed in Reg. 210.5-04 have been omitted because they are not applicable or the required information is shown in the consolidated financial statements or notes thereto.
(a)3. Exhibit Index
Exhibit | Description | ||
2(a) | Master Agreement dated as of December 3, 2009 by and among General Electric Company, NBC Universal, Inc., Comcast Corporation and Navy, LLC. (Incorporated by reference to Exhibit 2(a) to General Electric's Annual Report on Form 10-K (Commission file number 001-00035) for the fiscal year ended December 31, 2009). | ||
| |||
3(i) | The Certificate of Incorporation, as amended, of General Electric Company (Incorporated by reference to Exhibit 3(i) to General Electric's Annual Report on Form 10-K (Commission file number 001-00035) for the fiscal year ended December 31, 2013). | ||
| |||
3(ii) | The By-Laws, as amended, of General Electric Company (Incorporated by reference to Exhibit 3(ii) of General Electric's Current Report on Form 8-K dated February 11, 2015 (Commission file number 001-00035)). | ||
| |||
4(a) | Amended and Restated General Electric Capital Corporation (GECC) Standard Global Multiple Series Indenture Provisions dated as of February 27, 1997 (Incorporated by reference to Exhibit 4(a) to GECC's Registration Statement on Form S-3, File No. 333-59707 (Commission file number 001-06461)). | ||
| |||
4(b) | Third Amended and Restated Indenture dated as of February 27, 1997, between GECC and The Bank of New York Mellon, as successor trustee (Incorporated by reference to Exhibit 4(c) to GECC's Registration Statement on Form S-3, File No. 333-59707 (Commission file number 001-06461)). | ||
| |||
4(c) | First Supplemental Indenture dated as of May 3, 1999, supplemental to Third Amended and Restated Indenture dated as of February 27, 1997 (Incorporated by reference to Exhibit 4(dd) to GECC's Post-Effective Amendment No. 1 to Registration Statement on Form S-3, File No. 333-76479 (Commission file number 001-06461)). | ||
GE 2014 FORM 10-K 225
OTHER INFORMATION |
| |||
4(d) | Second Supplemental Indenture dated as of July 2, 2001, supplemental to Third Amended and Restated Indenture dated as of February 27, 1997 (Incorporated by reference to Exhibit 4(f) to GECC's Post-Effective Amendment No.1 to Registration Statement on Form S-3, File No. 333-40880 (Commission file number 001-06461)). | ||
| |||
4(e) | Third Supplemental Indenture dated as of November 22, 2002, supplemental to Third Amended and Restated Indenture dated as of February 27, 1997 (Incorporated by reference to Exhibit 4(cc) to GECC's Post-Effective Amendment No. 1 to the Registration Statement on Form S-3, File No. 333100527 (Commission file number 001-06461)). | ||
| |||
4(f) | Fourth Supplemental Indenture dated as of August 24, 2007, supplemental to Third Amended and Restated Indenture dated as of February 27, 1997 (Incorporated by reference to Exhibit 4(g) to GECC's Registration Statement on Form S-3, File number 333-156929 (Commission file number 001-06461)). | ||
| |||
4(g)
| Indenture dated December 1, 2005, between General Electric Company and The Bank of New York Mellon, as successor trustee (Incorporated by reference to Exhibit 4(a) of General Electric's Current Report on Form 8-K filed on December 9, 2005 (Commission file number 001-00035)) | ||
4(h) | Senior Note Indenture dated as of October 9, 2012, between General Electric Company and The Bank of New York Mellon, as trustee (Incorporated by reference to Exhibit 4.1 to General Electric's Current Report on Form 8-K filed on October 9, 2012 (Commission file number 001-00035)). | ||
| |||
4(i) | Thirteenth Amended and Restated Fiscal and Paying Agency Agreement among GECC, GE Capital Australia Funding Pty Ltd., GE Capital European Funding, GE Capital U.K. Funding and The Bank of New York Mellon and The Bank of New York Mellon (Luxembourg) S.A., as fiscal and paying agents, dated as of April 5, 2014 (Incorporated by reference to Exhibit 4(j) to GECC's Form 10-K Report for the year ended December 31, 2014 (Commission file number 001-06461)). | ||
| |||
4(j) | Letter from the Senior Vice President and Chief Financial Officer of General Electric to GECC dated September 15, 2006, with respect to returning dividends, distributions or other payments to GECC in certain circumstances described in the Indenture for Subordinated Debentures dated September 1, 2006, between GECC and the Bank of New York, as successor trustee (Incorporated by reference to Exhibit 4(c) to GECC's Post-Effective Amendment No. 2 to Registration Statement on Form S-3, File No. 333-132807 (Commission file number 001-06461)). | ||
4(k)
| Agreement to furnish to the Securities and Exchange Commission upon request a copy of instruments defining the rights of holders of certain long-term debt of the registrant and consolidated subsidiaries.* | ||
| |||
(10) | Except for 10(y), (z) and (aa) below, all of the following exhibits consist of Executive Compensation Plans or Arrangements: | ||
| |||
(a) | General Electric Incentive Compensation Plan, as amended effective July 1, 1991 (Incorporated by reference to Exhibit 10(a) to General Electric Annual Report on Form 10-K (Commission file number 001-00035) for the fiscal year ended December 31, 1991). | ||
| |||
(b) | General Electric Financial Planning Program, as amended through September 1993 (Incorporated by reference to Exhibit 10(h) to General Electric Annual Report on Form 10-K (Commission file number 001-00035) for the fiscal year ended December 31, 1993). | ||
| |||
(c) | General Electric Supplemental Life Insurance Program, as amended February 8, 1991 (Incorporated by reference to Exhibit 10(i) to General Electric Annual Report on Form 10-K (Commission file number 001-00035) for the fiscal year ended December 31, 1990). | ||
| |||
(d) | General Electric Directors' Charitable Gift Plan, as amended through December 2002 (Incorporated by reference to Exhibit 10(i) to General Electric Annual Report on Form 10-K (Commission file number 001-00035) for the fiscal year ended December 31, 2002). | ||
GE 2014 FORM 10-K 226
OTHER INFORMATION |
| |||
(e) | General Electric Leadership Life Insurance Program, effective January 1, 1994 (Incorporated by reference to Exhibit 10(r) to General Electric Annual Report on Form 10-K (Commission file number 001-00035) for the fiscal year ended December 31, 1993). | ||
| |||
(f) | General Electric 1996 Stock Option Plan for Non-Employee Directors (Incorporated by reference to Exhibit A to the General Electric Proxy Statement for its Annual Meeting of Shareowners held on April 24, 1996 (Commission file number 001-00035)). | ||
| |||
(g) | General Electric Supplementary Pension Plan, as amended effective January 1, 2012 (Incorporated by reference to Exhibit 10(g) to General Electric's Annual Report on Form 10-K (Commission file number 001-00035) for the fiscal year ended December 31, 2010).
| ||
(h) | General Electric 2003 Non-Employee Director Compensation Plan, Amended and Restated as of December 12, 2014.* | ||
| |||
(i) | Amendment to Nonqualified Deferred Compensation Plans, dated as of December 14, 2004 (Incorporated by reference to Exhibit 10(w) to the General Electric Annual Report on Form 10-K (Commission file number 001-00035) for the fiscal year ended December 31, 2004). | ||
| |||
(j) | GE Retirement for the Good of the Company Program, as amended effective January 1, 2009 (Incorporated by reference to Exhibit 10(j) to General Electric's Annual Report on Form 10-K (Commission file number 001-00035) for the fiscal year ended December 31, 2008. | ||
| |||
(k) | GE Excess Benefits Plan, effective January 1, 2009 (Incorporated by reference to Exhibit 10(k) to General Electric's Annual Report on Form 10-K (Commission file number 001-00035) for the fiscal year ended December 31, 2008). | ||
| |||
(l) | General Electric 2006 Executive Deferred Salary Plan, as amended January 1, 2009 (Incorporated by reference to Exhibit 10(l) to General Electric's Annual Report on Form 10-K (Commission file number 001-00035) for the fiscal year ended December 31, 2008). | ||
| |||
(m) | General Electric Company 2007 Long-Term Incentive Plan (as amended and restated April 25, 2012) (Incorporated by reference to Exhibit 99.1 to General Electric's Registration Statement on Form S-8, dated May 4, 2012, File number 333-181177 (Commission file number 001-00035)). | ||
| |||
(n) | Form of Agreement for Stock Option Grants to Executive Officers under the General Electric Company 2007 Long-term Incentive Plan, as amended January 1, 2009 (Incorporated by reference to Exhibit 10(n) to General Electric's Annual Report on Form 10-K (Commission file number 001-00035) for the fiscal year ended December 31, 2008). | ||
| |||
(o) | Form of Agreement for Annual Restricted Stock Unit Grants to Executive Officers under the General Electric Company 2007 Long-term Incentive Plan, as amended February 7, 2014 (Incorporated by reference to Exhibit 10(a) of General Electric's Quarterly Report on Form 10-Q for the quarter ended March 31, 2014 (Commission file number 001-00035)). | ||
| |||
(p) | Form of Agreement for Periodic Restricted Stock Unit Grants to Executive Officers under the General Electric Company 2007 Long-term Incentive Plan, as amended February 7, 2014 (Incorporated by reference to Exhibit 10(b) of General Electric's Quarterly Report on Form 10-Q for the quarter ended March 31, 2014 (Commission file number 001-00035)). | ||
| |||
(q) | Form of Agreement for Long Term Performance Award Grants to Executive Officers under the General Electric Company 2007 Long-term Incentive Plan (as amended and restated April 25, 2012) (Incorporated by reference to Exhibit 10(a) of General Electric's Quarterly Report on Form 10-Q for the quarter ended June 30, 2013 (Commission file number 001-00035)). | ||
GE 2014 FORM 10-K 227
OTHER INFORMATION |
| ||||
(r) | Form of Agreement for Performance Stock Unit Grants to Executive Officers under the General Electric Company 2007 Long-term Incentive Plan (Incorporated by reference to Exhibit 10.6 of General Electric's Current Report on Form 8-K dated April 27, 2007 (Commission file number 001-00035)). | |||
| ||||
(s) | First Restatement of the General Electric International Employee Stock Purchase Plan effective May 1, 2002 (Incorporated by reference to Exhibit 4.1 to General Electric's Registration Statement on Form S-8, File No. 333-163106 (Commission file number 001-00035)). | |||
| ||||
(t) | Form of Agreement for Long Term Performance Award Grants to Executive Officers under the General Electric Company 2007 Long-term Incentive Plan (Incorporated by reference to Exhibit 10 of General Electric's Current Report on Form 8-K dated February 12, 2010 (Commission file number 001-00035)). | |||
(u) | Time Sharing Agreement dated November 22, 2010 between General Electric Company and Jeffrey R. Immelt (Incorporated by reference to Exhibit 10(z) to General Electric's Annual Report on Form 10-K for the fiscal year ended December 31, 2010 (Commission file number 001-00035)).
| |||
(v)
(w)
(x)
| GE Stock Option Grant Agreement Dated March 4, 2010 for Jeffrey R. Immelt Terms & Conditions as Amended April 18, 2011 (Incorporated by reference to Exhibit 10(h) of General Electric's Quarterly Report on Form 10-Q for the quarter ended June 30, 2011 (Commission file number 001-00035)).
Non-Competition Agreement between General Electric Company and John Krenicki effective July 24, 2012 (Incorporated by reference to Exhibit 10(a) of General Electric's Quarterly Report on Form 10-Q for the quarter ended September 30, 2012 (Commission file number 001-00035)).
Time Sharing Agreement dated March 13, 2013 between General Electric Company and Brackett B. Denniston III (Incorporated by reference to Exhibit 10(b) of General Electric's Quarterly Report on Form 10-Q for the quarter ended March 31, 2013 (Commission file number 001-00035)).
| |||
(y) | Amended and Restated Income Maintenance Agreement, dated February 24, 2015, between the Registrant and General Electric Capital Corporation (Incorporated by reference to Exhibit 10 to GECC's Annual Report on Form 10-K for the year ended December 31, 2014 (Commission file number 001-06461)).
| |||
(z) | Transaction Agreement dated as of February 12, 2013 among General Electric Company, Comcast Corporation, National Broadcasting Company Holding, Inc., Navy Holdings, Inc., NBCUniversal, LLC and NBCUniversal Media, LLC (Incorporated by reference to Exhibit 10(a) of General Electric's Quarterly Report on Form 10-Q for the quarter ended March 31, 2013 (Commission file number 001-00035)).
| |||
(aa) | Amendment dated as of March 19, 2013 to the Transaction Agreement dated as of February 12, 2013 by and among General Electric Company, Comcast Corporation, NBCUniversal, LLC, NBCUniversal Media, LLC, National Broadcasting Company Holding, Inc. and Navy Holdings, Inc. (Incorporated by reference to Exhibit 10(c) of General Electric's Quarterly Report on Form 10-Q for the quarter ended March 31, 2013(Commission file number 001-00035)).
| |||
(bb) | Time Sharing Agreement dated April 30, 2014 between General Electric Company and Keith S. Sherin (Incorporated by reference to Exhibit 10(a) of General Electric's quarterly Report on Form 10-Q for the quarter ended June 30, 2014 ( Commission File number 001-00035)).
| |||
(11) | Statement re Computation of Per Share Earnings.** | |||
| ||||
12(a) | Computation of Ratio of Earnings to Fixed Charges.* | |||
| ||||
12(b) | Computation of Ratio of Earnings to Combined Fixed Charges and Preferred Stock Dividends.* | |||
| ||||
(21) | Subsidiaries of Registrant.* | |||
| ||||
(23) | Consent of Independent Registered Public Accounting Firm.* | |||
| ||||
(24) | Power of Attorney.* | |||
| ||||
31(a) | Certification Pursuant to Rules 13a-14(a) or 15d-14(a) under the Securities Exchange Act of 1934, as amended.* | |||
| ||||
31(b) | Certification Pursuant to Rules 13a-14(a) or 15d-14(a) under the Securities Exchange Act of 1934, as amended.* | |||
GE 2014 FORM 10-K 228
OTHER INFORMATION |
| ||||
(32) | Certification Pursuant to 18 U.S.C. Section 1350.* | |||
| ||||
99(a) |
| Undertaking for Inclusion in Registration Statements on Form S-8 of General Electric Company (Incorporated by reference to Exhibit 99(b) to General Electric Annual Report on Form 10-K (Commission file number 001-00035) for the fiscal year ended December 31, 1992). | ||
99(b) | Computation of Ratio of Earnings to Fixed Charges (Incorporated by reference to Exhibit 12(a) to GECC's Annual Report on Form 10-K for the fiscal year ended December 31, 2014 (Commission file number 001-06461)). | |||
99(c) | Supplement to Present Required Information in Searchable Format* | |||
(101) | The following materials from General Electric Company's Annual Report on Form 10-K for the year ended December 31, 2014, formatted in XBRL (eXtensible Business Reporting Language); (i) Statement of Earnings for the years ended December 31, 2014, 2013 and 2012, (ii) Consolidated Statement of Comprehensive Income for the years ended December 31, 2014, 2013 and 2012, (iii) Consolidated Statement of Changes in Shareowners' Equity for the years ended December 31, 2014, 2013 and 2012, (iv) Statement of Financial Position at December 31, 2014 and 2013, (v) Statement of Cash Flows for the years ended December 31, 2014, 2013 and 2012, and (vi) the Notes to Consolidated Financial Statements.* | |||
| ||||
* | Filed electronically herewith. | |||
** | Information required to be presented in Exhibit 11 is provided in Note 20 to the consolidated financial statements in this Form 10-K Report in accordance with the provisions of Financial Accounting Standards Board Accounting Standards Codification 260, Earnings Per Share . | |||
GE 2014 FORM 10-K 229
FORM 10-K CROSS REFERENCE INDEX |
FORM 10-K CROSS REFERENCE INDEX
Item Number |
| Page(s) | ||
Part I | ||||
Item 1. | Business | 19-22, 30-61, 68-69, 92-93, 105-106, 233 | ||
Item 1A. | Risk Factors | 112-117 | ||
Item 1B. | Unresolved Staff Comments | Not applicable | ||
Item 2. | Properties | 22 | ||
Item 3. | Legal Proceedings | 118-119 | ||
Item 4. | Mine Safety Disclosures | Not applicable | ||
Part II |
|
|
| |
Item 5. | Market for Registrant's Common Equity, Related Stockholder Matters and Issuer Purchases of Equity Securities | 26, 104 | ||
Item 6. | Selected Financial Data | 103 | ||
Item 7. | Management's Discussion and Analysis of Financial Condition and Results of Operations | 23-102,120-123 | ||
Item 7A. | Quantitative and Qualitative Disclosures About Market Risk | 75-76, 107-111 | ||
Item 8. | Financial Statements and Supplementary Data | 125-224 | ||
Item 9. | Changes in and Disagreements With Accountants on Accounting and Financial Disclosure | Not applicable | ||
Item 9A. | Controls and Procedures | 125 | ||
Item 9B. | Other Information | 77(a) | ||
Part III |
|
|
| |
Item 10. | Directors, Executive Officers and Corporate Governance | 225 | ||
Item 11. | Executive Compensation | (b) | ||
Item 12. | Security Ownership of Certain Beneficial Owners and Management and Related Stockholder Matters | (c), Note 16 | ||
Item 13. | Certain Relationships and Related Transactions, and Director Independence | (d) | ||
Item 14. | Principal Accounting Fees and Services | (e) | ||
Part IV |
|
|
| |
Item 15. | Exhibits and Financial Statement Schedules | 226-230 | ||
Signatures | 232 | |||
(a) | February 24, 2015 amendment of income maintenance agreement. |
(b) | Incorporated by reference to "Compensation Discussion and Analysis," "Management Development and Compensation Committee Report," "Summary Compensation," "All Other Compensation," "Other Benefits," "Grants of Plan-Based Awards," "Outstanding Equity Awards," "Option Exercises and Stock Vested," "Pension Benefits," "Nonqualified Deferred Compensation," "Potential Payments Upon Termination at Fiscal Year-End" and "Director Compensation" in the 2015 Proxy Statement. |
(c) | Incorporated by reference to "Stock Ownership Information" in the 2015 Proxy Statement. |
(d) | Incorporated by reference to "Related Person Transactions" and "How We Assess Director Independence" in the 2015 Proxy Statement. |
(e) Incorporated by reference to "Independent Auditor Information" in the 2015 Proxy Statement .
GE 2014 FORM 10-K 230
Pursuant to the requirements of Section 13 or 15(d) of the Securities Exchange Act of 1934, the registrant has duly caused this annual report on Form 10-K for the fiscal year ended December 31, 2014, to be signed on its behalf by the undersigned, and in the capacities indicated, thereunto duly authorized in the Town of Fairfield and State of Connecticut on the 27 th day of February 2015.
General Electric Company
(Registrant)
By /s/ Jeffrey S. Bornstein
Jeffrey S. Bornstein
Senior Vice President and
Chief Financial Officer
(Principal Financial Officer)
Pursuant to the requirements of the Securities Exchange Act of 1934, this report has been signed below by the following persons on behalf of the registrant and in the capacities and on the dates indicated.
Signer | Title | Date | |||
/s/ Jeffrey S. Bornstein | Principal Financial Officer | February 27, 2015 | |||
Jeffrey S. Bornstein Chief Financial Officer | |||||
| |||||
/s/ Jan R. Hauser | Principal Accounting Officer | February 27, 2015 | |||
Jan R. Hauser | |||||
/s/ Jeffrey R. Immelt Jeffrey R. Immelt* Chairman of the Board of Directors | Principal Executive Officer | February 27, 2015 | |||
| |||||
W. Geoffrey Beattie* John J. Brennan* | Director Director | ||||
James I. Cash, Jr.* Francisco D'Souza* Marijn E. Dekkers* | Director Director Director | ||||
Ann M. Fudge* | Director | ||||
Susan Hockfield* | Director | ||||
Andrea Jung* | Director | ||||
Robert W. Lane* | Director | ||||
Rochelle B. Lazarus* | Director | ||||
James J. Mulva* | Director | ||||
James E. Rohr* | Director | ||||
Mary L. Schapiro* | Director | ||||
Robert J. Swieringa* | Director | ||||
James S. Tisch* | Director | ||||
Douglas A. Warner III* | Director | ||||
A majority of the Board of Directors | |||||
| |||||
*By | /s/ Christoph A. Pereira | ||||
Christoph A. Pereira |
GE 2014 FORM 10-K 231
FORWARD LOOKING STATEMENTS |
FORWARD LOOKING STATEMENTS
This document contains "forward-looking statements" – that is, statements related to future, not past, events. In this context, forward-looking statements often address our expected future business and financial performance and financial condition, and often contain words such as "expect," "anticipate," "intend," "plan," "believe," "seek," "see," "will," "would," or "target." Forward-looking statements by their nature address matters that are, to different degrees, uncertain, such as statements about expected income; earnings per share; revenues; organic growth; margins; cost structure; restructuring charges; cash flows; return on capital; capital expenditures, capital allocation or capital structure; dividends; and the split between Industrial and GE Capital earnings.
For us, particular uncertainties that could cause our actual results to be materially different than those expressed in our forward-looking statements include:
| economic and financial conditions, including interest and exchange rate volatility, commodity and equity prices and the value of financial assets; |
| the impact of conditions in the financial and credit markets on the availability and cost of General Electric Capital Corporation's (GECC) funding, GECC's exposure to counterparties and our ability to reduce GECC's asset levels as planned; |
| the impact of conditions in the housing market and unemployment rates on the level of commercial and consumer credit defaults; |
| pending and future mortgage loan repurchase claims and other litigation claims in connection with WMC, which may affect our estimates of liability, including possible loss estimates; |
| our ability to maintain our current credit rating and the impact on our funding costs and competitive position if we do not do so; |
| the adequacy of our cash flows and earnings and other conditions which may affect our ability to pay our quarterly dividend at the planned level or to repurchase shares at planned levels; |
| GECC's ability to pay dividends to GE at the planned level, which may be affected by GECC's cash flows and earnings, financial services regulation and oversight, and other factors; |
| our ability to convert pre-order commitments/wins into orders; |
| the price we realize on orders since commitments/wins are stated at list prices; |
| customer actions or developments such as early aircraft retirements or reduced energy demand and other factors that may affect the level of demand and financial performance of the major industries and customers we serve; |
| the effectiveness of our risk management framework; |
| the impact of regulation and regulatory, investigative and legal proceedings and legal compliance risks, including the impact of financial services regulation and litigation; |
| adverse market conditions, timing of and ability to obtain required bank regulatory approvals, or other factors relating to us or Synchrony Financial that could prevent us from completing the Synchrony Financial split-off as planned; |
| our capital allocation plans, as such plans may change including with respect to the timing and size of share repurchases, acquisitions, joint ventures, dispositions and other strategic actions; |
| our success in completing, including obtaining regulatory approvals for, announced transactions, such as the proposed transactions and alliances with Alstom and sale of Appliances, and our ability to realize anticipated earnings and savings; |
| our success in integrating acquired businesses and operating joint ventures; |
| the impact of potential information technology or data security breaches; and |
| the other factors that are described in the Risk Factors section of this Form 10-K Report. |
These uncertainties may cause our actual future results to be materially different than those expressed in our forward-looking statements. We do not undertake to update our forward-looking statements. This document includes certain forward-looking projected financial information that is based on current estimates and forecasts. Actual results could differ materially.
GE 2014 FORM 10-K 232