UNITED STATES SECURITIES AND EXCHANGE COMMISSION
WASHINGTON, D.C. 20549
FORM 10-Q
(Mark One)
QUARTERLY REPORT PURSUANT TO SECTION 13 OR 15(d) OF THE SECURITIES EXCHANGE ACT OF 1934
For the quarterly period ended September 30, 2015
OR |
TRANSITION REPORT PURSUANT TO SECTION 13 OR 15(d) OF THE SECURITIES EXCHANGE ACT OF 1934 |
For the transition period from ____ to ____ |
Commission file number 001-00035  GENERAL ELECTRIC COMPANY (Exact name of registrant as specified in its charter) |
New York | 14-0689340 | |
(State or other jurisdiction of incorporation or organization) | (I.R.S. Employer Identification No.) | |
| ||
3135 Easton Turnpike, Fairfield, CT | 06828-0001 | |
(Address of principal executive offices) | (Zip Code) | |
| ||
(Registrant's telephone number, including area code) (203) 373-2211
_______________________________________________ (Former name, former address and former fiscal year, if changed since last report) | ||
Indicate by check mark whether the registrant (1) has filed all reports required to be filed by Section 13 or 15(d) of the Securities Exchange Act of 1934 during the preceding 12 months (or for such shorter period that the registrant was required to file such reports), and (2) has been subject to such filing requirements for the past 90 days. Yes No
Indicate by check mark whether the registrant has submitted electronically and posted on its corporate Web site, if any, every Interactive Data File required to be submitted and posted pursuant to Rule 405 of Regulation S-T (§232.405 of this chapter) during the preceding 12 months (or for such shorter period that the registrant was required to submit and post such files). Yes No
Indicate by check mark whether the registrant is a large accelerated filer, an accelerated filer, a non-accelerated filer, or a smaller reporting company. See the definitions of "large accelerated filer," "accelerated filer" and "smaller reporting company" in Rule 12b-2 of the Exchange Act. (Check one):
Large accelerated filer
| Accelerated filer
|
Non-accelerated filer
| Smaller reporting company
|
Indicate by check mark whether the registrant is a shell company (as defined in Rule 12b-2 of the Exchange Act). Yes No
There were 10,109,239,000 shares of common stock with a par value of $0.06 per share outstanding at September 30, 2015.
[PAGE INTENTIONALLY LEFT BLANK]
TABLE OF CONTENTS
Page | |
Forward Looking Statements | 4 |
Management's Discussion and Analysis of Financial Condition and Results of Operations (MD&A) | 5 |
Key Performance Indicators | 11 |
Consolidated Results | 12 |
Segment Operations | 14 |
Corporate Items and Eliminations | 33 |
Discontinued Operations | 35 |
Other Consolidated Information | 36 |
Statement of Financial Position | 37 |
Financial Resources and Liquidity | 40 |
Exposures | 45 |
Critical Accounting Estimates | 47 |
Other Items | 48 |
Controls and Procedures | 49 |
Other Financial Data | 49 |
Regulations and Supervision | 50 |
Legal Proceedings | 51 |
Financial Statements and Notes | 53 |
Exhibits | 108 |
Form 10-Q Cross Reference Index | 109 |
Signatures | 110 |
FORWARD LOOKING STATEMENTS
This document contains "forward-looking statements" – that is, statements related to future, not past, events. In this context, forward-looking statements often address our expected future business and financial performance and financial condition, and often contain words such as "expect," "anticipate," "intend," "plan," "believe," "seek," "see," "will," "would," or "target."
Forward-looking statements by their nature address matters that are, to different degrees, uncertain, such as statements about our announced plan to reduce the size of our financial services businesses, including expected cash and non-cash charges associated with this plan; expected income; earnings per share; revenues; organic growth; margins; cost structure; restructuring charges; cash flows; return on capital; capital expenditures, capital allocation or capital structure; dividends; and the split between Industrial and GE Capital earnings.
For us, particular uncertainties that could cause our actual results to be materially different than those expressed in our forward-looking statements include:
| obtaining (or the timing of obtaining) any required regulatory reviews or approvals or any other consents or approvals associated with our announced plan to reduce the size of our financial services businesses; |
| our ability to complete incremental asset sales as part of that plan in a timely manner (or at all) and at the prices we have assumed; |
| changes in law, economic and financial conditions, including interest and exchange rate volatility, commodity and equity prices and the value of financial assets, including the impact of these conditions on our ability to sell or the value of incremental assets to be sold as part of our announced plan to reduce the size of our financial services businesses as well as other aspects of that plan; |
| the impact of conditions in the financial and credit markets on the availability and cost of GECC's funding, and GECC's exposure to counterparties; |
| the impact of conditions in the housing market and unemployment rates on the level of commercial and consumer credit defaults; |
| pending and future mortgage loan repurchase claims and other litigation claims in connection with WMC, which may affect our estimates of liability, including possible loss estimates; |
| our ability to maintain our current credit rating and the impact on our funding costs and competitive position if we do not do so; |
| the adequacy of our cash flows and earnings and other conditions, which may affect our ability to pay our quarterly dividend at the planned level or to repurchase shares at planned levels; |
| GECC's ability to pay dividends to GE at the planned level, which may be affected by GECC's cash flows and earnings, financial services regulation and oversight, and other factors; |
| our ability to convert pre-order commitments/wins into orders; |
| the price we realize on orders since commitments/wins are stated at list prices; |
| customer actions or developments such as early aircraft retirements or reduced energy demand and other factors that may affect the level of demand and financial performance of the major industries and customers we serve; |
| the effectiveness of our risk management framework; |
| the impact of regulation and regulatory, investigative and legal proceedings and legal compliance risks, including the impact of financial services regulation and litigation; |
| adverse market conditions, timing of and ability to obtain required bank regulatory approvals, or other factors relating to us or Synchrony Financial that could prevent us from completing the Synchrony Financial split-off as planned; |
| our capital allocation plans, as such plans may change including with respect to the timing and size of share repurchases, acquisitions, joint ventures, dispositions and other strategic actions; |
| our success in completing, including obtaining regulatory approvals for, announced transactions, such as the proposed transactions and alliances with Alstom and Appliances and our announced plan and transactions to reduce the size of our financial services businesses, and our ability to realize anticipated earnings and savings; |
| our success in integrating acquired businesses and operating joint ventures; |
| the impact of potential information technology or data security breaches; and |
| the other factors that are described in "Risk Factors" in our Annual Report on Form 10-K for the year ended December 31, 2014. |
These or other uncertainties may cause our actual future results to be materially different than those expressed in our forward-looking statements. We do not undertake to update our forward-looking statements. This document includes certain forward-looking projected financial information that is based on current estimates and forecasts. Actual results could differ materially.
2015 3Q FORM 10-Q PAGE 4
MANAGEMENT'S DISCUSSION AND ANALYSIS OF FINANCIAL CONDITION AND RESULTS OF OPERATIONS (MD&A)
HOW WE TALK ABOUT OUR RESULTS
We believe that investors will gain a better understanding of our company if they understand how we measure and talk about our results. Because of the diversity in our businesses, we present our financial statements in a three- column format, which allows investors to see our industrial operations separately from our financial services operations. We believe that this provides useful information to investors. When used in this report, unless otherwise indicated by the context, we use the terms to mean the following:
| General Electric or the Company - the parent company, General Electric Company. |
| GE - the adding together of all affiliates other than General Electric Capital Corporation (GECC), whose continuing operations are presented on a one-line basis, giving effect to the elimination of transactions among such affiliates. Transactions between GE and GECC have not been eliminated at the GE level. We present the results of GE in the center columns of our consolidated statements of earnings, financial position and cash flows. An example of a GE metric is GE cash from operating activities (GE CFOA). |
| General Electric Capital Corporation or GECC or Financial Services – the adding together of all affiliates of GECC, giving effect to the elimination of transactions among such affiliates. We present the results of GECC in the right-side columns of our consolidated statements of earnings, financial position and cash flows. It should be noted that GECC is sometimes referred to as GE Capital or Capital, when not in the context of discussing segment results. |
| GE consolidated – the adding together of GE and GECC, giving effect to the elimination of transactions between GE and GECC. We present the results of GE consolidated in the left side columns of our consolidated statements of earnings, financial position and cash flows. |
| Industrial – GE excluding GECC. We believe that this provides investors with a view as to the results of our industrial businesses and corporate items. An example of an Industrial metric is Industrial CFOA, which is GE CFOA excluding the effects of dividends from GECC. |
| Industrial segment – the sum of our seven industrial reporting segments without giving effect to the elimination of transactions among such segments. We believe that this provides investors with a view as to the results of our industrial segments, without inter-segment eliminations and corporate items. An example of an industrial segment metric is industrial segment revenue growth. |
| Total segment – the sum of our seven industrial reporting segments and one financial services reporting segment, without giving effect to the elimination of transactions among such segments. We believe that this provides investors with a view as to the results of all of our segments, without inter-segment eliminations and corporate items. |
| GE Capital Verticals or Verticals – the adding together of GE Capital businesses that we expect to retain, principally its vertical financing businesses-GE Capital Aviation Services (GECAS), Energy Financial Services (EFS) and Healthcare Equipment Finance-that directly relate to the Company's core industrial domain and other operations, including Working Capital Solutions, our run-off insurance activities, and allocated corporate costs. |
2015 3Q FORM 10-Q PAGE 5
OTHER TERMS USED BY GE
| Revenues – unless otherwise indicated, we refer to captions such as "revenues and other income", simply as revenues. |
| Organic revenues – revenues excluding the effects of acquisitions, dispositions and foreign currency exchange. |
| Industrial segment services revenues – refers to the sales under product services agreements and sales of both goods (such as spare parts and equipment upgrades) and related services (such as monitoring, maintenance and repairs) as sales of "product services" or "services," which is an important part of our operations. |
| Earnings – unless otherwise indicated, we refer to captions such as "earnings from continuing operations attributable to the company" simply as earnings. |
| Earnings per share (EPS) – unless otherwise indicated, we refer to "earnings per share from continuing operations attributable to the company" simply as earnings per share. |
| Operating earnings – GE earnings from continuing operations attributable to the company excluding the impact of non-operating pension costs. |
| Segment profit – refers to the operating profit of the industrial segments and the net earnings of the financial services segment. See page 14 for a description of the basis for segment profits. |
| Operating pension costs – comprise the service cost of benefits earned, prior service cost amortization and curtailment loss for our principal pension plans. |
| Non-operating pension costs – comprise the expected return on plan assets, interest cost on benefit obligations and net actuarial loss amortization for our principal pension plans. |
NON-GAAP FINANCIAL MEASURES
In the accompanying analysis of financial information, we sometimes use information derived from consolidated financial data but not presented in our financial statements prepared in accordance with U.S. generally accepted accounting principles (GAAP). Certain of these data are considered "non-GAAP financial measures" under the SEC rules. Specifically, we have referred, in various sections of this Form 10-Q Report, to:
| Operating earnings (loss) and operating EPS |
| GE Industrial operating + Verticals EPS |
| Operating and non-operating pension costs |
| Industrial segment organic revenue growth |
| Oil & Gas organic revenue and operating profit growth |
| Industrial cash flows from operating activities (Industrial CFOA) |
| Adjusted Corporate Costs (Operating) |
| GE Capital ending net investment (ENI), excluding liquidity |
| GECC Tier 1 common ratio estimate |
The reasons we use these non-GAAP financial measures and the reconciliations to their most directly comparable GAAP financial measures are included in Exhibit 99(a) to this Form 10-Q Report. Non-GAAP financial measures referred to in this Form 10-Q Report are designated with an asterisk (*).
2015 3Q FORM 10-Q PAGE 6
OUR OPERATING SEGMENTS
We are one of the largest and most diversified infrastructure and financial services corporations in the world. With products and services ranging from aircraft engines, power generation, oil and gas production equipment, and household appliances to medical imaging, business and consumer financing and industrial products.
OUR INDUSTRIAL OPERATING SEGMENTS
 | Power & Water |  | Aviation |  | Transportation |
 | Oil & Gas |  | Healthcare |  | Appliances & Lighting |
 | Energy Management |
OUR FINANCIAL SERVICES OPERATING SEGMENT
 | GE Capital |
Operational and financial overview for our operating segment are provided in the "Segment Operations" section within this MD&A.
THE GE CAPITAL EXIT PLAN
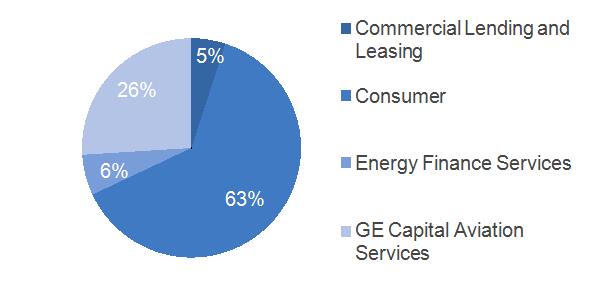
On April 10, 2015, the Company announced its plan (the GE Capital Exit Plan) to reduce the size of its financial services businesses through the sale of most of the assets of GECC over the following 24 months, and to focus on continued investment and growth in the Company's industrial businesses. Under the GE Capital Exit Plan, which was approved on April 2, 2015 and aspects of which were approved on March 31, 2015, the Company will retain certain GECC businesses, principally its vertical financing businesses-GE Capital Aviation Services, Energy Financial Services and Healthcare Equipment Finance-that directly relate to the Company's core industrial domain and other operations, including Working Capital Solutions and our run-off insurance activities (together referred to as GE Capital Verticals or Verticals). The assets planned for disposition include Real Estate, most of Commercial Lending and Leasing (CLL) and all Consumer platforms (including all U.S. banking assets). The Company expects to execute this strategy using an efficient approach for exiting non-vertical assets that works for the Company's and GECC's debt holders and the Company's shareowners. An element of this approach involves a merger of GECC into the Company to assure compliance with debt covenants as GECC exits non-vertical assets, and the creation of a new intermediate holding company to hold GECC's businesses after the merger. The Company has discussed the GE Capital Exit Plan, aspects of which are subject to regulatory review and approval, with its regulators and staff of the Financial Stability Oversight Council (FSOC) and will work closely with these bodies to take the actions necessary over time to terminate the FSOC's designation of GECC (and the new intermediate holding company, as applicable) as a nonbank systemically important financial institution (nonbank SIFI).
REORGANIZATION AND EXCHANGE OFFERS
The merger and creation of a new intermediate holding company is part of a reorganization of GECC's businesses (the Reorganization) pursuant to which GE will also separate GECC's international and U.S. operations. GECC's international operations will be consolidated under a new international holding company (GE Capital International Holdings) and will have a separate capital structure and be supervised by the U.K. Prudential Regulation Authority. The Reorganization, Exchange Offers (as described below) and establishment of GE Capital International Holdings are intended, among other things, to establish an efficient and simplified capital structure that is satisfactory to GECC's regulators, a key step in terminating the nonbank systemically important financial institution designation for GECC. In addition, the Exchange Offers were designed to align the liabilities of GE Capital International Holdings to its assets from a maturity profile and liquidity standpoint, taking into consideration asset sales, and where appropriate, shortening the maturity profile of targeted liabilities.
2015 3Q FORM 10-Q PAGE 7
As part of the GE Capital Exit Plan, on September 21, 2015 GE Capital commenced private offers to exchange (the Exchange Offers) up to $30 billion of certain outstanding debt for new notes with maturities of six months, five years, ten years or twenty years. On October 19, 2015, given the high level of participation, the offering was increased by $6 billion with the aggregate principal amount of $36 billion of outstanding notes being tendered for exchange and settled on October 26, 2015. The new notes that were issued at closing are composed of $15.3 billion of 0.964% Six Month Notes due 2016, £0.8 billion of 1.363% Six Month Notes due 2016, $6.1 billion of 2.342% Notes due 2020, $2.0 billion of 3.373% Notes due 2025 and $11.5 billion of 4.418% Notes due 2035. Of the $16.2 billion exchanged into the Six Month Notes, $1.3 billion is in short term borrowings at September 30, 2015. GECC will continue to evaluate the opportunity to repurchase debt while maintaining our liquidity at the levels communicated as part of the GE Capital Exit Plan. The new notes have been fully, irrevocably and unconditionally guaranteed by GE.
SALES AGREEMENTS
During the first nine months of 2015, GE signed agreements to sell approximately $94 billion of ENI, excluding liquidity (as originally reported at December 31, 2014), of which approximately $45 billion and $33 billion related to the CLL and Real Estate businesses, respectively. CLL transactions signed in the third quarter 2015 included approximately $9.3 billion related to its Healthcare Financial Services U.S. lending business with Capital One, approximately $7.6 billion related to its Transportation Finance business in the U.S. and Canada with BMO Financial Group, and approximately $1.8 billion related to its Mubadala joint venture with MidCap Finco. Ltd., which is managed by Apollo Capital Management. Of the signed agreements, approximately $60 billion have closed, including approximately $30 billion and $21 billion related to Real Estate and CLL, respectively. The Real Estate transactions that have closed included the majority of GECC's Real Estate debt and equity portfolio sold to funds managed by The Blackstone Group (which, in turn, sold a portion of this portfolio to Wells Fargo & Company). In connection with The Blackstone Group transactions, GECC provided $3.2 billion of seller financing to The Blackstone Group, which GECC intends to syndicate by 2016. As of September 30, 2015, GECC has collected or sold approximately $0.4 billion of this seller financing. The CLL transactions that have closed included its U.S. and European Sponsor Finance businesses and the majority of its Global Fleet services business.
In addition, during October 2015, we signed agreements to sell approximately $32 billion of ENI, excluding liquidity (as originally reported at December 31, 2014) related to our CLL business. These signed CLL transactions included approximately $30 billion related to our global Commercial Distribution Finance, North American Vendor Finance and North American Corporate Finance businesses with Wells Fargo & Company and approximately $2 billion related to our Corporate Aircraft portfolio with Global Jet Capital.
AFTER-TAX CHARGES RELATED TO THE GE CAPITAL EXIT PLAN
In connection with the GE Capital Exit Plan announced on April 10, the Company estimated that it would incur approximately $23 billion in after-tax charges through 2016, approximately $6 billion of which are expected to result in future net cash expenditures. These charges relate to: business dispositions, including goodwill allocations (approximately $13 billion), tax expense related to expected repatriation of foreign earnings and write-off of deferred tax assets (approximately $7 billion), and restructuring and other charges (approximately $3 billion).
In the nine months ended September 30, 2015, GE recorded $21.1 billion of after-tax charges related to the GE Capital Exit Plan, including $0.4 billion of after-tax charges recorded in the third quarter of 2015, primarily exit-related charges in our CLL business, partially offset by income associated with operations in CLL and Real Estate. A description of after-tax charges for the nine months ended September 30, 2015 is provided below.
| $9.8 billion of net loss primarily related to the planned disposition of the Real Estate business and most of the CLL business, which is recorded in discontinued operations under the caption "Earnings (loss) from discontinued operations, net of taxes" in the Statement of Earnings. |
| $6.2 billion of tax expense related to expected repatriation of foreign earnings and write-off of deferred tax assets, of which $6.1 billion is reported in GECC's Corporate component and $0.2 billion is reported in our Consumer business all recorded in continuing operations under the caption "Benefit (provision) for income taxes" in the Statement of Earnings. |
| $4.7 billion of net asset impairments due to shortened hold periods, of which $3.2 billion is recorded in continuing operations in our Consumer business primarily under the captions "Provisions for losses on financing receivables" and "Revenues from services" in the Statement of Earnings and $1.5 billion is recorded in discontinued operations in our CLL business under the caption "Earnings (loss) from discontinued operations, net of taxes" in the Statement of Earnings. |
2015 3Q FORM 10-Q PAGE 8
| $0.4 billion of restructuring and other charges, of which $0.3 billion is recorded in continuing operations in GECC's Corporate component under the caption "Other costs and expenses" in the Statement of Earnings and $0.1 billion is recorded in discontinued operations in our CLL business under the caption "Earnings (loss) from discontinued operations, net of taxes" in the Statement of Earnings. |
GUARANTEE
As part of the GE Capital Exit Plan, on April 10, 2015, the Company and GECC entered into an amendment to their existing financial support agreement. Under this amendment (the Amendment), the Company has provided a full and unconditional guarantee (the Guarantee) of the payment of principal and interest on all tradable senior and subordinated outstanding long-term debt securities and all commercial paper issued or guaranteed by GECC identified in the Amendment. In the aggregate, the Guarantee applied to approximately $184 billion of GECC debt as of September 30, 2015. The Guarantee replaced the requirement that the Company make certain income maintenance payments to GECC in certain circumstances. GECC's U.S. public indentures were concurrently amended to provide the full and unconditional guarantee by the Company set forth in the Guarantee.
SYNCHRONY FINANCIAL EXCHANGE OFFER
On October 14, 2015, the Federal Reserve Board approved Synchrony Financial's application to operate as a publicly owned savings and loan holding company following completion of the exchange offer, conditioned on Synchrony Financial complying with certain conditions, including receipt of all required regulatory approvals, and on the commitments made in connection with Synchrony Financial's applications .
On October 19, 2015, GE commenced an offer to exchange GE common stock for common stock of GECC's approximately 84.6% owned subsidiary, Synchrony Financial. This exchange offer is in connection with the previously announced separation of Synchrony Financial and is expected to conclude the week of November 16, 2015. We estimate that the exchange will reduce the outstanding shares of GE common stock by approximately 6-7%. Following the completion of the share exchange, GECC expects the Federal Reserve Board to act in due course on its application to deregister as a savings and loan holding company but cannot predict the timing of the Federal Reserve Board's action. For further information about the Synchrony Financial transaction, see the Form S-4 filed by Synchrony Financial on October 19, 2015 .
PRESENTATION
The consolidated financial statements of General Electric Company (the Company) combine the industrial manufacturing and services businesses of General Electric Company (GE) with the financial services businesses of General Electric Capital Corporation (GECC or financial services).
We integrate acquisitions as quickly as possible. Revenues and earnings from the date we complete the acquisition through the end of the following fourth quarter are considered the acquisition effect of such businesses.
Amounts reported in billions in graphs within this Form 10-Q report are computed based on the amounts in millions. As a result, the sum of the components reported in billions may not equal the total amount reported in billions due to rounding. Certain columns and rows within the tables may not add due to the use of rounded numbers. Percentages presented are calculated from the underlying numbers in millions.
Discussions throughout this MD&A are based on continuing operations unless otherwise noted.
REFERENCES
The MD&A should be read in conjunction with the Financial Statements and Notes to the consolidated financial statements.
For additional information related to the GE Capital Exit Plan, GE Capital segment operations and the credit quality of financing receivables, refer to the General Electric Capital Corporation quarterly report on Form 10-Q for the nine months ended September 30, 2015.
2015 3Q FORM 10-Q PAGE 9
CORPORATE INFORMATION
GE's Investor Relations website at www.ge.com/investor-relations and our corporate blog at www.gereports.com , as well as GE's Facebook page and Twitter accounts, including @GE_Reports, contain a significant amount of information about GE, including financial and other information for investors. GE encourages investors to visit these websites from time to time, as information is updated and new information is posted.
2015 3Q FORM 10-Q PAGE 10
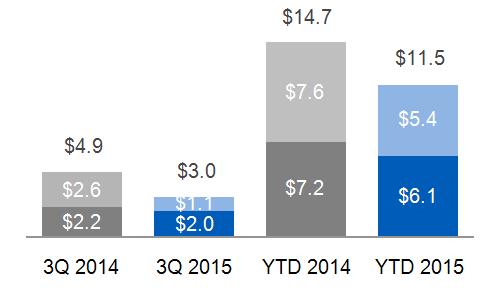
KEY PERFORMANCE INDICATORS
(Dollars in billions; per-share amounts in dollars)
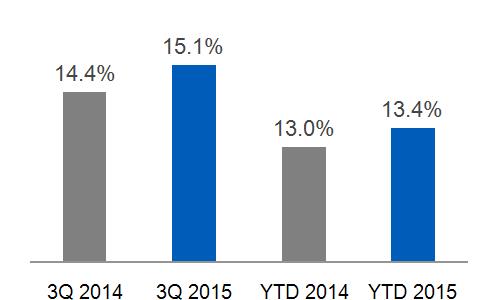
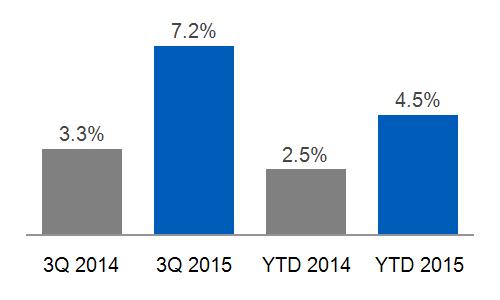
REVENUES PERFORMANCE | INDUSTRIAL SEGMENT PROFIT | INDUSTRIAL SEGMENT MARGIN | ||||||
 |  | |||||||
3Q 2015 | YTD 2015 | |||||||
Industrial Segment | (1)% | (1)% | ||||||
Industrial Segment Organic* | 4% | 4% | ||||||
Financial Services | (1)% | (9)% | ||||||
EARNINGS PER SHARE | INDUSTRIAL ORDERS | INDUSTRIAL BACKLOG | ||||||
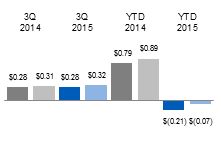
Earnings Operating Earnings*
 |
 |
Equipment
Services |
(a) Prior period reflects an update for Oil & Gas services backlog. |
Equipment
Services | ||||
IND'L OPERATING + VERTICALS EPS* | SIGNIFICANT DEVELOPMENTS IN 2015 | |||||||
 |
On October 19, 2015, w e launched the Synchrony Financial share exchange, after the Federal Reserve Board approved Synchrony Financial's application to operate as a publicly owned savings and loan holding company.
At September 30, 2015, we had an agreement to sell our consumer finance business in Australia and New Zealand for approximately 6.0 billion Australian dollars and 1.4 billion New Zealand dollars, respectively. We announced the GE Capital Exit Plan in April 2015 and GECC's Real Estate business and most of the CLL business have been classified as discontinued operations.
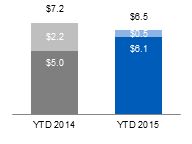
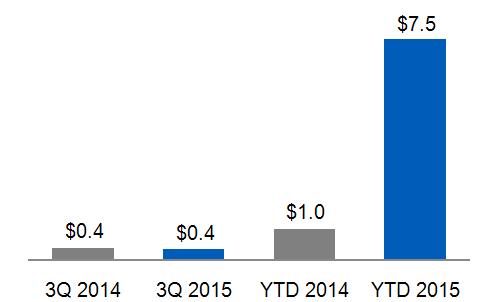
We acquired Milestone Aviation Group, a helicopter leasing business, for approximately $1.8 billion on January 30, 2015. The effects of the stronger U.S. dollar in the nine months ended September 30, 2015, primarily related to the euro, decreased consolidated revenues by $3.9 billion. GE returned $7.2 billion to shareowners in the nine months ended September 30, 2015 primarily through dividends.
| |||||||
Verticals include businesses expected to be retained (GECAS, EFS, Healthcare Equipment Finance, Working Capital Solutions, and run-off insurance), including allocated corporate costs.
| ||||||||
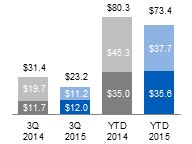
GE CFOA | ||||||||
 |
GECC Dividend
Industrial CFOA* | |||||||
* Non-GAAP Financial Measure
2015 3Q FORM 10-Q PAGE 11
CONSOLIDATED RESULTS
THREE AND NINE MONTHS ENDED SEPTEMBER 30
(Dollars in billions)
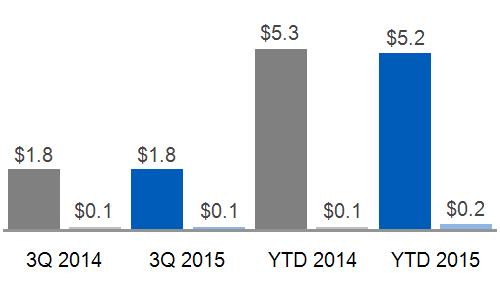
REVENUES | INDUSTRIAL SEGMENT EQUIPMENT & SERVICES REVENUES | ||
 | 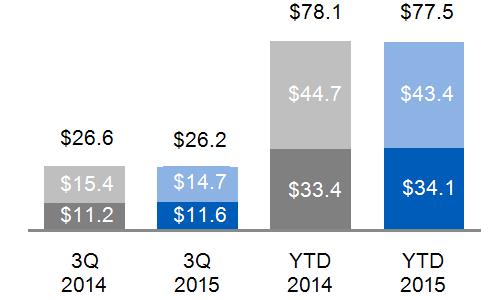 |
Equipment
Services
| |
COMMENTARY: 2015 - 2014 | |||
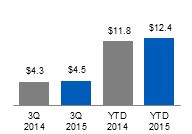
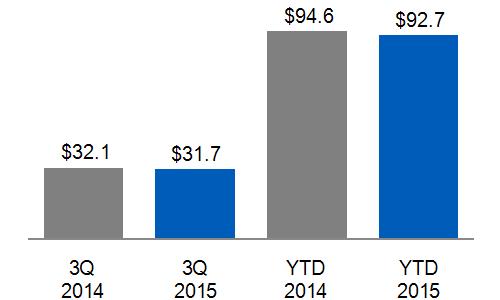
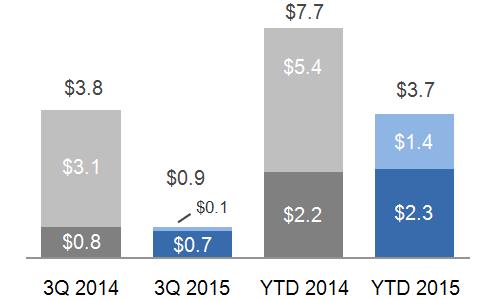
THREE MONTHS ENDED Consolidated revenues decreased $0.4 billion, or (1)%. Industrial segment revenues decreased 1%, reflecting the unfavorable impact of foreign exchange of $1.2 billion. Industrial segment organic revenues* grew 4%. Financial Services revenues decreased 1% as a result of higher impairments and the effects of currency exchange, partially offset by higher gains and the effects of acquisitions. The effects of acquisitions increased consolidated revenues $0.1 billion and $0.3 billion in 2015 and 2014, respectively. The effects of dispositions decreased consolidated revenues $0.1 billion and $0.6 billion in 2015 and 2014, respectively.
|
NINE MONTHS ENDED Consolidated revenues decreased $1.9 billion, or (2)%, primarily due to the impact of foreign exchange of $3.9 billion. Industrial segment revenues decreased 1%, reflecting the unfavorable impact of foreign exchange of $3.5 billion. Industrial segment organic revenues* grew 4%. Financial Services revenues decreased 9% primarily due to the effects of the GE Capital Exit Plan. The effects of acquisitions increased consolidated revenues $0.5 billion and $1.5 billion in 2015 and 2014, respectively. Dispositions affected our ongoing results through lower revenues of $0.4 billion and $3.0 billion in 2015 and 2014, respectively.
| ||
* Non-GAAP Financial Measure
2015 3Q FORM 10-Q PAGE 12
THREE AND NINE MONTHS ENDED SEPTEMBER 30
(Dollars in billions)
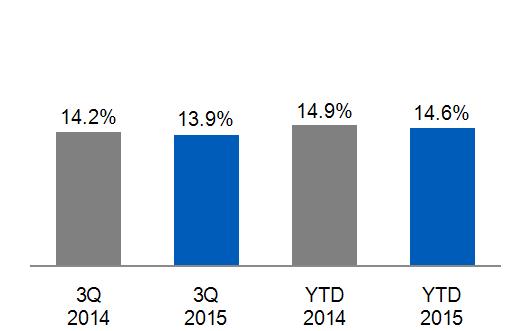
EARNINGS (LOSS) | INDUSTRIAL SELLING, GENERAL & ADMINISTRATIVE (SG&A) AS A % OF SALES | |
 |
 | |
Earnings Operating Earnings*
| ||
COMMENTARY: 2015 - 2014 | ||
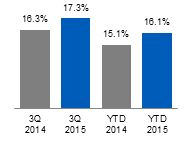
THREE MONTHS ENDED Consolidated earnings increased 1% primarily due to: Industrial segment profit increased 5% with five of seven segments growing earnings. Industrial segment margin increased 100 basis points (bps) driven by higher productivity and volume, partially offset by the impact of the stronger U.S. dollar. Financial Services earnings decreased 13% primarily due to core decreases, including charges associated with the GE Capital Exit Plan and higher impairments, partially offset by higher gains, the effects of dispositions and lower provisions for losses on financing receivables. The effects of acquisitions on our consolidated net earnings were insignificant amounts for both 2015 and 2014, respectively. The effects of dispositions on net earnings and settlements were an insignificant amount in 2015 and a decrease of $0.1 billion in 2014. Industrial SG&A as a percentage of total sales decreased to 13.9% primarily as a result of favorable impacts of global cost reduction initiatives and lower restructuring costs, partially offset by higher non-operating pension costs.
|
NINE MONTHS ENDED Consolidated earnings decreased $10.1 billion primarily due to lower financial services income resulting from charges associated with the GE Capital Exit Plan of $9.7 billion, which consisted primarily of tax expense related to expected repatriation of foreign earnings and write-off of deferred tax assets and asset impairments due to shortened hold periods. Industrial segment profit increased 6% with five of seven segments growing earnings. Industrial segment margin increased 100 bps driven by higher productivity, volume and pricing, partially offset by the impact of the stronger U.S. dollar, the effects of inflation and negative business mix. Financial Services earnings decreased significantly primarily due to charges associated with the GE Capital Exit Plan. The effects of acquisitions on our consolidated net earnings were increases of $0.1 billion in 2015 and $0.2 billion in 2014. The effects of dispositions and settlements on net earnings were an increase of $0.3 billion in 2015 and a decrease of $1.5 billion in 2014. Industrial SG&A as a percentage of total sales decreased to 14.6% primarily as a result of favorable impacts of global cost reduction initiatives, partially offset by higher non-operating pension costs and restructuring costs.
|
See the "Other Consolidated Information" section within the MD&A of this Form 10-Q for a discussion of income taxes.
*Non-GAAP Financial Measure
2015 3Q FORM 10-Q PAGE 13
SEGMENT OPERATIONS
SEGMENT REVENUES AND PROFIT
Segment revenues include revenues and other income related to the segment.
Segment profit is determined based on internal performance measures used by the Chief Executive Officer (CEO) to assess the performance of each business in a given period. In connection with that assessment, the CEO may exclude matters such as charges for restructuring; rationalization and other similar expenses; acquisition costs and other related charges; technology and product development costs; certain gains and losses from acquisitions or dispositions; and litigation settlements or other charges, for which responsibility preceded the current management team.
Segment profit excludes results reported as discontinued operations and accounting changes. Segment profit also excludes the portion of earnings or loss attributable to noncontrolling interests of consolidated subsidiaries, and as such only includes the portion of earnings or loss attributable to our share of the consolidated earnings or loss of consolidated subsidiaries.
Segment profit excludes or includes interest and other financial charges and income taxes according to how a particular segment's management is measured:
| Interest and other financial charges and income taxes are excluded in determining segment profit (which we sometimes refer to as "operating profit") for the industrial segments. |
| Interest and other financial charges and income taxes are included in determining segment profit (which we sometimes refer to as "net earnings") for the GE Capital segment. |
Certain corporate costs, such as shared services, employee benefits and information technology are allocated to our segments based on usage. A portion of the remaining corporate costs is allocated based on each segment's relative net cost of operations.
PLANNED ACQUISITION OF ALSTOM IMPACTS MULTIPLE SEGMENTS
During the second quarter of 2014, GE's offer to acquire the Thermal, Renewables and Grid businesses of Alstom for approximately €12,350 million (to be adjusted for the assumed net cash or liability at closing) was positively recommended by Alstom's board of directors. As part of the transaction, Alstom and the French Government signed a memorandum of understanding for the formation of three joint ventures in grid technology, renewable energy, and global nuclear and French steam power. Alstom will invest approximately €2,400 million in these joint ventures at the closing of the proposed transaction.
In the fourth quarter of 2014, Alstom completed its review of the proposed transaction with the works council and obtained approval from its shareholders. Also in the fourth quarter of 2014, GE and Alstom entered into an amendment to the original agreement where GE has agreed to pay Alstom a net amount of approximately €260 million of additional consideration at closing. In exchange for this funding, Alstom has agreed to extend the trademark licensing of the Alstom name from 5 years to 25 years as well as other contractual amendments.
In the second quarter of 2015, the European Commission indicated that it had competition concerns with the proposed transaction. In response, GE proposed remedies to address the concerns of the Commission and the U.S. Department of Justice while preserving the strategic and economic rationale of the proposed transaction. On September 8, 2015, the European Commission and the Department of Justice accepted GE's proposal and approved the transaction. In order to obtain approval, GE has pledged to sell certain of Alstom's gas-turbine assets and its Power Systems Mfg. subsidiary to Ansaldo Energia SpA after the close of the transaction for approximately €120 million. As a result of final negotiations, Alstom has agreed to contribute financially to the remedies through a €300 million reduction in the purchase price of the transaction. Further, GE and Alstom agreed to other purchase price amendments that resulted in a net increase of consideration of approximately €45 million and a reduction in the trademark licensing period of the Alstom name to five years. The transaction is targeted to close in November 2015.
2015 3Q FORM 10-Q PAGE 14
The acquisition and alliances with Alstom will impact our Power & Water and Energy Management segments. The impact of acquired businesses on individual segments will be affected by a number of variables, including operating performance, purchase accounting impacts and expected synergies. In addition, due to the amount of time between signing and closing, the operations of the businesses may fluctuate and impact the overall valuation of the acquired businesses at the time of close and, accordingly, may affect the amounts assigned to the assets and liabilities recorded in accordance with purchase accounting.
PLANNED SALE OF APPLIANCES
In the third quarter of 2014, we signed an agreement to sell our Appliances business to Electrolux for approximately $3.3 billion. On July 1, 2015, we were notified that the Department of Justice had initiated court proceedings seeking to enjoin the sale of Appliances to Electrolux. Electrolux and GE intend to defend the proposed transaction and a trial date has been set for November 9, 2015.
SEGMENT RESULTS
SUMMARY OF OPERATING SEGMENTS | |||||||||||||||||
Three months ended September 30 | Nine months ended September 30 | ||||||||||||||||
(In millions) | 2015 | 2014 | V% | 2015 | 2014 | V% | |||||||||||
Revenues | |||||||||||||||||
Power & Water | $ | 6,461 | $ | 6,375 | 1 % | $ | 18,978 | $ | 18,176 | 4 % | |||||||
Oil & Gas | 3,868 | 4,597 | (16)% | 11,891 | 13,666 | (13)% | |||||||||||
Energy Management | 1,773 | 1,813 | (2)% | 5,226 | 5,341 | (2)% | |||||||||||
Aviation | 6,001 | 5,698 | 5 % | 17,927 | 17,566 | 2 % | |||||||||||
Healthcare | 4,255 | 4,485 | (5)% | 12,666 | 13,166 | (4)% | |||||||||||
Transportation | 1,593 | 1,540 | 3 % | 4,322 | 4,073 | 6 % | |||||||||||
Appliances & Lighting | 2,293 | 2,117 | 8 % | 6,469 | 6,094 | 6 % | |||||||||||
Total industrial segment revenues | 26,243 | 26,625 | (1)% | 77,479 | 78,082 | (1)% | |||||||||||
GE Capital | 6,312 | 6,384 | (1)% | 17,452 | 19,223 | (9)% | |||||||||||
Total segment revenues | 32,555 | 33,009 | (1)% | 94,931 | 97,305 | (2)% | |||||||||||
Corporate items and eliminations | (875) | (902) | (3)% | (2,201) | (2,710) | (19)% | |||||||||||
Consolidated revenues | $ | 31,680 | $ | 32,107 | (1)% | $ | 92,731 | $ | 94,595 | (2)% | |||||||
Segment profit (loss) | |||||||||||||||||
Power & Water | $ | 1,270 | $ | 1,191 | 7 % | $ | 3,362 | $ | 3,212 | 5 % | |||||||
Oil & Gas | 584 | 660 | (12)% | 1,599 | 1,771 | (10)% | |||||||||||
Energy Management | 127 | 59 | F | 237 | 133 | 78 % | |||||||||||
Aviation | 1,353 | 1,264 | 7 % | 3,936 | 3,576 | 10 % | |||||||||||
Healthcare | 652 | 727 | (10)% | 1,944 | 2,027 | (4)% | |||||||||||
Transportation | 379 | 342 | 11 % | 934 | 814 | 15 % | |||||||||||
Appliances & Lighting | 165 | 88 | 88 % | 432 | 243 | 78 % | |||||||||||
Total industrial segment profit | 4,530 | 4,331 | 5 % | 12,445 | 11,776 | 6 % | |||||||||||
GE Capital | 734 | 843 | (13)% | (7,555) | 3,091 | U | |||||||||||
Total segment profit (loss) | 5,264 | 5,174 | 2 % | 4,890 | 14,867 | (67)% | |||||||||||
Corporate items and eliminations | (1,559) | (1,550) | 1 % | (4,436) | (4,566) | (3)% | |||||||||||
GE interest and other financial charges | (440) | (377) | 17 % | (1,243) | (1,142) | 9 % | |||||||||||
GE provision for income taxes | (413) | (416) | (1)% | (1,302) | (1,143) | 14 % | |||||||||||
Earnings (loss) from continuing operations | |||||||||||||||||
attributable to the Company | 2,853 | 2,831 | 1 % | (2,091) | 8,016 | U | |||||||||||
Earnings (loss) from discontinued | |||||||||||||||||
operations, net of taxes | (347) | 706 | U | (10,336) | 2,065 | U | |||||||||||
Consolidated net earnings (loss) | |||||||||||||||||
attributable to the Company | $ | 2,506 | $ | 3,537 | (29)% | $ | (12,427) | $ | 10,081 | U | |||||||
\ | \ | ||||||||||||||||
2015 3Q FORM 10-Q PAGE 15
 POWER & WATER
 OPERATIONAL OVERVIEW - THREE AND NINE MONTHS ENDED SEPTEMBER 30
(Dollars in billions)
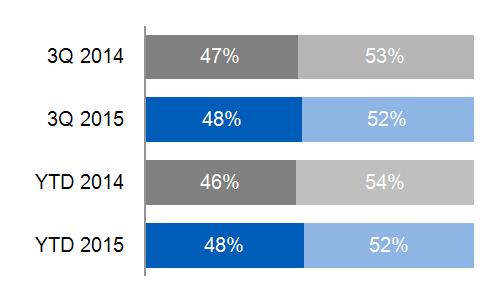
2015 YTD SUB-SEGMENT REVENUES | EQUIPMENT/SERVICES REVENUES | |||
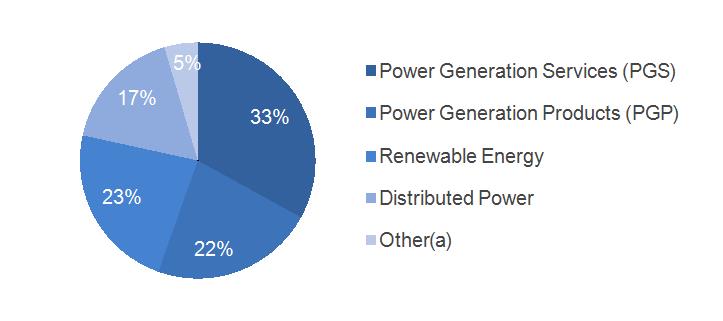
(a) Includes Water Process Technologies and Nuclear
|  | |||
Services Equipment | ||||
ORDERS |
BACKLOG | |||
 |
Equipment
Services
|  |
Equipment
Services
| |
UNIT SALES | ||||
 | ||||
2015 3Q FORM 10-Q PAGE 16
FINANCIAL OVERVIEW - THREE AND NINE MONTHS ENDED SEPTEMBER 30
(Dollars in billions)
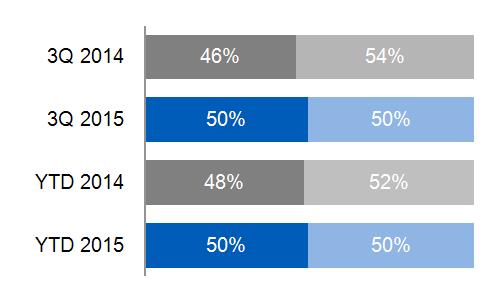
SEGMENT REVENUES & PROFIT | SEGMENT PROFIT MARGIN | |||||
Revenue Profit 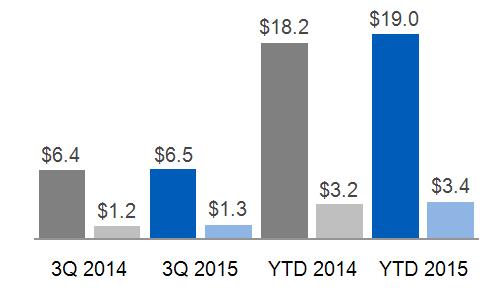 | 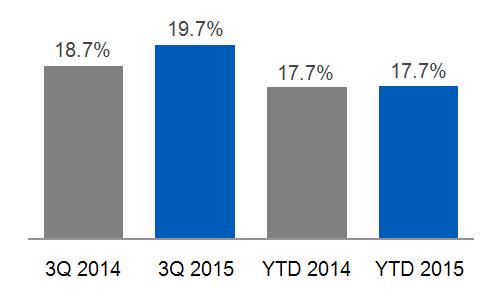 | |||||
SEGMENT REVENUES & PROFIT WALK: | COMMENTARY: 2015 - 2014 | |||||
THREE MONTHS ENDED | Segment revenues up $0.1 billion or 1%; Segment profit up $0.1 billion or 7% as a result of:
The increase in revenues was primarily due to higher volume, mainly driven by higher equipment sales at Renewable Energy and PGS upgrades, partially offset by the impact of the stronger U.S. dollar. The increase in profit was mainly due to services growth and cost productivity. These increases were partially offset by an unfavorable business mix.
| |||||
Revenues | Profit | |||||
September 30, 2014 | $ | 6.4 | $ | 1.2 | ||
Volume | 0.4 | 0.1 | ||||
Price | - | - | ||||
Foreign Exchange | (0.4) | - | ||||
(Inflation)/Deflation | N/A | - | ||||
Mix | N/A | (0.1) | ||||
Productivity | N/A | 0.1 | ||||
Other | - | - | ||||
September 30, 2015 | $ | 6.5 | $ | 1.3 | ||
NINE MONTHS ENDED | Segment revenues up $0.8 billion or 4%; Segment profit up $0.2 billion or 5% as a result of:
The increase in revenues was primarily due to higher volume, mainly driven by higher equipment sales at PGP and Renewable Energy and service sales at PGS, higher price and other income, partially offset by the impact of the stronger U.S. dollar. The increase in profit was mainly due to higher volume, price and other income, partially offset by unfavorable business mix and the impact of the stronger U.S. dollar.
| |||||
Revenues | Profit | |||||
September 30, 2014 | $ | 18.2 | $ | 3.2 | ||
Volume | 1.6 | 0.3 | ||||
Price | 0.1 | 0.1 | ||||
Foreign Exchange | (1.0) | (0.1) | ||||
(Inflation)/Deflation | N/A | - | ||||
Mix | N/A | (0.2) | ||||
Productivity | N/A | - | ||||
Other | 0.1 | 0.1 | ||||
September 30, 2015 | $ | 19.0 | $ | 3.4 | ||
2015 3Q FORM 10-Q PAGE 17
 OIL & GAS
 OPERATIONAL OVERVIEW - THREE AND NINE MONTHS ENDED SEPTEMBER 30
(Dollars in billions)
2015 YTD SUB-SEGMENT REVENUES | EQUIPMENT/SERVICES REVENUES | |||
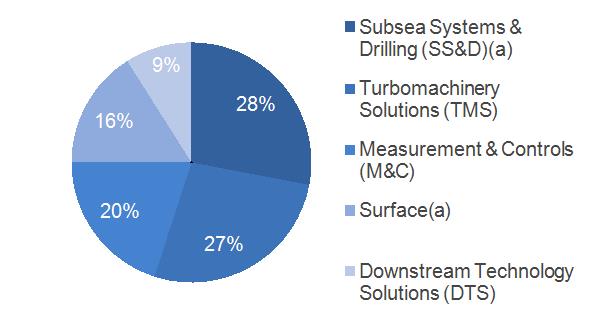 |  | |||
(a) Our drilling product line, previously part of Drilling & Surface (D&S), was realigned as part of Subsea Systems effective January 1, 2015. Accordingly, D&S is now Surface and Subsea Systems is now Subsea Systems & Drilling.
| Services Equipment
| |||
ORDERS |
BACKLOG | |||
 |
Equipment
Services
| 
(a) Prior period reflects an update for Oil & Gas services backlog. |
Equipment
Services
| |
2015 3Q FORM 10-Q PAGE 18
FINANCIAL OVERVIEW - THREE AND NINE MONTHS ENDED SEPTEMBER 30
(Dollars in billions)
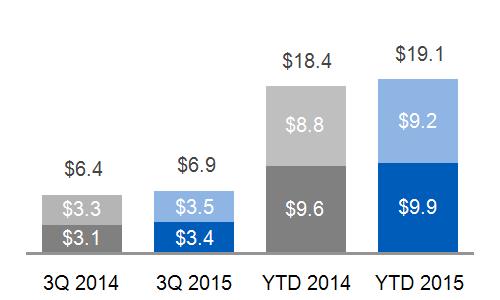
SEGMENT REVENUES & PROFIT | SEGMENT PROFIT MARGIN | |||||
Revenues Profit
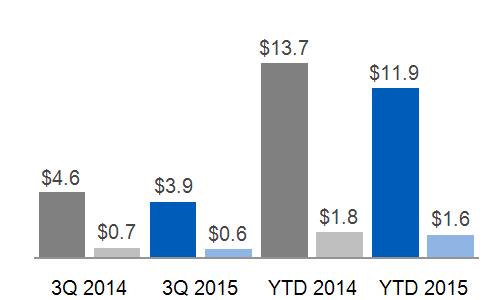 |  | |||||
SEGMENT REVENUES & PROFIT WALK: | COMMENTARY: 2015 - 2014 | |||||
THREE MONTHS ENDED | Segment revenues down $0.7 billion or 16%; Segment profit down $0.1 billion or 12% as a result of:
The decrease in revenues was primarily due to the impact of the stronger U.S. dollar and lower volume, partially offset by other income. Organic revenues* for the third quarter of 2015 were down 7% compared with the third quarter of 2014. The decrease in profit was due to lower volume, the impact of the stronger U.S. dollar and lower productivity, partially offset by other income. Organic operating profit* was flat in the third quarter of 2015.
| |||||
Revenues | Profit | |||||
September 30, 2014 | $ | 4.6 | $ | 0.7 | ||
Volume | (0.4) | (0.1) | ||||
Price | - | - | ||||
Foreign Exchange | (0.4) | (0.1) | ||||
(Inflation)/Deflation | N/A | - | ||||
Mix | N/A | - | ||||
Productivity | N/A | (0.1) | ||||
Other | 0.1 | 0.1 | ||||
September 30, 2015 | $ | 3.9 | $ | 0.6 | ||
NINE MONTHS ENDED | Segment revenues down $1.8 billion or 13%; Segment profit down $0.2 billion or 10% as a result of:
The decrease in revenues was primarily due to the impact of the stronger U.S. dollar and lower volume. Organic revenues* for the nine months ended September 30, 2015 were down 4% compared with the same period of 2014. The decrease in profit is primarily due to the impact of the stronger U.S. dollar and lower volume, partially offset by cost deflation and higher productivity. Organic operating profit* grew 5% in the nine months ended September 30, 2015.
| |||||
Revenues | Profit | |||||
September 30, 2014 | $ | 13.7 | $ | 1.8 | ||
Volume | (0.5) | (0.1) | ||||
Price | - | - | ||||
Foreign Exchange | (1.2) | (0.3) | ||||
(Inflation)/Deflation | N/A | 0.1 | ||||
Mix | N/A | - | ||||
Productivity | N/A | 0.1 | ||||
Other | (0.1) | - | ||||
September 30, 2015 | $ | 11.9 | $ | 1.6 | ||
*Non-GAAP Financial Measure
2015 3Q FORM 10-Q PAGE 19
 ENERGY MANAGEMENT
 OPERATIONAL OVERVIEW - THREE AND NINE MONTHS ENDED SEPTEMBER 30
(Dollars in billions)
2015 YTD SUB-SEGMENT REVENUES | EQUIPMENT/SERVICES REVENUES | |||
 | 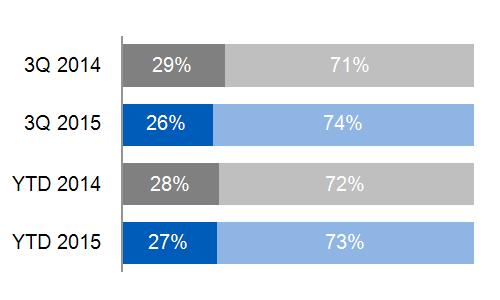 | |||
Services Equipment
| ||||
ORDERS |
BACKLOG | |||
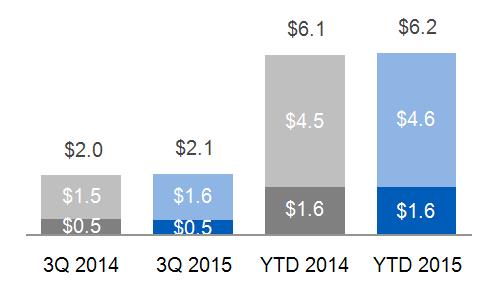 |
Equipment
Services
| 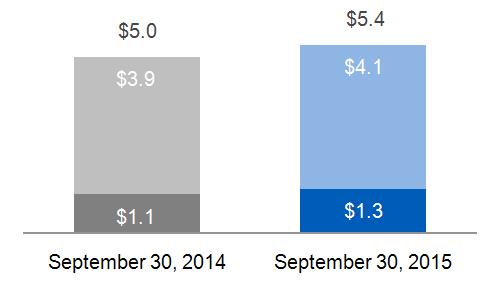 |
Equipment
Services
| |
2015 3Q FORM 10-Q PAGE 20
FINANCIAL OVERVIEW - THREE AND NINE MONTHS ENDED SEPTEMBER 30
(Dollars in billions)
SEGMENT REVENUES & PROFIT | SEGMENT PROFIT MARGIN | ||||
 |
 | ||||
Revenue Profit
| |||||
COMMENTARY: 2015 - 2014 | |||||
THREE MONTHS ENDED Segment revenues down 2% as a result of:
| NINE MONTHS ENDED Segment revenues down $0.1 billion or 2% as a result of:
| ||||
The impact of the stronger U.S. dollar ($0.1 billion), partially offset by higher sales volume ($0.1 billion).
| The impact of the stronger U.S. dollar ($0.4 billion), partially offset by higher volume ($0.3 billion).
| ||||
Segment profit up $0.1 billion as a result of :
| Segment profit up $0.1 billion or 78% as a result of :
| ||||
Improved productivity ($0.1 billion).
| Improved productivity ($0.2 billion), partially offset by the impact of the stronger U.S. dollar ($0.1 billion).
| ||||
2015 3Q FORM 10-Q PAGE 21
 AVIATION
 OPERATIONAL OVERVIEW - THREE AND NINE MONTHS ENDED SEPTEMBER 30
(Dollars in billions)
2015 YTD SUB-SEGMENT REVENUES | EQUIPMENT/SERVICES REVENUES | |||
 |  | |||
Services Equipment
| ||||
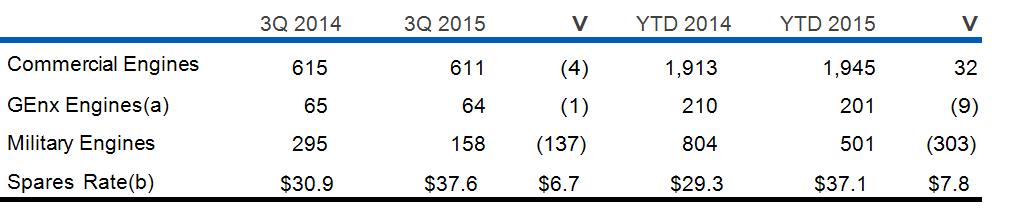
ORDERS |
BACKLOG | |||
 |
Equipment
Services
| 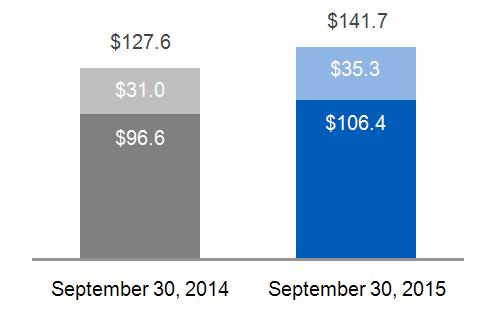 |
Equipment
Services
| |
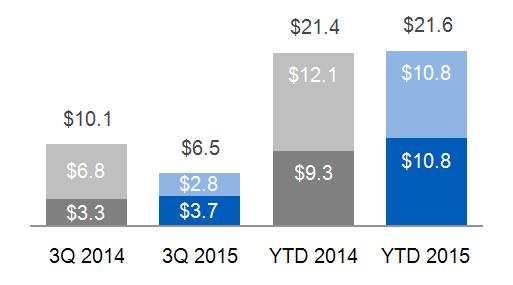
UNIT SALES | ||||
 (a) GEnx engines are a subset of commercial engines (b) Commercial spares shipment rate in millions of dollars per day | ||||
2015 3Q FORM 10-Q PAGE 22
FINANCIAL OVERVIEW - THREE AND NINE MONTHS ENDED SEPTEMBER 30
(Dollars in billions)
SEGMENT REVENUES & PROFIT | SEGMENT PROFIT MARGIN | |||||
Revenues Profit 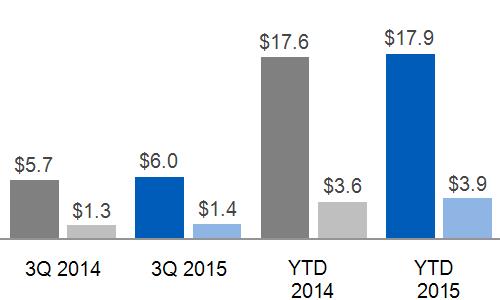 |
 | |||||
SEGMENT REVENUES & PROFIT WALK: | COMMENTARY: 2015 - 2014 | |||||
THREE MONTHS ENDED | Segment revenues up $0.3 billion or 5%; Segment profit up $0.1 billion or 7% as a result of:
The increase in revenues was primarily due to higher services volume and higher prices. The increase in profit was mainly due to higher price as well as a favorable business mix, partially offset lower productivity.
| |||||
Revenues | Profit | |||||
September 30, 2014 | $ | 5.7 | $ | 1.3 | ||
Volume | 0.2 | - | ||||
Price | 0.1 | 0.1 | ||||
Foreign Exchange | - | - | ||||
(Inflation)/Deflation | N/A | - | ||||
Mix | N/A | 0.1 | ||||
Productivity | N/A | (0.1) | ||||
Other | - | - | ||||
September 30, 2015 | $ | 6.0 | $ | 1.4 | ||
NINE MONTHS ENDED | Segment revenues up $0.4 billion or 2%; Segment profit up $0.4 billion or 10% as a result of:
The increase in revenues was primarily due to higher prices, partially offset by lower volume. The increase in profit was mainly due to higher price as well as a favorable business mix. These increases were partially offset by the effects of inflation.
| |||||
Revenues | Profit | |||||
September 30, 2014 | $ | 17.6 | $ | 3.6 | ||
Volume | (0.1) | - | ||||
Price | 0.5 | 0.5 | ||||
Foreign Exchange | - | - | ||||
(Inflation)/Deflation | N/A | (0.2) | ||||
Mix | N/A | 0.1 | ||||
Productivity | N/A | - | ||||
Other | - | - | ||||
September 30, 2015 | $ | 17.9 | $ | 3.9 | ||
2015 3Q FORM 10-Q PAGE 23
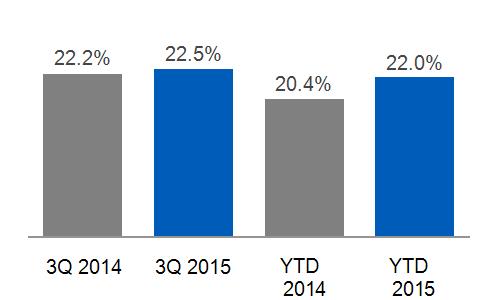
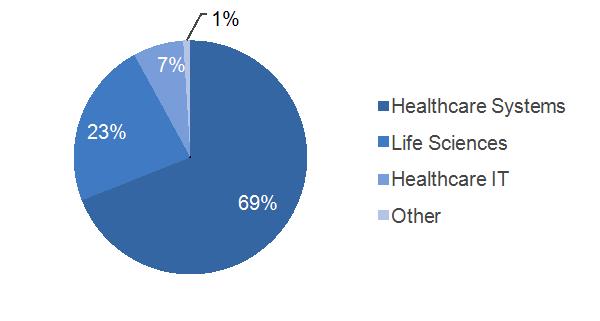
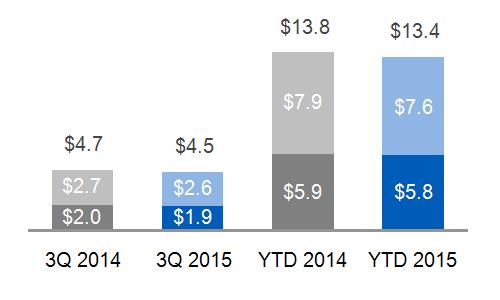
 HEALTHCARE
 OPERATIONAL OVERVIEW - THREE AND NINE MONTHS ENDED SEPTEMBER 30
(Dollars in billions)
2015 YTD SUB-SEGMENT REVENUES | EQUIPMENT/SERVICES REVENUES | |||
 | Services Equipment 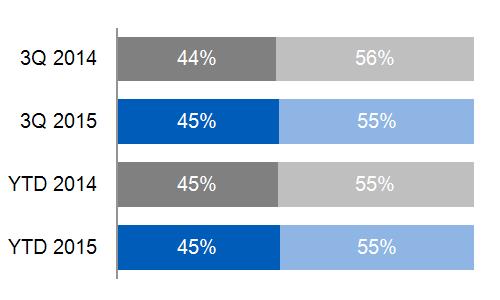 | |||
ORDERS |
BACKLOG | |||
 |
Equipment
Services
|  |
Equipment
Services
| |
2015 3Q FORM 10-Q PAGE 24
FINANCIAL OVERVIEW - THREE AND NINE MONTHS ENDED SEPTEMBER 30
(Dollars in billions)
SEGMENT REVENUES & PROFIT | SEGMENT PROFIT MARGIN | |||||
Revenue Profit 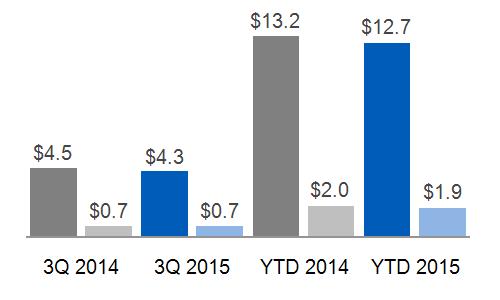 | 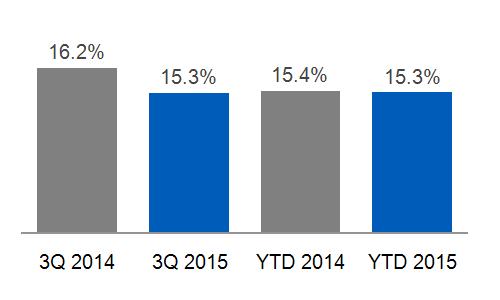 | |||||
SEGMENT REVENUES & PROFIT WALK: | COMMENTARY: 2015 - 2014 | |||||
THREE MONTHS ENDED | Segment revenues down $0.2 billion or 5%; Segment profit down $0.1 billion or 10% as a result of:
The decrease in revenues was due to the impact of the stronger U.S. dollar and lower prices, mainly in Healthcare Systems. These decreases were partially offset by higher volume, mainly driven by Life Sciences. The decrease in profit was due to lower prices, mainly in Healthcare Systems, partially offset by higher productivity as increased R&D and related costs were more than offset by higher cost productivity.
| |||||
Revenues | Profit | |||||
September 30, 2014 | $ | 4.5 | $ | 0.7 | ||
Volume | 0.2 | - | ||||
Price | (0.1) | (0.1) | ||||
Foreign Exchange | (0.3) | - | ||||
(Inflation)/Deflation | NA | - | ||||
Mix | N/A | - | ||||
Productivity | N/A | 0.1 | ||||
Other | - | - | ||||
September 30, 2015 | $ | 4.3 | $ | 0.7 | ||
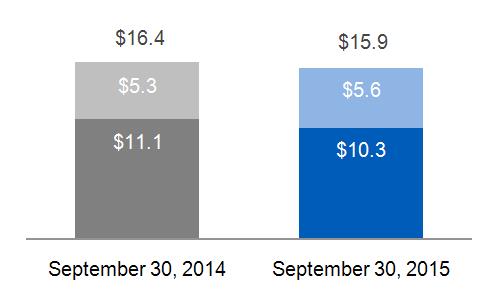
NINE MONTHS ENDED | Segment revenues down $0.5 billion or 4%; Segment profit down $0.1 billion or 4% as a result of:
The decrease in revenues was due to the impact of the stronger U.S. dollar and lower prices, mainly in Healthcare Systems. These decreases were partially offset by higher volume, mainly driven by Life Sciences. The decrease in profit was due to lower prices, mainly in Healthcare Systems, the impact of the stronger U.S. dollar and the effects of inflation. These decreases were partially offset by higher volume and higher productivity as increased R&D and related costs were more than offset by higher cost productivity.
| |||||
Revenues | Profit | |||||
September 30, 2014 | $ | 13.2 | $ | 2.0 | ||
Volume | 0.6 | 0.1 | ||||
Price | (0.2) | (0.2) | ||||
Foreign Exchange | (0.8) | (0.1) | ||||
(Inflation)/Deflation | N/A | (0.1) | ||||
Mix | N/A | - | ||||
Productivity | N/A | 0.3 | ||||
Other | - | - | ||||
September 30, 2015 | $ | 12.7 | $ | 1.9 | ||
2015 3Q FORM 10-Q PAGE 25
 TRANSPORTATION
 OPERATIONAL OVERVIEW - THREE AND NINE MONTHS ENDED SEPTEMBER 30
(Dollars in billions)
2015 YTD SUB-SEGMENT REVENUES | EQUIPMENT/SERVICES REVENUES | |||
(a) Includes Marine, Stationary & Drilling 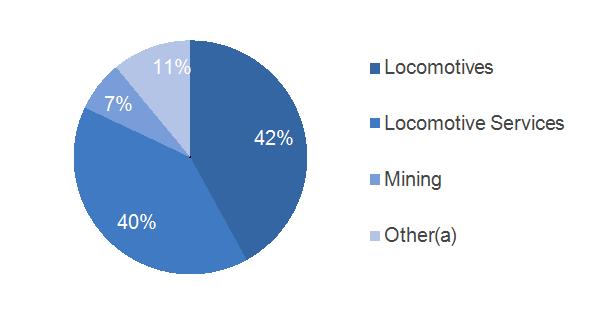 | Services Equipment 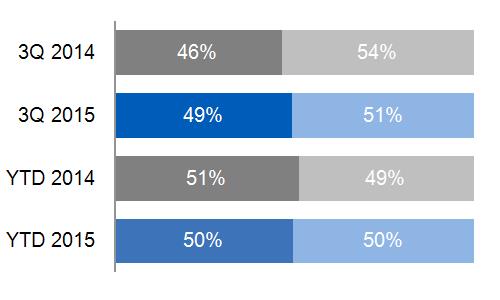 | |||
ORDERS |
BACKLOG | |||
 |
Equipment
Services
|  |
Equipment
Services
| |
UNIT SALES | ||||
 | ||||
2015 3Q FORM 10-Q PAGE 26
FINANCIAL OVERVIEW - THREE AND NINE MONTHS ENDED SEPTEMBER 30
(Dollars in billions)
SEGMENT REVENUES & PROFIT | SEGMENT PROFIT MARGIN | |
Revenue Profit  |
 | |
COMMENTARY: 2015 - 2014 | ||
THREE MONTHS ENDED Segment revenues up $0.1 billion or 3% as a result of: Higher volume, primarily due to higher locomotive and services sales.
Segment profit up 11% as a result of: Cost productivity and deflation, partially offset by an unfavorable business mix. | NINE MONTHS ENDED Segment revenues up $0.2 billion or 6% as a result of: Higher volume ($0.2 billion), due to higher locomotive and services sales.
Segment profit up $0.1 billion or 15% as a result of: Higher cost productivity ($0.1 billion), higher volume driven by locomotive and services sales and continued deflation, partially offset by an unfavorable business mix ($0.1 billion).
|
2015 3Q FORM 10-Q PAGE 27
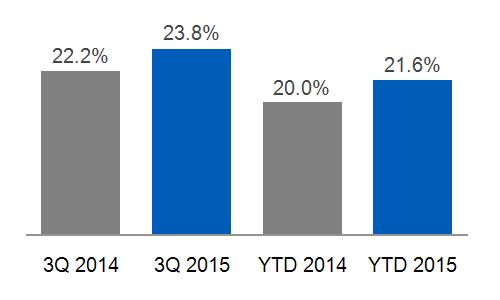
 APPLIANCES & LIGHTING
 OPERATIONAL OVERVIEW - THREE AND NINE MONTHS ENDED SEPTEMBER 30
(Dollar in billions)
2015 YTD SUB-SEGMENT REVENUES | |||
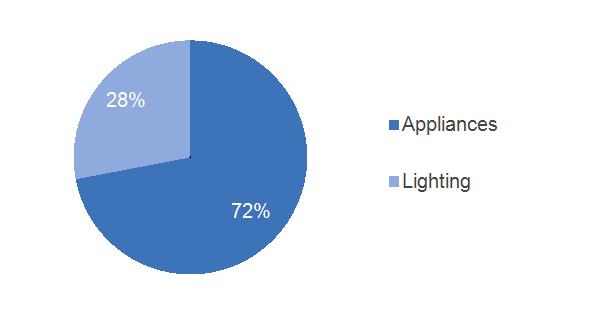 | |||
FINANCIAL OVERVIEW - THREE AND NINE MONTHS ENDED SEPTEMBER 30 (Dollar in billions) | |||
SEGMENT REVENUES & PROFIT |
SEGMENT PROFIT MARGIN | ||
Revenue Profit 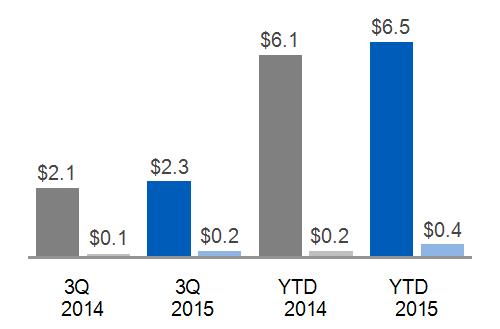 | 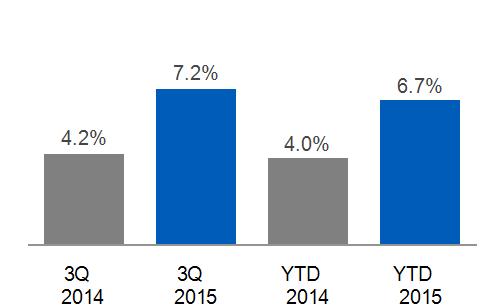 | ||
COMMENTARY: 2015 - 2014 | |||
THREE MONTHS ENDED Segment revenues up $0.2 billion or 8% as a result of: Higher volume ($0.2 billion) driven by higher sales at Appliances.
Segment profit up $0.1 billion or 88% as a result of : Improved productivity ($0.1 billion), including the effects of classifying Appliances as a business held for sale in the third quarter of 2014.
| NINE MONTHS ENDED Segment revenues up $0.4 billion or 6% as a result of: Higher volume ($0.5 billion) driven by higher sales at Appliances, partially offset by lower prices ($0.1 billion) and the impact of the stronger U.S. dollar ($0.1 billion).
Segment profit up $0.2 billion or 78% as a result of : Improved productivity ($0.2 billion), including the effects of classifying Appliances as a business held for sale and the effects of inflation ($0.1 billion), partially offset by lower prices ($0.1 billion).
| ||
2015 3Q FORM 10-Q PAGE 28
GE CAPITAL OPERATIONAL OVERVIEW - THREE AND NINE MONTHS ENDED SEPTEMBER 30
(Dollars in billions)
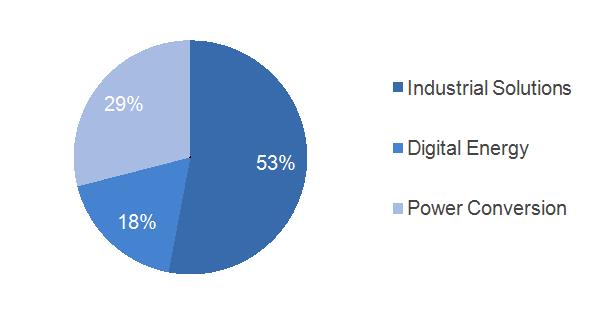
2015 YTD SUB-SEGMENT REVENUES | |||
 | |||
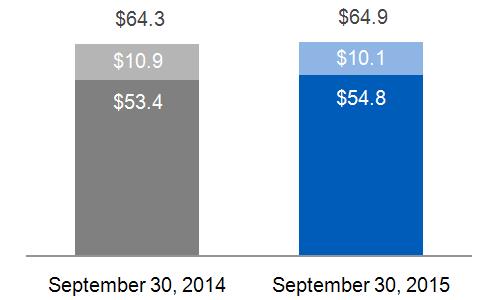
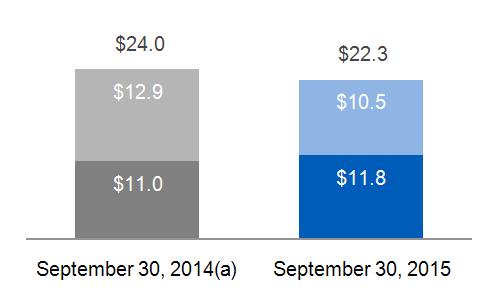
ENDING NET INVESTMENT, EXCLUDING LIQUIDITY* |
TIER 1 COMMON RATIO ESTIMATE* | ||
 | 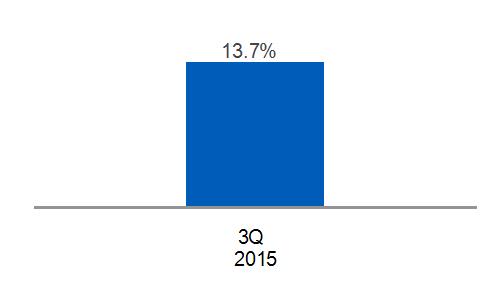 | ||
SIGNIFICANT TRENDS & DEVELOPMENTS | |||
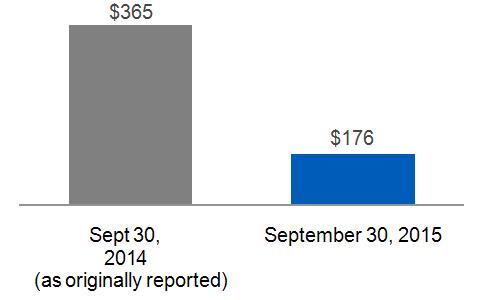
| The GE Capital Exit Plan - As previously discussed, on April 10, 2015, the Company announced its plan to reduce the size of the financial services businesses through the sale of most of the assets of GECC over the following 24 months. It is expected that as a result of the GE Capital Exit Plan, the GE Capital businesses that will remain with GE will account for about $90 billion in ending net investment (ENI), excluding liquidity, including about $40 billion in the U.S. ENI is a metric used to measure the total capital invested in the financial services businesses. GE Capital's ENI, excluding liquidity* was $176 billion at September 30, 2015. |
During the first nine months of 2015, GE signed agreements to sell approximately $94 billion of ENI, excluding liquidity (as originally reported at December 31, 2014), of which $45 billion and $33 billion related to the CLL and Real Estate businesses, respectively. CLL transactions signed in the third quarter 2015 included approximately $9.3 billion related to its Healthcare Financial Services U.S. lending business with Capital One, approximately $7.6 billion related to its Transportation Finance business in the U.S. and Canada with BMO Financial Group, and approximately $1.8 billion related to its Mubadala joint venture, with MidCap Finco Ltd., which is managed by Apollo Capital Management .
Of the signed agreements, approximately $60 billion have closed, including approximately $30 billion and $21 billion related to Real Estate and CLL, respectively. The Real Estate transactions that have closed included the majority of GECC's Real Estate debt and equity portfolio sold to funds managed by The Blackstone Group (which, in turn, sold a portion of this portfolio to Wells Fargo & Company). In connection with The Blackstone Group transactions, GECC provided $3.2 billion of seller financing to The Blackstone Group, which GECC intends to syndicate by 2016. As of September 30, 2015, GECC has collected or sold approximately $0.4 billion of this seller financing. The CLL transactions that have closed included its U.S. and European Sponsor Finance businesses and the majority of its Global Fleet services business.
* Non-GAAP Financial Measure
2015 3Q FORM 10-Q PAGE 29
In addition, during October 2015, we signed agreements to sell approximately $32 billion of ENI, excluding liquidity (as originally reported at December 31, 2014) related to our CLL business. These signed CLL transactions included approximately $30 billion related to our global Commercial Distribution Finance, North American Vendor Finance and North American Corporate Finance businesses with Wells Fargo & Company and approximately $2 billion related to our Corporate Aircraft portfolio with Global Jet Capital.
In the nine months ended September 30, 2015, GE recorded $21.1 billion of after-tax charges related to the GE Capital Exit Plan, including $0.4 billion of after-tax charges recorded in the third quarter of 2015, primarily exit-related charges in our CLL business, partially offset by income associated with operations in CLL and Real Estate. A description of after-tax charges for the nine months ended September 30, 2015 is provided below.
| $9.8 billion of net loss primarily related to the planned disposition of the Real Estate business and most of the CLL business, which is recorded in discontinued operations under the caption "Earnings (loss) from discontinued operations, net of taxes" in the Statement of Earnings. |
| $6.2 billion of tax expense related to expected repatriation of foreign earnings and write-off of deferred tax assets, of which $6.1 billion is reported in GECC's Corporate component and $0.2 billion reported in our Consumer business all recorded in continuing operations under the caption "Benefit (provision) for income taxes" in the Statement of Earnings. |
| $4.7 billion of net asset impairments due to shortened hold periods, of which $3.2 billion is recorded in continuing operations in our Consumer business primarily under the captions "Provisions for losses on financing receivables" and "Revenues from services" in the Statement of Earnings and $1.5 billion is recorded in discontinued operations in our CLL business under the caption "Earnings (loss) from discontinued operations, net of taxes" in the Statement of Earnings. |
| $0.4 billion of restructuring and other charges, of which $0.3 billion is recorded in continuing operations in GECC's Corporate component under the caption "Other costs and expenses" in the Statement of Earnings and $0.1 billion is recorded in discontinued operations in our CLL business under the caption "Earnings (loss) from discontinued operations, net of taxes" in the Statement of Earnings. |
| Budapest Bank – On June 29, 2015 we closed the sale of Budapest Bank to Hungary's government. |
| Australia and New Zealand (ANZ) Consumer Lending – At September 30, 2015, we had an agreement to sell our consumer finance business in Australia and New Zealand to a consortium including KKR, Varde Partners and Deutsche Bank for approximately 6.0 billion Australian dollars and 1.4 billion New Zealand dollars, respectively. |
| Milestone Aviation Group – On January 30, 2015, GECAS acquired Milestone Aviation Group, a helicopter leasing business, for approximately $1.8 billion. |
| Synchrony Financial – On October 19, 2015, GE commenced an offer to exchange GE common stock for common stock of GECC's approximately 84.6% owned subsidiary, Synchrony Financial. This exchange offer is in connection with the previously announced separation of Synchrony Financial and is expected to conclude the week of November 16, 2015. We estimate that the exchange will reduce the outstanding shares of GE common stock by approximately 6-7%. Following the completion of the share exchange, GECC expects the Federal Reserve Board to act in due course on its application to deregister as a savings and loan holding company but cannot predict the timing of the Federal Reserve Board's action. For further information about the Synchrony Financial transaction, see the Form S-4 filed by Synchrony Financial on October 19, 2015 . |
| Dividends - GECC paid no dividends and $0.5 billion of dividends to GE in the three and nine months ended September 30, 2015, respectively. |
2015 3Q FORM 10-Q PAGE 30
FINANCIAL OVERVIEW - THREE AND NINE MONTHS ENDED SEPTEMBER 30
(Dollars in billions)
SEGMENT REVENUES & PROFIT (LOSS) (a) | ||
Revenue Profit (Loss)
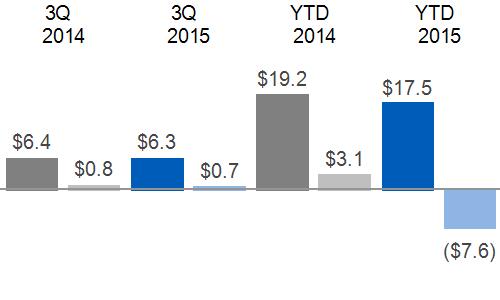 |
(a) Interest and other financial charges and income taxes are included in determining segment profit (loss) for the GE Capital segment.
| |
COMMENTARY: 2015 - 2014 | ||
Segment revenues decreased 1% in the three months ended September 30, 2015 as a result of higher impairments and the effects of currency exchange, partially offset by higher gains and the effects of acquisitions. Net earnings decreased 13% in the three months ended September 30, 2015 primarily due to core decreases, including charges associated with the GE Capital Exit Plan and higher impairments, partially offset by higher gains, the effects of dispositions and lower provisions for losses on financing receivables.
Segment revenues decreased 9% and net earnings decreased significantly in the nine months ended September 30, 2015, primarily due to the effects of the GE Capital Exit Plan.
COMMERCIAL LENDING AND LEASING
During the second quarter of 2015, the majority of CLL's business met held for sale criteria and was classified as discontinued operations. See Note 2 for additional information. The discussion below relates solely to the portion of CLL's business classified as continuing operations, which include Healthcare Equipment Finance and Working Capital Solutions.
CLL 2015 revenues increased 14% and net earnings increased 23% in the three months ended September 30, 2015. Revenues increased primarily as a result of organic revenue growth. Net earnings increased reflecting core increases.
CLL 2015 revenues increased 6% and net earnings increased 13% in the nine months ended September 30, 2015. Revenues increased primarily as a result of organic revenue growth, partially offset by the effects of currency exchange. Net earnings increased reflecting core increases.
2015 3Q FORM 10-Q PAGE 31
CONSUMER
Consumer 2015 revenues increased 1% and net earnings increased 28% in the three months ended September 30, 2015. Revenues increased reflecting higher gains ($0.2 billion), organic revenue growth ($0.1 billion) and the effects of acquisitions, partially offset by the effects of dispositions ($0.2 billion) and the effects of currency exchange ($0.1 billion). Net earnings increased as a result of higher gains ($0.1 billion) and lower provisions for financing receivables ($0.1 billion), partially offset by core decreases.
Consumer 2015 revenues decreased 15% and net earnings decreased unfavorably in the nine months ended September 30, 2015. Revenues decreased as a result of higher impairments ($1.4 billion), the effects of dispositions ($0.5 billion) and the effects of currency exchange ($0.4 billion), partially offset by higher gains ($0.4 billion), organic revenue growth ($0.3 billion) and the effects of acquisitions. Net earnings decreased as a result of higher provisions for losses on financing receivables ($2.0 billion), higher impairments ($1.2 billion) and core decreases ($0.4 billion), partially offset by higher gains ($0.2 billion). These decreases are primarily related to the reclassification of assets within Consumer to financing receivables held-for-sale recorded at the lower of cost or fair value, less cost to sell ($2.2 billion), and asset impairments related to equity method investments in connection with the GE Capital Exit Plan ($1.2 billion).
ENERGY FINANCIAL SERVICES
Energy Financial Services 2015 revenues decreased 35% and net earnings decreased unfavorably in the three months ended September 30, 2015. Revenues decreased as a result of higher impairments ($0.2 billion), lower gains ($0.1 billion) and organic revenue declines, partially offset by the effects of dispositions ($0.2 billion). Net earnings decreased as a result of higher impairments ($0.1 billion) and lower gains, partially offset by the effects of dispositions ($0.1 billion).
Energy Financial Services 2015 revenues decreased 19% and net earnings decreased 63% in the nine months ended September 30, 2015. Revenues decreased as a result of organic revenue declines ($0.3 billion), higher impairments ($0.1 billion) and lower gains ($0.1 billion), partially offset by the effects of dispositions ($0.2 billion). Net earnings decreased as a result of core decreases ($0.2 billion), higher impairments ($0.1 billion) and lower gains, partially offset by the effects of dispositions ($0.1 billion).
GECAS
GECAS 2015 revenues increased 4% and net earnings increased favorably in the three months ended September 30, 2015. Revenues increased as a result of the effects of acquisitions ($0.1 billion), partially offset by organic revenue declines ($0.1 billion). Net earnings increased as a result of lower impairments ($0.1 billion), the effects of acquisitions and core increases.
GECAS 2015 revenues decreased slightly and net earnings increased 18% in the nine months ended September 30, 2015. Revenues decreased as a result of organic revenue declines ($0.4 billion), partially offset by the effects of acquisitions ($0.2 billion) and lower impairments ($0.1 billion). Net earnings increased as a result of lower impairments ($0.2 billion) and the effects of acquisitions ($0.1 billion), partially offset by core decreases ($0.1 billion).
2015 3Q FORM 10-Q PAGE 32
CORPORATE ITEMS AND ELIMINATIONS | ||||||||||||
REVENUES AND OPERATING PROFIT (COST) | ||||||||||||
Three months ended September 30 | Nine months ended September 30 | |||||||||||
(In millions) | 2015 | 2014 | 2015 | 2014 | ||||||||
Revenues | ||||||||||||
Gains on disposed or held for sale businesses | $ | - | $ | - | $ | 49 | $ | 91 | ||||
NBCU settlement | - | - | 450 | - | ||||||||
Eliminations and other | (875) | (902) | (2,700) | (2,801) | ||||||||
Total Corporate Items and Eliminations | $ | (875) | $ | (902) | $ | (2,201) | $ | (2,710) | ||||
Operating profit (cost) | ||||||||||||
Gains on disposed or held for sale businesses | $ | - | $ | - | $ | 49 | $ | 91 | ||||
NBCU settlement | - | - | 450 | - | ||||||||
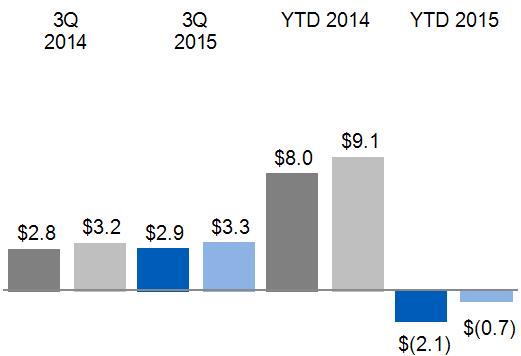
Principal retirement plans(a) | (659) | (582) | (2,121) | $ | (1,745) | |||||||
Restructuring and other charges | (346) | (435) | (1,167) | (1,218) | ||||||||
Eliminations and other | (554) | (533) | (1,647) | (1,694) | ||||||||
Total Corporate Items and Eliminations | $ | (1,559) | $ | (1,550) | $ | (4,436) | $ | (4,566) | ||||
CORPORATE COSTS | ||||||||||||
Three months ended September 30 | Nine months ended September 30 | |||||||||||
(In millions) | 2015 | 2014 | 2015 | 2014 | ||||||||
Total Corporate Items and Eliminations | $ | (1,559) | $ | (1,550) | $ | (4,436) | $ | (4,566) | ||||
Less non-operating pension cost | (693) | (537) | (2,077) | (1,592) | ||||||||
Total Corporate costs (operating) * | $ | (866) | $ | (1,013) | $ | (2,359) | $ | (2,974) | ||||
Less restructuring and other charges, gains and settlement | (346) | (435) | (668) | (1,127) | ||||||||
Adjusted total corporate costs (operating)* | $ | (520) | $ | (578) | $ | (1,691) | $ | (1,847) | ||||
(a) | Included non-operating pension cost* of $(0.7) billion and $(0.5) billion in the three months ended September 30, 2015 and 2014, respectively, and $(2.1) billion and $(1.6) billion in the nine months ended September 30, 2015 and 2014, respectively, which includes expected return on plan assets, interest costs and non-cash amortization of actuarial gains and losses. |
2015 – 2014 COMMENTARY: THREE MONTHS ENDED SEPTEMBER 30
Revenues and other income were flat.
Operating costs were flat, primarily as a result of:
| $0.1 billion lower restructuring and other charges offset by $0.1 billion higher costs associated with our principal retirement plans, including the effects of lower discount rates and updated mortality assumptions, and |
| Lower headquarter functional costs offset by higher investment in Information Technology (IT) growth initiatives. |
2015 – 2014 COMMENTARY: NINE MONTHS ENDED SEPTEMBER 30
Revenues and other income increased $0.5 billion, primarily a result of:
| $0.5 billion higher other income from a settlement related to the NBCU transaction. |
Operating costs decreased $0.1 billion, primarily as a result of:
| $0.5 billion higher income from the NBCU transaction, |
| $0.1 billion of lower restructuring and other charges, and |
| Lower headquarter functional costs offset by higher investment in IT growth initiatives. |
These decreases to operating costs were partially offset by $0.4 billion higher costs associated with our principal retirement plans including the effects of lower discount rates and updated mortality assumptions.
*Non-GAAP Financial Measure
2015 3Q FORM 10-Q PAGE 33
COSTS NOT INCLUDED IN SEGMENT RESULTS
Certain amounts are not included in industrial operating segment results because they are excluded from measurement of their operating performance for internal and external purposes. These amounts are included in GE Corporate Items & Eliminations and may include matters such as charges for restructuring; rationalization and other similar expenses; acquisition costs and related charges; technology and product development cost; certain gains and losses from acquisitions or dispositions; and litigation settlements or other charges, for which responsibility preceded the current management team. The amount of costs and gains not included in segment results follows.
COSTS | |||||||||||
Three months ended September 30 | Nine months ended September 30 | ||||||||||
(In billions) | 2015 | 2014 | 2015 | 2014 | |||||||
Power & Water | $ | 0.1 | $ | 0.1 | $ | 0.2 | $ | 0.3 | |||
Oil & Gas | 0.2 | 0.1 | 0.5 | 0.2 | |||||||
Energy Management | - | 0.1 | 0.1 | 0.2 | |||||||
Aviation | - | 0.1 | - | 0.2 | |||||||
Healthcare | - | 0.1 | 0.1 | 0.4 | |||||||
Transportation | - | - | - | - | |||||||
Appliances & Lighting | - | - | - | 0.1 | |||||||
Total | $ | 0.3 | $ | 0.5 | $ | 1.1 | $ | 1.4 | |||
For the nine months ended September 30, 2014, a gain of $0.1 billion related to a fuel dispenser business disposition was excluded from Oil & Gas results.
2015 3Q FORM 10-Q PAGE 34
DISCONTINUED OPERATIONS
Discontinued operations primarily included most of our CLL business, our Real Estate business and our U.S. mortgage business (WMC). All of these operations were previously reported in the GE Capital segment.
Results of operations, financial position and cash flows for these businesses are separately reported as discontinued operations for all periods presented.
FINANCIAL INFORMATION FOR DISCONTINUED OPERATIONS | |||||||||||
Three months ended September 30 | Nine months ended September 30 | ||||||||||
(In millions) | 2015 | 2014 | 2015 | 2014 | |||||||
Earnings (loss) from discontinued operations, net of taxes | $ | (347) | $ | 706 | $ | (10,336) | $ | 2,065 | |||
2015 – 2014 COMMENTARY: THREE MONTHS ENDED SEPTEMBER 30
The third quarter 2015 loss from discontinued operations, net of taxes, primarily reflected the following:
| $0.5 billion after-tax loss at our CLL business (including $1.2 billion after-tax impairment charges on planned disposals). |
| Third quarter 2015 losses were partially offset by $0.1 billion after-tax earnings at our Real Estate business, including a $0.2 billion after-tax gain on transactions closed in the quarter. |
The third quarter 2014 earnings from discontinued operations, net of taxes, primarily reflected the following:
| $0.5 billion of after-tax earnings from operations at our CLL business, and |
| $0.2 billion of after-tax earnings from operations at our Real Estate business. |
2015 – 2014 COMMENTARY: NINE MONTHS ENDED SEPTEMBER 30
The 2015 loss from discontinued operations, net of taxes, primarily reflected the following:
| $8.2 billion after-tax loss at our CLL business (including a $8.4 billion after-tax loss on planned disposals), and |
| $2.2 billion after-tax loss at our Real Estate business primarily loss on planned disposals. |
The 2014 earnings from discontinued operations, net of taxes, primarily reflected the following:
| $1.4 billion of after-tax earnings from operations at our CLL business, and |
| $0.7 billion of after-tax earnings from operations at our Real Estate business. |
For additional information related to discontinued operations, see Note 2 to the consolidated financial statements.
2015 3Q FORM 10-Q PAGE 35
OTHER CONSOLIDATED INFORMATION
INCOME TAXES
Income taxes have a significant effect on our net earnings. As a global commercial enterprise, our tax rates are affected by many factors, including our global mix of earnings, the extent to which those global earnings are indefinitely reinvested outside the United States, legislation, acquisitions, dispositions and tax characteristics of our income. Our tax rates are also affected by tax incentives introduced in the U.S. and other countries in furtherance of policies to encourage and support certain types of activity. Our tax returns are routinely audited and settlements of issues raised in these audits sometimes affect our tax provisions.
GE and GECC file a consolidated U.S. federal income tax return. This enables GE to use GECC tax deductions and credits to reduce the tax that otherwise would have been payable by GE. The GECC effective tax rate reflects the benefit of these tax reductions in the consolidated return. GE makes cash payments to GECC for these tax reductions at the time GE's tax payments are due.
CONSOLIDATED – THREE AND NINE MONTHS ENDED SEPTEMBER 30
(Dollars in billions)
PROVISION FOR INCOME TAXES | |||
 | |||
2015 – 2014 COMMENTARY: THREE MONTHS ENDED SEPTEMBER 30
| The consolidated income tax provision was slightly lower as tax benefits associated with the GE Capital Exit Plan were largely offset by lower tax benefits from lower-taxed global operations. |
| The consolidated tax provision includes $0.4 billion for GE (excluding GECC) for the third quarters of both 2014 and 2015. |
2015 – 2014 COMMENTARY: NINE MONTHS ENDED SEPTEMBER 30
| The consolidated income tax rate for the nine months ended September 30, 2015 was greater than 100% as the positive tax expense of $7.5 billion exceeded pre-tax income of $5.6 billion due to charges associated with GE Capital Exit Plan. |
| As discussed in Note 10 to the consolidated financial statements, during the first nine months ended September 30, 2015 in conjunction with the GE Capital Exit Plan, we incurred tax expense of $6.2 billion related to expected repatriation of foreign earnings and write-off of deferred tax assets. |
| The increase in the income tax expense is primarily due to the tax expense incurred as part of the GE Capital Exit Plan, lower tax benefits from lower-taxed global operations and an increase in pre-tax income taxed at above the average tax rate. |
| The consolidated tax provision includes $1.3 billion and $1.1 billion for GE (excluding GECC) for the first nine months of 2015 and 2014, respectively. The increase is related primarily to higher pre-tax income taxed at above the average tax rate. |
2015 3Q FORM 10-Q PAGE 36
|
|
BENEFITS FROM GLOBAL OPERATIONS
Absent the effects of the GE Capital Exit Plan, our consolidated income tax rate is lower than the U.S. statutory rate primarily because of benefits from lower-taxed global operations, including the use of global funding structures. There is a benefit from global operations as non-U.S. income is subject to local country tax rates that are significantly below the 35% U.S. statutory rate. These non-U.S. earnings have been indefinitely reinvested outside the U.S. and are not subject to current U.S. income tax. The rate of tax on our indefinitely reinvested non-U.S. earnings is below the 35% U.S. statutory rate because we have significant business operations subject to tax in countries where the tax on that income is lower than the U.S. statutory rate and because GE funds certain of its non-U.S. operations through foreign companies that are subject to low foreign taxes.
Historically, the most significant portion of these benefits depends on the provision of U.S. law deferring the tax on active financial services income, which, as discussed below, is subject to expiration. A substantial portion of the remaining benefit related to business operations subject to tax in countries where the tax on that income is lower than the U.S. statutory rate is derived from our GECAS aircraft leasing operations located in Ireland. No other operation in any one country accounts for a material portion of the remaining balance of the benefit.
We expect our ability to benefit from non-U.S. income taxed at less than the U.S. rate to continue, subject to changes in our earnings profile due to the GE Capital Exit Plan and changes in U.S. or foreign law, including the expiration of the U.S. tax law provision deferring tax on active financial services income. In addition, since this benefit depends on management's intention to indefinitely reinvest amounts outside the U.S., our tax provision will increase to the extent we no longer intend to indefinitely reinvest foreign earnings.
STATEMENT OF FINANCIAL POSITION
Because GE and GECC share certain significant elements of their Statements of Financial Position, the following discussion addresses significant captions in the consolidated statement. Within the following discussions, however, we distinguish between GE and GECC activities in order to permit meaningful analysis of each individual consolidating statement.
MAJOR CHANGES IN OUR FINANCIAL POSITION FOR THE NINE MONTHS ENDED SEPTEMBER 30, 2015
| Cash and equivalents increased $14.2 billion. See the following Liquidity Sources and Statement of Cash Flows sections for additional information. |
| GECC Financing receivables-net decreased $38.7 billion . See the following GECC Financing Receivables section for additional information. |
| GECC Financing receivables held for sale increased $22.9 billion . See the following GECC Financing Receivables Held for Sale section for additional information. |
| Deferred income taxes decreased $5.2 billion primarily due to deferred tax asset write-offs resulting from the GE Capital Exit Plan, along with the remeasurement of postretirement benefit plans. |
| Assets of discontinued operations decreased $65.0 billion , primarily due to the disposition of CLL businesses of $35.0 billion and Real Estate of $29.1 billion. See Note 2 for additional information. |
| Borrowings decreased $46.5 billion , primarily due to net repayments on GECC borrowings of $43.4 billion, along with a $7.3 billion reduction in the balances driven by the strengthening of the U.S. dollar against all major currencies, partially offset by new debt issuances by GE of $3.5 billion. |
| Bank deposits increased $4.8 billion , primarily due to an increase in U.S. bank deposits of $5.4 billion at Synchrony Financial, offset by a $0.7 billion reduction driven by the strengthening of the U.S. dollar in non-U.S. bank deposits. |
| Liabilities of discontinued operations decreased $5.0 billion , primarily due to the disposition of CLL businesses of $3.3 billion and Real Estate of $1.7 billion. See Note 2 for additional information. |
2015 3Q FORM 10-Q PAGE 37
|
|
GECC FINANCING RECEIVABLES
Financing receivables held for investment are those that we have the intent and ability to hold for the foreseeable future and are measured at the principal amount outstanding, net of the allowance for losses, write-offs, unamortized discounts and premiums, and net deferred loan fees or costs.
At September 30, 2015, our financing receivables portfolio primarily relates to Synchrony Financial (our U.S. consumer business), Working Capital Solutions, which purchases GE customer receivables and GECAS, Energy Financial Services and Healthcare Equipment Finance (that directly relate to GE's core industrial businesses). The portfolios in our GECAS and Energy Financial Services businesses are collateralized by commercial aircraft and operating assets in the global energy and water industries, respectively. Our Healthcare Equipment Finance portfolio is collateralized by equipment used in the healthcare industry and the Working Capital Solutions portfolio is substantially recourse to GE or insured. Both the Healthcare Equipment Finance and Working Capital Solutions portfolios are reported in the CLL segment. Substantially all of the Synchrony Financial portfolio consists of U.S. consumer credit card and sales finance receivables and are reported in the Consumer segment.
For purposes of the discussion that follows, "delinquent" receivables are those that are 30 days or more past due based on their contractual terms. Loans purchased at a discount are initially recorded at fair value and accrete interest income over their estimated lives based on reasonably estimable cash flows even if the underlying loans are contractually delinquent at acquisition. "Nonaccrual" financing receivables are those on which we have stopped accruing interest. We stop accruing interest at the earlier of the time at which collection of an account becomes doubtful or the account becomes 90 days past due, with the exception of consumer credit card accounts, for which we continue to accrue interest until the accounts are written off in the period that the account becomes 180 days past due. Recently restructured financing receivables are not considered delinquent when payments are brought current according to the restructured terms, but may remain classified as nonaccrual until there has been a period of satisfactory payment performance by the borrower and future payments are reasonably assured of collection.
Further information on the determination of the allowance for losses on financing receivables and the credit quality and categorization of our financing receivables is provided in Notes 5 and 18 to the consolidated financial statements.
GECC FINANCING RECEIVABLES AND ALLOWANCE FOR LOSSES(a) | ||||||
(Dollars in millions) | September 30, 2015 | December 31, 2014 | ||||
Financing receivables | $ | 87,204 | $ | 126,561 | ||
Nonaccrual receivables | 306 | (b) | 1,996 | |||
Allowance for losses | 3,457 | 4,104 | ||||
Nonaccrual financing receivables as a percent of financing receivables | 0.4 | % | 1.6 | % | ||
Allowance for losses as a percent of nonaccrual financing receivables | (c) | 205.6 | ||||
Allowance for losses as a percent of total financing receivables | 4.0 | 3.2 | ||||
(a) | For additional information related to the portfolio of financing receivables, refer to the GECC quarterly report on Form 10-Q for the nine months ended September 30, 2015. |
(b) | The majority of our $0.3 billion of nonaccrual loans at September 30, 2015, are currently paying in accordance with the contractual terms. We continue to accrue interest on consumer credit cards until the accounts are written off in the period the account becomes 180 days past due. |
(c) | Not meaningful. |
2015 3Q FORM 10-Q PAGE 38
Financing receivables, before allowance for losses, decreased $39.4 billion from December 31, 2014, primarily as a result of reclassifications to financing receivables held for sale or assets of businesses held for sale (primarily Consumer) ($34.5 billion), write-offs ($5.6 billion) and the stronger U.S. dollar ($4.0 billion), partially offset by originations exceeding collections (which includes sales) ($5.8 billion).
Nonaccrual receivables decreased $1.7 billion from December 31, 2014, primarily due to reclassifications to financing receivables held for sale (including write-offs) or assets of businesses held for sale (primarily Consumer).
Allowance for losses decreased $0.6 billion from December 31, 2014, primarily as a result of write-offs on financing receivables reclassified to financing receivables held for sale and the transfer of that portion of the allowance for losses related to financing receivables reclassified to assets of businesses held for sale (primarily Consumer). The allowance for losses as a percent of total financing receivables increased from 3.2% at December 31, 2014 to 4.0% at September 30, 2015 reflecting decreases in both the allowance for losses and the overall financing receivables balance related to the financing receivables reclassified to financing receivables held for sale and assets of businesses held for sale as part of the GE Capital Exit Plan.
GECC FINANCING RECEIVABLES HELD FOR SALE
Financing receivables held for sale are recorded at the lower of cost or fair value, less cost to sell, and represent those financing receivables that management does not intend to hold for the foreseeable future. Subsequent declines in fair value are recognized in the period in which they occur. Valuations are primarily performed on a portfolio basis, except for commercial financing receivables which may be performed on an individual financing receivable basis. Interest income on financing receivables held for sale is accrued and subject to the nonaccrual policies described above. Because financing receivables held for sale are recognized at the lower of cost or fair value, less cost to sell, the allowance for losses and write-off policies do not apply to these financing receivables.
During the first quarter of 2015, we transferred all of our non-U.S. Consumer financing receivables to financing receivables held for sale or assets of businesses held for sale as a result of the GE Capital Exit Plan and the signing of an agreement to sell our consumer finance business in Australia and New Zealand.
The transfer of financing receivables to financing receivables held for sale and assets of businesses held for sale in the nine months ended September 30, 2015, totaled $29.0 billion and $5.5 billion, respectively. Prior to transferring the financing receivables to financing receivables held for sale we recognized a pre-tax provision for losses on financing receivables of $2.4 billion ($2.2 billion after-tax), to reduce the carrying value of the financing receivables to the lower of cost or fair value, less cost to sell, and wrote-off the associated balance of the allowance for losses of $2.9 billion to establish a new cost basis of the financing receivables held for sale at September 30, 2015.
For businesses held for sale, financing receivable balances of $5.5 billion and the related allowance for loan losses of $0.2 billion were reclassified to assets of businesses held for sale. The businesses held for sale were recorded at the lower of cost or fair value, less cost to sell.
A majority of the provision for losses on financing receivables recognized upon the transfer of financing receivables to financing receivables held for sale during the nine months ended September 30, 2015 relates to our Consumer non-U.S. residential mortgage portfolios in the U.K., France, Poland and Spain, which primarily comprise variable rate mortgages with a remaining weighted average maturity of more than ten years. We estimate that the effect on the provision for losses is largely attributable to credit loss exposures that are not incurred losses recognizable under GAAP but nevertheless affect fair value that would be determined by a market participant when pricing the portfolio.
As a result of the GE Capital Exit Plan and transfer of financing receivables to financing receivables held for sale or assets of businesses held for sale, nonaccrual receivables and impaired loan balances at December 31, 2014 were reduced by $1.2 billion and $1.0 billion, respectively. Loans held for sale are not reported as impaired, as these loans are recorded at lower of cost or fair value, less cost to sell.
Further information on financing receivables held for sale is provided in Note 2 to the consolidated financial statements.
2015 3Q FORM 10-Q PAGE 39
FINANCIAL RESOURCES AND LIQUIDITY
LIQUIDITY AND BORROWINGS
We maintain a strong focus on liquidity. At both GE and GECC we manage our liquidity to help provide access to sufficient funding to meet our business needs and financial obligations throughout business cycles.
Our liquidity and borrowing plans for GE and GECC are established within the context of our annual financial and strategic planning processes. At GE, our liquidity and funding plans take into account the liquidity necessary to fund our operating commitments, which include primarily purchase obligations for inventory and equipment, payroll and general expenses (including pension funding). We also take into account our capital allocation and growth objectives, including paying dividends, repurchasing shares, investing in research and development and acquiring industrial businesses. At GE, we rely primarily on cash generated through our operating activities, any dividend payments from GECC, and also have historically maintained a commercial paper program that we regularly use to fund operations in the U.S., principally within the quarters.
GECC relies on a diversified source of funding, including the unsecured term debt markets, the global commercial paper markets, deposits, secured funding, retail funding products, bank borrowings and securitizations to fund its balance sheet. We also rely on cash generated through collection of principal, interest and other payments on our existing portfolio of loans and leases as well as dispositions to fund our operating and interest expense costs. GECC's liquidity position is targeted to meet its obligations under both normal and stressed conditions. GECC establishes a funding plan annually that is based on the projected asset size and cash needs of the Company, which, over the past few years, has incorporated our strategy to reduce our ending net investment in GE Capital. In connection with the GE Capital Exit Plan, we do not intend to issue any incremental GECC unsecured term debt in the next five years. We expect to maintain an elevated liquidity position as we generate cash from asset sales, returning to more normalized levels in 2019. While we maintain elevated liquidity levels, we may engage in liability management actions, such as buying back debt, based on market and economic conditions.
Our 2015 GECC funding plan anticipates repayment of principal on outstanding short-term borrowings, including the current portion of long-term debt ($37.0 billion at December 31, 2014), principally through dispositions, asset sales and cash on hand. Long-term maturities and early redemptions were $12.9 billion in the third quarter of 2015.
We maintain a detailed liquidity policy for GECC that requires GECC to maintain a contingency funding plan. The liquidity policy defines GECC's liquidity risk tolerance under different stress scenarios based on its liquidity sources and also establishes procedures to escalate potential issues. We actively monitor GECC's access to funding markets and its liquidity profile through tracking external indicators and testing various stress scenarios. The contingency funding plan provides a framework for handling market disruptions and establishes escalation procedures in the event that such events or circumstances arise. GECC will continue to evaluate the need to modify the existing contingency funding plan due to the GE Capital Exit Plan.
On April 10, 2015, Moody's Investors Service (Moody's) downgraded the senior unsecured debt rating for GE to A1 from Aa3 following GE's April 10 announcement of the GE Capital Exit Plan. GE's P-1 short-term rating was affirmed. Moody's affirmed GECC's A1/P-1 ratings. The rating outlook for GE and GECC remains stable. On April 10, 2015, Standard & Poor's Rating Services (S&P) affirmed GE's AA+/A-1+ ratings and GECC's AA+/A-1+ ratings each with a stable outlook. On October 7, 2015, S&P revised its outlook on GE's credit rating to negative from stable. S&P affirmed GE's AA+/A-1+ ratings.
As part of the GE Capital Exit Plan, on September 21, 2015 GE Capital commenced private offers to exchange up to $30 billion of certain outstanding debt for new notes with maturities of six months, five years, ten years or twenty years. On October 19, 2015, given the high level of participation, the offering was increased by $6 billion with the aggregate principal amount of $36 billion of outstanding notes being tendered for exchange and settled on October 26, 2015. The new notes that were issued at closing are composed of $15.3 billion of 0.964% Six Month Notes due 2016, £0.8 billion of 1.363% Six Month Notes due 2016, $6.1 billion of 2.342% Notes due 2020, $2.0 billion of 3.373% Notes due 2025 and $11.5 billion of 4.418% Notes due 2035. Of the $16.2 billion exchanged into the Six Month Notes, $1.3 billion is in short term borrowings at September 30, 2015. GECC will continue to evaluate the opportunity to repurchase debt while maintaining our liquidity at the levels communicated as part of the GE Capital Exit Plan. The new notes have been fully, irrevocably and unconditionally guaranteed by GE.
On May 28, 2015, GE issued €3,150 million senior unsecured debt, composed of €650 million of Floating Rate Notes due 2020, €1,250 million of 1.250% Notes due 2023 and €1,250 million of 1.875% Notes due 2027. On October 9, 2015, $2.0 billion of long-term debt issued by GE matured.
2015 3Q FORM 10-Q PAGE 40
LIQUIDITY SOURCES
In addition to GE cash of $16.8 billion at September 30, 2015, GECC maintained liquidity sources of $97.0 billion that consisted of cash and equivalents of $82.3 billion, high-quality, liquid investments of $3.2 billion and cash and equivalents of $11.5 billion classified as discontinued operations and businesses held for sale. Additionally, we have $46.0 billion of committed unused credit lines.
CASH AND EQUIVALENTS | |||||||
(In billions) | September 30, 2015 | September 30, 2015 | |||||
GE(a) | $ | 16.8 | U.S. | $ | 37.1 | ||
GECC(b) | 82.3 | Non-U.S.(c) | 62.0 | ||||
(a) | At September 30, 2015, $2.4 billion of GE cash and equivalents was held in countries with currency controls that may restrict the transfer of funds to the U.S. or limit our ability to transfer funds to the U.S. without incurring substantial costs. These funds are available to fund operations and growth in these countries and we do not currently anticipate a need to transfer these funds to the U.S. |
(b) | At September 30, 2015, GECC cash and equivalents of about $17.0 billion were in regulated banks and insurance entities and were subject to regulatory restrictions. |
(c) | Of this amount at September 30, 2015, $11.3 billion was considered indefinitely reinvested. Indefinitely reinvested cash held outside of the U.S. is available to fund operations and other growth of non-U.S. subsidiaries; it is also available to fund our needs in the U.S. on a short-term basis through short-term loans, without being subject to U.S. tax. Under the Internal Revenue Code, these loans are permitted to be outstanding for 30 days or less and the total of all such loans is required to be outstanding for less than 60 days during the year. If we were to repatriate indefinitely reinvested cash held outside the U.S., we would be subject to additional U.S. income taxes and foreign withholding taxes. |
COMMITTED UNUSED CREDIT LINES | ||
(In billions) | September 30, 2015 | |
Revolving credit agreements (exceeding one year) | $ | 24.5 |
Revolving credit agreements (364-day line)(a) | 21.6 | |
Total(b) | $ | 46.0 |
(a) | Included $20.8 billion that contains a term-out feature that allows us to extend borrowings for two years from the date on which such borrowings would otherwise be due. |
(b) | Total committed unused credit lines were extended to us by 48 financial institutions. GECC can borrow up to $45.3 billion under these credit lines. GE can borrow up to $15.6 billion under certain of these credit lines. |
FUNDING PLAN
We reduced our GE Capital ENI, excluding liquidity*, to $176 billion at September 30, 2015.
During the first nine months of 2015, GECC completed issuances of $8.1 billion of senior unsecured debt (excluding securitizations described below) with maturities up to 10 years. In addition, Synchrony Financial completed issuances of $2.0 billion of senior unsecured debt, including $1.0 billion in February 2015, maturing in 2020 and $1.0 billion in July 2015, maturing in 2025.
COMMERCIAL PAPER | |||||
(In billions) | GE | GECC | |||
Average commercial paper borrowings during the third quarter of 2015 | $ | 7.8 | $ | 22.5 | |
Maximum commercial paper borrowings outstanding during the third quarter of 2015 | 11.0 | 25.1 | |||
GECC commercial paper maturities have historically been funded principally through new commercial paper issuances and at GE are substantially repaid before quarter-end using indefinitely reinvested overseas cash, which as discussed above, is available for use in the U.S. on a short-term basis without being subject to U.S. tax. GECC commercial paper borrowings as of September 30, 2015 were $12.9 billion. As announced on April 10, 2015, GECC is targeting to reduce the outstanding commercial paper to approximately $5 billion by the end of 2015.
We securitize financial assets as an alternative source of funding. During the first nine months of 2015, we completed $2.1 billion of non-recourse issuances and $5.2 billion of non-recourse borrowings matured. At September 30, 2015, consolidated non-recourse securitization borrowings were $16.2 billion.
*Non-GAAP Financial Measure
2015 3Q FORM 10-Q PAGE 41
We have nine deposit-taking banks outside of the U.S., five of which are classified as discontinued operations, and two deposit-taking banks in the U.S. – Synchrony Bank (formerly GE Capital Retail Bank), a Federal Savings Bank (FSB), and GE Capital Bank, an industrial bank (IB), which is also classified as discontinued operations. The FSB and IB currently issue certificates of deposit (CDs) in maturity terms up to 10 years.
ALTERNATIVE FUNDING | |||
(In billions) | |||
Total alternative funding at December 31, 2014 | $ | 86.4 | |
Total alternative funding at September 30, 2015, as follows: | 75.3 | ||
Bank deposits | 48.7 | ||
Non-recourse securitization borrowings | 16.2 | ||
Funding secured by real estate, aircraft and other collateral | 5.0 | ||
Bank unsecured | 5.4 | ||
As a matter of general practice, we routinely evaluate the economic impact of calling debt instruments where GECC has the right to exercise a call. In determining whether to call debt, we consider the economic benefit to GECC of calling debt, the effect of calling debt on GECC's liquidity profile and other factors. During 2015, we called $0.6 billion of long-term debt.
INCOME MAINTENANCE AGREEMENT AND GE GUARANTEE OF CERTAIN GECC DEBT
GE provides implicit and explicit support to GECC through commitments, capital contributions and operating support. As part of the GE Capital Exit Plan, on April 10, 2015, GE and GECC entered into an amendment to their existing financial support agreement. Under this amendment (the Amendment), the Company has provided a full and unconditional guarantee (the Guarantee) of the payment of principal and interest on all tradable senior and subordinated outstanding long-term debt securities and all commercial paper issued or guaranteed by GECC identified in the Amendment. In the aggregate, the Guarantee applied to approximately $184 billion of GECC debt as of September 30, 2015. The Guarantee replaced the requirement that the Company make certain income maintenance payments to GECC in certain circumstances. GECC's U.S. public indentures were concurrently amended to provide the full and unconditional guarantee by the Company set forth in the Guarantee.
2015 3Q FORM 10-Q PAGE 42
STATEMENT OF CASH FLOWS - NINE MONTHS ENDED SEPTEMBER 30, 2015
CONSOLIDATED CASH FLOWS
We evaluate our cash flow performance by reviewing our industrial (non-financial services) businesses and financial services businesses separately. Cash from operating activities (CFOA) is the principal source of cash generation for our industrial businesses. The industrial businesses also have liquidity available via the public capital markets. Our financial services businesses use a variety of financial resources to meet our capital needs. Cash for financial services businesses is primarily provided from the issuance of term debt and commercial paper in the public and private markets and deposits, as well as financing receivables collections, sales and securitizations.
GE CASH FLOWS – NINE MONTHS ENDED SEPTEMBER 30
OPERATING CASH FLOWS | INVESTING CASH FLOWS | FINANCING CASH FLOWS | ||||||||
2014 | 2015 | 2014 | 2015 | 2014 | 2015 | |||||
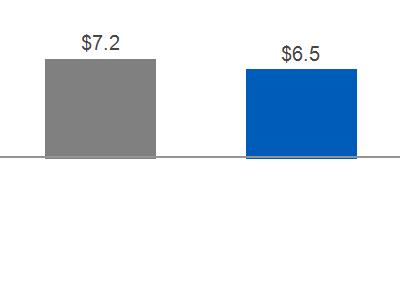 |
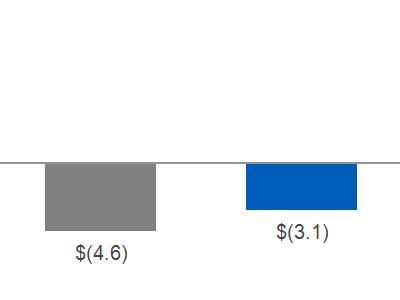
| 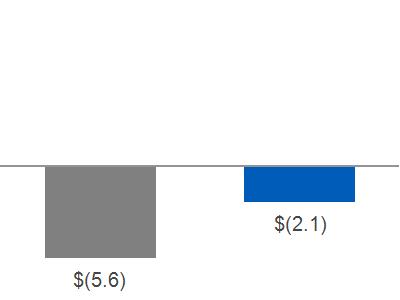
| ||||||||
With respect to GE CFOA, we believe that it is useful to supplement our GE Statement of Cash Flows and to examine in a broader context the business activities that provide and require cash.
The most significant source of cash in GE CFOA is customer-related activities, the largest of which is collecting cash resulting from product or services sales. See the Intercompany Transactions and Eliminations section for information related to transactions between GE and GECC. The most significant operating use of cash is to pay our suppliers, employees, tax authorities and others for a wide range of material and services. Dividends from GECC, including special dividends, represent the distribution of a portion of GECC retained earnings, and are distinct from cash from continuing operations within the financial services businesses. The amounts included in GE CFOA are the total dividends, including special dividends from excess capital.
2015 – 2014 COMMENTARY
GE cash from operating activities decreased $0.6 billion primarily due to the following:
| A decrease in operating cash collections of $0.1 billion to $76.6 billion in 2015. This decrease is consistent with comparable GE segment revenue decreases from sales of goods and services of $0.7 billion and lower progress collections of $0.5 billion. The decreases were partially offset by a $0.5 billion payment from a settlement related to the NBCU transaction and prepayments on service contracts of $0.2 billion. |
| A decrease in operating cash payments of $1.1 billion to $70.6 billion in 2015. This decrease is primarily driven by decreased spend on inventory in the nine months ended September 30, 2015 compared with that of 2014. |
| Further, GECC paid quarterly dividends of $0.5 billion and no special dividends to GE in the nine months ended September 30, 2015. GECC paid quarterly dividends of $1.5 billion and special dividends of $0.7 billion to GE in the nine months ended September 30, 2014. |
GE cash used for investing activities decreased $1.5 billion primarily due to the following:
| Lower business acquisition activity of $2.0 billion primarily driven by the 2014 acquisitions of certain Thermo Fisher Scientific Inc. life-science businesses for $1.1 billion, Cameron's Reciprocating Compression Division for $0.6 billion and API Healthcare (API) for $0.3 billion. |
| This is partially offset by $0.4 billion lower proceeds from principal business dispositions. |
2015 3Q FORM 10-Q PAGE 43
GE cash used for financing activities decreased $3.5 billion primarily due to the following:
| A decrease in net repurchases of GE shares for treasury in accordance with our share repurchase program of $2.0 billion. |
| A decrease in net change in borrowings (maturities of 90 days or less) of $1.4 billion. |
| Further, GE issued $3.4 billion and $3.0 billion of unsecured notes in the nine months ended September 30, 2015 and 2014. |
| These decreases were partially offset by an increase in the dividends paid to shareowners of $0.3 billion. |
GECC CASH FLOWS – NINE MONTHS ENDED SEPTEMBER 30
OPERATING CASH FLOWS | INVESTING CASH FLOWS | FINANCING CASH FLOWS | ||||||||
2014 | 2015 | 2014 | 2015 | 2014 | 2015 | |||||
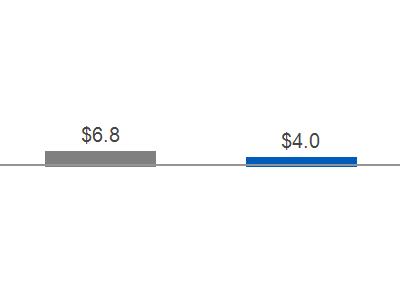 | 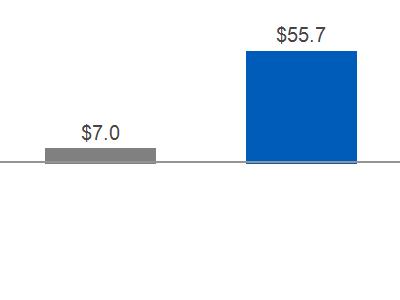 | 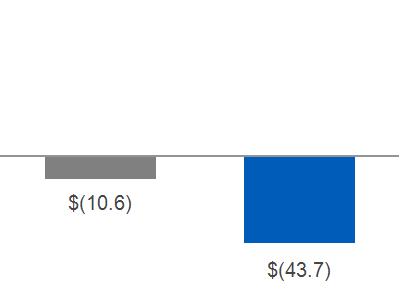 | ||||||||
2015 – 2014 COMMENTARY:
GECC cash from operating activities decreased $2.8 billion primarily due to the following:
| A decrease in net cash collateral activity with counterparties on derivative contracts of $2.2 billion. |
GECC cash from investing activities increased $48.6 billion primarily due to the following:
| In 2015, we closed the sale of certain of our Real Estate businesses and CLL businesses for proceeds of $25.6 billion and $16.8 billion, respectively. |
| A net increase in financing receivables activity of $6.1 billion driven by higher net collections (which includes sales) of financing receivables. |
| The 2014 payment of our obligation to the buyer of GE Money Japan for $1.7 billion. |
| These increases were partially offset by the 2015 acquisition of Milestone Aviation Group, resulting in net cash paid of $1.7 billion. |
GECC cash used for financing activities increased $33.1 billion primarily due to the following:
| Higher net repayments of borrowings of $29.4 billion driven primarily by a decrease in issuances of senior unsecured notes and an increase in short-term debt maturities. |
| A decrease in deposits at our banks of $1.6 billion. |
| Proceeds received from the initial public offering of Synchrony Financial of $2.8 billion in 2014. |
| These increases were partially offset by GECC paying quarterly dividends of $0.5 billion and no special dividends to GE in the nine months ended September 30, 2015. GECC paid quarterly dividends of $1.5 billion and special dividends of $0.7 billion to GE in the nine months ended September 30, 2014. |
INTERCOMPANY TRANSACTIONS AND ELIMINATIONS
Effects of transactions between related companies are made on an arms-length basis, are eliminated and consist primarily of GECC dividends to GE; GE customer receivables sold to GECC; GECC services for trade receivables management and material procurement; buildings and equipment (including automobiles) leased between GE and GECC; information technology (IT) and other services sold to GECC by GE; aircraft engines manufactured by GE that are installed on aircraft purchased by GECC from third-party producers for lease to others; and various investments, loans and allocations of GE corporate overhead costs.
2015 3Q FORM 10-Q PAGE 44
GE sells customer receivables to GECC in part to fund the growth of our industrial businesses. These transactions can result in cash generation or cash use. During any given period, GE receives cash from the sale of receivables to GECC. It also foregoes collection of cash on receivables sold. The incremental amount of cash received from sales of receivables in excess of the cash GE would have otherwise collected had those receivables not been sold, represents the cash generated or used in the period relating to this activity. The incremental cash generated in GE CFOA from selling these receivables to GECC decreased GE's CFOA by $0.4 billion and increased GE's CFOA by $0.2 billion for the nine months ended September 30, 2015 and 2014, respectively.
See Note 17 to the consolidated financial statements in this Form 10-Q Report for additional information about the eliminations of intercompany transactions between GE and GECC.
EXPOSURES
GECC SELECTED EUROPEAN EXPOSURES
At September 30, 2015, we had $28.1 billion in financing receivables to consumer and commercial customers in Europe, including $22.1 billion classified as financing receivables held for sale, and $6.0 billion classified as assets held for investment. The GECC financing receivables portfolio in Europe is well diversified across European geographies and customers. Approximately 88% of the portfolio is secured by collateral. Several European countries, including Spain, Portugal, Ireland, Italy, Greece and Hungary (focus countries), have been subject to credit deterioration due to weaknesses in their economic and fiscal situations. The carrying value of GECC funded exposures in these focus countries and in the rest of Europe comprised the following at September 30, 2015.
Rest of | Total | ||||||||||||||||||||||
(In millions) | Spain | Portugal | Ireland | Italy | Greece | Hungary | Europe | Europe | |||||||||||||||
Financing receivables - net (a)(d) | $ | 339 | $ | 74 | $ | 251 | $ | 1,422 | $ | - | $ | 377 | $ | 3,525 | $ | 5,988 | |||||||
Financing receivables held for sale | 332 | 33 | 14 | - | - | - | 21,742 | 22,121 | |||||||||||||||
Investments(b)(c) | 3 | - | - | - | - | - | 1,244 | 1,247 | |||||||||||||||
Cost and equity method investments(d) | - | - | 443 | - | - | - | 292 | 735 | |||||||||||||||
Derivatives, net of collateral(b)(e) | - | - | - | - | - | - | 318 | 318 | |||||||||||||||
Equipment leased to others (ELTO)(f) | 368 | 250 | 562 | 452 | 266 | 195 | 7,081 | 9,174 | |||||||||||||||
Total funded exposures(g)(h) | $ | 1,042 | $ | 357 | $ | 1,270 | $ | 1,874 | $ | 266 | $ | 572 | $ | 34,202 | $ | 39,583 | |||||||
Unfunded commitments(i) | $ | - | $ | - | $ | 31 | $ | - | $ | - | $ | - | $ | 2,066 | $ | 2,097 | |||||||
(a) | Financing receivable amounts are classified based on the location or nature of the related obligor. |
(b) | Investments and derivatives are classified based on the location of the parent of the obligor or issuer. |
(c) | Included $0.4 billion related to financial institutions, $47.5 million related to non-financial institutions and $0.8 billion related to sovereign issuers. We held no investments issued by sovereign entities in the countries of focus. |
(d) | Substantially all is non-sovereign. |
(e) | Net of cash collateral; entire amount is non-sovereign. |
(f) | These assets are held under long-term investment and operating strategies, and our ELTO strategies contemplate an ability to redeploy assets under lease should default by the lessee occur. The values of these assets could be subject to decline or impairment in the current environment. |
(g) | Excluded $29.6 billion of cash and equivalents, which is composed of $21.7 billion of cash on short-term placement with highly rated global financial institutions based in Europe, sovereign central banks and agencies or supranational entities, of which $0.5 billion is in focus countries, and $7.9 billion of cash and equivalents placed with highly rated European financial institutions on a short-term basis, secured by U.S. Treasury securities ($4.5 billion) and sovereign bonds of non-focus countries ($3.4 billion), where the value of our collateral exceeds the amount of our cash exposure. |
(h) | Rest of Europe included $1.5 billion and $0.1 billion of exposure for Russia and Ukraine, respectively, substantially all ELTO and financing receivables related to commercial aircraft in our GECAS portfolio. |
(i) | Includes ordinary course of business lending commitments, commercial and consumer unused revolving credit lines, inventory financing arrangements and investment commitments. |
2015 3Q FORM 10-Q PAGE 45
We manage counterparty exposure, including credit risk, on an individual counterparty basis. We place defined risk limits around each obligor and review our risk exposure on the basis of both the primary and parent obligor, as well as the issuer of securities held as collateral. These limits are adjusted on an ongoing basis based on our continuing assessment of the credit risk of the obligor or issuer. In setting our counterparty risk limits, we focus on high-quality credits and diversification through spread of risk in an effort to actively manage our overall exposure. We actively monitor each exposure against these limits and take appropriate action when we believe that risk limits have been exceeded or there are excess risk concentrations. Our collateral position and ability to work out problem accounts have historically mitigated our actual loss experience. Delinquency experience has been relatively stable in our European commercial and consumer platforms in the aggregate, and we actively monitor and take action to reduce exposures where appropriate. Uncertainties surrounding European markets could have an impact on the judgments and estimates used in determining the carrying value of these assets.
VENEZUELA
The results of our Venezuelan businesses have been reported under highly inflationary accounting since the beginning of 2010, at which time the functional currency of our Venezuelan entities was changed from the bolivar to the U.S. dollar.
Our activities related to Venezuela generated revenues of less than one percent of consolidated revenues, consisting of both exports to and operations within the country. The majority of these revenues are denominated in U.S. dollars and euro but we also transact in bolivars for certain businesses.
For our operations in Venezuela, determining the appropriate exchange rate for remeasurement of bolivar-denominated net monetary assets into U.S. dollars continues to be subject to uncertainty. Through February 2015, the Venezuelan government operated three different exchange mechanisms: CENCOEX (the official exchange mechanism), SICAD1 and SICAD 2, subsequently it merged the SICAD mechanisms and introduced a new mechanism, the Marginal Currency System (SIMADI). This mechanism is intended to operate with fewer restrictions and its exchange rate on September 30, 2015 was approximately 199 bolivars per U.S. dollar compared to SICAD at 13.5 bolivars per U.S. dollar.
At the end of each period, we remeasure the net monetary assets of our Venezuela entities using the rate at which we expect them to be settled, including through the payment of dividends. During the period ended September 30, 2015, we did not access the SIMADI market to obtain U.S. dollars and have continued to use the SICAD exchange rate to measure our net monetary assets.
Significant uncertainty persists regarding the exchange mechanisms in Venezuela, including the nature of transactions that are eligible to transact in the three recognized mechanisms that are currently available as well as the impact on non-bolivar credit exposures and recoverable amounts of bolivar denominated non-monetary assets. We are continuing to evaluate rates other than SICAD for use in remeasurement of our Venezuelan net monetary assets as well as the implications of economic and exchange-related conditions for our business activities in Venezuela.
Net monetary assets subject to remeasurement were approximately $82 million at September 30, 2015, including approximately $10 million in bolivar-denominated cash and cash equivalents and approximately $41 million related to a non-consolidated investment in our Appliances business, which is held for sale. In addition to our bolivar-denominated net monetary assets, we also have non-bolivar credit exposures of approximately $325 million at September 30, 2015 and recoverable amounts of non-monetary assets in Venezuela of approximately $31 million at September 30, 2015, which consists principally of inventory and property, plant and equipment.
OIL & GAS INDUSTRY
The sharp decline experienced in oil prices and the prospect of a continuation of prevailing oil prices could have mixed implications for the industries and countries in which we compete. In general, lower oil prices are expected to stimulate growth in oil importing countries while causing negative economic effects in many energy-exporting countries. Our Oil & Gas business has experienced declines in orders, project commencement delays and pricing pressures. In response to this uncertain industry outlook, we continue to execute cost actions with an increased focus on execution and productivity. We expect that relatively low oil prices will benefit our other businesses through lower direct material and other variable costs as well as through the expected stimulus-effect on growth in the U.S. and in other economies that rely on energy imports, including Europe, Japan and India.
2015 3Q FORM 10-Q PAGE 46
CRITICAL ACCOUNTING ESTIMATES
We utilized significant estimates in the preparation of the third quarter financial statements.
In addition to the discussion below on estimates used to determine the fair value of businesses and assets held for sale, please refer to the Critical Accounting Estimates section within MD&A and Note 1, Basis of Presentation and Summary of Significant Accounting Policies, to the consolidated financial statements of our Form 8-K Report filed on August 7, 2015 for a discussion of our accounting policies and the critical accounting estimates we use to: assess the recoverability of assets such as financing receivables and goodwill; determine the fair value of financial assets; and determine our provision for income taxes and recoverability of deferred tax assets.
BUSINESSES AND ASSETS HELD FOR SALE
Businesses held for sale represent components that meet the accounting requirements to be classified as held for sale and are presented as single asset and liability amounts in our financial statements with a valuation allowance, if necessary, to recognize the net carrying amount at the lower of cost or fair value less cost to sell. Financing receivables that no longer qualify to be presented as held for investment must be classified as held for sale and recognized in our financial statements at the lower of cost or fair value, less cost to sell, with that amount representing a new cost basis at the date of transfer.
As previously discussed, as a result of the GE Capital Exit Plan, management has committed to reduce the size of its financial services businesses through the sale of most of the assets of GECC over the following 24 months. As a result, certain GECC businesses met the criteria to be classified as businesses held for sale and certain financing receivables were required to be recognized as held for sale at September 30, 2015.
The determination of fair value for businesses and portfolios of financing receivables involves significant judgments and assumptions. Development of estimates of fair values in this circumstance is complex and is dependent upon, among other factors, the nature of the potential sales transaction (for example, asset sale versus sale of legal entity), composition of assets and/or businesses in the disposal group, the comparability of the disposal group to market transactions, negotiations with third party purchasers etc. Such factors bear directly on the range of potential fair values and the selection of the best estimates. Key assumptions were developed based on market observable data and, in the absence of such data, internal information that is consistent with what market participants would use in a hypothetical transaction as of September 30, 2015.
We review all businesses and assets held for sale each reporting period to determine whether the existing carrying amounts are fully recoverable in comparison to estimated fair values.
Further information is provided in Notes 2 and 14 to the consolidated financial statements of this Form 10-Q Report.
2015 3Q FORM 10-Q PAGE 47
OTHER ITEMS
NEW ACCOUNTING STANDARDS
In May 2014, the Financial Accounting Standards Board (FASB) issued Accounting Standards Update (ASU) 2014-09, Revenue from Contracts with Customers , which requires an entity to recognize the amount of revenue to which it expects to be entitled for the transfer of promised goods or services to customers. The ASU will replace most existing revenue recognition guidance in GAAP when it becomes effective. In July 2015, the FASB approved a one-year deferral of this standard, with a revised effective date for fiscal years beginning after December 15, 2017. Early adoption is permitted, although not prior to fiscal years beginning after December 15, 2016. The standard permits the use of either the retrospective or modified retrospective (cumulative effect) transition method. We are evaluating the effect that ASU 2014-09 will have on our consolidated financial statements and related disclosures. We have not yet selected a transition method and continue to evaluate the effect of the standard on our ongoing financial reporting.
In February 2015, the FASB issued ASU 2015-02, Amendments to the Consolidation Analysis . The ASU amends the consolidation guidance for VIEs and general partners' investments in limited partnerships and modifies the evaluation of whether limited partnerships and similar legal entities are VIEs or voting interest entities. The ASU is effective for interim and annual reporting periods beginning after December 15, 2015, with early adoption permitted. We are currently evaluating the effect of the ASU on our consolidated financial statements and related disclosures. While we anticipate additional disclosures, we do not expect the ASU to have a significant impact on our consolidated financial statements.
2015 3Q FORM 10-Q PAGE 48
CONTROLS AND PROCEDURES
Under the direction of our Chief Executive Officer and Chief Financial Officer, we evaluated our disclosure controls and procedures and internal control over financial reporting and concluded that our disclosure controls and procedures were effective as of September 30, 2015.
On April 10, 2015 we announced that, as part of the GE Capital Exit Plan, we plan to dispose of a substantial portion of GE Capital's operations over the 2015-2017 timeframe. This plan will affect the operation of GE Capital's framework of internal controls over financial reporting as dispositions and other restructuring activities are executed. During the transition period, we have put in place enhanced procedures and controls to monitor and maintain our system of internal controls over financial reporting. We will continue to assess the effect of the plan on GE Capital's control environment and will make adjustments as appropriate.
OTHER FINANCIAL DATA
PURCHASES OF EQUITY SECURITIES BY THE ISSUER AND AFFILIATED PURCHASERS | ||||||||||
Approximate | ||||||||||
dollar value | ||||||||||
Total number | of shares that | |||||||||
of shares | may yet be | |||||||||
purchased | purchased | |||||||||
as part of | under our | |||||||||
Total number | Average | our share | share | |||||||
of shares | price paid | repurchase | repurchase | |||||||
Period | purchased(a) | per share | program(b) | program(b) | ||||||
(Shares in thousands) | ||||||||||
2015 | ||||||||||
July | 751 | $ | 26.48 | 705 | ||||||
August | 766 | $ | 25.26 | 666 | ||||||
September | 648 | $ | 24.86 | 582 | ||||||
Total | 2,165 | $ | 25.56 | 1,953 | $ | 49.8 | billion | |||
| (a) | This category included 212 thousand shares repurchased from our various benefit plans. |
| (b) | Shares were repurchased through the 2015 GE Share Repurchase Program (the Program). As of September 30, 2015, we were authorized to repurchase up to $50 billion of our common stock through 2018 and we had repurchased a total of approximately $0.2 billion under the Program. The Program is flexible and shares will be acquired with a combination of borrowings and free cash flow from the public markets and other sources, including GE Stock Direct, a stock purchase plan that is available to the public. |
2015 3Q FORM 10-Q PAGE 49
REGULATIONS AND SUPERVISION
GECC is a regulated savings and loan holding company and in 2011 became subject to Federal Reserve Board (FRB) supervision under the Dodd-Frank Wall Street Reform and Consumer Protection Act (DFA). In 2013, the U.S. Financial Stability Oversight Council (FSOC) designated GECC as a nonbank systemically important financial institution (nonbank SIFI) under the DFA. As a result of this change in supervision and designation, stricter prudential regulatory standards and supervision apply to GECC. On July 20, 2015 the Federal Reserve published a final order applying enhanced prudential standards to GECC as a nonbank SIFI.
The final order staggers the application of the enhanced prudential standards with the first set of standards becoming applicable on January 1, 2016 and the second set becoming applicable on January 1, 2018. Beginning on January 1, 2016 GECC will be subject to the standardized approach for calculating capital adequacy. GECC will also be subject to a Liquidity Coverage Ratio (LCR) of 90% until December 31, 2016 at which time GECC will be subject to a 100% LCR coverage.
If GECC is still a nonbank SIFI on January 1, 2018 the second set of enhanced prudential standards will apply. These standards include the application of the Federal Reserve's capital plan rule, stress testing rules, enhanced leverage ratio requirements, enhanced governance requirements, daily liquidity calculations, additional reporting requirements and a market terms requirement for transactions between GE and GECC.
While the enhanced prudential standards do not subject GECC to the Federal Reserve's capital plan rule applicable to large bank holding companies until the capital planning cycle beginning January 1, 2018, GECC conducts, among others, an annual review of their capital adequacy prior to establishing a plan for dividends to us, the parent. This review is based on a forward-looking assessment of their material enterprise risks and involves the consideration of a number of factors. This analysis also includes an assessment of their capital and liquidity levels, as well as incorporating risk management and governance considerations. The most recent capital adequacy review, which contemplated the GE Capital Exit Plan, was approved by the GECC board of directors and the GE Board of Directors Risk Committee in October 2015. While a savings and loan holding company and nonbank SIFI like GECC is currently not required to obtain FRB approval to pay a dividend, it may not, under FRB regulations, conduct its operations in an unsafe or unsound manner. The FRB has articulated factors that it expects boards of directors of bank holding companies and savings and loan holding companies to consider in determining whether to pay a dividend.
As a nonbank SIFI, GECC is also required to submit an annual resolution plan to the FRB and Federal Deposit Insurance Corporation (FDIC). GECC submitted its first resolution plan to the FRB and FDIC on June 30, 2014 and feedback was provided on July 28, 2015. GECC's second Resolution Plan is due December 31, 2015, and we will work to address the July 28, 2015 feedback. GECC's resolution plan describes how GECC could be resolved under existing insolvency regimes in a manner that mitigates potential disruption to the U.S. financial system and the global financial markets without the use of government support or taxpayer funds. If the FRB and FDIC determine that their resolution plan is deficient, the DFA authorizes the FRB and FDIC to impose more stringent capital, leverage or liquidity requirements on GECC or restrict their growth or activities until they submit a plan remedying the deficiencies. If the FRB and FDIC ultimately determine that GECC has not adequately addressed the deficiencies, they could order GECC to divest assets or operations in order to facilitate their orderly resolution in the event of their failure.
As discussed in Management's Discussion and Analysis, on April 10, 2015, the company announced the GE Capital Exit Plan to reduce the size of its financial services businesses. GE has discussed the GE Capital Exit Plan, aspects of which are subject to regulatory review and approval, with its regulators and staff of the FSOC and will work closely with these bodies to take the actions necessary over time to terminate the FSOC's designation of GECC (and the new intermediate holding company, as applicable) as a nonbank SIFI.
2015 3Q FORM 10-Q PAGE 50
LEGAL PROCEEDINGS
The following information supplements and amends our discussion set forth under "Legal Proceedings" in our Annual Report on Form 10-K for the fiscal year ended December 31, 2014 and our Quarterly Report on Form 10-Q for the quarter ended June 30, 2015.
At October 29, 2015, there are 14 lawsuits relating to pending mortgage loan repurchase claims in which WMC, our U.S. mortgage business that we sold in 2007, is a party. The adverse parties in these cases are securitization trustees or parties claiming to act on their behalf. While the alleged claims for relief vary from case to case, the complaints and counterclaims in these actions generally assert claims for breach of contract, indemnification, and/or declaratory judgment, and seek specific performance (repurchase) and/or monetary damages. Beginning in the fourth quarter 2013, WMC entered into settlements that reduced its exposure on claims asserted in certain securitizations, and the claim amounts reported herein reflect the effect of these settlements.
Five WMC cases are pending in the United States District Court for the District of Connecticut. Four of these cases were initiated in 2012, and one was initiated in the third quarter 2013. Deutsche Bank National Trust Company (Deutsche Bank) is the adverse party in four cases, and Law Debenture Trust Company of New York (Law Debenture) is the adverse party in one case. The Deutsche Bank complaints assert claims on approximately $4,300 million of mortgage loans and seek to recover damages in excess of approximately $1,800 million. The Law Debenture complaint asserts claims on approximately $800 million of mortgage loans, and alleges losses on these loans in excess of approximately $425 million. On March 31, 2014, the District Court denied WMC's motions to dismiss these cases.
Four WMC cases are pending in the United States District Court for the District of Minnesota against US Bank National Association (US Bank), one of which was initiated by WMC seeking declaratory judgment. Three of these cases were filed in 2012, and one was filed in 2011. The Minnesota cases involve claims on approximately $800 million of mortgage loans and do not specify the amount of damages sought. In September 2013, the District Court granted in part and denied in part WMC's motions to dismiss or for summary judgment in these cases. On September 8, 2014, US Bank filed a petition for instructions in the administration of trusts in Minnesota state court seeking authorization and instruction for US Bank to implement the terms of a settlement agreement reached with WMC to compromise, settle, and release all claims arising out of the securitizations at issue in these four lawsuits. In February 2015, two bondholders filed objections to the proposed settlement, and in response the court has scheduled an evidentiary hearing for November 2015. In light of the state court action seeking approval of the proposed settlement, the District Court entered orders in April 2015 staying further proceedings in the four cases until August 2015.
Four cases are pending against WMC in New York State Supreme Court, all of which were initiated by securitization trustees or securities administrators. These cases involve, in the aggregate, claims involving approximately $4,559 million of mortgage loans. One of these lawsuits was initiated by Deutsche Bank in the second quarter 2013 and names as defendants WMC and Barclays Bank PLC. It involves claims against WMC on approximately $1,000 million of mortgage loans and does not specify the amount of damages sought. The second case, in which the plaintiff is The Bank of New York Mellon (BNY), was initiated in the fourth quarter 2012 and names as defendants WMC, J.P. Morgan Mortgage Acquisition Corporation and JPMorgan Chase Bank, N.A. BNY asserts claims on approximately $1,300 million of mortgage loans, and seeks to recover damages in excess of $650 million. The third case was initiated by BNY in November 2013 and names as defendants WMC, J.P. Morgan Mortgage Acquisition Corporation and JPMorgan Chase Bank, N.A. In this case, BNY asserts claims on approximately $1,300 million of mortgage loans, and seeks to recover damages in excess of $600 million. On September 18, 2015, the court granted defendants' motion to dismiss this case on statute of limitations grounds, and the plaintiff filed a notice of appeal on October 21, 2015. The fourth case was filed in October 2014 and names as defendants WMC, J.P. Morgan Mortgage Acquisition Corporation and JPMorgan Chase Bank, N.A. The plaintiff, BNY, asserts claims on approximately $959 million of mortgage loans and seeks to recover damages in excess of $475 million.
2015 3Q FORM 10-Q PAGE 51
At September 30, 2015, two cases were pending against WMC in the United States District Court for the Southern District of New York. One case, in which the plaintiff is BNY, was filed in the third quarter 2012. In the second quarter 2013, BNY filed an amended complaint in which it asserts claims on approximately $900 million of mortgage loans, and seeks to recover damages in excess of $378 million. In September 2013, the District Court denied WMC's motion to dismiss. On September 18, 2014, the District Court issued an order directing the parties to participate in settlement discussions before a private mediator or the assigned magistrate judge . Following this mediation, the parties reached a settlement in principle on the claims arising from a portion of the loans held in the trust, and, as a result, on February 9, 2015 the District Court stayed the case as to these claims. This settlement became effective September 16, 2015. On September 18, 2015, following a court-ordered mediation before the assigned magistrate judge, the parties reached a settlement in principle on the remaining claims in the case, and the securitization trustee declared this settlement effective October 20, 2015. The second case was initiated by the Federal Housing Finance Agency (FHFA), which filed a summons with notice in the fourth quarter 2012. In the second quarter 2013, Deutsche Bank, in its role as securitization trustee of the trust at issue in the case, intervened as a plaintiff and filed a complaint relating to approximately $1,300 million of loans and alleging losses in excess of approximately $100 million. In December 2013, the District Court issued an order denying WMC's motion to dismiss. In February 2015, the District Court on its own motion requested that the parties re-brief several issues raised by WMC's motion to dismiss. On July 10, 2015, the District Court entered an order dismissing the lawsuit as time-barred under the applicable statute of limitations. Deutsche Bank filed a notice of appeal from this order of dismissal on August 13, 2015.
The amounts of the claims at issue in these cases (discussed above) reflect the purchase price or unpaid principal balances of the mortgage loans at issue at the time of purchase and do not give effect to pay downs, accrued interest or fees, or potential recoveries based upon the underlying collateral. All of the mortgage loans involved in these lawsuits are included in WMC's reported claims at September 30, 2015. See Note 2 to the consolidated financial statements for additional information.
As previously reported, in 2000, GE and the Environmental Protection Agency (EPA) entered into a consent decree relating to PCB cleanup of the Housatonic River (the "River") in Massachusetts. In 2012, the EPA issued a status report describing potential conceptual approaches to a 10-mile stretch of the river downstream from a previously remediated area. In September 2015, the EPA released an intended final decision for the so called "Rest of River". This is not the EPA's final decision, rather, the consent decree provides for discussions and a detailed dispute resolution process between GE and EPA, after which the EPA will issue its final decision. As of September 30, 2015, and based on its assessment of current facts and circumstances, GE believes it has recorded adequate reserves to cover future obligations associated with an expected final remedy.
2015 3Q FORM 10-Q PAGE 52
FINANCIAL STATEMENTS AND NOTES
Statement of Earnings (Loss) | 54 | |||
Consolidated Statement of Comprehensive Income (Loss) | 58 | |||
Consolidated Statement of Changes in Shareowners' Equity | 59 | |||
Statement of Financial Position | 60 | |||
Statement of Cash Flows | 62 | |||
Notes to Consolidated Financial Statements | ||||
1 | Basis of Presentation and Summary of Significant Accounting Policies | 64 | ||
2 | Businesses Held for Sale, Financing Receivables Held for Sale and Discontinued Operations | 66 | ||
3 | Investment Securities | 72 | ||
4 | Inventories | 76 | ||
5 | GECC Financing Receivables and Allowance for Losses | 76 | ||
6 | Property, Plant and Equipment | 77 | ||
7 | Acquisitions, Goodwill and Other Intangible Assets | 78 | ||
8 | Borrowings and Bank Deposits | 81 | ||
9 | Postretirement Benefit Plans | 82 | ||
10 | Income Taxes | 83 | ||
11 | Shareowners' Equity | 84 | ||
12 | GECC Revenues from Services | 86 | ||
13 | Earnings Per Share Information | 87 | ||
14 | Fair Value Measurements | 88 | ||
15 | Financial Instruments | 93 | ||
16 | Variable Interest Entities | 99 | ||
17 | Intercompany Transactions | 102 | ||
18 | Supplemental Information About the Credit Quality of Financing Receivables and Allowance for Losses | 103 | ||
2015 3Q FORM 10-Q PAGE 53
FINANCIAL STATEMENTS
STATEMENT OF EARNINGS (LOSS) | |||||
(UNAUDITED) | |||||
Three months ended September 30 | |||||
General Electric Company | |||||
and consolidated affiliates | |||||
(In millions; per-share amounts in dollars) | 2015 | 2014 | |||
Revenues and other income | |||||
Sales of goods | $ | 17,860 | $ | 18,723 | |
Sales of services | 7,667 | 7,167 | |||
Other income | 169 | 258 | |||
GECC earnings from continuing operations | - | - | |||
GECC revenues from services (Note 12) | 5,984 | 5,959 | |||
Total revenues and other income | 31,680 | 32,107 | |||
Costs and expenses | |||||
Cost of goods sold | 14,199 | 15,232 | |||
Cost of services sold | 5,050 | 4,508 | |||
Interest and other financial charges | 1,462 | 1,325 | |||
Investment contracts, insurance losses and | |||||
insurance annuity benefits | 676 | 662 | |||
Provision for losses on financing receivables (Note 5) | 738 | 858 | |||
Other costs and expenses | 6,298 | 6,318 | |||
Total costs and expenses | 28,423 | 28,903 | |||
Earnings (loss) from continuing operations before income taxes | 3,257 | 3,204 | |||
Benefit (provision) for income taxes | (365) | (401) | |||
Earnings (loss) from continuing operations | 2,892 | 2,803 | |||
Earnings (loss) from discontinued operations, net of taxes (Note 2) | (347) | 706 | |||
Net earnings (loss) | 2,545 | 3,509 | |||
Less net earnings (loss) attributable to noncontrolling interests | 39 | (28) | |||
Net earnings (loss) attributable to the Company | 2,506 | 3,537 | |||
Preferred stock dividends declared | - | - | |||
Net earnings (loss) attributable to GE common shareowners | $ | 2,506 | $ | 3,537 | |
Amounts attributable to GE common shareowners | |||||
Earnings (loss) from continuing operations | $ | 2,892 | $ | 2,803 | |
Less net earnings (loss) attributable to noncontrolling interests | 39 | (28) | |||
Earnings (loss) from continuing operations attributable to the Company | 2,853 | 2,831 | |||
GECC preferred stock dividends declared | - | - | |||
Earnings (loss) from continuing operations attributable | |||||
to GE common shareowners | 2,853 | 2,831 | |||
Earnings (loss) from discontinued operations, net of taxes | (347) | 706 | |||
Net earnings (loss) attributable to GE common shareowners | $ | 2,506 | $ | 3,537 | |
Per-share amounts | |||||
Earnings (loss) from continuing operations | |||||
Diluted earnings (loss) per share | $ | 0.28 | $ | 0.28 | |
Basic earnings (loss) per share | $ | 0.28 | $ | 0.28 | |
Net earnings (loss) | |||||
Diluted earnings (loss) per share | $ | 0.25 | $ | 0.35 | |
Basic earnings (loss) per share | $ | 0.25 | $ | 0.35 | |
Dividends declared per common share | $ | 0.23 | $ | 0.22 | |
Amounts may not add due to rounding.
See Note 3 for other-than-temporary impairment amounts on investment securities.
See accompanying notes.
2015 3Q FORM 10-Q PAGE 54
STATEMENT OF EARNINGS (LOSS) (CONTINUED) | |||||||||||
(UNAUDITED) | |||||||||||
Three months ended September 30 | |||||||||||
GE(a) | Financial Services (GECC) | ||||||||||
(In millions; per-share amounts in dollars) | 2015 | 2014 | 2015 | 2014 | |||||||
Revenues and other income | |||||||||||
Sales of goods | $ | 17,874 | $ | 18,764 | $ | 21 | $ | 28 | |||
Sales of services | 7,738 | 7,261 | - | - | |||||||
Other income | 201 | 236 | - | - | |||||||
GECC earnings (loss) from continuing operations | 734 | 843 | - | - | |||||||
GECC revenues from services (Note 12) | - | - | 6,290 | 6,356 | |||||||
Total revenues and other income | 26,547 | 27,104 | 6,312 | 6,384 | |||||||
Costs and expenses | |||||||||||
Cost of goods sold | 14,215 | 15,274 | 18 | 25 | |||||||
Cost of services sold | 5,121 | 4,603 | - | - | |||||||
Interest and other financial charges | 440 | 377 | 1,151 | 1,061 | |||||||
Investment contracts, insurance losses and | |||||||||||
insurance annuity benefits | - | - | 717 | 700 | |||||||
Provision for losses on financing receivables (Note 5) | - | - | 738 | 858 | |||||||
Other costs and expenses | 3,549 | 3,686 | 2,918 | 2,857 | |||||||
Total costs and expenses | 23,325 | 23,940 | 5,542 | 5,501 | |||||||
Earnings (loss) from continuing operations before income taxes | 3,222 | 3,164 | 769 | 883 | |||||||
Benefit (provision) for income taxes | (413) | (416) | 48 | 15 | |||||||
Earnings (loss) from continuing operations | 2,809 | 2,748 | 817 | 898 | |||||||
Earnings (loss) from discontinued operations, net of taxes (Note 2) | (347) | 706 | (347) | 706 | |||||||
Net earnings (loss) | 2,462 | 3,454 | 470 | 1,604 | |||||||
Less net earnings (loss) attributable to noncontrolling interests | (43) | (83) | 83 | 55 | |||||||
Net earnings (loss) attributable to the Company | 2,506 | 3,537 | 387 | 1,549 | |||||||
Preferred stock dividends declared | - | - | - | - | |||||||
Net earnings (loss) attributable to GE common shareowners | $ | 2,506 | $ | 3,537 | $ | 387 | $ | 1,549 | |||
Amounts attributable to GE common shareowners: | |||||||||||
Earnings (loss) from continuing operations | $ | 2,809 | $ | 2,748 | $ | 817 | $ | 898 | |||
Less net earnings (loss) attributable to noncontrolling interests | (43) | (83) | 83 | 55 | |||||||
Earnings (loss) from continuing operations attributable to the Company | 2,853 | 2,831 | 734 | 843 | |||||||
GECC preferred stock dividends declared | - | - | - | - | |||||||
Earnings (loss) from continuing operations attributable | |||||||||||
to GE common shareowners | 2,853 | 2,831 | 734 | 843 | |||||||
Earnings (loss) from discontinued operations, net of taxes | (347) | 706 | (347) | 706 | |||||||
Net earnings (loss) attributable to GE common shareowners | $ | 2,506 | $ | 3,537 | $ | 387 | $ | 1,549 | |||
(a) | Represents the adding together of all affiliated companies except General Electric Capital Corporation (GECC or Financial Services), which is presented on a one-line basis. See Note 1. |
Amounts may not add due to rounding.
In the consolidating data on this page, "GE" means the basis of consolidation as described in Note 1 to the consolidated financial statements; "GECC" means General Electric Capital Corporation and all of its affiliates and associated companies. Separate information is shown for "GE" and "GECC." Transactions between GE and GECC have been eliminated from the "General Electric Company and consolidated affiliates" columns on the prior page.
2015 3Q FORM 10-Q PAGE 55
STATEMENT OF EARNINGS (LOSS) | |||||
(UNAUDITED) | |||||
Nine months ended September 30 | |||||
General Electric Company | |||||
and consolidated affiliates | |||||
(In millions; per-share amounts in dollars) | 2015 | 2014 | |||
Revenues and other income | |||||
Sales of goods | $ | 53,003 | $ | 53,894 | |
Sales of services | 22,263 | 21,945 | |||
Other income | 1,092 | 792 | |||
GECC earnings from continuing operations | - | - | |||
GECC revenues from services (Note 12) | 16,373 | 17,964 | |||
Total revenues and other income | 92,731 | 94,595 | |||
Costs and expenses | |||||
Cost of goods sold(a) | 42,748 | 43,600 | |||
Cost of services sold(a) | 14,690 | 14,668 | |||
Interest and other financial charges | 3,976 | 3,975 | |||
Investment contracts, insurance losses and |
| ||||
insurance annuity benefits | 1,952 | 1,940 | |||
Provision for losses on financing receivables (Note 5) | 4,636 | 2,693 | |||
Other costs and expenses | 19,125 | 18,744 | |||
Total costs and expenses | 87,127 | 85,620 | |||
Earnings (loss) from continuing operations before income taxes | 5,604 | 8,975 | |||
Benefit (provision) for income taxes | (7,466) | (1,034) | |||
Earnings (loss) from continuing operations | (1,862) | 7,941 | |||
Earnings (loss) from discontinued operations, net of taxes (Note 2) | (10,336) | 2,065 | |||
Net earnings (loss) | (12,198) | 10,006 | |||
Less net earnings (loss) attributable to noncontrolling interests | 229 | (75) | |||
Net earnings (loss) attributable to the Company | (12,427) | 10,081 | |||
Preferred stock dividends declared | - | - | |||
Net earnings (loss) attributable to GE common shareowners | $ | (12,427) | $ | 10,081 | |
Amounts attributable to GE common shareowners | |||||
Earnings (loss) from continuing operations | $ | (1,862) | $ | 7,941 | |
Less net earnings (loss) attributable to noncontrolling interests | 229 | (75) | |||
Earnings (loss) from continuing operations attributable to the Company | (2,091) | 8,016 | |||
GECC preferred stock dividends declared | - | - | |||
Earnings (loss) from continuing operations attributable | |||||
to GE common shareowners | (2,091) | 8,016 | |||
Earnings (loss) from discontinued operations, net of taxes | (10,336) | 2,065 | |||
Net earnings (loss) attributable to GE common shareowners | $ | (12,427) | $ | 10,081 | |
Per-share amounts | |||||
Earnings (loss) from continuing operations | |||||
Diluted earnings (loss) per share | $ | (0.21) | $ | 0.79 | |
Basic earnings (loss) per share | $ | (0.21) | $ | 0.80 | |
Net earnings (loss) | |||||
Diluted earnings (loss) per share | $ | (1.23) | $ | 0.99 | |
Basic earnings (loss) per share | $ | (1.23) | $ | 1.00 | |
Dividends declared per common share | $ | 0.69 | $ | 0.66 | |
| (a) | Includes revisions to previously reported amounts which increased cost of goods sold and decreased cost of services sold by $401million and $728 million for the three months ended March 31, 2015 and June 30, 2015, respectively. |
Amounts may not add due to rounding.
See Note 3 for other-than-temporary impairment amounts on investment securities.
See accompanying notes.
2015 3Q FORM 10-Q PAGE 56
STATEMENT OF EARNINGS (LOSS) (CONTINUED) | |||||||||||
(UNAUDITED) | |||||||||||
Nine months ended September 30 | |||||||||||
GE(a) | Financial Services (GECC) | ||||||||||
(In millions; per-share amounts in dollars) | 2015 | 2014 | 2015 | 2014 | |||||||
Revenues and other income | |||||||||||
Sales of goods | $ | 53,071 | $ | 54,017 | $ | 64 | $ | 89 | |||
Sales of services | 22,521 | 22,245 | - | - | |||||||
Other income | 1,023 | 689 | - | - | |||||||
GECC earnings (loss) from continuing operations | (7,394) | 3,252 | - | - | |||||||
GECC revenues from services (Note 12) | - | - | 17,388 | 19,134 | |||||||
Total revenues and other income | 69,221 | 80,203 | 17,452 | 19,223 | |||||||
Costs and expenses | |||||||||||
Cost of goods sold(b) | 42,821 | 43,729 | 58 | 81 | |||||||
Cost of services sold(b) | 14,948 | 14,969 | - | - | |||||||
Interest and other financial charges | 1,243 | 1,142 | 3,096 | 3,184 | |||||||
Investment contracts, insurance losses and | |||||||||||
insurance annuity benefits | - | - | 2,070 | 2,041 | |||||||
Provision for losses on financing receivables (Note 5) | - | - | 4,636 | 2,693 | |||||||
Other costs and expenses | 11,035 | 11,355 | 8,555 | 8,005 | |||||||
Total costs and expenses | 70,048 | 71,195 | 18,415 | 16,004 | |||||||
Earnings (loss) from continuing operations before income taxes | (827) | 9,008 | (963) | 3,219 | |||||||
Benefit (provision) for income taxes | (1,302) | (1,143) | (6,164) | 109 | |||||||
Earnings (loss) from continuing operations | (2,129) | 7,865 | (7,127) | 3,328 | |||||||
Earnings (loss) from discontinued operations, net of taxes (Note 2) | (10,336) | 2,065 | (10,332) | 2,070 | |||||||
Net earnings (loss) | (12,465) | 9,930 | (17,459) | 5,398 | |||||||
Less net earnings (loss) attributable to noncontrolling interests | (38) | (151) | 267 | 76 | |||||||
Net earnings (loss) attributable to the Company | (12,427) | 10,081 | (17,726) | 5,322 | |||||||
Preferred stock dividends declared | - | - | (161) | (161) | |||||||
Net earnings (loss) attributable to GE common shareowners | $ | (12,427) | $ | 10,081 | $ | (17,887) | $ | 5,161 | |||
Amounts attributable to GE common shareowners: | |||||||||||
Earnings (loss) from continuing operations | $ | (2,129) | $ | 7,865 | $ | (7,127) | $ | 3,328 | |||
Less net earnings (loss) attributable to noncontrolling interests | (38) | (151) | 267 | 76 | |||||||
Earnings (loss) from continuing operations attributable to the Company | (2,091) | 8,016 | (7,394) | 3,252 | |||||||
GECC preferred stock dividends declared | - | - | (161) | (161) | |||||||
Earnings (loss) from continuing operations attributable | |||||||||||
to GE common shareowners | (2,091) | 8,016 | (7,555) | 3,091 | |||||||
Earnings (loss) from discontinued operations, net of taxes | (10,336) | 2,065 | (10,332) | 2,070 | |||||||
Net earnings (loss) attributable to GE common shareowners | $ | (12,427) | $ | 10,081 | $ | (17,887) | $ | 5,161 | |||
(a) | Represents the adding together of all affiliated companies except General Electric Capital Corporation (GECC or Financial Services), which is presented on a one-line basis. See Note 1. |
(b) Includes revisions to previously reported amounts which increased cost of goods sold and decreased cost of services sold by $401million and $728 million for the three months ended March 31, 2015 and June 30, 2015, respectively.
Amounts may not add due to rounding.
In the consolidating data on this page, "GE" means the basis of consolidation as described in Note 1 to the consolidated financial statements; "GECC" means General Electric Capital Corporation and all of its affiliates and associated companies. Separate information is shown for "GE" and "GECC." Transactions between GE and GECC have been eliminated from the "General Electric Company and consolidated affiliates" columns on the prior page.
2015 3Q FORM 10-Q PAGE 57
GENERAL ELECTRIC COMPANY AND CONSOLIDATED AFFILIATES | |||||||||||
CONSOLIDATED STATEMENT OF COMPREHENSIVE INCOME (LOSS) | |||||||||||
(UNAUDITED) | |||||||||||
Three months ended September 30 | Nine months ended September 30 | ||||||||||
(In millions) | 2015 | 2014 | 2015 | 2014 | |||||||
Net earnings (loss) | $ | 2,545 | $ | 3,509 | $ | (12,198) | $ | 10,006 | |||
Less net earnings (loss) attributable to noncontrolling interests | 39 | (28) | 229 | (75) | |||||||
Net earnings (loss) attributable to the Company | $ | 2,506 | $ | 3,537 | $ | (12,427) | $ | 10,081 | |||
Other comprehensive income (loss) | |||||||||||
Investment securities | $ | (3) | $ | (284) | $ | (452) | $ | 450 | |||
Currency translation adjustments | 624 | (1,590) | (2,896) | (1,649) | |||||||
Cash flow hedges | (35) | 55 | 6 | 136 | |||||||
Benefit plans | 627 | 859 | 4,486 | 2,072 | |||||||
Other comprehensive income (loss) | 1,214 | (960) | 1,144 | 1,009 | |||||||
Less other comprehensive income (loss) | |||||||||||
attributable to noncontrolling interests | (8) | (8) | (45) | (1) | |||||||
Other comprehensive income (loss) attributable to the Company
| $ | 1,221 | $ | (952) | $ | 1,189 | $ | 1,010 | |||
Comprehensive income (loss) | $ | 3,759 | $ | 2,549 | $ | (11,054) | $ | 11,015 | |||
Less comprehensive income (loss) attributable to noncontrolling interests | 31 | (36) | 184 | (76) | |||||||
Comprehensive income (loss) attributable to the Company | $ | 3,727 | $ | 2,585 | $ | (11,238) | $ | 11,091 | |||
Amounts may not add due to rounding.
Amounts presented net of taxes. See Note 11 for further information about other comprehensive income (loss) and noncontrolling interests.
See accompanying notes.
2015 3Q FORM 10-Q PAGE 58
GENERAL ELECTRIC COMPANY AND CONSOLIDATED AFFILIATES | |||||
CONSOLIDATED STATEMENT OF CHANGES IN SHAREOWNERS' EQUITY | |||||
(UNAUDITED) | |||||
Nine months ended September 30 | |||||
(In millions) | 2015 | 2014 | |||
Shareowners' equity balance at January 1 | $ | 128,159 | $ | 130,566 | |
Increases (decreases) from net earnings (loss) attributable to the Company | (12,427) | 10,081 | |||
Dividends and other transactions with shareowners | (6,973) | (6,635) | |||
Other comprehensive income (loss) attributable to the Company | 1,189 | 1,010 | |||
Net sales (purchases) of shares for treasury | 1,386 | (444) | |||
Changes in other capital | (129) | 420 | |||
Ending balance at September 30 | 111,204 | 134,998 | |||
Noncontrolling interests | 8,788 | 8,513 | |||
Total equity balance at September 30 | $ | 119,993 | $ | 143,511 | |
Amounts may not add due to rounding.
See Note 11 for further information about changes in shareowners' equity.
See accompanying notes.
2015 3Q FORM 10-Q PAGE 59
STATEMENT OF FINANCIAL POSITION | |||||
General Electric Company
| |||||
and consolidated affiliates | |||||
(In millions, except share amounts) | September 30, 2015 | December 31, 2014 | |||
(Unaudited) | |||||
Assets | |||||
Cash and equivalents | $ | 99,086 | $ | 84,927 | |
Investment securities (Note 3) | 36,933 | 38,400 | |||
Current receivables | 22,332 | 23,237 | |||
Inventories (Note 4) | 19,285 | 17,689 | |||
Financing receivables – net (Note 5 and 18) | 72,353 | 110,255 | |||
Other GECC receivables | 6,280 | 6,920 | |||
Property, plant and equipment – net (Note 6) | 50,704 | 48,336 | |||
Investment in GECC | - | - | |||
Goodwill (Note 7) | 61,660 | 62,983 | |||
Other intangible assets – net (Note 7) | 13,618 | 13,855 | |||
All other assets | 45,793 | 47,905 | |||
Financing receivables held for sale (Note 2) | 22,832 | 421 | |||
Deferred income taxes | 176 | 5,352 | |||
Assets of businesses held for sale (Note 2) | 8,309 | 6,300 | |||
Assets of discontinued operations (Note 2) | 121,949 | 186,934 | |||
Total assets(a) | $ | 581,310 | 653,514 | ||
Liabilities and equity | |||||
Short-term borrowings (Note 8) | $ | 46,495 | $ | 70,714 | |
Accounts payable, principally trade accounts | 11,762 | 12,572 | |||
Progress collections and price adjustments accrued | 11,247 | 12,537 | |||
Dividends payable | 2,324 | 2,317 | |||
Other GE current liabilities | 12,624 | 12,682 | |||
Non-recourse borrowings of consolidated securitization entities (Note 8) | 16,225 | 19,369 | |||
Bank deposits (Note 8) | 48,656 | 43,841 | |||
Long-term borrowings (Note 8) | 180,011 | 199,182 | |||
Investment contracts, insurance liabilities and insurance annuity benefits | 26,135 | 27,578 | |||
All other liabilities | 60,685 | 63,720 | |||
Liabilities of businesses held for sale (Note 2) | 1,384 | 3,375 | |||
Liabilities of discontinued operations (Note 2) | 43,768 | 48,794 | |||
Total liabilities(a) | 461,317 | 516,681 | |||
GECC preferred stock (50,000 shares outstanding at both September 30, 2015 and December 31, 2014) | - | - | |||
Common stock (10,109,239,000 and 10,057,380,000 shares outstanding | |||||
at both September 30, 2015 and December 31, 2014, respectively) | 702 | 702 | |||
Accumulated other comprehensive income (loss) – net attributable to GE(b) | |||||
Investment securities | 561 | 1,013 | |||
Currency translation adjustments | (5,281) | (2,427) | |||
Cash flow hedges | (174) | (180) | |||
Benefit plans | (12,089) | (16,578) | |||
Other capital | 32,760 | 32,889 | |||
Retained earnings | 135,932 | 155,333 | |||
Less common stock held in treasury | (41,207) | (42,593) | |||
Total GE shareowners' equity | 111,204 | 128,159 | |||
Noncontrolling interests(c) (Note 11) | 8,788 | 8,674 | |||
Total equity | 119,993 | 136,833 | |||
Total liabilities and equity | $ | 581,310 | $ | 653,514 | |
| (a) | Our consolidated assets at September 30, 2015 included total assets of $41,589 million of certain variable interest entities (VIEs) that can only be used to settle the liabilities of those VIEs. These assets included current receivables and net financing receivables of $28,190 million and investment securities of $1,412 million within continuing operations and assets of discontinued operations of $11,427 million. Our consolidated liabilities at September 30, 2015 included liabilities of certain VIEs for which the VIE creditors do not have recourse to GE. These liabilities included non-recourse borrowings of consolidated securitization entities (CSEs) of $16,225 million within continuing operations and non-recourse borrowings of CSEs within discontinued operations of $8,072 million. See Note 16. |
| (b) | The sum of accumulated other comprehensive income (loss) (AOCI) attributable to the Company was $(16,983) million and $(18,172) million at September 30, 2015 and December 31, 2014, respectively. |
| (c) | Included AOCI attributable to noncontrolling interests of $(239) million and $(194) million at September 30, 2015 and December 31, 2014, respectively. |
Amounts may not add due to rounding.
See accompanying notes.
2015 3Q FORM 10-Q PAGE 60
STATEMENT OF FINANCIAL POSITION (CONTINUED) | |||||||||||
GE(a) | Financial Services (GECC) | ||||||||||
(In millions, except share amounts) | September 30, 2015 | December 31, 2014 | September 30, 2015 | December 31, 2014 | |||||||
(Unaudited) | (Unaudited) | ||||||||||
Assets | |||||||||||
Cash and equivalents | $ | 16,810 | $ | 15,916 | $ | 82,276 | $ | 69,011 | |||
Investment securities (Note 3) | 68 | 84 | 36,868 | 38,320 | |||||||
Current receivables | 10,786 | 11,513 | - | - | |||||||
Inventories (Note 4) | 19,225 | 17,639 | 59 | 50 | |||||||
Financing receivables - net (Note 5 and 18) | - | - | 83,748 | 122,457 | |||||||
Other GECC receivables | - | - | 14,039 | 14,508 | |||||||
Property, plant and equipment – net (Note 6) | 16,659 | 17,207 | 34,516 | 31,519 | |||||||
Investment in GECC | 63,217 | 82,549 | - | - | |||||||
Goodwill (Note 7) | 50,200 | 51,527 | 11,460 | 11,456 | |||||||
Other intangible assets – net (Note 7) | 12,445 | 12,984 | 1,177 | 875 | |||||||
All other assets | 26,669 | 24,680 | 19,155 | 23,198 | |||||||
Financing receivables held for sale (Note 2) | - | - | 23,665 | 778 | |||||||
Deferred income taxes | 6,634 | 8,772 | (6,458) | (3,420) | |||||||
Assets of businesses held for sale (Note 2) | 3,382 | 2,805 | 4,917 | 3,474 | |||||||
Assets of discontinued operations (Note 2) | 9 | 10 | 121,940 | 186,924 | |||||||
Total assets | $ | 226,104 | $ | 245,686 | $ | 427,361 | $ | 499,150 | |||
Liabilities and equity | |||||||||||
Short-term borrowings (Note 8) | $ | 4,761 | $ | 3,872 | $ | 42,880 | $ | 67,705 | |||
Accounts payable, principally trade accounts | 15,537 | 16,511 | 2,213 | 2,411 | |||||||
Progress collections and price adjustments accrued | 11,247 | 12,550 | - | - | |||||||
Dividends payable | 2,324 | 2,317 | - | - | |||||||
Other GE current liabilities | 12,622 | 12,681 | - | - | |||||||
Non-recourse borrowings of consolidated securitization entities (Note 8) | - | - | 16,225 | 19,369 | |||||||
Bank deposits (Note 8) | - | - | 48,656 | 43,841 | |||||||
Long-term borrowings (Note 8) | 15,895 | 12,468 | 164,183 | 186,759 | |||||||
Investment contracts, insurance liabilities and insurance annuity benefits | - | - | 26,646 | 28,027 | |||||||
All other liabilities | 49,956 | 54,662 | 11,330 | 9,549 | |||||||
Liabilities of businesses held for sale (Note 2) | 1,752 | 1,504 | 260 | 2,434 | |||||||
Liabilities of discontinued operations (Note 2) | 126 | 137 | 43,642 | 48,657 | |||||||
Total liabilities | 114,220 | 116,702 | 356,035 | 408,752 | |||||||
GECC preferred stock (50,000 shares outstanding | - | - | - | - | |||||||
at both September 30, 2015 and December 31, 2014) | |||||||||||
Common stock (10,109,239,000 and 10,057,380,000 shares outstanding | |||||||||||
at both September 30, 2015 and December 31, 2014, respectively) | 702 | 702 | - | - | |||||||
Accumulated other comprehensive income (loss) - net attributable to GE | |||||||||||
Investment securities | 561 | 1,013 | 580 | 1,010 | |||||||
Currency translation adjustments | (5,281) | (2,427) | (1,412) | (838) | |||||||
Cash flow hedges | (174) | (180) | (192) | (172) | |||||||
Benefit plans | (12,089) | (16,578) | (569) | (577) | |||||||
Other capital | 32,760 | 32,889 | 33,019 | 32,999 | |||||||
Retained earnings | 135,932 | 155,333 | 36,740 | 55,077 | |||||||
Less common stock held in treasury | (41,207) | (42,593) | - | - | |||||||
Total GE shareowners' equity | 111,204 | 128,159 | 68,166 | 87,499 | |||||||
Noncontrolling interests (Note 11) | 679 | 825 | 3,160 | 2,899 | |||||||
Total equity | 111,883 | 128,984 | 71,326 | 90,398 | |||||||
Total liabilities and equity | $ | 226,104 | $ | 245,686 | $ | 427,361 | $ | 499,150 | |||
| (a) | Represents the adding together of all affiliated companies except General Electric Capital Corporation (GECC or Financial Services), which is presented on a one-line basis. See Note 1. |
Amounts may not add due to rounding.
In the consolidating data on this page, "GE" means the basis of consolidation as described in Note 1 to the consolidated financial statements; "GECC" means General Electric Capital Corporation and all of its affiliates and associated companies. Separate information is shown for "GE" and "GECC." Transactions between GE and GECC have been eliminated from the "General Electric Company and consolidated affiliates" columns on the prior page.
2015 3Q FORM 10-Q PAGE 61
STATEMENT OF CASH FLOWS | |||||
(UNAUDITED) | |||||
Nine months ended September 30 | |||||
General Electric Company | |||||
and consolidated affiliates | |||||
(In millions) | 2015 | 2014 | |||
Cash flows – operating activities | |||||
Net earnings (loss) | $ | (12,198) | $ | 10,006 | |
Less net earnings (loss) attributable to noncontrolling interests | 229 | (75) | |||
Net earnings (loss) attributable to the Company | (12,427) | 10,081 | |||
(Earnings) loss from discontinued operations | 10,336 | (2,065) | |||
Adjustments to reconcile net earnings (loss) attributable to the | |||||
Company to cash provided from operating activities | |||||
Depreciation and amortization of property, | |||||
plant and equipment | 3,603 | 3,820 | |||
(Earnings) loss from continuing operations retained by GECC | - | - | |||
Deferred income taxes | 2,365 | (1,307) | |||
Decrease (increase) in GE current receivables | 909 | (691) | |||
Decrease (increase) in inventories | (1,766) | (2,768) | |||
Increase (decrease) in accounts payable | 245 | 1,331 | |||
Increase (decrease) in GE progress collections | (1,265) | (735) | |||
Provision for losses on GECC financing receivables | 4,636 | 2,693 | |||
All other operating activities | 3,429 | 809 | |||
Cash from (used for) operating activities – continuing operations | 10,065 | 11,168 | |||
Cash from (used for) operating activities – discontinued operations | 3,082 | 5,077 | |||
Cash from (used for) operating activities | 13,147 | 16,245 | |||
Cash flows – investing activities | |||||
Additions to property, plant and equipment | (4,893) | (4,977) | |||
Dispositions of property, plant and equipment | 2,375 | 2,430 | |||
Net decrease (increase) in GECC financing receivables | 4,248 | (1,699) | |||
Proceeds from sale of discontinued operations | 42,486 | 232 | |||
Proceeds from principal business dispositions | 1,496 | 607 | |||
Net cash from (payments for) principal businesses purchased | (1,738) | (2,090) | |||
All other investing activities | 8,567 | 7,165 | |||
Cash from (used for) investing activities – continuing operations | 52,541 | 1,668 | |||
Cash from (used for) investing activities – discontinued operations | 7,230 | (3,587) | |||
Cash from (used for) investing activities | 59,771 | (1,919) | |||
Cash flows – financing activities | |||||
Net increase (decrease) in borrowings (maturities of | |||||
90 days or less) | (16,791) | (6,069) | |||
Net increase (decrease) in bank deposits | 5,329 | 6,933 | |||
Newly issued debt (maturities longer than 90 days) | 17,873 | 29,605 | |||
Repayments and other debt reductions (maturities longer than 90 days) | (44,003) | (37,654) | |||
Net dispositions (purchases) of GE shares for treasury | 635 | (1,359) | |||
Dividends paid to shareowners | (6,960) | (6,643) | |||
Proceeds from initial public offering of Synchrony Financial | - | 2,842 | |||
All other financing activities | (1,394) | (274) | |||
Cash from (used for) financing activities – continuing operations | (45,312) | (12,619) | |||
Cash from (used for) financing activities – discontinued operations | (4,495) | 1,540 | |||
Cash from (used for) financing activities | (49,807) | (11,079) | |||
Effect of currency exchange rate changes on cash and equivalents | (3,517) | (1,360) | |||
Increase (decrease) in cash and equivalents | 19,594 | 1,887 | |||
Cash and equivalents at beginning of year | 91,017 | 88,787 | |||
Cash and equivalents at September 30 | 110,611 | 90,674 | |||
Less cash and equivalents of discontinued operations at September 30 | 11,226 | 5,070 | |||
Cash and equivalents of continuing operations at September 30 | $ | 99,385 | $ | 85,604 | |
Amounts may not add due to rounding.
See accompanying notes.
2015 3Q FORM 10-Q PAGE 62
STATEMENT OF CASH FLOWS (CONTINUED) | |||||||||||
(UNAUDITED) | |||||||||||
Nine months ended September 30 | |||||||||||
GE(a) | Financial Services (GECC) | ||||||||||
(In millions) | 2015 | 2014 | 2015 | 2014 | |||||||
Cash flows – operating activities | |||||||||||
Net earnings (loss) | $ | (12,465) | $ | 9,930 | $ | (17,459) | $ | 5,398 | |||
Less net earnings (loss) attributable to noncontrolling interests | (38) | (151) | 267 | 76 | |||||||
Net earnings (loss) attributable to the Company | (12,427) | 10,081 | (17,726) | 5,322 | |||||||
(Earnings) loss from discontinued operations | 10,336 | (2,065) | 10,332 | (2,070) | |||||||
Adjustments to reconcile net earnings (loss) attributable to the | |||||||||||
Company to cash provided from operating activities | |||||||||||
Depreciation and amortization of property, | |||||||||||
plant and equipment | 1,777 | 1,891 | 1,841 | 1,929 | |||||||
(Earnings) loss from continuing operations retained by GECC(b) | 7,844 | (1,031) | - | - | |||||||
Deferred income taxes | (407) | (618) | 2,772 | (689) | |||||||
Decrease (increase) in GE current receivables | 588 | (535) | - | - | |||||||
Decrease (increase) in inventories
| (1,739) | (2,771) | (9) | 20 | |||||||
Increase (decrease) in accounts payable | 34 | 1,054 | 165 | 764 | |||||||
Increase (decrease) in GE progress collections | (1,278) | (748) | - | - | |||||||
Provision for losses on GECC financing receivables | - | - | 4,636 | 2,693 | |||||||
All other operating activities | 1,798 | 1,917 | 1,943 | (1,194) | |||||||
Cash from (used for) operating activities – continuing operations | 6,526 | 7,175 | 3,954 | 6,775 | |||||||
Cash from (used for) operating activities – discontinued operations | (10) | (1) | 3,090 | 5,078 | |||||||
Cash from (used for) operating activities | 6,516 | 7,174 | 7,044 | 11,853 | |||||||
Cash flows – investing activities | |||||||||||
Additions to property, plant and equipment | (2,708) | (2,806) | (2,643) | (2,627) | |||||||
Dispositions of property, plant and equipment | 525 | 393 | 2,074 | 2,059 | |||||||
Net decrease (increase) in GECC financing receivables | - | - | 4,535 | (1,585) | |||||||
Proceeds from sale of discontinued operations | - | - | 42,486 | 232 | |||||||
Proceeds from principal business dispositions | 222 | 579 | 1,274 | - | |||||||
Net cash from (payments for) principal businesses purchased | (61) | (2,090) | (1,677) | - | |||||||
All other investing activities | (1,037) | (647) | 9,608 | 8,957 | |||||||
Cash from (used for) investing activities – continuing operations | (3,058) | (4,571) | 55,657 | 7,036 | |||||||
Cash from (used for) investing activities – discontinued operations | 10 | 1 | 7,218 | (3,588) | |||||||
Cash from (used for) investing activities | (3,048) | (4,570) | 62,875 | 3,448 | |||||||
Cash flows – financing activities | |||||||||||
Net increase (decrease) in borrowings (maturities of | |||||||||||
90 days or less) | 716 | (704) | (17,526) | (6,723) | |||||||
Net increase (decrease) in bank deposits | - | - | 5,329 | 6,933 | |||||||
Newly issued debt (maturities longer than 90 days) | 3,537 | 3,058 | 14,336 | 26,547 | |||||||
Repayments and other debt reductions (maturities longer than 90 days) | (153) | (215) | (43,850) | (37,439) | |||||||
Net dispositions (purchases) of GE shares for treasury | 635 | (1,359) | - | - | |||||||
Dividends paid to shareowners | (6,960) | (6,643) | (611) | (2,382) | |||||||
Proceeds from initial public offering of Synchrony Financial | - | - | - | 2,842 | |||||||
All other financing activities | 132 | 246 | (1,363) | (359) | |||||||
Cash from (used for) financing activities – continuing operations | (2,095) | (5,617) | (43,685) | (10,581) | |||||||
Cash from (used for) financing activities – discontinued operations | - | - | (4,496) | 1,540 | |||||||
Cash from (used for) financing activities | (2,095) | (5,617) | (48,181) | (9,041) | |||||||
Effect of currency exchange rate changes on cash and equivalents | (479) | (93) | (3,038) | (1,267) | |||||||
Increase (decrease) in cash and equivalents | 894 | (3,106) | 18,700 | 4,993 | |||||||
Cash and equivalents at beginning of year | 15,916 | 13,682 | 75,101 | 75,105 | |||||||
Cash and equivalents at September 30 | 16,810 | 10,576 | 93,801 | 80,098 | |||||||
Less cash and equivalents of discontinued operations at September 30 | - | - | 11,226 | 5,070 | |||||||
Cash and equivalents of continuing operations at September 30 | $ | 16,810 | $ | 10,576 | $ | 82,575 | $ | 75,028 | |||
| (a) | Represents the adding together of all affiliated companies except General Electric Capital Corporation (GECC or Financial Services), which is presented on a one-line basis. |
| (b) | Represents GECC earnings/loss from continuing operations attributable to the Company, net of GECC dividends paid to GE. |
Amounts may not add due to rounding.
See accompanying notes. Separate information is shown for "GE" and "Financial Services (GECC)." Transactions between GE and GECC have been eliminated from the "Consolidated" columns and are discussed in Note 17.
2015 3Q FORM 10-Q PAGE 63
NOTES TO CONSOLIDATED FINANCIAL STATEMENTS
NOTE 1. BASIS OF PRESENTATION AND SUMMARY OF SIGNIFICANT ACCOUNTING POLICIES
BASIS OF PRESENTATION
The accompanying consolidated financial statements represent the consolidation of General Electric Company (the Company) and all companies that we directly or indirectly control, either through majority ownership or otherwise. See Note 1 to the consolidated financial statements of our Form 8-K filed on August 7, 2015 which discusses our consolidation and financial statement presentation. As used in this report on Form 10-Q (Report), "GE" represents the adding together of all affiliated companies except General Electric Capital Corporation (GECC or Financial Services), whose continuing operations are presented on a one-line basis; GECC consists of General Electric Capital Corporation and all of its affiliates; and "Consolidated" represents the adding together of GE and GECC with the effects of transactions between the two eliminated. Unless otherwise indicated, we refer to the caption revenues and other income simply as "revenues" throughout this Form 10-Q.
We have reclassified certain prior-period amounts to conform to the current-period presentation. Effective September 30, 2015, certain columns and rows may not add due to the use of rounded numbers. Percentages presented are calculated from the underlying numbers in millions. Unless otherwise indicated, information in these notes to the consolidated financial statements relates to continuing operations.
THE GE CAPITAL EXIT PLAN
On April 10, 2015, the Company announced its plan (the GE Capital Exit Plan) to reduce the size of its financial services businesses through the sale of most of the assets of GECC over the following 24 months, and to focus on continued investment and growth in the Company's industrial businesses. Under the GE Capital Exit Plan, which was approved on April 2, 2015 and aspects of which were approved on March 31, 2015, the Company will retain certain GECC businesses, principally its vertical financing businesses-GE Capital Aviation Services (GECAS), Energy Financial Services (EFS) and Healthcare Equipment Finance-that directly relate to the Company's core industrial domain and other operations, including Working Capital Solutions and our run-off insurance activities (together referred to as GE Capital Verticals or Verticals). The assets planned for disposition include Real Estate, most of Commercial Lending and Leasing (CLL) and all Consumer platforms (including all U.S. banking assets).
In the nine months ended September 30, 2015, GE recorded $21,061 million of after-tax charges related to the GE Capital Exit Plan, including $362 million of after-tax charges recorded in the third quarter of 2015, primarily exit-related charges in our CLL business, partially offset by income associated with operations in CLL and Real Estate. A description of after-tax charges for the nine months ended September 30, 2015 is provided below.
| $9,756 million of net loss primarily related to the planned disposition of the Real Estate business and most of the CLL business, which is recorded in discontinued operations under the caption "Earnings (loss) from discontinued operations, net of taxes" in the Statement of Earnings. |
| $6,209 million of tax expense related to expected repatriation of foreign earnings and write-off of deferred tax assets, of which $6,057 million is reported in GECC's Corporate component and $152 million is reported in our Consumer business all recorded in continuing operations under the caption "Benefit (provision) for income taxes" in the Statement of Earnings. |
| $4,666 million of net asset impairments due to shortened hold periods, of which $3,151 million is recorded in continuing operations in our Consumer business primarily under the captions "Provisions for losses on financing receivables" and "Revenues from services" in the Statement of Earnings and $1,515 million is recorded in discontinued operations in our CLL business under the caption "Earnings (loss) from discontinued operations, net of taxes" in the Statement of Earnings. |
| $430 million of restructuring and other charges, of which $337 million is recorded in continuing operations in GECC's Corporate component under the caption "Other costs and expenses" in the Statement of Earnings and $93 million is recorded in discontinued operations in our CLL business under the caption "Earnings (loss) from discontinued operations, net of taxes" in the Statement of Earnings. |
2015 3Q FORM 10-Q PAGE 64
|
|
As part of the GE Capital Exit Plan, the Company and GECC entered into an amendment to their existing financial support agreement. Under this amendment (the Amendment), the Company has provided a full and unconditional guarantee (the Guarantee) of the payment of principal and interest on all tradable senior and subordinated outstanding long-term debt securities and all commercial paper issued or guaranteed by GECC identified in the Amendment. In the aggregate, the Guarantee applied to $183,670 million of GECC debt as of September 30, 2015. See Note 8. The Guarantee replaced the requirement that the Company make certain income maintenance payments to GECC in certain circumstances. GECC's U.S. public indentures were concurrently amended to provide the full and unconditional guarantee by the Company set forth in the Guarantee.
See Notes 2 and 7 to the consolidated financial statements for additional information.
INTERIM PERIOD PRESENTATION
The consolidated financial statements and notes thereto are unaudited. These statements include all adjustments (consisting of normal recurring accruals) that we considered necessary to present a fair statement of our results of operations, financial position and cash flows. The results reported in these consolidated financial statements should not be regarded as necessarily indicative of results that may be expected for the entire year. It is suggested that these consolidated financial statements be read in conjunction with the financial statements and notes thereto included in our 2014 consolidated financial statements. Effective for the first quarter of 2015, the Company is following a calendar quarter. Previously, we established interim quarterly closing dates using a fiscal calendar, which required our businesses to close their books on either a Saturday or Sunday, depending on the business.
SUMMARY OF SIGNIFICANT ACCOUNTING POLICIES
In addition to the policies referenced in our 2014 Form 10-K Report and Form 8-K filed on August 7, 2015, we have supplemented the discussion of our significant accounting policies and critical accounting estimates to describe the estimates used to determine the fair value of businesses and assets held for sale as follows.
BUSINESSES AND ASSETS HELD FOR SALE
Businesses held for sale represent components that meet accounting requirements to be classified as held for sale and are presented as single asset and liability amounts in our financial statements with a valuation allowance, if necessary, to recognize the net carrying amount at the lower of cost or fair value, less cost to sell. Financing receivables that no longer qualify to be presented as held for investment must be classified as held for sale and recognized in our financial statements at the lower of cost or fair value, less cost to sell, with that amount representing a new cost basis at the date of transfer.
As previously discussed, as a result of the GE Capital Exit Plan, management has committed to reduce the size of its financial services businesses through the sale of most of the assets of GECC over the following 24 months. As a result, certain GECC businesses met the criteria to be classified as businesses held for sale and certain financing receivables were required to be recognized as held for sale at September 30, 2015.
The determination of fair value for businesses and portfolios of financing receivables involves significant judgments and assumptions. Development of estimates of fair values in this circumstance is complex and is dependent upon, among other factors, the nature of the potential sales transaction (for example, asset sale versus sale of legal entity), composition of assets and/or businesses in the disposal group, the comparability of the disposal group to market transactions, negotiations with third party purchasers etc. Such factors bear directly on the range of potential fair values and the selection of the best estimates. Key assumptions were developed based on market observable data and, in the absence of such data, internal information that is consistent with what market participants would use in a hypothetical transaction as of September 30, 2015.
We review all businesses and assets held for sale each reporting period to determine whether the existing carrying amounts are fully recoverable in comparison to estimated fair values.
2015 3Q FORM 10-Q PAGE 65
NOTE 2. BUSINESSES HELD FOR SALE, FINANCING RECEIVABLES HELD FOR SALE AND DISCONTINUED OPERATIONS
NBCU
As previously disclosed, Comcast Corporation was obligated to share with us potential tax savings associated with its purchase of our interest in NBCU LLC. During the second quarter of 2015, we recognized $450 million of pre-tax income related to the settlement of this obligation.
ASSETS AND LIABILITIES OF BUSINESSES HELD FOR SALE
In the third quarter of 2015, we signed an agreement to sell our Intelligent Platforms Embedded Systems Products business within our Energy Management segment, with assets of $285 million and liabilities of $39 million to Veritas Capital for approximately $515 million. The transaction remains subject to customary closing conditions and regulatory approvals, and is targeted to close in 2015.
In the first quarter of 2015, we signed an agreement to sell our consumer finance business in Australia and New Zealand (ANZ Consumer Lending) for approximately 6,800 million Australian dollars and 1,400 million New Zealand dollars, respectively. On May 29, 2015, we sold a portion of the Australian business for gross proceeds of $671 million. As of September 30, 2015, ANZ Consumer Lending had assets and liabilities of $4,917 million and $260 million, respectively. The sale is targeted to close in 2015 with expected proceeds of approximately 6,000 million Australian dollars and 1,400 million New Zealand dollars. The transactions remain subject to customary closing conditions and regulatory approvals .
In the fourth quarter of 2014, we signed an agreement to sell our Signaling business within our Transportation segment, with assets of $296 million and liabilities of $138 million to Alstom for approximately $800 million, and our consumer finance business Budapest Bank, to Hungary's government. On June 29, 2015 we completed the sale of Budapest Bank for proceeds of $700 million. The Signaling business transaction is targeted to close in November 2015 in conjunction with the Alstom transaction.
In the third quarter of 2014, we signed an agreement to sell our Appliances business with assets of $2,801 million and liabilities of $1,576 million to Electrolux for approximately $3,300 million. On July 1, 2015, we were notified that the Department of Justice had initiated court proceedings seeking to enjoin the sale of Appliances to Electrolux. Electrolux and GE intend to defend the proposed transaction.
FINANCIAL INFORMATION FOR ASSETS AND LIABILITIES OF BUSINESSES HELD FOR SALE | |||||
(In millions) | September 30, 2015 |
| December 31, 2014 | ||
| |||||
Assets | |||||
Cash and equivalents | $ | 299 |
| $ | 676 |
Investment securities | - | 448 | |||
Current receivables(a) | 144 | 180 | |||
Inventories | 760 | 588 | |||
Financing receivables – net |
| 4,141 |
|
| 2,144 |
Property, plant, and equipment – net | 1,187 | 1,015 | |||
Goodwill | 976 | 539 | |||
Other intangible assets – net | 273 | 170 | |||
Other |
| 529 |
|
| 540 |
Assets of businesses held for sale | $ | 8,309 |
| $ | 6,300 |
|
|
|
| ||
Liabilities |
|
|
| ||
Short-term borrowings | $ | 27 | 441 | ||
Accounts payable(a) | 636 | 510 | |||
Other current liabilities | 388 | 348 | |||
Bank deposits | - | 1,931 | |||
Deferred income taxes | (115) | (33) | |||
Other | 448 | 178 | |||
Liabilities of businesses held for sale | $ | 1,384 | $ | 3,375 | |
| (a) | Certain transactions at our Appliances and Signaling businesses are made on an arms-length basis with GECC, consisting primarily of GE customer receivables sold to GECC and GECC services for material procurement. These intercompany balances included within our held for sale businesses are reported in the GE and GECC columns of our financial statements, but are eliminated in deriving our consolidated financial statements. |
2015 3Q FORM 10-Q PAGE 66
GECC FINANCING RECEIVABLES HELD FOR SALE
In the first quarter of 2015, in connection with the GE Capital Exit Plan, we committed to sell all of our non-U.S. Consumer financing receivables. As a result, we transferred these financing receivables to held for sale and recognized a pre-tax provision for losses on financing receivables of $2,405 million ($2,197 million after tax) and wrote-off the associated balance of the allowance for loan losses of $2,859 million to reduce the carrying value of the financing receivables to the lower of cost or fair value, less cost to sell.
FINANCING RECEIVABLES HELD FOR SALE | ||||||
(in millions) | September 30, 2015 | December 31, 2014 | ||||
Commercial | ||||||
CLL | $ | 833 | $ | 357 | ||
Energy Financial Services | - | 35 | ||||
GE Capital Aviation Services (GECAS) | 14 | 27 | ||||
Other | 105 | - | ||||
Total Commercial | 952 | 419 | ||||
Consumer | 22,713 | (a) | 359 | |||
Total financing receivables held for sale | $ | 23,665 | $ | 778 | ||
| (a) | Over 30 days past due and nonaccrual financing receivables related to consumer financing receivables held for sale were $1,060 million and $634 million, respectively. |
DISCONTINUED OPERATIONS
Discontinued operations primarily included most of our CLL business, our Real Estate business and our U.S. mortgage business (WMC). Results of operations, financial position and cash flows for these businesses are separately reported as discontinued operations for all periods presented.
FINANCIAL INFORMATION FOR DISCONTINUED OPERATIONS | |||||||||||
Three months ended September 30 | Nine months ended September 30 | ||||||||||
(In millions) | 2015 | 2014 | 2015 | 2014 | |||||||
Operations | |||||||||||
Total revenues and other income (loss) | $ | 2,756 | $ | 4,033 | $ | 9,536 | $ | 11,946 | |||
Earnings (loss) from discontinued operations before income taxes | $ | 1,060 | $ | 666 | $ | 202 | $ | 2,061 | |||
Benefit (provision) for income taxes | (420) | 40 | 30 | (11) | |||||||
Earnings (loss) from discontinued operations, net of taxes | $ | 640 | $ | 706 | $ | 232 | $ | 2,050 | |||
Disposal | |||||||||||
Gain (loss) on disposal before income taxes | $ | (2,616) | $ | - | $ | (9,652) | $ | 14 | |||
Benefit (provision) for income taxes | 1,629 | - | (916) | 1 | |||||||
Gain (loss) on disposal, net of taxes | $ | (987) | $ | - | $ | (10,568) | $ | 15 | |||
Earnings (loss) from discontinued operations, net of taxes(a) | $ | (347) | $ | 706 | $ | (10,336) | $ | 2,065 | |||
| (a) | The sum of GE industrial earnings (loss) from discontinued operations, net of taxes, and GECC earnings (loss) from discontinued operations, net of taxes, is reported as GE industrial earnings (loss) from discontinued operations, net of taxes, on the Consolidated Statement of Earnings (Loss). |
2015 3Q FORM 10-Q PAGE 67
(In millions) | September 30, 2015 | December 31, 2014 | |||||||||
Assets | |||||||||||
Cash and equivalents | $ | 11,226 | $ | 5,414 | |||||||
Investment securities | 8,179 | 10,006 | |||||||||
Financing receivables – net | 11,622 | 114,561 | |||||||||
Other receivables | 1,479 | 2,192 | |||||||||
Property, plant and equipment – net | 12,084 | 18,051 | |||||||||
Goodwill | 9,867 | 13,569 | |||||||||
Other intangible assets - net | 44 | 301 | |||||||||
Deferred income taxes | 2,389 | 2,920 | |||||||||
Financing receivables held for sale | 65,390 | 3,116 | |||||||||
Valuation allowance on disposal group classified as discontinued operations | (7,650) | - | |||||||||
Other | 7,320 | 16,804 | |||||||||
Assets of discontinued operations | $ | 121,949 | $ | 186,934 | |||||||
Liabilities | |||||||||||
Short-term borrowings | $ | 820 | $ | 1,125 | |||||||
Accounts payable | 3,884 | 3,770 | |||||||||
Other GE current liabilities | 27 | 28 | |||||||||
Non-recourse borrowings | 8,072 | 10,569 | |||||||||
Bank deposits | 18,348 | 18,998 | |||||||||
Long-term borrowings | 316 | 1,182 | |||||||||
All other liabilities | 9,695 | 7,720 | |||||||||
Deferred income taxes | 2,607 | 5,402 | |||||||||
Liabilities of discontinued operations | $ | 43,768 | $ | 48,794 | |||||||
COMMERCIAL LENDING AND LEASING
In connection with the GE Capital Exit Plan, we announced the planned disposition of most of our CLL business and classified this portion of the business as discontinued operations. We closed certain of our CLL business dispositions for proceeds of $21,215 million for the three and nine months ended September 30, 2015. We expect to dispose of substantially all of the remaining CLL business in 2015 and 2016.
FINANCIAL INFORMATION FOR COMMERCIAL LENDING AND LEASING | |||||||||||
Three months ended September 30 | Nine months ended September 30 | ||||||||||
(In millions) | 2015 | 2014 | 2015 | 2014 | |||||||
Operations | |||||||||||
Total revenues and other income (loss) | $ | 2,691 | $ | 3,370 | $ | 8,664 | $ | 9,998 | |||
Interest | $ | (576) | $ | (762) | $ | (1,919) | $ | (2,324) | |||
Operating and administrative | (900) | (942) | (2,905) | (2,732) | |||||||
Depreciation and amortization | - | (988) | (1,768) | (2,923) | |||||||
Provision for losses on financing receivables | 13 | (87) | (1,744) | (294) | |||||||
Earnings (loss) from discontinued operations, before income taxes | 1,228 | 591 | 328 | 1,725 | |||||||
Benefit (provision) for income taxes | (484) | (108) | (169) | (326) | |||||||
Earnings (loss) from discontinued operations, net of taxes | $ | 744 | $ | 483 | $ | 159 | $ | 1,399 | |||
Disposal | |||||||||||
Gain (loss) on disposal before income taxes | $ | (2,834) | $ | - | $ | (8,059) | $ | - | |||
Benefit (provision) for income taxes | 1,629 | - | (298) | - | |||||||
Gain (loss) on disposal, net of taxes | $ | (1,205) | $ | - | $ | (8,357) | $ | - | |||
Earnings (loss) from discontinued operations, net of taxes(a) | $ | (461) | $ | 483 | $ | (8,198) | $ | 1,399 | |||
| (a) | Earnings (loss) from discontinued operations attributable to the Company, before income taxes, was $(1,608) million and $589 million for the three months ended September 30, 2015 and 2014, respectively, and $(7,736) million and $1,710 million for the nine months ended September 30, 2015 and 2014, respectively. |
2015 3Q FORM 10-Q PAGE 68
REAL ESTATE
In connection with the GE Capital Exit Plan, we announced the planned disposition of our Real Estate business and classified the business as discontinued operations. We closed certain of our Real Estate business dispositions for proceeds of $12,991 million and $30,508 million for the three and nine months ended September 30, 2015, respectively. We expect to dispose of substantially all of the remaining Real Estate business by the end of 2015.
FINANCIAL INFORMATION FOR REAL ESTATE | |||||||||||
Three months ended September 30 | Nine months ended September 30 | ||||||||||
(In millions) | 2015 | 2014 | 2015 | 2014 | |||||||
Operations | |||||||||||
Total revenues and other income (loss) | $ | 81 | $ | 698 | $ | 893 | $ | 1,992 | |||
Interest | $ | (64) | $ | (270) | $ | (437) | $ | (817) | |||
Operating and administrative | (156) | (213) | (464) | (563) | |||||||
Depreciation and amortization | - | (82) | (62) | (252) | |||||||
Provision for losses on financing receivables | - | (12) | 4 | 92 | |||||||
Earnings (loss) from discontinued operations, | |||||||||||
before income taxes | (139) | 121 | (65) | 452 | |||||||
Benefit (provision) for income taxes | 53 | 55 | 95 | 251 | |||||||
Earnings (loss) from discontinued operations, net of taxes | $ | (86) | $ | 176 | $ | 30 | $ | 703 | |||
Disposal | |||||||||||
Gain (loss) on disposal before income taxes | $ | 218 | $ | - | $ | (1,593) | $ | - | |||
Benefit (provision) for income taxes | - | - | (618) | - | |||||||
Gain (loss) on disposal, net of taxes | $ | 218 | $ | - | $ | (2,211) | $ | - | |||
Earnings (loss) from discontinued operations, net of taxes(a) | $ | 132 | $ | 176 | $ | (2,181) | $ | 703 | |||
(a) | Earnings (loss) from discontinued operations attributable to the Company, before income taxes, was $81 million and $120 million for the three months ended September 30, 2015 and 2014, respectively, and $(1,658) million and $452 million for the nine months ended September 30, 2015 and 2014, respectively. |
2015 3Q FORM 10-Q PAGE 69
|
|
WMC
During the fourth quarter of 2007, we completed the sale of WMC, our U.S. mortgage business. WMC substantially discontinued all new loan originations by the second quarter of 2007, and is not a loan servicer. In connection with the sale, WMC retained certain representation and warranty obligations related to loans sold to third parties prior to the disposal of the business and contractual obligations to repurchase previously sold loans that had an early payment default. All claims received by WMC for early payment default have either been resolved or are no longer being pursued.
The remaining active claims have been brought by securitization trustees or administrators seeking recovery from WMC for alleged breaches of representations and warranties on mortgage loans that serve as collateral for residential mortgage-backed securities (RMBS). At September 30, 2015, such claims consisted of $3,468 million of individual claims generally submitted before the filing of a lawsuit (compared to $3,694 million at December 31, 2014) and $8,411 million of additional claims asserted against WMC in litigation without making a prior claim (Litigation Claims) (compared to $9,225 million at December 31, 2014). The total amount of these claims, $11,879 million, reflects the purchase price or unpaid principal balances of the loans at the time of purchase and does not give effect to pay downs or potential recoveries based upon the underlying collateral, which in many cases are substantial, nor to accrued interest or fees. As of September 30, 2015, these amounts do not include approximately $426 million of repurchase claims relating to alleged breaches of representations that are not in litigation and that are beyond the applicable statute of limitations. WMC believes that repurchase claims brought based upon representations and warranties made more than six years before WMC was notified of the claim would be disallowed in legal proceedings under applicable law and the June 11, 2015 decision of the New York Court of Appeals in ACE Securities Corp. v. DB Structured Products, Inc., on the statute of limitations period governing such claims.
Reserves related to repurchase claims made against WMC were $832 million at September 30, 2015, reflecting a net increase to reserves in the three months ended September 30, 2015 of $7 million due to incremental provisions net of settlements. The reserve estimate takes into account recent settlement activity and is based upon WMC's evaluation of the remaining exposures as a percentage of estimated lifetime mortgage loan losses within the pool of loans supporting each securitization for which timely claims have been asserted in litigation against WMC. Settlements in prior periods reduced WMC's exposure on claims asserted in certain securitizations and the claim amounts reported above give effect to these settlements .
ROLLFORWARD OF THE RESERVE | |||||||||||
Three months ended September 30 | Nine months ended September 30 | ||||||||||
(In millions) | 2015 | 2014 | 2015 | 2014 | |||||||
Balance, beginning of period | $ | 825 | $ | 549 | $ | 809 | $ | 800 | |||
Provision | 28 | 40 | 46 | 142 | |||||||
Claim resolutions / rescissions | (21) | (1) | (23) | (354) | |||||||
Balance, end of period | $ | 832 | $ | 588 | $ | 832 | $ | 588 | |||
Given the significant litigation activity and WMC's continuing efforts to resolve the lawsuits involving claims made against WMC, it is difficult to assess whether future losses will be consistent with WMC's past experience. Adverse changes to WMC's assumptions supporting the reserve may result in an increase to these reserves. WMC estimates a range of reasonably possible loss from $0 to approximately $500 million over its recorded reserve at September 30, 2015. This estimate involves significant judgment and may not reflect the range of uncertainties and unpredictable outcomes inherent in litigation, including WMC litigation discussed in Legal Proceedings and potential changes in WMC's legal strategy. This estimate excludes any possible loss associated with an adverse court decision on the applicable statute of limitations, as WMC is unable at this time to develop such a meaningful estimate.
At September 30, 2015, there were 15 lawsuits involving claims made against WMC arising from alleged breaches of representations and warranties on mortgage loans included in 14 securitizations. WMC reached a settlement in principle on one of these lawsuits in the third quarter, and the settlement became effective October 20, 2015. The adverse parties in these cases are securitization trustees or parties claiming to act on their behalf. Although the alleged claims for relief vary from case to case, the complaints and counterclaims in these actions generally assert claims for breach of contract, indemnification, and/or declaratory judgment, and seek specific performance (repurchase of defective mortgage loan) and/or money damages. Adverse court decisions, including in cases not involving WMC, could result in new claims and lawsuits on additional loans. However, WMC continues to believe that it has defenses to the claims asserted in litigation, including, for example, based on causation and materiality requirements and applicable statutes of limitations. It is not possible to predict the outcome or impact of these defenses and other factors, any of which could materially affect the amount of any loss ultimately incurred by WMC on these claims.
2015 3Q FORM 10-Q PAGE 70
WMC has also received indemnification demands, nearly all of which are unspecified, from depositors/underwriters/sponsors of RMBS in connection with lawsuits brought by RMBS investors concerning alleged misrepresentations in the securitization offering documents to which WMC is not a party or, in two cases, involving mortgage loan repurchase claims made against RMBS sponsors. WMC believes that it has defenses to these demands.
To the extent WMC is required to repurchase loans, WMC's loss also would be affected by several factors, including pay downs, accrued interest and fees, and the value of the underlying collateral. The reserve and estimate of possible loss reflect judgment, based on currently available information, and a number of assumptions, including economic conditions, claim and settlement activity, pending and threatened litigation, court decisions regarding WMC's legal defenses, indemnification demands, government activity, and other variables in the mortgage industry. Actual losses arising from claims against WMC could exceed these amounts and additional claims and lawsuits could result if actual claim rates, governmental actions, litigation and indemnification activity, adverse court decisions, actual settlement rates or losses WMC incurs on repurchased loans differ from its assumptions .
FINANCIAL INFORMATION FOR WMC | |||||||||||
Three months ended September 30 | Nine months ended September 30 | ||||||||||
(In millions) | 2015 | 2014 | 2015 | 2014 | |||||||
Total revenues and other income (loss) | $ | (22) | $ | (34) | $ | (26) | $ | (70) | |||
Earnings (loss) from discontinued operations, net of taxes | $ | (21) | $ | (25) | $ | (37) | $ | (57) | |||
2015 3Q FORM 10-Q PAGE 71
NOTE 3. INVESTMENT SECURITIES
Substantially all of our investment securities are classified as available-for-sale. These comprise mainly investment-grade debt securities supporting obligations to annuitants and policyholders in our run-off insurance operations. We do not have any securities classified as held-to-maturity.
September 30, 2015 | December 31, 2014 | ||||||||||||||||||||||
Gross | Gross | Gross | Gross | ||||||||||||||||||||
Amortized | unrealized | unrealized | Estimated | Amortized | unrealized | unrealized | Estimated | ||||||||||||||||
(In millions) | cost | gains | losses | fair value | cost | gains | losses | fair value | |||||||||||||||
GE | |||||||||||||||||||||||
Debt | |||||||||||||||||||||||
U.S. corporate | $ | 3 | $ | - | $ | - | $ | 3 | $ | 12 | $ | - | $ | - | $ | 12 | |||||||
Corporate – non-U.S. | 1 | - | - | 1 | 1 | - | - | 1 | |||||||||||||||
Equity | |||||||||||||||||||||||
Available-for-sale | 95 | 14 | (46) | 64 | 69 | 4 | (2) | 71 | |||||||||||||||
Trading | - | - | - | - | - | - | - | - | |||||||||||||||
99 | 14 | (46) | 68 | 82 | 4 | (2) | 84 | ||||||||||||||||
GECC | |||||||||||||||||||||||
Debt | |||||||||||||||||||||||
U.S. corporate | 19,975 | 3,102 | (178) | 22,899 | 19,810 | 3,962 | (69) | 23,703 | |||||||||||||||
State and municipal | 3,972 | 439 | (71) | 4,340 | 4,173 | 555 | (53) | 4,675 | |||||||||||||||
Residential mortgage-backed(a) | 905 | 84 | (5) | 984 | 1,544 | 153 | (5) | 1,692 | |||||||||||||||
Commercial mortgage-backed | 2,295 | 121 | (12) | 2,405 | 2,903 | 170 | (10) | 3,063 | |||||||||||||||
Asset-backed | 107 | 1 | (10) | 97 | 304 | 8 | (17) | 295 | |||||||||||||||
Corporate – non-U.S. | 769 | 101 | (3) | 867 | 908 | 109 | (1) | 1,016 | |||||||||||||||
Government – non-U.S. | 1,094 | 158 | (1) | 1,252 | 1,560 | 152 | (2) | 1,710 | |||||||||||||||
U.S. government and federal | |||||||||||||||||||||||
agency | 3,783 | 99 | - | 3,882 | 1,957 | 56 | - | 2,013 | |||||||||||||||
Equity | |||||||||||||||||||||||
Available-for-sale | 113 | 16 | (4) | 125 | 109 | 24 | (1) | 132 | |||||||||||||||
Trading | 19 | - | - | 19 | 21 | - | - | 21 | |||||||||||||||
33,032 | 4,121 | (285) | 36,868 | 33,289 | 5,189 | (158) | 38,320 | ||||||||||||||||
Eliminations | (4) | - | - | (4) | (4) | - | - | (4) | |||||||||||||||
Total | $ | 33,128 | $ | 4,136 | $ | (331) | $ | 36,933 | $ | 33,367 | $ | 5,193 | $ | (160) | $ | 38,400 | |||||||
| (a) | Substantially collateralized by U.S. mortgages. At September 30, 2015, $961 million related to securities issued by government-sponsored entities and $23 million related to securities of private-label issuers. Securities issued by private-label issuers are collateralized primarily by pools of individual direct mortgage loans of financial institutions. |
The fair value of investment securities decreased to $36,933 million at September 30, 2015, from $38,400 million at December 31, 2014, primarily due to a decline in unrealized gains resulting from higher interest rates, and net sales at Trinity, primarily related to mortgage-backed securities, partially offset by net purchases of U.S. government and federal agency securities at Synchrony Financial.
2015 3Q FORM 10-Q PAGE 72
ESTIMATED FAIR VALUE AND GROSS UNREALIZED LOSSES OF AVAILABLE-FOR-SALE INVESTMENT SECURITIES | ||||||||||||
In loss position for | ||||||||||||
Less than 12 months | 12 months or more | |||||||||||
Gross | Gross | |||||||||||
Estimated | unrealized | Estimated | unrealized | |||||||||
(In millions) | fair value(a) | losses(a)(b) | fair value | losses(b) | ||||||||
September 30, 2015 | ||||||||||||
Debt | ||||||||||||
U.S. corporate | $ | 2,161 | $ | (130) | $ | 335 | $ | (48) | ||||
State and municipal | 544 | (16) | 155 | (55) | ||||||||
Residential mortgage-backed | 175 | (2) | 77 | (3) | ||||||||
Commercial mortgage-backed | 351 | (8) | 26 | (4) | ||||||||
Asset-backed | - | - | 48 | (10) | ||||||||
Corporate – non-U.S. | 41 | (3) | 3 | - | ||||||||
Government – non-U.S. | 292 | (1) | - | - | ||||||||
U.S. government and federal agency | 450 | - | 1 | - | ||||||||
Equity | 75 | (50) | - | - | ||||||||
Total | $ | 4,089 | $ | (210) | $ | 645 | $ | (121) | (c) | |||
December 31, 2014 | ||||||||||||
Debt | ||||||||||||
U.S. corporate | $ | 554 | $ | (16) | $ | 836 | $ | (53) | ||||
State and municipal | 67 | (1) | 308 | (52) | ||||||||
Residential mortgage-backed | 30 | - | 146 | (5) | ||||||||
Commercial mortgage-backed | 165 | (1) | 204 | (9) | ||||||||
Asset-backed | 9 | - | 42 | (17) | ||||||||
Corporate – non-U.S. | 42 | (1) | 3 | - | ||||||||
Government – non-U.S. | 677 | (2) | 14 | - | ||||||||
U.S. government and federal agency | 705 | - | 1 | - | ||||||||
Equity | 10 | (3) | - | - | ||||||||
Total | $ | 2,259 | $ | (24) | $ | 1,554 | $ | (136) | ||||
| (a) | Includes the estimated fair value of and gross unrealized losses on equity securities held by GE. At September 30, 2015, the estimated fair value of and gross unrealized losses on equity securities were $37 million and $(46) million, respectively. At December 31, 2014, the estimated fair value of and gross unrealized losses on equity securities were $4 million and $(2) million, respectively. |
| (b) | Included gross unrealized losses of $27 million related to securities that had other-than-temporary impairments previously recognized at September 30, 2015. |
| (c) | Includes debt securities held to support obligations to holders of GICs all of which are considered to be investment-grade by the major rating agencies at September 30, 2015. |
We regularly review investment securities for other-than-temporary impairment (OTTI) using both qualitative and quantitative criteria. For debt securities, our qualitative review considers our ability and intent to hold the security and the financial condition of and near-term prospects for the issuer, including whether the issuer is in compliance with the terms and covenants of the security. Our quantitative review considers whether there has been an adverse change in expected future cash flows. Unrealized losses are not indicative of the amount of credit loss that would be recognized and at September 30, 2015 are primarily due to increases in market yields subsequent to our purchase of the securities. We presently do not intend to sell the vast majority of our debt securities that are in an unrealized loss position and believe that it is not more likely than not that we will be required to sell the vast majority of these securities before anticipated recovery of our amortized cost. The methodologies and significant inputs used to measure the amount of credit loss for our investment securities during 2015 have not changed. For equity securities, we consider the duration and the severity of the unrealized loss. We believe that the unrealized loss associated with our equity securities will be recovered within the foreseeable future.
Our corporate debt portfolio comprises securities issued by public and private corporations in various industries, primarily in the U.S. Substantially all of our corporate debt securities are rated investment grade by the major rating agencies.
2015 3Q FORM 10-Q PAGE 73
Our RMBS portfolio is collateralized primarily by pools of individual, direct mortgage loans, of which substantially all are in a senior position in the capital structure of the deals, not other structured products such as collateralized debt obligations. Of the total RMBS held at September 30, 2015, $961 million and $23 million related to agency and non-agency securities, respectively. Additionally, $58 million was related to residential subprime credit securities, primarily supporting obligations to annuitants and policyholders in our run-off insurance operations. Substantially all of the subprime exposure is related to securities backed by mortgage loans originated in 2005 and prior and are investment grade.
Our commercial mortgage-backed securities (CMBS) portfolio is collateralized by both diversified pools of mortgages that were originated for securitization (conduit CMBS) and pools of large loans backed by high-quality properties (large loan CMBS), about half of which were originated in 2008 and prior. The vast majority of the securities in our CMBS portfolio have investment-grade credit ratings.
PRE-TAX, OTHER-THAN-TEMPORARY IMPAIRMENTS ON INVESTMENT SECURITIES | |||||||||||
Three months ended September 30 | Nine months ended September 30 | ||||||||||
(In millions) | 2015 | 2014 | 2015 | 2014 | |||||||
Total pre-tax, OTTI recognized | $ | 2 | $ | 2 | $ | 34 | $ | 18 | |||
Pre-tax, OTTI recognized in AOCI | - | - | - | (4) | |||||||
Pre-tax, OTTI recognized in earnings(a) | $ | 2 | $ | 2 | $ | 34 | $ | 14 | |||
| (a) | Included pre-tax, other-than-temporary impairments recorded in earnings related to equity securities of $1 million and none in the three months ended September 30, 2015 and 2014, respectively and $1 million and $2 million in the nine months ended September 30, 2015 and 2014, respectively. |
CHANGES IN CUMULATIVE CREDIT LOSS IMPAIRMENTS RECOGNIZED ON DEBT SECURITIES STILL HELD | |||||||||||
Three months ended September 30 | Nine months ended September 30 | ||||||||||
(In millions) | 2015 | 2014 | 2015 | 2014 | |||||||
Cumulative credit loss impairments recognized, beginning of period | $ | 187 | $ | 423 | $ | 176 | $ | 474 | |||
Credit loss impairments recognized on securities not previously impaired | - | - | 14 | - | |||||||
Incremental credit loss impairments recognized | |||||||||||
on securities previously impaired | - | 2 | - | 4 | |||||||
Less credit loss impairments previously recognized on securities sold | |||||||||||
during the period or that we intend to sell | - | - | 2 | 53 | |||||||
Cumulative credit loss impairments recognized, end of period | $ | 187 | $ | 425 | $ | 188 | $ | 425 | |||
2015 3Q FORM 10-Q PAGE 74
CONTRACTUAL MATURITIES OF INVESTMENT IN AVAILABLE-FOR-SALE DEBT SECURITIES | |||||
(EXCLUDING MORTGAGE-BACKED AND ASSET-BACKED SECURITIES) | |||||
Amortized | Estimated | ||||
(In millions) | cost | fair value | |||
Due | |||||
Within one year | $ | 2,166 | $ | 2,175 | |
After one year through five years | 4,656 | 4,868 | |||
After five years through ten years | 4,854 | 5,217 | |||
After ten years | 17,921 | 20,983 | |||
We expect actual maturities to differ from contractual maturities because borrowers have the right to call or prepay certain obligations.
GROSS REALIZED GAINS AND LOSSES ON AVAILABLE-FOR-SALE INVESTMENT SECURITIES | |||||||||||
Three months ended September 30 | Nine months ended September 30 | ||||||||||
(In millions) | 2015 | 2014 | 2015 | 2014 | |||||||
GE | |||||||||||
Gains | $ | 3 | $ | - | $ | 4 | $ | 2 | |||
Losses, including impairments | - | - | (14) | - | |||||||
Net | 3 | - | (10) | 2 | |||||||
GECC | |||||||||||
Gains | 21 | 1 | 122 | 37 | |||||||
Losses, including impairments | (6) | (5) | (41) | (18) | |||||||
Net | 15 | (4) | 81 | 19 | |||||||
Total | $ | 18 | $ | (4) | $ | 71 | $ | 21 | |||
Although we generally do not have the intent to sell any specific securities at the end of the period, in the ordinary course of managing our investment securities portfolio, we may sell securities prior to their maturities for a variety of reasons, including diversification, credit quality, yield and liquidity requirements and the funding of claims and obligations to policyholders. In some of our bank subsidiaries, we maintain a certain level of purchases and sales volume principally of non-U.S. government debt securities. In these situations, fair value approximates carrying value for these securities.
Proceeds from investment securities sales and early redemptions by issuers totaled $6,030 million and $624 million in the three months ended September 30, 2015 and 2014, respectively, principally from sales of U.S. government and federal agency securities in Trinity and Synchrony Financial and short-term government securities in our bank subsidiaries.
Proceeds from investment securities sales and early redemptions by issuers totaled $9,330 million and $2,000 million in the nine months ended September 30, 2015 and 2014, respectively, principally from sales of short-term government securities in our bank subsidiaries and sales of U.S. corporate and CMBS securities in our run-off insurance operations. In addition, proceeds from investment securities sales in the nine months ended September 30, 2015 included $6,486 million principally from sales of U.S. government and federal agency securities, CMBS and RMBS at Trinity and Synchrony Financial.
2015 3Q FORM 10-Q PAGE 75
NOTE 4. INVENTORIES
(In millions) | September 30, 2015 | December 31, 2014 | |||
GE | |||||
Raw materials and work in process | $ | 10,625 | $ | 9,820 | |
Finished goods | 7,862 | 7,126 | |||
Unbilled shipments | 708 | 755 | |||
19,195 | 17,701 | ||||
Revaluation to LIFO | 30 | (62) | |||
Total GE | 19,225 | 17,639 | |||
GECC | |||||
Finished goods | 59 | 50 | |||
Total consolidated | $ | 19,285 | $ | 17,689 | |
NOTE 5. GECC FINANCING RECEIVABLES AND ALLOWANCE FOR LOSSES
The implementation of the GE Capital Exit Plan has caused significant reductions in our Consumer portfolio, as all of our non-U.S. consumer financing receivables have been reclassified to either financing receivables held for sale or assets of businesses held for sale. The transfer of financing receivables to financing receivables held for sale and assets of businesses held for sale totaled $29,016 million and $5,508 million in the nine months ended September 30, 2015, respectively. In addition, our Real Estate business and most of our CLL business have been classified as discontinued operations.
FINANCING RECEIVABLES, NET | |||||
(In millions) | September 30, 2015 | December 31, 2014 | |||
Loans, net of deferred income | $ | 82,196 | $ | 120,007 | |
Investment in financing leases, net of deferred income | 5,008 | 6,554 | |||
87,204 | 126,561 | ||||
Allowance for losses | (3,457) | (4,104) | |||
Financing receivables – net | $ | 83,748 | $ | 122,457 | |
FINANCING RECEIVABLES BY PORTFOLIO AND ALLOWANCE FOR LOSSES
FINANCING RECEIVABLES | ||||||
(In millions) | September 30, 2015 | December 31, 2014 | ||||
Commercial | ||||||
CLL | $ | 13,341 | (a) | $ | 14,418 | |
Energy Financial Services | 2,443 | 2,580 | ||||
GE Capital Aviation Services (GECAS) | 7,394 | 8,263 | ||||
Other | 506 | 480 | ||||
Total Commercial | 23,684 | 25,741 | ||||
Consumer | 63,520 | (b) | 100,820 | |||
Total financing receivables | 87,204 | 126,561 | ||||
Allowance for losses | (3,457) | (b) | (4,104) | |||
Total financing receivables – net | $ | 83,748 | $ | 122,457 | ||
(a) | Includes Healthcare Equipment Finance and Working Capital Solutions, which purchases GE customer receivables. |
(b) | Includes Synchrony Financial, our U.S. consumer business. |
2015 3Q FORM 10-Q PAGE 76
ALLOWANCE FOR LOSSES | ||||||||||||||||||
Provision | ||||||||||||||||||
Balance at | charged to | Gross | Balance at | |||||||||||||||
(In millions) | January 1 | operations(a) | Other | (b) | write-offs | (a)(c) | Recoveries | (c) | September 30 | |||||||||
2015 | ||||||||||||||||||
Commercial | ||||||||||||||||||
CLL | $ | 21 | $ | 20 | $ | - | $ | (15) | $ | 6 | $ | 32 | ||||||
Energy Financial Services | 26 | 16 | - | (29) | 1 | 14 | ||||||||||||
GECAS | 46 | (11) | - | (1) | 3 | 37 | ||||||||||||
Other | - | 15 | - | (13) | - | 2 | ||||||||||||
Total Commercial | 93 | 40 | - | (58) | 10 | 85 | ||||||||||||
Consumer | 4,011 | 4,596 | (252) | (5,622) | 639 | 3,372 | ||||||||||||
Total | $ | 4,104 | $ | 4,636 | $ | (252) | $ | (5,680) | $ | 649 | $ | 3,457 | ||||||
2014 | ||||||||||||||||||
Commercial | ||||||||||||||||||
CLL | $ | 17 | $ | 8 | $ | (1) | $ | (11) | $ | 7 | $ | 20 | ||||||
Energy Financial Services | 8 | 13 | - | (17) | 2 | 6 | ||||||||||||
GECAS | 17 | 9 | - | (11) | - | 15 | ||||||||||||
Other | 2 | - | (2) | - | - | - | ||||||||||||
Total Commercial | 44 | 30 | (3) | (39) | 9 | 41 | ||||||||||||
Consumer | 3,981 | 2,663 | (120) | (3,203) | 869 | 4,190 | ||||||||||||
Total | $ | 4,025 | $ | 2,693 | $ | (123) | $ | (3,242) | $ | 878 | $ | 4,231 | ||||||
(a) | Provision charged to operations included $2,405 million and gross write-offs included $2,859 million related to the effects of the 2015 reclassification of non-U.S. consumer financing receivables to financing receivables held for sale recorded at the lower of cost or fair value, less cost to sell. |
(b) | Other primarily includes the reclassification of financing receivables to assets of businesses held for sale and the effects of currency exchange. |
(c) | Net write-offs (gross write-offs less recoveries) in certain portfolios may exceed the beginning allowance for losses as a result of losses that are incurred subsequent to the beginning of the fiscal year due to information becoming available during the current year, which may identify further deterioration on existing financing receivables. |
NOTE 6. PROPERTY, PLANT AND EQUIPMENT
(In millions) | September 30, 2015 | December 31, 2014 | |||||||||
Original cost | $ | 87,332 | $ | 84,070 | |||||||
Less accumulated depreciation and amortization | (36,628) | (35,734) | |||||||||
Property, plant and equipment – net | $ | 50,704 | $ | 48,336 | |||||||
Consolidated depreciation and amortization on property, plant and equipment was $1,278 million and $1,424 million in the three months ended September 30, 2015 and 2014, respectively, and $3,603 million and $3,820 million in the nine months ended September 30, 2015 and 2014, respectively.
2015 3Q FORM 10-Q PAGE 77
NOTE 7. ACQUISITIONS, GOODWILL AND OTHER INTANGIBLE ASSETS
ACQUISITIONS
Upon closing an acquisition, we estimate the fair values of assets and liabilities acquired and consolidate the acquisition as quickly as possible. Given the time it takes to obtain pertinent information to finalize the acquired company's balance sheet, then to adjust the acquired company's accounting policies, procedures, and books and records to our standards, it is often several quarters before we are able to finalize those initial fair value estimates. Accordingly, it is not uncommon for our initial estimates to be subsequently revised.
On January 30, 2015, we acquired Milestone Aviation Group (Milestone Aviation), a helicopter leasing business, for approximately $1,750 million, which is included in our GE Capital segment. The preliminary purchase price allocation resulted in goodwill of approximately $730 million and amortizable intangible assets of approximately $345 million. The allocation of the purchase price will be finalized upon completion of post-closing procedures.
During the second quarter of 2014, GE's offer to acquire the Thermal, Renewables and Grid businesses of Alstom for approximately €12,350 million (to be adjusted for the assumed net cash or liability at closing) was positively recommended by Alstom's board of directors. As part of the transaction, Alstom and the French Government signed a memorandum of understanding for the formation of three joint ventures in grid technology, renewable energy, and global nuclear and French steam power. Alstom will invest approximately €2,400 million in these joint ventures at the closing of the proposed transaction.
In the fourth quarter of 2014, Alstom completed its review of the proposed transaction with the works council and obtained approval from its shareholders. Also in the fourth quarter of 2014, GE and Alstom entered into an amendment to the original agreement where GE has agreed to pay Alstom a net amount of approximately €260 million of additional consideration at closing. In exchange for this funding, Alstom has agreed to extend the trademark licensing of the Alstom name from 5 years to 25 years as well as other contractual amendments.
In the second quarter of 2015, the European Commission indicated that it had competition concerns with the proposed transaction. In response, GE proposed remedies to address the concerns of the Commission and the U.S. Department of Justice while preserving the strategic and economic rationale of the proposed transaction. On September 8, 2015, the European Commission and the Department of Justice accepted GE's proposal and approved the transaction. In order to obtain approval, GE has pledged to sell certain of Alstom's gas-turbine assets and its Power Systems Mfg. subsidiary to Ansaldo Energia SpA after the close of the transaction for approximately €120 million. As a result of final negotiations, Alstom has agreed to contribute financially to the remedies through a €300 million reduction in the purchase price of the transaction. Further, GE and Alstom agreed to other purchase price amendments that resulted in a net increase of consideration of approximately €45 million and a reduction in the trademark licensing period of the Alstom name to five years. The transaction is targeted to close in November 2015.
The acquisition and alliances with Alstom will impact our Power & Water and Energy Management segments. The impact of acquired businesses on individual segments will be affected by a number of variables, including operating performance, purchase accounting impacts and expected synergies. In addition, due to the amount of time between signing and closing, the operations of the businesses may fluctuate and impact the overall valuation of the acquired businesses at the time of close and, accordingly, may affect the amounts assigned to the assets and liabilities recorded in accordance with purchase accounting.
2015 3Q FORM 10-Q PAGE 78
GOODWILL
CHANGES IN GOODWILL BALANCES | |||||||||||
Dispositions, | |||||||||||
currency | |||||||||||
Balance at | exchange | Balance at | |||||||||
(In millions) | January 1, 2015 | Acquisitions | and other | September 30, 2015 | |||||||
Power & Water | $ | 8,754 | $ | 31 | $ | (136) | $ | 8,649 | |||
Oil & Gas | 10,572 | - | (322) | 10,250 | |||||||
Energy Management | 4,570 | - | (477) | 4,093 | |||||||
Aviation | 8,952 | - | (297) | 8,655 | |||||||
Healthcare | 17,532 | 8 | (86) | 17,454 | |||||||
Transportation | 887 | - | (39) | 848 | |||||||
Appliances & Lighting | 226 | - | (9) | 217 | |||||||
GE Capital | 11,456 | 729 | (725) | 11,460 | |||||||
Corporate | 34 | - | 1 | 35 | |||||||
Total | $ | 62,983 | $ | 768 | $ | (2,090) | $ | 61,660 | |||
Goodwill balances decreased by $1,323 million in the nine months ended September 30, 2015, primarily as a result of the currency exchange effects of the stronger U.S dollar, the reclassification of goodwill associated with ANZ Consumer Lending to assets of businesses held for sale and business dispositions, partially offset by the acquisition of Milestone Aviation.
We test goodwill for impairment annually in the third quarter of each year using data as of July 1 of that year. The impairment test consists of two steps: in step one, the carrying value of the reporting unit is compared with its fair value; in step two, which is applied when the carrying value is more than its fair value, the amount of goodwill impairment, if any, is derived by deducting the fair value of the reporting unit's assets and liabilities from the fair value of its equity, and comparing that amount with the carrying amount of goodwill. We determined fair values for each of the reporting units using the market approach, when available and appropriate, or the income approach, or a combination of both. We assess the valuation methodology based upon the relevance and availability of the data at the time we perform the valuation. If multiple valuation methodologies are used, the results are weighted appropriately.
Valuations using the market approach are derived from metrics of publicly traded companies or historically completed transactions of comparable businesses. The selection of comparable businesses is based on the markets in which the reporting units operate giving consideration to risk profiles, size, geography, and diversity of products and services. A market approach is limited to reporting units for which there are publicly traded companies that have the characteristics similar to our businesses.
Under the income approach, fair value is determined based on the present value of estimated future cash flows, discounted at an appropriate risk-adjusted rate. We use our internal forecasts to estimate future cash flows and include an estimate of long-term future growth rates based on our most recent views of the long-term outlook for each business. Actual results may differ from those assumed in our forecasts. We derive our discount rates using a capital asset pricing model and analyzing published rates for industries relevant to our reporting units to estimate the cost of equity financing. We use discount rates that are commensurate with the risks and uncertainty inherent in the respective businesses and in our internally developed forecasts. Discount rates used in our reporting unit valuations ranged from 10.0% to 15.5%.
During the third quarter of 2015, we performed our annual impairment test of goodwill for all of our reporting units. Based on the results of our step one testing, the fair values of each of the GE reporting units exceeded their carrying values; therefore, the second step of the impairment test was not required to be performed for any of our reporting units and no goodwill impairment was recognized.
2015 3Q FORM 10-Q PAGE 79
While all of our reporting units passed step one of our annual impairment testing in 2015, we identified one reporting unit for which the fair value was not substantially in excess of its carrying value. Primarily due to the sharp decline experienced in oil and gas prices and the prospect of a continuation of prevailing oil and gas prices, the fair value of our Energy Financial Services reporting unit, within our GE Capital operating segment, has been impacted and is in excess of its carrying value by approximately 13%. The goodwill associated with our Energy Financial Services reporting unit was $1,386 million at September 30, 2015, representing approximately 2% of our total goodwill. Our Oil & Gas business has also experienced declines in orders, project commencement delays and pricing pressures, which affect the fair value of our Oil & Gas reporting units. While the goodwill of these reporting units is not currently impaired, we will continue to monitor the oil and gas industry and the impact it may have on these businesses. As of September 30, 2015, we believe that the goodwill is recoverable for all of the reporting units; however, there can be no assurances that the goodwill will not be impaired in future periods.
In 2014, we identified one reporting unit for which the fair value was not substantially in excess of its carrying value. Within our Energy Management operating segment, the Power Conversion reporting unit was determined to have a fair value in excess of its carrying value by approximately 10%. In the current year, the fair value of the Power Conversion reporting unit significantly exceeded its carry value. The increase in fair value over its carry value was driven primarily by a stabilization of the business and cost cutting measures. In addition, our carry value has decreased due to currency effects of a stronger U.S. dollar.
Estimating the fair value of reporting units requires the use of estimates and significant judgments that are based on a number of factors including actual operating results. It is reasonably possible that the judgments and estimates described above could change in future periods.
OTHER INTANGIBLE ASSETS
OTHER INTANGIBLE ASSETS - NET | |||||
(In millions) | September 30, 2015 | December 31, 2014 | |||
Intangible assets subject to amortization | $ | 13,513 | $ | 13,725 | |
Indefinite-lived intangible assets(a) | 105 | 130 | |||
Total | $ | 13,618 | $ | 13,855 | |
| (a) | Indefinite-lived intangible assets principally comprise trademarks and in-process research and development. |
INTANGIBLE ASSETS SUBJECT TO AMORTIZATION | |||||||||||||||||
September 30, 2015 | December 31, 2014 | ||||||||||||||||
Gross | Gross | ||||||||||||||||
carrying | Accumulated | carrying | Accumulated | ||||||||||||||
(In millions) | amount | amortization | Net | amount | amortization | Net | |||||||||||
Customer-related | $ | 8,217 | $ | (2,426) | $ | 5,791 | $ | 8,064 | $ | (2,261) | $ | 5,803 | |||||
Patents and technology | 6,434 | (3,056) | 3,378 | 6,694 | (2,900) | 3,794 | |||||||||||
Capitalized software | 7,635 | (4,404) | 3,231 | 7,349 | (4,178) | 3,171 | |||||||||||
Trademarks | 1,126 | (272) | 854 | 1,151 | (263) | 888 | |||||||||||
Lease valuations | 107 | (16) | 92 | - | - | - | |||||||||||
Present value of future profits(a) | 643 | (643) | - | 614 | (614) | - | |||||||||||
All other | 351 | (181) | 170 | 203 | (134) | 69 | |||||||||||
Total | $ | 24,513 | $ | (10,998) | $ | 13,513 | $ | 24,075 | $ | (10,350) | $ | 13,725 | |||||
| (a) | Balances at September 30, 2015 and December 31, 2014 reflect adjustments of $272 million and $293 million, respectively, to the present value of future profits in our run-off insurance operation to reflect the effects that would have been recognized had the related unrealized investment securities holding gains and losses actually been realized. |
Intangible assets subject to amortization decreased by $212 million in the nine months ended September 30, 2015, primarily as a result of amortization and the currency exchange effects of the stronger U.S. dollar, partially offset by the acquisition of Milestone Aviation and the capitalization of new software across several business platforms.
Consolidated amortization expense was $437 million and $424 million in the three months ended September 30, 2015 and 2014, respectively, and $1,295 million and $1,205 million the nine months ended September 30, 2015 and 2014, respectively.
2015 3Q FORM 10-Q PAGE 80
NOTE 8. BORROWINGS AND BANK DEPOSITS
(In millions) | September 30, 2015 | December 31, 2014 | |||
Short-term borrowings | |||||
GE | |||||
Commercial paper | $ | 1,000 | $ | 500 | |
Payable to banks | 472 | 343 | |||
Current portion of long-term borrowings | 2,092 | 2,068 | |||
Other | 1,197 | 961 | |||
Total GE short-term borrowings | 4,761 | 3,872 | |||
GECC | |||||
Commercial paper(a) | |||||
U.S. | 9,811 | 22,019 | |||
Non-U.S. | 3,103 | 2,993 | |||
Current portion of long-term borrowings(a)(b)(c) | 29,679 | 36,995 | |||
GE Interest Plus notes(d) | - | 5,467 | |||
Other(c) | 287 | 231 | |||
Total GECC short-term borrowings | 42,880 | 67,705 | |||
Eliminations | (1,146) | (863) | |||
Total short-term borrowings | $ | 46,495 | $ | 70,714 | |
Long-term borrowings | |||||
GE | |||||
Senior notes | $ | 15,510 | $ | 11,945 | |
Payable to banks | 27 | 5 | |||
Other | 358 | 518 | |||
Total GE long-term borrowings | 15,895 | 12,468 | |||
GECC | |||||
Senior unsecured notes(a)(b)(e) | 144,935 | 162,194 | |||
Subordinated notes(a) | 4,715 | 4,804 | |||
Subordinated debentures(a)(f) | 6,782 | 7,085 | |||
Other(a)(c)(g) | 7,751 | 12,676 | |||
Total GECC long-term borrowings | 164,183 | 186,759 | |||
Eliminations | (67) | (45) | |||
Total long-term borrowings | $ | 180,011 | $ | 199,182 | |
Non-recourse borrowings of consolidated securitization entities(h) | $ | 16,225 | $ | 19,369 | |
Bank deposits(i) | $ | 48,656 | $ | 43,841 | |
Total borrowings and bank deposits | $ | 291,387 | $ | 333,106 | |
(a) | On April 10, 2015, GE announced it would provide a full and unconditional guarantee on the payment of the principal and interest on all tradable senior and subordinated outstanding long-term debt securities and all commercial paper issued or guaranteed by GECC. Short-term borrowings included $12,914 million of commercial paper and $28,373 million of the current portion of long-term borrowings. Long-term borrowings included $131,230 million of senior unsecured notes, $3,971 million of subordinated notes, $6,782 million of subordinated debentures, and $400 million of other. |
(b) | Included $431 million and $439 million of obligations to holders of GICs at September 30, 2015 and December 31, 2014, respectively. These obligations included conditions under which certain GIC holders could require immediate repayment of their investment should the long-term credit ratings of GECC fall below AA-/Aa3. The remaining outstanding GICs will continue to be subject to their scheduled maturities and individual terms, which may include provisions permitting redemption upon a downgrade of one or more of GECC's ratings, among other things. |
(c) | Included $4,969 million and $4,835 million of funding secured by real estate, aircraft and other collateral at September 30, 2015 and December 31, 2014, respectively, of which $1,216 million and $1,183 million is non-recourse to GECC at September 30, 2015 and December 31, 2014, respectively. |
(d) | Entirely variable denomination floating-rate demand notes. The GE Interest Plus program was closed effective August 31, 2015. |
(e) | Included $5,589 million and $3,594 million related to Synchrony Financial at September 30, 2015 and December 31, 2014, respectively. |
(f) | Subordinated debentures receive rating agency equity credit. |
(g) | Included $4,651 million and $8,245 million related to Synchrony Financial at September 30, 2015 and December 31, 2014, respectively. |
(h) | Included $1,934 million and $3,377 million of current portion of long-term borrowings at September 30, 2015 and December 31, 2014, respectively. See Note 16. |
(i) | Included $8,108 million and $8,905 million of deposits in non-U.S. banks at September 30, 2015 and December 31, 2014, respectively, and $15,990 million and $14,500 million of certificates of deposits with maturities greater than one year at September 30, 2015 and December 31, 2014, respectively. |
On May 28, 2015, GE issued €3,150 million senior unsecured debt, composed of €650 million of Floating Rate Notes due 2020, €1,250 million of 1.250% Notes due 2023 and €1,250 million of 1.875% Notes due 2027. On October 9, 2015, $2.0 billion of long-term debt issued by GE matured.
2015 3Q FORM 10-Q PAGE 81
NOTE 9. POSTRETIREMENT BENEFIT PLANS
We sponsor a number of pension and retiree health and life insurance benefit plans. Principal pension plans are the GE Pension Plan and the GE Supplementary Pension Plan. Principal retiree benefit plans provide health and life insurance benefits to certain eligible participants and these participants share in the cost of the healthcare benefits. Other pension plans include the U.S. and non-U.S. pension plans with pension assets or obligations greater than $50 million. Smaller pension plans and other retiree benefit plans are not material individually or in the aggregate.
EFFECT ON OPERATIONS OF PENSION PLANS | ||||||||||||
Principal pension plans | ||||||||||||
Three months ended September 30 | Nine months ended September 30 | |||||||||||
(In millions) | 2015 | 2014 | 2015 | 2014 | ||||||||
Service cost for benefits earned | $ | 348 | $ | 304 | $ | 1,076 | $ | 921 | ||||
Prior service cost amortization | 51 | 54 | 154 | 162 | ||||||||
Expected return on plan assets | (826) | (792) | (2,478) | (2,393) | ||||||||
Interest cost on benefit obligations | 696 | 687 | 2,087 | 2,060 | ||||||||
Net actuarial loss amortization | 823 | 642 | 2,468 | 1,925 | ||||||||
Curtailment loss | - | 65 | (a) | 71 | (b) | 65 | (a) | |||||
Pension plans cost | $ | 1,092 | $ | 960 | $ | 3,378 | $ | 2,740 | ||||
(a) | Curtailment loss resulting from our agreement with Electrolux to sell the GE Appliances business. |
(b) | Curtailment loss resulting from GE Capital Exit Plan. |
Other pension plans | |||||||||||
Three months ended September 30 | Nine months ended September 30 | ||||||||||
(In millions) | 2015 | 2014 | 2015 | 2014 | |||||||
Service cost for benefits earned | $ | 99 | $ | 91 | $ | 299 | $ | 310 | |||
Prior service cost amortization | 1 | 1 | 1 | 4 | |||||||
Expected return on plan assets | (211) | (200) | (625) | (596) | |||||||
Interest cost on benefit obligations | 133 | 149 | 396 | 443 | |||||||
Net actuarial loss amortization | 72 | 50 | 217 | 149 | |||||||
Pension plans cost | $ | 94 | $ | 91 | $ | 288 | $ | 310 | |||
EFFECT ON OPERATIONS OF PRINCIPAL RETIREE HEALTH AND LIFE INSURANCE PLANS | ||||||||||||
Principal retiree health | ||||||||||||
and life insurance plans | ||||||||||||
Three months ended September 30 | Nine months ended September 30 | |||||||||||
(In millions) | 2015 | 2014 | 2015 | 2014 | ||||||||
Service cost for benefits earned | $ | 27 | $ | 41 | $ | 119 | $ | 125 | ||||
Prior service cost (gain) amortization | (38) | 88 | 29 | 285 | ||||||||
Expected return on plan assets | (12) | (12) | (36) | (37) | ||||||||
Interest cost on benefit obligations | 67 | 106 | 268 | 326 | ||||||||
Net actuarial gain amortization | (14) | (38) | (11) | (124) | ||||||||
Curtailment loss (gain), net | - | 48 | (a) | (192) | (b)(c) | 48 | (a) | |||||
Retiree benefit plans cost | $ | 30 | $ | 233 | $ | 177 | $ | 623 | ||||
(a) | Curtailment loss resulting from our agreement with Electrolux to sell the GE Appliances business. |
(b) | Curtailment loss resulting from the GE Capital Exit Plan. |
(c) | Curtailment gain resulting from a life insurance plan amendment. |
2015 3Q FORM 10-Q PAGE 82
NOTE 10. INCOME TAXES
THE GE CAPITAL EXIT PLAN
In conjunction with the GE Capital Exit Plan, GECC will significantly reduce its non-U.S. assets while continuing to operate appropriately capitalized non-U.S. businesses with substantial assets related to GECC's vertical financing businesses, Energy Financial Services, GECAS and Healthcare Equipment Finance. As a result of the GE Capital Exit Plan, GECC recognized tax expense of $6,209 million in the nine months ended September 30, 2015. This consisted of tax expense of $3,548 million in the nine months ended September 30, 2015, related to expected repatriation of excess foreign cash in the amount of approximately $36 billion including approximately $10 billion of foreign earnings and the write-off of deferred tax assets of $2,661 million in the nine months ended September 30, 2015, that will no longer be supported under this plan.
UNRECOGNIZED TAX BENEFITS
UNRECOGNIZED TAX BENEFITS | |||||
(In millions) | September 30, 2015 | December 31, 2014 | |||
Unrecognized tax benefits | $ | 5,447 | $ | 5,619 | |
Portion that, if recognized, would reduce tax expense and effective tax rate(a) | 3,961 | 4,059 | |||
Accrued interest on unrecognized tax benefits | 782 | 807 | |||
Accrued penalties on unrecognized tax benefits | 97 | 103 | |||
Reasonably possible reduction to the balance of unrecognized tax benefits | |||||
in succeeding 12 months | 0-900 | 0-900 | |||
Portion that, if recognized, would reduce tax expense and effective tax rate(a) | 0-350 | 0-300 | |||
| (a) | Some portion of such reduction may be reported as discontinued operations. |
The Internal Revenue Service (IRS) is currently auditing our consolidated U.S. income tax returns for 2010-2011. In addition, certain other U.S. tax deficiency issues and refund claims for previous years are still unresolved. The IRS has disallowed the tax loss on our 2003 disposition of ERC Life Reinsurance Corporation. We have contested the disallowance of this loss. It is reasonably possible that the unresolved items could be resolved during the next 12 months, which could result in a decrease in our balance of unrecognized tax benefits – that is, the aggregate tax effect of differences between tax return positions and the benefits recognized in our financial statements. We believe that there are no other jurisdictions in which the outcome of unresolved issues or claims is likely to be material to our results of operations, financial position or cash flows. We further believe that we have made adequate provision for all income tax uncertainties.
2015 3Q FORM 10-Q PAGE 83
NOTE 11. SHAREOWNERS' EQUITY
ACCUMULATED OTHER COMPREHENSIVE INCOME (LOSS) | |||||||||||
Three months ended September 30 | Nine months ended September 30 | ||||||||||
(In millions) | 2015 | 2014 | 2015 | 2014 | |||||||
Investment securities | |||||||||||
Beginning balance | $ | 564 | $ | 1,040 | $ | 1,013 | $ | 307 | |||
Other comprehensive income (loss) (OCI) before reclassifications – | |||||||||||
net of deferred taxes of $14, $(146), $(196) and $310 | 22 | (265) | (382) | 484 | |||||||
Reclassifications from OCI – net of deferred taxes | |||||||||||
of $(20), $(15), $(45) and $(19) | (26) | (19) | (70) | (34) | |||||||
Other comprehensive income (loss)(a) | (3) | (284) | (452) | 450 | |||||||
Less OCI attributable to noncontrolling interests | - | 1 | - | 2 | |||||||
Ending balance | $ | 561 | $ | 755 | $ | 561 | $ | 755 | |||
Currency translation adjustments (CTA) | |||||||||||
Beginning balance | $ | (5,914) | $ | 61 | $ | (2,427) | $ | 126 | |||
OCI before reclassifications – net of deferred taxes | |||||||||||
of $(185), $198, $1,158 and $314 | (108) | (1,575) | (3,936) | (1,674) | |||||||
Reclassifications from OCI – net of deferred taxes | |||||||||||
of $(628), $1, $(779) and $124 | 733 | (15) | 1,039 | 25 | |||||||
Other comprehensive income (loss)(a) | 624 | (1,590) | (2,896) | (1,649) | |||||||
Less OCI attributable to noncontrolling interests | (8) | (11) | (43) | (5) | |||||||
Ending balance | $ | (5,281) | $ | (1,518) | $ | (5,281) | $ | (1,518) | |||
Cash flow hedges | |||||||||||
Beginning balance | $ | (140) | $ | (176) | $ | (180) | $ | (257) | |||
OCI before reclassifications – net of deferred taxes | |||||||||||
of $(28), $(44), $(24) and $(5) | (133) | (329) | (626) | (421) | |||||||
Reclassifications from OCI – net of deferred taxes | |||||||||||
of $11, $30, $59 and $39 | 98 | 384 | 632 | 557 | |||||||
Other comprehensive income (loss)(a) | (35) | 55 | 6 | 136 | |||||||
Less OCI attributable to noncontrolling interests | - | - | - | - | |||||||
Ending balance | $ | (174) | $ | (121) | $ | (174) | $ | (121) | |||
Benefit plans | |||||||||||
Beginning balance | $ | (12,716) | $ | (8,083) | $ | (16,578) | $ | (9,296) | |||
Prior service credit (costs) - net of deferred taxes | |||||||||||
of $0, $212, $1,194 and $212 | - | 374 | 2,090 | 374 | |||||||
Net actuarial gain (loss) – net of deferred taxes | |||||||||||
of $0, $(58), $269 and $(26) | 43 | (107) | 602 | 59 | |||||||
Net curtailment/settlement - net of deferred taxes | |||||||||||
of $0, $41, $(44) and $41 | - | 72 | (77) | 72 | |||||||
Prior service cost amortization – net of deferred taxes | |||||||||||
of $17, $62, $92 and $192 | - | 85 | 101 | 273 | |||||||
Net actuarial loss amortization – net of deferred taxes | |||||||||||
of $297, $213, $902 and $637 | 584 | 435 | 1,771 | 1,294 | |||||||
Other comprehensive income (loss)(a) | 627 | 859 | 4,486 | 2,072 | |||||||
Less OCI attributable to noncontrolling interests | - | 2 | (2) | 2 | |||||||
Ending balance | $ | (12,089) | $ | (7,226) | $ | (12,089) | $ | (7,226) | |||
Accumulated other comprehensive income (loss) at September 30 | $ | (16,983) | $ | (8,110) | $ | (16,983) | $ | (8,110) | |||
| (a) | Total other comprehensive income (loss) was $1,214 million and $(960) million in the three months ended September 30, 2015 and 2014, respectively and $1,144 million and $1,009 million in the nine months ended September 30, 2015 and 2014, respectively. |
2015 3Q FORM 10-Q PAGE 84
RECLASSIFICATION OUT OF AOCI | |||||||||||||
Three months ended | Nine months ended | ||||||||||||
September 30 | September 30 | ||||||||||||
(In millions) | 2015 | 2014 | 2015 | 2014 | Statement of Earnings Caption | ||||||||
Available-for-sale securities | |||||||||||||
Realized gains (losses) on | |||||||||||||
sale/impairment of securities | $ | 45 | $ | 34 | $ | 116 | $ | 53 | Other income(a) | ||||
(20) | (15) | (45) | (19) | Benefit (provision) for income taxes(b) | |||||||||
$ | 26 | $ | 19 | $ | 70 | $ | 34 | Net of tax | |||||
Currency translation adjustments | |||||||||||||
Gains (losses) on dispositions | $ | (104) | $ | 14 | $ | (260) | $ | (149) | Costs and expenses(c) | ||||
(628) | 1 | (779) | 124 | Benefit (provision) for income taxes(d) | |||||||||
$ | (733) | $ | 15 | $ | (1,039) | $ | (25) | Net of tax | |||||
Cash flow hedges | |||||||||||||
Gains (losses) on interest rate | |||||||||||||
derivatives | $ | (39) | $ | (53) | $ | (100) | $ | (182) | Interest and other financial charges | ||||
Foreign exchange contracts | (72) | (381) | (600) | (400) | (e) | ||||||||
Other | 2 | 20 | 9 | (14) | (f) | ||||||||
(109) | (414) | (691) | (596) | Total before tax | |||||||||
11 | 30 | 59 | 39 | Benefit (provision) for income taxes | |||||||||
$ | (98) | $ | (384) | $ | (632) | $ | (557) | Net of tax | |||||
Benefit plan items | |||||||||||||
Curtailment gain (loss) | $ | - | $ | (113) | $ | 121 | $ | (113) | (g) | ||||
Amortization of prior service costs | (17) | (147) | (193) | (465) | (g) | ||||||||
Amortization of actuarial gains (losses) | (881) | (648) | (2,673) | (1,931) | (g) | ||||||||
(898) | (908) | (2,745) | (2,509) | Total before tax | |||||||||
314 | 316 | 950 | 870 | Benefit (provision) for income taxes | |||||||||
$ | (584) | $ | (592) | $ | (1,795) | $ | (1,639) | Net of tax | |||||
Total reclassification adjustments | $ | (1,389) | $ | (942) | $ | (3,396) | $ | (2,187) | Net of tax | ||||
(a) | Included $28 million and $40 million for the three months ended September 30, 2015 and 2014, and $45 million and $34 million for the nine months ended September 30, 2015 and 2014, respectively in earnings (loss) from discontinued operations, net of taxes. |
(b) | Included $(15) million and $(15) million for the three months ended September 30, 2015 and 2014, and $(21) million and $(13) million for the nine months ended September 30, 2015 and 2014, respectively in earnings (loss) from discontinued operations, net of taxes. |
(c) | Included $(104) million and $1 million for the three months ended September 30, 2015 and 2014, and $(102) million and $(128) million for the nine months ended September 30, 2015 and 2014, respectively in earnings (loss) from discontinued operations, net of taxes. |
(d) | Included $(628) million and an insignificant amount for the three months ended September 30, 2015 and 2014, and $(764) million and $123 million for the nine months ended September 30, 2015 and 2014, respectively in earnings (loss) from discontinued operations, net of taxes. |
(e) | Included $(47) million and $(357) million in GECC revenues from services and $(25) million and $(24) million in interest and other financial charges in the three months ended September 30, 2015 and 2014, respectively and $(587) million and $(368) million in GECC revenues from services and $(13) million and $(32) million in interest and other financial charges in the nine months ended September 30, 2015 and 2014, respectively. |
(f) | Primarily recorded in costs and expenses. |
(g) | Curtailment gain (loss), amortization of prior service costs and actuarial gains and losses out of AOCI are included in the computation of net periodic pension costs. See Note 9 for further information. |
NONCONTROLLING INTERESTS
Noncontrolling interests in equity of consolidated affiliates includes common shares in consolidated affiliates and preferred stock issued by our affiliates.
2015 3Q FORM 10-Q PAGE 85
GECC preferred stock is presented as noncontrolling interests in the GE consolidated Statement of Financial Position. GECC preferred stock dividends are presented as noncontrolling interests in the GE consolidated Statement of Earnings. The balance is summarized as follows.
(In millions) | September 30, 2015 | December 31, 2014 | |||
|
|
|
|
|
|
GECC preferred stock | $ | 4,950 |
| $ | 4,950 |
Synchrony Financial | 2,790 | 2,531 | |||
Other noncontrolling interests in consolidated affiliates(a) |
| 1,048 |
|
| 1,193 |
Total | $ | 8,788 |
| $ | 8,674 |
| (a) | Consisted of a number of individually insignificant noncontrolling interests in partnerships and consolidated affiliates. |
CHANGES TO NONCONTROLLING INTERESTS | ||||||||||||
Three months ended September 30 | Nine months ended September 30 | |||||||||||
(In millions) | 2015 | 2014 | 2015 | 2014 | ||||||||
Beginning balance | $ | 8,776 | $ | 6,054 | $ | 8,674 | $ | 6,217 | ||||
Net earnings (loss) | 39 | (21) | 232 | (2) | ||||||||
GECC preferred stock dividend | - | - | (161) | (161) | ||||||||
Dividends | (18) | (20) | (36) | (55) | ||||||||
Dispositions | (3) | (6) | (9) | (98) | ||||||||
Synchrony Financial IPO | - | 2,393 | - | 2,393 | ||||||||
Other (including AOCI)(a) | (6) | 113 | 88 | 219 | ||||||||
Ending balance | $ | 8,788 | $ | 8,513 | $ | 8,788 | $ | 8,513 | ||||
(a) Includes research & development partner funding arrangements, acquisitions and eliminations.
OTHER
GE's authorized common stock consists of 13,200,000,000 shares having a par value of $0.06 each.
GECC did not pay any quarterly dividends or special dividends to GE in the three months ended September 30, 2015. GECC paid quarterly dividends of $472 million and special dividends of $333 million to GE in the three months ended September 30, 2014. GECC paid quarterly dividends of $450 million and did not pay any special dividends to GE in the nine months ended, September 30, 2015. GECC paid quarterly dividends of $1,555 million and special dividends of $666 million to GE in the nine months ended September 30, 2014.
NOTE 12. GECC REVENUES FROM SERVICES
Three months ended September 30 | Nine months ended September 30 | ||||||||||
(In millions) | 2015 | 2014 | 2015 | 2014 | |||||||
Interest on loans | $ | 3,010 | $ | 3,128 | $ | 8,902 | $ | 9,194 | |||
Equipment leased to others | 1,179 | 1,111 | 3,519 | 3,400 | |||||||
Fees | 839 | 852 | 2,426 | 2,466 | |||||||
Investment income(a) | 470 | 495 | 1,445 | 1,506 | |||||||
Associated companies | 158 | 189 | 893 | 796 | |||||||
Premiums earned by insurance activities | 353 | 397 | 1,062 | 1,130 | |||||||
Financing leases | 84 | 100 | 275 | 331 | |||||||
Other items(b) | 198 | 84 | (1,133) | 311 | |||||||
6,290 | 6,356 | 17,388 | 19,134 | ||||||||
Eliminations | (306) | (397) | (1,015) | (1,170) | |||||||
Total | $ | 5,984 | $ | 5,959 | $ | 16,373 | $ | 17,964 | |||
| (a) | Included net other-than-temporary impairments on investment securities of $2 million and $2 million in the three months ended September 30, 2015 and 2014, respectively, and $21 million and $14 million in the nine months ended September 30, 2015 and 2014, respectively. |
| (b) | During the nine months ended September 30, 2015, other items primarily included impairments related to equity method investments ($1,392 million) in connection with the GE Capital Exit Plan. |
2015 3Q FORM 10-Q PAGE 86
NOTE 13. EARNINGS PER SHARE INFORMATION
Three months ended September 30 | |||||||||||
2015 | 2014 | ||||||||||
(In millions; per-share amounts in dollars) | Diluted | Basic | Diluted | Basic | |||||||
Amounts attributable to the Company: | |||||||||||
Consolidated | |||||||||||
Earnings (loss) from continuing operations attributable to | |||||||||||
common shareowners for per-share calculation(a)(b) | $ | 2,849 | $ | 2,849 | $ | 2,826 | $ | 2,826 | |||
Earnings (loss) from discontinued operations | |||||||||||
for per-share calculation(a)(b) | (346) | (346) | 706 | 706 | |||||||
Net earnings (loss) attributable to GE common | |||||||||||
shareowners for per-share calculation(a)(b) | $ | 2,503 | $ | 2,502 | $ | 3,532 | $ | 3,532 | |||
Average equivalent shares | |||||||||||
Shares of GE common stock outstanding | 10,103 | 10,103 | 10,039 | 10,039 | |||||||
Employee compensation-related shares (including | |||||||||||
stock options) | 70 | - | 80 | - | |||||||
Total average equivalent shares | 10,173 | 10,103 | 10,119 | 10,039 | |||||||
Per-share amounts | |||||||||||
Earnings (loss) from continuing operations | $ | 0.28 | $ | 0.28 | $ | 0.28 | $ | 0.28 | |||
Earnings (loss) from discontinued operations | (0.03) | (0.03) | 0.07 | 0.07 | |||||||
Net earnings (loss) | 0.25 | 0.25 | 0.35 | 0.35 | |||||||
Nine months ended September 30 | |||||||||||
2015 | 2014 | ||||||||||
(In millions; per-share amounts in dollars) | Diluted | Basic | Diluted | Basic | |||||||
Amounts attributable to the Company: | |||||||||||
Consolidated | |||||||||||
Earnings (loss) from continuing operations attributable to | |||||||||||
common shareowners for per-share calculation(a)(b) | $ | (2,100) | $ | (2,100) | $ | 8,005 | $ | 8,004 | |||
Earnings (loss) from discontinued operations | |||||||||||
for per-share calculation(a)(b) | (10,345) | (10,345) | 2,064 | 2,064 | |||||||
Net earnings (loss) attributable to GE common | |||||||||||
shareowners for per-share calculation(a)(b) | $ | (12,436) | $ | (12,436) | $ | 10,068 | $ | 10,067 | |||
Average equivalent shares | |||||||||||
Shares of GE common stock outstanding | 10,085 | 10,085 | 10,042 | 10,042 | |||||||
Employee compensation-related shares (including | |||||||||||
stock options) | - | - | 79 | - | |||||||
Total average equivalent shares | 10,085 | 10,085 | 10,121 | 10,042 | |||||||
Per-share amounts | |||||||||||
Earnings (loss) from continuing operations | $ | (0.21) | $ | (0.21) | $ | 0.79 | $ | 0.80 | |||
Earnings (loss) from discontinued operations | (1.03) | (1.03) | 0.20 | 0.21 | |||||||
Net earnings (loss) | (1.23) | (1.23) | 0.99 | 1.00 | |||||||
(a) | Our unvested restricted stock unit awards that contain non-forfeitable rights to dividends or dividend equivalents are considered participating securities. For the nine months period ended September 30, 2015, pursuant to the two-class method, as a result of the net loss from continuing operations, losses were not allocated to the participating securities. For the three months ended September 30, 2015 and 2014; and the nine months period ended September 30, 2014, participating securities are included in the computation of earnings (loss) per share pursuant to the two-class method and the application of this treatment had an insignificant effect. |
(b) | Included an insignificant amount of dividend equivalents in each of the periods presented. |
For the three months ended September 30, 2015 and 2014, approximately 89 million and 88 million, respectively, of outstanding stock awards were not included in the computation of diluted earnings (loss) per share because their effect was antidilutive. As a result of the loss from continuing operations for the nine months ended September 30, 2015, outstanding stock awards of approximately 398 million, were not included in the computation of diluted earnings (loss) per share because their effect was antidilutive. For the nine months ended September 30, 2014, approximately 104 million of outstanding stock awards were not included in the computation of diluted earnings (loss) per share because their effect was antidilutive.
Earnings (loss) per share amounts are computed independently, as a result, the sum of per-share amounts from continuing operations and discontinued operations may not equal the total per share amounts for net earnings (loss).
2015 3Q FORM 10-Q PAGE 87
NOTE 14. FAIR VALUE MEASUREMENTS
RECURRING FAIR VALUE MEASUREMENTS
Our assets and liabilities measured at fair value on a recurring basis include investment securities primarily supporting obligations to annuitants and policyholders in our run-off insurance operations.
ASSETS AND LIABILITIES MEASURED AT FAIR VALUE ON A RECURRING BASIS | ||||||||||||||
Netting | ||||||||||||||
(In millions) | Level 1 | (a) | Level 2 | (a) | Level 3 | adjustment | (b) | Net balance | ||||||
September 30, 2015 | ||||||||||||||
Assets | ||||||||||||||
Investment securities | ||||||||||||||
Debt | ||||||||||||||
U.S. corporate | $ | - | $ | 19,853 | $ | 3,050 | $ | - | $ | 22,902 | ||||
State and municipal | - | 4,259 | 81 | - | 4,340 | |||||||||
Residential mortgage-backed | - | 981 | 2 | - | 984 | |||||||||
Commercial mortgage-backed | - | 2,403 | 1 | - | 2,405 | |||||||||
Asset-backed | - | 59 | 38 | - | 97 | |||||||||
Corporate – non-U.S. | 6 | 579 | 283 | - | 868 | |||||||||
Government – non-U.S. | 14 | 1,238 | - | - | 1,252 | |||||||||
U.S. government and federal agency | - | 3,573 | 309 | - | 3,882 | |||||||||
Equity | ||||||||||||||
Available-for-sale | 159 | 15 | 10 | - | 185 | |||||||||
Trading | 19 | - | - | - | 19 | |||||||||
Derivatives(c) | - | 8,545 | 79 | (6,620) | 2,003 | |||||||||
Other (d) | - | - | 233 | - | 233 | |||||||||
Total | $ | 197 | $ | 41,505 | $ | 4,086 | $ | (6,620) | $ | 39,168 | ||||
Liabilities | ||||||||||||||
Derivatives | $ | - | $ | 5,156 | $ | 5 | $ | (4,658) | $ | 503 | ||||
Other(e) | - | 1,070 | - | - | 1,070 | |||||||||
Total | $ | - | $ | 6,227 | $ | 5 | $ | (4,658) | $ | 1,573 | ||||
December 31, 2014 | ||||||||||||||
Assets | ||||||||||||||
Investment securities | ||||||||||||||
Debt | ||||||||||||||
U.S. corporate | $ | - | $ | 20,659 | $ | 3,056 | $ | - | $ | 23,715 | ||||
State and municipal | - | 4,560 | 115 | - | 4,675 | |||||||||
Residential mortgage-backed | - | 1,676 | 16 | - | 1,692 | |||||||||
Commercial mortgage-backed | - | 3,054 | 9 | - | 3,063 | |||||||||
Asset-backed | - | 172 | 123 | - | 295 | |||||||||
Corporate – non-U.S. | - | 680 | 337 | - | 1,017 | |||||||||
Government – non-U.S. | - | 1,708 | 2 | - | 1,710 | |||||||||
U.S. government and federal agency | - | 1,747 | 266 | - | 2,013 | |||||||||
Equity | - | |||||||||||||
Available-for-sale | 171 | 19 | 9 | - | 199 | |||||||||
Trading | 21 | - | - | - | 21 | |||||||||
Derivatives(c) | - | 9,957 | 40 | (7,584) | 2,413 | |||||||||
Other (d) | - | - | 277 | - | 277 | |||||||||
Total | $ | 192 | $ | 44,232 | $ | 4,250 | $ | (7,584) | $ | 41,090 | ||||
Liabilities | ||||||||||||||
Derivatives | $ | - | $ | 4,890 | $ | 13 | $ | (4,363) | $ | 540 | ||||
Other(e) | - | 1,178 | - | - | 1,178 | |||||||||
Total | $ | - | $ | 6,068 | $ | 13 | $ | (4,363) | $ | 1,718 | ||||
| (a) | There were no securities transferred between Level 1 and Level 2 in the nine months ended September 30, 2015. There were $487 million of Government – non-U.S. and $13 million of Corporate – non-U.S. available-for-sale debt securities transferred from Level 1 to Level 2 in the twelve months ended December 31, 2014 primarily attributable to changes in market observable data. |
| (b) | The netting of derivative receivables and payables (including the effects of any collateral posted or received) is permitted when a legally enforceable master netting agreement exists. |
| (c) | The fair value of derivatives includes an adjustment for non-performance risk. The cumulative adjustment was a gain (loss) of $1 million and $16 million at September 30, 2015 and December 31, 2014, respectively. See Note 15 for additional information on the composition of our derivative portfolio. |
| (d) | Includes private equity investments. |
| (e) | Primarily represented the liability associated with certain of our deferred incentive compensation plans. |
2015 3Q FORM 10-Q PAGE 88
LEVEL 3 INSTRUMENTS
The majority of our Level 3 balances consist of investment securities classified as available-for-sale with changes in fair value recorded in shareowners' equity.
CHANGES IN LEVEL 3 INSTRUMENTS FOR THE THREE MONTHS ENDED | |||||||||||||||||||||||||||
Net | |||||||||||||||||||||||||||
change in | |||||||||||||||||||||||||||
Net | Net | unrealized | |||||||||||||||||||||||||
realized/ | realized/ | gains | |||||||||||||||||||||||||
unrealized | unrealized | (losses) | |||||||||||||||||||||||||
gains | gains | relating to | |||||||||||||||||||||||||
(losses) | (losses) | Transfers | Transfers | instruments | |||||||||||||||||||||||
Balance at | included in | included | into | out of | Balance at | still held at | |||||||||||||||||||||
(In millions) | July 1 | earnings(a) | in AOCI | Purchases | Sales | Settlements | Level 3(b) | Level 3(b) | September 30 | September 30(c) | |||||||||||||||||
2015 | |||||||||||||||||||||||||||
Investment securities | |||||||||||||||||||||||||||
Debt | |||||||||||||||||||||||||||
U.S. corporate | $ | 3,024 | $ | 5 | $ | (7) | $ | 74 | $ | (29) | $ | (37) | $ | 35 | $ | (15) | $ | 3,050 | $ | - | |||||||
State and municipal | 101 | - | 1 | - | - | (5) | - | (17) | 81 | - | |||||||||||||||||
RMBS | 2 | - | - | - | - | (1) | - | - | 2 | - | |||||||||||||||||
CMBS | 2 | - | - | - | - | - | - | - | 1 | - | |||||||||||||||||
ABS | 76 | (2) | - | - | - | - | - | (36) | 38 | - | |||||||||||||||||
Corporate – non-U.S. | 283 | - | - | 1 | - | (1) | - | - | 283 | - | |||||||||||||||||
Government – non-U.S. | 2 | - | - | - | - | - | - | (2) | - | - | |||||||||||||||||
U.S. government and | |||||||||||||||||||||||||||
federal agency | 293 | - | 16 | - | - | - | - | - | 309 | - | |||||||||||||||||
Equity | |||||||||||||||||||||||||||
Available-for-sale | 6 | - | (1) | - | - | - | 6 | - | 10 | - | |||||||||||||||||
Derivatives(d)(e) | 72 | 16 | 1 | (1) | - | (1) | - | - | 86 | 14 | |||||||||||||||||
Other | 222 | 10 | - | - | - | - | - | - | 233 | - | |||||||||||||||||
Total | $ | 4,083 | $ | 29 | $ | 10 | $ | 74 | $ | (29) | $ | (45) | $ | 41 | $ | (70) | $ | 4,094 | $ | 14 | |||||||
2014 | |||||||||||||||||||||||||||
Investment securities | |||||||||||||||||||||||||||
Debt | |||||||||||||||||||||||||||
U.S. corporate | $ | 3,060 | $ | 4 | $ | (4) | $ | 102 | $ | (57) | $ | (90) | $ | 32 | $ | (16) | $ | 3,031 | $ | - | |||||||
State and municipal | 110 | - | 2 | 2 | - | (1) | - | - | 113 | - | |||||||||||||||||
RMBS | 66 | - | - | - | - | (3) | - | (47) | 16 | - | |||||||||||||||||
CMBS | 12 | - | - | - | - | (2) | - | - | 10 | - | |||||||||||||||||
ABS | 130 | 1 | 2 | - | - | (4) | - | - | 129 | - | |||||||||||||||||
Corporate – non-U.S. | 511 | - | - | 1 | - | (23) | - | - | 489 | - | |||||||||||||||||
Government – non-U.S. | 1 | - | - | - | - | - | - | (1) | - | - | |||||||||||||||||
U.S. government and | |||||||||||||||||||||||||||
federal agency | 249 | - | 6 | - | - | - | 9 | - | 264 | - | |||||||||||||||||
Retained interests | 1 | - | - | - | - | (1) | - | - | - | - | |||||||||||||||||
Equity | |||||||||||||||||||||||||||
Available-for-sale | 9 | - | - | - | - | - | - | - | 9 | - | |||||||||||||||||
Derivatives(d)(e) | 29 | 1 | 1 | (2) | - | - | - | - | 29 | (1) | |||||||||||||||||
Other | 217 | 5 | - | - | - | - | - | - | 222 | - | |||||||||||||||||
Total | $ | 4,395 | $ | 11 | $ | 7 | $ | 103 | $ | (57) | $ | (124) | $ | 41 | $ | (64) | $ | 4,312 | $ | (1) | |||||||
(a) | Earnings effects are primarily included in the "GECC revenues from services" and "Interest and other financial charges" captions in the Statement of Earnings (Loss). |
(b) | Transfers in and out of Level 3 are considered to occur at the beginning of the period. Transfers out of Level 3 were primarily a result of increased use of quotes from independent pricing vendors based on recent trading activity. |
(c) | Represents the amount of unrealized gains or losses for the period included in earnings. |
(d) | Represents derivative assets net of derivative liabilities and included cash accruals of $12 million and $9 million not reflected in the fair value hierarchy table for the three months ended September 30, 2015 and 2014, respectively. |
(e) | Gains (losses) included in net realized/unrealized gains (losses) included in earnings were offset by the earnings effects from the underlying items that were economically hedged. See Note 15. |
|
|
2015 3Q FORM 10-Q PAGE 89
CHANGES IN LEVEL 3 INSTRUMENTS FOR THE NINE MONTHS ENDED | |||||||||||||||||||||||||||
Net | |||||||||||||||||||||||||||
change in | |||||||||||||||||||||||||||
Net | Net | unrealized | |||||||||||||||||||||||||
realized/ | realized/ | gains | |||||||||||||||||||||||||
unrealized | unrealized | (losses) | |||||||||||||||||||||||||
gains | gains | relating to | |||||||||||||||||||||||||
(losses) | (losses) | Transfers | Transfers | instruments | |||||||||||||||||||||||
Balance at | included in | included | into | out of | Balance at | still held at | |||||||||||||||||||||
(In millions) | January 1 | earnings(a) | in AOCI | Purchases | Sales | Settlements | Level 3(b) | Level 3(b) | September 30 | September 30(c) | |||||||||||||||||
2015 | |||||||||||||||||||||||||||
Investment securities | |||||||||||||||||||||||||||
Debt | |||||||||||||||||||||||||||
U.S. corporate | $ | 3,056 | $ | 2 | $ | (93) | $ | 255 | $ | (84) | $ | (93) | $ | 35 | $ | (28) | $ | 3,050 | $ | - | |||||||
State and municipal | 115 | - | (3) | - | - | (15) | - | (17) | 81 | - | |||||||||||||||||
RMBS | 16 | 5 | (4) | - | (15) | (1) | - | - | 2 | - | |||||||||||||||||
CMBS | 9 | - | - | - | (7) | - | - | - | 1 | - | |||||||||||||||||
ABS | 123 | (16) | (5) | - | (12) | (3) | - | (49) | 38 | - | |||||||||||||||||
Corporate – non-U.S. | 337 | - | (4) | 1 | (50) | (1) | - | - | 283 | - | |||||||||||||||||
Government – non-U.S. | 2 | - | - | - | - | - | - | (2) | - | - | |||||||||||||||||
U.S. government and | |||||||||||||||||||||||||||
federal agency | 266 | - | 44 | - | - | (1) | - | - | 309 | - | |||||||||||||||||
Equity | |||||||||||||||||||||||||||
Available-for-sale | 9 | 2 | (3) | 6 | (5) | (4) | 6 | - | 10 | - | |||||||||||||||||
Derivatives(d)(e) | 36 | 15 | 3 | - | - | (9) | 42 | - | 86 | 11 | |||||||||||||||||
Other | 277 | (24) | - | - | (21) | - | - | - | 233 | (37) | |||||||||||||||||
Total | $ | 4,246 | $ | (16) | $ | (65) | $ | 262 | $ | (194) | $ | (127) | $ | 83 | $ | (96) | $ | 4,094 | $ | (26) | |||||||
2014 | |||||||||||||||||||||||||||
Investment securities | |||||||||||||||||||||||||||
Debt | |||||||||||||||||||||||||||
U.S. corporate | $ | 2,787 | $ | 22 | $ | 115 | $ | 441 | $ | (213) | $ | (158) | $ | 170 | $ | (133) | $ | 3,031 | $ | - | |||||||
State and municipal | 96 | - | 9 | 12 | - | (4) | - | - | 113 | - | |||||||||||||||||
RMBS | 86 | 1 | - | - | (16) | (8) | - | (47) | 16 | - | |||||||||||||||||
CMBS | 10 | - | - | - | - | (2) | 2 | - | 10 | - | |||||||||||||||||
ABS | 145 | 3 | 6 | - | - | (15) | - | (10) | 129 | - | |||||||||||||||||
Corporate – non-U.S. | 515 | 13 | 43 | 1 | (54) | (24) | 1 | (6) | 489 | - | |||||||||||||||||
Government – non-U.S. | 31 | - | - | - | - | - | - | (31) | - | - | |||||||||||||||||
U.S. government and | |||||||||||||||||||||||||||
federal agency | 225 | - | 32 | - | - | - | 9 | (2) | 264 | - | |||||||||||||||||
Retained interests | 1 | - | - | - | - | (1) | - | - | - | - | |||||||||||||||||
Equity | |||||||||||||||||||||||||||
Available-for-sale | 11 | - | - | 2 | (2) | (2) | - | - | 9 | - | |||||||||||||||||
Derivatives(d)(e) | 20 | 8 | 1 | (1) | - | 3 | (1) | (1) | 29 | 13 | |||||||||||||||||
Other | 201 | 16 | - | 20 | (15) | - | - | - | 222 | 4 | |||||||||||||||||
Total | $ | 4,128 | $ | 63 | $ | 206 | $ | 475 | $ | (300) | $ | (211) | $ | 181 | $ | (230) | $ | 4,312 | $ | 17 | |||||||
(a) | Earnings effects are primarily included in the "GECC revenues from services" and "Interest and other financial charges" captions in the Statement of Earnings (Loss). |
(b) | Transfers in and out of Level 3 are considered to occur at the beginning of the period. Transfers out of Level 3 were primarily a result of increased use of quotes from independent pricing vendors based on recent trading activity. |
(c) | Represents the amount of unrealized gains or losses for the period included in earnings. |
(d) | Represents derivative assets net of derivative liabilities and included cash accruals of $12 million and $9 million not reflected in the fair value hierarchy table for the nine months ended September 30, 2015 and 2014, respectively. |
(e) | Gains (losses) included in net realized/unrealized gains (losses) included in earnings were offset by the earnings effects from the underlying items that were economically hedged. See Note 15. |
2015 3Q FORM 10-Q PAGE 90
NON-RECURRING FAIR VALUE MEASUREMENTS
The following table represents non-recurring fair value amounts (as measured at the time of the adjustment) for those assets remeasured to fair value on a non-recurring basis during the fiscal year and still held at September 30, 2015 and December 31, 2014.
Remeasured during | Remeasured during | ||||||||||
the nine months ended | the year ended | ||||||||||
September 30, 2015 | December 31, 2014 | ||||||||||
(In millions) | Level 2 | Level 3 | Level 2 | Level 3 | |||||||
Financing receivables and financing receivables held for sale | $ | - | $ | 18,152 | $ | 1 | $ | 584 | |||
Cost and equity method investments | 1 | 2,347 | - | 346 | |||||||
Long-lived assets, including real estate | 3 | 301 | 102 | 718 | |||||||
Total | $ | 4 | $ | 20,800 | $ | 103 | $ | 1,648 | |||
The following table represents the fair value adjustments to assets measured at fair value on a non-recurring basis and still held at September 30, 2015 and 2014.
Three months ended September 30 | Nine months ended September 30 | ||||||||||
(In millions) | 2015 | 2014 | 2015 | 2014 | |||||||
Financing receivables and financing receivables held for sale | $ | (46) | $ | (31) | $ | (2,199) | $ | (135) | |||
Cost and equity method investments | (280) | (82) | (1,788) | (281) | |||||||
Long-lived assets, including real estate | (91) | (275) | (165) | (335) | |||||||
Total | $ | (417) | $ | (388) | $ | (4,151) | $ | (751) | |||
2015 3Q FORM 10-Q PAGE 91
LEVEL 3 MEASUREMENTS - SIGNIFICANT UNOBSERVABLE INPUTS | |||||||||
Range | |||||||||
(Dollars in millions) | Fair value | Valuation technique | Unobservable inputs | (weighted average) | |||||
September 30, 2015 | |||||||||
Recurring fair value measurements | |||||||||
Investment securities – Debt | |||||||||
U.S. corporate | $ | 863 | Income approach | Discount rate(a) | 2.2%-15.3% (7.4%) | ||||
Asset-backed | 38 | Income approach | Discount rate(a) | 5.0%-10.0% (9.1%) | |||||
Corporate – non-U.S. | 226 | Income approach | Discount rate(a) | 6.5%-14.0% (7.4%) | |||||
Other financial assets | 228 | Income approach, | EBITDA multiple | 6.1X-15.1X (9.8X) | |||||
Market comparables | Capitalization rate | 7.8%-7.8% (7.8%) | |||||||
Non-recurring fair value measurements | |||||||||
Financing receivables and | $ | 18,015 | Income approach | Discount rate(a) | 5.6%-8.0% (6.7%) | ||||
financing receivables held for sale | |||||||||
Cost and equity method investments | 2,134 | Income approach, | Discount rate(a) | 9.0%-14.5% (11.8%) | |||||
Market comparables | Price to book multiple | 0.4X-0.7X (0.6X) | |||||||
Long-lived assets, including real estate | 198 | Income approach | Discount rate(a) | 1.7%-9.8% (6.2%) | |||||
December 31, 2014 | |||||||||
Recurring fair value measurements | |||||||||
Investment securities – Debt | |||||||||
U.S. corporate | $ | 917 | Income approach | Discount rate(a) | 1.5%-14.8% (6.6%) | ||||
State and municipal | 17 | Income approach | Discount rate(a) | 4.9%-4.9% (4.9%) | |||||
Asset-backed | 102 | Income approach | Discount rate(a) | 4.3%-9.0% (5.6%) | |||||
Corporate – non-U.S. | 278 | Income approach | Discount rate(a) | 3.3%-14.0% (6.5%) | |||||
Other financial assets | 117 | Income approach, | EBITDA multiple | 5.4X-9.1X (7.7X) | |||||
Market comparables | Capitalization rate | 6.5%-7.8% (7.7%) | |||||||
Non-recurring fair value measurements | |||||||||
Cost and equity method investments | 309 | Income approach, | Discount rate(a) | 8.0%-10.0% (9.4%) | |||||
Market comparables | EBITDA multiple | 1.8X-5.2X (4.8X) | |||||||
Long-lived assets, including real estate | 664 | Income approach | Discount rate(a) | 2.0%-10.8% (6.7%) | |||||
(a) | Discount rates are determined based on inputs that market participants would use when pricing investments, including credit and liquidity risk. An increase in the discount rate would result in a decrease in the fair value. |
At September 30, 2015 and December 31, 2014, other Level 3 recurring fair value measurements of $2,690 million and $2,596 million, respectively, and non-recurring measurements of $267 million and $657 million, respectively, are valued using non-binding broker quotes or other third-party sources. At September 30, 2015 and December 31, 2014, other recurring fair value measurements of $36 million and $210 million, respectively, and non-recurring fair value measurements of $186 million and $18 million, respectively, were individually insignificant and utilize a number of different unobservable inputs not subject to meaningful aggregation.
2015 3Q FORM 10-Q PAGE 92
NOTE 15. FINANCIAL INSTRUMENTS
The following table provides information about assets and liabilities not carried at fair value. The table excludes finance leases and non-financial assets and liabilities. Substantially all of the assets discussed below are considered to be Level 3. The vast majority of our liabilities' fair value can be determined based on significant observable inputs and thus considered Level 2. Few of the instruments are actively traded and their fair values must often be determined using financial models. Realization of the fair value of these instruments depends upon market forces beyond our control, including marketplace liquidity.
September 30, 2015 | December 31, 2014 | ||||||||||||||||
Assets (liabilities) | Assets (liabilities) | ||||||||||||||||
Carrying | Carrying | ||||||||||||||||
Notional | amount | Estimated | Notional | amount | Estimated | ||||||||||||
(In millions) | amount | (net) | fair value | amount | (net) | fair value | |||||||||||
GE | |||||||||||||||||
Assets | |||||||||||||||||
Investments and notes receivable | $ | (a) | $ | 700 | $ | 760 | $ | (a) | $ | 502 | $ | 551 | |||||
Liabilities | |||||||||||||||||
Borrowings(b)(c) | (a) | (20,656) | (21,372) | (a) | (16,340) | (17,503) | |||||||||||
GECC | |||||||||||||||||
Assets | |||||||||||||||||
Loans | (a) | 78,775 | 85,107 | (a) | 115,889 | 120,067 | |||||||||||
Other commercial mortgages | (a) | 1,392 | 1,520 | (a) | 1,427 | 1,508 | |||||||||||
Loans held for sale | (a) | 22,651 | 23,039 | (a) | 778 | 799 | |||||||||||
Other financial instruments(d) | (a) | 161 | 195 | (a) | 122 | 136 | |||||||||||
Liabilities | |||||||||||||||||
Borrowings and bank deposits(b)(e)(f) | (a) | (271,944) | (283,092) | (a) | (317,674) | (333,956) | |||||||||||
Investment contract benefits | (a) | (2,821) | (3,327) | (a) | (2,970) | (3,565) | |||||||||||
Guaranteed investment contracts | (a) | (179) | (193) | (a) | (1,000) | (1,031) | |||||||||||
Insurance – credit life(g) | - | - | - | 1,843 | (90) | (77) | |||||||||||
| (a) | These financial instruments do not have notional amounts. |
| (b) | See Note 8. |
(c) Included $174 million and $94 million of accrued interest in estimated fair value at September 30, 2015 and December 31, 2014, respectively.
| (d) | Principally comprises cost method investments. |
| (e) | Fair values exclude interest rate and currency derivatives designated as hedges of borrowings. Had they been included, the fair value of borrowings at September 30, 2015 and December 31, 2014 would have been reduced by $4,710 million and $5,020 million, respectively. |
| (f) | Included $1,994 million and $2,888 million of accrued interest in estimated fair value at September 30, 2015 and December 31, 2014, respectively. |
| (g) | Net of reinsurance of none and $964 million at September 30, 2015 and December 31, 2014, respectively. |
NOTIONAL AMOUNTS OF LOAN COMMITMENTS | ||||||
(In millions) | September 30, 2015 | December 31, 2014 | ||||
Ordinary course of business lending commitments(a) | $ | 804 | $ | 1,214 | ||
Unused revolving credit lines(b) | ||||||
Commercial | 2,054 | 2,908 | ||||
Consumer – principally credit cards | 321,710 | 306,188 | ||||
(a) | Excluded investment commitments of $579 million and $818 million at September 30, 2015 and December 31, 2014, respectively. |
(b) | Excluded amounts related to inventory financing arrangements, which may be withdrawn at our option, of $39 million and $47 million at September 30, 2015 and December 31, 2014, respectively. |
2015 3Q FORM 10-Q PAGE 93
SECURITIES REPURCHASE AND REVERSE REPURCHASE ARRANGEMENTS
Our issuances of securities repurchase agreements are insignificant and are limited to activities at certain of our foreign banks primarily for purposes of liquidity management. At September 30, 2015, we were party to repurchase agreements totaling $132 million, which were reported in short-term borrowings on the financial statements. No repurchase agreements were accounted for as off-book financing and we do not engage in securities lending transactions.
We also enter into reverse securities repurchase agreements, primarily for short-term investment with maturities of 90 days or less. At September 30, 2015, we were party to reverse repurchase agreements totaling $10.0 billion, which were reported in cash and equivalents on the financial statements. Under these reverse securities repurchase agreements, we typically lend available cash at a specified rate of interest and hold U.S. or highly-rated European government securities as collateral during the term of the agreement. Collateral value is in excess of amounts loaned under the agreements.
DERIVATIVES AND HEDGING
As a matter of policy, we use derivatives for risk management purposes and we do not use derivatives for speculative purposes. A key risk management objective for our financial services businesses is to mitigate interest rate and currency risk by seeking to ensure that the characteristics of the debt match the assets they are funding. If the form (fixed versus floating) and currency denomination of the debt we issue do not match the related assets, we typically execute derivatives to adjust the nature and tenor of funding to meet this objective within pre-defined limits. The determination of whether we enter into a derivative transaction or issue debt directly to achieve this objective depends on a number of factors, including market related factors that affect the type of debt we can issue.
The notional amounts of derivative contracts represent the basis upon which interest and other payments are calculated and are reported gross, except for offsetting foreign currency forward contracts that are executed in order to manage our currency risk of net investment in foreign subsidiaries. Of the outstanding notional amount of $279,000 million, approximately 89% or $247,000 million, is associated with reducing or eliminating the interest rate, currency or market risk between financial assets and liabilities in our financial services businesses. The remaining derivative activities primarily relate to hedging against adverse changes in currency exchange rates and commodity prices related to anticipated sales and purchases and contracts containing certain clauses that meet the accounting definition of a derivative. The instruments used in these activities are designated as hedges when practicable. When we are not able to apply hedge accounting, or when the derivative and the hedged item are both recorded in earnings concurrently, the derivatives are deemed economic hedges and hedge accounting is not applied. This most frequently occurs when we hedge a recognized foreign currency transaction (e.g., a receivable or payable) with a derivative. Since the effects of changes in exchange rates are reflected concurrently in earnings for both the derivative and the transaction, the economic hedge does not require hedge accounting.
2015 3Q FORM 10-Q PAGE 94
FAIR VALUE OF DERIVATIVES | |||||||||||
September 30, 2015 | December 31, 2014 | ||||||||||
(In millions) | Assets | Liabilities | Assets | Liabilities | |||||||
Derivatives accounted for as hedges | |||||||||||
Interest rate contracts | $ | 5,579 | $ | 53 | $ | 5,859 | $ | 461 | |||
Currency exchange contracts | 1,501 | 1,310 | 2,579 | 884 | |||||||
Other contracts | - | 2 | - | 2 | |||||||
7,080 | 1,365 | 8,438 | 1,347 | ||||||||
Derivatives not accounted for as hedges | |||||||||||
Interest rate contracts | 144 | 56 | 111 | 64 | |||||||
Currency exchange contracts | 1,179 | 3,676 | 1,209 | 3,450 | |||||||
Other contracts | 221 | 64 | 239 | 42 | |||||||
1,544 | 3,796 | 1,559 | 3,556 | ||||||||
Gross derivatives recognized in statement of | |||||||||||
financial position | |||||||||||
Gross derivatives | 8,624 | 5,161 | 9,997 | 4,903 | |||||||
Gross accrued interest | 978 | 9 | 1,392 | (24) | |||||||
9,602 | 5,170 | 11,389 | 4,879 | ||||||||
Amounts offset in statement of financial position | |||||||||||
Netting adjustments(a) | (3,762) | (3,763) | (3,886) | (3,902) | |||||||
Cash collateral(b) | (2,858) | (895) | (3,698) | (461) | |||||||
(6,620) | (4,658) | (7,584) | (4,363) | ||||||||
Net derivatives recognized in statement of | |||||||||||
financial position | |||||||||||
Net derivatives | 2,982 | 512 | 3,805 | 516 | |||||||
Amounts not offset in statement of | |||||||||||
financial position | |||||||||||
Securities held as collateral(c) | (1,694) | - | (3,188) | - | |||||||
Net amount | $ | 1,288 | $ | 512 | $ | 617 | $ | 516 | |||
Derivatives are classified in the captions "All other assets" and "All other liabilities" and the related accrued interest is classified in "Other GECC receivables" and "All other liabilities" in our financial statements.
(a) | The netting of derivative receivables and payables is permitted when a legally enforceable master netting agreement exists. Amounts include fair value adjustments related to our own and counterparty non-performance risk. At September 30, 2015 and December 31, 2014, the cumulative adjustment for non-performance risk was a gain (loss) of $1 million and $16 million, respectively. |
(b) | Excluded excess cash collateral received and posted of $74 million and $66 million at September 30, 2015, respectively, and $63 million and $211 million at December 31, 2014, respectively. |
(c) | Excluded excess securities collateral received of $36 million and $397 million at September 30, 2015 and December 31, 2014, respectively. |
2015 3Q FORM 10-Q PAGE 95
FAIR VALUE HEDGES
We use interest rate and currency exchange derivatives to hedge the fair value effects of interest rate and currency exchange rate changes on local and non-functional currency denominated fixed-rate debt. For relationships designated as fair value hedges, changes in fair value of the derivatives are recorded in earnings within interest and other financial charges, along with offsetting adjustments to the carrying amount of the hedged debt.
EARNINGS EFFECTS OF FAIR VALUE HEDGING RELATIONSHIPS | |||||||||||
Three months ended September 30 | |||||||||||
2015 | 2014 | ||||||||||
Gain (loss) | Gain (loss) | Gain (loss) | Gain (loss) | ||||||||
on hedging | on hedged | on hedging | on hedged | ||||||||
(In millions) | derivatives | items | derivatives | items | |||||||
Interest rate contracts | $ | 1,391 | $ | (1,387) | $ | 341 | $ | (350) | |||
Currency exchange contracts | (6) | 5 | (8) | 8 | |||||||
Fair value hedges resulted in $3 million and $(9) million of ineffectiveness in the three months ended September 30, 2015 and 2014, respectively. In both the three months ended September 30, 2015 and 2014, there were insignificant amounts excluded from the assessment of effectiveness.
EARNINGS EFFECTS OF FAIR VALUE HEDGING RELATIONSHIPS | |||||||||||
Nine months ended September 30 | |||||||||||
2015 | 2014 | ||||||||||
Gain (loss) | Gain (loss) | Gain (loss) | Gain (loss) | ||||||||
on hedging | on hedged | on hedging | on hedged | ||||||||
(In millions) | derivatives | items | derivatives | items | |||||||
Interest rate contracts | $ | 514 | $ | (594) | $ | 2,056 | $ | (2,129) | |||
Currency exchange contracts | (6) | 4 | (11) | 10 | |||||||
Fair value hedges resulted in $(82) million and $(74) million of ineffectiveness in the nine months ended September 30, 2015 and 2014, respectively. In both the nine months ended September 30, 2015 and 2014, there were insignificant amounts excluded from the assessment of effectiveness.
CASH FLOW HEDGES
We use interest rate, currency exchange and commodity derivatives to reduce the variability of expected future cash flows associated with variable rate borrowings and commercial purchase and sale transactions, including commodities. For derivatives that are designated in a cash flow hedging relationship, the effective portion of the change in fair value of the derivative is reported as a component of AOCI and reclassified into earnings contemporaneously and in the same caption with the earnings effects of the hedged transaction.
Gain (loss) reclassified | |||||||||||
Gain (loss) recognized in AOCI | from AOCI into earnings | ||||||||||
for the three months ended September 30 | for the three months ended September 30 | ||||||||||
(In millions) | 2015 | 2014 | 2015 | 2014 | |||||||
Interest rate contracts | $ | 10 | $ | 9 | $ | (39) | $ | (53) | |||
Currency exchange contracts | (132) | (318) | (69) | (361) | |||||||
Commodity contracts | (2) | (1) | (1) | - | |||||||
Total(a) | $ | (124) | $ | (310) | $ | (109) | $ | (414) | |||
| (a) | Gain (loss) is recorded in GECC revenues from services, interest and other financial charges, and other costs and expenses when reclassified to earnings. |
2015 3Q FORM 10-Q PAGE 96
Gain (loss) reclassified | |||||||||||
Gain (loss) recognized in AOCI | from AOCI into earnings | ||||||||||
for the nine months ended September 30 | for the nine months ended September 30 | ||||||||||
(In millions) | 2015 | 2014 | 2015 | 2014 | |||||||
Interest rate contracts | $ | - | $ | - | $ | (100) | $ | (182) | |||
Currency exchange contracts | (757) | (343) | (589) | (412) | |||||||
Commodity contracts | (4) | (2) | (2) | (2) | |||||||
Total(a) | $ | (761) | $ | (345) | $ | (691) | $ | (596) | |||
| (a) | Gain (loss) is recorded in GECC revenues from services, interest and other financial charges, and other costs and expenses when reclassified to earnings. |
The total pre-tax amount in AOCI related to cash flow hedges of forecasted transactions was a $173 million loss at September 30, 2015. We expect to transfer $167 million to earnings as an expense in the next 12 months contemporaneously with the earnings effects of the related forecasted transactions. In both the nine months ended September 30, 2015 and 2014, we recognized insignificant gains and losses related to hedged forecasted transactions and firm commitments that did not occur by the end of the originally specified period. At September 30, 2015 and 2014, the maximum term of derivative instruments that hedge forecasted transactions was 17 years and 18 years, respectively. See Note 11 for additional information about reclassifications out of AOCI.
For cash flow hedges, the amount of ineffectiveness in the hedging relationship and amount of the changes in fair value of the derivatives that are not included in the measurement of ineffectiveness were insignificant for each reporting period.
NET INVESTMENT HEDGES IN FOREIGN OPERATIONS
We use currency exchange derivatives and foreign-currency-denominated debt as hedging instruments to protect our net investments in global operations conducted in non-U.S. dollar currencies. For hedging instruments that are designated as hedges of net investment in a foreign operation, we assess effectiveness based on changes in spot currency exchange rates. Changes in spot rates on the hedging instruments are recorded as a component of AOCI until such time as the foreign entity is substantially liquidated or sold, or upon the loss of a controlling interest in a foreign entity. Additionally, lower of cost or fair value, less cost to sell, assessments of foreign entities classified as held for sale take into account the related AOCI. The change in fair value of any forward points, which reflects the interest rate differential between the two countries on the derivative, is excluded from the effectiveness assessment.
GAINS (LOSSES) RECOGNIZED THROUGH CTA | |||||||||||
Gain (loss) recognized in CTA | Gain (loss) reclassified from CTA | ||||||||||
for the three months ended September 30 | for the three months ended September 30 | ||||||||||
(In millions) | 2015 | 2014 | 2015 | 2014 | |||||||
Derivative and non-derivative instruments | $ | 1,297 | $ | 2,792 | $ | 1,935 | $ | (24) | |||
Reclassifications from CTA of $0 million and $(11) million were recorded in GECC revenues from services and $1,935 million and $(13) million in discontinued operations in the three months ended September 30, 2015 and 2014, respectively.
The amounts related to the change in the fair value of the forward points that are excluded from the measure of effectiveness were $(37) million and $(147) million in the three months ended September 30, 2015 and 2014, respectively, and were recorded in interest and other financial charges.
GAINS (LOSSES) RECOGNIZED THROUGH CTA | |||||||||||
Gain (loss) recognized in CTA | Gain (loss) reclassified from CTA | ||||||||||
for the nine months ended September 30 | for the nine months ended September 30 | ||||||||||
(In millions) | 2015 | 2014 | 2015 | 2014 | |||||||
Derivative and non-derivative instruments | $ | 4,720 | $ | 2,194 | $ | 2,524 | $ | (14) | |||
2015 3Q FORM 10-Q PAGE 97
Reclassifications from CTA of $(34) million and $(11)million were recorded in GECC revenues from services and $2,558 million and $(3) million in discontinued operations in the nine months ended September 30, 2015 and 2014, respectively.
The amounts related to the change in the fair value of the forward points that are excluded from the measure of effectiveness were $(93) million and $(458) million in the nine months ended September 30, 2015 and 2014, respectively, and were recorded in interest and other financial charges.
FREE-STANDING DERIVATIVES
Changes in the fair value of derivatives that are not designated as hedges are recorded in earnings each period. As discussed above, these derivatives are typically entered into as economic hedges of changes in interest rates, currency exchange rates, commodity prices and other risks. Gains or losses related to the derivative are typically recorded in GECC revenues from services or other income, based on our accounting policy. In general, the earnings effects of the item that represent the economic risk exposure are recorded in the same caption as the derivative. Gains (losses) for the nine months ended September 30, 2015 on derivatives not designated as hedges were $(2,647) million composed of amounts related to interest rate contracts of $(101) million, currency exchange contracts of $(2,492) million, and other derivatives of $(54) million. Substantially all of these losses were offset by the earnings effects from the underlying items that were economically hedged. Gains (losses) for the nine months ended September 30, 2014 on derivatives not designated as hedges were $(578) million composed of amounts related to interest rate contracts of $(53) million, currency exchange contracts of $(565) million and other derivatives of $40 million. These losses were offset by the earnings effects from the underlying items that were economically hedged.
COUNTERPARTY CREDIT RISK
Fair values of our derivatives can change significantly from period to period based on, among other factors, market movements and changes in our positions. We manage counterparty credit risk (the risk that counterparties will default and not make payments to us according to the terms of our agreements) on an individual counterparty basis. Where we have agreed to netting of derivative exposures with a counterparty, we net our exposures with that counterparty and apply the value of collateral posted to us to determine the exposure. We actively monitor these net exposures against defined limits and take appropriate actions in response, including requiring additional collateral.
As discussed above, we have provisions in certain of our master agreements that require counterparties to post collateral (typically, cash or U.S. Treasury securities) when our receivable due from the counterparty, measured at current market value, exceeds a specified limit. The fair value of such collateral was $4,552 million at September 30, 2015, of which $2,858 million was cash and $1,694 million was in the form of securities held by a custodian for our benefit. Under certain of these same agreements, we post collateral to our counterparties for our derivative obligations, the fair value of which was $895 million at September 30, 2015. At September 30, 2015, our exposure to counterparties (including accrued interest), net of collateral we hold, was $1,148 million. This excludes exposure related to embedded derivatives.
Additionally, our master agreements typically contain mutual downgrade provisions that provide the ability of each party to require termination if the long-term credit rating of the counterparty were to fall below A-/A3. In certain of these master agreements, each party also has the ability to require termination if the short-term rating of the counterparty were to fall below A-1/P-1. Our master agreements also typically contain provisions that provide termination rights upon the occurrence of certain other events, such as a bankruptcy or events of default by one of the parties. If an agreement was terminated under any of these circumstances, the termination amount payable would be determined on a net basis and could also take into account any collateral posted. The net amount of our derivative liability, after consideration of collateral posted by us and outstanding interest payments was $540 million at September 30, 2015. This excludes embedded derivatives.
2015 3Q FORM 10-Q PAGE 98
NOTE 16. VARIABLE INTEREST ENTITIES
We use variable interest entities primarily to securitize financial assets and arrange other forms of asset-backed financing in the ordinary course of business. Investors in these entities only have recourse to the assets owned by the entity and not to our general credit. We do not have implicit support arrangements with any VIE. We did not provide non-contractual support for previously transferred financing receivables to any VIE in 2015 or 2014.
CONSOLIDATED VARIABLE INTEREST ENTITIES
We consolidate VIEs because we have the power to direct the activities that significantly affect the VIE's economic performance, typically because of our role as either servicer or manager for the VIE. Our consolidated VIEs fall into two main groups, which are further described below:
| Consolidated Securitization Entities (CSEs) were created to facilitate securitization of financial assets and other forms of asset-backed financing that serve as an alternative funding source by providing access to variable funding notes and term markets. The securitization transactions executed with these entities are similar to those used by many financial institutions and all are non-recourse. We provide servicing for substantially all of the assets in these entities. |
The financing receivables in these entities have similar risks and characteristics to our other financing receivables and were underwritten to the same standard. Accordingly, the performance of these assets has been similar to our other financing receivables; however, the blended performance of the pools of receivables in these entities reflects the eligibility criteria that we apply to determine which receivables are selected for transfer. Contractually the cash flows from these financing receivables must first be used to pay third-party debt holders as well as other expenses of the entity. Excess cash flows are available to GE and GECC. The creditors of these entities have no claim on other assets of GE or GECC.
| Other remaining assets and liabilities of consolidated VIEs relate primarily to three categories of entities: (1) joint ventures that lease equipment with $466 million of assets and $466 million of liabilities; (2) other entities that are involved in power generating and leasing activities with $331 million of assets and $187 million of liabilities; and (3) insurance entities that, among other lines of business, provide property and casualty and workers' compensation coverage for GE with $1,126 million of assets and $564 million of liabilities. |
2015 3Q FORM 10-Q PAGE 99
ASSETS AND LIABILITIES OF CONSOLIDATED VIEs | ||||||||||||||
Consolidated Securitization Entities(b) | ||||||||||||||
Trade | ||||||||||||||
(In millions) | Trinity(a) | Credit cards | receivables | Other | Total | |||||||||
September 30, 2015 | ||||||||||||||
Assets(c) | ||||||||||||||
Financing receivables, net | $ | - | $ | 24,036 | $ | - | $ | 531 | $ | 24,567 | ||||
Current receivables | - | - | 3,134 | (d) | 489 | 3,623 | ||||||||
Investment securities | 401 | - | - | 1,011 | 1,412 | |||||||||
Other assets | 45 | 144 | 2 | 2,002 | 2,193 | |||||||||
Total | $ | 446 | $ | 24,180 | $ | 3,136 | $ | 4,033 | $ | 31,795 | ||||
Liabilities(c) | ||||||||||||||
Borrowings | $ | - | $ | - | $ | - | $ | 990 | $ | 990 | ||||
Non-recourse borrowings | - | 13,640 | 2,516 | 69 | 16,225 | |||||||||
Other liabilities | 193 | 20 | 28 | 1,282 | 1,523 | |||||||||
Total | $ | 193 | $ | 13,660 | $ | 2,544 | $ | 2,341 | $ | 18,738 | ||||
December 31, 2014 | ||||||||||||||
Assets(c) | ||||||||||||||
Financing receivables, net | $ | - | $ | 25,645 | $ | - | $ | 1,030 | $ | 26,675 | ||||
Current receivables | - | - | 3,028 | (d) | 509 | 3,537 | ||||||||
Investment securities | 2,369 | - | - | 1,005 | 3,374 | |||||||||
Other assets | 17 | 1,059 | 2 | 2,345 | 3,423 | |||||||||
Total | $ | 2,386 | $ | 26,704 | $ | 3,030 | $ | 4,889 | $ | 37,009 | ||||
Liabilities(c) | ||||||||||||||
Borrowings | $ | - | $ | - | $ | - | $ | 517 | $ | 517 | ||||
Non-recourse borrowings | - | 14,967 | 2,692 | 436 | 18,095 | |||||||||
Other liabilities | 1,022 | 332 | 26 | 1,490 | 2,870 | |||||||||
Total | $ | 1,022 | $ | 15,299 | $ | 2,718 | $ | 2,443 | $ | 21,482 | ||||
(a) | Excluded intercompany advances from GECC to Trinity, which were eliminated in consolidation of $15 million and $1,565 million at September 30, 2015 and December 31, 2014, respectively. |
(b) | We provide servicing to the CSEs and are contractually permitted to commingle cash collected from customers on financing receivables sold to CSE investors with our own cash prior to payment to a CSE, provided our short-term credit rating does not fall below A-1/P-1. These CSEs also owe us amounts for purchased financial assets and scheduled interest and principal payments. At September 30, 2015 and December 31, 2014, the amounts of commingled cash owed to the CSEs were $939 million and $1,091 million, respectively, and the amounts owed to us by CSEs were $170 million and $391 million, respectively. |
(c) | Asset amounts exclude intercompany receivables for cash collected on behalf of the entities by GECC as servicer, which are eliminated in consolidation. Such receivables provide the cash to repay the entities' liabilities. If these intercompany receivables were included in the table above, assets would be higher. In addition, other assets, borrowings and other liabilities exclude intercompany balances that are eliminated in consolidation. |
(d) | Included $724 million and $686 million of receivables at September 30, 2015 and December 31, 2014, respectively, originated by Appliances. We require third party debt holder consent to sell these assets. The receivables will be included in assets of businesses held for sale when the consent is received. |
Total revenues from our consolidated VIEs were $1,635 million and $1,792 million in the three months ended September 30, 2015 and 2014, respectively, and $5,049 million and $4,966 million in the nine months ended September 30, 2015 and 2014, respectively. Related expenses consisted primarily of provisions for losses of $189 million and $244 million in the three months ended September 30, 2015 and 2014, respectively, and $714 million and $791 million in the nine months ended September 30, 2015 and 2014, respectively, and interest and other financial charges of $78 million and $70 million in the three months ended September 30, 2015 and 2014, respectively and $218 million and $197 million in the nine months ended September 30, 2015 and 2014, respectively. These amounts do not include intercompany revenues and costs, principally fees and interest between GE and the VIEs, which are eliminated in consolidation.
2015 3Q FORM 10-Q PAGE 100
INVESTMENTS IN UNCONSOLIDATED VARIABLE INTEREST ENTITIES
Our involvement with unconsolidated VIEs consists of the following activities: assisting in the formation and financing of the entity; providing recourse and/or liquidity support; servicing the assets; and receiving variable fees for services provided. We are not required to consolidate these entities because the nature of our involvement with the activities of the VIEs does not give us power over decisions that significantly affect their economic performance.
The classification of our variable interests in these entities in our financial statements is based on the nature of the entity and the characteristics of the investment we hold.
INVESTMENTS IN UNCONSOLIDATED VIEs | |||||
(In millions) | September 30, 2015 | December 31, 2014 | |||
Other assets and investment securities | $ | 810 | $ | 806 | |
Financing receivables – net | 10 | 120 | |||
Total investments | 820 | 926 | |||
Contractual obligations to fund investments, guarantees or revolving lines of credit | 99 | 37 | |||
Total | $ | 919 | $ | 963 | |
In addition to the entities included in the table above, we also hold passive investments in RMBS, CMBS and asset-backed securities issued by VIEs. Such investments were, by design, investment-grade at issuance and held by a diverse group of investors. Further information about such investments is provided in Note 3.
2015 3Q FORM 10-Q PAGE 101
NOTE 17. INTERCOMPANY TRANSACTIONS
Transactions between related companies are made on an arms-length basis, are eliminated and consist primarily of GECC dividends to GE; GE customer receivables sold to GECC; GECC services for trade receivables management and material procurement; buildings and equipment (including automobiles) leased between GE and GECC; information technology (IT) and other services sold to GECC by GE; aircraft engines manufactured by GE that are installed on aircraft purchased by GECC from third-party producers for lease to others; and various investments, loans and allocations of GE corporate overhead costs.
These intercompany transactions are reported in the GE and GECC columns of our financial statements, but are eliminated in deriving our consolidated financial statements. Effects of these eliminations on our consolidated cash flows from operating, investing and financing activities are $(413) million, $(56) million and $469 million in the nine months ended September 30 , 2015, and $(2,782) million, $(797) million and $3,579 million in the nine months ended September 30 , 2014, respectively. Details of these eliminations are shown below.
Nine months ended September 30 | |||||
(In millions) | 2015 | 2014 | |||
Cash from (used for) operating activities-continuing operations | |||||
Combined | $ | 10,478 | $ | 13,950 | |
GE customer receivables sold to GECC | 162 | 43 | |||
GECC dividends to GE | (450) | (2,221) | |||
Other reclassifications and eliminations | (125) | (604) | |||
$ | 10,065 | $ | 11,168 | ||
Cash from (used for) investing activities-continuing operations | |||||
Combined | $ | 52,597 | $ | 2,465 | |
GE customer receivables sold to GECC | (243) | (948) | |||
Other reclassifications and eliminations | 187 | 151 | |||
$ | 52,541 | $ | 1,668 | ||
Cash from (used for) financing activities-continuing operations | |||||
Combined | $ | (45,781) | $ | (16,198) | |
GE customer receivables sold to GECC | 81 | 905 | |||
GECC dividends to GE | 450 | 2,221 | |||
Other reclassifications and eliminations | (62) | 453 | |||
$ | (45,312) | $ | (12,619) | ||
2015 3Q FORM 10-Q PAGE 102
NOTE 18. SUPPLEMENTAL INFORMATION ABOUT THE CREDIT QUALITY OF FINANCING RECEIVABLES AND ALLOWANCE FOR LOSSES
As described in Note 5, our Consumer portfolio has been significantly reduced as all of our non-U.S. consumer financing receivables have been reclassified to either financing receivables held for sale or assets of businesses held for sale. In addition our Real Estate business and most of our CLL business have been classified as discontinued operations.
CREDIT QUALITY INDICATORS
Detailed information about the credit quality of our Commercial and Consumer financing receivables portfolios is provided below. For each portfolio, we describe the characteristics of the financing receivables and provide information about collateral, payment performance, credit quality indicators and impairment. We manage these portfolios using delinquency and nonaccrual data as key performance indicators. The categories used within this section such as impaired loans, troubled debt restructuring (TDR) and nonaccrual financing receivables are defined by the authoritative guidance and we base our categorization on the related scope and definitions contained in the related standards. The categories of nonaccrual and delinquent are used in our process for managing our financing receivables.
PAST DUE AND NONACCRUAL FINANCING RECEIVABLES | ||||||||||||||||
September 30, 2015 | December 31, 2014 | |||||||||||||||
Over 30 days | Over 90 days | Over 30 days | Over 90 days | |||||||||||||
(In millions) | past due | past due | Nonaccrual | past due | past due | Nonaccrual | ||||||||||
Commercial | ||||||||||||||||
CLL | $ | 655 | $ | 174 | $ | 27 | $ | 610 | $ | 131 | $ | 25 | ||||
Energy Financial Services | 63 | 63 | 82 | - | - | 68 | ||||||||||
GECAS | 2 | - | 195 | - | - | 419 | ||||||||||
Total Commercial | 720 | 237 | 304 | (a) | 610 | 131 | 512 | (a) | ||||||||
Consumer | 2,553 | 1,102 | (b) | 2 | (c) | 5,137 | 2,495 | (b) | 1,484 | (c) | ||||||
Total | $ | 3,273 | $ | 1,339 | $ | 306 | $ | 5,747 | $ | 2,626 | $ | 1,996 | ||||
Total as a percent of financing receivables | 3.8 % | 1.5 % | 0.4 % | 4.5 % | 2.1 % | 1.6 % | ||||||||||
| (a) | Included $228 million and $484 million at September 30, 2015 and December 31, 2014, respectively, which are currently paying in accordance with their contractual terms. |
(b) | Included $1,100 million and $1,231 million of Consumer loans at September 30, 2015 and December 31, 2014, respectively, which are over 90 days past due and continue to accrue interest until the accounts are written off in the period that the account becomes 180 days past due. |
(c) | Included none and $179 million at September 30, 2015 and December 31, 2014, respectively, which are currently paying in accordance with their contractual terms. |
2015 3Q FORM 10-Q PAGE 103
IMPAIRED LOANS AND RELATED RESERVES | |||||||||||||||||||
With no specific allowance | With a specific allowance | ||||||||||||||||||
Recorded | Unpaid | Average | Recorded | Unpaid | Average | ||||||||||||||
investment | principal | investment | investment | principal | Associated | investment | |||||||||||||
(In millions) | in loans | balance | in loans | in loans | balance | allowance(a) | in loans | ||||||||||||
September 30, 2015 | |||||||||||||||||||
Commercial | |||||||||||||||||||
CLL | $ | 11 | $ | 11 | $ | 11 | $ | 5 | $ | 5 | $ | 3 | $ | 5 | |||||
Energy Financial Services | 82 | 100 | 54 | - | - | - | 6 | ||||||||||||
GECAS | 116 | 122 | 213 | - | - | - | - | ||||||||||||
Other | - | - | - | - | - | - | - | ||||||||||||
Total Commercial(b) | 209 | 233 | 278 | 5 | 5 | 3 | 11 | ||||||||||||
Consumer(c) | - | - | 35 | 736 | 640 | (d) | 242 | 1,055 | |||||||||||
Total | $ | 209 | $ | 233 | $ | 313 | $ | 741 | $ | 645 | $ | 245 | $ | 1,066 | |||||
December 31, 2014 | |||||||||||||||||||
Commercial | |||||||||||||||||||
CLL | $ | 10 | $ | 10 | $ | 7 | $ | 5 | $ | 5 | $ | 4 | $ | 4 | |||||
Energy Financial Services | 53 | 54 | 26 | 15 | 15 | 12 | 24 | ||||||||||||
GECAS | 329 | 337 | 88 | - | - | - | 15 | ||||||||||||
Other | - | - | - | - | - | - | 1 | ||||||||||||
Total Commercial(b) | 392 | 401 | 121 | 20 | 20 | 16 | 44 | ||||||||||||
Consumer(c) | 138 | 179 | 120 | 2,042 | 2,092 | 408 | 2,547 | ||||||||||||
Total | $ | 530 | $ | 580 | $ | 241 | $ | 2,062 | $ | 2,112 | $ | 424 | $ | 2,591 | |||||
(a) | Write-offs to net realizable value are recognized against the allowance for losses primarily in the reporting period in which management has deemed all or a portion of the financing receivable to be uncollectible. |
(b) | We recognized insignificant amounts of interest income, including none on a cash basis, in the nine months ended September 30, 2015, the year ended December 31, 2014 and the nine months ended September 30, 2014, respectively, in CLL. The total average investment in impaired loans for the nine months ended September 30, 2015 and the year ended December 31, 2014 was $289 million and $165 million, respectively. |
(c) | We recognized $48 million, $126 million and $135 million of interest income, including $1 million, $5 million and $3 million on a cash basis, in the nine months ended September 30, 2015, the year ended December 31, 2014 and the nine months ended September 30, 2014, respectively. The total average investment in impaired loans for the nine months ended September 30, 2015 and the year ended December 31, 2014 was $1,090 million and $2,667 million, respectively. |
(d) | Unpaid principal balance excludes accrued interest and fees. |
(In millions) | Non-impaired financing receivables | General reserves | Impaired loans | Specific reserves | |||||||
September 30, 2015 | |||||||||||
Commercial | $ | 23,470 | $ | 82 | $ | 214 | $ | 3 | |||
Consumer | 62,784 | 3,130 | 736 | 242 | |||||||
Total | $ | 86,254 | $ | 3,212 | $ | 950 | $ | 245 | |||
December 31, 2014 | |||||||||||
Commercial | $ | 25,329 | $ | 77 | $ | 412 | $ | 16 | |||
Consumer | 98,640 | 3,603 | 2,180 | 408 | |||||||
Total | $ | 123,969 | $ | 3,680 | $ | 2,592 | $ | 424 | |||
2015 3Q FORM 10-Q PAGE 104
IMPAIRED LOAN BALANCE CLASSIFIED BY THE METHOD USED TO MEASURE IMPAIRMENT | |||||||||||
(In millions) | September 30, 2015 | December 31, 2014 | |||||||||
Discounted cash flow | $ | 819 | $ | 2,149 | |||||||
Collateral value | 131 | 443 | |||||||||
Total | $ | 950 | $ | 2,592 | |||||||
Our loss mitigation strategy is intended to minimize economic loss and, at times, can result in rate reductions, principal forgiveness, extensions, forbearance or other actions, which may cause the related loan to be classified as a troubled debt restructuring (TDR), and also as impaired. The determination of whether these changes to the terms and conditions of our commercial loans meet the TDR criteria includes our consideration of all relevant facts and circumstances. At September 30, 2015, TDRs included in impaired loans were $860 million, primarily relating to Consumer ($736 million), GECAS ($112 million), Energy Financial Services ($7 million) and CLL ($5 million).
Impaired loans in our Consumer business represent restructured smaller balance homogeneous loans meeting the definition of a TDR, and are therefore subject to the disclosure requirement for impaired loans. Impaired loans classified as TDRs in our Consumer business were $736 million and $2,132 million at September 30, 2015 and December 31, 2014, respectively. We utilize certain loan modification programs for borrowers experiencing financial difficulties in our Consumer loan portfolio. These loan modification programs primarily include interest rate reductions and payment deferrals in excess of three months, which were not part of the terms of the original contract. For the nine months ended September 30, 2015, we modified $363 million of U.S. consumer loans, primarily credit cards for borrowers experiencing financial difficulties, which are classified as TDRs. We expect borrowers whose loans have been modified under these programs to continue to be able to meet their contractual obligations upon the conclusion of the modification. Of our $621 million and $1,074 million of consumer loans modifications classified as TDRs in the twelve months ended September 30, 2015 and 2014, respectively, $49 million and $95 million have subsequently experienced a payment default in the nine months ended September 30, 2015 and 2014, respectively.
SUPPLEMENTAL CREDIT QUALITY INFORMATION
COMMERCIAL
Substantially all of our Commercial financing receivables portfolio is secured lending and we assess the overall quality of the portfolio based on the potential risk of loss measure. The metric incorporates both the borrower's credit quality along with any related collateral protection.
Our internal risk ratings process is an important source of information in determining our allowance for losses and represents a comprehensive approach to evaluate risk in our financing receivables portfolios. In deriving our internal risk ratings, we stratify our Commercial portfolios into 21 categories of default risk and/or six categories of loss given default to group into three categories: A, B and C. Our process starts by developing an internal risk rating for our borrowers, which is based upon our proprietary models using data derived from borrower financial statements, agency ratings, payment history information, equity prices and other commercial borrower characteristics. We then evaluate the potential risk of loss for the specific lending transaction in the event of borrower default, which takes into account such factors as applicable collateral value, historical loss and recovery rates for similar transactions, and our collection capabilities. Our internal risk ratings process and the models we use are subject to regular monitoring and internal controls. The frequency of rating updates is set by our credit risk policy, which requires annual Risk Committee approval.
As described above, financing receivables are assigned one of 21 risk ratings based on our process and then these are grouped by similar characteristics into three categories in the table below. Category A is characterized by either high-credit-quality borrowers or transactions with significant collateral coverage that substantially reduces or eliminates the risk of loss in the event of borrower default. Category B is characterized by borrowers with weaker credit quality than those in Category A, or transactions with moderately strong collateral coverage that minimizes but may not fully mitigate the risk of loss in the event of default. Category C is characterized by borrowers with higher levels of default risk relative to our overall portfolio or transactions where collateral coverage may not fully mitigate a loss in the event of default.
2015 3Q FORM 10-Q PAGE 105
COMMERCIAL FINANCING RECEIVABLES BY RISK CATEGORY | |||||||||||
Secured | |||||||||||
(In millions) | A | B | C | Total | |||||||
September 30, 2015 | |||||||||||
CLL | $ | 13,260 | $ | 44 | $ | 37 | $ | 13,341 | |||
Energy Financial Services | 2,301 | 41 | - | 2,342 | |||||||
GECAS | 7,076 | 225 | 93 | 7,394 | |||||||
Other | 153 | - | - | 153 | |||||||
Total | $ | 22,790 | $ | 310 | $ | 130 | $ | 23,230 | |||
December 31, 2014 | |||||||||||
CLL | $ | 14,271 | $ | 49 | $ | 98 | $ | 14,418 | |||
Energy Financial Services | 2,479 | 60 | 16 | 2,555 | |||||||
GECAS | 7,908 | 237 | 118 | 8,263 | |||||||
Other | 130 | - | - | 130 | |||||||
Total | $ | 24,788 | $ | 346 | $ | 232 | $ | 25,366 | |||
For our secured financing receivables portfolio, our collateral position and ability to work out problem accounts mitigate our losses. Our asset managers have deep industry expertise that enables us to identify the optimum approach to default situations. We price risk premiums for weaker credits at origination, closely monitor changes in creditworthiness through our risk ratings and watch list process, and are engaged early with deteriorating credits to minimize economic loss. Loans within Category C are reviewed and monitored regularly, and classified as impaired when it is probable that they will not pay in accordance with contractual terms. Our internal risk rating process identifies credits warranting closer monitoring; and as such, these loans are not necessarily classified as nonaccrual or impaired.
At September 30, 2015 and December 31, 2014, our unsecured commercial financing receivables included $165 million and $88 million rated A, and $289 million and $287 million rated B, respectively. We did not have any unsecured commercial financing receivables rated C at September 30, 2015 and December 31, 2014, respectively.
CONSUMER
At September 30, 2015, our U.S. consumer financing receivables included private-label credit card and sales financing for approximately 63 million customers across the U.S. with no metropolitan area accounting for more than 6% of the portfolio. Of the total U.S. consumer financing receivables, approximately 66% relate to credit card loans that are often subject to profit and loss sharing arrangements with the retailer (which are recorded in revenues), and the remaining 34% are sales finance receivables that provide financing to customers in areas such as electronics, recreation, medical and home improvement.
Our Consumer financing receivables portfolio comprises both secured and unsecured lending. Secured financing receivables are largely comprised of consumer installment loans secured by equipment. Unsecured financing receivables include private-label credit card financing. A substantial majority of these cards are not for general use and are limited to the products and services sold by the retailer. The private-label portfolio is diverse with no metropolitan area accounting for more than 5% of the related portfolio.
We assess overall credit quality of our U.S. installment and revolving credit portfolio using information from credit bureaus such as Fair Isaac Corporation (FICO) scores. FICO scores are generally obtained at origination of the account and are refreshed at a minimum quarterly, but could be as often as weekly, to assist in predicting customer behavior. We categorize these credit scores into the following three categories; (a) 661 or higher, which are considered the strongest credits; (b) 601 to 660, which are considered moderate credit risk; and (c) 600 or less, which are considered weaker credits.
Refreshed FICO score | |||||||||||||||||
September 30, 2015 | December 31, 2014 | ||||||||||||||||
661 or | 601 to | 600 or | 661 or | 601 to | 600 or | ||||||||||||
(in millions) | higher | 660 | less | higher | 660 | less | |||||||||||
U.S. installment and | |||||||||||||||||
revolving credit | $ | 45,383 | $ | 12,304 | $ | 4,403 | $ | 43,466 | $ | 11,865 | $ | 4,532 | |||||
2015 3Q FORM 10-Q PAGE 106
U.S. installment and revolving credit accounts with FICO scores of 600 or less have an average outstanding balance less than one thousand U.S. dollars and are primarily concentrated in our retail card and sales financing portfolios, which minimizes the potential for loss in the event of default. For lower credit scores, we adequately price for the incremental risk at origination and monitor credit migration through our risk ratings process. We continuously adjust our credit line underwriting management and collection strategies based on customer behavior and risk profile changes.
For our Consumer - Other portfolio, we develop our internal risk ratings for this portfolio in a manner consistent with the process used to develop our Commercial credit quality indicators, described above. We use the borrower's credit quality and underlying collateral strength to determine the potential risk of loss from these activities.
At September 30, 2015, Consumer - Other financing receivables of $1,138 million, $117 million and $175 million were rated A, B and C, respectively. At December 31, 2014, Consumer – Other financing receivables of $5,006 million, $276 million and $382 million were rated A, B and C, respectively.
2015 3Q FORM 10-Q PAGE 107
EXHIBITS
Exhibit 11 Exhibit 12
| Computation of Per Share Earnings.*
Computation of Ratio of Earnings to Fixed Charges.
| |
Exhibit 31(a)
| Certification Pursuant to Rules 13a14(a) or 15d14(a) under the Securities Exchange Act of 1934, as Amended.
| |
Exhibit 31(b)
| Certification Pursuant to Rules 13a14(a) or 15d14(a) under the Securities Exchange Act of 1934, as Amended.
| |
Exhibit 32
| Certification Pursuant to 18 U.S.C. Section 1350.
| |
Exhibit 99(a)
| Financial Measures That Supplement Generally Accepted Accounting Principles.
| |
Exhibit 99(b)
| Computation of Ratio of Earnings to Fixed Charges (Incorporated by reference to Exhibit 12 to General Electric Capital Corporation's Quarterly Report on Form 10-Q for the fiscal quarter ended September 30, 2015 (Commission file number 001-06461)).
| |
Exhibit 101
| The following materials from General Electric Company's Quarterly Report on Form 10-Q for the quarter ended September 30, 2015, formatted in XBRL (eXtensible Business Reporting Language); (i) Statement of Earnings (Loss) for the three and nine months ended September 30, 2015 and 2014, (ii) Consolidated Statement of Comprehensive Income (Loss) for the three and nine months ended September 30, 2015 and 2014, (iii) Consolidated Statement of Changes in Shareowners' Equity for the nine months ended September 30, 2015 and 2014, (iv) Statement of Financial Position at September 30, 2015 and December 31, 2014, (v) Statement of Cash Flows for the nine months ended September 30, 2015 and 2014, and (vi) Notes to Consolidated Financial Statements.
| |
* | Data required by Financial Accounting Standards Board Accounting Standards Codification 260, Earnings Per Share , is provided in Note 13 to the Consolidated Financial Statements in this Report.
| |
2015 3Q FORM 10-Q PAGE 108
FORM 10-Q CROSS REFERENCE INDEX
Item Number |
| Page(s) | ||
Part I – FINANCIAL INFORMATION | ||||
Item 1. | Financial Statements | 53-107 | ||
Item 2. | Management's Discussion and Analysis of Financial Condition and Results of Operations | 5-48,50 | ||
Item 3. | Quantitative and Qualitative Disclosures About Market Risk | Not applicable(a) | ||
Item 4. | Controls and Procedures | 49 | ||
Part II – OTHER INFORMATION | ||||
Item 1. | Legal Proceedings | 51-52 | ||
Item 1A. | Risk Factors | Not applicable(b) | ||
Item 2. | Unregistered Sales of Equity Securities and Use of Proceeds | 49 | ||
Item 3. | Defaults Upon Senior Securities | Not applicable | ||
Item 4. | Mine Safety Disclosures | Not applicable | ||
Item 5. | Other Information | Not applicable | ||
Item 6. | Exhibits | 108 | ||
Signatures | 110 | |||
(a) | There have been no significant changes to our market risk since December 31, 2014. For a discussion of our exposure to market risk, refer to our Annual Report on Form 10-K for the year ended December 31, 2014. |
(b) | There have been no significant changes to our risk factors since December 31, 2014. For a discussion of our risk factors, refer to our Annual Report on Form 10-K for the year ended December 31, 2014. |
2015 3Q FORM 10-Q PAGE 109
SIGNATURES
Pursuant to the requirements of the Securities Exchange Act of 1934, the registrant has duly caused this report to be signed on its behalf by the undersigned thereunto duly authorized.
General Electric Company
| |||
October 30, 2015 | /s/ Jan R. Hauser | ||
Date | Jan R. Hauser Vice President and Controller Duly Authorized Officer and Principal Accounting Officer
|
2015 3Q FORM 10-Q PAGE 110