UNITED STATES
SECURITIES AND EXCHANGE COMMISSION
WASHINGTON, D.C. 20549
Form 10-K
| x Annual Report pursuant to Section 13 or 15(d) of the Securities Exchange Act of 1934 |
| For the fiscal year ended August 31, 2012 |
| ¨ Transition Report pursuant to Section 13 or 15(d) of the Securities Exchange Act of 1934 |
| For the transition period from to |
Commission File Number: 1-11869
FACTSET RESEARCH SYSTEMS INC.
(Exact name of registrant as specified in its charter)
Delaware (State or other jurisdiction of incorporation or organization) | 13-3362547 (I.R.S. Employer Identification No.) |
601 Merritt 7, Norwalk, Connecticut 06851
(Address of principal executive office, including zip code)
Registrant's telephone number, including area code: (203) 810-1000
Securities registered pursuant to Section 12(b) of the Act: Common Stock, par value $0.01 per share
Name of each exchange on which registered: New York Stock Exchange and The NASDAQ Stock Market LLC
Securities registered pursuant to Section 12(g) of the Act: None
Indicate by check mark if the registrant is a well-known seasoned issuer, as defined in Rule 405 of the Securities Act. Yes ý No o
Indicate by check mark if the registrant is not required to file reports pursuant to Section 13 or Section 15(d) of the Act. Yes o No ý
Indicate by check mark whether the registrant (1) has filed all reports required to be filed by Section 13 or 15(d) of the Securities Exchange Act of 1934 during the preceding 12 months (or for such shorter period that the registrant was required to file such reports), and (2) has been subject to such filing requirements for the past 90 days. Yes ý No o
Indicate by check mark whether the registrant has submitted electronically and posted on its corporate Web site, if any, every Interactive Data File required to be submitted and posted pursuant to Rule 405 of Regulation S-T (§ 232.405 of this chapter) during the preceding 12 months (or for such shorter period that the registrant was required to submit and post such files). Yes ý No ¨
Indicate by check mark if disclosure of delinquent filers pursuant to Item 405 of Regulation S-K is not contained herein, and will not be contained, to the best of registrant's knowledge, in definitive proxy or information statements incorporated by reference in Part III of this Form 10-K or any amendment to this Form 10-K. ¨
Indicate by check mark whether the registrant is a large accelerated filer, an accelerated filer, a non-accelerated filer or a smaller reporting company. See definition of "large accelerated filer," "accelerated filer" and "smaller reporting company" in Rule 12b-2 of the Exchange Act.
| Large accelerated filer ý | Accelerated filer o | |
| Non-Accelerated filer o (Do not check if a smaller reporting company) | Smaller Reporting Company o | |
Indicate by check mark whether the registrant is a shell company (as defined in Exchange Act Rule 12b-2). Yes o No ý
The aggregate market value of the registrant's common stock held by non-affiliates of the registrant based upon the closing price of a share of the registrant's common stock on February 29, 2012, the last business day of the registrant's most recently completed second fiscal quarter, as reported by the New York Stock Exchange on that date, was $3,598,639,975.
The number of shares outstanding of the registrant's common stock, as of October 22, 2012, was 44,259,635.
DOCUMENTS INCORPORATED BY REFERENCE
Portions of the registrant's definitive Proxy Statement dated October 30, 2012, for the Fiscal 2012 Annual Meeting of Stockholders to be held on December 18, 2012, are incorporated by reference into Part III of this Annual Report on Form 10-K where indicated.
2
FACTSET RESEARCH SYSTEMS INC.
FORM 10-K
For The Fiscal Year Ended August 31, 2012
PART I
| Page | ||
ITEM 1. | Business |
| 4 |
ITEM 1A. | Risk Factors |
| 15 |
ITEM 1B. | Unresolved Staff Comments |
| 20 |
ITEM 2. | Properties |
| 20 |
ITEM 3. | Legal Proceedings |
| 21 |
ITEM 4. | Mine Safety Disclosures |
| 21 |
PART II | |||
ITEM 5. | Market for Registrant's Common Equity, Related Stockholder Matters and Issuer Purchases of Equity Securities |
| 22 |
ITEM 6. | Selected Financial Data |
| 24 |
ITEM 7. | Management's Discussion and Analysis of Financial Condition and Results of Operation s |
| 25 |
ITEM 7A. | Quantitative and Qualitative Disclosures About Market Risk |
| 48 |
ITEM 8. | Financial Statements and Supplementary Data |
| 49 |
ITEM 9. | Changes in and Disagreements with Accountants on Accounting and Financial Disclosure |
| 88 |
ITEM 9A. | Controls and Procedures |
| 88 |
ITEM 9B. | Other Information |
| 88 |
PART III | |||
ITEM 10. | Directors, Executive Officers and Corporate Governance |
| 89 |
ITEM 11. | Executive Compensation |
| 89 |
ITEM 12. | Security Ownership of Certain Beneficial Owners and Management and Related Stockholder Matters |
| 89 |
ITEM 13. | Certain Relationships and Related Transactions , and Director Independence |
| 89 |
ITEM 14. | Principal Accounting Fees and Services |
| 89 |
PART IV | |||
ITEM 15. | Exhibits and Financial Statement Schedules |
| 90 |
Signatures |
| 92 | |
3
Part I
I TEM 1. BUSINESS
Overview
FactSet Research Systems Inc. (the "Company" or "FactSet") is a provider of integrated financial information and analytical applications to the global investment community. FactSet combines content regarding companies and securities from major markets all over the globe into a single online platform of information and analytics. By consolidating content from hundreds of databases with powerful analytics, FactSet supports the investment process from initial research to published results for buy and sell-side professionals. These professionals include portfolio managers, research and performance analysts, risk managers, marketing professionals, sell-side equity research professionals, investment bankers and fixed income professionals. The Company's applications provide users access to company analysis, multicompany comparisons, industry analysis, company screening, portfolio analysis, predictive risk measurements, alphatesting, portfolio optimization and simulation, real-time news and quotes and tools to value and analyze fixed income securities and portfolios. With Microsoft Office integration, wireless access and customizable options, FactSet offers a complete financial workflow solution. The Company's revenues are derived from subscriptions to services such as workstations, content and applications.
Fiscal 2012 was the Company's 34 th year of operation, its 32 nd consecutive year of revenue growth and its 16 th consecutive year of positive earnings growth as a public company. In the past 12 months, FactSet has become faster and more relevant to a broader range of users as the Company continues to dedicate itself to building tools to support a variety of user workflows from traditional Asset Management clients to Wealth Managers, Mergers & Acquisitions, Advisory, Sales & Trading, Hedge Funds and Private Equity/Venture Capital. FactSet is on the desktops of many of the largest and most successful financial companies in the world. Its unique applications free global professionals from having to gather and collate financial and economic data, which allows them more time to analyze the data and increase their productivity.
Highlights
| · | Founded in 1978, public since 1996 |
| · | Dual listed on the New York Stock Exchange and the NASDAQ Stock Market under the symbol "FDS" |
| · | $4 billion market capitalization |
| · | 26 locations in 12 countries with 5,735 employees |
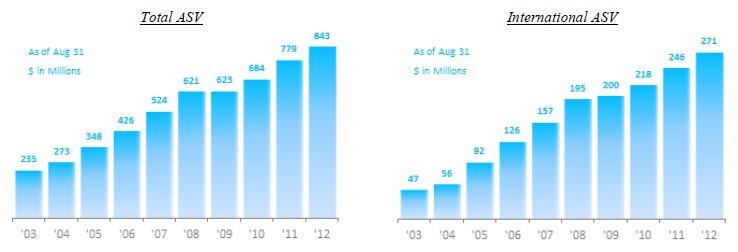
| · | Annual subscription value ("ASV") of $843 million as of August 31, 2012 |
| · | 2,392 clients and 49,500 users |
| · | More than 800 data sets and databases, 85 data suppliers, 130 news sources and 100 exchanges |
| · | 32 consecutive years of revenue growth |
| · | 16 consecutive years of positive earnings growth as a public company |
| · | 10 consecutive years of operating margins greater than 31% |
| · | Revenues were up 11% and diluted earnings per share grew by 14% in fiscal 2012 |
| · | $209 million in free cash flow generated during fiscal 2012, up 18% from the prior year |
| · | Employee count rose 9% to 5,735, up 484 employees from a year ago. |
Business Strategy
For over 34 years, the Company's business strategy has been built on the creative use of technology and an unwavering dedication to client service. FactSet allows a user to access data anywhere, anytime – in real-time. A global investment professional is able to keep track of thousands of global financial databases, get custom feeds or integrate their own data into the Company's solution that goes beyond the basics.
FactSet's business strategy is to be a leading provider of integrated financial information and analytical applications to the global investment community by consolidating data content with powerful analytics on a single platform while providing superior individual desktop client service. FactSet is a growing, global company that is increasing its international reach, headcount, and ultimately, its competitive edge. The Company saw evidence of this growth in fiscal 2012 as FactSet added 484 employees and increased the number of office locations around the world from 24 to 26.
The Company's strategy is to continue to concentrate on driving revenue and earnings per share growth by focusing on making FactSet's product line faster, more relevant and customizable for a broader range of user types. The Company's business model has allowed FactSet to become a major force within the financial information industry. FactSet believes it is well-positioned to maintain its competitive position in the longer term for the following reasons:

4
| · | Commitment to investing in product development in order to deliver new technology and applications. Significant enhancements during fiscal 2012 included an expansion of the Company's network of servers to calculate the quantitative models that drive Fixed Income Portfolio Analysis, release of Company Guide which is a suite of company reports available through FactSet, introduction of the Local Market Share suite of products, integration of Macro Attribution within the Portfolio Analysis suite, and Country Synopsis, a new application that combines economic data, stock index data, country fundamentals and company-level data into a single high-level report. |
| · | Excellent client service including a 24-hour consulting support desk. |
| · | A growing geographic footprint that now includes 26 offices throughout the world, which allows FactSet to serve its clients regardless of the complexity or number of locations. |
| · | Premier global proprietary datasets that include some of the latest, most accurate fundamentals, estimates and ownership data available. |
| · | FactSet's stability, reliability and scalability is appealing to clients. |
| · | Strong operating metrics and financial results have allowed FactSet to reinvest in future growth. |
| · | FactSet is a strong and well-recognized brand that is known in the financial industry worldwide for delivering superior workflow solutions. |
Vision for Future Growth
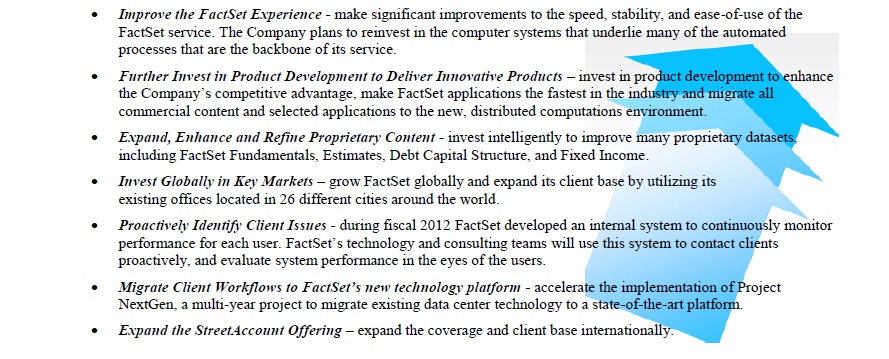
The Company's vision for the future is to continue its ongoing efforts while making key investments in its operations to position the business for sustainable growth. As stated last fiscal year, FactSet's strategic and product growth plans have its sights set on exceeding $1 billion in ASV. While the Company believes it is currently in a strong competitive position in the marketplace, FactSet expects to strengthen and grow its business by focusing on the following objectives:
FactSet views success over the long run, which requires the Company to make investments in its products, technology and people in each quarter of every year. This philosophy translates into its products becoming more competitive in the marketplace. The industry in which FactSet operates is highly competitive. Therefore it is imperative that the Company continues to invest heavily in its products and people in order to maintain its position as a premium provider of financial information and analytical tools. FactSet has state-of-the-art software; best-of-breed content; and, most importantly, the people who can use these tools to create and support a compelling suite of products.
FactSet's fiscal 2012 metrics illustrated that its business continues to grow. The Company's business expanded into adjacent areas, including in the wide variety of content that it collects and processes. FactSet has grown organically over the years, aided by strategic acquisitions, and will remain focused on its core client base in the future. The Company plans to focus on delivering blue-chip client service provided by its home-grown consultants and experienced sales and products teams. The vision for the future is to offer more customizable individual desktops, more relevant content, and enhanced applications that bring all the pieces together for a smooth, efficient and deeper client experience. These efforts will be the focal point for fiscal 2013 as the Company look towards future growth and success.
5
Cornerstones to Achieve Growth
| · | Product Enhancements - Developing new products that enhance the workflow of the Company's clients is a core component of the growth strategy. During fiscal 2012, the Company made investments to enhance the FactSet platform with Company Guide, improved Fixed Income Portfolio Analysis, the acquisition of StreetAccount to provide financial news, the creation of new Local Market Share data sets and applications, new Macro Attribution models, developed Portfolio Analysis in Kanji and released Country Synopsis. In fiscal 2013, FactSet plans to improve the integration of FactSet for use on the iPad, enhance existing applications and develop and launch new products to meet the demands of clients. |
| · | Proprietary Content – FactSet continues to integrate its own proprietary content into its product offerings, which allows the Company to enhance data in valuable and new ways. Quality controls are continuously performed over proprietary data to enhance accuracy. Over the past years, FactSet has built out its content collection facilities in India and the Philippines, staffing the centers with financial information industry experts. FactSet now offers the following proprietary datasets: fundamentals, estimates, ownership, corporate new issues, people, private equity and venture capital, mergers and acquisitions, corporate events and transcripts, fixed income, global filings and benchmark data. In fiscal 2013, FactSet plans to continue to invest in its content collection operations in order to provide deeper and even more high-quality, global databases for key content categories as well as providing users with the scope and coverage they need for in-depth analysis. |
| · | Technology - FactSet is evolving away from large mainframe computers to a more distributed environment powered by a vast array of smaller, faster, and more cost-effective machines. As part of a multi-phase project to be executed over several years, FactSet is converting all databases and several applications onto this new platform. While this initiative requires a significant investment of internal resources, the Company does not anticipate any interruption to our clients' workflows. Instead, clients will notice that their FactSet applications run more quickly and reliably. |
| · | Integrate Accurate and Timely Financial Information - FactSet is now faster, more intuitive, easier to customize and offers tools to analyze companies, view market data in real time, generate investment ideas and manage portfolios. Other key features include the ability to share workspaces with colleagues for improved collaboration, and type ahead technology that helps users find securities more quickly. In fiscal 2013, FactSet expects to improve on its timeliness and accuracy of data collected. |
| · | Customized Client Experience – FactSet's service-oriented culture is one of the reasons many of the world's top financial firms deploy its services. When a user contacts FactSet, they can expect to receive dedicated, around-the-clock support. This team of consultants dedicated to front-line support answer phone calls, assist with spreadsheet models and visit clients. In fiscal 2013, the Company anticipates adding capacity to its sales and consulting groups as well as focusing on increasing the level of productivity from its teams through additional staff training and support. |
| · | Market Expansion – FactSet's geographic footprint of 26 offices throughout the world allows FactSet to serve clients of nearly all sizes and deliver advanced technology and excellent services regardless of the complexity or number of locations. Achieving greater penetration levels in various growth markets also enhances a competitive strength as the Company's data, applications, and tools become ever more global in scope. In fiscal 2013, the Company plans to continue its strategy of ensuring its offerings are highly relevant to the financial markets throughout the world and look towards future expansion in other emerging markets. |
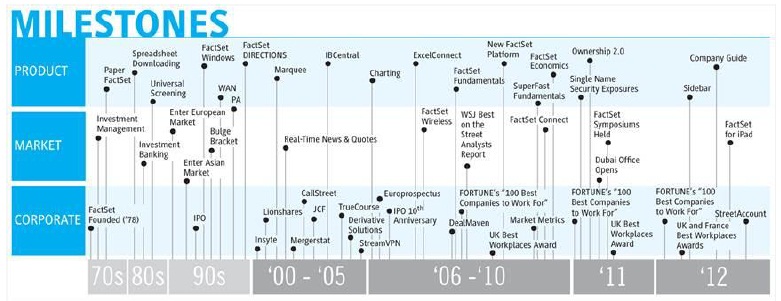
The Evolution of FactSet
The following depicts FactSet's continued business evolution within the financial industry over the past 34 years.
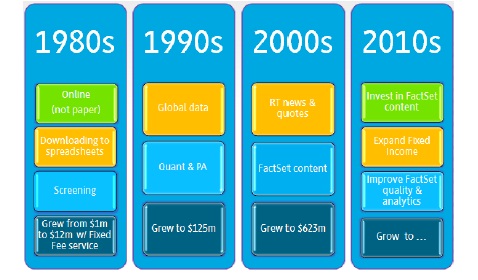
6
The Global Financial Information Services Industry
Over the past decade, the industry in which FactSet operates in has transformed dramatically. These changes include: a significant increase in cross-border asset flows and global investment activity; the evolution and maturation of electronic markets; the proliferation of research information from a myriad of sources; the increase in alternative asset strategies; and the creation of increasingly complex security instruments. |  | All of these factors have created opportunities over the years for FactSet's clients, but they have also resulted in substantially increased complexity in their operations and processes. FactSet believes that the global investment community has clear needs that translate into a demand for FactSet's solutions. |
Product and Service Offering
Customizable FactSet workspaces are designed for investment managers, investment bankers and others throughout each of our reportable segments, and include the following features and solutions:
Investment Managers
FactSet addresses the challenges unique to investment managers in its integrated platform. With FactSet, a user gains a sophisticated solution that can be customized with the exact data and analytics they need to support their firm's workflow while reducing training, technology, content, and deployment costs. FactSet is tightly integrated to make research efforts seamless. The comprehensive FactSet platform enables investment managers to manipulate data to an unprecedented degree and to present data in an infinite variety of formats, including customized reports and charts. With FactSet, clients around the globe are able to meet virtually all their research needs with just a few mouse clicks. The following are some of the key solutions offered to investment managers through the FactSet platform:
| · | Wireless Connectivity - Access reports via wireless handheld devices |
| · | Equity Analysis - Research public and private companies worldwide |
| · | Economics and Market Analysis - Stay on top of global economic events and analyze market, sector, and fundamental series with economic calendar and dynamic country, sector, and industry reports. |
| · | Quant and Risk Analysis – Build quant models and calculate risk to better understand portfolio risks |
| · | Portfolio Analysis - Applications for portfolio attribution, risk management and quantitative analysis |
| · | Fixed Income Analysis - Analyze entire debt-driven markets |
| · | Data Integration - Integrate client data, such as portfolio holdings with FactSet's data and applications |
| · | Charting - Create sophisticated reports and presentations |
Global Banking & Brokerage Professionals
FactSet enables investment banking professionals to gain in-depth company and industry insight with its integrated data and powerful analytical solutions designed specifically for a banker's workflow. From the beginning of research strategy to the end of the pitch, investment banking professionals can have access to the tools and information they need to identify new opportunities and track the companies and industries that are important to them and their clients. The comprehensive FactSet platform enables investment bankers to manipulate data and to present data in a multitude of formats, including customized reports and charts. The following are some of the key solutions offered to the sell-side professionals through the FactSet platform:
| · | Models and Presentations - Combine the latest market data with numbers, all in firm standard formats and branding, to quickly create flexible models and presentations |
| · | Company and Industry Analytics – Track, in real-time, the global public and private companies, industries, and events that make an impact on market performance |
| · | Idea Screening – Enables r esearch on public and private companies to target clients, partners, buyers and investors and searches deals and IPOs of interest |
| · | Deal Analytics - Provides insight into the global deal market with a suite of deal intelligence tools designed to meet M&A and corporate governance research needs |
| · | People Intelligence - Searches leads by connecting to others by business, charitable interests, education and other non-corporate relationships |
| · | Accountability - Audits global financials to their underlying SEC filings |
| · | Corporate Governance - Follows hot topics surrounding corporate governance matters |
| · | Wireless Connectivity - Access key reports via wireless handheld devices |
7
Other Global Professionals
Not only is FactSet designed to enhance the workflows of investment managers and bankers, but it is also able to be customized to meet the needs of many more professionals involved in hedge funds, private equity, sell-side research, equity sales, trading, consulting, investor relations, law firms and academic institutions.

Client Relationships and Support
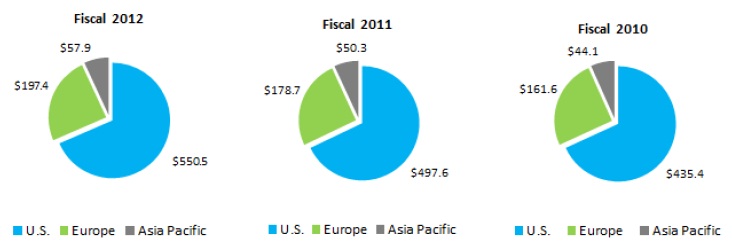
As of August 31, 2012, there were 49,500 users of FactSet spread across 2,392 clients in over 50 countries worldwide. Approximately 68.3% of fiscal 2012 revenues are from its U.S. client base, 24.5% in Europe and the remaining 7.2% in Asia Pacific. One of the Company's top priorities is to ensure that the user always has the most accurate data available and the support it needs to use FactSet most effectively. Whether it is a quick question or step-by-step guidance through a complex task, FactSet consultants will help the client find answers and maximize the value of FactSet. In addition to unlimited access to the global support desk, every FactSet client is assigned a consultant who becomes familiar with the user's needs and processes. Consultants train users, assist on projects and answer any questions the client may have. FactSet differentiates itself from others in the care and attention it provides to its users.
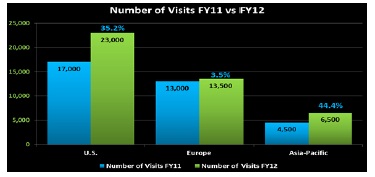
FactSet's client retention rate is an impressive 92%. The Company is known throughout the financial industry for having excellent client service, and FactSet continued that track record in fiscal 2012 as 96% of clients reported that they are satisfied or very satisfied with FactSet's client service. Clients are visited by company personnel for hands-on personalized desktop service. To properly support the 49,500 users on six continents, FactSet hired new consultants and went on 43,000 client visits during fiscal 2012, up from 34,500 in fiscal 2011. Consultants around the world answered 250,000 support desk calls, which results in building strong client relationships.
8
Competition
The market for providing accurate financial information and software solutions to the global investment community is highly competitive. The global financial information services industry, in which FactSet competes, includes both large and well-capitalized companies, as well as smaller, niche firms. International and U.S. competitors include market data suppliers, news and information providers and many of the content providers that supply the Company with financial information included in the FactSet workstation. The main competitors and competitive products include online database suppliers and integrators and their applications, such as Bloomberg L.P., Thomson Reuters Inc., Standard & Poor's including Capital IQ, MSCI Inc., Dealogic PLC, Interactive Data Corporation, Dow Jones & Company, Inc., Markit Group Limited, The Yield Book, Inc., Polypaths LLC and Wilshire Associates Incorporated. Many of these firms offer products or services which are similar to those sold by the Company.
Despite competing market data products and services, FactSet believes it has one of the broadest sets of functionalities. An indicator of the Company's competitive position is that it has been able to introduce higher premium-based pricing across its client base despite ongoing competition from larger vendors. FactSet enjoys high barriers to entry and believes it would be difficult for another vendor to quickly replicate the extensive databases the Company currently offers. In addition, FactSet's applications, supported by its client support and service offerings, are entrenched in the workflow of many financial professionals given the downloading functions and portfolio analysis/screening capabilities they offer. As a result, the Company's products have become central to investment analysis and decision-making for clients. While clients may add, reduce or cancel services at almost any time, switching costs may be high.
Recent Market Trends
The global equity indices have experienced significant volatility in recent years, which has had an impact on the solvency, size and buying power of some of FactSet's clients. Despite this challenging climate, FactSet has consistently grown revenues and the Company anticipates continued volatility in the financial markets. FactSet believes that these continued volatile market conditions increase the value of FactSet's ability to consolidate services for clients, including deploying real-time news and quotes, and advancing the sales of proprietary content.
Year-to-date global equity returns have been impressive thus far in 2012. However, this trend is currently short-term, and FactSet must continue to offer better service than its competitors, more relevant content, and enhanced applications that bring all the pieces together for a smooth, efficient client experience. These efforts continue to be the focus for fiscal 2013 as FactSet looks towards growth and success over the long-term.
Client Subscription Growth
Annual subscription value at any given point in time represents the forward-looking revenues for the next twelve months from all subscription services currently being supplied to clients. At August 31, 2012, ASV was $843 million, up 7% organically from a year ago. Of this total, 81% is derived from investment management clients and the remainder from the sell-side firms who perform M&A advisory work and equity research. The $64 million increase in ASV during fiscal 2012 was driven by broad-based growth across geographical segments, continued use of FactSet advanced applications such as Portfolio Analysis ("PA"), expanded deployment of proprietary data, growth in the number of clients and users, increased usage of FactSet in Excel by both buy and sell-side users, growth in the Market Metrics Local Market Share suite of products, a high annual client retention rate, the annual price increase for the majority of the Company's investment management clients and the acquisition of StreetAccount in June 2012, which at the time of acquisition, had annual subscriptions of $11.4 million. These growth drivers were partially offset by a cancellation of an earnings estimates feed to TheMarkets.com as a result of its acquisition by Standard & Poor's Capital IQ and a decline in ASV from investment banking clients in the past 12 months as the banks continued their reduction in spending and hiring.
9
Financial Information on Geographic Areas
FactSet's operations are organized into three reportable segments based on geographic operations: the U.S., Europe and Asia Pacific. These reportable segments are aligned with how the Company, including its chief operating decision maker, manages the business and the demographic markets in which FactSet serves. Financial information, including revenues, operating income and long-lived assets related to the Company's operations in each geographic area are presented in Note 6, Segment Information, in the Notes to the Company's Consolidated Financial Statements included in Item 8 below. FactSet believes this alignment helps it better manage the business and view the markets the Company serves, which are centered on providing integrated global financial and economic information. Sales, consulting, data collection and software engineering are the primary functional groups within the U.S., Europe and Asia Pacific segments that provide global financial and economic information to investment managers, investment banks and other financial services professionals. The U.S. segment services finance professionals including financial institutions throughout North America, while the European and Asia Pacific segments service investment professionals located throughout Europe and Asia.
The European segment is headquartered in London, England and maintains office locations in France, Germany, the Netherlands, Dubai and Italy. The Asia Pacific segment is headquartered in Tokyo, Japan with office locations in Hong Kong, Australia and India. The data content collection centers located in India and the Philippines benefit all of the Company's operating segments. Segment revenues reflect direct sales to clients based in their respective geographic locations. There are no intersegment or intercompany sales of the FactSet service. Each segment records compensation, including stock-based compensation, data collection costs, amortization of intangible assets, depreciation of furniture and fixtures, amortization of leasehold improvements, communication costs, professional fees, rent expense, travel, marketing, office and other direct expenses. Expenditures associated with the Company's data centers and corporate headquarters charges are recorded by the U.S. segment and are not allocated to the other segments.
The following charts depict revenues related to each of the three Company's reportable segments.
Data Centers
FactSet's business is dependent on its ability to rapidly and efficiently process substantial volumes of data and transactions on its computer-based networks and systems. The Company's global technology infrastructure supports its operations and is designed to facilitate the reliable and efficient processing and delivery of data and analytics to its clients. FactSet's data centers contain multiple layers of redundancy to enhance system performance, including maintaining, processing and storing data at multiple data centers. User connections are load balanced between data centers and, in the event of a site failure, equipment problem or regional disaster, the remaining centers have the capacity to handle the additional load. FactSet continues to be focused on maintaining a global technical infrastructure that allows the Company to support its growing business.
FactSet is evolving away from large mainframe computers to a more distributed environment powered by a vast array of smaller, faster, and more cost-effective machines. As part of a multi-phase project to be executed over several years, FactSet converted all databases and released several applications on this new platform during fiscal 2012. In addition to investing in the future via this NextGen initiative, the Company continued to ensure that its existing mainframe architecture functions at the highest level. During fiscal 2012, FactSet upgraded the remaining 20% of its mainframe server environment in order to optimize speed and consistency for both client batch and interactive workloads.
The Company continues to operate fully redundant data centers in Virginia and New Jersey. These data centers handle FactSet's entire client capacity. In addition, the Company maintains a vast private wide area network that provides a high-speed direct link between the client's local network and the data content and powerful applications found on FactSet's mainframe machines.
10
Job Creation
FactSet continues to invest aggressively in its people in order to recruit, develop and retain a talented employee workforce. The Company believes that its future success depends in part on its continued ability to hire, assimilate and retain qualified personnel. One of FactSet's top priorities is to maintain competitive compensation, benefits, equity participation and work environment practices and policies in order to attract and retain qualified personnel. To date, FactSet believes that it has been successful in recruiting qualified employees. FactSet has not experienced any work stoppages and believes its employee relations are good. None of the Company's employees are represented by a collective bargaining arrangement.
As of August 31, 2012, employee headcount was 5,735, up 9% from a year ago. Of this total, 1,840 employees were located in the U.S., 607 in Europe and 3,288 in the Asia Pacific region. For the third consecutive year, FactSet hired at least 450 people and in the past three years, the Company has created a net new 2,773 jobs around the world, including more than 500 within the U.S. Fiscal 2012 employee growth was broad-based as FactSet welcomed new classes of software engineers and sales consultants, continued the expansion of its proprietary content collection operations in India and the Philippines, and welcomed 49 new employees through the acquisition of StreetAccount in June 2012. Since the beginning of fiscal 2012, FactSet has increased its content collection headcount by 8% or approximately 215 employees, primarily at its offshore facilities. In addition to the hiring of employees for the Company's content collection operations, FactSet grew by approximately 210 net new engineering and product development employees and 30 net new consultants in the past year, as we continue to improve our applications and service the existing client base. Approximately 53% of the Company's employees are involved with content collection, 25% work in product development, software and systems engineering, another 18% conduct sales and consulting services and the remaining 4% provide administrative support.

FactSet initiatives that drive employee growth over the years include:
| · | New Hire Training - A major advantage of FactSet is a rigorous training program for new hires. Consultants train the longest and concentrate on a more detail-oriented skill set, whereas engineering tends to be more hands on. Software engineering training was redesigned in 2011 to include a core set of lessons followed by specialized tracks depending on the engineers' group to allow more detailed training. As a result, engineers finish the program well-equipped to start their work. |
| · | FactSet Talent Development – The FactSet talent development team works on programs designed to strengthen leadership, management and innovation across the Company through inspiring, connecting and developing the leaders of today and tomorrow. FactSet provides leadership and management training to create a competitive advantage for the Company. The leadership development curriculum is designed to help pave career paths, devise succession planning and measure performance management. The creation of the FactSet Talent group also allowed the Company to coordinate consistent training for all employees globally. |
| · | Community Service – In addition to servicing their clients, FactSet employees are committed to serving their local communities. In fiscal 2012, community outreach coordinators organized 90 activities in which more than 2,000 employees participated. FactSet aims to primarily support charities that can have a high impact on its offices' neighborhoods and provide basic human services (e.g., homeless shelters, soup kitchens, food pantries) and local education and mentoring initiatives . Activities ranged from mentoring students to fundraising for cancer research. |
Research and Product Development Costs
A key aspect of the Company's growth strategy is to enhance its existing products and applications by making them faster and the data within them more reliable. FactSet strives to rapidly adopt new technology that can improve its products and services. Research and product development costs relate to the salary and benefits for the Company's product development and software engineering technical support staff, which equaled approximately 25% and 23% of FactSet's workforce during fiscal 2012 and 2011, respectively. These research and product development costs are expensed when incurred within cost of services as employee compensation. The Company plans to continue to allocate a similar percentage of its workforce in future years in order to continue to develop new products and enhancements, respond quickly to market changes and to meet the needs of its clients efficiently.
11
| Marketing |  |
Fiscal 2012 was a strong year for promoting the FactSet brand, from traditional advertising, to client events, to data sourcing. The FactSet symposia were important marketing efforts during fiscal 2012. O ver 320 industry professionals from around the world, including 270 FactSet clients, attended the U.S. and European symposia held during the third quarter of fiscal 2012. The European event grew by more than 10% compared to the 2011 event, and for the first time ever sold out a month before the registration close date. The U.S. symposium was also a success, with 99% of attendees stating they would return next year and would recommend others to attend.
Other Marketing highlights during fiscal 2012 included the following:
| · | The Wall Street Journal released its results of the annual Best on the Street Analysts Survey on May 10, 2012, which marked FactSet's fourth consecutive year as the data provider. |
| · | FactSet was named Best Research Provider at the annual Inside Market Data Awards and Inside Reference Data Awards in New York City on May 22, 2012. |
In fiscal 2013 and beyond, FactSet plans to expand its brand presence along with media in newer markets. The Company will continue its messaging to the user base through enhanced marketing materials, sharing insights on the FactSet website and by extending its web presence through social media outlets, including Facebook, Twitter and LinkedIn.
Intellectual Property and other Proprietary Rights
FactSet's success depends upon its proprietary technology. FactSet has registered trademarks and copyrights for many of its products and services and will continue to evaluate the registration of additional trademarks and copyrights as appropriate. FactSet enters into confidentiality agreements with its employees, clients, data suppliers and vendors. The Company seeks to protect its software, documentation and other written materials under trade secret and copyright laws. While FactSet does not believe it is dependent on any one of its intellectual property rights, the Company does rely on the combination of intellectual property rights and other measures to protect its proprietary rights. Despite these efforts, existing intellectual property laws may afford only limited protection.
Third-Party Data Content
FactSet aggregates third-party content from more than 85 data suppliers and over 130 news sources and exchanges. The Company integrates content from premier providers such as Thomson Reuters, Standard & Poor's, Axioma, Inc., FTSE, Interactive Data Corporation, Dow Jones & Company Inc., Northfield Information Services, Inc., Barclays Capital, Intex Solutions, Inc., Bureau van Dijk, ProQuote Limited, MSCI Barra, APT, IHS Global Insight Inc., Morningstar, Inc., Lipper Inc., Russell Investments and Toyo Keizai. FactSet combines the data from these commercial databases into its own dedicated online service which the client accesses to perform their analyses. Content fees billed to the Company may be on a fixed or royalty (per client) basis.
FactSet seeks to maintain contractual relationships with a minimum of two content providers for each major type of financial data; however this is not possible for all types of data. Certain datasets that FactSet relies on have a limited number of suppliers, although the Company makes every effort to assure that, where reasonable, alternative sources are available. However, FactSet is not dependent on any one third-party data supplier in order to meet the needs of its clients. The Company has entered into third-party content agreements with varying lengths from as long as five years to as short as on an ad-hoc basis. The agreements in some cases can be terminated on one year's notice at predefined dates, in other cases on shorter notice. No single vendor or data supplier represented 10% or more of FactSet's total expenses in any fiscal year presented.
Government Regulation
The Company's wholly owned subsidiary, FactSet Data Systems, Inc., is a member of the Financial Industry Regulatory Authority, Inc. ("FINRA") and is a registered broker-dealer under Section 15 of the Securities and Exchange Act of 1934. FactSet Data Systems, Inc., as a registered broker-dealer, is subject to Rule 15c3-1 under the Securities and Exchange Act of 1934, which requires that the Company maintain minimum net capital requirements. The Company claims exemption under Rule 15c3-3(k)(2)(ii). In addition, the Company is subject to reporting requirements, disclosure obligations and other recordkeeping requirements per the Securities and Exchange Commission ("SEC").
Available Information
Through the Investor Relations section of the Company's website ( http://investor.factset.com ), FactSet makes available the following filings as soon as practicable after they are electronically filed with, or furnished to, the SEC: the Company's Annual Report on Form 10-K, Quarterly Reports on Form 10-Q, Current Reports on Form 8-K, Proxy Statements for the annual stockholder meetings, and any amendments to those reports filed or furnished pursuant to Section 13(a) or 15(d) of the Securities Exchange Act of 1934, as amended. All such filings are available free of charge.
12
FactSet broadcasts live its quarterly earnings calls via its investor relations web site. Additionally, the Company provides notifications of news or announcements regarding its financial performance, including SEC filings, investor events, press and earnings releases, and blogs as part of its investor relations web site. The contents of these web sites are not intended to be incorporated by reference into this report or in any other report or document the Company files and any reference to these web sites are intended to be inactive textual references only.
In addition, the Company's Code of Ethical Conduct for Financial Managers and Code of Business Conduct and Ethics are posted in the Investor Relations section of the Company's website and the same information is available in print to any stockholder who submits a written request to the Company's Investor Relations department at its corporate headquarters. Any amendments to or waivers of such code required to be publicly disclosed by the applicable exchange rules or the SEC will be posted on the Company's website. The charters of each of the committees of the Company's Board of Directors are available on the Investor Relations section of the Company's website and the same information is available in print, free of charge, to any stockholder who submits a written request to the Company's Investor Relations department at its corporate headquarters.
Corporate Information, including Internet Address
FactSet was founded as a Delaware corporation in 1978, and its principal executive offices are in Norwalk, Connecticut. The mailing address of the Company's headquarters is 601 Merritt 7, Norwalk, Connecticut 06851, and its telephone number at that location is (203) 810-1000. The Company's website address is www.factset.com .
Corporate History
The following timeline depicts FactSet's growth within the financial industry over the past 34 years.
13
Executive Officers of the Registrant
The following table shows the Company's executive officers as of August 31, 2012:
Name of Officer | Age | Office Held with the Company | Officer Since |
Philip A. Hadley | 50 | Chairman of the Board of Directors, Chief Executive Officer | 2000 |
Peter G. Walsh | 47 | Executive Vice President, Chief Operating Officer | 2005 |
Michael D. Frankenfield | 47 | Executive Vice President, Director of Global Sales | 2001 |
Maurizio Nicolelli | 44 | Senior Vice President, Principal Financial Officer | 2009 |
Kieran M. Kennedy | 47 | Senior Vice President, Director of Sales Operations | 2002 |
Philip A. Hadley, Chairman of the Board of Directors, Chief Executive Officer and Director. Mr. Hadley was named Chairman and Chief Executive Officer of FactSet on September 5, 2000. Mr. Hadley joined FactSet in 1985 as a Consultant. From 1986 to 1989, Mr. Hadley was the Company's Vice President, Sales. From 1989 to 2000, Mr. Hadley was Senior Vice President and Director of Sales and Marketing. Prior to joining the Company, Mr. Hadley was employed by Cargill Corporation. He currently serves as a member of the board of advisors of Kum & Go. Mr. Hadley received a B.B.A. in Accounting from the University of Iowa, has earned the right to use the Chartered Financial Analyst designation and is a member of the CFA Institute.
Peter G. Walsh, Executive Vice President, Chief Operating Officer. Mr. Walsh joined the Company in 1996 as Vice President, Planning and Control within the Company's Finance group. Mr. Walsh held the position of Vice President, Director of Finance from 1999 until 2001. From late 2001 to February 2005, Mr. Walsh occupied the position of Vice President, Regional Sales Manager of the U.S. Southeast Region. On March 1, 2005 he assumed the position of Chief Financial Officer and Treasurer. On October 1, 2009, Mr. Walsh was promoted to his current position as the Company's Chief Operating Officer, where he is responsible for product development, content collection and software and systems engineering. Prior to joining FactSet, Mr. Walsh held several positions at Arthur Anderson & Co. Mr. Walsh received a B.S. in Accounting from Fairfield University, has earned the right to use the Chartered Financial Analyst designation and is a member of the CFA Institute.
Michael D. Frankenfield, Executive Vice President and Director of Global Sales. Mr. Frankenfield joined the Company in 1989 within the Consulting Services Group. From 1990 to 1994, Mr. Frankenfield held the position of Vice President, Sales. From 1995 to 2000 Mr. Frankenfield was Director of Investment Banking Sales with the Company. From 2000 until 2005, Mr. Frankenfield was Director of Sales and Marketing and from September 2005 until August 2009, he was the Director of Investment Management Services. In August 2009, he was promoted to his current position as Director of Global Sales. Mr. Frankenfield received a B.A. in Economics and International Relations from the University of Pennsylvania, has earned the right to use the Chartered Financial Analyst designation and is a member of the CFA Institute.
Maurizio Nicolelli, Senior Vice President, Principal Finance Officer. Mr. Nicolelli joined FactSet in 1996 as the Senior Accountant and held the position of Chief Accountant from 1999 to 2001. Since 2002, he has served as Vice President and Comptroller of the Company. On October 1, 2009, Mr. Nicolelli was appointed to his current position as Senior Vice President, Principal Financial Officer. Prior to joining FactSet, he was employed at PricewaterhouseCoopers LLP. He holds a B.S. degree in Political Science from Syracuse University and an M.B.A. degree in Accounting from St. John's University. Mr. Nicolelli is a CPA licensed in the state of New York.
Kieran M. Kennedy, Senior Vice President and Director of Sales Operations. Mr. Kennedy joined the Company in 1990 within the Consulting Services Group. From 1993 to 1997, Mr. Kennedy held the position of Sales and Consulting Manager for the West Coast. Mr. Kennedy was Director of Consulting from 1997 until he assumed the position as Director of Investment Banking and Brokerage Services in 2002. In August 2009, he assumed his current position as Director of Sales Operations. Prior to joining FactSet, Mr. Kennedy held a Currency Trading position at Goldman Sachs & Co. Mr. Kennedy received a B.A. in Economics from Syracuse University.
Additional Information
Additional information with respect to the Company's business is included in the following pages and is incorporated herein by reference:
Page(s) | ||
Five-Year Summary of Selected Financial Data |
| 24 |
Management's Discussion and Analysis of Financial Condition and Results of Operations |
| 25-48 |
Quantitative and Qualitative Disclosures about Market Risk |
| 48-49 |
Note 1 to Consolidated Financial Statements entitled Organization and Nature of Business |
| 56 |
Note 6 to Consolidated Financial Statements entitled Segment Information |
| 65-66 |
14
ITEM 1A. RISK FACTORS
Set forth below and elsewhere in this report and in other documents FactSet files with the SEC are risks and uncertainties that could cause actual results to differ materially from those expressed by the forward-looking statements contained in this report. Investors should carefully consider the risks described below before making an investment decision. In assessing these risks, investors should also refer to the other information contained or incorporated by reference in this Annual Report on Form 10-K filed with the SEC, including the Company's consolidated financial statements and related notes thereto. FactSet's operating results are subject to quarterly and annual fluctuations as a result of numerous factors. As a consequence, operating results for a particular future period are difficult to predict, and, therefore, prior results are not necessarily indicative of results to be expected in future periods.
Risk factors which could cause future financial performance to differ materially from the expectations as expressed in any of FactSet's forward-looking statements made by or on the Company's behalf include, without limitation:
A decline in equity returns may impact the buying power of FactSet's investment management clients
Major equity indices ( e.g. , Dow Jones Industrials, Russell 1000, MSCI EAFE, S&P 500 and NASDAQ Composite) and the global economy have experienced increased levels of volatility. Approximately 81% of the Company's annual subscription value is derived from its investment management clients. The prosperity of these clients is tied to equity assets under management. An equity market decline not only depresses assets under management but could cause a significant increase in redemption requests to move money out of equities and into other asset classes. Moreover, extended declines in the equity markets may reduce new fund or client creation, resulting in lower demand for services from investment managers.
A global economic downturn and related market uncertainty may affect FactSet's revenues and liquidity
Current global economic and financial market conditions, and the potential for the prolongation of the global economic recession, could adversely affect FactSet's business, results of operations, financial condition and liquidity. The worldwide impact of market uncertainty, including European economic and financial uncertainty related to sovereign debt issues could materially impact clients, including large accounts, causing them to: go out of business entirely; defer, reduce, or not increase the volume of the subscriptions they purchase from FactSet in the future; or terminate existing relationships. A variety of other uncontrollable and changing factors, including inflationary pressures; political or social unrest; terrorist attacks; oil prices; natural disasters in a specific country or region; trade protection measures; and health or similar issues, such as a pandemic or epidemic could have a material adverse effect on FactSet's business and liquidity.
Uncertainty, consolidation, and business failures in the global investment banking industry may cause FactSet to lose additional clients and users
The global investment banking industry continues to experience uncertainty, consolidation and business failures. This consolidation has resulted in a reduction in the number of prospective clients and users within the investment banking sector. FactSet's sell-side clients who perform M&A advisory work and equity research account for approximately 19% of its revenues. A significant portion of these revenues relate to services deployed by large, bulge bracket banks. The continued lack of available credit continues to impact many of the large banking clients due to the amount of leverage deployed in past operations. Clients could encounter similar problems. A lack of confidence in the global banking system could cause declines in merger and acquisitions funded by debt. Additional uncertainty, consolidation and business failures in the global investment banking sector could adversely affect the Company's financial results and future growth.
Volatility in the financial markets may delay the spending pattern of clients and reduce future ASV growth
Sales cycles for FactSet can fluctuate and be extended in times where the financial markets are volatile. The decision to purchase the FactSet service offering often requires prospective clients to provide management-level sponsorship. As a result, FactSet often engages in relatively lengthy sales efforts. Purchases (and incremental ASV) may therefore be delayed during the client decision process because uncertainties in the financial markets can cause clients to remain cautious about capital and data content expenditures, particularly in uncertain economic environments. The cycle associated with the purchase of the Company's service offerings depends upon the size of the client, and is subject to a number of significant risks that have impacted ASV growth and over which FactSet has little or no control, including broader financial market volatility, adverse economic conditions, clients' budgeting constraints, internal selection procedures, and changes in client personnel.
FactSet must continue to introduce new products and enhancements to maintain its technological position
The market for FactSet is characterized by rapid technological change, changes in client demands and evolving industry standards. New technologies or industry standards can render existing products obsolete and unmarketable. As a result, the Company's future success will continue to depend upon its ability to develop new products and enhancements that address the future needs of its target markets and to respond to their changing standards and practices. FactSet may not be successful in developing, introducing, marketing and licensing the Company's new products and enhancements on a timely and cost effective basis, and the Company's new products and enhancements may not adequately meet the requirements of the marketplace or achieve market acceptance. In addition, clients may delay purchases in anticipation of new products or enhancements.
15
Undetected errors or failures found in new products and product enhancements may result in the loss of or delay in market acceptance of the Company's products
FactSet's products may contain undetected errors or scalability limitations at any point, but particularly when first introduced or as new versions are released. Despite significant testing by FactSet and by current and potential clients, errors may not be found in new products until after release. FactSet's data may also inadvertently include errors made by human misinterpretation of news and other types of information. Although FactSet attempts to prevent or correct errors, they may result in a loss of or a delay in market acceptance, damage to the Company's reputation, client dissatisfaction and reductions in revenues and margins, any of which could harm our business.
Increased competition in FactSet's industry may cause price reductions or loss of market share
FactSet continues to experience intense competition across all markets for its products. Its competitors range in size from multi-billion dollar companies to small, single-product businesses that are highly specialized. While the Company believes the breadth and depth of its suite of products and applications offer benefits to its clients that are a competitive advantage, its competitors may offer price incentives to acquire new business. Competitive pricing pressures did not have a material impact on the Company's results of operations during fiscal 2012 or in any other fiscal year presented. However, future competitive pricing pressures may result in decreased sales volumes and price reductions, resulting in lower revenues. Weak economic conditions can also result in clients' seeking to utilize lower-cost information that is available from alternative sources. The impact of cost-cutting pressures across the industries FactSet serves could lower demand for its services. In recent years, FactSet has seen clients intensify their focus on containing or reducing costs as a result of the more challenging market conditions. Clients within the financial services industry that strive to reduce their operating costs may seek to reduce their spending on financial market data and related services. If clients elect to reduce their spending with FactSet, the Company's results of operations could be materially adversely affected. Clients may use other strategies to reduce their overall spending on financial market data services by consolidating their spending with fewer vendors, by selecting vendors with lower-cost offerings or by self-sourcing their needs for financial market data. If clients elect to consolidate their spending on financial market data services with other vendors and not FactSet, the Company's results of operations could be adversely affected.
Increased accessibility to free or relatively inexpensive information sources may reduce demand for FactSet
In recent years, more free or relatively inexpensive information has become available, particularly through the Internet, and this trend may continue. The availability of free or relatively inexpensive information may reduce demand for FactSet. Weak economic conditions also can result in clients seeking to utilize lower-cost information that is available from alternative sources. While the Company believes its service offering is distinguished by such factors as customization, timeliness, accuracy, ease-of-use, completeness and other added value factors, if users choose to obtain the information they need from public or other sources, FactSet's business, financial condition, and results of operations could be adversely affected.
The FactSet brand and reputation are key assets and competitive advantages of the Company and its business may be affected by how FactSet is perceived in the marketplace
FactSet's ability to attract and retain clients is affected by external perceptions of brand and reputation. Reputational damage from negative perceptions or publicity could damage the Company's reputation with clients, prospects, and the general public. Although FactSet monitors developments for areas of potential risk to its reputation and brand, negative perceptions or publicity could have a material adverse effect on its business and financial results.
FactSet must ensure the protection and privacy of client data
Many of FactSet's products, as well as its internal systems and processes, involve the storage and transmission of proprietary information and sensitive or confidential data, including client portfolios. FactSet relies on a complex network of internal controls to protect the privacy of client data. If FactSet fails to maintain the adequacy of its internal controls, including any failure to implement required new or improved controls, or if FactSet experiences difficulties in their implementation, their misappropriation of client data by an employee or an external third party could occur, which could damage the Company's reputation and ultimately its business. Breaches of Company security measures could expose FactSet, its clients or the individuals affected to a risk of loss or misuse of this information, potentially resulting in litigation and liability for the Company, as well as the loss of existing or potential clients and damage to the Company brand and reputation.
A prolonged or recurring outage at FactSet's data centers could result in reduced service and the loss of clients
FactSet's clients rely on the Company for the delivery of time-sensitive, up-to-date data. FactSet's business is dependent on its ability to rapidly and efficiently process substantial volumes of data and transactions on its computer-based networks and systems. The Company's computer operations and those of its suppliers and clients are vulnerable to interruption by fire, natural disaster, power loss, telecommunications failures, terrorist attacks, acts of war, internet failures, computer viruses and other events beyond the Company's reasonable control. FactSet maintains back-up facilities for each of its major data centers to minimize the risk that any such event will disrupt operations. However, a loss of the Company's services may induce its clients to seek alternative data suppliers and any such losses or damages incurred by FactSet could have a material adverse effect on its business. Although the Company seeks to minimize these risks through security measures, controls and back-up data centers, there can be no assurance that such efforts will be successful or effective.
16
Man-made problems such as computer viruses or terrorism may disrupt FactSet's operations
Despite FactSet's implementation of network security measures, its servers are vulnerable to computer viruses, break-ins, and similar disruptions from unauthorized tampering with the Company's computer systems. Any such event could have a material adverse effect on FactSet's business, operating results and financial condition. Efforts to limit the ability of malicious third parties to disrupt the operations of the Internet or undermine the Company's own security efforts may meet with resistance. In addition, the continued threat of terrorism and heightened security and military action in response to this threat, or any future acts of terrorism, may cause further disruptions to the economies of the U.S. and other countries and create further uncertainties or otherwise materially harm FactSet's business, operating results and financial condition. To the extent that such disruptions or uncertainties result in delays or cancellations by clients, FactSet's business, operating results and financial condition could be materially adversely affected.
Malicious, ignorant or illegal employee acts regarding insider information
Misappropriation of insider information by an employee could damage the Company's reputation and ultimately its business. Improper disclosure of the Company's insider information could expose FactSet to a risk of loss or misuse of this information, potentially resulting in litigation and liability for the Company, as well as the loss of existing or potential clients and damage to the Company's brand and reputation.
FactSet's ability to integrate newly acquired companies
FactSet has made and expects to continue to make acquisitions from time to time. Acquisitions present significant challenges and risks relating to the integration of the business into FactSet's operations, and there can be no assurances that FactSet will manage acquisitions successfully. The related risks include the Company's failure to achieve strategic objectives and anticipated revenue improvements as well as the failure to retain key personnel of the acquired business. FactSet reviews its amortizable intangible assets for impairment when events or changes in circumstances indicate the carrying value may not be recoverable. Goodwill is required to be tested for impairment at least annually. Factors that may be considered a change in circumstances indicating that the carrying value of its goodwill or amortizable intangible assets may not be recoverable include a decline in stock price, market capitalization, future cash flows and slower growth rates in its industry. FactSet may be required to record a charge to earnings in its financial statements during the period in which any impairment of its goodwill or amortizable intangible assets is determined, resulting in an impact on its results of operations.
FactSet must hire and retain key qualified personnel
The Company's business is based on successfully attracting and retaining talented employees. Competition for talent, including engineering personnel, in the industry in which the Company competes is strong. If the Company is less successful in its recruiting efforts, or if it is unable to retain key employees, its ability to develop and deliver successful products and services may be adversely affected. FactSet needs technical resources such as product development engineers to develop new products and enhance existing products. The Company relies upon sales personnel to sell its products and services and maintain healthy business relationships. FactSet's failure to attract and retain talented employees could have a material adverse effect on the Company's business.
An unforeseen increase in FactSet's employee cost structure may reduce growth the Company's operating income
Increases in FactSet's cost structure related to hiring, benefit costs, salary levels, variable compensation, and other factors may reduce growth in operating income. If the Company is unable to manage operating costs as anticipated or operating costs are higher than expected, FactSet's operating results may fluctuate significantly. FactSet has made significant investments in its employee base in recent years. FactSet also made adjustments to employee salaries to remain competitive, and benefit costs have also increased. If employee compensation expenses exceed the Company's expectations and cannot be adjusted accordingly, FactSet's profitability may be reduced and results of operations and financial position may be adversely affected.
Risks of doing business internationally
During fiscal 2012, approximately 32% of the Company's revenue was generated outside the U.S. As of August 31, 2012, the Company employed 3,895 employees outside the U.S., representing 68% of the employee headcount worldwide and a 10% increase in the last 12 months. Because FactSet sells its services outside the U.S, the Company is subject to risks associated with doing business internationally that could have a material adverse effect on its results of operations including: the impact of recessions and market fluctuations; adverse changes in foreign currency exchange rates; difficulty in the enforcement of contractual provisions in local jurisdictions; unexpected changes in foreign laws and regulatory requirements; difficulties in successfully adapting the Company's products and services to the language, regulatory and technology standards of other countries; resistance of local cultures to foreign-based companies and difficulties engaging local resources; inflation; natural disasters in developing countries; and political and economic instability.
17
FactSet's ability to integrate and market FactSet proprietary data as a high quality asset
The Company offers proprietary datasets that include the latest, most accurate information available, wherever possible, including fundamentals, estimates, ownership, corporate new issues, people, private equity and venture capital, mergers and acquisitions, corporate events and transcripts, fixed income, global filings and benchmark data. FactSet understands that data is part of a broader investment process, so the Company makes timeliness and reliability a priority. In order to ensure accuracy, timeliness and reliability of the data, FactSet must continue to build on its content collection operations to populate the proprietary content databases. This complex process involves hiring, training and retaining thousands of employees and successfully deploying collection software and processes.
The negotiation of contract terms supporting new and existing datasets or products
FactSet is a provider of global financial and economic information on companies worldwide. Clients have access to the data and content found within these databases, which they can combine and utilize in nearly all of the Company's applications. These databases are important to the Company's operations because they provide its clients with key information such as company fundamentals, estimates, global equity ownership, M&A data, events and transcripts, earnings and other equity and fixed income data. FactSet aggregates third-party content from more than 85 data suppliers and over 100 news sources and exchanges. The Company has entered into third-party content agreements with varying lengths from as long as five years to as short as on an ad-hoc basis. The agreements in some cases can be terminated on one year's notice at predefined dates, in other cases on shorter notice.
Certain datasets that FactSet relies on have a limited number of suppliers, although the Company makes every effort to assure that, where reasonable, alternative sources are available. These datasets include, without limitation, (1) Equity Pricing from exchanges such as NASDAQ, (2) Global Exchange Indices, (3) S&P CUSIP distribution, (4) S&P Ratings and (5) Moody's Investor Service Corporate Ratings. However, FactSet is not dependent on any one third-party data supplier in order to meet the needs of its clients. The Company combines the data from commercial databases into its own dedicated single online service, which the client accesses to perform their analysis. The failure of FactSet to be able to maintain these relationships or the failure of its suppliers to deliver accurate data and in a timely manner could adversely affect the Company's business.
Unauthorized parties may attempt to copy aspects of FactSet's products or to obtain and use information that the Company regards as proprietary
FactSet's success depends significantly upon its proprietary technology. FactSet has registered trademarks and copyrights for many of its products and services and will continue to evaluate the registration of additional trademarks and copyrights as appropriate. FactSet enters into confidentiality agreements with its employees, clients, data suppliers and vendors. The Company seeks to protect its software, documentation and other written materials under trade secret and copyright laws. While FactSet does not believe it is dependent on any one of its intellectual property rights, the Company does rely on the combination of intellectual property rights and other measures to protect its proprietary rights. Despite these efforts, existing intellectual property laws may afford only limited protection. In addition, it may be possible for unauthorized third parties to copy certain portions of FactSet content or to reverse engineer or otherwise obtain and use its proprietary information. In addition, FactSet cannot be certain that others will not develop or acquire substantially equivalent or superseding proprietary technology or that equivalent or better products will not be marketed in competition with its services, thereby substantially reducing the value of its proprietary rights.
Third parties may claim FactSet infringes upon their intellectual property rights
FactSet may receive notice from others claiming that the Company has infringed upon their intellectual property rights. Responding to these claims may require the Company to enter into royalty and licensing agreements on less favorable terms, enter into settlements, require FactSet to stop selling or to redesign affected products, or to pay damages or to satisfy indemnification commitments with the Company's clients or vendors under contractual provisions of various license arrangements. If FactSet is required to enter into such agreements or take such actions, its operating margins may decline as a result. FactSet has made and expects to continue incurring expenditures to acquire the use of technology and intellectual property rights as part of its strategy to manage this risk.
Catastrophic events could adversely affect FactSet's business
Catastrophic events such as abrupt political change, terrorist acts, conflicts or wars may cause damage or disruption to the economy, financial markets and FactSet's clients. The potential for future attacks, the national and international responses to attacks or perceived threats to national security and other actual or potential conflicts, wars or political unrest, have created many economic and political uncertainties. Although it is impossible to predict the occurrences or consequences of any such events, they could unsettle the financial markets or result in a decline in the financial industry's spending, which could have a material adverse effect on the Company's revenues. Further, such disruptions could cause further instability in the financial markets or the spending of FactSet's clients and prospects upon which the Company depends on.
18
Exposure to fluctuations in currency exchange rates that could negatively impact financial results and cash flows
The Company faces exposure to adverse movements in foreign currency exchange rates because 68% of FactSet's employees and 45% of its leased office space are located outside the U.S. These exposures may change over time as business practices evolve, and they could have a material adverse impact on the Company's financial results and cash flows. The Company's primary exposures relate to non-U.S. dollar denominated expenses within Europe, Japan, India and the Philippines. This exposure has increased over the past 12 months primarily because the Company's international employee base rose 10% since August 31, 2011. The financial statements of the Company's foreign subsidiaries are translated into U.S. dollars using period-end rates of exchange for assets and liabilities and average rates for the period for revenues and expenses. FactSet's non-U.S. dollar denominated revenues expected to be recognized over the next twelve months are estimated to be $17 million while its non-U.S. dollar denominated expenses are $163 million, which translates into a net foreign currency exposure of $146 million per year. To manage the exposures related to the effects of foreign exchange rate fluctuations, the Company utilizes derivative instruments (foreign currency forward contracts). Although FactSet believes that its foreign exchange hedging policies are reasonable and prudent under the circumstances, the Company's attempt to hedge against these risks may not be successful, resulting in an adverse impact on its results of operations.
Resolution of ongoing and other probable audits by tax authorities
FactSet is subject to income taxes in both the U.S. and numerous foreign jurisdictions. Significant judgment is required in determining its worldwide provision for income taxes. In the ordinary course of business, there are many transactions and calculations where the ultimate tax determination is uncertain. The Company's provision for income taxes, tax liability or effective tax rates in the future could be adversely affected by numerous factors including, but not limited to, income before income taxes being lower than anticipated in countries with lower statutory tax rates and higher than anticipated in countries with higher statutory tax rates, changes in the valuation of deferred tax assets and liabilities and changes in tax laws, regulations, accounting principles or interpretations thereof. FactSet is subject to the continuous examination of its income tax returns by the Internal Revenue Service and other tax authorities. Although FactSet believes its tax estimates are reasonable, the final determination of tax audits and any related litigation could be materially different than that which is reflected in historical income tax provisions and accruals. There can be no assurance that the outcomes from these continuous examinations will not have an adverse effect on its provision for income taxes and tax liability.
Adverse resolution of litigation or governmental investigations may harm FactSet's operating results
FactSet is party to lawsuits in the normal course of business. Litigation can be expensive, lengthy, and disruptive to normal business operations. Moreover, the results of complex legal proceedings are difficult to predict. Unfavorable resolution of lawsuits or governmental investigations could have a material adverse effect on the Company's business, operating results or financial condition. For additional information regarding legal matters, see Item 3, Legal Proceedings , contained in Part I of this report.
Changes in securities laws and regulations may increase expenses or may harm demand
Many of FactSet's clients operate within a highly regulated environment. In light of the recent conditions in the U.S. financial markets and economy, Congress and regulators have increased their focus on the regulation of the financial services industry. The information provided by, or resident in, the service FactSet provides to its clients could be deemed relevant to a regulatory investigation or other governmental or private legal proceeding involving its clients, which could result in requests for information from FactSet that could be expensive and time consuming. In addition, clients subject to investigations or legal proceedings may be adversely impacted possibly leading to their liquidation, bankruptcy, receivership, reductions in assets under management, or diminished operations that would adversely affect the Company's revenues.
The Dodd-Frank Wall Street Reform and Consumer Protection Act of 2010 (the "Dodd-Frank Act") represents a comprehensive overhaul of the financial services industry within the U.S., established the new federal Bureau of Consumer Financial Protection (the "BCFP"), and will require the BCFP and other federal agencies to implement many new rules. While the general framework of the reforms is set forth in the Dodd-Frank Act, it provides for numerous studies and reports and the adoption and implementation of rules and regulations by regulatory agencies over the following four years to clarify and implement the Act's requirements fully. FactSet believes that it is too early to know the precise long-term impact on its business of the increased regulation of financial institutions. Demand could be negatively impacted by the deferral of purchase decisions by its clients until the new regulations have been adopted and the full impact and expense of the new regulatory environment is more clearly understood. The Dodd-Frank Act contains numerous other provisions affecting financial institutions of all types, many of which may have an impact on FactSet's operating environment in substantial and unpredictable ways. Accordingly, it is difficult to predict at this time what specific impact the Dodd-Frank Act and the forthcoming implementing rules and regulations will have on the Company and the financial services industry. Additionally, as a publicly-traded company, FactSet is subject to significant regulations including the Dodd-Frank Act and the Sarbanes-Oxley Act of 2002. There are significant corporate governance and executive compensation-related provisions in the Dodd-Frank Act that require the SEC to adopt additional rules and regulations in these areas. FactSet's efforts to comply with these requirements could result in an increase in its operating and compliance costs.
19
Changes in accounting may affect FactSet's reported earnings and operating income
FactSet prepares its consolidated financial statements in conformity with accounting principles generally accepted in the U.S. These principles and accompanying accounting standards, implementation guidelines and interpretations for many aspects of its business are highly complex and involve judgments. Changes in accounting rules, their interpretation, or changes in the Company's business could significantly change its reported earnings and operating income and could add significant volatility to those measures, without a comparable underlying change in cash flows from operations. In connection with the preparation of the Consolidated Financial Statements, FactSet uses certain estimates and assumptions, which are based on historical experience and management's knowledge of current events and actions that FactSet may undertake in the future. Significant estimates have been made in areas that include receivable reserves, accrued compensation, allocation of purchase price to assets and liabilities acquired, income taxes, stock-based compensation, valuation of goodwill, and useful lives and valuation of fixed and intangible assets. In addition, FactSet makes certain estimates including decisions related to legal proceedings and reserves. While management believes that these estimates and assumptions are reasonable under the circumstances, by definition they involve the use of judgment and the exercise of discretion, and therefore actual results may differ.
Internal controls may be ineffective
Effective internal controls are necessary to provide reasonable assurance with respect to its financial reports and to effectively prevent fraud. Pursuant to the Sarbanes-Oxley Act of 2002, FactSet is required to furnish a report by management on internal control over financial reporting, including management's assessment of the effectiveness of such control. Internal control over financial reporting may not prevent or detect misstatements because of its inherent limitations, including the possibility of human error, the circumvention or overriding of controls or fraud. Therefore, even effective internal controls can provide only reasonable assurance with respect to the preparation and fair presentation of financial statements. In addition, projections of any evaluation of effectiveness of internal control over financial reporting to future periods are subject to the risk that the control may become inadequate because of changes in conditions, or that the degree of compliance with the policies or procedures may deteriorate. If FactSet fails to maintain the adequacy of its internal controls, including any failure to implement required new or improved controls, or if FactSet experiences difficulties in its implementation, its business and operating results could be adversely impacted.
ITEM 1B. UNRESOLVED STAFF COMMENTS
None.
ITEM 2. PROPERTIES
At August 31, 2012, the Company leases approximately 193,000 square feet of office space at its headquarters in Norwalk, Connecticut. In addition, FactSet leases office space for its U.S. reportable segment in New York, New York; Boston, Massachusetts; Chicago, Illinois; San Mateo, California; Austin, Texas; Jackson, Wyoming; Atlanta, Georgia; Tuscaloosa, Alabama; Newark, Ridgewood and Piscataway, New Jersey; Manchester, New Hampshire; and Reston, Virginia. The Company's European segment operates in leased office space in London, England; Paris and Avon, France; Amsterdam, the Netherlands; Frankfurt, Germany; Dubai, United Arab Emirates; and Milan, Italy. Office space in Tokyo, Japan; Hong Kong; Mumbai, India; and Sydney, Australia are leased by FactSet for its Asia Pacific operating segment. The data content collection centers located in Hyderabad, India and Manila, the Philippines benefit all of the Company's operating segments. The leases expire on various dates through March 2021. Total minimum rental payments associated with the leases are recorded as rent expense (a component of selling, general and administrative expenses) on a straight-line basis over the periods of the respective non-cancelable lease terms. The Company believes that its leased office space is adequate for its current needs and that additional space is available for lease to meet any future needs.
Including new lease agreements entered into during fiscal 2012 (as summarized below), the Company's worldwide leased office space increased to approximately 807,000 square feet at August 31, 2012, up 11% from August 31, 2011. The following new lease agreements were finalized during fiscal 2012 by FactSet:
| · | Norwalk, CT: A new lease agreement was entered into during the first quarter of 2012 to expand FactSet's corporate headquarters in Norwalk, CT by approximately 23,800 square feet. The new lease results in incremental future minimum rental payments of $3.8 million over the non-cancelable lease term of eight years. |
| · | New York, New York : New lease agreements for an additional 17,600 square feet of space to support the Company's operations were entered into during first quarter of 2012, which resulted in incremental future minimum rental payments of $3.1 million over the non-cancelable lease term of approximately 3.5 years. |
| · | Hong Kong : A new lease agreement was entered into during the fourth quarter of fiscal 2012 to relocate the existing office within Hong Kong in order to support the Company's growing local presence. The new lease resulted in a net increase of approximately 3,000 rentable square feet and incremental future minimum rental payments of $5.4 million over the non-cancelable lease term of six years. |
| · | Manila, the Philippines: A new lease agreement was entered into during the fourth quarter of fiscal 2012 to expand the Company's content collection operations within the Philippines by approximately 22,900 square feet. The lease results in future minimum rental payments of $2.1 million over the non-cancelable lease term of five years. |
| · | Dubai, United Arab Emirates: A new lease agreement was entered into during the fourth quarter of fiscal 2012 to relocate the existing office within Dubai in order to support the Company's growing local presence. The new lease resulted in a net increase of approximately 1,600 rentable square feet and incremental future minimum rental payments of $0.8 million over the non-cancelable lease term of three years. |
| · | StreetAccount (various locations): The acquisition of StreetAccount in June 2012 increased leased office space by approximately 9,500 rentable square feet and future minimum rental payments by $0.5 million over the remaining non-cancelable lease terms. |
20
Partially offsetting new lease agreements entered into during fiscal 2012 was the consolidation of the East Grinstead office into the larger London office. This consolidation was completed in March 2012 and resulted in a reduction in leased office space by 3,853 rentable square feet. At the time FactSet exited the office space in East Grinstead in March 2012, there were seven months remaining on the lease and less than $0.1 million in remaining rental payments due.
At August 31, 2012, the Company's lease commitments for office space provide for the following future minimum rental payments under non-cancelable operating leases with remaining terms in excess of one year (in thousands):
Years Ended August 31, |
| Minimum Lease Payments | |
2013 |
| $ 27,592 | |
2014 |
| 26,122 | |
2015 |
| 21,771 | |
2016 |
| 15,705 | |
2017 | 14,441 | ||
Thereafter |
| 35,540 | |
Total |
| $ 141,171 | |
I TEM 3. LEGAL PROCEEDINGS
From time to time, FactSet is subject to legal proceedings, claims and litigation arising in the ordinary course of business, including intellectual property litigation . Based on currently available information, FactSet's management does not believe that the ultimate outcome of these unresolved matters against the Company, individually or in the aggregate, is likely to have a material adverse effect on the Company's consolidated financial position, its results of operations or its cash flows . However, these matters are subject to inherent uncertainties and management's view of these matters may change in the future.
ITEM 4. MINE SAFETY DISCLOSURES
Not applicable.
21
Part II
I TEM 5. MARKET FOR REGISTRANT'S COMMON EQUITY, RELATED STOCKHOLDER MATTERS AND ISSUER PURCHASES OF EQUITY SECURITIES
(a) | Market Information |
FactSet common stock is listed on the New York Stock Exchange and the NASDAQ Stock Market under the symbol "FDS." The following table sets forth, for each fiscal period indicated, the high and low sales prices per share of the Company's common stock as reported on the New York Stock Exchange.
FIRST | SECOND | THIRD | FOURTH | |||||||||||||
2012 | ||||||||||||||||
High | $ | 106.06 | $ | 95.52 | $ | 109.20 | $ | 108.00 | ||||||||
Low | $ | 80.93 | $ | 85.45 | $ | 85.38 | $ | 88.56 | ||||||||
2011 | ||||||||||||||||
High | $ | 90.82 | $ | 108.32 | $ | 112.40 | $ | 111.00 | ||||||||
Low | $ | 74.17 | $ | 89.77 | $ | 96.49 | $ | 78.25 | ||||||||
(b) | Holders of Record |
At October 22, 2012, there were approximately 93,162 holders of record of FactSet common stock. However, because many of FactSet's shares of common stock are held by brokers and other institutions on behalf of stockholders, FactSet is unable to estimate the total number of stockholders represented by these record holders. The closing price of FactSet's common stock on October 22, 2012 was $92.02 per share as reported on the New York Stock Exchange.
(c) | Dividends |
In fiscal 2012, the Company's Board of Directors declared the following dividends:
Declaration Date |
| Dividends Per Share of Common Stock |
| Type | Record Date |
| Total Amount (in thousands) |
| Payment Date | ||
August 8, 2012 | $ | 0.31 | Regular (cash) | August 31, 2012 | $ | 13,727 | September 18, 2012 | ||||
May 8, 2012 (1) | $ | 0.31 | Regular (cash) | May 31, 2012 | $ | 13,893 | June 19, 2012 | ||||
February 14, 2012 |
| $ | 0.27 |
| Regular (cash) | February 29, 2012 |
| $ | 12,085 |
| March 20, 2012 |
November 10, 2011 |
| $ | 0.27 |
| Regular (cash) | November 30, 2011 |
| $ | 12,181 |
| December 20, 2011 |
| (1) | On May 8, 2012, FactSet's Board of Directors approved a 15% increase in the regular quarterly dividend, beginning with the Company's dividend payment on June 19, 2012 of $0.31 per share, or $1.24 per share per annum. |
All of the above cash dividends were paid from existing cash resources. Future dividend payments will depend on the Company's earnings, capital requirements, financial condition and other factors considered relevant by the Company and is subject to final determination by the Company's Board of Directors.
(d) | Issuer Purchases of Equity Securities |
The following table provides a month-to-month summary of the share repurchase activity under the current stock repurchase program during the three months ended August 31, 2012:
Period | Total number of shares purchased | Average price paid per share | Total number of shares purchased as part of publicly announced plans or programs | Maximum number of shares (or approximate dollar value) that may yet be purchased under the plans or programs (in thousands)(1) | ||||||||||||
June 2012 | 430,000 | $ | 93.15 | 430,000 | $ | 215,527 | ||||||||||
July 2012 | 280,000 | $ | 92.01 | 280,000 | $ | 189,765 | ||||||||||
August 2012 | - | - | - | $ | 189,765 | |||||||||||
| 710,000 | $ | 92.70 | 710,000 | |||||||||||||
| (1) | Repurchases will be made from time to time in the open market and privately negotiated transactions, subject to market conditions. No minimum number of shares to be repurchased has been fixed. There is no timeframe to complete the repurchase program and it is expected that share repurchases will be paid using existing and future cash generated by operations. |
22
Securities Authorized for Issuance under Equity Compensation Plans
Information regarding securities authorized for issuance under equity compensation plans is incorporated by reference from the Company's Proxy Statement to be filed for its Fiscal 2012 Annual Meeting of Stockholders.
(e) | Recent Sales of Unregistered Securities |
There were no sales of unregistered equity securities in fiscal 2012.
(f) | Five-year Financial Performance Graph |
The annual changes for the five-year period shown in the graph below are based on the assumption that $100 had been invested in FactSet common stock, the Standard & Poor's 500 Index, the NYSE Composite Index and the Dow Jones U.S. Financial Services Index on August 31, 2007, and that all quarterly dividends were reinvested at the average of the closing stock prices at the beginning and end of the quarter. The total cumulative dollar returns shown on the graph represent the value that such investments would have had on August 31, 2012. Stockholder returns over the indicated period are based on historical data and should not be considered indicative of future stockholder returns.
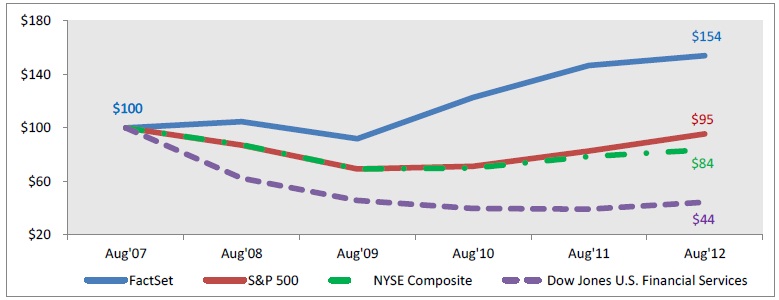
For the Years Ended August 31, | |||||||||||||||||||
2012 | 2011 | 2010 | 2009 | 2008 |
| 2007 | |||||||||||||
FactSet Research Systems Inc. | $154 | $147 | $123 | $ 92 | $105 | $100 | |||||||||||||
S&P 500 Index | $ 95 | $ 83 | $ 71 | $ 69 | $ 87 | $100 | |||||||||||||
NYSE Composite Index | $ 84 | $ 78 | $ 70 | $ 69 | $ 87 | $100 | |||||||||||||
Dow Jones U.S. Financial Services Index | $ 44 | $ 39 | $ 40 | $ 46 | $ 62 | $100 | |||||||||||||
The information contained in the above graph shall not been deemed to be soliciting material or filed or incorporated by reference in future filings with the SEC, or subject to the liabilities of Section 18 of the Securities Exchange Act of 1934, except to the extent that FactSet specifically incorporates it by reference into a document filed under the Securities Act of 1933 or the Securities Exchange Act of 1934.
23
ITEM 6. SELECTED FINANCIAL DATA
The following selected financial data has been derived from FactSet's consolidated financial statements. This financial data should be read in conjunction with Item 7, Management's Discussion and Analysis of Financial Condition and Results of Operations and Item 8, Financial Statements and Supplementary Data , of this Annual Report on Form 10-K.
Consolidated Statements of Income Data
(in thousands, except per share data) | Years Ended August 31, | |||||||||||||||||
| 2012 |
| 2011 |
| 2010 | 2009 |
| 2008 | ||||||||||
Revenues |
| $ | 805,793 |
| $ | 726,510 |
| $ | 641,059 | $ | 622,023 | $ | 575,519 | |||||
Operating income |
| 272,990 |
| 238,335 | (1) |
| 221,634 | 211,030 | 183,887 | (6) | ||||||||
Provision for income taxes | 85,896 | 67,912 | (2) | 71,970 | (4) | 67,172 | (5) | 64,030 | ||||||||||
Net income |
| 188,809 |
| 171,046 | (3) |
| 150,211 | (4) | 144,950 | (5) | 125,017 | |||||||
Diluted earnings per common share |
| $ | 4.12 |
| $ | 3.61 | (3) |
| $ | 3.13 | (4) | $ | 2.97 | (5) | $ | 2.50 | ||
Weighted average common shares (diluted) |
| 45,810 |
| 47,355 |
| 48,004 | 48,789 | 50,080 | ||||||||||
Cash dividends declared per common share |
| $ | 1.16 |
| $ | 1.00 |
| $ | 0.86 | $ | 0.76 | $ | 0.60 | |||||
Consolidated Balance Sheet Data
(in thousands) | August 31, | |||||||||||||||||
2012 | 2011 | 2010 | 2009 | 2008 | ||||||||||||||
Cash and cash equivalents | $ | 189,044 | $ | 181,685 | $ | 195,741 | $ | 216,320 | $ | 143,018 | ||||||||
Accounts receivable, net of reserves | 74,251 | 75,004 | 59,693 | 62,854 | 74,859 | |||||||||||||
Goodwill and intangible assets, net | 289,162 | 274,575 | 274,170 | 227,705 | 246,113 | |||||||||||||
Total assets |
| 694,143 |
| 657,440 |
| 644,608 | 633,952 | 587,274 | ||||||||||
Non-current liabilities | 28,703 | 32,829 | 32,926 | 33,760 | 29,177 | |||||||||||||
Total stockholders' equity |
| $ | 552,264 |
| $ | 515,188 |
| $ | 502,406 | $ | 500,829 | $ | 465,471 | |||||
(1)
| Includes a pre-tax charge of $7.9 million related to an increase in the estimated number of performance-based stock options that will vest. The revised estimate reflects a higher performance level than previously estimated and accordingly, increased the number of performance-based options that will vest and be expensed.
|
(2) | Includes income tax benefits of $6.3 million primarily from the finalization of the fiscal 2010 tax return and the reenactment of the U.S. Federal Research and Development ("R&D") tax credit in December 2010.
|
(3) | Includes $5.4 million (after-tax) of incremental expenses related to an increase in the estimated number of performance-based stock options that will vest and income tax benefits of $6.3 million primarily from the finalization of the fiscal 2010 tax return and the reenactment of the U.S. Federal R&D tax credit in December 2010.
|
(4) | Includes income tax benefits of $1.3 million primarily from the finalization of the fiscal 2009 tax return, adjustments to certain reserves to reflect the lapse of statute of limitations and higher levels of non-U.S. taxable income.
|
(5) | Includes income tax benefits of $4.0 million primarily from the reenactment of the U.S. Federal R&D tax credit in October 2008, finalizing prior year tax returns, adjusting certain reserves to reflect the lapse of statute of limitations and a benefit from repatriating foreign earnings to the U.S.
|
(6) | Includes a pre-tax charge of $2.4 million related to an increase in the number of performance-based stock options that vested in August 2008. |
24
ITEM 7. MANAGEMENT'S DISCUSSION AND ANALYSIS OF FINANCIAL CONDITION AND RESULTS OF OPERATIONS
Management's Discussion and Analysis of Financial Condition and Results of Operations ("MD&A") is designed to provide a reader of our financial statements with a narrative from the perspective of our management on our financial condition, results of operations, liquidity and certain other factors that may affect our future results. Our MD&A is presented in the following sections:
| - | Executive Overview |
| - | Results of Operations |
| - | Foreign Currency |
| - | Liquidity |
| - | Capital Resources |
| - | Off-Balance Sheet Arrangements |
| - | Share Repurchase Program |
| - | Contractual Obligations |
| - | Dividends |
| - | Significant Accounting Policies |
| - | Critical Accounting Estimates |
| - | New Accounting Pronouncements |
| - | Market Trends |
| - | Forward-Looking Factors |
The MD&A should be read in conjunction with the Consolidated Financial Statements and related Notes included in Item 8, Financial Statements and Supplementary Data, of this Annual Report on Form 10-K.
Executive Overview
FactSet is a provider of integrated financial information and analytical applications to the global investment community. We combine content regarding companies and securities from major markets all over the globe into a single online platform of information and analytics. By consolidating content from hundreds of databases with powerful analytics, FactSet supports the investment process from initial research to published results for buy and sell-side professionals. These professionals include portfolio managers, research and performance analysts, risk managers, marketing professionals, sell-side equity research professionals, investment bankers and fixed income professionals. Our applications provide users access to company analysis, multicompany comparisons, industry analysis, company screening, portfolio analysis, predictive risk measurements, alphatesting, portfolio optimization and simulation, real-time news and quotes and tools to value and analyze fixed income securities and portfolios. With Microsoft Office integration, wireless access and customizable options, we offer a complete financial workflow solution. Our revenues are derived from month-to-month subscriptions to services, databases and financial applications. We generate 81% of our revenues from investment management clients and the remainder is from investment banking firms who perform M&A advisory work and equity research.
As of August 31, 2012, we employed 5,735 employees, up 9% or 484 employees from a year ago. Of these employees, 1,840 were located in the U.S., 607 in Europe and 3,288 in Asia Pacific. Approximately 53% of employees are involved with content collection, 25% work in product development, software and systems engineering, another 18% conduct sales and consulting services and the remaining 4% provide administrative support.
Fiscal 2012 was our 34 th year of operation, our 32 nd consecutive year of revenue growth and our 16 th consecutive year of positive earnings growth as a public company. In the past 12 months, we have become faster and more relevant to a broader range of users as we continue to dedicate ourselves to building tools to support a variety of user workflows from traditional Asset Management to Wealth Managers, Mergers & Acquisitions, Advisor, Sales & Trading, Hedge Funds and Private Equity/Venture Capital. FactSet is on the desktops of many of the largest and most successful financial companies in the world. Our unique applications free global professionals from having to gather and collate financial and economic data, which allows them more time to analyze the data and increase their productivity.
25
Fiscal 2012 in Review
Our fiscal 2012 results continue to demonstrate the success FactSet has had in the marketplace. The strength of our business model continues to generate stockholder value as illustrated by our double-digit revenue and diluted earnings per share growth. Robust top and bottom-line growth was achieved despite volatility in the financial markets that may have interrupted short-term buying patterns from our clients. As the economy remains volatile, results indicate our philosophy of consistently investing for the future is paying off. Each of our key operating metrics experienced healthy growth, as we added 155 net new clients and 1,400 new users since August 31, 2011.
ASV totaled $843 million at August 31, 2012, up 7% organically over the prior year, while diluted earnings per share was $4.12, up 14% year over year. We continued to hire around the world, as we added employees in our content collection operations as well as in our engineering and consulting groups. During the third quarter of fiscal 2012, we increased our regular quarterly dividend by 15% to $0.31 per share, making 2012 the seventh consecutive year we have increased our dividend by more than 10%. Aggregating dividends with share repurchases, we returned $204 million to stockholders and generated over $209 million in free cash flow during fiscal 2012.
We acquired StreetAccount in June 2012, a leader in timely and informative news summaries for the investment community. StreetAccount has been integrated into the FactSet workstation and our mobile applications, and will continue to be offered as a standalone web application for its traditional user community. Client feedback about StreetAccount has been overwhelmingly positive.
We are also proud to have been recognized in fiscal 2012 for our exemplary employee workforce who continue to provide the industry's best service. For the fourth time in five years, we were named to Fortune's "100 Best Companies to Work For". We were named to one of the "UK's 50 Best Workplaces" for the fourth year in a row and recognized as one of "France's 50 Best Workplaces." As we continue to grow, we rely on the constant infusion of new ideas and creative thinking to maintain our position at the cutting-edge of financial services and software.
All these metrics simply show that, even now in a volatile marketplace, FactSet continues to grow. Our business continues to expand into adjacent areas, including the wide variety of content we collect and process, as we've grown organically, aided by strategic acquisitions over the years, and remained focused on our core client base. We continue to deliver excellent client service, provided by our home-grown consultants. With them and with our experienced sales and products teams, we provide superior service for clients that demand the very best. We view success over the long-term, which requires us to make new investments in our products and technology every year. This philosophy translates to our products becoming more competitive in the marketplace.
Product Enhancements
The following major fiscal 2012 product developments focused on building tools to support a variety of user workflows that are anticipated to have a significant impact on our future growth.
| · | Fixed Income Portfolio Analysis ("FIPA") - Clients use FIPA to analyze the performance of fixed income portfolios. We released a number of enhancements including a significant expansion of our network of servers to calculate the quantitative models that drive the analysis, as well as a tool to automate the testing of FIPA results. |
| · | StreetAccount - Through the acquisition of StreetAccount in June 2012, we now distill crucial market-moving information for investment professionals, providing concise and timely synopses of important events. We are now able to provide our clients with an efficient method for managing news presented to them each day. StreetAccount has been integrated into the FactSet workstation and our mobile applications, and will continue to be offered as a standalone web application for its traditional user community. |
| · | Company Guide - Company Guide is a new suite of company reports available on our traditional and mobile platforms. The reports and charts provide quick, relevant, and visually pleasing data views, enabling our clients to monitor any of the thousands of companies in our financial data libraries. Company Guide represents our product development focused on ease-of-use and speed of calculation for our product suite. |
| · | Local Market Share (Market Metrics) - We expanded our Local Market Share product beyond mutual funds to include variable annuity and life insurance data. We also grew the user base by introducing a new application for wholesalers to consume local market share data easily and quickly. |
| · | Macro Attribution - Macro attribution, which enables analysis of investment decisions for fund of funds portfolios, has been integrated within our PA suite. This attribution method treats a fund the same way traditional methods treat securities, so performance is viewed for the fund as a whole rather than its component securities. Macro attribution displays the performance of a particular strategy, manager, or asset class. |
| · | Portfolio Analysis in Kanji - This product enhancement has increased our opportunities within the local Japanese investment management market. |
26
| · | Country Synopsis - This new application, available in the FactSet workstation, combines economic data, stock index data, country fundamentals, and company-level data into a single high-level report, which serves as a starting point for analysis of a country. |
| · | Bank Loan Data within FIPA - In June 2012, we announced the integration of bank loan data from Markit to enhance our FIPA service. Under the agreement, we will carry Markit's terms and conditions data on bank loans as well as loan market performance data from both of Markit's iBoxx USD Leveraged Loan's Indexes. |
| · | Entity Structure - In June 2012, we released the industry's first interactive data visualization tool for business entity and counterparty analysis. This new Entity Structure report combines our Entity Data Management solution with comprehensive financial content, letting users dive deeply into a company or country's complex structure. The report capitalizes on the strength of FactSet EDM, which makes available high-quality symbology and entity mapping. Users are able to gain a detailed view of the capital structure of a given entity, as all securities are mapped to the entity's hierarchy at the issuing level. |
Evolving Technology
T he following were key fiscal 2012 improvements to our technology infrastructure necessary to expand our business:
| · | Project NextGen - FactSet is evolving away from large mainframe computers to a more distributed environment powered by a vast array of smaller, faster, and more cost-effective machines. As part of a multi-phase project to be executed over several years, we converted all databases and released several applications on this new platform during fiscal 2012. While this initiative requires a significant investment of internal resources, we do not anticipate any interruption to our clients' workflows. Instead, we expect clients will notice that their FactSet applications run more quickly and reliably. |
| · | Wireless Connectivity – The Company went mobile in the beginning of fiscal 2012 with FactSet for the iPad and the iPhone, supplementing its flagship workstation offering with the same data and analytical products on mobile devices. This capability embeds the FactSet service offering even further into the daily workflow of its clients. |
| · | Mainframe Upgrade - In addition to investing in the future via our NextGen initiative, we continued to ensure that our existing mainframe architecture functions at high levels. During the year we upgraded the remaining 20% of our mainframes to optimize speed and consistency for both client batch and interactive workloads. |
| · | Fixed Income Analytics - We expanded our state-of-the-art grid of servers and software systems that support our industry-leading fixed income analytics platform. This grid, or network of servers, now has more computing power than our mainframe computers and at a lower cost. |
| · | Direct Exchange Feed Expansion - We established direct lines to several dozen additional domestic and international securities exchanges during fiscal 2012, giving us more control of the quality and timeliness of real-time exchange data. Rather than depending upon third-party consolidated feeds, we have taken the initiative to control the technology for this critical information. |
Growing and Enhancing FactSet Proprietary Data Sets
Our proprietary collection process allows us to enhance data in valuable and new ways. As such, we continue to expand our content collection facilities in India and the Philippines, staffing the new centers with financial information industry experts to make improvements in timeliness and reliability. Over the last 12 months we increased our content collection headcount by 215 employees. As of August 31, 2012, there were 3,124 employees in Hyderabad and Manila responsible for collecting and publishing data on thousands of global companies using a proprietary FactSet collection process. T he following were significant proprietary content initiatives during fiscal 2012:
| · | FactSet Fundamentals – We expanded the number of companies covered by the FactSet Fundamentals collection team, making this critical data set even more relevant to users who follow Asian and emerging markets. Our team realized a huge improvement in collection speed, becoming more timely than other providers of fundamentals data. The comprehensive coverage available on FactSet Fundamentals now includes more than 72,000 companies, 20 years of historical data, up to 2,000 data elements on each company record and intra-day updates for more than 150 data items. |
| · | FactSet Estimates - The FactSet Estimates database is now a best-of-breed in the industry, used by The Wall Street Journal for the annual "Best on the Street" analyst survey and widely sourced in major financial publications and other media channels. The FactSet Estimates collection team expanded the breadth of available information, including such innovative enhancements as product-level estimates and reconciliations of GAAP to Non-GAAP measures, as investors seek to interpret company earnings releases to yet another level of detail. FactSet Estimates now covers approximately 16,300 active companies globally with 806 contributors providing comprehensive consensus-level estimates and statistics. |
| · | Credit Analysis - Our collection and presentation of debt capital structure information advanced beyond what we believe is currently offered by some of our competitors. This data set is global, timely, and links directly to the underlying prospectus or indenture. We've integrated our data with content from third parties and created new reports focused on liquidity, causing credit analysis to emerge as a competitive advantage for FactSet. |
27
| · | Fixed income Terms and Conditions - O ur collection teams also focused their 2012 efforts on collecting terms and conditions of fixed income instruments. The primary purpose of this effort was to improve the client experience for users of FIPA. Our terms and conditions database has grown this year to cover more than 75,000 non-U.S. securities, primarily related to corporate and sovereign debt instruments. |
Job Creation
We believe that future success depends in part on our continued ability to hire, assimilate and retain qualified personnel. As of August 31, 2012, employee headcount was 5,735, up 9% from a year ago. This marks the third consecutive year we have hired at least 450 people and in the past three years, FactSet has created a net new 2,773 jobs around the world, including more than 500 within the U.S. Fiscal 2012 employee growth was broad-based as we welcomed new classes of software engineers and sales consultants, continued the expansion of our proprietary content collection operations in India and the Philippines and welcomed employees through the acquisition of StreetAccount.
StreetAccount Acquisition
On June 29, 2012, we acquired StreetAccount LLC ("SA") to complement our news offering with distilled and crucial market moving information for buy-side and sell-side institutions. Founded in 2003, SA is known for its timely and informative news summaries and provides investment professionals with an efficient method for managing news flow. The StreetAccount service includes real-time company updates, portfolio and sector filtering, email alerts, and market summaries. Content is written by financial professionals and can be customized for portfolio, index, sector, market, time of day (i.e., Overnight Summaries), and category (i.e., Top Stories, Market Summaries, Economic, M&A). At the time of acquisition, SA had annual subscriptions of $11.4 million. FactSet is now the sole distributor of StreetAccount news and current FactSet users can gain immediate, integrated access to StreetAccount through the FactSet workstation and iPad application.
Awards and Recognition
We received the following accolades during fiscal 2012:
| · | Ranked #75 on Fortune's "100 Best Companies to Work For," and included on that list for the fourth time |
| · | FactSet Europe was named one of the "UK's 50 Best Workplaces" for the fourth consecutive year |
| · | Recognized as one of "France's 50 Best Workplaces" |
| · | Ranked within Connecticut's 2012 Best Places to Work |
| · | Named a "Top 10 Best Small-Medium Company to Work For" by the Business Research Guide |
| · | We also held our U.S. and European symposia during fiscal 2012, with over 320 industry professionals in attendance from around the world, including 270 clients |
Growth across all Geographies and Key Metrics
In fiscal 2012, we delivered growth across all of our key metrics as our sales and consulting staff continued to sell our broad range of products across each geographic region. We gained new clients and users both in the U.S. and internationally, as new and existing clients continue to value our functionality and content.
U.S. Operations
| · | U.S. revenues increased to $550.5 million in fiscal 2012. |
| · | Revenues from U.S. operations accounted for 68% of our consolidated revenues in fiscal 2012, consistent with the prior year. |
| · | ASV was $572 million at August 31, 2012, up 5% from a year ago when excluding acquired StreetAccount ASV. |
| · | Employee count in the U.S. grew 7% during fiscal 2012 and represented 32% of all employees at August 31, 2012. |
International Operations
| · | Non-U.S. revenues increased to $255.3 million in fiscal 2012. |
| · | Revenues from non-U.S. operations accounted for 32% of our consolidated revenues for fiscal 2012, consistent with the prior year. |
| · | ASV was $271 million at August 31, 2012, up 10% year over year. |
| · | Headcount increased by 357 since September 1, 2010 to 3,895 international employees as of August 31, 2012 and represented 68% of all employees company-wide. |
28
Capital Expenditures
| · | Capital expenditures were $22.5 million in fiscal 2012. |
| · | $13.1 million or 58% of capital expenditures was for computer equipment, including upgrading our mainframe server equipment held in our data centers and laptop computers and peripherals for our growing employee base. |
| · | $9.4 million or 42% of capital expenditures were incurred for the build out of new space in Norwalk, New York and Hong Kong as well as the continued expansion of leased office space in the Philippines. |
Growth in Several Key Metrics for Fiscal 2012
| · | ASV was $843 million at August 31, 2012, up 7% organically over the prior year. |
| · | Revenues grew 11% to $806 million. |
| · | Diluted earnings per share rose 14% to $4.12. |
| · | Free cash flow generated over the last twelve months was $209 million, up 18%. |
| · | Accounts receivable decreased $1 million over the last twelve months while organic ASV was up $53 million over the same period, reflecting an improvement in our days sales outstanding ("DSO") from 35 to 32 days. |
| · | Professionals using FactSet increased to 49,500, up 1,400 users. |
| · | A net increase of 155 clients over the last twelve months compared to 127 last year. |
| · | Annual client retention remained greater than 95% of ASV and 92% when expressed as a percentage of clients, both statistics consistent with a year ago. |
Returning Value to Stockholders
| · | We increased our quarterly dividend 15% from $0.27 to $0.31 per share in May 2012. |
| · | The Company paid $50 million of regular quarterly dividends during fiscal 2012. |
| · | We expanded our existing share repurchase program by an additional $200 million in May 2012. |
| · | FactSet repurchased 1.6 million shares for $153 million under the program. Including the expansion, $190 million remains authorized for future share repurchases as of August 31, 2012. |
Results of Operations
For an understanding of the significant factors that influenced our performance during the past three fiscal years, the following discussion should be read in conjunction with the Consolidated Financial Statements and the Notes to Consolidated Financial Statements presented in this Annual Report on Form 10-K.
(in thousands, except per share data) Years Ended August 31, | 2012 | 2011 | Change | 2011 | 2010 | Change | ||||||||||||||||||
Revenues | $ | 805,793 | $ | 726,510 | 10.9 | % | $ | 726,510 | $ | 641,059 | 13.3 | % | ||||||||||||
Cost of services | 275,537 | 244,623 | 12.6 | % | 244,623 | 206,550 | 18.4 | % | ||||||||||||||||
Selling, general and administrative | 257,266 | 243,552 | 5.6 | % | 243,552 | 212,875 | 14.4 | % | ||||||||||||||||
Operating income | 272,990 | 238,335 | 14.5 | % | 238,335 | 221,634 | 7.5 | % | ||||||||||||||||
Net income | $ | 188,809 | $ | 171,046 | 10.4 | % | $ | 171,046 | $ | 150,211 | 13.9 | % | ||||||||||||
Diluted earnings per common share | $ | 4.12 | $ | 3.61 | 14.1 | % | $ | 3.61 | $ | 3.13 | 15.3 | % | ||||||||||||
Diluted weighted average common shares | 45,810 | 47,355 | 47,355 | 48,004 | ||||||||||||||||||||
Revenues
Fiscal 2012 compared to Fiscal 2011
Revenues in fiscal 2012 were $805.8 million, up 10.9% compared to the prior year. Included in this total was $1.8 million from the acquisition of StreetAccount on June 29, 2012. Our revenue growth drivers during fiscal 2012 were broad-based growth across all geographies, continued use of our advanced applications such as Portfolio Analysis, growth in the number of clients and users, new features and enhancements to our competitive product suite, expanded deployment of our proprietary data, annual price increases, the ability to access FactSet for the iPad and the iPhone, increased usage of FactSet in Excel by both buy and sell-side users, growth in our Market Metrics business and an annual client retention rate that is greater than 95% of ASV and 92% in terms of clients. These revenue drivers were partially offset by TheMarkets.com cancellation of an earnings estimates feed from us.
Broad-based growth across all geographies
Our sales and consulting staff continued to sell our broad range of products across each geographic region. We gained new clients at traditional money managers, regional broker dealers and among research and sales departments both in the U.S. and internationally. Revenues generated by each of our segments experienced double-digit growth compared to a year ago, as U.S. revenues were up 10.6%, European revenues advanced 10.5% and Asia Pacific revenues grew 15.2%. Our investment management clients represented 81% of our total ASV as of August 31, 2012, up from 79% a year ago.
29
Clients continue to license our advanced applications
Our Portfolio Analytics suite of products, including our Fixed Income in PA product, continued to be a source of revenue growth. PA 2.0, Portfolio Publisher, SPAR (Style Performance and Risk Analysis), Fixed Income in PA, benchmarks and indices, and our risk optimizer products have been among the many value-added applications that continue to be in demand by existing clients as well as an attractive selling point for new clients. In the last 12 months, both PA users and clients have increased by double digits as this suite is comprehensive and includes the applications for portfolio attribution, risk, quantitative analysis, portfolio publishing and returns based, style analysis. Portfolio Publisher was successful in fiscal 2012 as buy side clients used it to streamline their report production workflows. Quantitative analysis groups have found value our suite of risk models and portfolio optimizers, which are fully integrated and offered by FactSet. Our strength in portfolio analysis and our ability to effectively manage the complex requirements of our clients is a marked differentiator for FactSet.
Growth in the number of clients and users of FactSet
We have experienced net new client growth for 11 consecutive quarters. It is rewarding to see net new client growth for 11 consecutive quarters against a backdrop of economic volatility where we have seen uncertain economic times stifle new firm creation and extend the timeframes clients take to make large spending decisions. The total number of FactSet clients as of August 31, 2012 was 2,392, a net increase of 155 clients during the past 12 months as compared to 127 net new clients during fiscal 2011. Excluding the StreetAccount acquisition, we added 57 net new clients during the fourth quarter of 2012. This represented the highest quarterly total in six years. Adding new clients is one of the first steps for us in increasing ASV. New clients typically begin at lower ASV levels and grow over the first few years. At August 31, 2012, our largest individual client accounted for 2% of total subscriptions and annual subscriptions from the ten largest clients did not surpass 16% of total client subscriptions, consistent with August 31, 2011.
At August 31, 2012, there were 49,500 professionals using FactSet, an increase of 1,400 users from a year ago. Users declined among sell-side clients, but the overall user count still increased by 1,400 on a net new basis during fiscal 2012 due to penetration on the buy-side. In the past 12 months, our investment management client base has added approximately 1,900 users while our investment banking clients have contracted by 500 users. These investment banking clients were cautious in fiscal 2012 as they closely reviewed and scrutinized their user populations and right-sized their populations based on how they perceive market opportunities. Many of them experienced headcount reductions, which lowered our investment banking user count. However, in the fourth quarter of fiscal 2012, total user count increased by 1,100 due to growth in both the investment management and banking businesses. This user count growth was strong when considering the high season of hiring for sell-side banks is in the summer, and our belief that new hires declined by approximately 20% compared to 2011.
New Features and Enhancements to our Competitive Product Suite
Though global market volatility resulted in a business environment less favorable to our clients, FactSet continued to provide a highly competitive product suite. Despite widespread expense reduction programs at our clients, fiscal 2012 saw FactSet gain market share. As a result, our client and user counts expanded to record highs. We successfully released new features and enhancements to the FactSet workstation during fiscal 2012. Speed and software stability improvements were highlights and made our system even more compelling to our clients. As in the prior year, our client product usage growth rate exceeded our subscription growth rate, signaling that we delivered more value per dollar of subscription to our clients.
Real-time users have increased every quarter since the product was released in 2002. Real-time news and quotes is a product that services the needs of a global investor and continues to be a source of revenue growth for us. Deployment of real-time news and quotes has resulted in a significant increase in user count over the last 12 months. In addition, the ability for our end users to access more than 85 premium third-party content providers and 100 exchanges and integrate their own data for use in FactSet applications continues to support revenue growth.
Expanded deployment of our proprietary data
FactSet proprietary content has been a solid contributor to our total revenue growth in fiscal 2012 as our proprietary multi-year content initiative took form during fiscal 2012. We believe that several of our content offerings have become superior to those of our competitors. Enhancements to a multitude of our content offerings were incorporated into FactSet during fiscal 2012. We have been successful in licensing proprietary FactSet data and in particular, FactSet Fundamentals and FactSet Estimates. The types of data licensed in feed form include Ownership, Transcripts, M&A and Corporate Hierarchy data, among others. Data feeds are consumed by a range of clients, including existing large FactSet clients and some who do not manage money or provide sell-side services.
30
Annual Price Increase
As FactSet has done for the past several years, we issued annual price increases during fiscal 2012. These price increases impacted the majority of our U.S. and non-U.S. investment management clients and resulted in ASV growth of $13 million during 2012 as compared to $11 million a year ago. The annual price increases implemented in January 2012 (for U.S. investment management clients) and March 2012 (for non-U.S. investment management clients) grew revenues by $8.2 million during fiscal 2012 compared to last year. The annual price increases implemented in January and March 2011 contributed an additional $4 million in revenues in fiscal 2012 compared to fiscal 2011.
FactSet Mobility
We went mobile in fiscal 2012 with FactSet for the iPad and the iPhone, supplementing our flagship workstation offering with the same data and analytical products on mobile devices. Client feedback for these offerings has been extremely positive and embeds our service even further into our clients' daily workflows.
Increased usage of FactSet in Excel by both buy and sell-side users
We've been pleased by the increased usage of FactSet in Excel by both buy and sell-side users. This increased client engagement level was brought about by the release of Sidebar a year ago, which is the new FactSet for Excel. Sidebar enhances the workflow of the user by making it simple and easy to customize and derive great value straight from Excel, one of the most widely-used software platforms in our industry.
Annual client retention rates
Consistent with last year, our annual client retention rate was greater than 95% of ASV at August 31, 2012. As a percentage of actual clients, the annual retention rate was 92% at August 31, 2012, also consistent with last year. We believe these statistics, which have remained consistent since last year despite a volatile global economy, demonstrate to us that our clients continue to be engaged with our services and derive value from them.
Growth in the Market Metrics business
The Market Metrics mutual fund local market share product that we introduced last year has been performing well. In addition to mutual funds, we have expanded the Local Market Share suite of products to include variable annuity, life insurance, and applications for wholesalers. The Local Market Share suite of products has enabled senior management to understand the value and penetration of their own products in local markets in greater detail than they have been able to examine before.
Acquisition of StreetAccount
On June 29, 2012, we acquired StreetAccount to complement our news offering with distilled and crucial market moving information for buy- and sell-side institutions. At the time of acquisition, StreetAccount had annual subscriptions of $11.4 million. During fiscal 2012, StreetAccount added $1.8 million of revenue to our operations. However, the acquisition of SA did not have an impact on our fourth quarter diluted earnings per share.
Partially offsetting the positive revenue drivers discussed above was a cancellation of an earnings estimates feed to TheMarkets.com as a result of its acquisition by S&P Capital IQ and a decline in ASV from investment banking clients in the past 12 months as the banks continued their reduction in spending and hiring. In late 2010, Capital IQ, a Standard & Poor's business and a subsidiary of The McGraw-Hill Companies, acquired the research and estimates business of TheMarkets.com. FactSet had previously negotiated an agreement to provide TheMarkets.com with an earnings estimates feed, and this agreement was subsequently cancelled in the third quarter of fiscal 2012, reducing ASV by $4.1 million. However, total user count was not impacted as a result of the cancellation because the agreement provided an earnings estimates feed without any workstations.
Fiscal 2011 compared to Fiscal 2010
Revenues in fiscal 2011 were $726.5 million, up 13.3% from $641.1 million in 2010. Increased revenues were from successes across our product suite and in all geographic locations. The fourth quarter of fiscal 2011 was a record quarter for us as ASV grew by $37 million, rising to $779 million at August 31, 2011. During fiscal 2011, our user count increased by 5,300, net new clients rose to 127, and annual subscriptions increased by $93 million organically. Broad-based growth was the catalyst for accelerating our ASV growth rate to 14% in fiscal 2011. Our investment management clients experienced strong growth and for much of fiscal 2011, the global financial markets were in positive territory, thus encouraging many of our clients to invest in people and in their business partnerships. This positive business environment, coupled with our strategy of continual product and service enhancements translated into progress in each of our key metrics. We also invested heavily in the product during 2011, releasing four new versions, each with many new features and improvements in speed and stability. Our revenue growth drivers during fiscal 2011 were broad-based growth across our geographical segments, clients continued use of our advanced applications such as Portfolio Analysis, growth in the number of clients and users, new functionality within FactSet that improves our clients' workflows by consolidating multiple services into one platform, the expanded deployment of our proprietary data, incremental revenue from the acquisition of Market Metrics on June 1, 2010, an increase in the client retention rate and annual price increases.
31
Revenues by Geographic Region
(in thousands) Years Ended August 31, | 2012 | 2011 | 2010 | |||||||||
U.S. | $ | 550,474 | $ | 497,564 | $ | 435,351 | ||||||
% of revenues | 68.3 | % | 68.5 | % | 67.9 | % | ||||||
Europe | $ | 197,404 | $ | 178,693 | $ | 161,649 | ||||||
Asia Pacific | 57,915 | 50,253 | 44,059 | |||||||||
International | $ | 255,319 | $ | 228,946 | $ | 205,708 | ||||||
% of revenues | 31.7 | % | 31.5 | % | 32.1 | % | ||||||
Consolidated | $ | 805,793 | $ | 726,510 | $ | 641,059 | ||||||
Revenues from our U.S. segment increased 10.6% to $550.5 million in fiscal 2012 compared the same period a year ago. Our revenue growth rate in the U.S. reflects strong client and user count growth, the expanded deployment of our proprietary content, an increase in the number of PA users, annual price increases, incremental revenues from Market Metrics and the acquisition of StreetAccount. The annual price increase for our U.S. investment management clients in January 2012 drove revenues up by approximately $6.8 million in fiscal 2012. StreetAccount added $1.8 million of revenue to the U.S. segment since its acquisition in June 2012.
International revenues in fiscal 2012 were $255.3 million, an increase from $228.9 million in the prior year period. The impact from foreign currency increased international revenues by $0.5 million year over year. European revenues advanced 10.5% to $197.4 million due to offering a broader selection of global proprietary content, an annual price increase for the majority of our non-U.S. investment management clients in March 2012, increases in user and client counts and clients licensing our advanced applications. Asia Pacific revenues grew to $57.9 million, up 15.2% from a year ago. The foreign currency impact attributable to the change in the value of the Japanese Yen compared to the U.S. dollar increased revenues by $0.5 million in fiscal 2012. Holding currencies constant, Asia Pacific revenue growth year over year was 14.2%, primarily due to growth in our global content offering, the expansion of our real-time news and quotes that services the needs of a global investor, our ability to sell additional services to existing clients and new client and user growth over the last 12 months. In March 2012, we issued our annual price increase for the majority of our non-U.S. investment management clients resulting in incremental revenue of $1.4 million during fiscal 2012. Revenues from international operations accounted for 31.7% of our consolidated revenues during 2012, up from 31.5% in the year ago quarter.
Our U.S. segment revenue increased 14.3% to $497.6 million during fiscal 2011 compared to 2010. Excluding the acquisition of Market Metrics on June 1, 2010, U.S. revenues grew 11.3% in fiscal 2011 as compared to the same period a year ago. International revenues were up 11.3% to $228.9 million in fiscal 2011 compared to the same period a year ago. The impact from foreign currency increased international revenues by $1.4 million year over year. European revenues advanced 10.5% due to offering a broader selection of global proprietary content coupled with user and client growth. Excluding the impact of foreign currency, Asia Pacific revenue growth was 10.9% year over year. The annual price increases for our U.S. investment management and banking and brokerage clients in January 2011 drove revenues up by approximately $6 million in fiscal 2011 as compared to $5 million in fiscal 2010.
Annual Subscription Value ("ASV")
At August 31, 2012, ASV was $843 million, up 7% organically over the prior year. ASV at a given point in time represents the forward-looking revenues for the next 12 months from all subscription services being supplied to our clients. With proper notice to us, our clients are able to add to, delete portions of, or terminate service at any time.
\
($ in millions) As of August 31, | 2012 | 2011 | 2010 |
| 2009 |
| 2008 |
| 2007 |
| 2006 |
| 2005 |
| 2004 | |||||||||||||||||||||
Total ASV | $ | 843 | * | $ | 779 | $ | 684 | ** |
| $ | 623 |
|
| $ | 621 |
|
| $ | 517 |
|
| $ | 423 |
|
| $ | 348 |
|
| $ | 273 |
| ||||
International ASV | $ | 271 |
| $ | 246 |
| $ | 218 |
|
| $ | 200 |
|
| $ | 195 |
|
| $ | 157 |
|
| $ | 126 |
|
| $ | 92 |
|
| $ | 56 |
| |||
* | Includes $11.4 million from the acquisition of StreetAccount on June 29, 2012.
|
** | Includes $15.9 million from the acquisition of Market Metrics on June 1, 2010. |
ASV from our U.S. operations was $572 million, up $28 million from a year ago, excluding acquired StreetAccount ASV. ASV from international operations increased $25 million since the beginning of the fiscal year and totaled $271 million at August 31, 2012, representing 32% of our Company-wide total. The percentage of our total ASV derived from investment management clients increased from 79% a year ago to 81% at August 31, 2012.
32
The increase in ASV during fiscal 2012 was driven by broad-based growth across geographical segments, continued use of FactSet advanced applications such as PA, expanded deployment of proprietary data, growth in the number of clients and users, increased usage of FactSet in Excel by both buy and sell-side users, growth in the Market Metrics Local Market Share suite of products, a high annual client retention rate, annual price increases for the majority of the Company's investment management clients and the acquisition of StreetAccount in June 2012, which at the time of acquisition, had annual subscriptions of $11.4 million. These growth drivers were partially offset by a cancellation of an earnings estimates feed to TheMarkets.com as a result of its acquisition by Standard & Poor's Capital IQ and a decline in ASV from investment banking clients in the past 12 months as the banks continued their reduction in spending and hiring. As noted earlier, in January 2012, we issued annual price increases for our U.S. investment management clients resulting in ASV growth of $10 million and in March 2012, we issued annual price increases for our non-U.S. investment management clients increasing ASV by $3 million.
Fiscal 2011 experienced ASV growth of 14%, driven by purchases of growth in the number of clients and users, the expanded deployment of proprietary data, an increase in the client retention rate, ASV growth in the Market Metrics business and an annual price increase for our clients. In January 2011, we implemented an annual price increase for the majority of our U.S. investment management clients and a smaller percentage of our U.S. global banking and brokerage business. This price increase resulted in ASV growth during fiscal 2011 of $9 million. In addition, in March 2011 we rolled out an annual price increase for our non-U.S. investment management clients, which increased ASV by $2 million.
We believe that our continued ASV growth in both fiscal 2012 and 2011 highlight the stability of our subscription business model. We continue to combine our analytic applications, premier global content and client service to foster growth and the expansion of our business.
Operating Expenses
(in thousands) Years Ended August 31, | 2012 | 2011 | 2010 | |||||||||
Cost of services | $ | 275,537 | $ | 244,623 | $ | 206,550 | ||||||
Selling, general and administrative | 257,266 | 243,552 | 212,875 | |||||||||
Total operating expenses | $ | 532,803 | $ | 488,175 | * | $ | 419,425 | |||||
Operating income | $ | 272,990 | $ | 238,335 | $ | 221,634 | ||||||
Operating Margin | 33.9 | % | 32.8 | % * | 34.6 | % | ||||||
* Included in operating expenses during fiscal 2011 was an incremental $7.9 million of stock-based compensation related to an increase in the estimated number of performance-based options scheduled to vest. The revised estimate reflects a higher performance level than previously estimated and accordingly, increased the number of performance-based options scheduled to vest and be expensed. The pre-tax stock-based compensation charge of $7.9 million reduced the Company's operating margin by 110 basis points from 33.9% to 32.8% during fiscal 2011.
Cost of Services
Fiscal 2012 compared to Fiscal 2011
For the twelve months ended August 31, 2012, cost of services increased 12.6% to $275.5 million as compared to $244.6 million in the same period a year ago. Cost of services expressed as a percentage of revenues was 34.2% during fiscal 2012, an increase of 50 basis points over the prior year due higher employee compensation expense associated with new hires in consulting, engineering and content as well as an uptick in data costs offset by lower computer depreciation, a decline in intangible assets amortization expense and a prior year stock-based compensation charge.
Employee compensation, including stock-based compensation, expressed as a percentage of revenues, increased 115 basis points during fiscal 2012 compared to the same period a year ago from new hires in software engineering and consulting, increased headcount in our proprietary content collection operations located in India and the Philippines and salary increases year over year. Over the last 12 months we have increased our headcount at our facilities in India and the Philippines by 215. At August 31, 2012, approximately 53% of our employees were involved with content collection. In addition to the hiring of employees at our primary content collection sites, we grew by approximately 210 net new engineering and product development employees and 30 net new consultants in the past year, as we continue to improve our applications and service our existing client base. Higher compensation was partially offset by lower stock-based compensation expense in fiscal 2012 as the year ago period included a pre-tax charge of $7.9 million related to an increase in the estimated number of performance-based options scheduled to vest (approximately $1.9 million of the total pre-tax charge of $7.9 million was recorded within cost of services). Data costs, expressed as a percentage of revenues, increased 15 basis points in fiscal 2012 compared to the same period a year ago due to our growing user base, the continued expansion of our third party data set offerings and incremental Market Metrics data collection costs. As the result of us adding 155 clients and 1,400 users in the past 12 months, we incurred incremental variable fees payable to data vendors based on deployment of their content over the FactSet platform.
33
Lower computer depreciation and amortization of intangible assets expense partially offset higher compensation and data costs during fiscal 2012 compared to the same period a year ago. Computer-related expenses, including depreciation and computer maintenance costs, decreased 55 basis points in fiscal 2012 as compared to a year ago due to the transition to more efficient and cost-effective servers in our data centers and the use of fully depreciated servers. The cost per server and related maintenance continues to decline as we have become more efficient in our data centers. Amortization of intangible assets declined 25 basis points from a year ago as additional intangible assets became fully amortized during 2012, while revenues increased over the same period by 11%. Amortization expense from intangible assets acquired from the StreetAccount acquisition in June 2012 was not material to fiscal 2012.
Fiscal 2011 compared to Fiscal 2010
Cost of services increased 18% to $244.6 million in fiscal 2011 as compared to $206.6 million in fiscal 2010. Cost of services expressed as a percentage of revenues was 33.7% during fiscal 2011, an increase of 150 basis points from 2010. The increase year over year was driven by higher employee compensation, including performance-based stock option expense, partially offset by lower levels of third party data costs, computer-related expenses and communication costs.
Employee compensation, including stock-based compensation, expressed as a percentage of revenues, increased 330 basis points for the twelve months ended August 31, 2011 compared to fiscal 2010 due to the continued expansion of our proprietary content collection operations, the hiring of new classes of engineers and consultants around the world, increased variable compensation and higher stock-based compensation expense. Stock-based compensation recorded within cost of services was up $3.2 million in fiscal 2011 as compared to a year ago due to performance-based stock options. As disclosed earlier, an incremental $7.9 million of stock-based compensation was recorded in fiscal 2011 related to an increase in the estimated number of performance-based options that will vest. The revised estimate reflected a higher performance level than previously estimated and accordingly, increased the number of performance-based options that will vest and be expensed. Approximately $1.9 million of the total pre-tax charge of $7.9 million was recorded within cost of services and the remaining $6.0 million within selling, general and administrative expenses.
Lower third party data costs, computer-related expenses and communication costs partially offset the overall increase in cost of services during fiscal 2011 compared to fiscal 2010. Third party data costs, expressed as a percentage of revenues, decreased 80 basis points for the twelve months ended August 31, 2011 compared to the same period in fiscal 2010 due to a reduction in data expense associated with the end of the Thomson Reuters transition services agreement and the increased focus on collecting more proprietary content which is recorded as employee compensation as opposed to paying for third party data content. Computer-related expenses, including depreciation and computer maintenance costs, decreased 70 basis points, expressed as a percentage of revenues, in fiscal 2011 as compared to a year ago due to the continued use of fully depreciated servers. Communication costs, expressed as a percentage of revenues, decreased 20 basis points in fiscal 2011 as compared to fiscal 2010 due to implementing more cost effective means to connect clients to our data centers.
Selling, General and Administrative
Fiscal 2012 compared to Fiscal 2011
For the twelve months ended August 31, 2012, SG&A expenses increased 5.6% to $257.3 million from $243.6 million a year ago. Expressed as a percentage of revenues, SG&A expenses decreased 160 basis points to 31.9% during fiscal 2012 due to lower employee compensation, including stock-based compensation, a reduction in travel and entertainment ("T&E") spending and lower occupancy costs partially offset by foreign currency hedging losses.
Employee compensation, including stock-based compensation, expressed as a percentage of revenues, decreased 150 basis points in fiscal 2012 due to decreased variable compensation and lower stock option expense due to a charge for vesting of performance options last year. Approximately $6.0 million of the total pre-tax stock-based compensation charge of $7.9 million was recorded within SG&A during fiscal 2011. In the past 12 months, the majority of our hiring was within our software engineering, content collection and product development teams, which is included within cost of services. As such, SG&A expenses, expressed as a percentage of revenues, has declined compared to the growth in cost of services. T&E costs, expressed as a percentage of revenues, decreased 50 basis points in the fiscal 2012 compared to the same period in fiscal 2011 primarily due to lower interoffice travel and a prior year internal sales conference that did not reoccur in fiscal 2012. Occupancy costs, including rent and depreciation of furniture and fixtures, expressed as a percentage of revenues, decreased 30 basis points in fiscal 2012 due to more efficient use of existing leased office space and the timing of acquiring new space. However, lower occupancy costs in fiscal 2012 are temporary and are being driven by the timing of acquiring new space and favorable currency rates.
Partially offsetting the decrease in SG&A expenses were realized losses recorded in fiscal 2012 from our hedges. During fiscal 2012, we entered into foreign currency forward contracts to partially hedge our Indian Rupee exposure through the end of the first quarter of fiscal 2015. Since the date the forward contracts were entered into, the U.S. dollar has strengthened against the Indian Rupee, and as a result, we recorded a loss on derivatives of $1.0 million in SG&A during fiscal 2012. This loss compares to a gain of $4.2 million recorded in SG&A a year ago as a result of previously entered into foreign currency forward contracts to hedge our Euro and British Pound Sterling currency risk.
34
Fiscal 2011 compared to Fiscal 2010
SG&A expenses in fiscal 2011 were up 14% from fiscal 2010. Expressed as a percentage of revenues, SG&A expenses rose 30 basis points to 33.5% in fiscal 2011 from higher T&E expenses, increased stock-based compensation from performance-based stock options and a full year of expense from the acquisition of Market Metrics partially offset by hedging gains and a decrease in marketing costs.
Expressed as a percentage of revenues, T&E costs increased 70 basis points in fiscal 2011 compared to fiscal 2010 primarily due to more client visits, more U.S. employees traveling overseas, a 30% overall increase in air fares and hotel fees and . In addition, during the third quarter of fiscal 2011, we held an internal sales conference as well as large scale client conferences, one in the U.S. and one in Europe. Higher stock-based compensation expense reflects the incremental charge from performance-based stock options. Of the total pre-tax charge of $7.9 million related to an increase in the estimated number of performance-based options that will vest, $6.0 million was recorded within SG&A. Market Metrics was acquired on June 1, 2010 resulting in incremental SG&A expenses in 2011 as compared to 2010, primarily within employee compensation, office expenses and T&E.
The rise in SG&A expenses was partially offset due to a gain on derivatives of $4.2 million during fiscal 2011 as compared to a gain of $0.8 million a year ago from foreign currency forward contracts to hedge our Euro and British Pound Sterling currency risk. Marketing costs, expressed as a percentage of revenues, decreased 10 basis points in 2011 as compared to 2010 primarily due to the prior year launch of the new FactSet and the related costs to market the new release.
Operating Income and Operating Margin
Fiscal 2012 compared to Fiscal 2011
Operating income advanced 14.5% to $273.0 million for the twelve months ended August 31, 2012 compared to the prior year. Our operating margin during fiscal 2012 was 33.9%, up 110 basis points from 32.8% a year ago due to lower stock-based compensation expense, a reduction T&E spending, more efficient occupancy costs and a decline in computer depreciation and the amortization of intangible assets. These reductions in expenses were partially offset by higher employee compensation due to expanding the number of employees in all areas throughout the world, including within our content operations, engineering, product development and consulting groups. The continued investment in our personnel resulted in employee count growth of 9% year over year and was driven by hiring in our India and Philippines operations, as well as the hiring of consultants and software engineers in each geographic region. The impact from foreign currency increased fiscal 2012 operating income by $1.3 million compared to a $0.1 million decrease in operating income during fiscal 2011.
Fiscal 2011 compared to Fiscal 2010
Operating income increased 8% to $238.3 million in fiscal 2011 from $221.6 million in fiscal 2010. Our operating margin during fiscal 2011 was 32.8%, down from 34.6% a year ago. Included in fiscal 2011 was an incremental $7.9 million of stock-based compensation from a favorable change in the outcome of performance-based stock options. This charge reduced our operating income by $7.9 million and operating margin by 110 basis points to 32.8%. In addition to higher stock-based compensation, the decrease in our fiscal 2011 operating margin compared to fiscal 2010 was due to the growth in our employee headcount and a rise in T&E partially offset by lower data costs and computer-related expenses. Foreign currency increased fiscal 2010 operating income by $4.7 million compared to a $0.1 million decrease in during fiscal 2011.
Operating Income by Segment
(in thousands) Years Ended August 31, | 2012 | 2011 | 2010 | |||||||||
U.S. | $ | 149,968 | $ | 135,327 | $ | 124,976 | ||||||
Europe | 95,417 | 79,637 | 72,239 | |||||||||
Asia Pacific | 27,605 | 23,371 | 24,419 | |||||||||
Consolidated | $ | 272,990 | $ | 238,335 | $ | 221,634 | ||||||
Our reportable segments are aligned with how we, including our chief operating decision maker, manage the business and the demographic markets in which we serve. Our internal financial reporting structure is based on three reportable segments; U.S., Europe and Asia Pacific, which we believe helps us better manage the business and view the markets we serve. Sales, consulting, data collection and software engineering are the primary functional groups within each segment. Each segment records compensation, including stock-based compensation, data collection costs, amortization of intangible assets, depreciation of furniture and fixtures, amortization of leasehold improvements, communication costs, professional fees, rent expense, travel, marketing, office and other direct expenses. Expenditures associated with the Company's data centers and corporate headquarters charges are recorded by the U.S. segment and are not allocated to the other segments.
35
Fiscal 2012 compared to Fiscal 2011
Operating income from our U.S. business increased 11% to $150.0 million during fiscal 2012 compared to $135.3 million a year ago. The increase in operating income was primarily due to $52.9 million of incremental revenues, lower interoffice travel, a prior year internal U.S. sales conference that did not reoccur in fiscal 2012, lower computer depreciation and a decline in intangible asset amortization expense partially offset by higher employee compensation within cost of services and an increase in data costs. Our revenue growth of 10.6% in the U.S. reflects strong client and user count growth, the expanded deployment of our proprietary content, an increase in the number of PA users, annual price increases, incremental revenues from Market Metrics and $1.8 million in revenues from the acquisition of StreetAccount. Computer-related expenses decreased due to the transition to more efficient and cost-effective servers in our data centers in addition to the continued use of fully depreciated servers. U.S. employee headcount increased 7% over the prior year leading to higher employee compensation costs in fiscal 2012.
European operating income increased 20% to $95.4 million during fiscal 2012 compared to the same period a year ago. The increase in European operating income is due to an $18.7 million increase in revenues, lower employee variable compensation expense, a reduction in T&E spending and lower amortization expense as previously acquired intangible assets become fully amortized. European revenues advanced 10.5% to $197.4 million due to our broader selection of global proprietary content, an annual price increase for the majority of our non-U.S. investment management clients in March 2012, increases in user and client counts and clients licensing our advanced applications.
Asia Pacific operating income increased 18% to $27.6 million during fiscal 2012 compared to $23.4 million in the same period a year ago. The increase in Asia Pacific operating income was from $7.7 million of incremental revenues year over year and a more disciplined approach to controlling operating expenses, including T&E. Asia Pacific revenue growth year over year of 15.2% was due to growth in our global content offering, the expansion of our real-time news and quotes that services the needs of a global investor, our ability to sell additional services to existing clients and new client and user growth over the last 12 months.
Fiscal 2011 compared to Fiscal 2010
Operating income from our U.S. segment increased 8% to $135.3 million during fiscal 2011 compared to $125.0 million a year ago. The increase in operating income was primarily due to $62.2 million of incremental revenues and lower data and computer-related expenses, partially offset by higher employee compensation, including incremental performance-based stock option expense, and a rise in our T&E spend. Our revenue growth in the U.S. reflects client and user growth, incremental revenues from Market Metrics, we expanded the number of PA users and an increase in the client retention rate. Variable fees payable to data vendors based on deployment of their content over the FactSet platform declined as the result of increased client usage of our proprietary content. Computer-related expenses decreased due to the continued use of fully depreciated servers. The increase in employee compensation is due to an 18% headcount growth in the U.S. and higher stock-based compensation expense to reflect the incremental charge from performance-based stock options.
European operating income increased 10% to $79.6 million during fiscal 2011 compared to $72.2 million in the same period a year ago. The 10% growth in European operating income was due to a $17.0 million increase in revenues and lower variable fees payable to data vendors partially offset by higher T&E expenses. The increase in European revenues was due to increases in user and client counts, a broader offering of global proprietary content, increased licenses to clients for our advanced applications, and growth in our real-time news and quotes. European T&E expenses rose primarily due to a 25% increase in airline ticketing fees and hotel stays in order to visit more clients as well as more trips to our data content collection operations in India and the Philippines.
Asia Pacific operating income decreased 4% to $23.4 million during fiscal 2011 compared to $24.4 million a year ago. The decrease in Asia Pacific operating income was primarily driven by higher employee compensation due to headcount growth, increased occupancy costs from our office expansions in Japan and Hong Kong, and higher T&E expense, partially offset by $6.2 million of incremental revenues year over year. The increase in Asia Pacific employee compensation was from a 19% increase in headcount in our sales offices location in Hong Kong, Tokyo, Mumbai and Sydney.
36
Other Income, Income Taxes, Net Income and Diluted Earnings per Share
(in thousands, except per share data) Years Ended August 31, | 2012 | 2011 | 2010 | |||||||||
Other income | $ | 1,715 | $ | 623 | $ | 547 | ||||||
Provision for income taxes* | $ | 85,896 | $ | 67,912 | $ | 71,970 | ||||||
Net income | $ | 188,809 | $ | 171,046 | $ | 150,211 | ||||||
Diluted earnings per common share | $ | 4.12 | $ | 3.61 | $ | 3.13 | ||||||
Effective Tax Rate* | 31.3 | % | 28.4 | % | 32.4 | % | ||||||
* Included in the provision for income taxes during fiscal 2011 were income tax benefits of $6.3 million from the finalization of the fiscal 2010 tax return and the reenactment of the U.S. Federal R&D tax credit in December 2010. Our effective tax rate is based on current enacted tax laws and as such, prior to the second quarter of fiscal 2011, it did not reflect the R&D tax credit in any months of fiscal 2011 as the R&D credit expired on December 31, 2009. The reenactment of the credit was retroactive to January 1, 2010 and resulted in an actual effective tax rate of 28.4% for the full fiscal 2011 year.
Other Income
Fiscal 2012 compared to Fiscal 2011
Other income rose by $1.1 million during fiscal 2012 due to our $15 million purchase of short-term certificates of deposit in October 2011. These deposits have maturities of less than one year and resulted in interest income of $1.1 million during fiscal 2012. Excluding our returns on the short-term certificates of deposit, our average annualized return on cash and cash equivalents remained relatively flat at 32 basis points during fiscal 2012, compared to 33 basis points in fiscal 2011. At no time during fiscal 2012 and 2011 did a component of our cash, cash equivalents and investments portfolio experience a decline in value due to a ratings change, default or increase in counterparty credit risk.
Fiscal 2011 compared to Fiscal 2010
Other income during fiscal 2011 was consistent with fiscal 2010 levels as the Federal Reserve maintained low U.S. interest rates which kept returns on our cash and cash equivalents low.
Income Taxes
Fiscal 2012 compared to Fiscal 2011
The provision for income taxes was $85.9 million, up 26% from $67.9 million in fiscal 2011 due a 15% increase in pre-tax income year over year and income tax benefits of $6.3 million recorded in fiscal 2011 from the finalization of the fiscal 2010 tax return and the reenactment of the U.S. Federal R&D tax credit in December 2010. Our annual effective tax rate for fiscal 2012 was 31.3%, 290 basis points higher than our annual effective tax rate in fiscal 2011 primarily due to the income tax benefits previously disclosed. The fiscal 2011 annual effective tax rate before discrete items of $6.3 million was 30.9% or 40 basis points lower than the 2012 effective tax rate due to the expiration of the U.S. Federal R&D tax credit on December 31, 2011. We expect that the U.S. Federal R&D tax credit will be reenacted as it has been for the past 30 years. However, we are not permitted to factor it into our effective tax rate unless it is part of currently enacted tax law. As such, the expiration of the R&D credit negatively impacted our fiscal 2012 annual effective tax rate by 130 basis points.
Fiscal 2011 compared to Fiscal 2010
During fiscal 2011 the provision for income taxes decreased 6% to $67.9 million as compared to fiscal 2010 primarily due to income tax benefits of $6.3 million from the finalization of the fiscal 2010 tax return and the reenactment of the U.S. Federal R&D tax credit in December 2010 partially offset by an 8% increase in income before income taxes. Our annual effective tax rate for fiscal 2011 before discrete items of $6.3 million was 30.9%, 200 basis points lower than our annual effective tax rate before discrete items of 32.9% in fiscal 2010. The decrease year over year was primarily due to higher levels of non-U.S. taxable income, increased R&D activity which increased our related R&D tax credit and a rise in our domestic production activities (Section 199) deduction.
Net Income and Earnings per Share
Fiscal 2012 compared to Fiscal 2011
Net income rose 10% to $188.8 million and diluted earnings per share increased 14% to $4.12 during fiscal 2012 compared to the same period a year ago. Included in fiscal 2011 were income tax benefits of $0.13 per diluted share from finalizing our 2010 U.S. tax return and the reenactment of the U.S. Federal R&D tax credit partially offset by a pre-tax charge of $7.9 million ($5.4 million after-tax) or $0.11 per diluted share related to an increase in the estimated number of performance-based stock options that were eligible to vest. Drivers of net income and diluted earnings per share growth in fiscal 2012 were higher levels of revenue, lower T&E, decreased computer depreciation and amortization of intangible assets and a reduction in the diluted weighted average shares outstanding partially offset by higher compensation and a higher effective tax rate due to the expiration of the U.S. Federal R&D tax credit.
37
Fiscal 2011 compared to Fiscal 2010
Net income rose 14% to $171.0 million and diluted earnings per share increased 15% to $3.61 in fiscal 2011 compared to fiscal 2010. As mentioned above, fiscal 2011 included income tax benefits of $0.13 per diluted share partially offset by a pre-tax charge of $7.9 million or $0.11 per diluted share. Drivers of net income and diluted earnings per share growth were higher levels of revenue, lower data costs, decreased computer-related expenses, a lower effective tax rate and a reduction in the diluted weighted average shares outstanding partially offset by higher compensation, including incremental performance-based stock option expense, and additional T&E spend. It remains our philosophy to expand over the long-term by investing in our employees to retain our position as a premium provider of financial information and analytical tools.
Foreign Currency
Certain wholly owned subsidiaries within the European and Asia Pacific segments operate under a functional currency different from the U.S. dollar. The financial statements of these foreign subsidiaries are translated into U.S. dollars using period-end rates of exchange for assets and liabilities and average rates for the period for revenues and expenses. Translation gains and losses that arise from translating assets, liabilities, revenues and expenses of foreign operations are recorded in accumulated other comprehensive loss as a component of stockholders' equity.
Our non-U.S. dollar denominated revenues expected to be recognized over the next twelve months are estimated to be $17 million while our non-U.S. dollar denominated expenses are $163 million, which translates into a net foreign currency exposure of $146 million per year. Our foreign currency exchange exposure is related to our operating expense base in countries outside the U.S., where approximately 68% of our employees are located. During fiscal 2012, foreign currency movements increased operating income by $1.3 million. In fiscal 2011, operating income decreased by $0.1 million from the impact of foreign currency fluctuations.
During fiscal 2012, we entered into foreign currency forward contracts to hedge approximately 90% of our Indian Rupee exposure through the end of the first quarter of fiscal 2013, 75% of our Indian Rupee exposure through the end of the first quarter of fiscal 2014 and 50% of our Indian Rupee exposure through the end of the first quarter of fiscal 2015. In the fourth quarter of fiscal 2012, additional foreign currency forward contracts were entered into to hedge approximately 50% of our net Euro exposure through the end of the second quarter of fiscal 2013. At August 31, 2012 the notional principal and fair value of foreign exchange contracts to purchase Indian Rupees with U.S. dollars was $36.3 million and ($2.4) million, respectively. At August 31, 2012, the notional principal and fair value of foreign exchange contracts to purchase Euros with U.S. dollars were €8.1 million and $0.1 million, respectively. At August 31, 2012, there were no other outstanding foreign exchange forward contracts. A loss on derivatives for during fiscal 2012 of $1.0 million was recorded into operating income in our Consolidated Statements of Income compared to a gain of $4.2 million a year ago.
Liquidity
The table below, for the periods indicated, provides selected cash flow information (in thousands):
Years Ended August 31, | 2012 | 2011 | 2010 | |||||||||
Net cash provided by operating activities | $ | 231,965 | $ | 207,136 | $ | 211,080 | ||||||
Capital expenditures (1) | (22,520 | ) | (29,343 | ) | ( 20,768 | ) | ||||||
Free cash flow (2) | $ | 209,444 | $ | 177,793 | $ | 190,312 | ||||||
Net cash used in investing activities | $ | (58,849 | ) | $ | (29,343 | ) | $ | (75,948 | ) | |||
Net cash used in financing activities | $ | (158,718 | ) | $ | (199,123 | ) | $ | (151,568 | ) | |||
Cash and cash equivalents at end of year (August 31) | $ | 189,044 | $ | 181,685 | $ | 195,741 | ||||||
(1) | Included in net cash used in investing activities during each fiscal year reported. |
(2) | We define free cash flow as cash provided by operating activities, which includes the cash cost for taxes and changes in working capital, less capital expenditures. The presentation of free cash flow is not intended to be considered in isolation or as a substitute for the financial information prepared and presented in accordance with generally accepted accounting principles ("GAAP"). We use this financial measure, both in presenting our results to stockholders and the investment community, and in our internal evaluation and management of the business. Management believes that this financial measure and the information we provide are useful to investors because it permits investors to view our performance using the same metric that we use to gauge progress in achieving our goals and is an indication of cash flow that may be available to fund further investments in future growth initiatives. |
38
Fiscal 2012 compared to Fiscal 2011
Cash and cash equivalents aggregated to $189.0 million or 27% of our total assets at August 31, 2012, compared with $181.7 million at August 31, 2011 or 28% of our total assets. All of our operating and capital expense requirements were financed entirely from cash generated from our operations. Our cash and cash equivalents increased $7.4 million in the past 12 months due to cash provided by operations of $232.0 million, $33.7 million from the exercise of employee stock options and $11.2 million of tax benefits from share-based payment arrangements partially offset by cash outflows of $153.6 million related to stock repurchases, dividend payments of $50.0 million, capital expenditures of $22.5 million, the purchase of the StreetAccount business for $21.3 million net of cash acquired, $15.0 million from purchases of investments, and $7.0 million from the effect of exchange rate changes on our foreign cash balances.
Free cash flow generated over the last twelve months was $209.4 million, up 18% over the prior year and exceeded net income by 11%. Free cash flow during fiscal 2012 was generated from a record level of net income, positive working capital changes, higher non-cash expenses and a year over year decline in capital expenditures. Working capital improvements of $8.7 million were from stronger accounts receivable collections in the past 12 months and a reduction in tax payments due to stock option exercises. Since August 31, 2011, our accounts receivable balance has decreased by $1.0 million, while organic ASV is up $53 million over the same period, reflecting an improvement in our DSO from 35 to 32 days. We have seen our DSO decrease substantially over the past several years as we continued to optimize our internal billing and collection systems.
Net cash used in investing activities was $58.8 million during fiscal 2012 due to the acquisition of StreetAccount in June 2012 for $21.3 million (net of cash acquired), capital expenditures of $22.5 million and the purchase of $15 million of certificates of deposit with maturity dates ranging from nine to twelve months from purchase date. Net cash used in investing activities was $29.5 million higher in fiscal 2012 compared to fiscal 2011 due to the acquisition of StreetAccount and purchase of time deposits partially offset by a reduction in capital expenditures. During the first quarter of fiscal 2011 we relocated our New Hampshire data center to a new facility in New Jersey, which resulted in our capital expenditures being higher in fiscal 2011 as compared to fiscal 2012.
Net cash used in financing activities was $158.7 million in fiscal 2012 as compared to $199.1 million in the same period a year ago due to a reduction in share repurchases of $62.9 million partially offset by lower proceeds from employee stock plans, a decrease in tax benefits from share-based payment arrangements and higher dividend payments based on a 15% increase in the regular quarterly dividend. In fiscal 2012, we repurchased 1.6 million shares for $152.7 million under the program. In fiscal 2011, we repurchased 2.3 million shares for $216.6 million. Proceeds from employee stock exercises decreased from $43.1 million in fiscal 2011 to $33.7 million in 2012 as the number of employee stock option exercises decreased by 0.5 million stock options. Through quarterly cash dividends and share repurchases, we have returned $204 million to our stockholders over the past 12 months.
We expect that for at least the next 12 months, our operating expenses will continue to constitute a significant use of our cash. As of August 31, 2012, our total cash and cash equivalents was $189.0 million with no outstanding borrowings. We believe our liquidity (including cash on hand, cash from operating activities and other cash flows that we expect to generate) will be sufficient to meet our short-term and longer-term operating requirements, as they occur, including working capital needs, capital expenditures, dividend payments, stock repurchases and financing activities. Refer to the section, Contractual Obligations, for the table summarizing our significant contractual obligations as of August 31, 2012 and the corresponding effect that these obligations will have on our liquidity and cash flows in future periods.
Fiscal 2011 compared to Fiscal 2010
Our cash and cash equivalents decreased $14.1 million in fiscal 2011 compared to fiscal 2010 as a result of cash outflows of $216.6 million related to stock repurchases, dividend payments of $43.9 million and capital expenditures of $29.3 partially offset by cash provided by operations of $207.1 million, $43.1 million from the exercise of employee stock options, $18.3 million of tax benefits from share-based payment arrangements and $7.3 million from the effect of exchange rate changes on our foreign cash balances.
Free cash flow of $178 million during fiscal 2011 was generated from net income, higher non-cash expenses and tax benefits from stock option exercises during the year resulting in lower income tax payments partially offset by increased capital expenditures and a decline in working capital from an increase in accounts receivable and a decrease in accrued compensation. Our accounts receivable balance, net of reserves, increased $15.3 million since August 31, 2010 due to organic ASV growth of $93 million in fiscal 2011, incremental outstanding receivables due from Market Metrics clients and the invoicing of a small percentage of our clients annually in advance during fiscal 2011. At August 31, 2011 our DSO was 35 days, up from 31 days a year ago, but down from 37 days at August 31, 2009. Accrued compensation decreased from $48.6 million at August 31, 2010 to $41.5 million at August 31, 2011 based on the timing of accrued payroll in the U.S.
39
Net cash used in investing activities was $29.3 million in fiscal 2011 due to capital expenditures of $29.3 million, of which 68% was for computer equipment, including additional server equipment for our Virginia and New Jersey data centers and laptop computers and peripherals for our growing employee base. The remaining $9 million or 32% of capital expenditures was for the build out of new space in Paris and New York as well as the continued expansion of leased office space in India and the Philippines.
Net cash used in financing activities was $199.1 in fiscal 2011 due to share repurchases and dividend payments partially offset by proceeds from employee stock plans. During fiscal 2011, we repurchased 2.3 million shares for $216.6 million under the program as compared to spending $193 million in fiscal 2010. Higher dividend payments of $5.5 million were made in fiscal 2011 because our Board of Directors approved a 17% increase in the regular quarterly dividend, beginning with the Company's dividend payment in June 2011. Proceeds from employee stock exercises decreased by $12.2 million because the number of employee stock option exercises decreased by 0.8 million stock options.
Capital Resources
Capital Expenditures
Capital expenditures were $22.5 million during fiscal 2012, down from $29.3 million a year ago. Capital spending levels were $6.8 million lower in fiscal 2012 compared to fiscal 2011 as we relocated our data center from New Hampshire to New Jersey in December 2010 and in that process we purchased several new servers and upgraded many other existing mainframe machines. Approximately $13.1 million or 58% of capital expenditures during fiscal 2012 were for computer equipment including upgrading our mainframe server equipment held in our data centers and laptop computers and peripherals for our growing employee base. The remaining 42% of capital expenditures was for office expansions, primarily for the build out of new space in Norwalk, New York and Hong Kong as well as the continued expansion of leased office space in the Philippines. We continue to expand aggressively to meet the needs of our growing global footprint. Including new lease agreements entered into during fiscal 2012, our worldwide leased office space increased to approximately 807,000 square feet at August 31, 2012, up 11% from August 31, 2011.
Capital expenditures during fiscal 2011 were $29.3 million, up from $20.8 million in fiscal 2010. Approximately $19.2 million or 68% of capital expenditures were for computer equipment and the remainder for office expansions. Computer equipment purchases during fiscal 2011 included new equipment to fit-out our data center in New Jersey, additional blade servers to increase the capacity and processing speed of our Virginia and New Jersey data centers and laptop computers for our growing employee base. The remaining $8.8 million of capital expenditures were for the build out of space in Paris and New York as well as the continued expansion of leased office space in India, the Philippines and Japan.
Capital Needs
We currently have no outstanding indebtedness, other than the letters of credit issued in the ordinary course of business. Approximately $4.3 million of standby letters of credit have been issued in connection with our current leased office space as of August 31, 2012. These standby letters of credit contain covenants that, among other things, require us to maintain minimum levels of consolidated net worth and certain leverage and fixed charge ratios. At August 31, 2012, we were in compliance with all covenants contained in the standby letters of credit. As of August 31, 2012 and 2011, we maintained a zero debt balance and were in compliance with all covenants.
Off-Balance Sheet Arrangements
At August 31, 2012 and 2011, we had no off-balance sheet financing or other arrangements with unconsolidated entities or financial partnerships (such as entities often referred to as structured finance or special purpose entities) established for purposes of facilitating off-balance sheet financing or other debt arrangements or for other contractually limited purposes.
Share Repurchase Program
During fiscal 2012, we repurchased 1.6 million shares for $152.7 million under the existing share repurchase program. On May 8, 2012, our Board of Directors approved a $200 million expansion of the existing share repurchase program. Including the expansion, $189.8 million remains authorized for future share repurchases at August 31, 2012. Repurchases will be made from time to time in the open market and privately negotiated transactions, subject to market conditions. No minimum number of shares to be repurchased has been fixed. There is no timeframe to complete the repurchase program and it is expected that share repurchases will be paid using existing and future cash generated by operations.
On June 13, 2011, our Board of Directors approved an expansion of their existing share repurchase program by an additional $200 million. During fiscal 2011, we repurchased 2.3 million shares for $216.6 million under the program. Including the expansion, $142 million remained authorized for future share repurchases as of August 31, 2011.
40
Contractual Obligations
Fluctuations in our operating results, the degree of success of our accounts receivable collection efforts, the timing of tax and other payments as well as necessary capital expenditures to support growth of our operations will impact our liquidity and cash flows in future periods. The effect of our contractual obligations on our liquidity and capital resources in future periods should be considered in conjunction with the factors mentioned here.
The following table summarizes our significant contractual obligations as of August 31, 2012 and the corresponding effect that these obligations will have on our liquidity and cash flows in future periods (in thousands):
Payments due by period | ||||||||||||||||||||
2013 | 2014-2015 | 2016-2017 | 2018 and thereafter | Total | ||||||||||||||||
Operating lease obligations (1) | $ | 27,592 | $ | 47,892 | $ | 30,147 | $ | 35,540 | $ | 141,171 | ||||||||||
Purchase commitments (2) | 48,620 | 3,531 | - | - | 52,151 | |||||||||||||||
Deferred rent and other non-current liabilities | 20,646 | - | - | - | 20,646 | |||||||||||||||
Total by period | $ | 96,858 | $ | 51,423 | $ | 30,147 | $ | 35,540 | $ | 213,968 | ||||||||||
Non-current taxes payable and deferred taxes (3) | 8,057 | |||||||||||||||||||
Total contractual obligations | $ | 222,025 | ||||||||||||||||||
(1) | Operating lease amounts include future minimum lease payments under all our non-cancelable operating leases with an initial term in excess of one year. For more information on our operating leases, see Note 17 to the Consolidated Financial Statements.
|
(2) | Purchase obligations represent payment due in future periods in respect of commitments to our various data vendors as well as commitments to purchase goods and services such as telecommunication and computer maintenance services.
|
(3) | Non-current income taxes payable of $5.5 million and non-current deferred tax liabilities of $2.6 million have been included only in the total column in the preceding table due to uncertainty regarding the timing of future payments. Non-current income taxes payable include uncertain tax positions (see Note 16 to the Consolidated Financial Statements).
|
Purchase orders do not necessarily reflect a binding commitment but are merely indicative of authorizations and intention to conclude purchases in the future. For the purpose of this tabular disclosure, purchase obligations for goods and services are defined as agreements that are enforceable and legally binding on us and that specify all significant terms, including: fixed or minimum quantities to be purchased; fixed, minimum or variable price provisions; and the approximate timing of the transaction. It is expected that all the contractual obligations noted in the table will be funded from existing cash and cash flows from operations. Expected timing pertaining to the contractual obligations included in the table above has been estimated based on information currently available. The amounts paid and timing of those payments may differ based on when the goods and services provided by our vendors to whom we are contractually obligated are actually received as well as due to changes to agreed upon amounts for any of our obligations.
Dividends
On May 8, 2012, our Board of Directors approved a 15% increase in the regular quarterly dividend, beginning with our dividend payment on June 19, 2012 of $0.31 per share, or $1.24 per share per annum. This is the seventh consecutive year that our annual dividend has been increased by more than 10%, resulting in a five year annual dividend growth rate of 21%.
During fiscal years 2012 and 2011, our Board of Directors declared the following dividends:
Declaration Date |
| Dividends Per Share of Common Stock |
| Type | Record Date |
| Total $ Amount (in thousands) |
| Payment Date | ||
August 8, 2012 | $ | 0.31 | Regular (cash) | August 31, 2012 | $ | 13,727 | September 18, 2012 | ||||
May 8, 2012 | $ | 0.31 | Regular (cash) | May 31, 2012 | $ | 13,893 | June 19, 2012 | ||||
February 14, 2012 |
| $ | 0.27 |
| Regular (cash) | February 29, 2012 |
| $ | 12,085 |
| March 20, 2012 |
November 10, 2011 |
| $ | 0.27 |
| Regular (cash) | November 30, 2011 |
| $ | 12,181 |
| December 20, 2011 |
August 11, 2011 |
| $ | 0.27 |
| Regular (cash) | August, 31 2011 |
| $ | 12,165 |
| September 20, 2011 |
May 9, 2011 |
| $ | 0.27 |
| Regular (cash) | May 31, 2011 |
| $ | 12,374 |
| June 21, 2011 |
February 9, 2011 |
| $ | 0.23 |
| Regular (cash) | February 28, 2011 |
| $ | 10,612 |
| March 15, 2011 |
November 10, 2010 |
| $ | 0.23 |
| Regular (cash) | November 30, 2010 |
| $ | 10,660 |
| December 21, 2010 |
All of the above cash dividends were paid from existing cash resources. Future cash dividends will depend on our earnings, capital requirements, financial condition and other factors considered relevant by us and is subject to final determination by our Board of Directors.
41
Significant Accounting Policies
We describe our significant accounting policies in Note 2, Summary of Significant Accounting Policies , of the Notes to our Consolidated Financial Statements included in Item 8 below.
Critical Accounting Estimates
We consider an accounting estimate to be critical if: (i) the accounting estimate requires us to make assumptions about matters that were highly uncertain at the time the accounting estimate was made, and (ii) changes in the estimate that are reasonably likely to occur from period to period, or use of different estimates that we reasonably could have used in the current period, would have a material impact on our financial condition or results of operations. Management has discussed the development and selection of these critical accounting estimates with the Audit Committee of our Board of Directors. In addition, there are other items within our financial statements that require estimation, but are not deemed critical as defined above. Changes in estimates used in these and other items could have a material impact on our financial statements.
Revenue Recognition and Receivable Reserves
Our revenues are derived from month-to-month subscriptions to services such as workstations (also referred to as users), content and applications. Subscription revenue is earned each month as the service is rendered to clients on a monthly basis. Revenue is recognized when the client subscribes to FactSet services, the service has been rendered and earned during the month, the amount of the subscription is fixed or determinable based on established rates quoted on an annualized basis and collectability is reasonably assured.
Accounts receivable are unsecured and are derived from revenues earned from clients located around the globe. We perform ongoing credit evaluations of our clients and do not require collateral. We maintain reserves for potential write-offs and these losses have historically been within expectations. Aged client receivables are analyzed each month and our collection efforts are directed accordingly. We review recent history of client receivable write-offs, analyze trends in aged client receivables and general market conditions to estimate our accounts receivable reserve. At August 31, 2012 and 2011, the receivable reserve was $1.8 and $2.0 million, respectively .
Accrued Compensation
We make significant estimates in determining our accrued compensation. Approximately 15-20% of our employee incentive compensation programs are discretionary. We conduct a final review of Company and departmental individual performance each year end to determine the amount of discretionary employee compensation. We also review compensation throughout the year to determine how overall performance tracks against management's expectations. Management takes these and other factors, including historical performance, into account in reviewing accrued compensation estimates quarterly and adjusting accrual rates as appropriate. The amount of the variable employee compensation recorded within accrued compensation as of August 31, 2012 was $35.9 million compared $37.2 million as of August 31, 2011.
Business Combinations
We record acquisitions using the purchase method of accounting. All of the assets acquired, liabilities assumed, contractual contingencies and contingent consideration are recognized at their fair value on the acquisition date. The application of the purchase method of accounting for business combinations requires management to make significant estimates and assumptions in the determination of the fair value of assets acquired and liabilities assumed in order to properly allocate purchase price consideration between assets that are depreciated and amortized from goodwill. Our estimates are based on historical experience, information obtained from the management of the acquired companies and when appropriate, includes assistance from independent third-party appraisal firms. Our significant assumptions and estimates can include, but are not limited to, the cash flows that an asset is expected to generate in the future, the appropriate weighted-average cost of capital, and the cost savings expected to be derived from acquiring an asset. These estimates are inherently uncertain and unpredictable. In addition, unanticipated events and circumstances may occur which may affect the accuracy or validity of such estimates.
Estimated Tax Provision and Tax Contingencies
We are subject to income taxes in the U.S. and numerous foreign jurisdictions. Our tax provision is an estimate based on our understanding of laws in Federal, state and foreign tax jurisdictions. These laws can be complicated and are difficult to apply to any business including ours. The tax laws also require us to allocate our taxable income to many jurisdictions based on subjective allocation methodologies and information collection processes. Our effective tax rates differ from the statutory rate primarily due to the impact of state taxes, foreign operations, R&D and other tax credits, tax audit settlements, incentive-stock options and domestic production activities (Section 199) deductions. Our effective tax rate was 31.3%, 28.4% and 32.4% in fiscal 2012, 2011, and 2010, respectively.
42
We recognize the benefit of an income tax position only if it is more-likely-than-not that the tax position will be sustained upon tax examination, based solely on the technical merits of the tax position as of the reporting date. Otherwise, no benefit can be recognized. The tax benefits recognized are measured based on the largest benefit that has a greater than 50% likelihood of being realized upon ultimate settlement. We will classify the liability for unrecognized tax benefits as current to the extent that we anticipate payment (or receipt) of cash within one year. Additionally, we accrue interest and related penalties, if applicable, on all tax exposures for which reserves have been established consistent with jurisdictional tax laws. Interest and penalties are classified as income tax expense in the financial statements.
As of August 31, 2012, we have gross unrecognized tax benefits totaling $5.5 million, including $1.0 million of accrued interest, recorded as non-current taxes payable in the Consolidated Balance Sheets. Unrecognized tax benefits represent tax positions taken on tax returns but not yet recognized in the consolidated financial statements. If recognized, essentially all of the unrecognized tax benefits and related interest would be recorded as a benefit to tax expense on the Consolidated Statement of Income. Audits by multiple tax authorities are currently ongoing. Significant judgment is required in evaluating our uncertain tax positions and determining our provision for income taxes. Although we believe our reserves are reasonable, no assurance can be given that the final tax outcome of these matters will not be different from that which is reflected in our historical income tax provisions and accruals. We adjust these reserves in light of changing facts and circumstances, such as the closing of a tax audit or the refinement of an estimate. To the extent that the final tax outcome of these matters is different than the amounts recorded, such differences will affect the provision for income taxes in the period in which such determination is made. The provision for income taxes includes the effect of reserve provisions and changes to reserves that are considered appropriate, as well as the related net interest.
Our provision for income taxes is subject to volatility and could be adversely impacted by lower earnings than anticipated in countries that have lower tax rates and higher earnings than anticipated in countries that have higher tax rates; by changes in the valuation of our deferred tax assets and liabilities; by expiration of or lapses in the R&D tax credit laws; by transfer pricing adjustments including the post-acquisition integration of purchased intangible assets from certain acquisitions; by tax effects of nondeductible compensation; by tax costs related to intercompany realignments; or by changes in tax laws, regulations, or accounting principles, including accounting for uncertain tax positions or interpretations of them. Significant judgment is required to determine recognition and measurement. Further, as a result of certain ongoing employment and capital investment actions and commitments, our income in certain countries is subject to reduced tax rates and in some cases is wholly exempt from tax. Our failure to meet these commitments could adversely affect our provision for income taxes. In addition, we are subject to the continuous examination of our income tax returns by the Internal Revenue Service and other tax authorities. We regularly assess the likelihood of adverse outcomes resulting from these examinations to determine the adequacy of our provision for income taxes. There can be no assurance that the outcomes from these continuous examinations will not have an adverse impact on our operating results and financial condition.
Performance-based Equity Awards
We have an employee stock-based compensation plan, which allows for the issuance of performance-based equity awards to employees. Accounting guidance requires the measurement and recognition of compensation expense for all performance-based equity awards made to employees based on the estimated fair values of the awards that are expected to vest. At the end of each reporting period, management must make assumptions regarding the likelihood of achieving our performance targets because the number of stock options that vest will be predicated on us achieving these levels.
October 2009 Annual Employee Performance-based Option Grant Review
In October 2009, we granted 900,665 performance-based employee stock options. 100% of these performance-based stock options are expected to vest because we achieved organic ASV and diluted earnings per share growth of more than 10% on a compounded annual basis for the two years ended August 31, 2011. This reflected a higher performance level than previously estimated and accordingly increased the number of options that will vest, which required us to record an incremental $5.8 million of stock-based compensation during fiscal 2011. The $5.8 million of additional stock-based compensation represented the cumulative adjustment to change the vesting percentage from 60% to 100% as of August 31, 2011.
November 2010 Annual Employee Performance-based Option Grant Review
In November 2010, we granted 734,334 performance-based employee stock options. None of these performance-based stock options granted vested because we did not achieve certain performance levels for both organic ASV and diluted earnings per share during the two fiscal years ended August 31, 2012. This reflected a lower performance level than previously estimated and accordingly decreased the number of options that will vest to zero, which required us to reverse $1.4 million of stock-based compensation during fiscal 2012. These performance-based options were recorded as forfeitures in fiscal 2012.
43
November 2011 Annual Employee Performance-based Option Grant Review
In November 2011, we granted 665,551 performance-based employee stock options. The number of performance-based options that vest is based on us achieving performance levels for both organic ASV and diluted earnings per share during the two fiscal years ended August 31, 2013. At August 31 2012, we believed that it was not probable we would achieve the required ASV and diluted earnings per share growth as our ASV growth rate decelerated to 7%. As such, we estimated that none (0%) of the performance-based stock options will vest. However, a change in the actual financial performance levels we achieve over the next 12 months could result in the following changes to our current estimate of the vesting percentage and related expense (in thousands):
Vesting Percentage | Total Unamortized Stock-based Compensation Expense at August 31, 2012 | Cumulative Catch-up Adjustment* | Average Remaining Quarterly Expense to be Recognized | ||||||||||
| 0% | $ | 0 | $ | 0 | $ | 0 | |||||||
| 20% | $ | 2,726 | $ | 914 | $ | 164 | |||||||
| 60% | $ | 8,178 | $ | 2,742 | $ | 492 | |||||||
| 100% | $ | 13,630 | $ | 4,570 | $ | 820 | |||||||
* Amounts represent the cumulative catch-up adjustment to be recorded if there had been a change in the vesting percentage as of August 31, 2012.
July 2012 Performance-based Option Grant Review
In July 2012, we granted 241,546 performance-based employee stock options. The number of performance-based options that vest is dependent upon future StreetAccount user growth through August 31, 2017. The five year performance measurement period is based on growing usage of FactSet and StreetAccount. At August 31 2012, we estimated that 20% or 48,309 of the performance-based stock options will vest based on forecasted StreetAccount growth, which results in unamortized stock-based compensation expense of $1.5 million to be recognized over the remaining vesting period of approximately 3.0 years. A change in the actual financial performance levels achieved by us due to unforeseen significant StreetAccount growth in future fiscal years could result in the following changes to our current estimate of the vesting percentage and related expense (in thousands):
Vesting Percentage | Cumulative Catch-up Adjustment* | Remaining Expense to be Recognized | |||||||
| 0% | $ | (84 | ) | $ | 0 | ||||
| 20% | $ | 0 | $ | 1,516 | |||||
| 40% | $ | 136 | $ | 3,064 | |||||
| 60% | $ | 200 | $ | 4,600 | |||||
| 80% | $ | 257 | $ | 6,143 | |||||
| 100% | $ | 330 | $ | 7,670 | |||||
* Amounts represent the cumulative catch-up adjustment to be recorded if there was a change in the vesting percentage as of August 31, 2012.
Other Performance-based Stock Options Granted
| · | Between June 2010 and July 2011, we granted 746,415 performance-based employee stock options that vest based on FactSet achieving certain ASV targets. At August 31, 2012, we estimated that none (0%) of these performance-based stock options will vest. A change in the actual financial performance levels achieved by us due to unforeseen significant ASV growth in future fiscal years could result in the following changes to our current estimate of the vesting percentage and related expense (in thousands): |
Vesting Percentage | Cumulative Catch-up Adjustment* | Remaining Expense to be Recognized | |||||||
| 0% | $ | 0 | $ | 0 | |||||
| 50% | $ | 3,380 | $ | 4,370 | |||||
| 100% | $ | 8,474 | $ | 7,026 | |||||
* Amounts represent the cumulative catch-up adjustment to be recorded if there was a change in the vesting percentage as of August 31, 2012.
| · | We granted 204,508 performance-based employee stock options between June 2010 and July 2011 that vest based on FactSet achieving certain ASV targets. Of this total, 133,958 vested during fiscal 2012 because we achieved certain ASV levels. At August 31, 2012, we estimated that the remaining performance-based stock options will vest based on forecasted ASV growth. A change in forecasted ASV growth in fiscal 2013 could result in a change in the expected vesting period of these performance-based options, requiring us to accelerate the recognition of the remaining unamortized stock-based compensation expense of $0.5 million as of August 31, 2012. |
44
Performance-Based Employee Restricted Stock Units Granted
Between June 2010 and July 2011, we granted 21,102 restricted stock units which entitle the holder to shares of common stock as the awards vest over time. A restricted stock unit is a promise to deliver shares to the employee at a future date if certain vesting conditions are met. Our restricted stock units are performance-based and cliff vest 25% when ASV targets are achieved during a six year period. Restricted stock units are amortized to expense based on a graded-vesting attribution approach over the vesting period. A change in the forecasted ASV growth in fiscal 2013 could result in a change in the expected vesting period of these restricted stock units, requiring us to accelerate the recognition of the remaining unamortized stock-based compensation expense of $0.1 million as of August 31, 2012.
Long-lived Assets
Long-lived assets, comprised of property, equipment and leasehold improvements are evaluated for impairment whenever events or changes in circumstances indicate that the carrying value may not be recoverable. Factors that may cause an impairment review include significant changes in technology that make current computer-related assets that we use in our operations obsolete or less useful and significant changes in the way we use these assets in our operations. When evaluating long-lived assets for potential impairment, we first compare the carrying value of the asset to the asset's estimated future cash flows (undiscounted and without interest charges). If the estimated future cash flows are less than the carrying value of the asset, we calculate an impairment loss. The impairment loss calculation compares the carrying value of the asset to the asset's estimated fair value, which may be based on estimated future cash flows (discounted and with interest charges). We recognize an impairment loss if the amount of the asset's carrying value exceeds the asset's estimated fair value. If we recognize an impairment loss, the adjusted carrying amount of the asset becomes its new cost basis. The new cost basis will be depreciated (amortized) over the remaining useful life of that asset. Using the impairment evaluation methodology described herein, there have been no long-lived asset impairment charges for each of the last three years. The carrying value of long-lived assets as of August 31, 2012, was $76.5 million.
Our impairment loss calculations contain uncertainties because they require management to make assumptions and to apply judgment to estimate future cash flows and asset fair values, including forecasting useful lives of the assets and selecting the discount rate that reflects the risk inherent in future cash flows. We have not made any material changes in our impairment loss assessment methodology during the past three fiscal years. We do not believe there is a reasonable likelihood that there will be a material change in the estimates or assumptions we use to calculate long-lived asset impairment losses. However, if actual results are not consistent with our estimates and assumptions used in estimating future cash flows and asset fair values, we may be exposed to losses that could be material.
Valuation of Goodwill
We evaluate goodwill at the reporting unit level for impairment annually and whenever events or changes in circumstances indicate the carrying value of the goodwill may not be recoverable. We complete our impairment evaluation by performing internal valuation analyses and consider other publicly available market information. We determined that there were three reporting units during fiscal years 2012, 2011 and 2010, which are consistent with the operating segments reported because there is no discrete financial information available for the subsidiaries within each operating segment. Our reporting units evaluated for potential impairment during fiscal years 2012, 2011 and 2010 were U.S., Europe and Asia Pacific, which reflects the level of internal reporting we use to manage our business and operations. We performed our annual goodwill impairment test during the fourth quarter of fiscal years 2012, 2011 and 2010 and determined that there were no reporting units that were deemed at risk and there had been no impairment. The carrying value of goodwill as of August 31, 2012 and 2011 was $245.8 million and $228.3 million, respectively.
We determine fair value using the discounted cash flows model. This analysis contains uncertainties because it requires management to make assumptions and to apply judgment to estimate industry economic factors including market conditions, legal and technological factors and the profitability of future business strategies. It is our policy to conduct impairment testing based on our current business strategy in light of present industry and economic conditions, as well as future expectations. We have not made any material changes in our impairment loss assessment methodology during the past three fiscal years. We do not believe there is a reasonable likelihood that there will be a material change in the future estimates or assumptions we use to test for goodwill impairment losses. However, if actual results are not consistent with our estimates and assumptions, we may be exposed to an impairment charge that could be material. Future events could cause us to conclude that indicators of impairment do exist and that goodwill associated with our previous acquisitions is impaired, which could result in an impairment loss in our Consolidated Statements of Income and a write-down of the related asset.
New Accounting Pronouncements
See Note 2 to the consolidated financial statements for a full description of recent accounting pronouncements, including the expected dates of adoption, which we include here by reference.
45
Market Trends
In the ordinary course of business, we are exposed to financial risks involving foreign currency and interest rate fluctuations. Major equity indices ( e.g. , Dow Jones Industrials, Russell 1000, MSCI EAFE, S&P 500 and NASDAQ Composite) continue to experience volatility. Approximately 81% of our annual subscription value is derived from our investment management clients. The prosperity of these clients is tied to equity assets under management. An equity market decline not only depresses assets under management but could cause a significant increase in redemption requests to move money out of equities and into other asset classes. Moreover, extended declines in the equity markets may reduce new fund or client creation, resulting in lower demand for services from investment managers.
Our investment banking clients who perform M&A advisory work and equity research account for approximately 19% of our annual subscription value. A significant portion of these revenues relate to services deployed by large, bulge bracket banks. Credit continues to impact many of the large banking clients due to the amount of leverage deployed in past operations. Clients could encounter similar problems. A lack of confidence in the global banking system could cause declines in merger and acquisitions funded by debt. Additional uncertainty, consolidation and business failures in the global investment banking sector could adversely affect our financial results and future growth.
We service equity research and M&A departments. These are low risk businesses that do not deploy leverage and will likely continue to operate far into the future and should represent a larger percentage of the overall revenues of our clients. Regardless, the size of banks in general is shrinking as they deleverage their balance sheets and adjust their expense bases to future revenue opportunities. Our revenues may decline if banks including those involved in recent merger activity significantly reduce headcount in the areas of corporate M&A and equity research to compensate for the issues created by other departments.
Forward-Looking Factors
Forward-Looking Statements
In addition to current and historical information, this Annual Report on Form 10-K, including Management's Discussion and Analysis of Financial Condition and Results of Operations, contains forward-looking statements regarding future events and our future results that are based on management's current expectations, estimates, forecast and projections about the industries in which we operate and the beliefs and assumptions of our management. All statements, other than statements of historical facts, are statements that could be deemed forward-looking statements. These include statements about our strategy for growth, product development, market position, subscriptions and expected expenditures and financial results. Forward-looking statements may be identified by words like "expects," "anticipates," "plans," "intends," "projects," "should," "indicates," "continues," "ASV," "subscriptions," "believes," "estimates," "may" and similar expressions. In addition, any statements that refer to projections of our future financial performance, our anticipated growth, trends in our business and other characterizations of future events or circumstances are forward-looking statements. Readers are cautioned that these forward-looking statements are only predictions and not guarantees of future performance and involve a number of risks, uncertainties and assumptions. Therefore, actual results may differ materially from what is expressed or forecasted in such forward-looking statements.
We intend that all forward-looking statements we make will be subject to safe harbor protection of the federal securities laws as found in Section 27A of the Securities Act of 1933 and Section 21E of the Securities Exchange Act of 1934.
These statements involve certain known and unknown risks and uncertainties that could cause our actual results to differ materially from those expressed or implied in our forward-looking statements. Such risks and uncertainties include, among others, those listed in Part 1 Item 1A, Risk Factors of this Annual Report on Form 10-K. We do not intend, and undertake no obligation, to update any of our forward-looking statements after the date of this Report to reflect actual results or future events or circumstances.
Dividend Payment
On August 8, 2012, a regular quarterly dividend of $0.31 per share was announced. The cash dividend of $13.7 million was paid on September 18, 2012, to common stockholders of record on August 31, 2012. Future cash dividends will be paid using our existing and future cash generated by operations.
46
Business Outlook
The following forward-looking statements reflect our expectations as of September 25, 2012. Given the number of risk factors, uncertainties and assumptions discussed below, actual results may differ materially. We do not intend to update our forward-looking statements until our next quarterly results announcement, other than in publicly available statements.
First Quarter Fiscal 2013 Expectations
| - | Revenues are expected to range between $210 million and $213 million. |
| - | Operating margin is expected to range between 33.5% and 34.0%. |
| - | The effective tax rate is expected to range between 31.5% and 32.5%. |
| - | Diluted earnings per share should range between $1.10 and $1.12, which represents year over year growth of 11% and 13% at each end of the range. |
Full Year Fiscal 2013
| - | The full year fiscal 2013 guidance for capital expenditures is $20 million to $28 million. |
| - | The annual effective tax rate is expected to range between 31.5% and 32.5%. |
Financial Risk Management
In the normal course of business, we are exposed to foreign currency exchange risk and interest rate risk that could impact our financial position and results of operations.
Foreign Currency Exchange Risk
We are exposed to market risk from changes in foreign currency exchange rates, which could affect operating results, financial position and cash flows. We manage our exposure to foreign currency exchange risk through our regular operating and financing activities and, when appropriate, through the use of derivative financial instruments. These derivative financial instruments are utilized to hedge currency exposures as well as to reduce earnings volatility resulting from shifts in market rates. We only enter into foreign currency forward contracts to manage foreign currency exposures. Our foreign currency market exposures include the Euro, British Pound Sterling, Japanese Yen, Indian Rupee and Philippines Peso. The fair market values of all our derivative contracts change with fluctuations in currency rates and are designed so that any changes in their values are offset by changes in the values of the underlying exposures. Derivative financial instruments are held solely as risk management tools and not for trading or speculative purposes.
We are required to recognize all derivative instruments as either assets or liabilities at fair value in the balance sheet. The level of volatility will vary with the type and amount of derivative hedges outstanding, as well as fluctuations in the currency markets during the period. The related cash flow impacts of all of our derivative activities are reflected as cash flows from operating activities.
By their nature, all derivative instruments involve, to varying degrees, elements of market and credit risk. The market risk associated with these instruments resulting from currency exchange movements is expected to offset the market risk of the underlying transactions, assets and liabilities being hedged. We do not believe there is significant risk of loss in the event of non-performance by the counterparties associated with these instruments because these transactions are executed with a major financial institution. Further, our policy is to deal with counterparties having a minimum investment grade or better credit rating. Credit risk is managed through the continuous monitoring of exposures to such counterparties.
Interest Rate Risk
The fair market value of our cash and investments at August 31, 2012 was $203.0 million. Our cash and cash equivalents consist of demand deposits and money market funds with maturities of three months or less at the date of acquisition and are reported at fair value. Our investments consist of certificates of deposits with original maturities greater than three months, but less than one year and, as such, are classified as investments (short-term) on our consolidated balance sheet. It is anticipated that the fair market value of our cash and investments will continue to be immaterially affected by fluctuations in interest rates. Preservation of principal is the primary goal of our cash and investment policy. Pursuant to our established investment guidelines, we try to achieve high levels of credit quality, liquidity and diversification. Our investment guidelines do not permit us to invest in puts, calls, strips, short sales, straddles, options, commodities, precious metals, futures or investments on margin. Because we have a restrictive investment policy, our financial exposure to fluctuations in interest rates is expected to remain low. We do not believe that the value or liquidity of our cash and investments have been significantly impacted by current market events. Current market events have not required us to modify materially or change our financial risk management strategies with respect to our exposures to foreign currency exchange risk and interest rate risk.
47
ITEM 7A. QUANTITATIVE AND QUALITATIVE DISCLOSURES ABOUT MARKET RISK
In the normal course of business, we are exposed to foreign currency exchange risk and interest rate risk that could impact our financial position and results of operations.
Foreign Currency Exchange Risk
We conduct business outside the U.S. in several currencies including the British Pound Sterling, Euro, Japanese Yen, Indian Rupee and Philippine Peso. The financial statements of these foreign subsidiaries are translated into U.S. dollars using period-end rates of exchange for assets and liabilities and average rates for the period for revenues and expenses. Our non-U.S. dollar denominated revenues expected to be recognized over the next twelve months are estimated to be $17 million while our non-U.S. dollar denominated expenses are $163 million, which translates into a net foreign currency exposure of $146 million per year. To the extent that our international activities recorded in local currencies increase in the future, our exposure to fluctuations in currency exchange rates will correspondingly increase. To manage the exposures related to the effects of foreign exchange rate fluctuations, we utilize derivative instruments (foreign currency forward contracts). Our primary objective in holding derivatives is to reduce the volatility of earnings associated with changes in foreign currency. Derivative financial instruments are held solely as risk management tools and not for trading or speculative purposes.
During fiscal 2012, we entered into foreign currency forward contracts to hedge approximately 90% of our Indian Rupee exposure through the end of the first quarter of fiscal 2013, 75% of our Indian Rupee exposure through the end of the first quarter of fiscal 2014 and 50% of our Indian Rupee exposure through the end of the first quarter of fiscal 2015. In the fourth quarter of fiscal 2012, additional foreign currency forward contracts were entered into to hedge approximately 50% of our net Euro exposure through the end of the second quarter of fiscal 2013. At August 31, 2012 the notional principal and fair value of foreign exchange contracts to purchase Indian Rupees with U.S. dollars was $36.3 million and ($2.4) million, respectively. At August 31, 2012, the notional principal and fair value of foreign exchange contracts to purchase Euros with U.S. dollars were €8.1 million and $0.1 million, respectively. At August 31, 2012, there were no other outstanding foreign exchange forward contracts. A loss on derivatives for during fiscal 2012 of $1.0 million was recorded into operating income in our Consolidated Statements of Income as compared to a gain of $4.2 million a year ago.
The gains and losses on foreign currency forward contracts mitigate the variability in operating expenses associated with currency movements. These transactions are designated and accounted for as cash flow hedges in accordance with applicable accounting guidance . The changes in fair value for these foreign currency forward contracts are initially reported as a component of accumulated other comprehensive loss and subsequently reclassified into operating expenses when the hedged exposure affects earnings.
A sensitivity analysis was performed based on the estimated fair value of all foreign currency forward contracts outstanding at August 31, 2012. If the U.S. dollar had been 10% weaker, the fair value of outstanding foreign currency forward contracts would have increased by $4.1 million, which would have had an immaterial impact on our consolidated balance sheet. Such a change in fair value of our financial instruments would be substantially offset by changes in our expense base. Had we not had any hedges in place as of August 31, 2012, a hypothetical 10% weaker U.S. dollar against all foreign currencies from the quoted foreign currency exchange rates at August 31, 2012, would result in a decrease in operating income by $13.6 million over the next twelve months. A hypothetical 10% weaker U.S. dollar against all foreign currencies at August 31, 2012 would increase the fair value of total assets by $29.8 million and equity by $27.2 million.
Interest Rate Risk
The fair market value of our cash and investments at August 31, 2012 was $203.0 million. Our cash and cash equivalents consist of demand deposits and money market funds with maturities of three months or less at the date of acquisition and are reported at fair value. Our investments consist of certificates of deposits with original maturities greater than three months, but less than one year and, as such, are classified as investments (short-term) on our consolidated balance sheet. It is anticipated that the fair market value of our cash and investments will continue to be immaterially affected by fluctuations in interest rates. Preservation of principal is the primary goal of our cash and investment policy. Pursuant to our established investment guidelines, we try to achieve high levels of credit quality, liquidity and diversification. Our investment guidelines do not permit us to invest in puts, calls, strips, short sales, straddles, options, commodities, precious metals, futures or investments on margin. Because we have a restrictive investment policy, our financial exposure to fluctuations in interest rates is expected to remain low. We do not believe that the value or liquidity of our cash and investments have been significantly impacted by current market events.
48
ITEM 8. FINANCIAL STATEMENTS AND SUPPLEMENTARY DATA
Index to Consolidated Financial Statements
Page(s) | ||
Consolidated Financial Statements: | ||
Management's Statement of Responsibility for Financial Statements |
| 50 |
Management's Report on Internal Control over Financial Reporting |
| 50 |
Report of Independent Registered Public Accounting Firm |
| 51 |
Consolidated Statements of Income for the years ended August 31, 2012, 2011 and 20 10 |
| 52 |
Consolidated Balance Sheets at August 31, 2012 and 20 11 |
| 53 |
Consolidated Statements of Cash Flows for the years ended August 31, 2012, 2011 and 20 10 | 54 | |
Consolidated Statements of Changes in Stockholders' Equity for the years ended August 31, 2012, 2011 and 20 10 |
| 55 |
Notes to the Consolidated Financial Statements |
| 56 |
Financial Statement Schedule: | ||
Schedule II – Valuation and Qualifying Accounts |
| 90 |
49
Management's Statement of Responsibility for Financial Statements
FactSet's consolidated financial statements are prepared by management, which is responsible for their fairness, integrity and objectivity. The accompanying consolidated financial statements have been prepared in conformity with accounting principles generally accepted in the United States of America and include amounts based on management's estimates and judgments. All financial information in this Annual Report on Form 10-K has been presented on a basis consistent with the information included in the accompanying financial statements.
FactSet's policies and practices reflect corporate governance initiatives that are compliant with the listing requirements of the New York Stock Exchange, the NASDAQ Stock Market and the corporate governance requirements of the Sarbanes-Oxley Act of 2002. Management, with oversight by the Company's Board of Directors, has established and maintains a strong ethical climate so that its affairs are conducted to the highest standards of personal and corporate conduct
FactSet maintains accounting systems, including internal accounting controls, designed to provide reasonable assurance of the reliability of financial records and the protection of assets. The concept of reasonable assurance is based on recognition that the cost of a system should not exceed the related benefits. The effectiveness of those systems depends primarily upon the careful selection of financial and other managers, clear delegation of authority and assignment of accountability, inculcation of high business ethics and conflict-of-interest standards, policies and procedures for coordinating the management of corporate resources, and the leadership and commitment of top management. In compliance with the Sarbanes-Oxley Act of 2002, FactSet assessed its internal control over financial reporting and issued a report (see below).
The Audit Committee of the Board of Directors, which consists solely of independent non-employee directors, is responsible for overseeing the functioning of the accounting system and related controls and the preparation of annual financial statements. The Audit Committee periodically meets with management and the independent accountants to review and evaluate their accounting, auditing and financial reporting activities and responsibilities, including management's assessment of internal control over financial reporting. The independent registered public accounting firm has full and free access to the Audit Committee and met with the committee, with and without management present.
Management's Report on Internal Control over Financial Reporting
Management is responsible for establishing and maintaining adequate internal control over financial reporting as defined in Rules 13a-15(f) and 15d-15(f) under the Exchange Act. Under the supervision and with the participation of the Company's management, including its principal executive officer and principal financial officer, the Company conducted an evaluation of the effectiveness of its internal control over financial reporting based on criteria established in the framework in Internal Control-Integrated Framework issued by the Committee of Sponsoring Organizations of the Treadway Commission. Based on this evaluation, the Company's management concluded that its internal control over financial reporting was effective as of August 31, 2012. PricewaterhouseCoopers LLP, an independent registered public accounting firm, has audited the effectiveness of FactSet's internal control over financial reporting and has issued a report on the Company's internal control over financial reporting as of August 31, 2012, which is included in their report on the following page.
Because of its inherent limitations, internal control over financial reporting may not prevent or detect misstatements. Also, projections of any evaluation of effectiveness to future periods are subject to the risk that controls may become inadequate because of changes in conditions, or that the degree of compliance with the policies or procedures may deteriorate.
/s/ PHILIP A. HADLEY | /s/ MAURIZIO NICOLELLI |
Philip A. Hadley | Maurizio Nicolelli |
Chairman of the Board of Directors and Chief Executive Officer | Senior Vice President and Principal Financial Officer |
(Principal Executive Officer) | (Principal Financial Officer) |
October 30, 2012 | October 30, 2012 |
50
Report of Independent Registered Public Accounting Firm
To the Board of Directors and Stockholders of FactSet Research Systems Inc.
In our opinion, the consolidated financial statements listed in the accompanying index present fairly, in all material respects, the financial position of FactSet Research Systems Inc. and its subsidiaries at August 31, 2012 and 2011, and the results of their operations and their cash flows for each of the three years in the period ended August 31, 2012 in conformity with accounting principles generally accepted in the United States of America. In addition, in our opinion, the financial statement schedule listed in the accompanying index presents fairly, in all material respects, the information set forth therein when read in conjunction with the related consolidated financial statements. Also in our opinion, the Company maintained, in all material respects, effective internal control over financial reporting as of August 31, 2012, based on criteria established in Internal Control - Integrated Framework issued by the Committee of Sponsoring Organizations of the Treadway Commission (COSO). The Company's management is responsible for these financial statements and financial statement schedule, for maintaining effective internal control over financial reporting and for its assessment of the effectiveness of internal control over financial reporting, included in the accompanying Management's Report on Internal Control Over Financial Reporting. Our responsibility is to express opinions on these financial statements, on the financial statement schedule, and on the Company's internal control over financial reporting based on our integrated audits. We conducted our audits in accordance with the standards of the Public Company Accounting Oversight Board (United States). Those standards require that we plan and perform the audits to obtain reasonable assurance about whether the financial statements are free of material misstatement and whether effective internal control over financial reporting was maintained in all material respects. Our audits of the financial statements included examining, on a test basis, evidence supporting the amounts and disclosures in the financial statements, assessing the accounting principles used and significant estimates made by management, and evaluating the overall financial statement presentation. Our audit of internal control over financial reporting included obtaining an understanding of internal control over financial reporting, assessing the risk that a material weakness exists, and testing and evaluating the design and operating effectiveness of internal control based on the assessed risk. Our audits also included performing such other procedures as we considered necessary in the circumstances. We believe that our audits provide a reasonable basis for our opinions.
A company's internal control over financial reporting is a process designed to provide reasonable assurance regarding the reliability of financial reporting and the preparation of financial statements for external purposes in accordance with generally accepted accounting principles. A company's internal control over financial reporting includes those policies and procedures that (i) pertain to the maintenance of records that, in reasonable detail, accurately and fairly reflect the transactions and dispositions of the assets of the company; (ii) provide reasonable assurance that transactions are recorded as necessary to permit preparation of financial statements in accordance with generally accepted accounting principles, and that receipts and expenditures of the company are being made only in accordance with authorizations of management and directors of the company; and (iii) provide reasonable assurance regarding prevention or timely detection of unauthorized acquisition, use, or disposition of the company's assets that could have a material effect on the financial statements.
Because of its inherent limitations, internal control over financial reporting may not prevent or detect misstatements. Also, projections of any evaluation of effectiveness to future periods are subject to the risk that controls may become inadequate because of changes in conditions, or that the degree of compliance with the policies or procedures may deteriorate.
/s/ PRICEWATERHOUSECOOPERS LLP
PricewaterhouseCoopers LLP
Stamford, Connecticut
October 30, 2012
51
Consolidated Statements of Income
(In thousands, except per share data)
Years Ended August 31, | 2012 | 2011 | 2010 | |||||||||
Revenues | $ | 805,793 | $ | 726,510 | $ | 641,059 | ||||||
Operating expenses | ||||||||||||
Cost of services | 275,537 | 244,623 | 206,550 | |||||||||
Selling, general and administrative | 257,266 | 243,552 | 212,875 | |||||||||
Total operating expenses | 532,803 | 488,175 | 419,425 | |||||||||
Operating income | 272,990 | 238,335 | 221,634 | |||||||||
Other income | 1,715 | 623 | 547 | |||||||||
Income before income taxes | 274,705 | 238,958 | 222,181 | |||||||||
Provision for income taxes | 85,896 | 67,912 | 71,970 | |||||||||
Net income | $ | 188,809 | $ | 171,046 | $ | 150,211 | ||||||
Basic earnings per common share | $ | 4.22 | $ | 3.72 | $ | 3.22 | ||||||
Diluted earnings per common share | $ | 4.12 | $ | 3.61 | $ | 3.13 | ||||||
Weighted average common shares (Basic) | 44,784 | 45,953 | 46,698 | |||||||||
Weighted average common shares (Diluted) | 45,810 | 47,355 | 48,004 | |||||||||
The accompanying notes are an integral part of these consolidated financial statements.
52
Consolidated Balance Sheets
(In thousands, except share data)
At August 31, | 2012 | 2011 | ||||||
CURRENT ASSETS | ||||||||
Cash and cash equivalents | $ | 189,044 | $ | 181,685 | ||||
Investments | 13,919 | - | ||||||
Accounts receivable, net of reserves of $1,830 and $1,955 at August 31, 2012 and 2011, respectively | 74,251 | 75,004 | ||||||
Prepaid taxes | 2,485 | - | ||||||
Deferred taxes | 5,085 | 4,008 | ||||||
Prepaid expenses and other current assets | 14,341 | 12,473 | ||||||
Total current assets | 299,125 | 273,170 | ||||||
LONG-TERM ASSETS | ||||||||
Property, equipment and leasehold improvements, at cost | 189,546 | 173,990 | ||||||
Less accumulated depreciation and amortization | (113,016 | ) | (92,370 | ) | ||||
Property, equipment and leasehold improvements, net | 76,530 | 81,620 | ||||||
Goodwill | 245,791 | 228,265 | ||||||
Intangible assets, net | 43,371 | 46,310 | ||||||
Deferred taxes | 23,113 | 20,166 | ||||||
Other assets | 6,213 | 7,909 | ||||||
TOTAL ASSETS | $ | 694,143 | $ | 657,440 | ||||
CURRENT LIABILITIES | ||||||||
Accounts payable and accrued expenses | $ | 27,680 | $ | 24,603 | ||||
Accrued compensation | 41,274 | 41,536 | ||||||
Deferred fees | 30,495 | 28,252 | ||||||
Taxes payable | - | 2,867 | ||||||
Dividends payable | 13,727 | 12,165 | ||||||
Total current liabilities | 113,176 | 109,423 | ||||||
NON-CURRENT LIABILITIES | ||||||||
Deferred taxes | 2,593 | 3,712 | ||||||
Taxes payable | 5,464 | 7,204 | ||||||
Deferred rent and other non-current liabilities | 20,646 | 21,913 | ||||||
TOTAL LIABILITIES | $ | 141,879 | $ | 142,252 | ||||
Commitments and contingencies (See Note 17) | ||||||||
STOCKHOLDERS' EQUITY | ||||||||
Preferred stock, $.01 par value, 10,000,000 shares authorized, none issued | $ | – | $ | – | ||||
Common stock, $.01 par value, 150,000,000 shares authorized, 45,599,754 and 61,427,391 shares issued; 44,279,214 and 45,055,219 shares outstanding at August 31, 2012 and 2011, respectively | 456 | 614 | ||||||
Additional paid-in capital | 137,569 | 432,538 | ||||||
Treasury stock, at cost: 1,320,540 and 16,372,172 shares at August 31, 2012 and 2011, respectively | (122,749 | ) | (824,382 | ) | ||||
Retained earnings | 559,714 | 912,078 | ||||||
Accumulated other comprehensive loss | (22,726 | ) | (5,660 | ) | ||||
TOTAL STOCKHOLDERS' EQUITY | 552,264 | 515,188 | ||||||
TOTAL LIABILITIES AND STOCKHOLDERS' EQUITY | $ | 694,143 | $ | 657,440 | ||||
The accompanying notes are an integral part of these consolidated financial statements.
53
Consolidated Statements of Cash Flows
(In thousands)
Years Ended August 31, | 2012 | 2011 | 2010 | |||||||||
CASH FLOWS FROM OPERATING ACTIVITIES | ||||||||||||
Net income | $ | 188,809 | $ | 171,046 | $ | 150,211 | ||||||
Adjustments to reconcile net income to net cash provided by operating activities | ||||||||||||
Depreciation and amortization | 33,779 | 36,847 | 37,343 | |||||||||
Stock-based compensation expense | 21,982 | 25,773 | 14,065 | |||||||||
Deferred income taxes | (3,760 | ) | (1,806 | ) | (5,827 | ) | ||||||
Gain on sale of assets | - | (22 | ) | (80 | ) | |||||||
Tax benefits from share-based payment arrangements | (11,159 | ) | (18,331 | ) | (24,492 | ) | ||||||
Changes in assets and liabilities, net of effects of acquisitions | ||||||||||||
Accounts receivable, net of reserves | 2,083 | (15,311 | ) | 3,883 | ||||||||
Accounts payable and accrued expenses | 9 | 715 | (1,308 | ) | ||||||||
Accrued compensation | 519 | (7,882 | ) | 7,440 | ||||||||
Deferred fees | (2,573 | ) | 3,219 | (7,759 | ) | |||||||
Taxes payable, net of prepaid taxes | 4,209 | 20,387 | 35,781 | |||||||||
Prepaid expenses and other assets | (445 | ) | (6,579 | ) | 281 | |||||||
Deferred rent and other non-current liabilities | (905 | ) | (483 | ) | (359 | ) | ||||||
Other working capital accounts, net | (583 | ) | (437 | ) | 1,901 | |||||||
Net cash provided by operating activities | 231,965 | 207,136 | 211,080 | |||||||||
CASH FLOWS FROM INVESTING ACTIVITIES | ||||||||||||
Acquisition of businesses, net of cash acquired | (21,329 | ) | - | (55,180 | ) | |||||||
Purchases of investments | (15,000 | ) | - | - | ||||||||
Purchases of property, equipment and leasehold improvements, net of proceeds from dispositions | (22,520 | ) | (29,343 | ) | (20,768 | ) | ||||||
| Net cash used in investing activities | (58,849 | ) | (29,343 | ) | (75,948 | ) | ||||||
CASH FLOWS FROM FINANCING ACTIVITIES | ||||||||||||
Dividend payments | (49,983 | ) | (43,949 | ) | (38,494 | ) | ||||||
Repurchase of common stock | (153,641 | ) | (216,584 | ) | (192,816 | ) | ||||||
Proceeds from employee stock plans | 33,747 | 43,079 | 55,250 | |||||||||
Tax benefits from share-based payment arrangements | 11,159 | 18,331 | 24,492 | |||||||||
Net cash used in financing activities | (158,718 | ) | (199,123 | ) | (151,568 | ) | ||||||
Effect of exchange rate changes on cash and cash equivalents | (7,039 | ) | 7,274 | (4,143 | ) | |||||||
Net increase (decrease) in cash and cash equivalents | 7,359 | (14,056 | ) | (20,579 | ) | |||||||
Cash and cash equivalents at beginning of year | 181,685 | 195,741 | 216,320 | |||||||||
Cash and cash equivalents at end of year | $ | 189,044 | $ | 181,685 | $ | 195,741 | ||||||
Supplemental Disclosure of Cash Flow Information | ||||||||||||
Cash paid during the year for income taxes | $ | 73,219 | $ | 36,869 | $ | 38,450 | ||||||
Supplemental Disclosure of Non-Cash Transactions | ||||||||||||
Dividends declared, not paid | $ | 13,727 | $ | 12,165 | $ | 10,586 | ||||||
| Stock issued for acquisition of business | $ | 3,974 | $ | - | $ | - | ||||||
The accompanying notes are an integral part of these consolidated financial statements.
54
Consolidated Statements of Changes in Stockholders' Equity
(In thousands)
Years Ended August 31, | 2012 | 2011 | 2010 | |||||||||
COMMON STOCK | ||||||||||||
Balance, beginning of year | $ | 614 | $ | 601 | $ | 581 | ||||||
Common stock issued for employee stock plans | 9 | 13 | 20 | |||||||||
Retirement of treasury stock (See Note 12) | (167 | ) | - | - | ||||||||
Balance, end of year | $ | 456 | $ | 614 | $ | 601 | ||||||
ADDITIONAL PAID-IN CAPITAL | ||||||||||||
Balance, beginning of year | $ | 432,538 | $ | 344,144 | $ | 248,840 | ||||||
Common stock issued for employee stock plans | 33,383 | 44,290 | 56,747 | |||||||||
Stock-based compensation expense | 21,982 | 25,773 | 14,065 | |||||||||
Tax benefits from share-based payment arrangements | 11,159 | 18,331 | 24,492 | |||||||||
Stock issued for acquisition of business (See Note 7) | (11 | ) | - | - | ||||||||
Retirement of treasury stock (See Note 12) | (361,482 | ) | - | - | ||||||||
Balance, end of year | $ | 137,569 | $ | 432,538 | $ | 344,144 | ||||||
TREASURY STOCK | ||||||||||||
Balance, beginning of year | $ | (824,382 | ) | $ | (607,798 | ) | $ | (414,995 | ) | |||
Repurchase of common stock | (153,641 | ) | (216,584 | ) | (192,803 | ) | ||||||
Stock issued for acquisition of business (See Note 7) | 3,985 | - | - | |||||||||
Purchase of common stock upon restricted stock vesting (See Note 14) | 354 | - | - | |||||||||
Retirement of treasury stock (See Note 12) | 850,935 | - | - | |||||||||
Balance, end of year | $ | (122,749 | ) | $ | (824,382 | ) | $ | (607,798 | ) | |||
RETAINED EARNINGS | ||||||||||||
Balance, beginning of year | $ | 912,078 | $ | 786,844 | $ | 676,626 | ||||||
Net income | 188,809 | 171,046 | 150,211 | |||||||||
Dividends | (51,887 | ) | (45,812 | ) | (39,993 | ) | ||||||
Retirement of treasury stock (See Note 12) | (489,286 | ) | - | - | ||||||||
Balance, end of year | $ | 559,714 | $ | 912,078 | $ | 786,844 | ||||||
ACCUMULATED OTHER COMPREHENSIVE LOSS | ||||||||||||
Balance, beginning of year | $ | (5,660 | ) | $ | (21,385 | ) | $ | (10,223 | ) | |||
Foreign currency translation adjustments | (14,925 | ) | 14,897 | (10,073 | ) | |||||||
Net unrealized (loss) gain on cash flow hedges, net of tax | (2,141 | ) | 828 | (1,089 | ) | |||||||
Balance, end of year | $ | (22,726 | ) | $ | (5,660 | ) | $ | (21,385 | ) | |||
TOTAL STOCKHOLDERS' EQUITY | ||||||||||||
Balance, beginning of year | $ | 515,188 | $ | 502,406 | $ | 500,829 | ||||||
Net income | 188,809 | 171,046 | 150,211 | |||||||||
Common stock issued for employee stock plans | 33,392 | 44,303 | 56,767 | |||||||||
Purchase of common stock upon restricted stock vesting (See Note 14) | 354 | - | - | |||||||||
Stock-based compensation expense | 21,982 | 25,773 | 14,065 | |||||||||
Tax benefits from share-based payment arrangements | 11,159 | 18,331 | 24,492 | |||||||||
Repurchase of common stock | (153,641 | ) | (216,584 | ) | (192,803 | ) | ||||||
Foreign currency translation adjustments | (14,925 | ) | 14,897 | (10,073 | ) | |||||||
Stock issued for acquisition of business (See Note 7) | 3,974 | - | - | |||||||||
Net unrealized (loss) gain on cash flow hedges, net of tax | (2,141 | ) | 828 | (1,089 | ) | |||||||
Dividends | (51,887 | ) | (45,812 | ) | (39,993 | ) | ||||||
Balance, end of year | $ | 552,264 | $ | 515,188 | $ | 502,406 | ||||||
The accompanying notes are an integral part of these consolidated financial statements.
55
Notes to the Consolidated Financial Statements
1. ORGANIZATION AND NATURE OF BUSINESS
FactSet Research Systems Inc. (the "Company" or "FactSet") is a provider of integrated financial information and analytical applications to the global investment community. FactSet combines content regarding companies and securities from major markets all over the globe into a single online platform of information and analytics. By consolidating content from hundreds of databases with powerful analytics, FactSet supports the investment process from initial research to published results for buy and sell-side professionals. These professionals include portfolio managers, research and performance analysts, risk managers, marketing professionals, sell-side equity research professionals, investment bankers and fixed income professionals. The Company's applications provide users access to company analysis, multicompany comparisons, industry analysis, company screening, portfolio analysis, predictive risk measurements, alphatesting, portfolio optimization and simulation, real-time news and quotes and tools to value and analyze fixed income securities and portfolios. With Microsoft Office integration, wireless access and customizable options, FactSet offers a complete financial workflow solution. The Company's revenues are derived from subscriptions to services such as workstations, content and applications.
As of August 31, 2012, the Company employed 5,735 employees, an increase of 280 over the past three months and up 9% or 484 employees from a year ago. Of these employees, 1,840 were located in the U.S., 607 in Europe and 3,288 in Asia Pacific. Approximately 53% of FactSet employees are involved with content collection, 25% work in product development, software and systems engineering, another 18% conduct sales and consulting services and the remaining 4% provide administrative support.
2. SUMMARY OF SIGNIFICANT ACCOUNTING POLICIES
The significant accounting policies of the Company and its subsidiaries are summarized below.
Basis of Presentation
FactSet conducts business globally and is managed on a geographic basis. The accompanying consolidated financial statements include the accounts of the Company and its wholly owned subsidiaries. All intercompany activity and balances have been eliminated from the consolidated financial statements. Certain reclassifications have been made to amounts for prior years in order to conform to the current year's presentation.
FactSet has performed an evaluation of subsequent events occurring subsequent to the end of the Company's fiscal 2012 fourth quarter and through the date the consolidated financial statements were issued based on the accounting guidance for subsequent events.
Basis of Financial Statements and Use of Estimates
The Company's consolidated financial statements are prepared in accordance with U.S. generally accepted accounting principles. The preparation of consolidated financial statements and related disclosures in conformity with accounting principles generally accepted in the U.S. requires management to make estimates and assumptions that affect the reported amounts of assets and liabilities and disclosure of contingent assets and liabilities at the date of the financial statements and the reported amounts of revenues and expenses during the reporting period. Significant estimates have been made in areas that include receivable reserves, accrued compensation, allocation of purchase price to assets and liabilities acquired, income taxes, stock-based compensation, valuation of goodwill, and useful lives and valuation of fixed and intangible assets. The Company bases its estimates on historical experience and on various other assumptions that are believed to be reasonable, the results of which form the basis for making judgments about the carrying values of assets and liabilities. Actual results could differ from those estimates.
Revenue Recognition
The Company's revenues are derived from month-to-month subscriptions to services such as workstations (also referred to as users), content and applications. The majority of clients are invoiced monthly to reflect the actual services provided. The remaining clients are invoiced quarterly, annually or biannually in advance. Subscription revenue is earned each month as the service is rendered to clients on a monthly basis. FactSet recognizes revenue when the client subscribes to FactSet services, the service has been rendered and earned during the month, the amount of the subscription is fixed or determinable based on established rates quoted on an annualized basis and collectability is reasonably assured. A provision for billing adjustments and cancellation of services is estimated and accounted for as a reduction of revenue, with a corresponding reduction to accounts receivable.
56
Cost of Services
Cost of services is comprised of compensation for Company employees within the content collection, consulting, product development, software and systems engineering groups in addition to data costs, amortization of identifiable intangible assets, computer maintenance and depreciation expenses and client-related communication costs.
Selling, General and Administrative
Selling, general and administrative expenses include compensation for the sales and various other support and administrative departments, travel and entertainment expenses, marketing costs, rent, amortization of leasehold improvements, depreciation of furniture and fixtures, office expenses, professional fees and other miscellaneous expenses.
Earnings per Share
Basic earnings per share ("EPS") is computed by dividing net income by the number of weighted average common shares outstanding during the period. Diluted earnings per share is computed by dividing net income by the number of weighted average common shares outstanding during the period increased by the dilutive effect of potential common shares outstanding during the period. The number of potential common shares outstanding has been determined in accordance with the treasury stock method to the extent they are dilutive. Common share equivalents consist of common shares issuable upon the exercise of outstanding share-based compensation awards, including employee stock options and restricted stock. Under the treasury stock method, the exercise price paid by the optionee, future stock-based compensation expense that the Company has not yet recognized and the amount of tax benefits that would be recorded in additional paid-in capital when the award becomes deductible are assumed to be used to repurchase shares.
Fair Value Measures
Fair value is defined as the price that would be received from selling an asset or paid to transfer a liability (i.e., the "exit price") in an orderly transaction between market participants at the measurement date. In determining fair value, the use of various valuation methodologies, including market, income and cost approaches is permissible. The Company considers the principal or most advantageous market in which it would transact and considers assumptions that market participants would use when pricing the asset or liability. The accounting guidance for fair value measurements establishes a fair value hierarchy that requires an entity to maximize the use of observable inputs and minimize the use of unobservable inputs when measuring fair value. There are three levels of inputs that may be used to measure fair value based on the reliability of inputs. A financial instrument's categorization within the fair value hierarchy is based upon the lowest level of input that is significant to the fair value measurement. The Company's cash equivalents are classified as Level 1 while the Company's derivative instruments (foreign exchange forward contracts) and certificates of deposit are classified as Level 2. There were no Level 3 assets or liabilities held by FactSet as of August 31, 2012 or 2011.
Cash and Cash Equivalents
Cash and cash equivalents consist of demand deposits and corporate money market funds with maturities of three months or less at the date of acquisition and are reported at fair value. The Company's corporate money market funds are traded in an active market and the net asset value of each fund on the last day of the quarter is used to determine its fair value.
Investments
Investments consist of certificates of deposits with original maturities greater than three months, but less than one year and, as such, are classified as investments (short-term) on the Consolidated Balance Sheets. During fiscal 2012, the Company purchased $15.0 million of certificates of deposit with maturity dates up to twelve months from purchase date. The impact of foreign currency reduced the carrying value by $2.2 million as these deposits are held in Indian Rupees.
Accounts Receivable and Deferred Fees
Amounts that have been earned but not yet paid are reflected on the Consolidated Balance Sheets as accounts receivable, net of reserves. Amounts invoiced in advance or client payments that are in excess of earned subscription revenues are reflected on the Consolidated Balance Sheets as deferred fees. As of August 31, 2012, the amount of accounts receivable that was unbilled totaled $2.3 million, which was billed in fiscal 2013.
Receivable Reserve
The Company calculates its receivable reserve through analyzing aged client receivables, reviewing the recent history of client receivable write-offs and understanding general market and economic conditions. In accordance with this policy, a receivable reserve of $1.8 million and $2.0 million was recorded as of August 31, 2012 and 2011, respectively, in the Consolidated Balance Sheets as a reduction of accounts receivable.
Property, Equipment and Leasehold Improvements
Property, equipment and leasehold improvements are stated at cost, less accumulated depreciation and amortization. Computers and related equipment are depreciated on a straight-line basis over estimated useful lives of three years. Furniture and fixtures are depreciated on a straight-line basis over their estimated useful lives of seven years. Leasehold improvements are amortized on a straight-line basis over the terms of the related leases or estimated useful lives of the improvements, whichever period is shorter. Repairs and maintenance expenditures, which are not considered leasehold improvements and do not extend the useful life of the property and equipment, are expensed as incurred.
57
The Company performs a test for impairment whenever events or changes in circumstances indicate that the carrying amount of an individual asset or asset group may not be recoverable. Should projected undiscounted future cash flows be less than the carrying amount of the asset or asset group, an impairment charge reducing the carrying amount to fair value is required. Fair value is determined based on the most appropriate valuation technique, including discounted cash flows.
Asset Retirement Obligations
An asset retirement obligation is recognized in the period in which sufficient information exists to determine the fair value of the liability with a corresponding increase to the carrying amount of the related property, plant and equipment which is then depreciated over its useful life. The liability is initially measured at discounted fair value and then accretion expense is recorded in each subsequent period. The Company's asset retirement obligations are primarily associated with its build out of office space in London and Hong Kong where FactSet made significant leasehold improvements and is obligated to remove the leasehold improvements at the end of the lease term. The Company's asset retirement obligations are not material to its consolidated financial statements.
Goodwill
Goodwill has resulted from the acquisitions of the Insyte, LionShares, Mergerstat, CallStreet, JCF, TrueCourse, Derivative Solutions, AlphaMetrics, Global Filings, DealMaven, Thomson Fundamentals, Market Metrics and StreetAccount businesses. Goodwill resulting from the acquisitions of LionShares, Mergerstat, TrueCourse, Derivative Solutions, Market Metrics, and StreetAccount are income tax-deductible based on the structure of the acquisition. On an ongoing basis, the Company evaluates goodwill at the reporting unit level for indications of potential impairment. Goodwill is tested for impairment based on the present value of discounted cash flows, and, if impaired, written down to fair value. FactSet has determined that there were three reporting units during fiscal years 2012, 2011 and 2010, which are consistent with the operating segments reported because there is no discrete financial information available for the subsidiaries within each operating segment. The Company's reporting units evaluated for potential impairment were U.S., Europe and Asia Pacific, which reflects the level of internal reporting the Company uses to manage its business and operations. The Company performed an annual goodwill impairment test during the fourth quarter of fiscal years 2012, 2011 and 2010 and determined that there were no reporting units that were deemed at risk and there had been no impairment.
Intangible Assets
Intangible assets consist of certain acquired content databases, client relationships, software technology, non-compete agreements and trade names resulting from the acquisitions of Insyte (data central application), LionShares (global equity ownership data), Mergerstat (M&A data), CallStreet (events and transcripts), JCF (earnings and other estimates), TrueCourse (takeover defense intelligence), Derivative Solutions (fixed income), AlphaMetrics (research and performance evaluation networking tool), Global Filings (equity and fixed income prospectuses), DealMaven (investment banking workflow tool), Thomson Fundamentals (financial data), Market Metrics (market research data on advisor-sold investments and insurance products), and StreetAccount (financial news) and depending on the nature of the intangible asset, are amortized on either a straight-line or an accelerated basis using estimated useful lives ranging between two and twenty years. These intangible assets have no assigned residual values. Intangible assets are reviewed for impairment whenever events or changes in circumstances indicate that the carrying amount of such assets may not be recoverable. Determination of recoverability is based on an estimate of undiscounted future cash flows resulting from the use of the asset and its eventual disposition. Measurement of any impairment loss for intangible assets that management expects to hold and use is based on the amount the carrying value exceeds the fair value of the asset. No impairment of intangible assets has been identified during any of the periods presented.
Internal Use Software
Certain costs related to computer software developed or obtained for internal use are capitalized. FactSet capitalizes only those direct costs incurred during the application development and implementation stages for developing, purchasing or otherwise acquiring software solely to meet the Company's internal needs. Capitalized costs are amortized on a straight-line basis over the estimated useful lives of the underlying software, three years or less. During fiscal 2012, 2011 and 2010, the Company capitalized $0.9 million, $0.9 million and $0.8 million, respectively of internal employee compensation costs associated with the application development and implementation stages for developing software for internal use only. In fiscal 2012, 2011 and 2010, FactSet recorded amortization expense related to capitalized software of $0.9 million, $0.7 million and $0.6 million, respectively.
58
Product Development
The Company capitalizes software development costs related to software to be sold, leased, or otherwise marketed. Software development costs are expensed as incurred until technological feasibility has been established, at which time such costs are capitalized until the product is available for general release to the public. Once the point of technological feasibility is reached, which is the completion of a working prototype that has been certified as having no critical bugs and is a release candidate or has alternative future uses, development costs are capitalized until the product is ready for general release. Research and product development costs not subject to capitalization are expensed as incurred. As of August 31, 2012 and 2011, there were no software development costs capitalized related to software to be sold, leased, or otherwise marketed.
Landlord Contributions for Leasehold Improvements
In conjunction with entering into leases for office space, the Company receives contributions from landlords toward leasehold improvements which are reported in the Accounts Payable and Accrued Expenses line item (current portion only) and the Deferred Rent and Other Non-Current Liabilities line item (non-current portion) of the Consolidated Balance Sheets. These contributions are amortized as a reduction to rent expense over the non-cancelable lease terms to which they pertain. During fiscal 2012, 2011 and 2010, cash contributions from landlords were $1.5 million, $1.4 million and $0.5 million, respectively.
Derivative Instruments
FactSet conducts business outside the U.S. in several currencies including the British Pound Sterling, Euro, Japanese Yen, Indian Rupee and Philippine Peso. As such, it is exposed to movements in foreign currency exchange rates compared to the U.S. dollar. To manage the exposures related to the effects of foreign exchange rate fluctuations, the Company utilizes derivative instruments (foreign currency forward contracts). The Company's primary objective in holding derivatives is to reduce the volatility of earnings and cash flows associated with changes in foreign currency. The Company does not enter into foreign exchange forward contracts for trading or speculative purposes.
FactSet enters into foreign currency forward contracts to reduce the effects of foreign currency fluctuations. In designing a specific hedging approach, FactSet considers several factors, including offsetting exposures, significance of exposures, forecasting risk and potential effectiveness of the hedge. These transactions are designated and accounted for as cash flow hedges in accordance with applicable accounting guidance . The changes in fair value for these foreign currency forward contracts are initially reported as a component of accumulated other comprehensive loss and subsequently reclassified into operating expenses when the hedged exposure affects earnings. The gains and losses on foreign currency forward contracts mitigate the variability in operating expenses associated with currency movements. All derivatives are assessed for effectiveness at each reporting period.
Accrued Liabilities
Accrued liabilities include estimates relating to employee compensation, operating expenses and tax liabilities. Approximately 15-20% of the Company's employee incentive compensation programs are discretionary. FactSet conducts a final review of Company and departmental individual performance each fiscal year end to determine the amount of discretionary employee compensation. The Company also reviews compensation throughout the year to determine how overall performance tracks against management's expectations. Management takes these and other factors, including historical performance, into account in reviewing accrued compensation estimates quarterly and adjusting accrual rates as appropriate. The amount of the variable employee compensation recorded within accrued compensation as of August 31, 2012 and 2011, were $35.9 million and $37.2 million, respectively.
Treasury Stock
The Company accounts for repurchased common stock under the cost method and includes such treasury stock as a component of its stockholders' equity. At the time treasury stock retirement is approved by FactSet's Board of Directors, the Company's accounting policy is to deduct its par value from common stock, reduce additional paid-in capital ("APIC") by the amount recorded in APIC when the stock was originally issued and any remaining excess of cost as a deduction from retained earnings.
Income and Deferred Taxes
Income tax expense is based on taxable income determined in accordance with current enacted laws and tax rates. Deferred income taxes are recorded for the temporary differences between the financial statement and tax bases of assets and liabilities using currently enacted tax rates.
FactSet recognizes the financial effect of an income tax position only if it is more likely than not (greater than 50%) that the tax position will prevail upon tax examination, based solely on the technical merits of the tax position as of the reporting date. Otherwise, no benefit or expense can be recognized in the consolidated financial statements. The tax benefits recognized are measured based on the largest benefit that has a greater than 50% likelihood of being realized upon ultimate settlement. Additionally, FactSet accrues interest and related penalties, if applicable, on all tax exposures for which reserves have been established consistent with jurisdictional tax laws. Interest and penalties are classified as income tax expense in the financial statements. As of August 31, 2012, the Company had gross unrecognized tax benefits totaling $5.5 million, including $1.0 million of accrued interest, recorded as non-current taxes payable in the Consolidated Balance Sheet.
59
Comprehensive Income (Loss)
The Company discloses comprehensive income (loss) in accordance with applicable standards for the reporting and display of comprehensive income (loss) in a set of financial statements. Comprehensive income (loss) is defined as the change in net assets of a business enterprise during a period from transactions generated from non-owner sources. It includes all changes in equity during a period except those resulting from investments by owners and distributions to owners. See Note 13 for further disclosure of comprehensive income (loss).
Foreign Currency Translation
Certain wholly owned subsidiaries within the Europe and Asia Pacific segments operate under a functional currency different from the U.S. dollar, such as the British Pound Sterling, Euro, Japanese Yen, Indian Rupee and Philippines Peso. The financial statements of these foreign subsidiaries are translated into U.S. dollars using period-end rates of exchange for assets and liabilities, and average rates for the period for revenues and expenses. Translation gains and losses that arise from translating assets, liabilities, revenues and expenses of foreign operations are recorded in accumulated other comprehensive loss as a component of stockholders' equity. The accumulated foreign currency translation loss totaled $21.2 million and $6.25 million at August 31, 2012 and 2011, respectively.
Stock-Based Compensation
Accounting guidance requires the measurement and recognition of compensation expense for all share-based payment awards made to employees and directors including stock options, restricted stock and common shares acquired under employee stock purchases based on estimated fair values of the share awards that are scheduled to vest during the period. FactSet uses the straight-line attribution method for all awards with graded vesting features and service conditions only. Under this method, the amount of compensation expense that is recognized on any date is at least equal to the vested portion of the award on that date. For all stock-based awards with performance conditions, the graded vesting attribution method is used by the Company to determine the monthly stock-based compensation expense over the applicable vesting periods.
As stock-based compensation expense recognized is based on awards ultimately expected to vest, it has been reduced for estimated forfeitures. Forfeitures are estimated at the time of grant and revised, if necessary, in subsequent periods if actual forfeitures differ from those estimates. Forfeitures were estimated based primarily on historical experience. Windfall tax benefits, defined as tax deductions that exceed recorded stock-based compensation, are classified as cash inflows from financing activities.
Performance-based stock options require management to make assumptions regarding the likelihood of achieving Company performance targets on a quarterly basis. The number of performance-based options that vest will be predicated on the Company achieving certain performance levels. A change in the financial performance levels the Company achieves could result in changes to FactSet's current estimate of the vesting percentage and related stock-based compensation.
Legal Matters
From time to time, the Company is subject to legal proceedings, claims, and litigation arising in the ordinary course of business, including intellectual property litigation. FactSet accrues liabilities for contingencies when management believes that a loss is probable and the amounts can be reasonably estimated, while contingent gains are recognized only when realized. Legal costs for services rendered in the course of these proceedings are charged to expense as they are incurred.
Operating Leases
The Company conducts all of its operations in leased facilities which have minimum lease obligations under non-cancelable operating leases. Certain of these leases contain rent escalations based on specified percentages. Most of the leases contain renewal options and require payments for taxes, insurance and maintenance. Rent expense is charged to operations as incurred except for escalating rents, which are charged to operations on a straight-line basis over the life of the lease. Lease incentives, relating to allowances provided by landlords, are amortized over the term of the lease as a reduction of rent expense. Costs associated with acquiring a subtenant, including broker commissions and tenant allowances, are amortized over the sublease term as a reduction of sublease income.
Recently Adopted Accounting Guidance
Fair Value Measurement and Disclosure Requirements
On September 1, 2011, FactSet adopted guidance issued by the Financial Accounting Standards Board ("FASB") on disclosure requirements related to fair value measurements. The guidance requires the disclosure of roll-forward activities on purchases, sales, issuance, and settlements of the assets and liabilities measured using significant unobservable inputs (Level 3 fair value measurements). Adoption of this new guidance did not have an impact on the Company's consolidated financial statements.
60
On March 1, 2012, FactSet adopted guidance issued by the FASB on accounting and disclosure requirements related to fair value measurements. The guidance is the result of joint efforts by the FASB and International Accounting Standards Board to develop a single, converged fair value framework on how to measure fair value and what disclosures to provide about fair value measurements. The most significant change in disclosures is an expansion of the information required for Level 3 measurements based on unobservable inputs. The adoption did not have a material impact on the Company's consolidated financial statements.
No other new accounting pronouncements issued or effective during fiscal 2012 have had or are expected to have an impact on the Company's consolidated financial statements.
Recent Accounting Guidance Not Yet Adopted
Balance Sheet Offsetting
In December 2011, the FASB issued an accounting standard update requiring enhanced disclosures about certain financial instruments and derivative instruments that are offset in the balance sheet or that are subject to enforceable master netting arrangements or similar agreements. This accounting standard update is effective for FactSet beginning in the first quarter of fiscal 2014. Other than requiring additional disclosures, the adoption is not expected to have an impact on the Company's consolidated financial statements.
Presentation of Comprehensive Income
In June 2011, the FASB issued an accounting standard update to provide guidance on increasing the prominence of items reported in other comprehensive income. The guidance eliminates the option to present components of other comprehensive income as part of the statement of stockholders' equity. Instead, it requires that the total of comprehensive income, the components of net income and the components of other comprehensive income be presented either in a single continuous statement of comprehensive income or in two separate but consecutive statements. The new guidance also required entities to present reclassification adjustments out of accumulated other comprehensive income by component in both the statement in which net income is presented and the statement in which other comprehensive income is presented. In December 2011, the FASB issued guidance which indefinitely defers the guidance related to the presentation of reclassification adjustments. The Company expects to present comprehensive income in two separate but consecutive statements upon adoption, beginning in the first quarter of fiscal 2013. Other than the change in presentation, the adoption is not expected to have an impact on the Company's consolidated financial statements.
Goodwill Impairment Testing
In September 2011, the FASB issued an accounting standard update intended to simplify how an entity tests goodwill for impairment. The guidance will allow an entity to first assess qualitative factors to determine whether it is necessary to perform the two-step quantitative goodwill impairment test. An entity no longer will be required to calculate the fair value of a reporting unit unless the entity determines, based on a qualitative assessment, that it is more likely than not that its fair value is less than its carrying amount. This accounting standard update is effective for FactSet beginning in the first quarter of fiscal 2013 and is not expected to have an impact on the Company's consolidated financial statements.
Indefinite-lived Intangible Assets
In July 2012, the FASB issued an accounting standard update intended to simplify how an entity tests indefinite-lived intangible assets other than goodwill for impairment by providing entities with an option to perform a qualitative assessment to determine whether further impairment testing is necessary. This accounting standard update is effective for FactSet beginning in the first quarter of fiscal 2014 and is not expected to have an impact on the Company's consolidated financial statements.
3. FAIR VALUE MEASURES
Fair value is defined as the price that would be received from selling an asset or paid to transfer a liability in an orderly transaction between market participants at the measurement date. When determining the fair value measurements for assets and liabilities required or permitted to be recorded at fair value, the Company considers the principal or most advantageous market in which it would transact, and considers assumptions that market participants would use when pricing the asset or liability.
61
(a) Fair Value Hierarchy
The accounting guidance establishes a fair value hierarchy that requires an entity to maximize the use of observable inputs and minimize the use of unobservable inputs when measuring fair value. There are three levels of inputs that may be used to measure fair value based on the reliability of inputs. A financial instrument's categorization within the fair value hierarchy is based upon the lowest level of input that is significant to the fair value measurement. The Company's assessment of the significance of a particular input to the fair value measurement requires judgment and may affect their placement within the fair value hierarchy levels. FactSet has categorized its cash equivalents, investments and derivatives within the hierarchy as follows:
Level 1 - applies to assets or liabilities for which there are quoted prices in active markets for identical assets or liabilities. These Level 1 assets and liabilities include FactSet's corporate money market funds that are classified as cash equivalents.
Level 2 - applies to assets or liabilities for which there are inputs other than quoted prices that are observable for the asset or liability such as quoted prices for similar assets or liabilities in active markets; quoted prices for identical assets or liabilities in markets with insufficient volume or infrequent transactions (less active markets); or model-derived valuations in which significant inputs are observable or can be derived principally from, or corroborated by, observable market data. The Company's certificates of deposit and derivative instruments are classified as Level 2.
Level 3 - applies to assets or liabilities for which there are unobservable inputs to the valuation methodology that are significant to the measurement of the fair value of the assets or liabilities. There were no Level 3 assets or liabilities held by FactSet as of August 31, 2012 or 2011.
(b) Assets and Liabilities Measured at Fair Value on a Recurring Basis
The following tables shows by level within the fair value hierarchy the Company's assets and liabilities that are measured at fair value on a recurring basis at August 31, 2012 and 2011 (in thousands):
Fair Value Measurements at Reporting Date Using | ||||||||||||||||
August 31, 2012 | Level 1 | Level 2 | Level 3 | Total | ||||||||||||
Assets | ||||||||||||||||
Corporate money market funds (1) | $ | 160,169 | $ | - | $ | - | $ | 160,169 | ||||||||
Certificates of deposit (2) | - | 13,919 | - | 13,919 | ||||||||||||
Total assets measured at fair value | $ | 160,169 | $ | 13,919 | $ | - | $ | 174,088 | ||||||||
Liabilities | ||||||||||||||||
Derivative instruments (3) | $ | - | $ | 2,374 | $ | - | $ | 2,374 | ||||||||
Total liabilities measured at fair value | $ | - | $ | 2,374 | $ | - | $ | 2,374 | ||||||||
Fair Value Measurements at Reporting Date Using | ||||||||||||||||
August 31, 2011 | Level 1 | Level 2 | Level 3 | Total | ||||||||||||
Assets | ||||||||||||||||
Corporate money market funds (1) | $ | 161,168 | $ | - | $ | - | $ | 161,168 | ||||||||
Derivative instruments (3) | - | 897 | - | 897 | ||||||||||||
Total assets measured at fair value | $ | 161,168 | $ | 897 | $ | - | $ | 162,065 | ||||||||
| (1) | The Company's corporate money market funds are traded in an active market and the net asset value of each fund on the last day of the quarter is used to determine its fair value. As such, the Company's corporate money market funds are classified as Level 1 and included in cash and cash equivalents on the consolidated balance sheet. |
| (2) | The Company's certificates of deposit held for investment are not debt securities and are classified as Level 2. These certificates of deposit have original maturities greater than three months, but less than one year and, as such, are classified as investments (short-term) on the Company's consolidated balance sheet. |
| (3) | The Company utilizes the income approach to measure fair value for its derivative instruments (foreign exchange forward contracts). The income approach uses pricing models that rely on market observable inputs such as spot, forward and interest rates, as well as credit default swap spreads and therefore are classified as Level 2. |
The Company did not have any transfers between Level 1 and Level 2 fair value measurements during the periods presented.
62
Assets and liabilities measured at fair value on a recurring basis were presented on the Company's Consolidated Balance Sheets at August 31, 2012 and 2011 as follows (in thousands):
Fair Value Measurements at Reporting Date Using | ||||||||||||||||
August 31, 2012 | Level 1 | Level 2 | Level 3 | Total | ||||||||||||
Cash and cash equivalents | $ | 160,169 | $ | - | $ | - | $ | 160,169 | ||||||||
Investments (short-term) | - | 13,919 | - | 13,919 | ||||||||||||
Total assets measured at fair value | $ | 160,169 | $ | 13,919 | $ | - | $ | 174,088 | ||||||||
Accounts payable and accrued liabilities (derivative liabilities) | $ | - | $ | 2,374 | $ | - | $ | 2,374 | ||||||||
Total liabilities measured at fair value | $ | - | $ | 2,374 | $ | - | $ | 2,374 | ||||||||
Fair Value Measurements at Reporting Date Using | ||||||||||||||||
August 31, 2011 | Level 1 | Level 2 | Level 3 | Total | ||||||||||||
Cash and cash equivalents | $ | 161,168 | $ | - | $ | - | $ | 161,168 | ||||||||
Prepaid expenses and other current assets (derivative assets) | - | 897 | - | 897 | ||||||||||||
Total assets measured at fair value | $ | 161,168 | $ | 897 | $ | - | $ | 162,065 | ||||||||
(c) Assets and Liabilities Measured at Fair Value on a Non-recurring Basis
Certain assets, including goodwill and intangible assets, and liabilities, are measured at fair value on a non-recurring basis; that is, the assets and liabilities are not measured at fair value on an ongoing basis but are subject to fair value adjustments in certain circumstances such as when they are deemed to be other-than-temporarily impaired. The fair values of these non-financial assets and liabilities are determined based on valuation techniques using the best information available, and may include quoted market prices, market comparables, and discounted cash flow projections. An impairment charge is recorded when the cost exceeds its fair value and this condition is determined to be other-than-temporary. During fiscal 2012, no fair value adjustments or material fair value measurements were required for the Company's non-financial assets or liabilities.
4. CASH AND CASH EQUIVALENTS
Cash and cash equivalents consist of demand deposits and corporate money market funds with maturities of three months or less at the date of acquisition and are reported at fair value.
The following table summarizes the Company's cash and cash equivalents at August 31, 2012 (in thousands):
Amortized Cost | Gross Unrealized Gain | Fair Value | ||||||||||
Cash on hand | $ | 28,875 | $ | - | $ | 28,875 | ||||||
Corporate money market funds | 160,169 | - | 160,169 | |||||||||
Total cash and cash equivalents | $ | 189,044 | $ | - | $ | 189,044 | ||||||
The following table summarizes the Company's cash and cash equivalents at August 31, 2011 (in thousands):
Amortized Cost | Gross Unrealized Gain | Fair Value | ||||||||||
Cash on hand | $ | 20,517 | $ | - | $ | 20,517 | ||||||
Corporate money market funds | 161,168 | - | 161,168 | |||||||||
Total cash and cash equivalents | $ | 181,685 | $ | - | $ | 181,685 | ||||||
Investments - during the first quarter of fiscal 2012, the Company purchased $15.0 million of certificates of deposit with maturity dates ranging from nine months to twelve months from purchase date. These certificates of deposit are held for investment and are not debt securities. During fiscal 2012, interest income from the certificates of deposit was $1.1 million. The value of the certificates of deposit at August 31, 2012 was $13.9 million and reported as investments (short-term) in the Company's consolidated balance sheet. The impact of foreign currency reduced the value by $2.2 million as these certificates of deposit are held in Indian Rupees. The Company's cash, cash equivalents and investments portfolio did not experience any realized or unrealized losses as a result of counterparty credit risk or ratings change during fiscal 2012 and 2011. The Company did not hold any investments at August 31, 2011.
63
5. DERIVATIVE INSTRUMENTS
Foreign Exchange Risk Management
FactSet conducts business outside the U.S. in several currencies including the British Pound Sterling, Euro, Japanese Yen, Indian Rupee and Philippine Peso. As such, it is exposed to movements in foreign currency exchange rates compared to the U.S. dollar. To manage the exposures related to the effects of foreign exchange rate fluctuations, the Company utilizes derivative instruments (foreign currency forward contracts). The Company's primary objective in holding derivatives is to reduce the volatility of earnings and cash flows associated with changes in foreign currency. The Company does not enter into foreign exchange forward contracts for trading or speculative purposes.
Cash Flow Hedges
FactSet enters into foreign currency forward contracts to reduce the effects of foreign currency fluctuations. In designing a specific hedging approach, FactSet considered several factors, including offsetting exposures, significance of exposures, forecasting risk and potential effectiveness of the hedge. The gains and losses on foreign currency forward contracts offset the variability in operating expenses associated with currency movements. There was no discontinuance of cash flow hedges during fiscal 2012 or fiscal 2011 and as such, no corresponding gains or losses were reclassified into earnings. The changes in fair value for these foreign currency forward contracts are initially reported as a component of accumulated other comprehensive loss ("AOCL") and subsequently reclassified into operating expenses when the hedged exposure affects earnings.
| · | New Indian Rupee Hedging Contracts in Fiscal 2012 - During fiscal 2012, FactSet entered into foreign currency forward contracts to hedge approximately 90% of its Indian Rupee exposure through the end of the first quarter of fiscal 2013, 75% of its Indian Rupee exposure through the end of the first quarter of fiscal 2014 and 50% of its Indian Rupee exposure through the end of the first quarter of fiscal 2015. |
| · | New Euro Hedging Contracts in Fiscal 2012 - In the fourth quarter of fiscal 2012, additional foreign currency forward contracts were entered into by FactSet to hedge approximately 50% of its net Euro exposure through the end of the second quarter of fiscal 2013. |
| · | Hedging Contracts from Fiscal 2011 - During the first quarter of fiscal 2011, FactSet entered into foreign currency forward contracts to hedge approximately 95% of its Japanese Yen operating income through the end of the fourth quarter of fiscal 2011. In the second half of fiscal 2010, FactSet entered into foreign currency forward contracts to hedge approximately 95% of its net Euro exposure through the end of the first quarter of fiscal 2012. |
At August 31, 2012 the notional principal and fair value of foreign exchange contracts to purchase Indian Rupees with U.S. dollars was $36.3 million and ($2.4) million, respectively. At August 31, 2012, the notional principal and fair value of foreign exchange contracts to purchase Euros with U.S. dollars were €8.1 million and $0.1 million, respectively.
The following is a summary of all hedging positions and corresponding fair values (in thousands):
Gross Notional Value | Fair Value Asset (Liability) | |||||||||||||||
Currency Hedged (in USD) | Aug 31, 2012 | Aug 31, 2011 | Aug 31, 2012 | Aug 31, 2011 | ||||||||||||
Euro | $ | 10,160 | $ | 8,422 | $ | 60 | $ | 916 | ||||||||
Indian Rupee | 36,286 | - | (2,434 | ) | - | |||||||||||
Japanese Yen | - | 196 | - | (19 | ) | |||||||||||
Total | $ | 46,446 | $ | 8,618 | $ | (2,374 | ) | $ | 897 | |||||||
Counterparty Credit Risk
As a result of the use of derivative instruments, the Company is exposed to counterparty credit risk. FactSet has incorporated counterparty risk into the fair value of its derivative assets and its own credit risk into the value of the Company's derivative liabilities. FactSet calculates credit risk from observable data related to credit default swaps ("CDS") as quoted by publicly available information. Counterparty risk is represented by CDS spreads related to the senior secured debt of the respective bank with whom FactSet has executed these derivative transactions. Because CDS spread information is not available for FactSet, the Company's credit risk is determined based on using a simple average of CDS spreads for peer companies.
To mitigate counterparty credit risk, FactSet enters into contracts with large financial institutions. The Company regularly reviews its credit exposure balances as well as the creditworthiness of the counterparties. The Company does not expect any losses as a result of default of its counterparties.
64
Fair Value of Derivative Instruments
The following tables provide a summary of the fair value amounts of derivative instruments and gains and losses on derivative instruments (in thousands):
Designation of Derivatives |
Balance Sheet Location | Aug 31, 2012 | Aug 31, 2011 | ||||||
Derivatives designated as hedging instruments | Assets: Foreign Currency Forward Contracts | ||||||||
Prepaid expenses and other current assets | $ | - |
| $ | 897 | ||||
Liabilities: Foreign Currency Forward Contracts | |||||||||
Accounts payable and accrued expenses | $ | 2,374 |
| $ | - |
All derivatives were designated as hedging instruments as of August 31, 2012 and 2011, respectively.
Derivatives in Cash Flow Hedging Relationships for the twelve months ended August 31, 2012 and 2011 (in thousands):
(Loss) Gain Recognized in AOCL on Derivatives (Effective Portion) | Location of (Loss) Gain Reclassified from AOCL into Income | (Loss) Gain Reclassified from AOCL into Income (Effective Portion) | ||||||||||||||
Derivatives in Cash Flow Hedging Relationships | 2012 | 2011 | (Effective Portion) | 2012 | 2011 | |||||||||||
Foreign currency forward contracts | $ | (3,172 | ) | $ | 5,010 |
| SG&A |
| $ | (1,031) | $ | 4,182 | ||||
Note: No amount of ineffectiveness was recorded in the Consolidated Statements of Income for these designated cash flow hedges and all components of each derivative's gain or loss was included in the assessment of hedge effectiveness.
Accumulated Other Comprehensive Loss
The following table provides a summary of the activity associated with all of the Company's designated cash flow hedges reflected in AOCL (in thousands):
| Twelve Months Ended August 31, | |||||||
| 2012 | 2011 | ||||||
Beginning balance, net of tax |
| $ | 590 | $ | (238 | ) | ||
Changes in fair value |
| (3,172 | ) | 5,010 | ||||
Realized loss (gain) reclassified to earnings |
| 1,031 | (4,182 | ) | ||||
Ending balance, net of tax |
| $ | (1,551 | ) | $ | 590 | ||
6. SEGMENT INFORMATION
Operating segments are defined as components of an enterprise that engage in business activities from which it may earn revenues and incur expenses, whose operating results are regularly reviewed by the enterprise's chief operating decision maker ("CODM") to make decisions about resources to be allocated to the segment and assess its performance, and for which discrete financial information is available. FactSet's CODM is its Chief Executive Officer, who is responsible for making decisions about resources allocated amongst the operating segments based on actual results.
FactSet's reportable segments are aligned with how the Company, including its CODM, manages the business and the demographic markets in which FactSet serves. The Company's internal financial reporting structure is based on three reportable segments; U.S., Europe and Asia Pacific. FactSet believes this alignment helps it better manage the business and view the markets the Company serves, which are centered on providing integrated global financial and economic information. Sales, consulting, data collection and software engineering are the primary functional groups within the U.S., Europe and Asia Pacific segments that provide global financial and economic information to investment managers, investment banks and other financial services professionals. The U.S. segment services finance professionals including financial institutions throughout North America, while the European and Asia Pacific segments service investment professionals located throughout Europe and Asia, respectively. The accounting policies of the segments are the same as those described in the Note 2, Summary of Significant Accounting Policies .
The European segment is headquartered in London, England and maintains office locations in France, Germany, the Netherlands, Dubai and Italy. The Asia Pacific segment is headquartered in Tokyo, Japan with office locations in Hong Kong, Australia and India. Segment revenues reflect direct sales to clients based in their respective geographic locations. There are no intersegment or intercompany sales of the FactSet service. Each segment records compensation, including stock-based compensation, data collection costs, amortization of intangible assets, depreciation of furniture and fixtures, amortization of leasehold improvements, communication costs, professional fees, rent expense, travel, marketing, office and other direct expenses. Expenditures associated with the Company's data centers and corporate headquarters charges are recorded by the U.S. segment and are not allocated to the other segments. The content collection centers located in India and the Philippines benefit all of the Company's operating segments and thus the expenses incurred at these locations are allocated to each segment based on a percentage of revenues. Of the total $246 million of goodwill reported by the Company at August 31, 2012, 68% was recorded in the U.S. segment, 30% in the European segment and the remaining 2% in the Asia Pacific segment.
65
The following reflects the results of operations of the segments consistent with the Company's management system. These results are used, in part, by management, both in evaluating the performance of, and in allocating resources to, each of the segments (in thousands).
| Year Ended August 31, 2012 | U.S. | Europe | Asia Pacific | Total | ||||||||||||
Revenues from clients | $ | 550,474 | $ | 197,404 | $ | 57,915 | $ | 805,793 | ||||||||
Segment operating profit | 149,968 | 95,417 | 27,605 | 272,990 | ||||||||||||
Total assets | 377,320 | 266,967 | 49,856 | 694,143 | ||||||||||||
Depreciation and amortization | 25,061 | 4,922 | 3,796 | 33,779 | ||||||||||||
Stock-based compensation | 20,180 | 1,680 | 122 | 21,982 | ||||||||||||
Capital expenditures | 20,408 | 488 | 1,624 | 22,520 | ||||||||||||
| Year Ended August 31, 2011 | U.S. | Europe | Asia Pacific | Total | ||||||||||||
Revenues from clients | $ | 497,564 | $ | 178,693 | $ | 50,253 | $ | 726,510 | ||||||||
Segment operating profit | 135,327 | 79,637 | 23,371 | 238,335 | ||||||||||||
Total assets | 353,205 | 274,139 | 30,096 | 657,440 | ||||||||||||
Depreciation and amortization | 27,463 | 6,092 | 3,292 | 36,847 | ||||||||||||
Stock-based compensation | 23,091 | 2,364 | 318 | 25,773 | ||||||||||||
Capital expenditures | 20,588 | 2,770 | 5,985 | 29,343 | ||||||||||||
Year Ended August 31, 2010 | U.S. | Europe | Asia Pacific | Total | ||||||||||||
Revenues from clients | $ | 435,351 | $ | 161,649 | $ | 44,059 | $ | 641,059 | ||||||||
Segment operating profit | 124,976 | 72,239 | 24,419 | 221,634 | ||||||||||||
Total assets | 401,684 | 216,171 | 26,753 | 644,608 | ||||||||||||
Depreciation and amortization | 28,866 | 6,466 | 2,011 | 37,343 | ||||||||||||
Stock-based compensation | 12,471 | 1,424 | 170 | 14,065 | ||||||||||||
Capital expenditures | 13,890 | 684 | 6,194 | 20,768 | ||||||||||||
GEOGRAPHIC INFORMATION - The following table sets forth information for those countries that are 10% or more of revenues (in thousands).
Years Ended August 31, | 2012 | 2011 | 2010 | |||||||||
Revenues * | ||||||||||||
United States | $ | 550,474 | $ | 497,564 | $ | 435,351 | ||||||
United Kingdom | 114,435 | 104,698 | 94,749 | |||||||||
All other European countries | 82,969 | 73,995 | 66,900 | |||||||||
Asia Pacific | 57,915 | 50,253 | 44,059 | |||||||||
Total revenues | $ | 805,793 | $ | 726,510 | $ | 641,059 | ||||||
* Revenues are attributed to countries based on the location of the client.
The following table sets forth long-lived assets by geographic area (in thousands):
At August 31, | 2012 | 2011 | 2010 | |||||||||
Long-lived Assets ** | ||||||||||||
United States | $ | 60,288 | $ | 60,092 | $ | 62,275 | ||||||
United Kingdom | 5,466 | 6,863 | 7,457 | |||||||||
All other European countries | 2,951 | 4,075 | 2,283 | |||||||||
Philippines | 3,420 | 4,181 | 2,413 | |||||||||
India | 2,921 | 4,453 | 3,283 | |||||||||
All other Asia Pacific countries | 1,484 | 1,956 | 1,784 | |||||||||
Total long-lived assets | $ | 76,530 | $ | 81,620 | $ | 79,495 | ||||||
** Long-lived assets consist of property, equipment and leasehold improvements, net of accumulated depreciation and amortization and exclude goodwill, intangible assets, deferred taxes and other assets.
66
7. BUSINESS COMBINATIONS
StreetAccount
On June 29, 2012, FactSet acquired StreetAccount LLC ("SA") to complement the Company's news offering with distilled and crucial market moving information for buy-side and sell-side institutions. Founded in 2003, SA is known for its timely and informative news summaries and provides investment professionals with an efficient method for managing news flow. The SA service includes real-time company updates, portfolio and sector filtering, email alerts, and market summaries. Content is written by financial professionals and can be customized for portfolio, index, sector, market, time of day (i.e., Overnight Summaries), and category (i.e., Top Stories, Market Summaries, Economic, M&A). As of the date of acquisition, SA had annual subscriptions of $11.4 million and employed 49 individuals. The acquisition of SA did not have an impact on FactSet's fourth quarter diluted earnings per share.
As of August 31, 2012, SA does not have a significant international presence and FactSet believes it can leverage its international network to sell SA outside the U.S. as many of their current clients would like to see the SA news offering increase coverage in Europe and Asia. Additionally, the Company is now able to integrate proprietary content through this new channel by providing key corporate and economic data to the news team at StreetAccount for integration into their newswire. The opportunity for FactSet to grow by providing proprietary financial news to clients worldwide contributed to a purchase price in excess of fair value of the StreetAccount net tangible and intangible assets. As a result, FactSet recorded goodwill in connection with this transaction.
The total purchase price of the acquisition is as follows (in thousands):
Cash consideration | $ | 21,632 | ||
Fair value of FactSet stock issued | 3,974 | |||
Working capital | 753 | |||
Total purchase price | $ | 26,359 |
Allocation of the purchase price to the assets acquired and liabilities assumed has not been finalized for this acquisition. The purchase price is dependent on the final working capital adjustment to be finalized in the first quarter of fiscal 2013. The total purchase price was allocated to StreetAccount's net tangible and intangible assets based upon their estimated fair value as of the date of acquisition.
Based upon the purchase price and the valuation, the preliminary allocation is as follows (in thousands):
Tangible assets acquired | $ | 3,598 | ||
Amortizable intangible assets: | ||||
Client relationships | 2,822 | |||
Software technology | 2,332 | |||
Data content | 613 | |||
Non-compete agreements | 404 | |||
Trade name | 186 | |||
Goodwill | 21,991 | |||
Total assets acquired | 31,946 | |||
Liabilities assumed | (5,587 | ) | ||
Net assets acquired | $ | 26,359 |
Intangible assets of $6.4 million have been allocated to amortizable intangible assets consisting of client relationships, amortized over seven years using an accelerated amortization method; software technology, amortized over five years using a straight-line amortization method; data content, amortized over three years using a straight-line amortization method; non-compete agreements, amortized over four years using an accelerated amortization method; and trade name, amortized over two years using a straight-line amortization method.
Goodwill totaling $22.0 million represents the excess of the purchase price over the fair value of the net tangible and intangible assets acquired. Goodwill will not be amortized, but tested for impairment at least annually. Goodwill generated from the StreetAcount acquisition is included in the U.S. segment and is deductible for income tax purposes. The results of operations of StreetAccount have been included in the Company's Consolidated Statement of Income since the completion of the acquisition on June 29, 2012 and did not have a material impact on the fourth quarter fiscal 2012. Pro forma information has not been presented because the effect of this acquisition was not material on the Company's fiscal 2012 consolidated financial results.
67
Market Metrics
On June 1, 2010, FactSet acquired Market Metrics for a total purchase price of $57.7 million. Formed in 1996 and headquartered in Massachusetts, Market Metrics is the leading market research firm in the U.S. focused on advisor-sold investments and insurance products. Each year Market Metrics conducts more than 20,000 in-depth surveys of financial advisors, brokers, research analysts and gatekeepers. Leveraging this unique body of data, Market Metrics helps senior managers to understand better their competitive strengths and weaknesses, and how they can improve their relationships with customers and increase market share. As of the date of acquisition, Market Metrics had annual subscriptions of $16 million and employed 25 individuals.
Market Metrics represents a new, unique content set for FactSet. The analytical content Market Metrics creates is original and is in demand in this industry, but it is not available from any other source. The opportunity for FactSet to grow by providing this unique content to clients worldwide contributed to a purchase price in excess of fair value of the Market Metrics net tangible and intangible assets. As a result, FactSet recorded goodwill in connection with this transaction.
The total purchase price of the acquisition is as follows (in thousands):
Cash consideration | $ | 57,100 | ||
Working capital | 632 | |||
Total purchase price | $ | 57,732 |
Allocation of the purchase price to the assets acquired and liabilities assumed has been finalized for this acquisition. The total purchase price was allocated to Market Metrics' net tangible and intangible assets based upon their estimated fair value as of the date of acquisition.
Based upon the purchase price and the valuation, the allocation is as follows (in thousands):
Tangible assets acquired | $ | 4,587 | ||
Amortizable intangible assets: | ||||
Data content | 8,070 | |||
Client relationships | 6,990 | |||
Non-compete agreements | 1,750 | |||
Trade name | 380 | |||
Goodwill | 46,130 | |||
Total assets acquired | 67,907 | |||
Liabilities assumed | (10,175 | ) | ||
Net assets acquired | $ | 57,732 |
Intangible assets of $17.2 million was allocated to amortizable intangible assets consisting of data content, amortized over five years using a straight-line amortization method; client relationships, amortized over nine years using an accelerated amortization method; non-compete agreements, amortized over five years using a straight-line amortization method; and trade name, amortized over three years using a straight-line amortization method.
Goodwill totaling $46.1 million represents the excess of the purchase price over the fair value of the net tangible and intangible assets acquired. Goodwill will not be amortized and will be tested for impairment at least annually. Goodwill generated from the Market Metrics acquisition is included in the U.S. segment and is deductible for income tax purposes. The results of operations of Market Metrics have been included in the Company's Consolidated Statement of Income since the completion of the acquisition on June 1, 2010 and did not have a material impact on the fiscal 2010 fourth quarter. Pro forma information has not been presented because the effect of this acquisition was not material on the Company's consolidated financial results.
68
8. GOODWILL
Changes in the carrying amount of goodwill by segment for fiscal years ended August 31, 2012 and 2011 are as follows (in thousands):
U.S. | Europe | Asia Pacific | Total | |||||||||||||
Balance at August 31, 2010 | $ | 145,826 | $ | 72,278 | $ | 3,887 | $ | 221,991 | ||||||||
Goodwill acquired during the period | - | - | - | - | ||||||||||||
Foreign currency translations | - | 5,894 | 380 | 6,274 | ||||||||||||
Balance at August 31, 2011 | $ | 145,826 | $ | 78,172 | $ | 4,267 | $ | 228,265 | ||||||||
Goodwill acquired during the period | 21,991 | - | - | 21,991 | ||||||||||||
Foreign currency translations | - | (4,366 | ) | (99 | ) | (4,465 | ) | |||||||||
Balance at August 31, 2012 | $ | 167,817 | $ | 73,806 | $ | 4,168 | $ | 245,791 | ||||||||
During fiscal 2012, $22.0 million of goodwill was acquired as a result of the purchase of StreetAccount on June 29, 2012 for a total purchase price of $26.4 million. There was no goodwill acquired during fiscal 2011.
Goodwill is not amortized as it has an estimated infinite life. On an ongoing basis, the Company evaluates goodwill at the reporting unit level for indications of potential impairment. Goodwill is tested for impairment based on the present value of discounted cash flows, and, if impaired, written down to fair value based on discounted cash flows. The Company has three reporting units, which are consistent with the operating segments reported because there is no discrete financial information available for the subsidiaries within each operating segment. The Company's reporting units evaluated for potential impairment were U.S., Europe and Asia Pacific, which reflects the level of internal reporting the Company uses to manage its business and operations. The Company performed an annual goodwill impairment test during the fourth quarter of fiscal years 2012, 2011 and 2010, which determined that there were no reporting units that were deemed at risk. The fair value of each of the Company's reporting units significantly exceeded carrying value, thus there had been no impairment. The measurement period for purchase price allocations ends as soon as information on the facts and circumstances becomes available, but will not exceed 12 months.
9. INTANGIBLE ASSETS
FactSet's identifiable intangible assets consist of acquired content databases, client relationships, software technology, non-compete agreements and trade names resulting from previous acquisitions, which have been fully integrated into the Company's operations. The weighted average useful life of the Company's acquired intangible assets at August 31, 2012 was 11.6 years.
The Company amortizes intangible assets over their estimated useful lives. Amortizable intangible assets are tested for impairment based on undiscounted cash flows, and, if impaired, written down to fair value based on discounted cash flows. No impairment of intangible assets has been identified during any of the periods presented. The intangible assets have no assigned residual values.
The gross carrying amounts and accumulated amortization totals related to the Company's identifiable intangible assets are as follows (in thousands):
At August 31, 2012 | Gross Carrying Amount | Accumulated Amortization | Net Carrying Amount | |||||||||
Data content | $ | 49,120 | $ | 18,521 | $ | 30,599 | ||||||
Client relationships | 22,841 | 14,089 | 8,752 | |||||||||
Software technology | 20,892 | 18,482 | 2,410 | |||||||||
Non-compete agreements | 2,154 | 810 | 1,344 | |||||||||
Trade names | 758 | 492 | 266 | |||||||||
Total | $ | 95,765 | $ | 52,394 | $ | 43,371 | ||||||
At August 31, 2011 | Gross Carrying Amount | Accumulated Amortization | Net Carrying Amount | |||||||||
Data content | $ | 52,438 | $ | 16,849 | $ | 35,589 | ||||||
Client relationships | 21,088 | 12,782 | 8,306 | |||||||||
Software technology | 19,093 | 18,222 | 871 | |||||||||
Non-compete agreements | 1,750 | 437 | 1,313 | |||||||||
Trade names | 572 | 341 | 231 | |||||||||
Total | $ | 94,941 | $ | 48,631 | $ | 46,310 | ||||||
69
During fiscal 2012, $6.4 million of intangible assets were acquired with a weighted average useful life of 5.5 years as a result of the acquisition of StreetAccount on June 29, 2012.
Weighted Average Amortization Period (years) | Acquisition Cost | ||||
Client relationships | 7.0 | $ | 2,822 | ||
Software Technology | 5.0 | 2,332 | |||
Data content | 3.0 | 613 | |||
Non-compete agreements | 4.0 | 404 | |||
Trade name | 2.0 | 186 | |||
Total | 5.5 | $ | 6,357 | ||
There were no intangible assets acquired during fiscal 2011.
Amortization expense recorded for intangible assets during fiscal years 2012, 2011 and 2010 was $7.5 million, $8.4 million and $8.5 million, respectively. As of August 31, 2012, estimated intangible asset amortization expense for each of the next five years and thereafter are as follows (in thousands):
Fiscal Year | Estimated Amortization Expense | ||||
2013 | $ | 7,078 | |||
2014 | 5,974 | ||||
2015 | 5,050 | ||||
2016 | 3,404 | ||||
2017 | 3,269 | ||||
Thereafter | 18,596 | ||||
Total | $ | 43,371 | |||
10. PROPERTY, EQUIPMENT AND LEASEHOLD IMPROVEMENTS
Property, equipment and leasehold improvements consist of the following (in thousands):
At August 31, |
| 2012 | 2011 | |||
Leasehold improvements | $ | 88,327 | $ | 83,478 | ||
Computers and related equipment |
| 74,370 | 65,934 | |||
Furniture and fixtures |
| 26,849 | 24,578 | |||
Subtotal | $ | 189,546 | $ | 173,990 | ||
Less accumulated depreciation and amortization | (113,016) | (92,370) | ||||
Property, equipment and leasehold improvements, net | $ | 76,530 | $ | 81,620 | ||
Depreciation expense was $26.1 million, $27.9 million and $28.8 million for fiscal years 2012, 2011 and 2010, respectively.
11. COMMON STOCK AND EARNINGS PER SHARE
On May 8, 2012, FactSet's Board of Directors approved a 15% increase in the regular quarterly dividend, beginning with the Company's dividend payment in June 2012 of $0.31 per share, or $1.24 per share per annum.
Shares of common stock outstanding were as follows (in thousands):
Years Ended August 31, | 2012 | 2011 | 2010 | |||||||||
Balance, beginning of year | 45,055 | 46,024 | 46,740 | |||||||||
Common stock issued for employee stock plans | 825 | 1,283 | 2,068 | |||||||||
Stock issued for acquisition of business | 43 | 0 | 0 | |||||||||
Repurchase of common stock | (1,644 | ) | (2,252 | ) | (2,784 | ) | ||||||
Balance, end of year | 44,279 | 45,055 | 46,024 | |||||||||
70
A reconciliation of the weighted average shares outstanding used in the basic and diluted earnings per share computations is as follows (in thousands, except per share data):
Net Income (Numerator)
| Weighted Average Common Shares (Denominator)
| Per Share Amount
| ||||||||||||||||||||||||||||||||||
Years Ended August 31, | 2012 | 2011 | 2010 | 2012 | 2011 | 2010 | 2012 | 2011 | 2010 | |||||||||||||||||||||||||||
Basic EPS | ||||||||||||||||||||||||||||||||||||
Income available to common stockholders | $ | 188,809 | $ | 171,046 | $ | 150,211 | 44,784 | 45,953 | 46,698 | $ | 4.22 | $ | 3.72 | $ | 3.22 | |||||||||||||||||||||
Diluted EPS | ||||||||||||||||||||||||||||||||||||
Dilutive effect of stock options and restricted stock | 1,026 | 1,402 | 1,306 | |||||||||||||||||||||||||||||||||
Income available to common stockholders plus assumed conversions | $ | 188,809 | $ | 171,046 | $ | 150,211 | 45,810 | 47,355 | 48,004 | $ | 4.12 | $ | 3.61 | $ | 3.13 | |||||||||||||||||||||
Dilutive potential common shares consist of stock options and unvested restricted stock. There were 383,058 stock options excluded from the fiscal 2012 calculation of diluted earnings per share compared to 2,670 stock options excluded from the fiscal 2011 calculation because their inclusion would have been anti-dilutive. No stock options were excluded from the fiscal 2010 calculation of diluted earnings per share. There were 30,456 restricted stock awards excluded from the calculation of diluted earnings per share in fiscal 2012 as compared to 11,284 in fiscal 2011 and zero in fiscal 2010.
As of August 31, 2012, 2011 and 2010, 1,710,017, 1,672,975 and 1,692,743, respectively, performance-based stock option grants were excluded from the calculation of diluted earnings per share . Performance-based stock options are omitted from the calculation of diluted earnings per share until the performance criteria have been met.
12. STOCKHOLDERS' EQUITY
Preferred Stock
At August 31, 2012 and 2011, there were 10,000,000 shares of preferred stock ($.01 par value per share) authorized, of which no shares were issued and outstanding. FactSet's Board of Directors may from time to time authorize the issuance of one or more series of preferred stock and, in connection with the creation of such series, determine the characteristics of each such series including, without limitation, the preference and relative, participating, optional or other special rights, and the qualifications, limitations or restrictions of the series.
Common Stock
At the fiscal 2011 Annual Meeting of Stockholders (the "Meeting") of FactSet held on December 13, 2011, the stockholders of FactSet voted on and approved an amendment to the Company's Restated Certificate of Incorporation to increase the number of authorized shares of common stock, par value $0.01, of FactSet from 100,000,000 to 150,000,000 shares. Such amendment to FactSet's Restated Certificate of Incorporation had previously been approved on October 24, 2011, by the Company's Board of Directors. On December 16, 2011, a Certificate of Amendment was filed with the Secretary of State of Delaware to effect, as of such date, the foregoing amendment of the Company's Restated Certificate of Incorporation. The newly authorized shares of common stock are issuable for any proper corporate purpose, including future stock splits, stock dividends, acquisitions, raising equity capital or to adopt additional employee benefit plans. These additional shares provide the Company the flexibility to issue shares for future corporate needs without potential expense or delay incident to obtaining stockholder approval for any particular issuance.
Treasury Stock
On December 31, 2011, FactSet retired 16,658,741 shares of treasury stock. These retired shares are now included in the Company's pool of authorized but unissued shares. The retired treasury stock was initially recorded using the cost method and had a carrying value of $850.9 million at December 31, 2011. The Company's accounting policy upon the formal retirement of treasury stock is to deduct its par value from common stock ($0.2 million), reduce APIC by the amount recorded in APIC when the stock was originally issued ($361.4 million) and any remaining excess of cost as a deduction from retained earnings ($489.3 million).
71
Share Repurchase Program
On May 8, 2012, the Company's Board of Directors approved a $200 million expansion to the existing share repurchase program. During fiscal 2012, the Company repurchased 1.6 million shares for $153 million under the existing share repurchase program leaving $190 million authorized for future share repurchases at August 31, 2012. Repurchases will be made from time to time in the open market and privately negotiated transactions, subject to market conditions. No minimum number of shares to be repurchased has been fixed. There is no timeframe to complete the repurchase program and it is expected that share repurchases will be paid using existing and future cash generated by operations.
During fiscal 2011, the Company repurchased 2.3 million shares for $217 million under the share repurchase program, leaving $142 million authorized for future share repurchases at August 31, 2011.
Restricted Stock
Restricted stock awards entitle the holder to shares of common stock as the awards vest over time. During fiscal 2012, FactSet did not grant restricted stock awards as compared to 154,281 granted during fiscal 2011. Approximately 14,258 of the previously granted restricted stock awards vested during fiscal 2012 and are included in the common stock outstanding as of August 31, 2012.
Dividends
The Company's Board of Directors declared the following dividends during the periods presented:
Declaration Date |
| Dividends Per Share of Common Stock |
| Type | Record Date |
| Total $ Amount (in thousands) |
| Payment Date | ||
August 8, 2012 | $ | 0.31 | Regular (cash) | August 31, 2012 | $ | 13,727 | September 18, 2012 | ||||
May 8, 2012 | $ | 0.31 | Regular (cash) | May 31, 2012 | $ | 13,893 | June 19, 2012 | ||||
February 14, 2012 |
| $ | 0.27 |
| Regular (cash) | February 29, 2012 |
| $ | 12,085 |
| March 20, 2012 |
November 10, 2011 |
| $ | 0.27 |
| Regular (cash) | November 30, 2011 |
| $ | 12,181 |
| December 20, 2011 |
August 11, 2011 |
| $ | 0.27 |
| Regular (cash) | August, 31 2011 |
| $ | 12,165 |
| September 20, 2011 |
May 9, 2011 |
| $ | 0.27 |
| Regular (cash) | May 31, 2011 |
| $ | 12,374 |
| June 21, 2011 |
February 9, 2011 |
| $ | 0.23 |
| Regular (cash) | February 28, 2011 |
| $ | 10,612 |
| March 15, 2011 |
November 10, 2010 |
| $ | 0.23 |
| Regular (cash) | November 30, 2010 |
| $ | 10,660 |
| December 21, 2010 |
August 10, 2010 |
| $ | 0.23 |
| Regular (cash) | August, 31 2010 |
| $ | 10,586 |
| September 21, 2010 |
May 14, 2010 |
| $ | 0.23 |
| Regular (cash) | May 28, 2010 |
| $ | 10,655 |
| June 15, 2010 |
February 9, 2010 |
| $ | 0.20 |
| Regular (cash) | February 26, 2010 |
| $ | 9,329 |
| March 16, 2010 |
November 10, 2009 |
| $ | 0.20 |
| Regular (cash) | November 30, 2009 |
| $ | 9,423 |
| December 15, 2009 |
All of the above cash dividends were paid from existing cash resources. Future dividend payments will depend on the Company's earnings, capital requirements, financial condition and other factors considered relevant by the Company and is subject to final determination by the Company's Board of Directors.
13. COMPREHENSIVE INCOME
Comprehensive Income
The components of comprehensive income were as follows for the periods presented (in thousands):
At August 31, | 2012 | 2011 | 2010 | |||||||||
Net income | $ | 188,809 | $ | 171,046 | $ | 150,211 | ||||||
Other comprehensive income, net of tax: | ||||||||||||
Net unrealized (loss) gain on cash flow hedges | (2,141 | ) | 828 | (1,089 | ) | |||||||
Foreign currency translation adjustments | (14,925 | ) | 14,897 | (10,073 | ) | |||||||
Comprehensive income | $ | 171,743 | $ | 186,771 | $ | 139,049 | ||||||
Accumulated Other Comprehensive Loss
The components of accumulated other comprehensive loss are as follows (in thousands):
At August 31, | 2012 | 2011 | 2010 | |||||||||
Accumulated unrealized (loss) gain on cash flow hedges, net of tax | $ | (1,551 | ) | $ | 590 | $ | (238 | ) | ||||
Accumulated foreign currency translation adjustments | (21,175 | ) | (6,250 | ) | (21,147 | ) | ||||||
Total accumulated other comprehensive loss | $ | (22,726 | ) | $ | (5,660 | ) | $ | (21,385 | ) | |||
72
14. EMPLOYEE STOCK OPTION AND RETIREMENT PLANS
Stock Option Plans
Stock Option Awards
Options granted without performance conditions under the Company's stock option plans expire either seven or ten years from the date of grant and the majority vest at a rate of 20% after the first year and 1.67% per month thereafter for years two through five. Options become vested and exercisable provided the employee continues employment with the Company through the applicable vesting date and remain exercisable until expiration or cancellation. The majority of the options granted with performance conditions expire either seven or ten years from the date of grant and vest at a rate of 40% after the first two years and 1.67% per month thereafter for years three through five. Options are not transferable or assignable other than by will or the laws of descent and distribution. During the grantee's lifetime, they may be exercised only by the grantee.
In fiscal years 2012, 2011 and 2010, stock options to purchase 1,468,513; 998,038; and 2,069,336 shares of common stock, respectively, at prices which ranged from $63.09 to $103.30 were granted to employees and non-employee directors of the Company.
Stock Options Outstanding and Exercisable
The following table summarizes the number of options outstanding and exercisable during fiscal 2012, 2011 and 2010, respectively (in thousands, except per share data):
| 2012 |
| 2011 |
| 2010 | ||||||||||
At August 31, | Number of Shares | Weighted Average Exercise Price Per Share |
| Number of Shares | Weighted Average Exercise Price Per Share |
| Number of Shares | Weighted Average Exercise Price Per Share | ||||||
Outstanding at fiscal year end | 6,083 | $ | 64.76 |
| 6,132 | $ | 57.28 |
| 6,451 | $ 47.73 | ||||
Exercisable at fiscal year end | 2,858 | $ | 48.44 |
| 2,643 | $ | 38.99 |
| 3,331 | $ 34.49 | ||||
The following table summarizes ranges of outstanding and exercisable options as of August 31, 2012 (in thousands, except per share data):
Outstanding | Exercisable | |||||||||||||||||||||||||||||||
Range of Exercise Prices Per Share | Number Outstanding | Weighted Average Remaining Years of Contractual Life | Weighted Average Exercise Price Per Share | Aggregate Intrinsic Value | Number Exercisable | Weighted Average Exercise Price Per Share | Aggregate Intrinsic Value | |||||||||||||||||||||||||
| $ | 14.97 | – | $39.99 | 1,048 | 2.08 | $ | 28.47 | $ | 66,865 | 977 | $ | 27.94 | $ | 62,882 | ||||||||||||||||||
| $ | 40.00 | – | $59.99 | 936 | 1.52 | $ | 49.56 | $ | 39,985 | 910 | $ | 49.72 | $ | 38,719 | ||||||||||||||||||
| $ | 60.00 | – | $66.46 | 1,585 | 3.77 | $ | 65.55 | $ | 42,347 | 799 | $ | 66.03 | $ | 20,952 | ||||||||||||||||||
| $ | 66.47 | – | $89.99 | 994 | 4.81 | $ | 71.12 | $ | 21,033 | 157 | $ | 74.30 | $ | 2,816 | ||||||||||||||||||
| $ | 90.00 | – | $103.30 | 1,520 | 9.24 | $ | 94.17 | $ | (2,887 | ) | 15 | $ | 98.88 | $ | (102 | ) | ||||||||||||||||
| 6,083 | 4.67 | $ | 64.76 | $ | 167,343 | 2,858 | $ | 48.44 | $ | 125,267 | ||||||||||||||||||||||
The total number of in-the-money options exercisable as of August 31, 2012 was 2.8 million with a weighted average exercise price of $48.17. As of August 31, 2011, 2.6 million in-the-money outstanding options were exercisable with a weighted average exercise price of $38.99. The aggregate intrinsic value of in-the-money stock options exercisable at August 31, 2012 and 2011 was $125.4 million and $129.3 million, respectively. Aggregate intrinsic value represents the difference between the Company's closing stock price of $92.27 at August 31, 2012 and the exercise price multiplied by the number of options exercisable as of that date. The total pre-tax intrinsic value of stock options exercised during fiscal 2012, 2011 and 2010 was $43.0 million, $71.3 million, and $83.5 million, respectively.
73
Stock Option Activity
A summary of stock option activity is as follows (in thousands, except per share data):
Number Outstanding | Weighted Average Exercise Price Per Share | |||||||
Balance at August 31, 2009 | 7,553 | $ | 39.51 | |||||
Granted – non performance-based | 329 | 63.42 | ||||||
Granted – performance-based | 1,721 | 66.91 | ||||||
Granted – non-employee Directors grant | 19 | 66.81 | ||||||
Exercised | (1,980 | ) | 25.77 | |||||
Forfeited* | (1,191 | ) | 64.47 | |||||
Balance at August 31, 2010 | 6,451 | $ | 47.73 | |||||
Granted – non performance-based | 91 | 89.45 | ||||||
Granted – performance-based | 892 | 89.39 | ||||||
Granted – non-employee Directors grant | 15 | 95.05 | ||||||
Exercised | (1,209 | ) | 32.08 | |||||
Forfeited | (108 | ) | 66.55 | |||||
Balance at August 31, 2011 | 6,132 | $ | 57.28 | |||||
Granted – non performance-based | 540 | 93.96 | ||||||
Granted – performance-based | 907 | 93.80 | ||||||
Granted – non-employee Directors grant | 21 | 87.26 | ||||||
Exercised | (731 | ) | 35.96 | |||||
Forfeited** | (786 | ) | 87.37 | |||||
Balance at August 31, 2012 | 6,083 | $ | 64.76 | |||||
* In August 2008, the Company granted 1,058,981 performance-based employee stock options. None of these performance-based stock options granted vested because FactSet did not achieve certain performance levels for both organic ASV and diluted earnings per share during the two fiscal years ended August 31, 2010. As such, these performance-based stock options were recorded as forfeitures in August 2010.
** In November 2010, the Company granted 734,334 performance-based employee stock options. None of these performance-based stock options granted vested because FactSet did not achieve certain performance levels for both organic ASV and diluted earnings per share during the two fiscal years ended August 31, 2012. As such, these performance-based stock options were recorded as forfeitures in August 2012.
Performance-based Stock Options
Performance-based stock options require management to make assumptions regarding the likelihood of achieving Company performance targets. The number of performance-based options that vest will be predicated on the Company achieving performance levels for both organic ASV and diluted earnings per share during the two fiscal years subsequent to the date of grant. Dependent on the financial performance levels attained by FactSet during the two subsequent fiscal years, 0%, 20%, 60% or 100% of the performance-based stock options will vest to the grantees of those stock options. However, there is no current guarantee that such options will vest in whole or in part.
October 2009 Annual Employee Performance-based Option Grant Review
In October 2009, FactSet granted 900,665 performance-based employee stock options. 100% of these options are expected to vest because FactSet achieved organic ASV and diluted earnings per share growth of more than 10% on a compounded annual basis for the two years ended August 31, 2011. This reflected a higher performance level than previously estimated and accordingly increased the number of options that will vest, which required FactSet to record an incremental $5.8 million (pre-tax) of stock-based compensation during fiscal 2011. The $5.8 million of additional stock-based compensation represented the cumulative adjustment to change the vesting percentage from 60% to 100% as of August 31, 2012.
November 2010 Annual Employee Performance-based Option Grant Review
In November 2010, the Company granted 734,334 performance-based employee stock options. None of these options granted vested because FactSet did not achieve certain performance levels for both organic ASV and diluted earnings per share during the two fiscal years ended August 31, 2012. This reflected a lower performance level than previously estimated and accordingly decreased the number of options that will vest to zero, which required the Company to reverse $1.4 million of stock-based compensation during fiscal 2012. These performance-based options were recorded as forfeitures in fiscal 2012.
74
November 2011 Annual Employee Performance-based Option Grant Review
In November 2011, FactSet granted 665,551 performance-based employee stock options. The number of performance-based options that vest is based on the Company achieving performance levels for both organic ASV and diluted earnings per share during the two fiscal years ended August 31, 2013. At August 31 2012, the Company believed that it was not probable FactSet would achieve the required ASV and diluted earnings per share growth as ASV growth rate decelerated to 7%. As such, the Company estimated that none (0%) of the performance-based stock options will vest. However, a change in the actual financial performance levels achieved over the next 12 months could result in the following changes to the Company's current estimate of the vesting percentage and related expense (in thousands):
Vesting Percentage | Total Unamortized Stock-based Compensation Expense at August 31, 2012 | Cumulative Catch-up Adjustment* | Average Remaining Quarterly Expense to be Recognized | ||||||||||
| 0% | $ | 0 | $ | 0 | $ | 0 | |||||||
| 20% | $ | 2,726 | $ | 914 | $ | 164 | |||||||
| 60% | $ | 8,178 | $ | 2,742 | $ | 492 | |||||||
| 100% | $ | 13,630 | $ | 4,570 | $ | 820 | |||||||
* Amounts represent the cumulative catch-up adjustment to be recorded if there had been a change in the vesting percentage as of August 31, 2012.
July 2012 Performance-based Option Grant Review
In July 2012, FactSet granted 241,546 performance-based employee stock options. The number of performance-based options that vest is dependent upon future StreetAccount user growth through August 31, 2017. The five year performance measurement period is based on growing usage of FactSet and StreetAccount. At August 31 2012, FactSet estimated that 20% or 48,309 of the performance-based stock options will vest based on forecasted StreetAccount user growth, which results in unamortized stock-based compensation expense of $1.5 million to be recognized over the remaining vesting period of approximately 3.0 years. A change in the actual financial performance levels achieved by the Company due to unforeseen significant StreetAccount growth in future fiscal years could result in the following changes to the current estimate of the vesting percentage and related expense (in thousands):
Vesting Percentage | Cumulative Catch-up Adjustment* | Remaining Expense to be Recognized | |||||||
| 0% | $ | (84 | ) | $ | 0 | ||||
| 20% | $ | 0 | $ | 1,516 | |||||
| 40% | $ | 136 | $ | 3,064 | |||||
| 60% | $ | 200 | $ | 4,600 | |||||
| 80% | $ | 257 | $ | 6,143 | |||||
| 100% | $ | 330 | $ | 7,670 | |||||
* Amounts represent the cumulative catch-up adjustment to be recorded if there was a change in the vesting percentage as of August 31, 2012.
Other Performance-based Stock Options Granted
| · | Between June 2010 and July 2011, FactSet granted 746,415 performance-based employee stock options that vest based on FactSet achieving certain ASV targets. At August 31, 2012, the Company estimated that none (0%) of these performance-based stock options will vest. A change in the actual financial performance levels achieved by FactSet due to unforeseen significant ASV growth in future fiscal years could result in the following changes to the current estimate of the vesting percentage and related expense (in thousands): |
Vesting Percentage | Cumulative Catch-up Adjustment* | Remaining Expense to be Recognized | |||||||
| 0% | $ | 0 | $ | 0 | |||||
| 50% | $ | 3,380 | $ | 4,370 | |||||
| 100% | $ | 8,474 | $ | 7,026 | |||||
* Amounts represent the cumulative catch-up adjustment to be recorded if there was a change in the vesting percentage as of August 31, 2012.
| · | FactSet granted 204,508 performance-based employee stock options between June 2010 and July 2011 that vest based on achieving certain ASV targets. Of this total, 133,958 vested during fiscal 2012 because FactSet achieved certain ASV levels. At August 31, 2012, the Company estimated that the remaining performance-based stock options will vest based on forecasted ASV growth, resulting in unamortized stock-based compensation expense of $0.5 million to be recognized. |
75
Restricted Stock and Stock Unit Awards
The Company's option plans permit the issuance of restricted stock and restricted stock units. Restricted stock awards are subject to continued employment over a specified period. A summary of restricted stock award activity is as follows (in thousands, except per award data):
Number Outstanding | Weighted Average Grant Date Fair Value Per Award | |||||||
Balance at August 31, 2010 | 261 | $ | 61.65 | |||||
Granted (restricted stock and stock units) | 154 | $ | 87.55 | |||||
Vested | - | $ | - | |||||
Canceled/forfeited | (8 | ) | $ | 69.41 | ||||
Balance at August 31, 2011 | 407 | $ | 71.31 | |||||
Granted (restricted stock and stock units) | - | $ | - | |||||
Vested* | (14 | ) | $ | 69.02 | ||||
Canceled/forfeited | (10 | ) | $ | 77.13 | ||||
Balance at August 31, 2012 | 383 | $ | 71.34 | |||||
* Between June 2010 and July 2011, FactSet granted 21,102 restricted stock units which entitled the holder to shares of common stock as the awards vest. A restricted stock unit is a promise to deliver shares to the employee at a future date if certain vesting conditions are met. These restricted stock units are performance-based and cliff vest 25% when certain ASV targets are met. Of the total 21,102 units granted, 14,258 units vested during the fourth quarter of fiscal 2012 because FactSet achieved three of the four ASV growth targets. As of August 31, 2012, the Company estimated that the remaining 25% will vest based on forecasted ASV growth, resulting in unamortized stock-based compensation expense of $0.1 million.
During fiscal 2012, there were no restricted stock awards and restricted stock units granted. During fiscal 2011, there were 154,281 restricted stock awards and restricted stock units granted as summarized below.
November 2010 Employee Restricted Stock Award
In November 2010, the Company granted 117,723 restricted stock awards which entitle the holder to shares of common stock as the awards vest over time. The Company's restricted stock awards cliff vest 60% after three years and the remaining 40% after five years. Restricted stock grants are amortized to expense over the vesting period using the straight-line attribution method. Employees granted restricted stock awards in November 2010 are not entitled to dividends declared on the underlying shares while the restricted stock is unvested. As such, the grant date fair value of the award was measured by reducing the grant date price of FactSet's share by the present value of the dividends expected to be paid on the underlying shares during the requisite service period, discounted at the appropriate risk-free interest rate. The resulting fair value of the restricted stock awards granted in November 2010 was $84.38. As of August 31, 2012, unamortized stock-based compensation expense of $5.2 million is to be amortized to compensation expense over the remaining vesting period of 3.2 years.
January 2011 Employee Restricted Stock Award
In January 2011, the Company granted 366 restricted stock awards with a fair value of $95.24, which entitle the holder to shares of common stock as the awards vest over time. The Company's restricted stock awards cliff vest 60% after three years and the remaining 40% after five years. Restricted stock grants are amortized to expense over the vesting period using the straight-line attribution method and are not entitled to dividends declared on the underlying shares while the restricted stock is unvested. As of August 31, 2012, unamortized stock-based compensation expense of less than $0.1 million is to be amortized ratably to compensation expense over the remaining vesting period of 3.4 years.
April 2011 Employee Restricted Stock Award
In April 2011, the Company granted 30,090 restricted stock awards with a fair value of $99.75, which entitle the holder to shares of common stock as the awards vest over time. The Company's restricted stock awards cliff vest 100% after three years. Restricted stock grants are amortized to expense over the vesting period using the straight-line attribution method and are not entitled to dividends declared on the underlying shares while the restricted stock is unvested. As of August 31, 2012, unamortized stock-based compensation expense of $1.6 million is to be amortized to compensation expense over the remaining vesting period of 1.6 years.
76
Share-based Awards Available for Grant
A summary of share-based awards available for grant is as follows (in thousands):
Share-based Awards Available for Grant under Employee Stock Option Plans | Share-based Awards Available for Grant under Non-Employee Stock Option Plans | |||||||
Balance at August 31, 2009 | 4,124 | 181 | ||||||
Granted – non performance-based options | (329 | ) | - | |||||
Granted – performance-based options | (1,721 | ) | - | |||||
Granted – non-employee Directors grant | - | (19 | ) | |||||
Restricted stock awards granted* | (667 | ) | - | |||||
Share-based awards canceled/forfeited | 1,204 | - | ||||||
Share-based awards expired** | (395 | ) | - | |||||
Balance at August 31, 2010 | 2,216 | 162 | ||||||
Amendment to the 2004 Stock Option and Award Plan to increase the number of shares available for issuance*** | 4,000 | - | ||||||
Granted – non performance-based options | (91 | ) | - | |||||
Granted – performance-based options | (892 | ) | - | |||||
Granted – non-employee Directors grant | - | (15 | ) | |||||
Restricted stock awards granted* | (386 | ) | - | |||||
Share-based awards canceled/forfeited | 130 | - | ||||||
Balance at August 31, 2011 | 4,977 | 147 | ||||||
Granted – non performance-based options | (540 | ) | - | |||||
Granted – performance-based options | (907 | ) | - | |||||
Granted – non-employee Directors grant | - | (21 | ) | |||||
Restricted stock awards granted* | - | - | ||||||
Share-based awards canceled/forfeited | 810 | - | ||||||
Balance at August 31, 2012 | 4,340 | 126 | ||||||
* For each share awarded as restricted stock under the Company's Option Plans, an equivalent of 2.5 shares were deducted from the available share-based awards balance.
** Represents the remaining stock options available for grant within the Company's 2000 Stock Option plan that expired in January 2010 because they were never granted.
*** As of November 30, 2010, 1.0 million shares remained available for future grant of share-based awards under the Company's 2004 Stock Option and Award Plan, a number that the Company believed to be insufficient to meet its anticipated needs over the next 12 to 18 months. Therefore, the Company's Board of Directors approved, subject to stockholder approval, an amendment to increase the maximum number of shares of FactSet common stock issuable under the 2004 Stock Option and Award Plan by 4,000,000 shares. The stockholders of FactSet voted on and approved the Amended and Restated FactSet Research Systems Inc. 2004 Stock Option and Award Plan at the Company's annual meeting held on December 14, 2010, including the reservation of an additional 4,000,000 shares of common stock for issuance.
Employee Stock Purchase Plan
On December 16, 2008, the Company's stockholders ratified the adoption of the FactSet Research Systems Inc. 2008 Employee Stock Purchase Plan (the "Purchase Plan"). A total of 500,000 shares have been reserved for issuance under the Purchase Plan. There is no expiration date for the Purchase Plan. Shares of FactSet common stock may be purchased by eligible employees under the Purchase Plan in three-month intervals at a purchase price equal to at least 85% of the lesser of the fair market value of the Company's common stock on either the first day or the last day of each three-month offering period. Employee purchases may not exceed 10% of their gross compensation during an offering period.
During fiscal 2012, employees purchased 85,487 shares at a weighted average price of $75.20 as compared to 75,718 shares at a weighted average price of $75.36 in fiscal 2011 and 91,429 shares at a weighted average price of $53.84 in fiscal 2010. At August 31, 2012, 195,051 shares were reserved for future issuance under the Purchase Plan.
77
401(k) Plan
The Company established a 401(k) Plan (the "401(k) Plan") in fiscal 1993. The 401(k) Plan is a defined contribution plan covering all full-time, U.S. employees of the Company and is subject to the provisions of the Employee Retirement Income Security Act of 1974 and the Internal Revenue Code of 1986. Each year, participants may contribute up to 60% of their eligible annual compensation, subject to annual limitations established by the Internal Revenue Code. The Company matches up to 4% of employees' earnings, capped at the IRS annual maximum. Company matching contributions are subject to a five year graduated vesting schedule. All full-time, U.S. employees are eligible for the matching contribution by the Company. The Company contributed $6.7 million, $5.9 million, and $5.5 million in matching contributions to employee 401(k) accounts during fiscal 2012, 2011 and 2010, respectively.
15. STOCK-BASED COMPENSATION
Accounting guidance requires the measurement and recognition of compensation expense for all share-based payment awards made to employees and directors including stock options, restricted stock and common shares acquired under employee stock purchases based on estimated fair values of the share awards that are scheduled to vest during the period. As stock-based compensation expense recognized is based on awards ultimately expected to vest, it has been reduced for estimated forfeitures. Forfeitures are estimated at the time of grant and revised, if necessary, in subsequent periods if actual forfeitures differ from those estimates. Forfeitures were estimated based on historical experience.
The Company recognized total stock-based compensation expense of $22.0 million, $25.8 million, and $14.1 million in fiscal 2012, 2011, and 2010, respectively. Included in fiscal 2011 was a pre-tax stock-based compensation charge of $7.9 million from an increase in the estimated number of performance-based options that will vest due to accelerating levels of ASV and diluted EPS than previously expected. The revised estimate reflects a higher performance level than previously estimated and accordingly, increased the number of performance-based options that will vest and be expensed.
As of August 31, 2012, $39.2 million of total unrecognized compensation expense related to non-vested awards is expected to be recognized over a weighted average period of 3.1 years. There was no stock-based compensation capitalized as of August 31, 2012 and 2011, respectively.
Employee Stock Option Fair Value Determinations
The Company utilizes the lattice-binomial option-pricing model ("binomial model") to estimate the fair value of new employee stock option grants. The Company's determination of fair value of stock option awards on the date of grant using the binomial model is affected by the Company's stock price as well as assumptions regarding a number of variables. These variables include, but are not limited to the Company's expected stock price volatility over the term of the awards, interest rates, option forfeitures and employee stock option exercise behaviors.
Fiscal 2012
| · | Q1 2012 – 419,593 non performance-based employee stock options and 665,551 performance-based employee stock options were granted at a weighted average exercise price of $94.84 and a weighted average estimated fair value of $32.08 per share. |
| · | Q2 2012 – There were no employee stock options granted during the second quarter. |
| · | Q3 2012 – There were no employee stock options granted during the third quarter. |
| · | Q4 2012 – 120,847 non performance-based employee stock options and 241,546 performance-based employee stock options were granted at a weighted average exercise price of $90.92 and fair value of $33.11 per share. |
Fiscal 2011
| · | Q1 2011 – 84,811 non performance-based employee stock options and 809,239 performance-based employee stock options were granted at a weighted average exercise price of $88.40 and fair value of $24.42 per share. |
| · | Q2 2011 – 65,224 performance-based employee stock options were granted at a weighted average exercise price of $99.78 and fair value of $29.07 per share. |
| · | Q3 2011 – 6,408 non performance-based employee stock options were granted at a weighted average exercise price of $103.30 and fair value of $23.41 per share. |
| · | Q4 2011 – 17,842 performance-based employee stock options were granted at a weighted average exercise price of $96.10 and a weighted average estimated fair value of $28.02 per share. |
78
Fiscal 2010
| · | Q1 2010 – 32,476 non performance-based employee stock options and 900,665 performance-based employee stock options were granted at a weighted average exercise price of $66.46 and fair value of $19.99 per share. |
| · | Q2 2010 – 297,483 non performance-based employee stock options were granted at a weighted average exercise price of $63.09 and fair value of $21.01 per share. |
| · | Q3 2010 – there were no stock options granted during the third quarter. |
| · | Q4 2010 – 820,202 performance-based employee stock options were granted at a weighted average exercise price of $67.41 and fair value of $20.19 per share. |
The weighted average estimated fair value of employee stock options granted during fiscal 2012, 2011 and 2010 was determined using the binomial model with the following weighted average assumptions:
2012 | 2011 | 2010 | ||||||||||||||||
Term structure of risk-free interest rate | 0.13% | - | 2.41 % | 0.18% | - | 1.88 % | 0.15% | - | 3.30 % | |||||||||
Expected life (years) | 7.6 | - | 9.1 | 4.0 | - | 6.5 | 4.0 | - | 6.7 | |||||||||
Term structure of volatility | 29% | - | 36 % | 23% | - | 35 % | 27% | - | 36 % | |||||||||
Dividend yield | 1.16% | 1.25% | 1.51% | |||||||||||||||
Weighted average estimated fair value | $32.34 | $24.78 | $20.22 | |||||||||||||||
Weighted average exercise price | $93.86 | $89.39 | $66.35 | |||||||||||||||
Fair value as a percentage of exercise price | 34.5% | 27.7% | 30.5% | |||||||||||||||
The risk-free interest rate assumption for periods within the contractual life of the option is based on the U.S. Treasury yield curve in effect at the time of grant. Expected volatility is based on a combination of historical volatility of the Company's stock and implied volatilities of publicly traded options to buy FactSet common stock with contractual terms closest to the expected life of options granted to employees. The approach to utilize a mix of historical and implied volatility was based upon the availability of actively traded options on the Company's stock and the Company's assessment that a combination of implied volatility and historical volatility is best representative of future stock price trends. The Company uses historical data to estimate option exercises and employee termination within the valuation model. The dividend yield assumption is based on the Company's history and expectation of dividend payouts. The expected life of employee stock options represents the weighted average period the stock options are expected to remain outstanding and is a derived output of the binomial model. The binomial model estimates employees exercise behavior is based on the option's remaining vested life and the extent to which the option is in-the-money. The binomial model estimates the probability of exercise as a function of these two variables based on the entire history of exercises and cancellations of all past option grants made by the Company.
Non-Employee Director Stock Option Grants
The 2008 Non-Employee Directors' Stock Option Plan (the "Directors' Plan") was ratified by the Company's stockholders on December 16, 2008 and provides for the grant of share-based awards, including stock options, to non-employee directors of FactSet. A total of 250,000 shares of FactSet common stock have been reserved for issuance under the Directors' Plan. The expiration date of the Directors' Plan is December 1, 2018. The shares of common stock to be issued may be either authorized and unissued shares or shares held by the Company in its treasury. The Directors' Plan provides for annual equity grants for each non-employee director and allows the Company greater flexibility to change the vesting schedule per option grant, modify the number of options granted on an annual basis and adjust the term of the grants.
The Company utilizes the Black-Scholes model to estimate the fair value of new non-employee Director stock option grants. The Company's determination of fair value of share-based payment awards on the date of grant is affected by the Company's stock price as well as assumptions regarding a number of variables. These variables include, but are not limited to the Company's expected stock price volatility over the term of the awards, interest rates, option forfeitures and employee stock option exercise behaviors.
Fiscal 2012
Risk-free interest rate | 0.94 | % | ||
Expected life (years) | 5.43 | |||
Expected volatility | 33.6 | % | ||
Dividend yield | 1.11 | % |
79
Fiscal 2011
On January 14, 2011, 14,514 stock options were granted to the Company's non-employee Directors with a weighted average estimated fair value of $26.87 per share, using the Black-Scholes option-pricing model with the following weighted average assumptions:
Risk-free interest rate | 2.13 | % | ||
Expected life (years) | 5.43 | |||
Expected volatility | 31.1 | % | ||
Dividend yield | 1.18 | % |
Fiscal 2010
On January 15, 2010, 18,510 stock options were granted to the Company's non-employee Directors with a weighted average estimated fair value of $21.06 per share, using the Black-Scholes option-pricing model with the following weighted average assumptions:
Risk-free interest rate | 2.54 | % | ||
Expected life (years) | 5.43 | |||
Expected volatility | 35.4 | % | ||
Dividend yield | 1.42 | % |
The risk-free interest rate assumption for periods within the contractual life of the option is based on the U.S. Treasury yield curve in effect at the time of grant. Expected volatility is based on the historical volatility of the Company's stock. The Company uses historical data to estimate option exercises and non-employee director terminations within the valuation model. The dividend yield assumption is based on the Company's history and expectation of dividend payouts.
Restricted Stock Fair Value Determinations
Restricted stock granted to employees entitle the holder to shares of common stock as the award vests over time, but not to dividends declared on the underlying shares while the restricted stock is unvested. The grant date fair value of restricted stock awards are measured by reducing the grant date price of FactSet's share by the present value of the dividends expected to be paid on the underlying stock during the requisite service period, discounted at the appropriate risk-free interest rate. Restricted stock awards are amortized to expense over the vesting period.
Fiscal 2012
| · | There were no restricted stocks awards granted during fiscal 2012. |
Fiscal 2011
| · | 117,723 shares of restricted stock with a fair value of $84.38 were granted on November 8, 2010. |
| · | 366 shares of restricted stock with a fair value of $95.24 were granted on January 27, 2011. |
| · | 3,291 restricted stock units with a fair value of $83.49 were granted on November 8, 2010. |
| · | 1,719 restricted stock units with a fair value of $94.50 were granted on January 27, 2011. |
| · | 30,090 shares of restricted stock with a fair value of $99.75 were granted on April 14, 2011. |
| · | 1,092 restricted stock units with a fair value of $91.54 were granted on July 22, 2011. |
Fiscal 2010
| · | 161,794 shares of restricted stock with a fair value of $62.85 were granted on October 23, 2009. |
| · | 90,030 shares of restricted stock with a fair value of $59.42 were granted on February 9, 2010. Of the total number of restricted stock awards granted, 55,572 cliff vest 100% after three years. The remaining 34,458 restricted stock awards cliff vest 50% after four years and the other 50% after six years. |
| · | 15,000 restricted stock units with a fair value of $62.49 were granted on June 1, 2010. |
Employee Stock Purchase Plan Fair Value Determinations
During fiscal 2012, employees purchased 85,487 shares at a weighted average price of $75.20 as compared to 75,718 shares at a weighted average price of $75.36 in fiscal 2011 and 91,429 shares at a weighted average price of $53.84 in fiscal 2010. At August 31, 2012, 195,051 shares were reserved for future issuance under the Purchase Plan. Stock-based compensation expense recorded during fiscal 2012, 2011, and 2010 relating to the employee stock purchase plan was $1.3 million, $1.1 million and $1.0 million, respectively.
80
The Company uses the Black-Scholes model to calculate the estimated fair value for the employee stock purchase plan. The weighted average estimated fair value of employee stock purchase plan grants during fiscal years 2012, 2011 and 2010 were $16.09, $15.99, and $11.21 per share, respectively, with the following weighted average assumptions:
2012 | 2011 | 2010 | ||||||||||
Risk-free interest rate | 0.06 | % | 0.10 | % | 0.12 | % | ||||||
| Expected life (months) | 3 | 3 | 3 | |||||||||
Expected volatility | 14.8 | % | 11.9 | % | 13.8 | % | ||||||
Dividend yield | 1.26 | % | 1.04 | % | 1.33 | % | ||||||
Accuracy of Fair Value Estimates
The Company is responsible for determining the assumptions used in estimating the fair value of its share-based payment awards. The Company's determination of fair value of share-based payment awards on the date of grant using an option-pricing model is affected by the Company's stock price as well as assumptions regarding a number of highly complex and subjective variables. These variables include, but are not limited to the Company's expected stock price volatility over the term of the awards, interest rates, option forfeiture rates and actual and projected employee stock option exercise behaviors. Option-pricing models were developed for use in estimating the value of traded options that have no vesting or hedging restrictions and are fully transferable.
16. INCOME TAXES
Provision for Income Taxes
The provision for income taxes by geographic operations is as follows (in thousands):
Years Ended August 31, | 2012 | 2011 | 2010 | |||||||||
U.S. operations | $ | 229,772 | $ | 198,688 | $ | 182,038 | ||||||
Non-U.S. operations | 44,933 | 40,270 | 40,143 | |||||||||
Income before income taxes | $ | 274,705 | $ | 238,958 | $ | 222,181 | ||||||
U.S. operations | $ | 76,020 | $ | 58,125 | $ | 62,554 | ||||||
Non-U.S. operations | 9,876 | 9,787 | 9,416 | |||||||||
Total provision for income taxes | $ | 85,896 | $ | 67,912 | * | $ | 71,970 | ** | ||||
Effective tax rate | 31.3 | % | 28.4 | % * | 32.4 | % ** | ||||||
* Includes income tax benefits of $6.3 million from the finalization of the fiscal 2010 tax return and the reenactment of the U.S. Federal R&D tax credit in December 2010. The fiscal 2011 annual effective tax rate before discrete items of $6.3 million was 30.9% or 40 basis points lower than the 2012 effective tax rate due to the expiration of the U.S. Federal R&D tax credit on December 31, 2011, which negatively impacted the fiscal 2012 annual effective tax rate by 130 basis points.
** Includes income tax benefits of $1.3 million from the finalization of the fiscal 2009 tax return, adjustments to certain reserves to reflect the lapse of statute of limitations and higher levels of non-U.S. taxable income. The fiscal 2010 annual effective tax rate before discrete items of $1.3 million was 32.9%.
The components of the provision for income taxes consist of the following (in thousands):
Years Ended August 31, | 2012 | 2011 | 2010 | |||||||||
Current | ||||||||||||
U.S. federal | $ | 73,272 | $ | 53,925 | $ | 63,712 | ||||||
U.S. state and local | 4,305 | 4,833 | 4,839 | |||||||||
Non-U.S. | 10,224 | 10,728 | 10,151 | |||||||||
Total current taxes | $ | 87,801 | $ | 69,486 | $ | 78,702 | ||||||
Deferred | ||||||||||||
U.S. federal | $ | 1,405 | $ | 606 | $ | 5,718 | ||||||
U.S. state and local | 152 | 27 | 279 | |||||||||
Non-U.S. | 348 | 941 | 735 | |||||||||
Total deferred taxes | $ | 1,905 | $ | 1,574 | $ | 6,732 | ||||||
Total provision for income taxes | $ | 85,896 | $ | 67,912 | $ | 71,970 | ||||||
81
The provision for income taxes differs from the amount of income tax determined by applying the U.S. statutory federal income tax rate to income before income taxes as a result of the following factors (expressed as a percentage of income before income taxes):
Years Ended August 31, | 2012 | 2011 | 2010 | |||||||||
Tax at federal U.S. statutory tax rate | 35.0 | % | 35.0 | % | 35.0 | % | ||||||
Increase (decrease) in taxes resulting from: | ||||||||||||
State and local taxes, net of U.S. federal income tax benefit | 2.1 | 2.2 | 2.1 | |||||||||
Foreign income at other than U.S. rates | (1.9 | ) | (1.7 | ) | (1.8 | ) | ||||||
Domestic production activities (Section 199) deduction | (2.6 | ) | (2.1 | ) | (1.9 | ) | ||||||
Income tax benefit from R&D tax credits | (0.8 | ) | (4.9 | ) | (0.6 | ) | ||||||
Income tax benefits from foreign tax credits | (0.5 | ) | (0.7 | ) | (0.5 | ) | ||||||
Other, net | 0.0 | 0.6 | 0.1 | |||||||||
Effective tax rate | 31.3 | % | 28.4 | % | 32.4 | % | ||||||
Deferred Tax Assets and Liabilities
The significant components of deferred tax assets that are recorded in the Consolidated Balance Sheets were as follows (in thousands):
At August 31, |
| 2012 | 2011 | |||||
Deferred tax assets |
| |||||||
Current |
| |||||||
Receivable reserve | $ | 687 | $ | 736 | ||||
Deferred rent | 3,175 | 3,272 | ||||||
Deferred fees |
| 1,223 | - | |||||
Net current deferred taxes |
| $ | 5,085 | $ | 4,008 | |||
Non-current |
| |||||||
Depreciation on property, equipment and leasehold improvements |
| $ | 2,498 | $ | 2,427 | |||
Deferred rent |
| 2,782 | 2,793 | |||||
Stock-based compensation | 23,395 | 18,096 | ||||||
Purchased intangible assets, including acquired technology |
| (6,801 | ) | (5,295 | ) | |||
Other | 1,239 | 2,145 | ||||||
Net non-current deferred taxes |
| $ | 23,113 | $ | 20,166 | |||
Total deferred tax assets |
| $ | 28,198 | $ | 24,174 | |||
The significant components of deferred tax liabilities that are recorded in the Consolidated Balance Sheets were as follows (in thousands):
At August 31, |
| 2012 | 2011 | |||||
Deferred tax liabilities (non-current) |
| |||||||
Purchased intangible assets, including acquired technology |
| $ | 2,936 | $ | 3,712 | |||
Stock-based compensation | (343 | ) | - | |||||
Total deferred tax liabilities (non-current) | $ | 2,593 | $ | 3,712 | ||||
A provision has not been made for additional U.S. Federal taxes as of August 31, 2012 on undistributed earnings of foreign subsidiaries, except for France, because the Company intends to reinvest these funds indefinitely to support foreign growth opportunities. The amount of such undistributed earnings of foreign subsidiaries included in consolidated retained earnings was immaterial at August 31, 2012 and 2011. It is not practicable to estimate the unrecognized deferred tax liability on these undistributed earnings. These earnings could become subject to additional tax if they are remitted as dividends, loaned to FactSet, or upon sale of the subsidiary's stock.
82
Unrecognized Tax Positions
Applicable accounting guidance prescribes a comprehensive model for the financial statement recognition, measurement, classification and disclosure of uncertain tax positions that a company has taken or expects to take on a tax return. A company can recognize the financial effect of an income tax position only if it is more likely than not (greater than 50%) that the tax position will prevail upon tax examination, based solely on the technical merits of the tax position. Otherwise, no benefit or expense can be recognized in the consolidated financial statements. The tax benefits recognized are measured based on the largest benefit that has a greater than fifty percent likelihood of being realized upon ultimate settlement. Additionally, companies are required to accrue interest and related penalties, if applicable, on all tax exposures for which reserves have been established consistent with jurisdictional tax laws.
As of August 31, 2012, the Company had gross unrecognized tax benefits totaling $5.5 million, including $1.0 million of accrued interest, recorded as non-current taxes payable in the consolidated balance sheet. Unrecognized tax benefits represent tax positions taken on tax returns but not yet recognized in the consolidated financial statements. When applicable, the Company adjusts the previously recorded tax expense to reflect examination results when the position is effectively settled. The Company regularly engages in discussions and negotiations with tax authorities regarding tax matters in various jurisdictions. It is reasonably possible that certain federal, foreign, and state tax matters may be concluded in the next 12 months. However, FactSet has no reason to believe that such audits will result in the payment of additional taxes and/or penalties that would have a material adverse effect on the Company's results of operations or financial position, beyond current estimates. Any changes in accounting estimates resulting from new developments with respect to uncertain tax positions will be recorded as appropriate. The Company does not currently anticipate that the total amounts of unrecognized tax benefits will significantly change within the next 12 months.
The following table summarizes the changes in the balance of gross unrecognized tax benefits from August 31, 2009 to August 31, 2012 (in thousands):
Unrecognized income tax benefits at August 31, 2009 | $ | 6,437 | ||
Additions based on tax positions related to the current year | 1,301 | |||
Additions for tax positions of prior years | 469 | |||
Statute of limitations lapse | (861 | ) | ||
Unrecognized income tax benefits at August 31, 2010 | $ | 7,346 | ||
Additions based on tax positions related to the current year | 1,258 | |||
Additions for tax positions of prior years | 1,493 | |||
Statute of limitations lapse | (964 | ) | ||
Reductions from settlements with taxing authorities | (1,929 | ) | ||
Unrecognized income tax benefits at August 31, 2011 | $ | 7,204 | ||
Additions based on tax positions related to the current year | 691 | |||
Additions for tax positions of prior years | 470 | |||
Statute of limitations lapse | (613 | ) | ||
Reductions from settlements with taxing authorities | (2,288 | ) | ||
Unrecognized income tax benefits at August 31, 2012 | $ | 5,464 |
In the normal course of business, the Company's tax filings are subject to audit by federal, state and foreign tax authorities. At August 31, 2012, the Company remained subject to examination in the following major tax jurisdictions for the tax years as indicated below:
Major Tax Jurisdictions | Open Tax Years |
U.S. | |
Federal | 2009 through 2012 |
State (various) | 2008 through 2012 |
Europe | |
France | 2010 through 2012 |
United Kingdom | 2008 through 2012 |
83
17. COMMITMENTS AND CONTINGENCIES
Commitments represent obligations, such as those for future purchases of goods or services that are not yet recorded on the balance sheet as liabilities. FactSet records liabilities for commitments when incurred ( i.e. , when the goods or services are received).
Lease Commitments
At August 31, 2012, the Company leases approximately 193,000 square feet of office space at its headquarters in Norwalk, Connecticut. In addition, FactSet leases office space for its U.S. reportable segment in New York, New York; Boston, Massachusetts; Chicago, Illinois; San Mateo, California; Austin, Texas; Jackson, Wyoming; Atlanta, Georgia; Tuscaloosa, Alabama; Newark, Ridgewood and Piscataway, New Jersey; Manchester, New Hampshire; and Reston, Virginia. The Company's European segment operates in leased office space in London, England; Paris and Avon, France; Amsterdam, the Netherlands; Frankfurt, Germany; Dubai, United Arab Emirates; and Milan, Italy. Office space in Tokyo, Japan; Hong Kong; Mumbai, India; and Sydney, Australia are leased by FactSet for its Asia Pacific operating segment. The data content collection centers located in Hyderabad, India and Manila, the Philippines benefit all of the Companies operating segments. The leases expire on various dates through March 2021. Total minimum rental payments associated with the leases are recorded as rent expense (a component of selling, general and administrative expenses) on a straight-line basis over the periods of the respective non-cancelable lease terms. The Company believes that its leased office space is adequate for its current needs and that additional space is available for lease to meet any future needs.
The following new lease agreements were finalized during fiscal 2012 by FactSet:
| · | Norwalk, CT: A new lease agreement was entered into during the first quarter of 2012 to expand FactSet's corporate headquarters in Norwalk, CT by approximately 23,800 square feet. The new lease results in incremental future minimum rental payments of $3.8 million over the non-cancelable lease term of eight years. |
| · | New York, New York : New lease agreements for an additional 17,600 square feet of space to support the Company's operations were entered into during the first quarter of 2012, which resulted in incremental future minimum rental payments of $3.1 million over the non-cancelable lease term of approximately 3.5 years. |
| · | Hong Kong : A new lease agreement was entered into during the fourth quarter of fiscal 2012 to relocate the existing office within Hong Kong in order to support the Company's growing local presence. The new lease resulted in a net increase of approximately 3,000 rentable square feet and incremental future minimum rental payments of $5.4 million over the non-cancelable lease term of six years. |
| · | Manila, the Philippines: A new lease agreement was entered into during the fourth quarter of fiscal 2012 to expand the Company's content collection operations within the Philippines by approximately 22,900 square feet. The lease results in future minimum rental payments of $2.1 million over the non-cancelable lease term of five years. |
| · | Dubai, United Arab Emirates: A new lease agreement was entered into during the fourth quarter of fiscal 2012 to relocate the existing office within Dubai in order to support the Company's growing local presence. The new lease resulted in a net increase of approximately 1,600 rentable square feet and incremental future minimum rental payments of $0.8 million over the non-cancelable lease term of three years. |
| · | StreetAccount (various locations): The acquisition of StreetAccount in June 2012 increased leased office by approximately 9,500 rentable square feet and future minimum rental payments by $0.5 million over the remaining non-cancelable lease terms. |
Partially offsetting new lease agreements entered into during fiscal 2012 was the consolidation of the East Grinstead office into the larger London office. This consolidation was completed in March 2012 and resulted in a reduction in leased office space by 3,853 rentable square feet. At the time FactSet exited the office space in East Grinstead in March 2012, there were seven months remaining on the lease and less than $0.1 million in remaining rental payments due.
Including new lease agreements entered into during fiscal 2012 (as summarized above), the Company's worldwide leased office space increased to approximately 807,000 square feet at August 31, 2012, up 11% from August 31, 2011.
During fiscal 2012, 2011 and 2010, rent expense for all operating leases amounted to approximately $34.6 million, $32.8 million, and $30.6 million, respectively. Approximately $4.3 million of standby letters of credit have been issued during the ordinary course of business in connection with the Company's current leased office space as of August 31, 2012. These standby letters of credit contain covenants that, among other things, require FactSet to maintain minimum levels of consolidated net worth and certain leverage and fixed charge ratios. As of August 31, 2012 and 2011, FactSet was in compliance with all covenants contained in the standby letters of credit.
84
At August 31, 2012, the Company's lease commitments for office space provide for the following future minimum rental payments under non-cancelable operating leases with remaining terms in excess of one year (in thousands):
Years Ended August 31, | Minimum Lease Payments | |||
2013 | $ | 27,592 | ||
2014 | 26,122 | |||
2015 | 21,771 | |||
2016 | 15,705 | |||
2017 | 14,441 | |||
Thereafter | 35,540 | |||
Total | $ | 141,171 | ||
Purchase Commitments with Suppliers
Purchase obligations represent payment due in future periods in respect of commitments to the Company's various data vendors as well as commitments to purchase goods and services such as telecommunication and computer maintenance services. These purchase commitments are agreements that are enforceable and legally binding on FactSet and that specify all significant terms, including: fixed or minimum quantities to be purchased; fixed, minimum or variable price provisions; and the approximate timing of the transaction. As of August 31, 2012 and 2011, the Company had total purchase commitments with suppliers of $52.2 million and $47.8 million, respectively.
Contingencies
Legal Matters
FactSet accrues non income-tax liabilities for contingencies when management believes that a loss is probable and the amounts can be reasonably estimated, while contingent gains are recognized only when realized. The Company is subject to legal proceedings, claims, and litigation arising in the ordinary course of business, including intellectual property litigation. These matters are subject to inherent uncertainties and management's view of these matters may change in the future. Based on currently available information as of August 31, 2012, FactSet's management does not believe that the ultimate outcome of these unresolved matters against the Company , individually or in the aggregate, is likely to have a material adverse effect on the Company's consolidated financial position, its results of operations or its cash flows .
Income Taxes
Uncertain income tax positions are accounted for in accordance with applicable accounting guidance (see Note 16). FactSet is currently under audit by multiple tax authorities. The Company has reserved for potential adjustments to its provision for income taxes that may result from examinations by, or any negotiated agreements with, these tax authorities, and the Company believes that the final outcome of these examinations or agreements will not have a material effect on its results of operations. If events occur which indicate payment of these amounts is unnecessary, the reversal of the liabilities would result in the recognition of tax benefits in the period FactSet determines the liabilities are no longer necessary. If the Company's estimates of the federal, state, and foreign income tax liabilities are less than the ultimate assessment, a further charge to expense would result.
Indemnifications
As permitted or required under Delaware law and to the maximum extent allowable under that law, FactSet has certain obligations to indemnify its current and former officers and directors for certain events or occurrences while the officer or director is, or was serving, at FactSet's request in such capacity. These indemnification obligations are valid as long as the director or officer acted in good faith and in a manner the person reasonably believed to be in or not opposed to the best interests of the Company, and with respect to any criminal action or proceeding, had no reasonable cause to believe his or her conduct was unlawful. The maximum potential amount of future payments FactSet could be required to make under these indemnification obligations is unlimited; however, FactSet has a director and officer insurance policy that mitigates FactSet's exposure and enables FactSet to recover a portion of any future amounts paid. The Company believes the estimated fair value of these indemnification obligations is minimal.
Revolving Credit Facility
FactSet's three-year credit facility with JPMorgan Chase Bank matured on March 31, 2011. Prior to its maturity date, the credit facility was available in an aggregate principal amount of up to $12.5 million for working capital and general corporate purposes. The Company was obligated to pay a commitment fee on the unused portion of the facility at a weighted average annual rate of 0.125%. The facility also contained covenants that, among other things, required FactSet to maintain minimum levels of consolidated net worth and certain leverage and fixed charge ratios.
85
18. RISKS AND CONCENTRATIONS OF CREDIT RISK
Financial Risk Management
In the normal course of business, FactSet is exposed to foreign currency exchange risk and interest rate risk that could impact its financial position and results of operations.
Foreign Currency Exchange Risk
The Company is exposed to changes in foreign currency exchange rates, which could affect its operating results, financial position and cash flows. The Company's primary foreign currency market exposures include the Euro, British Pound Sterling, Japanese Yen, Indian Rupee and Philippines Peso. The Company's non-U.S. dollar denominated revenues expected to be recognized over the next twelve months are estimated to be $17 million while its non-U.S. dollar denominated expenses are $163 million, which translates into a net foreign currency exposure of $146 million per year. To the extent that FactSet's international activities recorded in local currencies increase in the future, its exposure to fluctuations in currency exchange rates will correspondingly increase. FactSet manages its exposure to foreign currency exchange risk through its regular operating and financing activities and, when appropriate, through the use of derivative financial instruments. These derivative financial instruments are utilized to hedge currency exposures as well as to reduce earnings volatility resulting from shifts in market rates. FactSet only enters into foreign currency forward contracts to manage foreign currency exposures. The fair market values of all the Company's derivative contracts change with fluctuations in currency rates and are designed so that any changes in their values are offset by changes in the values of the underlying exposures. See Note 5 to the Consolidated Financial Statements for additional analysis of the Company's foreign currency exchange rate risk.
Interest Rate Risk
The fair market value of the Company's cash and investments at August 31, 2012 was $203 million. FactSet's cash and cash equivalents consist of demand deposits and money market funds with maturities of three months or less at the date of acquisition and are reported at fair value. The Company's investments consist of certificates of deposits with original maturities greater than three months, but less than one year and, as such, are reported as short-term investments. It is anticipated that the fair market value of the Company's portfolio will continue to be immaterially affected by fluctuations in interest rates. Because FactSet has a restrictive investment policy, its financial exposure to fluctuations in interest rates is expected to remain low. The Company does not believe that the value or liquidity of its cash and investments have been significantly impacted by the recent credit crisis.
Current market events have not required the Company to modify materially or change its financial risk management strategies with respect to its exposures to foreign currency exchange risk and interest rate risk.
Concentrations of Credit Risk
Cash equivalents
Cash and cash equivalents are maintained with several financial institutions. Deposits held with banks may exceed the amount of insurance provided on such deposits. These deposits may be redeemed upon demand and are maintained with financial institutions with reputable credit and therefore bear minimal credit risk. The Company seeks to mitigate its credit risks by spreading such risks across multiple counterparties and monitoring the risk profiles of these counterparties.
Accounts Receivable
Accounts receivable are unsecured and are derived from revenues earned from clients located around the globe. FactSet performs ongoing credit evaluations of its clients and does not require collateral from its clients. The Company maintains reserves for potential write-offs and these losses have historically been within expectations. No single client represented 10% or more of FactSet's total revenues in any fiscal year presented. As of August 31, 2012 and 2011, respectively, the Company's largest individual client accounted for 2% of total subscriptions. In both years, subscriptions from the ten largest clients did not surpass 16% of total subscriptions.
Derivative Instruments
As a result of the use of derivative instruments, the Company is exposed to counterparty credit risk. FactSet has incorporated counterparty risk into the fair value of its derivative assets and its own credit risk into the value of the Company's derivative liabilities. FactSet calculates credit risk from observable data related to credit default swaps as quoted by publicly available information. Counterparty risk is represented by CDS spreads related to the senior secured debt of the respective bank with whom FactSet has executed these derivative transactions. Because CDS spread information is not available for FactSet, the Company's credit risk is determined based on using a simple average of CDS spreads for peer companies as determined by FactSet. To mitigate counterparty credit risk, FactSet enters into contracts with large financial institutions and regularly review credit exposure balances as well as the creditworthiness of the counterparties.
86
Data Content Providers
Certain datasets that FactSet relies on have a limited number of suppliers, although the Company makes every effort to assure that, where reasonable, alternative sources are available. However, FactSet is not dependent on any one third-party data supplier in order to meet the needs of its clients. FactSet combines the data from these commercial databases into its own dedicated single online service, which the client accesses to perform their analysis. No single vendor or data supplier represented 10% or more of FactSet's total expenses in any fiscal year presented .
19. UNAUDITED QUARTERLY FINANCIAL DATA
The following table presents selected unaudited financial information for the eight quarters in the period ended August 31, 2012. The results for any quarter are not necessarily indicative of future quarterly results and, accordingly, period-to-period comparisons should not be relied upon as an indication of future performance (in thousands, except per share data).
Fiscal 2012 | First Quarter | Second Quarter | Third Quarter | Fourth Quarter | ||||||||||||
Revenues | $ | 196,448 | $ | 199,371 | $ | 202,311 | $ | 207,663 | ||||||||
Cost of services | 66,833 | 67,531 | 68,878 | 72,295 | ||||||||||||
Selling, general and administrative | 62,862 | 64,723 | 64,939 | 64,741 | ||||||||||||
Operating income | 66,753 | 67,117 | 68,494 | 70,627 | ||||||||||||
Net income | 45,544 | 46,746 | 47,980 | 48,539 | ||||||||||||
Diluted earnings per common share | $ | 0.99 | $ | 1.02 | $ | 1.05 | $ | 1.08 | ||||||||
Weighted average common shares (diluted) | 46,103 | 45,707 | 45,736 | 45,152 | ||||||||||||
Fiscal 2011 | First Quarter | Second Quarter | Third Quarter | Fourth Quarter | ||||||||||||
Revenues | $ | 173,289 | $ | 177,635 | $ | 183,647 | $ | 191,939 | ||||||||
Cost of services | 56,785 | 60,137 | 62,224 | 65,477 | ||||||||||||
Selling, general and administrative | 57,075 | 59,405 | 59,600 | 67,472 | ||||||||||||
Operating income | 59,429 | 58,093 | 61,823 | 58,990 | ||||||||||||
Net income | 41,601 | 45,254 | 43,311 | 40,880 | ||||||||||||
Diluted earnings per common share | $ | 0.88 | $ | 0.95 | $ | 0.92 | $ | 0.88 | ||||||||
Weighted average common shares (diluted) | 47,487 | 47,427 | 47,154 | 46,595 | ||||||||||||
87
ITEM 9. CHANGES IN AND DISAGREEMENTS WITH ACCOUNTANTS ON ACCOUNTING AND
FINANCIAL DISCLOSURE
None.
ITEM 9A. CONTROLS AND PROCEDURES
Evaluation of Disclosure Controls and Procedures
Under the supervision and with the participation of the Company's management, including the principal executive officer and principal financial officer, the Company has evaluated the effectiveness of its disclosure controls and procedures pursuant to Rules 13a-15(e) and 15d-15(e) under the Securities Exchange Act of 1934, as of the end of the annual period covered by this report. Based on that evaluation, the principal executive officer and principal financial officer have concluded that the Company's disclosure controls and procedures as defined in Rules 13a-15(e) and 15d-15(e) under the Securities Exchange Act of 1934, as amended, (the "Exchange Act") are effective to ensure that information required to be disclosed by the Company in reports that it files or submits under the Exchange Act is recorded, processed, summarized and reported within the time periods specified in Securities and Exchange Commission rules and forms and is accumulated and communicated to the Company's management, including its principal executive officer and principal financial officer, as appropriate to allow timely decisions regarding required disclosure.
Changes in Internal Control over Financial Reporting
The Company regularly reviews its system of internal control over financial reporting and makes changes to its processes and systems to improve controls and increase efficiency, while ensuring that the Company maintains an effective internal control environment. Changes may include such activities as implementing new, more efficient systems, consolidating activities, and migrating processes.
There have been no changes in the Company's internal control over financial reporting (as such term is defined in Rules 13a-15(f) and 15d-15(f) under the Exchange Act) during the fourth quarter of fiscal 2012 that has materially affected, or is reasonably likely to materially affect, the Company's internal control over financial reporting.
Management's Report on Internal Control over Financial Reporting
See Management's Report on Internal Control over Financial Reporting under Item 8 on page 50.
Report of Independent Registered Public Accounting Firm
See Report of Independent Registered Public Accounting Firm under Item 8 on page 51.
ITEM 9B. OTHER INFORMATION
None.
88
PART III
ITEM 10. DIRECTORS, EXECUTIVE OFFICERS AND CORPORATE GOVERNANCE
The information required by this item relating to our directors and nominees, regarding compliance with Section 16(a) of the Securities Act of 1934, and regarding our Audit Committee is included under the captions "Corporate Governance" and "Security Ownership of Certain Beneficial Owners and Management" and contained in the definitive Proxy Statement dated October 30, 2012, all of which information is incorporated herein by reference.
Pursuant to General Instruction G(3) of Form 10-K, the information required by this item relating to our executive officers is included under the caption "Executive Officers" of the Company's definitive Proxy Statement dated October 30, 2012, all of which information is incorporated herein by reference.
We have adopted a code of ethics that applies to our principal executive officer and all members of our finance department, including the principal financial officer and principal accounting officer. This code of ethics, which consists of the "Code of Ethical Conduct for Financial Managers," is posted on our website, along with our committee charters. The Internet address for our Website is www.factset.com , and the code of ethics may be found in the "Investor Relations" section under "Corporate Governance." All employees, officers and directors are also subject to our "Code of Business Conduct and Ethics," also posted on the "Corporate Governance" page of our website and the same information is available in print free of charge to any stockholder who submits a written request to the Company's Investor Relations department at its corporate headquarters at 601 Merritt 7, Norwalk, Connecticut 06851.
We intend to satisfy any disclosure requirement under Item 5.05 of Form 8-K regarding an amendment to, or waiver from, a provision of this code of ethics by posting such information on our website, at the address and general location specified above.
ITEM 11. EXECUTIVE COMPENSATION
The information required by this item relating to our executive compensation is included under the caption "Executive Compensation" contained in the definitive Proxy Statement dated October 30, 2012, all of which information is incorporated herein by reference.
ITEM 12. SECURITY OWNERSHIP OF CERTAIN BENEFICIAL OWNERS AND MANAGEMENT AND RELATED STOCKHOLDER MATTERS
The information required by this item relating to security ownership of certain beneficial owners and management is included under the caption "Security Ownership of Certain Beneficial Owners and Management" and the information required by this item relating to securities authorized for issuance under equity compensation plans is included under the caption "Equity Compensation Plan Information," in the definitive Proxy Statement dated October 30, 2012, all of which information is incorporated herein by reference.
ITEM 13. CERTAIN RELATIONSHIPS AND RELATED TRANSACTIONS, AND DIRECTOR INDEPENDENCE
The information required by this item relating to review, approval or ratification of transactions with related persons is included under the caption "Certain Relationships and Related Transactions" and the information required by this item relating to director independence is included under the captions "Corporate Governance" and "Director Compensation," contained in the definitive Proxy Statement dated October 30, 2012, all of which information is incorporated herein by reference.
ITEM 14. PRINCIPAL ACCOUNTING FEES AND SERVICES
The information required by this item is included under the captions "Proposal 2: Ratification of Independent Registered Public Accounting Firm" in the definitive Proxy Statement dated October 30, 2012, all of which information is incorporated herein by reference.
89
PART IV
ITEM 15. EXHIBITS AND FINANCIAL STATEMENT SCHEDULES
1. | Consolidated Financial Statements |
The Index to Consolidated Financial Statements under Item 8 on page 49 is incorporated herein by reference as the list of financial statements required as part of this report.
2. | Financial Statement Schedule |
Schedule II – Valuation and Qualifying Accounts
Years Ended August 31, 2012, 2011, and 2010 (in thousands):
Receivable reserve and billing adjustments* | Balance at Beginning of Year | Charged to Expense/ Against Revenue | Write-offs, Net of Recoveries | Balance at End of Year | ||||||||||||
2012 | $ | 1,955 | $ | 1,863 | $ | 1,988 | $ | 1,830 | ||||||||
2011 | $ | 1,862 | $ | 1,748 | $ | 1,655 | $ | 1,955 | ||||||||
2010 | $ | 1,712 | $ | 2,903 | $ | 2,753 | $ | 1,862 | ||||||||
* Additions to the receivable reserve for doubtful accounts are charged to bad debt expense. Additions to the receivable reserve for billing adjustments are charged against revenues.
Additional financial statement schedules have been omitted since they are either not required, not applicable, or the information is otherwise included.
3. | Exhibits |
| EXHIBIT NUMBER | DESCRIPTION | |
3.1 |
| Restated Certificate of Incorporation (1) |
3.2 |
| Amendment to the Restated Certificate of Incorporation (2) |
3.3 |
| Second Amendment to the Restated Certificate of Incorporation (3) |
3.4 |
| By-laws of FactSet Research Systems Inc. (4) |
3.5 | Amended and Restated By-laws of FactSet Research Systems Inc. (5) | |
4 |
| Form of Common Stock (1) |
10.1 | Severance Agreement dated September 20, 1999 between FactSet Research Systems Inc. and Peter G. Walsh | |
10.2 |
| The FactSet Research Systems Inc. 1994 Stock Option Plan and 1996 Stock Option Plan (6) |
10.3 |
| The FactSet Research Systems Inc. 2000 Stock Option Plan (7) |
10.4 | The FactSet Research Systems Inc. 2004 Stock Option and Award Plan, as Amended and Restated (8) | |
10.5 | The FactSet Research Systems Inc. 1998 Non-Employee Directors' Stock Option Plan (9) | |
10.6 | The FactSet Research Systems Inc. 2008 Non-Employee Directors' Stock Option Plan (10) | |
10.7 |
| The FactSet Research Systems Inc. 2001 Employee Stock Purchase Plan (11) |
10.8 |
| The FactSet Research Systems Inc. 2008 Employee Stock Purchase Plan (10) |
21 |
| Subsidiaries of the Registrant |
23 |
| Consent of Independent Registered Public Accounting Firm |
31.1 |
| Section 302 Certification of Principal Executive Officer |
31.2 |
| Section 302 Certification of Principal Financial Officer |
32.1 |
| Section 906 Certification of Principal Executive Officer |
32.2 |
| Section 906 Certification of Principal Financial Officer |
101.INS* | XBRL Instance Document | |
101.SCH* | XBRL Taxonomy Extension Schema | |
101.CAL* | XBRL Taxonomy Extension Calculation Linkbase | |
101.DEF* | XBRL Taxonomy Extension Definition Linkbase Document | |
101.LAB* | XBRL Taxonomy Extension Label Linkbase | |
101.PRE* | XBRL Taxonomy Extension Presentation Linkbase | |
90
(1) | Incorporated by reference to the Company's Registration Statement on Form S-1 (File No. 333-04238).
|
(2) | Incorporated by reference to the Company's annual report on Form 10-K for fiscal year 2001.
|
(3) | Incorporated by reference to the Company's periodic report on Form 8-K, filed on December 16, 2011.
|
(4) | Incorporated by reference to the Company's quarterly report on Form 10-Q for the third quarter of fiscal year 2000.
|
(5) | Incorporated by reference to the Company's quarterly report on Form 10-Q for the first quarter of fiscal year 2009.
|
(6) | Incorporated by reference to the Company's Registration Statement on Form S-8 (File No. 333-22319).
|
(7) | Incorporated by reference to the Company's Registration Statement on Form S-8 (File No. 333-56870).
|
(8) | Incorporated by reference to the Company's Registration Statement on Form S-8 (File No. 333-171667).
|
(9) | Incorporated by reference to the Company's Registration Statement on Form S-8 (File No. 333-59839).
|
(10) | Incorporated by reference to the Company's Registration Statement on Form S-8 (File No. 333-156649).
|
(11) | Incorporated by reference to the Company's Registration Statement on Form S-8 (File No. 333-57880).
|
91
SIGNATURES
Pursuant to the requirements of Section 13 or 15(d) of the Securities Exchange Act of 1934, the Registrant has duly caused this Report on Form 10-K to be signed on its behalf by the undersigned, thereunto duly authorized.
FACTSET RESEARCH SYSTEMS INC (Registrant) | |||
Date: October 30, 2012 | /s/ PHILIP A. HADLEY | ||
Philip A. Hadley | |||
Chairman and Chief Executive Officer | |||
| (Principal Executive Officer) | |||
Pursuant to the requirements of the Securities Exchange Act of 1934, this report has been signed below by the following persons on behalf of the registrant and in the capacities and on the dates indicated.
Name | Title | Date | ||
/ S / P HILIP A. H ADLEY | Chairman and Chief Executive Officer | October 30, 2012 | ||
Philip A. Hadley | (Principal Executive Officer) | |||
/s/ M AURIZIO N ICOLELLI | Senior Vice President and Principal Financial Officer | October 30, 2012 | ||
Maurizio Nicolelli | ||||
/s/ M ATTHEW J. M C N ULTY | Vice President and Controller | October 30, 2012 | ||
Matthew J. McNulty | (Principal Accounting Officer) | |||
/ S / C HARLES J. S NYDER | Vice Chairman of the Board of Directors | October 30, 2012 | ||
Charles J. Snyder | ||||
/S / J AMES J. M C G ONIGLE | Lead Independent Director | October 30, 2012 | ||
James J. McGonigle | ||||
/ S / R OBIN A. A BRAMS | Director | October 30, 2012 | ||
Robin A. Abrams | ||||
/ S / S COTT A. B ILLEADEAU | Director | October 30, 2012 | ||
Scott A. Billeadeau | ||||
/S / M ICHAEL F. D I C HRISTINA | Director | October 30, 2012 | ||
Michael F. DiChristina | ||||
/ S / J OSEPH E. L AIRD , J R . | Director | October 30, 2012 | ||
Joseph E. Laird, Jr. | ||||
/ S / W ALTER F. S IEBECKER | Director | October 30, 2012 | ||
Walter F. Siebecker | ||||
/s/ J OSEPH R . Z IMMEL | Director | October 30, 2012 | ||
Joseph R. Zimmel |
92