| ||
UNITED STATES | ||
SECURITIES AND EXCHANGE COMMISSION | ||
Washington, D.C. 20549 | ||
| ||
FORM 10-K | ||
| ||
(Mark One) | ||
[X] ANNUAL REPORT PURSUANT TO SECTION 13 OR 15(d) OF THE SECURITIES EXCHANGE ACT OF 1934 | ||
For the fiscal year ended December 31, 2014 | ||
OR | ||
[ ] TRANSITION REPORT PURSUANT TO SECTION 13 OR 15(d) OF THE SECURITIES EXCHANGE ACT OF 1934 | ||
For the transition period from |
| to |
Commission File Number: 001-11307-01 | ||
Freeport-McMoRan Inc. | ||
(Exact name of registrant as specified in its charter) | ||
Delaware | 74-2480931 |
(State or other jurisdiction of incorporation or organization) | (I.R.S. Employer Identification No.) |
|
|
333 North Central Avenue |
|
Phoenix, Arizona | 85004-2189 |
(Address of principal executive offices) | (Zip Code) |
| |
(602) 366-8100 | |
(Registrant's telephone number, including area code) | |
Securities registered pursuant to Section 12(b) of the Act:
Title of each class |
| Name of each exchange on which registered |
Common Stock, par value $0.10 per share |
| New York Stock Exchange |
Securities registered pursuant to Section 12(g) of the Act: None
Indicate by check mark if the registrant is a well-known seasoned issuer, as defined in Rule 405 of the Securities Act ☑ Yes ¨ No
Indicate by check mark if the registrant is not required to file reports pursuant to Section 13 or Section 15(d) of the Act. ¨ Yes ☑ No
Indicate by check mark whether the registrant (1) has filed all reports required to be filed by Section 13 or 15(d) of the Securities Exchange Act of 1934 during the preceding 12 months (or for such shorter period that the registrant was required to file such reports), and (2) has been subject to such filing requirements for the past 90 days. ☑ Yes ¨ No
Indicate by check mark whether the registrant has submitted electronically and posted on its corporate Web site, if any, every Interactive Data File required to be submitted and posted pursuant to Rule 405 of Regulation S-T (§ 232.405 of this chapter) during the preceding 12 months (or for such shorter period that the registrant was required to submit and post such files). ☑ Yes ¨ No
Indicate by check mark if disclosure of delinquent filers pursuant to Item 405 of Regulation S-K (§229.405 of this chapter) is not contained herein, and will not be contained, to the best of the registrant's knowledge, in definitive proxy or information statements incorporated by reference in Part III of this Form 10-K or any amendment to this Form 10-K. ☑
Indicate by check mark whether the registrant is a large accelerated filer, an accelerated filer, a non-accelerated filer or a smaller reporting company. See the definitions of "large accelerated filer," "accelerated filer" and "smaller reporting company" in Rule 12b-2 of the Exchange Act. ☑ Large accelerated filer ¨ Accelerated filer ¨ Non-accelerated filer ¨ Smaller reporting company
Indicate by check mark whether the registrant is a shell company (as defined in Rule 12b-2 of the Act). ¨ Yes ☑ No
The aggregate market value of common stock held by non-affiliates of the registrant was $21.8 billion on February 20, 2015 , and $37.3 billion on June 30, 2014.
Common stock issued and outstanding was 1,039,863,035 shares on February 20, 2015 , and 1,038,896,868 shares on June 30, 2014 .
Portions of our proxy statement for our 2014 annual meeting of stockholders are incorporated by reference into Part III (Items 10, 11, 12, 13 and 14) of this report. |
FREEPORT-McMoRan INC.
TABLE OF CONTENTS | |
|
|
| Page |
Part I | 1 |
Items 1. and 2. Business and Properties | 1 |
Item 1A. Risk Factors | 45 |
Item 1B. Unresolved Staff Comments | 58 |
Item 3. Legal Proceedings | 59 |
Item 4. Mine Safety Disclosures | 61 |
Executive Officers of the Registrant | 61 |
|
|
Part II | 62 |
Item 5. Market for Registrant's Common Equity, Related Stockholder Matters |
|
and Issuer Purchases of Equity Securities | 62 |
Item 6. Selected Financial Data | 64 |
Items 7. and 7A. Management's Discussion and Analysis of Financial Condition and Results |
|
of Operations and Quantitative and Qualitative Disclosures about Market Risk | 68 |
Item 8. Financial Statements and Supplementary Data | 128 |
Item 9. Changes in and Disagreements with Accountants on Accounting and Financial Disclosure | 206 |
Item 9A. Controls and Procedures | 206 |
Item 9B. Other Information | 206 |
|
|
Part III | 207 |
Item 10. Directors, Executive Officers and Corporate Governance | 207 |
Item 11. Executive Compensation | 207 |
Item 12. Security Ownership of Certain Beneficial Owners and Management and |
|
Related Stockholder Matters | 207 |
Item 13. Certain Relationships and Related Transactions, and Director Independence | 207 |
Item 14. Principal Accounting Fees and Services | 207 |
|
|
Part IV | 207 |
Item 15. Exhibits, Financial Statement Schedules | 207 |
|
|
Signatures | S-1 |
|
|
Index to Financial Statements | F-1 |
|
|
Exhibit Index | E-1 |
i
Table of Contents
PART I
Items 1. and 2. Business and Properties.
All of our periodic reports filed with the United States (U.S.) Securities and Exchange Commission (SEC) pursuant to Section 13(a) or 15(d) of the Securities Exchange Act of 1934, as amended, are available, free of charge, through our website, www.fcx.com, including our annual reports on Form 10-K, quarterly reports on Form 10-Q, current reports on Form 8-K and any amendments to those reports. These reports and amendments are available through our website as soon as reasonably practicable after we electronically file or furnish such material to the SEC.
References to "we," "us" and "our" refer to Freeport-McMoRan Inc. (FCX) and its consolidated subsidiaries. References to "Notes" refer to the Notes to Consolidated Financial Statements included herein (refer to Item 8), and references to "MD&A" refer to Management's Discussion and Analysis of Financial Condition and Results of Operations included herein (refer to Item 7).
GENERAL
We are a premier U.S.-based natural resource company with an industry leading global portfolio of mineral assets, significant oil and natural gas resources and a growing production profile. Our principal executive offices are in Phoenix, Arizona, and our company was incorporated under the laws of the state of Delaware on November 10, 1987.
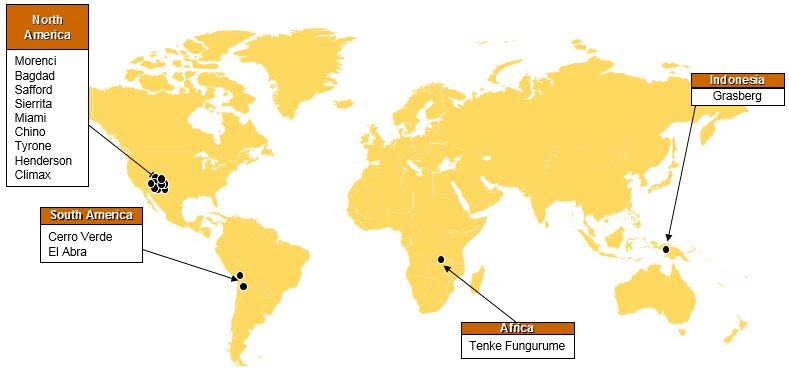
Our portfolio of assets includes the Grasberg minerals district in Indonesia, one of the world's largest copper and gold deposits, significant mining operations in North and South America, the Tenke Fungurume (Tenke) minerals district in the Democratic Republic of Congo (DRC) in Africa and significant oil and natural gas assets in North America. As further discussed in Note 2 , during 2014, we completed sales of our 80 percent ownership interests in the Candelaria and Ojos del Salado copper mining operations and of our Eagle Ford shale assets, and also acquired additional oil and gas interests in the Deepwater Gulf of Mexico (GOM). Following are FCX's ownership interests at December 31, 2014 , in its operating mines through its subsidiaries Freeport Minerals Corporation (FMC) and PT Freeport Indonesia (PT-FI), and in its oil and gas business through its subsidiary, FCX Oil & Gas Inc. (FM O&G):
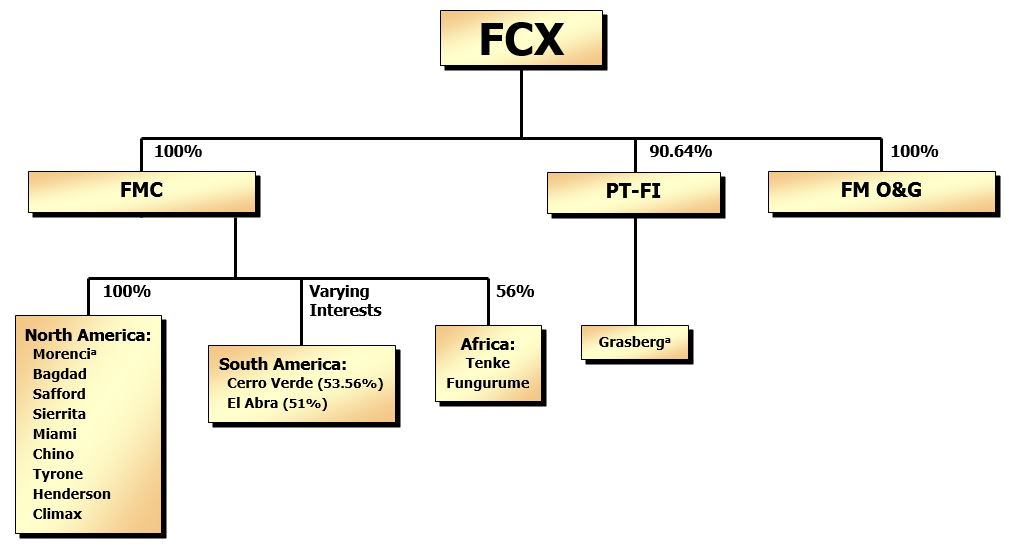
a. | FMC has an 85 percent undivided interest in Morenci via an unincorporated joint venture. Additionally, PT-FI has established an unincorporated joint venture with Rio Tinto plc (Rio Tinto) related to our Indonesia operations. Refer to Note 3 for further discussion of our ownership in subsidiaries and joint ventures. |
1
Table of Contents
Mining
At December 31, 2014 , our estimated consolidated recoverable proven and probable mineral reserves totaled 103.5 billion pounds of copper, 28.5 million ounces of gold, 3.11 billion pounds of molybdenum, 282.9 million ounces of silver and 0.85 billion pounds of cobalt. Following is a summary of our consolidated recoverable proven and probable mineral reserves at December 31, 2014 , by geographic location (refer to "Mining Operations" for further discussion):
| Copper |
| Gold |
| Molybdenum |
| Silver |
| Cobalt |
North America | 34% |
| 1% |
| 78% |
| 30% |
| - |
South America | 31% |
| - |
| 22% |
| 31% |
| - |
Indonesia | 28% |
| 99% |
| - |
| 39% |
| - |
Africa | 7% |
| - |
| - |
| - |
| 100% |
| 100% |
| 100% |
| 100% |
| 100% |
| 100% |
In North America, we have seven operating copper mines – Morenci, Bagdad, Safford, Sierrita and Miami in Arizona, and Chino and Tyrone in New Mexico, and two operating molybdenum mines – Henderson and Climax in Colorado. In addition to copper, certain of our North America copper mines also produce molybdenum concentrates and silver. In South America, we have two operating copper mines – Cerro Verde in Peru and El Abra in Chile. In addition to copper, the Cerro Verde mine also produces molybdenum concentrates and silver. In Indonesia, our subsidiary PT-FI operates the mines in the Grasberg minerals district. In addition to copper, the Grasberg minerals district also produces significant quantities of gold and silver. In Africa, our subsidiary Tenke Fungurume Mining S.A. (TFM) operates the mines in the Tenke minerals district. In addition to copper, the Tenke minerals district also produces cobalt hydroxide.
Following is a summary of our consolidated copper, gold and molybdenum production for the year 2014 by geographic location (refer to "Mining Operations" for further information):
| Copper |
| Gold |
| Molybdenum |
|
North America | 43% |
| 1% |
| 88% |
|
South America | 30% | a | 6% | a | 12% |
|
Indonesia | 16% |
| 93% |
| - |
|
Africa | 11% |
| - |
| - |
|
| 100% |
| 100% |
| 100% |
|
a. | Includes production from the Candelaria and Ojos del Salado mines totaling 284 million pound of copper (7 percent of consolidated FCX production) and 72 thousand ounces of gold (6 percent of consolidated FCX production). On November 3, 2014, FCX completed the sale of its 80 percent ownership interests in the Candelaria and Ojos del Salado mining operations. |
2
Table of Contents
Oil and Gas
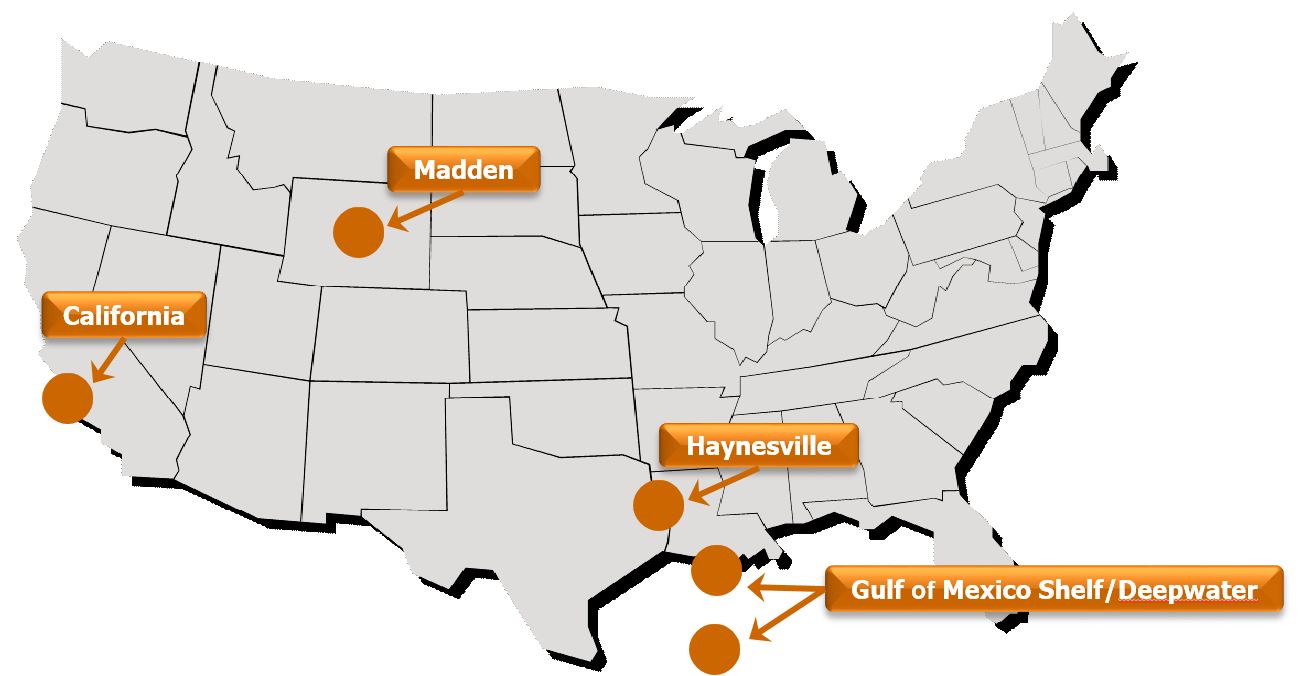
At December 31, 2014, our estimated proved oil and natural gas reserves totaled 390 million barrels of oil equivalents (MMBOE). All of our proved oil and natural gas reserves were located in the U.S., with 74 percent comprised of oil (including natural gas liquids, or NGLs) and 63 percent represented by proved developed reserves. Refer to "Oil and Gas Operations" for further discussion. Our oil and gas operations include oil production facilities and growth potential in the Deepwater GOM, established oil production facilities onshore and offshore California, large onshore natural gas resources in the Haynesville shale play in Louisiana, natural gas production from the Madden area in central Wyoming, and an industry-leading position in the emerging Inboard Lower Tertiary/Cretaceous natural gas trend located in the shallow waters of the GOM and onshore in South Louisiana.
The locations of our U.S. oil and gas operations are shown on the map below:
COPPER, GOLD, MOLYBDENUM AND OIL
Following provides a brief discussion of our primary natural resources, copper, gold, molybdenum and oil. For further discussion of historical market prices of these commodities refer to MD&A.
Copper
Copper is an internationally traded commodity, and its prices are determined by the major metals exchanges – the London Metal Exchange (LME), New York Mercantile Exchange (NYMEX) and Shanghai Futures Exchange. Prices on these exchanges generally reflect the worldwide balance of copper supply and demand, and can be volatile and cyclical. During 2014 , the LME spot copper price ranged from a low of $2.86 per pound to a high of $3.38 per pound, averaged $3.11 per pound, and was $2.88 per pound at December 31, 2014 .
In general, demand for copper reflects the rate of underlying world economic growth, particularly in industrial production and construction. According to Wood Mackenzie, a widely followed independent metals market consultant, copper's end-use markets (and their estimated shares of total consumption) are construction (30 percent), consumer products (28 percent), electrical applications (19 percent), transportation (12 percent) and industrial machinery (11 percent).
Gold
Gold is used for jewelry, coinage and bullion as well as various industrial and electronic applications. Gold can be readily sold on numerous markets throughout the world. Benchmark prices are generally based on London Bullion Market Association (London) PM quotations. During 2014 , the London PM gold price ranged from a low of $1,142 per ounce to a high of $1,385 per ounce, averaged $1,266 per ounce, and was $1,199 per ounce at December 31, 2014 .
3
Table of Contents
Molybdenum
Molybdenum is a key alloying element in steel and the raw material for several chemical-grade products used in catalysts, lubrication, smoke suppression, corrosion inhibition and pigmentation. Molybdenum, as a high-purity metal, is also used in electronics such as flat-panel displays and in super alloys used in aerospace. Reference prices for molybdenum are available in several publications, including Metals Week , Ryan's Notes and Metal Bulletin . During 2014 , the weekly average price of molybdenum quoted by Metals Week ranged from a low of $8.82 per pound to a high of $15.00 per pound, averaged $11.41 per pound, and was $9.00 per pound at December 31, 2014 .
Oil
Oil products include transportation fuels, fuel oils for heating and electricity generation, asphalt and road oil, and the feedstocks used to make chemicals, plastics and synthetic materials. The price of crude oil is set in the global marketplace, with prices largely determined by regional benchmarks, including Brent, West Texas Intermediate (WTI) and Heavy Louisiana Sweet. Prices generally reflect the worldwide supply and demand balance, and can be volatile. During 2014, the Brent crude oil price ranged from a low of $57.33 per barrel to a high of $115.06 per barrel, averaged $99.45 per barrel, and was $57.33 per barrel at December 31, 2014 .
PRODUCTS AND SALES
FCX's consolidated revenues for 2014 primarily included sales of copper ( 60 percent ), oil ( 20 percent ), gold ( 7 percent ) and molybdenum ( 6 percent ). Refer to Note 16 for a summary of our consolidated revenues and operating income by business segment and geographic area.
PT-FI's copper concentrate sales to PT Smelting (PT-FI's 25 percent owned copper smelter and refinery in Indonesia - refer to "Mining Operations - Smelting Facilities and Other Mining Properties" for further discussion) represented 8 percent of our consolidated revenues in both 2014 and 2013 and 11 percent in 2012 . Additionally, oil and gas sales to Phillips 66 Company represented 12 percent of our consolidated revenues in 2014. No other customer accounted for more than 10 percent of our consolidated revenues in any of the past three years.
Copper Products
We are one of the world's leading producers of copper concentrate, cathode and continuous cast copper rod. During 2014 , 44 percent of our mined copper was sold in concentrate, 31 percent as cathode and 25 percent as rod.
Our copper ore is generally processed either by smelting and refining or by solution extraction and electrowinning (SX/EW). Before being subject to the smelting and refining process, ore is crushed and treated to produce a copper concentrate with copper content of approximately 20 to 30 percent. Copper concentrate is then smelted ( i.e. , subjected to extreme heat) to produce copper anodes, which weigh between 800 and 900 pounds each and have an average copper content of 99.5 percent. The anodes are further treated by electrolytic refining to produce copper cathodes, which weigh between 100 and 350 pounds each and have an average copper content of 99.99 percent. For ore subject to the SX/EW process, copper is extracted from the ore by dissolving it with a weak sulphuric acid solution. The copper content of the solution is increased in two additional solution-extraction stages and then the copper-bearing solution undergoes an electrowinning process to produce cathode that is, on average, 99.99 percent copper. Our copper cathodes are used as the raw material input for copper rod, brass mill products and for other uses.
Copper Concentrate . We produce copper concentrate at six of our mines, of which PT-FI is our largest producer. In North America, copper concentrate is produced at our Morenci, Bagdad, Sierrita and Chino mines, and is generally shipped to our Miami smelter in Arizona. In South America, copper concentrate is produced at our Cerro Verde mine.
Copper Cathode . We produce copper cathode at our electrolytic refinery located in El Paso, Texas, and at 10 of our mines. In North America, SX/EW cathode is produced from our Morenci, Bagdad, Safford, Sierrita, Miami, Chino and Tyrone mines; in South America from our Cerro Verde and El Abra mines; and from the Tenke minerals district in Africa . Atlantic Copper S.L.U. (Atlantic Copper, our wholly owned copper smelting and refining unit in Spain - refer to "Mining Operations - Smelting Facilities and Other Mining Properties" for further discussion) and PT Smelting also produce copper cathode.
4
Table of Contents
Continuous Cast Copper Rod . We manufacture continuous cast copper rod at our facilities in El Paso, Texas; Norwich, Connecticut; and Miami, Arizona, primarily using copper cathode produced at our North America copper mines.
Copper Sales
North America . The majority of the copper produced at our North America copper mines and refined in our El Paso, Texas, refinery is consumed at our rod plants. The remainder of our North America copper production is sold in the form of copper cathode or copper concentrate under U.S. dollar-denominated annual contracts. Cathode and rod contract prices are generally based on the prevailing Commodity Exchange Inc. (COMEX - a division of NYMEX) monthly average spot price for the month of shipment and include a premium. Generally, copper rod is sold to wire and cable manufacturers, while cathode is sold to rod, brass or tube fabricators. During 2014 , 19 percent of our North America mines' copper sales volumes were shipped to Atlantic Copper in the form of copper concentrate.
South America . Production from our South America mines is sold as copper concentrate or copper cathode under U.S. dollar-denominated, annual and multi-year contracts. For the year 2015, our South America mines expect to sell approximately 50 to 60 percent of copper production in concentrate and the rest as cathode.
During 2014 , 21 percent of our South America mines' copper sales volumes were shipped to Atlantic Copper in the form of copper concentrate.
Substantially all of South America's copper concentrate and cathode sales contracts provide final copper pricing in a specified future month (generally one to four months from the shipment date) primarily based on quoted LME monthly average spot copper prices. Revenues from South America's concentrate sales are recorded net of treatment and refining charges ( i.e., fees paid to smelters and refiners that are generally negotiated annually), including any applicable price participation charges that are based on the market price of copper. In addition, because a portion of the metals contained in copper concentrates is unrecoverable from the smelting process, revenues from South America's concentrate sales are also recorded net of allowances for unrecoverable metals, which are a negotiated term of the contracts and vary by customer.
Indonesia . PT-FI sells its production in the form of copper concentrate, which contains significant quantities of gold and silver, under U.S. dollar-denominated, long-term contracts. PT-FI also sells a small amount of copper concentrates in the spot market. Following is a summary of PT-FI's aggregate percentage concentrate sales to PT Smelting, Atlantic Copper and third parties for the last three years:
| 2014 |
| 2013 |
| 2012 | |||
PT Smelting | 58 | % |
| 41 | % |
| 52 | % |
Atlantic Copper | 6 | % |
| 9 | % |
| 11 | % |
Third parties | 36 | % |
| 50 | % |
| 37 | % |
| 100 | % |
| 100 | % |
| 100 | % |
Substantially all of PT-FI's concentrate sales contracts provide final copper pricing in a specified future month (generally one to four months from the shipment date) primarily based on quoted LME monthly average spot copper prices. Revenues from PT-FI's concentrate sales are recorded net of royalties, export duties, treatment charges, and allowances for unrecoverable metals.
Africa . TFM sells its production in the form of copper cathode under U.S. dollar-denominated contracts. Substantially all of TFM's cathode sales provide final copper pricing in the month after the shipment date based on quoted LME monthly average spot copper prices. Revenues from TFM's cathode sales are recorded net of royalties and also include adjustments for point-of-sale transportation costs that are negotiated in customer contracts.
Gold Products and Sales
We produce gold, mostly from the Grasberg minerals district. Gold is primarily sold as a component of our copper concentrate or in slimes, which are a product of the smelting and refining process at Atlantic Copper. Gold generally is priced at the average London price for a specified month near the month of shipment. Revenues from gold sold as a component of our copper concentrate are recorded net of treatment and refining charges. Revenues from gold sold in slimes are recorded net of refining charges.
5
Table of Contents
Molybdenum Products and Sales
We are the world's largest producer of molybdenum and molybdenum-based chemicals. In addition to production from our Henderson and Climax molybdenum mines, we produce molybdenum concentrate at certain of our North America copper mines and our Cerro Verde copper mine in Peru. The majority of our molybdenum concentrates are processed in our own conversion facilities. Molybdenum generally is priced based on the average Metals Week price for the month prior to the month of shipment.
Cobalt and Silver Products and Sales
We produce cobalt hydroxide at the Tenke minerals district. Cobalt hydroxide is priced at a discount to the average monthly low price as published by Metal Bulletin or using LME-based pricing for a specified month near the month of shipment.
We also produce silver as a component of our copper concentrate or in slimes. Silver generally is priced at the average London price for a specified month near the month of shipment.
Oil and Gas Products and Sales
We produce and sell oil and gas in the U.S. Our oil production is primarily sold under contracts with prices based upon regional benchmarks. Approximately 40 percent of our gas production is sold monthly based on published index pricing, with the remainder priced daily on the spot market.
Approximately 70 percent of our California production is attributable to heavy crude oil, which is primarily sold under a long-term contract with prices based upon regional benchmarks. In the GOM, our share of oil and gas production is sold under a series of contracts pursuant to which crude oil is sold directly to refineries in the Gulf Coast regions of Texas and Louisiana at prices based on widely used industry benchmarks.
LABOR MATTERS
At December 31, 2014 , we employed approximately 35,000 people (13,200 in the U.S., 12,000 in Indonesia, 4,900 in South America, 3,500 in Africa and 1,400 in Europe and other locations). Additionally, we have contractors that have personnel at many of our operations, including approximately 19,800 at our South America mining operations (including contractors for the Cerro Verde expansion), 18,000 at the Grasberg minerals district, 4,600 at the Tenke minerals district, 3,400 in the U.S. and 500 in Europe and other locations. The number of employees represented by unions at December 31, 2014, and the expiration date of the applicable union agreements are listed below.
Location | Number of Unions | Number of Union- Represented Employees | Expiration Date | |||
PT-FI – Indonesia | 1 | 9,244 | | September 2015 |
| |
TFM – DRC | 11 | 3,404 | | N/A | a | |
Cerro Verde – Peru | 3 | 2,058 | | August 2018 |
| |
El Abra – Chile | 2 | 1,069 | | May 2016 |
| |
Atlantic Copper – Spain | 2 | 434 | | December 2015 |
| |
Kokkola - Finland | 3 | 412 | | November 2016 |
| |
Rotterdam – The Netherlands | 2 | 59 | | March 2015 |
| |
Bayway – New Jersey | 1 | 37 | | April 2016 |
| |
Stowmarket – United Kingdom | 1 | 35 | | May 2017 |
| |
a. | The Collective Labor Agreement between TFM and its workers' unions has no expiration date, but can be amended at any time in accordance with an established process. In September 2012, TFM negotiated a 4-year salary scale with union-represented employees. |
Refer to Item 1A. "Risk Factors" for further information on labor matters.
6
Table of Contents
ENVIRONMENTAL AND RECLAMATION MATTERS
The cost of complying with environmental laws is a fundamental and substantial cost of our business. For information about environmental regulation, litigation and related costs, refer to Item 1A. "Risk Factors" and Notes 1 and 12 .
COMPETITION
The top 10 producers of copper comprise approximately half of total worldwide mined copper production. We currently rank second among those producers, with approximately eight percent of total worldwide estimated mined copper production. Our competitive position is based on the size, quality and grade of our ore bodies and our ability to manage costs compared with other producers. We have a diverse portfolio of mining operations with varying ore grades and cost structures. Our costs are driven by the location, grade and nature of our ore bodies and the level of input costs, including energy, labor and equipment. The metals markets are cyclical and our ability to maintain our competitive position over the long term is based on our ability to acquire and develop quality deposits, hire and retain a skilled workforce and to manage our costs.
Within the oil and gas industry, our competitors include national and international oil companies, major integrated oil and gas companies, numerous independent oil and gas companies and others. There is substantial competition in the oil and gas industry. Our ability to identify and successfully develop additional prospects and to discover oil and gas reserves in the future will depend on our ability to evaluate and select suitable properties, consummate transactions and manage our operations in a cost-efficient and effective manner in a highly competitive environment.
MINING OPERATIONS
Following are maps and descriptions of our mining operations in North America (including both copper and molybdenum operations), South America, Indonesia and Africa.
North America
In the U.S., most of the land occupied by our copper and molybdenum mines, concentrators, SX/EW facilities, smelter, refinery, rod mills, molybdenum roasters and processing facilities is generally owned by us or is located on unpatented mining claims owned by us. Certain portions of our Bagdad, Sierrita, Miami, Chino, Tyrone, Henderson and Climax operations are located on government-owned land and are operated under a Mine Plan of Operations or other use permit. Various federal and state permits or leases on government land are held for purposes incidental to mine operations.
Morenci
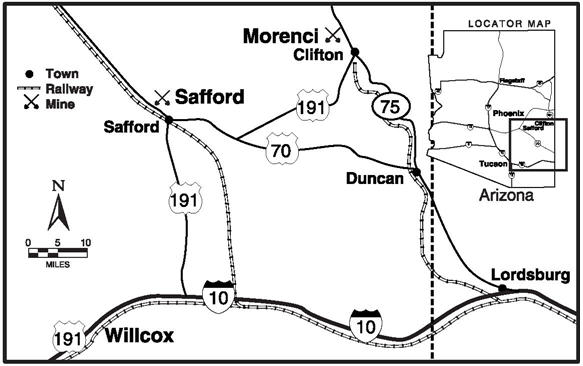
We own an 85 percent undivided interest in Morenci, with the remaining 15 percent owned by affiliates of Sumitomo Corporation. Each partner takes in kind its share of Morenci's production.
Morenci is an open-pit copper mining complex that has been in continuous operation since 1939 and previously was mined through underground workings. Morenci is located in Greenlee County, Arizona, approximately 50 miles northeast of Safford on U.S. Highway 191. The site is accessible by a paved highway and a railway spur.
7
Table of Contents
The Morenci mine is a porphyry copper deposit that has oxide and secondary sulfide mineralization, and primary sulfide mineralization. The predominant oxide copper mineral is chrysocolla. Chalcocite is the most important secondary copper sulfide mineral with chalcopyrite as the dominant primary copper sulfide.
The Morenci operation consists of two concentrators capable of milling 115,000 metric tons-per-day, which produce copper and molybdenum concentrates; a 68,000 metric ton-per-day crushed-ore leach pad and stacking system; a low-grade run-of-mine (ROM) leaching system; four SX plants; and three EW tank houses that produce copper cathode. Total EW tank house capacity is approximately 900 million pounds of copper per year. Morenci's concentrate leach, direct-electrowinning facility, which was placed on care-and-maintenance status in early 2009, is expected to resume operation during 2015. Morenci's available mining fleet consists of one hundred and eleven 236-metric ton haul trucks loaded by 12 shovels with bucket sizes ranging from 47 to 57 cubic meters, which are capable of moving an average of 815,000 metric tons of material per day.
Morenci has expanded its mining and milling capacity to process additional sulfide ores identified through exploratory drilling. The mill expansion project commenced operations in May 2014 and is expected to achieve full rates in first-quarter 2015. The project targets average incremental annual production (net of our joint venture partner's share) of approximately 225 million pounds of copper through an increase in milling rates from 50,000 metric tons of ore per day to 115,000 metric tons of ore per day. Morenci's copper production (net of our joint venture partner's share) is expected to average over 900 million pounds per year over the next five years, compared with 691 million pounds for the year 2014.
Construction of the expanded Morenci milling facility is substantially complete. Remaining items include completion of the molybdenum circuit, which would add capacity of approximately 9 million pounds of molybdenum per year, and the construction of an expanded tailings storage facility. Both are expected to be completed in 2015.
Morenci's production, including our joint venture partner's share, totaled 812 million pounds of copper and less than 1 million pounds of molybdenum in 2014 , 664 million pounds of copper and 2 million pounds of molybdenum in 2013 , and 632 million pounds of copper and 3 million pounds of molybdenum in 2012 .
Morenci is located in a desert environment with rainfall averaging 13 inches per year. The highest bench elevation is 2,000 meters above sea level and the ultimate pit bottom is expected to have an elevation of 840 meters above sea level. The Morenci operation encompasses approximately 65,100 acres, comprising 51,150 acres of patented mining claims and other fee lands, 10,900 acres of unpatented mining claims and 3,050 acres of land held by state or federal permits, easements and rights-of-way.
The Morenci operation's electrical power is primarily sourced from Tucson Electric Power Company, Arizona Public Service Company and the Luna Energy facility in Deming, New Mexico. Although we believe the Morenci operation has sufficient water sources to support current operations, we are a party to litigation that may impact our water rights claims or rights to continued use of currently available water supplies, which could adversely affect our water supply for the Morenci operation. Refer to Item 1A. "Risk Factors" and Item 3. "Legal Proceedings" for further discussion.
Bagdad
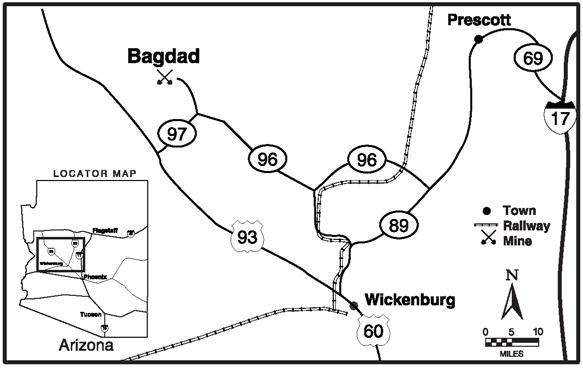
Our wholly owned Bagdad mine is an open-pit copper and molybdenum mining complex located in Yavapai County in west-central Arizona. It is approximately 60 miles west of Prescott and 100 miles northwest of Phoenix. The
8
Table of Contents
property can be reached by Arizona Highway 96, which ends at the town of Bagdad. The closest railroad is at Hillside, Arizona, approximately 24 miles southeast on Arizona Highway 96. The open-pit mining operation has been ongoing since 1945, and prior mining was conducted through underground workings.
The Bagdad mine is a porphyry copper deposit containing both sulfide and oxide mineralization. Chalcopyrite and molybdenite are the dominant primary sulfides and are the primary economic minerals in the mine. Chalcocite is the most common secondary copper sulfide mineral, and the predominant oxide copper minerals are chrysocolla, malachite and azurite.
The Bagdad operation consists of a 75,000 metric ton-per-day concentrator that produces copper and molybdenum concentrates, an SX/EW plant that can produce up to 32 million pounds per year of copper cathode from solution generated by low-grade stockpile leaching, and a pressure leach plant to process molybdenum concentrates. The available mining fleet consists of thirty 235-metric ton haul trucks loaded by five shovels with bucket sizes ranging from 44 to 62 cubic meters, which are capable of moving an average of 200,000 metric tons of material per day.
Bagdad's production totaled 237 million pounds of copper and 9 million pounds of molybdenum in 2014 , 216 million pounds of copper and 8 million pounds of molybdenum in 2013 , and 197 million pounds of copper and 10 million pounds of molybdenum in 2012 .
Bagdad is located in a desert environment with rainfall averaging 15 inches per year. The highest bench elevation is 1,200 meters above sea level and the ultimate pit bottom is expected to be 310 meters above sea level. The Bagdad operation encompasses approximately 21,750 acres, comprising 21,150 acres of patented mining claims and other fee lands and 600 acres of unpatented mining claims.
Bagdad receives electrical power from Arizona Public Service Company. Although we believe the Bagdad operation has sufficient water sources to support current operations, we are a party to litigation that may set legal precedents, which could adversely affect our water rights at Bagdad and at our other properties in Arizona. Refer to Item 1A. "Risk Factors" and Item 3. "Legal Proceedings" for further discussion.
Safford
Our wholly owned Safford mine has been in operation since 2007 and is an open-pit copper mining complex located in Graham County, Arizona, approximately eight miles north of the town of Safford and 170 miles east of Phoenix. The site is accessible by paved county road off U.S. Highway 70.
The Safford mine includes two copper deposits that have oxide mineralization overlaying primary copper sulfide mineralization. The predominant oxide copper minerals are chrysocolla and copper-bearing iron oxides with the predominant copper sulfide material being chalcopyrite.
The property is a mine-for-leach project and produces copper cathodes. The operation consists of two open pits feeding a crushing facility with a capacity of 103,000 metric tons per day. The crushed ore is delivered to leach pads by a series of overland and portable conveyors. Leach solutions feed a SX/EW facility with a capacity of 240 million pounds of copper per year. A sulphur burner plant is also in operation at Safford, providing a cost-effective source of sulphuric acid used in SX/EW operations. The available mining fleet consists of sixteen 235-metric ton haul trucks loaded by four shovels with bucket sizes ranging from 31 to 34 cubic meters, which are capable of moving an average of 225,000 metric tons of material per day.
9
Table of Contents
Safford's copper production totaled 139 million pounds in 2014 , 146 million pounds in 2013 and 175 million pounds in 2012 .
Safford is located in a desert environment with rainfall averaging 10 inches per year. The highest bench elevation is 1,250 meters above sea level and the ultimate pit bottom is expected to have an elevation of 750 meters above sea level. The Safford operation encompasses approximately 25,000 acres, comprising 21,000 acres of patented lands, 3,950 acres of unpatented lands and 50 acres of land held by federal permit.
The Safford operation's electrical power is primarily sourced from Tucson Electric Power Company, Arizona Public Service Company and the Luna Energy facility. Although we believe the Safford operation has sufficient water sources to support current operations, we are a party to litigation that may impact our water right claims or rights to continued use of currently available water supplies, which could adversely affect our water supply for the Safford operation. Refer to Item 1A. "Risk Factors" and Item 3. "Legal Proceedings" for further discussion.
Sierrita
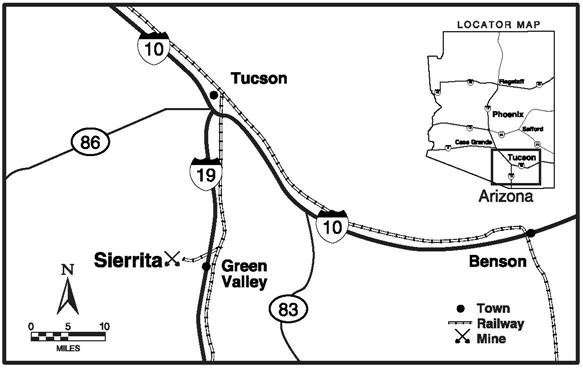
Our wholly owned Sierrita mine has been in operation since 1959 and is an open-pit copper and molybdenum mining complex located in Pima County, Arizona, approximately 20 miles southwest of Tucson and seven miles west of the town of Green Valley and Interstate Highway 19. The site is accessible by a paved highway and by rail.
The Sierrita mine is a porphyry copper deposit that has oxide and secondary sulfide mineralization, and primary sulfide mineralization. The predominant oxide copper minerals are malachite, azurite and chrysocolla. Chalcocite is the most important secondary copper sulfide mineral, and chalcopyrite and molybdenite are the dominant primary sulfides.
The Sierrita operation includes a 102,000 metric ton-per-day concentrator that produces copper and molybdenum concentrates. Sierrita also produces copper from a ROM oxide-leaching system. Cathode copper is plated at the Twin Buttes EW facility, which has a design capacity of approximately 50 million pounds of copper per year. The Sierrita operation also has a copper sulfate crystal plant, which has the capacity to produce 40 million pounds of copper sulfate per year, and molybdenum facilities consisting of a leaching circuit, two molybdenum roasters and a packaging facility. The molybdenum facilities process molybdenum concentrate produced by Sierrita, from our other mines and from third-party sources. The available mining fleet consists of twenty-five 235-metric ton haul trucks loaded by four shovels with bucket sizes ranging from 34 to 56 cubic meters, which are capable of moving an average of 200,000 metric tons of material per day.
Sierrita's production totaled 195 million pounds of copper and 24 million pounds of molybdenum in 2014 , 171 million pounds of copper and 20 million pounds of molybdenum in 2013 , and 157 million pounds of copper and 21 million pounds of molybdenum in 2012 .
Sierrita is located in a desert environment with rainfall averaging 12 inches per year. The highest bench elevation is 1,160 meters above sea level and the ultimate pit bottom is expected to be 440 meters above sea level. The Sierrita operation, including the adjacent Twin Buttes site (refer to "Smelting Facilities and Other Mining Properties" for further discussion), encompasses approximately 37,650 acres, comprising 13,300 acres of patented mining claims and 24,350 acres of split-estate lands.
10
Table of Contents
Sierrita receives electrical power through long-term contracts with the Tucson Electric Power Company. Although we believe the Sierrita operation has sufficient water sources to support current operations, we are a party to litigation that may impact our water rights claims or rights to continued use of currently available water supplies, which could adversely affect our water supply for the Sierrita operation. Refer to Item 1A. "Risk Factors" and Item 3. "Legal Proceedings" for further discussion.
Miami
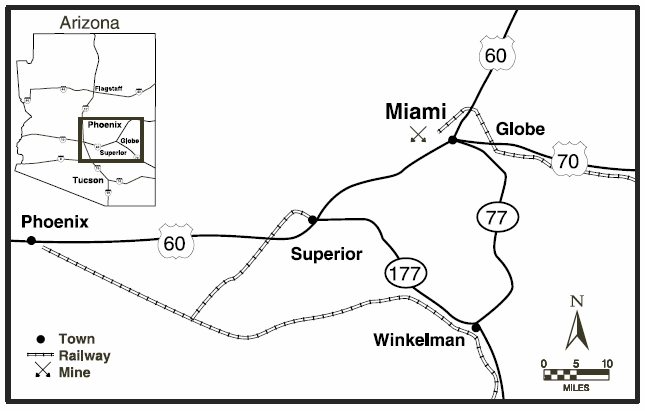
Our wholly owned Miami mine is an open-pit copper mining complex located in Gila County, Arizona, approximately 90 miles east of Phoenix and six miles west of the city of Globe on U.S. Highway 60. The site is accessible by a paved highway and by rail.
The Miami mine is a porphyry copper deposit that has leachable oxide and secondary sulfide mineralization. The predominant oxide copper minerals are chrysocolla, copper-bearing clays, malachite and azurite. Chalcocite and covellite are the most important secondary copper sulfide minerals.
Since about 1915, the Miami mining operation had processed copper ore using both flotation and leaching technologies. Current operations include leaching by the SX/EW process. The design capacity of the SX/EW plant is 200 million pounds of copper per year. The available mining fleet consists of six 227-metric ton haul trucks loaded by one 34 cubic meter shovel dipper and one 19 cubic meter loader dipper. This fleet is capable of moving an average of 35,000 metric tons of material per day.
Miami's copper production totaled 57 million pounds in 2014 , 61 million pounds in 2013 and 66 million pounds in 2012 .
Miami is located in a desert environment with rainfall averaging 18 inches per year. The highest bench elevation is 1,390 meters above sea level, and the ultimate pit bottom will have an elevation of 810 meters above sea level. The Miami operation encompasses approximately 9,100 acres, comprising 8,750 acres of patented mining claims and other fee lands and 350 acres of unpatented mining claims.
Miami receives electrical power through long-term contracts with the Salt River Project and natural gas through long-term contracts with El Paso Natural Gas as the transporter. Although we believe the Miami operation has sufficient water sources to support current operations, we are a party to litigation that may impact our water right claims or rights to continued use of currently available water supplies, which could adversely affect our water supply for the Miami operation. Refer to Item 1A. "Risk Factors" and Item 3. "Legal Proceedings" for further discussion.
11
Table of Contents
Chino and Tyrone
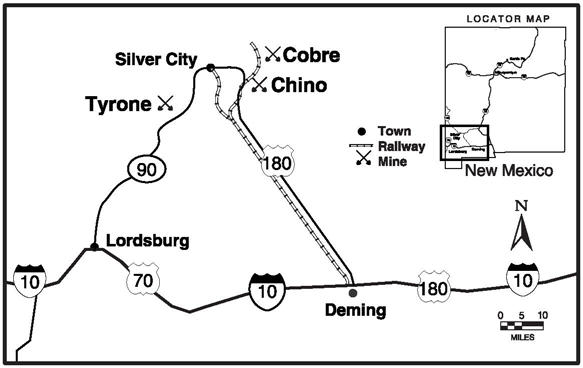
Chino
Our wholly owned Chino mine is an open-pit copper mining complex located in southwestern New Mexico in Grant County, approximately 15 miles east of the town of Silver City off of State Highway 180. The mine is accessible by paved roads and by rail. Chino has been in operation since 1910.
The Chino mine is a porphyry copper deposit with adjacent copper skarn deposits. There is leachable oxide and secondary sulfide mineralization, and millable primary sulfide mineralization. The predominant oxide copper mineral is chrysocolla. Chalcocite is the most important secondary copper sulfide mineral, and chalcopyrite and molybdenite the dominant primary sulfides.
The Chino operation consists of a 36,000 metric ton-per-day concentrator that produces copper and molybdenum concentrates, and a 150 million pound-per-year SX/EW plant that produces copper cathode from solution generated by ROM leaching. The available mining fleet consists of thirty-six 240-metric ton haul trucks loaded by four shovels with bucket sizes ranging from 42 to 48 cubic meters, which are capable of moving an average of 220,000 metric tons of material per day.
Chino's production totaled 250 million pounds of copper and less than 1 million pounds of molybdenum in 2014 , 171 million pounds of copper and 2 million pounds of molybdenum in 2013 , and 144 million pounds of copper and 2 million pounds of molybdenum in 2012 .
Chino is located in a desert environment with rainfall averaging 16 inches per year. The highest bench elevation is 2,250 meters above sea level, and the ultimate pit bottom is expected to be 1,500 meters above sea level. The Chino operation encompasses approximately 118,600 acres, comprising 113,200 acres of patented mining claims and other fee lands and 5,400 acres of unpatented mining claims.
Chino receives power from the Luna Energy facility and from the open market. We believe Chino has sufficient water resources to support current operations.
Tyrone
Our wholly owned Tyrone mine is an open-pit copper mining complex which has been in operation since 1967. It is located in southwestern New Mexico in Grant County, approximately 10 miles south of Silver City, New Mexico, along State Highway 90. The site is accessible by paved road and rail.
The Tyrone mine is a porphyry copper deposit. Mineralization is predominantly secondary sulfide consisting of chalcocite with leachable oxide mineralization consisting of chrysocolla.
Copper processing facilities consist of a SX/EW operation with a maximum capacity of approximately 100 million pounds of copper cathodes per year. The available mining fleet consists of nineteen 240-metric ton haul trucks loaded by two shovels with bucket sizes ranging from 17 to 47 cubic meters, which are capable of moving an average of 135,000 metric tons of material per day.
Tyrone's copper production totaled 94 million pounds in 2014 , 96 million pounds in 2013 and 83 million pounds in 2012 .
12
Table of Contents
Tyrone is located in a desert environment with rainfall averaging 16 inches per year. The highest bench elevation is 2,000 meters above sea level and the ultimate pit bottom is expected to have an elevation of 1,500 meters above sea level. The Tyrone operation encompasses approximately 35,200 acres, comprising 18,750 acres of patented mining claims and other fee lands and 16,450 acres of unpatented mining claims.
Tyrone receives electrical power from the Luna Energy facility and from the open market. We believe the Tyrone operation has sufficient water resources to support current operations.
Henderson and Climax
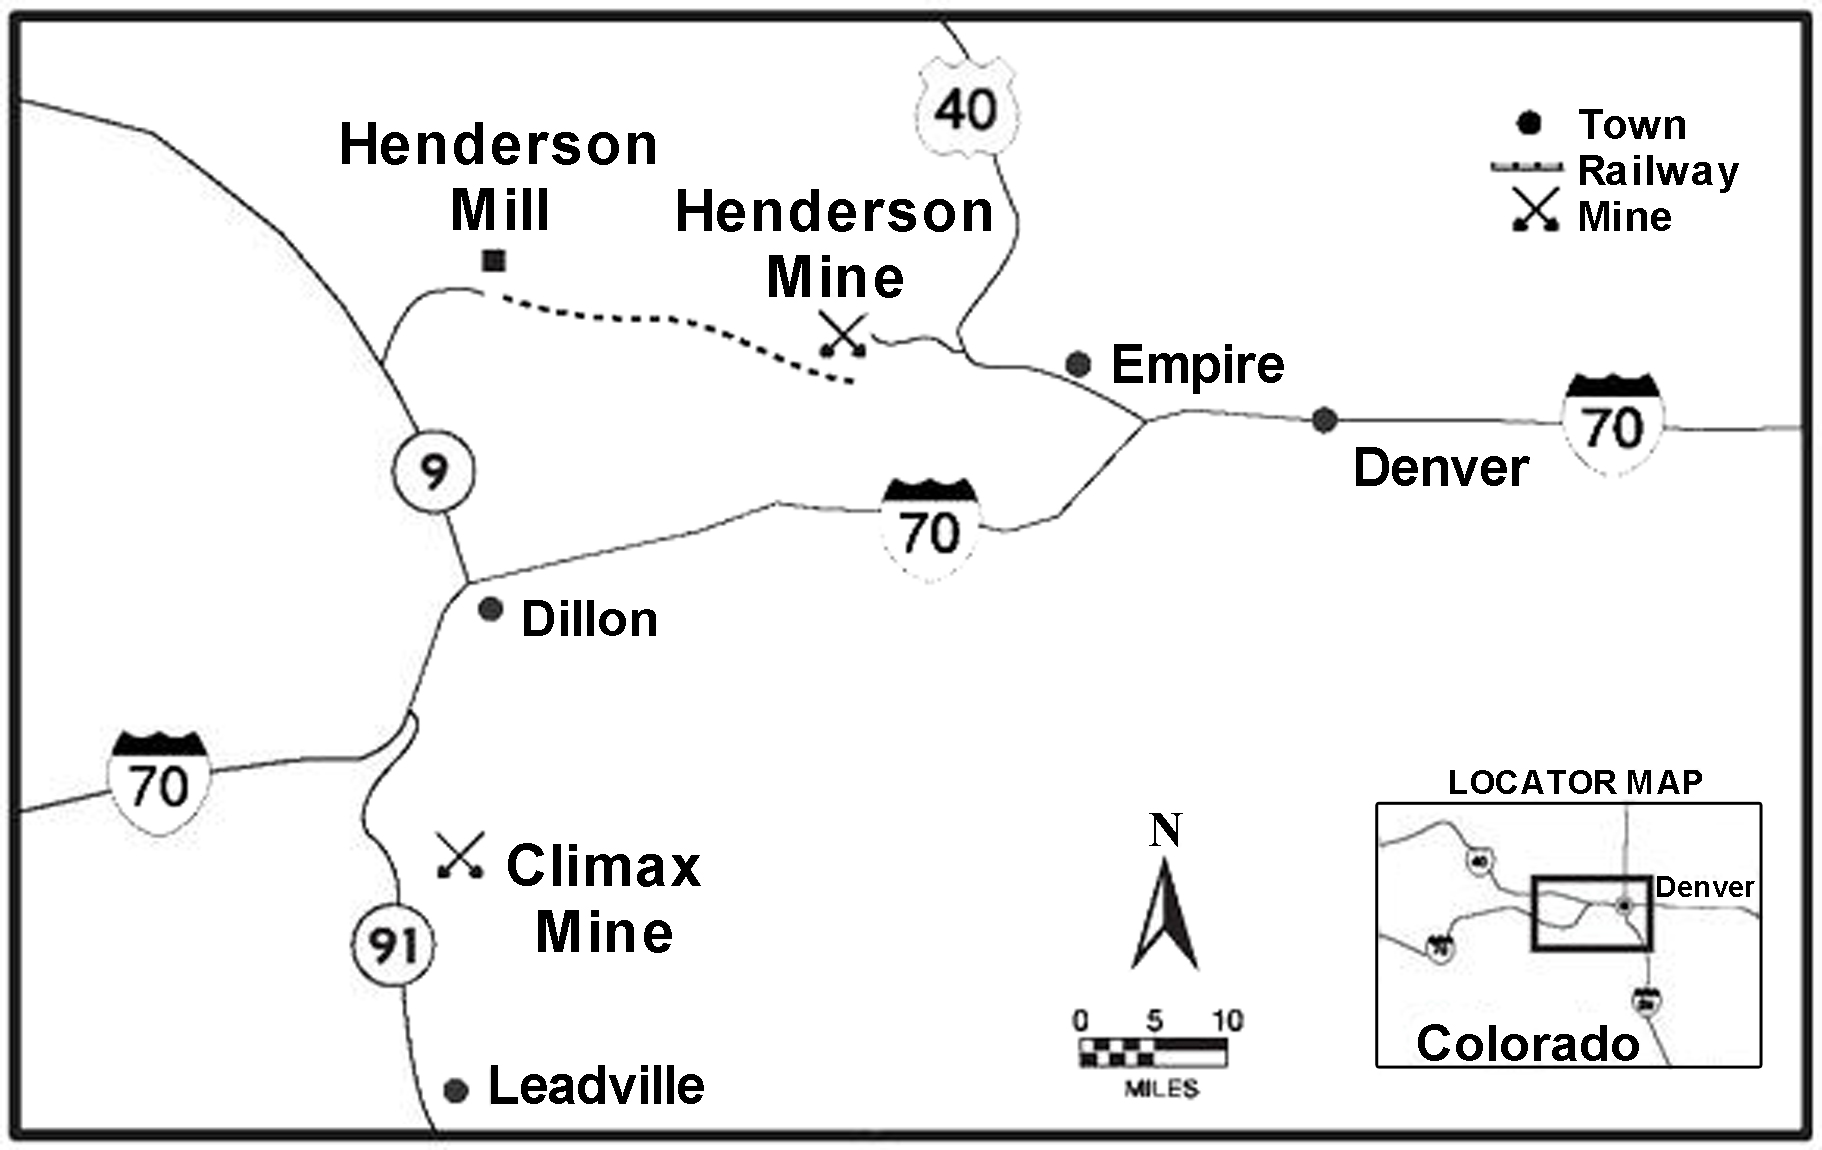
Henderson
Our wholly owned Henderson molybdenum mine has been in operation since 1976 and is located approximately 42 miles west of Denver, Colorado, off U.S. Highway 40. Nearby communities include the towns of Empire, Georgetown and Idaho Springs. The Henderson mill site is located approximately 15 miles west of the mine and is accessible from Colorado State Highway 9. The Henderson mine and mill are connected by a 10-mile conveyor tunnel under the Continental Divide and an additional five-mile surface conveyor. The tunnel portal is located five miles east of the mill.
The Henderson mine is a porphyry molybdenum deposit with molybdenite as the primary sulfide mineral.
The Henderson operation consists of a large block-cave underground mining complex feeding a concentrator with a current capacity of approximately 32,000 metric tons per day. Henderson has the capacity to produce approximately 40 million pounds of molybdenum per year. The majority of the molybdenum concentrate produced is shipped to our Fort Madison, Iowa, processing facility. The available underground mining equipment fleet consists of fourteen 9-metric ton load-haul-dump (LHD) units and seven 73-metric ton haul trucks, which deliver ore to a gyratory crusher feeding a series of three overland conveyors to the mill stockpiles.
Henderson's molybdenum production totaled 30 million pounds in both 2014 and 2013 and 34 million pounds in 2012 .
The Henderson mine is located in a mountainous region with the main access shaft at 3,180 meters above sea level. The main production levels are currently at elevations of 2,200 and 2,350 meters above sea level. This region experiences significant snowfall during the winter months.
The Henderson mine and mill operations encompass approximately 11,900 acres, comprising 11,850 acres of patented mining claims and other fee lands and a 50-acre easement with the U.S. Forest Service for the surface portion of the conveyor corridor.
Henderson operations receive electrical power through long-term contracts with Xcel Energy and natural gas through long-term contracts with BP Energy Company (with Xcel Energy as the transporter). We believe the Henderson operation has sufficient water resources to support current operations.
Climax
Our wholly owned Climax mine is located 13 miles northeast of Leadville, Colorado, off Colorado State Highway 91 at the top of Fremont Pass. The mine is accessible by paved roads .
13
Table of Contents
The Climax ore body is a porphyry molybdenum deposit with molybdenite as the primary sulfide mineral.
The Climax open-pit mine includes a 25,000 metric ton-per-day mill facility. The available mining fleet consists of nine 177-metric ton haul trucks loaded by two hydraulic shovels with bucket sizes of 34 cubic meters, which are capable of moving an average of 90,000 metric tons of material per day.
Molybdenum production from Climax totaled 21 million pounds in 2014, 19 million pounds in 2013 and 7 million pounds in 2012 (reflecting production since the start of commercial operations in May 2012).
The Climax mine is located in a mountainous region. The highest bench elevation is approximately 4,050 meters above sea level, and the ultimate pit bottom is expected to have an elevation of approximately 3,100 meters above sea level. This region experiences significant snowfall during the winter months.
The operations encompass approximately 14,350 acres, consisting primarily of patented mining claims and other fee lands.
Climax operations receive electrical power through long-term contracts with Xcel Energy and natural gas through long-term contracts with BP Energy Company (with Xcel Energy as the transporter). We believe the Climax operation has sufficient water resources to support current operations.
South America
At our operations in South America, mine properties and facilities are controlled through mining claims or concessions under the general mining laws of the relevant country. The claims or concessions are owned or controlled by the operating companies in which we or our subsidiaries have a controlling ownership interest. Roads, power lines and aqueducts are controlled by easements.
Cerro Verde
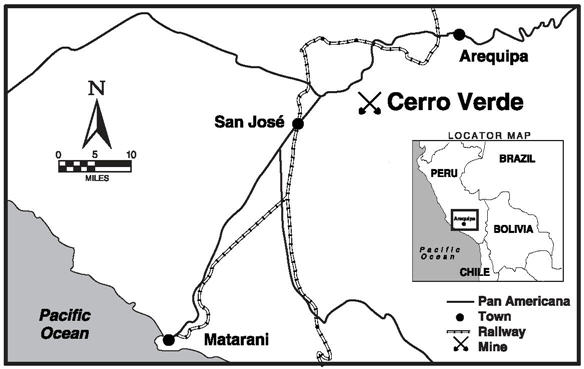
We have a 53.56 percent ownership interest in Cerro Verde, with the remaining 46.44 percent held by SMM Cerro Verde Netherlands B.V. (21.0 percent), Compañia de Minas Buenaventura S.A.A. (19.58 percent) and other stockholders whose shares are publicly traded on the Lima Stock Exchange (5.86 percent).
Cerro Verde is an open-pit copper and molybdenum mining complex that has been in operation since 1976 and is located 20 miles southwest of Arequipa, Peru. The site is accessible by paved highway. A majority of Cerro Verde's copper cathode production is sold locally and the remaining copper cathodes and concentrate production are transported approximately 70 miles by truck and rail to the Port of Matarani for shipment to international markets.
The Cerro Verde mine is a porphyry copper deposit that has oxide and secondary sulfide mineralization, and primary sulfide mineralization. The predominant oxide copper minerals are brochantite, chrysocolla, malachite and copper "pitch." Chalcocite and covellite are the most important secondary copper sulfide minerals. Chalcopyrite and molybdenite are the dominant primary sulfides.
Cerro Verde's current operation consists of an open-pit copper mine, a 120,000 metric ton-per-day concentrator and SX/EW leaching facilities. Leach copper production is derived from a 39,000 metric ton-per-day crushed leach facility and a ROM leach system. This SX/EW leaching operation has a capacity of approximately 200 million pounds of copper per year.
14
Table of Contents
The available fleet consists of two 305-metric ton haul trucks and fifty-five 230-metric ton haul trucks loaded by six electric shovels with bucket sizes ranging in size from 33 to 57 cubic meters and one hydraulic shovel with a bucket size of 21 cubic meters. This fleet is capable of moving an average of approximately 450,000 metric tons of material per day.
Construction activities associated with a large-scale expansion at Cerro Verde are advancing toward completion in late 2015. Detailed engineering and major procurement activities are complete and construction progress is more than 50 percent complete. The project will expand the concentrator facilities from 120,000 metric tons of ore per day to 360,000 metric tons of ore per day and provide incremental annual production of approximately 600 million pounds of copper and 15 million pounds of molybdenum beginning in 2016.
Cerro Verde's production totaled 500 million pounds of copper and 11 million pounds of molybdenum in 2014 , 558 million pounds of copper and 13 million pounds of molybdenum in 2013 , and 595 million pounds of copper and 8 million pounds of molybdenum in 2012 .
Cerro Verde is located in a desert environment with rainfall averaging 1.5 inches per year and is in an active seismic zone. The highest bench elevation is 2,750 meters above sea level and the ultimate pit bottom is expected to be 1,570 meters above sea level. The Peruvian general mining law and Cerro Verde's mining stability agreement grants the surface rights of mining concessions located on government land. Cerro Verde has a mining concession covering approximately 157,000 acres, including 14,500 acres rented from the Regional Government of Arequipa, plus 71 acres of owned property, and 80 acres of rights-of-way outside the mining concession area.
Cerro Verde receives electrical power under long-term contracts with Kallpa Generación SA and Empresa de Generación Eléctrica de Arequipa. Cerro Verde will also begin to receive electrical power under long-term contracts with ElectroPeru beginning in 2015 to supply energy to the expanded facilities.
Water for our Cerro Verde processing operations comes from renewable sources through a series of storage reservoirs on the Rio Chili watershed that collect water primarily from seasonal precipitation. Cerro Verde's participation in the Pillones Reservoir Project has allowed better regulation of the Rio Chili system, securing water rights that we believe will be sufficient to support Cerro Verde's current operations. An agreement has been reached with the Regional Government of Arequipa, the National Government, the local water utility company, Servicio de Agua Potable y Alcantarillado de Arequipa S.A. (SEDAPAR), and other local institutions to allow Cerro Verde to finance, engineer and construct a wastewater treatment plant for the city of Arequipa, which would be used to supplement existing water supplies to support the concentrator expansion. For further discussion of risks associated with the availability of water, see Item 1A. "Risk Factors."
El Abra
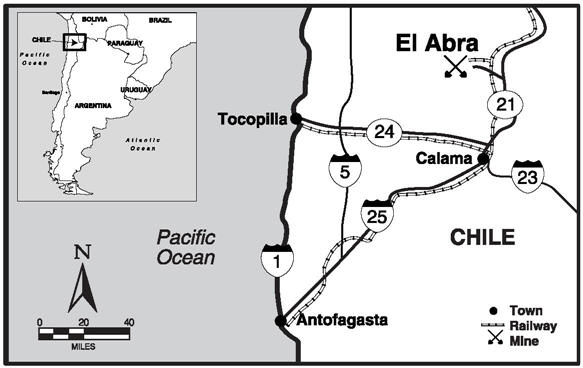
We own a 51 percent interest in El Abra, and the remaining 49 percent interest is held by the state-owned copper enterprise Corporación Nacional del Cobre de Chile (CODELCO).
El Abra is an open-pit copper mining complex that has been in operation since 1996 and is located 47 miles north of Calama in Chile's El Loa province, Region II. The site is accessible by paved highway and by rail.
15
Table of Contents
The El Abra mine is a porphyry copper deposit that has sulfide and oxide mineralization. The predominant primary sulfide copper minerals are bornite and chalcopyrite. There is a minor amount of secondary sulfide mineralization
as chalcocite. The oxide copper minerals are chrysocolla and pseudomalachite. There are lesser amounts of copper-bearing clays and tenorite.
The El Abra operation consists of an open-pit copper mine and a SX/EW facility with a capacity of 500 million pounds of copper cathode per year from a 125,000 metric ton-per-day crushed leach circuit and a similar-sized ROM leaching operation. The available fleet consists of forty-one 220-metric ton haul trucks loaded by four shovels with buckets ranging in size from 26 to 41 cubic meters, which are capable of moving an average of 214,000 metric tons of material per day.
El Abra's copper production totaled 367 million pounds in 2014 , 343 million pounds in 2013 and 338 million pounds in 2012 .
We continue to evaluate a potential large-scale milling operation at El Abra to process additional sulfide material and to achieve higher recoveries. Exploration results in recent years at El Abra indicate a significant sulfide resource, which could potentially support a major mill project. Future investments will be dependent on technical studies, economic factors and global copper market conditions.
El Abra is located in a desert environment with rainfall averaging less than one inch per year and is in an active seismic zone. The highest bench elevation is 4,180 meters above sea level and the ultimate pit bottom is expected to be 3,430 meters above sea level. El Abra controls a total of approximately 151,300 acres of mining claims covering the ore deposit, stockpiles, process plant, and water wellfield and pipeline. In addition, El Abra has land surface rights for the road between the processing plant and the mine, the water wellfield, power transmission lines and for the water pipeline from the Salar de Ascotán aquifer.
El Abra currently receives electrical power under a long-term contract with E-Cl. Water for our El Abra processing operations comes from pumping of groundwater from the Salar de Ascotán aquifer pursuant to regulatory approval. We believe El Abra has sufficient water rights and regulatory approvals to support current operations. For a discussion of risks associated with the availability of water, see Item 1A. "Risk Factors."
Indonesia
Ownership . PT-FI is a limited liability company organized under the laws of the Republic of Indonesia. We directly own 81.28 percent of the outstanding common stock of PT-FI and indirectly own 9.36 percent through our wholly owned subsidiary, PT Indocopper Investama; the Indonesian government owns the remaining 9.36 percent.
16
Table of Contents
PT-FI has established an unincorporated joint venture with Rio Tinto, under which Rio Tinto has a 40 percent interest in certain assets and future production exceeding specified annual amounts of copper, gold and silver through 2021 in Block A of PT-FI's Contract of Work (COW), and after 2021, a 40 percent interest in all production from Block A. Refer to Note 3 for further discussion of the joint venture agreement.
Contracts of Work . PT-FI conducts its current exploration and mining operations in Indonesia through a COW with the Indonesian government. The COW governs our rights and obligations relating to taxes, exchange controls, royalties, repatriation and other matters, and was concluded pursuant to the 1967 Foreign Capital Investment Law, which expresses Indonesia's foreign investment policy and provides basic guarantees of remittance rights and protection against nationalization, a framework for economic incentives and basic rules regarding other rights and obligations of foreign investors. Specifically, the COW provides that the Indonesian government will not nationalize or expropriate PT-FI's mining operations. Any disputes regarding the provisions of the COW are subject to international arbitration; however, we have not had an arbitration during the more than 40 years we have operated in Indonesia.
PT-FI's original COW was entered into in 1967 and was replaced by the current COW in 1991. The initial term of the current COW expires in 2021, but can be extended for two 10-year periods subject to Indonesian government approval, which pursuant to the COW cannot be withheld or delayed unreasonably. The COW allows us to conduct exploration, mining and production activities in the 24,700-acre Block A area, which is where all of PT-FI's proven and probable mineral reserves and all its current mining operations are located. Under the COW, PT-FI also conducts exploration activities in the Block B area currently covering 502,000 acres. Ongoing negotiations for an amended COW, discussed below and in Note 13 , may result in relinquishments of the Block B acreage.
PT-FI pays royalties on copper, gold and silver in the concentrate it sells. Prior to the modifications discussed below as of a result of the July 25, 2014, Memorandum of Understanding (MOU), PT-FI had agreed to pay additional royalties to the Indonesian government that are not required under its COW. The additional royalties provided further support to the local governments and to the people of the Indonesian province of Papua. PT-FI's share of the royalties totaled $115 million in 2014 (including the increased royalties per the MOU discussed below), $109 million in 2013 and $93 million in 2012 . Additionally, during 2014 PT-FI paid export duties totaling $77 million in accordance with regulations issued by the Indonesian government on July 25, 2014. Refer to Note 13 and "Regulatory Matters" below for further discussion of increased royalties and export taxes.
Through joint venture agreements under separate COWs, we were allowed to conduct exploration activities in Papua, Indonesia, through two other entities: PT Nabire Bakti Mining (PTNBM) and PT Irja Eastern Minerals (Eastern Minerals), of which we own 100 percent. The COWs for PTNBM and Eastern Minerals expired in 2013, and we are working with the Indonesia government to complete the process to terminate the COWs and return the exploration areas to the Indonesia government. We have completed the required notifications and reviews and are awaiting the termination acceptance documents.
Regulatory Matters . As further discussed in Item 1A. "Risk Factors," PT-FI has been engaged in discussions with officials of the Indonesian government since 2012 regarding various provisions of its COW. The Indonesian government has sought to modify existing mining contracts, including PT-FI's COW, to address provisions of Indonesia's 2009 Mining Law and subsequent regulations, including with respect to the size of contract concessions, government revenues, domestic processing of minerals, divestment, provision of local services, conversion from a contract of work to a licensing framework for extension periods, and a requirement that extensions may be applied for only within two years prior to a contract of work's expiration.
In January 2014, the Indonesian government published regulations providing that holders of contracts of work with existing processing facilities in Indonesia may continue to export product through January 12, 2017, but established new requirements for the continued export of copper concentrates, including the imposition of a progressive export duty on copper concentrates. Despite PT-FI's rights under its COW to export concentrates without the payment of duties, PT-FI was unable to obtain administrative approval for exports and operated at approximately half of its capacity from mid-January 2014 through July 2014.
On July 25, 2014, PT-FI entered into a MOU with the Indonesian government under which PT-FI and the government agreed to negotiate an amended COW to address provisions related to the size of PT-FI's concession area, royalties and taxes, domestic processing and refining, divestment, local content, and continuation of operations post-2021. Execution of the MOU enabled the resumption of concentrate exports, which began in August
17
Table of Contents
2014. The MOU has been extended to July 25, 2015. PT-FI is engaged in active discussions with the Indonesian government regarding an amended COW.
Provisions being addressed in the negotiation of an amended COW include the development of new copper smelting and refining capacity in Indonesia, divestment to the Indonesian government and/or Indonesian nationals of up to a 30 percent interest (an additional 20.64 percent interest) in PT-FI at fair value, and timely granting rights for the continuation of operations from 2022 through 2041. Negotiations are taking into consideration PT-FI's need for assurance of legal and fiscal terms post-2021 for PT-FI to continue with its large-scale investment program for the development of its underground reserves.
Effective with the signing of the MOU, PT-FI provided a $115 million assurance bond to support its commitment for smelter development, agreed to increase royalties to 4.0 percent for copper and 3.75 percent for gold from the previous rates of 3.5 percent for copper and 1.0 percent for gold, and to pay export duties as set forth in a new regulation. The Indonesian government revised its January 2014 regulations regarding export duties, which are now set at 7.5 percent, declining to 5.0 percent when smelter development progress exceeds 7.5 percent and are eliminated when development progress exceeds 30 percent.
PT-FI is advancing plans for the construction of new smelter capacity in parallel with completing negotiations of its long-term operating rights and will also discuss the possibility of expanding industrial activities in Papua in connection with its long-term development plans. PT-FI has identified a site adjacent to the existing PT Smelting site in Gresik, Indonesia, for the construction of additional smelter capacity. Refer to "Mining Development Projects and Exploration" for further discussion.
Under the MOU, no terms of the COW, other than those relating to the export duties, the smelter bond and royalties described above, will be changed until the completion of an amended COW.
PT-FI is required to apply for renewal of export permits at six-month intervals. In January 2015, PT-FI obtained a renewal of its export license through July 25, 2015.
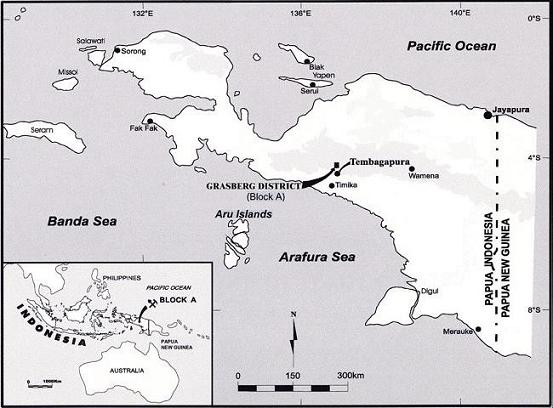
Grasberg Minerals District . PT-FI operates in the remote highlands of the Sudirman Mountain Range in the province of Papua, Indonesia, which is on the western half of the island of New Guinea. We and our predecessors have been the only operator of exploration and mining activities in Block A since 1967.
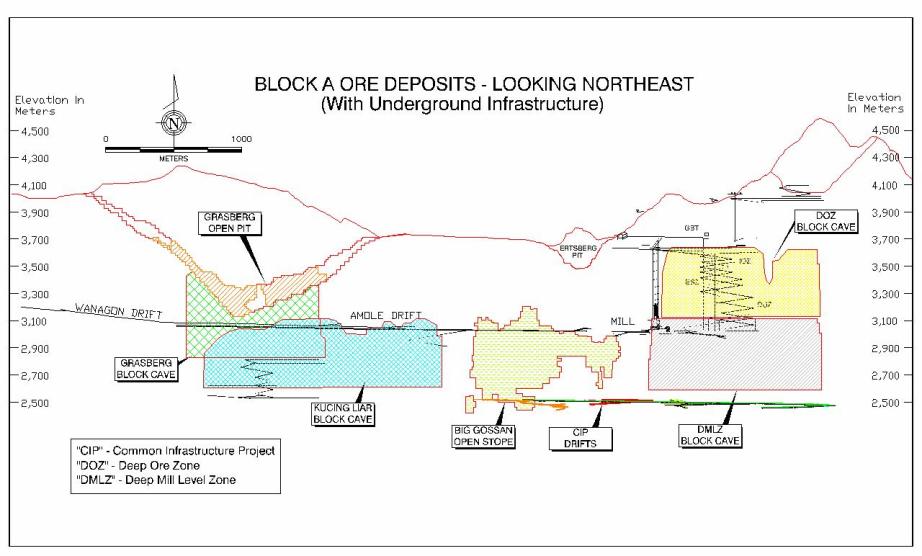
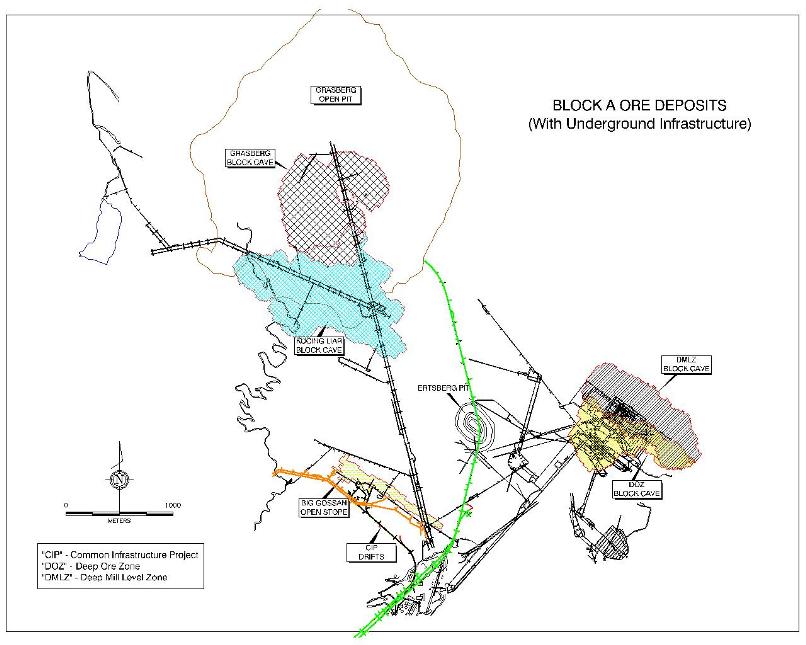
The Grasberg minerals district has three operating mines: the Grasberg open pit, the Deep Ore Zone (DOZ) underground mine and the Big Gossan underground mine. We also have several projects in progress in the Grasberg minerals district related to the development of the large-scale, long-lived, high-grade underground ore bodies located beneath and nearby the Grasberg open pit. In aggregate, these underground ore bodies are expected to ramp up over several years to process approximately 240,000 metric tons of ore per day following the transition from the Grasberg open pit, currently anticipated to occur in late 2017. Refer to MD&A for further discussion.
PT-FI's production, including our joint venture partner's share, totaled 651 million pounds of copper and 1.13 million ounces of gold in 2014 , 928 million pounds of copper and 1.14 million ounces of gold in 2013 and 695 million pounds of copper and 862 thousand ounces of gold in 2012 .
Our principal source of power for all our Indonesian operations is a coal-fired power plant that we built in 1998. Diesel generators supply peaking and backup electrical power generating capacity. A combination of naturally occurring mountain streams and water derived from our underground operations provides water for our operations. Our Indonesian operations are in an active seismic zone and experience average annual rainfall of approximately 200 inches.
Grasberg Open Pit
We began open-pit mining of the Grasberg ore body in 1990, with mining operations expected to continue through the end of 2017. Production in the open pit is currently at the 3,220- to 3,760-meter elevation level and totaled 24 million metric tons of ore in 2014 , which provided 55 percent of PT-FI's 2014 mill feed.
The current open-pit equipment fleet consists of over 500 units. The larger mining equipment directly associated with production includes an available fleet of 150 haul trucks with payloads ranging from 218 to 330 metric tons and
18
Table of Contents
16 shovels with bucket sizes ranging from 30 to 42 cubic meters, which mined an average of 298,000 metric tons of material per day during 2014 , 381,000 metric tons per day in 2013 and 399,000 metric tons per day in 2012 .
Grasberg crushing and conveying systems are integral to the mine and provide the capacity to transport up to 150,000 metric tons per day of Grasberg ore to the mill and 75,000 metric tons per day of overburden to the overburden stockpiles. The remaining overburden is moved by haul trucks. Ore milled from the Grasberg open-pit averaged 69,100 metric tons of ore per day for the year 2014 and is expected to approximate 125,000 metric tons of ore per day for the year 2015.
DOZ Underground Mine
The DOZ ore body lies vertically below the now depleted Intermediate Ore Zone. We began production from the DOZ ore body in 1989 using open stope mining methods, but suspended production in 1991 in favor of production from the Grasberg open pit. Production resumed in September 2000 using the block-cave method and is at the 3,110-meter elevation level. Ore milled from the DOZ mine averaged 50,500 metric tons of ore per day for the year 2014 and is expected to ramp up to approximately 70,000 metric tons of ore per day in the second half of 2015. Production at the DOZ mine is expected to continue through 2020.
The DOZ mine fleet consists of over 250 pieces of mobile equipment, which is capable of mining an average of 80,000 metric tons of material per day. The primary mining equipment directly associated with production and development includes an available fleet of 52 LHD units and 20 haul trucks. Each production LHD unit typically carries approximately 11 metric tons of ore. Using ore passes and chutes, the LHD units transfer ore into 55-metric ton capacity haul trucks. The trucks dump into two gyratory crushers and the ore is then conveyed to the surface stockpiles for processing.
The success of the development of the DOZ mine, one of the world's largest underground mines, provides confidence in the future development of PT-FI's large-scale undeveloped underground ore bodies.
Big Gossan Underground Mine
The Big Gossan mine lies underground and adjacent to the current mill site. It is a tabular, near vertical ore body with approximate dimensions of 1,200 meters along strike and 800 meters down dip with varying thicknesses from 20 meters to 120 meters. The mine utilizes a blasthole stoping method with delayed paste backfill. Stopes of varying sizes are mined and the ore dropped down passes to a truck haulage level. Trucks are chute loaded and transport the ore to a jaw crusher. The crushed ore is then hoisted vertically via a two-skip production shaft to a level where it is loaded onto a conveyor belt. The belt carries the ore to one of the main underground conveyors where the ore is transferred and conveyed to the surface stockpiles for processing.
Although development activities continue, production from the Big Gossan underground mine was suspended for the majority of 2014. Ore milled from the Big Gossan underground mine averaged 900 metric tons of ore per day for the year 2014 and is expected to ramp up to 7,000 metric tons of ore per day in 2018.
The Big Gossan underground mine fleet consists of over 100 pieces of mobile equipment, which includes five LHD units and three haul trucks used in development and production activities.
Description of Ore Bodies . Our Indonesia ore bodies are located within and around two main igneous intrusions, the Grasberg monzodiorite and the Ertsberg diorite. The host rocks of these ore bodies include both carbonate and clastic rocks that form the ridge crests and upper flanks of the Sudirman Range, and the igneous rocks of monzonitic to dioritic composition that intrude them. The igneous-hosted ore bodies (the Grasberg open pit and block cave, and portions of the DOZ block cave) occur as vein stockworks and disseminations of copper sulfides, dominated by chalcopyrite and, to a lesser extent, bornite. The sedimentary-rock hosted ore bodies (portions of the DOZ and all of the Big Gossan) occur as "magnetite-rich, calcium/magnesian skarn" replacements, whose location and orientation are strongly influenced by major faults and by the chemistry of the carbonate rocks along the margins of the intrusions.
The copper mineralization in these skarn deposits is dominated by chalcopyrite, but higher bornite concentrations are common. Moreover, gold occurs in significant concentrations in all of the district's ore bodies, though rarely visible to the naked eye. These gold concentrations usually occur as inclusions within the copper sulfide minerals, though, in some deposits, these concentrations can also be strongly associated with pyrite.
19
Table of Contents
The following diagram indicates the relative elevations (in meters) of our reported ore bodies.
20
Table of Contents
Africa
TFM is organized under the laws of the DRC. We own an effective 56 percent interest in TFM, with the remaining ownership interests held by Lundin Mining Corporation (Lundin) (an effective 24 percent interest) and La Générale des Carrières et des Mines (Gécamines), which is wholly owned by the DRC government (a 20 percent non-dilutable interest).
TFM is entitled to mine in the DRC under an Amended and Restated Mining Convention (ARMC) with the DRC government. The original Mining Convention was entered into in 1996 and was replaced with the ARMC in 2005, which was further amended in 2010 (approved in 2011). The current ARMC will remain in effect for as long as the Tenke concessions are exploitable.
TFM pays a royalty of two percent of net revenues under the ARMC, which totaled $29 million in both 2014 and 2013 and $25 million in 2012 .
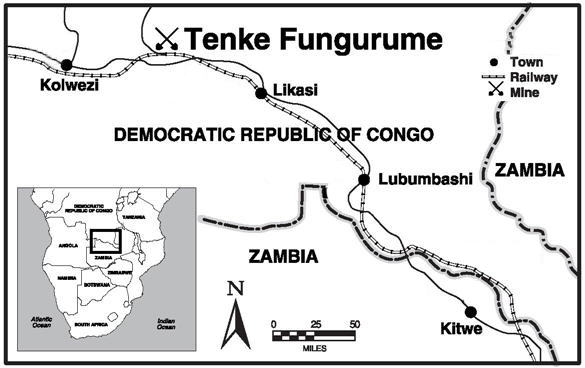
The Tenke minerals district is located in the Katanga province of the DRC approximately 110 miles northwest of Lubumbashi and is accessible by paved roads and by rail. The deposits are sediment-hosted copper and cobalt deposits with oxide, mixed oxide-sulfide and sulfide mineralization. The dominant oxide minerals are malachite, pseudomalachite and heterogenite. Important sulfide minerals consist of bornite, carrollite, chalcocite and chalcopyrite.
The Tenke minerals district contains an open-pit copper and cobalt mining complex, which commenced initial copper production in March 2009. TFM completed its second phase expansion project in early 2013, which included increasing mine, mill and processing capacity. Construction of a second sulfuric acid plant is underway, with completion expected in 2016. We continue to engage in exploration activities and metallurgical testing to evaluate the potential of the highly prospective minerals district at Tenke. These analyses are being incorporated in future plans for potential expansions of production capacity. Future expansions are subject to a number of factors, including power availability, economic and market conditions, and the business and investment climate in the DRC.
The current equipment fleet includes one 10-cubic meter mass excavator, three 17-cubic meter mass excavators, four 12-cubic meter front-end loaders, thirteen 7-cubic meter front-end loaders, thirty-two 91-metric ton haul trucks and fifteen 45-metric ton haul trucks.
Copper and cobalt are recovered through an agitation-leach plant. Production from the Tenke minerals district totaled 447 million pounds of copper and 29 million pounds of cobalt in 2014 , 462 million pounds of copper and 28 million pounds of cobalt in 2013 and 348 million pounds of copper and 26 million pounds of cobalt in 2012 .
The Tenke minerals district is located in a tropical region; however, temperatures are moderated by its higher altitudes. Weather in this region is characterized by a dry season and a wet season, each lasting about six months with average rainfall of 47 inches per year. The highest bench elevation is expected to be 1,520 meters above sea level and the ultimate pit bottom is expected to be 1,110 meters above sea level. The Tenke deposits are covered by six exploitation permits totaling approximately 394,450 acres.
TFM has long-term power supply and infrastructure funding agreements with La Société Nationale d'Electricité, the state-owned electric utility company serving the region. The results of a recent water exploration program, as well
21
Table of Contents
as the regional geological and hydro-geological conditions, indicate that adequate water is available during the expected life of the operation.
Smelting Facilities and Other Mining Properties
Atlantic Copper . Our wholly owned Atlantic Copper smelter and refinery is located on land concessions from the Huelva, Spain, port authorities, which are scheduled to expire in 2027.
The design capacity of the smelter is approximately 300,000 metric tons of copper per year and the refinery currently has a capacity of 285,000 metric tons of copper per year. During 2014 , Atlantic Copper treated 1.1 million metric tons of concentrate and scrap and produced 294,100 metric tons of copper anodes from its smelter and 283,800 metric tons of copper cathodes from its refinery. Following is a summary of Atlantic Copper's concentrate purchases from our copper mining operations and third parties for the last three years:
| 2014 |
| 2013 |
| 2012 | |||
North America copper mines | 21 | % |
| 13 | % |
| 16 | % |
South America mining | 21 | % |
| 32 | % |
| 31 | % |
Indonesia mining | 8 | % |
| 16 | % |
| 10 | % |
Third parties | 50 | % |
| 39 | % |
| 43 | % |
| 100 | % |
| 100 | % |
| 100 | % |
During 2013, Atlantic Copper successfully completed a scheduled 68-day major maintenance turnaround. Atlantic Copper's major maintenance turnarounds typically occur approximately every eight years, with short-term maintenance turnarounds in the interim. The next short-term maintenance turnaround is scheduled for the second half of 2015.
PT Smelting . PT-FI's COW required us to construct or cause to be constructed a smelter in Indonesia if we and the Indonesian government determined that such a project would be economically viable. In 1995, following the completion of a feasibility study, we entered into agreements relating to the formation of PT Smelting, an Indonesian company, and the construction of the copper smelter and refinery in Gresik, Indonesia. PT Smelting owns and operates the smelter and refinery. PT-FI owns 25 percent of PT Smelting, with the remainder owned by Mitsubishi Materials Corporation (60.5 percent), Mitsubishi Corporation Unimetals Ltd. (9.5 percent) and JX Nippon Mining & Metals Corporation (5 percent).
PT-FI's contract with PT Smelting provides for the supply of 100 percent of the copper concentrate requirements (subject to a minimum or maximum rate) necessary for PT Smelting to produce 205,000 metric tons of copper annually on a priority basis. PT-FI also sells copper concentrate to PT Smelting (at market rates) for quantities in excess of 205,000 metric tons of copper annually.
During 2014 , PT Smelting treated 911,500 metric tons of concentrate and produced 236,900 metric tons of copper anodes from its smelter and 231,800 metric tons of copper cathodes from its refinery.
PT Smelting's maintenance turnarounds (which range from two weeks to a month to complete) typically are expected to occur approximately every two years, with short-term maintenance turnarounds in the interim. PT Smelting completed a 23-day maintenance turnaround during 2014, and the next major maintenance turnaround is scheduled for 2016.
Miami Smelter . We own and operate a smelter at our Miami, Arizona, mining operation. The smelter has been operating for approximately 100 years and has been upgraded numerous times during that period to implement new technologies, to improve production and to comply with air quality requirements. As a result of new air quality standards for sulfur dioxide emissions, the Miami smelter will install pollution control equipment as part of an expansion that will allow the smelter to operate and comply with the new standards by 2018.
The Miami smelter processes copper concentrate primarily from our Arizona copper mines. Concentrate processed through the smelter totaled 603,700 metric tons in 2014 . In addition, because sulphuric acid is a by-product of smelting concentrates, the Miami smelter is also the most significant source of sulphuric acid for our North America leaching operations.
Major maintenance turnarounds (which take approximately three weeks to complete) typically occur approximately every 14 months for the Miami smelter, with shorter term maintenance turnarounds in the interim.The scheduled
22
Table of Contents
shutdown in fourth-quarter 2014 was extended for several weeks as a result of a furnace fire. Repairs have been completed, and the smelter is operating at normal rates.
Rod & Refining Operations . Our Rod & Refining operations consist of conversion facilities located in North America, including a refinery in El Paso, Texas; rod mills in El Paso, Texas, Norwich, Connecticut, and Miami, Arizona; and a specialty copper products facility in Bayway, New Jersey. We refine our copper anode production from our Miami smelter at our El Paso refinery. The El Paso refinery has the potential to operate at an annual production capacity of about 900 million pounds of copper cathode, which is sufficient to refine all of the copper anode we produce at Miami. Our El Paso refinery also produces nickel carbonate, copper telluride and autoclaved slimes material containing gold, silver, platinum and palladium.
Molybdenum Conversion Facilities . We process molybdenum concentrates at our conversion plants in the U.S. and Europe into such products as technical-grade molybdic oxide, ferromolybdenum, pure molybdic oxide, ammonium molybdates and molybdenum disulfide. We operate molybdenum roasters in Sierrita, Arizona; Fort Madison, Iowa; and Rotterdam, the Netherlands, and we operate a molybdenum pressure leach plant in Bagdad, Arizona. We also produce ferromolybdenum for customers worldwide at our conversion plant located in Stowmarket, United Kingdom.
Freeport Cobalt . On March 29, 2013, we, through a newly formed consolidated joint venture, completed the acquisition of a cobalt chemical refinery in Kokkola, Finland, and the related sales and marketing business. The acquisition provides direct end-market access for the cobalt hydroxide production at the Tenke minerals district. The joint venture operates under the name Freeport Cobalt, and we are the operator with an effective 56 percent ownership interest. The remaining effective ownership interest is held by our partners in TFM, including 24 percent by Lundin and 20 percent by Gécamines. The Kokkola refinery has an annual refining capacity of approximately 12,000 metric tons of cobalt, sufficient to refine the majority of the cobalt we produce in the Tenke minerals district.
Other North America Copper Mines . In addition to our operating mines, we have five non-operating copper mines in North America – Ajo, Bisbee, Twin Buttes and Tohono in Arizona, and Cobre in New Mexico – that have been on care-and-maintenance status for several years and would require new or updated environmental studies, new permits, and additional capital investment, which could be significant, to return them to operating status.
Mining Development Projects and Exploration
We have several projects and potential opportunities to expand production volumes, extend mine lives and develop large-scale underground ore bodies. Our near-term major development projects, which require substantial additional capital investment, include the Cerro Verde expansion and underground development activities in Grasberg. Refer to MD&A for further discussion of these and our other development projects. Considering the long-term nature and large size of our development projects, actual costs and timing could vary from estimates. We continue to review our mine development and processing plans to maximize the value of our mineral reserves.
Capital expenditures for mining operations totaled $4.0 billion (including $2.9 billion for major projects) in 2014, $3.8 billion (including $2.3 billion for major projects) in 2013 and $3.5 billion (including $2.2 billion for major projects) in 2012. Capital expenditures for major projects are primarily associated with the expansion projects at Morenci and Cerro Verde and underground development activities at Grasberg. Capital expenditures for major projects for the year 2012 also included amounts associated with the expansion at Tenke Fungurume. Capital expenditures for major projects at mining operations in the year 2015 are expected to approximate $2.5 billion and are primarily associated with the Cerro Verde expansion and underground development activities at Grasberg.
In connection with the MOU between PT-FI and the Indonesia government, we have agreed to pursue construction of a new smelter in Indonesia subject to reaching agreement on our long-term operating rights. The preliminary scope of the smelting facilities and associated refinery involves smelting and refining capacity of approximately two million metric tons per year of copper concentrate. Site selection and project definition studies are being advanced. Planning for engineering activities is underway as we explore partnership options. We will be reviewing project scope during 2015.
23
Table of Contents
We also have an additional long-term underground mine development project in the Grasberg minerals district for the Kucing Liar ore body, which lies on the southern flank of and underneath the southern portion of the Grasberg open pit at the 2,605-meter elevation level. We expect to mine the Kucing Liar ore body using the block-cave method; aggregate capital cost estimates for development of the Kucing Liar ore body are projected to approximate $2.4 billion (which are expected to be made between 2019 and 2032). Additionally, our current mine development plans include approximately $5 billion of capital expenditures at our processing facilities to optimize the handling of underground ore types once the Grasberg open-pit operations cease (we expect substantially all of these expenditures to be m ade between 2016 and 2034).
Our exploration activities are generally near our existing mines with a focus on opportunities to expand reserves and resources to support development of additional future production capacity in the large minerals districts where we currently operate. Exploration results continue to indicate opportunities for significant future reserve additions in North and South America and in the Tenke minerals district. The drilling data in North America also indicates the potential for significantly expanded sulfide production. Drilling results and exploration modeling in North America have identified large scale potential sulfide resources in the Morenci and Safford districts, providing a long-term pipeline for future growth in reserves and production capacity in an established minerals district. Exploration spending associated with mining operations totaled $96 million in 2014, $182 million in 2013 and $251 million in 2012, and is expected to approximate $100 million for the year 2015.
Sources and Availability of Energy, Natural Resources and Raw Materials
Our copper mining operations require significant energy, principally diesel, electricity, coal and natural gas, most of which is obtained from third parties under long-term contracts. Energy represented approximately 20 percent of our 2014 consolidated copper production costs and included purchases of approximately 250 million gallons of diesel fuel; 7,600 gigawatt hours of electricity at our North America, South America and Africa copper mining operations (we generate all of our power at our Indonesia mining operation); 600 thousand metric tons of coal for our coal power plant in Indonesia; and 1 million British thermal units (MMBtu) of natural gas at certain of our North America mines. Based on current cost estimates, we estimate energy will approximate 16 percent of our consolidated copper production costs for 2015.
Our mining operations also require significant quantities of water for mining, ore processing and related support facilities. Although we believe our mining operations have sufficient water rights, the loss of water rights for any of our mines, in whole or in part, or shortages of water to which we have rights, could require us to curtail or shut down mining operations. For a further discussion of risks and legal proceedings associated with the availability of water, refer to Item 1A. "Risk Factors" and Item 3. "Legal Proceedings."
Sulphuric acid is used in the SX/EW process and is produced as a by-product of the smelting process at our smelters and from our sulphur burners at the Safford and Tenke mines. Sulphuric acid needs in excess of the sulphuric acid produced by our operations are purchased from third parties.
Community and Human Rights
We have adopted policies that govern our working relationships with the communities where we operate and are designed to guide our practices and programs in a manner that respects human rights and the culture of the local people impacted by our operations. We continue to make significant expenditures on community development, education, training and cultural programs, which include:
• | comprehensive job training programs |
• | basic education programs |
• | public health programs, including malaria control and HIV |
• | agricultural assistance programs |
• | small and medium enterprise development programs |
• | cultural promotion and preservation programs |
• | clean water and sanitation projects |
• | community infrastructure development |
• | charitable donations |
In December 2000, we endorsed the joint U.S. State Department-British Foreign Office Voluntary Principles on Human Rights and Security (Voluntary Principles). We participated in developing these Voluntary Principles with other major natural resource companies and international human rights organizations and they are incorporated into our human rights policy and site level projects.
24
Table of Contents
We completed a corporate level human rights impact assessment in 2014, the results of which were used to evaluate our human rights program, including a review of our human rights policy. In February 2015, we updated our human rights policy to, among other things, reflect our commitment to integrating the United Nations Guiding Principles on Business and Human Rights into our human rights program. We also participate in a multi-industry human rights working group to gain insight from peer companies and evaluate ways to integrate human rights due diligence into our business practices and to support our human rights program.
We believe that our social and economic development programs are responsive to the issues raised by the local communities near our areas of operation and should help us maintain good relations with the surrounding communities and avoid disruptions of mining operations. As part of our ongoing, annual commitment to sustainable community development, we have made significant investments in social programs, including in-kind support and administration, across our global operations. Over the last five years, these investments have averaged $185 million per year. Nevertheless, social and political instability in the areas of our operations may adversely impact our mining operations. Refer to Item 1A. "Risk Factors" for further discussion.
South America . Cerro Verde has provided a variety of community support projects over the years. Following engagements with regional and local governments, civic leaders and development agencies, in 2006, Cerro Verde committed to support the costs for a new potable water treatment plant to serve Arequipa. In addition, an agreement was reached with the Peruvian government for development of a water storage and distribution network, which was financed by the Cerro Verde Civil Association (the Association). The Association manages contributions made by Cerro Verde for projects that focus on education, training, health, cultural preservation and basic infrastructure.
Cerro Verde has also reached agreement with the Regional Government of Arequipa, the National Government, SEDAPAR and other local institutions to allow it to finance, engineer and construct a wastewater treatment plant for the city of Arequipa. Treating this water will improve the regional water quality, enhance agriculture products grown in the area and reduce waterborne illnesses. In addition to these projects, Cerro Verde annually makes significant community development investments in the Arequipa region.
Indonesia . In 1996, PT-FI established the Freeport Partnership Fund for Community Development (the Partnership Fund), through which PT-FI has made available funding and technical assistance to support community development initiatives in the areas of health, education and economic development of the area. PT-FI has committed through 2016 to provide one percent of its annual revenue for the development of the local people in its area of operation through the Partnership Fund. Our share of contributions to the Partnership Fund totaled $31 million in 2014 , $41 million in 2013 and $39 million in 2012 .
The Amungme and Kamoro Community Development Organization ( Lembaga Pengembangan Masyarakat Amungme dan Kamoro or LPMAK) oversees disbursement of the program funds we contribute to the Partnership Fund. LPMAK is governed by a board of commissioners and a board of directors, which are comprised of representatives from the local Amungme and Kamoro tribal communities, government leaders, church leaders, and one representative of PT-FI on each board. The Amungme and Kamoro people are original inhabitants of the land in our area of operations. In addition to the Partnership Fund, PT-FI annually makes significant investments in public health, education, community infrastructure and economic development.
Security Matters . Consistent with our COW in Indonesia and our commitment to protect our employees and property, we have taken steps to provide a safe and secure working environment. As part of its security program, PT-FI maintains its own internal security department. Both employees and contractors are unarmed and perform functions such as protecting company facilities, monitoring shipments of supplies and products, assisting in traffic control and aiding in emergency response operations. The security department receives human rights training annually.
PT-FI's share of costs for its internal civilian security department totaled $57 million for 2014 , $51 million for 2013 and $52 million for 2012 .
PT-FI, and all businesses and residents of Indonesia, rely on the Indonesian government for the maintenance of public order, upholding the rule of law and the protection of personnel and property. The Grasberg minerals district has been designated by the Indonesian government as one of Indonesia's vital national assets. This designation results in the police, and to a lesser extent, the military, playing a significant role in protecting the area of our
25
Table of Contents
operations. The Indonesian government is responsible for employing police and military personnel and directing their operations.
From the outset of PT-FI's operations, the Indonesian government has looked to PT-FI to provide logistical and infrastructure support and assistance for these necessary services because of the limited resources of the Indonesian government and the remote location of and lack of development in Papua. PT-FI's financial support for the Indonesian government security institutions assigned to the operations area represents a prudent response to its requirements to protect its workforce and property, better ensuring that personnel are properly fed and lodged, and have the logistical resources to patrol PT-FI's roads and secure its operating area. In addition, the provision of such support is consistent with PT-FI's obligations under the COW, reflects our philosophy of responsible corporate citizenship, and is in keeping with our commitment to pursue practices that will promote human rights.
PT-FI's share of support costs for the government-provided security was $27 million in 2014 , $25 million in 2013 and $22 million in 2012 . This supplemental support consists of various infrastructure and other costs, such as food, housing, fuel, travel, vehicle repairs, allowances to cover incidental and administrative costs, and community assistance programs conducted by the military and police.
Refer to Item 1A. "Risk Factors" for further discussion of security risks in Indonesia.
Africa . TFM has committed to assist the communities living within its concession in the Katanga province of the DRC. Initiatives include an integrated malaria control program, construction, renovation and building of local health facilities, construction and renovation of local schools, installation of over 100 clean water wells in rural villages as well as construction of urban water distribution systems, and economic development programs supporting development and training of local entrepreneurs, contractors and farmers. We have also made significant investments in infrastructure in the region that will have lasting benefits to the country, including upgrading a portion of a national road and the regional power generation and transmission systems.
Through the ARMC, TFM has also committed to contribute 0.3 percent of its net sales revenue to a community development fund to assist the local communities with development of local infrastructure and related services including health, education and agriculture. The TFM Social Community Fund is managed by a board of directors comprised of two local community representatives, one representative nominated by the provincial governor and four TFM representatives. A community stakeholder forum comprised of 40 community representatives provides for increased community participation and input regarding project priorities, community needs, and transparency of fund management. The TFM Social Community Fund contributions totaled $4 million in each of the years 2014 , 2013 and 2012 .
Security Matters . TFM maintains an unarmed internal security department composed of both employees and contractors. The national government also has assigned Mines Police to the TFM concession area. The Mines Police are a division of the Congolese National Police and are responsible for maintaining security in mining concessions throughout the DRC. TFM provides food, housing, medical services, supervised transportation, non-lethal equipment and monetary allowances as well as direct payments to the government for the provision of the security assigned to the concession area. The total cost to TFM for this support, including in-kind support, totaled $2 million in 2014 and less than $1 million in both 2013 and 2012 .
TFM also participates in monthly security coordination meetings with host country security personnel, other mining companies, non-governmental organizations, and representatives from the United Nations to discuss security issues and concerns. As an outcome of the coordination meetings, TFM has partnered with MONUSCO (United Nations Stabilization Mission in the DRC) to conduct human rights training in the TFM concession for host government security personnel, local representatives and TFM security employees.
26
Table of Contents
Mining Production Data
| Years Ended December 31, |
| |||||||||||||
(FCX's net interest in %) | 2014 |
| 2013 |
| 2012 |
| 2011 |
| 2010 |
| |||||
COPPER (millions of recoverable pounds) |
|
|
|
|
|
|
|
|
|
| |||||
North America |
|
|
|
|
|
|
|
|
|
| |||||
Morenci (85%) a | 691 | |
| 564 | |
| 537 | |
| 522 | |
| 437 | |
|
Bagdad (100%) | 237 | |
| 216 | |
| 197 | |
| 194 | |
| 203 | |
|
Safford (100%) | 139 | |
| 146 | |
| 175 | |
| 151 | |
| 143 | |
|
Sierrita (100%) | 195 | |
| 171 | |
| 157 | |
| 177 | |
| 147 | |
|
Miami (100%) | 57 | |
| 61 | |
| 66 | |
| 66 | |
| 18 | |
|
Chino (100%) | 250 | |
| 171 | |
| 144 | |
| 69 | |
| 34 | |
|
Tyrone (100%) | 94 | |
| 96 | |
| 83 | |
| 76 | |
| 82 | |
|
Other (100%) | 7 | |
| 6 | |
| 4 | |
| 3 | |
| 3 | |
|
Total North America | 1,670 | |
| 1,431 | |
| 1,363 | |
| 1,258 | |
| 1,067 | |
|
South America |
|
|
|
|
|
|
|
|
|
| |||||
Cerro Verde (53.56%) | 500 | |
| 558 | |
| 595 | |
| 647 | |
| 668 | |
|
El Abra (51%) | 367 | |
| 343 | |
| 338 | |
| 274 | |
| 320 | |
|
Candelaria/Ojos del Salado (80%) b | 284 | |
| 422 | |
| 324 | |
| 385 | |
| 366 | |
|
Total South America | 1,151 | |
| 1,323 | |
| 1,257 | |
| 1,306 | |
| 1,354 | |
|
Indonesia |
|
|
|
|
|
|
|
|
|
| |||||
Grasberg (90.64%) c | 636 | |
| 915 | |
| 695 | |
| 846 | |
| 1,222 | |
|
Africa |
|
|
|
|
|
|
|
|
|
| |||||
Tenke Fungurume (56%) d | 447 | |
| 462 | |
| 348 | |
| 281 | |
| 265 | |
|
Consolidated | 3,904 | |
| 4,131 | |
| 3,663 | |
| 3,691 | |
| 3,908 | |
|
Less noncontrolling interests | 725 | |
| 801 | |
| 723 | |
| 710 | |
| 766 | |
|
Net | 3,179 | |
| 3,330 | |
| 2,940 | |
| 2,981 | |
| 3,142 | |
|
|
|
|
|
|
|
|
|
|
|
| |||||
GOLD (thousands of recoverable ounces) |
|
|
|
|
|
|
|
|
|
| |||||
North America (100%) a | 12 | |
| 7 | |
| 13 | |
| 10 | |
| 7 | |
|
South America (80%) b | 72 | |
| 101 | |
| 83 | |
| 101 | |
| 93 | |
|
Indonesia (90.64%) c | 1,130 | |
| 1,142 | |
| 862 | |
| 1,272 | |
| 1,786 | |
|
Consolidated | 1,214 | |
| 1,250 | |
| 958 | |
| 1,383 | |
| 1,886 | |
|
Less noncontrolling interests | 120 | |
| 127 | |
| 98 | |
| 139 | |
| 186 | |
|
Net | 1,094 | |
| 1,123 | |
| 860 | |
| 1,244 | |
| 1,700 | |
|
|
|
|
|
|
|
|
|
|
|
| |||||
MOLYBDENUM (millions of recoverable pounds) |
|
|
|
|
|
|
|
|
|
| |||||
Henderson (100%) | 30 | |
| 30 | |
| 34 | |
| 38 | |
| 40 | |
|
Climax (100%) e | 21 | |
| 19 | |
| 7 | |
| - | |
| - | |
|
North America copper mines (100%) a | 33 | |
| 32 | |
| 36 | |
| 35 | |
| 25 | |
|
Cerro Verde (53.56%) | 11 | |
| 13 | |
| 8 | |
| 10 | |
| 7 | |
|
Consolidated | 95 | |
| 94 | |
| 85 | |
| 83 | |
| 72 | |
|
Less noncontrolling interest | 5 | |
| 6 | |
| 4 | |
| 5 | |
| 3 | |
|
Net | 90 | |
| 88 | |
| 81 | |
| 78 | |
| 69 | |
|
|
|
|
|
|
|
|
|
|
|
| |||||
COBALT (millions of contained pounds) |
|
|
|
|
|
|
|
|
|
| |||||
Consolidated - Tenke Fungurume (56%) d | 29 | |
| 28 | |
| 26 | |
| 25 | |
| 20 | |
|
Less noncontrolling interests | 13 | |
| 12 | |
| 11 | |
| 11 | |
| 8 | |
|
Net | 16 | |
| 16 | |
| 15 | |
| 14 | |
| 12 | |
|
|
|
|
|
|
|
|
|
|
|
| |||||
a. | Amounts are net of Morenci's 15 percent joint venture partner interest. |
b. | On November 3, 2014, FCX completed the sale of its 80 percent interests in the Candelaria and Ojos del Salado mines. |
c. | Amounts are net of joint venture partner interest, which varies in accordance with terms of the joint venture agreement (refer to Note 3). Under the joint venture arrangements, PT-FI's share of copper production totaled 98 percent in 2014 , 99 percent in 2013 , 100 percent in 2012 , 96 percent in 2011 and 92 percent in 2010. |
d. | Effective March 26, 2012, FCX's effective ownership interest in TFM was prospectively reduced from 57.75 percent to 56 percent. |
e. | The Climax molybdenum mine began commercial operations in May 2012. |
27
Table of Contents
Mining Sales Data
| Years Ended December 31, |
| ||||||||||||||||||
(FCX's net interest in %) | 2014 |
| 2013 |
| 2012 |
| 2011 |
| 2010 |
| ||||||||||
COPPER (millions of recoverable pounds) |
|
|
|
|
|
|
|
|
|
| ||||||||||
North America |
|
|
|
|
|
|
|
|
|
| ||||||||||
Morenci (85%) a | 680 | |
| 561 | |
| 532 | |
| 521 | |
| 434 | |
| |||||
Bagdad (100%) | 240 | |
| 212 | |
| 196 | |
| 201 | |
| 206 | |
| |||||
Safford (100%) | 142 | |
| 151 | |
| 175 | |
| 147 | |
| 155 | |
| |||||
Sierrita (100%) | 196 | |
| 170 | |
| 162 | |
| 175 | |
| 152 | |
| |||||
Miami (100%) | 60 | |
| 60 | |
| 68 | |
| 59 | |
| 17 | |
| |||||
Chino (100%) | 243 | |
| 168 | |
| 132 | |
| 62 | |
| 35 | |
| |||||
Tyrone (100%) | 96 | |
| 94 | |
| 82 | |
| 79 | |
| 83 | |
| |||||
Other (100%) | 7 | |
| 6 | |
| 4 | |
| 3 | |
| 3 | |
| |||||
Total North America | 1,664 | |
| 1,422 | |
| 1,351 | |
| 1,247 | |
| 1,085 | |
| |||||
South America |
|
|
|
|
|
|
|
|
|
| ||||||||||
Cerro Verde (53.56%) | 501 | |
| 560 | |
| 589 | |
| 657 | |
| 654 | |
| |||||
El Abra (51%) | 366 | |
| 341 | |
| 338 | |
| 276 | |
| 315 | |
| |||||
Candelaria/Ojos del Salado (80%) b | 268 | |
| 424 | |
| 318 | |
| 389 | |
| 366 | |
| |||||
Total South America | 1,135 | |
| 1,325 | |
| 1,245 | |
| 1,322 | |
| 1,335 | |
| |||||
Indonesia |
|
|
|
|
|
|
|
|
|
| ||||||||||
Grasberg (90.64%) c | 664 | |
| 885 | |
| 716 | |
| 846 | |
| 1,214 | |
| |||||
Africa |
|
|
|
|
|
|
|
|
|
| ||||||||||
Tenke Fungurume (56%) d | 425 | |
| 454 | |
| 336 | |
| 283 | |
| 262 | |
| |||||
Consolidated sales from mines | 3,888 | |
| 4,086 | |
| 3,648 | |
| 3,698 | |
| 3,896 | |
| |||||
Less noncontrolling interests | 715 | |
| 795 | |
| 717 | |
| 717 | |
| 756 | |
| |||||
Net | 3,173 | |
| 3,291 | |
| 2,931 | |
| 2,981 | |
| 3,140 | |
| |||||
Consolidated sales from mines | 3,888 | |
| 4,086 | |
| 3,648 | |
| 3,698 | |
| 3,896 | |
| |||||
Purchased copper | 125 | |
| 223 | |
| 125 | |
| 223 | |
| 182 | |
| |||||
Total copper sales, including purchases | 4,013 | |
| 4,309 | |
| 3,773 | |
| 3,921 | |
| 4,078 | |
| |||||
Average realized price per pound | $ | 3.09 | |
| $ | 3.30 | |
| $ | 3.60 | |
| $ | 3.86 | |
| $ | 3.59 | |
|
|
|
|
|
|
|
|
|
|
|
| ||||||||||
GOLD (thousands of recoverable ounces) |
|
|
|
|
|
|
|
|
|
| ||||||||||
North America (100%) a | 13 | |
| 6 | |
| 13 | |
| 7 | |
| 5 | |
| |||||
South America (80%) b | 67 | |
| 102 | |
| 82 | |
| 101 | |
| 93 | |
| |||||
Indonesia (90.64%) c | 1,168 | |
| 1,096 | |
| 915 | |
| 1,270 | |
| 1,765 | |
| |||||
Consolidated sales from mines | 1,248 | |
| 1,204 | |
| 1,010 | |
| 1,378 | |
| 1,863 | |
| |||||
Less noncontrolling interests | 123 | |
| 123 | |
| 102 | |
| 139 | |
| 184 | |
| |||||
Net | 1,125 | |
| 1,081 | |
| 908 | |
| 1,239 | |
| 1,679 | |
| |||||
Average realized price per ounce | $ | 1,231 | |
| $ | 1,315 | |
| $ | 1,665 | |
| $ | 1,583 | |
| $ | 1,271 | |
|
|
|
|
|
|
|
|
|
|
|
| ||||||||||
MOLYBDENUM (millions of recoverable pounds) |
|
|
|
|
|
|
|
|
|
| ||||||||||
Consolidated sales from mines | 95 | |
| 93 | |
| 83 | |
| 79 | |
| 67 | |
| |||||
Less noncontrolling interests | 5 | |
| 5 | |
| 4 | |
| 4 | |
| 3 | |
| |||||
Net | 90 | |
| 88 | |
| 79 | |
| 75 | |
| 64 | |
| |||||
Average realized price per pound | $ | 12.74 | |
| $ | 11.85 | |
| $ | 14.26 | |
| $ | 16.98 | |
| $ | 16.47 | |
|
|
|
|
|
|
|
|
|
|
|
| ||||||||||
COBALT (millions of contained pounds) |
|
|
|
|
|
|
|
|
|
| ||||||||||
Consolidated - Tenke Fungurume (56%) d | 30 | |
| 25 | |
| 25 | |
| 25 | |
| 20 | |
| |||||
Less noncontrolling interests | 13 | |
| 11 | |
| 11 | |
| 10 | |
| 8 | |
| |||||
Net | 17 | |
| 14 | |
| 14 | |
| 15 | |
| 12 | |
| |||||
Average realized price per pound | $ | 9.66 | |
| $ | 8.02 | |
| $ | 7.83 | |
| $ | 9.99 | |
| $ | 10.95 | |
|
|
|
|
|
|
|
|
|
|
|
| ||||||||||
a. | Amounts are net of Morenci's joint venture partner's 15 percent interest. |
b. | On November 3, 2014, FCX completed the sale of its 80 percent interests in the Candelaria and Ojos del Salado mines. |
c. | Amounts are net of joint venture partner interest, which varies in accordance with terms of the joint venture agreement (refer to Note 3). Under the joint venture arrangements, PT-FI's share of copper sales totaled 98 percent in 2014 , 99 percent in 2013 , 100 percent in 2012 , 96 percent in 2011 and 92 percent in 2010. |
d. | Effective March 26, 2012, FCX's effective ownership interest in TFM was prospectively reduced from 57.75 percent to 56 percent. |
28
Table of Contents
Mineral Reserves
Recoverable proven and probable mineral reserves from our mining operations summarized below and detailed on the following pages have been calculated as of December 31, 2014 , in accordance with Industry Guide 7 as required by the Securities Exchange Act of 1934. Proven and probable reserves may not be comparable to similar information regarding mineral reserves disclosed in accordance with the guidance of other countries. Proven and probable mineral reserves were determined by the use of mapping, drilling, sampling, assaying and evaluation methods generally applied in the mining industry, as more fully discussed below. The term "reserve," as used in the reserve data presented here, means that part of a mineral deposit that can be economically and legally extracted or produced at the time of the reserve determination. The term "proven reserves" means mineral reserves for which (i) quantity is computed from dimensions revealed in outcrops, trenches, workings or drill holes; (ii) grade and/or quality are computed from the results of detailed sampling; and (iii) the sites for inspection, sampling and measurements are spaced so closely and the geologic character is sufficiently defined that size, shape, depth and mineral content of reserves are well established. The term "probable reserves" means mineral reserves for which quantity and grade are computed from information similar to that used for proven reserves, but the sites for sampling are farther apart or are otherwise less adequately spaced. The degree of assurance, although lower than that for proven reserves, is high enough to assume continuity between points of observation.
Our mineral reserve estimates are based on the latest available geological and geotechnical studies. We conduct ongoing studies of our ore bodies to optimize economic values and to manage risk. We revise our mine plans and estimates of recoverable proven and probable mineral reserves as required in accordance with the latest available studies. Our estimates of recoverable proven and probable mineral reserves are prepared by and are the responsibility of our employees; a majority of these estimates are reviewed and verified by independent experts in mining, geology and reserve determination.
Estimated recoverable proven and probable mineral reserves at December 31, 2014 , were determined using long-term average prices of $2.00 per pound for copper (consistent with the long-term average copper price used since December 31, 2010), $1,000 per ounce for gold and $10 per pound for molybdenum. For the three-year period ended December 31, 2014 , LME spot copper prices averaged $3.35 per pound, London PM gold prices averaged $1,449 per ounce, and the weekly average price of molybdenum quoted by Metals Week averaged $11.50 per pound.
The recoverable proven and probable mineral reserves presented in the table below represent the estimated metal quantities from which we expect to be paid after application of estimated metallurgical recovery rates and smelter recovery rates, where applicable. Recoverable reserves are the part of a mineral deposit that we estimate can be economically and legally extracted or produced at the time of the reserve determination.
| Recoverable Proven and Probable Mineral Reserves Estimated at December 31, 2014 | |||||||||||||
| Copper a (billion pounds) |
| Gold (million ounces) |
| Molybdenum (billion pounds) |
| Silver b (million ounces) |
| Cobalt b (billion pounds) | |||||
North America | 35.6 | |
| 0.3 | |
| 2.42 | |
| 86.2 | |
| - | |
South America | 31.8 | |
| - | |
| 0.69 | |
| 86.6 | |
| - | |
Indonesia | 29.0 | |
| 28.2 | |
| - | |
| 110.1 | |
| - | |
Africa | 7.1 | |
| - | |
| - | |
| - | |
| 0.85 | |
Consolidated basis c | 103.5 | |
| 28.5 | |
| 3.11 | |
| 282.9 | |
| 0.85 | |
Net equity interest d | 82.8 | |
| 25.9 | |
| 2.79 | |
| 232.4 | |
| 0.47 | |
a. | Consolidated recoverable copper reserves include 3.6 billion pounds in leach stockpiles and 0.9 billion pounds in mill stockpiles (refer to "Mill and Leach Stockpiles" for further discussion). |
b. | Determined using long-term average prices of $15 per ounce for silver and $10 per pound for cobalt. |
c. | Consolidated reserves represent estimated metal quantities after reduction for joint venture partner interests at the Morenci mine in North America and at the Grasberg minerals district in Indonesia. |
d. | Net equity interest reserves represent estimated consolidated metal quantities further reduced for noncontrolling interest ownership. |
29
Table of Contents
|
|
| Recoverable Proven and Probable Mineral Reserves | |||||||||||||||||||||||||||||||||||
|
|
| Estimated at December 31, 2014 | |||||||||||||||||||||||||||||||||||
|
|
| Proven Reserves |
| Probable Reserves |
| ||||||||||||||||||||||||||||||||
|
|
|
|
| Average Ore Grade |
|
|
| Average Ore Grade |
| ||||||||||||||||||||||||||||
| Processing |
| Million |
| Copper |
| Gold |
| Moly |
| Silver |
| Cobalt |
| Million |
| Copper |
| Gold |
| Moly |
| Silver |
| Cobalt |
| ||||||||||||
| Method |
| metric tons |
| % |
| g/t |
| % |
| g/t |
| % |
| metric tons |
| % |
| g/t |
| % |
| g/t |
| % |
| ||||||||||||
North America |
|
|
|
|
|
|
|
|
|
|
|
|
|
|
|
|
|
|
|
|
|
|
|
|
|
| ||||||||||||
Morenci | Mill |
| 635 | |
| 0.44 | |
| - | |
| 0.02 | |
| - | |
| - | |
| 130 | |
| 0.45 | |
| - | |
| 0.02 | |
| - | |
| - | |
|
| Crushed leach |
| 379 | |
| 0.49 | |
| - | |
| - | |
| - | |
| - | |
| 102 | |
| 0.46 | |
| - | |
| - | |
| - | |
| - | |
|
| ROM leach |
| 1,976 | |
| 0.18 | |
| - | |
| - | |
| - | |
| - | |
| 701 | |
| 0.17 | |
| - | |
| - | |
| - | |
| - | |
|
Bagdad | Mill |
| 1,007 | |
| 0.34 | |
| - | | a | 0.02 | |
| 1.63 | |
| - | |
| 152 | |
| 0.32 | |
| - | | a | 0.02 | |
| 1.54 | |
| - | |
|
| ROM leach |
| 129 | |
| 0.21 | |
| - | |
| - | |
| - | |
| - | |
| 46 | |
| 0.19 | |
| - | |
| - | |
| - | |
| - | |
|
Safford | Crushed leach |
| 81 | |
| 0.46 | |
| - | |
| - | |
| - | |
| - | |
| 41 | |
| 0.47 | |
| - | |
| - | |
| - | |
| - | |
|
Sierrita | Mill |
| 2,252 | |
| 0.24 | |
| - | | a | 0.03 | |
| 1.42 | |
| - | |
| 212 | |
| 0.20 | |
| - | | a | 0.02 | |
| 1.20 | |
| - | |
|
Miami | ROM leach |
| 2 | |
| 0.59 | |
| - | |
| - | |
| - | |
| - | |
| 1 | |
| 0.57 | |
| - | |
| - | |
| - | |
| - | |
|
Chino | Mill |
| 97 | |
| 0.53 | |
| 0.04 | |
| 0.01 | |
| 0.46 | |
| - | |
| 63 | |
| 0.49 | |
| 0.03 | |
| 0.01 | |
| 0.42 | |
| - | |
|
| ROM leach |
| 112 | |
| 0.26 | |
| - | |
| - | |
| - | |
| - | |
| 29 | |
| 0.20 | |
| - | |
| - | |
| - | |
| - | |
|
Tyrone | ROM leach |
| 57 | |
| 0.33 | |
| - | |
| - | |
| - | |
| - | |
| 2 | |
| 0.21 | |
| - | |
| - | |
| - | |
| - | |
|
Henderson | Mill |
| 74 | |
| - | |
| - | |
| 0.18 | |
| - | |
| - | |
| 16 | |
| - | |
| - | |
| 0.14 | |
| - | |
| - | |
|
Climax | Mill |
| 162 | |
| - | |
| - | |
| 0.17 | |
| - | |
| - | |
| 23 | |
| - | |
| - | |
| 0.10 | |
| - | |
| - | |
|
Cobre b | Mill |
| 12 | |
| 0.61 | |
| - | |
| - | |
| - | |
| - | |
| 1 | |
| 0.53 | |
| - | |
| - | |
| - | |
| - | |
|
| ROM leach |
| 57 | |
| 0.32 | |
| - | |
| - | |
| - | |
| - | |
| 1 | |
| 0.31 | |
| - | |
| - | |
| - | |
| - | |
|
|
|
| 7,032 | |
|
|
|
|
|
|
|
|
|
|
| 1,520 | |
|
|
|
|
|
|
|
|
|
|
| ||||||||||
South America |
|
|
|
|
|
|
|
|
|
|
|
|
|
|
|
|
|
|
|
|
|
|
|
|
|
| ||||||||||||
Cerro Verde | Mill |
| 881 | |
| 0.39 | |
| - | |
| 0.02 | |
| 1.62 | |
| - | |
| 2,904 | |
| 0.37 | |
| - | |
| 0.01 | |
| 1.52 | |
| - | |
|
| Crushed leach |
| 36 | |
| 0.52 | |
| - | |
| - | |
| - | |
| - | |
| 64 | |
| 0.45 | |
| - | |
| - | |
| - | |
| - | |
|
| ROM leach |
| 10 | |
| 0.26 | |
| - | |
| - | |
| - | |
| - | |
| 58 | |
| 0.24 | |
| - | |
| - | |
| - | |
| - | |
|
El Abra | Crushed leach |
| 287 | |
| 0.51 | |
| - | |
| - | |
| - | |
| - | |
| 77 | |
| 0.49 | |
| - | |
| - | |
| - | |
| - | |
|
| ROM leach |
| 61 | |
| 0.24 | |
| - | |
| - | |
| - | |
| - | |
| 19 | |
| 0.22 | |
| - | |
| - | |
| - | |
| - | |
|
|
|
| 1,275 | |
|
|
|
|
|
|
|
|
|
|
| 3,122 | |
|
|
|
|
|
|
|
|
|
|
| ||||||||||
Indonesia |
|
|
|
|
|
|
|
|
|
|
|
|
|
|
|
|
|
|
|
|
|
|
|
|
|
| ||||||||||||
Grasberg open pit | Mill |
| 77 | |
| 1.10 | |
| 1.37 | |
| - | |
| 2.83 | |
| - | |
| 102 | |
| 0.86 | |
| 0.82 | |
| - | |
| 2.10 | |
| - | |
|
Deep Ore Zone | Mill |
| 47 | |
| 0.56 | |
| 0.68 | |
| - | |
| 2.27 | |
| - | |
| 99 | |
| 0.53 | |
| 0.69 | |
| - | |
| 2.20 | |
| - | |
|
Big Gossan | Mill |
| 17 | |
| 2.39 | |
| 1.02 | |
| - | |
| 15.15 | |
| - | |
| 37 | |
| 2.20 | |
| 0.98 | |
| - | |
| 13.22 | |
| - | |
|
Grasberg Block Cave b | Mill |
| 447 | |
| 1.19 | |
| 0.96 | |
| - | |
| 3.75 | |
| - | |
| 565 | |
| 0.85 | |
| 0.61 | |
| - | |
| 3.28 | |
| - | |
|
Kucing Liar b | Mill |
| 152 | |
| 1.31 | |
| 1.11 | |
| - | |
| 7.45 | |
| - | |
| 254 | |
| 1.21 | |
| 1.04 | |
| - | |
| 6.21 | |
| - | |
|
Deep Mill Level Zone b | Mill |
| 65 | |
| 0.92 | |
| 0.74 | |
| - | |
| 4.60 | |
| - | |
| 407 | |
| 0.86 | |
| 0.71 | |
| - | |
| 4.33 | |
| - | |
|
|
|
| 805 | |
|
|
|
|
|
|
|
|
|
|
| 1,464 | |
|
|
|
|
|
|
|
|
|
|
| ||||||||||
Africa |
|
|
|
|
|
|
|
|
|
|
|
|
|
|
|
|
|
|
|
|
|
|
|
|
|
| ||||||||||||
Tenke Fungurume | Agitation leach |
| 47 | |
| 3.56 | |
| - | |
| - | |
| - | |
| 0.43 | |
| 51 | |
| 3.01 | |
| - | |
| - | |
| - | |
| 0.34 | |
|
Total FCX - 100% Basis |
|
| 9,159 | |
|
|
|
|
|
|
|
|
|
|
| 6,157 | |
|
|
|
|
|
|
|
|
|
|
| ||||||||||
|
|
|
|
|
|
|
|
|
|
|
|
|
|
|
|
|
|
|
|
|
|
|
|
|
|
| ||||||||||||
a. | Grade not shown because of rounding. |
b. | Undeveloped reserves that would require additional capital investment, which could be significant, to bring into production. |
The reserve table above and the tables on the following pages utilize the abbreviations described below:
• | g/t – grams per metric ton |
• | Moly – Molybdenum |
• | ROM – Run of Mine |
30
Table of Contents
|
|
| Recoverable Proven and Probable Mineral Reserves | |||||||||||||||||||||||||||||||
|
|
| Estimated at December 31, 2014 | |||||||||||||||||||||||||||||||
|
|
| (continued) | |||||||||||||||||||||||||||||||
|
|
| Proven and |
|
|
|
| |||||||||||||||||||||||||||
|
|
| Probable |
| Average Ore Grade |
| Recoveries a | |||||||||||||||||||||||||||
| Processing |
| Million |
| Copper |
| Gold |
| Moly |
| Silver |
| Cobalt |
| Copper |
| Gold |
| Moly |
| Silver |
| Cobalt | |||||||||||
| Method |
| metric tons |
| % |
| g/t |
| % |
| g/t |
| % |
| % |
| % |
| % |
| % |
| % | |||||||||||
North America |
|
|
|
|
|
|
|
|
|
|
|
|
|
|
|
|
|
|
|
|
|
|
| |||||||||||
Morenci | Mill |
| 765 | |
| 0.44 | |
| - | |
| 0.02 | |
| - | |
| - | |
| 79.7 | |
| - | |
| 50.7 | |
| - | |
| - | |
| Crushed leach |
| 481 | |
| 0.49 | |
| - | |
| - | |
| - | |
| - | |
| 75.7 | |
| - | |
| - | |
| - | |
| - | |
| ROM leach |
| 2,677 | |
| 0.18 | |
| - | |
| - | |
| - | |
| - | |
| 42.7 | |
| - | |
| - | |
| - | |
| - | |
Bagdad | Mill |
| 1,159 | |
| 0.34 | |
| - | | b | 0.02 | |
| 1.62 | |
| - | |
| 85.9 | |
| 59.1 | |
| 70.8 | |
| 49.3 | |
| - | |
| ROM leach |
| 175 | |
| 0.21 | |
| - | |
| - | |
| - | |
| - | |
| 23.0 | |
| - | |
| - | |
| - | |
| - | |
Safford | Crushed leach |
| 122 | |
| 0.47 | |
| - | |
| - | |
| - | |
| - | |
| 63.9 | |
| - | |
| - | |
| - | |
| - | |
Sierrita | Mill |
| 2,464 | |
| 0.23 | |
| - | | b | 0.02 | |
| 1.40 | |
| - | |
| 83.9 | |
| 59.1 | |
| 75.9 | |
| 49.3 | |
| - | |
Miami | ROM leach |
| 3 | |
| 0.58 | |
| - | |
| - | |
| - | |
| - | |
| 53.6 | |
| - | |
| - | |
| - | |
| - | |
Chino | Mill |
| 160 | |
| 0.51 | |
| 0.03 | |
| 0.01 | |
| 0.45 | |
| - | |
| 79.4 | |
| 77.9 | |
| 42.7 | |
| 78.5 | |
| - | |
| ROM leach |
| 141 | |
| 0.24 | |
| - | |
| - | |
| - | |
| - | |
| 42.9 | |
| - | |
| - | |
| - | |
| - | |
Tyrone | ROM leach |
| 59 | |
| 0.32 | |
| - | |
| - | |
| - | |
| - | |
| 58.7 | |
| - | |
| - | |
| - | |
| - | |
Henderson | Mill |
| 90 | |
| - | |
| - | |
| 0.17 | |
| - | |
| - | |
| - | |
| - | |
| 84.4 | |
| - | |
| - | |
Climax | Mill |
| 185 | |
| - | |
| - | |
| 0.16 | |
| - | |
| - | |
| - | |
| - | |
| 88.8 | |
| - | |
| - | |
Cobre c | Mill |
| 13 | |
| 0.61 | |
| - | |
| - | |
| - | |
| - | |
| 79.9 | |
| - | |
| - | |
| - | |
| - | |
| ROM leach |
| 58 | |
| 0.32 | |
| - | |
| - | |
| - | |
| - | |
| 49.6 | |
| - | |
| - | |
| - | |
| - | |
|
|
| 8,552 | |
|
|
|
|
|
|
|
|
|
|
|
|
|
|
|
|
|
|
|
| ||||||||||
South America |
|
|
|
|
|
|
|
|
|
|
|
|
|
|
|
|
|
|
|
|
|
|
| |||||||||||
Cerro Verde | Mill |
| 3,785 | |
| 0.37 | |
| - | |
| 0.02 | |
| 1.54 | |
| - | |
| 86.2 | |
| - | |
| 54.3 | |
| 44.7 | |
| - | |
| Crushed leach |
| 100 | |
| 0.47 | |
| - | |
| - | |
| - | |
| - | |
| 79.9 | |
| - | |
| - | |
| - | |
| - | |
| ROM leach |
| 68 | |
| 0.24 | |
| - | |
| - | |
| - | |
| - | |
| 53.1 | |
| - | |
| - | |
| - | |
| - | |
El Abra | Crushed leach |
| 364 | |
| 0.51 | |
| - | |
| - | |
| - | |
| - | |
| 57.6 | |
| - | |
| - | |
| - | |
| - | |
| ROM leach |
| 80 | |
| 0.23 | |
| - | |
| - | |
| - | |
| - | |
| 43.4 | |
| - | |
| - | |
| - | |
| - | |
|
|
| 4,397 | |
|
|
|
|
|
|
|
|
|
|
|
|
|
|
|
|
|
|
|
| ||||||||||
Indonesia |
|
|
|
|
|
|
|
|
|
|
|
|
|
|
|
|
|
|
|
|
|
|
| |||||||||||
Grasberg open pit | Mill |
| 179 | |
| 0.96 | |
| 1.06 | |
| - | |
| 2.41 | |
| - | |
| 84.1 | |
| 81.1 | |
| - | |
| 43.5 | |
| - | |
Deep Ore Zone | Mill |
| 146 | |
| 0.54 | |
| 0.69 | |
| - | |
| 2.22 | |
| - | |
| 86.4 | |
| 77.2 | |
| - | |
| 65.8 | |
| - | |
Big Gossan | Mill |
| 54 | |
| 2.26 | |
| 0.99 | |
| - | |
| 13.82 | |
| - | |
| 91.5 | |
| 65.6 | |
| - | |
| 63.7 | |
| - | |
Grasberg Block Cave c | Mill |
| 1,012 | |
| 1.00 | |
| 0.77 | |
| - | |
| 3.49 | |
| - | |
| 84.3 | |
| 65.0 | |
| - | |
| 57.1 | |
| - | |
Kucing Liar c | Mill |
| 406 | |
| 1.25 | |
| 1.07 | |
| - | |
| 6.67 | |
| - | |
| 85.0 | |
| 45.1 | |
| - | |
| 38.8 | |
| - | |
Deep Mill Level Zone c | Mill |
| 472 | |
| 0.87 | |
| 0.71 | |
| - | |
| 4.36 | |
| - | |
| 86.8 | |
| 79.3 | |
| - | |
| 64.9 | |
| - | |
|
|
| 2,269 | |
|
|
|
|
|
|
|
|
|
|
|
|
|
|
|
|
|
|
|
| ||||||||||
Africa |
|
|
|
|
|
|
|
|
|
|
|
|
|
|
|
|
|
|
|
|
|
|
| |||||||||||
Tenke Fungurume | Agitation leach |
| 98 | |
| 3.27 | |
| - | |
| - | |
| - | |
| 0.38 | |
| 86.4 | |
| - | |
| - | |
| - | |
| 75.9 | |
Total FCX - 100% Basis |
|
| 15,316 | |
|
|
|
|
|
|
|
|
|
|
|
|
|
|
|
|
|
|
|
| ||||||||||
| ||||||||||||||||||||||||||||||||||
a. | Recoveries are net of estimated mill and smelter losses. |
b. | Grade not shown because of rounding. |
c. | Undeveloped reserves that would require additional capital investment, which could be significant, to bring into production. |
31
Table of Contents
Recoverable Proven and Probable Mineral Reserves | ||||||||||||||||||
Estimated at December 31, 2014 | ||||||||||||||||||
(continued) | ||||||||||||||||||
|
|
|
|
| Recoverable Reserves | |||||||||||||
|
|
|
|
| Copper |
| Gold |
| Moly |
| Silver |
| Cobalt | |||||
| FCX's |
| Processing |
| billion |
| million |
| billion |
| million |
| billion | |||||
| Interest |
| Method |
| lbs. |
| ozs. |
| lbs. |
| ozs. |
| lbs. | |||||
North America |
|
|
|
|
|
|
|
|
|
|
|
|
| |||||
Morenci | 85% |
| Mill |
| 6.0 | |
| - | |
| 0.17 | |
| - | |
| - | |
|
|
| Crushed leach |
| 3.9 | |
| - | |
| - | |
| - | |
| - | |
|
|
| ROM leach |
| 4.5 | |
| - | |
| - | |
| - | |
| - | |
Bagdad | 100% |
| Mill |
| 7.5 | |
| 0.1 | |
| 0.38 | |
| 29.8 | |
| - | |
|
|
| ROM leach |
| 0.2 | |
| - | |
| - | |
| - | |
| - | |
Safford | 100% |
| Crushed leach |
| 0.8 | |
| - | |
| - | |
| - | |
| - | |
Sierrita | 100% |
| Mill |
| 10.6 | |
| 0.1 | |
| 1.01 | |
| 54.6 | |
| - | |
Miami | 100% |
| ROM leach |
| - | | a | - | |
| - | |
| - | |
| - | |
Chino | 100% |
| Mill |
| 1.4 | |
| 0.1 | |
| 0.01 | |
| 1.8 | |
| - | |
|
|
| ROM leach |
| 0.3 | |
| - | |
| - | |
| - | |
| - | |
Tyrone | 100% |
| ROM leach |
| 0.2 | |
| - | |
| - | |
| - | |
| - | |
Henderson | 100% |
| Mill |
| - | |
| - | |
| 0.28 | |
| - | |
| - | |
Climax | 100% |
| Mill |
| - | |
| - | |
| 0.58 | |
| - | |
| - | |
Cobre | 100% |
| Mill |
| 0.1 | |
| - | |
| - | |
| - | |
| - | |
|
|
| ROM leach |
| 0.2 | |
| - | |
| - | |
| - | |
| - | |
|
|
|
|
| 35.7 | |
| 0.3 | |
| 2.43 | |
| 86.2 | |
| - | |
Recoverable metal in stockpiles b |
|
|
| 2.1 | |
| - | |
| 0.01 | |
| - | |
| - | | |
100% operations |
|
|
| 37.8 | |
| 0.3 | |
| 2.44 | |
| 86.2 | |
| - | | |
Consolidated c |
|
|
| 35.6 | |
| 0.3 | |
| 2.42 | |
| 86.2 | |
| - | | |
Net equity interest d |
|
|
| 35.6 | |
| 0.3 | |
| 2.42 | |
| 86.2 | |
| - | | |
South America |
|
|
|
|
|
|
|
|
|
|
|
|
| |||||
Cerro Verde | 53.56% |
| Mill |
| 26.8 | |
| - | |
| 0.66 | |
| 83.9 | |
| - | |
|
|
| Crushed leach |
| 0.8 | |
| - | |
| - | |
| - | |
| - | |
|
|
| ROM leach |
| 0.2 | |
| - | |
| - | |
| - | |
| - | |
El Abra | 51% |
| Crushed leach |
| 2.3 | |
| - | |
| - | |
| - | |
| - | |
|
|
| ROM leach |
| 0.2 | |
| - | |
| - | |
| - | |
| - | |
|
|
|
|
| 30.3 | |
| - | |
| 0.66 | |
| 83.9 | |
| - | |
Recoverable metal in stockpiles b |
|
|
| 1.5 | |
| - | |
| 0.03 | |
| 2.7 | |
| - | | |
100% operations |
|
|
| 31.8 | |
| - | |
| 0.69 | |
| 86.6 | |
| - | | |
Consolidated c |
|
|
| 31.8 | |
| - | |
| 0.69 | |
| 86.6 | |
| - | | |
Net equity interest d |
|
|
| 16.9 | |
| - | |
| 0.37 | |
| 46.4 | |
| - | | |
Indonesia |
|
|
|
|
|
|
|
|
|
|
|
|
| |||||
Grasberg open pit | e |
| Mill |
| 3.2 | |
| 4.9 | |
| - | |
| 6.1 | |
| - | |
Deep Ore Zone | e |
| Mill |
| 1.5 | |
| 2.5 | |
| - | |
| 6.8 | |
| - | |
Big Gossan | e |
| Mill |
| 2.4 | |
| 1.1 | |
| - | |
| 15.3 | |
| - | |
Grasberg Block Cave | e |
| Mill |
| 18.9 | |
| 16.3 | |
| - | |
| 64.7 | |
| - | |
Kucing Liar | e |
| Mill |
| 9.5 | |
| 6.3 | |
| - | |
| 33.8 | |
| - | |
Deep Mill Level Zone | e |
| Mill |
| 7.9 | |
| 8.6 | |
| - | |
| 43.0 | |
| - | |
100% operations |
|
|
| 43.4 | |
| 39.7 | |
| - | |
| 169.7 | |
| - | | |
Consolidated c |
|
|
| 29.0 | |
| 28.2 | |
| - | |
| 110.1 | |
| - | | |
Net equity interest d |
|
|
| 26.3 | |
| 25.6 | |
| - | |
| 99.8 | |
| - | | |
Africa |
|
|
|
|
|
|
|
|
|
|
|
|
| |||||
Tenke Fungurume | 56% |
| Agitation leach |
| 6.1 | |
| - | |
| - | |
| - | |
| 0.62 | |
Recoverable metal in stockpiles b |
|
|
| 1.0 | |
| - | |
| - | |
| - | |
| 0.23 | | |
100% operations |
|
|
| 7.1 | |
| - | |
| - | |
| - | |
| 0.85 | | |
Consolidated c |
|
|
| 7.1 | |
| - | |
| - | |
| - | |
| 0.85 | | |
Net equity interest d |
|
|
| 4.0 | |
| - | |
| - | |
| - | |
| 0.47 | | |
|
|
|
|
|
|
|
|
|
|
|
|
| ||||||
Total FCX – 100% basis |
|
|
| 120.1 | |
| 40.0 | |
| 3.13 | |
| 342.5 | |
| 0.85 | | |
Total FCX – Consolidated basis c |
|
|
| 103.5 | |
| 28.5 | |
| 3.11 | |
| 282.9 | |
| 0.85 | | |
Total FCX – Net equity interest d |
|
|
| 82.8 | |
| 25.9 | |
| 2.79 | |
| 232.4 | |
| 0.47 | | |
a. | Amounts not shown because of rounding. |
b. | Refer to "Mill and Leach Stockpiles" for additional information. |
c. | Consolidated reserves represent estimated metal quantities after reduction for joint venture partner interests at the Morenci mine in North America and at the Grasberg minerals district in Indonesia. |
d. | Net equity interest represents estimated consolidated metal quantities further reduced for noncontrolling interest ownership. |
e. | Our joint venture agreement with Rio Tinto provides that PT-FI will receive cash flow from specified annual amounts of copper, gold and silver through 2021, calculated by reference to its proven and probable reserves as of December 31, 1994, and 60 percent of all remaining cash flow. |
32
Table of Contents
In defining our open-pit reserves, we apply a "variable cutoff grade" strategy. The objective of this strategy is to maximize the net present value of our operations. We use a "break-even cutoff grade" to define the in-situ reserves for our underground ore bodies. The break-even cutoff grade is defined for a metric ton of ore as that equivalent copper grade, once produced and sold, that generates sufficient revenue to cover all operating and administrative costs associated with our production.
Our copper mines may contain other commercially recoverable metals, such as gold, molybdenum, silver and cobalt. We value all commercially recoverable metals in terms of a copper equivalent percentage to determine a single cutoff grade. Copper equivalent percentage is used to express the relative value of multi-metal ores in terms of one metal. The calculation expresses the relative value of the ore using estimates of contained metal quantities, metals prices as used for reserve determination, recovery rates, treatment charges and royalties. Our molybdenum properties use a molybdenum cutoff grade.
The table below shows the minimum cutoff grade by process for each of our existing ore bodies as of December 31, 2014 :
| Copper Equivalent Cutoff Grade (Percent) |
| Molybdenum Cutoff Grade (Percent) | ||||
| Mill |
| Crushed or Agitation Leach |
| ROM Leach |
| Mill |
North America |
|
|
|
|
|
|
|
Morenci | 0.25 |
| 0.19 |
| 0.03 |
| - |
Bagdad | 0.18 |
| - |
| 0.08 |
| - |
Safford | - |
| 0.13 |
| - |
| - |
Sierrita | 0.18 |
| - |
| - |
| - |
Miami | - |
| - |
| 0.05 |
| - |
Chino | 0.20 |
| - |
| 0.08 |
| - |
Tyrone | - |
| - |
| 0.07 |
| - |
Henderson | - |
| - |
| - |
| 0.12 |
Climax | - |
| - |
| - |
| 0.05 |
Cobre | 0.50 |
| - |
| 0.10 |
| - |
South America |
|
|
|
|
|
|
|
Cerro Verde | 0.17 |
| 0.19 |
| 0.14 |
| - |
El Abra | - |
| 0.11 |
| 0.08 |
| - |
Indonesia |
|
|
|
|
|
|
|
Grasberg open pit | 0.25 |
| - |
| - |
| - |
Deep Ore Zone | 0.83 |
| - |
| - |
| - |
Big Gossan | 1.88 |
| - |
| - |
| - |
Grasberg Block Cave | 0.74 |
| - |
| - |
| - |
Kucing Liar | 0.86 |
| - |
| - |
| - |
Deep Mill Level Zone | 0.75 |
| - |
| - |
| - |
Africa |
|
|
|
|
|
|
|
Tenke Fungurume | - |
| 1.31 |
| - |
| - |
33
Table of Contents
Drill hole spacing data is used by mining professionals, such as geologists and geological engineers, in determining the suitability of data coverage (on a relative basis) in a given deposit type and mining method scenario so as to achieve a given level of confidence in the resource estimate. Drill hole spacing is only one of several criteria necessary to establish resource classification. Drilling programs are typically designed to achieve an optimum sample spacing to support the level of confidence in results that apply to a particular stage of development of a mineral deposit.
The following table sets forth the average drill hole spacing based on average sample distance or drill pattern spacing for proven and probable ore reserves by process type:
|
| Average Drill Hole Spacing (in Meters) | |||||||
|
|
| Proven |
| Probable | ||||
| Mining Unit |
| Mill |
| Leach |
| Mill |
| Leach |
North America |
|
|
|
|
|
|
|
|
|
Morenci | Open Pit |
| 86 |
| 86 |
| 122 |
| 122 |
Bagdad | Open Pit |
| 86 |
| 86 |
| 122 |
| 122 |
Safford | Open Pit |
| - |
| 86 |
| - |
| 122 |
Sierrita | Open Pit |
| 73 |
| - |
| 104 |
| - |
Miami | Open Pit |
| - |
| 61 |
| - |
| 91 |
Chino | Open Pit |
| 43 |
| 86 |
| 86 |
| 122 |
Tyrone | Open Pit |
| - |
| 86 |
| - |
| 86 |
Henderson | Block Cave |
| 38 |
| - |
| 85 |
| - |
Climax | Open Pit |
| 61 |
| - |
| 91 |
| - |
Cobre | Open Pit |
| 61 |
| 61 |
| 91 |
| 91 |
South America |
|
|
|
|
|
|
|
|
|
Cerro Verde | Open Pit |
| 50 |
| 50 |
| 100 |
| 100 |
El Abra | Open Pit |
| - |
| 75 |
| - |
| 120 |
Indonesia |
|
|
|
|
|
|
|
|
|
Grasberg | Open Pit |
| 35 |
| - |
| 82 |
| - |
Deep Ore Zone | Block Cave |
| 29 |
| - |
| 57 |
| - |
Big Gossan | Open Stope |
| 12 |
| - |
| 36 |
| - |
Grasberg | Block Cave |
| 34 |
| - |
| 80 |
| - |
Kucing Liar | Block Cave |
| 39 |
| - |
| 99 |
| - |
Deep Mill Level Zone | Block Cave |
| 16 |
| - |
| 61 |
| - |
Africa |
|
|
|
|
|
|
|
|
|
Tenke Fungurume | Open Pit |
| - |
| 50 |
| - |
| 100 |
34
Table of Contents
Production Sequencing
The following chart illustrates our current plans for sequencing and producing our proven and probable reserves at each of our ore bodies and the years in which we currently expect production from each ore body and from related stockpiles. The chart also shows the term of PT-FI's COW. Production volumes are typically lower in the first few years for each ore body as development activities are ongoing and as the mine ramps up to full production and production volumes may also be lower as the mine reaches the end of its life. The ultimate timing of the start of production from our undeveloped mines is dependent upon a number of factors, including the results of our exploration and development efforts, and may vary from the dates shown below. In addition, we develop our mine plans based on maximizing the net present value from the ore bodies. Significant additional capital expenditures will be required at many of these mines in order to achieve the life-of-mine plans reflected below.
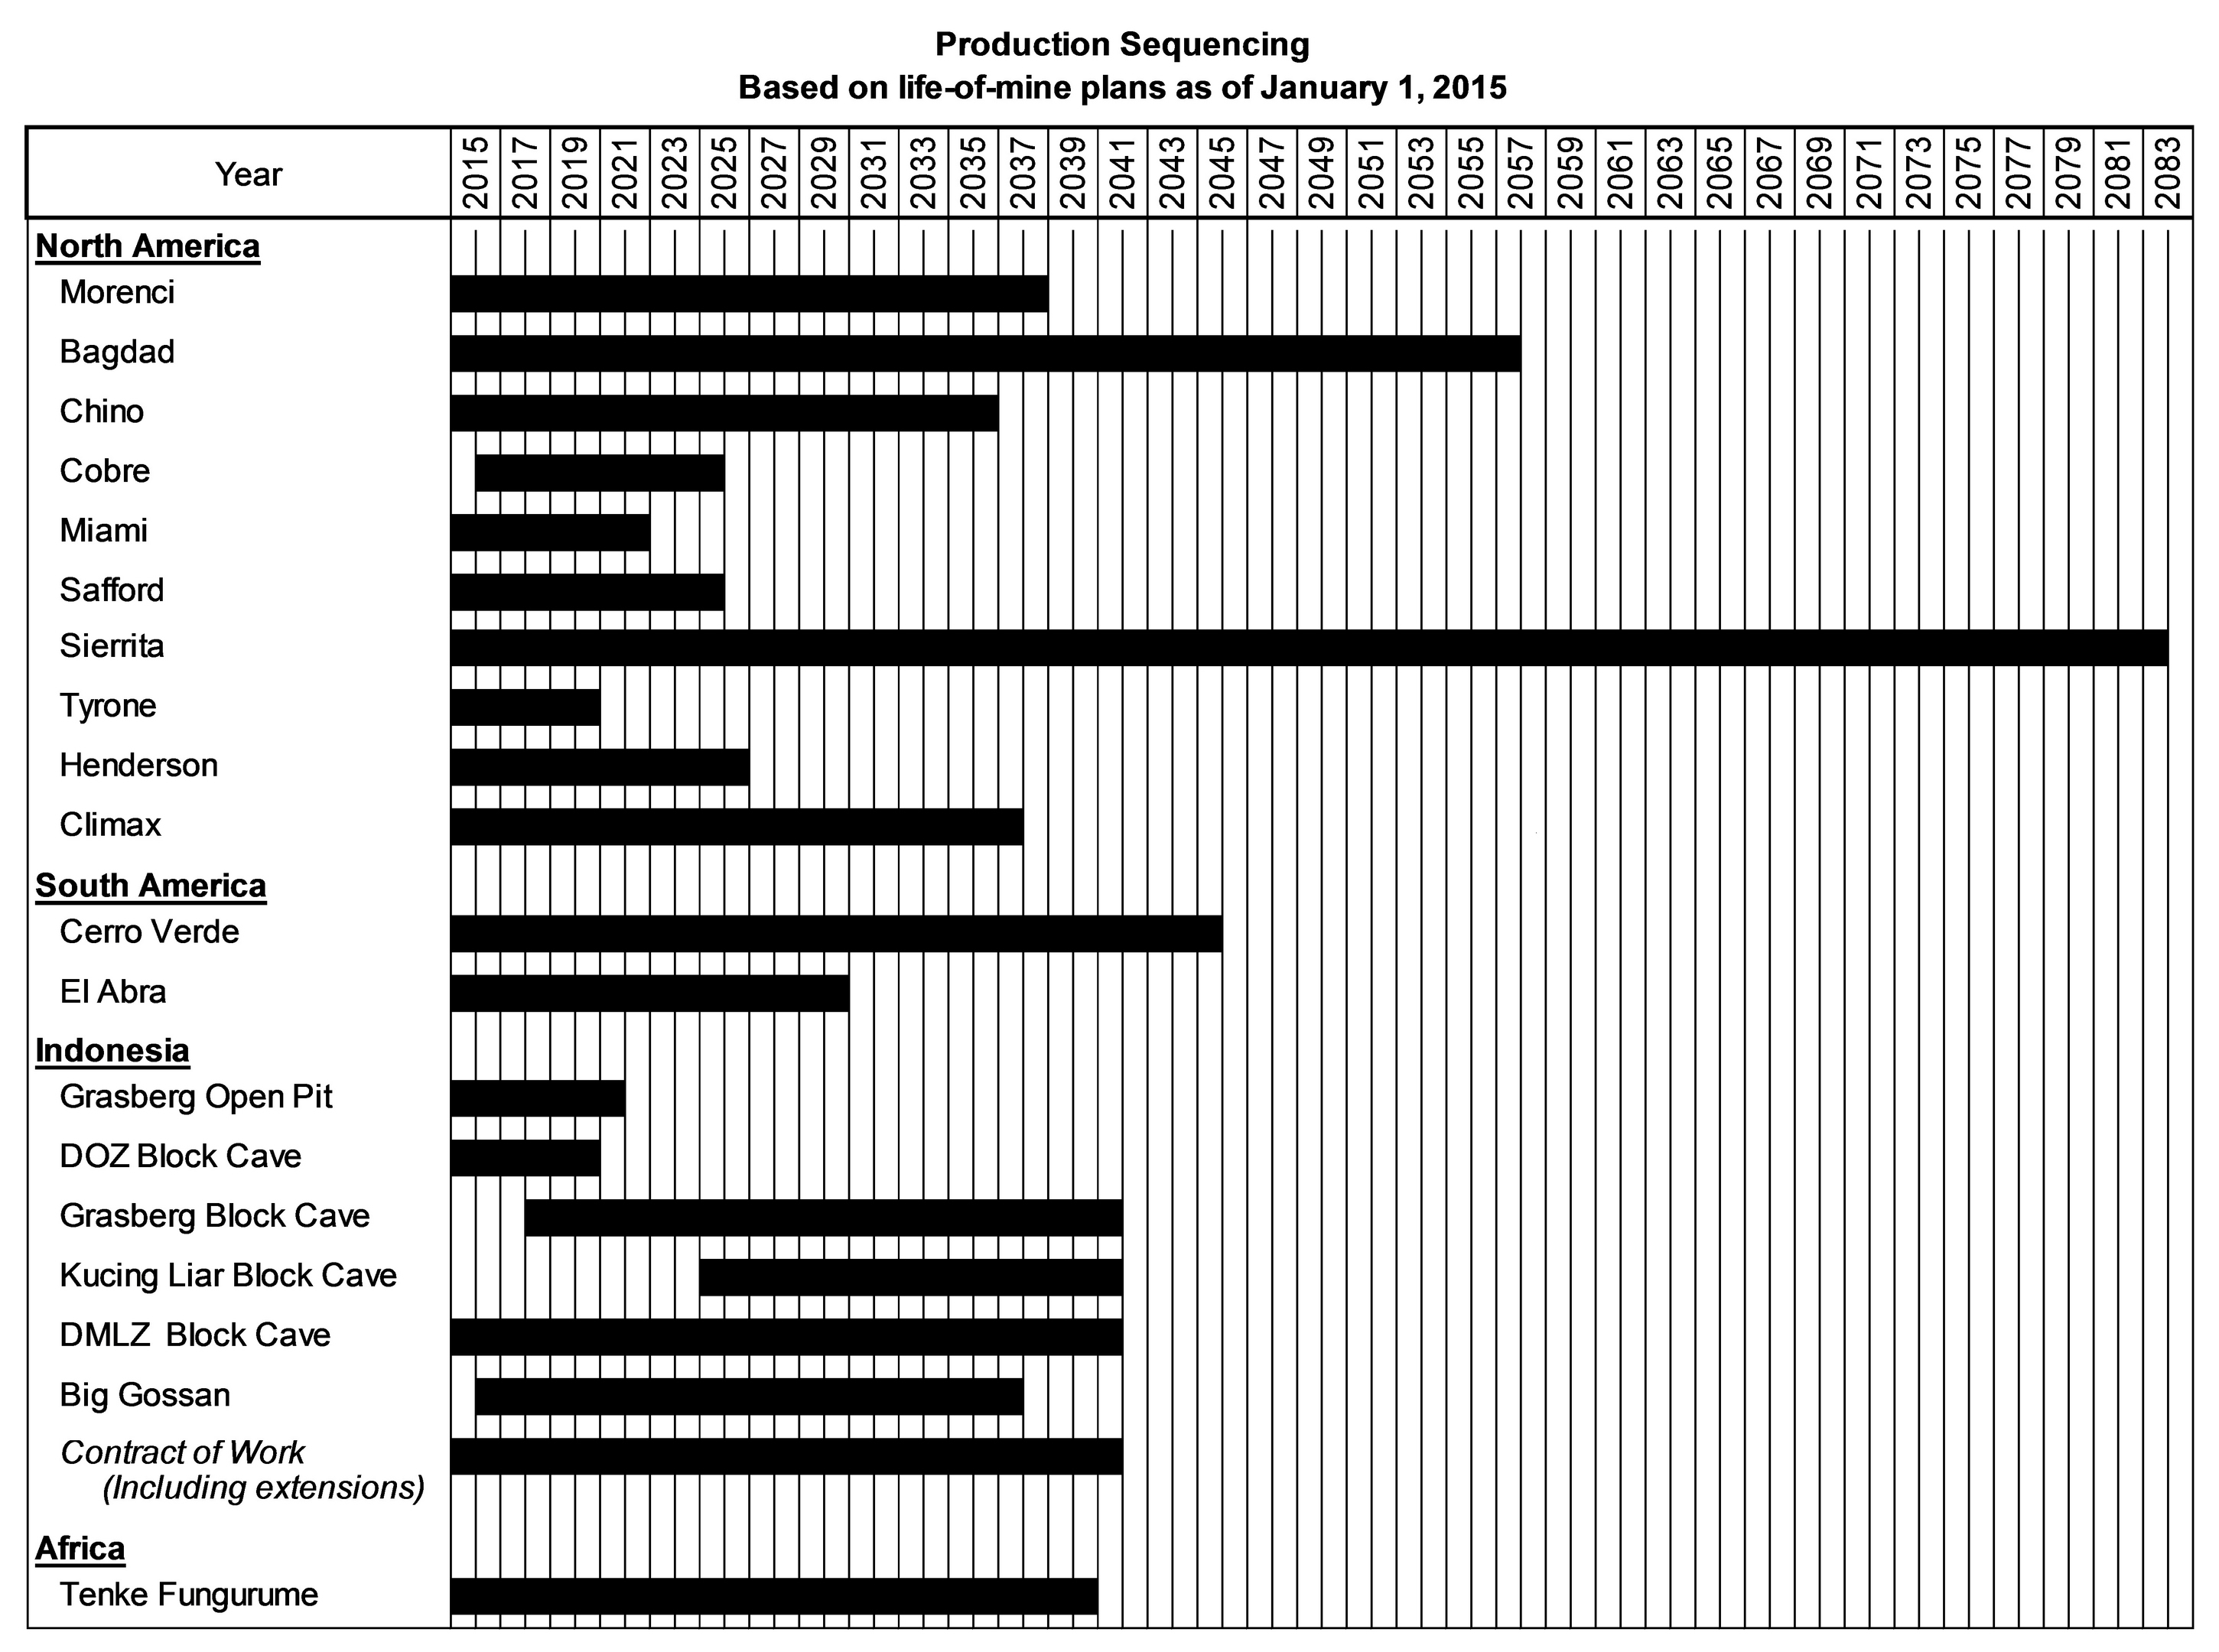
Mill and Leach Stockpiles
Mill and leach stockpiles generally contain lower grade ores that have been extracted from an ore body and are available for copper recovery. Mill stockpiles contain sulfide ores and recovery of metal is through milling, concentrating, smelting and refining or, alternatively, by concentrate leaching. Leach stockpiles contain oxide ores and certain secondary sulfide ores and recovery of metal is through exposure to acidic solutions that dissolve contained copper and deliver it in solution to extraction processing facilities.
Because it is generally impracticable to determine copper contained in mill and leach stockpiles by physical count, reasonable estimation methods are employed. The quantity of material delivered to mill and leach stockpiles is based on surveyed volumes of mined material and daily production records. Sampling and assaying of blasthole cuttings determine the estimated copper grades of material delivered to mill and leach stockpiles.
Expected copper recovery rates for mill stockpiles are determined by metallurgical testing. The recoverable copper in mill stockpiles, once entered into the production process, can be produced into copper concentrate almost immediately.
35
Table of Contents
Expected copper recovery rates for leach stockpiles are determined using small-scale laboratory tests, small- to large-scale column testing (which simulates the production-scale process), historical trends and other factors, including mineralogy of the ore and rock type. Total copper recovery in leach stockpiles can vary significantly from a low percentage to more than 90 percent depending on several variables, including processing methodology, processing variables, mineralogy and particle size of the rock. For newly placed material on active stockpiles, as much as 80 percent of total copper recovery may be extracted during the first year, and the remaining copper may be recovered over many years.
Processes and recovery rates are monitored regularly, and recovery rate estimates are adjusted periodically as additional information becomes available and as related technology changes.
|
|
|
|
|
|
| Recoverable | |||||
| Million |
| Average |
| Recovery |
| Copper | |||||
| Metric Tons |
| Ore Grade (%) |
| Rate (%) |
| (billion pounds) | |||||
Mill stockpiles |
|
|
|
|
|
|
|
| ||||
Cerro Verde | 131 | |
| 0.37 | |
| 81.4 | |
| 0.9 | |
|
|
|
|
|
|
|
|
|
| ||||
Leach stockpiles |
|
|
|
|
|
|
|
| ||||
Morenci | 5,730 | |
| 0.24 | |
| 2.4 | |
| 0.7 | |
|
Bagdad | 498 | |
| 0.25 | |
| 2.0 | |
| 0.1 | |
|
Safford | 187 | |
| 0.41 | |
| 15.2 | |
| 0.3 | |
|
Sierrita | 650 | |
| 0.15 | |
| 11.4 | |
| 0.2 | |
|
Miami | 494 | |
| 0.39 | |
| 3.2 | |
| 0.1 | |
|
Chino | 1,665 | |
| 0.26 | |
| 5.2 | |
| 0.5 | |
|
Tyrone | 1,107 | |
| 0.28 | |
| 2.7 | |
| 0.2 | |
|
Cerro Verde | 479 | |
| 0.51 | |
| 3.4 | |
| 0.2 | |
|
El Abra | 592 | |
| 0.43 | |
| 7.7 | |
| 0.4 | |
|
Tenke Fungurume | 39 | |
| 1.26 | |
| 91.2 | |
| 1.0 | |
|
| 11,441 | |
|
|
|
|
| 3.7 | |
| ||
|
|
|
|
|
|
|
|
| ||||
Total FCX - 100% basis |
|
|
|
|
|
| 4.6 | |
| |||
Total FCX - Consolidated basis a |
|
|
|
|
|
| 4.5 | |
| |||
Total FCX - Net equity interest b |
|
|
|
|
|
| 3.3 | |
| |||
|
|
|
|
|
|
|
|
| ||||
a. | Consolidated represents estimated metal quantities after reduction for our joint venture partner's interest in the Morenci mine in North America. |
b. | Net equity interest represents estimated consolidated metal quantities further reduced for noncontrolling interest ownership. |
Mineralized Material
We hold various properties containing mineralized material that we believe could be brought into production should market conditions warrant. However, permitting and significant capital expenditures would be required before operations could commence at these properties. Mineralized material is a mineralized body that has been delineated by appropriately spaced drilling and/or underground sampling to support the reported tonnage and average metal grades. Such a deposit cannot qualify as recoverable proven and probable reserves until legal and economic feasibility are confirmed based upon a comprehensive evaluation of development costs, unit costs, grades, recoveries and other material factors. Estimated mineralized materials as presented on the following page were assessed using prices of $2.20 per pound for copper, $1,000 per ounce for gold and $12 per pound for molybdenum.
36
Table of Contents
Mineralized Material | |||||||||||||||||||||||||||
Estimated at December 31, 2014 | |||||||||||||||||||||||||||
|
|
|
| Milling Material |
| Leaching Material |
| Total Mineralized Material |
| ||||||||||||||||||
|
|
|
| Million |
|
|
|
|
|
|
|
|
| Million |
|
|
| Million |
| ||||||||
|
| FCX's |
| metric |
| Copper |
| Gold |
| Moly |
| SIlver |
| metric |
| Copper |
| metric |
| ||||||||
|
| Interest |
| tons |
| % |
| g/t |
| % |
| g/t |
| tons |
| % |
| tons |
| ||||||||
North America |
|
|
|
|
|
|
|
|
|
|
|
|
|
|
|
|
|
|
| ||||||||
Morenci |
| 85% |
| 1,042 | |
| 0.27 | |
| - | |
| 0.02 | |
| - | |
| 1,085 | |
| 0.21 | |
| 2,127 | |
|
Bagdad |
| 100% |
| 652 | |
| 0.27 | |
| - | | a | 0.02 | |
| 1.3 | |
| 6 | |
| 0.17 | |
| 658 | |
|
Safford |
| 100% |
| 272 | |
| 0.61 | |
| 0.11 | |
| - | |
| 2.3 | |
| 47 | |
| 0.29 | |
| 319 | |
|
Sierrita |
| 100% |
| 1,535 | |
| 0.18 | |
| - | | a | 0.02 | |
| 1.1 | |
| - | |
| - | |
| 1,535 | |
|
Chino |
| 100% |
| 163 | |
| 0.43 | |
| 0.03 | |
| 0.01 | |
| 0.4 | |
| 30 | |
| 0.28 | |
| 193 | |
|
Tyrone |
| 100% |
| - | |
| - | |
| - | |
| - | |
| - | |
| 31 | |
| 0.33 | |
| 31 | |
|
Henderson |
| 100% |
| 226 | |
| - | |
| - | |
| 0.12 | |
| - | |
| - | |
| - | |
| 226 | |
|
Climax |
| 100% |
| 460 | |
| - | |
| - | |
| 0.15 | |
| - | |
| - | |
| - | |
| 460 | |
|
Cobre |
| 100% |
| 31 | |
| 0.50 | |
| 0.07 | |
| - | |
| 1.2 | |
| 5 | |
| 0.33 | |
| 36 | |
|
Ajo |
| 100% |
| 434 | |
| 0.40 | |
| 0.06 | |
| 0.01 | |
| 0.8 | |
| - | |
| - | |
| 434 | |
|
Cochise/Bisbee |
| 100% |
| - | |
| - | |
| - | |
| - | |
| - | |
| 254 | |
| 0.46 | |
| 254 | |
|
Lone Star |
| 100% |
| - | |
| - | |
| - | |
| - | |
| - | |
| 656 | |
| 0.44 | |
| 656 | |
|
Sanchez |
| 100% |
| - | |
| - | |
| - | |
| - | |
| - | |
| 180 | |
| 0.29 | |
| 180 | |
|
Tohono |
| 100% |
| 152 | |
| 0.69 | |
| - | |
| - | |
| - | |
| 165 | |
| 0.68 | |
| 317 | |
|
Twin Buttes |
| 100% |
| 73 | |
| 0.62 | |
| - | |
| 0.04 | |
| 6.4 | |
| 44 | |
| 0.23 | |
| 117 | |
|
Christmas |
| 100% |
| 245 | |
| 0.39 | |
| 0.05 | |
| - | | a | 1.0 | |
| - | |
| - | |
| 245 | |
|
South America |
|
|
|
|
|
|
|
|
|
|
|
|
|
|
|
|
|
|
| ||||||||
Cerro Verde |
| 53.56% |
| 272 | |
| 0.34 | |
| - | |
| 0.01 | |
| 1.4 | |
| 5 | |
| 0.40 | |
| 277 | |
|
El Abra |
| 51% |
| 1,765 | |
| 0.46 | |
| 0.02 | |
| 0.01 | |
| 1.5 | |
| 187 | |
| 0.30 | |
| 1,952 | |
|
Indonesia |
|
|
|
|
|
|
|
|
|
|
|
|
|
|
|
|
|
|
| ||||||||
Grasberg minerals district |
| 54.38% b |
| 2,489 | |
| 0.67 | |
| 0.60 | |
| - | |
| 3.6 | |
| - | |
| - | |
| 2,489 | |
|
Africa |
|
|
|
|
|
|
|
|
|
|
|
|
|
|
|
|
|
|
| ||||||||
Tenke Fungurume c |
| 56% |
| 49 | |
| 4.05 | |
| - | |
| - | |
| - | |
| 21 | |
| 2.99 | |
| 70 | |
|
Kisanfu c |
| 95% |
| 49 | |
| 2.48 | |
| - | |
| - | |
| - | |
| 47 | |
| 3.16 | |
| 96 | |
|
Total FCX - 100% basis |
|
|
| 9,909 | |
|
|
|
|
|
|
|
|
| 2,763 | |
|
|
| 12,672 | |
| |||||
Total FCX - Consolidated basis d |
|
|
| 8,756 | |
|
|
|
|
|
|
|
|
| 2,600 | |
|
|
| 11,356 | |
| |||||
Total FCX - Net equity interest e |
|
|
| 7,602 | |
|
|
|
|
|
|
|
|
| 2,494 | |
|
|
| 10,096 | |
| |||||
|
|
| |||||||||||||||||||||||||
a. | Amounts not shown because of rounding. |
b. | FCX's interest in the Grasberg minerals district reflects our 60 percent joint venture ownership further reduced by noncontrolling interest ownership. |
c. | Stated tonnage also includes cobalt at Tenke Fungurume (0.33 percent) and Kisanfu (1.15 percent). |
d. | Consolidated basis represents estimated mineralized materials after reduction for our joint venture partners' interest in the Morenci mine and the Grasberg minerals district. |
e. | Net equity interest represents estimated consolidated mineralized material further reduced for noncontrolling interest ownership. |
37
Table of Contents
OIL AND GAS OPERATIONS
As further discussed in Note 2, during second-quarter 2013, we acquired oil and gas operations by completing the acquisitions of Plains Exploration & Production Company (PXP) and McMoRan Exploration Co. (MMR), collectively FM O&G. The portfolio of assets includes significant oil production facilities and growth potential in the Deepwater GOM, established oil production onshore and offshore California, large onshore natural gas resources in the Haynesville shale play in Louisiana, natural gas production from the Madden area in central Wyoming, and an industry-leading position in the emerging Inboard Lower Tertiary/Cretaceous natural gas trend located in the shallow waters of the GOM and onshore in South Louisiana. Approximately 90 percent of our oil and gas revenues are from oil and NGLs.
In June 2014, FM O&G completed the sale of its Eagle Ford shale assets. During 2014, FM O&G also acquired additional interests in the Deepwater GOM, including interests in the Lucius and Heidelberg oil fields and several exploration leases in June 2014, and an interest in the Vito oil discovery in the Mississippi Canyon area and a significant lease position in the Vito basin in September 2014. Refer to Note 2 for further discussion of these transactions.
Acreage
At December 31, 2014 , we owned interests in oil and gas leases covering 5.0 million gross acres ( 2.9 million acres net to our interest). The following table summarizes, by geographic area, the developed and undeveloped oil and gas acreage in which we held interests at December 31, 2014 :
|
|
|
| Developed |
| Undeveloped |
| ||||||||
|
|
|
| Gross Acres |
| Net Acres |
| Gross Acres |
| Net Acres |
| ||||
U.S.: |
|
|
|
|
|
|
|
| |||||||
| Louisiana: |
|
|
|
|
|
|
|
| ||||||
|
| Onshore | 403,860 | |
| 81,034 | |
| 207,870 | |
| 160,487 | |
| |
|
| Offshore | 363,162 | |
| 210,342 | |
| 1,058,752 | |
| 673,251 | |
| |
| Texas: |
|
|
|
|
|
|
|
| ||||||
|
| Onshore | 21,526 | |
| 4,358 | |
| 3,760 | |
| 745 | |
| |
|
| Offshore | 46,080 | |
| 26,850 | |
| - | |
| - | |
| |
| California: |
|
|
|
|
|
|
|
| ||||||
|
| Onshore | 60,898 | |
| 60,406 | |
| 63,755 | |
| 39,970 | |
| |
|
| Offshore | 43,335 | |
| 39,062 | |
| - | |
| - | |
| |
| Wyoming | 80,692 | |
| 13,688 | |
| 65,527 | |
| 51,965 | |
| ||
| Nevada | - | |
| - | |
| 246,073 | |
| 246,073 | |
| ||
| Other states | 2,984 | |
| 449 | |
| 217,610 | |
| 165,846 | |
| ||
|
| 1,022,537 | |
| 436,189 | |
| 1,863,347 | |
| 1,338,337 | |
| ||
| Morocco | - | |
| - | |
| 2,154,014 | |
| 1,120,087 | |
| ||
|
| 1,022,537 | |
| 436,189 | |
| 4,017,361 | |
| 2,458,424 | |
| ||
Approximately 35 percent of our total U.S. net undeveloped acres are covered by leases that expire from 2015 to 2017. As a result of the decrease in crude oil prices, our current plans anticipate that the majority of expiring acreage will not be retained by drilling operations or other means.
The exploration permits covering our Morocco acreage expire in 2016; however, we have the ability to extend the exploration permits through 2019.
Oil and Gas Properties
Our oil and gas properties are subject to customary royalty interests, liens incident to operating agreements, liens for current taxes and other burdens, including other mineral encumbrances and restrictions. We do not believe that any of these burdens materially interfere with our use of the properties in the operation of our business.
We believe that we have satisfactory title to or rights in all of our producing properties. As is customary in the oil and gas industry, we make minimal investigation of title at the time we acquire undeveloped properties. We make title investigations and receive title opinions of local counsel only before we commence drilling operations. We believe that we have satisfactory title to all of our other assets. Although title to our properties is subject to encumbrances in certain cases, we believe that none of these burdens will materially detract from the value of our properties or from our interest therein or will materially interfere with our use in the operation of our business.
38
Table of Contents
Following are descriptions of our primary U.S. oil and gas properties:
Gulf of Mexico .
Deepwater GOM. Our Deepwater GOM portfolio includes a 100 percent working interest in the Holstein, Horn Mountain, Marlin, Dorado and King fields, a 31 percent working interest in the Ram Powell field, a 33.3 percent working interest in the Hoover field, a 12.5 percent working interest in the Heidelberg field, and an 18.67 percent interest in the Vito field. Additionally, our subsidiary Plains Offshore Operations Inc. (Plains Offshore), holds a 20 percent working interest in the Lucius development and a 50 percent working interest in the Phobos discovery. FM O&G's combined ownership in the Lucius development, including the 20 percent held by Plains Offshore, is 25.1 percent. Refer to Note 2 for further discussion of Plains Offshore.
Following is a summary of our Deepwater GOM platforms at December 31, 2014:
|
|
|
|
|
|
|
|
| Capacity per Day | ||
Platform |
| Field Location |
| Type of Platform |
| Production Commenced |
| Water Depth (feet) | Oil (MBbls) |
| Gas (MMcf) |
Holstein a |
| Green Canyon Blocks 644, 645 and 688 |
| Truss Spar |
| 2004 |
| 4,300 | 113 |
| 142 |
Horn Mountain a |
| Mississippi Canyon Blocks 126 and 127 |
| Truss Spar |
| 2002 |
| 5,400 | 75 |
| 72 |
Marlin Hub a |
| Several b |
| Tension Leg |
| 2000 |
| 3,200 | 60 |
| 235 |
Ram Powell |
| Viosca Knoll Blocks 911 to 913 and 955 to 957 |
| Tension Leg |
| 1997 |
| 3,200 | 70 |
| 310 |
Hoover |
| Several c |
| Deep Draft Caisson Vessel |
| 2000 |
| 4,800 | 100 |
| 325 |
Lucius |
| Keathley Canyon Blocks 874,875,918 and 919 |
| Truss Spar |
| 2015 |
| 7,200 | 80 |
| 450 |
a. We are the operator of the Holstein, Horn Mountain and Marlin Hub platforms.
b. The Marlin Hub is the production facility for three fields: the Marlin field (S/2 Viosca Knoll Block 871 and N/2 Viosca Knoll Block 915), the Dorado field (S/2 Viosca Knoll Block 915) and the King field (Mississippi Canyon Blocks 84, 85, 128 and 129). The Marlin field currently produces via a combination of platform and subsea tie-back wells while the Dorado and King fields currently produce exclusively via subsea wells and tie-back infrastructure.
c. The Hoover platform is located in Alaminos Canyon Block 25. The Hoover field is located in Alaminos Canyon Blocks 25 and 26.
As further described in Note 2, during 2014, FM O&G completed the acquisition of Deepwater GOM interests, including interests in the Heidelberg oil field and several exploration leases, and in the Vito oil discovery and a significant lease position in the Vito area. We have a 12.5 percent interest in Heidelberg, a large, high-quality oil development project located in 5,300 feet of water in the Green Canyon area. The Heidelberg truss spar was designed as a Lucius-look-alike facility with capacity of 80 MBbls of oil per day. Development drilling is in progress and the project remains on track for first production in 2016. We have an 18.67 percent interest in Vito, a large, deep subsalt Miocene oil discovery made in 2009, located in 4,000 feet of water in the Mississippi Canyon area (Blocks 940, 941, 984 and 985). Exploration and appraisal drilling in recent years confirmed a significant resource in high-quality, subsalt Miocene sands. Development options are under evaluation.
Our Deepwater GOM exploration portfolio includes interests in 169 blocks containing 70 prospects in the Pliocene, Miocene and Lower Tertiary reservoirs.
GOM Shelf. Our GOM Shelf properties are primarily located on the outer continental shelf in the shallow waters (less than 500 feet of water) of the GOM and onshore in the Gulf Coast area of Louisiana, with drilling depths not exceeding 15,000 feet considered to be traditional shelf prospects.
39
Table of Contents
Inboard Lower Tertiary/Cretaceous. Prospects with drilling depths below the salt weld (generally at depths exceeding 25,000 feet) are considered Inboard Lower Tertiary/Cretaceous prospects.
California .
Onshore California. We hold a 100 percent working interest in the majority of our Los Angeles Basin properties in the Inglewood, Las Cienegas, Montebello, Packard and San Vicente fields, and a 100 percent working interest in the majority of our San Joaquin Basin properties in the Cymric, Midway Sunset and South Belridge fields. The Los Angeles Basin properties are characterized by light crude oil (21 to 32 degree American Petroleum Institute (API) gravity), have well depths ranging from 2,000 feet to over 10,000 feet and include both primary production and mature wells using waterflood recovery methods (whereby water is injected into the reservoir formation to displace residual oil), where producing wells have a high ratio of water produced compared to total liquids produced (high water cuts). The San Joaquin Basin properties are long-lived fields that have heavier oil (12 to 16 degree API gravity) and shallow wells (generally less than 2,000 feet) that require enhanced oil recovery techniques, including steam injection, and produce with high water cuts.
We also hold a 100 percent working interest in the Arroyo Grande Field located in San Luis Obispo County, which is a long-lived field that has heavier oil (12 to 16 degree API gravity) and well depths averaging 1,700 feet requiring continuous steam injection.
Offshore California. All of our offshore California properties are located in federal waters approximately five to seven miles offshore in the Santa Maria Basin. We hold a 69.3 percent working interest in the Point Arguello Unit, composed of the Hidalgo, Hermosa and Harvest platforms, and the various partnerships owning the related transportation, processing and marketing infrastructure. We also hold a 100 percent working interest in the Point Pedernales field, which includes the Irene platform, that is utilized to access the Federal Outer Continental Shelf Monterey Reservoir by extended reach directional wells and support facilities which lie within the onshore Lompoc field.
Haynesville . The Haynesville shale play is characterized by gas production from the Jurassic aged Haynesville shale formation in Louisiana, and typical well depth is 10,500 feet. The area has historically been developed with approximately 4,000 foot horizontal wells at a measured total depth of 16,000 feet.
Madden . We own an approximate 14 percent working interest in the Madden Deep Unit and Lost Cabin Gas Plant located in central Wyoming. The Madden Deep Unit is a federal unit operated by a third party and consists of acreage in the Wind River Basin. The Madden area is characterized by gas production from multiple stratigraphic horizons of the Lower Fort Union, Lance, Mesaverde and Cody sands and the Madison Dolomite. Production from the Madden Deep Unit is typically found at depths ranging from 5,500 to 25,000 feet.
Exploration and Development Activities
Our oil and gas business has significant proved, probable and possible reserves, a broad range of development opportunities and high-potential exploration prospects. The business is managed to reinvest its cash flows in projects with attractive rates of returns and risk profiles. Following the recent sharp decline in oil prices, we have taken steps to significantly reduce capital spending plans and near-term oil and gas growth initiatives in order to preserve cash flows and its resources for anticipated improved market conditions in the future. We are also evaluating third-party participation in our oil and gas projects to provide additional funding.
FM O&G has a large strategic position in the Deepwater GOM with significant current oil production, strong cash margins and existing infrastructure and facilities with excess capacity. These assets, combined with FM O&G's large leasehold interests in an established geologic basin, provide financially attractive investment opportunities for high-impact growth in oil production and cash margins. FM O&G's capital allocation strategy is principally focused on drilling and development opportunities that can be tied back to existing facilities.
Capital expenditures for oil and gas operations totaled $3.2 billion in 2014 and $1.45 billion for the seven month period ending December 31, 2013. Capital expenditures for oil and gas operations for the year 2015 are currently estimated to total $2.3 billion , with approximately 80 percent of the 2015 capital budget expected to be directed to its highest return focus areas in the GOM. We are committed to achieving our objective of funding oil and gas capital expenditures with oil and gas cash flows, third-party joint venture transactions or asset sales. FM O&G is engaged in discussions to obtain funding from industry partners and other oil and gas market participants for a substantial portion of its 2015 capital expenditures to achieve this objective. Third-party funding could also enable FM O&G to complete additional development wells for production.
40
Table of Contents
Refer to MD&A for further discussion of current exploration and development activities at our oil and gas operations.
Production and Sales Data
The following table presents summary production data, average realized prices and average production costs for our oil and gas operations for the year ended December 31, 2014 and the seven-month period ending December 31, 2013:
| Year Ended December 31, 2014 | ||||||||||||||
| GOM a |
| California |
| Haynesville/Madden/Other |
| Eagle Ford b |
| Total c | ||||||
Oil Sales (MBbls) | 19,681 | |
| 13,732 | |
| 222 | |
| 6,481 | |
| 40,116 | | |
|
|
|
|
|
|
|
|
|
| ||||||
Natural Gas Sales (MMcf) |
|
|
|
|
|
|
|
|
| ||||||
Production | 28,700 | |
| 3,558 | |
| 42,364 | |
| 7,410 | |
| 82,032 | | |
Less: fuel used in our operations | - | |
| 1,190 | |
| - | |
| - | |
| 1,190 | | |
Sales | 28,700 | |
| 2,368 | |
| 42,364 | |
| 7,410 | |
| 80,842 | | |
|
|
|
|
|
|
|
|
|
| ||||||
NGL Sales (MBbls) | 2,027 | |
| 171 | |
| 35 | |
| 978 | |
| 3,211 | | |
|
|
|
|
|
|
|
|
|
| ||||||
MBOE |
|
|
|
|
|
|
|
|
| ||||||
Production | 26,491 | |
| 14,496 | |
| 7,318 | |
| 8,694 | |
| 56,999 | | |
Sales | 26,491 | |
| 14,298 | |
| 7,318 | |
| 8,694 | |
| 56,801 | | |
|
|
|
|
|
|
|
|
|
| ||||||
Average Realizations, excluding derivatives |
|
|
|
|
|
|
|
|
| ||||||
Oil (per barrel) |
|
|
|
|
|
|
|
| $ | 92.76 | | ||||
Natural gas (per MMBtu) |
|
|
|
|
|
|
|
| $ | 4.37 | | ||||
NGLs (per barrel) |
|
|
|
|
|
|
|
| $ | 39.73 | | ||||
|
|
|
|
|
|
|
|
|
| ||||||
Average Cost per BOE |
|
|
|
|
|
|
|
|
| ||||||
Production costs d |
|
|
|
|
|
|
|
| $ | 18.00 | | ||||
Production and ad valorem taxes |
|
|
|
|
|
|
|
| 2.08 | | |||||
Cash production costs e |
|
|
|
|
|
|
|
| $ | 20.08 | | ||||
| Seven-Month Period Ending December 31, 2013 | ||||||||||||||
| GOM a |
| California |
| Haynesville/Madden/Other |
| Eagle Ford |
| Total c | ||||||
Oil Sales (MBbls) | 11,364 | |
| 7,977 | |
| 83 | |
| 7,206 | |
| 26,630 | | |
|
|
|
|
|
|
|
|
|
| ||||||
Natural Gas Sales (MMcf) |
|
|
|
|
|
|
|
|
| ||||||
Production | 17,231 | |
| 2,098 | |
| 26,782 | |
| 8,844 | |
| 54,955 | | |
Less: fuel used in our operations | - | |
| 780 | |
| - | |
| - | |
| 780 | | |
Sales | 17,231 | |
| 1,318 | |
| 26,782 | |
| 8,844 | |
| 54,175 | | |
|
|
|
|
|
|
|
|
|
| ||||||
NGL Sales (MBbls) | 1,049 | |
| 97 | |
| 27 | |
| 1,244 | |
| 2,417 | | |
|
|
|
|
|
|
|
|
|
| ||||||
MBOE |
|
|
|
|
|
|
|
|
| ||||||
Production | 15,286 | |
| 8,423 | |
| 4,574 | |
| 9,924 | |
| 38,207 | | |
Sales | 15,286 | |
| 8,293 | |
| 4,574 | |
| 9,924 | |
| 38,077 | | |
|
|
|
|
|
|
|
|
|
| ||||||
Average Realizations, excluding derivatives |
|
|
|
|
|
|
|
|
| ||||||
Oil (per barrel) |
|
|
|
|
|
|
|
| $ | 99.67 | | ||||
Natural gas (per MMBtu) |
|
|
|
|
|
|
|
| $ | 3.73 | | ||||
NGLs (per barrel) |
|
|
|
|
|
|
|
| $ | 38.20 | | ||||
|
|
|
|
|
|
|
|
|
| ||||||
Average Cost per BOE |
|
|
|
|
|
|
|
|
| ||||||
Production costs d |
|
|
|
|
|
|
|
| $ | 15.18 | | ||||
Production and ad valorem taxes |
|
|
|
|
|
|
|
| 1.96 | | |||||
Cash production costs e |
|
|
|
|
|
|
|
| $ | 17.14 | | ||||
a. | Includes properties in the Deepwater GOM and on the Shelf. |
b. | Includes the results of Eagle Ford through June 19, 2014. |
c. | At December 31, 2014 and 2013, no individual fields represented 15 percent or more of our proved oil and gas reserves. |
d. | Reflects costs incurred to operate and maintain wells and related equipment and facilities. |
41
Table of Contents
e. | Refer to MD&A for further discussion of cash production costs per BOE and for a reconciliation to production and delivery costs reported in our consolidated financial statements. |
Oil and Natural Gas Reserves
Our reserve volumes have been determined in accordance with the current regulations and guidelines established by the SEC, which require the use of an average price, calculated as the twelve-month average of the first-day-of-the-month historical reference price as adjusted for location and quality differentials, unless prices are defined by contractual arrangements, excluding escalations based upon future conditions and the impact of derivatives. Reference prices for reserve determination are the WTI spot price for crude oil and the Henry Hub spot price for natural gas. At December 31, 2014 , our estimates were based on reference prices of $94.99 per barrel and $4.35 per MMBtu. All of our oil and natural gas reserves are located in the U.S.
Proved Reserves. All of our estimated proved oil and natural gas reserves at December 31, 2014 , are based upon reserve reports prepared by the independent petroleum engineering firms of Netherland, Sewell & Associates, Inc. (NSAI) and Ryder Scott Company, L.P. (Ryder Scott). The scope and results of procedures employed by NSAI and Ryder Scott are summarized in letters that are filed as exhibits to this annual report on Form 10-K. For purposes of reserve estimation, we and our independent petroleum engineers used technical and economic data including well logs, geologic maps, seismic data, well test data, production data, historical price and cost information, and property ownership interests. Our reserves have been estimated using deterministic methods. Standard engineering and geoscience methods were used, or a combination of methods, including performance analysis, volumetric analysis and analogy, which we and our independent petroleum engineers considered to be appropriate and necessary to categorize and estimate reserves in accordance with SEC definitions and regulations. A substantial portion of these reserves are for undeveloped locations; such reserves are based on estimates of reserve volumes and recovery efficiencies along with analogy to properties with similar geologic and reservoir characteristics. Because these estimates depend on many assumptions, any or all of which may differ substantially from actual results, reserve estimates may differ from the quantities of oil and natural gas that we ultimately recover.
Proved reserves represent quantities of oil and natural gas, which, by analysis of geoscience and engineering data, can be estimated with reasonable certainty to be economically producible from a given date forward, from known reservoirs, and under existing economic conditions, operating methods and government regulations. The term "reasonable certainty" implies a high degree of confidence that the quantities of oil and natural gas actually recovered will equal or exceed the estimate. At December 31, 2014 , our estimated proved oil and natural gas reserves totaled 390 MMBOE, of which 74 percent was comprised of oil (including NGLs).
|
| Proved Oil and Natural Gas Reserves |
| |||||||
|
| Estimated at December 31, 2014 |
| |||||||
|
| Oil a |
| Natural Gas |
| Total |
| |||
|
| (MMBbls) |
| (Bcf) |
| (MMBOE) |
| |||
Proved Developed: |
|
|
|
|
|
|
| |||
GOM |
| 69 | |
| 118 | |
| 89 | |
|
California |
| 114 | |
| 22 | |
| 118 | |
|
Haynesville/Madden/Other |
| 1 | |
| 229 | |
| 39 | |
|
|
| 184 | |
| 369 | |
| 246 | |
|
Proved Undeveloped: |
|
|
|
|
|
|
| |||
GOM |
| 69 | |
| 57 | |
| 79 | |
|
California |
| 35 | |
| 3 | |
| 35 | |
|
Haynesville/Madden/Other |
| - | |
| 181 | |
| 30 | |
|
|
| 104 | |
| 241 | |
| 144 | |
|
Total Proved Reserves |
| 288 | |
| 610 | |
| 390 | |
|
|
|
|
|
|
|
|
| |||
a. Includes 10 MMBbls of NGL proved reserves, consisting of 7 MMBbls of proved developed and 3 MMBbls of proved undeveloped.
At December 31, 2014 , we have an estimated total proved reserve life of 8.1 years and a proved developed reserve life of 5.1 years.
At December 31, 2014 , proved undeveloped reserves represented 37 percent of our total proved reserves. With the exception of one planned sidetrack development well in one of our Deepwater GOM properties that cannot be executed until the current producing well depletes, 96 percent of our proved undeveloped reserves are scheduled
42
Table of Contents
for development within five years, and $3.2 billion (or 95 percent) of our estimated future proved undeveloped capital is associated with the development of those reserves.
Total estimated proved undeveloped reserves of 144 MMBOE at December 31, 2014, decreased by 13 MMBOE from estimated proved undeveloped reserves of 157 MMBOE at December 31, 2013. During the year 2014, we invested $657 million and converted 25 MMBOE from proved undeveloped reserves to proved developed reserves. In addition, during the year 2014, we sold proved undeveloped reserves totaling 15 MMBOE associated with the Eagle Ford properties. Partly offsetting the decreases in proved undeveloped reserves during the year 2014, were additions of 16 MMBOE from the acquisition of interests in the Deepwater GOM (including interests in the Lucius and Heidelberg oil fields) and 9 MMBOE through extensions and discoveries primarily associated with continued successful development in the Deepwater GOM at Horn Mountain. We also had net upward revisions to proved undeveloped reserves totaling 2 MMBOE primarily related to the improved gas price realizations in the Haynesville shale play, which was mostly offset by downward revisions resulting from deferred development plans, as well as lower oil price realizations and higher steam-related operating expenses resulting from higher natural gas prices for certain onshore California properties.
During the year ended December 31, 2014 , we participated in 50 gross exploratory wells, of which 46 were successful, and 261 gross development wells, of which 259 were successful (refer to "Drilling Activities"). During this period, proved reserve additions from extensions and discoveries totaled 16 MMBOE.
The following table reflects the present value of estimated future net cash flows before income taxes from the production and sale of our estimated proved reserves reconciled to the standardized measure of discounted net cash flows (standardized measure) at December 31, 2014 (in millions):
Estimated undiscounted future net cash flows before income taxes |
| $ | 12,065 | |
Present value of estimated future net cash flows before income taxes (PV-10) a,b |
| $ | 8,142 | |
Discounted future income taxes |
| (1,721 | ) | |
Standardized measure (refer to Note 21) |
| $ | 6,421 | |
|
|
| ||
a. In accordance with SEC guidelines, estimates of future net cash flows from our proved reserves and the present value thereof are made using the twelve-month average of the first-day-of-the-month historical reference prices as adjusted for location and quality differentials. Reference prices as of December 31, 2014 , were $94.99 per barrel of oil and $4.35 per MMBtu of natural gas. These prices are held constant throughout the life of the oil and gas properties, except where such guidelines permit alternate treatment, including the use of fixed and determinable contractual price escalations. In accordance with the guidelines and excluding the impact of derivative instruments, the average realized prices used in our reserve reports as of December 31, 2014 , were $93.20 per barrel of oil and $4.35 per Mcf of natural gas. Our reference prices are the WTI spot price for crude oil and the Henry Hub spot price for natural gas.
b. The present value of estimated future net cash flows before income taxes (PV-10) is not considered a U.S. generally accepted accounting principle (GAAP) financial measure. We believe that our PV-10 presentation is an important measure and useful to our investors because it presents the discounted future net cash flows attributable to our proved reserves before taking into account the related future income taxes, as such taxes may differ among companies because of differences in the amounts and timing of deductible basis, net operating loss carryforwards and other factors. We believe investors use our PV-10 as a basis for comparison of the relative size and value of our proved reserves to the reserve estimates of other companies. PV-10 is not a measure of financial or operating performance under U.S. GAAP and is not intended to represent the current market value of our estimated oil and natural gas reserves. PV-10 should not be considered in isolation or as a substitute for the standardized measure of discounted future net cash flows as defined under U.S. GAAP.
Refer to Note 21 for further discussion of our proved reserves.
Probable Reserves. All of our estimated probable oil and natural gas reserves at December 31, 2014 , are based upon reserve reports prepared by the independent petroleum engineering firms of NSAI and Ryder Scott. Probable reserves are those additional reserves that are less certain to be recovered than proved reserves, but which, together with proved reserves, are as likely as not to be recovered. In addition to the uncertainties inherent in estimating quantities and values of proved reserves, probable reserves may be assigned to areas where data control or interpretations of available data are less certain even if the interpreted reservoir continuity of structure or productivity does not meet the reasonably certain criterion. Probable reserves may be assigned to areas that are structurally higher than the proved area if these areas are in communication with the proved reservoir. Probable reserve estimates also include potential incremental quantities associated with a greater percentage recovery of the
43
Table of Contents
hydrocarbons in place than assumed for proved reserves. Undeveloped reserves that meet the reasonably certain, economic and other requirements to be classified as proved undeveloped, except that they are not expected to be developed within five years, are classified as probable reserves. At December 31, 2014 , our estimated probable oil and natural gas reserves totaled 245 MMBOE, of which 81 percent was comprised of oil (including NGLs).
|
| Probable Oil and Natural Gas Reserves |
| |||||||
|
| Estimated at December 31, 2014 |
| |||||||
|
| Oil a |
| Natural Gas |
| Total |
| |||
|
| (MMBbls) |
| (Bcf) |
| (MMBOE) |
| |||
Probable Developed b : |
|
|
|
|
|
|
| |||
GOM |
| 27 | |
| 33 | |
| 32 | |
|
California |
| 8 | |
| - | |
| 8 | |
|
Haynesville/Madden/Other |
| - | |
| 6 | |
| 1 | |
|
|
| 35 | |
| 39 | |
| 41 | |
|
Probable Undeveloped: |
|
|
|
|
|
|
| |||
GOM |
| 81 | |
| 75 | |
| 93 | |
|
California |
| 83 | |
| 22 | |
| 87 | |
|
Haynesville/Madden/Other |
| - | |
| 142 | |
| 24 | |
|
|
| 164 | |
| 239 | |
| 204 | |
|
Total Probable Reserves |
| 199 | |
| 278 | |
| 245 | |
|
|
|
|
|
|
|
|
| |||
a. Includes 7 MMBbls of NGL probable reserves, consisting of 2 MMBbls of probable developed and 5 MMBbls of probable undeveloped.
b. Reflects reserves associated with incremental recovery from existing production/injection wells that require minimal to no future development costs and reserves associated with work performed on existing producers/injectors that do not meet the reasonable certainty requirements to be classified as proved reserves.
Internal Control and Qualifications of Third Party Engineers and Internal Staff. The technical personnel responsible for preparing the reserve estimates at NSAI and Ryder Scott meet the requirements regarding qualifications, independence, objectivity, and confidentiality set forth in the Standards Pertaining to the Estimating and Auditing of Oil and Gas Reserves Information promulgated by the Society of Petroleum Engineers. Both NSAI and Ryder Scott are independent firms of petroleum engineers, geologists, geophysicists, and petrophysicists; neither firm owns an interest in our properties nor are employed on a contingent fee basis. Our internal reservoir engineering staff are led and overseen by our Vice President of Engineering, who has over 38 years of technical experience in petroleum engineering and reservoir evaluation and analysis. This individual directs the activities of our internal reservoir staff for the internal reserve estimation process and also to provide the appropriate data to NSAI and Ryder Scott for our year-end oil and natural gas reserves estimation process.
Drilling Activities
The following table provides the total number of wells that we drilled during the year ended December 31, 2014 , and the seven month period ending December 31, 2013 :
|
|
| Year Ended |
| Seven Month Period Ending | ||||||||
|
|
| December 31, 2014 |
| December 31, 2013 | ||||||||
|
|
| Gross |
| Net |
| Gross |
| Net | ||||
Exploratory |
|
|
|
|
|
|
| ||||||
| Productive: |
|
|
|
|
|
|
| |||||
| Oil | 25 | |
| 21 | |
| 40 | |
| 35 | | |
| Gas | 21 | |
| 2 | |
| 25 | |
| 2 | | |
| Dry | 4 | |
| 3 | |
| 1 | |
| 1 | | |
|
|
| 50 | |
| 26 | |
| 66 | |
| 38 | |
Development |
|
|
|
|
|
|
| ||||||
| Productive: |
|
|
|
|
|
|
| |||||
| Oil | 184 | |
| 174 | |
| 71 | |
| 66 | | |
| Gas | 75 | |
| 10 | |
| 23 | |
| 8 | | |
| Dry | 2 | |
| - | |
| 1 | |
| 1 | | |
|
|
| 261 | |
| 184 | |
| 95 | |
| 75 | |
|
|
| 311 | |
| 210 | |
| 161 | |
| 113 | |
44
Table of Contents
In addition to the wells drilled during 2014, there were 43 gross exploratory and 38 gross development wells (11 net exploratory and 8 net development wells) in progress at December 31, 2014 , including 59 gross wells (7 net wells) in progress in the Haynesville Shale play.
In addition to the wells drilled during 2013, there were 36 gross exploratory and 60 gross development wells (23 net exploratory and 19 net development wells) in progress at December 31, 2013 , including 50 gross wells (5 net wells) in progress in the Haynesville shale play and 36 gross wells (31 net wells) in progress in the Eagle Ford shale play.
Productive Wells
At December 31, 2014 , we had working interests in 3,069 gross (2,991 net) active producing wells and 1,710 gross (211 net) active producing natural gas wells. At December 31, 2013 , we had working interests in 3,310 gross (3,153 net) active producing oil wells and 1,651 gross (238 net) active producing natural gas wells. One or more completions in the same well bore are considered one well. If any well in which one of the multiple completions is an oil completion, such well is classified as an oil well. At December 31, 2014 and 2013, we owned interests in five gross wells containing multiple completions.
Item 1A. Risk Factors.
This report contains "forward-looking statements" within the meaning of United States (U.S.) federal securities laws. Forward-looking statements are all statements other than statements of historical facts, such as projections or expectations relating to ore grades and milling rates; production and sales volumes; unit net cash costs; cash production costs per barrel of oil equivalent (BOE); operating cash flows; capital expenditures; exploration efforts and results; development and production activities and costs; liquidity; tax rates; the impact of copper, gold, molybdenum, cobalt crude oil and natural gas price changes; the impact of derivative positions; the impact of deferred intercompany profits on earnings; reserve estimates; future dividend payments; debt reduction; and share purchases.
We undertake no obligation to update any forward-looking statements. We caution readers that forward-looking statements are not guarantees of future performance and our actual results may differ materially from those anticipated, projected or assumed in the forward-looking statements. Important factors that can cause our actual results to differ materially from those anticipated in the forward-looking statements include the following:
Financial risks
Declines in the market prices of copper, gold and/or oil could adversely affect our earnings, cash flows and asset values and, if sustained, could adversely affect our ability to repay debt. Fluctuations in the market prices of copper, gold or oil can cause significant volatility in our financial performance and adversely affect the trading prices of our debt and common stock.
Our financial results vary with fluctuations in the market prices of the commodities we produce, primarily copper, gold and oil, and to a lesser extent molybdenum, silver, cobalt and natural gas. For further information about the market prices of our primary commodities, including the declines in copper and oil prices since mid-2014, refer to the discussion below and in Management's Discussion and Analysis of Financial Condition and Results of Operations (MD&A). A substantial or extended decline in the market prices of these commodities could have a material adverse effect on our financial results, the value of our assets and/or our ability to repay our debt and meet our other fixed obligations, and could depress the trading prices of our common stock and of our publicly traded debt securities.
Additionally, if the market prices for the commodities we produce decline for a sustained period of time, we may have to revise our operating plans, including curtailing production, halting or delaying expansion projects, reducing operating costs and capital expenditures and discontinuing certain exploration and development programs. We may be unable to decrease our costs in an amount sufficient to offset reductions in revenues, and may incur losses.
Fluctuations in commodities prices can occur because of varied and complex factors beyond our control, including global supply and demand balances and inventory levels of the commodities we sell; global economic and political conditions; government regulatory, trade and tax policies; commodities investment activity and speculation; the price and availability of substitute products; and changes in technology.
45
Table of Contents
In particular, copper prices may be affected by demand from China, which has become the largest consumer of refined copper in the world, and by changes in demand for industrial, commercial and residential products containing copper. Factors particularly affecting gold prices may include the relative strength of the U.S. dollar to other currencies, inflation and interest rate expectations, purchases and sales of gold by governments and central banks, demand from China and India, two of the world ' s largest consumers of gold, and demand for jewelry containing gold. Crude oil prices may be affected by continued development of shale reserves through hydraulic fracturing, actions of the Organization of the Petroleum Exporting Countries and other major oil producing nations, political and weather conditions in oil producing regions, transportation and refinery capacity, the amount of foreign imports of oil into the U.S., and potential changes in U.S. laws restricting oil exports.
Since the second half of 2014, oil prices have declined significantly. After averaging $109 per barrel in the first half of 2014, Brent crude oil prices averaged $90 per barrel for the second half of 2014 and declined to $57.33 per barrel on December 31, 2014, and were $60.22 per barrel on February 20, 2015 . Lower oil prices, and to a lesser extent natural gas prices, were a contributing factor to the $5.5 billion of non-cash impairment charges recorded for the year ended December 31, 2014, to write-down the carrying value of our oil and gas properties and reduce the goodwill associated with our oil and gas operations to zero. Refer to Notes 1 and 2 and MD&A for further discussion of these impairment charges. Sustained weaker oil and natural gas prices could result in additional impairments of our oil and gas properties.
Copper prices have also declined. During 2014, the London Metal Exchange (LME) spot copper prices ranged from a low of $2.86 per pound to a high of $3.38 per pound and averaged $3.11 per pound. The LME spot copper price closed at $2.88 per pound on December 31, 2014, and has declined to $2.59 per pound on February 20, 2015. Sustained lower copper prices could result in impairment of our long-lived mining assets and/or lower of cost or market inventory adjustments.
Refer to Note 1 and MD&A for further discussion of our accounting policies and estimates used in evaluating impairment of our long-lived assets and our oil and gas properties.
Our debt and other financial commitments may limit our financial and operating flexibility.
At December 31, 2014 , our total consolidated debt was $ 19.0 billion (see Note 8) and our total consolidated cash was $464 million . We also have various other financial commitments, including for reclamation and environmental obligations, take-or-pay contracts and leases. Our level of indebtedness and other financial commitments could have important consequences to our business, including the following:
• | Limiting our flexibility in planning for, or reacting to, changes in the industries in which we operate; |
• | Increasing our vulnerability to general adverse economic and industry conditions; |
• | Limiting our ability to fund future working capital and capital expenditures, to engage in future development activities, or to otherwise realize the value of our assets and opportunities fully because of the need to dedicate a substantial portion of our cash flows from operations to payments on our debt; or |
• | Placing us at a competitive disadvantage compared to our competitors that have less debt and/or fewer financial commitments. |
In addition, a future downgrade in our credit rating could negatively affect our cost of and ability to access capital. At February 20, 2015, our senior unsecured debt was rated "BBB-" with a stable outlook by Standard and Poor's, "BBB" with a stable outlook by Fitch Ratings, and "Baa3" with a stable outlook by Moody's Investors Service. We cannot be assured that our credit ratings will not be downgraded in the future. In addition, a downgrade could affect our requirements to provide significant financial assurance of our performance under certain legal requirements and contractual arrangements. Refer to the following risk factor for more information.
46
Table of Contents
Mine closure and reclamation regulations impose substantial costs on our operations, and include requirements that we provide financial assurance supporting those obligations. We also have plugging and abandonment obligations related to our oil and gas operations, and are required to provide bonds or other forms of financial assurance in connection with those operations. Changes in or the failure to comply with these requirements could have a material adverse effect on us.
We are required by U.S. federal and state mining laws to provide financial assurance sufficient to allow a third party to implement approved closure and reclamation plans if we are unable to do so. The U.S. Environmental Protection Agency (EPA) and state agencies may also seek financial assurance for investigation and remediation actions that are required under settlements of enforcement actions under the Comprehensive Environmental Response, Compensation and Liability Act (CERCLA) or equivalent state regulations.
With respect to our mining operations, most of our financial assurance obligations are imposed by state laws that vary significantly by jurisdiction. Currently there are no financial assurance requirements for active mining operations under CERCLA, but in 2009, the EPA published a notice identifying classes of facilities within the hardrock mining industry for which the agency will develop financial responsibility requirements under CERCLA. The EPA has indicated that it intends to propose regulations regarding hardrock mining financial responsibility in August 2016. The EPA's schedule has been challenged by environmental groups, which are petitioning the court to require the EPA to finalize such regulations by January 2016. It is uncertain how the new requirements, if promulgated, will affect the amount and form of our existing and future financial assurance obligations.
We are also subject to financial assurance requirements in connection with our oil and gas operations under both state and federal laws. For example, permits, bonding and insurance are required to drill, operate, and plug and abandon wells. Also, the Bureau of Ocean Energy Management (BOEM) and the Bureau of Safety and Environmental Enforcement (BSEE) regulations applicable to lessees in federal waters require that lessees have substantial U.S. assets and net worth or post bonds or other acceptable financial assurance that the regulatory obligations will be met. Financial responsibility requirements are also required under the Oil Pollution Act of 1990 to cover containment and cleanup costs resulting from an oil spill.
BOEM has signaled its intention to redesign and implement revised financial assurance requirements associated with offshore plugging and abandonment obligations. BOEM has recently taken a stricter approach regarding the level of decommissioning liabilities to be included in its financial test for purposes of determining eligibility for exemption from financial assurance requirements. It is uncertain whether additional changes will be implemented by the BOEM and how these changes might affect the form and amount of our existing and future financial assurance obligations associated with our offshore activities in federal waters.
As of December 31, 2014 , our financial assurance obligations associated with closure, reclamation and remediation in our mining and plugging and abandonment obligations in our oil and gas operations totaled approximately $2.6 billion, and a substantial portion of these obligations were satisfied by FCX and FM O&G guarantees and financial capability demonstrations. If our financial condition were to deteriorate substantially or our credit rating were downgraded, we may be required to provide additional or alternative forms of financial assurance, such as letters of credit, surety bonds or collateral. These other forms of assurance would be costly to provide and, depending on our financial condition and market conditions, may be difficult or impossible to obtain. Failure to provide the required financial assurance could result in the closure of mines or suspension of the affected oil and gas operations.
Refer to Notes 1 and 12 , for further discussion of our environmental and asset retirement obligations.
International risks
Our international operations are subject to political, social and geographic risks of doing business in countries outside the U.S.
We are a U.S.-based natural resource company with substantial mining assets located outside of the U.S. We conduct international mining operations in Indonesia, Peru, Chile and the Democratic Republic of Congo (DRC). Our oil and gas operations are located in the U.S., except that we expect to commence drilling at our first international oil and gas prospect offshore Morocco in the first half of 2015. Accordingly, in addition to the usual risks associated with conducting business in countries outside the U.S., our business may be adversely affected by political, economic and social uncertainties in each of these countries. Risks of conducting business in countries outside of the U.S. include:
47
Table of Contents
• | Renegotiation, cancellation or forced modification of existing contracts; |
• | Expropriation or nationalization of property; |
• | Changes in another country's laws, regulations and policies, including those relating to labor, taxation, royalties, divestment, imports, exports, trade regulations, currency and environmental matters, which because of rising "resource nationalism" in countries around the world, may impose increasingly onerous requirements on foreign operations and investment; |
• | Political instability, bribery, extortion, corruption, civil strife, acts of war, guerrilla activities, insurrection and terrorism; |
• | Changes in the aspirations and expectations of local communities in which we operate with respect to our contributions to employee health and safety, infrastructure and community development and other factors that may affect our social license to operate, all of which lead to increased costs; |
• | Foreign exchange controls and movements in foreign currency exchange rates; and |
• | The risk of having to submit to the jurisdiction of an international court or arbitration panel or having to enforce the judgment of an international court or arbitration panel against a sovereign nation within its own territory. |
Our insurance does not cover most losses caused by the above described risks. Accordingly, our exploration, development and production activities outside of the U.S. may be substantially affected by many unpredictable factors beyond our control, some of which could materially and adversely affect our results of operations and financial condition.
Our international operations must comply with the U.S. Foreign Corrupt Practices Act and similar anti-corruption and anti-bribery laws of the other jurisdictions in which we operate. There has been a substantial increase in the global enforcement of these laws. Any violation of these laws could result in significant criminal or civil fines and penalties, litigation, and loss of operating licenses or permits, and may damage our reputation, which could have a material adverse effect on our business, results of operations and financial condition.
We are involved in several significant tax proceedings and other tax disputes with the Indonesian and Peruvian tax authorities (refer to Note 12 for further discussion of these matters). Other risks specific to certain countries in which we operate are discussed in more detail below.
Because our Grasberg minerals district is our most significant operating asset, our business may continue to be adversely affected by political, economic and social uncertainties and security risks in Indonesia.
Our mining operations in Indonesia are conducted by our subsidiary PT Freeport Indonesia (PT-FI) pursuant to a Contract of Work (COW) with the Indonesian government. Maintaining a good working relationship with the Indonesian government is important to us because of the significance of our Indonesia operations to our business, and because our mining operations there are among Indonesia's most significant business enterprises. Partially because of their significance to Indonesia's economy, the environmentally sensitive area in which they are located, and the number of people employed, our Indonesia operations have been the subject of political debates and of criticism in the Indonesian press, and have been the target of protests and occasional violence.
In 2009, Indonesia enacted a mining law (2009 Mining Law), which operates under a licensing system that is less protective of licensees than the contract of work system that governs PT-FI. The 2009 Mining Law and the regulations issued pursuant to that law provide that contracts of work would continue to be honored until their expiration. However, the regulations, including those issued in January 2014, attempt to apply certain provisions of the 2009 Mining Law and regulations to existing contracts of work and seek to apply the licensing system to any extension periods of contracts of work.
In January 2012, the President of Indonesia issued a decree calling for the creation of a team of Ministers to evaluate contracts of work for adjustment to the 2009 Mining Law and to take steps to assess and determine the Indonesian government's position on reduction to the size of contract concessions, increasing government revenues and domestic processing of minerals.
48
Table of Contents
PT-FI has been engaged in discussions with officials of the Indonesian government since 2012 regarding various provisions of its COW. The Indonesian government has sought to modify existing mining contracts, including PT-FI's COW, to address provisions of the 2009 Mining Law and subsequent regulations, including with respect to the size of contract concessions, government revenues, domestic processing of minerals, divestment, provision of local services, conversion from a COW to a licensing framework for extension periods, and a requirement that extensions may be applied for only within two years prior to a COW's expiration.
In January 2014, the Indonesian government published regulations providing that holders of contracts of work with existing processing facilities in Indonesia may continue to export product through January 12, 2017, but established new requirements for the continued export of copper concentrates, including the imposition of a progressive export duty on copper concentrates. Despite PT-FI's rights under its COW to export concentrates without the payment of duties, PT-FI was unable to obtain administrative approval for exports and operated at approximately half of its capacity from mid-January 2014 through July 2014.
On July 25, 2014, PT-FI and the Indonesian government entered into a Memorandum of Understanding (MOU) under which PT-FI and the government agreed to negotiate an amended COW to address provisions related to the size of PT-FI's concession area, royalties and taxes, domestic processing and refining, divestment, local content, and continuation of operations post-2021. Execution of the MOU enabled the resumption of concentrate exports, which began in August 2014. The MOU has been extended to July 25, 2015. PT-FI is engaged in active discussions with the Indonesian government regarding an amended COW.
Provisions being addressed in the negotiation of an amended COW include the development of new copper smelting and refining capacity in Indonesia, divestment to the Indonesian government and/or Indonesian nationals of up to a 30 percent interest (an additional 20.64 percent interest) in PT-FI at fair value, and timely granting rights for the continuation of operations from 2022 through 2041. Negotiations are taking into consideration PT-FI's need for assurance of legal and fiscal terms post-2021 for PT-FI to continue with its large-scale investment program for the development of its underground reserves.
Effective with the signing of the MOU, PT-FI provided a $115 million assurance bond to support its commitment for smelter development, agreed to increase royalties to 4.0 percent for copper and 3.75 percent for gold from the previous rates of 3.5 percent for copper and 1.0 percent for gold, and pay export duties as set forth in a new regulation. The Indonesian government revised its January 2014 regulations regarding export duties, which are now set at 7.5 percent , declining to 5.0 percent when smelter development progress exceeds 7.5 percent and are eliminated when development progress exceeds 30 percent .
PT-FI is advancing plans for the construction of new smelter capacity in parallel with completing of negotiations of its long-term operating rights and will also discuss the possibility of expanding industrial activities in Papua in connection with its long-term development plans. PT-FI has identified a site adjacent to the existing PT Smelting site in Gresik, Indonesia, for the construction of additional smelter capacity.
Under the MOU, no terms of the COW other than those relating to the export duties, smelter bond and royalties described above will be changed until the completion of an amended COW.
The revisions to the COW are expected to result in additional costs for our Indonesian operations. We cannot predict whether we will be successful in reaching a satisfactory agreement on the terms of our long-term mining rights. If we are unable to reach agreement with the government on our long-term rights, we may be required to reduce or defer investments in our underground development projects, which would negatively impact future production and reserves. In addition, we are required to apply for renewal of export permits at six-month intervals and the next renewal date is July 25, 2015. We cannot predict if such permits will be granted on a timely basis or whether we will be permitted to export concentrates after July 25, 2015.
In January 2015, the Indonesian government issued regulations that require letters of credit to be posted to secure export sales of goods, which may impact PT-FI and PT Smelting. Such regulations are contrary to our COW, but it is possible that the Indonesian government may seek to impose such requirements on PT-FI. These requirements could result in additional costs as well as administrative complexities, which could impact the ability to obtain customs clearance to export concentrates in a timely manner.
Indonesia has also faced separatist movements and civil and religious strife in a number of provinces. Several separatist groups have sought increased political independence for the province of Papua, where our Grasberg minerals district is located. In Papua, there have been sporadic attacks on civilians by separatists and sporadic but
49
Table of Contents
highly publicized conflicts between separatists and the Indonesian military. In addition, illegal miners have periodically clashed with police who have attempted for years to move them away from our facilities. Social, economic and political instability in Papua could materially and adversely affect us if it results in damage to our property or interruption of our Indonesia operations.
Since July 2009, there have been violent incidents in and around the Grasberg minerals district, including along the road leading to our mining and milling operations, which have resulted in 20 fatalities and 59 injuries. The safety of our workforce is a critical concern, and PT-FI continues to work with the Indonesian government to address security issues. The investigation of these incidents is ongoing. We also continue to limit the use of the road leading to our mining and milling operations to secured convoys.
We cannot predict whether additional incidents will occur that could disrupt or suspend our Indonesian operations. If other disruptive incidents occur, they could adversely affect our results of operations and financial condition in ways that we cannot predict at this time. For further discussion of labor disruptions at PT-FI, refer to the operational risk factor "Labor unrest and activism could disrupt our operations and may adversely affect our business, financial condition, results of operations and prospects."
We will not mine all of our ore reserves in Indonesia before the initial term of our COW expires.
The initial term of PT-FI's COW expires in 2021, but can be extended for two 10-year periods subject to Indonesian government approval, which pursuant to the COW cannot be withheld or delayed unreasonably. Our proven and probable ore reserves in Indonesia reflect estimates of minerals that can be recovered through the end of 2041, and our current mine plan and planned operations are based on the assumption that we will receive the two 10-year extensions. As a result, we will not mine all of these ore reserves during the initial term of the current COW. Prior to the end of 2021, we expect to mine 23 percent of aggregate proven and probable recoverable ore at December 31, 2014 , representing 30 percent of PT-FI's share of recoverable copper reserves and 40 percent of its share of recoverable gold reserves. There can be no assurance that the Indonesian government will approve our COW extensions. For further discussion, refer to the above risk factor "Because our Grasberg minerals district is our most significant operating asset, our business may continue to be adversely affected by political, economic and social uncertainties and security risks in Indonesia."
PT-FI's COW may be subject to termination if we do not comply with our contractual obligations, and if a dispute arises, we may have to submit to the jurisdiction of an international arbitration panel.
PT-FI's COW was entered into under Indonesia's 1967 Foreign Capital Investment Law, which provides guarantees of remittance rights and protection against nationalization. The COW may be subject to termination by the Indonesian government if we do not satisfy our contractual obligations, which include the payment of royalties and taxes to the government and the satisfaction of certain mining, environmental, safety and health requirements.
Certain Indonesian laws and regulations may conflict with the mining rights established under the COW. Although the COW grants to PT-FI the unencumbered right to operate in accordance with the COW, government agencies may seek to impose additional restrictions on PT-FI that could affect exploration and operating requirements. For further discussion, refer to the above risk factor "Because our Grasberg minerals district is our most significant operating asset, our business may continue to be adversely affected by political, economic and social uncertainties and security risks in Indonesia."
At times, certain government officials and others in Indonesia have questioned the validity of contracts entered into by the Indonesian government prior to May 1998 ( i.e., during the Suharto regime, which lasted over 30 years), including PT-FI's COW, which was signed in December 1991. We cannot provide assurance that the validity of, or our compliance with, the COW will not be challenged for political or other reasons.
PT-FI's COW requires that disputes with the Indonesian government be submitted to international arbitration. Accordingly, if a dispute arises under the COW, we face the risk of having to submit to the jurisdiction of an international arbitration panel, and if we prevail in such a dispute, we will face the additional risk of having to enforce the judgment of an international arbitration panel against Indonesia within its own territory. Additionally, our operations may be adversely affected while resolution of a dispute is pending.
50
Table of Contents
The Tenke Fungurume (Tenke) minerals district is located in the Katanga province of the DRC, and may be adversely affected by security risks and political, economic and social instability in the DRC.
Since gaining independence in 1960, the DRC has undergone outbreaks of violence, changes in national leadership and financial crises. The DRC held its first democratic elections in 2006. President Joseph Kabila, elected in 2006 and currently serving his second term, is not eligible under the DRC constitution for reelection. The next presidential election is scheduled to be held in 2016. These factors heighten the risk of abrupt changes in the national policy toward foreign investors, which in turn could result in unilateral modification of concessions or contracts, increased taxation, denial of permits or permit renewals or expropriation of assets. As part of a review of all mining contracts by the Ministry of Mines (the Ministry) in the DRC, in February 2008, we received notification that the Ministry wished to renegotiate several material provisions of Tenke Fungurume Mining S.A.'s (TFM) mining contracts. In October 2010, the DRC government concluded its review of TFM's existing mining contracts and confirmed that they are in good standing. In connection with the review, several amendments were made to TFM ' s mining contracts and governing documents, and in March 2012, FCX's effective ownership in TFM was reduced from 57.75 percent to 56 percent.
Political, economic, social and security risks in the DRC are generally outside of our control and could adversely affect our business. These risks include legal and regulatory uncertainties; exposure to an environment of governmental corruption and bribery; attempts to increase taxes or claims for fees and penalties by governmental officials, including retroactive claims; administrative disputes; security risks resulting from political instability in the DRC; and risk of loss because of civil strife, acts of war, guerrilla activities, insurrection and terrorism.
In addition to ongoing conflict in the eastern region of the DRC, there have been acts of violence in the Katanga province where the Tenke minerals district is located. The safety of our workforce at all of our operations is our highest priority, and TFM works cooperatively with government officials to address security issues; however, no assurance can be given that conflict or random acts of violence will not occur near or impact Tenke's operations.
Accordingly, our Tenke operations and future development activities at the Tenke minerals district may be substantially affected by factors beyond our control, any of which could interrupt TFM ' s operations or future development activities and have a material adverse effect on our results of operations and financial condition.
Operational risks
Our mining and oil and gas operations are subject to operational risks that could adversely affect our business.
Mines by their nature are subject to many operational risks, some of which are outside of our control, and many of which are not covered fully, or in some cases even partially, by insurance. These operational risks, which could adversely affect our business, operating results and cash flow, include earthquakes, floods, and other natural disasters; equipment failures; accidents; wall failures and rock slides in our open-pit mines, and structural collapses in our underground mines; and lower than expected ore grades or recovery rates.
Managing the volume of waste rock, leach material and tailings produced in our mining operations also presents significant environmental, safety and engineering challenges and risks. We maintain large leach pads and tailings impoundments containing viscous material, which are effectively large dams that must be engineered, constructed and monitored to assure structural stability and avoid leakages or structural collapse; our tailings impoundments in arid areas must have effective programs to suppress fugitive dust emissions, and we must effectively monitor and treat acid rock drainage. In Indonesia, we use a river transport system for tailings management, which presents other risks, as discussed elsewhere in these risk factors. The failure of the systems or structures used to successfully manage these risks could result in significant personal injury, loss of life, property damage and damage to the environment, both in and around our areas of operations, as well as damage to production facilities and delays in or curtailments of production.
Our oil and gas operations are also subject to operating hazards, including well blowouts, cratering, explosions, fires, uncontrollable flows of oil, gas or well fluids and pipeline ruptures, as well as natural disasters such as earthquakes, mudslides and hurricanes. Our operations in California, including transportation of oil by pipelines within the city and county of Los Angeles, are especially susceptible to damage from earthquakes and involve increased risks of personal injury, property damage and marketing interruptions because of the population density
51
Table of Contents
of southern California. Our operations in the Gulf of Mexico (GOM) and Gulf Coast region are particularly susceptible to interruption and damage from hurricanes. Any of these operating hazards could cause personal injuries, fatalities, oil spills, discharge of hazardous substances into the air, soil, water and groundwater and other property or environmental damage, lost production and revenue, remediation and clean-up costs and liability for damages, all of which could adversely affect our financial condition and results of operations and may not be fully covered by our insurance.
Labor unrest and activism could disrupt our operations and may adversely affect our business, financial condition, results of operations and prospects.
As of December 31, 2014, 48 percent of our global labor force was covered by collective bargaining agreements and 28 percent of our global labor force was covered by agreements that will expire during 2015, including the agreement covering employees at our Indonesia operations. None of the employees of our oil and gas operations are represented by a union or covered by a collective labor agreement. Labor agreements are negotiated on a periodic basis, and may not be renewed on reasonably satisfactory terms to us or at all. If we do not successfully negotiate new collective bargaining agreements with our union workers, we may incur prolonged strikes and other work stoppages at our mining operations, which could adversely affect our financial condition and results of operations. Additionally, if we enter into a new labor agreement with any union that significantly increases our labor costs relative to our competitors, our ability to compete may be materially and adversely affected. Refer to Items 1 and 2, "Business and Properties," for additional information regarding labor matters, and expiration dates of such agreements.
We could also experience labor disruptions such as work stoppages, work slowdowns, union organizing campaigns, strikes, or lockouts which could adversely affect our operations. For example, our PT-FI operations experienced an eight-day work stoppage in July 2011 and an approximate three-month strike that concluded in December 2011. The strike involved civil unrest, transportation blockades, sabotage of important operating facilities and violence. Operations were also temporarily suspended during first-quarter 2012 when PT-FI experienced work interruptions in connection with its efforts to resume normal operations following the strike. In October 2014, a large percentage of Grasberg open-pit operators did not report to their scheduled shifts, notwithstanding approval of resumption of operations by Indonesian authorities upon completion of their investigation of a fatal haul truck accident that occurred near the Grasberg open-pit. Significant reductions in productivity or protracted work stoppages at one or more of our operations could significantly reduce our production and sales volumes, which could adversely affect our business, financial condition and results of operations.
Our mining production depends on the availability of sufficient water supplies.
Our mining operations require significant quantities of water for mining, ore processing and related support facilities. Most of our mining operations in North and South America are in areas where water is scarce and competition among users for continuing access to water is significant. Continuous production at our mines is dependent on our ability to maintain our water rights and claims, and the continuing physical availability of the water supplies. At our North America mining operations, certain of our water supplies are supported by surface water rights, which allow us to use public waters for a statutorily defined beneficial use at a designated location.
In Arizona, where our operations use both surface and ground water, we are a participant in two active general stream adjudications in which the Arizona courts have been attempting, for over 40 years, to quantify and prioritize surface water claims for two of the state's largest river systems, which affect four of our operating mines (Morenci, Safford, Sierrita and Miami). The legal precedent set in these proceedings may also affect our Bagdad mine. The adjudications are addressing the state law claims of thousands of competing users, including us, as well as very significant federally based water claims of U.S. interests in Arizona that are potentially adverse to the claims of surface water and groundwater users under state law. Groundwater is treated differently from surface water under Arizona law, which historically allowed land owners to pump at will, subject to the doctrine of reasonable use. However, court decisions in one of the adjudications have concluded that groundwater pumping may affect surface water, thereby effectively making it surface water and bringing the pumping within the jurisdiction of the general stream adjudications. The effort to define the boundaries between groundwater and surface water remains contested and is currently a primary focus of one of those adjudications. Because groundwater accounts for approximately 40 percent of Arizona ' s water supplies, the re-characterization of any significant portion of that water as surface water could jeopardize the ability of consumers, farmers, ranchers, municipalities, and industrial users like us, to continue to access water supplies that have been relied on for decades. Because we are a significant user of both groundwater and surface water in Arizona, we are an active participant in the adjudication proceedings.
52
Table of Contents
In Colorado, our surface water and groundwater rights are subject to adjudication and we are involved in legal proceedings to resolve disputes regarding priority and administration of rights, including priority of some of our rights for the Climax molybdenum mine. In New Mexico, our surface water and groundwater rights are fully licensed or have been fully adjudicated.
Water for our Cerro Verde operation in Peru comes from renewable sources through a series of storage reservoirs on the Rio Chili watershed that collect water primarily from seasonal precipitation. Due to occasional drought conditions and the possibility that climate change will reduce precipitation levels, temporary supply shortages are possible that could affect our current and planned Cerro Verde operations. Cerro Verde has completed studies to assess opportunities for additional water supplies to support current operations and potential future expansion projects. Cerro Verde has reached agreements with the Regional Government of Arequipa, the National Government, the local water utility Servicio de Agua Potable y Alcantarillado de Arequipa S.A. (SEDAPAR), and other local institutions to allow it to finance, engineer and construct a wastewater treatment plant for the city of Arequipa. Cerro Verde has obtained authorization to reuse an annual average of one cubic meter per second of the treated water, which is expected to supplement existing water supplies to support the concentrator expansion.
Water for our El Abra mining operation in Chile comes from the continued pumping of groundwater from the Salar de Ascotán aquifer. In 2010, El Abra obtained regulatory approval, subject to certain conditions, for the continued pumping of groundwater from the Salar de Ascotán aquifer for its sulfide processing plant, which began operations in 2011. El Abra has sufficient water rights and regulatory approvals to support current operations; however, a change to the sulfide ore project, such as increased production or mill processing, would require additional water beyond our allowable groundwater pumping, which is permitted through 2021. El Abra is conducting studies to assess the feasibility of constructing a desalination plant near the Pacific Ocean to treat seawater for possible increased sulfide ore production or mill processing.
Although each of our mining operations currently has access to sufficient water supplies to support current operational demands, some supplies are subject to unresolved claims by others, and additional supplies that may be needed to support expanded operations are expensive, in short supply, and can be difficult to access because of logistical and legal obstacles. Moreover, we cannot predict the potential outcome of pending or future legal proceedings on our water rights, claims and uses. Loss of a water right, loss of continued use of a currently available water supply, or inability to expand our water resources could materially and adversely affect our mining operations, by significantly increasing the cost of water, forcing us to curtail operations, preventing us from expanding operations or forcing premature closures, thereby increasing and/or accelerating costs or foregoing profitable operations.
In addition to the usual risks encountered in the mining industry, our Indonesia and Africa mining operations involve additional risks because they are located in very remote areas and, in Indonesia, unusually difficult terrain.
The Grasberg minerals district is located in steep mountainous terrain in a remote area of Indonesia. These conditions have required us to overcome special engineering difficulties and develop extensive infrastructure facilities. In addition, the area receives considerable rainfall, which has led to periodic floods and mudslides. The mine site is also in an active seismic area and has experienced earth tremors from time to time. Our insurance may not sufficiently cover an unexpected natural or operating disaster.
Underground mining operations can be particularly dangerous, and in May 2013, a tragic accident, which resulted in 28 fatalities and 10 injuries, occurred at PT-FI when the rock structure above the underground ceiling of a training facility collapsed. PT-FI temporarily suspended mining and processing activities at the Grasberg complex to conduct inspections and resumed open-pit mining and concentrating activities on June 24, 2013, and underground operations on July 9, 2013. In April 2011, two PT-FI employees died in an accident when a portion of the DOZ underground mine experienced an uncontrolled muck flow. No assurance can be given that similar events will not occur in the future.
The Tenke minerals district is located in a remote area of the DRC and is subject to challenges, such as severely limited infrastructure, including road, bridge and rail access that is in disrepair and receives minimal maintenance; limited and unreliable energy supply from antiquated equipment and from power distribution corridors that are not maintained; difficulties in attracting and retaining experienced personnel; security risks; and limited health care in an area plagued by disease and other potential endemic health issues, including malaria, cholera and HIV.
53
Table of Contents
Additionally, because of limited rail access, we currently truck a significant portion of the production from the Tenke mines approximately 1,900 miles to ports in South Africa. The Tenke minerals district and its future development may be substantially affected by factors beyond our control, which could adversely affect their contribution to our operating results and increase the cost of future development.
We must continually replace reserves depleted by production, but our exploration activities may not result in additional discoveries.
Our existing mineral and oil and natural gas reserves will be depleted over time by production from our operations. Because our profits are derived from our mining and oil and gas operations, our ability to replenish our reserves is essential to our long-term success. Our exploration projects involve many risks, require substantial expenditures and may not result in the discovery of additional deposits or reservoirs that can be produced profitably. We may not be able to discover, enhance, develop or acquire reserves in sufficient quantities to maintain or grow our current reserve levels, which could negatively affect our business and prospects.
Development projects are inherently risky and may require more capital than anticipated, which could adversely affect our business.
There are many risks and uncertainties inherent in all development projects (refer to MD&A for further discussion of our current development projects). The economic feasibility of development projects is based on many factors, including the accuracy of estimated reserves, estimated capital and operating costs, and estimated future prices of the relevant commodity. The capital expenditures and time required to develop new mines, wells, or other projects are considerable, and changes in costs or construction or drilling schedules can adversely affect project economics.
New development projects have no operating history upon which to base estimates of future cash flow. The actual costs, production rates and economic returns of our development projects may differ materially from our estimates, which may have a material adverse impact on our business and results of operations.
Operations in the Deepwater GOM present greater operating risks than operations in the shallower waters or onshore. In addition, our shallow water and onshore operations that target ultra-deep prospects involve greater risks and costs than conventional GOM Shelf and onshore Gulf Coast prospects.
The Deepwater GOM presents significant challenges because of risks associated with geological complexity, water depth and higher drilling and development costs. For example, in April 2010, the Deepwater Horizon, an unaffiliated offshore drilling rig located in the Deepwater GOM, sank following an explosion and fire, resulting in fatalities and the discharge of substantial amounts of oil into the GOM until mid-July 2010 when the flow of oil was finally stopped. The U.S. Department of Interior imposed a moratorium on deepwater drilling from May through October 2010 and also issued a series of rules and notices to lessees and operators imposing new and more stringent regulatory safety and performance requirements and permitting procedures for new wells to be drilled in the Deepwater GOM, all of which significantly and adversely disrupted oil and gas exploration activities in the GOM and resulted in increased costs.
The Deepwater GOM also lacks the infrastructure present in shallower waters, which can result in significant delays in obtaining or maintaining production. As a result, deepwater operations may require significant time between a discovery and marketability, thereby increasing the financial risk of these operations.
Our Inboard Lower Tertiary/Cretaceous exploration prospects target formations below the salt weld on the GOM Shelf and onshore in South Louisiana. These targets have not traditionally been the subject of exploratory activity in these regions, so that little direct comparative data is available. On February 25, 2015, the Highlander discovery, located onshore in South Louisiana in the Inboard Lower Tertiary/Cretaceous trend, began production. Prior to this date there had been no commercial production of hydrocarbons from Inboard Lower Tertiary/Cretaceous reservoirs in these areas. The lack of comparative data and the limitations of diagnostic tools operating in the extreme temperatures and pressures encountered at these depths make it difficult to predict reservoir quality and well performance of these formations. It is also significantly more risky and expensive to drill and complete wells in these formations than at more conventional depths. Major contributors to such increased risks and costs include far higher temperatures and pressures encountered down hole, longer drilling times, extended procurement time and increased costs associated with the specialized equipment required to drill and complete wells in these formations.
54
Table of Contents
Our operations are subject to extensive regulations, some of which require permits and other approvals. These regulations increase our costs and in some circumstances may delay or suspend our operations.
Our operations are subject to extensive and complex laws and regulations that are subject to change and to changing interpretation by governmental agencies and other bodies vested with broad supervisory authority. As a natural resource company, compliance with environmental legal requirements is an integral and costly part of our business. For additional information, see "Environmental risks." We are also subject to extensive regulation of worker health and safety, including the requirements of the U.S. Occupational Safety and Health Act and similar laws of other jurisdictions. In the U.S., the operation of our mines is subject to regulation by the U.S. Mine Safety and Health Administration (MSHA) under the Federal Mine Safety and Health Act of 1977. MSHA inspects our mines on a regular basis and issues citations and orders when it believes a violation has occurred. If such inspections result in an alleged violation, we may be subject to fines and penalties and, in instances of alleged significant violations, our mining operations could be subject to temporary or extended closures.
Our oil and gas operations are subject to extensive laws and regulations that require, among other things, permits for the drilling and operation of wells and bonding and insurance to drill, operate and plug and abandon wells, and that regulate the safety of our pipelines. Our U.S. offshore operations in federal waters are subject to broad regulation by the BOEM/BSEE, which among other things must issue permits in connection with our exploration, drilling, development and production plans. Under certain circumstances BOEM/BSEE may impose penalties and may suspend or terminate any of our operations on federal leases. Many other governmental bodies regulate our operations, and our failure to comply with these legal requirements can result in substantial penalties. In addition, new laws and regulations or changes to existing laws and regulations and new interpretations of existing laws and regulations by courts or regulatory authorities occur regularly, but are difficult to predict. Any such variations could have a material adverse effect on our business and prospects.
Our business may be adversely affected by information technology disruptions.
Cybersecurity incidents are increasing in frequency, evolving in nature and include, but are not limited to, installation of malicious software, unauthorized access to data and other electronic security breaches that could lead to disruptions in systems, unauthorized release of confidential or otherwise protected information and the corruption of data. We have experienced cybersecurity incidents in the past and may experience them in the future. We believe we have implemented appropriate measures to mitigate potential risks. However, given the unpredictability of the timing, nature and scope of information technology disruptions, we could be subject to manipulation or improper use of our systems and networks or financial losses from remedial actions, any of which could have a material adverse effect on our financial condition and results of operations.
Environmental risks
Our operations are subject to complex and evolving environmental laws and regulations. Compliance with environmental regulatory requirements involves significant costs and may constrain our expansion opportunities.
Our operations, both in the U.S. and internationally, are subject to extensive environmental laws and regulations governing the generation, transportation and disposal of hazardous substances, waste disposal, air emissions, water discharges, remediation, restoration and reclamation of environmental contamination, including oil spill cleanup, mine closure and well plug and abandonment requirements, protection of endangered and protected species, and other related matters. In addition, we must obtain regulatory permits and approvals to start, continue and expand operations. Laws such as CERCLA and similar state laws may subject us to joint and several liability for environmental damages caused by previous owners or operators of properties we acquired or are currently operating or at sites where we sent materials for processing, recycling or disposal. As discussed in more detail in the next risk factor, we have substantial obligations for environmental remediation on mining properties previously owned or operated by Freeport Minerals Corporation (FMC) and certain of its affiliates. Some of our onshore California oil and gas fields have been in operation for more than 100 years, and current or future legal requirements may require substantial expenditures to remediate the properties or to otherwise comply with these requirements. Noncompliance with these laws and regulations could result in material penalties or other liabilities. In addition, compliance with these laws may from time to time result in delays in or changes to our development or expansion plans. Compliance with these laws and regulations imposes substantial costs, which we expect will continue to increase over time because of increased regulatory oversight, adoption of increasingly stringent environmental standards, as well as other factors.
55
Table of Contents
New or revised environmental legal requirements are frequently proposed, many of which result in substantially increased costs for our business. For example, the EPA has recently promulgated rules that could result in the reclassification of some mineral processing materials as "hazardous waste" under the Federal Resource Conservation and Recovery Act and subject the industry to significant new and costly waste management requirements. We are seeking clarification of how those rules might affect our U.S. copper and molybdenum processing and recycling activities.
Other regulations under consideration by environmental regulatory agencies include provisions that would impose additional restrictions on waterway discharges and land use, regulate environmental impacts of radioactive materials associated with mining operations, and expand regulation of solid wastes, among other things. Regulations are being considered at various governmental levels to increase regulation of or prohibit hydraulic fracturing. Adoption of these or similar new environmental regulations or more stringent application of existing regulations may materially increase our costs and constrain our expansion opportunities.
During 2014 , we incurred environmental capital expenditures and other environmental costs (including our joint venture partners' shares) to comply with applicable environmental laws and regulations that affect our operations of $405 million , compared with $595 million in 2013 and $612 million in 2012 . For 2015 , we expect to incur approximately $500 million of aggregate environmental capital expenditures and other environmental costs. The timing and amounts of estimated payments could change as a result of changes in regulatory requirements, changes in scope and costs of reclamation and plug and abandonment activities, the settlement of environmental matters and the rate at which actual spending occurs.
We incur significant costs for remediating environmental conditions on mining properties that have not been operated in many years.
FMC and its subsidiaries, and many of their affiliates and predecessor companies have been involved in exploration, mining, milling, smelting and manufacturing in the U.S. for more than a century. Activities that occurred in the late 19th century and the 20th century prior to the advent of modern environmental laws were not subject to environmental regulation and were conducted before American industrial companies fully understood the long-term effects of their operations on the surrounding environment.
With the passage of CERCLA in 1980, companies like FMC became legally responsible for the remediation of hazardous substances released into the environment from properties owned or operated by them, including damages to natural resources, irrespective of when the damage to the environment occurred or who caused it. That liability is often shared on a joint and several basis with all other prior and subsequent owners and operators, meaning that each owner or operator of the property is fully responsible for the remediation, although in many cases some or all of the other historical owners or operators no longer exist, do not have the financial ability to respond or cannot be found. As a result, because of our acquisition of FMC in 2007, many of the subsidiary companies we now own are responsible for a wide variety of environmental remediation projects throughout the U.S., and we expect to spend substantial sums annually for many years to address those remediation issues. We are also subject to claims where the release of hazardous substances is alleged to have damaged natural resources. At December 31, 2014 , we had more than 100 active remediation projects (including damaged natural resource claims) in 27 U.S. states. In addition, FMC and certain affiliates and predecessor companies were parties to agreements relating to the transfer of businesses or properties, which contained indemnification provisions relating to environmental matters, and which from time to time become the source of claims against us.
At December 31, 2014 , we had $1.2 billion recorded in our consolidated balance sheet for environmental obligations attributable to CERCLA or analogous state programs and for estimated future costs associated with environmental matters at closed facilities or closed portions of certain operating facilities. Our environmental obligation estimates are primarily based upon:
• | Our knowledge and beliefs about complex scientific and historical facts and circumstances that in many cases occurred many decades ago; |
• | Our beliefs and assumptions regarding the nature, extent and duration of remediation activities that we will be required to undertake and the estimated costs of those remediation activities, which are subject to varying interpretations; and |
56
Table of Contents
• | Our beliefs regarding the requirements that are imposed on us by existing laws and regulations and, in some cases, the clarification of uncertain regulatory requirements that could materially affect our environmental obligation estimates. |
Significant adjustments to these estimates are likely to occur in the future as additional information becomes available. The actual environmental costs may exceed our current and future accruals for these costs, and any such changes could be material.
In addition, remediation standards for environmental media imposed by the EPA and state environmental agencies have generally become more stringent over time and may become more stringent in the future. Imposition of more stringent remediation standards poses a risk that additional remediation work could be required at sites that we have already remediated to the satisfaction of the responsible governmental agencies, and may increase the risk of toxic tort litigation.
Refer to Note 12 for further discussion of our environmental obligations.
Our Indonesia mining operations create difficult and costly environmental challenges, and future changes in environmental laws, or unanticipated environmental impacts from those operations, could require us to incur increased costs.
Mining operations on the scale of our Indonesia operations involve significant environmental risks and challenges. Our primary challenge is to dispose of the large amount of crushed and ground rock material, called tailings, that results from the process by which we physically separate the copper-, gold- and silver-bearing materials from the ore that we mine. Our tailings management plan, which has been approved by the Indonesian government, uses the unnavigable river system in the highlands near our mine to transport the tailings to an engineered area in the lowlands where the tailings and natural sediments are managed in a deposition area. Lateral levees have been constructed to help contain the footprint of the tailings and to limit their impact in the lowlands.
Another major environmental challenge is managing overburden, which is the rock that must be moved aside in the mining process to reach the ore. In the presence of air, water and naturally occurring bacteria, some overburden can generate acid rock drainage, or acidic water containing dissolved metals that, if not properly managed, can adversely affect the environment. In addition, overburden stockpiles are subject to erosion caused by the large amounts of rainfall, with the eroded stockpile material eventually being deposited in the lowlands tailing management area; this additional material, while predicted in our environmental studies, could influence the deposition of finer tailing material in the estuary.
From time to time, certain Indonesian government officials have raised questions with respect to our tailings and overburden management plans, including a suggestion that we implement a pipeline system rather than the river transport system for tailings management and disposition. Because our Indonesia mining operations are remotely located in steep mountainous terrain and in an active seismic area, a pipeline system would be costly, difficult to construct and maintain, and more prone to catastrophic failure, and could therefore involve significant potentially adverse environmental issues. Based on our own studies and others conducted by third parties, we do not believe that a pipeline system is necessary or practical.
Regulation of greenhouse gas emissions and climate change issues may increase our costs and adversely affect our operations.
Many scientists believe that emissions from the combustion of carbon-based fuels contribute to greenhouse effects and, therefore, contribute to climate change. Carbon-based energy is a significant input in our operations, and our revenues include significant sales of oil, NGLs and gas, and other carbon-based energy products. The potential physical impacts of climate change on our operations are highly uncertain, and would vary by operation based on particular geographic circumstances. A number of governments have introduced or are contemplating regulatory initiatives designed to control and reduce greenhouse gas emissions. In the U.S., the EPA has proposed regulations governing greenhouse gas emissions from new, modified, and existing power plants. Increased regulation of greenhouse gas emissions may increase our costs and may also affect the demand for the oil and gas we produce.
57
Table of Contents
Other risks
Our holding company structure may impact our ability to service debt and our stockholders ' ability to receive dividends .
We are a holding company with no material assets other than the capital stock of our subsidiaries. As a result, our ability to repay our indebtedness and pay dividends is dependent on the generation of cash flow by our subsidiaries and their ability to make such cash available to us, by dividend, loan, debt repayment or otherwise. Our subsidiaries do not have any obligation to make funds available to us to repay our indebtedness or pay dividends. Dividends from subsidiaries that are not wholly owned are shared with other equity owners. Cash at our international operations is also subject to foreign withholding taxes upon repatriation into the U.S.
In addition, our subsidiaries may not be able to, or be permitted to, make distributions to enable us to repay our indebtedness or pay dividends. Each of our subsidiaries is a distinct legal entity and, under certain circumstances, legal restrictions, as well as the financial condition and operating requirements of our subsidiaries, may limit our ability to obtain cash from our subsidiaries. Our rights to participate in any distribution of our subsidiaries' assets upon their liquidation, reorganization or insolvency would generally be subject to the prior claims of the subsidiaries' creditors, including any trade creditors.
Anti-takeover provisions in our charter documents and Delaware law may make an acquisition of us more difficult.
Anti-takeover provisions in our charter documents and Delaware law may make an acquisition of us more difficult. These provisions:
• | Authorize our Board of Directors (the Board) to issue preferred stock without stockholder approval and to designate the rights, preferences and privileges of each class; if issued, such preferred stock would increase the number of outstanding shares of our capital stock and could include terms that may deter an acquisition of us; |
• | Establish advance notice requirements for nominations to the Board or for proposals that can be presented at stockholder meetings; |
• | Limit removal of directors for cause only; |
• | Limit who may call stockholder meetings; and |
• | Require the approval of the holders of two thirds of our outstanding common stock to enter into certain business combination transactions, subject to certain exceptions, including if the consideration to be received by our common stockholders in the transaction is deemed to be a fair price. |
These provisions may discourage potential takeover attempts, discourage bids for our common stock at a premium over market price or adversely affect the market price of, and the voting and other rights of the holders of, our common stock. These provisions could also discourage proxy contests and make it more difficult for stockholders to elect directors other than the candidates nominated by the Board.
In addition, because we are incorporated in Delaware, we are governed by the provisions of Section 203 of the Delaware General Corporation Law, which may prohibit large stockholders from consummating a merger with, or acquisition of, us.
These provisions may deter an acquisition of us that might otherwise be attractive to stockholders.
Item 1B. Unresolved Staff Comments.
Not applicable.
58
Table of Contents
Item 3. Legal Proceedings.
We are involved in numerous legal proceedings that arise in the ordinary course of our business or are associated with environmental issues arising from legacy operations conducted over the years by Freeport Minerals Corporation (FMC) and its affiliates. We are also involved periodically in inquiries, investigations and other proceedings initiated by or involving government agencies, some of which may result in adverse judgments, settlements, fines, penalties, injunctions or other relief. Management does not believe, based on currently available information, that the outcome of any legal proceeding will have a material adverse effect on our financial condition; although individual outcomes could be material to our operating results for a particular period, depending on the nature and magnitude of the outcome and the operating results for the period. Below is a discussion of our material water rights legal proceedings. Refer to Note 12 for discussion of our other material legal proceedings.
Water Rights Legal Proceedings
Our operations in the western United States (U.S.) require significant quantities of water for mining, ore processing and related support facilities. Continuous operation of our mines is dependent on our ability to maintain our water rights and claims and the continuing physical availability of the water supplies. In the arid western U.S., water rights are often contested, and disputes over water rights are generally time-consuming, expensive and not necessarily dispositive unless they resolve both actual and potential claims. The loss of a water right, loss of continued use of a currently available water supply, or inability to expand our water resources could materially and adversely affect our mining operations by significantly increasing the cost of water, forcing us to curtail operations, preventing us from expanding operations or forcing premature closures, thereby increasing and/or accelerating costs and foregoing profitable operations.
At our North America operations, certain of our water supplies are supported by surface water rights, which give us the right to use public waters for a statutorily defined beneficial use at a designated location. In Arizona, where our operations use both surface and groundwater, we are a participant in two active general stream adjudications in which the Arizona courts have been attempting, for over 40 years, to quantify and prioritize surface water claims for two of the state's largest river systems, which affect four of our operating mines (Morenci, Safford, Sierrita and Miami). The legal precedent set in these proceedings may also affect our Bagdad mine. The adjudications are addressing the state law claims of thousands of competing users, including us, as well as very significant federally based water claims of U.S. interests in Arizona that are potentially adverse to the claims of surface water and groundwater users under state law. Groundwater is treated differently from surface water under Arizona law, which historically allowed land owners to pump at will, subject to the doctrine of reasonable use. However, court decisions in one of the adjudications have concluded that groundwater pumping may affect surface water, thereby effectively making it surface water and bringing the pumping within the jurisdiction of the general stream adjudications. The effort to define the boundaries between groundwater and surface water remains contested and is currently the principal focus of one of those adjudications. Because groundwater accounts for approximately 40 percent of Arizona's water supplies, the re-characterization of any significant portion of that water as surface water could jeopardize the ability of consumers, farmers, ranchers, municipalities, and industrial users like us, to continue to access water supplies that have been relied on for decades. Additionally, the adjudication court is currently addressing the quantification of several U.S. federal water rights claims. The legal precedent in these proceedings may affect the adjudication of federal water right claims near our Arizona operations. Because we are a significant user of both groundwater and surface water in Arizona, we are an active participant in the adjudication proceedings.
In Re the General Adjudication of All Rights to Use Water in the Little Colorado Water System and Sources , Apache County, Superior Court, No. 6417, filed on or about February 17, 1978. The principal parties, in addition to us, include: the state of Arizona; the Salt River Project; the Arizona Public Service Company; the Navajo Nation, the Hopi Indian Tribe; the San Juan Southern Paiute Tribe; and the U.S. on behalf of those tribes, on its own behalf, and on behalf of the White Mountain Apache Tribe. This case involves adjudication of water rights claims, including federal claims, in the Little Colorado River watershed.
In Re The General Adjudication of All Rights to Use Water in the Gila River System and Sources , Maricopa County, Superior Court, Cause Nos. W-1 (Salt), W-2 (Verde), W-3 (Upper Gila), and W-4 (San Pedro). This case was originally initiated in 1974 with the filing of a petition with the Arizona State Land Department and was consolidated and transferred to the Maricopa County Superior Court in 1981. The principal parties, in addition to us, include: the state of Arizona; the Gila Valley Irrigation District; the Franklin Irrigation District; the San Carlos Irrigation and Drainage District; the Salt River Project; the San Carlos Apache Tribe; the Gila River Indian Community (GRIC); and the U.S. on behalf of those tribes, on its own behalf, and on behalf of the White Mountain Apache Tribe, the
59
Table of Contents
Fort McDowell Mohave-Apache Indian Community, the Salt River Pima-Maricopa Indian Community, and the Payson Community of Yavapai Apache Indians.
Prior to January 1, 1983, various Indian tribes filed suits in the U.S. District Court in Arizona claiming superior rights to water being used by many other water users, including us, and claiming damages for prior use in derogation of their allegedly superior rights. These federal proceedings have been stayed pending the Arizona Superior Court adjudications.
The Maricopa County Superior Court issued a decision in 2005 in the Gila River adjudication that directed the Arizona Department of Water Resources (ADWR) to prepare detailed recommendations regarding the delineation of the "sub-flow" zone of the San Pedro River basin, a tributary of the Gila River. According to the court, the sub-flow zone is the subsurface area adjacent to the river where the court may find that groundwater is connected to the surface water such that groundwater pumping may reduce surface flows in violation of rights of holders of surface water rights. Although we have minimal interests in the San Pedro River basin, a decision that re-characterizes groundwater in that basin as surface water may set a precedent for other river systems in Arizona that could have material implications for many commercial, industrial, municipal and agricultural users of groundwater, including our Arizona operations.
ADWR produced its recommendations in June 2009 which were objected to by numerous parties. Following a three-day hearing held in January 2012, the court directed ADWR to submit a further report detailing the additional work it deemed necessary to properly delineate the San Pedro River basin subflow zone. On January 10, 2013, the court issued an order instructing ADWR to complete additional technical work and submit a new report. ADWR submitted its revised report on April 1, 2014, and on October 1, 2014, the parties submitted their comments to the revised report. Also on October 1, 2014, as directed by the court, ADWR submitted a proposal for the next projects that ADWR believes should be undertaken in the case. Among these next projects is the development of procedures for "cone of depression" analyses in the San Pedro River watershed to determine whether a well located outside of the subflow zone creates a cone of depression that intersects the subflow zone and causes a 0.1 foot or greater drawdown in the subflow of the river. Based on the cone of depression analyses, wells outside of the subflow zone could be determined by the court to be subject to the jurisdiction of the adjudication court, which may require the owners of those wells to either demonstrate a valid surface water claim to support such pumping or potentially be subject to compliance or damages claims. On November 6, 2014, the court held a hearing to address the parties' comments to ADWR's revised report and to discuss ADWR's proposal for next projects. During that hearing, ADWR agreed to provide additional information to the parties by February 13, 2015, to facilitate better evaluation of ADWR's methodologies and decision-making resulting in the revised report. Given the legal and technical complexity of this adjudication, its long history, and its long-term legal, economic and political implications, it is difficult to predict the timing or the outcome of this issue or of the overall adjudication. If we are unable to satisfactorily resolve the issues being addressed in this adjudication, our ability to pump groundwater could be diminished or curtailed, and our operations at Morenci, Safford, Sierrita, Miami and Bagdad could be adversely affected.
As part of the Gila River adjudication, the U.S. has asserted numerous claims for federal non-Indian reserved surface water and groundwater rights throughout Arizona. These claims are based on reservations of federal land for specific purposes (e.g., national parks, military bases and wilderness areas). Unlike state law-based water rights, federal reserved water rights are not based on a history of beneficial use of specific amounts of water. Instead, these rights are given priority in the prior appropriation system based on the date the land was reserved, not the date that water was first used on the land. As a result, these federal water rights can be very disruptive to existing state law-based water rights and uses, particularly groundwater uses.
Because federal reserved water rights have not been quantified, the task of determining how much water each federal reservation may use has been left to the Gila River adjudication court. Several "contested cases" to quantify reserved water rights for particular federal reservations are currently pending in the adjudication. In multiple instances, the U.S. asserts a right to all water in a particular watershed that was not effectively appropriated under state law prior to the reservation. This creates risks for both surface water users and groundwater users because such claims can severely impede current and future uses of water within the same watershed.
Federal reserved rights present additional risks to water users aside from the significant quantities of water claimed by the U.S. Of particular significance, federal reserved rights enjoy greater protection from groundwater pumping than is accorded to state law-based water rights.
60
Table of Contents
Because there are numerous federal reservations in watersheds across Arizona, the reserved water right claims of the U.S. pose a significant risk to multiple operations, including Morenci and Safford in the Upper Gila River watershed, Sierrita in the Santa Cruz watershed, and Bagdad in the Bill Williams River watershed. Although the Bill Williams watershed is not part of the Gila River adjudication, decisions made in the Gila River adjudication may be asserted as precedents for similar federal claims in the Bill Williams watershed. Because federal reserved water rights may adversely affect water uses at each of these operations, we have been actively involved in litigation over these claims.
Item 4. Mine Safety Disclosures.
The safety and health of all employees is our highest priority. Management believes that safety and health considerations are integral to, and compatible with, all other functions in the organization and that proper safety and health management will enhance production and reduce costs. Our approach towards the health and safety of our workforce is to continuously improve performance through implementing robust management systems and providing adequate training, safety incentive and occupational health programs.
Our objective is zero work place injuries and occupational illnesses. We measure progress toward achieving our objective against regularly established benchmarks, including measuring company-wide Total Recordable Incident Rates (TRIR). Our TRIR (including contractors) was 0.56 per 200,000 man-hours worked in 2014, 0.74 per 200,000 man-hours worked in 2013 and 0.58 per 200,000 man-hours worked in 2012 . The metal mining sector industry average reported by the U.S. Mine Safety and Health Administration (MSHA) was 2.38 per 200,000 man-hours worked in 2013 and 2.27 per 200,000 man-hours worked in 2012 . The metal mining sector industry average for 2014 was not available at the time of this filing.
Refer to Exhibit 95.1 for mine safety disclosures required in accordance with Section 1503(a) of the Dodd-Frank Wall Street Reform and Consumer Protection Act and Item 104 of Regulation S-K.
Executive Officers of the Registrant.
Certain information as of February 20, 2015 , about our executive officers is set forth in the following table and accompanying text:
Name |
| Age |
| Position or Office |
James R. Moffett |
| 76 |
| Chairman of the Board |
Richard C. Adkerson |
| 68 |
| Vice Chairman of the Board, and FCX President and Chief Executive Officer |
James C. Flores |
| 55 |
| Vice Chairman of the Board, and FM O&G President and Chief Executive Officer |
Michael J. Arnold |
| 62 |
| Executive Vice President and Chief Administrative Officer |
Kathleen L. Quirk |
| 51 |
| Executive Vice President, Chief Financial Officer and Treasurer |
James R. Moffett has served as Chairman of the Board since May 1992. Mr. Moffett previously served as the Chief Executive Officer from July 1995 until December 2003. He served as Co-Chairman of the Board of McMoRan Exploration Co. (MMR) from September 1998, and President and Chief Executive Officer from May 2010 until FCX's acquisition of MMR in 2013.
Richard C. Adkerson has served as Vice Chairman of the Board since June 2013, President since January 2008 and also from April 1997 to March 2007, Chief Executive Officer since December 2003 and a director since October 2006. Mr. Adkerson previously served as Chief Financial Officer from October 2000 to December 2003. Mr. Adkerson served as Co-Chairman of the Board of MMR from September 1998 until FCX's acquisition of MMR in 2013.
James C. Flores has served as Vice Chairman of the Board, and FM O&G President and Chief Executive Officer since June 2013. Mr. Flores previously served as Chairman of the Board, President and Chief Executive Officer of Plains Exploration & Production Company (PXP) from September 2002 until FCX's acquisition of PXP in 2013.
Michael J. Arnold has served as Executive Vice President since March 2007 and Chief Administrative Officer since December 2003.
61
Table of Contents
Kathleen L. Quirk has served as Executive Vice President since March 2007, Chief Financial Officer since December 2003 and Treasurer since February 2000. Ms. Quirk previously served as Senior Vice President from December 2003 to March 2007. Ms. Quirk served as the Senior Vice President of MMR from April 2002 and as Treasurer from January 2000 until FCX's acquisition of MMR in 2013.
PART II
Item 5. Market for Registrant's Common Equity, Related Stockholder Matters and Issuer Purchases of Equity Securities.
Unregistered Sales of Equity Securities
None.
Common Stock
Our common shares trade on the New York Stock Exchange (NYSE) under the symbol "FCX." The FCX share price is reported daily in the financial press under "FMCG" in most listings of NYSE securities. The table below shows the NYSE composite tape common share price ranges during 2014 and 2013 :
|
| 2014 |
| 2013 | ||||
|
| High |
| Low |
| High |
| Low |
First Quarter |
| $38.09 |
| $30.38 |
| $36.26 |
| $30.72 |
Second Quarter |
| $36.51 |
| $32.35 |
| $34.00 |
| $26.37 |
Third Quarter |
| $39.32 |
| $32.29 |
| $34.99 |
| $26.95 |
Fourth Quarter |
| $32.91 |
| $20.94 |
| $38.00 |
| $32.34 |
At February 20, 2015 , there were 15,149 holders of record of our common stock.
Common Stock Dividends
The declaration of dividends is at the discretion of the FCX Board of Directors (the Board) and will depend on our financial results, cash requirements, future prospects and other factors deemed relevant by the Board. In February 2012, the Board authorized an increase in the cash dividend on our common stock to the current annual rate of $1.25 per share ($0.3125 per share quarterly). The Board also authorized a supplemental common stock dividend of $1.00 per share that was paid in July 2013. Below is a summary of dividends on FCX common stock for 2014 and 2013 :
|
| 2014 | ||||
|
| Per Share Amount |
| Record Date |
| Payment Date |
First Quarter |
| $0.3125 |
| 01/15/2014 |
| 02/03/2014 |
Second Quarter |
| $0.3125 |
| 04/15/2014 |
| 05/01/2014 |
Third Quarter |
| $0.3125 |
| 07/15/2014 |
| 08/01/2014 |
Fourth Quarter |
| $0.3125 |
| 10/15/2014 |
| 11/03/2014 |
|
| 2013 | ||||
|
| Per Share Amount |
| Record Date |
| Payment Date |
First Quarter |
| $0.3125 |
| 01/15/2013 |
| 02/01/2013 |
Second Quarter |
| $0.3125 |
| 04/15/2013 |
| 05/01/2013 |
Supplemental Dividend |
| $1.0000 |
| 06/14/2013 |
| 07/01/2013 |
Third Quarter |
| $0.3125 |
| 07/15/2013 |
| 08/01/2013 |
Fourth Quarter |
| $0.3125 |
| 10/15/2013 |
| 11/01/2013 |
On December 19, 2014, the Board declared a regular quarterly dividend of $0.3125 per share, which was paid on February 2, 2015, to common stockholders of record at the close of business on January 15, 2015.
62
Table of Contents
Issuer Purchases of Equity Securities
The following table sets forth information with respect to shares of FCX common stock purchased by us during the three months ended December 31, 2014 :
Period |
| (a) Total Number of Shares Purchased |
| (b) Average Price Paid Per Share |
| (c) Total Number of Shares Purchased as Part of Publicly Announced Plans or Programs a |
| (d) Maximum Number of Shares That May Yet Be Purchased Under the Plans or Programs a | |||||
October 1-31, 2014 |
| - | |
| $ | - | |
| - | |
| 23,685,500 | |
November 1-30, 2014 |
| 214,923 | | b | $ | 27.79 | |
| - | |
| 23,685,500 | |
December 1-31, 2014 |
| - | |
| $ | - | |
| - | |
| 23,685,500 | |
Total |
| 214,923 | |
| $ | 27.79 | |
| - | |
| 23,685,500 | |
a. | On July 21, 2008, the Board approved an increase in our open-market share purchase program for up to 30 million shares. The program does not have an expiration date. |
b. | Consists of shares acquired in connection with stock option exercises. |
63
Table of Contents
Item 6. Selected Financial Data.
FREEPORT-McMoRan INC.
SELECTED FINANCIAL AND OPERATING DATA
| Years Ended December 31, |
| ||||||||||||||||||
| 2014 |
| 2013 a |
| 2012 |
| 2011 |
| 2010 |
| ||||||||||
CONSOLIDATED FINANCIAL DATA | (In millions, except per share amounts) |
| ||||||||||||||||||
Revenues | $ | 21,438 | | b | $ | 20,921 | | b | $ | 18,010 | |
| $ | 20,880 | |
| $ | 18,982 | |
|
Operating income | $ | 97 | | b,c | $ | 5,351 | | b,d,e | $ | 5,814 | |
| $ | 9,140 | | e | $ | 9,068 | |
|
Net (loss) income | $ | (745 | ) |
| $ | 3,441 | |
| $ | 3,980 | |
| $ | 5,747 | |
| $ | 5,544 | |
|
Net (loss) income attributable to common stockholders | $ | (1,308 | ) | b,c,f,g | $ | 2,658 | | b,d,e,f,g,h | $ | 3,041 | | f,g | $ | 4,560 | | e,f,g | $ | 4,273 | | f |
Basic net (loss) income per share attributable to common stockholders | $ | (1.26 | ) |
| $ | 2.65 | |
| $ | 3.20 | |
| $ | 4.81 | |
| $ | 4.67 | |
|
Basic weighted-average common shares outstanding | 1,039 | |
| 1,002 | |
| 949 | |
| 947 | |
| 915 | |
| |||||
Diluted net (loss) income per share attributable to common stockholders | $ | (1.26 | ) | b,c,f,g | $ | 2.64 | | b,d,e,f,g,h | $ | 3.19 | | f,g | $ | 4.78 | | e,f,g | $ | 4.57 | | f |
Diluted weighted-average common shares outstanding | 1,039 | |
| 1,006 | |
| 954 | |
| 955 | |
| 949 | |
| |||||
Dividends declared per share of common stock | $ | 1.25 | |
| $ | 2.25 | |
| $ | 1.25 | |
| $ | 1.50 | |
| $ | 1.125 | |
|
Operating cash flows | $ | 5,631 | |
| $ | 6,139 | |
| $ | 3,774 | |
| $ | 6,620 | |
| $ | 6,273 | |
|
Capital expenditures | $ | 7,215 | |
| $ | 5,286 | |
| $ | 3,494 | |
| $ | 2,534 | |
| $ | 1,412 | |
|
At December 31: |
|
|
|
|
|
|
|
|
|
| ||||||||||
Cash and cash equivalents | $ | 464 | |
| $ | 1,985 | |
| $ | 3,705 | |
| $ | 4,822 | |
| $ | 3,738 | |
|
Property, plant, equipment and mining development costs, net | $ | 26,220 | |
| $ | 24,042 | |
| $ | 20,999 | |
| $ | 18,449 | |
| $ | 16,785 | |
|
Oil and gas properties, net | $ | 19,274 | |
| $ | 23,359 | |
| $ | - | |
| $ | - | |
| $ | - | |
|
Goodwill | $ | - | |
| $ | 1,916 | |
| $ | - | |
| $ | - | |
| $ | - | |
|
Total assets | $ | 58,795 | |
| $ | 63,473 | |
| $ | 35,440 | |
| $ | 32,070 | |
| $ | 29,386 | |
|
Total debt, including current portion | $ | 18,970 | |
| $ | 20,706 | |
| $ | 3,527 | |
| $ | 3,537 | |
| $ | 4,755 | |
|
Redeemable noncontrolling interest | $ | 751 | |
| $ | 716 | |
| $ | - | |
| $ | - | |
| $ | - | |
|
Total stockholders' equity | $ | 18,287 | |
| $ | 20,934 | |
| $ | 17,543 | |
| $ | 15,642 | |
| $ | 12,504 | |
|
The selected consolidated financial data shown above is derived from our audited consolidated financial statements. These historical results are not necessarily indicative of results that you can expect for any future period. You should read this data in conjunction with Management's Discussion and Analysis of Financial Condition and Results of Operations and our Consolidated Financial Statements and Notes thereto contained in this annual report.
a. | Includes the results of FCX Oil & Gas Inc. (FM O&G) beginning June 1, 2013. |
b. | Includes net noncash mark-to-market realized gains (losses) associated with crude oil and natural gas derivative contracts totaling $627 million ( $389 million to net loss attributable to common stockholders or $0.37 per share) for 2014 and $(312) million ( $(194) million to net income attributable to common stockholders or $(0.19) per share) for the seven-month period from June 1, 2013, to December 31, 2013 . |
c. | Includes (i) impairment charges of $5.5 billion ( $4.0 billion to net loss attributable to common stockholders or $3.89 per share) to reduce the carrying value of oil and gas properties pursuant to full cost accounting rules and to fully impair goodwill and (ii) gains of $717 million ( $481 million to net loss attributable to common stockholders or $0.46 per share) primarily from the sale of our 80 percent interests in the Candelaria and Ojos del Salado mining operations. |
d. | Includes transaction and related costs principally associated with our oil and gas acquisitions totaling $80 million ( $50 million to net income attributable to common stockholders or $0.05 per share). |
e. | Includes charges associated with labor agreements totaling $36 million ( $13 million to net income attributable to common stockholders or $0.01 per share) at Cerro Verde in 2013 and $116 million ( $50 million to net income attributable to common stockholders or $0.05 per share) at PT-FI, Cerro Verde and El Abra in 2011. |
f. | Includes after-tax net gains (losses) on early extinguishment of debt totaling $3 million (less than $0.01 per share) in 2014 , $(28) million ( $(0.03) per share) in 2013 , $(149) million ( $(0.16) per share) in 2012, $(60) million ( $(0.06) per share) in 2011 and $(71) million ( $(0.07) per share) in 2010. |
g. | As further discussed in "Consolidated Results - Provision for Income Taxes" contained in Part 7. and 7a. Management's Discussion and Analysis of Financial Condition and Results of Operations, net (loss) income attributable to common stockholders includes a net tax charge of $121 million ( $103 million net of noncontrolling interests or $0.10 per share) in 2014, a net tax benefit of $199 million ( $0.20 per share) in 2013 and a net tax benefit of $205 million ( $98 million net of noncontrolling interests or $0.11 per share) in 2012. The year 2011 includes a tax charge of $53 million ( $49 million net of noncontrolling interests or $0.05 per share) for additional taxes associated with Cerro Verde's election to pay a special mining burden during the remaining term of its 1998 stability agreement. |
h. | Includes a gain of $128 million to net income attributable to common stockholders ($0.13 per share) related to our preferred stock investments in and the subsequent acquisition of McMoRan Exploration Co. |
64
Table of Contents
FREEPORT-McMoRan INC.
SELECTED FINANCIAL AND OPERATING DATA (Continued)
| Years Ended December 31, |
| ||||||||||||||||||
| 2014 |
| 2013 |
| 2012 |
| 2011 |
| 2010 |
| ||||||||||
CONSOLIDATED MINING OPERATING DATA |
|
|
|
|
|
|
|
|
|
| ||||||||||
Copper (recoverable) |
|
|
|
|
|
|
|
|
|
| ||||||||||
Production (millions of pounds) | 3,904 | |
| 4,131 | |
| 3,663 | |
| 3,691 | |
| 3,908 | |
| |||||
Production (thousands of metric tons) | 1,771 | |
| 1,874 | |
| 1,662 | |
| 1,674 | |
| 1,773 | |
| |||||
Sales, excluding purchases (millions of pounds) | 3,888 | |
| 4,086 | |
| 3,648 | |
| 3,698 | |
| 3,896 | |
| |||||
Sales, excluding purchases (thousands of metric tons) | 1,764 | |
| 1,853 | |
| 1,655 | |
| 1,678 | |
| 1,767 | |
| |||||
Average realized price per pound | $ | 3.09 | |
| $ | 3.30 | |
| $ | 3.60 | |
| $ | 3.86 | |
| $ | 3.59 | |
|
Gold (thousands of recoverable ounces) |
|
|
|
|
|
|
|
|
|
| ||||||||||
Production | 1,214 | |
| 1,250 | |
| 958 | |
| 1,383 | |
| 1,886 | |
| |||||
Sales, excluding purchases | 1,248 | |
| 1,204 | |
| 1,010 | |
| 1,378 | |
| 1,863 | |
| |||||
Average realized price per ounce | $ | 1,231 | |
| $ | 1,315 | |
| $ | 1,665 | |
| $ | 1,583 | |
| $ | 1,271 | |
|
Molybdenum (millions of recoverable pounds) |
|
|
|
|
|
|
|
|
|
| ||||||||||
Production | 95 | |
| 94 | |
| 85 | |
| 83 | |
| 72 | |
| |||||
Sales, excluding purchases | 95 | |
| 93 | |
| 83 | |
| 79 | |
| 67 | |
| |||||
Average realized price per pound | $ | 12.74 | |
| $ | 11.85 | |
| $ | 14.26 | |
| $ | 16.98 | |
| $ | 16.47 | |
|
NORTH AMERICA COPPER MINES |
|
|
|
|
|
|
|
|
|
| ||||||||||
Operating Data, Net of Joint Venture Interest |
|
|
|
|
|
|
|
|
|
| ||||||||||
Copper (recoverable) |
|
|
|
|
|
|
|
|
|
| ||||||||||
Production (millions of pounds) | 1,670 | |
| 1,431 | |
| 1,363 | |
| 1,258 | |
| 1,067 | |
| |||||
Production (thousands of metric tons) | 757 | |
| 649 | |
| 618 | |
| 571 | |
| 484 | |
| |||||
Sales, excluding purchases (millions of pounds) | 1,664 | |
| 1,422 | |
| 1,351 | |
| 1,247 | |
| 1,085 | |
| |||||
Sales, excluding purchases (thousands of metric tons) | 755 | |
| 645 | |
| 613 | |
| 566 | |
| 492 | |
| |||||
Average realized price per pound | $ | 3.13 | |
| $ | 3.36 | |
| $ | 3.64 | |
| $ | 3.99 | |
| $ | 3.42 | |
|
Molybdenum (millions of recoverable pounds) |
|
|
|
|
|
|
|
|
|
| ||||||||||
Production | 33 | |
| 32 | |
| 36 | |
| 35 | |
| 25 | |
| |||||
100% Operating Data |
|
|
|
|
|
|
|
|
|
| ||||||||||
Solution extraction/electrowinning (SX/EW) operations |
|
|
|
|
|
|
|
|
|
| ||||||||||
Leach ore placed in stockpiles (metric tons per day) | 1,005,300 | |
| 1,003,500 | |
| 998,600 | |
| 888,300 | |
| 648,800 | |
| |||||
Average copper ore grade (percent) | 0.25 | |
| 0.22 | |
| 0.22 | |
| 0.24 | |
| 0.24 | |
| |||||
Copper production (millions of recoverable pounds) | 963 | |
| 889 | |
| 866 | |
| 801 | |
| 746 | |
| |||||
Mill operations |
|
|
|
|
|
|
|
|
|
| ||||||||||
Ore milled (metric tons per day) | 273,800 | |
| 246,500 | |
| 239,600 | |
| 222,800 | |
| 189,200 | |
| |||||
Average ore grade (percent): |
|
|
|
|
|
|
|
|
|
| ||||||||||
Copper | 0.45 | |
| 0.39 | |
| 0.37 | |
| 0.38 | |
| 0.32 | |
| |||||
Molybdenum | 0.03 | |
| 0.03 | |
| 0.03 | |
| 0.03 | |
| 0.03 | |
| |||||
Copper recovery rate (percent) | 85.8 | |
| 85.3 | |
| 83.9 | |
| 83.1 | |
| 83.0 | |
| |||||
Copper production (millions of recoverable pounds) | 828 | |
| 642 | |
| 592 | |
| 549 | |
| 398 | |
| |||||
SOUTH AMERICA MINING |
|
|
|
|
|
|
|
|
|
| ||||||||||
Copper (recoverable) |
|
|
|
|
|
|
|
|
|
| ||||||||||
Production (millions of pounds) | 1,151 | |
| 1,323 | |
| 1,257 | |
| 1,306 | |
| 1,354 | |
| |||||
Production (thousands of metric tons) | 522 | |
| 600 | |
| 570 | |
| 592 | |
| 614 | |
| |||||
Sales (millions of pounds) | 1,135 | |
| 1,325 | |
| 1,245 | |
| 1,322 | |
| 1,335 | |
| |||||
Sales (thousands of metric tons) | 515 | |
| 601 | |
| 565 | |
| 600 | |
| 606 | |
| |||||
Average realized price per pound | $ | 3.08 | |
| $ | 3.30 | |
| $ | 3.58 | |
| $ | 3.77 | |
| $ | 3.68 | |
|
Gold (thousands of recoverable ounces) |
|
|
|
|
|
|
|
|
|
| ||||||||||
Production | 72 | |
| 101 | |
| 83 | |
| 101 | |
| 93 | |
| |||||
Sales | 67 | |
| 102 | |
| 82 | |
| 101 | |
| 93 | |
| |||||
Average realized price per ounce | $ | 1,271 | |
| $ | 1,350 | |
| $ | 1,673 | |
| $ | 1,580 | |
| $ | 1,263 | |
|
Molybdenum (millions of recoverable pounds) |
|
|
|
|
|
|
|
|
|
| ||||||||||
Production | 11 | |
| 13 | |
| 8 | |
| 10 | |
| 7 | |
| |||||
SX/EW operations |
|
|
|
|
|
|
|
|
|
| ||||||||||
Leach ore placed in stockpiles (metric tons per day) | 275,200 | |
| 274,600 | |
| 229,300 | |
| 245,200 | |
| 268,800 | |
| |||||
Average copper ore grade (percent) | 0.48 | |
| 0.50 | |
| 0.55 | |
| 0.50 | |
| 0.41 | |
| |||||
Copper production (millions of recoverable pounds) | 491 | |
| 448 | |
| 457 | |
| 439 | |
| 504 | |
| |||||
Mill operations |
|
|
|
|
|
|
|
|
|
| ||||||||||
Ore milled (metric tons per day) | 180,500 | |
| 192,600 | |
| 191,400 | |
| 189,200 | |
| 188,800 | |
| |||||
Average ore grade: |
|
|
|
|
|
|
|
|
|
| ||||||||||
Copper (percent) | 0.54 | |
| 0.65 | |
| 0.60 | |
| 0.66 | |
| 0.65 | |
| |||||
Gold (grams per metric ton) | 0.10 | |
| 0.12 | |
| 0.10 | |
| 0.12 | |
| 0.10 | |
| |||||
Molybdenum (percent) | 0.02 | |
| 0.02 | |
| 0.02 | |
| 0.02 | |
| 0.02 | |
| |||||
Copper recovery rate (percent) | 88.1 | |
| 90.9 | |
| 90.1 | |
| 89.6 | |
| 90.0 | |
| |||||
Copper production (millions of recoverable pounds) | 660 | |
| 875 | |
| 800 | |
| 867 | |
| 850 | |
| |||||
|
|
|
|
|
|
|
|
|
|
| ||||||||||
65
Table of Contents
FREEPORT-McMoRan INC.
SELECTED FINANCIAL AND OPERATING DATA (Continued)
| Years Ended December 31, |
| ||||||||||||||||||
| 2014 |
| 2013 |
| 2012 |
| 2011 |
| 2010 |
| ||||||||||
INDONESIA MINING |
|
|
|
|
|
|
|
|
|
| ||||||||||
Operating Data, Net of Joint Venture Interest |
|
|
|
|
|
|
|
|
|
| ||||||||||
Copper (recoverable) |
|
|
|
|
|
|
|
|
|
| ||||||||||
Production (millions of pounds) | 636 | |
| 915 | |
| 695 | |
| 846 | |
| 1,222 | |
| |||||
Production (thousands of metric tons) | 288 | |
| 415 | |
| 315 | |
| 384 | |
| 554 | |
| |||||
Sales (millions of pounds) | 664 | |
| 885 | |
| 716 | |
| 846 | |
| 1,214 | |
| |||||
Sales (thousands of metric tons) | 301 | |
| 401 | |
| 325 | |
| 384 | |
| 551 | |
| |||||
Average realized price per pound | $ | 3.01 | |
| $ | 3.28 | |
| $ | 3.58 | |
| $ | 3.85 | |
| $ | 3.69 | |
|
Gold (thousands of recoverable ounces) |
|
|
|
|
|
|
|
|
|
| ||||||||||
Production | 1,130 | |
| 1,142 | |
| 862 | |
| 1,272 | |
| 1,786 | |
| |||||
Sales | 1,168 | |
| 1,096 | |
| 915 | |
| 1,270 | |
| 1,765 | |
| |||||
Average realized price per ounce | $ | 1,229 | |
| $ | 1,312 | |
| $ | 1,664 | |
| $ | 1,583 | |
| $ | 1,271 | |
|
100% Operating Data |
|
|
|
|
|
|
|
|
|
| ||||||||||
Ore milled (metric tons per day): a |
|
|
|
|
|
|
|
|
|
| ||||||||||
Grasberg open pit | 69,100 | |
| 127,700 | |
| 118,800 | |
| 112,900 | |
| 149,800 | |
| |||||
Deep Ore Zone underground mine | 50,500 | |
| 49,400 | |
| 44,600 | |
| 51,700 | |
| 79,600 | |
| |||||
Big Gossan underground mine | 900 | |
| 2,100 | |
| 1,600 | |
| 1,500 | |
| 800 | |
| |||||
Total | 120,500 | |
| 179,200 | |
| 165,000 | |
| 166,100 | |
| 230,200 | |
| |||||
Average ore grade: |
|
|
|
|
|
|
|
|
|
| ||||||||||
Copper (percent) | 0.79 | |
| 0.76 | |
| 0.62 | |
| 0.79 | |
| 0.85 | |
| |||||
Gold (grams per metric ton) | 0.99 | |
| 0.69 | |
| 0.59 | |
| 0.93 | |
| 0.90 | |
| |||||
Recovery rates (percent): |
|
|
|
|
|
|
|
|
|
| ||||||||||
Copper | 90.3 | |
| 90.0 | |
| 88.7 | |
| 88.3 | |
| 88.9 | |
| |||||
Gold | 83.2 | |
| 80.0 | |
| 75.7 | |
| 81.2 | |
| 81.7 | |
| |||||
Production (recoverable): |
|
|
|
|
|
|
|
|
|
| ||||||||||
Copper (millions of pounds) | 651 | |
| 928 | |
| 695 | |
| 882 | |
| 1,330 | |
| |||||
Gold (thousands of ounces) | 1,132 | |
| 1,142 | |
| 862 | |
| 1,444 | |
| 1,964 | |
| |||||
AFRICA MINING |
|
|
|
|
|
|
|
|
|
| ||||||||||
Copper (recoverable) |
|
|
|
|
|
|
|
|
|
| ||||||||||
Production (millions of pounds) | 447 | |
| 462 | |
| 348 | |
| 281 | |
| 265 | |
| |||||
Production (thousands of metric tons) | 203 | |
| 210 | |
| 158 | |
| 127 | |
| 120 | |
| |||||
Sales (millions of pounds) | 425 | |
| 454 | |
| 336 | |
| 283 | |
| 262 | |
| |||||
Sales (thousands of metric tons) | 193 | |
| 206 | |
| 152 | |
| 128 | |
| 119 | |
| |||||
Average realized price per pound | $ | 3.06 | |
| $ | 3.21 | |
| $ | 3.51 | |
| $ | 3.74 | |
| $ | 3.45 | |
|
Cobalt (millions of contained pounds) |
|
|
|
|
|
|
|
|
|
| ||||||||||
Production | 29 | |
| 28 | |
| 26 | |
| 25 | |
| 20 | |
| |||||
Sales | 30 | |
| 25 | |
| 25 | |
| 25 | |
| 20 | |
| |||||
Average realized price per pound | $ | 9.66 | |
| $ | 8.02 | |
| $ | 7.83 | |
| $ | 9.99 | |
| 10.95 | |
| |
Ore milled (metric tons per day) | 14,700 | |
| 14,900 | |
| 13,000 | |
| 11,100 | |
| 10,300 | |
| |||||
Average ore grade (percent): |
|
|
|
|
|
|
|
|
|
| ||||||||||
Copper | 4.06 | |
| 4.22 | |
| 3.62 | |
| 3.41 | |
| 3.51 | |
| |||||
Cobalt | 0.34 | |
| 0.37 | |
| 0.37 | |
| 0.40 | |
| 0.40 | |
| |||||
Copper recovery rate (percent) | 92.6 | |
| 91.4 | |
| 92.4 | |
| 92.5 | |
| 91.4 | |
| |||||
MOLYBDENUM MINES |
|
|
|
|
|
|
|
|
|
| ||||||||||
Molybdenum production (millions of recoverable pounds) | 51 | |
| 49 | |
| 41 | | b | 38 | |
| 40 | |
| |||||
Ore milled (metric tons per day) c | 39,400 | |
| 35,700 | |
| 20,800 | |
| 22,300 | |
| 22,900 | |
| |||||
Average molybdenum ore grade (percent) c | 0.19 | |
| 0.19 | |
| 0.23 | |
| 0.24 | |
| 0.25 | |
| |||||
OIL AND GAS OPERATIONS d |
|
|
|
|
|
|
|
|
|
| ||||||||||
Sales Volumes: |
|
|
|
|
|
|
|
|
|
| ||||||||||
Oil (million barrels) | 40.1 | |
| 26.6 | |
|
|
|
|
|
|
| ||||||||
Natural gas (billion cubic feet) | 80.8 | |
| 54.2 | |
| - | |
| - | |
| - | |
| |||||
Natural gas liquids (NGLs) (million barrels) | 3.2 | |
| 2.4 | |
| - | |
| - | |
| - | |
| |||||
Million barrels of oil equivalents (MMBOE) | 56.8 | |
| 38.1 | |
| - | |
| - | |
| - | |
| |||||
Average Realizations: |
|
|
|
|
|
|
|
|
|
| ||||||||||
Oil (per barrel) | $ | 90.00 | |
| $ | 98.32 | |
| - | |
| - | |
| - | |
| |||
Natural gas (per million British thermal units) | $ | 4.23 | |
| $ | 3.99 | |
| - | |
| - | |
| - | |
| |||
NGLs (per barrel) | $ | 39.73 | |
| $ | 38.20 | |
| - | |
| - | |
| - | |
| |||
a. | Represents the approximate average daily throughput processed at PT-FI's mill facilities from each producing mine. |
b. | Includes production from the Climax molybdenum mine, which began commercial operations in May 2012. |
c. | The 2014 and 2013 periods reflect operating data for the Henderson and Climax mines; the prior periods reflect operating data of only the Henderson mine. |
d. | Represents the results of FM O&G beginning June 1, 2013. |
66
Table of Contents
Ratio of Earnings to Fixed Charges
For the ratio of earnings to fixed charges calculation, earnings consist of income (loss) from continuing operations before income taxes, noncontrolling interests in consolidated subsidiaries, equity in affiliated companies' net earnings, cumulative effect of accounting changes and fixed charges. Fixed charges include interest and that portion of rent deemed representative of interest. For the ratio of earnings to fixed charges and preferred stock dividends calculation, we assumed that our preferred stock dividend requirements were equal to the pre-tax earnings that would be required to cover those dividend requirements. We computed those pre-tax earnings using the effective tax rate for each year. Our ratio of earnings to fixed charges was as follows for the years presented:
| Years Ended December 31, | ||||||||
| 2014 |
| 2013 |
| 2012 |
| 2011 |
| 2010 |
Ratio of earnings to fixed charges | - | a | 7.4x |
| 19.8x |
| 20.7x |
| 16.3x |
Ratio of earnings to fixed charges |
|
|
|
|
|
|
|
|
|
and preferred stock dividends | - | a | 7.4x |
| 19.8x |
| 20.7x |
| 13.9x |
a. | As a result of the loss recorded in 2014, the ratio coverage was less than 1:1. FCX would have needed to generate additional earnings of $657 million to achieve coverage of 1:1 in 2014. |
67
Table of Contents
Items 7. and 7A. Management's Discussion and Analysis of Financial Condition and Results of Operations and Quantitative and Qualitative Disclosures About Market Risk.
In Management's Discussion and Analysis of Financial Condition and Results of Operations and Quantitative and Qualitative Disclosures About Market Risk, "we," "us" and "our" refer to Freeport-McMoRan Inc. (FCX) and its consolidated subsidiaries. The results of operations reported and summarized below are not necessarily indicative of future operating results (refer to "Cautionary Statement" for further discussion). References to "Notes" are Notes included in our Notes to Consolidated Financial Statements. Throughout Management's Discussion and Analysis of Financial Condition and Results of Operations and Quantitative and Qualitative Disclosures About Market Risk, all references to income or losses per share are on a diluted basis, unless otherwise noted.
OVERVIEW
We are a premier United States (U.S.)-based natural resources company with an industry-leading global portfolio of mineral assets, significant oil and gas resources and a growing production profile. We are the world's largest publicly traded copper producer. Our portfolio of assets includes the Grasberg minerals district in Indonesia, one of the world's largest copper and gold deposits; significant mining operations in North and South America; the Tenke Fungurume (Tenke) minerals district in the Democratic Republic of Congo (DRC) in Africa; and significant oil and natural gas assets in the U.S., including reserves in the Deepwater Gulf of Mexico (GOM), onshore and offshore California, in the Haynesville shale play in Louisiana, in the Madden area in central Wyoming, and an industry-leading position in the emerging Inboard Lower Tertiary/Cretaceous natural gas trend in the shallow waters of the GOM and onshore in South Louisiana.
We have significant mineral reserves, resources and future development opportunities within our portfolio of mining assets. At December 31, 2014 , our estimated consolidated recoverable proven and probable mineral reserves totaled 103.5 billion pounds of copper, 28.5 million ounces of gold and 3.11 billion pounds of molybdenum, which were determined using long-term average prices of $2.00 per pound for copper, $1,000 per ounce for gold and $10 per pound for molybdenum. Refer to "Critical Accounting Estimates – Mineral Reserves" for further discussion.
A summary of the sources of our consolidated copper, gold and molybdenum production for the year 2014 by geographic location follows:
| Copper |
| Gold |
| Molybdenum |
|
North America | 43% |
| 1% |
| 88% | a |
South America | 30% |
| 6% |
| 12% |
|
Indonesia | 16% |
| 93% |
| - |
|
Africa | 11% |
| - |
| - |
|
| 100% |
| 100% |
| 100% |
|
a. | For 2014 , 61 percent of our consolidated molybdenum production in North America was from the Henderson and Climax primary molybdenum mines. |
Copper production from the Grasberg mine in Indonesia, Morenci mine in North America and Cerro Verde mine in South America together totaled 47 percent of our consolidated copper production in 2014 . During 2014, we commenced operations at the Morenci mill expansion and continued construction on the Cerro Verde mill expansion, with completion expected in late 2015. These projects are expected to significantly increase our copper production in future periods. Refer to "Operations" for further discussion of our mining operations.
Our oil and gas business has significant proved, probable and possible reserves with financially attractive organic growth opportunities. Our estimated proved oil and natural gas reserves at December 31, 2014 , totaled 390 million barrels of oil equivalents (MMBOE), with 74 percent comprised of oil (including natural gas liquids, or NGLs). Our portfolio includes a broad range of development opportunities and high-potential exploration prospects. For 2014, our oil and gas sales volumes totaled 56.8 MMBOE, including 40.1 million barrels (MMBbls) of crude oil, 80.8 billion cubic feet (Bcf) of natural gas and 3.2 MMBbls of NGLs. Refer to "Operations" for further discussion of our oil and gas operations and to "Critical Accounting Estimates – Oil and Natural Gas Reserves" for further discussion of our reserves.
68
Table of Contents
During 2014, we completed approximately $5 billion in asset sales, including the June 2014 sale of our Eagle Ford shale assets for $3.1 billion and the November 2014 sale of our 80 percent ownership interests in the Candelaria and Ojos del Salado copper mining operations (Candelaria/Ojos) for $1.8 billion . Refer to Note 2 for further discussion of dispositions and acquisitions.
Our results for 2014 , compared with 2013, reflect lower copper volumes and lower price realizations for copper and gold, offset by higher gold sales volumes and a full year of results from FCX Oil & Gas Inc. (FM O&G). Results for 2014 were also significantly impacted by impairment charges totaling $5.5 billion ( $4.0 billion to net loss attributable to common stockholders) related to ceiling test impairment charges for our oil and gas properties pursuant to full cost accounting rules and a goodwill impairment charge (refer to Notes 1 and 2). These charges were partly offset by a gain on the sale of Candelaria/Ojos and net noncash mark-to-market gains on oil and gas derivative contracts. Refer to "Consolidated Results" for discussion of items impacting our consolidated results for the three years ended December 31, 2014 .
At December 31, 2014 , we had $19.0 billion in total debt and $464 million in consolidated cash and cash equivalents. During 2014, we continued our efforts to manage debt by completing several transactions that will reduce future interest costs and defer debt maturities. We remain committed to a strong balance sheet and are taking aggressive actions to reduce or defer capital expenditures and other costs and have initiated efforts to obtain third-party funding for a significant portion of our oil and gas capital expenditures to maintain financial strength and flexibility in response to recent sharp declines in oil prices. In addition, we are monitoring copper markets and will be responsive to market conditions. As a first step, we have reduced budgeted 2015 capital expenditures, exploration and other costs by a total of $2 billion. We have a broad set of natural resource assets that provide many alternatives for future actions to enhance our financial flexibility. Additional capital cost reductions, potential additional divestitures or monetizations and other actions will be pursued as required to maintain a strong balance sheet while preserving a strong resource position and portfolio of assets with attractive long-term growth prospects.
OUTLOOK
We view the long-term outlook for our business positively, supported by limitations on supplies of copper and by the requirements for copper and oil in the world's economy. Our financial results vary as a result of fluctuations in market prices primarily for copper, gold, molybdenum and oil, as well as other factors. World market prices for these commodities have fluctuated historically and are affected by numerous factors beyond our control. Because we cannot control the price of our products, the key measures that management focuses on in operating our business are sales volumes, unit net cash costs for our mining operations, cash production costs per BOE for our oil and gas operations and consolidated operating cash flow. The outlook for each of these measures follows.
Sales Volumes. Following are our projected consolidated sales volumes for 2015 and actual consolidated sales volumes for 2014 :
| 2015 |
| 2014 |
| ||
| (Projected) |
| (Actual) |
| ||
Copper (millions of recoverable pounds): |
|
|
|
| ||
North America copper mines | 1,930 | |
| 1,664 | |
|
South America mining | 935 | |
| 1,135 | |
|
Indonesia mining | 960 | |
| 664 | |
|
Africa mining | 445 | |
| 425 | |
|
| 4,270 | |
| 3,888 | |
|
Gold (thousands of recoverable ounces): |
|
|
|
| ||
Indonesia mining | 1,285 | |
| 1,168 | |
|
North and South America mining | - | |
| 80 | |
|
| 1,285 | |
| 1,248 | |
|
Molybdenum (millions of recoverable pounds) | 95 | | a | 95 | |
|
Oil Equivalents (MMBOE) | 55.5 | |
| 56.8 | |
|
a. | Projected molybdenum sales include 47 million pounds produced at our molybdenum mines and 48 million pounds produced at our North and South America copper mines. |
69
Table of Contents
Projected sales volumes are dependent on a number of factors, including operational performance and other factors. For other important factors that could cause results to differ materially from projections, refer to "Cautionary Statement."
Mining Unit Net Cash Costs. Assuming average prices of $1,300 per ounce of gold and $9 per pound of molybdenum, and achievement of current sales volume and cost estimates, consolidated unit net cash costs (net of by-product credits) for our copper mining operations are expected to average $1.53 per pound in 2015 , compared with $1.51 per pound in 2014. Quarterly unit net cash costs vary with fluctuations in sales volumes and average realized prices (primarily gold and molybdenum prices). The impact of price changes in 2015 on consolidated unit net cash costs would approximate $0.015 per pound for each $50 per ounce change in the average price of gold and $0.02 per pound for each $2 per pound change in the average price of molybdenum. Refer to "Consolidated Results – Production and Delivery Costs" for further discussion of consolidated production costs for our mining operations.
Oil and Gas Cash Production Costs per BOE. Based on current sales volume and cost estimates, cash production costs are expected to approximate $18 per BOE for 2015 , compared with $20.08 per BOE in 2014. Refer to "Operations – Oil and Gas Operations" for further discussion of oil and gas production costs.
Consolidated Operating Cash Flow. Our consolidated operating cash flows vary with prices realized from copper, gold, molybdenum and oil sales, our sales volumes, production costs, income taxes and other working capital changes and other factors. Based on current sales volume and cost estimates and assuming average prices of $2.60 per pound of copper, $1,300 per ounce of gold, $9 per pound of molybdenum and $50 per barrel of Brent crude oil in 2015 , consolidated operating cash flows are estimated to approximate $4 billion (including $0.2 billion of net working capital sources and changes in other tax payments) in 2015 . First-quarter 2015 operating cash flows are expected to include net working capital uses and changes in other tax payments of approximately $0.6 billion. Projected consolidated operating cash flows for the year 2015 also reflect no tax provision (refer to "Consolidated Results – Provision for Income Taxes" for discussion of our projected annual consolidated effective tax rate for 2015 ). The impact of price changes in 2015 on consolidated operating cash flows would approximate $315 million for each $0.10 per pound change in the average price of copper, $40 million for each $50 per ounce change in the average price of gold, $135 million for each $2 per pound change in the average price of molybdenum and $115 million for each $5 per barrel change in the average Brent crude oil price.
70
Table of Contents
MARKETS
Metals. World prices for copper, gold and molybdenum can fluctuate significantly. During the period from January 2005 through January 2015, the London Metal Exchange (LME) spot copper price varied from a low of $1.26 per pound in 2008 to a record high of $4.60 per pound in 2011; the London Bullion Market Association (London) PM gold price fluctuated from a low of $411 per ounce in 2005 to a record high of $1,895 per ounce in 2011, and the Metals Week Molybdenum Dealer Oxide weekly average price ranged from a low of $7.83 per pound in 2009 to a high of $39.25 per pound in 2005. Copper, gold and molybdenum prices are affected by numerous factors beyond our control as described further in our "Risk Factors" contained in Part I, Item 1A of our Form 10-K for the year ended December 31, 2014 .
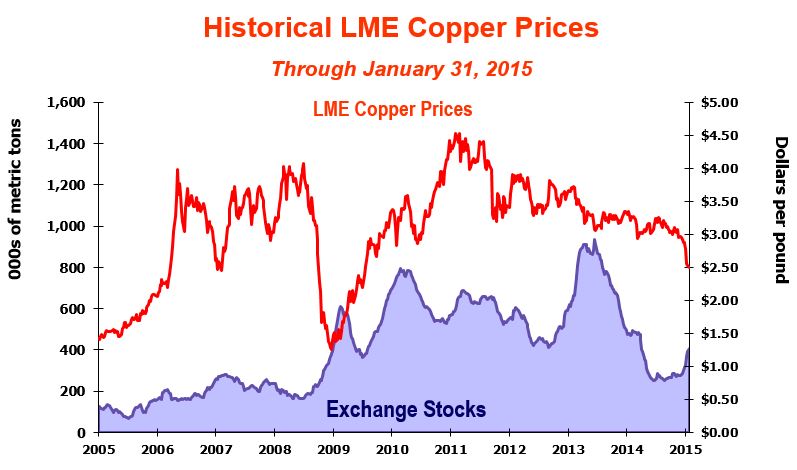
This graph presents LME spot copper prices and combined reported stocks of copper at the LME, Commodity Exchange Inc. (COMEX), a division of the New York Mercantile Exchange (NYMEX), and the Shanghai Futures Exchange from January 2005 through January 2015. From 2006 through most of 2008, limited supplies, combined with growing demand from China and other emerging economies, resulted in high copper prices and low levels of inventories. We believe current copper prices are supported by a combination of demand from developing economies and pro-growth monetary fiscal policy decisions in Europe, China and the U.S. Since mid-2014, copper prices have declined because of concerns about slowing growth rates in China, a stronger U.S. dollar and a broad-based decline in commodity prices, led by a sharp decline in oil prices. Copper prices have also come under pressure as financial investors take positions in the metal consistent with a view on declining global growth and the resulting general weak commodity prices. During 2014 , LME spot copper prices ranged from a low of $2.86 per pound to a high of $3.38 per pound, averaged $3.11 per pound and closed at $2.88 per pound on December 31, 2014 . The LME spot copper price closed at $2.59 per pound on February 20, 2015 .
We believe the underlying long-term fundamentals of the copper business remain positive, supported by the significant role of copper in the global economy and a challenging long-term supply environment attributable to difficulty in replacing existing large mines' output with new production sources. Future copper prices are expected to be volatile and are likely to be influenced by demand from China and emerging markets, as well as economic activity in the U.S. and other industrialized countries, the timing of the development of new supplies of copper and production levels of mines and copper smelters.
71
Table of Contents
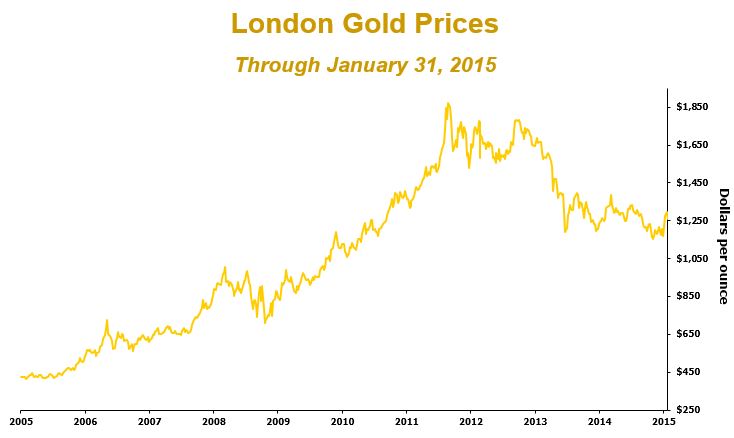
This graph presents London PM gold prices from January 2005 through January 2015. An improving economic outlook and positive global equity performance contributed to lower demand for gold in 2013 and 2014, resulting in generally lower prices. During 2014 , gold prices ranged from a low of $1,142 per ounce to a high of $1,385 per ounce, averaged $1,266 per ounce and closed at $1,199 per ounce on December 31, 2014 . Gold prices closed at $1,208 per ounce on February 20, 2015 .
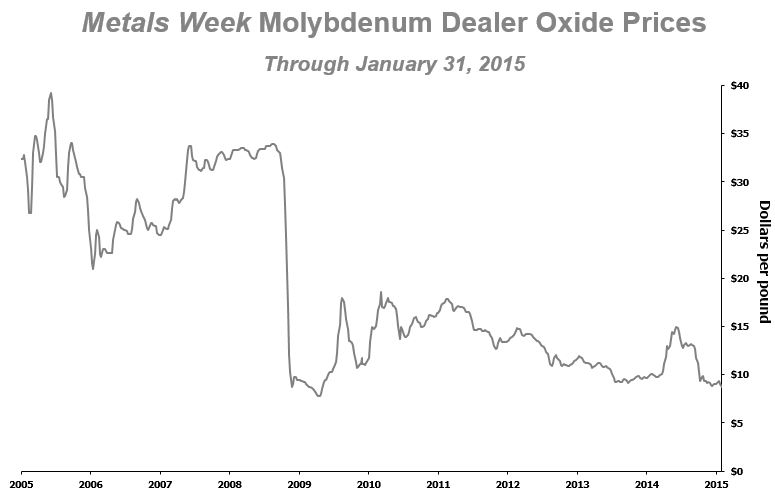
This graph presents the Metals Week Molybdenum Dealer Oxide weekly average price from January 2005 through January 2015. Molybdenum prices improved during most of 2014, resulting from improved demand in the metallurgical sector, but declined in fourth-quarter 2014 because of weaker demand from European steel and stainless steel producers. During 2014 , the weekly average price for molybdenum ranged from a low of $8.82 per pound to a high of $15.00 per pound, averaged $11.41 per pound and was $9.00 per pound on December 31, 2014 . The Metals Week Molybdenum Dealer Oxide weekly average price was $7.62 per pound on February 20, 2015 .
72
Table of Contents
Oil and Gas. Market prices for crude oil and natural gas can fluctuate significantly. During the period from January 2005 through January 2015, the Brent crude oil price ranged from a low of $36.61 per barrel to a high of $146.08 per barrel in 2008 and the NYMEX natural gas price fluctuated from a low of $2.04 per million British thermal units (MMBtu) in 2012 to a high of $13.91 per MMBtu in 2005. Crude oil and natural gas prices are affected by numerous factors beyond our control as described further in our "Risk Factors" contained in Part I, Item 1A of our Form 10-K for the year ended December 31, 2014 .
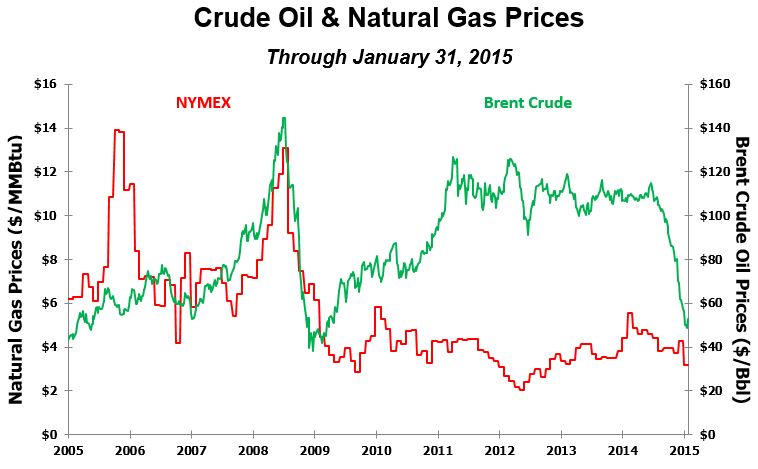
This graph presents Brent crude oil prices and NYMEX natural gas contract prices from January 2005 through January 2015. Crude oil prices reached a record high in July 2008 as economic growth in emerging economies and the U.S. created high global demand for oil and lower inventories. By the end of 2008, financial turmoil in the U.S. contributed to a global economic slowdown and a decline in many commodity prices. Crude oil prices rebounded after 2008, supported by a gradually improving global economy and demand outlook. Since mid-2014, oil prices have significantly declined associated with global oversupply primarily attributable to U.S. shale production and increased Brazilian and Libyan output, coupled with weak economic data in Europe and slowing Chinese demand. During 2014 , the Brent crude oil price ranged from a low of $57.33 per barrel to a high of $115.06 per barrel, averaged $99.45 per barrel and was $57.33 per barrel on December 31, 2014 . The Brent crude oil price was $60.22 per barrel on February 20, 2015 .
CRITICAL ACCOUNTING ESTIMATES
Management's Discussion and Analysis of Financial Condition and Results of Operations is based on our consolidated financial statements, which have been prepared in conformity with generally accepted accounting principles (GAAP) in the U.S. The preparation of these statements requires that we make estimates and assumptions that affect the reported amounts of assets, liabilities, revenues and expenses. We base these estimates on historical experience and on assumptions that we consider reasonable under the circumstances; however, reported results could differ from those based on the current estimates under different assumptions or conditions. The areas requiring the use of management's estimates are also discussed in Note 1 under the subheading "Use of Estimates." Management has reviewed the following discussion of its development and selection of critical accounting estimates with the Audit Committee of our Board of Directors (the Board).
73
Table of Contents
Mineral Reserves
Recoverable proven and probable reserves are the part of a mineral deposit that can be economically and legally extracted or produced at the time of the reserve determination. The determination of reserves involves numerous uncertainties with respect to the ultimate geology of the ore bodies, including quantities, grades and recovery rates. Estimating the quantity and grade of mineral reserves requires us to determine the size, shape and depth of our ore bodies by analyzing geological data, such as samplings of drill holes, tunnels and other underground workings. In addition to the geology of our mines, assumptions are required to determine the economic feasibility of mining these reserves, including estimates of future commodity prices and demand, the mining methods we use and the related costs incurred to develop and mine our reserves. Our estimates of recoverable proven and probable mineral reserves are prepared by and are the responsibility of our employees. A majority of these estimates are reviewed annually and verified by independent experts in mining, geology and reserve determination.
At December 31, 2014 , our consolidated estimated recoverable proven and probable reserves were determined using long-term average prices of $2.00 per pound for copper (consistent with the long-term average copper price used since December 31, 2010), $1,000 per ounce for gold and $10 per pound for molybdenum. The following table summarizes changes in our estimated consolidated recoverable proven and probable copper, gold and molybdenum reserves during 2014 and 2013 :
|
| Copper a (billion pounds) |
| Gold (million ounces) |
| Molybdenum (billion pounds) | |
Consolidated reserves at December 31, 2012 |
| 116.5 | |
| 32.5 |
| 3.42 |
Net additions/revisions |
| (1.2 | ) |
| - |
| (0.07) |
Production |
| (4.1 | ) |
| (1.2) |
| (0.09) |
Consolidated reserves at December 31, 2013 |
| 111.2 | |
| 31.3 |
| 3.26 |
Net additions/revisions |
| (0.1 | ) |
| (0.6) |
| (0.05) |
Production |
| (3.9 | ) |
| (1.2) |
| (0.10) |
Sale of Candelaria/Ojos |
| (3.7 | ) |
| (1.0) |
| - |
Consolidated reserves at December 31, 2014 |
| 103.5 | |
| 28.5 |
| 3.11 |
|
|
|
|
|
|
| |
a. | Includes estimated recoverable metals contained in stockpiles. See below for additional discussion of recoverable copper in stockpiles. |
Refer to Note 20 for further information regarding estimated recoverable proven and probable mineral reserves.
As discussed in Note 1 , we depreciate our life-of-mine mining and milling assets and values assigned to proven and probable mineral reserves using the unit-of-production (UOP) method based on our estimated recoverable proven and probable mineral reserves. Because the economic assumptions used to estimate mineral reserves may change from period to period and additional geological data is generated during the course of operations, estimates of reserves may change, which could have a significant impact on our results of operations, including changes to prospective depreciation rates and impairments of asset carrying values. Excluding impacts associated with changes in the levels of finished goods inventories and based on projected copper sales volumes for 2015 , if estimated copper reserves at our mines were 10 percent higher at December 31, 2014 , we estimate that our annual depreciation, depletion and amortization expense for 2015 would decrease by $59 million ($30 million to net income attributable to common stockholders), and a 10 percent decrease in copper reserves would increase depreciation, depletion and amortization expense by $77 million ($40 million to net income attributable to common stockholders). We perform annual assessments of our existing assets in connection with the review of mine operating and development plans. If it is determined that assigned asset lives do not reflect the expected remaining period of benefit, any change could affect prospective depreciation rates.
As discussed below and in Note 1 , we review and evaluate our long-lived assets for impairment when events or changes in circumstances indicate that the related carrying amount of such assets may not be recoverable, and changes to our estimates of recoverable proven and probable mineral reserves could have an impact on our assessment of asset recoverability.
Recoverable Copper in Stockpiles
We record, as inventory, applicable costs for copper contained in mill and leach stockpiles that are expected to be processed in the future based on proven processing technologies. Accounting for recoverable copper from mill and leach stockpiles represents a critical accounting estimate because (i) it is generally impracticable to determine
74
Table of Contents
copper contained in mill and leach stockpiles by physical count, thus requiring management to employ reasonable estimation methods and (ii) recovery rates from leach stockpiles can vary significantly. Refer to Note 1 for further discussion of our accounting policy for recoverable copper in stockpiles.
At December 31, 2014 , estimated consolidated recoverable copper was 3.6 billion pounds in leach stockpiles (with a carrying value of $3.6 billion ) and 0.9 billion pounds in mill stockpiles (with a carrying value of $446 million ), compared with 3.3 billion pounds in leach stockpiles (with a carrying value of $3.3 billion) and 1.4 billion pounds in mill stockpiles (with a carrying value of $789 million) at December 31, 2013.
Oil and Natural Gas Reserves
Proved reserves are those quantities of oil and natural gas, which, by analysis of geoscience and engineering data, can be estimated with reasonable certainty to be economically producible from a given date forward, from known reservoirs, and under existing economic conditions, operating methods and government regulations. The term "reasonable certainty" implies a high degree of confidence that the quantities of oil and natural gas actually recovered will equal or exceed the estimate. Engineering estimates of proved oil and natural gas reserves directly impact financial accounting estimates, including depreciation, depletion and amortization and the ceiling limitation under the full cost method. Estimates of total proved reserves are determined using methods prescribed by the U.S. Securities and Exchange Commission (SEC), which require the use of an average reference price calculated as the twelve-month average of the first-day-of-the-month historical market prices for crude oil and natural gas. At December 31, 2014, our estimates were based on reference prices of $94.99 per barrel (West Texas Intermediate) and $4.35 per MMBtu (Henry Hub spot natural gas) as adjusted for location and quality differentials, which are held constant throughout the lives of the oil and gas properties, except where such guidelines permit alternate treatment, including the use of fixed and determinable contractual price escalations, but excluding derivatives. Actual future prices and costs may be materially higher or lower than the average prices and costs as of the date of the estimate.
There are numerous uncertainties inherent in estimating quantities and values of proved oil and natural gas reserves and in projecting future rates of production and the amount and timing of development expenditures, including many factors beyond our control. Future development and abandonment costs are determined annually for each of our properties based upon its geographic location, type of production structure, water depth, reservoir depth and characteristics, currently available procedures and consultations with engineering consultants. Because these costs typically extend many years into the future, estimating these future costs is difficult and requires management to make judgments that are subject to future revisions based upon numerous factors, including changing technology and the political and regulatory environment. Reserve engineering is a subjective process of estimating the recovery from underground accumulations of oil and natural gas that cannot be measured in an exact manner and the accuracy of any reserve estimate is a function of the quality of available data and of engineering and geological interpretation and judgment. Because all reserve estimates are subjective, the quantities of oil and natural gas that are ultimately recovered, production and operating costs, the amount and timing of future development expenditures and future oil and natural gas sales prices may all differ from those assumed in our estimates.
Refer to Note 21 for further information regarding estimated proved oil and natural gas reserves.
The average amortization rate per BOE was $39.74 in 2014 and $35.54 for the period from June 1, 2013, to December 31, 2013. Our oil and gas depreciation, depletion and amortization rate for 2015, after the effect of the ceiling test impairments recorded in 2014, is expected to be $36.39 per BOE. Changes to estimates of proved reserves could result in changes to the prospective UOP amortization rate for our oil and gas properties, which could have a significant impact on our results of operations. Based on our estimated proved reserves and our net oil and gas properties subject to amortization at December 31, 2014, a 10 percent increase in our costs subject to amortization would increase our amortization rate by approximately $3.63 per BOE and a 10 percent reduction to proved reserves would increase our amortization rate by approximately $4.04 per BOE. Changes in estimates of proved oil and natural gas reserves may also affect our ceiling test calculation. Refer to Note 1 and "Impairment of Oil and Gas Properties" below for further discussion.
Impairment of Long-Lived Mining Assets
As discussed in Note 1 , we evaluate our long-lived mining assets for impairment when events or changes in circumstances indicate that the related carrying amount of such assets may not be recoverable. In evaluating our long-lived assets for recoverability, estimates of after-tax undiscounted future cash flows of our individual mining operations are used, with impairment losses measured by reference to fair value. As quoted market prices are unavailable for our individual mining operations, fair value is determined through the use of discounted estimated
75
Table of Contents
future cash flows. The estimated cash flows used to assess recoverability of our long-lived assets and measure fair value of our mining operations are derived from current business plans, which are developed using near-term price forecasts reflective of the current price environment and management's projections for long-term average metal prices. In addition to near- and long-term metal price assumptions, other key assumptions include commodity-based and other input costs; proven and probable reserves, including the timing and cost to develop and produce the reserves; and the use of appropriate escalation and discount rates. We believe our estimates and models used to determine fair value are similar to what a market participant would use.
Because the cash flows used to assess recoverability of our long-lived assets and measure fair value of our mining operations require us to make several estimates and assumptions that are subject to risk and uncertainty, changes in these estimates and assumptions could result in the impairment of our long-lived asset values. Events that could result in impairment of our long-lived assets include, but are not limited to, decreases in future metal prices, decreases in estimated recoverable proven and probable mineral reserves and any event that might otherwise have a material adverse effect on mine site production levels or costs.
Impairment of Oil and Gas Properties
As discussed in Note 1 , we follow the full cost method of accounting for our oil and gas operations, whereby all costs associated with oil and gas property acquisition, exploration and development activities are capitalized and amortized to expense under the UOP method on a country-by-country basis using estimates of proved oil and natural gas reserves relating to each country where such activities are conducted.
In evaluating our oil and gas properties for impairment, estimates of future cash flows are used (refer to Note 1 for further discussion of the ceiling test calculation). Additionally, SEC rules require that we price our future oil and gas production at the twelve-month average of the first-day-of-the-month historical reference prices adjusted for location and quality differentials. Such prices are utilized except where different prices are fixed and determinable from applicable contracts for the remaining term of those contracts excluding derivatives. The pricing in ceiling test impairment calculations required by full cost accounting may cause results that do not reflect current market conditions that exist at the end of an accounting period. For example, in periods of increasing oil and gas prices, the use of a twelve-month historical average price in the ceiling test calculation may result in an impairment. Conversely, in times of declining prices, ceiling test calculations may not result in an impairment.
At September 30, 2014, and December 31, 2014 , net capitalized costs with respect to FM O&G's proved U.S. oil and gas properties exceeded the ceiling amount specified by SEC full cost accounting rules, which resulted in the recognition of impairment charges totaling $3.7 billion ( $2.3 billion to net loss attributable to common stockholders) in 2014. The twelve-month average of the first-day-of-the-month historical reference oil price required to be used under SEC full cost accounting rules in determining the December 31, 2014, ceiling amount was $94.99 per barrel. Because the ceiling test limitation uses a twelve-month historical average price, if oil prices remain below the twelve-month 2014 average of $94.99 per barrel the ceiling limitation will decrease in 2015. In particular, the effect of weaker oil prices than the 2014 average is expected to result in significant additional ceiling test impairments of our oil and gas properties during 2015. Brent crude oil prices averaged $77.08 per barrel during fourth-quarter 2014 and were $57.33 per barrel at December 31, 2014, and $60.22 per barrel at February 20, 2015.
At December 31, 2014 , we also had $10.1 billion of costs for unproved oil and gas properties, which are excluded from amortization. These costs will be transferred into the amortization base (i.e., full cost pool) as the properties are evaluated and proved reserves are established or if impairment is determined. We assess our unproved properties at least annually, and if impairment is indicated, the cumulative drilling costs incurred to date for such property and all or a portion of the associated leasehold costs are transferred to the full cost pool and subject to amortization. Accordingly, an impairment of unproved properties does not immediately result in the recognition of a charge to the consolidated statements of income, but rather increases the costs subject to amortization and the costs subject to the ceiling limitation under the full cost accounting method. The transfer of costs into the amortization base involves a significant amount of judgment and may be subject to changes over time based on our drilling plans and results, geological and geophysical evaluations, the assignment of proved reserves, availability of capital and other factors.
Because the transfer of unevaluated property to the full cost pool requires significant judgment and the ceiling test used to evaluate impairment of our proved oil and gas properties requires us to make several estimates and assumptions that are subject to risk and uncertainty, changes in these estimates and assumptions could result in the impairment of our oil and gas properties. Events that could result in impairment of our oil and gas properties include, but are not limited to, decreases in future crude oil and natural gas prices, decreases in estimated proved
76
Table of Contents
oil and natural gas reserves, increases in production, development or abandonment costs and any event that might otherwise have a material adverse effect on our oil and gas production levels or costs.
Impairment of Goodwill
We account for business combinations using the acquisition method of accounting, which requires us to allocate the purchase price to the assets acquired and liabilities assumed based on their estimated fair values on the acquisition date. Determining the fair values of assets acquired and liabilities assumed requires management's judgment, the utilization of independent valuation experts, and often involves the use of significant estimates and assumptions, including future cash flows, discount rates and forward prices. The excess of acquisition consideration over the fair values of assets acquired and liabilities assumed is recorded as goodwill. In connection with our oil and gas acquisitions in 2013, we recorded goodwill, all of which was assigned to our U.S. oil and gas reporting unit.
Goodwill is required to be evaluated for impairment on at least an annual basis, or at any other time if events or circumstances indicate that its carrying amount may no longer be recoverable. During the fourth quarter of each year, we conduct a qualitative goodwill impairment assessment, which involves examining relevant events and circumstances which could have a negative impact on our goodwill such as macroeconomic conditions, industry and market conditions, cost factors that have a negative effect on earnings and cash flows, overall financial performance, dispositions and acquisitions, and any other relevant events or circumstances. After assessing the relevant events and circumstances for the qualitative impairment assessment during fourth-quarter 2014, including the significant decline in oil prices, we determined that performing a quantitative goodwill impairment test was necessary. These evaluations resulted in impairment charges totaling $1.7 billion ( $1.7 billion to net loss attributable to common stockholders) for the full carrying value of goodwill. Crude oil prices and our estimates of oil reserves at December 31, 2014, represent the most significant assumptions used in our evaluation of goodwill. Forward strip Brent oil prices used in our estimates as of December 31, 2014, ranged from approximately $62 per barrel to $80 per barrel for the years 2015 through 2021. Refer to Notes 1 and 2 for further discussion.
Environmental Obligations
Our current and historical operating activities are subject to various national, state and local environmental laws and regulations that govern the protection of the environment, and compliance with those laws requires significant expenditures. Environmental expenditures are expensed or capitalized, depending upon their future economic benefits. The guidance provided by U.S. GAAP requires that liabilities for contingencies be recorded when it is probable that obligations have been incurred and the cost can be reasonably estimated. At December 31, 2014 , environmental obligations recorded in our consolidated balance sheet totaled $1.2 billion , which reflect obligations for environmental liabilities attributed to the Comprehensive Environmental Response, Compensation, and Liability Act of 1980 (CERCLA) or analogous state programs and for estimated future costs associated with environmental matters. Refer to Notes 1 and 12 for further discussion of environmental obligations, including a summary of changes in our estimated environmental obligations for the three years ending December 31, 2014 .
Accounting for environmental obligations represents a critical accounting estimate because changes to environmental laws and regulations and/or circumstances affecting our operations could result in significant changes to our estimates, which could have a significant impact on our results of operations. We perform a comprehensive annual review of our environmental obligations and also review changes in facts and circumstances associated with these obligations at least quarterly. Judgments and estimates are based upon available facts, existing technology, presently enacted laws and regulations, remediation experience, whether or not we are a potentially responsible party (PRP), the ability of other PRPs to pay their allocated portions and take into consideration reasonably possible outcomes. Our cost estimates can change substantially as additional information becomes available regarding the nature or extent of site contamination, updated cost assumptions (including increases and decreases to cost estimates), changes in the anticipated scope and timing of remediation activities, the settlement of environmental matters, required remediation methods and actions by or against governmental agencies or private parties.
Asset Retirement Obligations
We record the fair value of our estimated asset retirement obligations (AROs) associated with tangible long-lived assets in the period incurred. Fair value is measured as the present value of cash flow estimates after considering inflation and a market risk premium. Our cost estimates are reflected on a third-party cost basis and comply with our legal obligation to retire tangible long-lived assets in the period incurred. These cost estimates may differ from financial assurance cost estimates for reclamation activities because of a variety of factors, including obtaining updated cost estimates for reclamation activities, the timing of reclamation activities, changes in scope and the exclusion of certain costs not considered reclamation and closure costs. At December 31, 2014 , AROs recorded in
77
Table of Contents
our consolidated balance sheet totaled $2.8 billion , including $1.1 billion associated with our oil and gas operations. Refer to Notes 1 and 12 for further discussion of reclamation and closure costs, including a summary of changes in our AROs for the three years ended December 31, 2014 .
Generally, ARO activities are specified by regulations or in permits issued by the relevant governing authority, and management judgment is required to estimate the extent and timing of expenditures. Accounting for AROs represents a critical accounting estimate because (i) we will not incur most of these costs for a number of years, requiring us to make estimates over a long period, (ii) reclamation and closure laws and regulations could change in the future and/or circumstances affecting our operations could change, either of which could result in significant changes to our current plans, (iii) the methods used or required to plug and abandon non-producing oil and gas wellbores, remove platforms, tanks, production equipment and flow lines, and restore the wellsite could change, (iv) calculating the fair value of our AROs requires management to estimate projected cash flows, make long-term assumptions about inflation rates, determine our credit-adjusted, risk-free interest rates and determine market risk premiums that are appropriate for our operations and (v) given the magnitude of our estimated reclamation, mine closure and wellsite abandonment and restoration costs, changes in any or all of these estimates could have a significant impact on our results of operations.
Taxes
In preparing our annual consolidated financial statements, we estimate the actual amount of income taxes currently payable or receivable as well as deferred income tax assets and liabilities attributable to temporary differences between the financial statement carrying amounts of existing assets and liabilities and their respective tax bases. Deferred income tax assets and liabilities are measured using enacted tax rates expected to apply to taxable income in the years in which these temporary differences are expected to be recovered or settled. The effect on deferred income tax assets and liabilities of a change in tax rates or laws is recognized in income in the period in which such changes are enacted.
Our operations are in multiple jurisdictions where uncertainties arise in the application of complex tax regulations. Some of these tax regimes are defined by contractual agreements with the local government, while others are defined by general tax laws and regulations. We and our subsidiaries are subject to reviews of our income tax filings and other tax payments, and disputes can arise with the taxing authorities over the interpretation of our contracts or laws. The final taxes paid may be dependent upon many factors, including negotiations with taxing authorities. In certain jurisdictions, we must pay a portion of the disputed amount to the local government in order to formally appeal the assessment. Such payment is recorded as a receivable if we believe the amount is collectible.
A valuation allowance is provided for those deferred income tax assets for which it is more likely than not that the related benefits will not be realized. In determining the amount of the valuation allowance, we consider estimated future taxable income as well as feasible tax planning strategies in each jurisdiction. If we determine that we will not realize all or a portion of our deferred income tax assets, we will increase our valuation allowance. Conversely, if we determine that we will ultimately be able to realize all or a portion of the related benefits for which a valuation allowance has been provided, all or a portion of the related valuation allowance will be reduced.
Our valuation allowances totaled $2.4 billion at December 31, 2014 , and covered a portion of our U.S. foreign tax credit carryforwards, foreign net operating loss carryforwards, U.S. state net operating loss carryforwards and U.S. state deferred tax assets. Valuation allowances totaled $2.5 billion at December 31, 2013 , and covered all of our U.S. foreign tax credit carryforwards, and a portion of our foreign net operating loss carryforwards, U.S. state net operating loss carryforwards, U.S. state deferred tax assets and U.S. capital loss carryforwards. Refer to Note 11 for further discussion.
78
Table of Contents
CONSOLIDATED RESULTS
| Years Ended December 31, |
| ||||||||||
| 2014 |
| 2013 a |
| 2012 |
| ||||||
SUMMARY FINANCIAL DATA | (in millions, except per share amounts) |
| ||||||||||
Revenues b | $ | 21,438 | | c,d | $ | 20,921 | | c,d | $ | 18,010 | | c |
Operating income b | $ | 97 | | c,d,e,f,g,h | $ | 5,351 | | c,d,g,h,i,j | $ | 5,814 | | c,g,h,i,j |
Net (loss) income attributable to common stockholders k | $ | (1,308 | ) | c,d,e,f,g,h,l,m | $ | 2,658 | | c,d,g,h,i,j,l,n | $ | 3,041 | | c,g,h,i,j,l,m |
Diluted net (loss) income per share attributable to common stockholders | $ | (1.26 | ) | c,d,e,f,g,h,l,m | $ | 2.64 | | c,d,g,h,i,j,l,n | $ | 3.19 | | c,g,h,i,j,l,m |
Diluted weighted-average common shares outstanding | 1,039 | |
| 1,006 | |
| 954 | |
| |||
Operating cash flows o | $ | 5,631 | |
| $ | 6,139 | |
| $ | 3,774 | |
|
Capital expenditures | $ | 7,215 | |
| $ | 5,286 | |
| $ | 3,494 | |
|
At December 31: |
|
|
|
|
|
| ||||||
Cash and cash equivalents | $ | 464 | |
| $ | 1,985 | |
| $ | 3,705 | |
|
Total debt, including current portion | $ | 18,970 | |
| $ | 20,706 | |
| $ | 3,527 | |
|
a. | Includes the results of FM O&G beginning June 1, 2013. |
| Years Ended December 31, | ||||||||||
Revenues | 2014 |
| 2013 |
| 2012 | ||||||
North America copper mines | $ | 5,616 | |
| $ | 5,183 | |
| $ | 5,486 | |
South America mining | 3,532 | |
| 4,485 | |
| 4,728 | | |||
Indonesia mining | 3,071 | |
| 4,087 | |
| 3,921 | | |||
Africa mining | 1,558 | |
| 1,637 | |
| 1,359 | | |||
Molybdenum mines | 587 | |
| 522 | |
| 529 | | |||
Rod & Refining | 4,655 | |
| 5,022 | |
| 5,016 | | |||
Atlantic Copper Smelting & Refining | 2,412 | |
| 2,041 | |
| 2,709 | | |||
U.S. oil & gas operations | 4,710 | |
| 2,616 | |
| - | | |||
Other mining, corporate, other & eliminations | (4,703 | ) |
| (4,672 | ) |
| (5,738 | ) | |||
Total revenues | $ | 21,438 | |
| $ | 20,921 | |
| $ | 18,010 | |
|
|
|
|
|
| ||||||
Operating income (loss) |
|
|
|
|
| ||||||
North America copper mines | $ | 1,698 | |
| $ | 1,506 | |
| $ | 2,204 | |
South America mining | 1,220 | |
| 2,063 | |
| 2,321 | | |||
Indonesia mining | 719 | |
| 1,420 | |
| 1,298 | | |||
Africa mining | 548 | |
| 625 | |
| 562 | | |||
Molybdenum mines | 167 | |
| 123 | |
| 150 | | |||
Rod & Refining | 12 | |
| 23 | |
| 14 | | |||
Atlantic Copper Smelting & Refining | (2 | ) |
| (75 | ) |
| 8 | | |||
U.S. oil & gas operations | (4,479 | ) |
| 450 | |
| - | | |||
Other mining, corporate, other & eliminations | 214 | |
| (784 | ) |
| (743 | ) | |||
Total operating income | $ | 97 | |
| $ | 5,351 | |
| $ | 5,814 | |
c. | Includes (unfavorable) favorable adjustments to provisionally priced concentrate and cathode sales recognized in prior periods totaling $(118) million ( $(65) million to net loss attributable to common stockholders or $(0.06) per share) in 2014 , $(26) million ( $(12) million to net income attributable to common stockholders or $(0.01) per share) in 2013 and $101 million ( $43 million to net income attributable to common stockholders or $0.05 per share) in 2012 . Refer to "Revenues" for further discussion. |
d. | Includes net noncash mark-to-market gains (losses) associated with crude oil and natural gas derivative contracts totaling $627 million ( $389 million to net loss attributable to common stockholders or $0.37 per share) in 2014 and $(312) million ( $(194) million to net income attributable to common stockholders or $(0.19) per share) for the seven-month period from June 1, 2013 , to December 31, 2013. Refer to "Revenues" for further discussion. |
e. | Includes charges of $3.7 billion ( $2.3 billion to net loss attributable to common stockholders or $2.24 per share) to reduce the carrying value of oil and gas properties pursuant to full cost accounting rules and a goodwill impairment charge of $1.7 billion ( $1.7 billion to net loss attributable to common stockholders or $1.65 per share) for the full carrying value of goodwill. |
f. | Includes gains of $717 million ( $481 million to net loss attributable to common stockholders or $0.46 per share) primarily from the sale of Candelaria/Ojos. |
79
Table of Contents
g. | Includes net (charges) credits for adjustments to environmental obligations and related litigation reserves totaling $(76) million ( $(50) million to net loss attributable to common stockholders or $(0.05) per share) in 2014 , $(19) million ( $(17) million to net income attributable to common stockholders or $(0.02) per share) in 2013 and $62 million ( $40 million to net income attributable to common stockholders or $0.04 per share) in 2012 . |
h. | The year 2014 includes charges totaling $37 million ( $23 million to net loss attributable to common stock or $0.02 per share) associated with early rig termination and inventory write offs at FCX's oil and gas operations . The year 2013 includes charges of (i) $76 million ( $49 million to net income attributable to common stockholders or $0.05 per share) associated with updated mine plans at Morenci that resulted in a loss in recoverable copper in leach stockpiles and (ii) $37 million ( $23 million to net income attributable to common stockholders or $0.02 per share) for restructuring an executive employment arrangement. The year 2012 includes a gain of $59 million ( $31 million to net income attributable to common stockholders or $0.03 per share) for the settlement of the insurance claim for business interruption and property damage relating to the 2011 incidents affecting PT-FI's concentrate pipelines. |
i. | Includes transaction and related costs totaling $80 million ( $50 million to net income attributable to common stockholders or $0.05 per share) in 2013 and $9 million ( $7 million to net income attributable to common stockholders or $0.01 per share) in 2012 principally associated with the oil and gas acquisitions. |
j. | Includes charges associated with new labor agreements totaling $36 million ( $13 million to net income attributable to common stockholders or $0.01 per share) at Cerro Verde in 2013 and $16 million ( $8 million to net income attributable to common stockholders or $0.01 per share) at Candelaria in 2012 . |
k. | We defer recognizing profits on intercompany sales until final sales to third parties occur. Refer to "Operations - Smelting & Refining" for a summary of net impacts from changes in these deferrals. |
l. | Includes net gains (losses) on early extinguishment of debt totaling $73 million ( $3 million to net loss attributable to common stockholders or less than $0.01 per share) in 2014 , $(35) million ( $(28) million to net income attributable to common stockholders or $(0.03) per share) in 2013 and $(168) million ( $(149) million to net income attributable to common stockholders or $(0.16) per share) in 2012 . Refer to Note 8 for further discussion. |
m. | The year 2014 includes a net tax charge of $103 million ( $0.10 per share) and the year 2012 includes a net tax credit of $98 million , net of noncontrolling interests ( $0.11 per share). Refer to Note 11 and "Provision for Income Taxes" below for further discussion of the net tax benefits (charges) impacting 2014 and 2012. |
n. | Includes gains associated with the oil and gas acquisitions, including (i) $199 million to net income attributable to common stockholders ( $0.20 per share) associated with net reductions in our deferred tax liabilities and deferred tax asset valuation allowances, and (ii) $ 128 million to net income attributable to common stockholders ($0.13 per share) related to our preferred stock investment in and the subsequent acquisition of McMoRan Exploration Co. Refer to Note 11 and "Provision for Income Taxes" below for further discussion. |
o. | Includes net working capital uses and changes in other tax payments of $632 million in 2014 , $377 million in 2013 and $1.4 billion in 2012 . |
80
Table of Contents
| Years Ended December 31, |
| ||||||||||
| 2014 |
| 2013 a |
| 2012 |
| ||||||
SUMMARY OPERATING DATA |
|
|
|
|
|
| ||||||
Copper (recoverable) |
|
|
|
|
|
| ||||||
Production (millions of pounds) | 3,904 | |
| 4,131 | |
| 3,663 | |
| |||
Sales, excluding purchases (millions of pounds) | 3,888 | |
| 4,086 | |
| 3,648 | |
| |||
Average realized price per pound | $ | 3.09 | |
| $ | 3.30 | |
| $ | 3.60 | |
|
Site production and delivery costs per pound b | $ | 1.90 | | c | $ | 1.88 | |
| $ | 2.00 | |
|
Unit net cash costs per pound b | $ | 1.51 | | c,d | $ | 1.49 | |
| $ | 1.48 | |
|
Gold (recoverable) |
|
|
|
|
|
| ||||||
Production (thousands of ounces) | 1,214 | |
| 1,250 | |
| 958 | |
| |||
Sales, excluding purchases (thousands of ounces) | 1,248 | |
| 1,204 | |
| 1,010 | |
| |||
Average realized price per ounce | $ | 1,231 | |
| $ | 1,315 | |
| $ | 1,665 | |
|
Molybdenum (recoverable) |
|
|
|
|
|
| ||||||
Production (millions of pounds) | 95 | |
| 94 | |
| 85 | |
| |||
Sales, excluding purchases (millions of pounds) | 95 | |
| 93 | |
| 83 | |
| |||
Average realized price per pound | $ | 12.74 | |
| $ | 11.85 | |
| $ | 14.26 | |
|
Oil Equivalents |
|
|
|
|
|
| ||||||
Sales volumes: |
|
|
|
|
|
| ||||||
MMBOE | 56.8 | |
| 38.1 | |
|
|
| ||||
Thousand BOE (MBOE) per day | 156 | |
| 178 | |
|
|
| ||||
Cash operating margin per BOE: e |
|
|
|
|
|
| ||||||
Realized revenues | $ | 71.83 | |
| $ | 76.87 | |
|
|
| ||
Cash production costs | 20.08 | |
| 17.14 | |
|
|
| ||||
Cash operating margin | $ | 51.75 | |
| $ | 59.73 | |
|
|
| ||
a. | Includes the results of FM O&G beginning June 1, 2013. |
b. | Reflects per pound weighted-average production and delivery costs and unit net cash costs (net of by-product credits) for all copper mines, excluding net noncash and other costs. For reconciliations of the per pound unit costs by operating division to production and delivery costs applicable to sales reported in our consolidated financial statements, refer to "Product Revenues and Production Costs." |
c. | Excludes $0.04 per pound of copper for fixed costs charged directly to cost of sales as a result of the impact of export restrictions on PT Freeport Indonesia's (PT-FI) operating rates. |
d. | Includes $0.03 per pound of copper for export duties and increased royalty rates at PT-FI. |
e. | Cash operating margin for oil and gas operations reflects realized revenues less cash production costs. Realized revenues exclude noncash mark-to-market adjustments on derivative contracts, and cash production costs exclude accretion and other costs. For reconciliations of realized revenues and cash production costs per BOE to revenues and production and delivery costs reported in our consolidated financial statements, refer to "Product Revenues and Production Costs." |
81
Table of Contents
Revenues
Consolidated revenues totaled $21.4 billion in 2014 , $20.9 billion in 2013 and $18.0 billion in 2012 . Revenues included the sale of copper concentrates, copper cathodes, copper rod, gold, molybdenum, silver, cobalt and beginning June 1, 2013, the sale of oil, natural gas and NGLs by our oil and gas operations. Our consolidated revenues for 2014 included sales of copper ( 60 percent ), oil ( 20 percent ), gold ( 7 percent ) and molybdenum ( 6 percent ). Following is a summary of changes in our consolidated revenues between periods (in millions):
| 2014 |
| 2013 |
| ||||
|
|
|
|
| ||||
Consolidated revenues - prior year | $ | 20,921 | |
| $ | 18,010 | |
|
Mining operations: |
|
|
|
| ||||
(Lower) higher sales volumes from mining operations: |
|
|
|
| ||||
Copper | (650 | ) |
| 1,576 | |
| ||
Gold | 58 | |
| 323 | |
| ||
Molybdenum | 17 | |
| 151 | |
| ||
(Lower) higher price realizations from mining operations: |
|
|
|
| ||||
Copper | (817 | ) |
| (1,226 | ) |
| ||
Gold | (105 | ) |
| (421 | ) |
| ||
Molybdenum | 84 | |
| (225 | ) |
| ||
Unfavorable impact of net adjustments for prior year provisionally priced copper sales | (92 | ) |
| (127 | ) |
| ||
(Lower) higher revenues from purchased copper | (361 | ) |
| 313 | |
| ||
Higher (lower) Atlantic Copper revenues | 371 | |
| (668 | ) |
| ||
Oil and gas operations: a |
|
|
|
| ||||
Higher oil and gas revenues, including realized cash losses on derivative contracts | 1,155 | |
| 2,928 | |
| ||
Favorable (unfavorable) impact of net noncash mark-to-market adjustments on derivative contracts | 939 | |
| (312 | ) |
| ||
Other, including intercompany eliminations | (82 | ) |
| 599 | |
| ||
Consolidated revenues - current year | $ | 21,438 | |
| $ | 20,921 | |
|
a. Includes the results of FM O&G beginning June 1, 2013.
Mining Sales Volumes
Consolidated sales volumes totaled 3.9 billion pounds of copper, 1.25 million ounces of gold and 95 million pounds of molybdenum in 2014 , 4.1 billion pounds of copper, 1.2 million ounces of gold and 93 million pounds of molybdenum in 2013 , and 3.65 billion pounds of copper, 1.0 million ounces of gold and 83 million pounds of molybdenum in 2012 . Lower consolidated copper sales volumes in 2014 , compared with 2013 , primarily reflected decreased volumes in Indonesia and South America, partly offset by higher volumes from our North America copper mines. Higher consolidated copper and gold sales volumes in 2013 , compared with 2012 , primarily reflected improved volumes throughout our global mining operations. Refer to "Operations" for further discussion of sales volumes at our operating divisions.
Metal Price Realizations
Our consolidated mining revenues can vary significantly as a result of fluctuations in the market prices of copper, gold, molybdenum, silver and cobalt. As presented above on the summary operating data table, we recognized lower copper and gold price realizations from our mining operations in 2014 , compared with 2013 , and also in 2013 , compared with 2012 . Refer to "Markets" for further discussion.
Provisionally Priced Sales
Impacts of net adjustments for prior year provisionally priced sales primarily relate to copper sales. Substantially all of our copper concentrate and cathode sales contracts provide final copper pricing in a specified future month (generally one to four months from the shipment date) based primarily on quoted LME monthly average spot copper prices (refer to "Disclosures About Market Risks-Commodity Price Risk" for further discussion). Revenues included (unfavorable) favorable net adjustments to prior years' provisionally prized copper sales totaling $(118) million in 2014 , $(26) million in 2013 and $101 million in 2012 .
82
Table of Contents
Purchased Copper
We purchased copper cathode for processing by our Rod & Refining segment totaling 125 million pounds in 2014, 223 million pounds in 2013 and 125 million pounds in 2012.
Atlantic Copper Revenues
Lower Atlantic Copper revenues in 2013 , compared with 2014 and 2012 , primarily reflected the impact of a major maintenance turnaround in 2013.
Oil & Gas Revenues and Derivative Contracts
Oil and gas sales volumes totaled 56.8 MMBOE in 2014 , and 38.1 MMBOE for the seven-month period from June 1, 2013, to December 31, 2013. Oil and gas realizations of $71.83 per BOE in 2014 were lower compared with $76.87 per BOE for the seven-month period from June 1, 2013, to December 31, 2013, primarily reflecting lower oil prices and higher realized cash losses on derivative contracts (realized cash losses totaled $122 million , or $2.15 per BOE in 2014, compared with $22 million , or $0.58 per BOE for the seven-month period from June 1, 2013, to December 31, 2013). Refer to "Operations" for further discussion of average realizations and sales volumes at our oil and gas operations.
In connection with the acquisition of Plains Exploration & Production Company (PXP), FCX has derivative contracts for 2015 consisting of crude oil options, and for 2013 and 2014, had derivative contracts that consisted of crude oil options and swaps and natural gas swaps. These crude oil and natural gas derivative contracts are not designated as hedging instruments; accordingly, they are recorded at fair value with the mark-to-market gains and losses recorded in revenues each period. Net credits (charges) to revenues for net noncash mark-to-market gains (losses) on crude oil and natural gas derivative contracts totaled $627 million in 2014 and $(312) million for the seven-month period from June 1, 2013, to December 31, 2013. Refer to Note 14 and "Disclosure About Market Risks - Commodity Price Risk" for further discussion of crude oil and natural gas derivative contracts.
Production and Delivery Costs
Consolidated production and delivery costs totaled $11.9 billion in 2014 , $11.8 billion in 2013 and $10.4 billion in 2012 . Higher production and delivery costs for 2014, compared with 2013, were primarily associated with our oil and gas operations, which included a full year of results for 2014, partly offset by lower costs for our mining operations mostly associated with lower volumes in South America and Indonesia. Higher consolidated production and delivery costs in 2013, compared with 2012, primarily reflected the addition of costs from our oil and gas operations and higher copper purchases.
Mining Unit Site Production and Delivery Costs
Site production and delivery costs for our copper mining operations primarily include labor, energy and commodity-based inputs, such as sulphuric acid, reagents, liners, tires and explosives. Consolidated unit site production and delivery costs (before net noncash and other costs) for our copper mining operations averaged $1.90 per pound of copper in 2014 , $1.88 per pound in 2013 and $2.00 per pound in 2012. Higher consolidated unit site production and delivery costs in 2014 , compared with 2013, primarily reflect the impact of lower copper sales volumes in South America and Indonesia, partly offset by higher volumes in North America. Consolidated production and delivery costs for 2014 also exclude fixed costs charged directly to cost of sales as a result of the impact of export restrictions on PT-FI's operating rates totaling $0.04 per pound of copper. Lower consolidated unit site production and delivery costs in 2013, compared with 2012, primarily reflects higher copper sales volumes in Indonesia and South America.
Assuming achievement of current 2015 volume and cost estimates, consolidated site production and delivery costs are expected to average $1.81 per pound of copper for 2015 . Refer to "Operations – Unit Net Cash Costs" for further discussion of unit net cash costs associated with our operating divisions, and to "Product Revenues and Production Costs" for reconciliations of per pound costs by operating division to production and delivery costs applicable to sales reported in our consolidated financial statements.
Our copper mining operations require significant energy, principally diesel, electricity, coal and natural gas, most of which is obtained from third parties under long-term contracts. Energy costs approximated 20 percent of our consolidated copper production costs in 2014 , including purchases of approximately 250 million gallons of diesel fuel; 7,600 gigawatt hours of electricity at our North America, South America and Africa copper mining operations (we generate all of our power at our Indonesia mining operation); 600 thousand metric tons of coal for our coal power plant in Indonesia; and 1 MMBtu of natural gas at certain of our North America mines. Based on current cost estimates, we estimate energy will approximate 16 percent of our consolidated copper production costs for 2015 .
83
Table of Contents
Oil and Gas Production Costs per BOE
Production costs for our oil and gas operations primarily include costs incurred to operate and maintain wells and related equipment and facilities, such as lease operating expenses, steam gas costs, electricity, production and ad valorem taxes, and gathering and transportation expenses. Cash production costs for our oil and gas operations of $20.08 per BOE were higher than $17.14 per BOE for the seven-month period from June 1, 2013, to December 31, 2013, primarily reflecting the sale of lower cost Eagle Ford properties in June 2014 and higher operating costs in California and the GOM.
Assuming achievement of current volume and cost estimates for 2015, cash production costs are expected to approximate $18 per BOE for the year 2015. Refer to "Operations" for further discussion of cash production costs at our oil and gas operations.
Depreciation, Depletion and Amortization
Depreciation will vary under the UOP method as a result of changes in sales volumes and the related UOP rates at our mining and oil and gas operations. Consolidated depreciation, depletion and amortization (DD&A) totaled $3.9 billion in 2014 , $2.8 billion in 2013 and $1.2 billion in 2012 . Higher DD&A in 2014 was primarily associated with a full year of expense for oil and gas operations ( $2.3 billion in 2014, compared with $1.4 billion for the seven-month period from June 1, 2013, to December 31, 2013). Higher DD&A in 2013, compared with 2012, primarily reflected the seven months of expense from our acquired oil and gas operations, and asset additions and higher production at our mining operations.
Impairment of Oil and Gas Properties
Under the full cost accounting rules, a "ceiling test" is conducted each quarter to review the carrying value of the oil and gas properties for impairment. At September 30, 2014, and December 31, 2014, net capitalized costs with respect to FM O&G's proved U.S. oil and gas properties exceeded the related ceiling limitation, which resulted in the recognition of impairment charges totaling $3.7 billion in 2014. Refer to Note 1 and "Critical Accounting Estimates - Impairment of Oil and Gas Properties" for further discussion.
Selling, General and Administrative Expenses
Consolidated selling, general and administrative expenses totaled $592 million in 2014 , $657 million in 2013 and $431 million in 2012 . Excluding amounts for our oil and gas operations, which totaled $207 million in 2014 and $120 million for the seven-month period from June 1, 2013, to December 31, 2013, selling, general and administrative expenses were lower in 2014, compared with 2013, primarily because of transaction and related costs totaling $80 million incurred during 2013 associated with the oil and gas acquisitions. Higher selling, general and administrative expenses in 2013, compared with 2012, primarily reflected the addition of costs associated with oil and gas operations, and transaction and related costs associated with the oil and gas acquisitions.
Consolidated selling, general and administrative expenses exclude capitalized general and administrative expenses at our oil and gas operations totaling $143 million in 2014 and $67 million for the seven-month period from June 1, 2013, to December 31, 2013.
Mining Exploration and Research Expenses
Consolidated exploration and research expenses for our mining operations totaled $126 million in 2014 , $210 million in 2013 and $285 million in 2012 . Our exploration activities are generally near our existing mines with a focus on opportunities to expand reserves and resources to support development of additional future production capacity in the large mineral districts where we currently operate. Exploration results continue to indicate opportunities for what we believe could be significant future potential reserve additions in North and South America, and in the Tenke minerals district. The drilling data in North America also continue to indicate the potential for significantly expanded sulfide production. Drilling results and exploration modeling in North America have identified large-scale potential sulfide resources in the Morenci and Safford/Lone Star districts, providing a long-term pipeline for future growth in reserves and production capacity in an established minerals district.
For the year 2015 , mining exploration and research expenditures are expected to total approximately $140 million , including approximately $100 million for exploration. As further discussed in Note 1, under the full cost method of accounting, exploration costs for our oil and gas operations are capitalized to oil and gas properties.
84
Table of Contents
Environmental Obligations and Shutdown Costs
Environmental obligation costs (credits) reflect net revisions to our long-term environmental obligations, which will vary from period to period because of changes to environmental laws and regulations, the settlement of environmental matters and/or circumstances affecting our operations that could result in significant changes in our estimates (refer to "Critical Accounting Estimates - Environmental Obligations" for further discussion). Shutdown costs include care and maintenance costs and any litigation, remediation or related expenditures associated with closed facilities or operations. Net charges (credits) for environmental obligations and shutdown costs totaled $119 million in 2014 , compared with $66 million in 2013 and $(22) million in 2012 . Refer to Note 12 for further discussion of environmental obligations and litigation matters.
Goodwill Impairment
We performed a goodwill assessment in fourth-quarter 2014, which resulted in an impairment charge of $1.7 billion for the full carrying value. Refer to Notes 1 and 2, and "Critical Accounting Estimates - Impairment of Goodwill" for further discussion.
Net Gain on Sales of Assets
Net gain on sales of assets totaled $717 million for the year 2014, primarily related to the sale of Candelaria/Ojos. Refer to Note 2 for further discussion.
Interest Expense, Net
Consolidated interest expense (excluding capitalized interest) totaled $866 million in 2014 , $692 million in 2013 and $267 million in 2012 . Increased interest expense in 2014 and 2013 was primarily associated with acquisition-related debt and assumed debt of PXP. Refer to Note 8 for further discussion.
Capitalized interest is related to the level of expenditures for our development projects and average interest rates on our borrowings, and totaled $236 million in 2014 , compared with $174 million in 2013 and $81 million in 2012 .
Net Gain (Loss) on Early Extinguishment of Debt
During 2014 , we recorded net gains on early extinguishment of debt totaling $73 million primarily related to the senior note redemptions and tender offers. During 2013 , we recorded net losses on early extinguishment of debt totaling $35 million associated with the termination of the bridge loan facilities for the oil and gas acquisitions, partly offset by a gain on the redemption of McMoRan Exploration Co.'s (MMR) remaining outstanding 11.875% Senior Notes. During 2012 , we recorded losses on early extinguishment of debt totaling $168 million associated with the redemption of our remaining 8.375% Senior Notes. Refer to Note 8 for further discussion of these transactions.
Gain on Investment in MMR
During 2013 , we recorded a gain totaling $128 million related to the carrying value of our preferred stock investment in and the subsequent acquisition of MMR. Refer to Note 2 for further discussion.
Provision for Income Taxes
Following is a summary of the approximate amounts used in the calculation of our consolidated provision for income taxes for the years ended December 31 (in millions, except percentages):
| 2014 |
| 2013 |
| ||||||||||||||||
| Income (Loss) a |
| Effective Tax Rate |
| Income Tax |
| Income a |
| Effective |
| Income Tax |
| ||||||||
U.S. | $ | 1,857 | |
| 30% |
| $ | (550 | ) | b,c | $ | 1,080 | |
| 23% |
| $ | (243 | ) |
|
South America | 1,221 | |
| 43% |
| (531 | ) | d | 2,021 | |
| 36% |
| (720 | ) |
| ||||
Indonesia | 709 | |
| 41% |
| (293 | ) |
| 1,370 | |
| 44% |
| (603 | ) |
| ||||
Africa | 379 | |
| 31% |
| (116 | ) |
| 425 | |
| 31% |
| (131 | ) |
| ||||
Impairment of oil and gas properties | (3,737 | ) |
| 38% |
| 1,413 | |
| - | |
| N/A |
| - | |
| ||||
Gain on sale of Candelaria/Ojos | 671 | |
| 33% |
| (221 | ) |
| - | |
| N/A |
| - | |
| ||||
Eliminations and other | 193 | |
| N/A |
| (26 | ) |
| 17 | |
| N/A |
| 23 | |
| ||||
| 1,293 | |
| 25% | g | (324 | ) |
| 4,913 | |
| 34% |
| (1,674 | ) |
| ||||
Adjustments | (1,717 | ) | e | N/A |
| - | |
| - | |
| N/A |
| 199 | | f | ||||
Consolidated FCX | $ | (424 | ) |
| (76)% |
| $ | (324 | ) |
| $ | 4,913 | |
| 30% |
| $ | (1,475 | ) |
|
a. | Represents income (loss) by geographic location before income taxes and equity in affiliated companies' net earnings. |
85
Table of Contents
b. | Includes an $84 million charge for deferred taxes recorded in connection with the allocation of goodwill to the sale of Eagle Ford properties. |
c. | Includes a net benefit of $41 million , comprised of $57 million related to changes in U.S. state income tax filing positions, partly offset by a charge of $16 million for a change in U.S. federal income tax law. |
d. | Includes charges related to changes in Chilean and Peruvian tax rules totaling $78 million ( $60 million net of noncontrolling interests). |
e. | Reflects goodwill impairment charges, which were non-deductible for tax purposes. |
f. | Reflects net reductions in our deferred tax liabilities and deferred tax asset valuation allowances resulting from the oil and gas acquisitions. |
g. | Our consolidated effective income tax rate is a function of the combined effective tax rates for the jurisdictions in which we conduct operations. Accordingly, variations in the relative proportions of jurisdictional income result in fluctuations to our consolidated effective income tax rate. Assuming average prices of $2.60 per pound for copper, $1,300 per ounce for gold, $9 per pound for molybdenum and Brent crude oil of $50 per barrel for the year ended 2015 and achievement of current sales volume and cost estimates, we estimate no tax provision for 2015. The effective tax rate at $3.00 per pound of copper and $65 per barrel of Brent crude oil for 2015, would approximate 30 percent . |
Following is a summary of the approximate amounts used in the calculation of our consolidated provision for income taxes for the year ended December 31 (in millions, except percentages):
| 2012 |
| ||||||||
| Income a |
| Effective |
| Income Tax |
| ||||
U.S. | $ | 1,571 | |
| 23% |
| $ | (357 | ) |
|
South America | 2,211 | |
| 36% |
| (791 | ) | b | ||
Indonesia | 1,287 | |
| 39% |
| (497 | ) |
| ||
Africa | 357 | |
| 31% |
| (112 | ) |
| ||
Eliminations and other | 61 | |
| N/A |
| 13 | |
| ||
| 5,487 | |
| 32% |
| (1,744 | ) |
| ||
Adjustments | - | |
| N/A |
| 234 | | c | ||
Consolidated FCX | $ | 5,487 | |
| 28% |
| $ | (1,510 | ) |
|
a. | Represents income by geographic location before income taxes and equity in affiliated companies' net earnings. |
b. | Cerro Verde signed a new 15-year mining stability agreement with the Peruvian government, which became effective January 1, 2014. In connection with the new mining stability agreement, Cerro Verde's income tax rate increased from 30 percent to 32 percent, and we recognized additional deferred tax expense of $29 million ( $25 million net of noncontrolling interests) in 2012. |
c. | Reflects the reversal of a net deferred tax liability totaling $234 million ( $123 million of noncontrolling interest) related to reinvested profits at Cerro Verde that were not distributed prior to expiration of its 1998 stability agreement on December 31, 2013. |
Refer to Note 11 for further discussion of income taxes.
OPERATIONS
North America Copper Mines
We operate seven open-pit copper mines in North America – Morenci, Bagdad, Safford, Sierrita and Miami in Arizona, and Chino and Tyrone in New Mexico. All of the North America mining operations are wholly owned, except for Morenci. We record our 85 percent interest in the Morenci unincorporated joint venture using the proportionate consolidation method.
The North America copper mines include open-pit mining, sulfide ore concentrating, leaching and solution extraction/electrowinning (SX/EW) operations. A majority of the copper produced at our North America copper mines is cast into copper rod by our Rod & Refining segment. The remainder of our North America copper sales is in the form of copper cathode or copper concentrate, a portion of which is shipped to Atlantic Copper (our wholly owned smelter). Molybdenum concentrate and silver are also produced by certain of our North America copper mines .
86
Table of Contents
Operating and Development Activities. We have increased production from our North America copper mines by approximately 50 percent over the past five years and continue to evaluate a number of opportunities to add production capacity following positive exploration results. Future investments will be undertaken based on the results of economic and technical feasibility studies and market conditions.
Morenci Mill Expansion. At Morenci, the mill expansion project commenced operations in May 2014 and is expected to achieve full rates in first-quarter 2015. The project targets average incremental annual production of approximately 225 million pounds of copper through an increase in milling rates from 50,000 metric tons of ore per day to approximately 115,000 metric tons of ore per day. Morenci's mill rates averaged 100,900 metric tons per day in fourth-quarter 2014. Morenci's copper production is expected to average over 900 million pounds per year over the next five years, compared with 691 million pounds in 2014.
Construction of the expanded Morenci milling facility is substantially complete. Remaining items include completion of the molybdenum circuit, which adds capacity of approximately 9 million pounds of molybdenum per year, and the construction of an expanded tailings storage facility. Both are expected to be completed in 2015. At December 31, 2014, approximately $1.6 billion had been incurred for the Morenci mill expansion project ( $0.6 billion during 2014 ), with approximately $55 million remaining to be incurred.
Operating Data. Following is summary operating data for the North America copper mines for the years ended December 31:
| 2014 |
| 2013 |
| 2012 | ||||||
Operating Data, Net of Joint Venture Interest |
|
|
|
|
| ||||||
Copper (recoverable) |
|
|
|
|
| ||||||
Production (millions of pounds) | 1,670 | |
| 1,431 | |
| 1,363 | | |||
Sales, excluding purchases (millions of pounds) | 1,664 | |
| 1,422 | |
| 1,351 | | |||
Average realized price per pound | $ | 3.13 | |
| $ | 3.36 | |
| $ | 3.64 | |
|
|
|
|
|
| ||||||
Molybdenum (millions of recoverable pounds) |
|
|
|
|
| ||||||
Production a | 33 | |
| 32 | |
| 36 | | |||
|
|
|
|
|
| ||||||
100% Operating Data |
|
|
|
|
| ||||||
SX/EW operations |
|
|
|
|
| ||||||
Leach ore placed in stockpiles (metric tons per day) | 1,005,300 | |
| 1,003,500 | |
| 998,600 | | |||
Average copper ore grade (percent) | 0.25 | |
| 0.22 | |
| 0.22 | | |||
Copper production (millions of recoverable pounds) | 963 | |
| 889 | |
| 866 | | |||
|
|
|
|
|
| ||||||
Mill operations |
|
|
|
|
| ||||||
Ore milled (metric tons per day) | 273,800 | |
| 246,500 | |
| 239,600 | | |||
Average ore grade (percent): |
|
|
|
|
| ||||||
Copper | 0.45 | |
| 0.39 | |
| 0.37 | | |||
Molybdenum | 0.03 | |
| 0.03 | |
| 0.03 | | |||
Copper recovery rate (percent) | 85.8 | |
| 85.3 | |
| 83.9 | | |||
Copper production (millions of recoverable pounds) | 828 | |
| 642 | |
| 592 | | |||
a. | Refer to "Consolidated Results" for our consolidated molybdenum sales volumes, which includes sales of molybdenum produced at the North America copper mines. |
2014 Compared with 2013
Copper sales volumes from our North America copper mines increased to 1.66 billion pounds in 2014 , compared with 1.42 billion pounds in 2013 , primarily reflecting higher mining and milling rates at Morenci and higher ore grades at Chino.
Copper sales from North America are expected to approximate 1.9 billion pounds in 2015 as a result of higher mill rates from the Morenci expansion. Refer to "Outlook" for projected molybdenum sales volumes.
87
Table of Contents
2013 Compared with 2012
Copper sales volumes from our North America copper mines increased to 1.42 billion pounds in 2013 , compared with 1.35 billion pounds in 2012 , primarily because of higher mining and milling rates, higher copper ore grades and higher recovery rates.
Unit Net Cash Costs. Unit net cash costs per pound of copper is a measure intended to provide investors with information about the cash-generating capacity of our mining operations expressed on a basis relating to the primary metal product for our respective operations. We use this measure for the same purpose and for monitoring operating performance by our mining operations. This information differs from measures of performance determined in accordance with U.S. GAAP and should not be considered in isolation or as a substitute for measures of performance determined in accordance with U.S. GAAP. This measure is presented by other metals mining companies, although our measure may not be comparable to similarly titled measures reported by other companies.
Gross Profit per Pound of Copper and Molybdenum
The following tables summarize unit net cash costs and gross profit per pound at our North America copper mines for the years ended December 31. Refer to "Product Revenues and Production Costs" for an explanation of the "by-product" and "co-product" methods and a reconciliation of unit net cash costs per pound to production and delivery costs applicable to sales reported in our consolidated financial statements.
| 2014 |
| 2013 | ||||||||||||||||||||
| By- |
| Co-Product Method |
| By- |
| Co-Product Method | ||||||||||||||||
| Product Method |
| Copper |
| Molyb- denum a |
| Product Method |
| Copper |
| Molyb- denum a | ||||||||||||
Revenues, excluding adjustments | $ | 3.13 | |
| $ | 3.13 | |
| $ | 11.52 | |
| $ | 3.36 | |
| $ | 3.36 | |
| $ | 10.79 | |
Site production and delivery, before net noncash |
|
|
|
|
|
|
|
|
|
|
| ||||||||||||
and other costs shown below | 1.85 | |
| 1.81 | |
| 2.74 | |
| 2.00 | |
| 1.94 | |
| 3.79 | | ||||||
By-product credits | (0.24 | ) |
| - | |
| - | |
| (0.24 | ) |
| - | |
| - | | ||||||
Treatment charges | 0.12 | |
| 0.12 | |
| - | |
| 0.11 | |
| 0.11 | |
| - | | ||||||
Unit net cash costs | 1.73 | |
| 1.93 | |
| 2.74 | |
| 1.87 | |
| 2.05 | |
| 3.79 | | ||||||
Depreciation, depletion and amortization | 0.29 | |
| 0.28 | |
| 0.14 | |
| 0.28 | |
| 0.27 | |
| 0.22 | | ||||||
Noncash and other costs, net | 0.09 | |
| 0.09 | |
| 0.03 | |
| 0.14 | | b | 0.14 | |
| 0.04 | | ||||||
Total unit costs | 2.11 | |
| 2.30 | |
| 2.91 | |
| 2.29 | |
| 2.46 | |
| 4.05 | | ||||||
Revenue adjustments, primarily for pricing on prior period open sales | - | |
| - | |
| - | |
| - | |
| - | |
| - | | ||||||
Gross profit per pound | $ | 1.02 | |
| $ | 0.83 | |
| $ | 8.61 | |
| $ | 1.07 | |
| $ | 0.90 | |
| $ | 6.74 | |
|
|
|
|
|
|
|
|
|
|
|
| ||||||||||||
Copper sales (millions of recoverable pounds) | 1,657 | |
| 1,657 | |
|
|
| 1,416 | |
| 1,416 | |
|
| ||||||||
Molybdenum sales (millions of recoverable pounds) a |
|
|
|
| 33 | |
|
|
|
|
| 32 | | ||||||||||
a. | Reflects sales of molybdenum produced by certain of the North America copper mines to our molybdenum sales company at market-based pricing. |
b. | Includes $76 million ($0.05 per pound) associated with updated mine plans at Morenci that resulted in a loss in recoverable copper in leach stockpiles. |
Our North America copper mines have varying cost structures because of differences in ore grades and characteristics, processing costs, by-product credits and other factors. During 2014 , average unit net cash costs (net of by-product credits) for the North America copper mines ranged from $1.24 per pound to $2.32 per pound at the individual mines and averaged $1.73 per pound. Lower average unit net cash costs (net of by-product credits) in 2014 , compared with $1.87 per pound in 2013 , primarily reflected higher copper sales volumes.
Because certain assets are depreciated on a straight-line basis, North America's average unit depreciation rate may vary with asset additions and the level of copper production and sales.
Assuming achievement of current sales volume and cost estimates and an average price of $9 per pound of molybdenum for 2015 , average unit net cash costs (net of by-product credits) for our North America copper mines are expected to approximate $1.67 per pound of copper in 2015 . North America's average unit net cash costs for 2015 would change by approximately $0.04 per pound for each $2 per pound change in the average price of molybdenum during 2015 .
88
Table of Contents
| 2013 |
| 2012 | ||||||||||||||||||||
| By- |
| Co-Product Method |
| By- |
| Co-Product Method | ||||||||||||||||
| Product Method |
| Copper |
| Molyb- denum a |
| Product Method |
| Copper |
| Molyb- denum a | ||||||||||||
Revenues, excluding adjustments | $ | 3.36 | |
| $ | 3.36 | |
| $ | 10.79 | |
| $ | 3.64 | |
| $ | 3.64 | |
| $ | 13.00 | |
Site production and delivery, before net noncash |
|
|
|
|
|
|
|
|
|
|
| ||||||||||||
and other costs shown below | 2.00 | |
| 1.94 | |
| 3.79 | |
| 1.91 | |
| 1.75 | |
| 6.32 | | ||||||
By-product credits | (0.24 | ) |
| - | |
| - | |
| (0.36 | ) |
| - | |
| - | | ||||||
Treatment charges | 0.11 | |
| 0.11 | |
| - | |
| 0.12 | |
| 0.11 | |
| - | | ||||||
Unit net cash costs | 1.87 | |
| 2.05 | |
| 3.79 | |
| 1.67 | |
| 1.86 | |
| 6.32 | | ||||||
Depreciation, depletion and amortization | 0.28 | |
| 0.27 | |
| 0.22 | |
| 0.26 | |
| 0.24 | |
| 0.48 | | ||||||
Noncash and other costs, net | 0.14 | | b | 0.14 | |
| 0.04 | |
| 0.10 | |
| 0.10 | |
| 0.09 | | ||||||
Total unit costs | 2.29 | |
| 2.46 | |
| 4.05 | |
| 2.03 | |
| 2.20 | |
| 6.89 | | ||||||
Revenue adjustments, primarily for pricing on prior period open sales | - | |
| - | |
| - | |
| 0.01 | |
| 0.01 | |
| - | | ||||||
Gross profit per pound | $ | 1.07 | |
| $ | 0.90 | |
| $ | 6.74 | |
| $ | 1.62 | |
| $ | 1.45 | |
| $ | 6.11 | |
|
|
|
|
|
|
|
|
|
|
|
| ||||||||||||
Copper sales (millions of recoverable pounds) | 1,416 | |
| 1,416 | |
|
|
| 1,347 | |
| 1,347 | |
|
| ||||||||
Molybdenum sales (millions of recoverable pounds) a |
|
|
|
| 32 | |
|
|
|
|
| 36 | | ||||||||||
a. | Reflects sales of molybdenum produced by certain of the North America copper mines to our molybdenum sales company at market-based pricing. |
b. | Includes $76 million ($0.05 per pound) associated with updated mine plans at Morenci that resulted in a loss in recoverable copper in leach stockpiles. |
Unit net cash costs (net of by-product credits) for our North America copper mines increased to $1.87 per pound of copper in 2013 , compared with $1.67 per pound in 2012 , primarily reflecting lower molybdenum credits and increased mining and milling activities, partly offset by higher copper sales volumes.
South America Mining
We operate two copper mines in South America – Cerro Verde in Peru (in which we own a 53.56 percent interest) and El Abra in Chile (in which we own a 51 percent interest). All operations in South America are consolidated in our financial statements.
On November 3, 2014, we completed the sale of our 80 percent ownership interests in Candelaria/Ojos for $1.8 billion in cash. Refer to Note 2 for further discussion.
South America mining includes open-pit mining, sulfide ore concentrating, leaching and SX/EW operations. Production from our South America mines is sold as copper concentrate or copper cathode under long-term contracts. Our South America mines also ship a portion of their copper concentrate inventories to Atlantic Copper. In addition to copper, the Cerro Verde mine produces molybdenum concentrates and silver.
Operating and Development Activities.
Cerro Verde Expansion. Construction activities associated with a large-scale expansion at Cerro Verde are advancing toward completion in late 2015. Detailed engineering and major procurement activities are complete and construction progress is more than 50 percent complete. The project will expand the concentrator facilities from 120,000 metric tons of ore per day to 360,000 metric tons of ore per day and provide incremental annual production of approximately 600 million pounds of copper and 15 million pounds of molybdenum beginning in 2016. As of December 31, 2014 , $3.1 billion had been incurred for this project ($1.6 billion during 2014 ), with approximately $1.5 billion remaining to be incurred.
El Abra Sulfide. We continue to evaluate a potential large-scale milling operation at El Abra to process additional sulfide material and to achieve higher recoveries. Exploration results in recent years at El Abra indicate a significant sulfide resource, which could potentially support a major mill project. Future investments will be dependent on technical studies, economic factors and global copper market conditions.
89
Table of Contents
Operating Data. Following is summary operating data for our South America mining operations for the years ended December 31.
| 2014 a |
| 2013 |
| 2012 | ||||||
Copper (recoverable) |
|
|
|
|
| ||||||
Production (millions of pounds) | 1,151 | |
| 1,323 | |
| 1,257 | | |||
Sales (millions of pounds) | 1,135 | |
| 1,325 | |
| 1,245 | | |||
Average realized price per pound | $ | 3.08 | |
| $ | 3.30 | |
| $ | 3.58 | |
|
|
|
|
|
| ||||||
Gold (recoverable) |
|
|
|
|
| ||||||
Production (thousands of ounces) | 72 | |
| 101 | |
| 83 | | |||
Sales (thousands of ounces) | 67 | |
| 102 | |
| 82 | | |||
Average realized price per ounce | $ | 1,271 | |
| $ | 1,350 | |
| $ | 1,673 | |
|
|
|
|
|
| ||||||
Molybdenum (millions of recoverable pounds) |
|
|
|
|
| ||||||
Production b | 11 | |
| 13 | |
| 8 | | |||
|
|
|
|
|
| ||||||
SX/EW operations |
|
|
|
|
| ||||||
Leach ore placed in stockpiles (metric tons per day) | 275,200 | |
| 274,600 | |
| 229,300 | | |||
Average copper ore grade (percent) | 0.48 | |
| 0.50 | |
| 0.55 | | |||
Copper production (millions of recoverable pounds) | 491 | |
| 448 | |
| 457 | | |||
|
|
|
|
|
| ||||||
Mill operations |
|
|
|
|
| ||||||
Ore milled (metric tons per day) | 180,500 | |
| 192,600 | |
| 191,400 | | |||
Average ore grade: |
|
|
|
|
| ||||||
Copper (percent) | 0.54 | |
| 0.65 | |
| 0.60 | | |||
Gold (grams per metric ton) | 0.10 | |
| 0.12 | |
| 0.10 | | |||
Molybdenum (percent) | 0.02 | |
| 0.02 | |
| 0.02 | | |||
Copper recovery rate (percent) | 88.1 | |
| 90.9 | |
| 90.1 | | |||
Copper production (millions of recoverable pounds) | 660 | |
| 875 | |
| 800 | | |||
a. | Includes the results of Candelaria/Ojos through November 3, 2014. |
b. | Refer to "Consolidated Results" for our consolidated molybdenum sales volumes, which includes sales of molybdenum produced at Cerro Verde. |
2014 Compared with 2013
Consolidated copper sales volumes from South America totaled 1.14 billion pounds in 2014 , compared with 1.33 billion in 2013 , primarily reflecting anticipated lower ore grades at Candelaria and Cerro Verde, and the sale of Candelaria/Ojos in November 2014.
For the year 2015, consolidated sales volumes from South America mines are expected to approximate 0.9 billion pounds of copper. Refer to "Outlook" for projected gold and molybdenum sales volumes.
2013 Compared with 2012
Copper sales volumes from our South America mining operations totaled 1.33 billion pounds in 2013 , compared with 1.25 billion pounds in 2012 , primarily reflecting higher ore grades at Candelaria, partly offset by lower ore grades at Cerro Verde.
Unit Net Cash Costs. Unit net cash costs per pound of copper is a measure intended to provide investors with information about the cash-generating capacity of our mining operations expressed on a basis relating to the primary metal product for our respective operations. We use this measure for the same purpose and for monitoring operating performance by our mining operations. This information differs from measures of performance determined in accordance with U.S. GAAP and should not be considered in isolation or as a substitute for measures of performance determined in accordance with U.S. GAAP. This measure is presented by other metals mining companies, although our measure may not be comparable to similarly titled measures reported by other companies.
90
Table of Contents
Gross Profit per Pound of Copper
The following tables summarize unit net cash costs and gross profit per pound at our South America mining operations for the years ended December 31. Unit net cash costs per pound of copper are reflected under the by-product and co-product methods as the South America mining operations also had small amounts of molybdenum, gold and silver sales. Refer to "Product Revenues and Production Costs" for an explanation of the "by-product" and "co-product" methods and a reconciliation of unit net cash costs per pound to production and delivery costs applicable to sales reported in our consolidated financial statements.
| 2014 a |
| 2013 | ||||||||||||
| By-Product Method |
| Co-Product Method |
| By-Product Method |
| Co-Product Method | ||||||||
Revenues, excluding adjustments | $ | 3.08 | |
| $ | 3.08 | |
| $ | 3.30 | |
| $ | 3.30 | |
Site production and delivery, before net noncash |
|
|
|
|
|
|
| ||||||||
and other costs shown below | 1.62 | |
| 1.50 | |
| 1.53 | | b | 1.42 | | ||||
By-product credits | (0.22 | ) |
| - | |
| (0.27 | ) |
| - | | ||||
Treatment charges | 0.17 | |
| 0.17 | |
| 0.17 | |
| 0.17 | | ||||
Royalty on metals | 0.01 | |
| 0.01 | |
| - | |
| - | | ||||
Unit net cash costs | 1.58 | |
| 1.68 | |
| 1.43 | |
| 1.59 | | ||||
Depreciation, depletion and amortization | 0.32 | |
| 0.30 | |
| 0.26 | |
| 0.24 | | ||||
Noncash and other costs, net | 0.06 | |
| 0.07 | |
| 0.04 | |
| 0.03 | | ||||
Total unit costs | 1.96 | |
| 2.05 | |
| 1.73 | |
| 1.86 | | ||||
Revenue adjustments, primarily for pricing on |
|
|
|
|
|
|
| ||||||||
prior period open sales | (0.05 | ) |
| (0.05 | ) |
| (0.03 | ) |
| (0.03 | ) | ||||
Gross profit per pound | $ | 1.07 | |
| $ | 0.98 | |
| $ | 1.54 | |
| $ | 1.41 | |
|
|
|
|
|
|
|
| ||||||||
Copper sales (millions of recoverable pounds) | 1,135 | |
| 1,135 | |
| 1,325 | |
| 1,325 | | ||||
a. | Includes the results of Candelaria/Ojos through November 3, 2014. |
b. | Includes labor agreement costs totaling $36 million ($0.03 per pound) at Cerro Verde. |
Our South America mines have varying cost structures because of differences in ore grades and characteristics, processing costs, by-products and other factors. During 2014 , unit net cash costs (net of by-product credits) for the South America mines ranged from $1.47 per pound to $1.96 per pound at the individual mines and averaged $1.58 per pound. Average unit net cash costs (net of by-product credits) for our South America mining operations increased to $1.58 per pound of copper in 2014 , compared with $1.43 per pound in 2013 , primarily reflecting lower sales volumes and by-product credits.
Because certain assets are depreciated on a straight-line basis, South America's unit depreciation rate may vary with asset additions and the level of copper production and sales. The increase in unit depreciation in 2014, compared with 2013, primarily relates to asset additions at Cerro Verde.
Revenue adjustments primarily result from changes in prices on provisionally priced copper sales recognized in prior periods. Refer to "Consolidated Results - Revenues" for further discussion of adjustments to prior period provisionally priced copper sales.
Assuming achievement of current sales volume and cost estimates and average prices of $9 per pound of molybdenum in 2015 , we estimate that average unit net cash costs (net of by-product credits) for our South America mining operations would approximate $1.70 per pound of copper in 2015 .
91
Table of Contents
| 2013 |
| 2012 | ||||||||||||
| By-Product Method |
| Co-Product Method |
| By-Product Method |
| Co-Product Method | ||||||||
Revenues, excluding adjustments | $ | 3.30 | |
| $ | 3.30 | |
| $ | 3.58 | |
| $ | 3.58 | |
Site production and delivery, before net noncash |
|
|
|
|
|
|
| ||||||||
and other costs shown below | 1.53 | | a | 1.42 | |
| 1.60 | | a | 1.49 | | ||||
By-product credits | (0.27 | ) |
| - | |
| (0.26 | ) |
| - | | ||||
Treatment charges | 0.17 | |
| 0.17 | |
| 0.16 | |
| 0.16 | | ||||
Unit net cash costs | 1.43 | |
| 1.59 | |
| 1.50 | |
| 1.65 | | ||||
Depreciation, depletion and amortization | 0.26 | |
| 0.24 | |
| 0.23 | |
| 0.22 | | ||||
Noncash and other costs, net | 0.04 | |
| 0.03 | |
| 0.09 | |
| 0.06 | | ||||
Total unit costs | 1.73 | |
| 1.86 | |
| 1.82 | |
| 1.93 | | ||||
Revenue adjustments, primarily for pricing on |
|
|
|
|
|
|
| ||||||||
prior period open sales | (0.03 | ) |
| (0.03 | ) |
| 0.09 | |
| 0.09 | | ||||
Gross profit per pound | $ | 1.54 | |
| $ | 1.41 | |
| $ | 1.85 | |
| $ | 1.74 | |
|
|
|
|
|
|
|
| ||||||||
Copper sales (millions of recoverable pounds) | 1,325 | |
| 1,325 | |
| 1,245 | |
| 1,245 | | ||||
a. | Includes labor agreement costs totaling $36 million ($0.03 per pound) at Cerro Verde in 2013 and $16 million ($0.01 per pound) at Candelaria in 2012. |
Unit net cash costs (net of by-product credits) for our South America mining operations decreased to $1.43 per pound of copper in 2013 , compared with $1.50 per pound in 2012 , primarily reflecting higher volumes.
Indonesia Mining
Indonesia mining includes PT-FI's Grasberg minerals district, one of the world's largest copper and gold deposits, in Papua, Indonesia. We own 90.64 percent of PT-FI, including 9.36 percent owned through our wholly owned subsidiary, PT Indocopper Investama (refer to Notes 3 and 13 ).
PT-FI produces copper concentrates, which contain significant quantities of gold and silver. Substantially all of PT-FI's copper concentrates are sold under long-term contracts, of which approximately one-half is sold to Atlantic Copper and PT Smelting, and the remainder to other third-party customers.
PT-FI proportionately consolidates an unincorporated joint venture with Rio Tinto plc (Rio Tinto) established in 1996, under which Rio Tinto has a 40 percent interest in certain assets and a 40 percent interest through 2021 in production exceeding specified annual amounts of copper, gold and silver. After 2021, all production and related revenues and costs are shared 60 percent PT-FI and 40 percent Rio Tinto. As of December 31, 2014, the amounts allocated 100 percent to PT-FI remaining to be produced totaled 7.5 billion pounds of copper, 10.9 million ounces of gold and 20.8 million ounces of silver. Based on the current mine plans, PT-FI anticipates that it will be allocated most of the production and related revenues and costs through 2021. Under the joint venture arrangements, PT-FI's share of copper production and sales totaled 98 percent in 2014, 99 percent in 2013 and 100 percent in 2012, and of gold production and sales totaled nearly 100 percent for the last three years. Refer to Note 3 for further discussion of our joint venture with Rio Tinto. Refer to "Regulatory Matters" below and Note 13 for further discussion of PT-FI's Contract of Work (COW) with the Indonesian government.
Refer to "Risk Factors" contained in Part I, Item 1A of our annual report on Form 10-K for the year ended December 31, 2014 , for discussion of risks associated with operations in Indonesia.
Regulatory Matters. On July 25, 2014, PT-FI entered into a Memorandum of Understanding (MOU) with the Indonesian government under which PT-FI and the government agreed to negotiate an amended COW to address provisions related to the size of PT-FI's concession area, royalties and taxes, domestic processing and refining, divestment, local content, and continuation of operations post-2021. Execution of the MOU enabled the resumption of concentrate exports in August 2014, which had been suspended since January 2014. The MOU has been extended to July 25, 2015. PT-FI is engaged in active discussions with the Indonesian government regarding an amended COW.
Provisions being addressed include the development of new copper smelting and refining capacity in Indonesia, provisions for divestment to the Indonesian government and/or Indonesian nationals of up to a 30 percent interest (an additional 20.64 percent interest) in PT-FI at fair value, and timely granting rights for the continuation of
92
Table of Contents
operations from 2022 through 2041. Negotiations are taking into consideration PT-FI's need for assurance of legal and fiscal terms post-2021 for PT-FI to continue with its large-scale investment program for the development of its underground reserves.
Effective with the signing of the MOU, PT-FI provided a $115 million assurance bond to support its commitment for smelter development, agreed to increase royalties to 4.0 percent for copper and 3.75 percent for gold from the previous rates of 3.5 percent for copper and 1.0 percent for gold, and to pay export duties as set forth in a new regulation. PT-FI's royalties totaled $115 million in 2014 , $109 million in 2013 and $93 million in 2012 . The Indonesian government revised its January 2014 regulations regarding export duties, which are now set at 7.5 percent, declining to 5.0 percent when smelter development progress exceeds 7.5 percent and are eliminated when development progress exceeds 30 percent. PT-FI's export duties totaled $77 million in 2014 .
Under the MOU, no terms of the COW other than those relating to the export duties, the smelter bond and royalties described above will be changed until the completion of an amended COW.
PT-FI is advancing plans for the construction of new smelter capacity in parallel with completing negotiations of its long-term operating rights and will also discuss the possibility of expanding industrial activities in Papua in connection with its long-term development plans. PT-FI has identified a site adjacent to the existing PT Smelting site in Gresik, Indonesia, for the construction of additional smelter capacity.
PT-FI is required to apply for renewal of export permits at six-month intervals. In January 2015, PT-FI obtained a renewal of its export license through July 25, 2015.
Operating and Development Activities. We have several projects in progress in the Grasberg minerals district related to the development of large-scale, long-lived, high-grade underground ore bodies. In aggregate, these underground ore bodies are expected to ramp up over several years to process approximately 240,000 metric tons of ore per day following the transition from the Grasberg open pit, currently anticipated to occur in late 2017. Development of the Grasberg Block Cave and Deep Mill Level Zone (DMLZ) underground mines is advancing to enable DMLZ to commence production in late 2015 and the Grasberg Block Cave mine to commence production in early 2018. Over the next five years, estimated aggregate capital spending on these projects is currently expected to average $0.9 billion per year ( $0.7 billion per year net to PT-FI). Considering the long-term nature and size of these projects, actual costs could vary from these estimates. Additionally, PT-FI may reduce or defer these activities pending resolution of negotiations for an amended COW.
The following provides additional information on the continued development of the Common Infrastructure project, the Grasberg Block Cave underground mine and development of the DMLZ ore body that lies below the Deep Ore Zone (DOZ) underground mine.
Common Infrastructure and Grasberg Block Cave Mine. In 2004, PT-FI commenced its Common Infrastructure project to provide access to its large undeveloped underground ore bodies located in the Grasberg minerals district through a tunnel system located approximately 400 meters deeper than its existing underground tunnel system. In addition to providing access to our underground ore bodies, the tunnel system will enable PT-FI to conduct future exploration in prospective areas associated with currently identified ore bodies. The tunnel system was completed to the Big Gossan terminal, and the Big Gossan mine was brought into production in 2010. Development of the DMLZ and Grasberg Block Cave underground mines is advancing using the Common Infrastructure project tunnels as access.
The Grasberg Block Cave underground mine accounts for more than 40 percent of our recoverable proven and probable reserves in Indonesia. Production at the Grasberg Block Cave mine is expected to commence in early 2018, at the end of mining the Grasberg open pit. Targeted production rates once the Grasberg Block Cave mining operation reaches full capacity are expected to approximate 160,000 metric tons of ore per day.
Aggregate mine development capital for the Grasberg Block Cave mine and associated Common Infrastructure is expected to approximate $5.7 billion (incurred between 2008 to 2021), with PT-FI's share totaling approximately $5.1 billion. Aggregate project costs totaling $1.8 billion have been incurred through December 31, 2014 ($0.5 billion during 2014 ).
DMLZ. The DMLZ ore body lies below the DOZ mine at the 2,590-meter elevation and represents the downward continuation of mineralization in the Ertsberg East Skarn system and neighboring Ertsberg porphyry. We plan to
93
Table of Contents
mine the ore body using a block-cave method with production beginning in late 2015. Targeted production rates once the DMLZ mining operation reaches full capacity are expected to approximate 80,000 metric tons of ore per day. Drilling efforts continue to determine the extent of this ore body. Aggregate mine development capital costs for the DMLZ mine are expected to approximate $2.7 billion (incurred between 2009 to 2020), with PT-FI's share totaling approximately $1.6 billion. Aggregate project costs totaling $1.2 billion have been incurred through December 31, 2014 ($0.3 billion during 2014 ).
Operating Data. Following is summary operating data for our Indonesia mining operations for the years ended December 31.
| 2014 |
| 2013 |
| 2012 | ||||||
Operating Data, Net of Joint Venture Interest |
|
|
|
|
| ||||||
Copper (recoverable) |
|
|
|
|
| ||||||
Production (millions of pounds) | 636 | |
| 915 | |
| 695 | | |||
Sales (millions of pounds) | 664 | |
| 885 | |
| 716 | | |||
Average realized price per pound | $ | 3.01 | |
| $ | 3.28 | |
| $ | 3.58 | |
|
|
|
|
|
| ||||||
Gold (recoverable) |
|
|
|
|
| ||||||
Production (thousands of ounces) | 1,130 | |
| 1,142 | |
| 862 | | |||
Sales (thousands of ounces) | 1,168 | |
| 1,096 | |
| 915 | | |||
Average realized price per ounce | $ | 1,229 | |
| $ | 1,312 | |
| $ | 1,664 | |
|
|
|
|
|
| ||||||
100% Operating Data |
|
|
|
|
| ||||||
Ore milled (metric tons per day): a |
|
|
|
|
| ||||||
Grasberg open pit | 69,100 | |
| 127,700 | |
| 118,800 | | |||
DOZ underground mine b | 50,500 | |
| 49,400 | |
| 44,600 | | |||
Big Gossan underground mine c | 900 | |
| 2,100 | |
| 1,600 | | |||
Total | 120,500 | |
| 179,200 | |
| 165,000 | | |||
|
|
|
|
|
| ||||||
Average ore grade: |
|
|
|
|
| ||||||
Copper (percent) | 0.79 | |
| 0.76 | |
| 0.62 | | |||
Gold (grams per metric ton) | 0.99 | |
| 0.69 | |
| 0.59 | | |||
Recovery rates (percent): |
|
|
|
|
| ||||||
Copper | 90.3 | |
| 90.0 | |
| 88.7 | | |||
Gold | 83.2 | |
| 80.0 | |
| 75.7 | | |||
Production (recoverable): |
|
|
|
|
| ||||||
Copper (millions of pounds) | 651 | |
| 928 | |
| 695 | | |||
Gold (thousands of ounces) | 1,132 | |
| 1,142 | |
| 862 | | |||
a. | Amounts represent the approximate average daily throughput processed at PT-FI's mill facilities from each producing mine. |
b. | Ore milled from the DOZ underground mine is expected to ramp up to 70,000 metric tons of ore per day in the second half of 2015. |
c. | Ore milled from the Big Gossan underground mine is expected to ramp up to 7,000 metric tons of ore per day in 2018. |
2014 Compared with 2013
Indonesia's sales volumes totaled 664 million pounds of copper and 1.2 million ounces of gold in 2014 , compared with 885 million pounds of copper and 1.1 million ounces of gold in 2013 , reflecting lower mill throughput resulting from the export restrictions and labor-related work stoppages, partly offset by higher gold ore grades. During fourth-quarter 2014, reduced workforce attendance levels in certain operating areas (primarily in the Grasberg open pit) unfavorably impacted productivity. Following discussions with union leadership and other stakeholders, attendance levels improved significantly by year-end 2014 and in January 2015.
At the Grasberg mine, the sequencing of mining areas with varying ore grades causes fluctuations in quarterly and annual production of copper and gold. Consolidated sales volumes from our Indonesia mining operations are expected to approximate 1.0 billion pounds of copper and 1.3 million ounces of gold for 2015. PT-FI has updated its mine plans to incorporate lower than planned mining rates associated with work stoppages in late 2014 and the impact of export restrictions in the first half of 2014, resulting in a deferral of completion of mining the open pit from mid-2017 to late 2017.
94
Table of Contents
2013 Compared with 2012
Sales volumes from our Indonesia mining operations increased to 885 million pounds of copper and 1.1 million ounces of gold in 2013 , compared with 716 million pounds of copper and 915 thousand ounces of gold in 2012 , primarily reflecting higher ore grades and increased mill rates.
Unit Net Cash Costs. Unit net cash costs per pound of copper is a measure intended to provide investors with information about the cash-generating capacity of our mining operations expressed on a basis relating to the primary metal product for our respective operations. We use this measure for the same purpose and for monitoring operating performance by our mining operations. This information differs from measures of performance determined in accordance with U.S. GAAP and should not be considered in isolation or as a substitute for measures of performance determined in accordance with U.S. GAAP. This measure is presented by other metal mining companies, although our measure may not be comparable to similarly titled measures reported by other companies.
Gross Profit per Pound of Copper/per Ounce of Gold
The following tables summarize the unit net cash costs and gross profit per pound of copper and per ounce of gold at our Indonesia mining operations for the years ended December 31. Refer to "Production Revenues and Production Costs" for an explanation of "by-product" and "co-product" methods and a reconciliation of unit net cash costs per pound to production and delivery costs applicable to sales reported in our consolidated financial statements.
| 2014 |
| 2013 | ||||||||||||||||||||
| By- Product |
| Co-Product Method |
| By- |
| Co-Product Method | ||||||||||||||||
| Method |
| Copper |
| Gold |
| Method |
| Copper |
| Gold | ||||||||||||
Revenues, excluding adjustments | $ | 3.01 | |
| $ | 3.01 | |
| $ | 1,229 | |
| $ | 3.28 | |
| $ | 3.28 | |
| $ | 1,312 | |
Site production and delivery, before net noncash |
|
|
|
|
|
|
|
|
|
|
| ||||||||||||
and other costs shown below | 2.76 | | a | 1.59 | |
| 648 | |
| 2.46 | |
| 1.62 | |
| 648 | | ||||||
Gold and silver credits | (2.25 | ) |
| - | |
| - | |
| (1.69 | ) |
| - | |
| - | | ||||||
Treatment charges | 0.26 | |
| 0.15 | |
| 61 | |
| 0.23 | |
| 0.15 | |
| 61 | | ||||||
Export duties | 0.12 | |
| 0.06 | |
| 27 | |
| - | |
| - | |
| - | | ||||||
Royalty on metals | 0.17 | | b | 0.10 | |
| 41 | |
| 0.12 | |
| 0.08 | |
| 33 | | ||||||
Unit net cash costs | 1.06 | |
| 1.90 | |
| 777 | |
| 1.12 | |
| 1.85 | |
| 742 | | ||||||
Depreciation and amortization | 0.40 | |
| 0.23 | |
| 94 | |
| 0.28 | |
| 0.19 | |
| 73 | | ||||||
Noncash and other costs, net | 0.29 | |
| 0.17 | |
| 68 | |
| 0.13 | |
| 0.09 | |
| 35 | | ||||||
Total unit costs | 1.75 | |
| 2.30 | |
| 939 | |
| 1.53 | |
| 2.13 | |
| 850 | | ||||||
Revenue adjustments, primarily for pricing on |
|
|
|
|
|
|
|
|
|
|
| ||||||||||||
prior period open sales | (0.08 | ) |
| (0.08 | ) |
| 15 | |
| - | |
| - | |
| (1 | ) | ||||||
PT Smelting intercompany profit (loss) | 0.05 | |
| 0.03 | |
| 12 | |
| (0.02 | ) |
| (0.01 | ) |
| (6 | ) | ||||||
Gross profit per pound/ounce | $ | 1.23 | |
| $ | 0.66 | |
| $ | 317 | |
| $ | 1.73 | |
| $ | 1.14 | |
| $ | 455 | |
|
|
|
|
|
|
|
|
|
|
|
| ||||||||||||
Copper sales (millions of recoverable pounds) | 664 | |
| 664 | |
|
|
| 885 | |
| 885 | |
|
| ||||||||
Gold sales (thousands of recoverable ounces) |
|
|
|
| 1,168 | |
|
|
|
|
| 1,096 | | ||||||||||
a. | Excludes fixed costs totaling $0.22 per pound of copper charged directly to cost of sales as a result of the impact of export restrictions on PT-FI's operating rates. |
b. | Includes $0.05 per pound of copper associated with increased royalty rates. |
A significant portion of PT-FI's costs are fixed and unit costs vary depending on sales volumes. Indonesia's unit net cash costs (including gold and silver credits) averaged $1.06 per pound of copper in 2014 , compared with $1.12 per pound in 2013 , primarily reflecting lower copper sales volumes, the impact of export duties and increased royalty rates, which were more than offset by higher gold and silver credits as a result of lower copper sales volumes.
Treatment charges vary with the volume of metals sold and the price of copper, and royalties vary with the volume of metals sold and the prices of copper and gold.
Because certain assets are depreciated on a straight-line basis, PT-FI's unit depreciation rate varies with the level of copper production and sales.
95
Table of Contents
Revenue adjustments primarily result from changes in prices on provisionally priced copper sales recognized in prior periods. Refer to "Consolidated Results - Revenues" for further discussion of adjustments to prior period provisionally priced copper sales.
PT Smelting intercompany profit (loss) represents the change in the deferral of 25 percent of PT-FI's profit on sales to PT Smelting. Refer to "Operations - Smelting & Refining" for further discussion.
Assuming achievement of current sales volume and cost estimates, and an average gold price of $1,300 per ounce for 2015 , we estimate that Indonesia's unit net cash costs (net of gold and silver credits) are expected to approximate $1.19 per pound of copper for the year 2015 . Indonesia's projected unit net cash costs would change by approximately $0.06 per pound for each $50 per ounce change in the average price of gold during 2015 . Because of the fixed nature of a large portion of Indonesia's costs, unit costs vary from quarter to quarter depending on copper and gold volumes.
| 2013 |
| 2012 | ||||||||||||||||||||
| By- |
| Co-Product Method |
| By- |
| Co-Product Method | ||||||||||||||||
| Method |
| Copper |
| Gold |
| Method |
| Copper |
| Gold | ||||||||||||
Revenues, excluding adjustments | $ | 3.28 | |
| $ | 3.28 | |
| $ | 1,312 | |
| $ | 3.58 | |
| $ | 3.58 | |
| $ | 1,664 | |
Site production and delivery, before net noncash |
|
|
|
|
|
|
|
|
|
|
| ||||||||||||
and other costs shown below | 2.46 | |
| 1.62 | |
| 648 | |
| 3.12 | |
| 1.93 | |
| 894 | | ||||||
Gold and silver credits | (1.69 | ) |
| - | |
| - | |
| (2.22 | ) |
| - | |
| - | | ||||||
Treatment charges | 0.23 | |
| 0.15 | |
| 61 | |
| 0.21 | |
| 0.13 | |
| 61 | | ||||||
Royalty on metals | 0.12 | |
| 0.08 | |
| 33 | |
| 0.13 | |
| 0.08 | |
| 38 | | ||||||
Unit net cash costs | 1.12 | |
| 1.85 | |
| 742 | |
| 1.24 | |
| 2.14 | |
| 993 | | ||||||
Depreciation and amortization | 0.28 | |
| 0.19 | |
| 73 | |
| 0.30 | |
| 0.18 | |
| 85 | | ||||||
Noncash and other costs, net | 0.13 | |
| 0.09 | |
| 35 | |
| 0.11 | |
| 0.07 | |
| 33 | | ||||||
Total unit costs | 1.53 | |
| 2.13 | |
| 850 | |
| 1.65 | |
| 2.39 | |
| 1,111 | | ||||||
Revenue adjustments, primarily for pricing on |
|
|
|
|
|
|
|
|
|
|
| ||||||||||||
prior period open sales | - | |
| - | |
| (1 | ) |
| 0.02 | |
| 0.02 | |
| 3 | | ||||||
PT Smelting intercompany loss | (0.02 | ) |
| (0.01 | ) |
| (6 | ) |
| (0.05 | ) |
| (0.03 | ) |
| (15 | ) | ||||||
Gross profit per pound/ounce | $ | 1.73 | |
| $ | 1.14 | |
| $ | 455 | |
| $ | 1.90 | |
| $ | 1.18 | |
| $ | 541 | |
|
|
|
|
|
|
|
|
|
|
|
| ||||||||||||
Copper sales (millions of recoverable pounds) | 885 | |
| 885 | |
|
|
| 716 | |
| 716 | |
|
| ||||||||
Gold sales (thousands of recoverable ounces) |
|
|
|
| 1,096 | |
|
|
|
|
| 915 | | ||||||||||
Unit net cash costs (net of gold and silver credits) for our Indonesia mining operations averaged $1.12 per pound of copper in 2013 , compared with $1.24 per pound in 2012 , primarily reflecting higher volumes.
Africa Mining
Africa mining includes Tenke Fungurume Mining S.A.'s (TFM) Tenke minerals district. We hold an effective 56 percent interest in the Tenke copper and cobalt mining concessions in the Katanga province of the DRC through our consolidated subsidiary TFM, and we are the operator of Tenke.
The Tenke operation includes surface mining, leaching and SX/EW operations. Copper production from the Tenke minerals district is sold as copper cathode. In addition to copper, the Tenke minerals district produces cobalt hydroxide.
Operating and Development Activities. TFM completed its second phase expansion project in early 2013, which included increasing mine, mill and processing capacity. Construction of a second sulphuric acid plant is under way, with completion expected in 2016. We continue to engage in exploration activities and metallurgical testing to evaluate the potential of the highly prospective minerals district at Tenke. These analyses are being incorporated in future plans for potential expansions of production capacity. Future expansions are subject to a number of factors, including power availability, economic and market conditions, and the business and investment climate in the DRC.
96
Table of Contents
Operating Data. Following is summary operating data for our Africa mining operations for the years ended December 31.
| 2014 |
| 2013 |
| 2012 |
| ||||||
Copper (recoverable) |
|
|
|
|
|
| ||||||
Production (millions of pounds) | 447 | |
| 462 | |
| 348 | |
| |||
Sales (millions of pounds) | 425 | |
| 454 | |
| 336 | |
| |||
Average realized price per pound a | $ | 3.06 | |
| $ | 3.21 | |
| $ | 3.51 | |
|
|
|
|
|
|
|
| ||||||
Cobalt (contained) |
|
|
|
|
|
| ||||||
Production (millions of pounds) | 29 | |
| 28 | |
| 26 | |
| |||
Sales (millions of pounds) | 30 | |
| 25 | |
| 25 | |
| |||
Average realized price per pound | $ | 9.66 | |
| $ | 8.02 | |
| $ | 7.83 | |
|
|
|
|
|
|
|
| ||||||
Ore milled (metric tons per day) | 14,700 | |
| 14,900 | |
| 13,000 | |
| |||
Average ore grade (percent): |
|
|
|
|
|
| ||||||
Copper | 4.06 | |
| 4.22 | |
| 3.62 | |
| |||
Cobalt | 0.34 | |
| 0.37 | |
| 0.37 | |
| |||
Copper recovery rate (percent) | 92.6 | |
| 91.4 | |
| 92.4 | |
| |||
a. | Includes point-of-sale transportation costs as negotiated in customer contracts. |
2014 Compared with 2013
Copper sales volumes from TFM decreased to 425 million pounds in 2014 , compared with 454 million pounds in 2013 , primarily because of lower ore grades.
Consolidated sales volumes from our Africa mining operations are expected to approximate 445 million pounds of copper and 32 million pounds of cobalt in 2015 .
2013 Compared with 2012
Copper sales volumes from our Africa mining operations increased to 454 million pounds of copper in 2013 , compared with 336 million pounds of copper in 2012 , primarily reflecting increased mining and milling rates resulting from the expansion project completed in early 2013 and higher ore grades.
Unit Net Cash Costs. Unit net cash costs per pound of copper is a measure intended to provide investors with information about the cash-generating capacity of our mining operations expressed on a basis relating to the primary metal product for our respective operations. We use this measure for the same purpose and for monitoring operating performance by our mining operations. This information differs from measures of performance determined in accordance with U.S. GAAP and should not be considered in isolation or as a substitute for measures of performance determined in accordance with U.S. GAAP. This measure is presented by other metals mining companies, although our measure may not be comparable to similarly titled measures reported by other companies.
97
Table of Contents
Gross Profit per Pound of Copper and Cobalt
The following tables summarize the unit net cash costs and gross profit per pound of copper and cobalt at our Africa mining operations for the years ended December 31. Refer to "Production Revenues and Production Costs" for an explanation of "by-product" and "co-product" methods and a reconciliation of unit net cash costs per pound to production and delivery costs applicable to sales reported in our consolidated financial statements.
| 2014 |
| 2013 | ||||||||||||||||||||
| By-Product |
| Co-Product Method |
| By-Product |
| Co-Product Method | ||||||||||||||||
| Method |
| Copper |
| Cobalt |
| Method |
| Copper |
| Cobalt | ||||||||||||
Revenues, excluding adjustments a | $ | 3.06 | |
| $ | 3.06 | |
| $ | 9.66 | |
| $ | 3.21 | |
| $ | 3.21 | |
| $ | 8.02 | |
Site production and delivery, before net noncash |
|
|
|
|
|
|
|
|
|
|
| ||||||||||||
and other costs shown below | 1.56 | |
| 1.39 | |
| 5.30 | |
| 1.43 | |
| 1.35 | |
| 4.35 | | ||||||
Cobalt credits b | (0.48 | ) |
| - | |
| - | |
| (0.29 | ) |
| - | |
| - | | ||||||
Royalty on metals | 0.07 | |
| 0.06 | |
| 0.16 | |
| 0.07 | |
| 0.06 | |
| 0.14 | | ||||||
Unit net cash costs | 1.15 | |
| 1.45 | |
| 5.46 | |
| 1.21 | |
| 1.41 | |
| 4.49 | | ||||||
Depreciation, depletion and amortization | 0.54 | |
| 0.46 | |
| 1.13 | |
| 0.54 | |
| 0.48 | |
| 1.00 | | ||||||
Noncash and other costs, net | 0.05 | |
| 0.04 | |
| 0.11 | |
| 0.06 | |
| 0.06 | |
| 0.11 | | ||||||
Total unit costs | 1.74 | |
| 1.95 | |
| 6.70 | |
| 1.81 | |
| 1.95 | |
| 5.60 | | ||||||
Revenue adjustments, primarily for pricing on |
|
|
|
|
|
|
|
|
|
|
| ||||||||||||
prior period open sales | - | |
| - | |
| 0.07 | |
| - | |
| - | |
| 0.09 | | ||||||
Gross profit per pound | $ | 1.32 | |
| $ | 1.11 | |
| $ | 3.03 | |
| $ | 1.40 | |
| $ | 1.26 | |
| $ | 2.51 | |
|
|
|
|
|
|
|
|
|
|
|
| ||||||||||||
Copper sales (millions of recoverable pounds) | 425 | |
| 425 | |
|
|
| 454 | |
| 454 | |
|
| ||||||||
Cobalt sales (millions of contained pounds) |
|
|
|
| 30 | |
|
|
|
|
| 25 | | ||||||||||
a. | Includes point-of-sale transportation costs as negotiated in customer contracts. |
b. | Net of cobalt downstream processing and freight costs. |
Lower unit net cash costs (net of cobalt credits) for our Africa mining operations of $1.15 per pound of copper in 2014 , compared with $1.21 per pound of copper in 2013 , primarily reflecting higher cobalt credits, partly offset by higher site production and delivery costs associated with input and mine logistics support costs.
Assuming achievement of current sales volume and cost estimates, and an average cobalt market price of $13 per pound for 2015 , average unit net cash costs (net of cobalt credits) are expected to approximate $1.31 per pound of copper in 2015 . Africa's projected unit net cash costs for 2015 would change by $0.09 per pound for each $2 per pound change in the average price of cobalt during 2015 .
| 2013 |
| 2012 | ||||||||||||||||||||
| By-Product |
| Co-Product Method |
| By-Product |
| Co-Product Method | ||||||||||||||||
| Method |
| Copper |
| Cobalt |
| Method |
| Copper |
| Cobalt | ||||||||||||
Revenues, excluding adjustments a | $ | 3.21 | |
| $ | 3.21 | |
| $ | 8.02 | |
| $ | 3.51 | |
| $ | 3.51 | |
| $ | 7.83 | |
Site production and delivery, before net noncash |
|
|
|
|
|
|
|
|
|
|
| ||||||||||||
and other costs shown below | 1.43 | |
| 1.35 | |
| 4.35 | |
| 1.49 | |
| 1.39 | |
| 4.86 | | ||||||
Cobalt credits b | (0.29 | ) |
| - | |
| - | |
| (0.33 | ) |
| - | |
| - | | ||||||
Royalty on metals | 0.07 | |
| 0.06 | |
| 0.14 | |
| 0.07 | |
| 0.06 | |
| 0.12 | | ||||||
Unit net cash costs | 1.21 | |
| 1.41 | |
| 4.49 | |
| 1.23 | |
| 1.45 | |
| 4.98 | | ||||||
Depreciation, depletion and amortization | 0.54 | |
| 0.48 | |
| 1.00 | |
| 0.52 | |
| 0.47 | |
| 0.67 | | ||||||
Noncash and other costs, net | 0.06 | |
| 0.06 | |
| 0.11 | |
| 0.09 | |
| 0.08 | |
| 0.11 | | ||||||
Total unit costs | 1.81 | |
| 1.95 | |
| 5.60 | |
| 1.84 | |
| 2.00 | |
| 5.76 | | ||||||
Revenue adjustments, primarily for pricing on |
|
|
|
|
|
|
|
|
|
|
| ||||||||||||
prior period open sales | - | |
| - | |
| 0.09 | |
| 0.02 | |
| 0.02 | |
| 0.09 | | ||||||
Gross profit per pound | $ | 1.40 | |
| $ | 1.26 | |
| $ | 2.51 | |
| $ | 1.69 | |
| $ | 1.53 | |
| $ | 2.16 | |
|
|
|
|
|
|
|
|
|
|
|
| ||||||||||||
Copper sales (millions of recoverable pounds) | 454 | |
| 454 | |
|
|
| 336 | |
| 336 | |
|
| ||||||||
Cobalt sales (millions of contained pounds) |
|
|
|
| 25 | |
|
|
|
|
| 25 | | ||||||||||
a. | Includes point-of-sale transportation costs as negotiated in customer contracts. |
98
Table of Contents
b. | Net of cobalt downstream processing and freight costs. |
Unit net cash costs (net of cobalt credits) for our Africa mining operations of $1.21 per pound of copper in 2013 were lower than unit net cash costs of $1.23 per pound of copper in 2012 , primarily reflecting higher copper sales volumes, partly offset by lower cobalt credits.
Molybdenum Mines
We have two wholly owned molybdenum mines in North America – the Henderson underground mine and the Climax open-pit mine, both in Colorado. The Henderson and Climax mines produce high-purity, chemical-grade molybdenum concentrates, which are typically further processed into value-added molybdenum chemical products. The majority of molybdenum concentrates produced at the Henderson and Climax mines, as well as from North and South America copper mines, are processed at our own conversion facilities.
Production from our molybdenum mines totaled 51 million pounds of molybdenum in 2014 , 49 million pounds in 2013 and 41 million pounds in 2012 . Refer to "Consolidated Results" for our consolidated molybdenum operating data, which includes sales of molybdenum produced at our molybdenum mines and at our North and South America copper mines, and refer to "Outlook" for projected consolidated molybdenum sales volumes.
Unit Net Cash Costs Per Pound of Molybdenum. Unit net cash costs per pound of molybdenum is a measure intended to provide investors with information about the cash-generating capacity of our mining operations expressed on a basis relating to the primary metal product for our respective operations. We use this measure for the same purpose and for monitoring operating performance by our mining operations. This information differs from measures of performance determined in accordance with U.S. GAAP and should not be considered in isolation or as a substitute for measures of performance determined in accordance with U.S. GAAP. This measure is presented by other metals mining companies, although our measure may not be comparable to similarly titled measures reported by other companies.
Average unit net cash costs for our molybdenum mines totaled $7.08 per pound of molybdenum in 2014 , compared with $7.15 per pound in 2013 and with Henderson's unit net cash costs of $7.07 per pound in 2012 . Assuming achievement of current sales volume and cost estimates, we estimate unit net cash costs for the molybdenum mines to average $7.60 per pound of molybdenum in 2015 . Refer to "Product Revenues and Production Costs" for a reconciliation of unit net cash costs per pound to production and delivery costs applicable to sales reported in our consolidated financial statements.
Smelting & Refining
We wholly own and operate a smelter in Miami, Arizona and Atlantic Copper, a smelter and refinery in Spain. Additionally, PT-FI owns 25 percent of PT Smelting, a smelter and refinery in Gresik, Indonesia. Treatment charges for smelting and refining copper concentrates consist of a base rate and, in certain contracts, price participation based on copper prices. Treatment charges represent a cost to our mining operations and income to Atlantic Copper and PT Smelting. Thus, higher treatment charges benefit our smelter operations and adversely affect our mining operations. Our North America copper mines are less significantly affected by changes in treatment charges because these operations are largely integrated with our Miami smelter. Through this form of downstream integration, we are assured placement of a significant portion of our concentrate production. During 2014, approximately half of our consolidated concentrate production was processed through the Miami smelter, Atlantic Copper and PT Smelting's facilities.
Atlantic Copper smelts and refines copper concentrates and markets refined copper and precious metals in slimes. Following is a summary of Atlantic Copper's concentrate purchases from our copper mining operations and third parties for the three years ended December 31:
| 2014 |
| 2013 |
| 2012 |
North America copper mines | 21% |
| 13% |
| 16% |
South America mining | 21% |
| 32% |
| 31% |
Indonesia mining | 8% |
| 16% |
| 10% |
Third parties | 50% |
| 39% |
| 43% |
| 100% |
| 100% |
| 100% |
PT-FI's contract with PT Smelting provides for PT-FI to supply 100 percent of the copper concentrate requirements (subject to a minimum or maximum rate) necessary for PT Smelting to produce 205,000 metric tons of copper
99
Table of Contents
annually on a priority basis. PT-FI also sells copper concentrate to PT Smelting at market rates for quantities in excess of 205,000 metric tons of copper annually. PT-FI supplied 81 percent in 2014, 83 percent in 2013 and 99 percent in 2012 of PT Smelting's concentrate requirements, and PT Smelting processed 58 percent in 2014, 41 percent in 2013 and 52 percent in 2012 of PT-FI's concentrate production.
We defer recognizing profits on sales from our mining operations to Atlantic Copper and on 25 percent of Indonesia mining's sales to PT Smelting until final sales to third parties occur. Changes in these deferrals attributable to variability in intercompany volumes resulted in net reductions to net loss attributable to common stockholders totaling $43 million ( $0.04 per share) in 2014 , compared with net reductions to net income attributable to common stockholders of $17 million ( $0.02 per share) in 2013 and $80 million ( $0.08 per share) in 2012 . Our net deferred profits on inventories at Atlantic Copper and PT Smelting to be recognized in future periods' net income attributable to common stockholders totaled $73 million at December 31, 2014. Quarterly variations in ore grades, the timing of intercompany shipments and changes in product prices will result in variability in our net deferred profits and quarterly earnings. Refer to Note 6 for further discussion.
Oil and Gas Operations
Our portfolio of oil and gas assets includes significant oil production facilities and growth potential in the Deepwater GOM, established oil production facilities onshore and offshore California, large onshore natural gas resources in the Haynesville shale play in Louisiana, natural gas production from the Madden area in central Wyoming, and an industry-leading position in the emerging Inboard Lower Tertiary/Cretaceous natural gas trend located in the shallow waters of the GOM and onshore in South Louisiana. Approximately 90 percent of our oil and gas revenues are from oil and NGLs.
Exploration, Operating and Development Activities. Our oil and gas business has significant proved, probable and possible reserves, a broad range of development opportunities and high-potential exploration prospects. The business is managed to reinvest its cash flows in projects with attractive rates of returns and risk profiles. Following the recent sharp decline in oil prices, we have taken steps to significantly reduce capital spending plans and near-term oil and gas growth initiatives in order to preserve cash flows and resources for anticipated improved market conditions in the future. We are also evaluating third-party participation in our oil and gas projects to provide additional funding.
FM O&G has a large, strategic position in the Deepwater GOM with significant current oil production, strong cash margins and existing infrastructure and facilities with excess capacity. These assets, combined with FM O&G's large leasehold interests in an established geologic basin, provide financially attractive investment opportunities for high-impact growth in oil production and cash margins. FM O&G's capital allocation strategy is principally focused on drilling and development opportunities that can be tied back to existing facilities.
Capital expenditures for our oil and gas operations totaled $3.2 billion for the year ended December 31, 2014 , including $2.1 billion incurred for the Deepwater GOM and $0.7 billion for the Inboard Lower Tertiary/Cretaceous natural gas trend. Capital expenditures for oil and gas operations for the year 2015 are currently estimated to total $2.3 billion . Approximately 80 percent of the 2015 capital budget is expected to be directed to the highest return focus areas in the GOM. We are committed to achieving our objective of funding oil and gas capital expenditures with oil and gas cash flows, third-party joint venture transactions or asset sales. FM O&G is engaged in discussions to obtain funding from industry partners and other oil and gas market participants for a substantial portion of its 2015 capital expenditures to achieve this objective. Third-party funding could also enable FM O&G to complete additional development wells for production.
Sale and Purchase Transactions. In June 2014, FM O&G completed the sale of its Eagle Ford shale assets for cash consideration of $3.1 billion and the acquisition of Deepwater GOM interests for $0.9 billion, including interests in the Lucius and Heidelberg oil fields and several exploration leases. In September 2014, FM O&G acquired additional Deepwater GOM interests for $0.5 billion, including an 18.67 percent interest in the Vito oil discovery in the Mississippi Canyon area (Blocks 940, 941, 984 and 985) and a significant lease position in the Vito area. Refer to Note 2 for further discussion of this disposition and these acquisitions.
International Oil and Gas Operations.
International Exploration (Morocco). FM O&G has a farm-in arrangement to earn interests in exploration blocks located in the Mazagan permit area offshore Morocco. The exploration area covers 2.2 million gross acres in water depths of 4,500 to 9,900 feet. FM O&G expects to commence drilling the first prospect in the first half of 2015. FM O&G currently has no proved reserves or production in Morocco.
100
Table of Contents
U.S. Oil and Gas Operations. Following is summary operating results for the U.S. oil and gas operations for the years 2014 and 2013 .
|
| 2014 a |
| 2013 b | ||||
Sales Volumes |
|
|
|
| ||||
Oil (MMBbls) |
| 40.1 | |
| 26.6 | | ||
Natural gas (Bcf) |
| 80.8 | |
| 54.2 | | ||
NGLs (MMBbls) |
| 3.2 | |
| 2.4 | | ||
MMBOE |
| 56.8 | |
| 38.1 | | ||
|
|
|
|
| ||||
Average Realizations c |
|
|
|
| ||||
Oil (per barrel) |
| $ | 90.00 | |
| $ | 98.32 | |
Natural gas (per MMBtu) |
| $ | 4.23 | |
| $ | 3.99 | |
NGLs (per barrel) |
| $ | 39.73 | |
| $ | 38.20 | |
|
|
|
|
| ||||
Gross (Loss) Profit per BOE |
|
|
|
| ||||
Realized revenues c |
| $ | 71.83 | |
| $ | 76.87 | |
Less: cash production costs c |
| 20.08 | |
| 17.14 | | ||
Cash operating margin c |
| 51.75 | |
| 59.73 | | ||
Less: depreciation, depletion and amortization |
| 40.34 | |
| 35.81 | | ||
Less: impairment of oil and gas properties |
| 65.80 | |
| - | | ||
Less: accretion and other costs |
| 1.69 | |
| 0.79 | | ||
Plus: net noncash mark-to-market gains (losses) on derivative contracts |
| 11.03 | |
| (8.20 | ) | ||
Plus: other net adjustments |
| 0.06 | |
| 0.04 | | ||
Gross (loss) profit |
| $ | (44.99 | ) |
| $ | 14.97 | |
a. | Includes results from Eagle Ford through June 19, 2014. |
b. | Include the results of FM O&G beginning June 1, 2013. |
c. | Cash operating margin for oil and gas operations reflects realized revenues less cash production costs. Realized revenues exclude noncash mark-to-market adjustments on derivative contracts, and cash production costs exclude accretion and other costs. For reconciliations of realized revenues (including average realizations for oil, natural gas and NGLs) and cash production costs to revenues and production and delivery costs reported in our consolidated financial statements, refer to the supplemental schedule, "Product Revenues and Production Costs." |
FM O&G's average realized price for crude oil was $90.00 per barrel, including $2.76 per barrel of realized cash losses on derivative contracts, for the year 2014 . Excluding the impact of derivative contracts, the 2014 average realized price for crude oil was $92.76 per barrel ( 93 percent of the average Brent crude oil price of $99.45 per barrel).
FM O&G has derivative contracts that provide price protection between $70 and $90 per barrel of Brent crude oil for more than 80 percent of estimated 2015 oil production. At current Brent crude oil prices approximating $50 per barrel, we would receive a benefit of $20 per barrel on 2015 volumes of 30.7 million barrels, before taking into account premiums of $6.89 per barrel. Refer to Note 14 for further discussion.
FM O&G's average realized price for natural gas was $4.23 per MMBtu for the year 2014 . Excluding the impact of derivative contracts, the average realized price for natural gas was $4.37 per MMBtu, compared to the NYMEX natural gas price average of $4.41 per MMBtu for the January through December 2014 contracts. As of December 31, 2014, FM O&G has no remaining derivative contracts for natural gas.
Realized revenues for oil and gas operations of $71.83 per BOE for the year 2014 were lower than realized revenues of $76.87 per BOE for the seven-month period from June 1, 2013, to December 31, 2013 , primarily reflecting lower oil prices and higher realized cash losses on derivative contracts (realized losses were $122 million or $2.15 per BOE for the year 2014 , compared with $22 million or $0.58 per BOE for the seven-month period from June 1, 2013, to December 31, 2013 ).
Cash production costs of $20.08 per BOE for the year 2014 were higher than cash production costs of $17.14 per BOE for the seven-month period from June 1, 2013, to December 31, 2013 , primarily reflecting the sale of lower cost Eagle Ford properties in June 2014 and higher operating costs in California and the GOM.
101
Table of Contents
Based on current sales volume and cost estimates, cash production costs are expected to approximate $18 per BOE for the year 2015 .
Following is a summary of average sales volumes per day by region for oil and gas operations for the years ended 2014 and 2013 :
|
| 2014 |
| 2013 a | ||
Sales Volumes (MBOE per day): |
|
|
|
| ||
GOM b |
| 73 | |
| 72 | |
California |
| 39 | |
| 39 | |
Haynesville/Madden/Other |
| 20 | | c | 21 | |
Eagle Ford |
| 24 | | d | 46 | |
Total oil and gas operations |
| 156 | |
| 178 | |
a. | Reflects the results of FM O&G beginning June 1, 2013. |
b. | Includes sales from properties on the GOM Shelf and in the Deepwater GOM. Production from the GOM Shelf totaled 13 MBOE per day for 2014 (17 percent of the GOM total) and 13 MBOE per day (18 percent of the GOM total) for the seven-month period from June 1, 2013, to December 31, 2013 . |
c. | Results include volume adjustments related to Eagle Ford's pre-close sales. |
d. | FM O&G completed the sale of Eagle Ford on June 20, 2014. |
Daily sales volumes averaged 156 MBOE for the year 2014 , including 110 MBbls of crude oil, 221 MMcf of natural gas and 9 MBbls of NGLs, compared to 178 MBOE for the seven-month period from June 1, 2013, to December 31, 2013 , including 124 MBbls of crude oil, 254 MMcf of natural gas and 11 MBbls of NGLs. Oil and gas sales volumes are expected to average 152 MBOE per day for the year 2015 , comprised of 67 percent oil, 28 percent natural gas and 5 percent NGLs.
Deepwater Gulf of Mexico. Multiple development and exploration opportunities have been identified in the Deepwater GOM that are expected to benefit from tieback opportunities to available production capacity at the FM O&G operated large-scale Holstein, Marlin and Horn Mountain deepwater production platforms. In addition, FM O&G has interests in the Lucius and Heidelberg oil fields and in the Vito basin area.
In January 2015, first oil production commenced from the Lucius oil field in Keathley Canyon and the operator is continuing to ramp up production. Lucius is a subsea development consisting of six subsea wells tied back to a truss spar hull located in 7,200 feet of water. The spar has a design capacity of 80 MBbls of oil per day and 450 MMcf of natural gas per day. The Lucius field was discovered in November 2009 and the subsequent development project was sanctioned in late 2011. FM O&G has a 25.1 percent working interest in Lucius.
During fourth-quarter 2014, installation operations for flow lines, export lines and suction piles for Heidelberg's mooring system commenced . Fabrication of the main topsides module is more than 70 percent complete. The Heidelberg truss spar was designed as a Lucius-look-alike facility with capacity of 80 MBbls of oil per day. Development drilling is in progress and the project remains on track for first production in 2016. Heidelberg is a large, high-quality oil development project located in 5,300 feet of water in the Green Canyon area. FM O&G has a 12.5 percent working interest in Heidelberg.
In December 2014, FM O&G announced successful results from the 100-percent-owned Holstein Deep delineation well in the Green Canyon area. The well, which is approximately one mile south of the discovery well, was drilled to a total depth of 31,100 feet and wireline logs and core data confirmed 234 net feet of Miocene oil pay with excellent reservoir characteristics and good correlation to the discovery well and previous confirmation sidetrack penetration.
In December 2014, FM O&G commenced drilling the second delineation well at Holstein Deep. The well, which is updip to the discovery well, is currently drilling below 24,800 feet towards a proposed total depth of 31,500 feet. Production from the planned three-well development program is expected to reach approximately 15 MBOE per day. The timing of tying in this production will be subject to partner arrangements and general market conditions.
Recent data supports the potential for additional development opportunities at Holstein Deep to achieve production of up to 75 MBOE per day by 2020. The Holstein Deep development is located in Green Canyon Block 643, west of
102
Table of Contents
the Holstein platform in 3,890 feet of water. FM O&G has identified multiple additional development opportunities in the Green Canyon area that could be tied back to the Holstein facility.
Marlin, in which FM O&G has a 100 percent working interest, is located in Viosca Knoll and has production facilities capable of producing in excess of 90 MBOE per day. Several tieback opportunities in the area have been identified including the Dorado and King development projects.
In December 2014, FM O&G announced positive drilling results from the 100-percent-owned Dorado development project . This well is the first of three planned subsea tieback wells to the Marlin facility targeting undrained fault blocks and updip resource potential south of the Marlin facility. The well is expected to commence production in second-quarter 2015. Drilling operations for the second and third wells are expected to begin in the second half of 2015. The Dorado development is located on Viosca Knoll Block 915 in 3,860 feet of water.
FM O&G commenced drilling at the 100-percent-owned King prospect in late 2014 and the well was drilled to a true vertical depth of 12,250 feet in January 2015. Log results indicated 71 net feet of gas pay and FM O&G is preparing a downdip sidetrack to pursue an optimum oil take point below the gas-oil contact in the reservoir. King is located in Mississippi Canyon south of the Marlin facility in 5,200 feet of water.
Horn Mountain, in which FM O&G has a 100 percent working interest, is located in Mississippi Canyon and has production facilities capable of producing in excess of 80 MBOE per day. Several tieback opportunities in the area have been identified including Kilo/Oscar/Quebec/Victory (KOQV), which are expected to commence in mid-2015 . This infill drilling program will target undrained fault blocks and updip resource potential just east of the Horn Mountain facility. KOQV is located in approximately 5,500 feet of water.
In December 2014, the Power Nap exploration well in the Vito area encountered positive drilling results. The well was drilled to a total depth of 30,970 feet and wireline logs and core data indicated that the well encountered hydrocarbons in multiple subsalt Miocene sand packages. The operator is preparing to drill a sidetrack well to delineate the reservoir and test the downdip limit of the oil accumulation. Power Nap, in which FM O&G has a 50 percent working interest, is located in 4,200 feet of water and is operated by Shell Offshore Inc., which has a 50 percent working interest.
FM O&G has an 18.67 percent interest in the Vito oil discovery in the Mississippi Canyon area and a significant lease position in the Vito basin in the Mississippi Canyon and Atwater Valley areas. Vito, a large, deep subsalt Miocene oil discovery made in 2009, is located in approximately 4,000 feet of water and is operated by Shell Offshore Inc. Exploration and appraisal drilling in recent years confirmed a significant resource in high-quality, subsalt Miocene sands. Development options are under evaluation.
Inboard Lower Tertiary/Cretaceous. FM O&G has an industry-leading position in the emerging Inboard Lower Tertiary/Cretaceous natural gas trend, located on the Shelf of the GOM and onshore in South Louisiana. FM O&G believes that data from eight wells drilled to date indicate the presence of geologic formations that are analogous to productive formations in the Deepwater GOM and onshore in the Gulf Coast region.
In February 2015, we announced the results of additional production testing on FM O&G's Highlander discovery, located onshore in South Louisiana in the Inboard Lower Tertiary/Cretaceous trend. The production test, which was performed in the Cretaceous/Tuscaloosa section, utilized expanded testing equipment and indicated a flow rate of approximately 75 million MMcf/d, approximately 37 MMcf/d net to FM O&G, on a 42/64th choke with flowing tubing pressure of 10,300 pounds per square inch. Highlander began production on February 25, 2015, using FM O&G facilities in the immediate area. FM O&G plans to install additional amine processing facilities to accommodate the higher rates. A second well location has been identified and future plans will be determined pending review of well performance from the first well. FM O&G is the operator and has a 72 percent working interest and an approximate 49 percent net revenue interest in Highlander. FM O&G has identified multiple prospects in the Highlander area where it controls rights to more than 50,000 gross acres.
The Farthest Gate West onshore exploration prospect commenced drilling in October 2014 and is currently drilling below 18,500 feet towards a proposed total depth of 24,000 feet. Farthest Gate West is located onshore in Cameron Parish, Louisiana, and is a Lineham Creek analog prospect with Paleogene objectives.
In response to current oil and gas market conditions, future activities at other Inboard Lower Tertiary/Cretaceous prospects have been deferred.
103
Table of Contents
California. FM O&G's California assets benefit from an established oil production base with a stable production profile and access to favorably priced crude markets. Development plans are principally focused on maintaining stable production levels through continued drilling in the long-established producing fields onshore in California. FM O&G's position in California is located onshore in the San Joaquin Valley and Los Angeles Basin and offshore in the Point Arguello and Point Pedernales fields.
Haynesville. FM O&G has rights to a substantial natural gas resource located in the Haynesville shale play in North Louisiana. Drilling activities in recent years have been reduced to maximize cash flows in a low natural gas price environment.
CAPITAL RESOURCES AND LIQUIDITY
Our consolidated operating cash flows vary with prices realized from copper, gold, molybdenum and oil, our sales volumes, production costs, income taxes, other working capital changes and other factors. We remain committed to a strong balance sheet and will take prudent actions in response to market conditions. We have taken steps to sell assets, defer capital spending and will continue to evaluate opportunities to strengthen our financial position.
Cash
Following is a summary of the U.S. and international components of consolidated cash and cash equivalents, including cash available to the parent company, net of noncontrolling interests' share, taxes and other costs at December 31 (in millions):
| 2014 |
| 2013 | ||||
Cash at domestic companies | $ | 78 | |
| $ | 410 | |
Cash at international operations | 386 | |
| 1,575 | | ||
Total consolidated cash and cash equivalents | 464 | |
| 1,985 | | ||
Less: Noncontrolling interests' share | (91 | ) |
| (602 | ) | ||
Cash, net of noncontrolling interests' share | 373 | |
| 1,383 | | ||
Less: Withholding taxes and other | (16 | ) |
| (75 | ) | ||
Net cash available | $ | 357 | |
| $ | 1,308 | |
Cash held at our international operations is generally used to support our foreign operations' capital expenditures, operating expenses, working capital and other tax payments or other cash needs. Management believes that sufficient liquidity is available in the U.S. from cash balances and availability from our revolving credit facility and uncommitted lines of credit (refer to Note 8 ). With the exception of TFM, we have not elected to permanently reinvest earnings from our foreign subsidiaries, and we have recorded deferred tax liabilities for foreign earnings that are available to be repatriated to the U.S. From time to time, our foreign subsidiaries distribute earnings to the U.S. through dividends that are subject to applicable withholding taxes and noncontrolling interests' share.
Debt
Following is a summary of our total debt and related weighted-average interest rates at December 31 (in billions, except percentages):
| 2014 |
| 2013 |
| ||||||||
|
|
| Weighted- |
|
|
| Weighted- |
| ||||
|
|
| Average |
|
|
| Average |
| ||||
|
|
| Interest Rate |
|
|
| Interest Rate |
| ||||
FCX Senior Notes | $ | 12.0 | |
| 3.8% |
| $ | 9.5 | |
| 3.6% |
|
FM O&G Senior Notes | 2.6 | |
| 6.6% |
| 6.7 | |
| 6.8% |
| ||
FCX Term Loan | 3.1 | |
| 1.7% |
| 4.0 | |
| 1.7% |
| ||
Other FCX debt | 1.3 | |
| 3.3% |
| 0.5 | |
| 6.4% |
| ||
Total debt | $ | 19.0 | |
| 3.8% |
| $ | 20.7 | |
| 4.2% |
|
|
|
|
|
|
|
|
|
| ||||
On May 30, 2014, we amended our revolving credit facility, extending the maturity date by one year, to May 31, 2019 , and increased the aggregate principal amount available from $3.0 billion to $4.0 billion . At December 31, 2014 , we had no borrowings and $45 million of letters of credit issued under our revolving credit facility.
104
Table of Contents
We have uncommitted and short-term lines of credit with certain financial institutions that are unsecured, which have terms and pricing that are generally more favorable than our revolving credit facility. As of December 31, 2014, there were $474 million of borrowings drawn on these lines of credit.
In March 2014, Cerro Verde entered into a five-year, $1.8 billion senior unsecured credit facility. Amounts may be drawn or letters of credit issued over a two-year period to fund a portion of the expansion project (see "Operations - South America Mining") and for Cerro Verde's general corporate purposes. At December 31, 2014 , there were $425 million of borrowings and no letters of credit issued under Cerro Verde's credit facility.
Refer to Note 8 and "Financing Activities" below for further discussion of our debt and Note 18 and Item 9B for discussion of February 2015 modifications to our revolving credit facility and unsecured bank term loan (Term Loan).
Operating Activities
We generated consolidated operating cash flows totaling $5.6 billion in 2014 (net of $0.6 billion for working capital uses and changes in other tax payments) , $6.1 billion in 2013 (net of $0.4 billion for working capital uses and changes in other tax payments) and $3.8 billion in 2012 (net of $1.4 billion for working capital uses and changes in other tax payments).
Lower consolidated operating cash flows for 2014 , compared with 2013 , reflect the impact of lower copper and gold price realizations and lower copper sales volumes, partly offset by a full year of our oil and gas operations.
Higher consolidated operating cash flows for 2013 , compared with 2012 , resulted from our oil and gas operations, higher copper and gold sales volumes and a decrease in working capital uses and changes in other tax payments, primarily associated with changes in accrued income taxes, inventories and accounts receivable. Partly offsetting these increases was the impact of lower metals price realizations.
Based on current operating plans and subject to future copper, gold, molybdenum and crude oil prices, we expect estimated consolidated operating cash flows for the year 2015 , plus available cash and availability under our credit facilities, to be sufficient to fund our budgeted capital expenditures, dividends, noncontrolling interest distributions and other cash requirements for the year. Refer to "Outlook" for further discussion of projected operating cash flows for the year 2015 .
Investing Activities
Capital Expenditures. Capital expenditures, including capitalized interest, totaled $7.2 billion in 2014 (including $2.9 billion for major projects at mining operations and $3.2 billion for oil and gas operations), $5.3 billion in 2013 (including $2.3 billion for major projects at mining operations and $1.45 billion for oil and gas operations) and $3.5 billion in 2012 (including $2.2 billion for major projects at mining operations).
Increased capital expenditures at mining operations in 2014 , compared with 2013, were primarily associated with the expansion project at Cerro Verde. Increased capital expenditures at mining operations in 2013, compared with 2012, were primarily associated with the expansion projects at Morenci and Cerro Verde and our underground development activities at Grasberg, partly offset by decreased spending for the expansion at Tenke, which was completed in early 2013, and at the Climax mine, which began commercial operations in May 2012.
Capital expenditures are expected to approximate $6.0 billion for the year 2015 , including $2.5 billion for major projects at our mining operations (primarily for the Cerro Verde expansion and underground development at Grasberg) and $2.3 billion for our oil and gas operations. We are engaged in discussions to obtain funding from oil and gas market participants for a substantial portion of our planned capital expenditures for our oil and gas operations.
We are taking aggressive actions to reduce or defer capital expenditures and other costs and have initiated efforts to obtain third-party funding for a significant portion of our oil and gas capital expenditures to maintain financial strength and flexibility in response to recent sharp declines in oil prices. In addition, we are monitoring copper markets and will be responsive to the market conditions. As a first step, we have reduced budgeted 2015 capital expenditures, exploration and other costs by a total of $2 billion. We have a broad set of natural resource assets that provide many alternatives for future actions to enhance our financial flexibility. Additional capital cost reductions, potential additional divestitures or monetizations, potential reduction or suspension in common dividend
105
Table of Contents
payments and other actions will be pursued as required to maintain a strong balance sheet while preserving a strong resource position and portfolio of assets with attractive long-term growth prospects. Refer to "Operations" for further discussion.
Dispositions and Acquisitions. In November 2014, we completed the sale of our 80 percent ownership interests in the Candelaria/Ojos to Lundin Mining Corporation (Lundin) for $1.8 billion in cash and contingent consideration of up to $200 million . Excluding contingent consideration, after-tax net proceeds from the transaction approximated $1.5 billion .
In June 2014, we completed the sale of the Eagle Ford shale assets for cash consideration of $3.1 billion. A portion of the proceeds was reinvested in additional oil and gas interests and the remaining net proceeds were used to repay debt. In June 2014 and September 2014, we completed acquisitions of Deepwater GOM interests totaling $1.4 billion.
In June 2013, we paid $3.5 billion in cash (net of cash acquired) for the acquisition of PXP and $1.6 billion in cash (net of cash acquired) for the acquisition of MMR.
In March 2013, we paid $348 million (net of cash acquired) for the acquisition of a cobalt chemical refinery in Kokkola, Finland, and the related sales and marketing business. The acquisition was funded 70 percent by us and 30 percent by Lundin, our joint venture partner.
Refer to Note 2 for further discussion of these dispositions and acquisitions.
Financing Activities
Debt Transactions. In November 2014, we completed the sale of $3.0 billion of senior notes, which were comprised of four tranches with a weighted-average interest rate of 4.1 percent. The proceeds from these senior notes were used to fund our December 2014 tender offers for $1.14 billion aggregate principal of senior notes (with a weighted-average interest rate of 6.5 percent), essentially all of our 2015 scheduled maturities (including scheduled term loan amortization and $500 million of 1.40% Senior Notes due 2015), $300 million in 7.625% Senior Notes, and to repay borrowings under our revolving credit facility. Other senior note redemptions during 2014 included $400 million of our 8.625% Senior Notes, $1.7 billion of the aggregate principal amount of certain senior notes (with a weighted-average interest rate of 6.6 percent) and $210 million of the aggregate principal amount of our 6.625% Senior Notes.
During 2013, we sold $6.5 billion of senior notes in four tranches with a weighted-average interest rate of 3.9 percent, and borrowed $4.0 billion under an unsecured bank term loan with an interest rate of London Interbank Offered Rate (LIBOR) plus 1.75 percent. Net proceeds from these borrowings were used to fund the acquisitions of PXP and MMR, repay certain debt of PXP and for general corporate purposes. Also in 2013, we redeemed the $299 million of MMR's outstanding 11.875% Senior Notes due 2014 and $400 million of PXP's 7 5 / 8 % Senior Notes due 2018, which were assumed in the acquisitions.
During 2012, we sold $3.0 billion of senior notes in three tranches with a weighted-average interest rate of 3.0 percent. Net proceeds from this offering, plus cash on hand, were used to redeem the remaining $3.0 billion of our 8.375% Senior Notes.
Refer to Note 8 for further discussion of these transactions.
Dividends and Other Equity Transactions. We paid dividends on our common stock totaling $1.3 billion in 2014 , $2.3 billion in 2013 (including $1.0 billion for a supplemental dividend of $1.00 per share paid in July 2013) and $1.1 billion in 2012 . The current annual dividend rate for our common stock is $1.25 per share ( $0.3125 per share quarterly). Based on outstanding common shares of 1.0 billion at December 31, 2014, and the current dividend rate, our estimated regular common stock dividend for 2015 approximates $1.3 billion. As a result of the recent sharp decline in copper and oil prices, our Board is reviewing the effect of market conditions on our financial position. We have reduced capital spending and other costs and are seeking third-party funding for a significant portion of our oil and gas expenditures. In addition, the Board is reviewing our financial policy and may take further steps to enhance the Company's liquidity and financial position, including a potential reduction or suspension in common dividend payments. For information about a special dividend expected to paid in 2015 associated with the proposed settlement of the stockholder derivative litigation, refer to Note 12. The declaration of dividends is at the discretion
106
Table of Contents
of the Board and will depend upon our financial results, cash requirements, future prospects and other factors deemed relevant by the Board. The Board will continue to review our financial policy on an ongoing basis.
Cash dividends and other distributions paid to noncontrolling interests totaled $424 million in 2014 , $256 million in 2013 and $113 million in 2012 . Higher noncontrolling interest payments in 2014, compared with 2013, primarily reflected higher dividends to the noncontrolling interest holders of El Abra and Tenke. Higher noncontrolling interest payments in 2013, compared with 2012, primarily reflected higher dividends to the noncontrolling interest holders of El Abra and Candelaria. These payments will vary based on the operating results and cash requirements of our consolidated subsidiaries.
Conversion of MMR's 8% Convertible Perpetual Preferred Stock and 5.75% Convertible Perpetual Preferred Stock, Series 1 required cash payments of $228 million during 2013. Refer to Note 2 for further discussion.
CONTRACTUAL OBLIGATIONS
We have contractual and other long-term obligations, including debt maturities based on the principal amounts, which we expect to fund with available cash, projected operating cash flows, availability under our revolving credit facility or future financing transactions, if necessary. A summary of these various obligations at December 31, 2014 , follows (in millions):
| Total |
| 2015 |
| 2016 to 2017 |
| 2018 to 2019 |
| Thereafter | ||||||||||
Debt maturities | $ | 18,752 | |
| $ | 478 | |
| $ | 2,102 | |
| $ | 4,363 | |
| $ | 11,809 | |
Scheduled interest payment obligations a | 7,720 | |
| 704 | |
| 1,382 | |
| 1,186 | |
| 4,448 | | |||||
ARO and environmental obligations b | 8,062 | |
| 319 | |
| 728 | |
| 428 | |
| 6,587 | | |||||
Take-or-pay contracts c | 4,273 | |
| 2,128 | |
| 1,711 | |
| 230 | |
| 204 | | |||||
Operating lease obligations | 354 | |
| 44 | |
| 86 | |
| 59 | |
| 165 | | |||||
Total d | $ | 39,161 | |
| $ | 3,673 | |
| $ | 6,009 | |
| $ | 6,266 | |
| $ | 23,213 | |
a. | Scheduled interest payment obligations were calculated using stated coupon rates for fixed-rate debt and interest rates applicable at December 31, 2014 , for variable-rate debt. |
b. | Represents estimated cash payments, on an undiscounted and unescalated basis, associated with ARO and environmental activities (including $1.9 billion for our oil and gas operations). The timing and the amount of these payments could change as a result of changes in regulatory requirements, changes in scope and timing of ARO activities, the settlement of environmental matters and as actual spending occurs. Refer to Note 12 for additional discussion of environmental and ARO matters. |
c. | Represents contractual obligations for purchases of goods or service agreements enforceable and legally binding and that specify all significant terms, including minimum commitments for deepwater drillships to be utilized in the GOM drilling campaign ( $1.8 billion ), transportation services ( $732 million ), the procurement of copper concentrates ( $572 million ), electricity ( $316 million ) and deferred premium costs and future interest on the crude oil derivative contracts ( $231 million ). Some of our take-or-pay contracts are settled based on the prevailing market rate for the service or commodity purchased, and in some cases, the amount of the actual obligation may change over time because of market conditions. Drillship obligations provide for an operating rate over the contractual term upon delivery of the drillship. Transportation obligations are primarily for South America contracted ocean freight and FM O&G contracted gathering. Obligations for copper concentrates provide for deliveries of specified volumes to Atlantic Copper at market-based prices. Electricity obligations are primarily for contractual minimum demand at the South America and Tenke mines. |
d. | This table excludes certain other obligations in our consolidated balance sheets, such as estimated funding for pension obligations as the funding may vary from year to year based on changes in the fair value of plan assets and actuarial assumptions, commitments and contingencies totaling $191 million and unrecognized tax benefits totaling $68 million where the timing of settlement is not determinable, and other less significant amounts.This table also excludes purchase orders for the purchase of inventory and other goods and services, as purchase orders typically represent authorizations to purchase rather than binding agreements. |
Refer to Note 18 and Item 9B for discussion of February 2015 modifications to our revolving credit facility and Term Loan.
In addition to our debt maturities and other contractual obligations discussed above, we have other commitments, which we expect to fund with available cash, projected operating cash flows, available credit facilities or future financing transactions, if necessary. These include (i) PT-FI's commitment to provide one percent of its annual revenue for the development of the local people in its area of operations through the Freeport Partnership Fund for
107
Table of Contents
Community Development, (ii) TFM's commitment to provide 0.3 percent of its annual revenue for the development of the local people in its area of operations and (iii) other commercial commitments, including standby letters of credit, surety bonds and guarantees. Refer to Notes 12 and 13 for further discussion.
CONTINGENCIES
Environmental
The cost of complying with environmental laws is a fundamental and substantial cost of our business. At December 31, 2014 , we had $1.2 billion recorded in our consolidated balance sheet for environmental obligations attributed to CERCLA or analogous state programs and for estimated future costs associated with environmental obligations that are considered probable based on specific facts and circumstances.
During 2014 , we incurred environmental capital expenditures and other environmental costs (including our joint venture partners' shares) of $405 million for programs to comply with applicable environmental laws and regulations that affect our operations, compared with $595 million in 2013 and $612 million in 2012 . Lower spending in 2014 primarily reflects the completion of a water treatment facility in 2013 and extended project timelines. For 2015 , we expect to incur approximately $500 million of aggregate environmental capital expenditures and other environmental costs, which are part of our overall 2015 operating budget, and are higher than 2014 because of timing of expenditures. The timing and amount of estimated payments could change as a result of changes in regulatory requirements, changes in scope and timing of reclamation activities, the settlement of environmental matters and as actual spending occurs.
Refer to Note 12 for further information about environmental regulation, including significant environmental matters.
Asset Retirement Obligations
We recognize AROs as liabilities when incurred, with the initial measurement at fair value. These obligations, which are initially estimated based on discounted cash flow estimates, are accreted to full value over time through charges to income. Mine reclamation costs for disturbances are recorded as an ARO and as a related asset retirement cost (ARC) (included in property, plant, equipment and development costs) in the period of disturbance. Oil and gas plugging and abandonment costs are recognized as an ARO and as a related ARC (included in oil and gas properties) in the period in which the well is drilled or acquired. Our cost estimates are reflected on a third-party cost basis and comply with our legal obligation to retire tangible, long-lived assets. At December 31, 2014 , we had $2.8 billion recorded in our consolidated balance sheet for AROs, including $1.1 billion related to our oil and gas properties. Spending on AROs totaled $99 million in 2014 , $107 million in 2013 and $47 million in 2012 , including $74 million in 2014 and $64 million in 2013 for our oil and gas operations. For 2015 , we expect to incur approximately $191 million for aggregate ARO payments. Refer to Note 12 for further discussion.
Litigation and Other Contingencies
Refer to Notes 2 and 12 and "Legal Proceedings" contained in Part I, Item 3 of our annual report on Form 10-K for the year ended December 31, 2014 , for further discussion of contingencies associated with legal proceedings and other matters.
DISCLOSURES ABOUT MARKET RISKS
Commodity Price Risk
Metals. Our consolidated revenues from our mining operations include the sale of copper concentrates, copper cathodes, copper rod, gold, molybdenum and other metals by our North and South America mines, the sale of copper concentrates (which also contain significant quantities of gold and silver) by our Indonesia mining operations, the sale of copper cathodes and cobalt hydroxide by our Africa mining operations, the sale of molybdenum in various forms by our molybdenum operations, and the sale of copper cathodes, copper anodes and gold in anodes and slimes by Atlantic Copper. Our financial results can vary significantly as a result of fluctuations in the market prices of copper, gold, molybdenum, silver and cobalt. World market prices for these commodities have fluctuated historically and are affected by numerous factors beyond our control.
For 2014 , 44 percent of our mined copper was sold in concentrate, 31 percent as cathode and 25 percent as rod. Substantially all of our copper concentrate and cathode sales contracts provide final copper pricing in a specified future month (generally one to four months from the shipment date) based primarily on quoted LME monthly average spot copper prices. We receive market prices based on prices in the specified future period, which results in price fluctuations recorded through revenues until the date of settlement. We record revenues and invoice
108
Table of Contents
customers at the time of shipment based on then-current LME prices, which results in an embedded derivative on our provisionally priced concentrate and cathode sales that is adjusted to fair value through earnings each period, using the period-end forward prices, until the date of final pricing. To the extent final prices are higher or lower than what was recorded on a provisional basis, an increase or decrease to revenues is recorded each reporting period until the date of final pricing. Accordingly, in times of rising copper prices, our revenues benefit from adjustments to the final pricing of provisionally priced sales pursuant to contracts entered into in prior periods; in times of falling copper prices, the opposite occurs.
| 2014 |
| 2013 |
| 2012 |
| ||||||
Revenues | $ | (118 | ) |
| $ | (26 | ) |
| $ | 101 | |
|
Net income attributable to common stockholders | $ | (65 | ) |
| $ | (12 | ) |
| $ | 43 | |
|
Net income per share of common stockholders | $ | (0.06 | ) |
| $ | (0.01 | ) |
| $ | 0.05 | |
|
At December 31, 2014 , we had provisionally priced copper sales at our copper mining operations, primarily South America and Indonesia, totaling 405 million pounds of copper (net of intercompany sales and noncontrolling interests) recorded at an average price of $2.86 per pound, subject to final pricing over the next several months. We estimate that each $0.05 change in the price realized from the December 31, 2014 , provisional price recorded would have a net impact on our 2015 consolidated revenues of approximately $26 million ( $13 million to net income attributable to common stockholders). The LME spot copper price closed at $2.59 per pound on February 20, 2015 .
Oil & Gas. Our financial results from oil and gas operations may vary with fluctuations in crude oil prices and, to a lesser extent natural gas prices. Market prices for crude oil and natural gas have fluctuated historically and are affected by numerous factors beyond our control.
Our oil and gas operations have used various derivative contracts to manage exposure to oil and gas price risk. Realized cash losses on crude oil and natural gas derivative contracts totaled $122 million for the year 2014 and $22 million for the seven-month period from June 1, 2013, to December 31, 2013. Additionally, following is a summary of the net noncash mark-to-market gains (losses) on crude oil and natural gas derivative contracts for the years ended December 31 (in millions, except per share amounts):
| 2014 |
| 2013 a | ||||
Revenues | $ | 627 | |
| $ | (312 | ) |
Net income to common stockholders | $ | 389 | |
| $ | (194 | ) |
Net income per share attributable to common stockholders | $ | 0.37 | |
| $ | (0.19 | ) |
a. | Reflects the seven-month period from June 1, 2013, to December 31, 2013. |
At December 31, 2014 , the fair value of the crude oil derivative contracts totaled a $526 million asset; partly offsetting the fair value is $210 million in deferred premiums and interest to be settled in future periods. The estimated increase in the net asset on our balance sheet of a 10 percent decrease in Brent crude oil prices on the fair values of outstanding crude oil derivative contracts, compared with forward prices used to determine the December 31, 2014 , fair values approximates $38 million . The estimated decrease in the net asset on our balance sheet of a 10 percent increase in Brent crude oil prices on the fair values of outstanding crude oil derivative contracts, compared with the forward prices used to determine the December 31, 2014 , fair values approximates $51 million . Refer to Note 14 for further discussion of our crude oil and natural gas derivative contracts.
109
Table of Contents
Foreign Currency Exchange Risk
The functional currency for most of our operations is the U.S. dollar. All of our revenues and a significant portion of our costs are denominated in U.S. dollars; however, some costs and certain asset and liability accounts are denominated in local currencies, including the Indonesian rupiah, Australian dollar, Chilean peso, Peruvian nuevo sol and euro. Generally, our results are positively affected when the U.S. dollar strengthens in relation to those foreign currencies and adversely affected when the U.S. dollar weakens in relation to those foreign currencies.
Following is a summary of estimated annual payments and the impact of changes in foreign currency rates on our annual operating costs:
| Exchange Rate per $1 at December 31, |
| Estimated Annual Payments |
| 10% Change in Exchange Rate (in millions) a | |||||||||||||||||
| 2014 |
| 2013 |
| 2012 |
| (in local currency) |
| (in millions) b |
| Increase |
| Decrease | |||||||||
Indonesia |
|
|
|
|
|
|
|
|
|
|
|
|
| |||||||||
Rupiah | 12,378 | |
| 12,128 | |
| 9,622 | |
| 7.6 trillion |
| $ | 614 | |
| $ | (56 | ) |
| $ | 68 | |
Australian dollar | 1.22 | |
| 1.12 | |
| 0.93 | |
| 225 million |
| $ | 185 | |
| $ | (17 | ) |
| $ | 21 | |
South America |
|
|
|
|
|
|
|
|
|
|
|
|
| |||||||||
Chilean peso | 607 | |
| 525 | |
| 480 | |
| 170 billion |
| $ | 280 | |
| $ | (25 | ) |
| $ | 31 | |
Peruvian nuevo sol | 2.99 | |
| 2.80 | |
| 2.55 | |
| 600 million |
| $ | 201 | |
| $ | (18 | ) |
| $ | 22 | |
Atlantic Copper |
|
|
|
|
|
|
|
|
|
|
|
|
| |||||||||
Euro | 0.82 | |
| 0.73 | |
| 0.76 | |
| 135 million |
| $ | 164 | |
| $ | (15 | ) |
| $ | 18 | |
a. | Reflects the estimated impact on annual operating costs assuming a 10 percent increase or decrease in the exchange rate reported at December 31, 2014 . |
b. | Based on December 31, 2014 , exchange rates. |
Interest Rate Risk
At December 31, 2014 , we had total debt maturities based on the principal amounts of $18.8 billion , of which approximately 22 percent was variable-rate debt with interest rates based on the LIBOR or the Euro Interbank Offered Rate. The table below presents average interest rates for our scheduled maturities of principal for our outstanding debt (excluding fair value adjustments) and the related fair values at December 31, 2014 (in millions, except percentages):
| 2015 |
| 2016 |
| 2017 |
| 2018 |
| 2019 |
| Thereafter |
| Fair Value | ||||||||||||||
Fixed-rate debt | $ | 4 | |
| $ | 1 | |
| $ | 1,251 | |
| $ | 1,501 | |
| $ | 237 | |
| $ | 11,702 | |
| $ | 14,679 | |
Average interest rate | 1.1 | % |
| 3.9 | % |
| 2.2 | % |
| 2.4 | % |
| 6.1 | % |
| 4.8 | % |
| 4.4 | % | |||||||
|
|
|
|
|
|
|
|
|
|
|
|
|
| ||||||||||||||
Variable-rate debt | $ | 474 | |
| $ | 650 | |
| $ | 200 | |
| $ | 2,200 | |
| $ | 425 | |
| $ | 107 | |
| $ | 4,056 | |
Average interest rate | 1.3 | % |
| 1.7 | % |
| 1.7 | % |
| 1.7 | % |
| 2.1 | % |
| 3.9 | % |
| 1.7 | % | |||||||
NEW ACCOUNTING STANDARDS
We do not expect the provisions of recently issued accounting standards to have a significant impact on our future financial statements and disclosures.
OFF-BALANCE SHEET ARRANGEMENTS
Refer to Note 13 for discussion of off-balance sheet arrangements.
110
Table of Contents
PRODUCT REVENUES AND PRODUCTION COSTS
Mining Product Revenues and Unit Net Cash Costs
Unit net cash costs per pound of copper and molybdenum are measures intended to provide investors with information about the cash-generating capacity of our mining operations expressed on a basis relating to the primary metal product for the respective operations. We use this measure for the same purpose and for monitoring operating performance by our mining operations. This information differs from measures of performance determined in accordance with U.S. GAAP and should not be considered in isolation or as a substitute for measures of performance determined in accordance with U.S. GAAP. This measure is presented by other metals mining companies, although our measures may not be comparable to similarly titled measures reported by other companies.
We present gross profit per pound of copper in the following tables using both a "by-product" method and a "co-product" method. We use the by-product method in our presentation of gross profit per pound of copper because (i) the majority of our revenues are copper revenues, (ii) we mine ore, which contains copper, gold, molybdenum and other metals, (iii) it is not possible to specifically assign all of our costs to revenues from the copper, gold, molybdenum and other metals we produce, (iv) it is the method used to compare mining operations in certain industry publications and (v) it is the method used by our management and the Board to monitor operations. In the co-product method presentation below, shared costs are allocated to the different products based on their relative revenue values, which will vary to the extent our metals sales volumes and realized prices change.
We show revenue adjustments for prior period open sales as separate line items. Because these adjustments do not result from current period sales, we have reflected these separately from revenues on current period sales. Noncash and other costs consist of items such as stock-based compensation costs, start-up costs, write-offs of equipment and/or unusual charges. They are removed from site production and delivery costs in the calculation of unit net cash costs. As discussed above, gold, molybdenum and other metal revenues at copper mines are reflected as credits against site production and delivery costs in the by-product method. The following schedules for our mining operations are presentations under both the by-product and co-product methods together with reconciliations to amounts reported in our consolidated financial statements.
Oil & Gas Product Revenues and Cash Production Costs per Unit
Realized revenues and cash production costs per unit are measures intended to provide investors with information about the cash operating margin of our oil and gas operations expressed on a basis relating to each product sold. We use this measure for the same purpose and for monitoring operating performance by our oil and gas operations. This information differs from measures of performance determined in accordance with U.S. GAAP and should not be considered in isolation or as a substitute for measures of performance determined in accordance with U.S. GAAP. Our measures may not be comparable to similarly titled measures reported by other companies.
We show revenue adjustments from derivative contracts as separate line items. Because these adjustments do not result from oil and gas sales, these gains and losses have been reflected separately from revenues on current period sales. Additionally, accretion and other costs are removed from production and delivery costs in the calculation of cash production costs per BOE. The following schedules include calculations of oil and gas product revenues and cash production costs together with a reconciliation to amounts reported in our consolidated financial statements.
111
Table of Contents
North America Copper Mines Product Revenues and Production Costs
Year Ended December 31, 2014 |
|
|
| ||||||||||||||||
(In millions) | By-Product |
| Co-Product Method | ||||||||||||||||
| Method |
| Copper |
| Molybdenum a |
| Other b |
| Total | ||||||||||
Revenues, excluding adjustments | $ | 5,186 | |
| $ | 5,186 | |
| $ | 379 | |
| $ | 127 | |
| $ | 5,692 | |
Site production and delivery, before net noncash |
|
|
|
|
|
|
|
|
| ||||||||||
and other costs shown below | 3,057 | |
| 2,999 | |
| 90 | |
| 75 | |
| 3,164 | | |||||
By-product credits | (399 | ) |
| - | |
| - | |
| - | |
| - | | |||||
Treatment charges | 203 | |
| 198 | |
| - | |
| 5 | |
| 203 | | |||||
Net cash costs | 2,861 | |
| 3,197 | |
| 90 | |
| 80 | |
| 3,367 | | |||||
Depreciation, depletion and amortization | 473 | |
| 462 | |
| 4 | |
| 7 | |
| 473 | | |||||
Noncash and other costs, net | 149 | |
| 147 | |
| 1 | |
| 1 | |
| 149 | | |||||
Total costs | 3,483 | |
| 3,806 | |
| 95 | |
| 88 | |
| 3,989 | | |||||
Revenue adjustments, primarily for pricing on prior period open sales | (7 | ) |
| (7 | ) |
| - | |
| - | |
| (7 | ) | |||||
Gross profit | $ | 1,696 | |
| $ | 1,373 | |
| $ | 284 | |
| $ | 39 | |
| $ | 1,696 | |
|
|
|
|
|
|
|
|
|
| ||||||||||
Copper sales (millions of recoverable pounds) | 1,657 | |
| 1,657 | |
|
|
|
|
|
| ||||||||
Molybdenum sales (millions of recoverable pounds) a |
|
|
|
| 33 | |
|
|
|
| |||||||||
|
|
|
|
|
|
|
|
|
| ||||||||||
Gross profit per pound of copper/molybdenum: |
|
|
|
|
| ||||||||||||||
|
|
|
|
|
|
|
|
|
| ||||||||||
Revenues, excluding adjustments | $ | 3.13 | |
| $ | 3.13 | |
| $ | 11.52 | |
|
|
|
| ||||
Site production and delivery, before net noncash |
|
|
|
|
|
|
|
|
| ||||||||||
and other costs shown below | 1.85 | |
| 1.81 | |
| 2.74 | |
|
|
|
| |||||||
By-product credits | (0.24 | ) |
| - | |
| - | |
|
|
|
| |||||||
Treatment charges | 0.12 | |
| 0.12 | |
| - | |
|
|
|
| |||||||
Unit net cash costs | 1.73 | |
| 1.93 | |
| 2.74 | |
|
|
|
| |||||||
Depreciation, depletion and amortization | 0.29 | |
| 0.28 | |
| 0.14 | |
|
|
|
| |||||||
Noncash and other costs, net | 0.09 | |
| 0.09 | |
| 0.03 | |
|
|
|
| |||||||
Total unit costs | 2.11 | |
| 2.30 | |
| 2.91 | |
|
|
|
| |||||||
Revenue adjustments, primarily for pricing |
|
|
|
|
|
|
|
|
| ||||||||||
on prior period open sales | - | |
| - | |
| - | |
|
|
|
| |||||||
Gross profit per pound | $ | 1.02 | |
| $ | 0.83 | |
| $ | 8.61 | |
|
|
|
| ||||
|
|
|
|
|
|
|
|
|
| ||||||||||
Reconciliation to Amounts Reported |
|
|
|
|
|
|
|
|
| ||||||||||
|
|
|
|
| Depreciation, |
|
|
|
| ||||||||||
|
|
| Production |
| Depletion and |
|
|
|
| ||||||||||
(In millions) | Revenues |
| and Delivery |
| Amortization |
|
|
|
| ||||||||||
Totals presented above | $ | 5,692 | |
| $ | 3,164 | |
| $ | 473 | |
|
|
|
| ||||
Treatment charges | - | |
| 203 | |
| - | |
|
|
|
| |||||||
Noncash and other costs, net | - | |
| 149 | |
| - | |
|
|
|
| |||||||
Revenue adjustments, primarily for pricing on prior period open sales | (7 | ) |
| - | |
| - | |
|
|
|
| |||||||
Eliminations and other | (69 | ) |
| (76 | ) |
| 11 | |
|
|
|
| |||||||
North America copper mines | 5,616 | |
| 3,440 | |
| 484 | |
|
|
|
| |||||||
Other mining & eliminations c | 11,112 | |
| 7,225 | |
| 1,074 | |
|
|
|
| |||||||
Total mining | 16,728 | |
| 10,665 | |
| 1,558 | |
|
|
|
| |||||||
U.S. oil & gas operations | 4,710 | |
| 1,237 | |
| 6,028 | | d |
|
|
| |||||||
Corporate, other & eliminations | - | |
| 2 | |
| 14 | |
|
|
|
| |||||||
As reported in FCX's consolidated financial statements | $ | 21,438 | |
| $ | 11,904 | |
| $ | 7,600 | | d |
|
|
| ||||
a. | Reflects sales of molybdenum by certain of the North America copper mines to our molybdenum sales company at market-based pricing. |
b. | Includes gold and silver product revenues and production costs . |
c. | Represents the combined total for all other mining operations and the related eliminations, as presented in Note 16 . |
d. | Includes impairment of oil and gas properties of $3.7 billion . |
112
Table of Contents
North America Copper Mines Product Revenues and Production Costs (continued)
Year Ended December 31, 2013 |
|
|
| ||||||||||||||||
(In millions) | By-Product |
| Co-Product Method | ||||||||||||||||
| Method |
| Copper |
| Molybdenum a |
| Other b |
| Total | ||||||||||
Revenues, excluding adjustments | $ | 4,752 | |
| $ | 4,752 | |
| $ | 349 | |
| $ | 106 | |
| $ | 5,207 | |
Site production and delivery, before net noncash |
|
|
|
|
|
|
|
|
| ||||||||||
and other costs shown below | 2,828 | |
| 2,744 | |
| 123 | |
| 74 | |
| 2,941 | | |||||
By-product credits | (342 | ) |
| - | |
| - | |
| - | |
| - | | |||||
Treatment charges | 155 | |
| 151 | |
| - | |
| 4 | |
| 155 | | |||||
Net cash costs | 2,641 | |
| 2,895 | |
| 123 | |
| 78 | |
| 3,096 | | |||||
Depreciation, depletion and amortization | 391 | |
| 378 | |
| 7 | |
| 6 | |
| 391 | | |||||
Noncash and other costs, net | 202 | | c | 200 | |
| 1 | |
| 1 | |
| 202 | | |||||
Total costs | 3,234 | |
| 3,473 | |
| 131 | |
| 85 | |
| 3,689 | | |||||
Revenue adjustments, primarily for pricing on prior period open sales | (4 | ) |
| (4 | ) |
| - | |
| - | |
| (4 | ) | |||||
Gross profit | $ | 1,514 | |
| $ | 1,275 | |
| $ | 218 | |
| $ | 21 | |
| $ | 1,514 | |
|
|
|
|
|
|
|
|
|
| ||||||||||
Copper sales (millions of recoverable pounds) | 1,416 | |
| 1,416 | |
|
|
|
|
|
| ||||||||
Molybdenum sales (millions of recoverable pounds) a |
|
|
|
| 32 | |
|
|
|
| |||||||||
|
|
|
|
|
|
|
|
|
| ||||||||||
Gross profit per pound of copper/molybdenum: |
|
|
|
|
| ||||||||||||||
|
|
|
|
|
|
|
|
|
| ||||||||||
Revenues, excluding adjustments | $ | 3.36 | |
| $ | 3.36 | |
| $ | 10.79 | |
|
|
|
| ||||
Site production and delivery, before net noncash |
|
|
|
|
|
|
|
|
| ||||||||||
and other costs shown below | 2.00 | |
| 1.94 | |
| 3.79 | |
|
|
|
| |||||||
By-product credits | (0.24 | ) |
| - | |
| - | |
|
|
|
| |||||||
Treatment charges | 0.11 | |
| 0.11 | |
| - | |
|
|
|
| |||||||
Unit net cash costs | 1.87 | |
| 2.05 | |
| 3.79 | |
|
|
|
| |||||||
Depreciation, depletion and amortization | 0.28 | |
| 0.27 | |
| 0.22 | |
|
|
|
| |||||||
Noncash and other costs, net | 0.14 | | c | 0.14 | |
| 0.04 | |
|
|
|
| |||||||
Total unit costs | 2.29 | |
| 2.46 | |
| 4.05 | |
|
|
|
| |||||||
Revenue adjustments, primarily for pricing |
|
|
|
|
|
|
|
|
| ||||||||||
on prior period open sales | - | |
| - | |
| - | |
|
|
|
| |||||||
Gross profit per pound | $ | 1.07 | |
| $ | 0.90 | |
| $ | 6.74 | |
|
|
|
| ||||
|
|
|
|
|
|
|
|
|
| ||||||||||
Reconciliation to Amounts Reported |
|
|
|
|
|
|
|
|
| ||||||||||
|
|
|
|
| Depreciation, |
|
|
|
| ||||||||||
|
|
| Production |
| Depletion and |
|
|
|
| ||||||||||
(In millions) | Revenues |
| and Delivery |
| Amortization |
|
|
|
| ||||||||||
Totals presented above | $ | 5,207 | |
| $ | 2,941 | |
| $ | 391 | |
|
|
|
| ||||
Treatment charges | - | |
| 155 | |
| - | |
|
|
|
| |||||||
Noncash and other costs, net | - | |
| 202 | | c | - | |
|
|
|
| |||||||
Revenue adjustments, primarily for pricing on prior period open sales | (4 | ) |
| - | |
| - | |
|
|
|
| |||||||
Eliminations and other | (20 | ) |
| (32 | ) |
| 11 | |
|
|
|
| |||||||
North America copper mines | 5,183 | |
| 3,266 | |
| 402 | |
|
|
|
| |||||||
Other mining & eliminations d | 13,118 | |
| 7,885 | |
| 1,020 | |
|
|
|
| |||||||
Total mining | 18,301 | |
| 11,151 | |
| 1,422 | |
|
|
|
| |||||||
U.S. oil & gas operations | 2,616 | |
| 682 | |
| 1,364 | |
|
|
|
| |||||||
Corporate, other & eliminations | 4 | |
| 7 | |
| 11 | |
|
|
|
| |||||||
As reported in FCX's consolidated financial statements | $ | 20,921 | |
| $ | 11,840 | |
| $ | 2,797 | |
|
|
|
| ||||
a. | Reflects sales of molybdenum by certain of the North America copper mines to our molybdenum sales company at market-based pricing. |
b. | Includes gold and silver product revenues and production costs. |
c. | Includes $76 million ($0.05 per pound) associated with updated mine plans at Morenci that resulted in a loss in recoverable copper in leach stockpiles. |
d. | Represents the combined total for all other mining operations and the related eliminations, as presented in Note 16 . |
113
Table of Contents
North America Copper Mines Product Revenues and Production Costs (continued)
Year Ended December 31, 2012 |
|
|
| ||||||||||||||||
(In millions) | By-Product |
| Co-Product Method | ||||||||||||||||
| Method |
| Copper |
| Molybdenum a |
| Other b |
| Total | ||||||||||
Revenues, excluding adjustments | $ | 4,908 | |
| $ | 4,908 | |
| $ | 468 | |
| $ | 91 | |
| $ | 5,467 | |
Site production and delivery, before net noncash |
|
|
|
|
|
|
|
|
| ||||||||||
and other costs shown below | 2,572 | |
| 2,357 | |
| 227 | |
| 60 | |
| 2,644 | | |||||
By-product credits | (487 | ) |
| - | |
| - | |
| - | |
| - | | |||||
Treatment charges | 161 | |
| 147 | |
| - | |
| 14 | |
| 161 | | |||||
Net cash costs | 2,246 | |
| 2,504 | |
| 227 | |
| 74 | |
| 2,805 | | |||||
Depreciation, depletion and amortization | 346 | |
| 323 | |
| 18 | |
| 5 | |
| 346 | | |||||
Noncash and other costs, net | 138 | |
| 134 | |
| 3 | |
| 1 | |
| 138 | | |||||
Total costs | 2,730 | |
| 2,961 | |
| 248 | |
| 80 | |
| 3,289 | | |||||
Revenue adjustments, primarily for pricing on prior period open sales | 4 | |
| 4 | |
| - | |
| - | |
| 4 | | |||||
Gross profit | $ | 2,182 | |
| $ | 1,951 | |
| $ | 220 | |
| $ | 11 | |
| $ | 2,182 | |
|
|
|
|
|
|
|
|
|
| ||||||||||
Copper sales (millions of recoverable pounds) | 1,347 | |
| 1,347 | |
|
|
|
|
|
| ||||||||
Molybdenum sales (millions of recoverable pounds) a |
|
|
|
| 36 | |
|
|
|
| |||||||||
|
|
|
|
|
|
|
|
|
| ||||||||||
Gross profit per pound of copper/molybdenum: |
|
|
|
|
| ||||||||||||||
|
|
|
|
|
|
|
|
|
| ||||||||||
Revenues, excluding adjustments | $ | 3.64 | |
| $ | 3.64 | |
| $ | 13.00 | |
|
|
|
| ||||
Site production and delivery, before net noncash |
|
|
|
|
|
|
|
|
| ||||||||||
and other costs shown below | 1.91 | |
| 1.75 | |
| 6.32 | |
|
|
|
| |||||||
By-product credits | (0.36 | ) |
| - | |
| - | |
|
|
|
| |||||||
Treatment charges | 0.12 | |
| 0.11 | |
| - | |
|
|
|
| |||||||
Unit net cash costs | 1.67 | |
| 1.86 | |
| 6.32 | |
|
|
|
| |||||||
Depreciation, depletion and amortization | 0.26 | |
| 0.24 | |
| 0.48 | |
|
|
|
| |||||||
Noncash and other costs, net | 0.10 | |
| 0.10 | |
| 0.09 | |
|
|
|
| |||||||
Total unit costs | 2.03 | |
| 2.20 | |
| 6.89 | |
|
|
|
| |||||||
Revenue adjustments, primarily for pricing |
|
|
|
|
|
|
|
|
| ||||||||||
on prior period open sales | 0.01 | |
| 0.01 | |
| - | |
|
|
|
| |||||||
Gross profit per pound | $ | 1.62 | |
| $ | 1.45 | |
| $ | 6.11 | |
|
|
|
| ||||
|
|
|
|
|
|
|
|
|
| ||||||||||
Reconciliation to Amounts Reported |
|
|
|
|
|
|
|
|
| ||||||||||
|
|
|
|
| Depreciation, |
|
|
|
| ||||||||||
|
|
| Production |
| Depletion and |
|
|
|
| ||||||||||
(In millions) | Revenues |
| and Delivery |
| Amortization |
|
|
|
| ||||||||||
Totals presented above | $ | 5,467 | |
| $ | 2,644 | |
| $ | 346 | |
|
|
|
| ||||
Treatment charges | - | |
| 161 | |
| - | |
|
|
|
| |||||||
Noncash and other costs, net | - | |
| 138 | |
| - | |
|
|
|
| |||||||
Revenue adjustments, primarily for pricing on prior period open sales | 4 | |
| - | |
| - | |
|
|
|
| |||||||
Eliminations and other | 15 | |
| (10 | ) |
| 14 | |
|
|
|
| |||||||
North America copper mines | 5,486 | |
| 2,933 | |
| 360 | |
|
|
|
| |||||||
Other mining & eliminations c | 12,517 | |
| 7,446 | |
| 812 | |
|
|
|
| |||||||
Total mining | 18,003 | |
| 10,379 | |
| 1,172 | |
|
|
|
| |||||||
U.S. oil & gas operations | - | |
| - | |
| - | |
|
|
|
| |||||||
Corporate, other & eliminations | 7 | |
| 3 | |
| 7 | |
|
|
|
| |||||||
As reported in FCX's consolidated financial statements | $ | 18,010 | |
| $ | 10,382 | |
| $ | 1,179 | |
|
|
|
| ||||
a. | Reflects sales of molybdenum by certain of the North America copper mines to our molybdenum sales company at market-based pricing. |
b. | Includes gold and silver product revenues and production costs. |
c. | Represents the combined total for all other mining operations and the related eliminations, as presented in Note 16 . |
114
Table of Contents
South America Mining Product Revenues and Production Costs
Year Ended December 31, 2014 |
|
|
|
|
|
|
| ||||||||
(In millions) | By-Product |
| Co-Product Method | ||||||||||||
| Method |
| Copper |
| Other |
| Total | ||||||||
Revenues, excluding adjustments | $ | 3,498 | |
| $ | 3,498 | |
| $ | 269 | | a | $ | 3,767 | |
Site production and delivery, before net noncash |
|
|
|
|
|
|
| ||||||||
and other costs shown below | 1,839 | |
| 1,708 | |
| 153 | |
| 1,861 | | ||||
By-product credits | (247 | ) |
| - | |
| - | |
| - | | ||||
Treatment charges | 191 | |
| 191 | |
| - | |
| 191 | | ||||
Royalty on metals | 6 | |
| 5 | |
| 1 | |
| 6 | | ||||
Net cash costs | 1,789 | |
| 1,904 | |
| 154 | |
| 2,058 | | ||||
Depreciation, depletion and amortization | 367 | |
| 345 | |
| 22 | |
| 367 | | ||||
Noncash and other costs, net | 67 | |
| 78 | |
| (11 | ) |
| 67 | | ||||
Total costs | 2,223 | |
| 2,327 | |
| 165 | |
| 2,492 | | ||||
Revenue adjustments, primarily for pricing on prior period open sales | (65 | ) |
| (65 | ) |
| - | |
| (65 | ) | ||||
Gross profit | $ | 1,210 | |
| $ | 1,106 | |
| $ | 104 | |
| $ | 1,210 | |
|
|
|
|
|
|
|
| ||||||||
Copper sales (millions of recoverable pounds) | 1,135 | |
| 1,135 | |
|
|
|
| ||||||
|
|
|
|
|
|
|
| ||||||||
Gross profit per pound of copper: |
|
|
| ||||||||||||
|
|
|
|
|
|
|
| ||||||||
Revenues, excluding adjustments | $ | 3.08 | |
| $ | 3.08 | |
|
|
|
| ||||
Site production and delivery, before net noncash |
|
|
|
|
|
|
| ||||||||
and other costs shown below | 1.62 | |
| 1.50 | |
|
|
|
| ||||||
By-product credits | (0.22 | ) |
| - | |
|
|
|
| ||||||
Treatment charges | 0.17 | |
| 0.17 | |
|
|
|
| ||||||
Royalty on metals | 0.01 | |
| 0.01 | |
|
|
|
| ||||||
Unit net cash costs | 1.58 | |
| 1.68 | |
|
|
|
| ||||||
Depreciation, depletion and amortization | 0.32 | |
| 0.30 | |
|
|
|
| ||||||
Noncash and other costs, net | 0.06 | |
| 0.07 | |
|
|
|
| ||||||
Total unit costs | 1.96 | |
| 2.05 | |
|
|
|
| ||||||
Revenue adjustments, primarily for pricing |
|
|
|
|
|
|
| ||||||||
on prior period open sales | (0.05 | ) |
| (0.05 | ) |
|
|
|
| ||||||
Gross profit per pound | $ | 1.07 | |
| $ | 0.98 | |
|
|
|
| ||||
|
|
|
|
|
|
|
| ||||||||
Reconciliation to Amounts Reported |
|
|
|
|
|
|
| ||||||||
|
|
|
|
| Depreciation, |
|
| ||||||||
|
|
| Production |
| Depletion and |
|
| ||||||||
(In millions) | Revenues |
| and Delivery |
| Amortization |
|
| ||||||||
Totals presented above | $ | 3,767 | |
| $ | 1,861 | |
| $ | 367 | |
|
| ||
Treatment charges | (191 | ) |
| - | |
| - | |
|
| |||||
Royalty on metals | (6 | ) |
| - | |
| - | |
|
| |||||
Noncash and other costs, net | - | |
| 67 | |
| - | |
|
| |||||
Revenue adjustments, primarily for pricing on prior period open sales | (65 | ) |
| - | |
| - | |
|
| |||||
Eliminations and other | 27 | |
| 11 | |
| - | |
|
| |||||
South America mining | 3,532 | |
| 1,939 | |
| 367 | |
|
| |||||
Other mining & eliminations b | 13,196 | |
| 8,726 | |
| 1,191 | |
|
| |||||
Total mining | 16,728 | |
| 10,665 | |
| 1,558 | |
|
| |||||
U.S. oil & gas operations | 4,710 | |
| 1,237 | |
| 6,028 | | c |
| |||||
Corporate, other & eliminations | - | |
| 2 | |
| 14 | |
|
| |||||
As reported in FCX's consolidated financial statements | $ | 21,438 | |
| $ | 11,904 | |
| $ | 7,600 | | c |
| ||
a. | Includes gold sales of 67 thousand ounces ( $1,271 per ounce average realized price) and silver sales of 2.9 million ounces ( $18.54 per ounce average realized price). Also reflects sales of molybdenum produced by Cerro Verde to our molybdenum sales company at market-based pricing. |
b. | Represents the combined total for all other mining operations and the related eliminations, as presented in Note 16 . |
c. | Includes impairment of oil and gas properties of $3.7 billion . |
115
Table of Contents
South America Mining Product Revenues and Production Costs (continued)
Year Ended December 31, 2013 |
|
|
|
|
|
|
| ||||||||
(In millions) | By-Product |
| Co-Product Method | ||||||||||||
| Method |
| Copper |
| Other |
| Total | ||||||||
Revenues, excluding adjustments | $ | 4,366 | |
| $ | 4,366 | |
| $ | 374 | | a | $ | 4,740 | |
Site production and delivery, before net noncash |
|
|
|
|
|
|
| ||||||||
and other costs shown below | 2,023 | | b | 1,875 | |
| 170 | |
| 2,045 | | ||||
By-product credits | (352 | ) |
| - | |
| - | |
| - | | ||||
Treatment charges | 226 | |
| 226 | |
| - | |
| 226 | | ||||
Net cash costs | 1,897 | |
| 2,101 | |
| 170 | |
| 2,271 | | ||||
Depreciation, depletion and amortization | 346 | |
| 323 | |
| 23 | |
| 346 | | ||||
Noncash and other costs, net | 49 | |
| 44 | |
| 5 | |
| 49 | | ||||
Total costs | 2,292 | |
| 2,468 | |
| 198 | |
| 2,666 | | ||||
Revenue adjustments, primarily for pricing on prior period open sales | (28 | ) |
| (28 | ) |
| - | |
| (28 | ) | ||||
Gross profit | $ | 2,046 | |
| $ | 1,870 | |
| $ | 176 | |
| $ | 2,046 | |
|
|
|
|
|
|
|
| ||||||||
Copper sales (millions of recoverable pounds) | 1,325 | |
| 1,325 | |
|
|
|
| ||||||
|
|
|
|
|
|
|
| ||||||||
Gross profit per pound of copper: |
|
|
| ||||||||||||
|
|
|
|
|
|
|
| ||||||||
Revenues, excluding adjustments | $ | 3.30 | |
| $ | 3.30 | |
|
|
|
| ||||
Site production and delivery, before net noncash |
|
|
|
|
|
|
| ||||||||
and other costs shown below | 1.53 | | b | 1.42 | |
|
|
|
| ||||||
By-product credits | (0.27 | ) |
| - | |
|
|
|
| ||||||
Treatment charges | 0.17 | |
| 0.17 | |
|
|
|
| ||||||
Unit net cash costs | 1.43 | |
| 1.59 | |
|
|
|
| ||||||
Depreciation, depletion and amortization | 0.26 | |
| 0.24 | |
|
|
|
| ||||||
Noncash and other costs, net | 0.04 | |
| 0.03 | |
|
|
|
| ||||||
Total unit costs | 1.73 | |
| 1.86 | |
|
|
|
| ||||||
Revenue adjustments, primarily for pricing |
|
|
|
|
|
|
| ||||||||
on prior period open sales | (0.03 | ) |
| (0.03 | ) |
|
|
|
| ||||||
Gross profit per pound | $ | 1.54 | |
| $ | 1.41 | |
|
|
|
| ||||
|
|
|
|
|
|
|
| ||||||||
Reconciliation to Amounts Reported |
|
|
|
|
|
|
| ||||||||
|
|
|
|
| Depreciation, |
|
| ||||||||
|
|
| Production |
| Depletion and |
|
| ||||||||
(In millions) | Revenues |
| and Delivery |
| Amortization |
|
| ||||||||
Totals presented above | $ | 4,740 | |
| $ | 2,045 | |
| $ | 346 | |
|
| ||
Treatment charges | (226 | ) |
| - | |
| - | |
|
| |||||
Noncash and other costs, net | - | |
| 49 | |
| - | |
|
| |||||
Revenue adjustments, primarily for pricing on prior period open sales | (28 | ) |
| - | |
| - | |
|
| |||||
Eliminations and other | (1 | ) |
| (25 | ) |
| - | |
|
| |||||
South America mining | 4,485 | |
| 2,069 | |
| 346 | |
|
| |||||
Other mining & eliminations c | 13,816 | |
| 9,082 | |
| 1,076 | |
|
| |||||
Total mining | 18,301 | |
| 11,151 | |
| 1,422 | |
|
| |||||
U.S. oil & gas operations | 2,616 | |
| 682 | |
| 1,364 | |
|
| |||||
Corporate, other & eliminations | 4 | |
| 7 | |
| 11 | |
|
| |||||
As reported in FCX's consolidated financial statements | $ | 20,921 | |
| $ | 11,840 | |
| $ | 2,797 | |
|
| ||
a. | Includes gold sales of 102 thousand ounces ( $1,350 per ounce average realized price) and silver sales of 4.1 million ounces ( $21.88 per ounce average realized price). Also reflects sales of molybdenum produced by Cerro Verde to our molybdenum sales company at market-based pricing. |
b. | Includes $36 million ($0.03 per pound) associated with labor agreement costs at Cerro Verde. |
c. | Represents the combined total for all other mining operations and the related eliminations, as presented in Note 16 . |
116
Table of Contents
South America Mining Product Revenues and Production Costs (continued)
Year Ended December 31, 2012 |
|
|
|
|
|
|
| ||||||||
(In millions) | By-Product |
| Co-Product Method | ||||||||||||
| Method |
| Copper |
| Other |
| Total | ||||||||
Revenues, excluding adjustments | $ | 4,462 | |
| $ | 4,462 | |
| $ | 355 | | a | $ | 4,817 | |
Site production and delivery, before net noncash |
|
|
|
|
|
|
| ||||||||
and other costs shown below | 1,995 | | b | 1,846 | |
| 173 | |
| 2,019 | | ||||
By-product credits | (331 | ) |
| - | |
| - | |
| - | | ||||
Treatment charges | 202 | |
| 202 | |
| - | |
| 202 | | ||||
Net cash costs | 1,866 | |
| 2,048 | |
| 173 | |
| 2,221 | | ||||
Depreciation, depletion and amortization | 287 | |
| 272 | |
| 15 | |
| 287 | | ||||
Noncash and other costs, net | 110 | |
| 75 | |
| 35 | |
| 110 | | ||||
Total costs | 2,263 | |
| 2,395 | |
| 223 | |
| 2,618 | | ||||
Revenue adjustments, primarily for pricing on prior period open sales | 106 | |
| 106 | |
| - | |
| 106 | | ||||
Gross profit | $ | 2,305 | |
| $ | 2,173 | |
| $ | 132 | |
| $ | 2,305 | |
|
|
|
|
|
|
|
| ||||||||
Copper sales (millions of recoverable pounds) | 1,245 | |
| 1,245 | |
|
|
|
| ||||||
|
|
|
|
|
|
|
| ||||||||
Gross profit per pound of copper: |
|
|
| ||||||||||||
|
|
|
|
|
|
|
| ||||||||
Revenues, excluding adjustments | $ | 3.58 | |
| $ | 3.58 | |
|
|
|
| ||||
Site production and delivery, before net noncash |
|
|
|
|
|
|
| ||||||||
and other costs shown below | 1.60 | | b | 1.49 | |
|
|
|
| ||||||
By-product credits | (0.26 | ) |
| - | |
|
|
|
| ||||||
Treatment charges | 0.16 | |
| 0.16 | |
|
|
|
| ||||||
Unit net cash costs | 1.50 | |
| 1.65 | |
|
|
|
| ||||||
Depreciation, depletion and amortization | 0.23 | |
| 0.22 | |
|
|
|
| ||||||
Noncash and other costs, net | 0.09 | |
| 0.06 | |
|
|
|
| ||||||
Total unit costs | 1.82 | |
| 1.93 | |
|
|
|
| ||||||
Revenue adjustments, primarily for pricing |
|
|
|
|
|
|
| ||||||||
on prior period open sales | 0.09 | |
| 0.09 | |
|
|
|
| ||||||
Gross profit per pound | $ | 1.85 | |
| $ | 1.74 | |
|
|
|
| ||||
|
|
|
|
|
|
|
| ||||||||
Reconciliation to Amounts Reported |
|
|
|
|
|
|
| ||||||||
|
|
|
|
| Depreciation, |
|
| ||||||||
|
|
| Production |
| Depletion and |
|
| ||||||||
(In millions) | Revenues |
| and Delivery |
| Amortization |
|
| ||||||||
Totals presented above | $ | 4,817 | |
| $ | 2,019 | |
| $ | 287 | |
|
| ||
Treatment charges | (202 | ) |
| - | |
| - | |
|
| |||||
Noncash and other costs, net | - | |
| 110 | |
| - | |
|
| |||||
Revenue adjustments, primarily for pricing on prior period open sales | 106 | |
| - | |
| - | |
|
| |||||
Eliminations and other | 7 | |
| (15 | ) |
| - | |
|
| |||||
South America mining | 4,728 | |
| 2,114 | |
| 287 | |
|
| |||||
Other mining & eliminations c | 13,275 | |
| 8,265 | |
| 885 | |
|
| |||||
Total mining | 18,003 | |
| 10,379 | |
| 1,172 | |
|
| |||||
U.S. oil & gas operations | - | |
| - | |
| - | |
|
| |||||
Corporate, other & eliminations | 7 | |
| 3 | |
| 7 | |
|
| |||||
As reported in FCX's consolidated financial statements | $ | 18,010 | |
| $ | 10,382 | |
| $ | 1,179 | |
|
| ||
a. | Includes gold sales of 82 thousand ounces ( $1,673 per ounce average realized price) and silver sales of 3.2 million ounces ( $30.33 per ounce average realized price). Also reflects sales of molybdenum produced by Cerro Verde to our molybdenum sales company at market-based pricing. |
b. | Includes $16 million ($0.01 per pound) associated with labor agreement costs at Candelaria. |
c. | Represents the combined total for all other mining operations and the related eliminations, as presented in Note 16 . |
117
Table of Contents
Indonesia Mining Product Revenues and Production Costs
Year Ended December 31, 2014 |
|
|
| ||||||||||||||||
(In millions) | By-Product |
| Co-Product Method | ||||||||||||||||
| Method |
| Copper |
| Gold |
| Silver |
| Total | ||||||||||
Revenues, excluding adjustments | $ | 1,998 | |
| $ | 1,998 | |
| $ | 1,434 | |
| $ | 39 | | a | $ | 3,471 | |
Site production and delivery, before net noncash |
|
|
|
|
|
|
|
|
| ||||||||||
and other costs shown below | 1,831 | |
| 1,054 | |
| 757 | |
| 20 | |
| 1,831 | | |||||
Gold and silver credits | (1,491 | ) |
| - | |
| - | |
| - | |
| - | | |||||
Treatment charges | 171 | |
| 99 | |
| 70 | |
| 2 | |
| 171 | | |||||
Export duties | 77 | |
| 44 | |
| 32 | |
| 1 | |
| 77 | | |||||
Royalty on metals | 115 | |
| 66 | |
| 48 | |
| 1 | |
| 115 | | |||||
Net cash costs | 703 | |
| 1,263 | |
| 907 | |
| 24 | |
| 2,194 | | |||||
Depreciation and amortization | 266 | |
| 153 | |
| 110 | |
| 3 | |
| 266 | | |||||
Noncash and other costs, net | 191 | | b | 110 | |
| 79 | |
| 2 | |
| 191 | | |||||
Total costs | 1,160 | |
| 1,526 | |
| 1,096 | |
| 29 | |
| 2,651 | | |||||
Revenue adjustments, primarily for pricing on prior period open sales | (55 | ) |
| (55 | ) |
| 18 | |
| - | |
| (37 | ) | |||||
PT Smelting intercompany profit | 34 | |
| 20 | |
| 14 | |
| - | |
| 34 | | |||||
Gross profit | $ | 817 | |
| $ | 437 | |
| $ | 370 | |
| $ | 10 | |
| $ | 817 | |
|
|
|
|
|
|
|
|
|
| ||||||||||
Copper sales (millions of recoverable pounds) | 664 | |
| 664 | |
|
|
|
|
|
| ||||||||
Gold sales (thousands of recoverable ounces) |
|
|
|
| 1,168 | |
|
|
|
| |||||||||
|
|
|
|
|
|
|
|
|
| ||||||||||
Gross profit per pound of copper/per ounce of gold: |
|
|
|
|
| ||||||||||||||
|
|
|
|
|
|
|
|
|
| ||||||||||
Revenues, excluding adjustments | $ | 3.01 | |
| $ | 3.01 | |
| $ | 1,229 | |
|
|
|
| ||||
Site production and delivery, before net noncash |
|
|
|
|
|
|
|
|
| ||||||||||
and other costs shown below | 2.76 | |
| 1.59 | |
| 648 | |
|
|
|
| |||||||
Gold and silver credits | (2.25 | ) |
| - | |
| - | |
|
|
|
| |||||||
Treatment charges | 0.26 | |
| 0.15 | |
| 61 | |
|
|
|
| |||||||
Export duties | 0.12 | |
| 0.06 | |
| 27 | |
|
|
|
| |||||||
Royalty on metals | 0.17 | |
| 0.10 | |
| 41 | |
|
|
|
| |||||||
Unit net cash costs | 1.06 | |
| 1.90 | |
| 777 | |
|
|
|
| |||||||
Depreciation and amortization | 0.40 | |
| 0.23 | |
| 94 | |
|
|
|
| |||||||
Noncash and other costs, net | 0.29 | | b | 0.17 | |
| 68 | |
|
|
|
| |||||||
Total unit costs | 1.75 | |
| 2.30 | |
| 939 | |
|
|
|
| |||||||
Revenue adjustments, primarily for pricing on |
|
|
|
|
|
|
|
|
| ||||||||||
prior period open sales | (0.08 | ) |
| (0.08 | ) |
| 15 | |
|
|
|
| |||||||
PT Smelting intercompany profit | 0.05 | |
| 0.03 | |
| 12 | |
|
|
|
| |||||||
Gross profit per pound/ounce | $ | 1.23 | |
| $ | 0.66 | |
| $ | 317 | |
|
|
|
| ||||
|
|
|
|
|
|
|
|
|
| ||||||||||
Reconciliation to Amounts Reported |
|
|
|
|
|
|
|
|
| ||||||||||
|
|
|
|
| Depreciation, |
|
|
|
| ||||||||||
|
|
| Production |
| Depletion and |
|
|
|
| ||||||||||
(In millions) | Revenues |
| and Delivery |
| Amortization |
|
|
|
| ||||||||||
Totals presented above | $ | 3,471 | |
| $ | 1,831 | |
| $ | 266 | |
|
|
|
| ||||
Treatment charges | (171 | ) |
| - | |
| - | |
|
|
|
| |||||||
Export duties | (77 | ) |
| - | |
| - | |
|
|
|
| |||||||
Royalty on metals | (115 | ) |
| - | |
| - | |
|
|
|
| |||||||
Noncash and other costs, net | - | |
| 191 | | b | - | |
|
|
|
| |||||||
Revenue adjustments, primarily for pricing on prior period open sales | (37 | ) |
| - | |
| - | |
|
|
|
| |||||||
PT Smelting intercompany profit | - | |
| (34 | ) |
| - | |
|
|
|
| |||||||
Indonesia mining | 3,071 | |
| 1,988 | |
| 266 | |
|
|
|
| |||||||
Other mining & eliminations c | 13,657 | |
| 8,677 | |
| 1,292 | |
|
|
|
| |||||||
Total mining | 16,728 | |
| 10,665 | |
| 1,558 | |
|
|
|
| |||||||
U.S. oil & gas operations | 4,710 | |
| 1,237 | |
| 6,028 | | d |
|
|
| |||||||
Corporate, other & eliminations | - | |
| 2 | |
| 14 | |
|
|
|
| |||||||
As reported in FCX's consolidated financial statements | $ | 21,438 | |
| $ | 11,904 | |
| $ | 7,600 | | d |
|
|
| ||||
a. Includes silver sales of 2.2 million ounces ( $17.42 per ounce average realized price).
b. | Includes $143 million ($0.22 per pound) of fixed costs charged directly to cost of sales as a result of the impact of export restrictions on PT-FI's operating rates. |
c. | Represents the combined total for all other mining operations and the related eliminations, as presented in Note 16 . |
d. Includes impairment of oil and gas properties of $3.7 billion .
118
Table of Contents
Indonesia Mining Product Revenues and Production Costs (continued)
Year Ended December 31, 2013 |
|
|
| ||||||||||||||||
(In millions) | By-Product |
| Co-Product Method | ||||||||||||||||
| Method |
| Copper |
| Gold |
| Silver |
| Total | ||||||||||
Revenues, excluding adjustments | $ | 2,903 | |
| $ | 2,903 | |
| $ | 1,438 | |
| $ | 61 | | a | $ | 4,402 | |
Site production and delivery, before net noncash |
|
|
|
|
|
|
|
|
| ||||||||||
and other costs shown below | 2,174 | |
| 1,434 | |
| 710 | |
| 30 | |
| 2,174 | | |||||
Gold and silver credits | (1,497 | ) |
| - | |
| - | |
| - | |
| - | | |||||
Treatment charges | 205 | |
| 135 | |
| 67 | |
| 3 | |
| 205 | | |||||
Royalty on metals | 109 | |
| 72 | |
| 36 | |
| 1 | |
| 109 | | |||||
Net cash costs | 991 | |
| 1,641 | |
| 813 | |
| 34 | |
| 2,488 | | |||||
Depreciation and amortization | 247 | |
| 163 | |
| 80 | |
| 4 | |
| 247 | | |||||
Noncash and other costs, net | 116 | |
| 77 | |
| 38 | |
| 1 | |
| 116 | | |||||
Total costs | 1,354 | |
| 1,881 | |
| 931 | |
| 39 | |
| 2,851 | | |||||
Revenue adjustments, primarily for pricing on prior period open sales | 1 | |
| 1 | |
| (2 | ) |
| - | |
| (1 | ) | |||||
PT Smelting intercompany loss | (19 | ) |
| (12 | ) |
| (6 | ) |
| (1 | ) |
| (19 | ) | |||||
Gross profit | $ | 1,531 | |
| $ | 1,011 | |
| $ | 499 | |
| $ | 21 | |
| $ | 1,531 | |
|
|
|
|
|
|
|
|
|
| ||||||||||
Copper sales (millions of recoverable pounds) | 885 | |
| 885 | |
|
|
|
|
|
| ||||||||
Gold sales (thousands of recoverable ounces) |
|
|
|
| 1,096 | |
|
|
|
| |||||||||
|
|
|
|
|
|
|
|
|
| ||||||||||
Gross profit per pound of copper/per ounce of gold: |
|
|
|
|
| ||||||||||||||
|
|
|
|
|
|
|
|
|
| ||||||||||
Revenues, excluding adjustments | $ | 3.28 | |
| $ | 3.28 | |
| $ | 1,312 | |
|
|
|
| ||||
Site production and delivery, before net noncash |
|
|
|
|
|
|
|
|
| ||||||||||
and other costs shown below | 2.46 | |
| 1.62 | |
| 648 | |
|
|
|
| |||||||
Gold and silver credits | (1.69 | ) |
| - | |
| - | |
|
|
|
| |||||||
Treatment charges | 0.23 | |
| 0.15 | |
| 61 | |
|
|
|
| |||||||
Royalty on metals | 0.12 | |
| 0.08 | |
| 33 | |
|
|
|
| |||||||
Unit net cash costs | 1.12 | |
| 1.85 | |
| 742 | |
|
|
|
| |||||||
Depreciation and amortization | 0.28 | |
| 0.19 | |
| 73 | |
|
|
|
| |||||||
Noncash and other costs, net | 0.13 | |
| 0.09 | |
| 35 | |
|
|
|
| |||||||
Total unit costs | 1.53 | |
| 2.13 | |
| 850 | |
|
|
|
| |||||||
Revenue adjustments, primarily for pricing on |
|
|
|
|
|
|
|
|
| ||||||||||
prior period open sales | - | |
| - | |
| (1 | ) |
|
|
|
| |||||||
PT Smelting intercompany loss | (0.02 | ) |
| (0.01 | ) |
| (6 | ) |
|
|
|
| |||||||
Gross profit per pound/ounce | $ | 1.73 | |
| $ | 1.14 | |
| $ | 455 | |
|
|
|
| ||||
|
|
|
|
|
|
|
|
|
| ||||||||||
Reconciliation to Amounts Reported |
|
|
|
|
|
|
|
|
| ||||||||||
|
|
|
|
| Depreciation, |
|
|
|
| ||||||||||
|
|
| Production |
| Depletion and |
|
|
|
| ||||||||||
(In millions) | Revenues |
| and Delivery |
| Amortization |
|
|
|
| ||||||||||
Totals presented above | $ | 4,402 | |
| $ | 2,174 | |
| $ | 247 | |
|
|
|
| ||||
Treatment charges | (205 | ) |
| - | |
| - | |
|
|
|
| |||||||
Royalty on metals | (109 | ) |
| - | |
| - | |
|
|
|
| |||||||
Noncash and other costs, net | - | |
| 116 | |
| - | |
|
|
|
| |||||||
Revenue adjustments, primarily for pricing on prior period open sales | (1 | ) |
| - | |
| - | |
|
|
|
| |||||||
PT Smelting intercompany loss | - | |
| 19 | |
| - | |
|
|
|
| |||||||
Indonesia mining | 4,087 | |
| 2,309 | |
| 247 | |
|
|
|
| |||||||
Other mining & eliminations b | 14,214 | |
| 8,842 | |
| 1,175 | |
|
|
|
| |||||||
Total mining | 18,301 | |
| 11,151 | |
| 1,422 | |
|
|
|
| |||||||
U.S. oil & gas operations | 2,616 | |
| 682 | |
| 1,364 | |
|
|
|
| |||||||
Corporate, other & eliminations | 4 | |
| 7 | |
| 11 | |
|
|
|
| |||||||
As reported in FCX's consolidated financial statements | $ | 20,921 | |
| $ | 11,840 | |
| $ | 2,797 | |
|
|
|
| ||||
a. | Includes silver sales of 2.9 million ounces ( $21.32 per ounce average realized price). |
b. | Represents the combined total for all other mining operations and the related eliminations, as presented in Note 16 . |
119
Table of Contents
Indonesia Mining Product Revenues and Production Costs (continued)
Year Ended December 31, 2012 |
|
|
| ||||||||||||||||
(In millions) | By-Product |
| Co-Product Method | ||||||||||||||||
| Method |
| Copper |
| Gold |
| Silver |
| Total | ||||||||||
Revenues, excluding adjustments | $ | 2,564 | |
| $ | 2,564 | |
| $ | 1,522 | |
| $ | 64 | | a | $ | 4,150 | |
Site production and delivery, before net noncash |
|
|
|
|
|
|
|
|
| ||||||||||
and other costs shown below | 2,230 | |
| 1,378 | |
| 818 | |
| 34 | |
| 2,230 | | |||||
Gold and silver credits | (1,589 | ) |
| - | |
| - | |
| - | |
| - | | |||||
Treatment charges | 152 | |
| 94 | |
| 56 | |
| 2 | |
| 152 | | |||||
Royalty on metals | 93 | |
| 58 | |
| 34 | |
| 1 | |
| 93 | | |||||
Net cash costs | 886 | |
| 1,530 | |
| 908 | |
| 37 | |
| 2,475 | | |||||
Depreciation and amortization | 212 | |
| 131 | |
| 78 | |
| 3 | |
| 212 | | |||||
Noncash and other costs, net | 82 | |
| 50 | |
| 30 | |
| 2 | |
| 82 | | |||||
Total costs | 1,180 | |
| 1,711 | |
| 1,016 | |
| 42 | |
| 2,769 | | |||||
Revenue adjustments, primarily for pricing on prior period open sales | 13 | |
| 13 | |
| 3 | |
| - | |
| 16 | | |||||
PT Smelting intercompany loss | (37 | ) |
| (23 | ) |
| (13 | ) |
| (1 | ) |
| (37 | ) | |||||
Gross profit | $ | 1,360 | |
| $ | 843 | |
| $ | 496 | |
| $ | 21 | |
| $ | 1,360 | |
|
|
|
|
|
|
|
|
|
| ||||||||||
Copper sales (millions of recoverable pounds) | 716 | |
| 716 | |
|
|
|
|
|
| ||||||||
Gold sales (thousands of recoverable ounces) |
|
|
|
| 915 | |
|
|
|
| |||||||||
|
|
|
|
|
|
|
|
|
| ||||||||||
Gross profit per pound of copper/per ounce of gold: |
|
|
|
|
| ||||||||||||||
|
|
|
|
|
|
|
|
|
| ||||||||||
Revenues, excluding adjustments | $ | 3.58 | |
| $ | 3.58 | |
| $ | 1,664 | |
|
|
|
| ||||
Site production and delivery, before net noncash |
|
|
|
|
|
|
|
|
| ||||||||||
and other costs shown below | 3.12 | |
| 1.93 | |
| 894 | |
|
|
|
| |||||||
Gold and silver credits | (2.22 | ) |
| - | |
| - | |
|
|
|
| |||||||
Treatment charges | 0.21 | |
| 0.13 | |
| 61 | |
|
|
|
| |||||||
Royalty on metals | 0.13 | |
| 0.08 | |
| 38 | |
|
|
|
| |||||||
Unit net cash costs | 1.24 | |
| 2.14 | |
| 993 | |
|
|
|
| |||||||
Depreciation and amortization | 0.30 | |
| 0.18 | |
| 85 | |
|
|
|
| |||||||
Noncash and other costs, net | 0.11 | |
| 0.07 | |
| 33 | |
|
|
|
| |||||||
Total unit costs | 1.65 | |
| 2.39 | |
| 1,111 | |
|
|
|
| |||||||
Revenue adjustments, primarily for pricing on |
|
|
|
|
|
|
|
|
| ||||||||||
prior period open sales | 0.02 | |
| 0.02 | |
| 3 | |
|
|
|
| |||||||
PT Smelting intercompany loss | (0.05 | ) |
| (0.03 | ) |
| (15 | ) |
|
|
|
| |||||||
Gross profit per pound/ounce | $ | 1.90 | |
| $ | 1.18 | |
| $ | 541 | |
|
|
|
| ||||
|
|
|
|
|
|
|
|
|
| ||||||||||
Reconciliation to Amounts Reported |
|
|
|
|
|
|
|
|
| ||||||||||
|
|
|
|
| Depreciation, |
|
|
|
| ||||||||||
|
|
| Production |
| Depletion and |
|
|
|
| ||||||||||
(In millions) | Revenues |
| and Delivery |
| Amortization |
|
|
|
| ||||||||||
Totals presented above | $ | 4,150 | |
| $ | 2,230 | |
| $ | 212 | |
|
|
|
| ||||
Treatment charges | (152 | ) |
| - | |
| - | |
|
|
|
| |||||||
Royalty on metals | (93 | ) |
| - | |
| - | |
|
|
|
| |||||||
Noncash and other costs, net | - | |
| 82 | |
| - | |
|
|
|
| |||||||
Revenue adjustments, primarily for pricing on prior period open sales | 16 | |
| - | |
| - | |
|
|
|
| |||||||
PT Smelting intercompany loss | - | |
| 37 | |
| - | |
|
|
|
| |||||||
Indonesia mining | 3,921 | |
| 2,349 | |
| 212 | |
|
|
|
| |||||||
Other mining & eliminations b | 14,082 | |
| 8,030 | |
| 960 | |
|
|
|
| |||||||
Total mining | 18,003 | |
| 10,379 | |
| 1,172 | |
|
|
|
| |||||||
U.S. oil & gas operations | - | |
| - | |
| - | |
|
|
|
| |||||||
Corporate, other & eliminations | 7 | |
| 3 | |
| 7 | |
|
|
|
| |||||||
As reported in FCX's consolidated financial statements | $ | 18,010 | |
| $ | 10,382 | |
| $ | 1,179 | |
|
|
|
| ||||
a. | Includes silver sales of 2.1 million ounces ( $30.70 per ounce average realized price). |
b. | Represents the combined total for all other mining operations and the related eliminations, as presented in Note 16 . |
120
Table of Contents
Africa Mining Product Revenues and Production Costs
Year Ended December 31, 2014 |
|
|
|
|
|
|
| ||||||||
(In millions) | By-Product |
| Co-Product Method | ||||||||||||
| Method |
| Copper |
| Cobalt |
| Total | ||||||||
Revenues, excluding adjustments a | $ | 1,301 | |
| $ | 1,301 | |
| $ | 285 | |
| $ | 1,586 | |
Site production and delivery, before net noncash |
|
|
|
|
|
|
| ||||||||
and other costs shown below | 665 | |
| 591 | |
| 157 | |
| 748 | | ||||
Cobalt credits b | (204 | ) |
| - | |
| - | |
| - | | ||||
Royalty on metals | 29 | |
| 24 | |
| 5 | |
| 29 | | ||||
Net cash costs | 490 | |
| 615 | |
| 162 | |
| 777 | | ||||
Depreciation, depletion and amortization | 228 | |
| 195 | |
| 33 | |
| 228 | | ||||
Noncash and other costs, net | 22 | |
| 19 | |
| 3 | |
| 22 | | ||||
Total costs | 740 | |
| 829 | |
| 198 | |
| 1,027 | | ||||
Revenue adjustments, primarily for pricing on prior period open sales | (1 | ) |
| (1 | ) |
| 2 | |
| 1 | | ||||
Gross profit | $ | 560 | |
| $ | 471 | |
| $ | 89 | |
| $ | 560 | |
|
|
|
|
|
|
|
| ||||||||
Copper sales (millions of recoverable pounds) | 425 | |
| 425 | |
|
|
|
| ||||||
Cobalt sales (millions of contained pounds) |
|
|
|
| 30 | |
|
| |||||||
|
|
|
|
|
|
|
| ||||||||
Gross profit per pound of copper and cobalt: |
|
|
| ||||||||||||
|
|
|
|
|
|
|
| ||||||||
Revenues, excluding adjustments a | $ | 3.06 | |
| $ | 3.06 | |
| $ | 9.66 | |
|
| ||
Site production and delivery, before net noncash |
|
|
|
|
|
|
| ||||||||
and other costs shown below | 1.56 | |
| 1.39 | |
| 5.30 | |
|
| |||||
Cobalt credits b | (0.48 | ) |
| - | |
| - | |
|
| |||||
Royalty on metals | 0.07 | |
| 0.06 | |
| 0.16 | |
|
| |||||
Unit net cash costs | 1.15 | |
| 1.45 | |
| 5.46 | |
|
| |||||
Depreciation, depletion and amortization | 0.54 | |
| 0.46 | |
| 1.13 | |
|
| |||||
Noncash and other costs, net | 0.05 | |
| 0.04 | |
| 0.11 | |
|
| |||||
Total unit costs | 1.74 | |
| 1.95 | |
| 6.70 | |
|
| |||||
Revenue adjustments, primarily for pricing on |
|
|
|
|
|
|
| ||||||||
prior period open sales | - | |
| - | |
| 0.07 | |
|
| |||||
Gross profit per pound | $ | 1.32 | |
| $ | 1.11 | |
| $ | 3.03 | |
|
| ||
|
|
|
|
|
|
|
| ||||||||
Reconciliation to Amounts Reported |
|
|
|
|
|
|
| ||||||||
|
|
|
|
| Depreciation, |
|
| ||||||||
|
|
| Production |
| Depletion and |
|
| ||||||||
(In millions) | Revenues |
| and Delivery |
| Amortization |
|
| ||||||||
Totals presented above | $ | 1,586 | |
| $ | 748 | |
| $ | 228 | |
|
| ||
Royalty on metals | (29 | ) |
| - | |
| - | |
|
| |||||
Noncash and other costs, net | - | |
| 22 | |
| - | |
|
| |||||
Revenue adjustments, primarily for pricing on prior period open sales | 1 | |
| - | |
| - | |
|
| |||||
Africa mining | 1,558 | |
| 770 | |
| 228 | |
|
| |||||
Other mining & eliminations c | 15,170 | |
| 9,895 | |
| 1,330 | |
|
| |||||
Total mining | 16,728 | |
| 10,665 | |
| 1,558 | |
|
| |||||
U.S. oil & gas operations | 4,710 | |
| 1,237 | |
| 6,028 | | d |
| |||||
Corporate, other & eliminations | - | |
| 2 | |
| 14 | |
|
| |||||
As reported in FCX's consolidated financial statements | $ | 21,438 | |
| $ | 11,904 | |
| $ | 7,600 | | d |
| ||
a. | Includes point-of-sale transportation costs as negotiated in customer contracts. |
b. | Net of cobalt downstream processing and freight costs. |
c. | Represents the combined total for all other mining operations and the related eliminations, as presented in Note 16 . |
d. | Includes impairment of oil and gas properties of $3.7 billion . |
121
Table of Contents
Africa Mining Product Revenues and Production Costs (continued)
Year Ended December 31, 2013 |
|
|
|
|
|
|
| ||||||||
(In millions) | By-Product |
| Co-Product Method | ||||||||||||
| Method |
| Copper |
| Cobalt |
| Total | ||||||||
Revenues, excluding adjustments a | $ | 1,457 | |
| $ | 1,457 | |
| $ | 205 | |
| $ | 1,662 | |
Site production and delivery, before net noncash |
|
|
|
|
|
|
| ||||||||
and other costs shown below | 649 | |
| 614 | |
| 111 | |
| 725 | | ||||
Cobalt credits b | (131 | ) |
| - | |
| - | |
| - | | ||||
Royalty on metals | 29 | |
| 26 | |
| 3 | |
| 29 | | ||||
Net cash costs | 547 | |
| 640 | |
| 114 | |
| 754 | | ||||
Depreciation, depletion and amortization | 246 | |
| 220 | |
| 26 | |
| 246 | | ||||
Noncash and other costs, net | 29 | |
| 26 | |
| 3 | |
| 29 | | ||||
Total costs | 822 | |
| 886 | |
| 143 | |
| 1,029 | | ||||
Revenue adjustments, primarily for pricing on prior period open sales | 2 | |
| 2 | |
| 2 | |
| 4 | | ||||
Gross profit | $ | 637 | |
| $ | 573 | |
| $ | 64 | |
| $ | 637 | |
|
|
|
|
|
|
|
| ||||||||
Copper sales (millions of recoverable pounds) | 454 | |
| 454 | |
|
|
|
| ||||||
Cobalt sales (millions of contained pounds) |
|
|
|
| 25 | |
|
| |||||||
|
|
|
|
|
|
|
| ||||||||
Gross profit per pound of copper and cobalt: |
|
|
| ||||||||||||
|
|
|
|
|
|
|
| ||||||||
Revenues, excluding adjustments a | $ | 3.21 | |
| $ | 3.21 | |
| $ | 8.02 | |
|
| ||
Site production and delivery, before net noncash |
|
|
|
|
|
|
| ||||||||
and other costs shown below | 1.43 | |
| 1.35 | |
| 4.35 | |
|
| |||||
Cobalt credits b | (0.29 | ) |
| - | |
| - | |
|
| |||||
Royalty on metals | 0.07 | |
| 0.06 | |
| 0.14 | |
|
| |||||
Unit net cash costs | 1.21 | |
| 1.41 | |
| 4.49 | |
|
| |||||
Depreciation, depletion and amortization | 0.54 | |
| 0.48 | |
| 1.00 | |
|
| |||||
Noncash and other costs, net | 0.06 | |
| 0.06 | |
| 0.11 | |
|
| |||||
Total unit costs | 1.81 | |
| 1.95 | |
| 5.60 | |
|
| |||||
Revenue adjustments, primarily for pricing on |
|
|
|
|
|
|
| ||||||||
prior period open sales | - | |
| - | |
| 0.09 | |
|
| |||||
Gross profit per pound | $ | 1.40 | |
| $ | 1.26 | |
| $ | 2.51 | |
|
| ||
|
|
|
|
|
|
|
| ||||||||
Reconciliation to Amounts Reported |
|
|
|
|
|
|
| ||||||||
|
|
|
|
| Depreciation, |
|
| ||||||||
|
|
| Production |
| Depletion and |
|
| ||||||||
(In millions) | Revenues |
| and Delivery |
| Amortization |
|
| ||||||||
Totals presented above | $ | 1,662 | |
| $ | 725 | |
| $ | 246 | |
|
| ||
Royalty on metals | (29 | ) |
| - | |
| - | |
|
| |||||
Noncash and other costs, net | - | |
| 29 | |
| - | |
|
| |||||
Revenue adjustments, primarily for pricing on prior period open sales | 4 | |
| - | |
| - | |
|
| |||||
Africa mining | 1,637 | |
| 754 | |
| 246 | |
|
| |||||
Other mining & eliminations c | 16,664 | |
| 10,397 | |
| 1,176 | |
|
| |||||
Total mining | 18,301 | |
| 11,151 | |
| 1,422 | |
|
| |||||
U.S. oil & gas operations | 2,616 | |
| 682 | |
| 1,364 | |
|
| |||||
Corporate, other & eliminations | 4 | |
| 7 | |
| 11 | |
|
| |||||
As reported in FCX's consolidated financial statements | $ | 20,921 | |
| $ | 11,840 | |
| $ | 2,797 | |
|
| ||
a. | Includes point-of-sale transportation costs as negotiated in customer contracts. |
b. | Net of cobalt downstream processing and freight costs. |
c. | Represents the combined total for all other mining operations and the related eliminations, as presented in Note 16 . |
122
Table of Contents
Africa Mining Product Revenues and Production Costs (continued)
Year Ended December 31, 2012 |
|
|
|
|
|
|
| ||||||||
(In millions) | By-Product |
| Co-Product Method | ||||||||||||
| Method |
| Copper |
| Cobalt |
| Total | ||||||||
Revenues, excluding adjustments a | $ | 1,179 | |
| $ | 1,179 | |
| $ | 194 | |
| $ | 1,373 | |
Site production and delivery, before net noncash |
|
|
|
|
|
|
| ||||||||
and other costs shown below | 501 | |
| 465 | |
| 121 | |
| 586 | | ||||
Cobalt credits b | (112 | ) |
| - | |
| - | |
| - | | ||||
Royalty on metals | 25 | |
| 22 | |
| 3 | |
| 25 | | ||||
Net cash costs | 414 | |
| 487 | |
| 124 | |
| 611 | | ||||
Depreciation, depletion and amortization | 176 | |
| 160 | |
| 16 | |
| 176 | | ||||
Noncash and other costs, net | 29 | |
| 26 | |
| 3 | |
| 29 | | ||||
Total costs | 619 | |
| 673 | |
| 143 | |
| 816 | | ||||
Revenue adjustments, primarily for pricing on prior period open sales | 8 | |
| 8 | |
| 3 | |
| 11 | | ||||
Gross profit | $ | 568 | |
| $ | 514 | |
| $ | 54 | |
| $ | 568 | |
|
|
|
|
|
|
|
| ||||||||
Copper sales (millions of recoverable pounds) | 336 | |
| 336 | |
|
|
|
| ||||||
Cobalt sales (millions of contained pounds) |
|
|
|
| 25 | |
|
| |||||||
|
|
|
|
|
|
|
| ||||||||
Gross profit per pound of copper and cobalt: |
|
|
| ||||||||||||
|
|
|
|
|
|
|
| ||||||||
Revenues, excluding adjustments a | $ | 3.51 | |
| $ | 3.51 | |
| $ | 7.83 | |
|
| ||
Site production and delivery, before net noncash |
|
|
|
|
|
|
| ||||||||
and other costs shown below | 1.49 | |
| 1.39 | |
| 4.86 | |
|
| |||||
Cobalt credits b | (0.33 | ) |
| - | |
| - | |
|
| |||||
Royalty on metals | 0.07 | |
| 0.06 | |
| 0.12 | |
|
| |||||
Unit net cash costs | 1.23 | |
| 1.45 | |
| 4.98 | |
|
| |||||
Depreciation, depletion and amortization | 0.52 | |
| 0.47 | |
| 0.67 | |
|
| |||||
Noncash and other costs, net | 0.09 | |
| 0.08 | |
| 0.11 | |
|
| |||||
Total unit costs | 1.84 | |
| 2.00 | |
| 5.76 | |
|
| |||||
Revenue adjustments, primarily for pricing on |
|
|
|
|
|
|
| ||||||||
prior period open sales | 0.02 | |
| 0.02 | |
| 0.09 | |
|
| |||||
Gross profit per pound | $ | 1.69 | |
| $ | 1.53 | |
| $ | 2.16 | |
|
| ||
|
|
|
|
|
|
|
| ||||||||
Reconciliation to Amounts Reported |
|
|
|
|
|
|
| ||||||||
|
|
|
|
| Depreciation, |
|
| ||||||||
|
|
| Production |
| Depletion and |
|
| ||||||||
(In millions) | Revenues |
| and Delivery |
| Amortization |
|
| ||||||||
Totals presented above | $ | 1,373 | |
| $ | 586 | |
| $ | 176 | |
|
| ||
Royalty on metals | (25 | ) |
| - | |
| - | |
|
| |||||
Noncash and other costs, net | - | |
| 29 | |
| - | |
|
| |||||
Revenue adjustments, primarily for pricing on prior period open sales | 11 | |
| - | |
| - | |
|
| |||||
Africa mining | 1,359 | |
| 615 | |
| 176 | |
|
| |||||
Other mining & eliminations c | 16,644 | |
| 9,764 | |
| 996 | |
|
| |||||
Total mining | 18,003 | |
| 10,379 | |
| 1,172 | |
|
| |||||
U.S. oil & gas operations | - | |
| - | |
| - | |
|
| |||||
Corporate, other & eliminations | 7 | |
| 3 | |
| 7 | |
|
| |||||
As reported in FCX's consolidated financial statements | $ | 18,010 | |
| $ | 10,382 | |
| $ | 1,179 | |
|
| ||
a. | Includes point-of-sale transportation costs as negotiated in customer contracts. |
b. | Net of cobalt downstream processing and freight costs. |
c. | Represents the combined total for all other mining operations and the related eliminations, as presented in Note 16 . |
123
Table of Contents
Molybdenum Mines Product Revenues and Production Costs
| Years Ended December 31, |
|
|
|
| ||||||||||
(In millions) | 2014 a |
| 2013 a |
| 2012 a |
|
|
|
| ||||||
Revenues, excluding adjustments b | $ | 630 | |
| $ | 566 | |
| $ | 484 | |
|
|
|
|
Site production and delivery, before net noncash |
|
|
|
|
|
|
|
|
| ||||||
and other costs shown below | 321 | |
| 303 | |
| 210 | |
|
|
|
| |||
Treatment charges and other | 43 | |
| 44 | |
| 30 | |
|
|
|
| |||
Net cash costs | 364 | |
| 347 | |
| 240 | |
|
|
|
| |||
Depreciation, depletion and amortization | 92 | |
| 82 | |
| 33 | |
|
|
|
| |||
Noncash and other costs, net | 7 | |
| 14 | |
| 8 | |
|
|
|
| |||
Total costs | 463 | |
| 443 | |
| 281 | |
|
|
|
| |||
Gross profit | $ | 167 | |
| $ | 123 | |
| $ | 203 | |
|
|
|
|
|
|
|
|
|
|
|
|
|
| ||||||
Molybdenum sales (millions of recoverable pounds) b | 51 | |
| 49 | |
| 34 | |
|
|
|
| |||
|
|
|
|
|
|
|
|
|
| ||||||
Gross profit per pound of molybdenum: |
|
|
|
|
|
| |||||||||
|
|
|
|
|
|
|
|
|
| ||||||
Revenues, excluding adjustments b | $ | 12.28 | |
| $ | 11.65 | |
| $ | 14.27 | |
|
|
|
|
Site production and delivery, before net noncash |
|
|
|
|
|
|
|
|
| ||||||
and other costs shown below | 6.24 | |
| 6.24 | |
| 6.19 | |
|
|
|
| |||
Treatment charges and other | 0.84 | |
| 0.91 | |
| 0.88 | |
|
|
|
| |||
Unit net cash costs | 7.08 | |
| 7.15 | |
| 7.07 | |
|
|
|
| |||
Depreciation, depletion and amortization | 1.80 | |
| 1.68 | |
| 0.97 | |
|
|
|
| |||
Noncash and other costs, net | 0.15 | |
| 0.29 | |
| 0.24 | |
|
|
|
| |||
Total unit costs | 9.03 | |
| 9.12 | |
| 8.28 | |
|
|
|
| |||
Gross profit per pound | $ | 3.25 | |
| $ | 2.53 | |
| $ | 5.99 | |
|
|
|
|
|
|
|
|
|
|
|
|
|
| ||||||
Reconciliation to Amounts Reported |
|
|
|
| Depreciation, |
|
|
|
| ||||||
|
|
| Production |
| Depletion and |
|
|
|
| ||||||
Year Ended December 31, 2014 | Revenues |
| and Delivery |
| Amortization |
|
|
|
| ||||||
Totals presented above | $ | 630 | |
| $ | 321 | |
| $ | 92 | |
|
|
|
|
Treatment charges and other | (43 | ) |
| - | |
| - | |
|
|
|
| |||
Noncash and other costs, net | - | |
| 7 | |
| - | |
|
|
|
| |||
Molybdenum mines | 587 | |
| 328 | |
| 92 | |
|
|
|
| |||
Other mining & eliminations c | 16,141 | |
| 10,337 | |
| 1,466 | |
|
|
|
| |||
Total mining | 16,728 | |
| 10,665 | |
| 1,558 | |
|
|
|
| |||
U.S. oil & gas operations | 4,710 | |
| 1,237 | |
| 6,028 | | d |
|
|
| |||
Corporate, other & eliminations | - | |
| 2 | |
| 14 | |
|
|
|
| |||
As reported in FCX's consolidated financial statements | $ | 21,438 | |
| $ | 11,904 | |
| $ | 7,600 | | d |
|
|
|
|
|
|
|
|
|
|
|
|
| ||||||
Year Ended December 31, 2013 |
|
|
|
|
|
|
|
|
| ||||||
Totals presented above | $ | 566 | |
| $ | 303 | |
| $ | 82 | |
|
|
|
|
Treatment charges and other | (44 | ) |
| - | |
| - | |
|
|
|
| |||
Noncash and other costs, net | - | |
| 14 | |
| - | |
|
|
|
| |||
Molybdenum mines | 522 | |
| 317 | |
| 82 | |
|
|
|
| |||
Other mining & eliminations c | 17,779 | |
| 10,834 | |
| 1,340 | |
|
|
|
| |||
Total mining | 18,301 | |
| 11,151 | |
| 1,422 | |
|
|
|
| |||
U.S. oil & gas operations | 2,616 | |
| 682 | |
| 1,364 | |
|
|
|
| |||
Corporate, other & eliminations | 4 | |
| 7 | |
| 11 | |
|
|
|
| |||
As reported in FCX's consolidated financial statements | $ | 20,921 | |
| $ | 11,840 | |
| $ | 2,797 | |
|
|
|
|
|
|
|
|
|
|
|
|
|
| ||||||
Year Ended December 31, 2012 |
|
|
|
|
|
|
|
|
| ||||||
Totals presented above | $ | 484 | |
| $ | 210 | |
| $ | 33 | |
|
|
|
|
Treatment charges and other | (30 | ) |
| - | |
| - | |
|
|
|
| |||
Noncash and other costs, net | - | |
| 8 | |
| - | |
|
|
|
| |||
Henderson mine | 454 | |
| 218 | |
| 33 | |
|
|
|
| |||
Climax mine | 75 | |
| 102 | |
| 26 | |
|
|
|
| |||
Molybdenum mines | 529 | |
| 320 | |
| 59 | |
|
|
|
| |||
Other mining & eliminations c | 17,474 | |
| 10,059 | |
| 1,113 | |
|
|
|
| |||
Total mining | 18,003 | |
| 10,379 | |
| 1,172 | |
|
|
|
| |||
U.S. oil & gas operations | - | |
| - | |
| - | |
|
|
|
| |||
Corporate, other & eliminations | 7 | |
| 3 | |
| 7 | |
|
|
|
| |||
As reported in FCX's consolidated financial statements | $ | 18,010 | |
| $ | 10,382 | |
| $ | 1,179 | |
|
|
|
|
|
|
|
|
|
|
|
|
|
| ||||||
a. The years 2014 and 2013 include the combined results of the Henderson and Climax mines; the year 2012 reflects the results of only the Henderson mine as start-up activities were still underway at the Climax mine. | |||||||||||||||
|
|
|
|
|
|
|
|
|
| ||||||
b. Reflects sales of the molybdenum mines' production to FCX's molybdenum sales company at market-based pricing. On a consolidated basis, realizations are based on the actual contract terms for sales to third parties; as a result, FCX's consolidated average realized price per pound of molybdenum will differ from the amounts reported in this table. | |||||||||||||||
|
|
|
|
|
|
|
|
|
| ||||||
c. Represents the combined total for all other mining operations and the related eliminations, as presented in Note 16. Also includes amounts associated with FCX's molybdenum sales company, which includes sales of molybdenum produced by the molybdenum mines and by certain of the North and South America copper mines. | |||||||||||||||
|
|
|
|
|
|
|
|
|
| ||||||
d. Includes impairment of oil and gas properties of $3.7 billion. | |||||||||||||||
124
Table of Contents
U.S. Oil & Gas Product Revenues, Cash Production Costs and Realizations
|
|
|
|
|
|
|
|
| ||||||||
Year Ended December 31, 2014 |
|
|
|
|
|
|
|
| ||||||||
|
|
|
|
|
|
| Total |
| ||||||||
|
|
| Natural |
|
|
| U.S. Oil |
| ||||||||
(In millions) | Oil |
| Gas |
| NGLs |
| & Gas |
| ||||||||
Oil and gas revenues before derivatives | $ | 3,721 | |
| $ | 353 | |
| $ | 128 | |
| $ | 4,202 | |
|
Realized cash losses on derivative contracts | (111 | ) |
| (11 | ) |
| - | |
| (122 | ) |
| ||||
Realized revenues | $ | 3,610 | |
| $ | 342 | |
| $ | 128 | |
| 4,080 | |
| |
Less: cash production costs |
|
|
|
|
|
| 1,140 | |
| |||||||
Cash operating margin |
|
|
|
|
|
| 2,940 | |
| |||||||
Less: depreciation, depletion and amortization |
|
|
|
|
|
| 2,291 | |
| |||||||
Less: impairment of oil and gas properties |
|
|
|
|
|
| 3,737 | |
| |||||||
Less: accretion and other costs |
|
|
|
|
|
| 97 | |
| |||||||
Plus: net noncash mark-to-market gains on derivative contracts |
|
|
|
|
|
| 627 | |
| |||||||
Plus: other net adjustments |
|
|
|
|
|
| 3 | |
| |||||||
Gross loss |
|
|
|
|
|
| $ | (2,555 | ) |
| ||||||
|
|
|
|
|
|
|
|
| ||||||||
Oil (MMBbls) | 40.1 | |
|
|
|
|
|
|
| |||||||
Gas (Bcf) |
|
| 80.8 | |
|
|
|
|
| |||||||
NGLs (MMBbls) |
|
|
|
| 3.2 | |
|
|
| |||||||
Oil Equivalents (MMBOE) |
|
|
|
|
|
| 56.8 | |
| |||||||
|
|
|
|
|
|
|
|
| ||||||||
| Oil |
| Natural Gas |
| NGLs |
|
|
| ||||||||
| (per barrel) |
| (per MMBtu) |
| (per barrel) |
| Per BOE |
| ||||||||
Oil and gas revenues before derivatives | $ | 92.76 | |
| $ | 4.37 | |
| $ | 39.73 | |
| $ | 73.98 | |
|
Realized cash losses on derivative contracts | (2.76 | ) |
| (0.14 | ) |
| - | |
| (2.15 | ) |
| ||||
Realized revenues | $ | 90.00 | |
| $ | 4.23 | |
| $ | 39.73 | |
| 71.83 | |
| |
Less: cash production costs |
|
|
|
|
|
| 20.08 | |
| |||||||
Cash operating margin |
|
|
|
|
|
| 51.75 | |
| |||||||
Less: depreciation, depletion and amortization |
|
|
|
|
|
| 40.34 | |
| |||||||
Less: impairment of oil and gas properties |
|
|
|
|
|
| 65.80 | |
| |||||||
Less: accretion and other costs |
|
|
|
|
|
| 1.69 | |
| |||||||
Plus: net noncash mark-to-market gains on derivative contracts |
|
|
|
|
|
| 11.03 | |
| |||||||
Plus: other net adjustments |
|
|
|
|
|
| 0.06 | |
| |||||||
Gross loss |
|
|
|
|
|
| $ | (44.99 | ) |
| ||||||
|
|
|
|
|
|
|
|
| ||||||||
Reconciliation to Amounts Reported |
| |||||||||||||||
(In millions) | Revenues |
| Production and Delivery |
| Depreciation, Depletion and Amortization |
|
|
| ||||||||
Totals presented above | $ | 4,202 | |
| $ | 1,140 | |
| $ | 2,291 | |
|
|
| ||
Realized cash losses on derivative contracts | (122 | ) |
| - | |
| - | |
|
|
| |||||
Net noncash mark-to-market gains on derivative contracts | 627 | |
| - | |
| - | |
|
|
| |||||
Accretion and other costs | - | |
| 97 | |
| - | |
|
|
| |||||
Impairment of oil and gas properties | - | |
| - | |
| 3,737 | |
|
|
| |||||
Other net adjustments | 3 | |
| - | |
| - | |
|
|
| |||||
U.S. oil & gas operations | 4,710 | |
| 1,237 | |
| 6,028 | |
|
|
| |||||
Total mining a | 16,728 | |
| 10,665 | |
| 1,558 | |
|
|
| |||||
Corporate, other & eliminations | - | |
| 2 | |
| 14 | |
|
|
| |||||
As reported in FCX's consolidated financial statements | $ | 21,438 | |
| $ | 11,904 | |
| $ | 7,600 | |
|
|
| ||
|
|
|
|
|
|
|
|
| ||||||||
|
|
|
|
|
|
|
|
| ||||||||
a. Represents the combined total for mining operations and the related eliminations, as presented in Note 16 .
125
Table of Contents
U.S. Oil & Gas Product Revenues, Cash Production Costs and Realizations (continued)
Seven months from June 1, 2013, to December 31, 2013 |
|
|
|
|
|
| ||||||||||
|
|
|
|
|
|
| Total |
| ||||||||
(In millions) | Oil |
| Natural Gas |
| NGLs |
| U.S.Oil & Gas |
| ||||||||
Oil and gas revenues before derivatives | $ | 2,655 | |
| $ | 202 | |
| $ | 92 | |
| $ | 2,949 | |
|
Realized cash (losses) gains on derivative contracts | (36 | ) |
| 14 | |
| - | |
| (22 | ) |
| ||||
Realized revenues | $ | 2,619 | |
| $ | 216 | |
| $ | 92 | |
| 2,927 | |
| |
Less: cash production costs |
|
|
|
|
|
| 653 | |
| |||||||
Cash operating margin |
|
|
|
|
|
| 2,274 | |
| |||||||
Less: depreciation, depletion and amortization |
|
|
|
|
|
| 1,364 | |
| |||||||
Less: accretion and other costs |
|
|
|
|
|
| 29 | |
| |||||||
Plus: net noncash mark-to-market losses on derivative contracts |
|
|
|
|
|
| (312 | ) |
| |||||||
Plus: other net adjustments |
|
|
|
|
|
| 1 | |
| |||||||
Gross profit |
|
|
|
|
|
| $ | 570 | |
| ||||||
|
|
|
|
|
|
|
|
| ||||||||
Oil (MMBbls) | 26.6 | |
|
|
|
|
|
|
| |||||||
Gas (Bcf) |
|
| 54.2 | |
|
|
|
|
| |||||||
NGLs (MMBbls) |
|
|
|
| 2.4 | |
|
|
| |||||||
Oil Equivalents (MMBOE) |
|
|
|
|
|
| 38.1 | |
| |||||||
|
|
|
|
|
|
|
|
| ||||||||
| Oil |
| Natural Gas |
| NGLs |
|
|
| ||||||||
| (per barrel) |
| (per MMbtu) |
| (per barrel) |
| Per BOE |
| ||||||||
Oil and gas revenues before derivatives | $ | 99.67 | |
| $ | 3.73 | |
| $ | 38.20 | |
| $ | 77.45 | |
|
Realized cash (losses) gains on derivative contracts | (1.35 | ) |
| 0.26 | |
| - | |
| (0.58 | ) |
| ||||
Realized revenues | $ | 98.32 | |
| $ | 3.99 | |
| $ | 38.20 | |
| 76.87 | |
| |
Less: cash production costs |
|
|
|
|
|
| 17.14 | |
| |||||||
Cash operating margin |
|
|
|
|
|
| 59.73 | |
| |||||||
Less: depreciation, depletion and amortization |
|
|
|
|
|
| 35.81 | |
| |||||||
Less: accretion and other costs |
|
|
|
|
|
| 0.79 | |
| |||||||
Plus: net noncash mark-to-market losses on derivative contracts |
|
|
|
|
|
| (8.20 | ) |
| |||||||
Plus: other net adjustments |
|
|
|
|
|
| 0.04 | |
| |||||||
Gross profit |
|
|
|
|
|
| $ | 14.97 | |
| ||||||
|
|
|
|
|
|
|
|
| ||||||||
Reconciliation to Amounts Reported | ||||||||||||||||
(In millions) | Revenues |
| Production and Delivery |
| Depreciation, Depletion and Amortization |
|
|
| ||||||||
Totals presented above | $ | 2,949 | |
| $ | 653 | |
| $ | 1,364 | |
|
|
| ||
Realized cash losses on derivative contracts | (22 | ) |
| - | |
| - | |
|
|
| |||||
Net noncash mark-to-market losses on derivative contracts | (312 | ) |
| - | |
| - | |
|
|
| |||||
Accretion and other costs | - | |
| 29 | |
| - | |
|
|
| |||||
Other net adjustments | 1 | |
| - | |
| - | |
|
|
| |||||
U.S. oil & gas operations | 2,616 | |
| 682 | |
| 1,364 | |
|
|
| |||||
Total mining a | 18,301 | |
| 11,151 | |
| 1,422 | |
|
|
| |||||
Corporate, other & eliminations | 4 | |
| 7 | |
| 11 | |
|
|
| |||||
As reported in FCX's consolidated financial statements | $ | 20,921 | |
| $ | 11,840 | |
| $ | 2,797 | |
|
|
| ||
a. | Represents the combined total for all mining operations and the related eliminations, as presented in Note 16 . |
126
Table of Contents
CAUTIONARY STATEMENT
Our discussion and analysis contains forward-looking statements in which we discuss factors we believe may affect our future performance. Forward-looking statements are all statements other than statements of historical facts, such as projections or expectations relating to ore grades and milling rates; production and sales volumes; unit net cash costs; cash production costs per BOE; operating cash flows; capital expenditures; exploration efforts and results; development and production activities and costs; liquidity; tax rates; the impact of copper, gold, molybdenum, cobalt, crude oil and natural gas price changes; the impact of derivative positions; the impact of deferred intercompany profits on earnings; reserve estimates; future dividend payments; debt reduction; and share purchases. The words "anticipates," "may," "can," "plans," "believes," "potential," "estimates," "expects," "projects," "targets," "intends," "likely," "will," "should," "to be" and any similar expressions are intended to identify those assertions as forward-looking statements. The declaration of dividends is at the discretion of the Board and will depend on our financial results, cash requirements, future prospects, and other factors deemed relevant by the Board.
We caution readers that forward-looking statements are not guarantees of future performance and that our actual results may differ materially from those anticipated, projected or assumed in the forward-looking statements. Important factors that can cause our actual results to differ materially from those anticipated in the forward-looking statements include supply of and demand for, and prices of copper, gold, molybdenum, cobalt, oil and gas, mine sequencing, production rates, industry risks, regulatory changes, political risks, drilling results, the outcome of negotiations with the Indonesian government regarding an amendment to PT-FI's COW, PT-FI's ability to obtain renewal of its export license after July 25, 2015, the potential effects of violence in Indonesia, the resolution of administrative disputes in the Democratic Republic of Congo, weather- and climate-related risks, labor relations, environmental risks, litigation results and other factors described in more detail under the heading "Risk Factors" in our annual report on Form 10-K for the year ended December 31, 2014 , filed with the SEC as updated by our subsequent filings with the SEC.
Investors are cautioned that many of the assumptions on which our forward-looking statements are based are likely to change after our forward-looking statements are made, including for example commodity prices, which we cannot control, and production volumes and costs, some aspects of which we may or may not be able to control. Further, we may make changes to our business plans that could or will affect our results. We caution investors that we do not intend to update forward-looking statements more frequently than quarterly notwithstanding any changes in our assumptions, changes in business plans, actual experience or other changes, and we undertake no obligation to update any forward-looking statements.
127
Table of Contents
Item 8. Financial Statements and Supplementary Data.
MANAGEMENT'S REPORT ON INTERNAL CONTROL OVER FINANCIAL REPORTING
Freeport-McMoRan Inc.'s (the Company's) management is responsible for establishing and maintaining adequate internal control over financial reporting. Internal control over financial reporting is defined in Rule 13a-15(f) or 15d-15(f) under the Securities Exchange Act of 1934 as a process designed by, or under the supervision of, the Company's principal executive and principal financial officers and effected by the Company's Board of Directors, management and other personnel, to provide reasonable assurance regarding the reliability of financial reporting and the preparation of financial statements for external purposes in accordance with generally accepted accounting principles and includes those policies and procedures that:
• | Pertain to the maintenance of records that in reasonable detail accurately and fairly reflect the transactions and dispositions of the Company's assets; |
• | Provide reasonable assurance that transactions are recorded as necessary to permit preparation of financial statements in accordance with generally accepted accounting principles, and that receipts and expenditures of the Company are being made only in accordance with authorizations of management and directors of the Company; and |
• | Provide reasonable assurance regarding prevention or timely detection of unauthorized acquisition, use or disposition of the Company's assets that could have a material effect on the financial statements. |
Because of its inherent limitations, internal control over financial reporting may not prevent or detect misstatements. Projections of any evaluation of effectiveness to future periods are subject to the risk that controls may become inadequate because of changes in conditions, or that the degree of compliance with the policies or procedures may deteriorate.
Our management, including our principal executive officer and principal financial officer, assessed the effectiveness of our internal control over financial reporting as of the end of the fiscal year covered by this annual report on Form 10-K. In making this assessment, our management used the criteria set forth in Internal Control-Integrated Framework issued by the Committee of Sponsoring Organizations of the Treadway Commission (2013 framework) (the COSO criteria). Based on our management's assessment, management concluded that, as of December 31, 2014 , our Company's internal control over financial reporting is effective based on the COSO criteria.
Ernst & Young LLP, an independent registered public accounting firm, who audited the Company's consolidated financial statements included in this Form 10-K, has issued an attestation report on the Company's internal control over financial reporting, which is included herein.
/s/ Richard C. Adkerson |
| /s/ Kathleen L. Quirk |
Richard C. Adkerson |
| Kathleen L. Quirk |
Vice Chairman of the Board, |
| Executive Vice President, |
President and Chief Executive Officer |
| Chief Financial Officer and Treasurer |
128
Table of Contents
REPORT OF INDEPENDENT REGISTERED PUBLIC ACCOUNTING FIRM
TO THE BOARD OF DIRECTORS AND STOCKHOLDERS OF
FREEPORT-McMoRan INC.
We have audited Freeport-McMoRan Inc.'s (formerly Freeport-McMoRan Copper & Gold Inc.) internal control over financial reporting as of December 31, 2014 , based on criteria established in Internal Control-Integrated Framework issued by the Committee of Sponsoring Organizations of the Treadway Commission (2013 framework) (the COSO criteria). Freeport-McMoRan Inc.'s management is responsible for maintaining effective internal control over financial reporting, and for its assessment of the effectiveness of internal control over financial reporting included in the accompanying Management's Report on Internal Control Over Financial Reporting. Our responsibility is to express an opinion on the Company's internal control over financial reporting based on our audit.
We conducted our audit in accordance with the standards of the Public Company Accounting Oversight Board (United States). Those standards require that we plan and perform the audit to obtain reasonable assurance about whether effective internal control over financial reporting was maintained in all material respects. Our audit included obtaining an understanding of internal control over financial reporting, assessing the risk that a material weakness exists, testing and evaluating the design and operating effectiveness of internal control based on the assessed risk, and performing such other procedures as we considered necessary in the circumstances. We believe that our audit provides a reasonable basis for our opinion.
A company's internal control over financial reporting is a process designed to provide reasonable assurance regarding the reliability of financial reporting and the preparation of financial statements for external purposes in accordance with generally accepted accounting principles. A company's internal control over financial reporting includes those policies and procedures that (1) pertain to the maintenance of records that, in reasonable detail, accurately and fairly reflect the transactions and dispositions of the assets of the company; (2) provide reasonable assurance that transactions are recorded as necessary to permit preparation of financial statements in accordance with generally accepted accounting principles, and that receipts and expenditures of the company are being made only in accordance with authorizations of management and directors of the company; and (3) provide reasonable assurance regarding prevention or timely detection of unauthorized acquisition, use, or disposition of the company's assets that could have a material effect on the financial statements.
Because of its inherent limitations, internal control over financial reporting may not prevent or detect misstatements. Also, projections of any evaluation of effectiveness to future periods are subject to the risk that controls may become inadequate because of changes in conditions, or that the degree of compliance with the policies or procedures may deteriorate.
In our opinion, Freeport-McMoRan Inc. maintained, in all material respects, effective internal control over financial reporting as of December 31, 2014 , based on the COSO criteria.
We also have audited, in accordance with the standards of the Public Company Accounting Oversight Board (United States), the consolidated balance sheets of Freeport-McMoRan Inc. as of December 31, 2014 and 2013 , and the related consolidated statements of operations, comprehensive (loss) income, equity and cash flows for each of the three years in the period ended December 31, 2014 , and our report dated February 27, 2015 expressed an unqualified opinion thereon.
/s/ Ernst & Young LLP
Phoenix, Arizona
February 27, 2015
129
Table of Contents
REPORT OF INDEPENDENT REGISTERED PUBLIC ACCOUNTING FIRM
TO THE BOARD OF DIRECTORS AND STOCKHOLDERS OF
FREEPORT-McMoRan INC.
We have audited the accompanying consolidated balance sheets of Freeport-McMoRan Inc. (formerly Freeport-McMoRan Copper & Gold Inc.) as of December 31, 2014 and 2013 , and the related consolidated statements of operations, comprehensive (loss) income, equity and cash flows for each of the three years in the period ended December 31, 2014 . These financial statements are the responsibility of the Company's management. Our responsibility is to express an opinion on these financial statements based on our audits.
We conducted our audits in accordance with the standards of the Public Company Accounting Oversight Board (United States). Those standards require that we plan and perform the audit to obtain reasonable assurance about whether the financial statements are free of material misstatement. An audit includes examining, on a test basis, evidence supporting the amounts and disclosures in the financial statements. An audit also includes assessing the accounting principles used and significant estimates made by management, as well as evaluating the overall financial statement presentation. We believe that our audits provide a reasonable basis for our opinion.
In our opinion, the financial statements referred to above present fairly, in all material respects, the consolidated financial position of Freeport-McMoRan Inc. at December 31, 2014 and 2013 , and the consolidated results of its operations and its cash flows for each of the three years in the period ended December 31, 2014 , in conformity with U.S. generally accepted accounting principles.
We also have audited, in accordance with the standards of the Public Company Accounting Oversight Board (United States), Freeport-McMoRan Inc.'s internal control over financial reporting as of December 31, 2014 , based on criteria established in Internal Control-Integrated Framework issued by the Committee of Sponsoring Organizations of the Treadway Commission (2013 framework) and our report dated February 27, 2015 expressed an unqualified opinion thereon.
/s/ Ernst & Young LLP
Phoenix, Arizona
February 27, 2015
130
Table of Contents
FREEPORT-McMoRan INC.
CONSOLIDATED STATEMENTS OF OPERATIONS
| Years Ended December 31, | ||||||||||
| 2014 |
| 2013 |
| 2012 | ||||||
| (In millions, except per share amounts) | ||||||||||
Revenues | $ | 21,438 | |
| $ | 20,921 | |
| $ | 18,010 | |
Cost of sales: |
|
|
|
|
| ||||||
Production and delivery | 11,904 | |
| 11,840 | |
| 10,382 | | |||
Depreciation, depletion and amortization | 3,863 | |
| 2,797 | |
| 1,179 | | |||
Impairment of oil and gas properties | 3,737 | |
| - | |
| - | | |||
Total cost of sales | 19,504 | |
| 14,637 | |
| 11,561 | | |||
Selling, general and administrative expenses | 592 | |
| 657 | |
| 431 | | |||
Mining exploration and research expenses | 126 | |
| 210 | |
| 285 | | |||
Environmental obligations and shutdown costs | 119 | |
| 66 | |
| (22 | ) | |||
Goodwill impairment | 1,717 | |
| - | |
| - | | |||
Net gain on sales of assets | (717 | ) |
| - | |
| - | | |||
Gain on insurance settlement | - | |
| - | |
| (59 | ) | |||
Total costs and expenses | 21,341 | |
| 15,570 | |
| 12,196 | | |||
Operating income | 97 | |
| 5,351 | |
| 5,814 | | |||
Interest expense, net | (630 | ) |
| (518 | ) |
| (186 | ) | |||
Net gain (loss) on early extinguishment of debt | 73 | |
| (35 | ) |
| (168 | ) | |||
Gain on investment in McMoRan Exploration Co. (MMR) | - | |
| 128 | |
| - | | |||
Other income (expense), net | 36 | |
| (13 | ) |
| 27 | | |||
(Loss) income before income taxes and equity in affiliated companies' net earnings | (424 | ) |
| 4,913 | |
| 5,487 | | |||
Provision for income taxes | (324 | ) |
| (1,475 | ) |
| (1,510 | ) | |||
Equity in affiliated companies' net earnings | 3 | |
| 3 | |
| 3 | | |||
Net (loss) income | (745 | ) |
| 3,441 | |
| 3,980 | | |||
Net income attributable to noncontrolling interests | (523 | ) |
| (761 | ) |
| (939 | ) | |||
Preferred dividends attributable to redeemable noncontrolling interest | (40 | ) |
| (22 | ) |
| - | | |||
Net (loss) income attributable to FCX common stockholders | $ | (1,308 | ) |
| $ | 2,658 | |
| $ | 3,041 | |
|
|
|
|
|
| ||||||
Net (loss) income per share attributable to FCX common stockholders: |
|
|
|
|
| ||||||
Basic | $ | (1.26 | ) |
| $ | 2.65 | |
| $ | 3.20 | |
Diluted | $ | (1.26 | ) |
| $ | 2.64 | |
| $ | 3.19 | |
|
|
|
|
|
| ||||||
Weighted-average common shares outstanding: |
|
|
|
|
| ||||||
Basic | 1,039 | |
| 1,002 | |
| 949 | | |||
Diluted | 1,039 | |
| 1,006 | |
| 954 | | |||
|
|
|
|
|
| ||||||
Dividends declared per share of common stock | $ | 1.25 | |
| $ | 2.25 | |
| $ | 1.25 | |
The accompanying Notes to Consolidated Financial Statements are an integral part of these consolidated financial statements.
131
Table of Contents
FREEPORT-McMoRan INC.
CONSOLIDATED STATEMENTS OF COMPREHENSIVE (LOSS) INCOME
| Years Ended December 31, | ||||||||||
| 2014 |
| 2013 |
| 2012 | ||||||
| (In millions) | ||||||||||
Net (loss) income | $ | (745 | ) |
| $ | 3,441 | |
| $ | 3,980 | |
|
|
|
|
|
| ||||||
Other comprehensive (loss) income, net of taxes: |
|
|
|
|
| ||||||
Defined benefit plans: |
|
|
|
|
| ||||||
Actuarial (losses) gains arising during the period | (161 | ) |
| 73 | |
| (69 | ) | |||
Prior service costs arising during the period | - | |
| (21 | ) |
| - | | |||
Amortization of unrecognized amounts included in net periodic benefit costs | 25 | |
| 30 | |
| 26 | | |||
Foreign exchange gains | 1 | |
| 12 | |
| 3 | | |||
Adjustment to deferred tax valuation allowance | (5 | ) |
| - | |
| (1 | ) | |||
Translation adjustments and unrealized losses on securities | (1 | ) |
| 4 | |
| (1 | ) | |||
Other comprehensive (loss) income | (141 | ) |
| 98 | |
| (42 | ) | |||
|
|
|
|
|
| ||||||
Total comprehensive (loss) income | (886 | ) |
| 3,539 | |
| 3,938 | | |||
Total comprehensive income attributable to noncontrolling interests | (521 | ) |
| (758 | ) |
| (938 | ) | |||
Preferred dividends attributable to redeemable noncontrolling interest | (40 | ) |
| (22 | ) |
| - | | |||
Total comprehensive (loss) income attributable to FCX common stockholders | $ | (1,447 | ) |
| $ | 2,759 | |
| $ | 3,000 | |
The accompanying Notes to Consolidated Financial Statements are an integral part of these consolidated financial statements.
132
Table of Contents
FREEPORT-McMoRan INC.
CONSOLIDATED STATEMENTS OF CASH FLOWS
|
| Years Ended December 31, | ||||||||||
|
| 2014 |
| 2013 |
| 2012 | ||||||
|
| (In millions) | ||||||||||
Cash flow from operating activities: |
|
|
|
|
|
| ||||||
Net (loss) income |
| $ | (745 | ) |
| $ | 3,441 | |
| $ | 3,980 | |
Adjustments to reconcile net (loss) income to net cash provided by operating activities: |
|
|
|
|
|
| ||||||
Depreciation, depletion and amortization |
| 3,863 | |
| 2,797 | |
| 1,179 | | |||
Impairment of oil and gas properties and goodwill |
| 5,454 | |
| - | |
| - | | |||
Net (gains) losses on crude oil and natural gas derivative contracts |
| (504 | ) |
| 334 | |
| - | | |||
Gain on investment in MMR |
| - | |
| (128 | ) |
| - | | |||
Stock-based compensation |
| 106 | |
| 173 | |
| 100 | | |||
Net charges for environmental and asset retirement obligations, including accretion |
| 200 | |
| 164 | |
| 22 | | |||
Payments for environmental and asset retirement obligations |
| (176 | ) |
| (237 | ) |
| (246 | ) | |||
Net (gain) loss on early extinguishment of debt |
| (73 | ) |
| 35 | |
| 168 | | |||
Net gain on sales of assets |
| (717 | ) |
| - | |
| - | | |||
Deferred income taxes |
| (929 | ) |
| 277 | |
| 269 | | |||
Increase in long-term mill and leach stockpiles |
| (233 | ) |
| (431 | ) |
| (269 | ) | |||
Other, net |
| 17 | |
| 91 | |
| (12 | ) | |||
Decreases (increases) in working capital and changes in other tax payments, excluding amounts from acquisitions and dispositions: |
|
|
|
|
|
| ||||||
Accounts receivable |
| 215 | |
| 49 | |
| (365 | ) | |||
Inventories |
| (249 | ) |
| (288 | ) |
| (729 | ) | |||
Other current assets |
| - | |
| 26 | |
| (76 | ) | |||
Accounts payable and accrued liabilities |
| (394 | ) |
| (359 | ) |
| 209 | | |||
Accrued income taxes and changes in other tax payments |
| (204 | ) |
| 195 | |
| (456 | ) | |||
Net cash provided by operating activities |
| 5,631 | |
| 6,139 | |
| 3,774 | | |||
|
|
|
|
|
|
| ||||||
Cash flow from investing activities: |
|
|
|
|
|
| ||||||
Capital expenditures: |
|
|
|
|
|
| ||||||
North America copper mines |
| (969 | ) |
| (1,066 | ) |
| (825 | ) | |||
South America |
| (1,785 | ) |
| (1,145 | ) |
| (931 | ) | |||
Indonesia |
| (948 | ) |
| (1,030 | ) |
| (843 | ) | |||
Africa |
| (159 | ) |
| (205 | ) |
| (539 | ) | |||
Molybdenum mines |
| (54 | ) |
| (164 | ) |
| (245 | ) | |||
U.S. oil and gas operations |
| (3,205 | ) |
| (1,436 | ) |
| - | | |||
Other |
| (95 | ) |
| (240 | ) |
| (111 | ) | |||
Acquisition of Deepwater Gulf of Mexico interests |
| (1,426 | ) |
| - | |
| - | | |||
Acquisition of Plains Exploration & Production Company, net of cash acquired |
| - | |
| (3,465 | ) |
| - | | |||
Acquisition of MMR, net of cash acquired |
| - | |
| (1,628 | ) |
| - | | |||
Acquisition of cobalt chemical business, net of cash acquired |
| - | |
| (348 | ) |
| - | | |||
Net proceeds from sale of Candelaria and Ojos del Salado |
| 1,709 | |
| - | |
| - | | |||
Net proceeds from sale of Eagle Ford shale assets |
| 2,910 | |
| - | |
| - | | |||
Other, net |
| 221 | |
| (181 | ) |
| 31 | | |||
Net cash used in investing activities |
| (3,801 | ) |
| (10,908 | ) |
| (3,463 | ) | |||
|
|
|
|
|
|
| ||||||
Cash flow from financing activities: |
|
|
|
|
|
| ||||||
Proceeds from debt |
| 8,710 | |
| 11,501 | |
| 3,029 | | |||
Repayments of debt |
| (10,306 | ) |
| (5,476 | ) |
| (3,186 | ) | |||
Redemption of MMR preferred stock |
| - | |
| (228 | ) |
| - | | |||
Cash dividends and distributions paid: |
|
|
|
|
|
| ||||||
Common stock |
| (1,305 | ) |
| (2,281 | ) |
| (1,129 | ) | |||
Noncontrolling interests |
| (424 | ) |
| (256 | ) |
| (113 | ) | |||
Stock-based awards net proceeds (payments), including excess tax benefit |
| 9 | |
| (98 | ) |
| 7 | | |||
Debt financing costs and other, net |
| (35 | ) |
| (113 | ) |
| (36 | ) | |||
Net cash (used in) provided by financing activities |
| (3,351 | ) |
| 3,049 | |
| (1,428 | ) | |||
Net decrease in cash and cash equivalents |
| (1,521 | ) |
| (1,720 | ) |
| (1,117 | ) | |||
Cash and cash equivalents at beginning of year |
| 1,985 | |
| 3,705 | |
| 4,822 | | |||
Cash and cash equivalents at end of year |
| $ | 464 | |
| $ | 1,985 | |
| $ | 3,705 | |
The accompanying Notes to Consolidated Financial Statements are an integral part of these consolidated financial statements.
133
Table of Contents
FREEPORT-McMoRan INC.
CONSOLIDATED BALANCE SHEETS
| December 31, | ||||||
| 2014 |
| 2013 | ||||
| (In millions, except par value) | ||||||
ASSETS |
|
|
| ||||
Current assets: |
|
|
| ||||
Cash and cash equivalents | $ | 464 | |
| $ | 1,985 | |
Trade accounts receivable | 953 | |
| 1,728 | | ||
Income and other tax receivables | 1,322 | |
| 695 | | ||
Other accounts receivable | 288 | |
| 139 | | ||
Inventories: |
|
|
| ||||
Mill and leach stockpiles | 1,914 | |
| 1,705 | | ||
Materials and supplies, net | 1,886 | |
| 1,730 | | ||
Product | 1,561 | |
| 1,583 | | ||
Other current assets | 657 | |
| 407 | | ||
Total current assets | 9,045 | |
| 9,972 | | ||
Property, plant, equipment and mining development costs, net | 26,220 | |
| 24,042 | | ||
Oil and gas properties, net - full cost method: |
|
|
| ||||
Subject to amortization, less accumulated amortization of $7,360 and $1,357, respectively | 9,187 | |
| 12,472 | | ||
Not subject to amortization | 10,087 | |
| 10,887 | | ||
Long-term mill and leach stockpiles | 2,179 | |
| 2,386 | | ||
Goodwill | - | |
| 1,916 | | ||
Other assets | 2,077 | |
| 1,798 | | ||
Total assets | $ | 58,795 | |
| $ | 63,473 | |
|
|
|
| ||||
LIABILITIES AND EQUITY |
|
|
| ||||
Current liabilities: |
|
|
| ||||
Accounts payable and accrued liabilities | $ | 3,653 | |
| $ | 3,708 | |
Current portion of debt | 478 | |
| 312 | | ||
Accrued income taxes | 410 | |
| 184 | | ||
Dividends payable | 335 | |
| 333 | | ||
Current portion of environmental and asset retirement obligations | 296 | |
| 236 | | ||
Total current liabilities | 5,172 | |
| 4,773 | | ||
Long-term debt, less current portion | 18,492 | |
| 20,394 | | ||
Deferred income taxes | 6,398 | |
| 7,410 | | ||
Environmental and asset retirement obligations, less current portion | 3,647 | |
| 3,259 | | ||
Other liabilities | 1,861 | |
| 1,690 | | ||
Total liabilities | 35,570 | |
| 37,526 | | ||
|
|
|
| ||||
Redeemable noncontrolling interest | 751 | |
| 716 | | ||
|
|
|
| ||||
Equity: |
|
|
| ||||
Stockholders' equity: |
|
|
| ||||
Common stock, par value $0.10, 1,167 shares and 1,165 shares issued, respectively | 117 | |
| 117 | | ||
Capital in excess of par value | 22,281 | |
| 22,161 | | ||
Retained earnings | 128 | |
| 2,742 | | ||
Accumulated other comprehensive loss | (544 | ) |
| (405 | ) | ||
Common stock held in treasury – 128 shares and 127 shares, respectively, at cost | (3,695 | ) |
| (3,681 | ) | ||
Total stockholders' equity | 18,287 | |
| 20,934 | | ||
Noncontrolling interests | 4,187 | |
| 4,297 | | ||
Total equity | 22,474 | |
| 25,231 | | ||
Total liabilities and equity | $ | 58,795 | |
| $ | 63,473 | |
The accompanying Notes to Consolidated Financial Statements are an integral part of these consolidated financial statements.
134
Table of Contents
FREEPORT-McMoRan INC.
CONSOLIDATED STATEMENTS OF EQUITY
| Stockholders' Equity |
|
|
|
| ||||||||||||||||||||||||||||||||
| Common Stock |
|
|
| Retained Earnings |
| Accumu- Other Compre-hensive Loss |
| Common Stock Held in Treasury |
| Total Stock- holders' Equity |
|
|
|
| ||||||||||||||||||||||
| Number of Shares |
| At Par Value |
| Capital in Excess of Par Value |
|
|
| Number of Shares |
| At Cost |
|
| Non- controlling Interests |
| Total Equity | |||||||||||||||||||||
|
| ||||||||||||||||||||||||||||||||||||
Balance at January 1, 2012 | 1,071 | |
| $ | 107 | |
| $ | 19,007 | |
| $ | 546 | |
| $ | (465 | ) |
| 123 | |
| $ | (3,553 | ) |
| $ | 15,642 | |
| $ | 2,911 | |
| $ | 18,553 | |
Exercised and issued stock-based awards | 2 | |
| - | |
| 15 | |
| - | |
| - | |
| - | |
| - | |
| 15 | |
| - | |
| 15 | | ||||||||
Stock-based compensation | - | |
| - | |
| 100 | |
| - | |
| - | |
| - | |
| - | |
| 100 | |
| - | |
| 100 | | ||||||||
Tax benefit for stock-based awards | - | |
| - | |
| 7 | |
| - | |
| - | |
| - | |
| - | |
| 7 | |
| - | |
| 7 | | ||||||||
Tender of shares for stock-based awards | - | |
| - | |
| 7 | |
| - | |
| - | |
| 1 | |
| (23 | ) |
| (16 | ) |
| - | |
| (16 | ) | ||||||||
Dividends on common stock | - | |
| - | |
| - | |
| (1,188 | ) |
| - | |
| - | |
| - | |
| (1,188 | ) |
| - | |
| (1,188 | ) | ||||||||
Dividends to noncontrolling interests | - | |
| - | |
| - | |
| - | |
| - | |
| - | |
| - | |
| - | |
| (113 | ) |
| (113 | ) | ||||||||
Change in ownership interests | - | |
| - | |
| (17 | ) |
| - | |
| - | |
| - | |
| - | |
| (17 | ) |
| 17 | |
| - | | ||||||||
Contributions from noncontrolling interests | - | |
| - | |
| - | |
| - | |
| - | |
| - | |
| - | |
| - | |
| 15 | |
| 15 | | ||||||||
Net income attributable to FCX common stockholders | - | |
| - | |
| - | |
| 3,041 | |
| - | |
| - | |
| - | |
| 3,041 | |
| - | |
| 3,041 | | ||||||||
Net income attributable to noncontrolling interests | - | |
| - | |
| - | |
| - | |
| - | |
| - | |
| - | |
| - | |
| 939 | |
| 939 | | ||||||||
Other comprehensive loss | - | |
| - | |
| - | |
| - | |
| (41 | ) |
| - | |
| - | |
| (41 | ) |
| (1 | ) |
| (42 | ) | ||||||||
Balance at December 31, 2012 | 1,073 | |
| 107 | |
| 19,119 | |
| 2,399 | |
| (506 | ) |
| 124 | |
| (3,576 | ) |
| 17,543 | |
| 3,768 | |
| 21,311 | | ||||||||
Common stock issued to acquire Plains Exploration & Production Company | 91 | |
| 9 | |
| 2,822 | |
| - | |
| - | |
| - | |
| - | |
| 2,831 | |
| - | |
| 2,831 | | ||||||||
Exchange of employee stock-based awards in connection with acquisitions | - | |
| - | |
| 67 | |
| - | |
| - | |
| - | |
| - | |
| 67 | |
| - | |
| 67 | | ||||||||
Exercised and issued stock-based awards | 1 | |
| 1 | |
| 8 | |
| - | |
| - | |
| - | |
| - | |
| 9 | |
| - | |
| 9 | | ||||||||
Stock-based compensation | - | |
| - | |
| 153 | |
| - | |
| - | |
| - | |
| - | |
| 153 | |
| - | |
| 153 | | ||||||||
Reserve of tax benefit for stock-based awards | - | |
| - | |
| (1 | ) |
| - | |
| - | |
| - | |
| - | |
| (1 | ) |
| - | |
| (1 | ) | ||||||||
Tender of shares for stock-based awards | - | |
| - | |
| - | |
| - | |
| - | |
| 3 | |
| (105 | ) |
| (105 | ) |
| - | |
| (105 | ) | ||||||||
Dividends on common stock | - | |
| - | |
| - | |
| (2,315 | ) |
| - | |
| - | |
| - | |
| (2,315 | ) |
| - | |
| (2,315 | ) | ||||||||
Dividends to noncontrolling interests | - | |
| - | |
| - | |
| - | |
| - | |
| - | |
| - | |
| - | |
| (236 | ) |
| (236 | ) | ||||||||
Noncontrolling interests' share of contributed capital in subsidiary | - | |
| - | |
| (7 | ) |
| - | |
| - | |
| - | |
| - | |
| (7 | ) |
| 7 | |
| - | | ||||||||
Net income attributable to FCX common stockholders | - | |
| - | |
| - | |
| 2,658 | |
| - | |
| - | |
| - | |
| 2,658 | |
| - | |
| 2,658 | | ||||||||
Net income attributable to noncontrolling interests | - | |
| - | |
| - | |
| - | |
| - | |
| - | |
| - | |
| - | |
| 761 | |
| 761 | | ||||||||
Other comprehensive income (loss) | - | |
| - | |
| - | |
| - | |
| 101 | |
| - | |
| - | |
| 101 | |
| (3 | ) |
| 98 | | ||||||||
Balance at December 31, 2013 | 1,165 | |
| $ | 117 | |
| $ | 22,161 | |
| $ | 2,742 | |
| $ | (405 | ) |
| 127 | |
| $ | (3,681 | ) |
| $ | 20,934 | |
| $ | 4,297 | |
| $ | 25,231 | |
135
Table of Contents
FREEPORT-McMoRan INC.
CONSOLIDATED STATEMENTS OF EQUITY (CONTINUED)
| Stockholders' Equity |
|
|
|
| ||||||||||||||||||||||||||||||||
| Common Stock |
|
|
| Retained Earnings |
| Accumu- Other Compre-hensive Loss |
| Common Stock Held in Treasury |
| Total Stock- holders' Equity |
|
|
|
| ||||||||||||||||||||||
| Number of Shares |
| At Par Value |
| Capital in Excess of Par Value |
|
|
| Number of Shares |
| At Cost |
|
| Non- controlling Interests |
| Total Equity | |||||||||||||||||||||
|
| ||||||||||||||||||||||||||||||||||||
Balance at December 31, 2013 | 1,165 | |
| $ | 117 | |
| $ | 22,161 | |
| $ | 2,742 | |
| $ | (405 | ) |
| 127 | |
| $ | (3,681 | ) |
| $ | 20,934 | |
| $ | 4,297 | |
| $ | 25,231 | |
Exercised and issued stock-based awards | 2 | |
| - | |
| 12 | |
| - | |
| - | |
| - | |
| - | |
| 12 | |
| - | |
| 12 | | ||||||||
Stock-based compensation | - | |
| - | |
| 98 | |
| - | |
| - | |
| - | |
| - | |
| 98 | |
| - | |
| 98 | | ||||||||
Tax benefit for stock-based awards | - | |
| - | |
| 5 | |
| - | |
| - | |
| - | |
| - | |
| 5 | |
| 1 | |
| 6 | | ||||||||
Tender of shares for stock-based awards | - | |
| - | |
| 6 | |
| - | |
| - | |
| 1 | |
| (14 | ) |
| (8 | ) |
| - | |
| (8 | ) | ||||||||
Dividends on common stock | - | |
| - | |
| - | |
| (1,306 | ) |
| - | |
| - | |
| - | |
| (1,306 | ) |
| - | |
| (1,306 | ) | ||||||||
Dividends to noncontrolling interests | - | |
| - | |
| - | |
| - | |
| - | |
| - | |
| - | |
| - | |
| (396 | ) |
| (396 | ) | ||||||||
Noncontrolling interests' share of contributed capital in subsidiary | - | |
| - | |
| (1 | ) |
| - | |
| - | |
| - | |
| - | |
| (1 | ) |
| 7 | |
| 6 | | ||||||||
Sale of Candelaria and Ojos del Salado | - | |
| - | |
| - | |
| - | |
| - | |
| - | |
| - | |
| - | |
| (243 | ) |
| (243 | ) | ||||||||
Net loss attributable to FCX common stockholders | - | |
| - | |
| - | |
| (1,308 | ) |
| - | |
| - | |
| - | |
| (1,308 | ) |
| - | |
| (1,308 | ) | ||||||||
Net income attributable to noncontrolling interests | - | |
| - | |
| - | |
| - | |
| - | |
| - | |
| - | |
| - | |
| 523 | |
| 523 | | ||||||||
Other comprehensive loss | - | |
| - | |
| - | |
| - | |
| (139 | ) |
| - | |
| - | |
| (139 | ) |
| (2 | ) |
| (141 | ) | ||||||||
Balance at December 31, 2014 | 1,167 | |
| $ | 117 | |
| $ | 22,281 | |
| $ | 128 | |
| $ | (544 | ) |
| 128 | |
| $ | (3,695 | ) |
| $ | 18,287 | |
| $ | 4,187 | |
| $ | 22,474 | |
The accompanying Notes to Consolidated Financial Statements are an integral part of these consolidated financial statements.
136
Table of Contents
FREEPORT-McMoRan INC.
NOTES TO CONSOLIDATED FINANCIAL STATEMENTS
NOTE 1. SUMMARY OF SIGNIFICANT ACCOUNTING POLICIES
Basis of Presentation. Effective July 14, 2014 , Freeport-McMoRan Copper & Gold Inc. changed its name to Freeport-McMoRan Inc. (FCX) to simplify the corporate name and better reflect FCX's expanded portfolio of assets. The consolidated financial statements of FCX include the accounts of those subsidiaries where it directly or indirectly has more than 50 percent of the voting rights and has the right to control significant management decisions. The most significant entities that FCX consolidates include its 90.64 percent -owned subsidiary PT Freeport Indonesia (PT-FI), and the following wholly owned subsidiaries: Freeport Minerals Corporation (FMC, formerly Freeport-McMoRan Corporation), Atlantic Copper, S.L.U. (Atlantic Copper) and FCX Oil & Gas Inc. (FM O&G).
FCX acquired mining assets in North America, South America and Africa when it acquired Phelps Dodge Corporation (now known as FMC) in 2007. FCX acquired oil and gas operations when it acquired Plains Exploration & Production Company (PXP) and McMoRan Exploration Co. (MMR), collectively known as FM O&G, on May 31, 2013 , and June 3, 2013 , respectively. The results included in these financial statements for the year ended December 31, 2013, include PXP's results beginning June 1, 2013 , and MMR's results beginning June 4, 2013 (refer to Note 2 for further discussion).
FCX's unincorporated joint ventures with Rio Tinto plc (Rio Tinto) and Sumitomo Metal Mining Arizona, Inc. (Sumitomo) are reflected using the proportionate consolidation method (refer to Note 3 for further discussion). Investments in unconsolidated companies owned 20 percent or more are recorded using the equity method. Investments in companies owned less than 20 percent , and for which FCX does not exercise significant influence, are carried at cost. All significant intercompany transactions have been eliminated. Dollar amounts in tables are stated in millions, except per share amounts.
Business Segments. FCX has organized its operations into six primary divisions – North America copper mines, South America mining, Indonesia mining, Africa mining, Molybdenum mines and United States (U.S.) oil and gas operations. Notwithstanding this structure, FCX internally reports information on a mine-by-mine basis for its mining operations. Therefore, FCX concluded that its operating segments include individual mines or operations relative to its mining operations. For oil and gas operations, FCX determines its operating segments on a country-by-country basis. Operating segments that meet certain financial thresholds are reportable segments. Refer to Note 16 for further discussion.
Use of Estimates. The preparation of FCX's financial statements in conformity with accounting principles generally accepted in the U.S. requires management to make estimates and assumptions that affect the amounts reported in these financial statements and accompanying notes. The more significant areas requiring the use of management estimates include reserve estimation (minerals, and oil and natural gas); timing of transfers of oil and gas properties not subject to amortization into the full cost pool; asset lives for depreciation, depletion and amortization; environmental obligations; asset retirement obligations; estimates of recoverable copper in mill and leach stockpiles; deferred taxes and valuation allowances; reserves for contingencies and litigation; asset impairment, including estimates used to derive future cash flows associated with those assets; determination of fair value of assets acquired, liabilities assumed and redeemable noncontrolling interest, and recognition of goodwill and deferred taxes in connection with business combinations; pension benefits; and valuation of derivative instruments. Actual results could differ from those estimates.
Cash Equivalents. Highly liquid investments purchased with maturities of three months or less are considered cash equivalents.
Inventories. Inventories include mill and leach stockpiles, materials and supplies, and product inventories. Inventories are stated at the lower of weighted-average cost or market. Costs of finished goods and work-in-process ( i.e. , not materials and supplies or raw materials) inventories include labor and benefits, supplies, energy, depreciation, depletion, amortization, site overhead costs and other necessary costs associated with the extraction and processing of ore, including, depending on the process, mining, haulage, milling, concentrating, smelting, leaching, solution extraction, refining, roasting and chemical processing. Corporate general and administrative costs are not included in inventory costs. Refer to Note 4 for further discussion.
137
Table of Contents
Mill and Leach Stockpiles. Mill and leach stockpiles are work-in-process inventories for FCX's mining operations. Both mill and leach stockpiles generally contain lower grade ores that have been extracted from an ore body and are available for copper recovery. Mill stockpiles contain sulfide ores and recovery of metal is through milling, concentrating, smelting and refining or, alternatively, by concentrate leaching. Leach stockpiles contain oxide ores and certain secondary sulfide ores and recovery of metal is through exposure to acidic solutions that dissolve contained copper and deliver it in solution to extraction processing facilities ( i.e., solution extraction and electrowinning (SX/EW)). The recorded cost of mill and leach stockpiles includes mining and haulage costs incurred to deliver ore to stockpiles, depreciation, depletion, amortization and site overhead costs. Material is removed from the stockpiles at a weighted-average cost per pound.
Because it is generally impracticable to determine copper contained in mill and leach stockpiles by physical count, reasonable estimation methods are employed. The quantity of material delivered to mill and leach stockpiles is based on surveyed volumes of mined material and daily production records. Sampling and assaying of blasthole cuttings determine the estimated copper grade of the material delivered to mill and leach stockpiles.
Expected copper recovery rates for mill stockpiles are determined by metallurgical testing. The recoverable copper in mill stockpiles, once entered into the production process, can be produced into copper concentrate almost immediately.
Expected copper recovery rates for leach stockpiles are determined using small-scale laboratory tests, small- to large-scale column testing (which simulates the production-scale process), historical trends and other factors, including mineralogy of the ore and rock type. Total copper recovery in leach stockpiles can vary significantly from a low percentage to more than 90 percent depending on several variables, including processing methodology, processing variables, mineralogy and particle size of the rock. For newly placed material on active stockpiles, as much as 80 percent total copper recovery may be extracted during the first year, and the remaining copper may be recovered over many years.
Processes and recovery rates for mill and leach stockpiles are monitored regularly, and recovery rate estimates are adjusted periodically as additional information becomes available and as related technology changes. Adjustments to recovery rates will typically result in a future impact to the value of the material removed from the stockpiles at a revised weighted-average cost per pound of recoverable copper.
Product Inventories. Raw materials are primarily unprocessed concentrate at Atlantic Copper's smelting and refining operations. Work-in-process inventories primarily are copper concentrates at various stages of conversion into anodes and cathodes at Atlantic Copper's operations. Atlantic Copper's in-process inventories are valued at the weighted-average cost of the material fed to the smelting and refining process plus in-process conversion costs. Finished goods for mining operations represent salable products ( e.g. , copper and molybdenum concentrates, copper anodes, copper cathodes, copper rod, copper wire, molybdenum oxide, high-purity molybdenum chemicals and other metallurgical products, and various cobalt products). Finished goods are valued based on the weighted-average cost of source material plus applicable conversion costs relating to associated process facilities.
Property, Plant, Equipment and Mining Development Costs. Property, plant, equipment and mining development costs are carried at cost. Mineral exploration costs, as well as drilling and other costs incurred for the purpose of converting mineral resources to proven and probable reserves or identifying new mineral resources at development or production stage properties, are charged to expense as incurred. Development costs are capitalized beginning after proven and probable mineral reserves have been established. Development costs include costs incurred resulting from mine pre-production activities undertaken to gain access to proven and probable reserves, including shafts, adits, drifts, ramps, permanent excavations, infrastructure and removal of overburden. Additionally, interest expense allocable to the cost of developing mining properties and to constructing new facilities is capitalized until assets are ready for their intended use.
Expenditures for replacements and improvements are capitalized. Costs related to periodic scheduled maintenance ( i.e. , turnarounds) are charged to expense as incurred. Depreciation for mining and milling life-of-mine assets, infrastructure and other common costs is determined using the unit-of-production (UOP) method based on total estimated recoverable proven and probable copper reserves (for primary copper mines) and proven and probable molybdenum reserves (for primary molybdenum mines). Development costs and acquisition costs for proven and probable mineral reserves that relate to a specific ore body are depreciated using the UOP method based on estimated recoverable proven and probable mineral reserves for the ore body benefited. Depreciation, depletion and amortization using the UOP method is recorded upon extraction of the recoverable copper or molybdenum from
138
Table of Contents
the ore body, at which time it is allocated to inventory cost and then included as a component of cost of goods sold. Other assets are depreciated on a straight-line basis over estimated useful lives of up to 39 years for buildings and three to 25 years for machinery and equipment, and mobile equipment.
Included in property, plant, equipment and mining development costs is value beyond proven and probable mineral reserves (VBPP), primarily resulting from FCX's acquisition of FMC in 2007. The concept of VBPP has been interpreted differently by different mining companies. FCX's VBPP is attributable to (i) mineralized material, which includes measured and indicated amounts, that FCX believes could be brought into production with the establishment or modification of required permits and should market conditions and technical assessments warrant, (ii) inferred mineral resources and (iii) exploration potential.
Carrying amounts assigned to VBPP are not charged to expense until the VBPP becomes associated with additional proven and probable mineral reserves and the reserves are produced or the VBPP is determined to be impaired. Additions to proven and probable mineral reserves for properties with VBPP will carry with them the value assigned to VBPP at the date acquired, less any impairment amounts. Refer to Note 5 for further discussion.
Asset Impairment for Mining Operations. FCX reviews and evaluates its mining long-lived assets for impairment when events or changes in circumstances indicate that the related carrying amounts may not be recoverable. In evaluating mining operations' long-lived assets for recoverability, estimates of after-tax undiscounted future cash flows of FCX's individual mining operations are used. An impairment is considered to exist if total estimated future cash flows on an undiscounted basis are less than the carrying amount of the asset. Once it is determined that an impairment exists, an impairment loss is measured as the amount by which the asset carrying value exceeds its fair value. As quoted market prices are unavailable for FCX's individual mining operations, fair value is determined through the use of discounted estimated future cash flows. Estimated cash flows used to assess recoverability of long-lived assets and measure the fair value of FCX's mining operations are derived from current business plans, which are developed using near-term price forecasts reflective of the current price environment and management's projections for long-term average metal prices. Estimates of future cash flows also include estimates of commodity-based and other input costs; proven and probable mineral reserve estimates, including any costs to develop the reserves and the timing of producing the reserves; and the use of appropriate escalation and discount rates. FCX believes its estimates and models used to determine fair value are similar to what a market participant would use.
Oil and Gas Properties. FCX follows the full cost method of accounting specified by the U.S. Securities and Exchange Commission's (SEC) rules whereby all costs associated with oil and gas property acquisition, exploration and development activities are capitalized into a cost center on a country-by-country basis. Such costs include internal general and administrative costs, such as payroll and related benefits and costs directly attributable to employees engaged in acquisition, exploration and development activities. General and administrative costs associated with production, operations, marketing and general corporate activities are charged to expense as incurred. Capitalized costs, along with estimated future costs to develop proved reserves and asset retirement costs that are not already included in oil and gas properties, net of related salvage value, are amortized to expense under the UOP method using engineers' estimates of the related, by-country proved oil and natural gas reserves.
The costs of unproved oil and gas properties are excluded from amortization until the properties are evaluated. Costs are transferred into the amortization base on an ongoing basis as the properties are evaluated and proved oil and natural gas reserves are established or if impairment is determined. Unproved oil and gas properties are assessed periodically, at least annually, to determine whether impairment has occurred. FCX assesses oil and gas properties on an individual basis or as a group if properties are individually insignificant. The assessment considers the following factors, among others: intent to drill, remaining lease term, geological and geophysical evaluations, drilling results and activity, the assignment of proved reserves and the economic viability of development if proved reserves are assigned. During any period in which these factors indicate an impairment, the cumulative drilling costs incurred to date for such property and all or a portion of the associated leasehold costs are transferred to the full cost pool and are then subject to amortization. The transfer of costs into the amortization base involves a significant amount of judgment and may be subject to changes over time based on drilling plans and results, geological and geophysical evaluations, the assignment of proved oil and natural gas reserves, availability of capital and other factors. Costs not subject to amortization consist primarily of capitalized costs incurred for undeveloped acreage and wells in progress pending determination, together with capitalized interest for these projects. The ultimate evaluation of the properties will occur over a period of several years. Interest costs totaling $88 million in 2014 and $69 million in 2013 were capitalized on oil and gas properties not subject to amortization and in the process of development.
139
Table of Contents
Proceeds from the sale of oil and gas properties are accounted for as reductions to capitalized costs unless the reduction causes a significant change in proved reserves, which absent other factors, is generally described as a 25 percent or greater change, and significantly alters the relationship between capitalized costs and proved reserves attributable to a cost center, in which case a gain or loss is recognized.
Under the SEC full cost accounting rules, FCX reviews the carrying value of its oil and gas properties each quarter on a country-by-country basis. Under these rules, capitalized costs of oil and gas properties (net of accumulated depreciation, depletion and amortization, and related deferred income taxes) for each cost center may not exceed a "ceiling" equal to:
• | the present value, discounted at 10 percent , of estimated future net cash flows from the related proved oil and natural gas reserves, net of estimated future income taxes; plus |
• | the cost of the related unproved properties not being amortized; plus |
• | the lower of cost or estimated fair value of the related unproved properties included in the costs being amortized (net of related tax effects). |
These rules require that FCX price its future oil and gas production at the twelve-month average of the first-day-of-the-month historical reference prices as adjusted for location and quality differentials. FCX's reference prices are West Texas Intermediate (WTI) for oil and the Henry Hub spot price for natural gas. Such prices are utilized except where different prices are fixed and determinable from applicable contracts for the remaining term of those contracts, excluding derivatives. The reserve estimates exclude the effect of any crude oil and natural gas derivatives FCX has in place. The estimated future net cash flows also exclude future cash outflows associated with settling asset retirement obligations included in the net book value of the oil and gas properties. The rules require an impairment if the capitalized costs exceed this "ceiling."
At September 30, 2014, and December 31, 2014 , the net capitalized costs with respect to FCX's U.S. oil and gas properties exceeded the related ceiling; therefore, impairment charges of $3.7 billion were recorded in 2014 primarily because of higher capitalized costs and the lower twelve-month average of the first-day-of-the-month historical reference oil price at such dates.
Goodwill. Goodwill has an indefinite useful life and is not amortized, but rather is tested for impairment at least annually during the fourth quarter, unless events occur or circumstances change between annual tests that would more likely than not reduce the fair value of a related reporting unit below its carrying value. Impairment occurs when the carrying amount of goodwill exceeds its implied fair value. FCX generally uses a discounted cash flow model to determine if the carrying value of a reporting unit, including goodwill, is less than the fair value of the reporting unit. FCX's approach to allocating goodwill includes the identification of the reporting unit it believes has contributed to the excess purchase price and includes consideration of the reporting unit's potential for future growth. Goodwill arose in 2013 with FCX's acquisitions of PXP and MMR, and was allocated to the U.S. oil and gas reporting unit. When a sale of oil and gas properties occurs, goodwill is allocated to that property based on the relationship of the fair value of the property sold to the total reporting unit's fair value. A significant sale of oil and gas properties may represent a triggering event that requires goodwill to be evaluated for impairment. Events affecting crude oil and natural gas prices caused a decrease in the fair value of the reporting unit in 2014, which resulted in the full impairment of goodwill (refer to Note 2 for further discussion).
Deferred Mining Costs. Stripping costs ( i.e. , the costs of removing overburden and waste material to access mineral deposits) incurred during the production phase of a mine are considered variable production costs and are included as a component of inventory produced during the period in which stripping costs are incurred. Major development expenditures, including stripping costs to prepare unique and identifiable areas outside the current mining area for future production that are considered to be pre-production mine development, are capitalized and amortized using the UOP method based on estimated recoverable proven and probable reserves for the ore body benefited. However, where a second or subsequent pit or major expansion is considered to be a continuation of existing mining activities, stripping costs are accounted for as a current production cost and a component of the associated inventory.
140
Table of Contents
Environmental Expenditures. Environmental expenditures are charged to expense or capitalized, depending upon their future economic benefits. Accruals for such expenditures are recorded when it is probable that obligations have been incurred and the costs can be reasonably estimated. Environmental obligations attributed to the Comprehensive Environmental Response, Compensation, and Liability Act (CERCLA) or analogous state programs are considered probable when a claim is asserted, or is probable of assertion, and FCX, or any of its subsidiaries, have been associated with the site. Other environmental remediation obligations are considered probable based on specific facts and circumstances. FCX's estimates of these costs are based on an evaluation of various factors, including currently available facts, existing technology, presently enacted laws and regulations, remediation experience, whether or not FCX is a potentially responsible party (PRP) and the ability of other PRPs to pay their allocated portions. With the exception of those obligations assumed in the acquisition of FMC that were initially recorded at estimated fair values (refer to Note 12 for further discussion), environmental obligations are recorded on an undiscounted basis. Where the available information is sufficient to estimate the amount of the obligation, that estimate has been used. Where the information is only sufficient to establish a range of probable liability and no point within the range is more likely than any other, the lower end of the range has been used. Possible recoveries of some of these costs from other parties are not recognized in the consolidated financial statements until they become probable. Legal costs associated with environmental remediation (such as fees to outside law firms for work relating to determining the extent and type of remedial actions and the allocation of costs among PRPs) are included as part of the estimated obligation.
Environmental obligations assumed in the acquisition of FMC, which were initially recorded at fair value and estimated on a discounted basis, are accreted to full value over time through charges to interest expense. Adjustments arising from changes in amounts and timing of estimated costs and settlements may result in increases and decreases in these obligations and are calculated in the same manner as they were initially estimated. Unless these adjustments qualify for capitalization, changes in environmental obligations are charged to operating income when they occur.
FCX performs a comprehensive review of its environmental obligations annually and also reviews changes in facts and circumstances associated with these obligations at least quarterly.
Asset Retirement Obligations. FCX records the fair value of estimated asset retirement obligations (AROs) associated with tangible long-lived assets in the period incurred. Retirement obligations associated with long-lived assets are those for which there is a legal obligation to settle under existing or enacted law, statute, written or oral contract or by legal construction. These obligations, which are initially estimated based on discounted cash flow estimates, are accreted to full value over time through charges to cost of sales. In addition, asset retirement costs (ARCs) are capitalized as part of the related asset's carrying value and are depreciated over the asset's respective useful life.
For mining operations, reclamation costs for disturbances are recognized as an ARO and as a related ARC (included in property, plant, equipment and mining development costs) in the period of the disturbance and depreciated primarily on a UOP basis. FCX's AROs for mining operations consist primarily of costs associated with mine reclamation and closure activities. These activities, which are site specific, generally include costs for earthwork, revegetation, water treatment and demolition (refer to Note 12 for further discussion).
For oil and gas properties, the fair value of the legal obligation is recognized as an ARO and as a related ARC(included in oil and gas properties) in the period in which the well is drilled or acquired and is amortized on a UOP basis together with other capitalized costs. Substantially all of FCX's oil and gas leases require that, upon termination of economic production, the working interest owners plug and abandon non-producing wellbores, remove platforms, tanks, production equipment and flow lines, and restore the wellsite (refer to Note 12 for further discussion).
At least annually, FCX reviews its ARO estimates for changes in the projected timing of certain reclamation and closure/restoration costs, changes in cost estimates and additional AROs incurred during the period.
Revenue Recognition. FCX sells its products pursuant to sales contracts entered into with its customers. Revenue for all FCX's products is recognized when title and risk of loss pass to the customer and when collectibility is reasonably assured. The passing of title and risk of loss to the customer are based on terms of the sales contract, generally upon shipment or delivery of product.
141
Table of Contents
Revenues from FCX's concentrate and cathode sales are recorded based on a provisional sales price or a final sales price calculated in accordance with the terms specified in the relevant sales contract. Revenues from concentrate sales are recorded net of treatment and all refining charges (including price participation, if applicable, as discussed below) and the impact of derivative contracts. Moreover, because a portion of the metals contained in copper concentrates is unrecoverable as a result of the smelting process, FCX's revenues from concentrate sales are also recorded net of allowances based on the quantity and value of these unrecoverable metals. These allowances are a negotiated term of FCX's contracts and vary by customer. Treatment and refining charges represent payments or price adjustments to smelters and refiners and are either fixed or, in certain cases, vary with the price of copper (referred to as price participation).
Under the long-established structure of sales agreements prevalent in the mining industry, copper contained in concentrate and cathode is generally provisionally priced at the time of shipment. The provisional prices are finalized in a specified future month (generally one to four months from the shipment date) based on quoted monthly average spot copper prices on the London Metal Exchange (LME) or the Commodity Exchange Inc. (COMEX), a division of the New York Mercantile Exchange (NYMEX). FCX receives market prices based on prices in the specified future month, which results in price fluctuations recorded to revenues until the date of settlement. FCX records revenues and invoices customers at the time of shipment based on then-current LME or COMEX prices, which results in an embedded derivative ( i.e. , a pricing mechanism that is finalized after the time of delivery) that is required to be bifurcated from the host contract. The host contract is the sale of the metals contained in the concentrates or cathodes at the then-current LME or COMEX price. FCX applies the normal purchases and normal sales scope exception in accordance with derivatives and hedge accounting guidance to the host contract in its concentrate or cathode sales agreements since these contracts do not allow for net settlement and always result in physical delivery. The embedded derivative does not qualify for hedge accounting and is adjusted to fair value through earnings each period, using the period-end forward prices, until the date of final pricing.
Gold sales are priced according to individual contract terms, generally the average London Bullion Market Association (London) price for a specified month near the month of shipment.
Substantially all of FCX's 2014 molybdenum sales were priced based on prices published in Metals Week , Ryan's Notes or Metal Bulletin , plus conversion premiums for products that undergo additional processing, such as ferromolybdenum and molybdenum chemical products. The majority of these sales use the average price of the previous month quoted by the applicable publication. FCX's remaining molybdenum sales generally have pricing that is either based on the current month published prices or a fixed price.
PT-FI concentrate sales, Tenke Fungurume Mining S.A. (TFM or Tenke) metal sales and certain Sociedad Minera Cerro Verde S.A.A. (Cerro Verde) metal sales are subject to certain royalties, which are recorded as a reduction to revenues. In addition, PT-FI concentrate sales are also subject to export duties beginning in 2014, which are recorded as a reduction to revenues. Refer to Note 13 for further discussion.
Oil and gas revenue from FCX's interests in producing wells is recognized upon delivery and passage of title, net of any royalty interests or other profit interests in the produced product. Oil sales are primarily under contracts with prices based upon regional benchmarks. Approximately 40 percent of gas sales are priced monthly using industry recognized, published index pricing, and the remainder is priced daily on the spot market. Gas revenue is recorded using the sales method for gas imbalances. If FCX's sales of production volumes for a well exceed its portion of the estimated remaining recoverable reserves of the well, a liability is recorded. No receivables are recorded for those wells on which FCX has taken less than its ownership share of production unless the amount taken by other parties exceeds the estimate of their remaining reserves. There were no material gas imbalances at December 31, 2014 .
Stock-Based Compensation. Compensation costs for share-based payments to employees are measured at fair value and charged to expense over the requisite service period for awards that are expected to vest. The fair value of stock options is determined using the Black-Scholes-Merton option valuation model. The fair value for stock-settled restricted stock units (RSUs) is based on FCX's stock price on the date of grant. Shares of common stock are issued at the vesting date for stock-settled RSUs. The fair value of the performance share units (PSUs) and the performance-based RSUs are determined using a Monte-Carlo simulation model. The fair value for liability-classified awards (i.e., cash-settled stock appreciation rights (SARs) and cash-settled RSUs) is remeasured each reporting period using the Black-Scholes-Merton option valuation model for SARs and FCX's stock price for cash-settled RSUs. FCX has elected to recognize compensation costs for stock option awards and SARs that vest over several years on a straight-line basis over the vesting period, and for RSUs on the graded-vesting method over the vesting period. Refer to Note 10 for further discussion.
142
Table of Contents
Earnings Per Share. FCX's basic net income per share of common stock was computed by dividing net income attributable to FCX common stockholders by the weighted-average shares of common stock outstanding during the year. Diluted net income per share of common stock was computed using the most dilutive of (a) the two-class method or (b) the treasury stock method. Under the two-class method, net income is allocated to each class of common stock and participating securities as if all of the earnings for the period had been distributed. FCX's participating securities consist of vested RSUs for which the underlying common shares are not yet issued and entitle holders to non-forfeitable dividends.
A reconciliation of net income and weighted-average shares of common stock outstanding for purposes of calculating basic and diluted net income per share for the years ended December 31 follows :
| 2014 |
| 2013 |
| 2012 |
| ||||||
Net (loss) income | $ | (745 | ) |
| $ | 3,441 | |
| $ | 3,980 | |
|
Net income attributable to noncontrolling interests | (523 | ) |
| (761 | ) |
| (939 | ) |
| |||
Preferred dividends on redeemable noncontrolling interest | (40 | ) |
| (22 | ) |
| - | |
| |||
Undistributed earnings allocable to participating securities | (3 | ) |
| - | |
| - | |
| |||
Net (loss) income allocable to FCX common stockholders | $ | (1,311 | ) |
| $ | 2,658 | |
| $ | 3,041 | |
|
|
|
|
|
|
|
| ||||||
Basic weighted-average shares of common stock outstanding (millions) | 1,039 | |
| 1,002 | |
| 949 | |
| |||
Add shares issuable upon exercise or vesting of dilutive stock options and RSUs (millions) | - | | a | 4 | | a | 5 | | a | |||
Diluted weighted-average shares of common stock outstanding (millions) | 1,039 | |
| 1,006 | |
| 954 | |
| |||
|
|
|
|
|
|
| ||||||
Basic net (loss) income per share attributable to FCX common stockholders | $ | (1.26 | ) |
| $ | 2.65 | |
| $ | 3.20 | |
|
|
|
|
|
|
|
| ||||||
Diluted net (loss) income per share attributable to FCX common stockholders | $ | (1.26 | ) |
| $ | 2.64 | |
| $ | 3.19 | |
|
a. | Excludes shares of common stock associated with outstanding stock options with exercise prices less than the average market price of FCX's common stock and RSUs that were anti-dilutive, with related amounts totaling approximately ten million for the year ended December 31, 2014 , and one million for the years ended December 31, 2013 and 2012 . |
Outstanding stock options with exercise prices greater than the average market price of FCX's common stock during the year are excluded from the computation of diluted net income per share of common stock. Excluded stock options totaled 31 million with a weighted-average exercise price of $40.52 per option in 2014 ; 30 million with a weighted-average exercise price of $40.23 per option in 2013 ; and 17 million with a weighted-average exercise price of $44.73 per option in 2012 .
NOTE 2. DISPOSITIONS AND ACQUISITIONS
Candelaria and Ojos del Salado Disposition. On November 3, 2014 , FCX completed the sale of its 80 percent ownership interests in the Candelaria and Ojos del Salado copper mining operations and supporting infrastructure (Candelaria/Ojos) located in Chile to Lundin Mining Corporation (Lundin) for $1.8 billion in cash, before closing adjustments, and contingent consideration of up to $200 million . Contingent consideration is calculated as five percent of net copper revenues in any annual period over the next five years when the average realized copper price exceeds $4.00 per pound . Excluding contingent consideration, after-tax net proceeds totaled $1.5 billion , and FCX recorded a gain of $671 million ( $450 million after tax) associated with this transaction. The transaction had an effective date of June 30, 2014 . FCX used the proceeds from this transaction to repay indebtedness.
Current assets | $ | 482 | |
Long-term assets | 1,155 | | |
Current liabilities | 129 | | |
Long-term liabilities | 89 | | |
Noncontrolling interests | 242 | | |
143
Table of Contents
The following table provides net income before income taxes and net income attributable to FCX common stockholders for Candelaria/Ojos:
|
| January 1, 2014, |
|
|
|
| ||||||
|
| to |
| Years Ended December 31, | ||||||||
|
| November 3, 2014 |
| 2013 |
| 2012 | ||||||
Net income before income taxes |
| $ | 270 | |
| $ | 689 | |
| $ | 547 | |
Net income attributable to FCX common stockholders |
| 144 | |
| 341 | |
| 304 | | |||
Eagle Ford Disposition. On June 20, 2014 , FCX completed the sale of its Eagle Ford shale assets to a subsidiary of Encana Corporation for cash consideration of $3.1 billion , before closing adjustments from the April 1, 2014 , effective date. Under full cost accounting rules, the proceeds were recorded as a reduction of capitalized oil and gas properties, with no gain or loss recognition, except for $84 million of deferred tax expense recorded in connection with the allocation of $221 million of goodwill (for which deferred taxes were not previously provided) to the Eagle Ford shale assets. Approximately $1.3 billion of proceeds from this transaction was placed in a like-kind exchange escrow and was used to reinvest in additional oil and gas interests, as discussed below. The remaining proceeds were used to repay debt.
Deepwater Gulf of Mexico (GOM) Acquisitions. On June 30, 2014 , FCX completed the acquisition of interests in the Deepwater GOM from a subsidiary of Apache Corporation, including interests in the Lucius and Heidelberg oil fields and several exploration leases, for $918 million ( $451 million for oil and gas properties subject to amortization and $477 million for costs not subject to amortization, including transaction costs and $10 million of asset retirement costs). The Deepwater GOM acquisition was funded by the like-kind exchange escrow.
On September 8, 2014 , FCX completed the acquisition of additional Deepwater GOM interests for $496 million , including an interest in the Vito oil discovery in the Mississippi Canyon area and a significant lease position in the Vito basin area. Based on preliminary valuations, and including purchase price adjustments and transaction costs, FCX recorded capitalized costs for oil and gas properties not subject to amortization of $509 million . This acquisition was funded in part with the remaining $414 million of funds from the like-kind exchange escrow.
PXP and MMR Acquisitions. FCX acquired PXP on May 31, 2013 , and MMR on June 3, 2013 . These acquisitions added a portfolio of oil and gas assets to FCX ' s global mining business, creating a U.S.-based natural resources company. The portfolio of oil and gas assets included oil production facilities and growth potential in the GOM, oil production from the onshore Eagle Ford shale play in Texas, oil production facilities onshore and offshore California, onshore natural gas resources in the Haynesville shale play in Louisiana, natural gas production from the Madden area in central Wyoming, and a position in the emerging Inboard Lower Tertiary/Cretaceous natural gas trend in the shallow waters of the GOM and onshore in South Louisiana. The acquisitions have been accounted for under the acquisition method, with FCX as the acquirer. As further discussed in Note 8 , FCX issued $6.5 billion of unsecured senior notes in March 2013 for net proceeds of $6.4 billion , which was used, together with borrowings under a $4.0 billion unsecured five -year bank term loan, to fund the cash portion of the merger consideration for both transactions, to repay certain indebtedness of PXP and for general corporate purposes.
In the PXP acquisition, FCX acquired PXP for per-share consideration equivalent to 0.6531 shares of FCX common stock and $25.00 in cash. FCX issued 91 million shares of its common stock and paid $3.8 billion in cash (which included $411 million for the value of the $3 per share special dividend paid to PXP stockholders on May 31, 2013 ). Following is a summary of the $6.6 billion purchase price for PXP:
Number of shares of PXP common stock acquired (millions) | 132.280 | |
| |
Exchange ratio of FCX common stock for each PXP share | 0.6531 | |
| |
| 86.392 | |
| |
Shares of FCX common stock issued for certain PXP equity awards (millions) | 4.769 | |
| |
Total shares of FCX common stock issued (millions) | 91.161 | |
| |
|
|
| ||
Closing share price of FCX common stock at May 31, 2013 | $ | 31.05 | |
|
FCX stock consideration | $ | 2,831 | |
|
Cash consideration | 3,725 | | a | |
Employee stock-based awards, primarily cash-settled stock-based awards | 83 | |
| |
Total purchase price | $ | 6,639 | |
|
144
Table of Contents
a. | Cash consideration includes the payment of $25.00 in cash for each PXP share ( $3.3 billion ), cash paid in lieu of any fractional shares of FCX common stock, cash paid for certain equity awards ( $7 million ) and the value of the $3 per share PXP special cash dividend ( $411 million ) paid on May 31, 2013 . |
In the MMR acquisition, for each MMR share owned, MMR stockholders received $14.75 in cash and 1.15 units of a royalty trust, which holds a 5 percent overriding royalty interest in future production from MMR's Inboard Lower Tertiary/Cretaceous exploration prospects that existed as of December 5, 2012 , the date of the merger agreement. MMR conveyed the royalty interests to the royalty trust immediately prior to the effective time of the merger, and they were "carved out" of the mineral interests that were acquired by FCX and not considered part of purchase consideration.
Prior to June 3, 2013 , FCX owned 500,000 shares of MMR ' s 5.75% Convertible Perpetual Preferred Stock, Series 2, which were accounted for under the cost method and recorded on FCX's balance sheet at $432 million on May 31, 2013 . Through its acquisition of PXP on May 31, 2013 , FCX acquired 51 million shares of MMR ' s common stock, which had a fair value of $848 million on that date based upon the closing market price of MMR's common stock ( $16.63 per share, i.e. , Level 1 measurement). As a result of FCX obtaining control of MMR on June 3, 2013 , FCX remeasured its ownership interests in MMR to a fair value of $1.4 billion , resulting in a gain of $128 million that was recorded in 2013. Fair value was calculated using the closing quoted market price of MMR ' s common stock on June 3, 2013 , of $16.75 per share ( i.e. , Level 1 measurement) and a valuation model using observable inputs ( i.e. , Level 2 measurement) for the preferred stock. Following is a summary of the $3.1 billion purchase price for MMR:
Number of shares of MMR common stock acquired (millions) | 112.362 | | a | |
Cash consideration of $14.75 per share | $ | 14.75 | |
|
Cash consideration paid by FCX | $ | 1,657 | |
|
Employee stock-based awards | 63 | |
| |
Total | 1,720 | |
| |
Fair value of FCX's investment in 51 million shares of MMR common stock acquired on |
|
| ||
May 31, 2013, through the acquisition of PXP | 854 | |
| |
Fair value of FCX's investment in MMR's 5.75% Convertible Perpetual Preferred Stock, Series 2 | 554 | |
| |
Total purchase price | $ | 3,128 | |
|
a. | Excludes 51 million shares of MMR common stock owned by FCX through its acquisition of PXP on May 31, 2013 . |
The following table summarizes the final purchase price allocations for PXP and MMR:
| PXP |
| MMR |
| Eliminations |
| Total | ||||||||
Current assets | $ | 1,193 | |
| $ | 98 | |
| $ | - | |
| $ | 1,291 | |
Oil and gas properties - full cost method: |
|
|
|
|
|
|
| ||||||||
Subject to amortization | 11,447 | |
| 751 | |
| - | |
| 12,198 | | ||||
Not subject to amortization | 9,401 | |
| 1,711 | |
| - | |
| 11,112 | | ||||
Property, plant and equipment | 261 | |
| 1 | |
| - | |
| 262 | | ||||
Investment in MMR a | 848 | |
| - | |
| (848 | ) |
| - | | ||||
Other assets | 12 | |
| 382 | |
| - | |
| 394 | | ||||
Current liabilities | (906 | ) |
| (174 | ) |
| - | |
| (1,080 | ) | ||||
Debt (current and long-term) | (10,631 | ) |
| (620 | ) |
| - | |
| (11,251 | ) | ||||
Deferred income taxes b | (3,917 | ) |
| - | |
| - | |
| (3,917 | ) | ||||
Other long-term liabilities | (799 | ) |
| (262 | ) |
| - | |
| (1,061 | ) | ||||
Redeemable noncontrolling interest | (708 | ) |
| (259 | ) |
| - | |
| (967 | ) | ||||
Total fair value, excluding goodwill | 6,201 | |
| 1,628 | |
| (848 | ) |
| 6,981 | | ||||
Goodwill | 438 | |
| 1,500 | |
| - | |
| 1,938 | | ||||
Total purchase price | $ | 6,639 | |
| $ | 3,128 | |
| $ | (848 | ) |
| $ | 8,919 | |
a. | PXP owned 51 million shares of MMR common stock, which were eliminated in FCX's consolidated balance sheet at the acquisition date of MMR. |
b. | Deferred income taxes have been recognized based on the estimated fair value adjustments to net assets using a 38 percent tax rate, which reflected a 35 percent federal statutory rate and a 3 percent weighted-average of the applicable statutory state tax rates (net of federal benefit). |
145
Table of Contents
In accordance with the acquisition method of accounting, the purchase price from FCX's acquisitions of both PXP and MMR has been allocated to the assets acquired, liabilities assumed and redeemable noncontrolling interest based on their estimated fair values on the respective acquisition dates. The fair value estimates were based on, but not limited to, quoted market prices, where available; expected future cash flows based on estimated reserve quantities; costs to produce and develop reserves; current replacement cost for similar capacity for certain fixed assets; market rate assumptions for contractual obligations; appropriate discount rates and growth rates, and crude oil and natural gas forward prices. The excess of the total consideration over the estimated fair value of the amounts assigned to the identifiable assets acquired, liabilities assumed and redeemable noncontrolling interest was recorded as goodwill. Goodwill recorded in connection with the acquisitions is not deductible for income tax purposes.
The fair value measurement of the oil and gas properties, asset retirement obligations included in other liabilities (refer to Note 12 for further discussion) and redeemable noncontrolling interest were based, in part, on significant inputs not observable in the market (as discussed above) and thus represents a Level 3 measurement. The fair value measurement of long-term debt, including the current portion, was based on prices obtained from a readily available pricing source and thus represents a Level 2 measurement.
During second-quarter 2014, FCX finalized the purchase price allocations, which resulted in a decrease of $5 million to oil and gas properties subject to amortization, an increase of $25 million to oil and gas properties not subject to amortization, a net decrease of $42 million to deferred income tax assets and an increase of $22 million to goodwill.
Goodwill arose on these acquisitions principally because of limited drilling activities to date and the absence of production history and material reserve data associated with the very large estimated geologic potential of an emerging trend targeting deep-seated structures in the shallow waters of the GOM and onshore analogous to large discoveries in the Deepwater GOM and other proven basins' prospects. In addition, goodwill also resulted from the requirement to recognize deferred taxes on the difference between the fair value and the tax basis of the acquired assets.
A summary of changes in the carrying amount of goodwill follows:
Balance at January 1, 2013 |
| $ | - | |
Acquisitions of PXP and MMR |
| 1,916 | | |
Balance at December 31, 2013 |
| 1,916 | | |
Purchase accounting adjustments |
| 22 | | |
Disposal of Eagle Ford (see above) |
| (221 | ) | |
Impairment charge |
| (1,717 | ) | |
Balance at December 31, 2014 |
| $ | - | |
During fourth-quarter 2014, FCX conducted a goodwill impairment assessment because of the significant decline in oil prices, which resulted in a goodwill impairment charge of $1.7 billion for the full carrying value of goodwill. Crude oil prices and FCX's estimates of oil reserves at December 31, 2014 , represent the most significant assumptions used in FCX's evaluation of goodwill ( i.e. , Level 3 measurement). Forward strip Brent oil prices used in FCX's estimates at December 31, 2014 , ranged from approximately $62 per barrel to $80 per barrel for the years 2015 through 2021, compared with a range from approximately $90 per barrel to $98 per barrel at the acquisition date.
Refer to Note 16 for the revenue and operating (loss) income that FM O&G contributed to FCX's consolidated results for the year ended December 31, 2014 , and for the seven-month period from June 1, 2013, to December 31, 2013. FCX's acquisition-related costs for the PXP and MMR acquisitions totaled $74 million for the year ended December 31, 2013, and were included in selling, general and administrative expenses in the consolidated statement of operations . In addition, FCX deferred debt issuance costs of $96 million in connection with the debt financings for the acquisitions (refer to Note 8 for further discussion of the debt financings), which, net of amortization, are included in other assets in the consolidated balance sheets .
146
Table of Contents
Redeemable Noncontrolling Interest - PXP. In 2011, PXP issued (i) 450,000 shares of Plains Offshore Operations Inc. (Plains Offshore, a consolidated subsidiary) 8% Convertible Preferred Stock (Preferred Stock) for gross proceeds of $450 million and (ii) non-detachable warrants with an exercise price of $20 per share to purchase in aggregate 9.1 million shares of Plains Offshore's common stock. In addition, Plains Offshore issued 87 million shares of Plains Offshore Class A common stock, which will be held in escrow until the conversion and cancellation of the Preferred Stock or the exercise of the warrants. Plains Offshore holds certain of FM O&G's oil and gas properties and assets located in the GOM in water depths of 500 feet or more, including the Lucius oil field and the Phobos discovery, but excluding the properties acquired by PXP in 2012 from BP Exploration & Production Inc., BP America Production Company and Shell Offshore Inc. The Preferred Stock represents a 20 percent equity interest in Plains Offshore and is entitled to a dividend of 8 percent per annum, payable quarterly, of which 2 percent may be deferred ( $34 million of accumulated deferred dividends as of December 31, 2014 ). The preferred holders are entitled to vote on all matters on which Plains Offshore common stockholders are entitled to vote. The shares of Preferred Stock also fully participate, on an as-converted basis at four times, in cash dividends distributed to any class of common stockholders of Plains Offshore. Plains Offshore has not distributed any dividends to its common stockholders.
The holders of the Preferred Stock (preferred holders) have the right, at any time at their option, to convert any or all of such holder's shares of Preferred Stock and exercise any of the associated non-detachable warrants into shares of Class A common stock of Plains Offshore, at an initial conversion/exercise price of $20 per share; the conversion price is subject to adjustment as a result of certain events. At any time on or after November 17, 2016, the fifth anniversary of the closing date, FM O&G may exercise a call right to purchase all, but not less than all, of the outstanding shares of Preferred Stock and associated non-detachable warrants for cash, at a price equal to a liquidation preference as defined in the agreement. At any time after November 17, 2015, the fourth anniversary of the closing date, a majority of the preferred holders may cause Plains Offshore to use its commercially reasonable efforts to consummate an exit event as defined in the agreement.
The non-detachable warrants are considered to be embedded derivative instruments for accounting purposes and have been assessed as not being clearly and closely related to the Preferred Stock. Therefore, the warrants are classified as a long-term liability in the accompanying consolidated balance sheets and are adjusted to fair value each reporting period with adjustments recorded in other income (expense).
The Preferred Stock of Plains Offshore is classified as temporary equity because of its redemption features and is therefore reported outside of permanent equity in FCX's consolidated balance sheet. The redeemable noncontrolling interest totaled $751 million as of December 31, 2014, and $716 million as of December 31, 2013. Remeasurement of the redeemable noncontrolling interest represents its initial carrying amount adjusted for any noncontrolling interest's share of net income (loss) or changes to the redemption value. Additionally, the carrying amount will be further increased by amounts representing dividends not currently declared or paid, but which are payable under the redemption features. Future mark-to-market adjustments to the redemption value, subject to a minimum balance of the original recorded value ( $708 million ) on May 31, 2013, shall be reflected in retained earnings and earnings per share. Changes in the redemption value above the original recorded value are accreted over the period from the date FCX acquired PXP to the earliest redemption date. The redemption value has not exceeded the original recorded value; therefore, no amounts have been accreted.
Redeemable Noncontrolling Interest - MMR. Following FCX's acquisition of MMR, MMR's 8% Convertible Perpetual Preferred Stock and 5.75% Convertible Perpetual Preferred Stock, Series 1 (totaling $259 million ) converted during 2013 primarily at the make-whole conversion rates for which holders received cash of $228 million and 17.7 million royalty trust units with a fair value of $31 million at the acquisition date.
147
Table of Contents
Unaudited Pro Forma Consolidated Financial Information . The following unaudited pro forma financial information has been prepared to reflect the acquisitions of PXP and MMR. The unaudited pro forma financial information combines the historical statements of income of FCX, PXP and MMR (including the pro forma effects of PXP's GOM acquisition that was completed on November 30, 2012) for the years ended December 31, 2013 and 2012, giving effect to the mergers as if they had occurred on January 1, 2012. The historical consolidated financial information has been adjusted to reflect factually supportable items that are directly attributable to the acquisitions.
| Years Ended December 31, |
| ||||||
| 2013 |
| 2012 |
| ||||
Revenues | $ | 23,075 | |
| $ | 22,713 | |
|
Operating income | 6,267 | |
| 6,815 | |
| ||
Income from continuing operations | 3,626 | |
| 4,277 | |
| ||
Net income attributable to FCX common stockholders | 2,825 | |
| 3,301 | |
| ||
|
|
|
|
| ||||
Net income per share attributable to FCX common stockholders: |
|
|
|
| ||||
Basic | $ | 2.71 | |
| $ | 3.17 | |
|
Diluted | 2.70 | |
| 3.16 | |
| ||
The above unaudited pro forma consolidated information has been prepared for illustrative purposes only and is not intended to be indicative of the results of operations that actually would have occurred, or the results of operations expected in future periods, had the events reflected herein occurred on the date indicated. The most significant pro forma adjustments to income from continuing operations for the year ended December 31, 2013, were to exclude $519 million of acquisition-related costs, the net tax benefit of $199 million of acquisition-related adjustments and the $128 million gain on the investment in MMR and to include them in the year ended December 31, 2012. Additionally, for the year ended December 31, 2013, the pro forma consolidated information excluded a $77 million gain on the sale of oil and gas properties reflected in MMR's results of operations prior to the acquisition because of the application of the full cost accounting method.
Cobalt Chemical Refinery Business. On March 29, 2013 , FCX, through a newly formed consolidated joint venture, completed the acquisition of a cobalt chemical refinery in Kokkola, Finland, and the related sales and marketing business. The acquisition provides direct end-market access for the cobalt hydroxide production at Tenke. The joint venture operates under the name Freeport Cobalt, and FCX is the operator with an effective 56 percent ownership interest. The remaining effective ownership interest is held by FCX's partners in TFM, including 24 percent by Lundin and 20 percent by La Générale des Carrières et des Mines (Gécamines). Consideration paid was $382 million , which included $34 million for cash acquired, and was funded 70 percent by FCX and 30 percent by Lundin. Under the terms of the acquisition agreement, there is also the potential for additional consideration of up to $110 million over a period of three years, contingent upon the achievement of revenue-based performance targets. As of December 31, 2014 , no amount was recorded for this contingency because these targets are not expected to be achieved.
NOTE 3. OWNERSHIP IN SUBSIDIARIES AND JOINT VENTURES
Ownership in Subsidiaries. FMC is a fully integrated producer of copper and molybdenum, with mines in North America, South America and the Tenke minerals district in the Democratic Republic of Congo (DRC). At December 31, 2014 , FMC's operating mines in North America were Morenci, Bagdad, Safford, Sierrita and Miami located in Arizona; Tyrone and Chino located in New Mexico; and Henderson and Climax located in Colorado. FCX has an 85 percent interest in Morenci (refer to "Joint Ventures – Sumitomo") and owns 100 percent of the other North America mines. At December 31, 2014 , operating mines in South America were Cerro Verde ( 53.56 percent owned) located in Peru and El Abra ( 51 percent owned) located in Chile. At December 31, 2014 , FMC owned an effective 56 percent interest in the Tenke minerals district in the DRC (refer to Note 13 for discussion of the change in ownership interest in 2012). At December 31, 2014 , FMC's net assets totaled $19.6 billion and its accumulated deficit totaled $9.7 billion . FCX had no loans outstanding to FMC at December 31, 2014 .
FCX's direct ownership in PT-FI totals 81.28 percent . PT Indocopper Investama, an Indonesian company, owns 9.36 percent of PT-FI, and FCX owns 100 percent of PT Indocopper Investama. Refer to "Joint Ventures - Rio Tinto" for discussion of the unincorporated joint ventures. At December 31, 2014 , PT-FI's net assets totaled $5.4 billion and its retained earnings totaled $5.2 billion . FCX had $213 million in intercompany loans outstanding to PT-FI at December 31, 2014 .
148
Table of Contents
FCX owns 100 percent of the outstanding Atlantic Copper common stock. At December 31, 2014 , Atlantic Copper's net liabilities totaled $145 million and its accumulated deficit totaled $552 million . FCX had $579 million in intercompany loans outstanding to Atlantic Copper at December 31, 2014 .
FCX owns 100 percent of FM O&G, which has a portfolio of oil and gas assets. At December 31, 2014 , FM O&G's net assets totaled $7.2 billion and its accumulated deficit totaled $4.4 billion . FCX had $4.6 billion in intercompany loans to FM O&G at December 31, 2014 .
Joint Ventures. FCX has the following unincorporated joint ventures with third parties.
Rio Tinto. PT-FI and Rio Tinto have established an unincorporated joint venture pursuant to which Rio Tinto has a 40 percent interest in PT-FI's Contract of Work (COW) and the option to participate in 40 percent of any other future exploration projects in Papua, Indonesia.
Pursuant to the joint venture agreement, Rio Tinto has a 40 percent interest in certain assets and future production exceeding specified annual amounts of copper, gold and silver through 2021 in Block A of PT-FI's COW, and, after 2021, a 40 percent interest in all production from Block A. All of PT-FI's proven and probable reserves and all its mining operations are located in the Block A area. PT-FI receives 100 percent of production and related revenues from reserves established as of December 31, 1994 ( 27.1 billion pounds of copper, 38.4 million ounces of gold and 75.8 million ounces of silver), divided into annual portions subject to reallocation for events causing changes in the anticipated production schedule. Production and related revenues exceeding those annual amounts (referred to as incremental expansion revenues) are shared 60 percent PT-FI and 40 percent Rio Tinto. Operating, nonexpansion capital and administrative costs are shared 60 percent PT-FI and 40 percent Rio Tinto based on the ratio of (i) the incremental expansion revenues to (ii) total revenues from production from Block A, with PT-FI responsible for the rest of such costs. PT-FI will continue to receive 100 percent of the cash flow from specified annual amounts of copper, gold and silver through 2021 calculated by reference to its proven and probable reserves as of December 31, 1994, and 60 percent of all remaining cash flow. Expansion capital costs are shared 60 percent PT-FI and 40 percent Rio Tinto. The payable to Rio Tinto for its share of joint venture cash flows was $29 million at December 31, 2014 , and $33 million at December 31, 2013 .
Sumitomo. FCX owns an 85 percent undivided interest in Morenci via an unincorporated joint venture. The remaining 15 percent is owned by Sumitomo, a jointly owned subsidiary of Sumitomo Metal Mining Co., Ltd. and Sumitomo Corporation. Each partner takes in kind its share of Morenci's production. FMC purchased 82 million pounds of Morenci's copper cathode from Sumitomo at market prices for $257 million during 2014 . FCX had a receivable from Sumitomo of $11 million at December 31, 2014 , and $12 million at December 31, 2013 .
149
Table of Contents
NOTE 4. INVENTORIES, INCLUDING LONG-TERM MILL AND LEACH STOCKPILES
The components of inventories follow:
| December 31, |
| ||||||
| 2014 |
| 2013 |
| ||||
Current inventories: |
|
|
|
| ||||
Mill stockpiles | $ | 86 | |
| $ | 91 | |
|
Leach stockpiles | 1,828 | |
| 1,614 | | a | ||
Total current mill and leach stockpiles | $ | 1,914 | |
| $ | 1,705 | |
|
|
|
|
|
| ||||
Total materials and supplies, net b | $ | 1,886 | |
| $ | 1,730 | |
|
|
|
|
|
| ||||
Raw materials (primarily concentrates) | $ | 288 | |
| $ | 238 | |
|
Work-in-process | 174 | |
| 199 | |
| ||
Finished goods | 1,099 | |
| 1,146 | |
| ||
Total product inventories | $ | 1,561 | |
| $ | 1,583 | |
|
|
|
|
|
| ||||
Long-term inventories: |
|
|
|
| ||||
Mill stockpiles | $ | 360 | |
| $ | 698 | |
|
Leach stockpiles | 1,819 | |
| 1,688 | |
| ||
Total long-term mill and leach stockpiles c | $ | 2,179 | |
| $ | 2,386 | |
|
a. | Amount is net of a $76 million charge associated with updated mine plans at Morenci that resulted in a loss in recoverable copper in leach stockpiles. |
b. | Materials and supplies inventory was net of obsolescence reserves totaling $20 million at December 31, 2014 , and $24 million at December 31, 2013 . |
c. | Estimated metals in stockpiles not expected to be recovered within the next 12 months. |
NOTE 5. PROPERTY, PLANT, EQUIPMENT AND MINING DEVELOPMENT COSTS, NET
The components of net property, plant, equipment and mining development costs follow:
| December 31, | ||||||
| 2014 |
| 2013 | ||||
Proven and probable mineral reserves | $ | 4,651 | |
| $ | 4,651 | |
VBPP | 1,042 | |
| 1,044 | | ||
Mining development and other | 4,712 | |
| 4,335 | | ||
Buildings and infrastructure | 5,100 | |
| 4,334 | | ||
Machinery and equipment | 11,251 | |
| 10,379 | | ||
Mobile equipment | 3,926 | |
| 3,903 | | ||
Construction in progress | 6,802 | |
| 5,603 | | ||
Property, plant, equipment and mining development costs | 37,484 | |
| 34,249 | | ||
Accumulated depreciation, depletion and amortization | (11,264 | ) |
| (10,207 | ) | ||
Property, plant, equipment and mining development costs, net | $ | 26,220 | |
| $ | 24,042 | |
FCX recorded $2.2 billion for VBPP in connection with the FMC acquisition in 2007 and transferred $2 million to proven and probable mineral reserves during 2014 , $22 million during 2013 and $762 million prior to 2013 . Cumulative impairments of VBPP total $482 million , which were primarily recorded in 2008.
Capitalized interest, which primarily related to FCX's mining operations' capital projects, totaled $148 million in 2014 , $105 million in 2013 and $81 million in 2012 .
150
Table of Contents
NOTE 6. OTHER ASSETS
The components of other assets follow:
| December 31, | ||||||
| 2014 |
| 2013 | ||||
|
|
|
| ||||
Disputed tax assessments: a |
|
|
| ||||
PT-FI | $ | 279 | |
| $ | 255 | |
Cerro Verde | 232 | |
| 72 | | ||
Intangible assets b | 334 | |
| 380 | | ||
Investments: |
|
|
| ||||
Assurance bond c | 115 | |
| - | | ||
PT Smelting d | 107 | |
| 71 | | ||
Available-for-sale securities | 46 | |
| 44 | | ||
Other | 60 | |
| 63 | | ||
Legally restricted funds e | 172 | |
| 392 | | ||
Loan to a DRC public electric utility | 164 | |
| 152 | | ||
Debt issue costs | 141 | |
| 107 | | ||
Deferred drillship costs | 113 | |
| - | | ||
Long-term receivable for income tax refunds | 63 | |
| 77 | | ||
Loan to Gécamines (related party) | 37 | |
| 34 | | ||
Other | 214 | |
| 151 | | ||
Total other assets | $ | 2,077 | |
| $ | 1,798 | |
a. | Refer to Note 12 for further discussion. |
b. | Intangible assets were net of accumulated amortization totaling $62 million at December 31, 2014 , and $57 million at December 31, 2013 . |
c. | Relates to PT-FI's commitment for smelter development in Indonesia at December 31, 2014 (refer to Note 13 for further discussion). |
d. | FCX's 25 percent ownership in PT Smelting (smelter and refinery in Gresik, Indonesia) is recorded using the equity method. Amounts were reduced by unrecognized profits on sales from PT-FI to PT Smelting totaling $24 million at December 31, 2014 , and $58 million at December 31, 2013 . |
e. | Includes $168 million for AROs related to properties in New Mexico at December 31, 2014 , and a $210 million time deposit that secured a bank guarantee (until the time deposit was released as security for the bank guarantee in 2014) associated with the Cerro Verde royalty dispute and $158 million for AROs related to properties in New Mexico at December 31, 2013 (refer to Note 12 for further discussion). |
NOTE 7. ACCOUNTS PAYABLE AND ACCRUED LIABILITIES
Additional information regarding accounts payable and accrued liabilities follows:
| December 31, | ||||||
| 2014 |
| 2013 | ||||
Accounts payable | $ | 2,439 | |
| $ | 2,144 | |
Salaries, wages and other compensation | 373 | |
| 352 | | ||
Accrued interest a | 166 | |
| 210 | | ||
Other accrued taxes | 137 | |
| 142 | | ||
Pension, postretirement, postemployment and other employee benefits b | 106 | |
| 161 | | ||
Deferred revenue | 105 | |
| 115 | | ||
Oil and gas royalty and revenue payable | 76 | |
| 169 | | ||
Rio Tinto's share of joint venture cash flows | 29 | |
| 33 | | ||
Commodity derivative contracts | 43 | |
| 205 | | ||
Other | 179 | |
| 177 | | ||
Total accounts payable and accrued liabilities | $ | 3,653 | |
| $ | 3,708 | |
a. | Third-party interest paid, net of capitalized interest, was $637 million in 2014 , $397 million in 2013 and $111 million in 2012 . |
b. | Refer to Note 9 for long-term portion. |
151
Table of Contents
NOTE 8. DEBT
Debt included $226 million of fair value adjustments related to the debt assumed in the acquisition of PXP at December 31, 2014 , and $653 million at December 31, 2013 . The components of debt follow:
| December 31, | ||||||
| 2014 |
| 2013 | ||||
Bank term loan | $ | 3,050 | |
| $ | 4,000 | |
Revolving credit facility | - | |
| - | | ||
Lines of credit | 474 | |
| - | | ||
Subsidiary credit facility | 425 | |
| - | | ||
Senior notes and debentures: |
|
|
| ||||
Issued by FCX: |
|
|
| ||||
1.40% Senior Notes due 2015 | - | |
| 500 | | ||
2.15% Senior Notes due 2017 | 500 | |
| 500 | | ||
2.30% Senior Notes due 2017 | 749 | |
| - | | ||
2.375% Senior Notes due 2018 | 1,500 | |
| 1,500 | | ||
3.100% Senior Notes due 2020 | 1,000 | |
| 999 | | ||
4.00% Senior Notes due 2021 | 598 | |
| - | | ||
3.55% Senior Notes due 2022 | 1,996 | |
| 1,996 | | ||
3.875% Senior Notes due 2023 | 1,999 | |
| 1,999 | | ||
4.55% Senior Notes due 2024 | 849 | |
| - | | ||
5.40% Senior Notes due 2034 | 796 | |
| - | | ||
5.450% Senior Notes due 2043 | 1,991 | |
| 1,991 | | ||
Issued by FM O&G: |
|
|
| ||||
6.125% Senior Notes due 2019 | 255 | |
| 817 | | ||
8.625% Senior Notes due 2019 | - | |
| 447 | | ||
7.625% Senior Notes due 2020 | - | |
| 336 | | ||
6½% Senior Notes due 2020 | 670 | |
| 1,647 | | ||
6.625% Senior Notes due 2021 | 284 | |
| 659 | | ||
6.75% Senior Notes due 2022 | 493 | |
| 1,111 | | ||
6⅞% Senior Notes due 2023 | 866 | |
| 1,686 | | ||
Issued by FMC: |
|
|
| ||||
7 1 / 8 % Debentures due 2027 | 115 | |
| 115 | | ||
9½% Senior Notes due 2031 | 129 | |
| 130 | | ||
6 1 / 8 % Senior Notes due 2034 | 116 | |
| 115 | | ||
Other (including equipment capital leases and other short-term borrowings) | 115 | |
| 158 | | ||
Total debt | 18,970 | |
| 20,706 | | ||
Less current portion of debt | (478 | ) |
| (312 | ) | ||
Long-term debt | $ | 18,492 | |
| $ | 20,394 | |
Bank Term Loan. In February 2013, FCX entered into an agreement for a $4.0 billion unsecured bank term loan (Term Loan) in connection with the acquisitions of PXP and MMR. Upon closing the PXP acquisition, FCX borrowed $4.0 billion under the Term Loan, and Freeport-McMoRan Oil & Gas LLC (FM O&G LLC, a wholly owned subsidiary of FM O&G and the successor entity of PXP) joined the Term Loan as a borrower. In November 2014, FCX prepaid $750 million of the Term Loan scheduled quarterly payments of which $100 million was applied to fourth-quarter 2014, $550 million to 2015 and $100 million to first-quarter 2016. Therefore, as of December 31, 2014, the Term Loan's scheduled payments total $650 million of quarterly installments in 2016 and $200 million in first-quarter 2017, with the final payment of $2.2 billion due on May 31, 2018 . At FCX's option, the Term Loan bears interest at either an adjusted London Interbank Offered Rate ( LIBOR ) or an alternate base rate ( ABR ) (as defined under the Term Loan agreement) plus a spread determined by reference to FCX's credit ratings (effective February 11, 2015, LIBOR plus 1.75 percent or ABR plus 0.75 percent ; previously LIBOR plus 1.50 percent or ABR plus 0.50 percent ). The effective interest rate on the Term Loan was 1.67 percent at December 31, 2014 . In February 2015, the Term Loan was amended (refer to Note 18 for further discussion).
152
Table of Contents
Revolving Credit Facility. In May 2014, FCX, PT-FI and FM O&G LLC amended the senior unsecured $3.0 billion revolving credit facility to extend the maturity date one year to May 31, 2019 , and increase the aggregate facility amount from $3.0 billion to $4.0 billion , with $500 million available to PT-FI. FCX, PT-FI and FM O&G LLC had entered into the $3.0 billion revolving credit facility on May 31, 2013 (upon completion of the acquisition of PXP). At December 31, 2014 , there were no borrowings and $45 million of letters of credit issued under the revolving credit facility, resulting in availability of approximately $4.0 billion , of which $1.5 billion could be used for additional letters of credit. In February 2015, the revolving credit facility was amended (refer to Note 18 for further discussion).
Interest on the revolving credit facility (effective February 11, 2015, LIBOR plus 1.75 percent or the ABR plus 0.75 percent ; previously LIBOR plus 1.50 percent or ABR plus 0.50 percent ) is determined by reference to FCX's credit ratings.
Lines of Credit. At December 31, 2014 , FCX had $474 million outstanding on its uncommitted and short-term lines of credit with certain financial institutions. These unsecured lines of credit allow FCX to borrow at a spread over LIBOR or the respective financial institution's cost of funds with terms and pricing that are generally more favorable than FCX's revolving credit facility. The weighted-average effective interest rate on the lines of credit was 1.29 percent at December 31, 2014 .
Subsidiary Credit Facility. In March 2014, Cerro Verde (FCX's mining subsidiary in Peru) entered into a five -year, $1.8 billion senior unsecured credit facility that is nonrecourse to FCX and the other shareholders of Cerro Verde. The credit facility allows for term loan borrowings up to the full amount of the facility, less any amounts issued and outstanding under a $500 million letter of credit sublimit. Interest on amounts drawn under the term loan is based on LIBOR plus a spread (currently 1.90 percent ) based on Cerro Verde's total net debt to earnings before interest, taxes, depreciation and amortization (EBITDA) ratio as defined in the agreement. Amounts may be drawn or letters of credit may be issued over a two -year period to fund a portion of Cerro Verde's expansion project and for Cerro Verde's general corporate purposes. The credit facility amortizes in three installments in amounts necessary for the aggregate borrowings and outstanding letters of credit not to exceed 85 percent of the $1.8 billion commitment on September 30, 2017 , 70 percent on March 31, 2018 , and 35 percent on September 30, 2018 , with the remaining balance due on the maturity date of March 10, 2019 . At December 31, 2014 , $425 million was outstanding and no letters of credit were issued under Cerro Verde's credit facility. The effective interest rate on Cerro Verde's credit facility was 2.07 percent at December 31, 2014 .
Senior Notes issued by FCX. In November 2014, FCX sold $750 million of 2.30% Senior Notes due 2017, $600 million of 4.00% Senior Notes due 2021, $850 million of 4.55% Senior Notes due 2024 and $800 million of 5.40% Senior Notes due 2034 for total net proceeds of $2.97 billion . The 2.30% Senior Notes and the 4.00% Senior Notes are redeemable in whole or in part, at the option of FCX, at a make-whole redemption price. The 4.55% Senior Notes are redeemable in whole or in part, at the option of FCX, at a make-whole redemption price prior to August 14, 2024 , and thereafter at 100 percent of principal. The 5.40% Senior Notes are redeemable in whole or in part, at the option of FCX, at a make-whole redemption price prior to May 14, 2034 , and thereafter at 100 percent of principal. FCX used the net proceeds from these senior notes to repay certain of its outstanding debt.
In March 2013, in connection with the financing of FCX's acquisitions of PXP and MMR, FCX issued $6.5 billion of unsecured senior notes in four tranches. FCX sold $1.5 billion of 2.375% Senior Notes due March 2018, $1.0 billion of 3.100% Senior Notes due March 2020, $2.0 billion of 3.875% Senior Notes due March 2023 and $2.0 billion of 5.450% Senior Notes due March 2043 for total net proceeds of $6.4 billion . The 2.375% Senior Notes and the 3.100% Senior Notes are redeemable in whole or in part, at the option of FCX, at a make-whole redemption price. The 3.875% Senior Notes are redeemable in whole or in part, at the option of FCX, at a make-whole redemption price prior to December 15, 2022 , and thereafter at 100 percent of principal. The 5.450% Senior Notes are redeemable in whole or in part, at the option of FCX, at a make-whole redemption price prior to September 15, 2042 , and thereafter at 100 percent of principal.
In February 2012, FCX sold $500 million of 1.40% Senior Notes due 2015, $500 million of 2.15% Senior Notes due 2017 and $2.0 billion of 3.55% Senior Notes due 2022 for total net proceeds of $2.97 billion . In December 2014, FCX redeemed all of its outstanding $500 million of 1.40% Senior Notes due 2015. The 2.15% Senior Notes are redeemable in whole or in part, at the option of FCX, at a make-whole redemption price prior to the redemption date. The 3.55% Senior Notes are redeemable in whole or in part, at the option of FCX, at a make-whole redemption price prior to December 1, 2021 , and thereafter at 100 percent of principal.
These senior notes rank equally with FCX's other existing and future unsecured and unsubordinated indebtedness.
153
Table of Contents
Senior Notes issued by FM O&G. In May 2013, in connection with the acquisition of PXP, FCX assumed unsecured senior notes with a stated value of $6.4 billion , which was increased by $716 million to reflect the acquisition-date fair market value of these senior notes. The fair value adjustments are being amortized over the term of the senior notes and recorded as a reduction of interest expense. These senior notes are redeemable in whole or in part, at the option of FM O&G LLC, at make-whole redemption prices prior to the dates stated below, and beginning on the dates stated below at specified redemption prices. Upon completion of the acquisition of PXP, FCX guaranteed these senior notes resulting in an investment grade rating for these senior notes.
Debt Instrument |
| Date |
6.125% Senior Notes due 2019 |
| June 15, 2016 |
6½% Senior Notes due 2020 |
| November 15, 2015 |
6.625% Senior Notes due 2021 |
| May 1, 2016 |
6.75% Senior Notes due 2022 |
| February 1, 2017 |
6⅞% Senior Notes due 2023 |
| February 15, 2018 |
Additionally, in connection with the acquisition of MMR, FCX assumed MMR's 11.875% Senior Notes due 2014, 4% Convertible Senior Notes due 2017 and 5¼% Convertible Senior Notes due 2013 with a total stated value of $558 million , which was increased by $62 million to reflect the acquisition-date fair market value of these obligations. During 2013, all of the 11.875% Senior Notes due 2014 were redeemed, and holders of 4% Convertible Senior Notes due 2017 and 5¼% Convertible Senior Notes due 2013 converted their notes into merger consideration totaling $306 million , including cash payments of $270 million and 21.0 million royalty trust units with a fair value of $36 million at the acquisition date. At December 31, 2014 and 2013, there were no outstanding amounts in connection with MMR's senior notes.
Early Extinguishments of Debt. A summary of debt extinguishments during 2014 for senior notes resulting from redemptions and tender offers follows:
| Principal Amount |
| Purchase Accounting Fair Value Adjustments |
| Book Value |
| (Loss) Gain | ||||||||
|
|
|
|
|
|
|
| ||||||||
1.40% Senior Notes due 2015 | $ | 500 | |
| $ | - | |
| $ | 500 | |
| $ | (1 | ) |
6.125% Senior Notes due 2019 | 513 | |
| 40 | |
| 553 | |
| (2 | ) | ||||
8.625% Senior Notes due 2019 | 400 | |
| 41 | |
| 441 | |
| 24 | | ||||
7.625% Senior Notes due 2020 | 300 | |
| 32 | |
| 332 | |
| 14 | | ||||
6½% Senior Notes due 2020 | 883 | |
| 79 | |
| 962 | |
| 10 | | ||||
6.625% Senior Notes due 2021 | 339 | |
| 31 | |
| 370 | |
| 3 | | ||||
6.75% Senior Notes due 2022 | 551 | |
| 57 | |
| 608 | |
| 8 | | ||||
6⅞% Senior Notes due 2023 | 722 | |
| 84 | |
| 806 | |
| 21 | | ||||
| $ | 4,208 | |
| $ | 364 | |
| $ | 4,572 | |
| $ | 77 | |
In addition, FCX recorded a loss on early extinguishment of debt of $4 million associated with the modification of its revolving credit facility in May 2014 and for fees related to the tender offers in December 2014.
In 2013, FCX completed the following transactions that resulted in a net loss on early extinguishment of debt of $35 million : (i) the termination of its $9.5 billion acquisition bridge loan facility, which was entered into in December 2012 to provide interim financing for the acquisitions of PXP and MMR but was replaced with other financing, that resulted in a loss of $45 million ; (ii) the repayment of the $ 3.9 billion outstanding under PXP's amended credit facility and the redemption of all of PXP's 7⅝% Senior Notes due 2018 for $415 million , which did not result in a gain or loss; partially offset by (iii) the redemption of MMR's remaining outstanding 11.875% Senior Notes due 2014 for $299 million , which resulted in a gain of $10 million .
In 2012, FCX redeemed the remaining $3.0 billion of its outstanding 8.375% Senior Notes due 2017 for which holders received 104.553 percent of the principal amount together with the accrued and unpaid interest. As a result of this redemption, FCX recorded a loss on early extinguishment of debt of $168 million during 2012.
Guarantees. In connection with the acquisition of PXP, FCX guaranteed the PXP senior notes, and the guarantees by certain PXP subsidiaries were released. Refer to Note 17 for a discussion of FCX's senior notes guaranteed by FM O&G LLC.
154
Table of Contents
Restrictive Covenants. FCX's Term Loan and revolving credit facility contain customary affirmative covenants and representations, and also contain a number of negative covenants that, among other things, restrict, subject to certain exceptions, the ability of FCX's subsidiaries that are not borrowers or guarantors to incur additional indebtedness (including guarantee obligations) and FCX's ability or the ability of FCX's subsidiaries to: create liens on assets; enter into sale and leaseback transactions; engage in mergers, liquidations and dissolutions; and sell all or substantially all of the assets of FCX and its subsidiaries, taken as a whole. FCX's Term Loan and revolving credit facility also contain financial ratios governing maximum total leverage and minimum interest coverage. FCX's senior notes contain limitations on liens that are generally typical for investment grade companies. At December 31, 2014 , FCX was in compliance with all of its covenants.
Maturities. Maturities of debt instruments based on the principal amounts and terms outstanding at December 31, 2014 , total $478 million in 2015 , $651 million in 2016 , $1.5 billion in 2017 , $3.7 billion in 2018 , $662 million in 2019 and $11.8 billion thereafter.
NOTE 9. OTHER LIABILITIES, INCLUDING EMPLOYEE BENEFITS
Information regarding other liabilities follows:
| December 31, | ||||||
| 2014 |
| 2013 | ||||
Pension, postretirement, postemployment and other employment benefits a | $ | 1,430 | |
| $ | 1,225 | |
Reserve for uncertain tax positions | 68 | |
| 87 | | ||
Commodity derivative contracts | - | |
| 115 | | ||
Other | 363 | |
| 263 | | ||
Total other liabilities | $ | 1,861 | |
| $ | 1,690 | |
a. | Refer to Note 7 for current portion. |
Pension Plans. Following is a discussion of FCX's pension plans.
FMC Plans. FMC has U.S. trusteed, non-contributory pension plans covering substantially all of its U.S. employees and some employees of its international subsidiaries hired before 2007. The applicable FMC plan design determines the manner in which benefits are calculated for any particular group of employees. Benefits are calculated based on final average monthly compensation and years of service or based on a fixed amount for each year of service. Participants in the FMC plans generally vest in their accrued benefits after five years of service. Non-bargained FMC employees hired after December 31, 2006, are not eligible to participate in the FMC U.S. pension plan.
FCX's funding policy for these plans provides that contributions to pension trusts shall be at least equal to the minimum funding requirements of the Employee Retirement Income Security Act of 1974, as amended, for U.S. plans; or, in the case of international plans, the minimum legal requirements that may be applicable in the various countries. Additional contributions also may be made from time to time.
FCX's policy for determining asset-mix targets for the FMC plan assets held in a master trust (Master Trust) includes the periodic development of asset and liability studies to determine expected long-term rates of return and expected risk for various investment portfolios. FCX's retirement plan administration and investment committee considers these studies in the formal establishment of asset-mix targets. FCX's investment objective emphasizes the need to maintain a well-diversified investment program through both the allocation of the Master Trust assets among asset classes and the selection of investment managers whose various styles are fundamentally complementary to one another and serve to achieve satisfactory rates of return. Diversification, by asset class and by investment manager, is FCX's principal means of reducing volatility and exercising prudent investment judgment. FCX's present target asset allocation approximates 45 percent equity investments (primarily global equities), 45 percent fixed income (primarily long-term treasury STRIPS or "separate trading or registered interest and principal securities"; long-term U.S. treasury/agency bonds; global fixed income securities; long-term, high-credit quality corporate bonds; high-yield and emerging markets fixed income securities; and fixed income debt securities) and 10 percent alternative investments (private real estate, real estate investment trusts and private equity).
155
Table of Contents
The expected rate of return on plan assets is evaluated at least annually, taking into consideration asset allocation, historical returns on the types of assets held in the Master Trust and the current economic environment. Based on these factors, FCX expects the pension assets will earn an average of 7.25 percent per annum beginning January 1, 2015. The 7.25 percent estimation was based on a passive return on a compound basis of 6.75 percent and a premium for active management of 0.5 percent reflecting the target asset allocation and current investment array.
For estimation purposes, FCX assumes the long-term asset mix for these plans generally will be consistent with the current mix. Changes in the asset mix could impact the amount of recorded pension income or expense, the funded status of the plans and the need for future cash contributions. A lower-than-expected return on assets also would decrease plan assets and increase the amount of recorded pension expense in future years. When calculating the expected return on plan assets, FCX uses the market value of assets.
Among the assumptions used to estimate the benefit obligation is a discount rate used to calculate the present value of expected future benefit payments for service to date. The discount rate assumption for FCX's U.S. plans is designed to reflect yields on high-quality, fixed-income investments for a given duration. The determination of the discount rate for these plans is based on expected future benefit payments for service to date together with the Mercer Pension Discount Curve - Above Mean Yield. The Mercer Pension Discount Curve - Above Mean Yield is constructed from the bonds in the Mercer Pension Discount Curve that have a yield higher than the regression mean yield curve. The Mercer Pension Discount Curve consists of spot ( i.e. , zero coupon) interest rates at one-half year increments for each of the next 30 years and is developed based on pricing and yield information for high-quality corporate bonds. Changes in the discount rate are reflected in FCX's benefit obligation and, therefore, in future pension costs.
Other FCX Plans. In February 2004, FCX established an unfunded Supplemental Executive Retirement Plan (SERP) for its two most senior executive officers. The SERP provides for retirement benefits payable in the form of a joint and survivor annuity or an equivalent lump sum. The annuity will equal a percentage of the executive's highest average compensation for any consecutive three-year period during the five years immediately preceding 25 years of credited service. The SERP benefit will be reduced by the value of all benefits paid or due under any defined benefit or defined contribution plan sponsored by FM Services Company, FCX's wholly owned subsidiary, FCX or its predecessor, but not including accounts funded exclusively by deductions from participant's pay.
PT-FI Plan. PT-FI has a defined benefit pension plan denominated in Indonesian rupiah covering substantially all of its Indonesian national employees. PT-FI funds the plan and invests the assets in accordance with Indonesian pension guidelines. The pension obligation was valued at an exchange rate of 12,378 rupiah to one U.S. dollar on December 31, 2014 , and 12,128 rupiah to one U.S. dollar on December 31, 2013 . Indonesian labor laws enacted in 2003 require that companies provide a minimum level of benefits to employees upon employment termination based on the reason for termination and the employee's years of service. PT-FI's pension benefit disclosures include benefits related to this law. PT-FI's expected rate of return on plan assets is evaluated at least annually, taking into consideration its long-range estimated return for the plan based on the asset mix. Based on these factors, PT-FI expects its pension assets will earn an average of 7.75 percent per annum beginning January 1, 2015. The discount rate assumption for PT-FI's plan is based on the Mercer Indonesian zero coupon bond yield curve derived from the Indonesian Government Security Yield Curve. Changes in the discount rate are reflected in PT-FI's benefit obligation and, therefore, in future pension costs.
Plan Information. FCX uses a measurement date of December 31 for its plans. Information for those plans where the accumulated benefit obligations exceed the fair value of plan assets follows:
| December 31, | ||||||
| 2014 |
| 2013 | ||||
Projected benefit obligation | $ | 2,221 | |
| $ | 2,180 | |
Accumulated benefit obligation | 2,090 | |
| 1,933 | | ||
Fair value of plan assets | 1,433 | |
| 1,490 | | ||
156
Table of Contents
Information on the FCX (including FMC's plans and FCX's SERP plans) and PT-FI plans as of December 31 follows:
| FCX |
| PT-FI | ||||||||||||
| 2014 |
| 2013 |
| 2014 |
| 2013 | ||||||||
Change in benefit obligation: |
|
|
|
|
|
|
| ||||||||
Benefit obligation at beginning |
|
|
|
|
|
|
| ||||||||
of year | $ | 1,871 | |
| $ | 1,954 | |
| $ | 259 | |
| $ | 240 | |
Service cost | 30 | |
| 30 | |
| 22 | |
| 20 | | ||||
Interest cost | 92 | |
| 77 | |
| 23 | |
| 14 | | ||||
Actuarial losses (gains) | 278 | |
| (103 | ) |
| 30 | |
| 13 | | ||||
Plan amendment | - | |
| - | |
| - | |
| 33 | | ||||
Foreign exchange (gains) losses | (2 | ) |
| 1 | |
| (7 | ) |
| (53 | ) | ||||
Benefits paid | (90 | ) |
| (88 | ) |
| (9 | ) |
| (8 | ) | ||||
Benefit obligation at end of year | 2,179 | |
| 1,871 | |
| 318 | |
| 259 | | ||||
|
|
|
|
|
|
|
| ||||||||
Change in plan assets: |
|
|
|
|
|
|
| ||||||||
Fair value of plan assets at |
|
|
|
|
|
|
| ||||||||
beginning of year | 1,350 | |
| 1,300 | |
| 124 | |
| 130 | | ||||
Actual return on plan assets | 151 | |
| 112 | |
| 20 | |
| (3 | ) | ||||
Employer contributions a | 6 | |
| 26 | |
| 55 | |
| 35 | | ||||
Foreign exchange losses | (1 | ) |
| - | |
| (5 | ) |
| (30 | ) | ||||
Benefits paid | (90 | ) |
| (88 | ) |
| (9 | ) |
| (8 | ) | ||||
Fair value of plan assets at end |
|
|
|
|
|
|
| ||||||||
of year | 1,416 | |
| 1,350 | |
| 185 | |
| 124 | | ||||
Funded status | $ | (763 | ) |
| $ | (521 | ) |
| $ | (133 | ) |
| $ | (135 | ) |
|
|
|
|
|
|
|
| ||||||||
Accumulated benefit obligation | $ | 2,048 | |
| $ | 1,742 | |
| $ | 168 | |
| $ | 141 | |
|
|
|
|
|
|
|
| ||||||||
Weighted-average assumptions |
|
|
|
|
|
|
| ||||||||
used to determine benefit obligations: |
|
|
|
|
|
|
| ||||||||
Discount rate | 4.10 | % |
| 5.00 | % |
| 8.25 | % |
| 9.00 | % | ||||
Rate of compensation increase | 3.25 | % |
| 3.75 | % |
| 9.00 | % |
| 9.00 | % | ||||
|
|
|
|
|
|
|
| ||||||||
Balance sheet classification of |
|
|
|
|
|
|
| ||||||||
funded status: |
|
|
|
|
|
|
| ||||||||
Other assets | $ | 8 | |
| $ | 8 | |
| $ | - | |
| $ | - | |
Accounts payable and |
|
|
|
|
|
|
| ||||||||
accrued liabilities | (4 | ) |
| (4 | ) |
| - | |
| - | | ||||
Other liabilities | (767 | ) |
| (525 | ) |
| (133 | ) |
| (135 | ) | ||||
Total | $ | (763 | ) |
| $ | (521 | ) |
| $ | (133 | ) |
| $ | (135 | ) |
a. | Employer contributions for 2015 are expected to approximate $98 million for the FCX plans and $20 million for the PT-FI plan (based on a December 31, 2014 , exchange rate of 12,378 Indonesian rupiah to one U.S. dollar). |
157
Table of Contents
The weighted-average assumptions used to determine net periodic benefit cost and the components of net periodic benefit cost for FCX's pension plans for the years ended December 31 follow:
| 2014 |
| 2013 |
| 2012 | ||||||
Weighted-average assumptions: a |
|
|
|
|
| ||||||
Discount rate | 5.00 | % |
| 4.10 | % |
| 4.60 | % | |||
Expected return on plan assets | 7.50 | % |
| 7.50 | % |
| 7.50 | % | |||
Rate of compensation increase | 3.75 | % |
| 3.75 | % |
| 3.75 | % | |||
|
|
|
|
|
| ||||||
Service cost | $ | 30 | |
| $ | 30 | |
| $ | 27 | |
Interest cost | 92 | |
| 77 | |
| 79 | | |||
Expected return on plan assets | (98 | ) |
| (95 | ) |
| (86 | ) | |||
Amortization of prior service credit | (1 | ) |
| - | |
| (1 | ) | |||
Amortization of net actuarial losses | 28 | |
| 38 | |
| 33 | | |||
Net periodic benefit cost | $ | 51 | |
| $ | 50 | |
| $ | 52 | |
a. | The assumptions shown relate only to the FMC plans. |
The weighted-average assumptions used to determine net periodic benefit cost and the components of net periodic benefit cost for PT-FI's pension plan for the years ended December 31 follow:
| 2014 |
| 2013 |
| 2012 | ||||||
Weighted-average assumptions: |
|
|
|
|
| ||||||
Discount rate | 9.00 | % |
| 6.25 | % |
| 7.00 | % | |||
Expected return on plan assets | 7.75 | % |
| 7.50 | % |
| 9.25 | % | |||
Rate of compensation increase | 9.00 | % |
| 8.00 | % |
| 8.00 | % | |||
|
|
|
|
|
| ||||||
Service cost | $ | 22 | |
| $ | 20 | |
| $ | 17 | |
Interest cost | 23 | |
| 14 | |
| 14 | | |||
Expected return on plan assets | (10 | ) |
| (10 | ) |
| (9 | ) | |||
Amortization of prior service cost | 3 | |
| - | |
| 1 | | |||
Amortization of net actuarial loss | 8 | |
| 8 | |
| 7 | | |||
Net periodic benefit cost | $ | 46 | |
| $ | 32 | |
| $ | 30 | |
Included in accumulated other comprehensive loss are the following amounts that have not been recognized in net periodic pension cost as of December 31:
| 2014 |
| 2013 | ||||||||||||
| Before Taxes |
| After Taxes and Noncontrolling Interests |
| Before Taxes |
| After Taxes and Noncontrolling Interests | ||||||||
Prior service costs | $ | 28 | |
| $ | 15 | |
| $ | 32 | |
| $ | 17 | |
Net actuarial loss | 749 | |
| 456 | |
| 542 | |
| 326 | | ||||
| $ | 777 | |
| $ | 471 | |
| $ | 574 | |
| $ | 343 | |
Actuarial losses in excess of 10 percent of the greater of the projected benefit obligation or market-related value of plan assets are amortized over the expected average remaining future service period of the current active participants. The amount expected to be recognized in 2015 net periodic pension cost for actuarial losses is $52 million ( $32 million net of tax and noncontrolling interests).
FCX does not expect to have any plan assets returned to it in 2015 . Plan assets are classified within a fair value hierarchy that prioritizes the inputs to valuation techniques used to measure fair value. The hierarchy gives the highest priority to unadjusted quoted prices in active markets for identical assets or liabilities (Level 1), then to significant observable inputs (Level 2) and the lowest priority to significant unobservable inputs (Level 3).
158
Table of Contents
A summary of the fair value hierarchy for pension plan assets associated with the FCX plans follows:
| Fair Value at December 31, 2014 | ||||||||||||||
| Total |
| Level 1 |
| Level 2 |
| Level 3 | ||||||||
Commingled/collective funds: |
|
|
|
|
|
|
| ||||||||
Global equity | $ | 487 | |
| $ | - | |
| $ | 487 | |
| $ | - | |
Global fixed income securities | 106 | |
| - | |
| 106 | |
| - | | ||||
Fixed income securities | 99 | |
| - | |
| 99 | |
| - | | ||||
U.S. small-cap equity | 69 | |
| - | |
| 69 | |
| - | | ||||
U.S. real estate securities | 54 | |
| - | |
| 54 | |
| - | | ||||
Real estate property | 54 | |
| - | |
| - | |
| 54 | | ||||
Short-term investments | 8 | |
| - | |
| 8 | |
| - | | ||||
Open-ended mutual funds: |
|
|
|
|
|
|
| ||||||||
Emerging markets equity | 38 | |
| 38 | |
| - | |
| - | | ||||
Mutual funds: |
|
|
|
|
|
|
| ||||||||
Emerging markets equity | 25 | |
| 25 | |
| - | |
| - | | ||||
Fixed income: |
|
|
|
|
|
|
| ||||||||
Government bonds | 244 | |
| - | |
| 244 | |
| - | | ||||
Corporate bonds | 148 | |
| - | |
| 148 | |
| - | | ||||
Private equity investments | 39 | |
| - | |
| - | |
| 39 | | ||||
Other investments | 35 | |
| - | |
| 35 | |
| - | | ||||
Total investments | 1,406 | |
| $ | 63 | |
| $ | 1,250 | |
| $ | 93 | | |
|
|
|
|
|
|
|
| ||||||||
Cash and receivables | 19 | |
|
|
|
|
|
| |||||||
Payables | (9 | ) |
|
|
|
|
|
| |||||||
Total pension plan net assets | $ | 1,416 | |
|
|
|
|
|
| ||||||
| Fair Value at December 31, 2013 | ||||||||||||||
| Total |
| Level 1 |
| Level 2 |
| Level 3 | ||||||||
Commingled/collective funds: |
|
|
|
|
|
|
| ||||||||
Global equity | $ | 623 | |
| $ | - | |
| $ | 623 | |
| $ | - | |
U.S. small-cap equity | 65 | |
| - | |
| 65 | |
| - | | ||||
Real estate property | 47 | |
| - | |
| - | |
| 47 | | ||||
U.S. real estate securities | 40 | |
| - | |
| 40 | |
| - | | ||||
Fixed income debt securities | 30 | |
| - | |
| 30 | |
| - | | ||||
Short-term investments | 5 | |
| - | |
| 5 | |
| - | | ||||
Open-ended mutual funds: |
|
|
|
|
|
|
| ||||||||
Government bonds | 43 | |
| 43 | |
| - | |
| - | | ||||
Emerging markets equity | 41 | |
| 41 | |
| - | |
| - | | ||||
Corporate bonds | 33 | |
| 33 | |
| - | |
| - | | ||||
Mutual funds: |
|
|
|
|
|
|
| ||||||||
Foreign bonds | 51 | |
| 51 | |
| - | |
| - | | ||||
Emerging markets equity | 26 | |
| 26 | |
| - | |
| - | | ||||
Emerging markets bond | 20 | |
| 20 | |
| - | |
| - | | ||||
Fixed income: |
|
|
|
|
|
|
| ||||||||
Government bonds | 198 | |
| - | |
| 198 | |
| - | | ||||
Corporate bonds | 52 | |
| - | |
| 52 | |
| - | | ||||
Private equity investments | 43 | |
| - | |
| - | |
| 43 | | ||||
Other investments | 29 | |
| 1 | |
| 28 | |
| - | | ||||
Total investments | 1,346 | |
| $ | 215 | |
| $ | 1,041 | |
| $ | 90 | | |
|
|
|
|
|
|
|
| ||||||||
Cash and receivables | 18 | |
|
|
|
|
|
| |||||||
Payables | (14 | ) |
|
|
|
|
|
| |||||||
Total pension plan net assets | $ | 1,350 | |
|
|
|
|
|
| ||||||
159
Table of Contents
Following is a description of the pension plan asset categories and the valuation techniques used to measure fair value. There have been no changes to the techniques used to measure fair value.
Commingled/collective funds are managed by several fund managers and are valued at the net asset value per unit of the fund. For most of these funds, the majority of the underlying assets are actively traded equity securities; however, the unit level is considered to be at the fund level. These funds (except the real estate property funds) require less than a month's notice for redemptions and, as such, are classified within Level 2 of the fair value hierarchy. Real estate property funds are valued at net realizable value using information from independent appraisal firms, who have knowledge and expertise about the current market values of real property in the same vicinity as the investments. Redemptions of the real estate property funds are allowed once per quarter, subject to available cash and, as such, are classified within Level 3 of the fair value hierarchy.
Open-ended mutual funds are managed by registered investment companies and are valued at the daily published net asset value of shares/units held. Because redemptions and purchases of shares/units occur at the net asset value without any adjustments to the published net asset value that is provided on an ongoing basis (active-market criteria are met), these investments are classified within Level 1 of the fair value hierarchy.
Mutual funds are valued at the closing price reported on the active market on which the individual securities are traded and, as such, are classified within Level 1 of the fair value hierarchy.
Fixed income investments include government and corporate bonds held directly by the Master Trust or through commingled funds. Fixed income securities are valued using a bid evaluation price or a mid-evaluation price and, as such, are classified within Level 2 of the fair value hierarchy. A bid evaluation price is an estimated price at which a dealer would pay for a security. A mid-evaluation price is the average of the estimated price at which a dealer would sell a security and the estimated price at which a dealer would pay for a security. These evaluations are based on quoted prices, if available, or models that use observable inputs.
Private equity investments are valued at net realizable value using information from general partners and are classified within Level 3 of the fair value hierarchy because of the inherent restrictions on redemptions that may affect the ability to sell the investments at their net asset value in the near term.
A summary of changes in the fair value of FCX's Level 3 pension plan assets for the years ended December 31 follows:
| Real Estate Property |
| Private |
| Total | ||||||
Balance at January 1, 2013 | $ | 41 | |
| $ | 45 | |
| $ | 86 | |
Actual return on plan assets: |
|
|
|
|
| ||||||
Realized gains | 1 | |
| - | |
| 1 | | |||
Net unrealized gains (losses) related to |
|
|
|
|
| ||||||
assets still held at the end of the year | 6 | |
| (1 | ) |
| 5 | | |||
Purchases | - | |
| 3 | |
| 3 | | |||
Sales | (1 | ) |
| - | |
| (1 | ) | |||
Settlements, net | - | |
| (4 | ) |
| (4 | ) | |||
Balance at December 31, 2013 | 47 | |
| 43 | |
| 90 | | |||
Actual return on plan assets: |
|
|
|
|
| ||||||
Realized gains | 2 | |
| - | |
| 2 | | |||
Net unrealized gains (losses) related to |
|
|
|
|
| ||||||
assets still held at the end of the year | 6 | |
| (1 | ) |
| 5 | | |||
Purchases | - | |
| 1 | |
| 1 | | |||
Sales | (1 | ) |
| - | |
| (1 | ) | |||
Settlements, net | - | |
| (4 | ) |
| (4 | ) | |||
Balance at December 31, 2014 | $ | 54 | |
| $ | 39 | |
| $ | 93 | |
160
Table of Contents
A summary of the fair value hierarchy for pension plan assets associated with the PT-FI plan follows:
| Fair Value at December 31, 2014 | ||||||||||||||
| Total |
| Level 1 |
| Level 2 |
| Level 3 | ||||||||
Common stocks | $ | 43 | |
| $ | 43 | |
| $ | - | |
| $ | - | |
Government bonds | 27 | |
| 27 | |
| - | |
| - | | ||||
Mutual funds | 14 | |
| 14 | |
| - | |
| - | | ||||
Total investments | 84 | |
| $ | 84 | |
| $ | - | |
| $ | - | | |
|
|
|
|
|
|
|
| ||||||||
Cash and receivables a | 101 | |
|
|
|
|
|
| |||||||
Total pension plan net assets | $ | 185 | |
|
|
|
|
|
| ||||||
| Fair Value at December 31, 2013 | ||||||||||||||
| Total |
| Level 1 |
| Level 2 |
| Level 3 | ||||||||
Common stocks | $ | 27 | |
| $ | 27 | |
| $ | - | |
| $ | - | |
Government bonds | 23 | |
| 23 | |
| - | |
| - | | ||||
Mutual funds | 12 | |
| 12 | |
| - | |
| - | | ||||
Total investments | 62 | |
| $ | 62 | |
| $ | - | |
| $ | - | | |
|
|
|
|
|
|
|
| ||||||||
Cash and receivables a | 62 | |
|
|
|
|
|
| |||||||
Total pension plan net assets | $ | 124 | |
|
|
|
|
|
| ||||||
a. | Cash consists primarily of short-term time deposits. |
Following is a description of the valuation techniques used for pension plan assets measured at fair value associated with the PT-FI plan. There have been no changes to the techniques used to measure fair value.
Common stocks, government bonds and mutual funds are valued at the closing price reported on the active market on which the individual securities are traded and, as such, are classified within Level 1 of the fair value hierarchy.
The techniques described above may produce a fair value calculation that may not be indicative of net realizable value or reflective of future fair values. Furthermore, while FCX believes its valuation techniques are appropriate and consistent with other market participants, the use of different techniques or assumptions to determine the fair value of certain financial instruments could result in a different fair value measurement at the reporting date.
The expected benefit payments for FCX's and PT-FI's pension plans follow:
| FCX |
| PT-FI a | ||||
2015 | $ | 97 | |
| $ | 20 | |
2016 | 155 | |
| 9 | | ||
2017 | 103 | |
| 16 | | ||
2018 | 107 | |
| 20 | | ||
2019 | 110 | |
| 24 | | ||
2020 through 2024 | 603 | |
| 172 | | ||
a. | Based on a December 31, 2014 , exchange rate of 12,378 Indonesian rupiah to one U.S. dollar. |
Postretirement and Other Benefits. FCX also provides postretirement medical and life insurance benefits for certain U.S. employees and, in some cases, employees of certain international subsidiaries. These postretirement benefits vary among plans, and many plans require contributions from retirees. The expected cost of providing such postretirement benefits is accrued during the years employees render service.
The benefit obligation (funded status) for the postretirement medical and life insurance benefit plans consisted of a current portion of $17 million (included in accounts payable and accrued liabilities) and a long-term portion of $162 million (included in other liabilities) at December 31, 2014 , and a current portion of $19 million and a long-term portion of $163 million at December 31, 2013 . The discount rate used to determine the benefit obligation for these plans, which was determined on the same basis as FCX's pension plans, was 3.60 percent at December 31, 2014 , and 4.30 percent at December 31, 2013 . Expected benefit payments for these plans total $17 million for 2015 , $16 million for 2016 , $15 million for 2017 , $14 million for 2018 , $15 million for 2019 and $64 million for 2020 through 2024 .
161
Table of Contents
The net periodic benefit cost charged to operations for FCX's postretirement benefits totaled $7 million in 2014, $9 million in 2013 and $10 million in 2012 (primarily for interest costs). The discount rate used to determine net periodic benefit cost and the components of net periodic benefit cost for FCX's postretirement benefits was 4.30 percent in 2014 , 3.50 percent in 2013 and 4.20 percent in 2012 . The medical-care trend rates assumed the first year trend rate was 7.50 percent at December 31, 2014 , which declines over the next 15 years with an ultimate trend rate of 4.25 percent .
FCX has a number of postemployment plans covering severance, long-term disability income, continuation of health and life insurance coverage for disabled employees or other welfare benefits. The accumulated postemployment benefit consisted of a current portion of $6 million (included in accounts payable and accrued liabilities) and a long-term portion of $38 million (included in other liabilities) at December 31, 2014 , and a current portion of $9 million and a long-term portion of $75 million at December 31, 2013 .
FCX also sponsors savings plans for the majority of its U.S. employees. The plans allow employees to contribute a portion of their pre-tax income in accordance with specified guidelines. These savings plans are principally qualified 401(k) plans for all U.S. salaried and non-bargained hourly employees. In these plans, participants exercise control and direct the investment of their contributions and account balances among various investment options. FCX contributes to these plans at varying rates and matches a percentage of employee pre-tax deferral contributions up to certain limits, which vary by plan. For employees whose eligible compensation exceeds certain levels, FCX provides an unfunded defined contribution plan, which had a liability balance of $69 million at December 31, 2014 , and $65 million at December 31, 2013 .
The costs charged to operations for employee savings plans totaled $79 million in 2014 (of which $11 million was capitalized to oil and gas properties), $66 million in 2013 (of which $5 million was capitalized to oil and gas properties) and $43 million in 2012 . FCX has other employee benefit plans, certain of which are related to FCX's financial results, which are recognized in operating costs.
NOTE 10. STOCKHOLDERS' EQUITY AND STOCK-BASED COMPENSATION
FCX's authorized shares of capital stock total 1.85 billion shares, consisting of 1.8 billion shares of common stock and 50 million shares of preferred stock.
Common Stock. At December 31, 2014 , 23.7 million shares remain available for purchase under FCX's open-market share purchase program, which does not have an expiration date. There have been no purchases under this program since 2008. The timing of future purchases of FCX's common stock is dependent on many factors, including FCX's operating results, cash flows and financial position; copper, molybdenum, gold, crude oil and natural gas prices; the price of FCX's common stock; and general economic and market conditions.
FCX's Board of Directors (the Board) authorized an increase in the cash dividend on FCX's common stock in February 2012 to the current annual rate of $1.25 per share. The Board declared a supplemental cash dividend of $1.00 per share, which was paid in July 2013. On December 19, 2014 , the Board declared a regular quarterly dividend of $0.3125 per share, which was paid on February 2, 2015 , to common shareholders of record at the close of business on January 15, 2015 . The declaration of dividends is at the discretion of the Board and will depend on FCX's financial results, cash requirements, future prospects and other factors deemed relevant by the Board.
162
Table of Contents
Accumulated Other Comprehensive Loss. A summary of changes in the balances of each component of accumulated other comprehensive loss, net of tax follows:
| Unrealized Losses on Securities |
| Translation Adjustment |
| Defined Benefit Plans |
| Total | ||||||||
Balance at January 1, 2012 | $ | (4 | ) |
| $ | 6 | |
| $ | (467 | ) |
| $ | (465 | ) |
Amounts arising during the period a,b,c,d | - | |
| (1 | ) |
| (66 | ) |
| (67 | ) | ||||
Amounts reclassified e | - | |
| - | |
| 26 | |
| 26 | | ||||
Balance at December 31, 2012 | (4 | ) |
| 5 | |
| (507 | ) |
| (506 | ) | ||||
Amounts arising during the period a,b,c | (1 | ) |
| - | |
| 67 | |
| 66 | | ||||
Amounts reclassified e | - | |
| 5 | |
| 30 | |
| 35 | | ||||
Balance at December 31, 2013 | (5 | ) |
| 10 | |
| (410 | ) |
| (405 | ) | ||||
Amounts arising during the period a,b,c,d | (1 | ) |
| - | |
| (162 | ) |
| (163 | ) | ||||
Amounts reclassified e | - | |
| - | |
| 24 | |
| 24 | | ||||
Balance at December 31, 2014 | $ | (6 | ) |
| $ | 10 | |
| $ | (548 | ) |
| $ | (544 | ) |
a. | Includes net actuarial (losses) gains, net of noncontrolling interest, totaling $(106) million for 2012 , $126 million for 2013 and $(252) million for 2014 . The year 2013 also included $33 million for prior service costs. |
b. | Includes foreign exchange gains (losses), net of noncontrolling interest, totaling $3 million for 2012 , $11 million for 2013 and $1 million for 2014 . |
c. | Includes tax benefits (provision) totaling $39 million for 2012 , $(37) million for 2013 and $94 million for 2014 . |
d. | Includes adjustments to deferred tax valuation allowance of $1 million for 2012 and $5 million for 2014 . |
e. | Includes amortization primarily related to actuarial losses that were net of taxes of $15 million for 2012 , $17 million for 2013 and $14 million for 2014 . |
Stock Award Plans. FCX currently has awards outstanding under various stock-based compensation plans. The 2006 Stock Incentive Plan (the 2006 Plan), which was stockholder approved, provides for the issuance of stock options, SARs, restricted stock, RSUs and other stock-based awards for up to 74 million common shares. FCX's stockholders approved amendments to the plan in 2007 primarily to increase the number of shares available for grants, and in 2010, to permit grants to outside directors. As of December 31, 2014 , 19.6 million shares were available for grant under the 2006 Plan.
During 2014, the Board approved an incentive plan that provides for the issuance of cash-settled RSUs to employees who are not executive officers.
In connection with the restructuring of an executive employment arrangement, a special retention award of one million RSUs was granted in December 2013. The RSUs are fully vested and the related shares of common stock will be delivered to the executive upon separation of service, along with a cash payment for accumulated dividends. With respect to stock options previously granted to this executive, such awards became fully vested. With respect to performance-based awards previously granted to this executive, the service requirements are considered to have been satisfied, and the vesting of any such awards shall continue to be contingent upon the achievement of all performance conditions set forth in the award agreements. In connection with the restructuring, FCX recorded a $37 million charge to selling, general and administrative expenses in 2013.
Stock-Based Compensation Cost. Compensation cost charged against earnings for stock-based awards for the years ended December 31 follows:
|
| 2014 |
| 2013 |
| 2012 | ||||||
Selling, general and administrative expenses |
| $ | 79 | |
| $ | 145 | |
| $ | 77 | |
Production and delivery |
| 28 | |
| 28 | |
| 23 | | |||
Capitalized costs |
| 23 | |
| 13 | |
| - | | |||
Total stock-based compensation |
| 130 | |
| 186 | |
| 100 | | |||
Less: capitalized costs |
| (23 | ) |
| (13 | ) |
| - | | |||
Tax benefit and noncontrolling interests' share |
| (42 | ) |
| (66 | ) |
| (39 | ) | |||
Impact on net income |
| $ | 65 | |
| $ | 107 | |
| $ | 61 | |
163
Table of Contents
Stock Options and SARs. Stock options granted under the plans generally expire 10 years after the date of grant and vest in 25 percent annual increments beginning one year from the date of grant. The award agreements provide that participants will receive the following year's vesting after retirement. Therefore, on the date of grant, FCX accelerates one year of amortization for retirement-eligible employees. Stock options granted prior to February 2012 provide for accelerated vesting if there is a change of control (as defined in the award agreements). Stock options granted after that date provide for accelerated vesting only upon certain qualifying termination of employment within one year following a change of control. SARs generally expire within five years after the date of grant and vest in one-third annual increments beginning one year from the date of grant. SARs are similar to stock options, but are settled in cash rather than in shares of common stock and are classified as liability awards.
A summary of options and SARs outstanding as of December 31, 2014 , including 1,413,153 SARs, and activity during the year ended December 31, 2014 , follows:
| Number of Options and SARs |
| Weighted- Average Exercise Price Per Share |
| Weighted- Average Remaining Contractual Term (years) |
| Aggregate Intrinsic Value | |||||
Balance at January 1 | 45,130,661 | |
| $ | 35.39 | |
| |
|
| ||
Granted | 3,276,000 | |
| 31.01 | |
|
|
|
| |||
Exercised | (1,950,130 | ) |
| 21.23 | |
| |
|
| |||
Expired/Forfeited | (526,792 | ) |
| 37.51 | |
| |
|
| |||
Balance at December 31 | 45,929,739 | |
| 35.65 | |
| 5.1 |
| $ | 38 | | |
|
|
|
|
|
|
|
| |||||
Vested and exercisable at December 31 | 35,062,748 | |
| $ | 35.15 | |
| 4.2 |
| $ | 38 | |
The fair value of each stock option is estimated on the date of grant using the Black-Scholes-Merton option valuation model. The fair value of each SAR is determined using the Black-Scholes-Merton option valuation model and remeasured at each reporting date until the date of settlement. Expected volatility is based on implied volatilities from traded options on FCX's common stock and historical volatility of FCX's common stock. FCX uses historical data to estimate future option and SARs exercises, forfeitures and expected life. When appropriate, separate groups of employees who have similar historical exercise behavior are considered separately for valuation purposes. The expected dividend rate is calculated using the annual dividend (excluding supplemental dividends) at the date of grant. The risk-free interest rate is based on Federal Reserve rates in effect for bonds with maturity dates equal to the expected term of the option or SAR.
Information related to stock options during the years ended December 31 follows:
| 2014 |
| 2013 |
| 2012 | ||||||
Weighted-average assumptions used to value stock option awards: |
|
|
|
|
| ||||||
Expected volatility | 36.6 | % |
| 48.9 | % |
| 52.0 | % | |||
Expected life of options (in years) | 4.92 | |
| 4.66 | |
| 4.54 | | |||
Expected dividend rate | 3.5 | % |
| 3.3 | % |
| 3.1 | % | |||
Risk-free interest rate | 1.7 | % |
| 0.7 | % |
| 0.7 | % | |||
Weighted-average grant date fair value (per share) | $ | 7.43 | |
| $ | 10.98 | |
| $ | 15.60 | |
Intrinsic value of options exercised | $ | 17 | |
| $ | 10 | |
| $ | 34 | |
Fair value of options vested | $ | 76 | |
| $ | 101 | |
| $ | 77 | |
As of December 31, 2014 , FCX had $48 million of total unrecognized compensation cost related to unvested stock options expected to be recognized over a weighted-average period of 1.4 years.
The assumptions used to value SARs as of December 31, 2014 , ranged from 30.2 percent to 32.4 percent for expected volatility; one to three years for expected life; 0.2 percent to 1.0 percent for expected risk-free interest rate; and an expected dividend rate of 4.3 percent . The weighted-average grant-date fair value of SARs granted was $7.00 for the period from June 1, 2013, to December 31, 2013. The total intrinsic value of SARs exercised was $5 million during 2014 and $3 million during 2013. As of December 31, 2014 , FCX had a minimal amount of unrecognized compensation cost related to unvested SARs expected to be recognized. As of December 31, 2014 , FCX had $2 million associated with SARs included in accounts payable and accrued liabilities.
164
Table of Contents
Stock-Settled PSUs and RSUs. Beginning in 2014, FCX's executive officers were granted PSUs that vest after three years. The final number of shares to be issued to the executive officers ( i.e. , the target shares) will be based on FCX's total shareholder return compared to the total shareholder return of a peer group. The total grant date target shares related to the 2014 PSU grants were 344 thousand , of which the executive officers will earn from 0 percent to 200 percent .
Prior to 2014, a portion of each executive officer's annual bonus was to be paid in performance-based RSUs. The performance-based RSUs were a component of an annual incentive award pool that was calculated as a percentage of FCX's consolidated operating cash flows adjusted for changes in working capital and other tax payments for the preceding year. Grants of these performance-based RSUs vest after three years, subject to FCX attaining a five-year average return on investment (a performance condition defined in the award agreement) of at least six percent and subject to a 20 percent reduction if FCX performs below a group of its peers as defined in the award agreement.
All of FCX's executive officers are retirement eligible, and for the 2014 awards, FCX charged the cost of these awards to expense in the year of grant because they are non-forfeitable. For the performance-based RSUs, the cost was charged to expense in the year the related operating cash flows were generated, as performance of services was only required in the calendar year preceding the date of grant.
In February 2014, FCX granted RSUs to certain employees that vest over a period of three years, and in February 2013, FCX granted RSUs to certain employees that cliff-vest at the end of three years.
FCX also grants other RSUs that vest over a period of four years to its directors. The fair value of the RSUs is amortized over the four -year vesting period or the period until the director becomes retirement eligible, whichever is shorter. Upon a director's retirement, all of their unvested RSUs immediately vest. For retirement-eligible directors, the fair value of RSUs is recognized in earnings on the date of grant.
The award agreements provide for accelerated vesting of all RSUs held by directors if there is a change of control (as defined in the award agreements) and for accelerated vesting of all RSUs held by employees if they experience a qualifying termination within one year following a change of control.
Dividends on PSUs, and dividends and interest on RSUs accrue and are paid if the award vests. A summary of outstanding stock-settled PSUs and RSUs as of December 31, 2014 , and activity during the year ended December 31, 2014 , follows:
| Number of Awards |
| Weighted-Average Grant-Date Fair Value |
| Weighted- Average Remaining Contractual Term (years) |
| Aggregate Intrinsic Value | |||||
Balance at January 1 | 4,255,476 | |
| $ | 35.13 | |
|
|
|
| ||
Granted | 2,161,700 | |
| 31.17 | |
|
|
|
| |||
Vested | (436,610 | ) |
| 37.93 | |
|
|
|
| |||
Forfeited | (175,421 | ) |
| 31.46 | |
|
|
|
| |||
Balance at December 31 | 5,805,145 | |
| 33.57 | |
| 4.7 |
| $ | 128 | | |
The total fair value of stock-settled PSUs and RSUs granted was $67 million during 2014 , $125 million during 2013 and $14 million during 2012 . The total intrinsic value of RSUs vested was $15 million during 2014 , $12 million during 2013 and $28 million during 2012 . As of December 31, 2014 , FCX had $41 million of total unrecognized compensation cost related to unvested stock-settled RSUs expected to be recognized over 1.6 years.
Cash-Settled RSUs. Cash-settled RSUs are similar to stock-settled RSUs, but are settled in cash rather than in shares of common stock and are classified as liability awards. These cash-settled RSUs generally vest over periods ranging from three to five years of service. The award agreements for cash-settled RSUs provide for accelerated vesting upon certain qualifying termination of employment within one year following a change of control (as defined in the award agreements). The fair value of these awards is remeasured each reporting period until the vesting dates.
165
Table of Contents
Dividends and interest on cash-settled RSUs accrue and are paid if the award vests. A summary of outstanding cash-settled RSUs as of December 31, 2014 , and activity during the year ended December 31, 2014 , follows:
| Number of Cash-Settled RSUs |
| Weighted-Average Grant-Date Fair Value |
| Weighted- Average Remaining Contractual Term (years) |
| Aggregate Intrinsic Value | |||||
Balance at January 1 | 2,219,812 | |
| $ | 31.05 | |
|
|
|
| ||
Granted | 2,204,986 | |
| 30.95 | |
|
|
|
| |||
Vested | (544,048 | ) |
| 31.05 | |
|
|
|
| |||
Forfeited | (293,186 | ) |
| 31.01 | |
|
|
|
| |||
Balance at December 31 | 3,587,564 | |
| 30.99 | |
| 1.3 |
| $ | 84 | | |
The total fair value of cash-settled RSUs granted was $68 million during 2014 and $70 million during 2013 . The intrinsic value of cash-settled RSUs vested was $18 million during 2014 . The accrued liability associated with cash-settled RSUs consisted of a current portion of $28 million (included in accounts payable and accrued liabilities) and a long-term portion of $29 million (included in other liabilities) at December 31, 2014 , and a current portion of $17 million and a long-term portion of $19 million at December 31, 2013.
Other Information. The following table includes amounts related to exercises of stock options and vesting of RSUs during the years ended December 31 :
| 2014 |
| 2013 |
| 2012 | ||||||
FCX shares tendered to pay the exercise price |
|
|
|
|
| ||||||
and/or the minimum required taxes a | 474,480 | |
| 3,294,624 | |
| 515,558 | | |||
Cash received from stock option exercises | $ | 12 | |
| $ | 8 | |
| $ | 15 | |
Actual tax benefit realized for tax deductions | $ | 16 | |
| $ | 8 | |
| $ | 16 | |
Amounts FCX paid for employee taxes | $ | 8 | |
| $ | 105 | |
| $ | 16 | |
a. | Under terms of the related plans, upon exercise of stock options and vesting of RSUs, employees may tender existing FCX shares to FCX to pay the exercise price and/or the minimum required taxes. |
NOTE 11. INCOME TAXES
Geographic sources of (losses) income before income taxes and equity in affiliated companies' net earnings for the years ended December 31 consist of the following:
| 2014 |
| 2013 |
| 2012 | ||||||
United States | $ | (2,997 | ) |
| $ | 1,104 | |
| $ | 1,539 | |
Foreign | 2,573 | |
| 3,809 | |
| 3,948 | | |||
Total | $ | (424 | ) |
| $ | 4,913 | |
| $ | 5,487 | |
With the exception of TFM, income taxes are provided on the earnings of FCX's material foreign subsidiaries under the assumption that these earnings will be distributed. FCX has determined that TFM's undistributed earnings are reinvested indefinitely and have been allocated toward specifically identifiable needs of the local operations, including, but not limited to, existing liabilities and potential expansions of production capacity. FCX has not provided deferred income taxes for other differences between the book and tax carrying amounts of its investments in material foreign subsidiaries as FCX considers its ownership positions to be permanent in duration, and quantification of the related deferred tax liability is not practicable.
166
Table of Contents
FCX's provision for income taxes for the years ended December 31 consists of the following:
| 2014 |
| 2013 |
| 2012 |
| ||||||
Current income taxes: |
|
|
|
|
|
| ||||||
Federal | $ | 281 | |
| $ | 203 | |
| $ | 238 | |
|
State | 35 | |
| 9 | |
| 7 | |
| |||
Foreign | 1,128 | |
| 1,081 | |
| 1,002 | |
| |||
Total current | 1,444 | |
| 1,293 | |
| 1,247 | |
| |||
|
|
|
|
|
|
| ||||||
Deferred income taxes (benefits): |
|
|
|
|
|
| ||||||
Federal | (606 | ) |
| 234 | |
| 87 | |
| |||
State | (214 | ) |
| (35 | ) |
| 18 | |
| |||
Foreign | 33 | |
| 346 | |
| 363 | |
| |||
Total deferred | (787 | ) |
| 545 | |
| 468 | |
| |||
|
|
|
|
|
|
| ||||||
Adjustments | - | |
| (199 | ) | a | (205 | ) | b,c | |||
Federal operating loss carryforwards | (333 | ) | d | (164 | ) | d | - | |
| |||
Provision for income taxes | $ | 324 | |
| $ | 1,475 | |
| $ | 1,510 | |
|
a. | As a result of the oil and gas acquisitions, FCX recognized a net tax benefit of $199 million consisting of income tax benefits of $190 million associated with net reductions in FCX's valuation allowances, $69 million related to the release of the deferred tax liability on PXP's investment in MMR common stock and $16 million associated with the revaluation of state deferred tax liabilities, partially offset by income tax expense of $76 million associated with the write off of deferred tax assets related to environmental liabilities. |
b. | In 2012, Cerro Verde signed a new 15 -year mining stability agreement with the Peruvian government, which became effective January 1, 2014 . In connection with the new mining stability agreement, Cerro Verde's income tax rate increased from 30 percent to 32 percent , and FCX recognized additional deferred tax expense of $29 million . |
c. | Cerro Verde previously recorded deferred Peruvian income tax liabilities for income taxes that would become payable if the reinvested profits used to fund the initial Cerro Verde sulfide expansion were distributed prior to the expiration of Cerro Verde's 1998 stability agreement on December 31, 2013. Because reinvested profits at Cerro Verde were not expected to be distributed prior to December 31, 2013, a net deferred income tax liability of $234 million was reversed and recognized as an income tax benefit in 2012. |
d. | Benefit from the use of federal operating loss carryforwards acquired as part of the oil and gas acquisitions. |
A reconciliation of the U.S. federal statutory tax rate to FCX's effective income tax rate for the years ended December 31 follows:
| 2014 |
| 2013 |
| 2012 | |||||||||||||||
| Amount |
| Percent |
| Amount |
| Percent |
| Amount |
| Percent | |||||||||
U.S. federal statutory tax rate | $ | (149 | ) |
| 35 | % |
| $ | 1,720 | |
| 35 | % |
| $ | 1,920 | |
| 35 | % |
Foreign tax credit limitation | 167 | |
| (39 | ) |
| 117 | |
| 2 | |
| 110 | |
| 2 | | |||
Percentage depletion | (263 | ) | a | 62 | |
| (223 | ) |
| (5 | ) |
| (263 | ) |
| (5 | ) | |||
Withholding and other impacts on |
|
|
|
|
|
|
|
|
|
|
| |||||||||
foreign earnings | 161 | |
| (38 | ) |
| 306 | |
| 7 | |
| (17 | ) |
| - | | |||
Effect of foreign rates different than the U.S. |
|
|
|
|
|
|
|
|
|
|
| |||||||||
federal statutory rate | (135 | ) |
| 32 | |
| (223 | ) |
| (5 | ) |
| (204 | ) |
| (4 | ) | |||
Valuation allowance on minimum |
|
|
|
|
|
|
|
|
| |
|
| ||||||||
tax credits | - | |
| - | |
| (190 | ) |
| (4 | ) |
| (9 | ) |
| - | | |||
Goodwill impairment | 601 | |
| (142 | ) |
| - | |
| - | |
| - | |
| - | | |||
Goodwill transferred to full cost pool | 77 | |
| (18 | ) |
| - | |
| - | |
| - | |
| - | | |||
State income taxes | (115 | ) |
| 27 | |
| (43 | ) |
| - | |
| 17 | |
| - | | |||
Other items, net | (20 | ) |
| 5 | |
| 11 | |
| - | |
| (44 | ) |
| - | | |||
Provision for income taxes | $ | 324 | | b,c | (76 | )% |
| $ | 1,475 | | d | 30 | % |
| $ | 1,510 | | e | 28 | % |
a. | Includes a net charge of $16 million related to a change in U.S. federal income tax law. |
b. | Includes charges related to changes in Chilean and Peruvian tax rules of $54 million and $24 million , respectively. |
c. | Includes a net charge of $221 million related to the sale of Candelaria/Ojos. |
d. | Includes a net tax benefit of $199 million as a result of the oil and gas acquisitions. |
e. | Includes the reversal of Cerro Verde's deferred income tax liability of $234 million . |
167
Table of Contents
FCX paid federal, state, local and foreign income taxes totaling $1.5 billion in 2014 , $1.3 billion in 2013 and $1.8 billion in 2012 . FCX received refunds of federal, state, local and foreign income taxes of $257 million in 2014 , $270 million in 2013 and $69 million in 2012 .
The components of deferred taxes follow:
| December 31, | ||||||
| 2014 |
| 2013 | ||||
Deferred tax assets: |
|
|
| ||||
Foreign tax credits | $ | 2,306 | |
| $ | 2,144 | |
Accrued expenses | 1,047 | |
| 1,098 | | ||
Minimum tax credits | 737 | |
| 603 | | ||
Net operating loss carryforwards | 590 | |
| 925 | | ||
Employee benefit plans | 422 | |
| 443 | | ||
Other | 734 | |
| 557 | | ||
Deferred tax assets | 5,836 | |
| 5,770 | | ||
Valuation allowances | (2,434 | ) |
| (2,487 | ) | ||
Net deferred tax assets | 3,402 | |
| 3,283 | | ||
|
|
|
| ||||
Deferred tax liabilities: |
|
|
| ||||
Property, plant, equipment and mining development costs | (5,331 | ) |
| (4,887 | ) | ||
Oil and gas properties | (3,392 | ) |
| (4,708 | ) | ||
Undistributed earnings | (807 | ) |
| (936 | ) | ||
Other | (185 | ) |
| (34 | ) | ||
Total deferred tax liabilities | (9,715 | ) |
| (10,565 | ) | ||
Net deferred tax liabilities | $ | (6,313 | ) |
| $ | (7,282 | ) |
At December 31, 2014 , FCX had U.S. foreign tax credit carryforwards of $2.3 billion that will expire between 2015 and 2024 , and U.S. minimum tax credit carryforwards of $737 million that can be carried forward indefinitely, but may be used only to the extent that regular tax exceeds the alternative minimum tax in any given year.
At December 31, 2014 , FCX had (i) U.S. state net operating loss carryforwards of $2.4 billion that expire between 2015 and 2034 , (ii) Spanish net operating loss carryforwards of $623 million that expire between 2015 and 2032 , and (iii) U.S. federal net operating loss carryforwards of $800 million that expire between 2030 and 2034 .
On the basis of available information at December 31, 2014 , including positive and negative evidence, FCX has provided valuation allowances for certain of its deferred tax assets where it believes it is more likely than not that some portion or all of such assets will not be realized. Valuation allowances totaled $2.4 billion at December 31, 2014 , and covered a portion of FCX's U.S. foreign tax credit carryforwards, foreign net operating loss carryforwards, U.S. state net operating loss carryforwards and U.S. state deferred tax assets. Valuation allowances totaled $2.5 billion at December 31, 2013 , and covered all of FCX's U.S. foreign tax credit carryforwards, and a portion of its foreign net operating loss carryforwards, U.S. state net operating loss carryforwards, U.S. state deferred tax assets and U.S. capital loss carryforwards.
The $2.4 billion valuation allowance at December 31, 2014 , is primarily related to FCX's U.S. foreign tax credits. FCX has operations in tax jurisdictions where statutory income taxes and withholding taxes combine to create effective tax rates in excess of the U.S. federal income tax liability that is due upon repatriation of foreign earnings. As a result, FCX continues to generate foreign tax credits for which no benefit is expected to be realized. In addition, any foreign income taxes currently accrued or paid on unremitted foreign earnings may result in additional future foreign tax credits for which no benefit is expected to be realized upon repatriation of the related earnings. A full valuation allowance will continue to be carried on these excess U.S. foreign tax credit carryforwards until such time that FCX believes it has a prudent and feasible means of securing the benefit of U.S. foreign tax credit carryforwards that can be implemented.
The $53 million net decrease in the valuation allowance during 2014 relates primarily to increased utilization of U.S. capital loss carryforwards in the current year, and U.S. foreign tax credits and U.S. state net operating losses during the carryforward period.
168
Table of Contents
World market prices for commodities have fluctuated historically. At December 31, 2014 , market prices for copper, gold, molybdenum and oil were below their twelve-month averages. Future market prices at or below 2014 year-end prices may result in valuation allowances provided on additional deferred tax assets, including U.S. alternative minimum tax credits and net operating loss carryforwards.
In 2010, the Chilean legislature approved an increase in mining royalty taxes to help fund earthquake reconstruction activities, education and health programs. Mining royalty taxes at FCX's El Abra and Candelaria mines were stabilized through 2017 at a rate of 4 percent . However, under the legislation, FCX opted to transfer from its stabilized rate to the sliding scale of 4 to 9 percent for the years 2011 and 2012 and returned to its 4 percent rate for the years 2013 through 2017. Beginning in 2018 and through 2023, rates will move to a sliding scale of 5 to 14 percent (depending on a defined operational margin).
In September 2014, the Chilean legislature approved a tax reform package implementing a dual tax system. As currently applied, FCX will be subject to the "Partially-Integrated System." Under the previous rules, FCX's share of income from Chilean operations was subject to an effective 35 percent tax rate allocated between income taxes and dividend withholding taxes. Under the new Partially-Integrated System, FCX's share of income from Chilean operations will be subject to progressively increasing effective tax rates of 35 percent in 2014 through 2016, 44 percent in 2017 and 44.5 percent in 2018 and thereafter.
In December 2014, the Peruvian parliament passed tax legislation intended to stimulate the economy. Under the legislation, the corporate income tax rate will progressively decrease from 30 percent in 2014 to 26 percent in 2019 and thereafter. In addition, the dividend tax rate on distributions will progressively increase from 4.1 percent in 2014 to 9.3 percent in 2019 and thereafter. Cerro Verde's current mining stability agreement subjects FCX to a stable income tax rate of 32 percent through the expiration of the agreement on December 31, 2028 . The tax rate on dividend distributions is not stabilized by the agreement.
FCX accounts for uncertain income tax positions using a threshold and measurement criteria for the financial statement recognition and measurement of a tax position taken or expected to be taken in a tax return. FCX's policy associated with uncertain tax positions is to record accrued interest in interest expense and accrued penalties in other income and expenses rather than in the provision for income taxes.
169
Table of Contents
A summary of the activities associated with FCX's reserve for unrecognized tax benefits, interest and penalties follows:
| Unrecognized Tax Benefits |
| Interest |
| Penalties | ||||||
Balance at January 1, 2013 | $ | 138 | |
| $ | 31 | |
| $ | - | |
Additions: |
|
|
|
|
| ||||||
Prior year tax positions | 18 | |
| * | |
| * | | |||
Current year tax positions | 14 | |
| * | |
| * | | |||
Acquisition of PXP | 5 | |
| * | |
| * | | |||
Interest and penalties | - | |
| 7 | |
| - | | |||
Decreases: |
|
|
|
|
| ||||||
Prior year tax positions | (37 | ) |
| * | |
| * | | |||
Current year tax positions | - | |
| * | |
| * | | |||
Settlements with tax authorities | - | |
| * | |
| * | | |||
Lapse of statute of limitations | (28 | ) |
| * | |
| * | | |||
Interest and penalties | - | |
| (17 | ) |
| - | | |||
Balance at December 31, 2013 | 110 | |
| 21 | |
| - | | |||
Additions: |
|
|
|
|
| ||||||
Prior year tax positions | 4 | |
| * | |
| * | | |||
Current year tax positions | 11 | |
| * | |
| * | | |||
Interest and penalties | - | |
| 1 | |
| - | | |||
Decreases: |
|
|
|
|
| ||||||
Prior year tax positions | (12 | ) |
| * | |
| * | | |||
Current year tax positions | - | |
| * | |
| * | | |||
Settlements with tax authorities | (9 | ) |
| * | |
| * | | |||
Lapse of statute of limitations | - | |
| * | |
| * | | |||
Interest and penalties | - | |
| (7 | ) |
| - | | |||
Balance at December 31, 2014 | $ | 104 | |
| $ | 15 | |
| $ | - | |
* Amounts not allocated.
The reserve for unrecognized tax benefits of $104 million at December 31, 2014 , included $97 million ( $55 million net of income tax benefits) that, if recognized, would reduce FCX's provision for income taxes.
Changes to the reserve for unrecognized tax benefits associated with current year tax positions were primarily related to uncertainties associated with FCX ' s cost recovery methods and deductibility of social welfare payments. Changes in the reserve for unrecognized tax benefits associated with prior year tax positions were primarily related to uncertainties associated with cost recovery methods and deductibility of costs allocated to foreign operations. Changes to the reserve for unrecognized tax benefits associated with the lapse of statute of limitations were primarily related to benefits received from stock-based compensation. There continues to be uncertainty related to the timing of settlements with taxing authorities, but if additional settlements are agreed upon during the year 2015, FCX could experience a change in its reserve for unrecognized tax benefits.
FCX or its subsidiaries file income tax returns in the U.S. federal jurisdiction and various state and foreign jurisdictions. The tax years for FCX's major tax jurisdictions that remain subject to examination are as follows:
Jurisdiction |
| Years Subject to Examination |
| Additional Open Years |
U.S. Federal |
| 2007-2012 |
| 2013-2014 |
Indonesia |
| 2006-2008, 2011-2012 |
| 2010, 2013-2014 |
Peru |
| 2010 |
| 2011-2014 |
Chile |
| 2012-2013 |
| 2014 |
DRC |
| 2013 |
| 2012, 2014 |
170
Table of Contents
NOTE 12. CONTINGENCIES
Environmental. FCX subsidiaries are subject to various national, state and local environmental laws and regulations that govern emissions of air pollutants; discharges of water pollutants; and generation, handling, storage and disposal of hazardous substances, hazardous wastes and other toxic materials, including remediation, restoration and reclamation of environmental contamination. FCX subsidiaries that operate in the U.S. also are subject to potential liabilities arising under CERCLA and similar state laws that impose responsibility on current and previous owners and operators of a facility for the remediation of hazardous substances released from the facility into the environment, including damages to natural resources, irrespective of when the damage to the environment occurred or who caused it. This remediation liability also extends to persons who arranged for the disposal of hazardous substances or transported the hazardous substances to a disposal site selected by the transporter. This liability often is shared on a joint and several basis, meaning that each responsible party is fully responsible for the remediation, although in many cases some or all of the other historical owners or operators no longer exist, do not have the financial ability to respond or cannot be found. As a result, because of FCX's acquisition of FMC in 2007, many of the subsidiary companies FCX now owns are responsible for a wide variety of environmental remediation projects throughout the U.S., and FCX expects to spend substantial sums annually for many years to address those remediation issues. Certain FCX subsidiaries have been advised by the U.S. Environmental Protection Agency (EPA), the Department of the Interior, the Department of Agriculture and various state agencies that, under CERCLA or similar state laws and regulations, they may be liable for costs of responding to environmental conditions at a number of sites that have been or are being investigated to determine whether releases of hazardous substances have occurred and, if so, to develop and implement remedial actions to address environmental concerns. FCX is also subject to claims where the release of hazardous substances is alleged to have damaged natural resources (NRD). As of December 31, 2014 , FCX had more than 100 active remediation projects, including NRD claims, in 27 U.S. states.
A summary of changes in environmental obligations for the years ended December 31 follows:
| 2014 |
| 2013 |
| 2012 | ||||||
Balance at beginning of year | $ | 1,167 | |
| $ | 1,222 | |
| $ | 1,453 | |
Accretion expense a | 77 | |
| 79 | |
| 80 | | |||
Additions | 16 | |
| 73 | |
| 70 | | |||
Reductions b | (6 | ) |
| (77 | ) |
| (182 | ) | |||
Spending | (80 | ) |
| (130 | ) |
| (199 | ) | |||
Balance at end of year | 1,174 | |
| 1,167 | |
| 1,222 | | |||
Less current portion | (105 | ) |
| (121 | ) |
| (186 | ) | |||
Long-term portion | $ | 1,069 | |
| $ | 1,046 | |
| $ | 1,036 | |
a. | Represents accretion of the fair value of environmental obligations assumed in the 2007 acquisition of FMC, which were determined on a discounted cash flow basis. |
b. | Reductions primarily reflect revisions for changes in the anticipated scope and timing of projects and other noncash adjustments. |
Estimated environmental cash payments (on an undiscounted and unescalated basis) total $105 million in 2015 , $151 million in 2016 , $120 million in 2017 , $108 million in 2018 , $79 million in 2019 and $1.8 billion thereafter. The amount and timing of these estimated payments will change as a result of changes in regulatory requirements, changes in scope and timing of remediation activities, the settlement of environmental matters and as actual spending occurs.
In 2007, FCX recorded FMC's environmental obligations at fair value on the acquisition date in accordance with business combination accounting guidance. Significant adjustments to these obligations may occur in the future. New environmental obligations will be recorded as described in Note 1 under "Environmental Expenditures." At December 31, 2014 , FCX's environmental obligations totaled $1.2 billion , including $1.1 billion recorded on a discounted basis for those obligations assumed in the FMC acquisition at fair value. On an undiscounted and unescalated basis, these obligations totaled $2.4 billion . FCX estimates it is reasonably possible that these obligations could range between $2.0 billion and $2.6 billion on an undiscounted and unescalated basis.
171
Table of Contents
At December 31, 2014 , the most significant environmental obligations were associated with the Pinal Creek site in Arizona; the Newtown Creek site in New York City; historical smelter sites principally located in Arizona, Kansas, New Jersey, Oklahoma and Pennsylvania; and uranium mining sites in the western U.S. The recorded environmental obligations for these sites totaled $1.0 billion at December 31, 2014 . FCX may also be subject to litigation brought by private parties, regulators and local governmental authorities related to these historical sites. A discussion of these sites follows.
Pinal Creek. The Pinal Creek site was listed under the Arizona Department of Environmental Quality's (ADEQ) Water Quality Assurance Revolving Fund program in 1989 for contamination in the shallow alluvial aquifers within the Pinal Creek drainage near Miami, Arizona. Since that time, environmental remediation was performed by members of the Pinal Creek Group (PCG), consisting of FMC Miami, Inc. (Miami), a wholly owned subsidiary of FCX, and two other companies. Pursuant to a 2010 settlement agreement, Miami agreed to take full responsibility for future groundwater remediation at the Pinal Creek site, with limited exceptions. Remediation work consisting of both capping (earthwork) and groundwater extraction and treatment continues at this time and is expected to continue for many years in the future.
Newtown Creek. From the 1930s until 1964, Phelps Dodge Refining Corporation (PDRC), a subsidiary of FCX, operated a copper smelter, and from the 1930s until 1984, it operated a copper refinery on the banks of Newtown Creek (the creek), which is a 3.5-mile-long waterway that forms part of the boundary between Brooklyn and Queens in New York City. Heavy industrialization along the banks of the creek and discharges from the City of New York's sewer system over more than a century resulted in significant environmental contamination of the waterway. In 2010, EPA notified PDRC, four other companies and the City of New York that EPA considers them to be PRPs under CERCLA. The notified parties began working with EPA to identify other PRPs, and EPA proposed that the notified parties perform a Remedial Investigation/Feasibility Study (RI/FS) at their expense and reimburse EPA for its oversight costs. EPA is not expected to propose a remedy until after a RI/FS is completed. Additionally, in 2010, EPA designated the creek as a Superfund site, and in 2011, PDRC and five other parties entered an Administrative Order on Consent (AOC) to perform the RI/FS to assess the nature and extent of environmental contamination in the creek and identify potential remedial options. The parties ' RI/FS work under the AOC and their identification of other PRPs are ongoing and expected to take several years to complete. The actual costs of fulfilling this remedial obligation and the allocation of costs among PRPs are uncertain and subject to change based on the results of the RI/FS, the remediation remedy ultimately selected by EPA and related allocation determinations. Depending on the overall cost and the portion allocated to PDRC, that share could be material to FCX.
Historical Smelter Sites . FCX subsidiaries and their predecessors at various times owned or operated copper and zinc smelters in states including Arizona, Kansas, New Jersey, Oklahoma and Pennsylvania. For some of these smelter sites, certain FCX subsidiaries have been advised by EPA or state agencies that they may be liable for costs of investigating and, if appropriate, remediating environmental conditions associated with the smelters. At other sites, certain FCX subsidiaries have entered into state voluntary remediation programs to investigate and, if appropriate, remediate onsite and offsite conditions associated with the smelters. The historical smelter sites are in various stages of assessment and remediation. At some of these sites, disputes with local residents and elected officials regarding the health effects of alleged contamination or the effectiveness of remediation efforts have resulted in litigation of various types, and similar litigation at other sites is possible.
Uranium Mining Sites. During a period between 1940 and the early 1970s, certain FCX subsidiaries and their predecessors were involved in uranium exploration and mining in the western U.S., primarily on federal and tribal lands in the Four Corners region of the southwest. Similar exploration and mining activities by other companies have also caused environmental impacts warranting remediation, and EPA and local authorities are currently evaluating the need for significant cleanup activities in the region. To date, FCX has undertaken remediation at a limited number of sites associated with these predecessor entities. During 2014, FCX initiated reconnaissance work at a limited number of historic mining sites on federal lands in the Four Corners region and expects to increase those activities over the next several years in order to identify sites for possible future investigation and remediation. During 2014, FCX also initiated dialogue with federal and tribal representatives regarding a potential phased program to investigate and remediate historic uranium sites on tribal lands in the Four Corners region.
172
Table of Contents
AROs. FCX's ARO estimates are reflected on a third-party cost basis and comply with FCX's legal obligation to retire tangible, long-lived assets. A summary of changes in FCX's AROs for the years ended December 31 follows:
| 2014 |
| 2013 |
| 2012 | ||||||
Balance at beginning of year | $ | 2,328 | |
| $ | 1,146 | |
| $ | 921 | |
Liabilities assumed in the acquisitions of PXP and MMR a | - | |
| 1,028 | |
| - | | |||
Liabilities incurred | 430 | | b | 45 | |
| 6 | | |||
Settlements and revisions to cash flow estimates, net | 65 | |
| 123 | |
| 211 | | |||
Accretion expense | 117 | |
| 95 | |
| 55 | | |||
Dispositions | (61 | ) |
| - | |
| - | | |||
Spending | (99 | ) |
| (107 | ) |
| (47 | ) | |||
Other | (11 | ) |
| (2 | ) |
| - | | |||
Balance at end of year | 2,769 | |
| 2,328 | |
| 1,146 | | |||
Less current portion | (191 | ) |
| (115 | ) |
| (55 | ) | |||
Long-term portion | $ | 2,578 | |
| $ | 2,213 | |
| $ | 1,091 | |
a. | The fair value of AROs assumed in the acquisitions of PXP and MMR ( $741 million and $287 million , respectively) were estimated based on projected cash flows, an estimated long-term annual inflation rate of 2.5 percent , and discount rates based on FCX's estimated credit-adjusted, risk-free interest rates ranging from 1.3 percent to 6.3 percent . |
b. | Primarily reflects revisions to the closure approach to reclaim an overburden stockpile in Indonesia. |
ARO costs may increase or decrease significantly in the future as a result of changes in regulations, changes in engineering designs and technology, permit modifications or updates, changes in mine plans, changes in drilling plans, settlements, inflation or other factors and as actual reclamation spending occurs. ARO activities and expenditures for mining operations generally are made over an extended period of time commencing near the end of the mine life; however, certain reclamation activities may be accelerated if legally required or if determined to be economically beneficial. The methods used or required to plug and abandon non-producing oil and gas wellbores, remove platforms, tanks, production equipment and flow lines, and restore wellsites could change over time.
New Mexico, Arizona, Colorado and other states require financial assurance to be provided for the estimated costs of mine reclamation and closure, including groundwater quality protection programs. FCX has satisfied financial assurance requirements by using a variety of mechanisms, primarily involving parent company performance guarantees and financial capability demonstrations, but also including trust funds, surety bonds, letters of credit and collateral. The applicable regulations specify financial strength tests that are designed to confirm a company's or guarantor's financial capability to fund estimated reclamation and closure costs. The amount of financial assurance FCX is required to provide will vary with changes in laws, regulations, reclamation and closure requirements, and cost estimates. At December 31, 2014 , FCX's financial assurance obligations associated with these closure and reclamation/restoration costs totaled $1.0 billion , of which $636 million was in the form of guarantees issued by FCX and financial capability demonstrations of FCX. At December 31, 2014 , FCX had trust assets totaling $168 million (included in other assets), which are legally restricted to be used to satisfy its financial assurance obligations for its mining properties in New Mexico.
New Mexico Environmental and Reclamation Programs. FCX's New Mexico operations are regulated under the New Mexico Water Quality Act and regulations adopted under that act by the Water Quality Control Commission (WQCC). The New Mexico Environment Department (NMED) has required each of these operations to submit closure plans for NMED's approval. The closure plans must include measures to assure meeting groundwater quality standards following the closure of discharging facilities and to abate any groundwater or surface water contamination. In 2013, the WQCC adopted Supplemental Permitting Requirements for Copper Mining Facilities, which became effective on December 1, 2013, and specify closure requirements for copper mine facilities. The rules were adopted after an extensive stakeholder process in which FCX participated and were jointly supported by FCX and NMED. The rules are being challenged in the New Mexico courts by certain environmental organizations and the New Mexico Attorney General. Finalized closure plan requirements, including those resulting from the 2013 rules, could result in material increases in closure costs for FCX's New Mexico operations.
FCX's New Mexico operations also are subject to regulation under the 1993 New Mexico Mining Act (the Mining Act) and the related rules that are administered by the Mining and Minerals Division (MMD) of the New Mexico Energy, Minerals and Natural Resources Department. Under the Mining Act, mines are required to obtain approval of plans describing the reclamation to be performed following cessation of mining operations. At December 31, 2014 , FCX had accrued reclamation and closure costs of $450 million for its New Mexico operations. As stated
173
Table of Contents
above, additional accruals may be required based on the state's periodic review of FCX's updated closure plans and any resulting permit conditions, and the amount of those accruals could be material.
Arizona Environmental and Reclamation Programs. FCX's Arizona properties are subject to regulatory oversight in several areas. ADEQ has adopted regulations for its aquifer protection permit (APP) program that require permits for, among other things, certain facilities, activities and structures used for mining, leaching, concentrating and smelting and require compliance with aquifer water quality standards at an applicable point of compliance well or location. The APP program also may require mitigation and discharge reduction or elimination of some discharges.
An application for an APP requires a description of a closure strategy that will meet applicable groundwater protection requirements following cessation of operations and an estimate of the cost to implement the closure strategy. An APP may specify closure requirements, which may include post-closure monitoring and maintenance. A more detailed closure plan must be submitted within 90 days after a permitted entity notifies ADEQ of its intent to cease operations. A permit applicant must demonstrate its financial ability to meet the closure costs estimated in the APP. In 2014, the state enacted legislation requiring closure costs for facilities covered by aquifer protection permits to be updated no more frequently than every five years and financial assurance mechanisms to be updated no more frequently than every two years. ADEQ has not yet formally notified FCX regarding the time table for updating the closure cost estimates and financial assurance mechanisms for FCX's Arizona mine sites, although FCX may be required to begin updating its closure costs in 2015.
Portions of Arizona mining facilities that operated after January 1, 1986, also are subject to the Arizona Mined Land Reclamation Act (AMLRA). AMLRA requires reclamation to achieve stability and safety consistent with post-mining land use objectives specified in a reclamation plan. Reclamation plans must be approved by the State Mine Inspector and must include an estimate of the cost to perform the reclamation measures specified in the plan along with financial assurance. FCX will continue to evaluate options for future reclamation and closure activities at its operating and non-operating sites, which are likely to result in adjustments to FCX's ARO liabilities, and those adjustments could be material. At December 31, 2014 , FCX had accrued reclamation and closure costs of $285 million for its Arizona operations.
Colorado Reclamation Programs. FCX ' s Colorado operations are regulated by the Colorado Mined Land Reclamation Act (Reclamation Act) and regulations promulgated thereunder. Under the Reclamation Act, mines are required to obtain approval of plans for reclamation of lands affected by mining operations to be performed during mining or upon cessation of mining operations. During 2014, FCX met with the Colorado Division of Reclamation Mining & Safety (DRMS) regarding the inclusion of long-term water management costs in its closure plans, and Henderson updated its closure cost estimate in the fourth quarter of 2014 for long-term water management, which is still pending formal approval by DRMS. As of December 31, 2014 , FCX had accrued reclamation and closure costs of $73 million for its Colorado operations.
Chilean Reclamation and Closure Programs. In July 2011, the Chilean senate passed legislation regulating mine closure, which establishes new requirements for closure plans and became effective in November 2012. FCX's El Abra operation submitted updated closure cost estimates based on the existing approved closure plan in November 2014. At December 31, 2014 , FCX had accrued reclamation and closure costs of $67 million for its El Abra operation.
Peruvian Reclamation and Closure Programs . Cerro Verde is subject to regulation under the Mine Closure Law administered by the Peruvian Ministry of Energy and Mines. Under the closure regulations, mines must submit a closure plan that includes the reclamation methods, closure cost estimates, methods of control and verification, closure and post-closure plans and financial assurance. The latest closure plan and cost estimate for the Cerro Verde mine expansion was submitted to the Peruvian regulatory authorities in November 2013. At December 31, 2014 , Cerro Verde had accrued reclamation and closure costs of $78 million .
Indonesian Reclamation and Closure Programs. The ultimate amount of reclamation and closure costs to be incurred at PT-FI's operations will be determined based on applicable laws and regulations and PT-FI's assessment of appropriate remedial activities in the circumstances, after consultation with governmental authorities, affected local residents and other affected parties and cannot currently be projected with precision. Some reclamation costs will be incurred during mining activities, while the remaining reclamation costs will be incurred at the end of mining activities, which are currently estimated to continue for approximately 25 years. During 2014, PT-FI updated its closure approach for an overburden stockpile, which resulted in an increase in the estimated closure costs of $403 million . At December 31, 2014 , PT-FI had accrued reclamation and closure costs of $636 million .
174
Table of Contents
In 1996, PT-FI began contributing to a cash fund ( $20 million balance at December 31, 2014 , which is included in other assets) designed to accumulate at least $100 million (including interest) by the end of its Indonesia mining activities. PT-FI plans to use this fund, including accrued interest, to pay mine closure and reclamation costs. Any costs in excess of the $100 million fund would be funded by operational cash flow or other sources.
In December 2009, PT-FI submitted its revised mine closure plan to the Department of Energy and Mineral Resources for review and has addressed comments received during the course of this review process. In December 2010, the President of Indonesia issued a regulation regarding mine reclamation and closure, which requires a company to provide a mine closure guarantee in the form of a time deposit placed in a state-owned bank in Indonesia. In accordance with its COW, PT-FI is working with the Department of Energy and Mineral Resources to review these requirements, including discussion of other options for the mine closure guarantee.
Oil and Gas Properties. Substantially all of FM O&G's oil and gas leases require that, upon termination of economic production, the working interest owners plug and abandon non-producing wellbores, remove equipment and facilities from leased acreage and restore land in accordance with applicable local, state and federal laws. FM O&G operating areas include the GOM, offshore and onshore California, the Gulf Coast and the Rocky Mountain area. FM O&G AROs cover more than 6,500 wells and more than 180 platforms and other structures. At December 31, 2014 , FM O&G had accrued $1.1 billion associated with its AROs.
Litigation. FCX is involved in numerous legal proceedings that arise in the ordinary course of business or are associated with environmental issues arising from legacy operations conducted over the years by FMC and its affiliates as discussed in this note under "Environmental." FCX is also involved periodically in other reviews, investigations and proceedings by government agencies, some of which may result in adverse judgments, settlements, fines, penalties, injunctions or other relief. Management does not believe, based on currently available information, that the outcome of any legal proceeding reported below will have a material adverse effect on FCX's financial condition, although individual outcomes could be material to FCX's operating results for a particular period, depending on the nature and magnitude of the outcome and the operating results for the period.
Asbestos Claims. Since approximately 1990, FMC and various subsidiaries have been named as defendants in a large number of lawsuits that claim personal injury either from exposure to asbestos allegedly contained in electrical wire products produced or marketed many years ago or from asbestos contained in buildings and facilities located at properties owned or operated by FMC affiliates, or from alleged asbestos in talc products. Many of these suits involve a large number of codefendants. Based on litigation results to date and facts currently known, FCX believes there is a reasonable possibility that losses may have been incurred related to these matters; however, FCX also believes that the amounts of any such losses, individually or in the aggregate, are not material to its consolidated financial statements. There can be no assurance, however, that future developments will not alter this conclusion.
Shareholder Litigation . On January 15, 2015, a Stipulation and Agreement of Settlement, Compromise and Release (Stipulation) was entered into with respect to the consolidated stockholder derivative litigation captioned In Re Freeport-McMoRan Copper & Gold Inc. Derivative Litigation , No. 8145-VCN. The settlement is subject to specified conditions, including final approval by the Delaware Court of Chancery. If approved by the Court, this settlement will resolve all pending derivative claims against directors and officers of FCX challenging FCX's 2013 acquisitions of PXP and MMR. Pursuant to the Stipulation, insurers under FCX's directors and officers liability insurance policies will fund $115 million (Settlement Amount) to FCX. The settlement is conditioned upon FCX's Board declaring a special dividend in an aggregate amount not less than the net proceeds received by FCX in respect to the settlement ( i.e., the Settlement Amount less plaintiffs' attorneys' fees and expenses as awarded by the Court) plus an additional $22.5 million to be funded by FCX. The special dividend is to be paid at the time of the issuance of, and with the same record date to be established for, the next quarterly dividend announced after the Settlement Amount is received by FCX.
Pursuant to the settlement, FCX's Board has approved and agreed to keep in effect for at least three years corporate governance enhancements specified in the Stipulation. These corporate governance enhancements include agreements by FCX to maintain and/or establish (i) a lead independent director position, (ii) an independent executive committee, (iii) solely independent directors on each of the executive, corporate responsibility, audit, compensation and nominating and governance committees, and (iv) certain procedures or policies relating to the selection of members of special committees, approval of related-party transactions, and executive compensation.
175
Table of Contents
Tax and Other Matters. FCX's operations are in multiple jurisdictions where uncertainties arise in the application of complex tax regulations. Some of these tax regimes are defined by contractual agreements with the local government, while others are defined by general tax laws and regulations. FCX and its subsidiaries are subject to reviews of its income tax filings and other tax payments, and disputes can arise with the taxing authorities over the interpretation of its contracts or laws. The final taxes paid may be dependent upon many factors, including negotiations with taxing authorities. In certain jurisdictions, FCX must pay a portion of the disputed amount to the local government in order to formally appeal the assessment. Such payment is recorded as a receivable if FCX believes the amount is collectible.
Cerro Verde Royalty Dispute. SUNAT, the Peruvian national tax authority, has assessed mining royalties on ore processed by the Cerro Verde concentrator, which commenced operations in late 2006. These assessments cover the period December 2006 to December 2007 and the years 2008 and 2009. In July 2013, the Peruvian Tax Tribunal issued two decisions affirming SUNAT's assessments for the period December 2006 through December 2008. Decisions by the Tax Tribunal ended the administrative stage of the appeal procedures for these assessments. In September 2013, Cerro Verde filed judiciary appeals related to the assessments for the 2006 through 2008 periods because it continues to believe that its 1998 stability agreement exempts all minerals extracted from its mining concession from royalties, irrespective of the method used for processing those minerals. With respect to the judiciary appeal related to assessments for the year 2008, on December 17, 2014, Peru's Eighteenth Contentious Administrative Court rendered its decision upholding Cerro Verde's position and nullifying the Tax Tribunal's resolution and SUNAT's assessment. On December 31, 2014, SUNAT and the Tax Tribunal appealed this decision. As of February 20, 2015 , no decision had been rendered with respect to Cerro Verde's judicial appeal of assessments for the 2006 and 2007 periods. In July 2013, a hearing on SUNAT's assessment for 2009 was held, but no decision has been issued by the Tax Tribunal for that year. Although FCX believes its interpretation of the stability agreement is correct, if Cerro Verde is ultimately found responsible for these assessments, it may also be liable for penalties and interest, which accrues at rates that range from approximately 7 percent to 18 percent based on the year accrued and the currency in which the amounts would be payable.
In October 2013, SUNAT served Cerro Verde with a demand for payment totaling 492 million Peruvian Nuevos Soles ( $165 million based on the exchange rate at December 31, 2014 , including interest and penalties of $97 million , or a total of $88 million , net of noncontrolling interests) based on the Peruvian Tax Tribunal's decisions for the period December 2006 through December 2008. As permitted by law, Cerro Verde requested and was granted an installment payment program that deferred payment for six months and thereafter satisfies the amount via 66 equal monthly payments. As of December 31, 2014, Cerro Verde has made payments totaling 113 million Peruvian Nuevos Soles ( $40 million based on exchange rates at the date of payment) under the installment program, which are included in other assets in the consolidated balance sheet. As of December 31, 2014 , the aggregate amount of the assessments, including interest and penalties, for the year 2009 was 226 million Peruvian Nuevos Soles ( $76 million based on the exchange rate at December 31, 2014 , or a total of $41 million , net of noncontrolling interests). SUNAT may make additional assessments for mining royalties and associated penalties and interest for the years 2010 through 2013, which Cerro Verde will contest; FCX believes any such assessments for the years 2010 through 2013, if made, would in the aggregate be similar to the aggregate assessments received for the periods December 2006 through December 2009.
No amounts have been accrued for these assessments or the installment payment program as of December 31, 2014 , because Cerro Verde believes its 1998 stability agreement exempts it from these royalties and believes any payments will be recoverable.
176
Table of Contents
Other Peruvian Tax Matters. Cerro Verde has also received assessments from SUNAT for additional taxes, penalties and interest related to various audit exceptions for income and other taxes. Cerro Verde has filed or will file objections to the assessments because it believes it has properly determined and paid its taxes. A summary of these assessments follows:
Tax Year |
| Tax Assessment |
| Penalty and Interest Assessment |
| Total |
| ||||||
2002 to 2005 |
| $ | 16 | |
| $ | 49 | |
| $ | 65 | |
|
2006 |
| 7 | |
| 45 | |
| 52 | |
| |||
2007 |
| 12 | |
| 18 | |
| 30 | |
| |||
2008 |
| 21 | |
| 13 | |
| 34 | |
| |||
2009 |
| 59 | |
| 49 | |
| 108 | |
| |||
2010 |
| 63 | |
| 85 | |
| 148 | | a | |||
2014 |
| 5 | |
| - | |
| 5 | |
| |||
|
| $ | 183 | |
| $ | 259 | |
| $ | 442 | |
|
a. | The tax assessment for the year 2010 was issued in February 2015. |
As of December 31, 2014 , Cerro Verde had paid $192 million (included in other assets) on these disputed tax assessments, which it believes are collectible. No amounts have been accrued for these assessments.
Indonesia Tax Matters. PT-FI has received assessments from the Indonesian tax authorities for additional taxes and interest related to various audit exceptions for income and other taxes. PT-FI has filed objections to the assessments because it believes it has properly determined and paid its taxes. A summary of these assessments follows:
Tax Year |
| Tax Assessment |
| Interest Assessment |
| Total | ||||||
2005 |
| $ | 103 | |
| $ | 49 | |
| $ | 152 | |
2006 |
| 22 | |
| 10 | |
| 32 | | |||
2007 |
| 91 | |
| 44 | |
| 135 | | |||
2008 |
| 62 | |
| 52 | |
| 114 | | |||
2011 |
| 56 | |
| 13 | |
| 69 | | |||
2012 |
| 137 | |
| - | |
| 137 | | |||
|
| $ | 471 | |
| $ | 168 | |
| $ | 639 | |
Required estimated income tax payments for 2011 significantly exceeded PT-FI's 2011 reported income tax liability, which resulted in a $313 million overpayment. During 2013, the Indonesian tax authorities agreed to refund $291 million associated with income tax overpayments made by PT-FI for 2011, and PT-FI filed objections for the remaining $22 million that it believes it is due. PT-FI received a cash refund of $165 million in July 2013, and the Indonesian tax authorities withheld $126 million of the 2011 overpayment for unrelated assessments from 2005 and 2007, which PT-FI is disputing.
Required estimated income tax payments for 2012 significantly exceeded PT-FI's 2012 reported income tax liability, which resulted in a $303 million overpayment (included in income and other tax receivables in the consolidated balance sheet at December 31, 2013). During second-quarter 2014, the Indonesian tax authorities issued tax assessments for 2012 of $137 million and other offsets of $15 million , and refunded the balance of $151 million (before foreign exchange adjustments). PT-FI filed objections and will use other means available under Indonesian tax laws and regulations to recover all overpayments that remain in dispute.
As of December 31, 2014 , PT-FI had paid $359 million (of which $279 million was included in other assets) on disputed tax assessments, which it believes are collectible. In addition, PT-FI has $267 million (included in income and other tax receivables in the consolidated balance sheet at December 31, 2014) for overpayments of 2014 income taxes.
In December 2009, PT-FI was notified by the Large Taxpayer's Office of the Government of Indonesia of its view that PT-FI is obligated to pay value added taxes on certain goods imported after the year 2000. In December 2014, PT-FI paid $269 million for valued added taxes for the period from November 2005 through 2009. The taxes are refundable and are included in income and other tax receivables in the consolidated balance sheet at December 31, 2014 .
177
Table of Contents
Letters of Credit, Bank Guarantees and Surety Bonds. Letters of credit and bank guarantees totaled $306 million at December 31, 2014 , primarily for the Cerro Verde royalty dispute (refer to discussion above), environmental and asset retirement obligations, workers' compensation insurance programs, tax and customs obligations, and other commercial obligations. In addition, FCX had surety bonds totaling $275 million at December 31, 2014 , associated with environmental and asset retirement obligations ( $217 million ), self-insurance bonds primarily for workers' compensation ( $20 million ) and other bonds ( $38 million ).
Insurance. FCX purchases a variety of insurance products to mitigate potential losses, which typically have specified deductible amounts or self-insured retentions and policy limits. FCX generally is self-insured for U.S. workers' compensation, but purchases excess insurance up to statutory limits. An actuarial analysis is performed twice a year on the various casualty insurance programs covering FCX's U.S. based mining operations, including workers' compensation, to estimate expected losses. At December 31, 2014 , expected losses under these insurance programs totaled $64 million , which consisted of a current portion of $8 million (included in accounts payable and accrued liabilities) and a long-term portion of $56 million (included in other liabilities).
FCX's oil and gas operations are subject to all of the risks normally incident to the exploration for and the production of oil and gas, including well blowouts, cratering, explosions, oil spills, releases of gas or well fluids, fires, pollution and releases of toxic gas, each of which could result in damage to or destruction of oil and gas wells, production facilities or other property or injury to persons. Although FCX maintains insurance coverage considered to be customary in the oil and gas industry, FCX is not fully insured against all risks either because insurance is not available or because of high premium costs. FCX is self-insured for named windstorms in the GOM. FCX's insurance policies provide limited coverage for losses or liabilities relating to pollution, with broader coverage for sudden and accidental occurrences.
FCX and its insurers entered into an agreement in December 2012 to settle an insurance claim for business interruption and property damage relating to the 2011 incidents affecting PT-FI's concentrate pipelines. The insurers paid an aggregate of $63 million , including PT-FI's joint venture partner's share. As a result of the settlement, FCX recorded a gain of $59 million in 2012.
NOTE 13. COMMITMENTS AND GUARANTEES
Operating Leases. FCX leases various types of properties, including offices, aircraft and equipment. Future minimum rentals under non-cancelable leases at December 31, 2014 , total $44 million in 2015, $44 million in 2016, $42 million in 2017, $36 million in 2018, $23 million in 2019 and $165 million thereafter. Minimum payments under operating leases have not been reduced by aggregate minimum sublease rentals, which are minimal. Total aggregate rental expense under operating leases was $96 million in 2014 , $96 million in 2013 and $77 million in 2012 .
Contractual Obligations. Based on applicable prices at December 31, 2014 , FCX has unconditional purchase obligations of $4.3 billion , primarily comprising minimum commitments for deepwater drillships to be utilized in the GOM drilling campaign ( $1.8 billion ), transportation services ( $732 million ), the procurement of copper concentrates ( $572 million ), electricity ( $316 million ) and deferred premium costs and future interest on crude oil derivative contracts ( $231 million ), which is expected to be paid once the options settle (refer to Note 14 for further discussion of the amounts recorded at December 31, 2014 ). Some of FCX's unconditional purchase obligations are settled based on the prevailing market rate for the service or commodity purchased. In some cases, the amount of the actual obligation may change over time because of market conditions. Drillship obligations provide for an operating rate over the contractual term upon delivery of the drillship. Transportation obligations are primarily for South America contracted ocean freight and FM O&G contracted gathering. Obligations for copper concentrates provide for deliveries of specified volumes to Atlantic Copper at market-based prices. Electricity obligations are primarily for contractual minimum demand at the South America mines.
FCX's future commitments associated with unconditional purchase obligations total $2.1 billion in 2015 , $1.0 billion in 2016 , $707 million in 2017 , $111 million in 2018 , $119 million in 2019 and $204 million thereafter, of which $210 million was accrued at December 31, 2014 , related to deferred premiums and interest on crude oil derivative contracts. During the three-year period ended December 31, 2014 , FCX fulfilled its minimum contractual purchase obligations.
178
Table of Contents
Mining Contracts - Indonesia. FCX is entitled to mine in Indonesia under the COW between PT-FI and the Government of Indonesia. The original COW was entered into in 1967 and was replaced with the current COW in 1991. The initial term of the current COW expires in 2021 but can be extended by PT-FI for two 10 -year periods subject to Indonesian government approval, which pursuant to the COW cannot be withheld or delayed unreasonably. PT-FI is currently engaged in discussions with the Indonesian government related to the amendment and extension of its contractual and operating rights for the two ten-year extension periods.
The copper royalty rate payable by PT-FI under its COW, prior to modifications discussed below as a result of a recent Memorandum of Understanding (MOU) entered into with the Indonesian government, varied from 1.5 percent of copper net revenue at a copper price of $0.90 or less per pound to 3.5 percent at a copper price of $1.10 or more per pound. The COW royalty rate for gold and silver sales was at a fixed rate of 1.0 percent .
A large part of the mineral royalties under Indonesian government regulations is designated to the provinces from which the minerals are extracted. In connection with its fourth concentrator mill expansion completed in 1998, PT-FI agreed to pay the Government of Indonesia additional royalties (royalties not required by the COW) to provide further support to the local governments and the people of the Indonesian province of Papua. The additional royalties, prior to modifications discussed below as a result of a recent MOU, were paid on production exceeding specified annual amounts of copper, gold and silver generated when PT-FI's milling facilities operated above 200,000 metric tons of ore per day. The additional royalty for copper equaled the COW royalty rate, and for gold and silver equaled twice the COW royalty rates. Therefore, PT-FI's royalty rate on copper net revenues from production above the agreed levels was double the COW royalty rate, and the royalty rates on gold and silver sales from production above the agreed levels were triple the COW royalty rates.
In 2009, Indonesia enacted a mining law (2009 Mining Law), which operates under a licensing system that is less protective of licensees than the contract of work system that governs PT-FI. The 2009 Mining Law and the regulations issued pursuant to that law provide that contracts of work would continue to be honored until their expiration. However, the regulations, including those issued in January 2014 as discussed below, attempt to apply certain provisions of the 2009 Mining Law and regulations to existing contracts of work and seek to apply the licensing system to any extension periods of contracts of work.
In January 2012, the President of Indonesia issued a decree calling for the creation of a team of Ministers to evaluate contracts of work for adjustment to the 2009 Mining Law and to take steps to assess and determine the Indonesian government's position on reduction to the size of contract concessions, increasing government revenues and domestic processing of minerals.
In January 2014, the Indonesian government published regulations providing that holders of contracts of work with existing processing facilities in Indonesia may continue to export product through January 12, 2017 , but established new requirements for the continued export of copper concentrates, including the imposition of a progressive export duty on copper concentrates in the amount of 25 percent in 2014, rising to 60 percent by mid-2016. PT-FI's COW authorizes it to export concentrates and specifies the taxes and other fiscal terms available to its operations. The COW states that PT-FI shall not be subject to taxes, duties or fees subsequently imposed or approved by the Indonesian government except as expressly provided in the COW. Additionally, PT-FI complied with the requirements of its COW for local processing by arranging for the construction and commissioning of Indonesia's only copper smelter and refinery, which is owned by PT Smelting (refer to Note 6 ).
On July 25, 2014 , PT-FI entered into a MOU with the Indonesian government under which PT-FI and the government agreed to negotiate an amended COW to address provisions related to the size of PT-FI's concession area, royalties and taxes, domestic processing and refining, divestment, local content, and continuation of operations post- 2021 . Execution of the MOU enabled the resumption of concentrate exports in August 2014, which had been suspended since January 2014. The MOU has been extended to July 25, 2015 . PT-FI is engaged in active discussions with the Indonesian government regarding an amended COW.
Provisions being addressed include the development of new copper smelting and refining capacity in Indonesia, provisions for divestment to the Indonesian government and/or Indonesian nationals of up to a 30 percent interest (an additional 20.64 percent interest) in PT-FI at fair value, and timely granting rights for the continuation of operations from 2022 through 2041 . Negotiations are taking into consideration PT-FI's need for assurance of legal and fiscal terms post- 2021 for PT-FI to continue with its large-scale investment program for the development of its underground reserves.
179
Table of Contents
Effective with the signing of the MOU, PT-FI provided a $115 million assurance bond to support its commitment for smelter development, agreed to increase royalties to 4.0 percent for copper and 3.75 percent for gold from the previous rates of 3.5 percent for copper and 1.0 percent for gold, and to pay export duties as set forth in a new regulation. PT-FI's royalties totaled $115 million in 2014 , $109 million in 2013 and $93 million in 2012 . The Indonesian government revised its January 2014 regulations regarding export duties, which are now set at 7.5 percent , declining to 5.0 percent when smelter development progress exceeds 7.5 percent and are eliminated when development progress exceeds 30 percent . PT-FI's export duties totaled $77 million in 2014 .
Under the MOU, no terms of the COW other than those relating to the export duties, smelter bond and royalties described previously will be changed until the completion of an amended COW.
PT-FI is advancing plans for the construction of new smelter capacity in parallel with completing negotiations of its long-term operating rights and will also discuss the possibility of expanding industrial activities in Papua in connection with its long-term development plans. PT-FI has identified a site adjacent to the existing PT Smelting site in Gresik, Indonesia, for the construction of additional smelter capacity.
PT-FI is required to apply for renewal of export permits at six -month intervals. In January 2015, PT-FI obtained a renewal of its export license through July 25, 2015 .
Mining Contracts - Africa . FCX is entitled to mine in the DRC under an Amended and Restated Mining Convention (ARMC) between TFM and the Government of the DRC. The original Mining Convention was entered into in 1996, was replaced with the ARMC in 2005 and was further amended in 2010 (approved in 2011). The current ARMC will remain in effect for as long as the Tenke concession is exploitable. The royalty rate payable by TFM under the ARMC is two percent of net revenue. These mining royalties totaled $29 million in 2014 , $29 million in 2013 and $25 million in 2012 .
Effective March 26, 2012, the DRC government issued a Presidential Decree approving the modifications to TFM's bylaws following a review (completed in 2010) of TFM's existing mining contracts. Among other changes to the amended ARMC, FCX's effective ownership interest in TFM was reduced from 57.75 percent to 56 percent and $50 million of TFM's stockholder loan payable to a subsidiary of FMC was converted to equity.
Community Development Programs. FCX has adopted policies that govern its working relationships with the communities where it operates. These policies are designed to guide its practices and programs in a manner that respects basic human rights and the culture of the local people impacted by FCX's operations. FCX continues to make significant expenditures on community development, education, training and cultural programs.
In 1996, PT-FI established the Freeport Partnership Fund for Community Development (Partnership Fund) through which PT-FI has made available funding and technical assistance to support community development initiatives in the area of health, education and economic development of the area. PT-FI has committed through 2016 to provide one percent of its annual revenue for the development of the local people in its area of operations through the Partnership Fund. PT-FI charged $31 million in 2014 , $41 million in 2013 and $39 million in 2012 to cost of sales for this commitment.
TFM has committed to assist the communities living within its concession area in the Katanga province of the DRC. TFM will contribute 0.3 percent of net sales revenue from production to a community development fund to assist the local communities with development of local infrastructure and related services, such as those pertaining to health, education and economic development. TFM charged $4 million in each of the years 2014 , 2013 and 2012 to cost of sales for this commitment.
Guarantees. FCX provides certain financial guarantees (including indirect guarantees of the indebtedness of others) and indemnities.
FCX's venture agreement with Sumitomo at its Morenci mine in Arizona (refer to Note 3 for further discussion) includes a put and call option guarantee clause. FCX holds an 85 percent undivided interest in the Morenci complex. Under certain conditions defined in the venture agreement, Sumitomo has the right to sell its 15 percent share to FCX. Likewise, under certain conditions, FCX has the right to purchase Sumitomo's share of the venture. At December 31, 2014 , the maximum potential payment FCX is obligated to make to Sumitomo upon exercise of the put option (or FCX's exercise of its call option) totaled approximately $354 million based on calculations defined in the venture agreement. At December 31, 2014 , FCX had not recorded any liability in its consolidated financial
180
Table of Contents
statements in connection with this guarantee as FCX does not believe, based on information available, that it is probable that any amounts will be paid under this guarantee as the fair value of Sumitomo's 15 percent share is in excess of the exercise price.
Prior to its acquisition by FCX, FMC and its subsidiaries have, as part of merger, acquisition, divestiture and other transactions, from time to time, indemnified certain sellers, buyers or other parties related to the transaction from and against certain liabilities associated with conditions in existence (or claims associated with actions taken) prior to the closing date of the transaction. As part of these transactions, FMC indemnified the counterparty from and against certain excluded or retained liabilities existing at the time of sale that would otherwise have been transferred to the party at closing. These indemnity provisions generally now require FCX to indemnify the party against certain liabilities that may arise in the future from the pre-closing activities of FMC for assets sold or purchased. The indemnity classifications include environmental, tax and certain operating liabilities, claims or litigation existing at closing and various excluded liabilities or obligations. Most of these indemnity obligations arise from transactions that closed many years ago, and given the nature of these indemnity obligations, it is not possible to estimate the maximum potential exposure. Except as described in the following sentence, FCX does not consider any of such obligations as having a probable likelihood of payment that is reasonably estimable, and accordingly, has not recorded any obligations associated with these indemnities. With respect to FCX's environmental indemnity obligations, any expected costs from these guarantees are accrued when potential environmental obligations are considered by management to be probable and the costs can be reasonably estimated.
NOTE 14. FINANCIAL INSTRUMENTS
FCX does not purchase, hold or sell derivative financial instruments unless there is an existing asset or obligation, or it anticipates a future activity that is likely to occur and will result in exposure to market risks, which FCX intends to offset or mitigate. FCX does not enter into any derivative financial instruments for speculative purposes, but has entered into derivative financial instruments in limited instances to achieve specific objectives. These objectives principally relate to managing risks associated with commodity price changes, foreign currency exchange rates and interest rates.
Commodity Contracts. From time to time, FCX has entered into derivatives contracts to hedge the market risk associated with fluctuations in the prices of commodities it purchases and sells. As a result of the acquisition of PXP, FCX assumed a variety of crude oil and natural gas commodity derivatives to hedge the exposure to the volatility of crude oil and natural gas commodity prices. Derivative financial instruments used by FCX to manage its risks do not contain credit risk-related contingent provisions. As of December 31, 2014 and 2013 , FCX had no price protection contracts relating to its mine production. A discussion of FCX's derivative contracts and programs follows.
Derivatives Designated as Hedging Instruments – Fair Value Hedges
Copper Futures and Swap Contracts. Some of FCX's U.S. copper rod customers request a fixed market price instead of the COMEX average copper price in the month of shipment. FCX hedges this price exposure in a manner that allows it to receive the COMEX average price in the month of shipment while the customers pay the fixed price they requested. FCX accomplishes this by entering into copper futures or swap contracts. Hedging gains or losses from these copper futures and swap contracts are recorded in revenues. FCX did not have any significant gains or losses during the three years ended December 31, 2014 , resulting from hedge ineffectiveness. At December 31, 2014 , FCX held copper futures and swap contracts that qualified for hedge accounting for 50 million pounds at an average contract price of $2.97 per pound, with maturities through May 2016 .
A summary of gains (losses) recognized in revenues for derivative financial instruments related to commodity contracts that are designated and qualify as fair value hedge transactions, along with the unrealized gains (losses) on the related hedged item for the years ended December 31 follows:
| 2014 |
| 2013 |
| 2012 | ||||||
Copper futures and swap contracts: |
|
|
|
|
| ||||||
Unrealized (losses) gains: |
|
|
|
|
| ||||||
Derivative financial instruments | $ | (12 | ) |
| $ | 1 | |
| $ | 15 | |
Hedged item – firm sales commitments | 12 | |
| (1 | ) |
| (15 | ) | |||
|
|
|
|
|
| ||||||
Realized losses: |
|
|
|
|
| ||||||
Matured derivative financial instruments | (9 | ) |
| (17 | ) |
| (2 | ) | |||
181
Table of Contents
Derivatives Not Designated as Hedging Instruments
Embedded Derivatives. As described in Note 1 under "Revenue Recognition," certain FCX copper concentrate, copper cathode and gold sales contracts provide for provisional pricing primarily based on the LME copper price or the COMEX copper price and the London gold price at the time of shipment as specified in the contract. Similarly, FCX purchases copper under contracts that provide for provisional pricing. FCX applies the normal purchases and normal sales scope exception in accordance with derivatives and hedge accounting guidance to the host sales agreements since the contracts do not allow for net settlement and always result in physical delivery. Sales and purchases with a provisional sales price contain an embedded derivative ( i.e. , the price settlement mechanism is settled after the time of delivery) that is required to be bifurcated from the host contract. The host contract is the sale or purchase of the metals contained in the concentrates or cathodes at the then-current LME or COMEX copper price or the London gold price as defined in the contract. Mark-to-market price fluctuations from these embedded derivatives are recorded through the settlement date and are reflected in revenues for sales contracts and in cost of sales as production and delivery costs for purchase contracts.
A summary of FCX's embedded derivatives at December 31, 2014 , follows:
| Open |
| Average Price Per Unit |
| Maturities | |||||||
| Positions |
| Contract |
| Market |
| Through | |||||
Embedded derivatives in provisional sales contracts: |
|
|
|
|
|
|
| |||||
Copper (millions of pounds) | 574 | |
| $ | 3.02 | |
| $ | 2.86 | |
| May 2015 |
Gold (thousands of ounces) | 178 | |
| 1,207 | |
| 1,200 | |
| April 2015 | ||
Embedded derivatives in provisional purchase contracts: |
|
|
|
|
|
|
| |||||
Copper (millions of pounds) | 101 | |
| 3.01 | |
| 2.87 | |
| April 2015 | ||
Crude Oil and Natural Gas Contracts. As a result of the acquisition of PXP, FCX has derivative contracts for 2015 that consist of crude oil options. These crude oil derivatives are not designated as hedging instruments and are recorded at fair value with the mark-to-market gains and losses recorded in revenues.
The crude oil options were entered into by PXP to protect the realized price of a portion of expected future sales in order to limit the effects of crude oil price decreases. At December 31, 2014 , these contracts are composed of crude oil put spreads consisting of put options with a floor limit. The premiums associated with put options are deferred until the settlement period. At December 31, 2014 , the deferred option premiums and accrued interest associated with the crude oil option contracts totaled $210 million , which was included as a component of the fair value of the crude oil option contracts. At December 31, 2014 , the outstanding crude oil option contracts, which settle monthly and cover approximately 31 million barrels in 2015, follow:
|
|
|
|
|
| Average Price (per barrel) a |
|
|
|
| |||||||||
Period |
| Instrument Type |
| Daily Volumes (thousand barrels) |
| Floor |
| Floor Limit |
| Weighted-Average Deferred Premium (per barrel) |
| Index | |||||||
|
|
|
|
|
|
|
|
|
|
|
|
| |||||||
2015 |
|
|
|
|
|
|
|
|
|
|
|
| |||||||
January - December |
| Put options b |
| 84 | |
| $ | 90 | |
| $ | 70 | |
| $ | 6.89 | |
| Brent |
|
|
|
|
|
|
|
|
|
|
|
|
| |||||||
a. | The average strike prices do not reflect any premiums to purchase the put options. |
b. | If the index price is less than the per barrel floor, FCX receives the difference between the per barrel floor and the index price up to a maximum of $20 per barrel less the option premium. If the index price is at or above the per barrel floor, FCX pays the option premium and no cash settlement is received. |
Copper Forward Contracts. Atlantic Copper, FCX's wholly owned smelting and refining unit in Spain, enters into forward copper contracts designed to hedge its copper price risk whenever its physical purchases and sales pricing periods do not match. These economic hedge transactions are intended to hedge against changes in copper prices, with the mark-to-market hedging gains or losses recorded in cost of sales. At December 31, 2014 , Atlantic Copper held net forward copper purchase contracts for 13 million pounds at an average contract price of $2.90 per pound, with maturities through February 2015 .
182
Table of Contents
Summary of (Losses) Gains . A summary of the realized and unrealized (losses) gains recognized in income before income taxes and equity in affiliated companies' net earnings for commodity contracts that do not qualify as hedge transactions, including embedded derivatives, for the years ended December 31 follows:
| 2014 |
| 2013 |
| 2012 | |||||||
Embedded derivatives in provisional copper and gold |
|
|
|
|
| |||||||
sales contracts a | $ | (289 | ) |
| $ | (136 | ) |
| $ | 77 | | |
Crude oil options and swaps a | 513 | |
| (344 | ) |
| - | | ||||
Natural gas swaps a | (8 | ) |
| 10 | | - | | - | | |||
Copper forward contracts b | (4 | ) |
| 3 | |
| 15 | | ||||
a. | Amounts recorded in revenues. |
b. | Amounts recorded in cost of sales as production and delivery costs. |
Unsettled Derivative Financial Instruments
A summary of the fair values of unsettled commodity derivative financial instruments follows:
| December 31, | ||||||
| 2014 |
| 2013 | ||||
Commodity Derivative Assets: |
|
|
| ||||
Derivatives designated as hedging instruments: |
|
|
| ||||
Copper futures and swap contracts a | $ | - | |
| $ | 6 | |
Derivatives not designated as hedging instruments: |
|
|
| ||||
Embedded derivatives in provisional copper and gold |
| |
|
| | ||
sales/purchase contracts | 15 | |
| 63 | | ||
Crude oil options b | 316 | |
| - | | ||
Total derivative assets | $ | 331 | |
| $ | 69 | |
Commodity Derivative Liabilities: |
|
|
| ||||
Derivatives designated as hedging instruments: |
|
|
| ||||
Copper futures and swap contracts a | $ | 7 | |
| $ | - | |
Derivatives not designated as hedging instruments: |
|
|
| ||||
Embedded derivatives in provisional copper and gold |
|
|
| ||||
sales/purchase contracts | 93 | |
| 16 | | ||
Crude oil options b | - | |
| 309 | | ||
Natural gas swaps | - | |
| 4 | | ||
Copper forward contracts | - | |
| 1 | | ||
Total derivative liabilities | $ | 100 | |
| $ | 330 | |
a. | FCX had paid $10 million to brokers at December 31, 2014 , and $1 million at December 31, 2013 , for margin requirements (recorded in other current assets). |
b. | Includes $210 million at December 31, 2014 , and $444 million at December 31, 2013 , for deferred premiums and accrued interest. |
183
Table of Contents
FCX's commodity contracts have netting arrangements with counterparties with which the right of offset exists, and it is FCX's policy to offset balances by counterparty on the balance sheet. FCX's embedded derivatives on provisional sales/purchases are netted with the corresponding outstanding receivable/payable balances. A summary of these unsettled commodity contracts that are offset in the balance sheet follows:
|
| Assets at December 31, |
| Liabilities at December 31, | ||||||||||||
|
| 2014 |
| 2013 |
| 2014 |
| 2013 | ||||||||
|
|
|
|
|
|
|
|
| ||||||||
Gross amounts recognized: |
|
|
|
|
|
|
|
| ||||||||
Commodity contracts: |
|
|
|
|
|
|
|
| ||||||||
Embedded derivatives on provisional |
|
|
|
|
|
|
|
| ||||||||
sales/purchase contracts |
| $ | 15 | |
| $ | 63 | |
| $ | 93 | |
| $ | 16 | |
Crude oil and natural gas derivatives a |
| 316 | |
| - | |
| - | |
| 313 | | ||||
Copper derivatives |
| - | |
| 6 | |
| 7 | |
| 1 | | ||||
|
| 331 | |
| 69 | |
| 100 | |
| 330 | | ||||
|
|
|
|
|
|
|
|
| ||||||||
Less gross amounts of offset: |
|
|
|
|
|
|
|
| ||||||||
Commodity contracts: |
|
|
|
|
|
|
|
| ||||||||
Embedded derivatives on provisional |
|
|
|
|
|
|
|
| ||||||||
sales/purchase contracts |
| 1 | |
| 10 | |
| 1 | |
| 10 | | ||||
Crude oil and natural gas derivatives |
| - | |
| - | |
| - | |
| - | | ||||
Copper derivatives |
| - | |
| - | |
| - | |
| - | | ||||
|
| 1 | |
| 10 | |
| 1 | |
| 10 | | ||||
|
|
|
|
|
|
|
|
| ||||||||
Net amounts presented in balance sheet: |
|
|
|
|
|
|
|
| ||||||||
Commodity contracts: |
|
|
|
|
|
|
|
| ||||||||
Embedded derivatives on provisional |
|
|
|
|
|
|
|
| ||||||||
sales/purchase contracts |
| 14 | |
| 53 | |
| 92 | |
| 6 | | ||||
Crude oil and natural gas derivatives a |
| 316 | |
| - | |
| - | |
| 313 | | ||||
Copper derivatives |
| - | |
| 6 | |
| 7 | |
| 1 | | ||||
|
| $ | 330 | |
| $ | 59 | |
| $ | 99 | |
| $ | 320 | |
|
|
|
|
|
|
|
|
| ||||||||
Balance sheet classification: |
|
|
|
|
|
|
|
| ||||||||
Trade accounts receivable |
| $ | 5 | |
| $ | 53 | |
| $ | 56 | |
| $ | - | |
Other current assets |
| 316 | |
| 6 | |
| - | |
| - | | ||||
Accounts payable and accrued liabilities |
| 9 | |
| - | |
| 43 | |
| 205 | | ||||
Other liabilities |
| - | |
| - | |
| - | |
| 115 | | ||||
|
| $ | 330 | |
| $ | 59 | |
| $ | 99 | |
| $ | 320 | |
a. | Includes only crude oil derivatives at December 31, 2014. |
Credit Risk. FCX is exposed to credit loss when financial institutions with which FCX has entered into derivative transactions (commodity, foreign exchange and interest rate swaps) are unable to pay. To minimize the risk of such losses, FCX uses counterparties that meet certain credit requirements and periodically reviews the creditworthiness of these counterparties. FCX does not anticipate that any of the counterparties it deals with will default on their obligations. As of December 31, 2014 , the maximum amount of credit exposure associated with derivative transactions was $379 million .
Other Financial Instruments. Other financial instruments include cash and cash equivalents, accounts receivable, investment securities, legally restricted funds, accounts payable and accrued liabilities, dividends payable and long-term debt. The carrying value for cash and cash equivalents (which included time deposits of $48 million at December 31, 2014 , and $211 million at December 31, 2013), accounts receivable, accounts payable and accrued liabilities, and dividends payable approximates fair value because of their short-term nature and generally negligible credit losses (refer to Note 15 for the fair values of investment securities, legally restricted funds and long-term debt).
184
Table of Contents
NOTE 15. FAIR VALUE MEASUREMENT
Fair value accounting guidance includes a hierarchy that prioritizes the inputs to valuation techniques used to measure fair value. The hierarchy gives the highest priority to unadjusted quoted prices in active markets for identical assets or liabilities (Level 1 inputs) and the lowest priority to unobservable inputs (Level 3 inputs).
FCX recognizes transfers between levels at the end of the reporting period. FCX did not have any significant transfers in or out of Level 1, 2 or 3 for 2014 . A summary of the carrying amount and fair value of FCX's financial instruments, other than cash and cash equivalents, accounts receivable, accounts payable and accrued liabilities, and dividends payable follows:
| At December 31, 2014 | ||||||||||||||||||
| Carrying |
| Fair Value | ||||||||||||||||
| Amount |
| Total |
| Level 1 |
| Level 2 |
| Level 3 | ||||||||||
Assets |
|
|
|
|
|
|
|
|
| ||||||||||
Investment securities: a,b,c |
|
|
|
|
|
|
|
|
| ||||||||||
U.S. core fixed income fund | $ | 23 | |
| $ | 23 | |
| $ | - | |
| $ | 23 | |
| $ | - | |
Money market funds | 20 | |
| 20 | |
| 20 | |
| - | |
| - | | |||||
Equity securities | 3 | |
| 3 | |
| 3 | |
| - | |
| - | | |||||
Total | 46 | |
| 46 | |
| 23 | |
| 23 | |
| - | | |||||
|
|
|
|
|
|
|
|
|
| ||||||||||
Legally restricted funds: a,b,d |
|
|
|
|
|
|
|
|
| ||||||||||
U.S. core fixed income fund | 52 | |
| 52 | |
| - | |
| 52 | |
| - | | |||||
Government bonds and notes | 39 | |
| 39 | |
| - | |
| 39 | |
| - | | |||||
Corporate bonds | 27 | |
| 27 | |
| - | |
| 27 | |
| - | | |||||
Government mortgage-backed securities | 25 | |
| 25 | |
| - | |
| 25 | |
| - | | |||||
Asset-backed securities | 17 | |
| 17 | |
| - | |
| 17 | |
| - | | |||||
Money market funds | 11 | |
| 11 | |
| 11 | |
| - | |
| - | | |||||
Municipal bonds | 1 | |
| 1 | |
| - | |
| 1 | |
| - | | |||||
Total | 172 | |
| 172 | |
| 11 | |
| 161 | |
| - | | |||||
Derivatives: a,e |
|
|
|
|
|
|
|
|
| ||||||||||
Embedded derivatives in provisional sales/purchase |
|
|
|
|
|
|
|
|
| ||||||||||
contracts in a gross asset position | 15 | |
| 15 | |
| - | |
| 15 | |
| - | | |||||
Crude oil options | 316 | |
| 316 | |
| - | |
| - | |
| 316 | | |||||
Total | 331 | |
| 331 | |
| - | |
| 15 | |
| 316 | | |||||
|
|
|
|
|
|
|
|
|
| ||||||||||
Total assets |
|
| $ | 549 | |
| $ | 34 | |
| $ | 199 | |
| $ | 316 | | ||
|
|
|
|
|
|
|
|
|
| ||||||||||
Liabilities |
|
|
|
|
|
|
|
|
| ||||||||||
Derivatives: a,e |
|
|
|
|
|
|
|
|
| ||||||||||
Embedded derivatives in provisional sales/purchase |
|
|
|
|
|
|
|
|
| ||||||||||
contracts in a gross liability position | $ | 93 | |
| $ | 93 | |
| $ | - | |
| $ | 93 | |
| $ | - | |
Copper futures and swap contracts | 7 | |
| 7 | |
| 6 | |
| 1 | |
| - | | |||||
Total | 100 | |
| 100 | |
| 6 | |
| 94 | |
| - | | |||||
|
|
|
|
|
|
|
|
|
| ||||||||||
Long-term debt, including current portion f | 18,970 | |
| 18,735 | |
| - | |
| 18,735 | |
| - | | |||||
|
|
|
|
|
|
|
|
|
| ||||||||||
Total liabilities |
|
| $ | 18,835 | |
| $ | 6 | |
| $ | 18,829 | |
| $ | - | | ||
185
Table of Contents
| At December 31, 2013 | ||||||||||||||||||
| Carrying |
| Fair Value | ||||||||||||||||
| Amount |
| Total |
| Level 1 |
| Level 2 |
| Level 3 | ||||||||||
Assets |
|
|
|
|
|
|
|
|
| ||||||||||
Investment securities: a,b |
|
|
|
|
|
|
|
|
| ||||||||||
U.S. core fixed income fund | $ | 21 | |
| $ | 21 | |
| $ | - | |
| $ | 21 | |
| $ | - | |
Money market funds | 18 | |
| 18 | |
| 18 | |
| - | |
| - | | |||||
Equity securities | 5 | |
| 5 | |
| 5 | |
| - | |
| - | | |||||
Total | 44 | |
| 44 | |
| 23 | |
| 21 | |
| - | | |||||
|
|
|
|
|
|
|
|
|
| ||||||||||
Legally restricted funds: a,b,d |
|
|
|
|
|
|
|
|
| ||||||||||
U.S. core fixed income fund | 48 | |
| 48 | |
| - | |
| 48 | |
| - | | |||||
Government mortgage-backed securities | 34 | |
| 34 | |
| - | |
| 34 | |
| - | | |||||
Corporate bonds | 28 | |
| 28 | |
| - | |
| 28 | |
| - | | |||||
Government bonds and notes | 28 | |
| 28 | |
| - | |
| 28 | |
| - | | |||||
Money market funds | 28 | |
| 28 | |
| 28 | |
| - | |
| - | | |||||
Asset-backed securities | 15 | |
| 15 | |
| - | |
| 15 | |
| - | | |||||
Municipal bonds | 1 | |
| 1 | |
| - | |
| 1 | |
| - | | |||||
Total | 182 | |
| 182 | |
| 28 | |
| 154 | |
| - | | |||||
|
|
|
|
|
|
|
|
|
| ||||||||||
Derivatives: a,e |
|
|
| |
|
| |
|
| |
|
| | ||||||
Embedded derivatives in provisional sales/purchase |
|
|
| |
|
| |
|
| |
|
| | ||||||
contracts in a gross asset position | 63 | |
| 63 | |
| - | |
| 63 | |
| - | | |||||
Copper futures and swap contracts | 6 | |
| 6 | |
| 5 | |
| 1 | |
| - | | |||||
Total | 69 | |
| 69 | |
| 5 | |
| 64 | |
| - | | |||||
|
|
|
|
|
|
|
|
|
| ||||||||||
Total assets |
|
| $ | 295 | |
| $ | 56 | |
| $ | 239 | |
| $ | - | | ||
|
|
|
|
|
|
|
|
|
| ||||||||||
Liabilities |
|
|
| |
|
| |
|
| |
|
| | ||||||
Derivatives: a |
|
|
| |
|
| |
|
| |
|
| | ||||||
Embedded derivatives in provisional sales/purchase |
|
|
| |
|
| |
|
| |
|
| | ||||||
contracts in a gross liability position e | $ | 16 | |
| $ | 16 | |
| $ | - | |
| $ | 16 | |
| $ | - | |
Crude oil options e | 309 | |
| 309 | |
| - | |
| - | |
| 309 | | |||||
Natural gas swaps e | 4 | |
| 4 | |
| - | |
| 4 | |
| - | | |||||
Copper forward contracts e | 1 | |
| 1 | |
| 1 | |
| - | |
| - | | |||||
Plains Offshore warrants g | 2 | |
| 2 | |
| - | |
| - | |
| 2 | | |||||
Total | 332 | |
| 332 | |
| 1 | |
| 20 | |
| 311 | | |||||
|
|
|
|
|
|
|
|
|
| ||||||||||
Long-term debt, including current portion f | 20,706 | |
| 20,487 | |
| - | |
| 20,487 | |
| - | | |||||
|
|
|
|
|
|
|
|
|
| ||||||||||
Total liabilities |
|
| $ | 20,819 | |
| $ | 1 | |
| $ | 20,507 | |
| $ | 311 | | ||
a. | Recorded at fair value. |
b. | Current portion included in other current assets and long-term portion included in other assets. |
c. | Excludes $115 million of time deposits (which approximated fair value) at December 31, 2014 (included in other assets), associated with an assurance bond to support PT-FI's commitment for smelter development in Indonesia (refer to Note 13 for further discussion). |
d. | Excludes time deposits (which approximated fair value) of $17 million (included in other current assets) associated with a customs audit assessment and a reclamation guarantee at PT-FI at December 31, 2014 , and $15 million included in other current assets and $210 million in other assets at December 31, 2013 , associated with the Cerro Verde royalty dispute (refer to Note 12 for further discussion). |
e. | Refer to Note 14 for further discussion and balance sheet classifications. Crude oil options were net of $210 million at December 31, 2014 , and $444 million at December 31, 2013 , for deferred premiums and accrued interest. |
f. | Recorded at cost except for debt assumed in acquisitions, which are recorded at fair value at the respective acquisition dates. |
g. | Included in other liabilities. |
186
Table of Contents
Valuation Techniques
Money market funds are classified within Level 1 of the fair value hierarchy because they are valued using quoted market prices in active markets.
Fixed income securities (U.S. core fixed income funds, government securities, corporate bonds, asset-backed securities and municipal bonds) are valued using a bid evaluation price or a mid-evaluation price. A bid evaluation price is an estimated price at which a dealer would pay for a security. A mid-evaluation price is the average of the estimated price at which a dealer would sell a security and the estimated price at which a dealer would pay for a security. These evaluations are based on quoted prices, if available, or models that use observable inputs and, as such, are classified within Level 2 of the fair value hierarchy.
Equity securities are valued at the closing price reported on the active market on which the individual securities are traded and, as such, are classified within Level 1 of the fair value hierarchy.
FCX's embedded derivatives on provisional copper concentrate, copper cathode and gold purchases and sales have critical observable inputs of quoted monthly LME or COMEX copper forward prices and the London gold forward price at each reporting date based on the month of maturity; however, FCX's contracts themselves are not traded on an exchange. As a result, these derivatives are classified within Level 2 of the fair value hierarchy.
FCX ' s derivative financial instruments for crude oil options are valued using an option pricing model, which uses various observable inputs including IntercontinentalExchange, Inc. (ICE) crude oil prices, volatilities, interest rates and contract terms. FCX ' s derivative financial instruments for natural gas swaps were valued using a pricing model that had various observable inputs, including NYMEX price quotations, interest rates and contract terms (classified within Level 2 of the fair value hierarchy). Valuations are adjusted for credit quality, using the counterparties ' credit quality for asset balances and FCX ' s credit quality for liability balances (which considers the impact of netting agreements on counterparty credit risk, including whether the position with the counterparty is a net asset or net liability). For asset balances, FCX uses the credit default swap value for counterparties when available or the spread between the risk-free interest rate and the yield rate on the counterparties ' publicly traded debt for similar instruments . The crude oil options are classified within Level 3 of the fair value hierarchy because the inputs used in the valuation models are not observable for substantially the full term of the instruments. The significant unobservable inputs used in the fair value measurement of the crude oil options are implied volatilities and deferred premiums. Significant increases (decreases) in implied volatilities in isolation would result in a significantly higher (lower) fair value measurement. The implied volatilities range from 34 percent to 53 percent , with a weighted average of 39 percent . The weighted-average cost of deferred premiums totals $6.89 per barrel at December 31, 2014 . Refer to Note 14 for further discussion of these derivative financial instruments .
FCX's derivative financial instruments for copper futures and swap contracts and copper forward contracts that are traded on the respective exchanges are classified within Level 1 of the fair value hierarchy because they are valued using quoted monthly COMEX or LME prices at each reporting date based on the month of maturity (refer to Note 14 for further discussion). Certain of these contracts are traded on the over-the-counter market and are classified within Level 2 of the fair value hierarchy based on COMEX and LME forward prices.
Long-term debt, including current portion, is not actively traded and is valued using prices obtained from a readily available pricing source and, as such, is classified within Level 2 of the fair value hierarchy.
The techniques described above may produce a fair value calculation that may not be indicative of net realizable value or reflective of future fair values. Furthermore, while FCX believes its valuation techniques are appropriate and consistent with other market participants, the use of different techniques or assumptions to determine fair value of certain financial instruments could result in a different fair value measurement at the reporting date. There have been no changes in the techniques used at December 31, 2014 .
187
Table of Contents
Fair value at January 1, 2013 | $ | - | |
|
Crude oil options assumed in the PXP acquisition | (83 | ) |
| |
Net realized losses | (38 | ) | a | |
Net unrealized losses included in earnings related to liabilities still held at the end of the period | (230 | ) | b | |
Settlement payments | 42 | |
| |
Fair value at December 31, 2013 | $ | (309 | ) |
|
Net realized losses | (42 | ) | a | |
Net unrealized gains included in earnings related to assets still held at the end of the period | 430 | | b | |
Settlement payments | 237 | |
| |
Fair value at December 31, 2014 | $ | 316 | |
|
a. | Includes net realized losses of $37 million recorded in revenues in 2013 and $41 million in 2014 , and $1 million of interest expense associated with deferred premiums in 2013 and 2014 . |
b. | Includes unrealized losses (gains) of $228 million recorded in revenues in 2013 and $(432) million in 2014 , and $2 million of interest expense associated with deferred premiums in 2013 and 2014 . |
Refer to Note 2 for the levels within the fair value hierarchy associated with other assets acquired, liabilities assumed and redeemable noncontrolling interest related to PXP and MMR acquisitions and the goodwill impairment.
NOTE 16. BUSINESS SEGMENT INFORMATION
Product Revenue. FCX revenues attributable to the products it produced for the years ended December 31 follow:
| 2014 |
| 2013 |
| 2012 | ||||||
Refined copper products | $ | 9,451 | |
| $ | 9,178 | |
| $ | 9,699 | |
Copper in concentrates a | 3,366 | |
| 5,328 | |
| 4,589 | | |||
Gold | 1,584 | |
| 1,656 | |
| 1,741 | | |||
Molybdenum | 1,207 | |
| 1,110 | |
| 1,187 | | |||
Oil | 4,233 | |
| 2,310 | |
| - | | |||
Other | 1,597 | |
| 1,339 | |
| 794 | | |||
Total | $ | 21,438 | |
| $ | 20,921 | |
| $ | 18,010 | |
a. | Amounts are net of treatment and refining charges totaling $374 million for 2014 , $400 million for 2013 and $311 million for 2012 . |
Geographic Area. Information concerning financial data by geographic area follows:
| December 31, | ||||||||||
| 2014 |
| 2013 |
| 2012 | ||||||
Long-lived assets: a |
|
|
|
|
| ||||||
United States | $ | 29,468 | |
| $ | 32,969 | | b | $ | 8,689 | |
Indonesia | 6,961 | |
| 5,799 | |
| 5,127 | | |||
Peru | 6,848 | |
| 5,181 | |
| 3,933 | | |||
Democratic Republic of Congo | 4,071 | |
| 3,994 | |
| 3,926 | | |||
Chile | 1,542 | | c | 2,699 | |
| 2,587 | | |||
Other | 522 | |
| 562 | |
| 327 | | |||
Total | $ | 49,412 | |
| $ | 51,204 | |
| $ | 24,589 | |
a. | Long-lived assets exclude deferred tax assets, intangible assets and goodwill. |
b. | Increased from 2012 primarily because of the PXP and MMR acquisitions. |
c. | Decreased from 2013 primarily because of the sale of Candelaria/Ojos. |
188
Table of Contents
| Years Ended December 31, | ||||||||||
| 2014 |
| 2013 |
| 2012 | ||||||
Revenues: a |
|
|
|
|
| ||||||
United States | $ | 10,311 | |
| $ | 9,418 | |
| $ | 6,285 | |
Indonesia | 1,792 | |
| 1,651 | |
| 2,054 | | |||
Japan | 1,573 | |
| 2,141 | |
| 2,181 | | |||
Spain | 1,208 | |
| 1,223 | |
| 1,581 | | |||
China | 968 | |
| 1,078 | |
| 579 | | |||
Switzerland | 800 | |
| 1,098 | |
| 731 | | |||
Chile | 687 | |
| 754 | |
| 704 | | |||
Turkey | 484 | |
| 341 | |
| 345 | | |||
Korea | 383 | |
| 297 | |
| 525 | | |||
Other | 3,232 | |
| 2,920 | |
| 3,025 | | |||
Total | $ | 21,438 | |
| $ | 20,921 | |
| $ | 18,010 | |
a. | Revenues are attributed to countries based on the location of the customer. |
Major Customers. Copper concentrate sales to PT Smelting totaled $1.8 billion ( 8 percent of FCX's consolidated revenues) in 2014 , $1.7 billion ( 8 percent of FCX's consolidated revenues) in 2013 and $2.1 billion ( 11 percent of FCX's consolidated revenues) in 2012 . Additionally, oil and gas sales to Phillips 66 Company totaled $2.5 billion ( 12 percent of FCX's consolidated revenues) in 2014. No other customer accounted for 10 percent or more of FCX's consolidated revenues. Refer to Note 6 for further discussion of FCX's investment in PT Smelting.
Labor Matters . As of December 31, 2014 , 48 percent of FCX's labor force was covered by collective bargaining agreements, and 28 percent of FCX's labor force is covered by agreements that will expire within one year.
Business Segments. FCX has organized its operations into six primary divisions – North America copper mines, South America mining, Indonesia mining, Africa mining, Molybdenum mines and U.S. oil and gas operations. FCX's U.S. oil and gas operations reflect the results of FM O&G beginning June 1, 2013. Operating segments that meet certain thresholds are reportable segments, which are disclosed separately in the following tables, and include the Morenci (included in North America copper mines), Cerro Verde (included in South America mining), Grasberg (Indonesia mining) and Tenke Fungurume (Africa mining) copper mines, the Rod & Refining operations and the U.S. oil and gas operations.
Intersegment sales between FCX's mining operations are based on similar arm's-length transactions with third parties at the time of the sale. Intersegment sales may not be reflective of the actual prices ultimately realized because of a variety of factors, including additional processing, timing of sales to unaffiliated customers and transportation premiums.
FCX defers recognizing profits on sales from its mines to other divisions, including Atlantic Copper and on 25 percent of PT-FI's sales to PT Smelting, until final sales to third parties occur. Quarterly variations in ore grades, the timing of intercompany shipments and changes in product prices result in variability in FCX's net deferred profits and quarterly earnings.
FCX allocates certain operating costs, expenses and capital expenditures to its operating divisions and individual segments. However, not all costs and expenses applicable to an operation are allocated. U.S. federal and state income taxes are recorded and managed at the corporate level (included in corporate, other and eliminations), whereas foreign income taxes are recorded and managed at the applicable country level. In addition, most mining exploration and research activities are managed on a consolidated basis, and those costs along with some selling, general and administrative costs are not allocated to the operating divisions or individual segments. Accordingly, the following segment information reflects management determinations that may not be indicative of what the actual financial performance of each operating division or segment would be if it was an independent entity.
North America Copper Mines. FCX has seven operating copper mines in North America – Morenci, Bagdad, Safford, Sierrita and Miami in Arizona, and Tyrone and Chino in New Mexico. The North America copper mines include open-pit mining, sulfide ore concentrating, leaching and SX/EW operations. A majority of the copper produced at the North America copper mines is cast into copper rod by FCX's Rod & Refining operations. In addition to copper, certain of FCX's North America copper mines also produce molybdenum concentrates and silver.
189
Table of Contents
The Morenci open-pit mine, located in southeastern Arizona, produces copper cathodes and copper concentrates. In addition to copper, the Morenci mine also produces molybdenum concentrates. The Morenci mine produced 41 percent of FCX's North America copper during 2014 .
South America Mining. South America mining includes two operating copper mines – Cerro Verde in Peru and El Abra in Chile. These operations include open-pit mining, sulfide ore concentrating, leaching and SX/EW operations.
On November 3, 2014 , FCX completed the sale of its 80 percent ownership interests in the Candelaria mine and the Ojos del Salado mine, both reported as components of other South America mines. South America mining includes the results of the the Candelaria and Ojos del Salado mines through the sale date. Refer to Note 2 for further discussion.
The Cerro Verde open-pit copper mine, located near Arequipa, Peru, produces copper cathodes and copper concentrates. In addition to copper, the Cerro Verde mine also produces molybdenum concentrates and silver. The Cerro Verde mine produced 43 percent of FCX's South America copper during 2014 .
Indonesia Mining. Indonesia mining includes PT-FI's Grasberg minerals district that produces copper concentrates, which contain significant quantities of gold and silver.
Africa Mining. Africa mining includes the Tenke minerals district. The Tenke operation includes surface mining, leaching and SX/EW operations and produces copper cathodes. In addition to copper, the Tenke operation produces cobalt hydroxide.
Molybdenum Mines. Molybdenum mines include the wholly owned Henderson underground mine and Climax open-pit mine in Colorado. The Henderson and Climax mines produce high-purity, chemical-grade molybdenum concentrates, which are typically further processed into value-added molybdenum chemical products.
Rod & Refining. The Rod & Refining segment consists of copper conversion facilities located in North America, and includes a refinery, three rod mills and a specialty copper products facility. These operations process copper produced at FCX's North America copper mines and purchased copper into copper cathode, rod and custom copper shapes. At times these operations refine copper and produce copper rod and shapes for customers on a toll basis. Toll arrangements require the tolling customer to deliver appropriate copper-bearing material to FCX's facilities for processing into a product that is returned to the customer, who pays FCX for processing its material into the specified products.
Atlantic Copper Smelting & Refining. Atlantic Copper smelts and refines copper concentrates and markets refined copper and precious metals in slimes. During 2014 , Atlantic Copper purchased approximately 21 percent of its concentrate requirements from the North America copper mines, approximately 21 percent from the South America mining operations and approximately 8 percent from the Indonesia mining operations at market prices, with the remainder purchased from third parties.
Other Mining & Eliminations. Other mining and eliminations include the Miami smelter (a smelter at FCX's Miami, Arizona, mining operation), Freeport Cobalt (a cobalt chemical refinery in Kokkola, Finland), molybdenum conversion facilities in the U.S. and Europe, four non-operating copper mines in North America (Ajo, Bisbee and Tohono in Arizona, and Cobre in New Mexico) and other mining support entities.
U.S. Oil & Gas Operations. FCX's U.S. oil and gas operations include oil production facilities in the Deepwater GOM, oil production facilities onshore and offshore California, onshore natural gas resources in the Haynesville shale play in Louisiana, natural gas production from the Madden area in central Wyoming, and a position in the shallow-water Inboard Lower Tertiary/Cretaceous natural gas trend on the Shelf of the GOM and onshore in South Louisiana. All of the U.S. operations are considered one operating and reportable segment.
190
Table of Contents
Financial Information by Business Segment
|
|
|
|
|
|
|
|
|
|
|
|
|
|
|
|
|
|
|
|
|
|
|
|
|
|
|
|
|
|
|
| ||||||||||||||||||||||||||||||||
| Mining Operations |
|
|
|
|
|
| ||||||||||||||||||||||||||||||||||||||||||||||||||||||||
| North America Copper Mines |
| South America |
| Indonesia |
| Africa |
|
|
|
|
|
|
|
|
|
|
|
|
|
|
|
| ||||||||||||||||||||||||||||||||||||||||
|
|
|
|
|
|
|
|
|
|
|
|
|
|
|
|
|
|
|
|
| Atlantic |
| Other |
|
|
|
|
| Corporate, |
|
| ||||||||||||||||||||||||||||||||
|
|
|
|
|
|
|
|
|
|
|
|
|
|
|
|
| Molyb- |
|
|
| Copper |
| Mining |
|
|
| U.S. |
| Other |
|
| ||||||||||||||||||||||||||||||||
|
|
| Other |
|
|
| Cerro |
| Other |
|
|
|
|
|
|
| denum |
| Rod & |
| Smelting |
| & Elimi- |
| Total |
| Oil & Gas |
| & Elimi- |
| FCX | ||||||||||||||||||||||||||||||||
| Morenci |
| Mines |
| Total |
| Verde |
| Mines |
| Total |
| Grasberg |
| Tenke |
| Mines |
| Refining |
| & Refining |
| nations |
| Mining |
| Operations |
| nations |
| Total | ||||||||||||||||||||||||||||||||
Year Ended December 31, 2014 |
|
|
|
|
|
|
|
|
|
|
|
|
|
|
|
|
|
|
|
|
|
|
|
|
|
|
|
|
|
|
| ||||||||||||||||||||||||||||||||
Revenues: |
|
|
|
|
|
|
|
|
|
|
|
|
|
|
|
|
|
|
|
|
|
|
|
|
|
|
|
|
|
|
| ||||||||||||||||||||||||||||||||
Unaffiliated customers | $ | 364 | |
| $ | 336 | |
| $ | 700 | |
| $ | 1,282 | |
| $ | 1,740 | |
| $ | 3,022 | |
| $ | 2,848 | | a | $ | 1,437 | |
| $ | - | |
| $ | 4,626 | |
| $ | 2,391 | |
| $ | 1,704 | | b | $ | 16,728 | |
| $ | 4,710 | | c | $ | - | |
| $ | 21,438 | |
Intersegment | 1,752 | |
| 3,164 | |
| 4,916 | |
| 206 | |
| 304 | |
| 510 | |
| 223 | |
| 121 | |
| 587 | |
| 29 | |
| 21 | |
| (6,407 | ) |
| - | |
| - | |
| - | |
| - | | ||||||||||||||||
Production and delivery | 1,287 | |
| 2,153 | |
| 3,440 | |
| 741 | |
| 1,198 | |
| 1,939 | |
| 1,988 | |
| 770 | |
| 328 | |
| 4,633 | |
| 2,356 | |
| (4,789 | ) |
| 10,665 | |
| 1,237 | |
| 2 | |
| 11,904 | | ||||||||||||||||
Depreciation, depletion and amortization | 168 | |
| 316 | |
| 484 | |
| 159 | |
| 208 | |
| 367 | |
| 266 | |
| 228 | |
| 92 | |
| 10 | |
| 41 | |
| 70 | |
| 1,558 | |
| 2,291 | |
| 14 | |
| 3,863 | | ||||||||||||||||
Impairment of oil and gas properties | - | |
| - | |
| - | |
| - | |
| - | |
| - | |
| - | |
| - | |
| - | |
| - | |
| - | |
| - | |
| - | |
| 3,737 | |
| - | |
| 3,737 | | ||||||||||||||||
Selling, general and administrative expenses | 2 | |
| 3 | |
| 5 | |
| 3 | |
| 3 | |
| 6 | |
| 98 | |
| 12 | |
| - | |
| - | |
| 17 | |
| 25 | |
| 163 | |
| 207 | |
| 222 | |
| 592 | | ||||||||||||||||
Mining exploration and research expenses | - | |
| 8 | |
| 8 | |
| - | |
| - | |
| - | |
| - | |
| - | |
| - | |
| - | |
| - | |
| 118 | |
| 126 | |
| - | |
| - | |
| 126 | | ||||||||||||||||
Environmental obligations and shutdown costs | - | |
| (5 | ) |
| (5 | ) |
| - | |
| - | |
| - | |
| - | |
| - | |
| - | |
| - | |
| - | |
| 123 | |
| 118 | |
| - | |
| 1 | |
| 119 | | ||||||||||||||||
Goodwill impairment | - | |
| - | |
| - | |
| - | |
| - | |
| - | |
| - | |
| - | |
| - | |
| - | |
| - | |
| - | |
| - | |
| 1,717 | |
| - | |
| 1,717 | | ||||||||||||||||
Net gain on sales of assets | - | |
| (14 | ) |
| (14 | ) |
| - | |
| - | |
| - | |
| - | |
| - | |
| - | |
| - | |
| - | |
| (703 | ) | d | (717 | ) |
| - | |
| - | |
| (717 | ) | ||||||||||||||||
Operating income (loss) | 659 | |
| 1,039 | |
| 1,698 | |
| 585 | |
| 635 | |
| 1,220 | |
| 719 | |
| 548 | |
| 167 | |
| 12 | |
| (2 | ) | | 453 | |
| 4,815 | |
| (4,479 | ) |
| (239 | ) |
| 97 | | ||||||||||||||||
|
|
|
|
|
|
|
|
|
|
|
|
|
|
|
|
|
|
|
|
|
|
|
|
|
|
|
|
|
|
|
| ||||||||||||||||||||||||||||||||
Interest expense, net | 3 | |
| 1 | |
| 4 | |
| 1 | |
| - | |
| 1 | |
| - | |
| - | |
| - | |
| - | |
| 13 | |
| 84 | |
| 102 | |
| 241 | |
| 287 | |
| 630 | | ||||||||||||||||
Provision for (benefit from) income taxes | - | |
| - | |
| - | |
| 265 | |
| 266 | |
| 531 | |
| 293 | |
| 116 | |
| - | |
| - | |
| - | |
| 221 | | d | 1,161 | |
| - | |
| (837 | ) | | 324 | | ||||||||||||||||
Total assets at December 31, 2014 | 3,780 | |
| 5,611 | |
| 9,391 | |
| 7,513 | |
| 1,993 | |
| 9,506 | |
| 8,626 | |
| 5,073 | |
| 2,095 | |
| 235 | |
| 898 | |
| 1,319 | |
| 37,143 | |
| 20,834 | |
| 818 | |
| 58,795 | | ||||||||||||||||
Capital expenditures | 826 | |
| 143 | |
| 969 | |
| 1,691 | |
| 94 | |
| 1,785 | |
| 948 | |
| 159 | |
| 54 | |
| 4 | |
| 17 | |
| 52 | |
| 3,988 | |
| 3,205 | |
| 22 | |
| 7,215 | | ||||||||||||||||
|
|
|
|
|
|
|
|
|
|
|
|
|
|
|
|
|
|
|
|
|
|
|
|
|
|
|
|
|
|
|
| ||||||||||||||||||||||||||||||||
Year Ended December 31, 2013 |
|
|
|
|
|
|
|
|
|
|
|
|
|
|
|
|
|
|
|
|
|
|
|
|
|
|
|
|
|
|
| ||||||||||||||||||||||||||||||||
Revenues: |
|
|
|
|
|
|
|
|
|
|
|
|
|
|
|
|
|
|
|
|
|
|
|
|
|
|
|
|
|
|
| ||||||||||||||||||||||||||||||||
Unaffiliated customers | $ | 244 | |
| $ | 326 | |
| $ | 570 | |
| $ | 1,473 | |
| $ | 2,379 | |
| $ | 3,852 | |
| $ | 3,751 | | a | $ | 1,590 | |
| $ | - | |
| $ | 4,995 | |
| $ | 2,027 | |
| $ | 1,516 | | b | $ | 18,301 | |
| $ | 2,616 | | c | $ | 4 | |
| $ | 20,921 | |
Intersegment | 1,673 | |
| 2,940 | |
| 4,613 | |
| 360 | |
| 273 | |
| 633 | |
| 336 | |
| 47 | |
| 522 | |
| 27 | |
| 14 | |
| (6,192 | ) |
| - | |
| - | |
| - | |
| - | | ||||||||||||||||
Production and delivery | 1,233 | |
| 2,033 | |
| 3,266 | |
| 781 | |
| 1,288 | |
| 2,069 | |
| 2,309 | |
| 754 | |
| 317 | |
| 4,990 | |
| 2,054 | |
| (4,608 | ) |
| 11,151 | |
| 682 | |
| 7 | |
| 11,840 | | ||||||||||||||||
Depreciation, depletion and amortization | 133 | |
| 269 | |
| 402 | |
| 152 | |
| 194 | |
| 346 | |
| 247 | |
| 246 | |
| 82 | |
| 9 | |
| 42 | |
| 48 | |
| 1,422 | |
| 1,364 | |
| 11 | |
| 2,797 | | ||||||||||||||||
Selling, general and administrative expenses | 2 | |
| 3 | |
| 5 | |
| 3 | |
| 4 | |
| 7 | |
| 110 | |
| 12 | |
| - | |
| - | |
| 20 | |
| 29 | |
| 183 | |
| 120 | |
| 354 | |
| 657 | | ||||||||||||||||
Mining exploration and research expenses | - | |
| 5 | |
| 5 | |
| - | |
| - | |
| - | |
| 1 | |
| - | |
| - | |
| - | |
| - | |
| 193 | |
| 199 | |
| - | |
| 11 | |
| 210 | | ||||||||||||||||
Environmental obligations and shutdown costs | - | |
| (1 | ) |
| (1 | ) |
| - | |
| - | |
| - | |
| - | |
| - | |
| - | |
| - | |
| - | |
| 67 | |
| 66 | |
| - | |
| - | |
| 66 | | ||||||||||||||||
Operating income (loss) | 549 | |
| 957 | |
| 1,506 | |
| 897 | |
| 1,166 | |
| 2,063 | |
| 1,420 | |
| 625 | |
| 123 | |
| 23 | |
| (75 | ) | e | (405 | ) |
| 5,280 | |
| 450 | |
| (379 | ) |
| 5,351 | | ||||||||||||||||
|
|
|
|
|
|
|
|
|
|
|
|
|
|
|
|
|
|
|
|
|
|
|
|
|
|
|
|
|
|
|
| ||||||||||||||||||||||||||||||||
Interest expense, net | 3 | |
| 1 | |
| 4 | |
| 2 | |
| 1 | |
| 3 | |
| 12 | |
| 2 | |
| - | |
| - | |
| 16 | |
| 80 | |
| 117 | |
| 181 | |
| 220 | |
| 518 | | ||||||||||||||||
Provision for income taxes | - | |
| - | |
| - | |
| 316 | | | 404 | |
| 720 | |
| 603 | |
| 131 | |
| - | |
| - | |
| - | |
| - | |
| 1,454 | |
| - | |
| 21 | | f | 1,475 | | ||||||||||||||||
Total assets at December 31, 2013 | 3,110 | |
| 5,810 | |
| 8,920 | |
| 6,584 | |
| 3,996 | |
| 10,580 | |
| 7,437 | |
| 4,849 | |
| 2,107 | |
| 239 | |
| 1,039 | |
| 1,003 | |
| 36,174 | |
| 26,252 | |
| 1,047 | |
| 63,473 | | ||||||||||||||||
Capital expenditures | 737 | |
| 329 | |
| 1,066 | |
| 960 | |
| 185 | |
| 1,145 | |
| 1,030 | |
| 205 | |
| 164 | |
| 4 | |
| 67 | |
| 113 | |
| 3,794 | |
| 1,436 | |
| 56 | |
| 5,286 | | ||||||||||||||||
a. | Includes PT-FI's sales to PT Smelting totaling $1.8 billion in 2014 and $1.7 billion in 2013. |
b. | Includes revenues from FCX's molybdenum sales company, which included sales of molybdenum produced by the molybdenum mines and by certain of the North and South America copper mines. |
c. | Includes net mark-to-market gains (losses) associated with crude oil and natural gas derivative contracts totaling $505 million in 2014 and $(334) million for the period from June 1, 2013, to December 31, 2013. |
d. | Includes a gain of $671 million for the sale of Candelaria/Ojos and related provision for income taxes of $221 million . |
e. | Includes $50 million for shutdown costs associated with Atlantic Copper's scheduled 68 -day maintenance turnaround, which was completed in fourth-quarter 2013. |
f. | Includes $199 million of net benefits resulting from oil and gas acquisitions. |
191
Table of Contents
|
|
|
|
|
|
|
|
|
|
|
|
|
|
|
|
|
|
|
|
|
|
|
|
|
|
|
|
|
|
|
| ||||||||||||||||||||||||||||||||
| Mining Operations |
|
|
|
|
|
| ||||||||||||||||||||||||||||||||||||||||||||||||||||||||
| North America Copper Mines |
| South America |
| Indonesia |
| Africa |
|
|
|
|
|
|
|
|
|
|
|
|
|
|
|
| ||||||||||||||||||||||||||||||||||||||||
|
|
|
|
|
|
|
|
|
|
|
|
|
|
|
|
|
|
|
|
| Atlantic |
| Other |
|
|
|
|
| Corporate, |
|
| ||||||||||||||||||||||||||||||||
|
|
|
|
|
|
|
|
|
|
|
|
|
|
|
|
| Molyb- |
|
|
| Copper |
| Mining |
|
|
| U.S. |
| Other |
|
| ||||||||||||||||||||||||||||||||
|
|
| Other |
|
|
| Cerro |
| Other |
|
|
|
|
|
|
| denum |
| Rod & |
| Smelting |
| & Elimi- |
| Total |
| Oil & Gas |
| & Elimi- |
| FCX | ||||||||||||||||||||||||||||||||
| Morenci |
| Mines |
| Total |
| Verde |
| Mines |
| Total |
| Grasberg |
| Tenke |
| Mines |
| Refining |
| & Refining |
| nations |
| Mining |
| Operations |
| nations |
| Total | ||||||||||||||||||||||||||||||||
Year Ended December 31, 2012 |
|
|
|
|
|
|
|
|
|
|
|
|
|
|
|
|
|
|
|
|
|
|
|
|
|
|
|
|
|
|
| ||||||||||||||||||||||||||||||||
Revenues: |
|
|
|
|
|
|
|
|
|
|
|
|
|
|
|
|
|
|
|
|
|
|
|
|
|
|
|
|
|
|
| ||||||||||||||||||||||||||||||||
Unaffiliated customers | $ | 156 | |
| $ | 46 | |
| $ | 202 | |
| $ | 1,767 | |
| $ | 2,143 | |
| $ | 3,910 | |
| $ | 3,611 | | a | $ | 1,349 | |
| $ | - | |
| $ | 4,989 | |
| $ | 2,683 | |
| $ | 1,259 | | b | $ | 18,003 | |
| $ | - | |
| $ | 7 | |
| $ | 18,010 | |
Intersegment | 1,846 | |
| 3,438 | |
| 5,284 | |
| 388 | |
| 430 | |
| 818 | |
| 310 | |
| 10 | |
| 529 | |
| 27 | |
| 26 | |
| (7,004 | ) |
| - | |
| - | |
| - | |
| - | | ||||||||||||||||
Production and delivery | 1,076 | |
| 1,857 | |
| 2,933 | |
| 813 | |
| 1,301 | |
| 2,114 | |
| 2,349 | |
| 615 | |
| 320 | |
| 4,993 | |
| 2,640 | |
| (5,585 | ) |
| 10,379 | |
| - | |
| 3 | |
| 10,382 | | ||||||||||||||||
Depreciation, depletion and amortization | 122 | |
| 238 | |
| 360 | |
| 139 | |
| 148 | |
| 287 | |
| 212 | |
| 176 | |
| 59 | |
| 9 | |
| 42 | |
| 27 | |
| 1,172 | |
| - | |
| 7 | |
| 1,179 | | ||||||||||||||||
Selling, general and administrative expenses | 2 | |
| 2 | |
| 4 | |
| 3 | |
| 3 | |
| 6 | |
| 121 | |
| 6 | |
| - | |
| - | |
| 19 | |
| 18 | |
| 174 | |
| - | |
| 257 | |
| 431 | | ||||||||||||||||
Mining exploration and research expenses | 1 | |
| - | |
| 1 | |
| - | |
| - | |
| - | |
| - | |
| - | |
| - | |
| - | |
| - | |
| 272 | |
| 273 | |
| - | |
| 12 | |
| 285 | | ||||||||||||||||
Environmental obligations and shutdown costs | (11 | ) |
| (5 | ) |
| (16 | ) |
| - | |
| - | |
| - | |
| - | |
| - | |
| - | |
| - | |
| - | |
| (3 | ) |
| (19 | ) |
| - | |
| (3 | ) |
| (22 | ) | ||||||||||||||||
Gain on insurance settlement | - | |
| - | |
| - | |
| - | |
| - | |
| - | |
| (59 | ) |
| - | |
| - | |
| - | |
| - | |
| - | |
| (59 | ) |
| - | |
| - | |
| (59 | ) | ||||||||||||||||
Operating income (loss) | 812 | |
| 1,392 | |
| 2,204 | |
| 1,200 | |
| 1,121 | |
| 2,321 | |
| 1,298 | |
| 562 | |
| 150 | |
| 14 | |
| 8 | |
| (474 | ) |
| 6,083 | |
| - | |
| (269 | ) |
| 5,814 | | ||||||||||||||||
|
|
|
|
|
|
|
|
|
|
|
|
|
|
|
|
|
|
|
|
|
|
|
|
|
|
|
|
|
|
|
| ||||||||||||||||||||||||||||||||
Interest expense, net | 1 | |
| - | |
| 1 | |
| 7 | |
| - | |
| 7 | |
| 5 | |
| 1 | |
| - | |
| - | |
| 12 | |
| 81 | |
| 107 | |
| - | |
| 79 | |
| 186 | | ||||||||||||||||
Provision for income taxes | - | |
| - | |
| - | |
| 228 | | c | 329 | |
| 557 | |
| 497 | |
| 112 | |
| - | |
| - | |
| - | |
| - | |
| 1,166 | |
| - | |
| 344 | |
| 1,510 | | ||||||||||||||||
Total assets at December 31, 2012 | 2,445 | |
| 5,703 | |
| 8,148 | |
| 5,821 | |
| 4,342 | |
| 10,163 | |
| 6,591 | |
| 4,622 | |
| 2,018 | |
| 242 | |
| 992 | |
| 614 | |
| 33,390 | |
| - | |
| 2,050 | |
| 35,440 | | ||||||||||||||||
Capital expenditures | 266 | |
| 559 | |
| 825 | |
| 558 | |
| 373 | |
| 931 | |
| 843 | |
| 539 | |
| 245 | |
| 6 | |
| 16 | |
| 69 | |
| 3,474 | |
| - | |
| 20 | |
| 3,494 | | ||||||||||||||||
a. | Includes PT-FI's sales to PT Smelting totaling $2.1 billion in 2012. |
b. | Includes revenues from FCX's molybdenum sales company, which included sales of molybdenum produced by the molybdenum mines and by certain of the North and South America copper mines. |
c. | Includes a credit of $234 million for the reversal of a net deferred tax liability. |
192
Table of Contents
NOTE 17. GUARANTOR FINANCIAL STATEMENTS
All of the senior notes issued by FCX and discussed in Note 8 are fully and unconditionally guaranteed on a senior basis jointly and severally by FM O&G LLC, as guarantor, which is a 100 percent owned subsidiary of FM O&G and FCX. The guarantee is an unsecured obligation of the guarantor and ranks equal in right of payment with all existing and future indebtedness of FM O&G LLC, including indebtedness under the revolving credit facility. The guarantee ranks senior in right of payment with all of FM O&G LLC's future subordinated obligations and is effectively subordinated in right of payment to any debt of FM O&G LLC's subsidiaries. In the future, FM O&G LLC's guarantee may be released or terminated for certain obligations under the following circumstances: (i) all or substantially all of the equity interests or assets of FM O&G LLC are sold to a third party; or (ii) FM O&G LLC no longer has any obligations under any FM O&G senior notes or any refinancing thereof and no longer guarantees any obligations of FCX under the revolver, the Term Loan or any other senior debt.
The following condensed consolidating financial information includes information regarding FCX, as issuer, FM O&G LLC, as guarantor, and all other non-guarantor subsidiaries of FCX. Included are the condensed consolidating balance sheets at December 31, 2014 and 2013 , and the related condensed consolidating statements of comprehensive (loss) income for the years ended December 31, 2014 and 2013 , and the condensed consolidating statements of cash flows for the years ended December 31, 2014 and 2013 , which should be read in conjunction with FCX's notes to the consolidated financial statements:
CONDENSED CONSOLIDATING BALANCE SHEET
December 31, 2014
| FCX |
| FM O&G LLC |
| Non-guarantor |
|
|
| Consolidated | ||||||||||
| Issuer |
| Guarantor |
| Subsidiaries |
| Eliminations |
| FCX | ||||||||||
ASSETS |
|
|
|
|
|
|
|
|
| ||||||||||
Current assets: |
|
|
|
|
|
|
|
|
| ||||||||||
Cash and cash equivalents | $ | - | |
| $ | 1 | |
| $ | 463 | |
| $ | - | |
| $ | 464 | |
Accounts receivable | 234 | |
| 2,230 | |
| 2,671 | |
| (2,572 | ) |
| 2,563 | | |||||
Other current assets | 89 | |
| 404 | |
| 5,525 | |
| - | |
| 6,018 | | |||||
Total current assets | 323 | |
| 2,635 | |
| 8,659 | |
| (2,572 | ) |
| 9,045 | | |||||
Property, plant, equipment and mining development costs, net | 22 | |
| 46 | |
| 26,152 | |
| - | |
| 26,220 | | |||||
Oil and gas properties, net - full cost method: |
|
|
|
|
|
|
|
|
| ||||||||||
Subject to amortization, less accumulated amortization | - | |
| 3,296 | |
| 5,907 | |
| (16 | ) |
| 9,187 | | |||||
Not subject to amortization | - | |
| 2,447 | |
| 7,640 | |
| - | |
| 10,087 | | |||||
Investments in consolidated subsidiaries | 28,765 | |
| 6,460 | |
| 10,246 | |
| (45,471 | ) |
| - | | |||||
Other assets | 9,012 | |
| 3,947 | |
| 4,084 | |
| (12,787 | ) |
| 4,256 | | |||||
Total assets | $ | 38,122 | |
| $ | 18,831 | |
| $ | 62,688 | |
| $ | (60,846 | ) |
| $ | 58,795 | |
|
|
|
|
|
|
|
|
|
| ||||||||||
LIABILITIES AND EQUITY |
|
|
|
|
|
|
|
|
| ||||||||||
Current liabilities | $ | 1,592 | |
| $ | 560 | |
| $ | 5,592 | |
| $ | (2,572 | ) |
| $ | 5,172 | |
Long-term debt, less current portion | 15,028 | |
| 3,874 | |
| 8,902 | |
| (9,312 | ) |
| 18,492 | | |||||
Deferred income taxes | 3,161 | | a | - | |
| 3,237 | |
| - | |
| 6,398 | | |||||
Environmental and asset retirement obligations, less current portion | - | |
| 302 | |
| 3,345 | |
| - | |
| 3,647 | | |||||
Other liabilities | 54 | |
| 3,372 | |
| 1,910 | |
| (3,475 | ) |
| 1,861 | | |||||
Total liabilities | 19,835 | |
| 8,108 | |
| 22,986 | |
| (15,359 | ) |
| 35,570 | | |||||
|
|
|
|
|
|
|
|
|
| ||||||||||
Redeemable noncontrolling interest | - | |
| - | |
| 751 | |
| - | |
| 751 | | |||||
|
|
|
|
|
|
|
|
|
| ||||||||||
Equity: |
|
|
|
|
|
|
|
|
| ||||||||||
Stockholders' equity | 18,287 | |
| 10,723 | |
| 35,268 | |
| (45,991 | ) |
| 18,287 | | |||||
Noncontrolling interests | - | |
| - | |
| 3,683 | |
| 504 | |
| 4,187 | | |||||
Total equity | 18,287 | |
| 10,723 | |
| 38,951 | |
| (45,487 | ) |
| 22,474 | | |||||
Total liabilities and equity | $ | 38,122 | |
| $ | 18,831 | |
| $ | 62,688 | |
| $ | (60,846 | ) |
| $ | 58,795 | |
a. | All U.S. related deferred income taxes are recorded at the parent company. |
193
Table of Contents
CONDENSED CONSOLIDATING BALANCE SHEET
December 31, 2013
| FCX |
| FM O&G LLC |
| Non-guarantor |
|
|
| Consolidated | ||||||||||
| Issuer |
| Guarantor |
| Subsidiaries |
| Eliminations |
| FCX | ||||||||||
ASSETS |
|
|
|
|
|
|
|
|
| ||||||||||
Current assets: |
|
|
|
|
|
|
|
|
| ||||||||||
Cash and cash equivalents | $ | - | |
| $ | - | |
| $ | 1,985 | |
| $ | - | |
| $ | 1,985 | |
Accounts receivable | 855 | |
| 659 | |
| 2,258 | |
| (1,210 | ) |
| 2,562 | | |||||
Other current assets | 114 | |
| 38 | |
| 5,273 | |
| - | |
| 5,425 | | |||||
Total current assets | 969 | |
| 697 | |
| 9,516 | |
| (1,210 | ) |
| 9,972 | | |||||
Property, plant, equipment and mining development costs, net | 27 | |
| 43 | |
| 23,972 | |
| - | |
| 24,042 | | |||||
Oil and gas properties, net - full cost method: |
|
|
|
|
|
|
|
|
| ||||||||||
Subject to amortization, less accumulated amortization | - | |
| 6,207 | |
| 6,265 | |
| - | |
| 12,472 | | |||||
Not subject to amortization | - | |
| 2,649 | |
| 8,238 | |
| - | |
| 10,887 | | |||||
Investment in consolidated subsidiaries | 31,162 | |
| 9,712 | |
| 12,468 | |
| (53,342 | ) |
| - | | |||||
Goodwill | - | |
| 437 | |
| 1,479 | |
| - | |
| 1,916 | | |||||
Other assets | 7,126 | |
| 4,640 | |
| 4,128 | |
| (11,710 | ) |
| 4,184 | | |||||
Total assets | $ | 39,284 | |
| $ | 24,385 | |
| $ | 66,066 | |
| $ | (66,262 | ) |
| $ | 63,473 | |
|
|
|
|
|
|
|
|
|
| ||||||||||
LIABILITIES AND EQUITY |
|
|
|
|
|
|
|
|
| ||||||||||
Current liabilities | $ | 1,003 | |
| $ | 758 | |
| $ | 4,222 | |
| $ | (1,210 | ) |
| $ | 4,773 | |
Long-term debt, less current portion | 13,184 | |
| 7,199 | |
| 8,056 | |
| (8,045 | ) |
| 20,394 | | |||||
Deferred income taxes | 4,137 | | a | - | |
| 3,273 | |
| - | |
| 7,410 | | |||||
Environmental and asset retirement obligations, less current portion | - | |
| 301 | |
| 2,958 | |
| - | |
| 3,259 | | |||||
Other liabilities | 26 | |
| 3,436 | |
| 1,893 | |
| (3,665 | ) |
| 1,690 | | |||||
Total liabilities | 18,350 | |
| 11,694 | |
| 20,402 | |
| (12,920 | ) |
| 37,526 | | |||||
|
|
|
|
|
|
|
|
|
| ||||||||||
Redeemable noncontrolling interest | - | |
| - | |
| 716 | |
| - | |
| 716 | | |||||
|
|
|
|
|
|
|
|
|
| ||||||||||
Equity: |
|
|
|
|
|
|
|
|
| ||||||||||
Stockholders' equity | 20,934 | |
| 12,691 | |
| 41,100 | |
| (53,791 | ) |
| 20,934 | | |||||
Noncontrolling interests | - | |
| - | |
| 3,848 | |
| 449 | |
| 4,297 | | |||||
Total equity | 20,934 | |
| 12,691 | |
| 44,948 | |
| (53,342 | ) |
| 25,231 | | |||||
Total liabilities and equity | $ | 39,284 | |
| $ | 24,385 | |
| $ | 66,066 | |
| $ | (66,262 | ) |
| $ | 63,473 | |
a. | All U.S. related deferred income taxes are recorded at the parent company . |
194
Table of Contents
CONDENSED CONSOLIDATING STATEMENTS OF COMPREHENSIVE (LOSS) INCOME
Year Ended December 31, 2014 |
|
|
|
|
|
|
|
|
| ||||||||||
| FCX |
| FM O&G LLC |
| Non-guarantor |
|
|
| Consolidated | ||||||||||
| Issuer |
| Guarantor |
| Subsidiaries |
| Eliminations |
| FCX | ||||||||||
Revenues | $ | - | |
| $ | 2,356 | |
| $ | 19,082 | |
| $ | - | |
| 21,438 | | |
Total costs and expenses | 59 | |
| 3,498 | | a | 17,762 | | a | 22 | |
| 21,341 | | |||||
Operating (loss) income | (59 | ) |
| (1,142 | ) |
| 1,320 | |
| (22 | ) |
| 97 | | |||||
Interest expense, net | (382 | ) |
| (139 | ) |
| (189 | ) |
| 80 | |
| (630 | ) | |||||
Net (loss) gain on early extinguishment of debt | (5 | ) |
| 78 | |
| - | |
| - | |
| 73 | | |||||
Other income (expense), net | 72 | |
| 3 | |
| 41 | |
| (80 | ) |
| 36 | | |||||
(Loss) income before income taxes and equity in affiliated companies' net (losses) earnings | (374 | ) |
| (1,200 | ) |
| 1,172 | |
| (22 | ) |
| (424 | ) | |||||
Benefit from (provision for) income taxes | 73 | |
| 281 | |
| (686 | ) |
| 8 | |
| (324 | ) | |||||
Equity in affiliated companies' net (losses) earnings | (1,007 | ) |
| (3,429 | ) |
| (4,633 | ) |
| 9,072 | |
| 3 | | |||||
Net (loss) income | (1,308 | ) |
| (4,348 | ) |
| (4,147 | ) |
| 9,058 | |
| (745 | ) | |||||
Net income and preferred dividends attributable to noncontrolling interests | - | |
| - | |
| (519 | ) |
| (44 | ) |
| (563 | ) | |||||
Net (loss) income attributable to FCX common stockholders | $ | (1,308 | ) |
| $ | (4,348 | ) |
| $ | (4,666 | ) |
| $ | 9,014 | |
| $ | (1,308 | ) |
|
|
|
|
|
|
|
|
|
| ||||||||||
Other comprehensive loss | - | |
| - | |
| (139 | ) |
| - | |
| (139 | ) | |||||
Total comprehensive (loss) income | $ | (1,308 | ) |
| $ | (4,348 | ) |
| $ | (4,805 | ) |
| $ | 9,014 | |
| $ | (1,447 | ) |
a. | Includes impairment charges totaling $1.9 billion at the FM O&G LLC Guarantor and $3.5 billion at the non-guarantor subsidiaries related to ceiling test impairment charges for FCX's oil and gas properties pursuant to full cost accounting rules and a goodwill impairment charge. |
Year Ended December 31, 2013 |
|
|
|
|
|
|
|
|
| ||||||||||
| FCX |
| FM O&G LLC |
| Non-guarantor |
|
|
| Consolidated | ||||||||||
| Issuer |
| Guarantor |
| Subsidiaries |
| Eliminations |
| FCX | ||||||||||
Revenues | $ | - | |
| $ | 1,177 | |
| $ | 19,744 | |
| $ | - | |
| $ | 20,921 | |
Total costs and expenses | 134 | |
| 1,065 | |
| 14,371 | |
| - | |
| 15,570 | | |||||
Operating (loss) income | (134 | ) |
| 112 | |
| 5,373 | |
| - | |
| 5,351 | | |||||
Interest expense, net | (319 | ) |
| (129 | ) |
| (129 | ) |
| 59 | |
| (518 | ) | |||||
Net (loss) gain on early extinguishment of debt | (45 | ) |
| - | |
| 10 | |
| - | |
| (35 | ) | |||||
Gain on investment in MMR | 128 | |
| - | |
| - | |
| - | |
| 128 | | |||||
Other income (expense), net | 61 | |
| - | |
| (15 | ) |
| (59 | ) |
| (13 | ) | |||||
(Loss) income before income taxes and equity in affiliated companies' net earnings (losses) | (309 | ) |
| (17 | ) |
| 5,239 | |
| - | |
| 4,913 | | |||||
Benefit from (provision for) income taxes | 81 | |
| 17 | |
| (1,573 | ) |
| - | |
| (1,475 | ) | |||||
Equity in affiliated companies' net earnings (losses) | 2,886 | |
| 281 | |
| 268 | |
| (3,432 | ) |
| 3 | | |||||
Net income (loss) | 2,658 | |
| 281 | |
| 3,934 | |
| (3,432 | ) |
| 3,441 | | |||||
Net income and preferred dividends attributable to noncontrolling interests | - | |
| - | |
| (706 | ) |
| (77 | ) |
| (783 | ) | |||||
Net income (loss) attributable to FCX common stockholders | $ | 2,658 | |
| $ | 281 | |
| $ | 3,228 | |
| $ | (3,509 | ) |
| $ | 2,658 | |
|
|
|
|
|
|
|
|
|
| ||||||||||
Other comprehensive income | - | |
| - | |
| 101 | |
| - | |
| 101 | | |||||
Total comprehensive income (loss) | $ | 2,658 | |
| $ | 281 | |
| $ | 3,329 | |
| $ | (3,509 | ) |
| $ | 2,759 | |
195
Table of Contents
CONDENSED CONSOLIDATING STATEMENT OF CASH FLOWS
Year Ended December 31, 2014
| FCX |
| FM O&G LLC |
| Non-guarantor |
|
|
| Consolidated | ||||||||||
| Issuer |
| Guarantor |
| Subsidiaries |
| Eliminations |
| FCX | ||||||||||
Cash flow from operating activities: |
|
|
|
|
|
|
|
|
| ||||||||||
Net (loss) income | $ | (1,308 | ) |
| $ | (4,348 | ) |
| $ | (4,147 | ) |
| $ | 9,058 | |
| $ | (745 | ) |
Adjustments to reconcile net (loss) income to net cash (used in) provided by operating activities: |
|
|
|
|
|
|
|
|
| ||||||||||
Depreciation, depletion and amortization | 4 | |
| 806 | |
| 3,077 | |
| (24 | ) |
| 3,863 | | |||||
Impairment of oil and gas properties and goodwill | - | |
| 1,922 | |
| 3,486 | |
| 46 | |
| 5,454 | | |||||
Net gains on crude oil and natural gas derivative contracts | - | |
| (504 | ) |
| - | |
| - | |
| (504 | ) | |||||
Equity in (earnings) losses of consolidated subsidiaries | 1,007 | |
| 3,429 | |
| 4,633 | |
| (9,072 | ) |
| (3 | ) | |||||
Other, net | (882 | ) |
| (113 | ) |
| (807 | ) |
| - | |
| (1,802 | ) | |||||
Decreases (increases) in working capital and changes in other tax payments, excluding amounts from dispositions | 723 | |
| (1,750 | ) |
| 395 | |
| - | |
| (632 | ) | |||||
Net cash (used in) provided by operating activities | (456 | ) |
| (558 | ) |
| 6,637 | |
| 8 | |
| 5,631 | | |||||
|
|
|
|
|
|
|
|
|
| ||||||||||
Cash flow from investing activities: |
|
|
|
|
|
|
|
|
| ||||||||||
Capital expenditures | - | |
| (2,143 | ) |
| (5,072 | ) |
| - | |
| (7,215 | ) | |||||
Acquisition of Deepwater GOM interests | - | |
| - | |
| (1,426 | ) |
| - | |
| (1,426 | ) | |||||
Intercompany loans | (1,328 | ) |
| 704 | |
| - | |
| 624 | |
| - | | |||||
Dividend from (investment in) consolidated subsidiary | 1,221 | |
| (130 | ) |
| (2,408 | ) |
| 1,317 | |
| - | | |||||
Net proceeds from sale of Candelaria and Ojos del Salado | - | |
| - | |
| 1,709 | |
| - | |
| 1,709 | | |||||
Net proceeds from sale of Eagle Ford shale assets | - | |
| 2,910 | |
| - | |
| - | |
| 2,910 | | |||||
Other, net | - | |
| 41 | |
| 180 | |
| - | |
| 221 | | |||||
Net cash (used in) provided by investing activities | (107 | ) |
| 1,382 | |
| (7,017 | ) |
| 1,941 | |
| (3,801 | ) | |||||
|
|
|
|
|
|
|
|
|
| ||||||||||
Cash flow from financing activities: |
|
|
|
|
|
|
|
|
| ||||||||||
Proceeds from debt | 7,464 | |
| - | |
| 1,246 | |
| - | |
| 8,710 | | |||||
Repayments of debt | (5,575 | ) |
| (3,994 | ) |
| (737 | ) |
| - | |
| (10,306 | ) | |||||
Intercompany loans | - | |
| 810 | |
| (186 | ) |
| (624 | ) |
| - | | |||||
Cash dividends and distributions paid, and contributions received | (1,305 | ) |
| 2,364 | |
| (1,463 | ) |
| (1,325 | ) |
| (1,729 | ) | |||||
Other, net | (21 | ) |
| (3 | ) |
| (2 | ) |
| - | |
| (26 | ) | |||||
Net cash provided by (used in) financing activities | 563 | |
| (823 | ) |
| (1,142 | ) |
| (1,949 | ) |
| (3,351 | ) | |||||
|
|
|
|
|
|
|
|
|
| ||||||||||
Net increase (decrease) in cash and cash equivalents | - | |
| 1 | |
| (1,522 | ) |
| - | |
| (1,521 | ) | |||||
Cash and cash equivalents at beginning of year | - | |
| - | |
| 1,985 | |
| - | |
| 1,985 | | |||||
Cash and cash equivalents at end of year | $ | - | |
| $ | 1 | |
| $ | 463 | |
| $ | - | |
| $ | 464 | |
196
Table of Contents
CONDENSED CONSOLIDATING STATEMENT OF CASH FLOWS
Year Ended December 31, 2013
| FCX |
| FM O&G LLC |
| Non-guarantor |
|
|
| Consolidated | ||||||||||
| Issuer |
| Guarantor |
| Subsidiaries |
| Eliminations |
| FCX | ||||||||||
Cash flow from operating activities: |
|
|
|
|
|
|
|
|
| ||||||||||
Net income (loss) | $ | 2,658 | |
| $ | 281 | |
| $ | 3,934 | |
| $ | (3,432 | ) |
| $ | 3,441 | |
Adjustments to reconcile net income (loss) to net cash (used in) provided by operating activities: |
|
|
|
|
|
|
|
|
| ||||||||||
Depreciation, depletion and amortization | 4 | |
| 616 | |
| 2,177 | |
| - | |
| 2,797 | | |||||
Net losses on crude oil and natural gas derivative contracts | - | |
| 334 | |
| - | |
| - | |
| 334 | | |||||
Gain on investment in MMR | (128 | ) |
| - | |
| - | |
| - | |
| (128 | ) | |||||
Equity in (earnings) losses of consolidated subsidiaries | (2,886 | ) |
| (281 | ) |
| (265 | ) |
| 3,432 | |
| - | | |||||
Other, net | 8 | |
| (14 | ) |
| 78 | |
| - | |
| 72 | | |||||
Decreases (increases) in working capital and changes in other tax payments, excluding amounts from acquisitions and dispositions | 272 | |
| 735 | |
| (1,384 | ) |
| - | |
| (377 | ) | |||||
Net cash (used in) provided by operating activities | (72 | ) |
| 1,671 | |
| 4,540 | |
| - | |
| 6,139 | | |||||
|
|
|
|
|
|
|
|
|
| ||||||||||
Cash flow from investing activities: |
|
|
|
|
|
|
|
|
| ||||||||||
Capital expenditures | - | |
| (894 | ) |
| (4,392 | ) |
| - | |
| (5,286 | ) | |||||
Acquisitions, net of cash acquired | (5,437 | ) |
| - | |
| (4 | ) |
| - | |
| (5,441 | ) | |||||
Intercompany loans | 834 | |
| - | |
| (162 | ) |
| (672 | ) |
| - | | |||||
Dividend from (investment in) consolidated subsidiary | 629 | |
| - | |
| - | |
| (629 | ) |
| - | | |||||
Other, net | 15 | |
| 30 | |
| (226 | ) |
| - | |
| (181 | ) | |||||
Net cash used in investing activities | (3,959 | ) |
| (864 | ) |
| (4,784 | ) |
| (1,301 | ) |
| (10,908 | ) | |||||
|
|
|
|
|
|
|
|
|
| ||||||||||
Cash flow from financing activities: |
|
|
|
|
|
|
|
|
| ||||||||||
Proceeds from debt | 11,260 | |
| - | |
| 241 | |
| - | |
| 11,501 | | |||||
Repayments of debt and redemption of MMR preferred stock | (4,737 | ) |
| (416 | ) |
| (551 | ) |
| - | |
| (5,704 | ) | |||||
Intercompany loans | - | |
| (391 | ) |
| (281 | ) |
| 672 | |
| - | | |||||
Cash dividends and distributions paid | (2,281 | ) |
| - | |
| (885 | ) |
| 629 | |
| (2,537 | ) | |||||
Other, net | (211 | ) |
| - | |
| - | |
| - | |
| (211 | ) | |||||
Net cash provided by (used in) financing activities | 4,031 | |
| (807 | ) |
| (1,476 | ) |
| 1,301 | |
| 3,049 | | |||||
|
|
|
|
|
|
|
|
|
| ||||||||||
Net decrease in cash and cash equivalents | - | |
| - | |
| (1,720 | ) |
| - | |
| (1,720 | ) | |||||
Cash and cash equivalents at beginning of year | - | |
| - | |
| 3,705 | |
| - | |
| 3,705 | | |||||
Cash and cash equivalents at end of year | $ | - | |
| $ | - | |
| $ | 1,985 | |
| $ | - | |
| $ | 1,985 | |
NOTE 18. SUBSEQUENT EVENTS
In February 2015, FCX's revolving credit facility and Term Loan were modified to amend the maximum total leverage ratio. In addition, the Term Loan amortization schedule was extended such that, as amended, the Term Loan's scheduled payments total $225 million in 2016, $269 million in 2017, $1.1 billion in 2018, $299 million in 2019 and $1.2 billion in 2020, compared with $650 million in 2016, $200 million in 2017 and $2.2 billion in 2018.
FCX evaluated events after December 31, 2014 , and through the date the financial statements were issued, and determined any events or transactions occurring during this period that would require recognition or disclosure are appropriately addressed in these financial statements.
197
Table of Contents
NOTE 19. QUARTERLY FINANCIAL INFORMATION (UNAUDITED)
| First Quarter |
| Second Quarter |
| Third Quarter |
| Fourth Quarter |
| Year |
| ||||||||||
2014 |
|
|
|
|
|
|
|
|
|
| ||||||||||
Revenues | $ | 4,985 | | a | $ | 5,522 | | a | $ | 5,696 | | a | $ | 5,235 | | a | $ | 21,438 | | a |
Operating income (loss) | 1,111 | |
| 1,153 | |
| 1,132 | | b,c | (3,299 | ) | b,c | 97 | | b,c | |||||
Net income (loss) | 626 | |
| 660 | | d,e | 704 | | d,e | (2,735 | ) | d,e | (745 | ) | d,e | |||||
Net income and preferred dividends |
|
|
|
|
|
|
|
|
|
| ||||||||||
attributable to noncontrolling interests | 116 | |
| 178 | |
| 152 | |
| 117 | |
| 563 | |
| |||||
Net income (loss) attributable to FCX |
|
|
|
|
|
|
|
|
|
| ||||||||||
common stockholders | 510 | | a | 482 | | a,d,e | 552 | | a,b,c,d,e | (2,852 | ) | a,b,c,d,e | (1,308 | ) | a,b,c,d,e | |||||
Basic net income (loss) per share |
|
|
|
|
|
|
|
|
|
| ||||||||||
attributable to FCX common stockholders | 0.49 | |
| 0.46 | |
| 0.53 | |
| (2.75 | ) |
| (1.26 | ) |
| |||||
Diluted net income (loss) per share |
|
|
|
|
|
|
|
|
|
| ||||||||||
attributable to FCX common stockholders | 0.49 | | a | 0.46 | | a,d,e | 0.53 | | a,b,c,d,e | (2.75 | ) | a,b,c,d,e | (1.26 | ) | a,b,c,d,e | |||||
|
|
|
|
|
|
|
|
|
|
| ||||||||||
2013 |
|
|
|
|
|
|
|
|
|
| ||||||||||
Revenues | $ | 4,583 | |
| $ | 4,288 | | f | $ | 6,165 | | f | $ | 5,885 | | f | $ | 20,921 | | f |
Operating income | 1,355 | | g | 639 | | g | 1,707 | | g | 1,650 | | g,h | 5,351 | | g,h | |||||
Net income | 824 | |
| 610 | | i | 1,048 | |
| 959 | | i | 3,441 | | i | |||||
Net income and preferred dividends |
|
|
|
|
|
|
|
|
|
| ||||||||||
attributable to noncontrolling interests | 176 | |
| 128 | |
| 227 | |
| 252 | |
| 783 | |
| |||||
Net income attributable to FCX common |
|
|
|
|
|
|
|
|
|
| ||||||||||
stockholders | 648 | | g,j | 482 | | f,g,i,j,k | 821 | | f,g | 707 | | f,g,h,i,j | 2,658 | | f,g,h,i,j,k | |||||
Basic net income per share attributable |
|
|
|
|
|
|
|
|
|
| ||||||||||
to FCX common stockholders | 0.68 | |
| 0.49 | |
| 0.79 | |
| 0.68 | |
| 2.65 | |
| |||||
Diluted net income per share attributable |
|
|
|
|
|
|
|
|
|
| ||||||||||
to FCX common stockholders | 0.68 | | g,j | 0.49 | | f,g,i,j,k | 0.79 | | f,g | 0.68 | | f,g,h,i,j | 2.64 | | f,g,h,i,j,k | |||||
a. | Includes credits (charges) of $15 million ( $9 million to net income attributable to common stockholders or $0.01 per share) in the first quarter, $(7) million ( $(4) million to net income attributable to common stockholders) in the second quarter, $122 million ( $76 million to net income attributable to common stockholders or $0.07 per share) in the third quarter, $497 million ( $309 million to net loss attributable to common stockholders or $0.30 per share) in the fourth quarter and $627 million ( $389 million to net loss attributable to common stockholders or $0.37 per share) for the year for net unrealized and noncash realized gains (losses) on crude oil and natural gas derivative contracts. |
b. | Includes a charge of $308 million ( $192 million to net income attributable to common stockholders or $0.18 per share) in the third quarter, $3.4 billion ( $2.1 billion to net loss attributable to common stockholders or $2.05 per share) in the fourth quarter and $3.7 billion ( $2.3 billion to net loss attributable to common stockholders or $2.24 per share) for the year to reduce the carrying value of oil and gas properties pursuant to full cost accounting rules. Additionally, the fourth quarter and the year includes a goodwill impairment charge of $1.7 billion ( $1.65 per share) for the full carrying value of goodwill. |
c. | Includes net gains of $46 million ( $31 million to net income attributable to common stockholders or $0.03 per share) in third quarter, $671 million ( $450 million to net loss attributable to common stockholders or $0.43 per share) in the fourth quarter and $717 million ( $481 million to net loss attributable to common stockholders or $0.46 per share) for the year primarily from the sale of the Candelaria and Ojos del Salado copper mining operations in the fourth quarter (refer to Note 2 for further discussion) and the sale of a metals injection molding plant in the third quarter. |
d. | Includes a tax charge of $57 million ( $0.06 per share) in the second quarter, $5 million in the third quarter, $22 million ( $0.02 per share) in the fourth quarter and $84 million ( $0.08 per share) for the year associated with deferred taxes recorded in connection with the allocation of goodwill to the sale of the Eagle Ford properties. Additionally, includes a net tax charge (benefit) of $54 million ( $7 million attributable to noncontrolling interests and $47 million to net income attributable to common stockholders or $0.04 per share) in the third quarter, $(17) million ( $11 million attributable to noncontrolling interests and $(28) million to net loss attributable to common stockholders or $(0.03) per share) in the fourth quarter and $37 million ( $18 million attributable to noncontrolling interests and $19 million to net loss attributable to common stockholders or $0.02 per share) for the year associated with changes in Chilean tax rules, U.S. federal income tax regulations and Peruvian tax rules, partially offset by a tax benefit related to changes in U.S. state income tax filing positions. |
e. | Includes net gains (losses) on early extinguishment of debt totaling $4 million in the second quarter, $17 million ( $0.02 per share) in the third quarter, $(18) million ($ (0.02) per share) in the fourth quarter and $3 million for the year. Refer to Note 8 for further discussion. |
f. | Includes charges of $36 million ( $23 million to net income attributable to common stockholders or $0.02 per share) in the second quarter, $158 million ( $98 million to net income attributable to common stockholders or $0.09 per share) in the third quarter, $118 million ( $73 million to net income attributable to common stockholders or $0.07 per share) in the fourth quarter and $312 million ( $194 million to net income attributable to common stockholders or $0.19 per share) for the year (reflecting the seven-month period from June 1, 2013, to December 31, 2013) for unrealized and noncash realized losses on crude oil and natural gas derivative contracts. |
198
Table of Contents
g. | Includes charges of $14 million ( $10 million to net income attributable to common stockholders or $0.01 per share) in the first quarter, $61 million ( $36 million to net income attributable to common stockholders or $0.04 per share) in the second quarter, $1 million ( $1 million to net income attributable to common stockholders) in the third quarter, $4 million ( $3 million to net income attributable to common stockholders) in the fourth quarter and $80 million ( $50 million to net income attributable to common stockholders or $0.05 per share) for the year for transaction and related costs principally associated with the acquisitions of PXP and MMR. |
h. | Includes charges in the fourth quarter and for the year of (i) $76 million ( $49 million to net income attributable to common stockholders or $0.05 per share) associated with updated mine plans at Morenci that resulted in a loss in recoverable copper in leach stockpiles, (ii) $37 million ( $23 million to net income attributable to common stockholders or $0.02 per share) associated with the restructuring of an executive employment arrangement and (iii) $36 million ( $13 million to net income attributable to common stockholders or $0.01 per share) associated with a new labor agreement at Cerro Verde. |
i. | Includes a net tax benefit of $183 million ( $0.19 per share) in the second quarter, $16 million ( $0.01 per share) in the fourth quarter and $199 million ( $0.20 per share) for the year associated with net reductions in FCX's deferred tax liabilities and deferred tax asset valuation allowances related to the acquisitions of PXP and MMR. |
j. | Includes net (losses) gains on early extinguishment of debt totaling $(40) million ( $(0.04) per share) in the first quarter, $5 million ( $0.01 per share) in the second quarter for an adjustment related to taxes on the first quarter losses, $7 million ( $0.01 per share) in the fourth quarter and $(28) million ( $(0.03) per share) for the year. Refer to Note 8 for further discussion. |
k. | Includes a gain of $128 million ( $0.13 per share) in the second quarter and for the year related to FCX's preferred stock investment in and the subsequent acquisition of MMR. Refer to Note 2 for further discussion. |
NOTE 20. SUPPLEMENTARY MINERAL RESERVE INFORMATION (UNAUDITED)
Recoverable proven and probable reserves have been calculated as of December 31, 2014 , in accordance with Industry Guide 7 as required by the Securities Exchange Act of 1934. FCX's proven and probable reserves may not be comparable to similar information regarding mineral reserves disclosed in accordance with the guidance in other countries. Proven and probable reserves were determined by the use of mapping, drilling, sampling, assaying and evaluation methods generally applied in the mining industry, as more fully discussed below. The term "reserve," as used in the reserve data presented here, means that part of a mineral deposit that can be economically and legally extracted or produced at the time of the reserve determination. The term "proven reserves" means reserves for which (i) quantity is computed from dimensions revealed in outcrops, trenches, workings or drill holes; (ii) grade and/or quality are computed from the results of detailed sampling; and (iii) the sites for inspection, sampling and measurements are spaced so closely and the geologic character is sufficiently defined that size, shape, depth and mineral content of reserves are well established. The term "probable reserves" means reserves for which quantity and grade are computed from information similar to that used for proven reserves but the sites for sampling are farther apart or are otherwise less adequately spaced. The degree of assurance, although lower than that for proven reserves, is high enough to assume continuity between points of observation.
FCX's reserve estimates are based on the latest available geological and geotechnical studies. FCX conducts ongoing studies of its ore bodies to optimize economic values and to manage risk. FCX revises its mine plans and estimates of proven and probable mineral reserves as required in accordance with the latest available studies.
Estimated recoverable proven and probable reserves at December 31, 2014 , were determined using long-term average prices of $2.00 per pound for copper (consistent with the long-term average copper price used since December 31, 2010), $1,000 per ounce for gold and $10 per pound for molybdenum. For the three-year period ended December 31, 2014 , LME spot copper prices averaged $3.35 per pound, London PM gold prices averaged $1,449 per ounce and the weekly average price for molybdenum quoted by Metals Week averaged $11.50 per pound.
The recoverable proven and probable reserves presented in the table below represent the estimated metal quantities from which FCX expects to be paid after application of estimated metallurgical recovery rates and smelter recovery rates, where applicable. Recoverable reserves are that part of a mineral deposit that FCX estimates can be economically and legally extracted or produced at the time of the reserve determination.
199
Table of Contents
| Recoverable Proven and Probable Mineral Reserves | |||||||
| Estimated at December 31, 2014 | |||||||
| Copper a (billion pounds) |
| Gold (million ounces) |
| Molybdenum (billion pounds) | |||
North America | 35.6 | |
| 0.3 | |
| 2.42 | |
South America | 31.8 | |
| - | |
| 0.69 | |
Indonesia | 29.0 | |
| 28.2 | |
| - | |
Africa | 7.1 | |
| - | |
| - | |
Consolidated b | 103.5 | |
| 28.5 | |
| 3.11 | |
|
|
|
|
|
| |||
Net equity interest c | 82.8 | |
| 25.9 | |
| 2.79 | |
a. | Consolidated recoverable copper reserves included 3.6 billion pounds in leach stockpiles and 0.9 billion pounds in mill stockpiles. |
b. | Consolidated reserves represent estimated metal quantities after reduction for joint venture partner interests at the Morenci mine in North America and the Grasberg minerals district in Indonesia. Excluded from the table above were FCX's estimated recoverable proven and probable reserves of 0.85 billion pounds of cobalt at Tenke and 282.9 million ounces of silver in Indonesia, South America and North America, which were determined using long-term average prices of $10 per pound for cobalt and $15 per ounce for silver. |
c. | Net equity interest reserves represent estimated consolidated metal quantities further reduced for noncontrolling interest ownership. Excluded from the table above were FCX's estimated recoverable proven and probable reserves of 0.47 billion pounds of cobalt at Tenke and 232.4 million ounces of silver in Indonesia, South America and North America. |
200
Table of Contents
|
| Recoverable Proven and Probable Mineral Reserves | |||||||||||||||||
|
| Estimated at December 31, 2014 | |||||||||||||||||
|
|
|
| Average Ore Grade Per Metric Ton a |
| Recoverable Proven and Probable Reserves b | |||||||||||||
|
| Ore a (million metric tons) |
| Copper (%) |
| Gold (grams) |
| Molybdenum (%) |
| Copper (billion pounds) |
| Gold (million ounces) |
| Molybdenum (billion pounds) | |||||
North America |
|
|
|
|
|
|
|
|
|
|
|
|
|
| |||||
Developed and producing: |
|
|
|
|
|
|
|
|
|
|
|
| |||||||
Morenci |
| 3,923 | |
| 0.27 |
| - | |
| - | c | 15.1 | |
| - | |
| 0.17 | |
Bagdad |
| 1,334 | |
| 0.32 |
| - | | c | 0.02 |
| 7.8 | |
| 0.1 | |
| 0.38 | |
Safford |
| 122 | |
| 0.47 |
| - | |
| - |
| 1.1 | |
| - | |
| - | |
Sierrita |
| 2,464 | |
| 0.23 |
| - | | c | 0.02 |
| 10.8 | |
| 0.1 | |
| 1.01 | |
Miami |
| 3 | |
| 0.58 |
| - | |
| - |
| 0.1 | |
| - | |
| - | |
Chino |
| 301 | |
| 0.39 |
| 0.02 | |
| - | c | 2.2 | |
| 0.1 | |
| 0.01 | |
Tyrone |
| 59 | |
| 0.32 |
| - | |
| - |
| 0.4 | |
| - | |
| - | |
Henderson |
| 90 | |
| - |
| - | |
| 0.17 |
| - | |
| - | |
| 0.28 | |
Climax |
| 185 | |
| - |
| - | |
| 0.16 |
| - | |
| - | |
| 0.59 | |
Undeveloped: |
|
|
|
|
|
|
|
|
|
|
|
|
|
| |||||
Cobre |
| 71 | |
| 0.37 |
| - | |
| - |
| 0.3 | |
| - | |
| - | |
South America |
|
|
|
|
|
|
|
|
|
|
|
|
|
| |||||
Developed and producing: |
|
|
|
|
|
|
|
|
|
|
|
| |||||||
Cerro Verde |
| 3,953 | |
| 0.37 |
| - | |
| 0.01 |
| 28.9 | |
| - | |
| 0.69 | |
El Abra |
| 444 | |
| 0.46 |
| - | |
| - |
| 2.9 | |
| - | |
| - | |
Indonesia |
|
|
|
|
|
|
|
|
|
|
|
|
|
| |||||
Developed and producing: |
|
|
|
|
|
|
|
|
|
|
|
| |||||||
Grasberg open pit |
| 179 | |
| 0.96 |
| 1.06 | |
| - |
| 3.2 | |
| 4.9 | |
| - | |
Deep Ore Zone |
| 146 | |
| 0.54 |
| 0.69 | |
| - |
| 1.5 | |
| 2.5 | |
| - | |
Big Gossan |
| 54 | |
| 2.26 |
| 0.99 | |
| - |
| 2.4 | |
| 1.1 | |
| - | |
Undeveloped: |
|
|
|
|
|
|
|
|
|
|
|
|
|
| |||||
Grasberg Block Cave |
| 1,012 | |
| 1.00 |
| 0.77 | |
| - |
| 18.9 | |
| 16.3 | |
| - | |
Kucing Liar |
| 406 | |
| 1.25 |
| 1.07 | |
| - |
| 9.5 | |
| 6.3 | |
| - | |
Deep Mill Level Zone |
| 472 | |
| 0.87 |
| 0.71 | |
| - |
| 7.9 | |
| 8.6 | |
| - | |
Africa |
|
|
|
|
|
|
|
|
|
|
|
|
|
| |||||
Developed and producing: |
|
|
|
|
|
|
|
|
|
|
|
| |||||||
Tenke Fungurume |
| 98 | |
| 3.27 |
| - | |
| - |
| 7.1 | |
| - | |
| - | |
Total 100% basis |
| 15,316 | |
|
|
|
|
|
|
| 120.1 | |
| 40.0 | |
| 3.13 | | |
Consolidated d |
|
|
|
|
|
|
|
|
| 103.5 | |
| 28.5 | |
| 3.11 | | ||
FCX's equity share e |
|
|
|
|
|
|
|
|
| 82.8 | |
| 25.9 | |
| 2.79 | | ||
a. | Excludes material contained in stockpiles. |
b. | Includes estimated recoverable metals contained in stockpiles. |
c. | Amounts not shown because of rounding. |
d. | Consolidated reserves represent estimated metal quantities after reduction for joint venture partner interests at the Morenci mine in North America and the Grasberg minerals district in Indonesia. |
e. | Net equity interest reserves represent estimated consolidated metal quantities further reduced for noncontrolling interest ownership. |
201
Table of Contents
NOTE 21. SUPPLEMENTARY OIL AND GAS INFORMATION (UNAUDITED)
Costs Incurred. A summary of the costs incurred for FCX's oil and gas acquisition, exploration and development activities for the years ended December 31 follows:
| 2014 |
| 2013 a |
| ||||
Property acquisition costs: |
|
|
|
| ||||
Proved properties | $ | 463 | |
| $ | 12,205 | | b |
Unproved properties | 1,460 | |
| 11,259 | | c | ||
Exploration costs | 1,482 | |
| 502 | |
| ||
Development costs | 1,270 | |
| 854 | |
| ||
| $ | 4,675 | |
| $ | 24,820 | |
|
a. | Includes the results of FM O&G beginning June 1, 2013. |
b. | Includes $12.2 billion from the acquisitions of PXP and MMR. |
c. | Includes $11.1 billion from the acquisitions of PXP and MMR. |
These amounts included changes in AROs of $(27) million in 2014 and $1.1 billion in 2013 (including $1.0 billion assumed in the acquisitions of PXP and MMR), capitalized general and administrative expenses of $143 million in 2014 and $67 million in 2013, and capitalized interest of $88 million in 2014 and $69 million in 2013.
Capitalized Costs. The aggregate capitalized costs subject to amortization for oil and gas properties and the aggregate related accumulated amortization as of December 31 follow:
| 2014 |
| 2013 |
| ||||
Properties subject to amortization | $ | 16,547 | |
| $ | 13,829 | |
|
Accumulated amortization | (7,360 | ) | a | (1,357 | ) |
| ||
| $ | 9,187 | |
| $ | 12,472 | |
|
a. | Includes charges of $3.7 billion to reduce the carrying value of oil and gas properties pursuant to full cost accounting rules. |
The average amortization rate per barrel of oil equivalents (BOE) was $39.74 in 2014 and $35.54 for the period from June 1, 2013, to December 31, 2013.
Costs Not Subject to Amortization. A summary of the categories of costs comprising the amount of unproved properties not subject to amortization by the year in which such costs were incurred follows:
|
| December 31, | ||||||||||
|
| Total |
| 2014 |
| 2013 | ||||||
U.S.: |
|
|
|
|
|
| ||||||
Onshore |
|
|
|
|
|
| ||||||
Acquisition costs |
| $ | 2,303 | |
| $ | 18 | |
| $ | 2,285 | |
Exploration costs |
| 121 | |
| 119 | |
| 2 | | |||
Capitalized interest |
| 27 | |
| 22 | |
| 5 | | |||
Offshore |
|
|
|
|
|
| ||||||
Acquisition costs |
| 7,094 | |
| 1,413 | |
| 5,681 | | |||
Exploration costs |
| 429 | |
| 387 | |
| 42 | | |||
Capitalized interest |
| 75 | |
| 39 | |
| 36 | | |||
International: |
|
|
|
|
|
| ||||||
Offshore |
|
|
|
|
|
| ||||||
Acquisition costs |
| 15 | |
| - | |
| 15 | | |||
Exploration costs |
| 23 | |
| 23 | |
| - | | |||
Capitalized interest |
| - | |
| - | |
| - | | |||
|
| $ | 10,087 | |
| $ | 2,021 | |
| $ | 8,066 | |
FCX expects that 48 percent of the costs not subject to amortization at December 31, 2014 , will be transferred to the amortization base over the next five years and the majority of the remainder in the next seven to ten years.
202
Table of Contents
Approximately 35 percent of the total U.S. net undeveloped acres is covered by leases that expire from 2015 to 2017 . As a result of the decrease in crude oil prices, FCX's current plans anticipate that the majority of the expiring acreage will not be retained by drilling operations or other means. The exploration permits covering FM O&G's Morocco acreage expire in 2016 ; however, FM O&G has the ability to extend the exploration permits through 2019 . Over 95 percent of the acreage in the Haynesville shale play in Louisiana is currently held by production or held by operations, and future plans include drilling or otherwise extending leases on the remaining acreage.
Results of Operations for Oil and Gas Producing Activities. The results of operations from oil and gas producing activities for the year ended December 31, 2014 , and the period from June 1, 2013, to December 31, 2013 , presented below exclude non-oil and gas revenues, general and administrative expenses, goodwill impairment, interest expense and interest income. Income tax benefit (expense) was determined by applying the statutory rates to pre-tax operating results:
| Year Ended |
| June 1, 2013 to | ||||
| December 31, 2014 |
| December 31, 2013 | ||||
Revenues from oil and gas producing activities | $ | 4,710 | |
| $ | 2,616 | |
Production and delivery costs | (1,237 | ) |
| (682 | ) | ||
Depreciation, depletion and amortization | (2,265 | ) |
| (1,358 | ) | ||
Impairment of oil and gas properties | (3,737 | ) |
| - | | ||
Income tax benefit (expense) (based on FCX's statutory tax rate) | 958 | |
| (219 | ) | ||
Results of operations from oil and gas producing activities | $ | (1,571 | ) |
| $ | 357 | |
Proved Oil and Natural Gas Reserve Information. The following information summarizes the net proved reserves of oil (including condensate and natural gas liquids (NGLs)) and natural gas and the standardized measure as described below. All of the oil and natural gas reserves are located in the U.S.
Management believes the reserve estimates presented herein, in accordance with generally accepted engineering and evaluation principles consistently applied, are reasonable. However, there are numerous uncertainties inherent in estimating quantities and values of proved reserves and in projecting future rates of production and the amount and timing of development expenditures, including many factors beyond FCX's control. Reserve engineering is a subjective process of estimating the recovery from underground accumulations of oil and natural gas that cannot be measured in an exact manner, and the accuracy of any reserve estimate is a function of the quality of available data and of engineering and geological interpretation and judgment. Because all oil and natural gas reserve estimates are to some degree subjective, the quantities of oil and natural gas that are ultimately recovered, production and operating costs, the amount and timing of future development expenditures and future crude oil and natural gas sales prices may all differ from those assumed in these estimates. In addition, different reserve engineers may make different estimates of reserve quantities and cash flows based upon the same available data. Therefore, the standardized measure of discounted future net cash flows (Standardized Measure) shown below represents estimates only and should not be construed as the current market value of the estimated reserves attributable to FCX's oil and gas properties. In this regard, the information set forth in the following tables includes revisions of reserve estimates attributable to proved properties acquired from PXP and MMR, and reflect additional information from subsequent development activities, production history of the properties involved and any adjustments in the projected economic life of such properties resulting from changes in product prices.
Decreases in the prices of crude oil and natural gas could have an adverse effect on the carrying value of the proved reserves, reserve volumes and FCX's revenues, profitability and cash flows. FCX's reference prices for reserve determination are the WTI spot price for crude oil and the Henry Hub spot price for natural gas. As of February 20, 2015 , the twelve-month average of the first-day-of-the-month historical reference price for natural gas has decreased from $4.35 per MMBtu at December 31, 2014 , to $4.04 per MMBtu, while the comparable price for crude oil has decreased from $94.99 per barrel at December 31, 2014 , to $87.12 per barrel.
Historically, the market price for California crude oil differs from the established market indices in the U.S. primarily because of the higher transportation and refining costs associated with heavy oil. In recent years, California market prices had strengthened substantially against these indices, primarily due to increasing world demand and declining domestic supplies of both Alaskan and California crude oil. This trend has reversed of late, however, because of increasing production from U.S. shale plays and other non-OPEC countries, low refinery utilization and high West Coast inventory levels. Approximately 39 percent of FCX's oil and natural gas reserve volumes are attributable to properties in California where differentials to the reference prices have been volatile as a result of these factors.
203
Table of Contents
The market price for GOM crude oil differs from WTI as a result of a large portion of FCX's production being sold under a Heavy Louisiana Sweet based pricing. Approximately 35 percent of FCX's December 31, 2014 , oil and natural gas reserve volumes are attributable to properties in the GOM where oil price realizations are generally higher because of these marketing contracts.
|
| Oil |
| Gas |
| Total | |||
|
| (MMBbls) a,b |
| (Bcf) a |
| (MMBOE) a | |||
2014 |
|
|
|
|
|
| |||
Proved reserves: |
|
|
|
|
|
| |||
Balance at beginning of year |
| 370 | |
| 562 | |
| 464 | |
Extensions and discoveries |
| 10 | |
| 35 | |
| 16 | |
Acquisitions of reserves in-place |
| 14 | |
| 9 | |
| 16 | |
Revisions of previous estimates |
| (10 | ) |
| 140 | |
| 13 | |
Sale of reserves in-place |
| (53 | ) |
| (54 | ) |
| (62 | ) |
Production |
| (43 | ) |
| (82 | ) |
| (57 | ) |
Balance at end of year |
| 288 | |
| 610 | |
| 390 | |
|
|
|
|
|
|
| |||
Proved developed reserves at December 31, 2014 |
| 184 | |
| 369 | |
| 246 | |
|
|
|
|
|
|
| |||
Proved undeveloped reserves at December 31, 2014 |
| 104 | |
| 241 | |
| 144 | |
2013 |
|
|
|
|
|
| |||
Proved reserves: |
|
|
|
|
|
| |||
Balance at beginning of year |
| - | |
| - | |
| - | |
Acquisitions of PXP and MMR |
| 368 | |
| 626 | |
| 472 | |
Extensions and discoveries |
| 20 | |
| 20 | |
| 24 | |
Revisions of previous estimates |
| 11 | |
| (26 | ) |
| 7 | |
Sale of reserves in-place |
| - | |
| (3 | ) |
| (1 | ) |
Production |
| (29 | ) |
| (55 | ) |
| (38 | ) |
Balance at end of year |
| 370 | |
| 562 | |
| 464 | |
|
|
|
|
|
|
| |||
Proved developed reserves at December 31, 2013 |
| 236 | |
| 423 | |
| 307 | |
|
|
|
|
|
|
| |||
Proved undeveloped reserves at December 31, 2013 |
| 134 | |
| 139 | |
| 157 | |
a. | MMBbls = million barrels; Bcf = billion cubic feet; MMBOE = million BOE |
b. | Includes 10 MMBbls of NGL proved reserves ( 7 MMBbls of developed and 3 MMBbls of undeveloped) at December 31, 2014 , and 20 MMBbls of NGL proved reserves ( 14 MMBbls of developed and 6 MMBbls of undeveloped) at December 31, 2013. |
For the year ended December 31, 2014 , FCX had a total of 16 MMBOE of extensions and discoveries, including 8 MMBOE in the Deepwater GOM, primarily associated with the continued successful development at Horn Mountain and 5 MMBOE in the Haynesville shale play resulting from continued successful drilling that extended and developed FCX's proved acreage. From June 1, 2013, to December 31, 2013, FCX had a total of 24 MMBOE of extensions and discoveries, including 16 MMBOE in the Eagle Ford shale play resulting from continued successful drilling that extended and developed FCX's proved acreage and 5 MMBOE in the Deepwater GOM, primarily associated with the previously drilled Holstein Deep development acquired during 2013.
For the year ended December 31, 2014 , FCX had net positive revisions of 13 MMBOE primarily related to improved gas price realizations in both the Haynesville shale play and Madden field, as well as continued improved performance in the Eagle Ford shale play prior to the disposition, partially offset by the downward revisions of certain proved undeveloped reserves resulting from deferred development plans, as well as lower oil price realizations and higher steam-related operating expenses resulting from higher natural gas prices in certain FCX onshore California properties. From June 1, 2013, to December 31, 2013, FCX had net positive revisions of 7 MMBOE primarily related to improved performance at certain FCX onshore California and Deepwater GOM properties, partially offset by performance reductions primarily related to certain other FCX Deepwater GOM properties and the Haynesville shale play.
204
Table of Contents
For the year ended December 31, 2014 , FCX acquired reserves in-place totaling 16 MMBOE from the acquisition of interests in the Deepwater GOM, including interests in the Lucius and Heidelberg oil fields.
For the year ended December 31, 2014 , FCX sold reserves in-place totaling 62 MMBOE primarily related to its Eagle Ford properties. From June 1, 2013, to December 31, 2013, FCX sold reserves in-place totaling 1 MMBOE related to its Panhandle properties.
Standardized Measure. The Standardized Measure (discounted at 10 percent ) from production of proved oil and natural gas reserves has been developed as of December 31, 2014 , in accordance with SEC guidelines. FCX estimated the quantity of proved oil and natural gas reserves and the future periods in which they are expected to be produced based on year-end economic conditions. Estimates of future net revenues from FCX's proved oil and gas properties and the present value thereof were made using the twelve-month average of the first-day-of-the-month historical reference prices as adjusted for location and quality differentials, which are held constant throughout the life of the oil and gas properties, except where such guidelines permit alternate treatment, including the use of fixed and determinable contractual price escalations (excluding the impact of crude oil derivative contracts). Future gross revenues were reduced by estimated future operating costs (including production and ad valorem taxes) and future development and abandonment costs, all of which were based on current costs in effect at December 31, 2014 , and held constant throughout the life of the oil and gas properties. Future income taxes were calculated by applying the statutory federal and state income tax rate to pre-tax future net cash flows, net of the tax basis of the respective oil and gas properties and utilization of FCX's available tax carryforwards related to its oil and gas operations.
Excluding the impact of crude oil derivative contracts, the average realized sales prices used in FCX's reserve reports as of December 31, 2014 , were $93.20 per barrel of crude oil and $4.35 per one thousand cubic feet (Mcf) of natural gas.
The Standardized Measure related to proved oil and natural gas reserves as of December 31 follows:
| 2014 |
| 2013 | ||||
Future cash inflows | $ | 29,504 | |
| $ | 38,901 | |
Future production expense | (10,991 | ) |
| (12,774 | ) | ||
Future development costs a | (6,448 | ) |
| (6,480 | ) | ||
Future income tax expense | (2,487 | ) |
| (4,935 | ) | ||
Future net cash flows | 9,578 | |
| 14,712 | | ||
Discounted at 10% per year | (3,157 | ) |
| (5,295 | ) | ||
Standardized Measure | $ | 6,421 | |
| $ | 9,417 | |
a. | Includes estimated asset retirement costs of $1.8 billion at December 31, 2014 and 2013. |
A summary of the principal sources of changes in the Standardized Measure for the years ended December 31 follows:
|
| 2014 |
| 2013 a | ||||
Balance at beginning of year |
| $ | 9,417 | |
| $ | - | |
Changes during the year: |
|
|
|
| ||||
Reserves acquired in the acquisitions of PXP and MMR |
| - | |
| 14,467 | | ||
Sales, net of production expenses |
| (3,062 | ) |
| (2,296 | ) | ||
Net changes in sales and transfer prices, net of production expenses |
| (2,875 | ) |
| (459 | ) | ||
Extensions, discoveries and improved recoveries |
| 194 | |
| 752 | | ||
Changes in estimated future development costs |
| (498 | ) |
| (1,190 | ) | ||
Previously estimated development costs incurred during the year |
| 982 | |
| 578 | | ||
Sales of reserves in-place |
| (1,323 | ) |
| (12 | ) | ||
Other purchases of reserves in-place |
| 487 | |
| - | | ||
Revisions of quantity estimates |
| 399 | |
| 102 | | ||
Accretion of discount |
| 1,195 | |
| 701 | | ||
Net change in income taxes |
| 1,505 | |
| (3,226 | ) | ||
Total changes |
| (2,996 | ) |
| 9,417 | | ||
Balance at end of year |
| $ | 6,421 | |
| $ | 9,417 | |
a. | Includes the results of FM O&G beginning June 1, 2013. |
205
Table of Contents
Item 9. Changes in and Disagreements with Accountants on Accounting and Financial Disclosure.
Not applicable.
Item 9A. Controls and Procedures.
(a) Evaluation of disclosure controls and procedures . Our chief executive officer and chief financial officer, with the participation of management, have evaluated the effectiveness of our "disclosure controls and procedures" (as defined in Rules 13a-15(e) and 15d-15(e) under the Securities Exchange Act of 1934) as of the end of the period covered by this annual report on Form 10-K. Based on their evaluation, they have concluded that our disclosure controls and procedures are effective as of the end of the period covered by this report.
(b) Changes in internal controls . There has been no change in our internal control over financial reporting that occurred during the quarter ended December 31, 2014, that has materially affected, or is reasonably likely to materially affect, our internal control over financial reporting.
(c) Management's annual report on internal control over financial reporting and the report thereon of Ernst & Young LLP are included herein under Item 8. "Financial Statements and Supplemental Data."
Item 9B. Other Information.
First Amendment to Term Loan
On February 27, 2015, FCX and FM O&G LLC, as borrowers, JPMorgan Chase Bank, N.A., as administrative agent, Bank of America, N.A., as syndication agent, and each of the lenders party thereto entered into the First Amendment to Term Loan Agreement dated as of February 27, 2015 (First Amendment) to the Term Loan Agreement dated as of February 14, 2013, among the borrowers, the administrative agent, the syndication agent, and each of the lenders party thereto.
Pursuant to the First Amendment, the amortization schedule was extended such that, as amended, the Term Loan's scheduled payments total $225 million in 2016, $269 million in 2017, $1.1 billion in 2018, $299 million in 2019 and $1.2 billion in 2020, compared with $650 million in 2016, $200 million in 2017 and $2.2 billion in 2018.
In addition, the maximum total leverage ratio was modified consistent with the revolving credit facility amendment described below.
Second Amendment to Revolving Credit Facility
On February 27, 2015, FCX, PT-FI, and FM O&G LLC, as borrowers, JPMorgan Chase Bank, N.A., as administrative agent, Bank of America, N.A., as syndication agent, and each of the lenders party thereto entered into the Second Amendment to Revolving Credit Agreement dated as of February 27, 2015 (Second Amendment) to the Revolving Credit Agreement dated as of February 14, 2013, as amended by the First Amendment to Revolving Credit Agreement dated as of May 30, 2014, among the borrowers, the administrative agent, the syndication agent, and each of the lenders party thereto.
Pursuant to the Second Amendment, the maximum total leverage ratio (Debt/EBITDA) was modified to 4.75x in 2015 and 2016 (from the previous limit of 3.75x) with a step-down in 2017, reverting back to 3.75x in 2018.
As of February 26, 2015, there were borrowings of $1.1 billion and $44 million of letters of credit issued under the revolving credit facility, resulting in availability of approximately $2.9 billion, of which $1.5 billion could be used for additional letters of credit.
JPMorgan Chase Bank, N.A. and Bank of America, N.A. and their respective affiliates have in the past engaged, and may in the future engage, in transactions with and perform services, including commercial banking, financial advisory and investment banking services, for FCX and its affiliates in the ordinary course of business for which JPMorgan Chase Bank, N.A. and Bank of America, N.A. have received or will receive customary fees and expenses.
For additional information about the Term Loan and the revolving credit facility, refer to Note 8.
206
Table of Contents
PART III
Item 10. Directors, Executive Officers and Corporate Governance.
The information set forth under the captions "Information About Director Nominees" and "Section 16(a) Beneficial Ownership Reporting Compliance" of our definitive proxy statement to be filed with the United States Securities and Exchange Commission (SEC), relating to our 2015 annual meeting of stockholders, is incorporated herein by reference. The information required by Item 10 regarding our executive officers appears in a separately captioned heading after Item 4 in Part I of this report.
Item 11. Executive Compensation.
The information set forth under the captions "Director Compensation" and "Executive Officer Compensation" of our definitive proxy statement to be filed with the SEC, relating to our 2015 annual meeting of stockholders, is incorporated herein by reference.
Item 12. Security Ownership of Certain Beneficial Owners and Management and Related Stockholder Matters.
The information set forth under the captions "Stock Ownership of Directors and Executive Officers" and "Stock Ownership of Certain Beneficial Owners" of our definitive proxy statement to be filed with the SEC, relating to our 2015 annual meeting of stockholders, is incorporated herein by reference.
Item 13. Certain Relationships and Related Transactions, and Director Independence.
The information set forth under the caption "Certain Transactions" of our definitive proxy statement to be filed with the SEC, relating to our 2015 annual meeting of stockholders, is incorporated herein by reference.
Item 14. Principal Accounting Fees and Services.
The information set forth under the caption "Independent Registered Public Accounting Firm" of our definitive proxy statement to be filed with the SEC, relating to our 2015 annual meeting of stockholders, is incorporated herein by reference.
PART IV
Item 15. Exhibits, Financial Statement Schedules.
(a)(1). Financial Statements.
The consolidated statements of operations, comprehensive (loss) income, cash flows and equity, and the consolidated balance sheets are included as part of Item 8. "Financial Statements and Supplementary Data."
(a)(2). Financial Statement Schedules.
Reference is made to the Index to Financial Statements appearing on page F-1 hereof.
(a)(3). Exhibits.
Reference is made to the Exhibit Index beginning on page E-1 hereof.
207
Table of Contents
GLOSSARY OF TERMS
Following is a glossary of selected terms used throughout the FCX Form 10-K that are technical in nature:
Mining
Adits. A horizontal passage leading into a mine for the purposes of access or drainage.
Agitation-leach plant. A processing plant that recovers copper and other metals by passing a slurry of finely ground ores mixed with acidic solutions through a series of continuously stirred tanks.
Alluvial aquifers. A water-bearing deposit of loosely arranged gravel, sand or silt left behind by a river or other flowing water.
Anode. A positively charged metal sheet, usually lead, on which oxidation occurs. During the electro-refining process, the anodes are impure copper sheets from the smelting process that require further processing to produce refined copper cathodes.
Azurite. A bluish supergene copper mineral and ore found in the oxidized portions of copper deposits often associated with malachite.
Bench. The horizontal floor cuttings along which mining progresses in an open-pit mine. As the pit progresses to lower levels, safety benches are left in the walls to catch any falling rock.
Blasthole stoping. An underground mining method that extracts the ore zone in large vertical rooms. The ore is broken by blasting using large-diameter vertical drill holes.
Block cave. A general term used to describe an underground mining method where the extraction of ore depends largely on the action of gravity. By continuously removing a thin horizontal layer at the bottom mining level of the ore column, the vertical support of the ore column is removed and the ore then caves by gravity.
Bornite. A red-brown isometric mineral comprising copper, iron and sulfur.
Brochantite. A greenish-black copper mineral occurring in the oxidation zone of copper sulfide deposits.
Carrollite. A cubic sulfide of cobalt with small amounts of copper, iron and nickel.
Cathode. Refined copper produced by electro-refining of impure copper or by electrowinning.
Chalcocite. A grayish copper sulfide mineral, usually found as a supergene in copper deposits formed from the re-deposition of copper minerals that were solubilized from the oxide portion of the deposit.
Chalcopyrite. A brass-yellow sulfide of mineral copper and iron.
Chrysocolla. A bluish-green to emerald-green oxide copper mineral that forms incrustations and thin seams in oxidized parts of copper-mineral veins; a source of copper and an ornamental stone.
Cobalt. A tough, lustrous, nickel-white or silvery-gray metallic element often associated with nickel and copper ores from which it is obtained as a by-product.
Concentrate. The resulting product from the concentrating process that is composed predominantly of copper sulfide or molybdenum sulfide minerals. Further processing might include smelting and electro-refining, or roasting.
Concentrating. The process by which ore is separated into metal concentrates through crushing, milling and flotation.
Concentrator. A process plant used to separate targeted minerals from gangue and produce a mineral concentrate that can be marketed or processed by additional downstream processes to produce salable metals or mineral products. Term is used interchangeably with Mill.
Contained copper. The percentage of copper in a mineral sample before the reduction of amounts unable to be recovered during the metallurgical process.
208
Table of Contents
Copper sulfate. A solid copper product of blue crystals formed by evaporation and crystallization from a sulfate solution containing copper.
Covellite. A metallic, indigo-blue supergene mineral found in copper deposits.
Crushed-ore leach pad. A slightly sloping pad upon which leach ores are placed in lifts for processing.
Cutoff grade. The minimum percentage of copper contained in the ore for processing. When percentages are below this grade, the material would be routed to a high-lift or waste stockpile. When percentages are above grade, the material would be processed using concentrating or leaching methods for higher recovery.
Disseminations. A mineral deposit in which the desired minerals occur as scattered particles in the rock that has sufficient quantity to be considered an ore deposit.
Electrolytic refining. The purification of metals by electrolysis. A large piece of impure copper is used as the anode with a thin strip of pure copper as the cathode.
Electrowinning. A process that uses electricity to plate copper contained in an electrolyte solution into copper cathode.
Flotation. A concentrating process in which valuable minerals attach themselves to bubbles of an oily froth for separation as concentrate. The gangue material from the flotation process reports as a tailing product.
Grade. The relative quality or percentage of metal content.
Heterogenite. A cobalt mineral containing up to 4 percent copper oxide.
Leach stockpiles. A quantity of leachable ore placed on a leach pad or in another suitable location that permits leaching and collection of solutions that contain solubilized metal.
Leaching. The process of extracting copper using a chemical solution to dissolve copper contained in ore.
Malachite. A bright-green copper mineral (ore) that often occurs with azurite in oxidized zones of copper deposits.
Metric ton. The equivalent of 2,204.62 pounds.
Mill stockpile. Millable ore that has been mined and placed at the concentrator, and is available for future processing.
Mine-for-leach. A mining operation focused on mining only leachable ores.
Mineralization. The process by which a mineral is introduced into a rock, resulting in concentration of minerals that may form a valuable or potentially valuable deposit.
Molybdenite. A black, platy, disulfide of molybdenum. It is the most common ore of molybdenum.
Ore body. A continuous, well-defined mass of mineralized material of sufficient ore content to make extraction economically feasible.
Oxide. In mining, oxide is used as an ore classification relating to material that usually leaches well but does not perform well in a concentrator. Oxide minerals in mining refer to an oxidized form.
Porphyry. A deposit in which minerals of copper, molybdenum, gold or, less commonly, tungsten and tin are disseminated or occur in stock-work of small veinlets within a large mass of hydro-thermally altered igneous rock. The host rock is commonly an intrusive porphyry, but other rocks intruded by a porphyry can also be hosts for ore minerals.
Production level. With respect to underground mining, the elevation of the underground works that permit extraction/transport of the ore to a common point, shaft or plant.
Pseudomalachite. A dark-green monoclinic copper mineral.
209
Table of Contents
Roasting. The heating of sulfide ores to oxidize sulfides to facilitate further processing.
Run-of-Mine (ROM). Leachable ore that is mined and directly placed on a leach pad without utilizing any further processes to reduce particle size prior to leaching.
Skarn. A Swedish mining term for silicate gangue of certain iron ore and sulfide deposits of Archaean age, particularly those that have replaced limestone and dolomite. Its meaning has been generally expanded to include lime-bearing silicates, of any geologic age, derived from nearly pure limestone and dolomite with the introduction of large amounts of silicon, aluminum, iron and magnesium.
Smelting. The process of melting and oxidizing concentrates to separate copper and precious metals from metallic and non-metallic impurities, including iron, silica, alumina and sulfur.
Solution extraction. A process that transfers copper from a copper-bearing ore to an organic solution, then to an electrolyte. The electrolyte is then pumped to a tankhouse where the copper is extracted, using electricity, into a copper cathode (refer to the term Electrowinning), together referred to solution extraction/electrowinning (SX/EW).
Spot price. The current price at which a commodity can be bought or sold at a specified time and place.
Stope. An underground mining method that is usually applied to highly inclined or vertical veins. Ore is extracted by driving horizontally upon it in a series of workings, one immediately over the other. Each horizontal working is called a stope because when a number of them are in progress, each working face under attack assumes the shape of a flight of stairs.
Sulfide. A mineral compound containing sulfur and a metal. Copper sulfides can be concentrated or leached, depending on the mineral type.
Tailing. The material remaining after economically recoverable metals and minerals have been extracted.
Tolling. The process of converting customer-owned material into specified products, which is then returned to the customer.
Oil and Gas
3-D seismic data. Seismic data which has been digitally recorded, processed and analyzed in a manner that permits three-dimensional displays of geologic structures.
API gravity. A system of classifying oil based on its specific gravity, whereby the greater the gravity, the lighter the oil.
Barrel or Bbl . One stock tank barrel, or 42 U.S. gallons liquid volume (used in reference to crude oil or other liquid hydrocarbons).
Block . A block depicted on the Outer Continental Shelf Leasing and Official Protraction Diagrams issued by BOEM or a similar depiction on official protraction or similar diagrams issued by a state bordering on the Gulf of Mexico.
Blowouts. Accidents resulting from loss of hydraulic well control while conducting drilling operations.
Barrel of Oil Equivalent or BOE. One stock tank barrel equivalent of oil, calculated by converting gas volumes to equivalent oil barrels at a ratio of 6 thousand cubic feet to 1 barrel of oil.
British thermal unit or Btu. One British thermal unit is the amount of heat required to raise the temperature of one pound of water by one degree Fahrenheit.
Completion . The installation of permanent equipment for production of oil or gas, or, in the case of a dry well, the reporting to the appropriate authority that the well has been abandoned.
Condensate. A mixture of hydrocarbons that exists in the gaseous phase at original reservoir temperature and pressure, but that, when produced, is in the liquid phase at surface pressure and temperature.
Cratering. The collapse of the circulation system dug around the drilling rig for the prevention of blowouts.
210
Table of Contents
Deterministic estimate. The method of estimating reserves or resources is called deterministic when a single value for each parameter (from the geoscience, engineering, or economic data) in the reserves calculation is used in the reserves estimation procedure.
Developed oil and gas reserves. Developed oil and gas reserves are reserves of any category that can be expected to be recovered: (i) through existing wells with existing equipment and operating methods or in which the cost of the required equipment is relatively minor compared to the cost of a new well; and (ii) through installed extraction equipment and infrastructure operational at the time of the reserves estimate if the extraction is by means not involving a well.
Development well . A well drilled within the proved area of an oil or gas reservoir to the depth of a stratigraphic horizon known to be productive.
Differential. An adjustment to the price of oil or natural gas from an established spot market price to reflect differences in the quality and/or location of oil or gas.
Exploratory well . A well drilled to find a new field or to find a new reservoir in a field previously found to be productive of oil or gas in another reservoir.
Field . An area consisting of a single reservoir or multiple reservoirs all grouped on or related to the same individual geological structural feature and/or stratigraphic condition. There may be two or more reservoirs in a field that are separated vertically by intervening impervious, strata, or laterally by local geologic barriers, or by both. Reservoirs that are associated by being in overlapping or adjacent fields may be treated as a single or common operational field. The geological terms "structural feature" and "stratigraphic condition" are intended to identify localized geological features as opposed to the broader terms of basins, trends, provinces, plays, areas-of-interest, etc.
Gross well or gross acre . A well or acre in which the registrant owns a working interest. The numbers of gross wells is the total number of wells in which the registrant owns a working interest.
Net well or net acre. Deemed to exist when the sum of the fractional ownership working interests in gross wells or acres equals one. The number of net wells or acres is the sum of the fractional working interests owned in gross wells or acres expressed as whole numbers and fractions of whole numbers.
Natural gas liquids or NGLs. Hydrocarbons (primarily ethane, propane, butane and natural gasolines) which have been extracted from wet natural gas and become liquid under various combinations of increasing pressure and lower temperature.
Net revenue interest. An interest in a revenue stream net of all other interests burdening that stream, such as a lessor's royalty and any overriding royalties. For example, if a lessor executes a lease with a one-eighth royalty, the lessor's net revenue interest is 12.5 percent and the lessee's net revenue interest is 87.5 percent.
Pay. Reservoir rock containing crude oil or natural gas.
Play. A geographic area with hydrocarbon potential.
Possible reserves. Possible reserves are those additional reserves that are less certain to be recovered than probable reserves.
Reasonable certainty. If deterministic methods are used, reasonable certainty means a high degree of confidence that the quantities will be recovered. If probabilistic methods are used, there should be at least a 90% probability that the quantities actually recovered will equal or exceed the estimate. A high degree of confidence exists if the quantity is much more likely to be achieved than not, and, as changes due to increased availability of geoscience (geological, geophysical and geochemical), engineering and economic data are made to estimated ultimate recovery with time, reasonably certain estimated ultimate recovery is much more likely to increase or remain constant than to decrease.
Reserve life. A measure of the productive life of an oil and gas property or a group of properties, expressed in years. Reserve life is calculated by dividing proved reserve volumes at year end by production volumes. In our calculation of reserve life, production volumes are based on annualized fourth-quarter production and are adjusted, if necessary, to reflect property acquisitions and dispositions.
Reservoir . A porous and permeable underground formation containing a natural accumulation of producible oil and/or gas that is confined by impermeable rock or water barriers and is individual and separate from other reservoirs.
211
Table of Contents
Resources. Resources are quantities of oil and gas estimated to exist in naturally occurring accumulations. A portion of the resources may be estimated to be recoverable, and another portion may be considered to be unrecoverable. Resources include both discovered and undiscovered accumulations.
Royalty interest. An interest in an oil and gas lease that gives the owner of the interest the right to receive a portion of the production from the leased acreage (or of the proceeds of the sale thereof), but generally does not require the owner to pay any portion of the costs of drilling or operating the wells on the leased acreage. Royalties may be either landowner's royalties, which are reserved by the owner of the leased acreage at the time the lease is granted, or overriding royalties, which are usually reserved by an owner of the leasehold in connection with a transfer to a subsequent owner.
Sands. Sandstone or other sedimentary rocks.
Shale. A fine-grained, clastic sedimentary rock composed of mud that is a mix of flakes of clay minerals and tiny fragments of other minerals.
Standardized measure. The present value, discounted at 10 percent per year, of estimated future net revenues from the production of proved reserves, computed by applying sales prices used in estimating proved oil and natural gas reserves to the year-end quantities of those reserves in effect as of the dates of such estimates and held constant throughout the productive life of the reserves (except for consideration of future price changes to the extent provided by contractual arrangements in existence at year-end), and deducting the estimated future costs to be incurred in developing, producing and abandoning the proved reserves (computed based on year-end costs and assuming continuation of existing economic conditions). Future income taxes are calculated by applying the appropriate year-end statutory federal and state income tax rates, with consideration of future tax rates already legislated, to pre-tax future net cash flows, net of the tax basis of the properties involved and utilization of available tax carryforwards related to proved oil and natural gas reserves.
Undeveloped acreage. Lease acreage on which wells have not been drilled or completed to a point that would permit the production of economic quantities of oil or gas regardless of whether the acreage contains proved reserves.
Undeveloped oil and gas reserves. Undeveloped oil and natural gas reserves are reserves of any category that are expected to be recovered from new wells on undrilled acreage, or from existing wells where a relatively major expenditure is required for recompletion. Reserves on undrilled acreage shall be limited to those directly offsetting development spacing areas that are reasonably certain of production when drilled, unless evidence using reliable technology exists that establishes reasonable certainty of economic producibility at greater distances. Undrilled locations can be classified as having undeveloped reserves only if a development plan has been adopted indicating that they are scheduled to be drilled within five years, unless the specific circumstances justify a longer time. Under no circumstances shall estimates for undeveloped reserves be attributable to any acreage for which an application of fluid injection or other improved recovery technique is contemplated, unless such techniques have been proved effective by actual projects in the same reservoir or an analogous reservoir, or by other evidence using reliable technology establishing reasonable certainty.
Working interest . An interest in an oil and gas lease that gives the owner of the interest the right to drill for and produce oil and gas on the leased acreage and requires the owner to pay a share of the costs of drilling and production operations.
For additional information regarding the definitions contained in this Glossary, or for other oil and gas definitions, refer to Rule 4-10 of Regulation S-X.
212
Table of Contents
SIGNATURES
Pursuant to the requirements of Section 13 of the Securities Exchange Act of 1934, the registrant has duly caused this report to be signed on its behalf by the undersigned, thereunto duly authorized, on February 27, 2015 .
Freeport-McMoRan Inc.
By: /s/ Richard C. Adkerson
Richard C. Adkerson
Vice Chairman of the Board, President and Chief Executive Officer
Pursuant to the requirements of the Securities Exchange Act of 1934, this report has been signed by the following persons on behalf of the registrant in the capacities indicated on February 27, 2015 .
* | Chairman of the Board |
James R. Moffett |
|
|
|
/s/ Richard C. Adkerson | Vice Chairman of the Board, President and Chief Executive Officer |
Richard C. Adkerson | (Principal Executive Officer) |
|
|
* | Vice Chairman of the Board |
James C. Flores |
|
|
|
/s/ Kathleen L. Quirk | Executive Vice President, Chief Financial Officer and Treasurer |
Kathleen L. Quirk | (Principal Financial Officer) |
|
|
* | Vice President and Controller - Financial Reporting |
C. Donald Whitmire, Jr. | (Principal Accounting Officer) |
|
|
* | Director |
Robert J. Allison, Jr. |
|
|
|
* | Director |
Alan R. Buckwalter III |
|
|
|
* | Director |
Robert A. Day |
|
|
|
* | Director |
Gerald J. Ford |
|
|
|
* | Director |
Thomas A. Fry, III |
|
|
|
|
|
S - 1
Table of Contents
* | Director |
H. Devon Graham, Jr. |
|
|
|
* | Director |
Lydia H. Kennard |
|
|
|
* | Director |
Charles C. Krulak |
|
|
|
* | Director |
Bobby Lee Lackey |
|
|
|
* | Director |
Jon C. Madonna |
|
|
|
* | Director |
Dustan E. McCoy |
|
|
|
* | Director |
Stephen H. Siegele |
|
|
|
* | Director |
Frances Fragos Townsend |
|
|
|
|
|
|
|
* By: /s/ Richard C. Adkerson |
|
Richard C. Adkerson |
|
Attorney-in-Fact |
|
S - 2
Table of Contents
FREEPORT-McMoRan INC.
INDEX TO FINANCIAL STATEMENTS
Our financial statements and the notes thereto, and the report of Ernst & Young LLP included in our 2014 annual report are incorporated herein by reference.
| Page |
Report of Independent Registered Public Accounting Firm | F-1 |
Schedule II-Valuation and Qualifying Accounts | F-2 |
Schedules other than the one listed above have been omitted since they are either not required, not applicable or the required information is included in the financial statements or notes thereto.
REPORT OF INDEPENDENT REGISTERED PUBLIC ACCOUNTING FIRM
TO THE BOARD OF DIRECTORS AND STOCKHOLDERS OF
FREEPORT-McMoRan INC.
We have audited the consolidated financial statements of Freeport-McMoRan Inc. (formerly Freeport-McMoRan Copper & Gold Inc.) as of December 31, 2014 and 2013 , and for each of the three years in the period ended December 31, 2014 ,and have issued our report thereon dated February 27, 2015 (included elsewhere in this Form 10-K). Our audits also included the financial statement schedule listed in the Index to Financial Statements of this Form 10-K. This schedule is the responsibility of the Company's management. Our responsibility is to express an opinion on this schedule based on our audits.
In our opinion, the financial statement schedule referred to above, when considered in relation to the basic consolidated financial statements taken as a whole, presents fairly in all material respects the information set forth therein.
/s/ Ernst & Young LLP
Phoenix, Arizona
February 27, 2015
F - 1
Table of Contents
FREEPORT-McMoRan INC.
SCHEDULE II - VALUATION AND QUALIFYING ACCOUNTS
(In millions)
|
|
|
| Additions |
|
|
|
| ||||||||||||
|
| Balance at |
| Charged to |
| Charged to |
| Other |
| Balance at | ||||||||||
|
| Beginning of |
| Costs and |
| Other |
| Additions |
| End of | ||||||||||
|
| Year |
| Expense |
| Accounts |
| (Deductions) |
| Year | ||||||||||
Reserves and allowances deducted |
|
|
|
|
|
|
|
|
|
| ||||||||||
from asset accounts: |
|
|
|
|
|
|
|
|
|
| ||||||||||
Valuation allowance for deferred tax assets |
|
|
|
|
|
|
|
|
|
| ||||||||||
Year Ended December 31, 2014 |
| $ | 2,487 | |
| $ | (53 | ) |
| $ | - | |
| $ | - | |
| $ | 2,434 | |
Year Ended December 31, 2013 |
| 2,443 | |
| 44 | |
| - | |
| - | |
| 2,487 | | |||||
Year Ended December 31, 2012 |
| 2,393 | |
| 49 | |
| 1 | |
| - | |
| 2,443 | | |||||
|
|
|
|
|
|
|
|
|
|
| ||||||||||
Reserves for non-income taxes: |
|
|
|
|
|
|
|
|
|
| ||||||||||
Year Ended December 31, 2014 |
| $ | 78 | |
| $ | 16 | |
| $ | - | |
| $ | (1 | ) | a | $ | 93 | |
Year Ended December 31, 2013 |
| 80 | |
| 35 | |
| (1 | ) |
| (36 | ) | a | 78 | | |||||
Year Ended December 31, 2012 |
| 73 | |
| 21 | |
| (2 | ) |
| (12 | ) | a | 80 | | |||||
a. | Represents amounts paid or adjustments to reserves based on revised estimates. |
F - 2
Table of Contents
FREEPORT-McMoRan INC. | |||||
EXHIBIT INDEX | |||||
|
| Filed |
|
|
|
Exhibit |
| with this | Incorporated by Reference | ||
Number | Exhibit Title | Form 10-K | Form | File No. | Date Filed |
2.1 | Agreement and Plan of Merger dated as of November 18, 2006, by and among FCX, Phelps Dodge Corporation and Panther Acquisition Corporation. |
| 8-K | 333-139252 | 11/20/2006 |
2.2 | Agreement and Plan of Merger by and among Plains Exploration & Production Company, FCX and IMONC LLC, dated as of December 5, 2012. |
| 8-K | 001-11307-01 | 12/6/2012 |
2.3 | Agreement and Plan of Merger by and among McMoRan Exploration Co., FCX and INAVN Corp., dated as of December 5, 2012. |
| 8-K | 001-11307-01 | 12/6/2012 |
2.4 | Stock Purchase Agreement, dated as of October 6, 2014, among LMC Candelaria SpA, LMC Ojos del Salado SpA and Freeport Minerals Corporation. |
| 10-Q | 001-11307-01 | 11/7/2014 |
3.1 | Composite Certificate of Incorporation of FCX. |
| 10-Q | 001-11307-01 | 8/8/2014 |
3.2 | Composite By-Laws of FCX, as of July 14, 2014. |
| 8-K | 001-11307-01 | 7/2/2014 |
4.1 | Indenture dated as of February 13, 2012, between FCX and U.S. Bank National Association, as Trustee (relating to the 2.15% Senior Notes due 2017, the 3.55% Senior Notes due 2022, the 2.30% Senior Notes due 2017, the 4.00% Senior Notes due 2021, the 4.55% Senior Notes due 2024, and the 5.40% Senior Notes due 2034). |
| 8-K | 001-11307-01 | 2/13/2012 |
4.2 | Second Supplemental Indenture dated as of February 13, 2012, between FCX and U.S. Bank National Association, as Trustee (relating to the 2.15% Senior Notes due 2017). |
| 8-K | 001-11307-01 | 2/13/2012 |
4.3 | Third Supplemental Indenture dated as of February 13, 2012, between FCX and U.S. Bank National Association, as Trustee (relating to the 3.55% Senior Notes due 2022). |
| 8-K | 001-11307-01 | 2/13/2012 |
4.4 | Fourth Supplemental Indenture dated as of May 31, 2013, among FCX, Freeport-McMoRan Oil & Gas LLC and U.S. Bank National Association, as Trustee (relating to the 2.15% Senior Notes due 2017, the 3.55% Senior Notes due 2022, the 2.30% Senior Notes due 2017, the 4.00% Senior Notes due 2021, the 4.55% Senior Notes due 2024, and the 5.40% Senior Notes due 2034). |
| 8-K | 001-11307-01 | 6/3/2013 |
4.5 | Fifth Supplemental Indenture dated as of November 14, 2014 among FCX, Freeport-McMoRan Oil & Gas LLC and U.S. Bank National Association, as Trustee (relating to the 2.30% Senior Notes due 2017). |
| 8-K | 001-11307-01 | 11/14/2014 |
4.6 | Sixth Supplemental Indenture dated as of November 14, 2014 among FCX, Freeport-McMoRan Oil & Gas LLC and U.S. Bank National Association, as Trustee (relating to the 4.00% Senior Notes due 2021) . |
| 8-K | 001-11307-01 | 11/14/2014 |
4.7 | Seventh Supplemental Indenture dated as of November 14, 2014 among FCX, Freeport-McMoRan Oil & Gas LLC and U.S. Bank National Association, as Trustee. (relating to the 4.55% Senior Notes due 2024). |
| 8-K | 001-11307-01 | 11/14/2014 |
4.8 | Eighth Supplemental Indenture dated as of November 14, 2014 among FCX, Freeport-McMoRan Oil & Gas LLC and U.S. Bank National Association, as Trustee (relating to the 5.40% Senior Notes due 2034) . |
| 8-K | 001-11307-01 | 11/14/2014 |
4.9 | Indenture dated as of March 7, 2013, between FCX and U.S. Bank National Association, as Trustee (relating to the 2.375% Senior Notes due 2018, the 3.100% Senior Notes due 2020, the 3.875% Senior Notes due 2023, and the 5.450% Senior Notes due 2043). |
| 8-K | 001-11307-01 | 3/7/2013 |
E - 1
Table of Contents
FREEPORT-McMoRan INC. | |||||
EXHIBIT INDEX | |||||
|
| Filed |
|
|
|
Exhibit |
| with this | Incorporated by Reference | ||
Number | Exhibit Title | Form 10-K | Form | File No. | Date Filed |
4.10 | Supplemental Indenture dated as of May 31, 2013, among FCX, Freeport-McMoRan Oil & Gas LLC and U.S. Bank National Association, as Trustee (relating to the 2.375% Senior Notes due 2018, the 3.100% Senior Notes due 2020, the 3.875% Senior Notes due 2023, and the 5.450% Senior Notes due 2043). |
| 8-K | 001-11307-01 | 6/3/2013 |
4.11 | Indenture dated as of March 13, 2007, among Plains Exploration & Production Company, the Subsidiary Guarantors parties thereto, and Wells Fargo Bank, N.A., as Trustee (relating to the 6.625% Senior Notes due 2021, the 6.75% Senior Notes due 2022, the 6.125% Senior Notes due 2019, the 6.5% Senior Notes due 2020, and the 6.875% Senior Notes due 2023). |
| 8-K | 001-31470 | 3/13/2007 |
4.12 | Twelfth Supplemental Indenture dated as of March 29, 2011 to the Indenture dated as of March 13, 2007, among Plains Exploration & Production Company, the Subsidiary Guarantors parties thereto and Wells Fargo Bank, N.A., as Trustee (relating to the 6.625% Senior Notes due 2021). |
| 8-K | 001-31470 | 3/29/2011 |
4.13 | Thirteenth Supplemental Indenture dated as of November 21, 2011 to the Indenture dated as of March 13, 2007, among Plains Exploration & Production Company, the Subsidiary Guarantors parties thereto and Wells Fargo Bank, N.A., as Trustee (relating to the 6.75% Senior Notes due 2022). |
| 8-K | 001-31470 | 11/22/2011 |
4.14 | Fourteenth Supplemental Indenture dated as of April 27, 2012 to the Indenture dated as of March 13, 2007, among Plains Exploration & Production Company, the Subsidiary Guarantors parties thereto and Wells Fargo Bank, N.A., as Trustee (relating to the 6.125% Senior Notes due 2019). |
| 8-K | 001-31470 | 4/27/2012 |
4.15 | Sixteenth Supplemental Indenture dated as of October 26, 2012 to the Indenture dated as of March 13, 2007, among Plains Exploration & Production Company, the Subsidiary Guarantors parties thereto and Wells Fargo Bank, N.A., as Trustee (relating to the 6.5% Senior Notes due 2020). |
| 8-K | 001-31470 | 10/26/2012 |
4.16 | Seventeenth Supplemental Indenture dated as of October 26, 2012 to the Indenture dated as of March 13, 2007, among Plains Exploration & Production Company, the Subsidiary Guarantors parties thereto and Wells Fargo Bank, N.A., as Trustee (relating to the 6.875% Senior Notes due 2023). |
| 8-K | 001-31470 | 10/26/2012 |
4.17 | Eighteenth Supplemental Indenture dated as of May 31, 2013 to the Indenture dated as of March 13, 2007, among Freeport-McMoRan Oil & Gas LLC, as Successor Issuer, FCX Oil & Gas Inc., as Co-Issuer, FCX, as Parent Guarantor, Plains Exploration & Production Company, as Original Issuer, and Wells Fargo Bank, N.A., as Trustee (relating to the 6.625% Senior Notes due 2021, the 6.75% Senior Notes due 2022, the 6.125% Senior Notes due 2019, the 6.5% Senior Notes due 2020, and the 6.875% Senior Notes due 2023). |
| 8-K | 001-11307-01 | 6/3/2013 |
4.18 | Form of Indenture dated as of September 22, 1997, between Phelps Dodge Corporation and The Chase Manhattan Bank, as Trustee (relating to the 7.125% Senior Notes due 2027, the 9.50% Senior Notes due 2031, and the 6.125% Senior Notes due 2034). |
| S-3 | 333-36415 | 9/25/1997 |
4.19 | Form of 7.125% Debenture due November 1, 2027 of Phelps Dodge Corporation issued on November 5, 1997, pursuant to the Indenture dated as of September 22, 1997, between Phelps Dodge Corporation and The Chase Manhattan Bank, as Trustee (relating to the 7.125% Senior Notes due 2027). |
| 8-K | 001-00082 | 11/3/1997 |
E - 2
Table of Contents
FREEPORT-McMoRan INC. | |||||
EXHIBIT INDEX | |||||
|
| Filed |
|
|
|
Exhibit |
| with this | Incorporated by Reference | ||
Number | Exhibit Title | Form 10-K | Form | File No. | Date Filed |
4.20 | Form of 9.5% Note due June 1, 2031 of Phelps Dodge Corporation issued on May 30, 2001, pursuant to the Indenture dated as of September 22, 1997, between Phelps Dodge Corporation and First Union National Bank, as successor Trustee (relating to the 9.50% Senior Notes due 2031). |
| 8-K | 001-00082 | 5/30/2001 |
4.21 | Form of 6.125% Note due March 15, 2034 of Phelps Dodge Corporation issued on March 4, 2004, pursuant to the Indenture dated as of September 22, 1997, between Phelps Dodge Corporation and First Union National Bank, as successor Trustee (relating to the 6.125% Senior Notes due 2034). |
| 10-K | 001-00082 | 3/7/2005 |
10.1 | Contract of Work dated December 30, 1991, between the Government of the Republic of Indonesia and PT Freeport Indonesia. |
| S-3 | 333-72760 | 11/5/2001 |
10.2 | Memorandum of Understanding dated as of July 25, 2014, between the Directorate General of Mineral and Coal, the Ministry of Energy and Mineral Resources and PT Freeport Indonesia on Adjustment of the Contract of Work. |
| 8-K | 001-11307-01 | 7/8/2014 |
10.3 | Extension dated as of January 23, 2015, to Memorandum of Understanding Between the Government of the Republic of Indonesia and PT Freeport Indonesia dated as of July 25, 2014. | X |
|
|
|
10.4 | Participation Agreement dated as of October 11, 1996, between PT Freeport Indonesia and P.T. RTZ-CRA Indonesia (a subsidiary of Rio Tinto PLC) with respect to a certain contract of work. |
| S-3 | 333-72760 | 11/5/2001 |
10.5 | First Amendment dated April 30, 1999, Second Amendment dated February 22, 2006, Third Amendment dated October 7, 2009, Fourth Amendment dated November 14, 2013, and Fifth Amendment dated August 4, 2014, to the Participation Agreement dated as of October 11, 1996, between PT Freeport Indonesia and P.T. Rio Tinto Indonesia (formerly P.T. RTZ-CRA Indonesia). | X |
|
|
|
10.6 | Agreement dated as of October 11, 1996, to Amend and Restate Trust Agreement among PT Freeport Indonesia, FCX, the RTZ Corporation PLC (now Rio Tinto PLC), P.T. RTZ-CRA Indonesia, RTZ Indonesian Finance Limited and First Trust of New York, National Association, and The Chase Manhattan Bank, as Administrative Agent, JAA Security Agent and Security Agent. |
| 8-K | 001-09916 | 11/13/1996 |
10.7 | Concentrate Purchase and Sales Agreement dated effective December 11, 1996, between PT Freeport Indonesia and PT Smelting. |
| S-3 | 333-72760 | 11/5/2001 |
10.8 | Amendment No. 1, dated as of March 19, 1998, Amendment No. 2 dated as of December 1, 2000, Amendment No. 3 dated as of January 1, 2003, Amendment No. 4 dated as of May 10, 2004, Amendment No. 5 dated as of March 19, 2009, Amendment No. 6 dated as of January 1, 2011, and Amendment No. 7 dated as of October 29, 2012, to the Concentrate Purchase and Sales Agreement dated effective December 11, 1996, between PT Freeport Indonesia and PT Smelting. | X |
|
|
|
|
|
|
|
|
|
|
|
|
|
|
|
|
|
|
|
|
|
E - 3
Table of Contents
FREEPORT-McMoRan INC. | |||||
EXHIBIT INDEX | |||||
|
| Filed |
|
|
|
Exhibit |
| with this | Incorporated by Reference | ||
Number | Exhibit Title | Form 10-K | Form | File No. | Date Filed |
10.9 | Third Amended and Restated Joint Venture and Shareholders Agreement dated as of December 11, 2003 among PT Freeport Indonesia, Mitsubishi Corporation, Nippon Mining & Metals Company, Limited and PT Smelting, as amended by the First Amendment dated as of September 30, 2005, and the Second Amendment dated as of April 30, 2008. | X |
|
|
|
10.10 | Participation Agreement, dated as of March 16, 2005, among Phelps Dodge Corporation, Cyprus Amax Minerals Company, a Delaware corporation, Cyprus Metals Company, a Delaware corporation, Cyprus Climax Metals Company, a Delaware corporation, Sumitomo Corporation, a Japanese corporation, Summit Global Management, B.V., a Dutch corporation, Sumitomo Metal Mining Co., Ltd., a Japanese corporation, Compañia de Minas Buenaventura S.A.A., a Peruvian sociedad anonima abierta, and Sociedad Minera Cerro Verde S.A.A., a Peruvian sociedad anonima abierta. |
| 8-K | 001-00082 | 3/22/2005 |
10.11 | Shareholders Agreement, dated as of June 1, 2005, among Phelps Dodge Corporation, Cyprus Climax Metals Company, a Delaware corporation, Sumitomo Corporation, a Japanese corporation, Sumitomo Metal Mining Co., Ltd., a Japanese corporation, Summit Global Management B.V., a Dutch corporation, SMM Cerro Verde Netherlands, B.V., a Dutch corporation, Compañia de Minas Buenaventura S.A.A., a Peruvian sociedad anonima abierta, and Sociedad Minera Cerro Verde S.A.A., a Peruvian sociedad anonima abierta. |
| 8-K | 001-00082 | 6/7/2005 |
10.13 | Amended and Restated Mining Convention dated as of September 28, 2005, among the Democratic Republic of Congo, La Générale des Carrières et des Mines, Lundin Holdings Ltd. (now TF Holdings Limited) and Tenke Fungurume Mining S.A.R.L. |
| 8-K | 001-11307-01 | 9/2/2008 |
10.14 | Addendum No.1 to the Amended and Restated Mining Convention dated as of September 28, 2005, among the Democratic Republic of Congo, La Générale des Carrières et des Mines, TF Holdings Limited and Tenke Fungurume Mining S.A.R.L., dated as of December 11, 2010 |
| 10-Q | 001-11307-01 | 5/6/2011 |
10.15 | Amended and Restated Shareholders Agreement dated as of September 28, 2005, by and between La Générale des Carrières et des Mines and Lundin Holdings Ltd. (now TF Holdings Limited) and its subsidiaries. |
| 8-K | 001-11307-01 | 9/2/2008 |
10.16 | Addendum No.1 to the Amended and Restated Shareholders Agreement dated as of September 28, 2005, among La Générale des Carrières et des Mines and TF Holdings Limited, Chui Ltd., Faru Ltd., Mboko Ltd., Tembo Ltd., and Tenke Fungurume Mining S.A.R.L., dated as of December 11, 2010. |
| 10-Q | 001-11307-01 | 5/6/2011 |
10.17 | Term Loan Agreement dated as of February 14, 2013, among FCX, And Freeport-McMoRan Oil & Gas LLC, as borroweres, JPMorgan Chase Bank, N.A., as administrative agent, Bank of America, N.A., as syndication agent, HSBC Bank USA, National Association, Mizuho Corporate Bank, Ltd., Sumitomo Mitsui Banking Corporation, The Bank of Nova Scotia and The Bank of Tokyo-Mitsubishi UFJ, Ltd., as co-documentation agents, and each of the lenders party thereto. |
| 8-K | 001-11307-01 | 2/15/2013 |
|
|
|
|
|
|
E - 4
Table of Contents
FREEPORT-McMoRan INC. | |||||
EXHIBIT INDEX | |||||
|
| Filed |
|
|
|
Exhibit |
| with this | Incorporated by Reference | ||
Number | Exhibit Title | Form 10-K | Form | File No. | Date Filed |
10.18 | First Amendment dated as of February 27, 2015, to Term Loan Agreement dated as of February 14, 2013, among FCX and Freeport-McMoRan Oil & Gas LLC, as borrowers, JPMorgan Chase Bank, N.A., as administrative agent, Bank of America, N.A., as syndication agent, HSBC Bank USA, National Association, Mizuho Corporate Bank, Ltd., Sumitomo Mitsui Banking Corporation, The Bank of Nova Scotia and The Bank of Tokyo-Mitsubishi UFJ, Ltd., as co-documentation agents, and each of the lenders party thereto. | X |
|
|
|
10.19 | Revolving Credit Agreement dated as of February 14, 2013, among FCX, PT Freeport Indonesia, and Freeport-McMoRan Oil & Gas LLC, as borrowers, JPMorgan Chase Bank, N.A., as administrative agent and the swingline lender, Bank of America, N.A., as syndication agent, BNP Paribas, Citibank, N.A., HSBC Bank USA, National Association, Muzho Corporate Bank, Ltd., Sumitomo Mitsui Banking Corporation, The Bank of Nova Scotia and The Bank of Tokyo-Mitsubishi UFJ, Ltd., as co-documentation agents, and each of the lenders and issuing banks party thereto. |
| 8-K | 001-11307-01 | 2/15/2013 |
10.20 | First Amendment dated as of May 30, 2014, to the Revolving Credit Agreement dated as of February 14, 2013, among FCX, PT Freeport Indonesia and Freeport-McMoRan Oil & Gas LLC, as borrowers, JPMorgan Chase Bank, N.A., as administrative agent and the swingline lender, Bank of America, N.A., as syndication agent, BNP Paribas, Citibank, N.A., HSBC Bank USA, National Association, Mizuho Bank, Ltd., Sumitomo Mitsui Banking Corporation, The Bank of Nova Scotia and The Bank of Tokyo-Mitsubishi UFJ, Ltd., as co-documentation agents, and each of the lenders and issuing banks party thereto. |
| 8-K | 001-11307-01 | 6/2/2014 |
10.21 | Second Amendment dated as of February 27, 2015, to the Revolving Credit Agreement dated as of February 14, 2013, as amended by the First Amendment dated as of May 30, 2014, among FCX, PT Freeport Indonesia and Freeport-McMoRan Oil & Gas LLC, as borrowers, JPMorgan Chase Bank, N.A., as administrative agent and the swingline lender, Bank of America, N.A., as syndication agent, BNP Paribas, Citibank, N.A., HSBC Bank USA, National Association, Mizuho Bank, Ltd., Sumitomo Mitsui Banking Corporation, The Bank of Nova Scotia and The Bank of Tokyo-Mitsubishi UFJ, Ltd., as co-documentation agents, and each of the lenders and issuing banks party thereto. | X |
|
|
|
10.22# | Crude Oil Purchase Agreement dated January 1, 2012, between Plains Exploration & Production Company and ConocoPhillips Company. |
| 10-Q/A | 001-31470 | 9/22/2011 |
10.23# | First Amendment, dated January 1, 2014, to the Crude Oil Purchase Agreement dated January 1, 2012, between Freeport-McMoRan Oil & Gas LLC (formerly Plains Exploration & Production Company) and ConocoPhillips Company. | X |
|
|
|
10.24# | Second Amendment, dated July 1, 2014, to the Crude Oil Purchase Agreement dated January 1, 2012, between Freeport-McMoRan Oil & Gas LLC and ConocoPhillips Company. | X |
|
|
|
10.25* | Letter Agreement, dated as of December 5, 2012, by and among James C. Flores, Plains Exploration & Production Company and FCX |
| 8-K | 001-11307-01 | 12/6/2012 |
10.26* | Amended and Restated Employment Agreement dated February 27, 2014, between FCX and James C. Flores. |
| 8-K | 001-11307-01 | 3/3/2014 |
E - 5
Table of Contents
FREEPORT-McMoRan INC. | |||||
EXHIBIT INDEX | |||||
|
| Filed |
|
|
|
Exhibit |
| with this | Incorporated by Reference | ||
Number | Exhibit Title | Form 10-K | Form | File No. | Date Filed |
10.27* | Letter Agreement dated as of December 19, 2013, by and between FCX and Richard C. Adkerson. |
| 8-K | 001-11307-01 | 12/23/2013 |
10.28* | FCX Director Compensation. | X |
|
|
|
10.29* | Amended and Restated Executive Employment Agreement dated effective as of December 2, 2008, between FCX and James R. Moffett. |
| 10-K | 001-11307-01 | 2/26/2009 |
10.30* | Amended and Restated Change of Control Agreement dated effective as of December 2, 2008, between FCX and James R. Moffett. |
| 10-K | 001-11307-01 | 2/26/2009 |
10.31* | Letter Agreement dated February 27, 2014, between FCX and James R. Moffett. |
| 8-K | 001-11307-01 | 3/3/2014 |
10.32* | Amended and Restated Executive Employment Agreement dated effective as of December 2, 2008, between FCX and Kathleen L. Quirk. |
| 10-K | 001-11307-01 | 2/26/2009 |
10.33* | Amendment to Amended and Restated Executive Employment Agreement dated December 2, 2008, by and between FCX and Kathleen L. Quirk, dated April 27, 2011. |
| 8-K | 001-11307-01 | 4/29/2011 |
10.34* | FCX Executive Services Program |
| 10-K | 001-11307-01 | 2/27/2012 |
10.35* | FCX Supplemental Executive Retirement Plan, as amended and restated. |
| 8-K | 001-11307-01 | 2/5/2007 |
10.36* | FCX Supplemental Executive Capital Accumulation Plan. |
| 10-Q | 001-11307-01 | 5/12/2008 |
10.37* | FCX Supplemental Executive Capital Accumulation Plan Amendment One. |
| 10-Q | 001-11307-01 | 5/12/2008 |
10.38* | FCX Supplemental Executive Capital Accumulation Plan Amendment Two. |
| 10-K | 001-11307-01 | 2/26/2009 |
10.39* | FCX Supplemental Executive Capital Accumulation Plan Amendment Three. | X |
|
|
|
10.40* | FCX Supplemental Executive Capital Accumulation Plan Amendment Four. | X |
|
|
|
10.41* | FCX 2005 Supplemental Executive Capital Accumulation Plan, as amended and restated effective January 1, 2015. | X |
|
|
|
10.42* | FCX 1995 Stock Option Plan for Non-Employee Directors, as amended and restated. |
| 10-Q | 001-11307-01 | 5/10/2007 |
10.43* | FCX Amended and Restated 1999 Stock Incentive Plan, as amended and restated. |
| 10-Q | 001-11307-01 | 5/10/2007 |
10.44* | FCX 2003 Stock Incentive Plan, as amended and restated. |
| 10-Q | 001-11307-01 | 5/10/2007 |
10.45* | Form of Amendment No. 1 to Notice of Grant of Nonqualified Stock Options and Stock Appreciation Rights under the 2004 Director Compensation Plan. |
| 8-K | 001-11307-01 | 5/5/2006 |
10.46* | FCX 2004 Director Compensation Plan, as amended and restated. |
| 10-Q | 001-11307-01 | 8/6/2010 |
10.47* | FCX Amended and Restated 2006 Stock Incentive Plan. |
| 10-K | 001-11307-01 | 2/27/2014 |
10.48* | Form of Notice of Grant of Nonqualified Stock Options for grants under the FCX 1999 Stock Incentive Plan, the 2003 Stock Incentive Plan and the 2006 Stock Incentive Plan. |
| 10-K | 001-11307-01 | 2/29/2008 |
10.49* | Form of Notice of Grant of Nonqualified Stock Options and Restricted Stock Units under the 2006 Stock Incentive Plan (for grants made to non-management directors and advisory directors). |
| 8-K | 001-11307-01 | 6/14/2010 |
10.50* | FCX 2009 Annual Incentive Plan |
| 8-K | 001-11307-01 | 6/17/2009 |
E - 6
Table of Contents
FREEPORT-McMoRan INC. | |||||
EXHIBIT INDEX | |||||
|
| Filed |
|
|
|
Exhibit |
| with this | Incorporated by Reference | ||
Number | Exhibit Title | Form 10-K | Form | File No. | Date Filed |
10.51* | Form of Nonqualified Stock Options Grant Agreement (effective February 2012). |
| 10-K | 001-11307-01 | 2/27/2012 |
10.52* | Form of Restricted Stock Unit Agreement (effective February 2012). |
| 10-K | 001-11307-01 | 2/27/2012 |
10.53* | Form of Performance-Based Restricted Stock Unit Agreement (effective February 2012). |
| 10-K | 001-11307-01 | 2/27/2012 |
10.54* | Form of Nonqualified Stock Options Grant Agreement under the FCX stock incentive plans (effective February 2014). |
| 10-K | 001-11307-01 | 2/27/2014 |
10.55* | Form of Restricted Stock Unit Agreement under the FCX stock incentive plans (effective February 2014). |
| 10-K | 001-11307-01 | 2/27/2014 |
10.56* | Form of Performance Share Unit Agreement (effective February 2014). |
| 8-K | 001-11307-01 | 3/3/2014 |
10.57* | FCX Annual Incentive Plan (For Fiscal Years Ending 2014 - 2018). |
| 8-K | 001-11307-01 | 6/18/2014 |
10.58* | Form of Notice of Grant of Restricted Stock Units under the 2006 Stock Incentive Plan (for grants made to non-management directors). |
| 10-Q | 001-11307-01 | 8/11/2014 |
10.59* | Form of Restricted Stock Unit Agreement under the FCX stock incentive plans (effective February 2015). | X |
|
|
|
12.1 | FCX Computation of Ratio of Earnings to Fixed Charges. | X |
|
|
|
14.1 | FCX Principles of Business Conduct. |
| 10-K | 001-11307-01 | 2/29/2008 |
21.1 | Subsidiaries of FCX. | X |
|
|
|
23.1 | Consent of Ernst & Young LLP. | X |
|
|
|
23.2 | Consent of Netherland, Sewell & Associates, Inc. | X |
|
|
|
23.3 | Consent of Ryder Scott Company, L.P. | X |
|
|
|
24.1 | Certified resolution of the Board of Directors of FCX authorizing this report to be signed on behalf of any officer or director pursuant to a Power of Attorney. | X |
|
|
|
24.2 | Powers of Attorney pursuant to which this report has been signed on behalf of certain officers and directors of FCX. | X |
|
|
|
31.1 | Certification of Principal Executive Officer pursuant to Rule 13a-14(a)/15d – 14(a). | X |
|
|
|
31.2 | Certification of Principal Financial Officer pursuant to Rule 13a-14(a)/15d – 14(a). | X |
|
|
|
32.1 | Certification of Principal Executive Officer pursuant to 18 U.S.C. Section 1350. | X |
|
|
|
32.2 | Certification of Principal Financial Officer pursuant to 18 U.S.C Section 1350. | X |
|
|
|
95.1 | Mine Safety Disclosure. | X |
|
|
|
99.1 | Asset and Stock Purchase Agreement among OMG Harjavalta Chemicals Holding BV, OMG Americas, Inc., OM Group, Inc., Koboltti Chemicals Holdings Limited and solely for purposes of Section 10.13 and Exhibit A, Freeport-McMoRan Corporation, dated as of January 21, 2013. |
| 10-K | 001-11307-01 | 2/22/2013 |
99.2 | Report of Netherland, Sewell & Associates, Inc. | X |
|
|
|
99.3 | Report of Ryder Scott Company, L.P. | X |
|
|
|
101.INS | XBRL Instance Document. | X |
|
|
|
101.SCH | XBRL Taxonomy Extension Schema. | X |
|
|
|
101.CAL | XBRL Taxonomy Extension Calculation Linkbase. | X |
|
|
|
E - 7
Table of Contents
FREEPORT-McMoRan INC. | |||||
EXHIBIT INDEX | |||||
|
| Filed |
|
|
|
Exhibit |
| with this | Incorporated by Reference | ||
Number | Exhibit Title | Form 10-K | Form | File No. | Date Filed |
101.DEF | XBRL Taxonomy Extension Definition Linkbase. | X |
|
|
|
101.LAB | XBRL Taxonomy Extension Label Linkbase. | X |
|
|
|
101.PRE | XBRL Taxonomy Extension Presentation Linkbase. | X |
|
|
|
Note: Certain instruments with respect to long-term debt of FCX have not been filed as exhibits to this Annual Report on Form 10-K since the total amount of securities authorized under any such instrument does not exceed 10 percent of the total assets of FCX and its subsidiaries on a consolidated basis. FCX agrees to furnish a copy of each such instrument upon request of the Securities and Exchange Commission.
* Indicates management contract or compensatory plan or arrangement.
# Pursuant to a request for confidential treatment, portions of this exhibit have been redacted from the publicly filed document and have been furnished separately to the SEC.
E - 8