Table of Contents
|
UNITED STATES
SECURITIES AND EXCHANGE COMMISSION
Washington, D.C. 20549
____________________________________________________
Form 10-K
____________________________________________________
(Mark One)
x | ANNUAL REPORT PURSUANT TO SECTION 13 OR 15(d) OF THE SECURITIES EXCHANGE ACT OF 1934 |
| For the fiscal year ended June 30, 2012 |
OR
o | TRANSITION REPORT PURSUANT TO SECTION 13 OR 15(d) OF THE SECURITIES EXCHANGE ACT OF 1934 |
| For the transition period from to . |
Commission file number 000-25711
____________________________________________________
Extreme Networks, Inc.
(Exact name of Registrant as specified in its charter)
____________________________________________________
Delaware |
| 77-0430270 |
(State or other jurisdiction of incorporation or organization) |
| (I.R.S. Employer Identification No.) |
|
|
|
3585 Monroe Street Santa Clara, California |
| 95051 |
(Address of principal executive offices) |
| (Zip Code) |
Registrant's telephone number, including area code: (408) 579-2800
____________________________________________________
Securities registered pursuant to Section 12(b) of the Act: None
Securities registered pursuant to Section 12(g) of the Act:
Common stock, $.001 par value
____________________________________________________
Indicate by check mark if the registrant is a well-known seasoned issuer, as defined in Rule 405 of the Securities Act. Yes o No x
Indicate by check mark if the registrant is not required to file reports pursuant to Section 13 or Section 15(d) of the Act. Yes o No x
Indicate by check mark whether the registrant (1) has filed all reports required to be filed by Section 13 or 15(d) of the Securities Exchange Act of 1934 during the preceding 12 months (or for such shorter period that the registrant was required to file such reports), and (2) has been subject to such filing requirements for the past 90 days. Yes x No o
Indicate by check mark if disclosure of delinquent filers pursuant to Item 405 of Regulation S-K (§229.405 of this chapter) is not contained herein, and will not be contained, to the best of registrant's knowledge, in definitive proxy or information statements incorporated by reference in Part III of this Form 10-K or any amendment to this Form 10-K. x
Indicate by check mark whether the registrant has submitted electronically and posted on its corporate Web site, if any, every Interactive Data File required to be submitted and posted pursuant to Rule 405 of Regulation S-T (§229.405 of this chapter) during the preceding 12 months (or for such shorter period that the registrant was required to submit and post such files). Yes x No o
Indicate by check mark whether the registrant is a large accelerated filer, an accelerated filer, a non-accelerated filer, or a smaller reporting company. See definitions of "large accelerated filer," "accelerated filer" and "smaller reporting company" in Rule 12b-2 of the Exchange Act. (Check One):
Large Accelerated Filer o |
| Accelerated Filer x |
Non-Accelerated Filer o |
| Smaller reporting company o |
Indicate by check mark whether the registrant is a shell company (as defined in Rule 12b-2 of the Exchange Act). Yes o No x
The aggregate market value of voting stock held by non-affiliates of the Registrant was approximately $164.4 million as of December 30, 2011, the last business day of the Registrant's most recently completed second fiscal quarter, based upon the per share closing price of the Registrant's common stock as reported on The NASDAQ Global Market reported on such date. For purposes of this disclosure, shares of common stock held or controlled by executive officers and directors of the registrant and by persons who hold more than 5% of the outstanding shares of common stock have been treated as shares held by affiliates. This calculation does not reflect a determination that certain persons are affiliates of the Registrant for any other purpose.
94,528,405 shares of the Registrant's Common stock, $.001 par value, were outstanding as of August 6, 2012.
DOCUMENTS INCORPORATED BY REFERENCE
Part III incorporates by reference from the definitive proxy statement for the Company's 2012 Annual Meeting of Stockholders to be filed with the Commission pursuant to Regulation 14A not later than 120 days after the end of the fiscal year covered by this Annual Report on Form 10-K.
|
Table of Contents
EXTREME NETWORKS, INC.
FORM 10-K
INDEX
|
| Page |
Forward Looking Statements | 3 | |
| PART I | 3 |
|
|
|
Item 1. | Business | 3 |
|
|
|
Item 1A. | Risk Factors | 12 |
|
|
|
Item 1B. | Unresolved Staff Comments | 21 |
|
|
|
Item 2. | Properties | 21 |
|
|
|
Item 3. | Legal Proceedings | 22 |
|
|
|
Item 4. | Mine Safety Disclosures | 22 |
|
|
|
| PART II | 23 |
|
|
|
Item 5. | Market for Registrant's Common Equity, Related Stockholder Matters and Issuer Purchases of Equity Securities | 23 |
|
|
|
Item 6. | Selected Financial Data | 25 |
|
|
|
Item 7. | Management's Discussion and Analysis of Financial Condition and Results of Operations | 26 |
|
|
|
Item 7A. | Quantitative and Qualitative Disclosures About Market Risk | 37 |
|
|
|
Item 8. | Financial Statements and Supplementary Data | 39 |
|
|
|
Item 9. | Changes in and Disagreements With Accountants on Accounting and Financial Disclosure | 55 |
|
|
|
Item 9A. | Controls and Procedures | 55 |
|
|
|
Item 9B. | Other Information | 56 |
|
|
|
| PART III | 58 |
|
|
|
Item 10. | Directors, Executive Officers and Corporate Governance | 58 |
|
|
|
Item 11. | Executive Compensation | 58 |
|
|
|
Item 12. | Security Ownership of Certain Beneficial Owners and Management and Related Stockholder Matters | 58 |
|
|
|
Item 13. | Certain Relationships and Related Transactions, and Director Independence | 58 |
|
|
|
Item 14. | Principal Accountant Fees and Services | 58 |
|
|
|
| PART IV | 59 |
|
|
|
Item 15. | Exhibits and Financial Statement Schedules | 59 |
|
|
|
SIGNATURES | 61 | |
2
Table of Contents
FORWARD LOOKING STATEMENTS
This annual report on Form 10-K, including the following sections, contains forward-looking statements within the meaning of the Private Securities Litigation Reform Act of 1995, particularly, our expectations regarding results of operations, our ability to expand our market penetration, our ability to expand our distribution channels, customer acceptance of our products, our ability to meet the expectations of our customers, product demand and revenue, cash flows, product gross margins, our expectations to continue to develop new products and enhance existing products, our expectations regarding the amount of our research and development expenses, our expectations relating to our selling, general and administrative expenses, our efforts to achieve additional operating efficiencies and to review and improve our business systems and cost structure, our expectations to continue investing in technology, resources and infrastructure, our expectations concerning the availability of products from suppliers and contract manufacturers, anticipated product costs and sales prices, our expectations that we have sufficient capital to meet our requirements for at least the next twelve months, and our expectations regarding materials and inventory management. These forward-looking statements involve risks and uncertainties, and the cautionary statements set forth below and those contained in the section entitled "Risk Factors" identify important factors that could cause actual results to differ materially from those predicted in any such forward-looking statements. We caution investors that actual results may differ materially from those projected in the forward-looking statements as a result of certain risk factors identified in this Form 10-K and other filings we have made with the Securities and Exchange Commission. More information about potential factors that could affect our business and financial results is set forth under "Risk Factors" and "Management's Discussion and Analysis of Financial Condition and Results of Operations."
PART I
Item1. Business
Overview
Extreme Networks, Inc., together with its subsidiaries, (collectively referred to as Extreme and as we , us and our ) is a leading provider of network infrastructure equipment and services for enterprises, data centers, and service providers. Our customers include businesses, hospitals, schools, hotels, telecommunications companies and government agencies around the world. Since our founding in 1996, our vision has been a world enabled by a unified network based upon Ethernet that simplifies each element and component of the network, and through simplification, provides services at a lower cost. As networks internal to businesses, between businesses and the Internet itself become more pervasive and critical to a wide variety of business and social communications, the volume and the demands of applications, data, users and devices on networks continue to increase. Our vision focuses on the design and delivery of easily deployable, highly scalable, secure and comprehensively managed networks which are reliable, fast, flexible and cost-effective. We primarily sell our products through an ecosystem of our channel partners who combine our Ethernet products with their offerings to create compelling information technology solutions for end user customers.
Industry Background
The networking industry has undergone significant changes in the last few years. With the mobilization of the workforce, the virtualization of the data center, and the demand for anywhere, anytime connectivity, across any device, Ethernet is the common technology across both enterprises and service providers. Extreme Networks' strategy, product portfolio, and research and development are aligned with the following trends:
• | Ethernet. Through its scalability, adaptability, and cost-effectiveness, has solidified its role as the basis for both public and private networks. At the same time, the enterprises and service providers expect the technology to follow a price-performance curve that mandates continued innovation by Ethernet vendors. |
• | Mobile Workforce . Employees expect high-quality and secure access to corporate resources in a Bring Your Own Device ("BYOD") world across a diversity of endpoints such as laptops, tablets, and smart phones, whether they are within the corporate firewall or on-the-go. IT departments focus their investment decisions on this mobile workforce, taking a unified view of wireless access, the campus core, and the data center. Networking vendors offer end-to-end solutions that permit IT managers to meet employee expectations and to maximize IT return on investment. |
• | The Cloud. Data center architectures are influenced by the cloud and by the deployment of server virtualization. Enterprises have migrated applications and services to either private clouds, or public clouds offered by 3 rd parties. In either case, the network infrastructure must adapt to this new dynamic environment. Intelligence and automation are key if enterprises are to derive maximum benefit from their cloud deployments. Ethernet, scaling from 10 Gigabits (G) to 40G and even 100G, provides the infrastructure for both private and public clouds. In addition, there is growing interest in Software Defined Network (SDN) approaches that may include technologies such as OpenFlow, OpenStack, and CloudStack. |
3
Table of Contents
• | Public Network Evolution . 3G and 4G mobile networks now provide the necessary capacity and reach to enable employees to be productive away from the office and away from fixed networks. Mobile operators continue to invest in their next-generation networks, and Ethernet is the technology often used for their access networks, referred to as Mobile Backhaul. |
• | Vendor Consolidation . Consolidation of vendors within the Ethernet networking market and between adjacent markets (storage, security, wireless & voice applications) continues to gain momentum. We believe that the underpinning technology for all of these adjacent markets is Ethernet. As a result, we believe that there will be continued mergers between adjacent market vendors to enable them to deliver complete and broad solutions to customers. |
The Extreme Networks Strategy
With the proliferation of mobile users and their devices, within a campus or across continents, the challenges of operating and managing a network have changed. IT has rapidly evolved from a world of fixed to a new world of mobility where everything-people, devices, machines, and applications-are in motion. IT now has to support end users with smart phones, tablets, laptops and other wireless peripherals as well as their wired workstations. Users are beginning to define the services that IT must offer as they adopt tablets and their applications, and work on the go. Users know what they need to be productive, and they expect the network to help them achieve productivity.
Extreme Networks provides networks designed for mobility. Customers deploying our technology can know what resources are using the network, what they are requesting and where they are located, and can provide customized access to approved resources and content.
Our networks help enable granular visibility and control, higher performance and resource security.
Extreme Networks strategy is to offer sophisticated, open, and cost effective scalable networks, an alternative to single-sourced, highly proprietary networking equipment from other companies. Our commitment to open standards is manifested by demonstrated interoperability within both enterprise and service provider networks, and the active participation in key industry and standards associations.
Key elements of our strategy include:
• | Provide simple, easy-to-use, high-performance, cost-effective switching solutions. We offer simple, easy-to-use, high performance and cost-effective switching solutions that meet the specific demands of the following customers: |
◦ | Enterprises and cloud data centers use our products to deploy next generation virtualized and high-density server infrastructure solutions. |
◦ | Enterprises, including large or medium sized businesses, schools, hospitals, hotels and government agencies, use our products for their campus access and backbone networks. |
◦ | Mobile Operators deploy our products for mobile backhaul in support of mobile broadband. |
• | Extend switching technology leadership. Our technological leadership is based on innovative switching technology, the depth and focus of our market experience and the ExtremeXOS ® operating system - the software that runs on all of our Ethernet switches. Our standardization on a single network operating system, a primary merchant silicon vendor, and single Original Design Manufacturer (" ODM ") for our core products permit us to derive leverage from our engineering investment. We intend to invest our engineering resources to continue to create leading-edge technologies that will increase the performance and functionality of our products and as a direct result, the value of the Extreme Networks solution to our current and future customers. In addition, we look for maximum synergies from our engineering investment in our targeted verticals and when targeting new vertical market segments. |
• | Expand market penetration by targeting high-growth verticals. Within the campus, we focus on the mobile user, leveraging our automation capabilities and tracking wireless LAN growth. Our data center approach leverages our product portfolio to address the needs of managed hosting and cloud data center providers, while we deliver key components of mobile backhaul solutions to our network equipment partners. Within the campus we also target the high-growth physical security market, converging technologies such as IP video across a common Ethernet infrastructure in conjunction with our technology partners |
• | Leverage and expand multiple distribution channels. We distribute our products through select distributors, a large number of resellers and system-integrators worldwide and our large strategic partners. We maintain a field sales force to support our channel partners and to sell directly to certain strategic accounts. As an independent Ethernet switch |
4
Table of Contents
vendor, we seek to provide products that, when combined with the offerings of our channel partners, create compelling solutions for end user customers.
• | Maintain and extend our Strategic Relationships. We have established strategic relationships with a number of industry-leading vendors to both provide increased and enhanced routes to market, but also to collaboratively develop unique solutions. |
• | Provide high-quality customer service and support. We seek to enhance customer satisfaction and build customer loyalty through high-quality service and support. This includes a wide range of standard support programs that provide the level of service our customers require, from standard business hours to global 24-hour-a-day, 365-day-a-year real-time response support. |
Products
Our products offer a resilient, intelligent and sustainable foundation for Enterprise IT. We build our products into vertical markets solutions for converged campus networks with user and device mobility, and for Data Center and Cloud administrators to virtualize their server and storage over a high-performance Ethernet infrastructure, and Service Providers to provide bandwidth and Service Level Agreements for Carrier Ethernet, 3G and 4G services.
• | Resilient . Customers can choose to deploy redundant management and fabric modules, hot swappable line cards, multi-speed stacking across 100 Megabits (M)/1G/10G/40G systems, redundant power supplies and fan trays delivering high hardware availability. These are supported by ExtremeXOS, our modular and fault-tolerant network operating system that spans our complete switching portfolio. Technologies supported include a variety of layer-2 resiliency protocols including multi-switch Link Aggregation (M-LAG), Ethernet Automatic Protection Switching (EAPS), MPLS/VPLS for high service availability, and layer-3 IPv4 and IPv6 routing protocols for high network availability. EAPS is an example of Extreme Networks innovation and allows network managers to configure their network infrastructure so that critical network communications can be rerouted within 50 milliseconds in the event of a network outage in most topologies. This level of high-speed communications 'reroute' is targeted for mission critical and demanding applications, including voice and video and maintains service delivery in the event of network outage. We further offer a versatile and flexible Quality of Service ( "QoS" ) solution that allows network operators to configure bandwidth for mission critical applications and in doing so control the overall experience and the service-level of the communication flows. We have deep experience with communication quality controls, starting with our introduction to the market of the first broad QoS controls for Ethernet to the recent Data Center Bridging (" DCB" ) protocols for 'lossless' Ethernet that enables traditional storage networks to converge over a common Ethernet infrastructure. Our mobile backhaul products also support sophisticated timing functionality including Synchronous Ethernet and RFC1588, as well as Time Division Multiplexing (" TDM ") interfaces for the transport of T1/E1 traffic across an Ethernet infrastructure. |
• | Intelligent . Based on a resilient ExtremeXOS foundation, our customers can take advantage of user, machine and application visibility and control from the networks infrastructure. Universal Port automatically detects new devices such as IP phones that plug-in to the network and can assign appropriate power, server and other configurations. The Identity Management engine allows tracking of users based on their login id and host machine, and assigning them to roles based on guest, contractor, or employee privilege. In the Data Center and Cloud, ExtremeXOS Network Virtualization (XNV) allows network administrators visibility into Virtual Machine (VM) movement and having virtual port-profiles follow VMs as they move within and across network switches. CLEAR-Flow, our wire-speed security rules engine, helps detect and mitigate traffic anomalies, including denial of service attacks. This user, machine, virtual machine, and traffic intelligence helps our customers fulfill the productivity promise from the exploding growth of mobility and cloud applications. These customers are further able to simplify provisioning and operations by leveraging extensibility capabilities inherent in ExtremeXOS including the ability to create custom scripts, dynamically load application modules, or moving to a dynamic extensible Markup Language (XML) from static SNMP based management. |
• | Sustainable . Our portfolio of switching hardware has been created with power consumption in mind. Our switches are designed to require less power to perform the network traffic switching function, and where Power over Ethernet (PoE) solutions have been deployed within the customers' network, features within the Extreme XOS operating system can intelligently control the delivery of power to the attached devices. In addition to lower power consumption, the air flow on our Data Center switches is built to integrate well with hot-aisle-cool-aisle designs to help minimize cooling costs. |
5
Table of Contents
• | Vertical Market Solutions . Our hardware and software offerings can be combined into complete solutions targeted at specific high-growth vertical markets. These include Open Fabric, our architecture for open and scalable next-generation data center deployments that offer investment protection and provide a path to SDN. Extreme Network's All Ethernet Open Fabric is anchored by our BlackDiamond BDX switch, our Summit top-of-rack data center switches, RidgeLine management, and where required, products from technology partners. In the campus, our Intelligent Mobile Edge offering combines our Summit edge virtual chassis switches, our WLAN access point and controller portfolio, and our RidgeLine management platform offering rich user and device identity awareness. |
Our product categories include:
• | Modular Ethernet switching systems. Our Black Diamond ® products deliver modular or chassis-based Ethernet connectivity solutions for enterprises, data centers and service providers. These products have a range of management and line cards that allow our customers to flexibly configure and re-purpose the systems to meet specific needs. The Black Diamond products in conjunction with our ExtremeXOS operating system and our centralized management software product provide the density, performance and reliability required to serve in environments with demanding applications. |
• | Stackable Ethernet switching systems . Our Summit ® product family delivers Ethernet connectivity for the network edge, aggregation and core. Within the Summit family are products that offer a range of connection speeds (from 10 Megabit to 40 Gigabit), various physical presentations (copper and fiber) and options to deliver Power-over-Ethernet or unpowered standard Ethernet ports. As with the our Black Diamond products, the Summit products in conjunction with our ExtremeXOS operating system provide the features, performance and reliability required by our customers to deploy, operate and manage converged networking infrastructure. |
• | Wireless Ethernet controllers and access points . In addition to our wired Ethernet switch portfolio, we offer our SummitWM family of wireless network controllers and associated Altitude™ access points to enable the deployment of nomadic and mobile converged network applications. Our wireless access products offer both indoor and outdoor 802.11abgn access points. |
• | Centralized Management software. To provide a central configuration, status and alerting capability we offer our RidgeLine management software system. This system provides the ability to deploy, configure, monitor and support our complete range of switching technology to enable our customers to reduce the overall cost of network administration and operations. This software system can exist as a standalone management solution or it can operate as part of a larger infrastructure management environment, and includes features tailored to data center, campus, and service provider management. |
Sales, Marketing and Distribution
We conduct our sales and marketing activities on a worldwide basis through a distribution channel utilizing distributors, resellers and our field sales organization. We primarily sell our products through an ecosystem of channel partners who combine our Ethernet products with their offerings to create compelling information technology solutions for end user customers. We utilize our field sales organization to support our channel partners and to sell direct to end-user customers, including some large global accounts.
Strategic Relationships. We have strategic relationships with Ericsson Enterprise AB, Motorola Inc., Netgear, Inc., Nokia Siemens Networks and others who sell our products as part of an overall solution.
Distributors . We have established several key relationships with leading distributors in the electronics and computer networking industries. Each of our distributors primarily resells our products to resellers. The distributors enhance our ability to sell and provide support to resellers, who may benefit from the broad service and product fulfillment capabilities offered by these distributors. One distributor, Westcon Group, Inc., accounted for 19%, 16%, and 16% of our net revenue in fiscal years 2012 , 2011 and 2010 , respectively. Distributors are generally given the right to return a portion of inventory to us for the purpose of stock rotation, to claim rebates for competitive discounts and participate in various cooperative marketing programs to promote the sale of our products and services. We defer recognition of revenue on all sales to distributors who maintain inventory of our products until the distributors sell the product, as evidenced by monthly "sales-out" reports that the distributors provide to us, provided other revenue recognition criteria are met. (See "Revenue Recognition" in Item 7. Management's Discussion and Analysis of Financial Condition and Results of Operations .)
Resellers. We rely on many resellers worldwide that sell directly to end-user customer. Our resellers include regional networking system resellers, resellers who focus on specific vertical markets, value added resellers, network integrators and wholesale resellers. We provide training and support to our resellers and our resellers generally provide the first level of contact to end-users of our products. Our relationships with resellers are on a non-exclusive basis. Our resellers are not given rights to
6
Table of Contents
return inventory and do not automatically participate in any cooperative marketing programs. We generally recognize product revenue from our reseller and end-user customers at the time of shipment, provided other revenue recognition criteria are met. When significant obligations or contingencies remain after products are delivered, such as installation or customer acceptance, revenue and related costs are deferred until such obligations or contingencies are satisfied. (See "Revenue Recognition" in Item 7. Management's Discussion and Analysis of Financial Condition and Results of Operations .)
Field Sales. We have trained our field sales organization to support and develop leads for our resellers and to establish and maintain key accounts and strategic end user customers. To support these objectives, our field sales force:
• | assists end-user customers in finding solutions to complex network system and architecture problems; |
• | differentiates the features and capabilities of our products from competitive offerings; |
• | continually monitors and understands the evolving networking needs of enterprise and service provider customers; |
• | promotes our products and ensures direct contact with current and potential customers; and |
• | assists our resellers to drive to closure business opportunities. |
As of June 30, 2012 , our worldwide sales and marketing organization consisted of 266 employees, including directors, managers, sales representatives, and technical and administrative support personnel. We have domestic sales offices located in 10 states and international sales offices located in 23 countries.
Customers with 10% of net revenue or greater
The following table sets forth major customers accounting for 10% or more of our net revenue:
|
| Fiscal Year Ended | |||||||
|
| June 30, 2012 |
| July 3, 2011 |
| June 27, 2010 | |||
Westcon Group Inc. |
| 19 | % |
| 16 | % |
| 16 | % |
Scansource, Inc. |
| 13 | % |
| 14 | % |
| 13 | % |
Ericsson AB |
| 12 | % |
| 11 | % |
| * | |
Tech Data Corporation |
| * | |
| 11 | % |
| 12 | % |
|
|
|
|
|
|
| |||
* Less than 10% of revenue |
|
|
|
|
|
| |||
International sales
International sales are an important portion of our business. In fiscal 2012 , sales to customers outside of the United States accounted for 67% of our consolidated net revenue, compared to 68% in fiscal 2011 and 63% in fiscal 2010 . These sales are conducted primarily through foreign-based distributors and resellers managed by our worldwide sales organization. In addition, we have direct sales to end-user customers, including large global accounts. The primary markets for sales outside of the United States are countries in Europe and Asia, as well as Canada, Mexico, Central America and South America. (See "Net Revenue" in Item 7. Management's Discussion and Analysis of Financial Condition and Results of Operations .)
Long-Lived Assets
See Note 2 of our Notes to Consolidated Financial Statements in this Annual Report on Form 10-K for more information regarding our long-lived assets.
Marketing
We continue to develop and execute on a number of marketing programs to support the sale and distribution of our products by communicating the value of our solutions to our existing and potential customers, our distribution channels and our resellers. Our marketing efforts include participation in industry tradeshows, conferences and seminars, publication of technical and educational articles in industry journals, frequent updates to our publicly available website, promotions, web-based training courses, advertising and public relations. We also submit our products for independent product testing and evaluation.
Backlog
7
Table of Contents
Our product backlog at June 30, 2012, the last day of our 2012 fiscal year, net of anticipated back end rebates for distributor sales, was approximately $10.6 million, compared with product backlog of approximately $12.7 million at July 3, 2011, the last day of our 2011 fiscal year. Our products are often sold on the basis of standard purchase orders that are cancelable prior to shipment without significant penalties. In addition, purchase orders are subject to changes in quantities of products and delivery schedules in order to reflect changes in customer requirements and manufacturing capacity. Our business is characterized by seasonal variability in demand and short lead-time orders and delivery schedules. Actual shipments depend on the then-current capacity of our contract manufacturers and the availability of materials and components from our vendors. Although the Company believes that the orders included in the backlog are firm, all orders are subject to possible rescheduling by customers, cancellations by customers which the Company may elect to allow without penalty to customer, and further pricing adjustments on orders from distributors. Therefore, the Company does not believe that its backlog, as of any particular date is necessarily indicative of actual revenue for any future period.
Seasonality
Like many of our competitors, we historically have experienced seasonal fluctuations in customer spending patterns, which generally adversely affect our first and third fiscal quarters. This pattern should not be relied upon, however, as it has varied in the past.
Customer Service and Support
Our customers seek high reliability and maximum uptime for their networks. To that extent, we provide the following service offerings:
• | Support services for end-users, resellers and distributors. We meet the service requirements of our customers and channel partners through our Technical Assistance Centers, or TACs, located in Utrecht, Netherlands; Research Triangle Park, North Carolina; and Chennai, India. Our TAC engineers and technicians assist in diagnosing and troubleshooting technical issues regarding customer networks. Development engineers work with the TACs to resolve product functionality issues specific to each customer. |
• | Professional services . We provide consultative services to improve customer productivity in all phases of the network lifecycle – planning, design, implementation, operations and optimization management. Our network architects develop and execute customized hardware deployment plans to meet individualized network strategies. These activities may include the management and coordination of the design and network configuration, resource planning, staging, logistics, migration and deployment. We also provide customized training and operational best practices manuals to assist customers in the transition and sustenance of their networks. |
• | Education . Our classes cover a wide range of topics such as installation, configuration, operation, management and optimization – providing customers with the necessary knowledge and experience to successfully deploy and manage our products in various networking environments. Classes may be scheduled and available at numerous locations worldwide. We deliver training using our staff, on-line training classes and authorized training partners. In addition, we make much of our training materials accessible free-of-charge on our internet site for customers and partners to use in self-education. We believe this approach enhances the market's ability to learn and understand the broad array of advantages of our products. |
Manufacturing
We outsource the majority of our manufacturing and supply chain management operations as part of our strategy to maintain global manufacturing capabilities and to reduce our costs. We conduct quality assurance, manufacturing engineering, document control and test development at our main campus in Santa Clara, California. This approach enables us to reduce fixed costs and to flexibly respond to changes in market demand. Our end-to-end supply chain, including our three engineering facilities at Santa Clara, RTP, and Chennai, India, are all ISO 9001 certified.
We use Alpha Networks, Inc. headquartered in Hsinchu, Taiwan to design and build some of our products. Alpha Networks is a global networking Original Design Manufacturer ("ODM") leader with core competencies in areas such as Ethernet, LAN/MAN, Wireless, Broadband and VoIP. Alpha Networks, Inc.'s manufacturing processes and procedures are ISO 9001 certified.
Our wireless products are supplied under an Original Equipment Manufacturer ("OEM") supply agreement with Symbol Technologies, Inc., a subsidiary of Motorola, Inc. ("Motorola"). Motorola rebrands and customizes the wireless products for us to resell to customers. Motorola's manufacturing processes and procedures are ISO 9001 certified. Motorola has made ongoing supply and support commitments during the term of the agreement and is required to provide support for a defined period of time after any termination of the agreement.
These manufacturers utilize automated testing equipment to perform product testing and burn-in with specified tests.
8
Table of Contents
Together we rely upon comprehensive inspection testing and statistical process controls to assure the quality and reliability of our products.
We use our forecast of expected demand to determine our material requirements. Lead times for materials and components vary significantly, and depend on factors such as the specific supplier, contract terms and demand for a component at a given time. We order most of our materials and components on an indirect basis through our contract manufacturer. Purchase commitments with our manufacturers/ODM/OEM's are generally on a purchase order basis.
We contract with Flextronics International, Ltd. for the repair of some of our products in Guadalajara, Mexico.
Research and Development
The success of our products to date is due in large part to our focus on research and development. We believe that continued success in the marketplace will depend on our ability to develop new and enhanced products employing leading-edge technology. Accordingly, we are undertaking development efforts with an emphasis on increasing the reliability, performance and features of our family of products, and designing innovative products to reduce the overall network operating costs of customers.
Our product development activities focus on solving the needs of enterprises, data centers, and service providers. Current activities include the continuing development of our innovative switching technology aimed at extending the capabilities of our products. Our ongoing research activities cover a broad range of areas, including, in particular, 40G and 100G Ethernet, routing, timing and resiliency protocols, network security, identity management, data center fabrics, and wireless networking.
We continue to enhance the functionality of our modular operating system (ExtremeXOS) which has been designed to provide high reliability and availability. This allows us to leverage a common operating system across different hardware and network chipsets.
As of June 30, 2012 , our research and development organization consisted of 210 employees. Research and development efforts are conducted in several locations, including Santa Clara, California; Raleigh, North Carolina; and Chennai, India. Our research and development expenses in fiscal years 2012 , 2011 and 2010 were $45.6 million , $49.3 million and $49.4 million , respectively.
Competition
The market for network switches, which is part of the broader market for networking equipment, is extremely competitive and characterized by rapid technological progress, frequent new product introductions, changes in customer requirements and evolving industry standards. We believe the principal competitive factors in the network switching market are:
• | expertise and familiarity with network protocols, network switching and network management; |
• | product performance, features, functionality and reliability; |
• | price/performance characteristics; |
• | timeliness of new product introductions; |
• | adoption of emerging industry standards; |
• | customer service and support; |
• | size and scope of distribution network; |
• | brand name; |
• | breadth of product offering; |
• | access to customers; and |
• | size of installed customer base. |
We believe that we compete with our competitors with respect to many of the foregoing factors. However, the market for network switching solutions is dominated by a few large companies, particularly Brocade Communications Systems, Inc., Cisco Systems, Inc., Hewlett-Packard Company, Huawei, and Juniper Networks Inc. Most of these competitors have longer operating histories, greater name recognition, larger customer bases, broader product lines and substantially greater financial, technical, sales, marketing and other resources.
Intellectual Property
We rely on a combination of patent, copyright, trademark and trade secret laws and restrictions on disclosure to protect our
9
Table of Contents
intellectual property rights. As of June 30, 2012 , the Company has 158 issued patents in the United States and 33 patents outside of the United States. The expiration dates of the Company's issued patents in the United States range from 2017 to approximately 2032 . Although the Company has patent applications pending, there can be no assurance that patents will be issued from pending applications or that claims allowed on any future patents will be sufficiently broad to protect the Company's technology. With respect to trademarks, we have a number of pending and registered trademarks in the United States and abroad.
We enter into confidentiality or license agreements with our employees, consultants and corporate partners, and control access to, and distribution of, our software, documentation and other proprietary information. In addition, we provide our software products to end-user customers primarily under "shrink-wrap" license agreements. These agreements are not negotiated with or signed by the licensee, and thus these agreements may not be enforceable in some jurisdictions. Despite our efforts to protect our proprietary rights, unauthorized parties may attempt to copy or otherwise obtain and use our products or technology, particularly in foreign countries where the laws may not protect our proprietary rights as fully as in the United States.
Environment
We are committed to energy efficiency in our product lines. For example, some of our products consume less power than offerings from our major competitors under normal operations. Accordingly, we believe this is an area that affords us a competitive advantage for our products in the marketplace. We maintain compliance with various regulations related to the environment, including the Waste Electrical and Electronic Equipment and Restriction of the Use of Certain Hazardous Substances in Electrical and Electronic Equipment regulations adopted by the European Union. To date, our compliance efforts with various U.S. and foreign regulations related to the environment has not had a material effect on our operating results.
Employees
As of June 30, 2012 , we employed 668 people, including 266 in sales and marketing, 210 in research and development, 74 in operations, 63 in customer support and service, and 55 in finance and administration. We have never had a work stoppage and no U.S. personnel are represented under collective bargaining agreements. We consider our employee relations to be good.
We believe that our future success depends on our continued ability to attract, integrate, retain, train and motivate highly qualified personnel, and upon the continued service of our senior management and key personnel. None of our executive officers or key employees is bound by an employment agreement which mandates that the employee render services for any specific term. The market for qualified personnel is competitive.
Organization
We were incorporated in California in May 1996 and reincorporated in Delaware in March 1999. Our corporate headquarters are located at 3585 Monroe Street, Santa Clara, CA 95051 and our telephone number is (408) 579-2800. We electronically file our annual reports on Form 10-K, quarterly reports on Form 10-Q and current reports on Form 8-K pursuant to Section 13(a) or 15(d) of the Securities Exchange Act of 1934 with the Securities Exchange Commission. The public can obtain copies of our SEC filings from our website found at www.extremenetworks.com free of charge, or on the Securities Exchange Commission's website at www.sec.gov. The public may also read or copy any materials we file with the Securities Exchange Commission at the Securities Exchange Commission's Public Reference Room at 450 Fifth Street, NW, Washington, DC 20549. The public may obtain information on the operation of the Public Reference Room by calling the Securities Exchange Commission at 1-800-SEC-0330.
Our corporate governance guidelines, the charters of our audit committee, our compensation committee and our nominating and corporate governance committee and our code of ethics policy (including code of ethics provisions that apply to our principal executive officer, principal financial officers, controller and senior financial officers) are available on our website at www.extremenetworks.com under "Corporate Governance." These items are also available to any stockholder who requests them by calling (408) 579-2800.
Executive Officers of the Registrant
The following table sets forth information regarding our executive officers as of August 22, 2012 :
10
Table of Contents
Name | Age |
| Position |
Oscar Rodriguez | 52 |
| President and Chief Executive Officer |
John Kurtzweil | 56 |
| Senior Vice President and Chief Financial Officer |
David Ginsburg | 49 |
| Chief Marketing Officer |
Gavin Cato | 44 |
| Vice President, Engineering |
Mimi Gigoux | 51 |
| Senior Vice President, Human Resources |
Diane C. Honda | 47 |
| Vice President, General Counsel and Secretary |
Margaret Echerd | 53 |
| Vice President, Corporate Controller |
Oscar Rodriguez. Mr. Rodriguez has served as our President and Chief Executive Officer since August 2010. From April 2007 to August 2010, Mr. Rodriguez served as the Chief Executive Officer of Movius Interactive Corporation, a privately held messaging collaboration and mobile media solutions company. Prior to Movius, beginning in April 2006, Mr. Rodriguez served as Chief Marketing Officer for Alcatel-Lucent's Enterprise Business Group. Mr. Rodriguez previously also served as CEO and President of Riverstone Networks, a publicly traded network company focused on Metro Ethernet switching. In addition, Mr. Rodriguez served as President of both the Enterprise Solutions division and the Intelligent Internet division at Nortel Networks. Mr. Rodriguez holds a B.S. in computer engineering from the University of Central Florida, and an M.B.A. from the University of North Carolina at Chapel Hill.
John Kurtzweil. Mr. Kurtzweil has served as our Senior Vice President, Chief Financial Officer, since June 29, 2012. Mr. Kurtzweil has over 30 years of corporate finance and accounting experience. From 2006 to 2012, Mr. Kurtzweil served as Executive Vice President, Finance and as Chief Financial Officer and Treasurer of Cree, Inc. Prior to Cree, Mr. Kurtzweil was Senior Vice President and Chief Financial Officer at Cirrus Logic, Inc. from 2004-2006. Mr. Kurtzweil, who is a certified public accountant and certified management accountant, earned an MBA from the University of St. Thomas, and a B.A. in Accounting from Arizona State University.
David Ginsburg. Mr. Ginsburg has served as our Chief Marketing Officer since July 2011. From November 2010 to July 2011, he served as our Senior Vice President, Strategic Marketing. From October 2006 to May 2010, Mr. Ginsburg served as Vice President of Marketing for InnoPath, a privately held company focused on over-the-air smart phone management and customer care. From May 2006 to October 2006, Mr. Ginsburg served as Vice President of Marketing at Lucent Technologies, where he was responsible for all aspects of Lucent's Carrier Ethernet Solutions marketing, product strategy and business operations. He previously was Senior Vice President of Marketing and Product Management at Riverstone Networks, Vice President of Marketing at Allegro Networks and Vice President of Product Marketing at Nortel Networks. Mr. Ginsburg holds a B.S.E.E. from Rensselaer Polytechnic Institute.
Gavin Cato . Dr. Cato has served as our Vice President of Engineering since June 2011. Prior to joining Extreme Networks, Dr. Cato was Director of Strategic Alliances for Elster Solutions from August 2010 to June 2011 and had his own business consulting practice under Timewater Group, LLC from February 2009 to August 2010. From 2006 to February 2009, Dr. Cato held leadership roles in Tekelec, a hardware and software solutions company, including Vice President of Market Development, Vice President of Product Management, and Vice President of Strategic Solutions. Dr. Cato has also held leadership roles in research and development and product management for Arsenal Digital Solutions and Nortel Networks. Dr. Cato holds B.S. and M.S. degrees in Electrical Engineering from Duke University, a PhD in Computer Engineering from North Carolina State University, and an M.B.A. from Duke University.
Mimi Gigoux . Ms. Gigoux has served as our Senior Vice President of Human Resources since April 2011. From January 2010 to April 2011, Ms. Gigoux served as Chief Human Resources Officer and Senior Vice President of Aviat Networks, a mobile broadband technology company, where she led its worldwide HR organization. From May 2005 to October 2009, Ms. Gigoux served as Vice President of HR and Chief of Staff at Redback Networks, where she led major organizational changes to address its rapid expansion and subsequent acquisition by Ericsson.
Diane C. Honda. Ms. Honda serves as our Vice President, General Counsel and Secretary. She joined us in November 2004 as Vice President and Associate General Counsel. She previously held legal or business positions with Speedera Networks, Inc., Riverstone Networks, Inc., Legato Systems, Inc., and Hewlett-Packard Company. She received a bachelor's in science in Applied Math Computer Science and Industrial Management from Carnegie Mellon University and a J.D. from Santa Clara University School of Law.
Margaret Echerd. Ms. Echerd has served as our Vice President, Corporate Controller and Principal Accounting Officer since September 2011. Ms. Echerd previously served as out Assistant Corporate Controller from June 2010 to September 2011. Prior to joining us, Ms. Echerd served as Corporate Controller of XeroCoat, Inc., a solar technology company, from December 2008 to May 2010. From October 2006 to July 2008, Ms. Echerd served as the US Controller for Align Technology, Inc., a medical device company. Ms. Echerd, who is a certified public accountant, earned a BBA in Marketing from Texas A&M University and
11
Table of Contents
an MBA from Golden Gate University.
Item 1A. Risk Factors
The following is a list of risks and uncertainties which may have a material and adverse effect on our business, financial condition or results of operations. The risks and uncertainties set out below are not the only risks and uncertainties we face, and some are endemic to the networking industry.
We cannot assure you that we will be profitable in the future because a number of factors could negatively affect our financial results.
We have a limited history of profitability and have reported losses in some of our prior fiscal years. In addition, in years when we reported profits, we were not profitable in each quarter during those years. We anticipate continuing to incur significant sales and marketing, product development and general and administrative expenses. Any delay in generating or recognizing revenue could result in a loss for a quarter or full year. Even if we are profitable, our operating results may fall below our expectations and those of our investors, which could cause the price of our stock to fall.
We may experience challenges or delays in generating or recognizing revenue for a number of reasons and our revenue and operating results have varied significantly in the past and may vary significantly in the future due to a number of factors, including, but not limited to, the following:
• | we are dependent upon obtaining orders during a quarter and shipping those orders in the same quarter to achieve our revenue objectives; |
• | decreases in the prices of the products that we sell; |
• | the mix of products sold and the mix of distribution channels through which products are sold; |
• | acceptance provisions in customer contracts; |
• | our ability to deliver installation or inspection services by the end of the quarter; |
• | changes in general and/or specific economic conditions in the networking industry; |
• | seasonal fluctuations in demand for our products and services; |
• | a disproportionate percentage of our sales occurring in the last month of the quarter; |
• | our ability to ship products by the end of a quarter; |
• | reduced visibility into the implementation cycles for our products and our customers' spending plans; |
• | our ability to forecast demand for our products, which in the case of lower-than-expected sales, may result in excess or obsolete inventory in addition to non-cancelable purchase commitments for component parts; |
• | sales to the telecommunications service provider market, which represent a significant source of large product orders, are especially volatile and difficult to forecast; |
• | product returns or the cancellation or rescheduling of orders; |
• | announcements and new product introductions by our competitors; |
• | our ability to develop and support relationships with enterprise customers, service providers and other potential large customers; |
• | our ability to achieve targeted cost reductions; |
• | fluctuations in warranty or other service expenses actually incurred; |
• | our ability to obtain sufficient supplies of sole- or limited-source components for our products on a timely basis; |
• | increases in the prices of the components that we purchase. |
Due to the foregoing factors, period-to-period comparisons of our operating results should not be relied upon as an indicator of our future performance.
Intense competition in the market for networking equipment could prevent us from increasing revenue and maintaining profitability.
The market for network switching solutions is intensely competitive and dominated primarily by Brocade Communications Systems, Inc., Cisco Systems Inc., Hewlett-Packard Company, Huawei, and Juniper Networks, Inc. Most of our competitors have longer operating histories, greater name recognition, larger customer bases, broader product lines and substantially greater financial, technical, sales, marketing and other resources. As a result, these competitors are able to devote greater resources to the development,
12
Table of Contents
promotion, sale and support of their products. In addition, they have larger distribution channels, stronger brand names, access to more customers, a larger installed customer base and a greater ability to make attractive offers to channel partners and customers than we do. For example, we have encountered, and expect to continue to encounter, many potential customers who are confident in and committed to the product offerings of our principal competitors. Accordingly, these potential customers may not consider or evaluate our products. When such potential customers have considered or evaluated our products, we have in the past lost, and expect in the future to lose, sales to some of these customers as large competitors have offered significant price discounts to secure these sales.
The pricing policies of our competitors impact the overall demand for our products and services. Some of our competitors are capable of operating at significant losses for extended periods of time, increasing pricing pressure on our products and services. If we do not maintain competitive pricing, the demand for our products and services, as well as our market share, may decline. From time to time, we may lower the prices of our products and services in response to competitive pressure. When this happens, if we are unable to reduce our component costs or improve operating efficiencies, our revenue and margins will be adversely affected.
Industry consolidation may lead to stronger competition and may harm our operating results
There has been a trend toward industry consolidation in our markets for several years. We expect this trend to continue as companies attempt to strengthen or hold their market positions in an evolving industry and as companies are acquired or are unable to continue operations. For example, some of our current and potential competitors for enterprise data center business have made acquisitions, or announced new strategic alliances, designed to position them with the ability to provide end-to-end technology solutions for the enterprise data center. Companies that are strategic alliance partners in some areas of our business may acquire or form alliances with our competitors, thereby reducing their business with us. We believe that industry consolidation may result in stronger competitors that are better able to compete as sole-source vendors for customers. This could lead to more variability in our operating results and could have a material adverse effect on our business, operating results, and financial condition. Furthermore, particularly in the service provider market, rapid consolidation will lead to fewer customers, with the effect that loss of a major customer could have a material impact on results not anticipated in a customer marketplace composed of more numerous participants.
We may engage in future acquisitions that dilute the ownership interests of our stockholders, cause us to incur debt and assume contingent liabilities.
As part of our business strategy, we review acquisition and strategic investment prospects that we believe would complement our current product offerings, augment our market coverage or enhance our technical capabilities, or otherwise offer growth opportunities. In the event of any future acquisitions, we could:
• | issue equity securities which would dilute current stockholders' percentage ownership; |
• | incur substantial debt; |
• | assume contingent liabilities; or |
• | expend significant cash. |
These actions could have a material adverse effect on our operating results or the price of our common stock. Moreover, even if we do obtain benefits in the form of increased sales and earnings, these benefits may be recognized much later than the time when the expenses associated with an acquisition are incurred. This is particularly relevant in cases where it would be necessary to integrate new types of technology into our existing portfolio and new types of products may be targeted for potential customers with which we do not have pre-existing relationships. Acquisitions and investment activities also entail numerous risks, including:
• | difficulties in the assimilation of acquired operations, technologies and/or products; |
• | unanticipated costs associated with the acquisition or investment transaction; |
• | the diversion of management's attention from other business concerns; |
• | adverse effects on existing business relationships with suppliers and customers; |
• | risks associated with entering markets in which we have no or limited prior experience; |
• | the potential loss of key employees of acquired organizations; and |
• | substantial charges for the amortization of certain purchased intangible assets, deferred stock compensation or similar items. |
We may not be able to successfully integrate any businesses, products, technologies, or personnel that we might acquire in the future, and our failure to do so could have a material adverse effect on our business, operating results and financial condition.
13
Table of Contents
We expect the average selling prices of our products to decrease, which may reduce gross margin and/or revenue.
The network equipment industry has traditionally experienced an erosion of average selling prices due to a number of factors, including competitive pricing pressures, promotional pricing and technological progress. We anticipate that the average selling prices of our products will decrease in the future in response to competitive pricing pressures, excess inventories, increased sales discounts and new product introductions by us or our competitors. We may experience decreases in future operating results due to the erosion of our average selling prices. To maintain our gross margin, we must develop and introduce on a timely basis new products and product enhancements and continually reduce our product costs. Our failure to do so would likely cause our revenue and gross margin to decline.
Our success is dependent on our ability to continually introduce new products and features that achieve broad market acceptance.
The network equipment market is characterized by rapid technological progress, frequent new product introductions, changes in customer requirements and evolving industry standards. If we do not regularly introduce new products in this dynamic environment, our product lines will become obsolete. These new products must be compatible and inter-operate with products and architectures offered by other vendors. We have and may in the future experience delays in product development and releases, and such delays have and could in the future adversely affect our ability to compete and our operating results.
When we announce new products or product enhancements or end of sale existing products that have the potential to replace or shorten the life cycle of our existing products, customers may defer or cancel orders for our existing products. These actions could have a material adverse effect on our operating results by unexpectedly decreasing sales, increasing inventory levels of older products and exposing us to greater risk of product obsolescence.
Even if we introduce new switching products, alternative technologies could achieve widespread market acceptance and displace the Ethernet technology on which we have based our product architecture. For example, developments in routers and routing software could significantly reduce demand for our products. As a result, we may not be able to achieve widespread market acceptance of our current or future new products.
The unfavorable economic environment has and may continue to negatively impact our business and operating results.
The challenges and uncertainty currently affecting global economic conditions may negatively impact our business and operating results in the following ways:
• | customers may delay or cancel plans to purchase our products and services; |
• | customers may not be able to pay, or may delay payment of, the amounts that they owe us which may adversely affect our cash flow, the timing of our revenue recognition and the amount of revenue; |
• | increased pricing pressure may result from our competitors aggressively discounting their products; |
• | accurate budgeting and planning will be difficult due to low visibility into future sales; |
• | forecasting customer demand will be more difficult, increasing the risk of either excess and obsolete inventory if our forecast is too high or insufficient inventory to meet customer demand if our forecast is too low; and |
• | our component suppliers and contract manufacturers have been negatively affected by the economy which may result in product delays and changes in pricing and service levels. |
If global economic conditions do not show continued improvement, we believe that we could experience material adverse impacts to our business and operating results.
Claims of infringement by others may increase and the resolution of such claims may adversely affect our operating results.
Our industry is characterized by the existence of a large number of patents and frequent claims and related litigation regarding patents, copyrights (including rights to "open source" software), and other intellectual property rights. Because of the existence of a large number of patents in the networking field, the secrecy of some pending patents and the issuance of new patents at a rapid pace, it is not possible to determine in advance if a product or component might infringe the patent rights of others. Because of the potential for courts awarding substantial damages and the lack of predictability of such awards, it is not uncommon for companies in our industry to settle even potentially unmeritorious claims for very substantial amounts. Further, the entities with whom we have or could have disputes or discussions include entities with extensive patent portfolios and substantial financial assets. These entities are actively engaged in programs to generate substantial revenue from their patent portfolios and are seeking or may seek significant payments or royalties from us and others in our industry.
Litigation resulting from claims that we are infringing the proprietary rights of others has resulted and could in the future
14
Table of Contents
result in substantial costs and a diversion of resources, and could have a material adverse effect on our business, financial condition and results of operations. We have received notices from entities alleging that we may be infringing their patents, and we are currently parties to patent litigation as described under Part I, Item 3, Legal Proceedings. Without regard to the merits of these or any other claims, an adverse court order or a settlement could require us, among other actions, to:
• | stop selling our products that incorporate the challenged intellectual property; |
• | obtain a royalty bearing license to sell or use the relevant technology, and that license may not be available on reasonable terms or available at all; |
• | pay damages; or |
• | redesign those products that use the disputed technology. |
In addition, our products include so-called "open source" software. Open source software is typically licensed for use at no initial charge, but imposes on the user of the open source software certain requirements to license to others both the open source software as well as modifications to the open source software. Our use of open source software subjects us to certain additional risks for the following reasons:
• | open source license terms may be ambiguous and may result in unanticipated obligations regarding our products; |
• | open source software cannot be protected under trade secret law; |
• | suppliers of open-source software do not provide the warranty, support and liability protections typically provided by vendors who offer proprietary software; and |
• | it may be difficult for us to accurately determine the developers of the open source code and whether the acquired software infringes third-party intellectual property rights. |
We believe that even if we do not infringe the rights of others, we will incur significant expenses in the future due to disputes or licensing negotiations, though the amounts cannot be determined. These expenses may be material or otherwise adversely affect our operating results.
Our operating results may be negatively affected by defending or pursuing claims or lawsuits.
We have and may in the future pursue or be subject to claims or lawsuits in the normal course of our business. In addition to the intellectual property lawsuits described above, we are currently parties to securities and contract litigation as described in "Item 3. Legal Proceedings." Regardless of the result, litigation can be expensive, lengthy and disruptive to normal business operations. Moreover, the results of complex legal proceedings are difficult to predict. An unfavorable resolution of a lawsuit in which we are a defendant could result in a court order against us or payments to other parties that would have an adverse effect on our business, results of operations, or financial condition. Even if we are successful in prosecuting claims and lawsuits, we may not recover damages sufficient to cover our expenses incurred to manage, investigate and pursue the litigation. In addition, subject to certain limitations, we may be obligated to indemnify our current and former directors, officers and employees in certain lawsuits. We do not maintain insurance coverage which will cover all of our litigation costs and liabilities.
If we fail to protect our intellectual property, our business could suffer.
We rely on a combination of patent, copyright, trademark and trade secret laws and restrictions on disclosure to protect our intellectual property rights. However, we cannot ensure that the actions we have taken will adequately protect our intellectual property rights or that other parties will not independently develop similar or competing products that do not infringe on our patents. We generally enter into confidentiality or license agreements with our employees, consultants and corporate partners, and control access to and distribution of our intellectual property and other proprietary information. Despite our efforts to protect our proprietary rights, unauthorized parties may attempt to copy or otherwise misappropriate or use our products or technology, which would adversely affect our business.
When our products contain undetected errors, we may incur significant unexpected expenses and could lose sales.
Network products frequently contain undetected errors when new products or new versions or updates of existing products are released to the marketplace. In the past, we have experienced such errors in connection with new products and product updates. We have experienced component problems in prior years that caused us to incur higher than expected warranty, service costs and expenses, and other related operating expenses. In the future, we expect that, from time to time, such errors or component failures will be found in new or existing products after the commencement of commercial shipments. These problems may have a material adverse effect on our business by causing us to incur significant warranty, repair and replacement costs, diverting the attention of our engineering personnel from new product development efforts, delaying the recognition of revenue and causing significant customer relations problems. Further, if products are not accepted by customers due to such defects, and such returns exceed the
15
Table of Contents
amount we accrued for defective returns based on our historical experience, our operating results would be adversely affected.
Our products must successfully interoperate with products from other vendors. As a result, when problems occur in a network, it may be difficult to identify the sources of these problems. The occurrence of system errors, whether or not caused by our products, could result in the delay or loss of market acceptance of our products and any necessary revisions may cause us to incur significant expenses. The occurrence of any such problems would likely have a material adverse effect on our business, operating results and financial condition.
We purchase several key components for products from single or limited sources and could lose sales if these suppliers fail to meet our needs.
We currently purchase several key components used in the manufacture of our products from single or limited sources and are dependent upon supply from these sources to meet our needs. Certain components such as tantalum capacitors, SRAM, DRAM, and printed circuit boards, have been in the past, and may in the future be, in short supply. We have encountered, and are likely in the future to encounter, shortages and delays in obtaining these or other components, and this could have a material adverse effect on our ability to meet customer orders. Our principal sole-source components include:
• | ASICs; |
• | Merchant silicon; |
• | microprocessors; |
• | programmable integrated circuits; |
• | selected other integrated circuits; |
• | custom power supplies; and |
• | custom-tooled sheet metal. |
Our principal limited-source components include:
• | flash memory; |
• | DRAMs and SRAMs; |
• | printed circuit boards; and |
• | CAMs. |
We use our forecast of expected demand to determine our material requirements. Lead times for materials and components we order vary significantly, and depend on factors such as the specific supplier, contract terms and demand for a component at a given time. If forecasts exceed orders, we may have excess and/or obsolete inventory, which could have a material adverse effect on our operating results and financial condition. If orders exceed forecasts, we may have inadequate supplies of certain materials and components, which could have a material adverse effect on our ability to meet customer delivery requirements and to recognize revenue.
Generally, we do not have agreements fixing long-term prices or minimum volume requirements from suppliers. From time to time we have experienced shortages and allocations of certain components, resulting in delays in filling orders. Qualifying new suppliers to compensate for such shortages may be time-consuming and costly, and may increase the likelihood of errors in design or production. In addition, during the development of our products, we have experienced delays in the prototyping of our chipsets, which in turn has led to delays in product introductions. Similar delays may occur in the future. Furthermore, the performance of the components as incorporated in our products may not meet the quality requirements of our customers.
Our dependence on one manufacturer for our manufacturing requirements could harm our operating results.
We primarily rely on one manufacturing partner, Alpha Networks, Inc. headquartered in Hsinchu, Taiwan, to manufacture our products. We have experienced delays in product shipments from our manufacturing partner in the past, which in turn delayed product shipments to our customers. These or similar problems may arise in the future, such as delivery of products of inferior quality, delivery of insufficient quantity of products, or the interruption or discontinuance of operations of a manufacturer, any of which could have a material adverse effect on our business and operating results. In addition, any natural disaster or business interruption to our manufacturing partner could significantly disrupt our business. While we maintain strong relationships with our manufacturing partner, our agreements with this manufacturer are generally of limited duration and pricing, quality and volume commitments are negotiated on a recurring basis. The failure to maintain continuing agreements with our manufacturing partner could adversely affect our business. We intend to introduce new products and product enhancements, which will require that we
16
Table of Contents
rapidly achieve volume production by coordinating our efforts with those of our suppliers and contract manufacturer.
As part of our cost-reduction efforts, we will need to realize lower per unit product costs from our manufacturing partner by means of volume efficiencies and the utilization of manufacturing sites in lower-cost geographies. However, we cannot be certain when or if such price reductions will occur. The failure to obtain such price reductions would adversely affect our gross margins and operating results.
Our dependence on an OEM for all of our wireless products could harm our operating results.
We rely on Motorola to provide our wireless products. If we experience delays in product shipments from our OEM or if they experience delays from their suppliers, which in turn delays product shipments to our customers, our financial results could be negatively impacted. Problems such as delivery of products of inferior quality, delivery of insufficient quantity of products, or the interruption or discontinuance of operations of our OEM, may arise in the future, any of which could have a material adverse effect on our business and operating results.
We depend upon international sales for a significant portion of our revenue which imposes a number of risks on our business.
International sales constitute a significant portion of our net revenue. Our ability to grow will depend in part on the expansion of international sales. Our international sales primarily depend on the success of our resellers and distributors. The failure of these resellers and distributors to sell our products internationally would limit our ability to sustain and grow our revenue. There are a number of risks arising from our international business, including:
• | longer accounts receivable collection cycles; |
• | difficulties in managing operations across disparate geographic areas; |
• | difficulties associated with enforcing agreements through foreign legal systems; |
• | higher credit risks requiring cash in advance or letters of credit; |
• | difficulties in safeguarding intellectual property; |
• | political and economic turbulence; |
• | terrorism, war or other armed conflict; |
• | natural disasters and epidemics; |
• | potential adverse tax consequences; |
• | compliance with regulatory requirements of foreign countries, including compliance with rapidly evolving environmental regulations; |
• | compliance with U.S. laws and regulations pertaining to the sale and distribution of products to customers in foreign countries, including export controls and the Foreign Corrupt Practices Act; and |
• | the payment of operating expenses in local currencies, which exposes us to risks of currency fluctuations. |
All of our international sales are U.S. dollar-denominated. Future increases in the value of the U.S. dollar relative to foreign currencies could make our products less competitive in international markets. In the future, we may elect to invoice some of our international customers in local currency, which would expose us to fluctuations in exchange rates between the U.S. dollar and the particular local currency. If we do so, we may decide to engage in hedging transactions to minimize the risk of such fluctuations.
We have entered into foreign exchange forward contracts to offset the impact of payment of operating expenses in local currencies to some of our operating foreign subsidiaries. However, if we are not successful in managing these foreign currency transactions, we could incur losses from these activities.
We must continue to develop and increase the productivity of our indirect distribution channels to increase net revenue and improve our operating results.
Our distribution strategy focuses primarily on developing and increasing the productivity of our indirect distribution channels. If we fail to develop and cultivate relationships with significant channel partners, or if these channel partners are not successful in their sales efforts, sales of our products may decrease and our operating results could suffer. Many of our channel partners also sell products from other vendors that compete with our products. Our channel partners may not continue to market or sell our products effectively or to devote the resources necessary to provide us with effective sales, marketing and technical support. We may not be able to successfully manage our sales channels or enter into additional reseller and/or distribution
17
Table of Contents
agreements. Our failure to do any of these could limit our ability to grow or sustain revenue.
Our operating results for any given period have and will continue to depend to a significant extent on large orders from a relatively small number of channel partners and other customers. However, we do not have binding purchase commitments from any of them. A substantial reduction or delay in sales of our products to a significant reseller, distributor or other customer could harm our business, operating results and financial condition because our expense levels are based on our expectations as to future revenue and to a large extent are fixed in the short term. Under specified conditions, some third-party distributors are allowed to return products to us and unexpected returns could adversely affect our results.
The sales cycle for our products is long and we may incur substantial non-recoverable expenses or devote significant resources to sales that do not occur when anticipated.
Our products represent a significant strategic decision by a customer regarding its communications infrastructure. The decision by customers to purchase our products is often based on the results of a variety of internal procedures associated with the evaluation, testing, implementation and acceptance of new technologies. Accordingly, the product evaluation process frequently results in a lengthy sales cycle, typically ranging from three months to longer than a year, and as a result, our ability to sell products is subject to a number of significant risks, including risks that:
• | budgetary constraints and internal acceptance reviews by customers will result in the loss of potential sales; |
• | there may be substantial variation in the length of the sales cycle from customer to customer, making decisions on the expenditure of resources difficult to assess; |
• | we may incur substantial sales and marketing expenses and expend significant management time in an attempt to initiate or increase the sale of products to customers, but not succeed; |
• | if a sales forecast from a specific customer for a particular quarter is not achieved in that quarter, we may be unable to compensate for the shortfall, which could harm our operating results; and |
• | downward pricing pressures could occur during the lengthy sales cycle for our products. |
To successfully manage our business or achieve our goals, we must attract, retain, train, motivate, develop and promote key employees, and failure to do so can harm us.
Our success depends to a significant degree upon the continued contributions of our key management, engineering, sales and marketing, service and operations personnel, many of whom would be difficult to replace. We do not have employment contracts with these individuals that mandate that they render services for any specific term, nor do we carry life insurance on any of our key personnel. We have experienced and may in the future experience significant turnover in our executive personnel. In addition, retention has generally become more difficult for us, in part because the exercise price of most of the stock options granted to many of our employees is below the market price. As a result, we experienced high levels of attrition. We believe our future success will also depend in large part upon our ability to attract and retain highly skilled managerial, engineering, sales and marketing, service, finance and operations personnel. The market for these personnel is competitive, and we have had difficulty in hiring employees, particularly engineers, in the time-frame we desire.
Companies in the networking industry whose employees accept positions with competitors frequently claim that competitors have engaged in unfair hiring practices. We have from time to time been involved in claims like this with other companies and, although to date they have not resulted in material litigation, we do not know whether we will be involved in additional claims in the future. We could incur substantial costs in litigating any such claims, regardless of the merits.
Failure of our products to comply with evolving industry standards and complex government regulations may adversely impact our business.
If we do not comply with existing or evolving industry standards and government regulations, we may not be able to sell our products where these standards or regulations apply. The network equipment industry in which we compete is characterized by rapid changes in technology and customers' requirements and evolving industry standards. As a result, our success depends on:
• | the timely adoption and market acceptance of industry standards, and timely resolution of conflicting U.S. and international industry standards; and |
• | our ability to influence the development of emerging industry standards and to introduce new and enhanced products that are compatible with such standards. |
In the past, we have introduced new products that were not compatible with certain technological standards, and in the future, we may not be able to effectively address the compatibility and interoperability issues that arise as a result of technological
18
Table of Contents
changes and evolving industry standards.
Our products must also comply with various U.S. federal government regulations and standards defined by agencies such as the Federal Communications Commission, standards established by governmental authorities in various foreign countries and recommendations of the International Telecommunication Union. In some circumstances, we must obtain regulatory approvals or certificates of compliance before we can offer or distribute our products in certain jurisdictions or to certain customers. Complying with new regulations or obtaining certifications can be costly and disruptive to our business.
If we do not comply with existing or evolving industry standards or government regulations, we will not be able to sell our products where these standards or regulations apply, which may prevent us from sustaining our net revenue or achieving profitability.
Changes in the effective tax rate including from the release of the valuation allowance recorded against our net U.S. deferred tax assets, or adverse outcomes resulting from examination of our income or other tax returns or change in ownership, could adversely affect our results.
Our future effective tax rates may be volatile or adversely affected by changes in our business or U.S. or foreign tax laws, including: the partial or full release of the valuation allowance recorded against our net U.S. deferred tax assets; expiration of or lapses in the research and development tax credit laws; transfer pricing adjustments; tax effects of stock-based compensation; or costs related to restructurings. In addition, we are subject to the examination of our income tax returns by the Internal Revenue Service and other tax authorities. Although we regularly assess the likelihood of adverse outcomes resulting from these examinations to determine the adequacy of our provision for income taxes, there is no assurance that such determinations by us are in fact adequate. Changes in our effective tax rates or amounts assessed upon examination of our tax returns may have a material, adverse impact on our cash flows and our financial condition.
Our future effective tax rate in particular could be adversely affected by a change in ownership pursuant to U.S. Internal Revenue Code Section 382. If a change in ownership occurs, it may limit our ability to utilize our net operating losses to offset our U.S. taxable income. If U.S. taxable income is greater than the change in ownership limitation, we will pay a higher rate of tax with respect to the amount of taxable income that exceeds the limitation. This could have a material adverse impact on our results of operations. On April 26, 2012, we adopted an amended and restated Shareholder Rights plan to help protect our assets. The plan is effective through April 30, 2013.
If we do not adequately manage and evolve our financial reporting and managerial systems and processes, our ability to manage and grow our business may be harmed.
Our ability to successfully implement our business plan and comply with regulations requires an effective planning and management process. We need to continue improving our existing, and implement new, operational and financial systems, procedures and controls. Any delay in the implementation of, or disruption in the transition to, new or enhanced systems, procedures or controls, could harm our ability to record and report financial and management information on a timely and accurate basis, or to forecast future results.
Compliance with laws, rules and regulations relating to corporate governance and public disclosure may result in additional expenses.
Federal securities laws, rules and regulations, as well as NASDAQ rules and regulations, require companies to maintain extensive corporate governance measures, impose comprehensive reporting and disclosure requirements, set strict independence and financial expertise standards for audit and other committee members and impose civil and criminal penalties for companies and their Chief Executive Officers, Chief Financial Officers and directors for securities law violations. These laws, rules and regulations and the interpretation of these requirements are evolving, and we are making investments to evaluate current practices and to continue to achieve compliance.
Our headquarters and some significant supporting businesses are located in northern California and other areas subject to natural disasters that could disrupt our operations and harm our business.
Our corporate headquarters are located in Silicon Valley in Northern California. Historically, this region as well as our R&D center in North Carolina has been vulnerable to natural disasters and other risks, such as earthquakes, fires, floods and tropical storms, which at times have disrupted the local economy and posed physical risks to our property. We have contract manufacturers located in Taiwan where similar natural disasters and other risks may disrupt the local economy and pose physical risks to our property and the property of our contract manufacturer.
In addition, the continued threat of terrorism and heightened security and military action in response to this threat, or any future acts of terrorism, may cause further disruptions to the economies of the U.S. and other countries. If such disruptions result in delays or cancellations of customer orders for our products, our business and operating results will suffer.
19
Table of Contents
We currently do not have redundant, multiple site capacity in the event of a natural disaster, terrorist act or other catastrophic event. In the event of such an occurrence, our business would suffer.
Failure to successfully expand our sales and support teams or educate them in regard to technologies and our product families may harm our operating results.
The sale of our products and services requires a concerted effort that is frequently targeted at several levels within a prospective customer's organization. We may not be able to increase net revenue unless we expand our sales and support teams in order to address all of the customer requirements necessary to sell our products.
We cannot assure you that we will be able to successfully integrate employees into our company or to educate current and future employees in regard to rapidly evolving technologies and our product families. A failure to do so may hurt our revenue growth and operating results.
Our stock price has been volatile in the past and our stock price may significantly fluctuate in the future.
In the past, our common stock price has fluctuated significantly. This could continue as we or our competitors announce new products, our results or those of our customers or competition fluctuate, conditions in the networking or semiconductor industry change, or when investors, change their sentiment toward stocks in the networking technology sector.
In addition, fluctuations in our stock price and our price-to-earnings multiple may make our stock attractive to momentum, hedge or day-trading investors who often shift funds into and out of stock rapidly, exacerbating price fluctuations in either direction, particularly when viewed on a quarterly basis.
Provisions in our charter documents and Delaware law and our adoption of a stockholder rights plan may delay or prevent an acquisition of Extreme, which could decrease the value of our Common Stock.
Our certificate of incorporation and bylaws and Delaware law contain provisions that could make it more difficult for a third party to acquire us without the consent of our Board of Directors. Delaware law also imposes some restrictions on mergers and other business combinations between us and any holder of 15% or more of our outstanding common stock. In addition, our Board of Directors has the right to issue preferred stock without stockholder approval, which could be used to dilute the stock ownership of a potential hostile acquirer. Although we believe these provisions of our certificate of incorporation and bylaws and Delaware law and our stockholder rights plan, which is described below, will provide for an opportunity to receive a higher bid by requiring potential acquirers to negotiate with our Board of Directors, these provisions apply even if the offer may be considered beneficial by some of our stockholders.
Our Board of Directors adopted a stockholder rights plan, under which we declared and paid a dividend of one right for each share of common stock held by stockholders of record as of May 14, 2001. Under the plan, each right will entitle stockholders to purchase a fractional share of our preferred stock for $150.00. Each such fractional share of the new preferred stock has terms designed to make it substantially the economic equivalent of one share of common stock. Initially the rights will not be exercisable and will trade with our common stock. Generally, the rights may become exercisable if a person or group acquires beneficial ownership of 4.95% or more of our common stock or commences a tender or exchange offer upon consummation of which such person or group would beneficially own 4.95% or more of our common stock. When the rights become exercisable, our Board of Directors has the right to authorize the issuance of one share of our common stock in exchange for each right that is then exercisable.
We rely on the availability of third-party licenses
Some of our products are designed to include software or other intellectual property licensed from third parties. It may be necessary in the future to seek or renew licenses relating to various aspects of these products. There can be no assurance that the necessary licenses would be available on acceptable terms, if at all. The inability to obtain certain licenses or other rights or to obtain such licenses or rights on favorable terms, or the need to engage in litigation regarding these matters, could have a material adverse effect on our business, operating results, and financial condition. Moreover, the inclusion in our products of software or other intellectual property licensed from third parties on a nonexclusive basis could limit our ability to protect our proprietary rights in our products.
Market conditions and changes in the industry could lead to discontinuation of our products or businesses resulting in asset impairments
In response to changes in industry and market conditions, we may be required to strategically realign our resources and consider restructuring, disposing of, or otherwise exiting businesses. Any decision to limit investment in or dispose of or otherwise exit businesses may result in the recording of special charges, such as inventory and technology-related write-offs, workforce reduction costs, charges relating to consolidation of excess facilities, or claims from third parties who were resellers or users of
20
Table of Contents
discontinued products. Our estimates with respect to the useful life or ultimate recoverability of our carrying basis of assets, including purchased intangible assets, could change as a result of such assessments and decisions. Although in certain instances, our supply agreements allow us the option to cancel, reschedule, and adjust our requirements based on our business needs prior to firm orders being placed, our loss contingencies may include liabilities for contracts that we cannot cancel with contract manufacturers and suppliers. Further, our estimates relating to the liabilities for excess facilities are affected by changes in real estate market conditions.
We intend to invest in engineering, sales, service, marketing and manufacturing on a long term basis, and delays or inability to attain the expected benefits may result in unfavorable operating results
While we intend to focus on managing our costs and expenses, over the long term, we also intend to invest in personnel and other resources related to our engineering, sales, service, marketing and manufacturing functions as we focus on our foundational priorities, such as leadership in our core products and solutions and architectures for business transformation. We are likely to recognize the costs associated with these investments earlier than some of the anticipated benefits and the return on these investments may be lower, or may develop more slowly, than we expect. If we do not achieve the benefits anticipated from these investments, or if the achievement of these benefits is delayed, our operating results may be adversely affected.
I f our products do not effectively inter-operate with our customers' networks and result in cancellations and delays of installations our business could be harmed.
Our products are designed to interface with our customers' existing networks, each of which have different specifications and utilize multiple protocol standards and products from other vendors. Many of our customers' networks contain multiple generations of products that have been added over time as these networks have grown and evolved. Our products must inter-operate with many or all of the products within these networks as well as future products in order to meet our customers' requirements. If we find errors in the existing software or defects in the hardware used in our customers' networks, we may need to modify our software or hardware to fix or overcome these errors so that our products will inter-operate and scale with the existing software and hardware, which could be costly and could negatively affect our business, financial condition, and results of operations. In addition, if our products do not inter-operate with those of our customers' networks, demand for our products could be adversely affected or orders for our products could be cancelled. This could hurt our operating results, damage our reputation, and seriously harm our business and prospects.
Item 1B. Unresolved Staff Comments
None.
Item 2. Properties
The Company's principal administrative, sales, and marketing facilities are located in Santa Clara, California. The Company also leases office space and executive suites in various other geographic locations domestically and internationally for research & development, sales and service personnel and administration. The Company's aggregate lease expense for fiscal 2012 was approximately $4.3 million. Extreme Networks is actively engaged in efforts to sell excess property that was acquired in prior years.
On September 23, 2010, the Company entered into an Option Agreement with Trumark Companies LLC ("Trumark"), under which the Company granted Trumark an option (the "Option") to purchase half of its corporate headquarters campus in Santa Clara, California (First Property), at a price of $24.0 million. On January 25, 2012, Company entered into a new Option Agreement with Trumark, under which it granted Trumark an option to purchase the remaining portion of the Company's corporate campus (Second Property), at a price of $24.5 million. Under the agreements, Trumark will have until December 18, 2012 and December 28, 2012 to exercise the options to purchase the First Property and the Second Property, respectively, and may extend the option if they make certain payments to the Company. As of June 30, 2012 , the Company had received option payments totaling $2.0 million from Trumark, which were classified as a deferred gain and included in other current liabilities on the consolidated balance sheet.
In January 2012, the Company classified the First Property as "assets held for sale" on the consolidated balance at a net book value of $17.1 million, which was the lesser of the fair value (less cost to sell) or carrying amount of the assets, and ceased recognizing depreciation expense on the assets. As of June 30, 2012 , the Second Property, with a net book value of $16.0 million, remains classified as "assets held for use" due to certain unresolved contingencies that may delay the completion date of this
21
Table of Contents
transaction, including the Company's execution of an agreement with Trumark to lease back the Second Property.
Item 3. Legal Proceedings
The information set forth under the heading "Legal Proceedings" in Note 3, Commitments and Contingencies and Leases , in Notes to Consolidated Financial Statements in Item 8 of Part II of this Annual Report on Form 10-K, is incorporated herein by reference.
Item 4. Mine Safety Disclosures
Not Applicable
22
Table of Contents
PART II
Item 5. Market for Registrant's Common Equity, Related Stockholder Matters and Issuer Purchases of Equity Securities
Common Stock Market Prices and Dividends
Our common stock trades on the NASDAQ Global Market and commenced trading on NASDAQ on April 9, 1999 under the symbol "EXTR." The following table sets forth the high and low sales prices as reported by NASDAQ. Such prices represent prices between dealers, do not include retail mark-ups, mark-downs or commissions and may not represent actual transactions.
Stock Prices | High |
| Low | ||||
Fiscal year ended June 30, 2012: |
|
|
| ||||
First quarter | $ | 3.60 | |
| $ | 2.53 | |
Second quarter | $ | 3.15 | |
| $ | 2.46 | |
Third quarter | $ | 3.96 | |
| $ | 2.95 | |
Fourth quarter | $ | 4.32 | |
| $ | 3.36 | |
Fiscal year ended July 3, 2011: |
|
|
| ||||
First quarter | $ | 3.26 | |
| $ | 2.55 | |
Second quarter | $ | 3.25 | |
| $ | 2.82 | |
Third quarter | $ | 4.06 | |
| $ | 3.09 | |
Fourth quarter | $ | 3.50 | |
| $ | 2.89 | |
As of August 6, 2012, there were 275 stockholders of record of our common stock and 14,366 beneficial shareholders. We have never declared or paid cash dividends on our capital stock and do not anticipate paying any cash dividends in the foreseeable future. We currently intend to retain future earnings for the development of our business.
Certain information regarding our equity compensation plan(s) as required by Part II is incorporated by reference from our definitive Proxy Statement to be filed with the Securities and Exchange Commission in connection with the solicitation of proxies for our 2012 Annual Meeting of Stockholders (the " Proxy Statement ") not later than 120 days after the end of the fiscal year covered by this report.
23
Table of Contents
STOCK PRICE PERFORMANCE GRAPH
Set forth below is a stock price performance graph comparing the annual percentage change in the cumulative total return on our common stock with the cumulative total returns of the CRSP Total Return Index for The NASDAQ Stock Market (U.S. companies) and the NASDAQ Computer Manufacturers Securities for the period commencing July 1, 2007 and ending on June 30, 2012 . The comparisons in the graph below are based on historical data and are not intended to forecast the possible future performance of our common stock.
Comparison of Five-Year Cumulative Total Returns
Performance Graph for Extreme Networks, Inc.
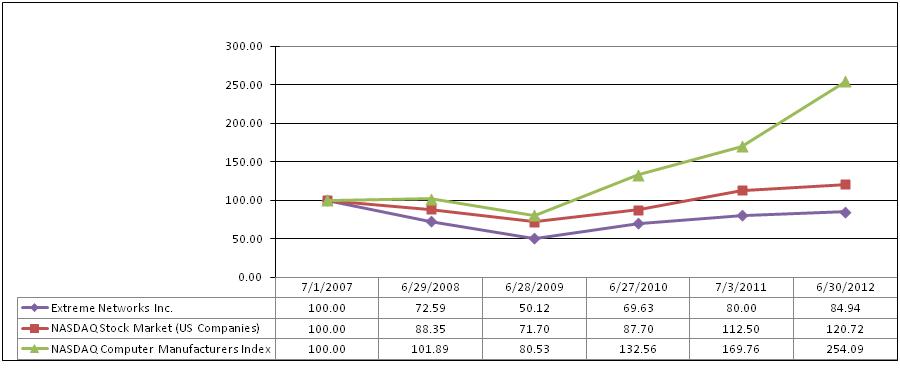
Prepared by CRSP (www.crsp.uchicago.edu), Center for Research in Security Prices, Booth School of Business, The University of Chicago. Used with permission. All rights reserved.
24
Table of Contents
Item 6. Selected Financial Data
The following table sets forth selected consolidated financial data for each of the fiscal years ended June 30, 2012 , July 3, 2011 , June 27, 2010 , June 28, 2009 and June 29, 2008 derived from audited financial statements. These tables should be reviewed in conjunction with the Consolidated Financial Statements in Item 8 and related Notes, as well as Item 7, "Management's Discussion and Analysis of Financial Condition and Results of Operations." Historical results may not be indicative of future results.
| Year Ended | ||||||||||||||||||
| June 30, 2012 (1) |
| July 3, 2011 (2) |
| June 27, 2010 (3) |
| June 28, 2009 (4) |
| June 29, 2008 (5) | ||||||||||
| (In thousands, except per share amounts) | ||||||||||||||||||
Consolidated Statements of Operations Data: |
|
|
|
|
|
|
|
|
| ||||||||||
Net revenues | $ | 322,722 | |
| $ | 334,428 | |
| $ | 309,354 | |
| $ | 335,559 | |
| $ | 361,835 | |
Operating income (loss) | $ | 13,909 | |
| $ | 3,114 | |
| $ | (1,424 | ) |
| $ | 2,061 | |
| $ | 895 | |
Net income | $ | 15,872 | |
| $ | 2,713 | |
| $ | 227 | |
| $ | 2,815 | |
| $ | 8,381 | |
Net income per share – basic | $ | 0.17 | |
| $ | 0.03 | |
| $ | - | |
| $ | 0.03 | |
| $ | 0.07 | |
Net income per share – diluted | $ | 0.17 | |
| $ | 0.03 | |
| $ | - | |
| $ | 0.03 | |
| $ | 0.07 | |
Shares used in per share calculation – basic | 93,451 | |
| 91,423 | |
| 89,281 | |
| 94,225 | |
| 115,002 | | |||||
Shares used in per share calculation – diluted | 94,490 | |
| 92,795 | |
| 89,477 | |
| 94,284 | |
| 115,784 | | |||||
| As of | ||||||||||||||||||
| June 30, |
| July 3, |
| June 27, |
| June 28, |
| June 29, | ||||||||||
| (In thousands) | ||||||||||||||||||
Consolidated Balance Sheets Data: |
|
|
|
|
|
|
| ||||||||||||
Cash and cash equivalents, short-term investments and marketable securities | $ | 153,515 | |
| $ | 146,977 | |
| $ | 135,359 | |
| $ | 130,440 | |
| $ | 229,326 | |
Inventories | $ | 26,609 | |
| $ | 21,583 | |
| $ | 21,842 | |
| $ | 12,380 | |
| $ | 13,942 | |
Total assets | $ | 284,590 | |
| $ | 270,973 | |
| $ | 262,885 | |
| $ | 243,013 | |
| $ | 362,576 | |
Deferred revenue, net | $ | 39,328 | |
| $ | 36,973 | |
| $ | 37,185 | |
| $ | 37,483 | |
| $ | 40,290 | |
Other long-term liabilities | $ | 643 | |
| $ | 2,474 | |
| $ | 3,665 | |
| $ | 4,675 | |
| $ | 8,238 | |
Common stock and capital in excess of par value | $ | 970,743 | |
| $ | 963,697 | |
| $ | 956,922 | |
| $ | 949,241 | |
| $ | 943,283 | |
Accumulated deficit | $ | (640,576 | ) |
| $ | (656,448 | ) |
| $ | (659,161 | ) |
| $ | (659,388 | ) |
| $ | (662,203 | ) |
____________________
(1) | Fiscal 2012 net income includes restructuring charge, net of reversal of $1.6 million, litigation settlement of $0.1 million and $1.9 million cumulative translation adjustments (" CTA ") gain from Japan subsidiary liquidation. |
(2) | Fiscal 2011 net income includes restructuring charge, net of reversal of $3.8 million and litigation settlement of $4.2 million. |
(3) | Fiscal 2010 net income includes restructuring charge of $4.2 million and litigation settlement of $1.0 million. |
(4) | Fiscal 2009 net income includes and restructuring charge of $2.2 million. |
(5) | Fiscal 2008 net income includes restructuring charge of $0.9 million. |
25
Table of Contents
Item 7. Management's Discussion and Analysis of Financial Condition and Results of Operations
Business Overview
We develop and sell network infrastructure equipment and offer related services contracts for extended warranty and maintenance to our enterprise, data center and metropolitan telecommunications service provider customers. Substantially all of our revenue is derived from the sale of our networking equipment and related service contracts. In our fiscal year ended June 30, 2012 , our revenue decreased $11.7 million , gross profit decreased $0.1 million , operating profit increased $10.8 million and net income increased $13.2 million as compared to fiscal 2011 .
We believe that understanding the following key developments is helpful to an understanding of our operating results for the fiscal year ended June 30, 2012 .
Impact of the Global Economic Developments
Although our net income and earnings per share both increased in fiscal 2012 , we believe that the credit market crisis, slow economic recovery in the United States, and other challenges affecting global economic conditions placed significant limitations on our financial performance. We operate in three regions: Americas, which includes the United States, Canada, Mexico, Central America and South America; EMEA, which includes Europe, Middle East, and Africa; and APAC which includes Asia Pacific, South Asia and Japan. Sales in the APAC and some European countries were most impacted as a result of the soft global economy and the global credit crisis in the financial market and certain European countries. We believe that limited access to credit, conservative purchasing patterns and delays or cancellation of IT infrastructure plans in the face of continued uncertainty regarding the global economy, may continue to negatively impact overall demand for networking solutions, including Ethernet equipment.
We have taken and plan to continue to take other steps to manage our business in the current economic environment. For example, we have managed from time to time our contingent work force, reduced travel and other discretionary spending, realigned our product portfolio and organization to grow revenue and operating income, and controlled all hiring activities.
Increasing Demand for Bandwidth
We believe that the continued increase in demand for bandwidth will over time drive future demand for high performance Ethernet solutions. Wide-spread adoption of electronic communications in all aspects of our lives, proliferation of next generation converged mobile devices and deployment of triple-play services to residences and businesses alike, continues to generate demand for greater network performance across broader geographic locations. In parallel to these transformational forces within society and the community at large, the accelerating adoption of internet and intranet "cloud" solutions within business enterprises is enabling organizations to offer greater business scalability to improve efficiency and through more effective operations, improve profitability. In order to realize the benefits of these developments, customers require additional bandwidth and high performance from their network infrastructure at affordable prices. We are seeing the initial indications that the Ethernet segment of the networking equipment market will return to growth as enterprise, data center and carrier customers continue to recognize the performance and operating cost benefits of Ethernet technology.
Expanding Product Portfolio
We believe that continued success in our marketplace is dependent upon a variety of factors that includes, but is not limited to, our ability to design, develop and distribute new and enhanced products employing leading-edge technology. During the past year we further extended our Ethernet product portfolio through the addition of the BlackDiamond BD-X, a highly-scalable core switch for IT and cloud data centers, the Summit X440 for the intelligent edge, the Summit X670 for data center top-of-rack deployments, the E4G Cell Site Router family for mobile backhaul, and a revamp of our RidgeLine network management platform
Industry Developments
The market for network infrastructure equipment is highly competitive and dominated by a few large companies. The current economic climate has further driven consolidation of vendors within the Ethernet networking market and with vendors from adjacent markets, including storage, security, wireless and voice applications. We believe that the underpinning technology for all of these adjacent markets is Ethernet. As a result, independent Ethernet switch vendors are being acquired or merged with larger, adjacent market vendors to enable them to deliver complete and broad solutions. As an independent Ethernet switch vendor, we must provide products that, when combined with the products of our large strategic partners, create compelling solutions for end user customers. Our approach is to focus on the intelligence and automation layer that spans our hardware products and that facilitates end-to-end solutions, as opposed to positioning Extreme Networks as a low-cost-vendor with point products. Lower overall market growth has also created an environment of declining margins due to increased competition between the remaining vendors in this space. During the last year, overall Ethernet port counts have grown, while industry revenues have decreased, signaling a decline in average selling price. Our product life cycle and operational cost reduction efforts are therefore even more
26
Table of Contents
critical for margin preservation.
Realignment of Corporate Strategies
In fiscal 2011, we commenced a strategy to focus on growing revenue in specific market verticals and on improving operational effectiveness. As part of this corporate realignment we recorded a charge of $1.6 million during the fiscal year ended June 30, 2012.
Amendment to Rights Agreement
On April 26, 2012, our Board of Directors of the Company adopted an Amended and Restated Rights Agreement between Extreme Networks and Computershare Shareholder Services LLC as the rights agent. The Restated Rights Plan governs the terms of each right ( "Right" ) that has been issued with respect to each share of Common Stock of Extreme Networks. Each Right initially represents the right to purchase one one-thousandth of a share of Series A Preferred Stock of Extreme Networks. The Restated Rights Plan replaces in its entirety the Rights Agreement, dated as of April 27, 2001, as amended on June 30, 2010 and April 26, 2011, between Extreme Networks and Mellon Investor services LLC (the "Prior Rights Plan").
The Board reviewed the necessity of the provision of the Prior Rights Plan adopted to preserve the value of Extreme Networks' deferred tax assets, including its net operating loss carry forwards, with respect to its ability to fully use its tax benefits to offset future income may be limited if it experiences an "ownership change" for purposes of Section 382 of the Internal Revenue Code of 1986 as a result of ordinary buying and selling of Extreme Networks' common stock. Following its review, the Board decided it was necessary and in the best interests of Extreme Networks and its stockholders to enter into the Restated Rights Plan The Restated Rights Plan incorporates the Prior Rights Plan and the amendments thereto into a single agreement and extends the term of the Prior Rights Plan from April 30, 2012 to April 30, 2013.
Results of Operations
Effective June 30, 2012, we changed our fiscal period to coincide with calendar month-end. Previously, we used a fiscal 52/53 week manufacturing calendar year. Accordingly, the fiscal year ended June 30, 2012 has 52 weeks compared to 53 weeks in 2011 and 52 weeks in fiscal 2010.
Our operations and financial performance have been affected by the economic factors described above, and during fiscal 2012 , we achieved the following results:
• | Net revenue of $322.7 million , a decrease of 4% from fiscal 2011 net revenue of $334.4 million . |
• | Product revenue of $261.9 million , a decrease of 5% from fiscal 2011 product revenue of $274.4 million . |
• | Service revenue of $60.8 million , roughly equal to fiscal 2011 service revenue of $60.0 million |
• | Total gross margin was 55.7% of net revenue in fiscal 2012 (including share-based compensation expense of $0.7 million ), compared to 53.8% in fiscal 2011 . |
• | Net income was $15.9 million in fiscal 2012 (including share-based compensation expense of $6.2 million and restructuring charges of $1.6 million ), an increase from net income of $2.7 million in fiscal 2011 . |
• | Cash flow provided by operating activities was $13.8 million , compared to cash flow provided by operating activities of $16.8 million in fiscal 2011 , a decrease of $3.0 million . Cash and cash equivalents, short-term investments and marketable securities were $153.5 million as of June 30, 2012 , an increase of $6.5 million from fiscal 2011 was primarily due to cash provided by operating activities. |
Net Revenue
The following table presents net product and service revenue for the fiscal years 2012 , 2011 and 2010 (dollars in thousands):
27
Table of Contents
| Year Ended |
| Year Ended | ||||||||||||||||||||||||||
| June 30, |
| July 3, |
| $ Change |
| % Change |
| July 3, |
| June 27, |
| $ Change |
| % Change | ||||||||||||||
Net Revenue: |
|
|
|
|
|
|
|
|
|
|
|
|
|
|
| ||||||||||||||
Product | $ | 261,873 | |
| $ | 274,388 | |
| $ | (12,515 | ) |
| (4.6 | )% |
| $ | 274,388 | |
| $ | 249,035 | |
| $ | 25,353 | |
| 10.2 | % |
Percentage of net revenue | 81.2 | % |
| 82.1 | % |
|
|
|
|
| 82.1 | % |
| 80.5 | % |
|
|
|
| ||||||||||
Service | 60,849 | |
| 60,040 | |
| 809 | |
| 1.3 | % |
| 60,040 | |
| 60,319 | |
| (279 | ) |
| (0.5 | )% | ||||||
Percentage of net revenue | 18.9 | % |
| 18.0 | % |
|
|
|
|
| 18.0 | % |
| 19.5 | % |
|
|
|
| ||||||||||
Total net revenue | $ | 322,722 | |
| $ | 334,428 | |
| $ | (11,706 | ) |
| (3.5 | )% |
| $ | 334,428 | |
| $ | 309,354 | |
| $ | 25,074 | |
| 8.1 | % |
Product revenue decreased in fiscal 2012 as compared to fiscal 2011 primarily due to increased pricing pressure on our other products and lower volumes. The decreases were also a result of elimination of certain products and product mix shift.
Product revenue increased in fiscal 2011 as compared to fiscal 2010 primarily due to growth in our Asia Pacific region and select strategic partners such as Ericsson AB, which accounted for 11% of our overall business, as well as increasing stability in the EMEA market. In the first quarter of fiscal 2010, we experienced supply constraint issues which resulted in the loss of business.
Service revenue increased in fiscal 2012 as compared to fiscal 2011 resulting from a significant one time renewal contract for a single customer and maintenance contract extensions.
Service revenue was flat in fiscal 2011 as compared to fiscal 2010 primarily due to the reduction of maintenance revenue for end-of-life products, offset by growth in new value-added services, coupled with maintenance service contracts attached to increased product sales.
As noted previously, we operate in three regions: Americas, which includes the United States, Canada, Mexico, Central America and South America; EMEA, which includes Europe, Middle East, and Africa; and APAC which includes Asia Pacific, South Asia and Japan. Prior to fiscal 2012, South America was included as part of EMEA. The following table presents the total net revenue geographically for the fiscal years 2012 , 2011 and 2010 (dollars in thousands):
| Year Ended |
| Year Ended | ||||||||||||||||||||||||||
Net Revenue | June 30, |
| July 3, |
| $ Change |
| % Change |
| July 3, |
| June 27, |
| $ Change |
| % Change | ||||||||||||||
Americas: |
|
|
|
|
|
|
|
|
|
|
|
|
|
|
| ||||||||||||||
United States | $ | 106,110 | |
| $ | 103,087 | |
| $ | 3,023 | |
| 2.9 | % |
| $ | 103,087 | |
| $ | 105,532 | |
| $ | (2,445 | ) |
| (2.3 | )% |
Other | 34,970 | |
| 30,487 | |
| 4,483 | |
| 14.7 | % |
| 30,487 | |
| 26,632 | |
| 3,855 | |
| 14.5 | % | ||||||
Total Americas | 141,080 | |
| 133,574 | |
| 7,506 | |
| 5.6 | % |
| 133,574 | |
| 132,164 | |
| 1,410 | |
| 1.1 | % | ||||||
Percentage of net revenue | 43.7 | % |
| 39.9 | % |
|
|
|
|
| 39.9 | % |
| 42.7 | % |
|
|
|
| ||||||||||
EMEA | 128,093 | |
| 134,730 | |
| (6,637 | ) |
| (4.9 | )% |
| 134,730 | |
| 125,357 | |
| 9,373 | |
| 7.5 | % | ||||||
Percentage of net revenue | 39.7 | % |
| 40.3 | % |
|
|
|
|
| 40.3 | % |
| 40.5 | % |
|
|
|
| ||||||||||
APAC | 53,549 | |
| 66,124 | |
| (12,575 | ) |
| (19.0 | )% |
| 66,124 | |
| 51,833 | |
| 14,291 | |
| 27.6 | % | ||||||
Percentage of net revenue | 16.6 | % |
| 19.8 | % |
|
|
|
|
| 19.8 | % |
| 16.8 | % |
|
|
|
| ||||||||||
Total net revenues | $ | 322,722 | |
| $ | 334,428 | |
| $ | (11,706 | ) |
| (3.5 | )% |
| $ | 334,428 | |
| $ | 309,354 | |
| $ | 25,074 | |
| 8.1 | % |
Revenue in the Americas increased in 2012 as compared to fiscal 2011 primarily due to sales to several large customers. Revenue in EMEA decreased in fiscal 2012 as compared to FY 2011 due to slow economic recovery in Europe. Revenue in APAC also decreased in fiscal 2012 as compared to fiscal 2011 due to organizational changes in 2012 and weaker sales in India, Korea, Hong Kong and Japan.
Revenue in the Americas remained consistent in fiscal 2011 as compared to fiscal 2010 primarily due to slow economic recovery and organizational structure changes in the United States, offset by growth in Mexico, Central America, and South America for several large strategic deals. Revenue in the United States decreased in fiscal 2011 as compared to fiscal 2010 primarily due to slow economic recovery and organizational structure changes.
28
Table of Contents
Revenue in EMEA increased in fiscal 2011 as compared to fiscal 2010 primarily due to increasing demand in Central and Northern Europe and growth with Ericsson AB. Revenue in APAC increased in fiscal 2011 as compared to fiscal 2010 primarily due to stronger service provider and enterprise sales in China, Korea and Southeast Asia.
We rely upon multiple channels of distribution, including distributors, direct resellers, OEM, and direct sales. Revenue through our distributor channel was 42% of total product revenue in fiscal 2012 , 52% of total product revenue in fiscal 2011 , and 59% in fiscal 2010 . The decrease in distributor channel revenue over the past three years was due to a shift in sales from distributors to our OEMs and direct resellers.
The level of sales to any one customer, including a distributor, may vary from period to period.
Cost of Revenue and Gross Profit
The following table presents the gross profit on product and service revenue and the gross profit percentage of net revenue for the fiscal years 2012 , 2011 and 2010 (dollars in thousands):
| Year Ended |
| Year Ended | ||||||||||||||||||||||||||
| June 30, |
| July 3, |
| $ Change |
| % Change |
| July 3, |
| June 27, |
| $ Change |
| % Change | ||||||||||||||
Gross profit: |
|
|
|
|
|
|
|
|
|
|
|
|
|
|
| ||||||||||||||
Product | $ | 141,646 | |
| $ | 144,832 | |
| $ | (3,186 | ) |
| (2.2 | )% |
| $ | 144,832 | |
| $ | 141,037 | |
| $ | 3,795 | |
| 2.7 | % |
Percentage of product revenue | 54.1 | % |
| 52.8 | % |
|
|
|
|
| 52.8 | % |
| 56.6 | % |
|
|
|
| ||||||||||
Service | 38,201 | |
| 35,129 | |
| 3,072 | |
| 8.7 | % |
| 35,129 | |
| 35,456 | |
| (327 | ) |
| (0.9 | )% | ||||||
Percentage of service revenue | 62.8 | % |
| 58.5 | % |
|
|
|
|
| 58.5 | % |
| 58.8 | % |
|
|
|
| ||||||||||
Total gross profit | $ | 179,847 | |
| $ | 179,961 | |
| $ | (114 | ) |
| (0.1 | )% |
| $ | 179,961 | |
| $ | 176,493 | |
| $ | 3,468 | |
| 2.0 | % |
Percentage of net revenue | 55.7 | % |
| 53.8 | % |
|
|
|
|
| 53.8 | % |
| 57.1 | % |
|
|
|
| ||||||||||
Cost of product revenue includes costs of materials, amounts paid to third-party contract manufacturers, costs related to warranty obligations, charges for excess and obsolete inventory, royalties under technology license agreements, and internal costs associated with manufacturing overhead, including management, manufacturing engineering, quality assurance, development of test plans, and document control. We outsource substantially all of our manufacturing and supply chain management operations, and we conduct quality assurance, manufacturing engineering, document control and distribution at our facilities in Santa Clara, California, China, and Taiwan. Accordingly, a significant portion of our cost of product revenue consists of payments to our primary contract manufacturer, Alpha Networks, located in Hsinchu, Taiwan. In addition, we OEM our wireless product line from Motorola.
Product gross profit in fiscal 2012 decreased as compared to fiscal 2011 due to lower sales offset by lower material cost, costs associated with inventory write-down charges, and a decrease in inbound freight costs due to the Company's new Hong Kong distribution center which is located closer to our contract manufacturer Alpha Networks.
Product gross profit in fiscal 2011 increased as compared to fiscal 2010 primarily due to increased revenue offset by higher material cost and a $5.4 million charge associated with the write-down of inventory from our strategic realignment.
Our cost of service revenue consists primarily of labor, overhead, repair and freight costs and the cost of spares used in providing support under customer service contracts. Service gross profit in fiscal 2012 increased as compared to fiscal 2011 primarily due to lower RMA shipments for legacy chassis products, mix change from higher repair cost chassis products to lower repair cost stackable products.
Service gross profit in fiscal 2011 remained flat as compared to fiscal 2010 as revenue and costs were relatively unchanged from the prior year.
Operating Expenses
The following table presents operating expenses and operating income (in thousands, except percentages):
29
Table of Contents
| Year Ended |
| Year Ended | ||||||||||||||||||||||||||
| June 30, |
| July 3, |
| $ Change |
| % Change |
| July 3, |
| June 27, |
| $ Change |
| % Change | ||||||||||||||
Sales and marketing | $ | 90,167 | |
| $ | 103,277 | |
| $ | (13,110 | ) |
| (12.7 | )% |
| $ | 103,277 | |
| $ | 96,621 | |
| $ | 6,656 | |
| 6.9 | % |
Research and development | 45,640 | |
| 49,330 | |
| (3,690 | ) |
| (7.5 | )% |
| 49,330 | |
| 49,390 | |
| (60 | ) |
| (0.1 | )% | ||||||
General and administrative | 28,658 | |
| 24,683 | |
| 3,975 | |
| 16.1 | % |
| 24,683 | |
| 26,839 | |
| (2,156 | ) |
| (8.0 | )% | ||||||
Restructuring charge, net of reversal | 1,594 | |
| 3,806 | |
| (2,212 | ) |
| (58.1 | )% |
| 3,806 | |
| 4,238 | |
| (432 | ) |
| (10.2 | )% | ||||||
Litigation settlement | (121 | ) |
| (4,249 | ) |
| 4,128 | |
| (97.2 | )% |
| (4,249 | ) |
| 829 | |
| (5,078 | ) |
| (612.5 | )% | ||||||
Total operating expenses | $ | 165,938 | |
| $ | 176,847 | |
| $ | (10,909 | ) |
| (6.2 | )% |
| $ | 176,847 | |
| $ | 177,917 | |
| $ | (1,070 | ) |
| (0.6 | )% |
Operating income (loss) | $ | 13,909 | |
| 3,114 | |
| $ | 10,795 | |
| 346.7 | % |
| 3,114 | |
| $ | (1,424 | ) |
| $ | 4,538 | |
| (318.7 | )% | ||
The following table highlights our operating expenses and operating income as a percentage of net revenues:
| Year Ended | |||||||
| June 30, |
| July 3, |
| June 27, | |||
Sales and marketing | 27.9 | % |
| 30.9 | % |
| 31.2 | % |
Research and development | 14.1 | % |
| 14.8 | % |
| 16.0 | % |
General and administrative | 8.9 | % |
| 7.4 | % |
| 8.7 | % |
Restructuring charge, net of reversal | 0.5 | % |
| 1.1 | % |
| 1.4 | % |
Litigation settlement | - | % |
| (1.3 | )% |
| 0.3 | % |
Total operating expenses | 51.4 | % |
| 52.9 | % |
| 57.5 | % |
Operating (loss) income | 4.3 | % |
| 0.9 | % |
| (0.5 | )% |
Sales and Marketing Expenses
Sales and marketing expenses consist of salaries, commissions and related expenses for personnel engaged in marketing and sales functions, as well as trade shows and promotional expenses. Sales and marketing expenses decreased in fiscal 2012 as compared to fiscal 2011 primarily due to $4.5 million reduction in salaries and benefits, $3.5 million reduction in commissions due to lower revenue, $1.7 million less professional fees due to utilization of in-house services, and $1.4 million lesser travel expenses resulting from the reduction in headcount at the beginning of fiscal 2012.
Sales and marketing expenses increased in fiscal 2011 as compared to fiscal 2010 primarily due to $3.2 million higher salary and benefits expense resulting from increased headcount, $2.3 million higher commissions due to increased revenue, and $0.6 million increase in new marketing initiatives to improve brand awareness.
Research and Development Expenses
Research and development expenses consist primarily of salaries and related personnel expenses, consultant fees and prototype expenses related to the design, development, and testing of our products. Research and development expenses decreased in fiscal 2012 as compared to fiscal 2011 primarily due to $3.5 million less in salaries and benefits expense due to a reduction in headcount and a transfer of resources to lower cost regions and $0.9 million less in small equipment expenses due to better utilization of existing test equipment, offset by $0.6 million increase in professional fees related to new product launches.
Research and development expenses remained flat in fiscal 2011 as compared to fiscal 2010 primarily due to a $3.5 million increase in engineering project expenses offset by a $2.4 million decrease in salaries and benefits due to a reduction in headcount, a $0.5 million decrease in professional fees related to development work, and a $0.6 million decrease in stock-based compensation expense.
General and Administrative Expenses
General and administrative expenses increased in fiscal 2012 as compared to fiscal 2011 primarily due to increased legal expense of $2.0 million, increased contract labor expense for accounting and finance of $1.0 million, increased stock based compensation expense of $0.8 million, increased international accounting fees of $0.8 million offset by lower salaries and benefits
30
Table of Contents
expense of $0.8 million due to fewer headcount.
General and administrative expenses decreased in fiscal 2011 as compared to fiscal 2010 primarily due to a $1.7 million decrease in litigation expenses.
Restructuring Charge, Net of Reversal
During the fiscal 2012 , 2011 and 2010 , we recorded restructuring charges of $1.6 million , $3.8 million , and $4.2 million , respectively.
Fiscal 2012 Restructuring
During fiscal 2012, we incurred total charges of $2.2 million, including $1.8 million related to severance, $0.1 million of contract termination fees, and $0.2 million other charges. A portion of this restructuring activity is related to the liquidation of our Japan subsidiary with a cost of $0.5 million at June 30, 2012. We substantially liquidated the subsidiary in Japan in the fourth quarter or fiscal 2012, as part of our broad restructuring effort. We will dispose the remaining immaterial assets and liabilities and complete the liquidation process by the end of fiscal 2013.
Fiscal 2011 Restructuring
During fiscal 2011, we commenced a strategy to focus on growing revenue in specific market verticals and on improving operational effectiveness. As part of the strategy, we reduced headcount and incurred total restructuring charges of $4.2 million , of which $1.0 million and $3.2 million were recognized in the third and fourth quarter of fiscal 2011, respectively. During the fourth quarter of fiscal 2011, the lease term for the excess leased facilities ended. We recognized a restructuring reversal of $0.4 million related to the true up of operating and rent expenses.
Fiscal 2010 Restructuring
During fiscal 2010, we incurred charges of $4.6 million related to the restructuring or the organization from a business unit organization to a functional organization. Total termination benefits were $4.1 million. We incurred $0.2 million increase in facilities operating expenses related to one of the facilities; $0.5 million reversal of restructuring expense due to higher projected sublease receipt from sublease renewal arrangement. $0.1 million reversal of restructuring expense related to the settlement of employment termination benefits incurred in the third fiscal quarter of 2009.
Litigation Settlement
During the fourth quarter of fiscal 2012, from a judgment related to our lawsuit with Enterasys Networks for patent infringement, we received $0.6 million from Enterasys including a first trial damage award of $0.2 million, reimbursement of legal costs from the first trial of $0.4 million, and interest.
Interest Income
Interest income was $1.2 million in fiscal 2012 , $1.3 million in fiscal 2011 and $1.5 million in fiscal 2010 , representing a decrease of $0.1 million in fiscal 2012 from fiscal 2011 , and a decrease of $0.2 million in fiscal 2011 from fiscal 2010 . The decrease in interest income in fiscal 2012 from fiscal 2011 was due to a decrease in the average interest yield from 1.2% in fiscal 2011 to 0.95% in fiscal 2012. The decrease in interest income in fiscal 2011 from fiscal 2010 was due to a decrease in the average interest yield from 1.6% in fiscal 2010 to 1.2% in fiscal 2011.
Interest Expense
Interest expense was $0.1 million for each fiscal year 2012 , 2011 and 2010 . Interest expense in fiscal 2012 and fiscal 2011 were primarily related to interest amortization of technology agreements.
Other Income (Expense), net
Other income (expense) net, was income of $2.0 million in fiscal 2012 , expense of $0.6 million in fiscal 2011 and expense of $0.1 million in fiscal 2010 . Other income in fiscal 2012 was primarily comprised of $1.9 million in foreign currency translation gains that were reclassified from other comprehensive income (loss) due to the substantial liquidation of our Japan subsidiary.
Provision (Benefit) for Income Taxes
We recorded an income tax provision of $1.2 million for fiscal 2012. The effective tax rate in fiscal 2012 was 7.0% which differs from the federal statutory tax rate of 35% due primarily to the tax impact of income from foreign operations and the change
31
Table of Contents
in valuation allowance. We recorded an income tax provision of $1.2 million for fiscal 2012 due to profits in our foreign subsidiaries, utilization of the US entity's net operating losses, and the release of foreign tax reserves.
The income tax provision of $1.0 million and income tax benefit of $0.4 million for fiscal 2011 and 2010, respectively, were recorded for taxes due on income generated in U.S federal, certain states and foreign tax jurisdictions. The effective tax rate was 26.9% for fiscal 2011 which differs from the federal statutory tax rate of 35% due primarily to the tax impact of income from foreign operations and the change in valuation allowance. The effective tax rate was 223.6% for fiscal 2010 which differs from the federal statutory tax rate of 35% due primarily to the benefit of U.S. net operating losses carry-forwards and the tax impact of income from foreign operations.
Critical Accounting Policies and Estimates
Our significant accounting policies are more fully described in Note 2 of Notes to Consolidated Financial Statements included in Item 8 of this Annual Report on Form 10-K. The preparation of consolidated financial statements in accordance with generally accepted accounting principles requires management to make estimates, assumptions and judgments that affect the reported amounts of assets and liabilities and the disclosure of contingent assets and liabilities at the date of the consolidated financial statements, and the reported amounts of revenue and expenses during the period reported. By their nature, these estimates, assumptions and judgments are subject to an inherent degree of uncertainty. We base our estimates, assumptions and judgments on historical experience, market trends and other factors that are believed to be reasonable under the circumstances. Estimates, assumptions and judgments are reviewed on an ongoing basis and the effects of revisions are reflected in the consolidated financial statements in the period they are determined to be necessary. Actual results may differ from these estimates under different assumptions or conditions. We believe the critical accounting policies stated below, among others, affect our more significant judgments and estimates used in the preparation of our consolidated financial statements.
Share-based Payments
We use the Black-Scholes option-pricing model to determine the fair value of option awards, and share purchase options under our Employee Stock Purchase Plan (" ESPP ") on the date of grant with the weighted average assumptions. The expected term of options granted is derived from historical data on employee exercise and post-vesting employment termination behavior. The expected term of purchase options under our ESPP represents the contractual life of the ESPP purchase period. The risk-free rate based upon the estimated life of the option and ESPP award is based on the U.S. Treasury yield curve in effect at the time of grant. Expected volatility is based on both the implied volatilities from traded options on our stock and historical volatility on our stock. We do not currently pay cash dividends on our common stock and do not anticipate doing so in the foreseeable future. Accordingly, our expected dividend yield is zero. We are required to estimate forfeitures at the time of grant and revise those estimates in subsequent periods if actual forfeitures differ from those estimates. In fiscal 2012, our estimated forfeiture rates based on historical forfeiture experiences are 7% for executives and 9% for non-executive employees. We use the straight-line method for expense attribution, and we estimate forfeitures and only recognize expense for those shares expected to vest.
Revenue Recognition
We derive the majority of our revenue from sales of our networking equipment, with the remaining revenue generated from service fees relating to maintenance service contracts, professional services, and training for our products. We recognize revenue when persuasive evidence of an arrangement exists, delivery has occurred, the price of the product is fixed or determinable, and the collection of the sales proceeds is reasonably assured. In instances where any of the criteria for revenue recognition are not met, we defer revenue until all criteria have been met.
Product revenue from our value-added resellers, non-stocking distributors and end-user customers is recognized at the time of shipment, provided that all of the foregoing revenue recognition requirements have been satisfied. We generally do not grant return privileges, except for defective products during the warranty period, nor do we grant pricing credits. Accordingly, we recognize revenue upon transfer of title and risk of loss to the customer, which is generally upon shipment. We maintain estimated accruals and allowances for sales incentives and other programs that we may make available to our partners, based on historical experience or applicable contractual terms. Shipping costs are included in cost of product revenues. Sales taxes collected from customers are excluded from revenues.
We also sell our products to distributors that stock inventory and sell to resellers. We defer recognition of revenue on all sales to our stocking distributors until the distributors have sold the products, as evidenced by sales data that the distributors provide to us. We grant stocking distributors certain price protection rights and the right to return a portion of unsold inventory for the purpose of stock rotation. The distributor-related deferred revenue and receivables are adjusted at the time of the stock rotation return or price reduction. We also provide stocking distributors with credits for changes in selling prices based on competitive conditions, and provide funding for our distributors and their resellers to perform marketing development activities. We maintain estimated accruals and allowances for these exposures based upon our contractual obligations. Our marketing
32
Table of Contents
development channel programs do not meet the criteria for recognizing the costs as marketing expenses and therefore these costs are accrued as a reduction to revenue in the same period that the products are sold.
Revenue from service contracts is deferred and recognized ratably over the contractual service period, which is typically from one to two years. Professional service revenue is recognized upon delivery or completion of performance.
Our networking products are tangible products that contain software and non-software components that function together to deliver the tangible product's essential functionality. Our sales arrangements may contain multiple deliverables comprised of our tangible products, standalone software licenses, and service offerings depending on the distribution sales channel through which the products are sold and the requirements of our customers. We recognize revenue for our multiple deliverable arrangements in accordance with the accounting standard for multiple deliverable revenue arrangements, which provides guidance on whether multiple deliverables exist, how deliverables in an arrangement should be separated, and how consideration should be allocated. The industry-specific software revenue recognition guidance generally does not apply to the sales of our tangible products. Software revenue guidance is applied to sales of our standalone software products, including software upgrades and software that is not essential to the functionality of the hardware with which it is sold.
Pursuant to the guidance of the accounting standard for multiple-deliverable revenue arrangements, we allocate the total arrangement consideration to each separable element of an arrangement based on the relative selling price of each element. We determine the standalone selling price for each element based on a selling price hierarchy. Under the selling price hierarchy, the selling price for each deliverable is based on our vendor-specific objective evidence of selling price ("VSOE"), which is determined by a substantial majority of our historical standalone sales transactions for a product or service falling within a reasonable range. If VSOE is not available due to a lack of standalone sales transactions or lack of pricing within a narrow range, then third party evidence (" TPE "), as determined by the standalone pricing of competitive vendor products in similar markets, is used. TPE typically is difficult to establish due to the proprietary differences of competitive products and difficulty in obtaining reliable competitive standalone pricing information. When neither VSOE nor TPE is available, we determine the best estimate of standalone selling price (" ESP ") for a product or service by considering several factors including, but not limited to, the 12-month historical median sales price, sales channels, geography, gross margin consistency, competitive product pricing, and product life cycle. In consideration of all relevant pricing factors, we apply management judgment to determine the best estimate of selling price through consultation with and formal approval by our management for all products and services for which neither VSOE nor TPE is available. Generally the standalone selling price of services is determined using VSOE and the standalone selling price of all other deliverables is determined by using ESP. We regularly review VSOE, TPE and ESP for all of our products and services and maintain internal controls over the establishment and updates of these estimates.
Pursuant to the software revenue recognition accounting standard, we continue to recognize revenue for software using the residual method for our sales of standalone software products, including optional software upgrades, and other software that is not essential to the functionality of the hardware with which it is sold. After allocation of the relative selling price to each element of the multiple deliverable arrangement, we recognize revenue in accordance with our policies for product, software, and service revenue recognition.
Our total deferred product revenue from customers other than distributors was $2.2 million and $2.0 million as of June 30, 2012 and July 3, 2011 , respectively. Our total deferred revenue for services, primarily from service contracts, was $37.7 million as of June 30, 2012 and $36.0 million as of July 3, 2011 . Service contracts typically range from one to two years. Shipping costs are included in cost of product revenues.
We provide an allowance for sales returns based on our historical returns, analysis of credit memo data and our return policies. The allowance for sales returns was $1.3 million and $0.6 million as of June 30, 2012 and July 3, 2011 , respectively, for estimated future returns that were recorded as a reduction of our accounts receivable. If the historical data that we use to calculate the estimated sales returns and allowances does not properly reflect future levels of product returns, these estimates will be revised, thus resulting in an impact on future net revenue. We estimate and adjust this allowance at each balance sheet date.
Inventory Valuation
Our inventory balance was $26.6 million as of June 30, 2012 , compared with $21.6 million as of July 3, 2011 . We value our inventory at lower of cost or market. Cost is computed using standard cost, which approximates actual cost, on a first-in, first-out basis. We provide inventory allowances based on excess and obsolete inventories determined primarily by the age of inventory. At the point of the loss recognition, a new, lower-cost basis for that inventory is established, and subsequent changes in facts and circumstances do not result in the restoration or increase in that newly established cost basis. Any written down or obsolete inventory subsequently sold has not had a material impact on gross margin for any of the periods disclosed. Inventory write-downs charged to cost of product revenue were $1.1 million in fiscal 2012 , $2.2 million in fiscal 2011 and $1.9 million in fiscal 2010 .
Long Lived Assets
Long-lived assets include property and equipment, intangible assets, and service inventory which we hold to support customers
33
Table of Contents
who have purchased service contracts with a hardware replacement element. Long-lived assets are reviewed for impairment whenever events or changes in circumstances indicate that the carrying amount of such assets or asset groups may not be recoverable. If such facts and circumstances exist, we assess the recoverability of the long-lived assets by comparing the projected un-discounted net cash flows associated with the related asset or group of assets over their remaining lives against their respective carrying amounts. Impairments, if any, are based on the excess of the carrying amount over the fair value of those assets.
Accrued Warranty
Networking products may contain undetected hardware or software errors when new products or new versions or updates of existing products are released to the marketplace. In the past, we had experienced such errors in connection with products and product updates. Our standard hardware warranty period is typically 12 months from the date of shipment to end-users and 90 days for software. For certain access products, we offer a limited lifetime hardware warranty commencing on the date of shipment from us and ending five (5) years following the our announcement of the end of sale of such product. Upon shipment of products to our customers, including both end-users and channel partners, we estimate expenses for the cost to repair or replace products that may be returned under warranty and accrue a liability through charges to cost of product revenue for this amount.
Our accrued warranty balance was $2.9 million and $2.6 million as of June 30, 2012 and July 3, 2011 , respectively. The determination of our warranty requirements is based on our actual historical experience with the product or product family, estimates of repair and replacement costs and any product warranty problems that are identified after shipment. We estimate and adjust this accrual at each balance sheet date in accordance with changes in these factors.
The cost of new warranties issued that was charged to cost of product revenue was $3.1 million in fiscal 2012 , $2.4 million in fiscal 2011 , and $2.9 million in fiscal 2010.
Accounts Receivable and Allowance for Doubtful Accounts
Our accounts receivable balance, net of allowance for doubtful accounts, was $41.2 million and $33.7 million as of June 30, 2012 and July 3, 2011 , respectively. The allowance for doubtful accounts for trade accounts receivable was $0.4 million and $0.8 million as of June 30, 2012 and July 3, 2011 , respectively. We continually monitor and evaluate the collectability of our trade receivables based on a combination of factors. We record specific allowances for bad debts in general and administrative expense when we become aware of a specific customer's inability to meet its financial obligation to us, such as in the case of bankruptcy filings or deterioration of financial position. Estimates are used in determining our allowances for all other customers based on factors such as current trends in the length of time the receivables are past due and historical collection experience. We mitigate some collection risk by requiring most of our customers in the Asia-Pacific region, excluding Japan and Australia, to pay cash in advance or secure letters of credit when placing an order with us. Our provision for doubtful accounts was an expense of $128,000 in fiscal 2012 , benefit of $9,000 in fiscal 2011 and expense of $26,000 in fiscal 2010 .
Deferred Tax Asset Valuation Allowance
We recognize deferred tax assets and liabilities based on the differences between the financial statement carrying amounts and the tax bases of assets and liabilities. Significant management judgment is required in determining our valuation allowance recorded against our net deferred tax assets. We make an assessment of the likelihood that our net deferred tax assets will be recovered from future taxable income, and to the extent that recovery is not believed to be likely, a valuation allowance is established. In fiscal 2012, the valuation allowance decreased by $9.9 million to $140.6 million, and in fiscal 2011, the valuation allowance decreased by $4.6 million to $150.5 million. We have not provided a valuation allowance against any of our non-U.S. deferred tax assets.
The valuation allowance requires an assessment of both negative and positive evidence when measuring the need for a valuation allowance. Evidence, such as operating results during the most recent three-year period was given more weight than our expectations of future profitability, which are inherently uncertain. Our U.S. cumulative losses during those periods represented sufficient negative evidence to require a full valuation allowance against our U.S. federal and state net deferred tax assets. This valuation allowance will be evaluated periodically and can be reversed partially or totally if business results have sufficiently improved to support realization of our deferred tax assets.
Accounting for Uncertainty in Income Taxes
We had unrecognized tax benefits of $25.7 million as of June 30, 2012. If fully recognized in the future, $0.5 million would impact our effective tax rate, and $25.2 million would result in adjustments to deferred tax assets and corresponding adjustments to the valuation allowance. It is reasonably possible that the amount of unrealized tax benefit could decrease by approximately $0.2 million during the next twelve months due to the expiration of the statute of limitations in certain foreign jurisdictions.
34
Table of Contents
Legal Contingencies
We are currently involved in various claims and legal proceedings, including negotiations regarding potential licenses from third parties who have notified us that they believe our products may infringe certain patents. Periodically, we review the status of each significant matter, whether litigation or licensing negotiation, and assess our potential financial exposure. If the potential loss from any claim or legal proceeding is considered probable and the amount can be estimated, we accrue a liability for the estimated loss. Because of uncertainties related to these matters, accruals, if any, are based only on the most current and dependable information available at any given time. As additional information becomes available, we may reassess the potential liability from pending claims and litigation and the probability of claims being successfully asserted against us. As a result, we may revise our estimates related to these pending claims and litigation. Such revisions in the estimates of the potential liabilities could have a material impact on our consolidated results of operations, financial position and cash flows in the future. For further detail, see Note 3 of Notes to Consolidated Financial Statements.
Impact of Recently Issued Accounting Standards
In June 2011, the FASB issued ASU 2011-05, Comprehensive Income (Topic 220) : Presentation of Comprehensive Income . ASU 2011-05 requires one of two alternatives for presenting comprehensive income and eliminates the option to report other comprehensive income and its components as a part of the Consolidated Statements of Stockholders' Equity. Additionally, ASU 2011-05 requires presentation on the face of the financial statements reclassification adjustments for items that are reclassified from other comprehensive income to net income in the statement(s) where the components of net income and the components of other comprehensive income are presented. The requirement related to the reclassification adjustments from other comprehensive income to net income was deferred in December 2011, as a result of the issuance of ASU 2011-12, Deferral of the Effective Date for Amendments to the Presentation of Reclassifications of Items Out of Accumulated Other Comprehensive Income in Accounting Standards Update 2011-05 (Topic 220) . The amendments in ASU 2011-05, as amended by ASU 2011-12, do not change the items that must be reported in other comprehensive income or when an item of other comprehensive income must be reclassified to net income. ASU 2011-05, as amended by ASU 2011-12 is effective for fiscal years and interim periods within those years beginning after December 15, 2011 and is to be applied retrospectively. We will adopt ASU 2011-05 during the first quarter of fiscal 2013. We do not expect the adoption of ASU 2011-05, as amended by ASU 2011-12 to have a material impact on our Consolidated Financial Statements.
Liquidity and Capital Resources
The following summarizes information regarding our cash, investments, and working capital (in thousands):
| June 30, |
| July 3, | ||||
Cash and cash equivalent | $ | 54,596 | |
| $ | 49,972 | |
Short-term investments | 23,358 | |
| 41,357 | | ||
Marketable securities | 75,561 | |
| 55,648 | | ||
Total cash and investments | $ | 153,515 | |
| $ | 146,977 | |
Working capital | $ | 72,361 | |
| $ | 57,561 | |
Cash and cash equivalents increased by $4.6 million primarily due to cash provided by operating activities of $13.8 million and cash from financing activities of $2.4 million , offset by cash used in investing activities of $10.4 million . Refer to further discussions below under Key Components of Cash Flows and Liquidity .
Short-term investments decreased by $18.0 million due to the maturity of the other short-term investments. Cash was primarily invested in the long-term investments to optimize yield. Refer to further discussions below under Item 7A. Quantitative and Qualitative Disclosures About Market Risk.
The Company increased their holding in marketable securities by $19.9 million as compared to the prior year to optimize their yield by purchasing long term investments.
The increase in working capital of $14.8 million was primarily due to the assets held for sale classified as current assets.
Key Components of Cash Flows and Liquidity
A summary of the sources and uses of cash and cash equivalents is as follows (in thousands):
35
Table of Contents
| Year Ended | ||||||||||
| June 30, |
| July 3, |
| June 27, | ||||||
Net cash provided by operating activities | $ | 13,813 | |
| $ | 16,777 | |
| $ | 10,943 | |
Net cash (used in) investing activities | $ | (10,410 | ) |
| $ | (22,079 | ) |
| $ | (8,774 | ) |
Net cash provided by financing activities | $ | 2,393 | |
| $ | 2,530 | |
| $ | 1,085 | |
Foreign currency effect on cash | $ | (1,172 | ) |
| $ | 800 | |
| $ | (543 | ) |
Net increase (decrease) in cash and cash equivalents | $ | 4,624 | |
| $ | (1,972 | ) |
| $ | 2,711 | |
Cash and cash equivalents, short-term investments and marketable securities were $153.5 million at June 30, 2012 , representing an increase of $6.5 million from $147.0 million at July 3, 2011 . This increase was primarily due to cash provided by operations of $13.8 million and cash provided by financing activities of $2.4 million , offset by cash used in investing activities of $10.4 million and foreign currency impact of $1.2 million.
Cash provided by operating activities was $13.8 million , a decrease of $3.0 million compared to cash provided by operating activities of $16.8 million in fiscal 2011 . Accounts receivable, net, increased to $41.2 million at June 30, 2012 from $33.7 million at July 3, 2011 . Days sales outstanding in receivables increased to 42 days at June 30, 2012 from 38 days at July 3, 2011 . The increase in accounts receivable and days sales outstanding were primarily due to increased billings during the fourth quarter of 2012 resulting in a higher receivables balance. Inventories increased to $26.6 million at June 30, 2012 from $21.6 million at July 3, 2011 as a result of us increasing quantities on hand to support our new distribution center added in Hong Kong in the second half of fiscal 2012.
Deferred revenue, net increased to $39.3 million at June 30, 2012 from $37.0 million at July 3, 2011 . This increase was a result of higher sales of service maintenance agreements.
Cash flow used in investing activities was $10.4 million . Capital expenditures were $5.2 million and purchases of investments were $75.9 million , offset by proceeds from maturities of investments and marketable securities of $30.3 million and sales of investments and marketable securities of $40.7 million .
Cash provided by financing activities was $2.4 million resulting from $1.4 million proceeds from the issuance of common stock and $1.0 million deposit received from the sale of the building.
Contractual Obligations
The following summarizes our contractual obligations at June 30, 2012 , and the effect such obligations are expected to have on our liquidity and cash flow in future periods (in thousands):
| Total |
| Less Than 1 Year |
| 1 – 3 Years |
| 3 – 5 Years |
| More Than Five Years | ||||||||||
Contractual Obligations: |
|
|
|
|
|
|
|
|
| ||||||||||
Non-cancelable inventory purchase commitments | $ | 38,765 | |
| $ | 38,765 | |
| $ | - | |
| $ | - | |
| $ | - | |
Non-cancelable operating lease obligations | 9,098 | |
| 3,528 | |
| 3,566 | |
| 1,197 | |
| 807 | | |||||
Total contractual cash obligations | $ | 47,863 | |
| $ | 42,293 | |
| $ | 3,566 | |
| $ | 1,197 | |
| $ | 807 | |
Non-cancelable inventory purchase commitments represent the purchase of long lead-time component inventory that our contract manufacturers procure in accordance with our forecast. Inventory purchase commitments were $38.8 million as of June 30, 2012 , an increase of $12.8 million from $26.0 million as of July 3, 2011 .
The amounts in the table above exclude $0.5 million of income tax liabilities related to uncertain tax positions as we are unable to reasonably estimate the timing of settlement.
We did not have any material commitments for capital expenditures as of June 30, 2012 . Other non-cancelable purchase commitments represent OEM and technology agreements.
Off-Balance Sheet Arrangements
We did not have any off-balance sheet arrangements as of June 30, 2012 .
Capital Resources and Financial Condition
36
Table of Contents
As of June 30, 2012 , in addition to $54.6 million in cash and cash equivalents, we had $23.4 million invested in short-term investments and $75.6 million invested in long-term marketable investments for a total cash and cash equivalents, short-term investments and marketable securities of $153.5 million .
We believe that our current cash and cash equivalents, short-term investments, marketable securities and cash available from credit facilities and future operations will enable us to meet our working capital requirements for at least the next 12 months.
Item 7A. Quantitative and Qualitative Disclosures About Market Risk
Interest Rate Sensitivity
The primary objective of our investment activities is to preserve principal while at the same time maximize the income we receive from our investments without significantly increasing risk. Some of the securities that we have invested in may be subject to market risk. This means that a change in prevailing interest rates may cause the principal amount of the investment to fluctuate. For example, if we hold a security that was issued with a fixed interest rate at the then-prevailing rate and the prevailing interest rate later rises, the principal amount of our investment will probably decline. To minimize this risk, we maintain our portfolio of cash equivalents and short-term investments in a variety of securities, including commercial paper, other non-government debt securities and money market funds.
The valuation of our investment portfolio is subject to uncertainties that are difficult to predict. Factors that may impact its valuation include changes to credit ratings of the securities, discount rates and ongoing strength and quality of market credit and liquidity.
If the current market conditions deteriorate further, or the anticipated recovery in market values does not occur, we may be required to record impairment charges in future quarters.
The following table presents the amounts of our cash equivalents, short-term investments and marketable securities that are subject to market risk by range of expected maturity and weighted-average interest rates as of June 30, 2012 and July 3, 2011 . This table does not include money market funds because those funds are generally not subject to market risk.
| Maturing in | ||||||||||||||||||
| Three months or less |
| Three months to one year |
| Greater than one year |
| Total |
| Fair Value | ||||||||||
| (In thousands) | ||||||||||||||||||
June 30, 2012 |
|
|
|
|
|
|
|
|
| ||||||||||
Included in short-term investments | $ | - | |
| $ | 23,358 | |
| - | |
| $ | 23,358 | |
| $ | 23,358 | | |
Weighted average interest rate | - | |
| 0.99 | % |
| - | |
|
|
| | |||||||
Included in marketable securities | - | |
| - | |
| $ | 75,561 | |
| $ | 75,561 | |
| $ | 75,561 | | ||
Weighted average interest rate | - | |
| - | |
| 0.75 | % |
|
|
| | |||||||
| Maturing in | ||||||||||||||||||
| Three months or less |
| Three months to one year |
| Greater than one year |
| Total |
| Fair Value | ||||||||||
| (In thousands) | ||||||||||||||||||
July 3, 2011 |
|
|
|
|
|
|
|
|
| ||||||||||
Included in short-term investments | $ | 10,524 | |
| $ | 30,833 | |
| - | |
| $ | 41,357 | |
| $ | 41,357 | | |
Weighted average interest rate | 0.95 | % |
| 1.18 | % |
| - | |
|
|
| | |||||||
Included in marketable securities | - | |
| - | |
| $ | 55,648 | |
| $ | 55,648 | |
| $ | 55,648 | | ||
Weighted average interest rate | - | |
| - | |
| 1.13 | % |
|
|
| | |||||||
The following tables present hypothetical changes in fair value of the financial instruments held at June 30, 2012 that are sensitive to changes in interest rates:
37
Table of Contents
Unrealized gain given a decrease in interest rate of X bps |
| Fair value as of |
| Unrealized loss given an increase in interest rate of X bps | ||||
(100 bps) |
| (50 bps) |
| June 30, 2012 |
| 100 bps |
| 50 bps |
(In thousands) | ||||||||
$1,070 |
| $744 |
| $98,920 |
| $(1,458) |
| $(734) |
|
|
|
|
|
|
|
|
|
Exchange Rate Sensitivity
Currently, substantially all of our sales and the majority of our expenses are denominated in United States dollars and, as a result, we have experienced no significant foreign exchange gains and losses to date. While we conduct some sales transactions and incur certain operating expenses in foreign currencies and expect to continue to do so, we do not anticipate that foreign exchange gains or losses will be significant, in part because of our foreign exchange risk management process discussed below.
Foreign Exchange Forward Contracts
We record all derivatives on the balance sheet at fair value. Changes in the fair value of derivatives are recognized in earnings as Other Income (Expense). We enter into foreign exchange forward contracts to mitigate the effect of gains and losses generated by the foreign currency forecasted transactions related to certain operating expenses and re-measurement of certain assets and liabilities denominated in Japanese Yen, the Euro, the Swedish Krona, the Indian Rupee and the British Pound. These derivatives do not qualify as hedges. At June 30, 2012 , these forward foreign currency contracts had a notional principal amount of $16.9 million and unrealized gains on foreign exchange contracts of $ 0.2 million. These contracts have maturities of less than 60 days. Changes in the fair value of these foreign exchange forward contracts are offset largely by re-measurement of the underlying assets and liabilities.
Foreign currency transaction gains and losses from operations were a gain of $2.5 million in fiscal 2012 , a loss of $0.6 million in fiscal 2011 and a loss of $0.4 million in fiscal 2010 .
38
Table of Contents
Item 8. Financial Statements and Supplementary Data
INDEX TO CONSOLIDATED FINANCIAL STATEMENTS OF EXTREME NETWORKS, INC. | |
| Page(s) |
Reports of Independent Registered Public Accounting Firm | 40 |
|
|
Consolidated Balance Sheets | 41 |
|
|
Consolidated Statements of Income | 41 |
|
|
Consolidated Statements of Stockholde rs' Equity and Comprehensive Income | 41 |
|
|
Consolidated Statements of Cash Flows | 41 |
|
|
Notes to Consolidated Financial Statements | 42 |
39
Table of Contents
Report of Independent Registered Public Accounting Firm
The Board of Directors and Stockholders
Extreme Networks, Inc.
We have audited the accompanying consolidated balance sheets of Extreme Networks, Inc. and subsidiaries (the Company) as of June 30, 2012 and July 3, 2011, and the related consolidated statements of income, stockholders' equity and comprehensive income, and cash flows for the years then ended. In connection with our audits of the consolidated financial statements, we also have audited the related financial statement schedule. These consolidated financial statements and financial statement schedule are the responsibility of the Company's management. Our responsibility is to express an opinion on these consolidated financial statements and financial statement schedule based on our audits.
We conducted our audits in accordance with the standards of the Public Company Accounting Oversight Board (United States). Those standards require that we plan and perform the audit to obtain reasonable assurance about whether the financial statements are free of material misstatement. An audit includes examining, on a test basis, evidence supporting the amounts and disclosures in the financial statements. An audit also includes assessing the accounting principles used and significant estimates made by management, as well as evaluating the overall financial statement presentation. We believe that our audits provide a reasonable basis for our opinion.
In our opinion, the consolidated financial statements referred to above present fairly, in all material respects, the financial position of Extreme Networks, Inc. and subsidiaries as of June 30, 2012 and July 3, 2011, and the results of their operations and their cash flows for each of the years then ended, in conformity with U.S. generally accepted accounting principles. Also in our opinion, the related financial statement schedule, when considered in relation to the basic consolidated financial statements taken as a whole, presents fairly, in all material respects, the information set forth therein.
We also have audited, in accordance with the standards of the Public Company Accounting Oversight Board (United States), the Company's internal control over financial reporting as of June 30, 2012, based on criteria established in Internal Control - Integrated Framework issued by the Committee of Sponsoring Organizations of the Treadway Commission (COSO), and our report dated August 22, 2012 expressed an unqualified opinion on the effectiveness of the Company's internal control over financial reporting.
/s/ KPMG LLP
Santa Clara, California
August 22, 2012
40
Table of Contents
Report of Ernst & Young LLP, Independent Registered Public Accounting Firm
The Board of Directors and Shareholders
Extreme Networks, Inc.
We have audited the accompanying consolidated statements of income, stockholders' equity, and cash flows for the year ended June 27, 2010. Our audit also included the financial statement schedule listed in the Index at Item 15(a). These financial statements and schedule are the responsibility of the Company's management. Our responsibility is to express an opinion on these financial statements and schedule based on our audit.
We conducted our audit in accordance with the standards of the Public Company Accounting Oversight Board (United States). Those standards require that we plan and perform the audit to obtain reasonable assurance about whether the financial statements are free of material misstatement. An audit includes examining, on a test basis, evidence supporting the amounts and disclosures in the financial statements. An audit also includes assessing the accounting principles used and significant estimates made by management, as well as evaluating the overall financial statement presentation. We believe that our audit provide a reasonable basis for our opinion.
In our opinion, the financial statements referred to above present fairly, in all material respects, the consolidated results of operations and cash flows of Extreme Networks, Inc. for the year ended June 27, 2010, in conformity with U.S. generally accepted accounting principles. Also, in our opinion, the related financial statement schedule, when considered in relation to the basic financial statements taken as a whole, presents fairly in all material respects the information set forth therein.
/s/ Ernst & Young LLP
San Francisco, California
August 20, 2010
EXTREME NETWORKS, INC.
CONSOLIDATED BALANCE SHEETS
(In thousands, except share and per share amounts)
| June 30, |
| July 3, | ||||
ASSETS |
|
|
| ||||
Current assets: |
|
|
| ||||
Cash and cash equivalents | $ | 54,596 | |
| $ | 49,972 | |
Short-term investments | 23,358 | |
| 41,357 | | ||
Accounts receivable, net of allowances of $1,646 at June 30, 2012 and $1,412 at July 3, 2011 | 41,166 | |
| 33,689 | | ||
Inventories | 26,609 | |
| 21,583 | | ||
Deferred income taxes | 644 | |
| 681 | | ||
Prepaid expenses and other current assets | 5,655 | |
| 10,132 | | ||
Assets held for sale | 17,081 | |
| - | | ||
Total current assets | 169,109 | |
| 157,414 | | ||
Property and equipment, net | 25,180 | |
| 41,877 | | ||
Marketable securities | 75,561 | |
| 55,648 | | ||
Intangible assets, net | 5,106 | |
| 4,906 | | ||
Other assets | 9,634 | |
| 11,128 | | ||
Total assets | $ | 284,590 | |
| $ | 270,973 | |
LIABILITIES AND STOCKHOLDERS' EQUITY |
|
|
| ||||
Current liabilities: |
|
|
| ||||
Accounts payable | $ | 19,437 | |
| $ | 15,092 | |
Accrued compensation and benefits | 13,409 | |
| 13,723 | | ||
Restructuring liabilities | 463 | |
| 3,183 | | ||
Accrued warranty | 2,871 | |
| 2,640 | | ||
Deferred revenue, net | 31,769 | |
| 29,613 | | ||
Deferred distributors revenue, net of cost of sales to distributors | 15,319 | |
| 16,552 | | ||
Other accrued liabilities | 13,480 | |
| 19,050 | | ||
Total current liabilities | 96,748 | |
| 99,853 | | ||
Deferred revenue, less current portion | 7,559 | |
| 7,360 | | ||
Deferred income taxes | - | |
| 93 | | ||
Other long-term liabilities | 643 | |
| 2,381 | | ||
Commitments and contingencies (Note 3) | | |
| | | ||
Stockholders' equity: |
|
|
| ||||
Convertible preferred stock, $.001 par value, issuable in series, 2,000,000 shares authorized; none issued | - | |
| - | | ||
Common stock, $.001 par value, 750,000,000 shares authorized; 133,965,455 and 94,333,619 shares issued and outstanding, respectively, at June 30, 2012 and 132,147,451 and 92,522,146 shares issued and outstanding, respectively, at July 3, 2011 | 134 | |
| 132 | | ||
Treasury stock, 39,631,836 shares at June 30, 2012 and 39,625,305 shares at July 3, 2011 | (149,666 | ) |
| (149,666 | ) | ||
Additional paid-in-capital | 970,609 | |
| 963,565 | | ||
Accumulated other comprehensive income | (861 | ) |
| 3,703 | | ||
Accumulated deficit | (640,576 | ) |
| (656,448 | ) | ||
Total stockholders' equity | 179,640 | |
| 161,286 | | ||
Total liabilities and stockholders' equity | $ | 284,590 | |
| $ | 270,973 | |
See accompanying notes to consolidated financial statements.
EXTREME NETWORKS, INC.
CONSOLIDATED STATEMENTS OF INCOME
(In thousands, except per share amounts)
| Fiscal Year Ended | ||||||||||
| June 30, |
| July 3, |
| June 27, | ||||||
Net revenues: |
|
|
|
|
| ||||||
Product | $ | 261,873 | |
| $ | 274,388 | |
| $ | 249,035 | |
Service | 60,849 | |
| 60,040 | |
| 60,319 | | |||
Total net revenues | 322,722 | |
| 334,428 | |
| 309,354 | | |||
Cost of revenues: |
|
|
|
|
| ||||||
Product | 120,227 | |
| 129,556 | |
| 107,998 | | |||
Service | 22,648 | |
| 24,911 | |
| 24,863 | | |||
Total cost of revenues | 142,875 | |
| 154,467 | |
| 132,861 | | |||
Gross profit: |
|
|
|
|
| ||||||
Product | 141,646 | |
| 144,832 | |
| 141,037 | | |||
Service | 38,201 | |
| 35,129 | |
| 35,456 | | |||
Total gross profit | 179,847 | |
| 179,961 | |
| 176,493 | | |||
Operating expenses: |
|
|
|
|
| ||||||
Sales and marketing | 90,167 | |
| 103,277 | |
| 96,621 | | |||
Research and development | 45,640 | |
| 49,330 | |
| 49,390 | | |||
General and administrative | 28,658 | |
| 24,683 | |
| 26,839 | | |||
Restructuring charge, net of reversals | 1,594 | |
| 3,806 | |
| 4,238 | | |||
Litigation settlement (gain)/loss | (121 | ) |
| (4,249 | ) |
| 829 | | |||
Total operating expenses | 165,938 | |
| 176,847 | |
| 177,917 | | |||
Operating income (loss) | 13,909 | |
| 3,114 | |
| (1,424 | ) | |||
Interest income | 1,239 | |
| 1,304 | |
| 1,481 | | |||
Interest expense | (75 | ) |
| (132 | ) |
| (141 | ) | |||
Other income (expense), net | 1,995 | |
| (574 | ) |
| (99 | ) | |||
Income (loss) before income taxes | 17,068 | |
| 3,712 | |
| (183 | ) | |||
Provision (benefit) for income taxes | 1,196 | |
| 999 | |
| (410 | ) | |||
Net income | $ | 15,872 | |
| $ | 2,713 | |
| $ | 227 | |
Basic and diluted net income per share: |
|
|
|
|
| ||||||
Net income per share – basic | $ | 0.17 | |
| $ | 0.03 | |
| $ | - | |
Net income per share – diluted | $ | 0.17 | |
| $ | 0.03 | |
| $ | - | |
Shares used in per share calculation – basic | 93,451 | |
| 91,423 | |
| 89,281 | | |||
Shares used in per share calculation – diluted | 94,490 | |
| 92,795 | |
| 89,477 | | |||
See accompanying notes to consolidated financial statements.
EXTREME NETWORKS, INC.
CONSOLIDATED STATEMENTS OF STOCKHOLDERS' EQUITY
AND COMPREHENSIVE INCOME
(In thousands)
| Common Stock |
| Treasury Stock |
| Additional Paid-in-Capital |
| Accumulated Other Comprehensive Income (Loss) |
| Accumulated Deficit |
| Total Stockholders' Equity | ||||||||||||||||||
| Shares |
| Amount |
| Shares |
| Amount |
| |||||||||||||||||||||
Balances at June 28, 2009 | 128,425 | |
| $ | 128 | |
| (39,625 | ) |
| $ | (149,666 | ) |
| $ | 949,112 | |
| $ | 1,323 | |
| $ | (659,388 | ) |
| $ | 141,510 | |
Components of comprehensive income: | |
| |
| |
| |
| |
| |
| |
|
| ||||||||||||||
Net income | - | |
| - | |
| - | |
| - | |
| | |
| - | |
| 227 | |
| 227 | | ||||||
Change in unrealized gain on investments, net of tax expense of $0 | - | |
| - | |
| - | |
| - | |
| | |
| (265 | ) |
| - | |
| (265 | ) | ||||||
Foreign currency translation adjustment | - | |
| - | |
| - | |
| - | |
| | |
| 42 | |
| - | |
| 42 | | ||||||
Total comprehensive income | |
| |
| |
| |
| |
| |
| |
| 4 | | |||||||||||||
Exercise of options to purchase common stock | 337 | |
| - | |
| - | |
| - | |
| 739 | |
| - | |
| - | |
| 739 | | ||||||
Issuance of common stock under employee stock purchase plan | 620 | |
| 1 | |
| - | |
| - | |
| 1,101 | |
| - | |
| - | |
| 1,101 | | ||||||
Issuance of restricted stock, net of repurchases | 446 | |
| 1 | |
| - | |
| - | |
| (750 | ) |
| - | |
| - | |
| (749 | ) | ||||||
Share-based payments | - | |
| - | |
| - | |
| - | |
| 6,243 | |
| - | |
| - | |
| 6,243 | | ||||||
Repurchase of common stock | - | |
| - | |
| - | |
| - | |
| (7 | ) |
| - | |
| - | |
| (7 | ) | ||||||
Acceleration of employee stock option | - | |
| - | |
| - | |
| - | |
| 354 | |
| - | |
| - | |
| 354 | | ||||||
Balances at June 27, 2010 | 129,828 | |
| $ | 130 | |
| (39,625 | ) |
| $ | (149,666 | ) |
| $ | 956,792 | |
| $ | 1,100 | |
| $ | (659,161 | ) |
| $ | 149,195 | |
Components of comprehensive income: | |
| |
| |
| |
| |
| |
| |
|
| ||||||||||||||
Net income | - | |
| - | |
| - | |
| - | |
| | |
| - | |
| 2,713 | |
| 2,713 | | ||||||
Change in unrealized gain on investments, net of tax expense of $0 | - | |
| - | |
| - | |
| - | |
| | |
| 109 | |
| - | |
| 109 | | ||||||
Foreign currency translation adjustment | - | |
| - | |
| - | |
| - | |
| | |
| 2,494 | |
| - | |
| 2,494 | | ||||||
Total comprehensive income | |
| |
| |
| |
| |
| |
| |
| 5,316 | | |||||||||||||
Exercise of options to purchase common stock | 606 | |
| 2 | |
| - | |
| - | |
| 1,523 | |
| - | |
| - | |
| 1,525 | | ||||||
Issuance of common stock under employee stock purchase plan | 677 | |
| 2 | |
| - | |
| - | |
| 1,742 | |
| - | |
| - | |
| 1,744 | | ||||||
Issuance of restricted stock, net of repurchases | 1,036 | |
| (2 | ) |
| - | |
| - | |
| (1,737 | ) |
| - | |
| - | |
| (1,739 | ) | ||||||
Share-based payments | - | |
| - | |
| - | |
| - | |
| 5,245 | |
| - | |
| - | |
| 5,245 | | ||||||
Balances at July 3, 2011 | 132,147 | |
| $ | 132 | |
| (39,625 | ) |
| $ | (149,666 | ) |
| $ | 963,565 | |
| $ | 3,703 | |
| $ | (656,448 | ) |
| $ | 161,286 | |
Components of comprehensive income: | |
| |
| |
| |
| |
| |
| |
|
| ||||||||||||||
Net income | - | |
| - | |
| - | |
| - | |
| - | |
| - | |
| 15,872 | |
| 15,872 | | ||||||
Change in unrealized loss on investments, net of tax expense of $0 | - | |
| - | |
| - | |
| - | |
| - | |
| (196 | ) |
| | |
| (196 | ) | ||||||
Foreign currency translation adjustment | - | |
| - | |
| - | |
| - | |
| - | |
| (4,368 | ) |
| - | |
| (4,368 | ) | ||||||
Total comprehensive income | - | |
| - | |
| - | |
| - | |
| - | |
| - | |
| - | |
| 11,308 | | ||||||
Exercise of options to purchase common stock | 437 | |
| - | |
| - | |
| - | |
| 978 | |
| - | |
| - | |
| 978 | | ||||||
Issuance of common stock under employee stock purchase plan | 570 | |
| - | |
| - | |
| - | |
| 1,632 | |
| - | |
| - | |
| 1,632 | | ||||||
Issuance of restricted stock, net of repurchases | 811 | |
| 2 | |
| - | |
| - | |
| (1,219 | ) |
| - | |
| - | |
| (1,217 | ) | ||||||
Repurchase of common stock | - | |
| - | |
| (7 | ) |
| - | |
| (1 | ) |
| - | |
| - | |
| (1 | ) | ||||||
Share-based payments | - | |
| - | |
| - | |
| - | |
| 5,654 | |
| - | |
| - | |
| 5,654 | | ||||||
Balances at June 30, 2012 | 133,965 | |
| $ | 134 | |
| (39,632 | ) |
| $ | (149,666 | ) |
| $ | 970,609 | |
| $ | (861 | ) |
| $ | (640,576 | ) |
| $ | 179,640 | |
See accompanying notes to consolidated financial statements.
EXTREME NETWORKS, INC.
CONSOLIDATED STATEMENTS OF CASH FLOWS
(In thousands)
| Year Ended | ||||||||||
| June 30, |
| July 3, |
| June 27, | ||||||
Cash flows from operating activities: |
|
|
|
|
| ||||||
Net income | $ | 15,872 | |
| $ | 2,713 | |
| $ | 227 | |
Adjustments to reconcile net income to net cash provided by operating activities: |
|
|
|
|
| ||||||
Decrease in accrued investment income | 2,786 | |
| 2,900 | |
| 1,194 | | |||
Depreciation and amortization | 5,348 | |
| 6,811 | |
| 5,588 | | |||
Amortization of intangible assets | 1,818 | |
| 2,080 | |
| 1,322 | | |||
Change in value / loss on value of UBS option to put securities | - | |
| 2,429 | |
| 2,091 | | |||
Auction rate securities mark to market, trading (gain) | - | |
| (2,429 | ) |
| (2,091 | ) | |||
Provision for (recovery of) doubtful accounts | 127 | |
| (9 | ) |
| (26 | ) | |||
Provision for excess and obsolete inventory | 1,089 | |
| 2,232 | |
| 1,866 | | |||
Deferred income taxes | 37 | |
| (928 | ) |
| 21 | | |||
Loss on retirement of assets | 103 | |
| 582 | |
| 178 | | |||
Stock-based compensation | 6,189 | |
| 5,248 | |
| 6,235 | | |||
Non-cash restructuring charge, net of reversal | - | |
| - | |
| 379 | | |||
Foreign exchange gain on dissolution of entity | (1,887 | ) |
| - | |
| - | | |||
Unrealized loss on foreign exchange transactions | (904 | ) |
| (714 | ) |
| (167 | ) | |||
Changes in operating assets and liabilities, net |
|
|
|
|
| ||||||
Accounts receivable | (7,603 | ) |
| 8,376 | |
| (4,414 | ) | |||
Inventories | (6,115 | ) |
| (1,977 | ) |
| (11,320 | ) | |||
Prepaid expenses and other assets | 5,289 | |
| (8,581 | ) |
| (2,882 | ) | |||
Accounts payable | 3,918 | |
| (3,453 | ) |
| 5,773 | | |||
Accrued compensation and benefits | (850 | ) |
| (2,581 | ) |
| 946 | | |||
Restructuring liabilities | (2,696 | ) |
| (213 | ) |
| (3,734 | ) | |||
Accrued warranty | 231 | |
| (529 | ) |
| - | | |||
Deferred revenue, net | 2,355 | |
| (212 | ) |
| (299 | ) | |||
Deferred revenue, net of cost of sales to distributors | (1,233 | ) |
| (1,793 | ) |
| 8,524 | | |||
Other accrued liabilities | (9,232 | ) |
| 8,103 | |
| (536 | ) | |||
Other long-term liabilities | (829 | ) |
| (1,278 | ) |
| 2,068 | | |||
Net cash provided by operating activities | 13,813 | |
| 16,777 | |
| 10,943 | | |||
Cash flows provided by (used in) investing activities: |
|
|
|
|
| ||||||
Capital expenditures | (5,237 | ) |
| (5,697 | ) |
| (5,109 | ) | |||
Purchases of investments | (75,851 | ) |
| (111,798 | ) |
| (51,552 | ) | |||
Proceeds from maturities of investments and marketable securities | 30,295 | |
| 33,600 | |
| 34,452 | | |||
Proceeds from sales of investments and marketable securities | 40,658 | |
| 61,816 | |
| 13,435 | | |||
Purchases of intangible assets | (275 | ) |
| - | |
| - | | |||
Net cash (used in) investing activities | (10,410 | ) |
| (22,079 | ) |
| (8,774 | ) | |||
Cash flows provided by (used in) financing activities: |
|
|
|
|
| ||||||
Proceeds from issuance of common stock | 1,392 | |
| 1,530 | |
| 1,085 | | |||
Deposit received from sale of building | 1,001 | |
| 1,000 | |
| - | | |||
Net cash provided by financing activities | 2,393 | |
| 2,530 | |
| 1,085 | | |||
|
|
|
|
|
| ||||||
Foreign currency effect on cash | (1,172 | ) |
| 800 | |
| (543 | ) | |||
|
|
|
|
|
| ||||||
Net increase (decrease) in cash and cash equivalents | 4,624 | |
| (1,972 | ) |
| 2,711 | | |||
|
|
|
|
|
| ||||||
Cash and cash equivalents at beginning of period | 49,972 | |
| 51,944 | |
| 49,233 | | |||
Cash and cash equivalents at end of period | $ | 54,596 | |
| $ | 49,972 | |
| $ | 51,944 | |
Supplemental disclosure of cash flow information: |
|
|
|
|
| ||||||
Interest paid | $ | 75 | |
| $ | 132 | |
| $ | 141 | |
Cash paid for income taxes, net | $ | 2,615 | |
| $ | 1,759 | |
| $ | 1,197 | |
See accompanying notes to the consolidated financial statements.
41
Table of Contents
EXTREME NETWORKS, INC.
NOTES TO CONSOLIDATED FINANCIAL STATEMENTS
1. Description of Business
Extreme Networks, Inc. (" Extreme Networks " or " the Company ") is a leading provider of network infrastructure equipment and markets its products primarily to business, governmental, health care, service provider, and educational customers with a focus on large corporate enterprises and metropolitan service providers on a global basis. The Company conducts its sales and marketing activities on a worldwide basis through distributors, resellers and the Company's field sales organization. Extreme Networks was incorporated in California in 1996 and reincorporated in Delaware in 1999.
2. Basis of Presentation and Summary of Significant Accounting Policies
Fiscal Year
Effective June 30, 2012, the Company changed their fiscal period to coincide with calendar month-end. Previously, the Company used a fiscal 52/53 week manufacturing calendar year. Accordingly, the fiscal year ended June 30, 2012 has 52 weeks compared to 53 weeks in 2011 and 52 weeks in fiscal 2010. All references herein to "fiscal 2012 " or " 2012 " represent the fiscal year ended June 30, 2012 .
Principles of Consolidation
The consolidated financial statements include the accounts of Extreme Networks and its wholly-owned subsidiaries. All inter-company accounts and transactions have been eliminated.
The Company uses the U.S. dollar predominately as its functional currency. The functional currency for certain of its foreign subsidiaries is the local currency. For those subsidiaries that operate in a local currency functional environment, all assets and liabilities are translated to United States dollars at current rates of exchange; and revenue and expenses are translated using average rates.
Accounting Estimates
The preparation of financial statements and related disclosures in conformity with accounting principles generally accepted in the United States requires management to make estimates and assumptions that affect the amounts reported in the financial statements and accompanying notes. Estimates are used for, but are not limited to, the accounting for the allowances for doubtful accounts and sales returns, estimated selling prices, inventory valuation, depreciation and amortization, impairment of long-lived assets, warranty accruals, restructuring liabilities, measurement of share-based compensation costs and income taxes. Actual results could differ materially from these estimates.
Revenue Recognition
The Company's revenue is primarily derived from sales of networking products, which are tangible products containing software and non-software components that function together to deliver the tangible product's essential functionality. In addition to tangible products, the Company's sales arrangements may include other deliverables such as standalone software licenses, or service offerings. For multiple deliverable arrangements, the Company recognizes revenue in accordance with the accounting standard for multiple deliverable revenue arrangements, which provides guidance on whether multiple deliverables exist, how deliverables in an arrangement should be separated, and how consideration should be allocated. Software revenue recognition guidance is applied to the sales of the Company's standalone software products, including software upgrades and software that is not essential to the functionality of the hardware with which it is sold.
Pursuant to the guidance of the accounting standard for multiple deliverable revenue arrangements, when the Company's sales arrangements contain multiple elements, such as products, software licenses, maintenance agreements, or professional services, the Company determines the standalone selling price for each element based on a selling price hierarchy. The application of the multiple deliverable revenue accounting standard does not change the units of accounting for the Company's multiple element arrangements. Under the selling price hierarchy, the selling price for each deliverable is based on the Company's vendor-specific objective evidence ("VSOE"), which is determined by a substantial majority of the Company's historical standalone sales transactions for a product or service falling within a narrow range. If VSOE is not available due to a lack of standalone sales transactions or lack of pricing within a narrow range, then third party evidence ("TPE"), as determined by the standalone pricing of competitive vendor products in similar markets, is used, if available. TPE typically is difficult to establish due to the proprietary differences of competitive products and difficulty in obtaining reliable competitive standalone pricing information. When neither VSOE nor TPE is available, the Company determines its best estimate of standalone selling price ("ESP") for a product or service and does so by considering several factors including, but not limited to, the 12-month historical median sales price, sales channel, geography, gross margin objective, competitive product pricing, and product life cycle. In consideration of all relevant pricing
42
Table of Contents
EXTREME NETWORKS, INC.
NOTES TO CONSOLIDATED FINANCIAL STATEMENTS-(Continued)
factors, the Company applies management judgment to determine the Company's best estimate of selling price through consultation with and formal approval by the Company's management for all products and services for which neither VSOE nor TPE is available. Generally the standalone selling price of services is determined using VSOE and the standalone selling price of other deliverables is determined by using ESP. The Company regularly reviews VSOE, TPE and ESP for all of its products and services and maintains internal controls over the establishment and updates of these estimates.
Pursuant to the software revenue recognition accounting standard, the Company continues to recognize revenue for software using the residual method for its sale of standalone software products, including optional software upgrades and other software that is not essential to the functionality of the hardware with which it is sold. After allocation of the relative selling price to each element of the arrangement, the Company recognizes revenue in accordance with the Company's policies for product, software, and service revenue recognition.
The Company derives the majority of its revenue from sales of its networking equipment, with the remaining revenue generated from service fees relating to maintenance service contracts, professional services, and training for its products. The Company generally recognizes product revenue from its value-added resellers, non-stocking distributors and end-user customers at the time of shipment, provided that persuasive evidence of an arrangement exists, delivery has occurred, the price of the product is fixed or determinable, and collection of the sales proceeds is reasonably assured. In instances where the criteria for revenue recognition are not met, revenue is deferred until all criteria have been met. The Company's total deferred product revenue from customers other than distributors was $2.2 million and $2.0 million as of June 30, 2012 and July 3, 2011 , respectively. The Company's total deferred revenue for services, primarily from service contracts, was $37.7 million as of June 30, 2012 and $36.0 million as of July 3, 2011 . Shipping costs are included in cost of product revenues. Sales taxes collected from customers that are excluded from revenues.
The Company sells its products and maintenance service contracts to partners in two distribution channels, or tiers. The first tier consists of a limited number of independent distributors that stock its products and sell primarily to resellers. The Company defers recognition of revenue on all sales to its stocking distributors until the distributors sell the product, as evidenced by "sales-out" reports that the distributors provide. The Company grants these distributors the right to return a portion of unsold inventory for the purpose of stock rotation and certain price protection rights. The distributor-related deferred revenue and receivables are adjusted at the time of the stock rotation return or price reduction. The Company also provides distributors with credits for changes in selling prices based on competitive conditions, and allows distributors to participate in cooperative marketing programs. The Company maintains estimated accruals and allowances for these exposures based upon the Company's historical experience. In connection with cooperative advertising programs, the Company does not meet the criteria for recognizing the expenses as marketing expenses and accordingly, the costs are recorded as a reduction to revenue in the same period that the related revenue is recorded.
The second tier of the distribution channel consists of a non-stocking distributors and value-added resellers that sell directly to end-users. For product sales to non-stocking distributors and value-added resellers, the Company does not grant return privileges, except for defective products during the warranty period, nor does the Company grant pricing credits. Accordingly, the Company recognizes revenue upon transfer of title and risk of loss or damage, generally upon shipment. The Company reduces product revenue for cooperative marketing activities and certain price protection rights that may occur under contractual arrangements with its resellers.
The Company provides an allowance for sales returns based on its historical returns, analysis of credit memo data and its return policies. The allowance for sales returns was $1.3 million and $0.6 million as of June 30, 2012 and July 3, 2011 , respectively, for estimated future returns that were recorded as a reduction of our accounts receivable. If the historical data that the Company uses to calculate the estimated sales returns and allowances does not properly reflect future levels of product returns, these estimates will be revised, thus resulting in an impact on future net revenue. The Company estimates and adjusts this allowance at each balance sheet date.
Cash Equivalents, Short-Term Investments and Marketable Securities
Summary of Available-for-Sale Securities (in thousands)
43
Table of Contents
EXTREME NETWORKS, INC.
NOTES TO CONSOLIDATED FINANCIAL STATEMENTS-(Continued)
| June 30, 2012 |
| July 3, 2011 | ||||
Cash | $ | 18,455 | |
| $ | 19,567 | |
|
|
|
| ||||
Cash equivalents | $ | 36,141 | |
| $ | 30,405 | |
Short-term investments | 23,358 | |
| 41,357 | | ||
Marketable securities | 75,561 | |
| 55,648 | | ||
Total available-for-sale | $ | 135,060 | |
| $ | 127,410 | |
|
|
|
| ||||
Total cash and available for sale securities | $ | 153,515 | |
| $ | 146,977 | |
Available-for-Sale Securities
The following is a summary of available-for-sale securities (in thousands):
| Amortized Cost |
| Fair Value |
| Unrealized Holding Gains |
| Unrealized Holding Losses | ||||||||
June 30, 2012 |
|
|
|
|
|
|
| ||||||||
Money market funds | $ | 36,141 | |
| $ | 36,141 | |
| $ | - | |
| $ | - | |
U.S. corporate debt securities | 84,882 | |
| 84,949 | |
| 148 | |
| (81 | ) | ||||
U.S. government agency securities | 11,241 | |
| 11,234 | |
| 3 | |
| (10 | ) | ||||
U.S. municipal bonds | 2,738 | |
| 2,736 | |
| - | |
| (2 | ) | ||||
| $ | 135,002 | |
| $ | 135,060 | |
| $ | 151 | |
| $ | (93 | ) |
Classified as: |
|
|
|
|
|
|
| ||||||||
Cash equivalents | $ | 36,141 | |
| $ | 36,141 | |
| $ | - | |
| $ | - | |
Short-term investments | 23,311 | |
| 23,358 | |
| 48 | |
| (1 | ) | ||||
Marketable securities | 75,550 | |
| 75,561 | |
| 103 | |
| (92 | ) | ||||
| $ | 135,002 | |
| $ | 135,060 | |
| $ | 151 | |
| $ | (93 | ) |
July 3, 2011 |
|
|
|
|
|
|
| ||||||||
Money market funds | $ | 30,405 | |
| $ | 30,405 | |
| $ | - | |
| $ | - | |
U.S. corporate debt securities | 89,004 | |
| 89,249 | |
| 287 | |
| (43 | ) | ||||
U.S. government agency securities | 7,746 | |
| 7,756 | |
| 13 | |
| (3 | ) | ||||
| $ | 127,155 | |
| $ | 127,410 | |
| $ | 300 | |
| $ | (46 | ) |
Classified as: |
|
|
|
|
|
|
| ||||||||
Cash equivalents | $ | 30,405 | |
| $ | 30,405 | |
| $ | - | |
| $ | - | |
Short-term investments | 41,245 | |
| 41,357 | |
| 114 | |
| (1 | ) | ||||
Marketable securities | 55,505 | |
| 55,648 | |
| 186 | |
| (45 | ) | ||||
| $ | 127,155 | |
| $ | 127,410 | |
| $ | 300 | |
| $ | (46 | ) |
The amortized cost and estimated fair value of available-for-sale investments in debt securities at June 30, 2012 , by contractual maturity, were as follows (in thousands):
| Amortized Cost |
| Fair Value | ||||
Due in 1 year or less | $ | 23,311 | |
| $ | 23,357 | |
Due in 1-2 years | 52,965 | |
| 52,994 | | ||
Due in 2-5 years | 22,585 | |
| 22,568 | | ||
Due in more than 5 years | - | |
| - | | ||
Total investments in available for sale debt securities | $ | 98,861 | |
| $ | 98,919 | |
The Company considers highly liquid investments with maturities of three months or less at the date of purchase to be cash
44
Table of Contents
EXTREME NETWORKS, INC.
NOTES TO CONSOLIDATED FINANCIAL STATEMENTS-(Continued)
equivalents. Investments with maturities of greater than three months, but less than one year at the balance sheet date are classified as Short Term Investments. Investments with maturities of greater than one year at balance sheet date are classified as Marketable Securities. Except for direct obligations of the United States government, securities issued by agencies of the United States government, and money market funds, the Company diversifies its investments by limiting its holdings with any individual issuer.
Investments include available-for-sale investment-grade debt securities that the Company carries at fair value. The Company accumulates unrealized gains and losses on the Company's available-for-sale debt securities, net of tax, in accumulated other comprehensive income in the stockholders' equity section of its balance sheets. Such an unrealized gain or loss does not reduce net income for the applicable accounting period. If the fair value of an available-for-sale debt instrument is less than its amortized cost basis, an other-than-temporary impairment is triggered in circumstances where (1) the Company intends to sell the instrument, (2) it is more likely than not that the Company will be required to sell the instrument before recovery of its amortized cost basis, or (3) the Company does not expect to recover the entire amortized cost basis of the instrument (that is, a credit loss exists). If the Company intends to sell or it is more likely than not that the Company will be required to sell the available-for-sale debt instrument before recovery of its amortized cost basis, the Company recognizes an other-than-temporary impairment in earnings equal to the entire difference between the debt instruments' amortized cost basis and its fair value. For available-for-sale debt instruments that are considered other-than-temporarily impaired due to the existence of a credit loss, if the Company does not intend to sell and it is not more likely than not that the Company will be required to sell the instrument before recovery of its remaining amortized cost basis (amortized cost basis less any current-period credit loss), the Company separates the amount of the impairment into the amount that is credit related and the amount due to all other factors. The credit loss component is recognized in earnings and is the difference between the debt instrument's amortized cost basis and the present value of its expected future cash flows. The remaining difference between the debt instrument's fair value and the present value of future expected cash flows is due to factors that are not credit related and is recognized in other comprehensive income.
The following table presents the Company's investments' gross unrealized losses and fair values, aggregated by investment category and length of time that individual securities have been in a continuous unrealized loss position.
| Less than 12 months |
| 12 months or more |
| Total | ||||||||||||||||||
| Fair Value |
| Unrealized Losses |
| Fair Value |
| Unrealized Losses |
| Fair Value |
| Unrealized Losses | ||||||||||||
June 30, 2012 |
|
|
|
|
|
|
|
|
|
|
| ||||||||||||
U.S. corporate debt securities | $ | 26,728 | |
| $ | (81 | ) |
| $ | 1,014 | |
| $ | - | |
| $ | 27,742 | |
| $ | (81 | ) |
U.S. government agency securities | $ | 5,498 | |
| $ | (10 | ) |
| $ | - | |
| $ | - | |
| $ | 5,498 | |
| $ | (10 | ) |
U.S. municipal bonds | $ | 2,736 | |
| $ | (2 | ) |
| $ | - | |
| $ | - | |
| $ | 2,736 | |
| $ | (2 | ) |
| $ | 34,962 | |
| $ | (93 | ) |
| $ | 1,014 | |
| $ | - | |
| $ | 35,976 | |
| $ | (93 | ) |
The Company determines the basis of the cost of a security sold or the amount reclassified out of accumulated other comprehensive income into earnings using the specific identification method. Realized gains or losses recognized on the sale of investments were not significant for fiscal 2012 , 2011 or fiscal 2010 . As of June 30, 2012 , there were twenty-one out of fifty-five investment securities that had unrealized losses. The unrealized gains / (losses) on the Company's investments were caused by interest rate fluctuations. Substantially all of the Company's available-for-sale investments are investment grade government and corporate debt securities that have maturities of less than three years. The Company does not intend to sell the investments and it is not more likely than not that the Company will be required to sell the investments before recovery of its amortized costs.
Fair Value of Financial Instruments
The Company measures certain financial assets and liabilities at fair value on a recurring basis, including cash equivalents, available-for-sale securities, trading securities and foreign currency derivatives. Fair value is measured based on a fair value hierarchy following three levels of inputs, of which the first two are considered observable and the last unobservable:
45
Table of Contents
EXTREME NETWORKS, INC.
NOTES TO CONSOLIDATED FINANCIAL STATEMENTS-(Continued)
• Level 1 |
|
| Quoted prices in active markets for identical assets or liabilities; |
|
|
|
|
• Level 2 |
|
| Inputs other than Level 1 that are observable, either directly or indirectly, such as quoted prices for similar assets or liabilities; quoted prices in markets that are not active; or other inputs that are observable or can be corroborated by observable market data for substantially the full term of the assets or liabilities; and |
|
|
|
|
• Level 3 |
|
| Unobservable inputs that are supported by little or no market activity and that are significant to the fair value of the assets or liabilities. |
The following table presents the Company's fair value hierarchy for its financial assets measured at fair value on a recurring basis:
June 30, 2012 | Level 1 |
| Level 2 |
| Level 3 |
| Total | ||||||||
| (In thousands) | ||||||||||||||
Assets |
|
|
|
|
|
|
| ||||||||
Investments: |
|
|
|
|
|
|
| ||||||||
Municipal bonds | $ | - | |
| $ | 2,736 | |
| $ | - | |
| $ | 2,736 | |
Federal agency notes | - | |
| 11,234 | |
| - | |
| 11,234 | | ||||
Money market funds | 36,141 | |
| - | |
| - | |
| 36,141 | | ||||
Corporate notes/bonds | - | |
| 84,949 | |
| - | |
| 84,949 | | ||||
Foreign currency forward contracts | - | |
| 179 | |
| - | |
| 179 | | ||||
Total | $ | 36,141 | |
| $ | 99,098 | |
| $ | - | |
| $ | 135,239 | |
July 3, 2011 | Level 1 |
| Level 2 |
| Level 3 |
| Total | ||||||||
| (In thousands) | ||||||||||||||
Assets |
|
|
|
|
|
|
| ||||||||
Investments: |
|
|
|
|
|
|
| ||||||||
Federal agency notes | $ | - | |
| $ | 7,756 | |
| $ | - | |
| $ | 7,756 | |
Money market funds | 30,405 | |
| - | |
| - | |
| 30,405 | | ||||
Corporate notes/bonds | - | |
| 89,249 | |
| - | |
| 89,249 | | ||||
Total | $ | 30,405 | |
| $ | 97,005 | |
| $ | - | |
| $ | 127,410 | |
Liabilities |
|
|
|
|
|
|
| ||||||||
Foreign currency forward contracts | $ | - | |
| $ | 37 | |
| $ | - | |
| $ | 37 | |
Total | $ | - | |
| $ | 37 | |
| $ | - | |
| $ | 37 | |
Level 2 investment valuations are based on inputs such as quoted market prices of similar instruments, dealer quotations or valuations provided by alternative pricing sources supported by observable inputs. These generally include U.S. government and sovereign obligations, most government agency securities, investment-grade corporate bonds, and state, municipal and provincial obligations. As of June 30, 2012 and July 3, 2011 , the Company had no assets or liabilities classified within Level 3. There were no transfers of assets or liabilities between Level 1 and Level 2 during the fiscal 2012.
Concentrations
The Company may be subject to concentration of credit risk as a result of certain financial instruments consisting principally of marketable investments and accounts receivable. The Company has placed its investments with high-credit quality issuers. The Company does not invest an amount exceeding 10% of its combined cash, cash equivalents, short-term investments and marketable securities in the securities of any one obligor or maker, except for obligations of the United States government, obligations of United States government agencies and money market accounts.
The Company performs ongoing credit evaluations of its customers and generally does not require collateral in exchange for credit.
The following table sets forth major customers accounting for 10% or more of our net revenue. The amounts for the fiscal year ended July 3, 2011 and June 27, 2010 have been revised to correct previously disclosed amounts:
46
Table of Contents
EXTREME NETWORKS, INC.
NOTES TO CONSOLIDATED FINANCIAL STATEMENTS-(Continued)
|
| Fiscal Year Ended | |||||||
|
| June 30, 2012 |
| July 3, 2011 |
| June 27, 2010 | |||
Westcon Group Inc. |
| 19 | % |
| 16 | % |
| 16 | % |
Scansource, Inc. |
| 13 | % |
| 14 | % |
| 13 | % |
Ericsson AB |
| 12 | % |
| 11 | % |
| * | |
Tech Data Corporation |
| * | |
| 11 | % |
| 12 | % |
|
|
|
|
|
|
| |||
* Less than 10% of revenue |
|
|
|
|
|
| |||
The following table sets forth major customers accounting for 10% or more of our accounts receivable balance. The amounts for the fiscal year ended July 3, 2011 have been revised to correct previously disclosed amounts:
|
| June 30, 2012 |
| July 3, 2011 | ||
Ericsson AB |
| 21 | % |
| 18 | % |
Westcon Group Inc. |
| 16 | % |
| * | |
Scansource, Inc. |
| * | |
| 18 | % |
|
|
|
|
| ||
* Less than 10% of accounts receivable |
|
|
|
| ||
Accounts Receivable and Allowance for Doubtful Accounts
Accounts receivable are recorded at the invoiced amount and do not bear interest. Substantially all receivables were trade receivables as of June 30, 2012 and July 3, 2011 .
The Company continually monitors and evaluates the collectability of its trade receivables based on a combination of factors. The Company records specific allowances for bad debts in general and administrative expense when the Company becomes aware of a specific customer's inability to meet its financial obligation to it, such as in the case of bankruptcy filings or deterioration of financial position. The Company writes-off receivables to the allowance after all collection efforts are exhausted. Estimates are used in determining the Company's allowances for all other customers based on factors such as current trends in the length of time the receivables are past due and historical collection experience. The Company mitigates some collection risk by requiring most of its customers in the Asia-Pacific region, excluding Japan, to pay cash in advance or secure letters of credit when placing an order with it.
Inventories
Inventory is stated at the lower of cost or market. Cost is computed using standard cost, which approximates actual cost, on a first-in, first-out basis. The Company reduces the carrying value of inventory to net realizable value based on excess and obsolete inventories which are primarily determined by age of inventory and future demand forecasts. At the point of the loss recognition, a new, lower-cost basis for that inventory is established, and subsequent changes in facts and circumstances do not result in the restoration or increase in that newly established cost basis. Any written down or obsolete inventory subsequently sold has not had a material impact on gross profit for any of the periods disclosed.
Inventories at June 30, 2012 and July 3, 2011 , respectively, were (in thousands):
| June 30, 2012 |
| July 3, 2011 | ||||
Inventory | $ | 27,964 | |
| $ | 26,487 | |
Less: Excess and Obsolete Inventory | 1,355 | |
| 4,904 | | ||
Inventory, net | $ | 26,609 | |
| $ | 21,583 | |
Assets Held for Sale
On September 23, 2010, the Company entered into an Option Agreement with Trumark Companies LLC ("Trumark"), under
47
Table of Contents
EXTREME NETWORKS, INC.
NOTES TO CONSOLIDATED FINANCIAL STATEMENTS-(Continued)
which the Company granted Trumark an option (the "Option") to purchase half of its corporate headquarters campus in Santa Clara, California (First Property), at a price of $24.0 million . On January 25th the Company entered into a new option to purchase the remaining property. Under the agreements, Trumark will have until December 18, 2012 to exercise the options to purchase the First Property and may extend the option if they make certain payments to the Company. In January 2012, the Company classified the First Property as "assets held for sale" on the consolidated balance sheet at a net book value of $17.1 million , which was the lesser of the fair value (less cost to sell) or carrying amount of the assets, and ceased recognizing depreciation expense on the assets. During the third quarter of fiscal 2012, Company entered into a new Option Agreement with Trumark, under which it granted Trumark an option to purchase the remaining portion of the Company's corporate campus (Second Property). The Second Property is included as part of the Property and Equipment, classified as 'assets held for use', due to certain unresolved contingencies.
Long-Lived Assets
Long-lived assets include (a) property and equipment, (b) intangible assets, and (c) service inventory. Property and equipment, and intangible assets are reviewed for impairment whenever events or changes in circumstances indicate that the carrying amount of such assets or asset groups may not be recoverable. If such facts and circumstances exist, the Company assesses the recoverability of these assets by comparing the projected undiscounted net cash flows associated with the related asset or group of assets over their remaining lives against their respective carrying amounts. Impairments, if any, are based on the excess of the carrying amount over the fair value of those assets. The Company reduces the carrying value of service inventory to net realizable value based on excess and obsolete inventories which are primarily determined by age of inventory and future demand forecasts.
(a) Property and Equipment, Net
Property and equipment are stated at cost less accumulated depreciation and amortization. Depreciation and amortization is computed using the straight-line method over the estimated useful lives of the assets, with the exception of land, which is not depreciated. Estimated useful lives of 25 years are used for buildings. Estimated useful lives of one to four years are used for computer equipment and software. Estimated useful lives of three years are used for office equipment, furniture and fixtures. Depreciation and amortization of leasehold improvements is computed using the lesser of the useful life or lease terms (ranging from two to ten years). Property and equipment consist of the following (in thousands):
| June 30, 2012 |
| July 3, 2011 | ||||
Computer equipment | $ | 42,771 | |
| $ | 51,806 | |
Land | 10,300 | |
| 20,600 | | ||
Buildings and improvements | 9,581 | |
| 19,213 | | ||
Purchased software | 11,961 | |
| 12,176 | | ||
Office equipment, furniture and fixtures | 3,201 | |
| 3,774 | | ||
Leasehold improvements | 5,467 | |
| 5,736 | | ||
| 83,281 | |
| 113,305 | | ||
Less: accumulated depreciation and amortization | (58,101 | ) |
| (71,428 | ) | ||
Property and equipment, net | $ | 25,180 | |
| $ | 41,877 | |
On January 25, 2012, Company entered into a new Option Agreement with Trumark, under which it granted Trumark an option to purchase the remaining portion of the Company's corporate campus (Second Property), at a price of $24.5 million . Under the agreement, Trumark will have until December 28, 2012 to exercise the options to purchase the Second Property and may extend the option if they make certain payments to the Company. As of June 30, 2012 , the Company had received option payments totaling $2.0 million from Trumark, which were classified as a deferred gain and included in other current liabilities on the consolidated balance sheet. As of June 30, 2012, the Second Property, with a net book value of $16.0 million , remains classified as "assets held for use" due to certain unresolved contingencies that may delay the completion date of this transaction, including the Company's execution of an agreement with Trumark to lease back the Second Property.
(b) Intangible Assets
The following tables summarize the components of gross and net intangible asset balances (in thousands):
48
Table of Contents
EXTREME NETWORKS, INC.
NOTES TO CONSOLIDATED FINANCIAL STATEMENTS-(Continued)
| Weighted Average Remaining Amortization Period |
| Gross Carrying Amount |
| Accumulated Amortization |
| Net Carrying Amount | ||||||
June 30, 2012 |
|
|
|
|
|
|
| ||||||
Patents | 7.4 years |
| $ | 1,800 | |
| $ | 669 | |
| $ | 1,131 | |
License Agreements | 9.3 years |
| 10,158 | |
| 6,231 | |
| 3,927 | | |||
Other Intangibles | 0.3 years |
| 324 | |
| 276 | |
| 48 | | |||
|
|
| $ | 12,282 | |
| $ | 7,176 | |
| $ | 5,106 | |
| Weighted Average Remaining Amortization Period |
| Gross Carrying Amount |
| Accumulated Amortization |
| Net Carrying Amount | ||||||
July 3, 2011 |
|
|
|
|
|
|
| ||||||
Patents | 7.7 years |
| $ | 1,800 | |
| $ | 387 | |
| $ | 1,413 | |
License Agreements | 6.5 years |
| 8,140 | |
| 4,788 | |
| 3,352 | | |||
Other Intangibles | 1.2 years |
| 324 | |
| 183 | |
| 141 | | |||
|
|
| $ | 10,264 | |
| $ | 5,358 | |
| $ | 4,906 | |
Amortization expense was $1.8 million , $2.1 million , and $1.3 million in fiscal 2012 , 2011 , and 2010 , respectively. Amortization expense expected to be recorded for each of the next five years is as follows (in thousands):
For the fiscal year ending: |
| ||
2013 | $ | 1,427 | |
2014 | 834 | | |
2015 | 438 | | |
2016 | 308 | | |
2017 | 282 | | |
Thereafter | 1,817 | | |
Total | $ | 5,106 | |
(c) Service Inventory
The Company holds service inventory to support customers who have purchased long term service contracts with a hardware replacement element.
| June 30, 2012 |
| July 3, 2011 | ||||
Service Inventory | $ | 13,109 | |
| $ | 13,555 | |
Less: Excess and Obsolete Inventory | 5,074 | |
| 3,976 | | ||
Service Inventory, Net | $ | 8,035 | |
| $ | 9,579 | |
Deferred Revenue, Net
Deferred revenue, net represents amounts for (i) deferred services revenue (support arrangements, professional services and training), and (ii) deferred product revenue net of the related cost of revenue where the revenue recognition criteria have not been met related to sales by the Company to its resellers or directly to its end-customers. Product revenue includes shipments to end-users and value-add resellers. The following table summarizes deferred revenue, net at the end of fiscal 2012 and 2011 , respectively (in thousands):
49
Table of Contents
EXTREME NETWORKS, INC.
NOTES TO CONSOLIDATED FINANCIAL STATEMENTS-(Continued)
| June 30, 2012 |
| July 3, 2011 | ||||
Deferred services | $ | 37,708 | |
| $ | 36,025 | |
Deferred product: |
|
|
| ||||
Deferred revenue | 2,236 | |
| 1,984 | | ||
Deferred cost of sales | (616 | ) |
| (1,036 | ) | ||
Deferred product revenue, net | 1,620 | |
| 948 | | ||
Balance at end of period | 39,328 | |
| 36,973 | | ||
Less: current portion | 31,769 | |
| 29,613 | | ||
Non-current deferred revenue, net | $ | 7,559 | |
| $ | 7,360 | |
The Company offers renewable support arrangements, including extended warranty contracts, to its customers that range generally from one to five years. Deferred support revenue is included within deferred revenue, net within the Services category above. The change in the Company's deferred support revenue balance in relation to these arrangements was as follows (in thousands):
| Year Ended | ||||||
| June 30, 2012 |
| July 3, 2011 | ||||
Balance beginning of period | $ | 35,802 | |
| $ | 36,193 | |
New support arrangements | 59,313 | |
| 58,150 | | ||
Recognition of support revenue | (57,654 | ) |
| (58,541 | ) | ||
Balance end of period | 37,461 | |
| 35,802 | | ||
Less: current portion | 29,902 | |
| 28,442 | | ||
Non-current deferred revenue | $ | 7,559 | |
| $ | 7,360 | |
Deferred Distributors Revenue, Net of Cost of Sales to Distributors
At the time of shipment to distributors, the Company records a trade receivable at the contractual discount to list selling price since there is a legally enforceable obligation from the distributor to pay on a current basis for product delivered, the Company relieves inventory for the carrying value of goods shipped since legal title has passed to the distributor, and the Company records deferred revenue and deferred cost of sales in "Deferred distributors revenue, net of cost of sales to distributors" in the liability section of its consolidated balance sheets. Deferred distributors revenue, net of cost of sales to distributors effectively represents the gross margin on the sale to the distributor; however, the amount of gross margin the Company recognizes in future periods will frequently be less than the originally recorded deferred distributors revenue, net of cost of sales to distributors as a result of price concessions negotiated at time of sell-through to end customers. The Company sells each item in its product catalog to all of its distributors worldwide at contractually discounted prices. However, distributors resell the Company's products to end customers at a very broad range of individually negotiated price points based on customer, product, quantity, geography, and other competitive conditions which results in the Company remitting back to the distributors a portion of their original purchase price after the resale transaction is completed. Thus, a portion of the deferred revenue balance represents a portion of distributors' original purchase price that will be remitted back to the distributors in the future. The wide range and variability of negotiated price credits granted to distributors does not allow the Company to accurately estimate the portion of the balance in the deferred revenue that will be remitted to the distributors. Therefore, the Company does not reduce deferred revenue by anticipated future price credits; instead, price credits are recorded against revenue when incurred, which is generally at the time the distributor sells the product.
The following table summarizes deferred distributors revenue, net of cost of sales to distributors at the end of fiscal 2012 and 2011 , respectively (in thousands):
| Year Ended | ||||||
| June 30, 2012 |
| July 3, 2011 | ||||
Deferred revenue | $ | 20,361 | |
| $ | 22,454 | |
Deferred cost of Sales | (5,042 | ) |
| (5,902 | ) | ||
Total deferred distributors revenue, net of cost of sales to distributors | $ | 15,319 | |
| $ | 16,552 | |
Guarantees and Product Warranties
50
Table of Contents
EXTREME NETWORKS, INC.
NOTES TO CONSOLIDATED FINANCIAL STATEMENTS-(Continued)
Upon issuance of a standard product warranty, the Company discloses and recognizes a liability for the obligation it assumes under the warranty. The following table summarizes the activity related to the Company's product warranty liability during fiscal 2012 and fiscal 2011 :
| Year ended | ||||||
| June 30, 2012 |
| July 3, 2011 | ||||
Balance beginning of period | $ | 2,640 | |
| $ | 3,169 | |
New warranties issued | 3,117 | |
| 2,351 | | ||
Warranty expenditures | (2,886 | ) |
| (2,880 | ) | ||
Balance end of period | $ | 2,871 | |
| $ | 2,640 | |
The Company's standard hardware warranty period is typically 12 months from the date of shipment to end-users and 90 days for software. For certain access products, the Company offers a limited lifetime hardware warranty commencing on the date of shipment from the Company and ending five (5) years following the Company's announcement of the end of sale of such product. Upon shipment of products to its customers, the Company estimates expenses for the cost to repair or replace products that may be returned under warranty and accrue a liability in cost of product revenue for this amount. The determination of the Company's warranty requirements is based on actual historical experience with the product or product family, estimates of repair and replacement costs and any product warranty problems that are identified after shipment. The Company estimates and adjusts these accruals at each balance sheet date in accordance with changes in these factors.
In the normal course of business to facilitate sales of its products, the Company indemnifies its resellers and end-user customers with respect to certain matters. The Company has agreed to hold the customer harmless against losses arising from a breach of intellectual property infringement or other claims made against certain parties. These agreements may limit the time within which an indemnification claim can be made and the amount of the claim. It is not possible to estimate the maximum potential amount under these indemnification agreements due to the limited history of prior indemnification claims and the unique facts and circumstances involved in each particular agreement. Historically, payments made by the Company under these agreements have not had a material impact on its operating results or financial position.
Other Accrued Liabilities
The following are the components of other accrued liabilities (in thousands):
| June 30, 2012 |
| July 3, 2011 | ||||
Accrued general and administrative costs | $ | 1,599 | |
| $ | 5,373 | |
Other accrued liabilities | 11,881 | |
| 13,677 | | ||
Total | $ | 13,480 | |
| $ | 19,050 | |
Advertising
Cooperative advertising obligations with customers are accrued and the costs expensed at the time the related revenue is recognized. All other advertising costs are expensed as incurred. Cooperative advertising expenses are recorded as marketing expenses to the extent that an advertising benefit separate from the revenue transaction can be identified and the cash paid does not exceed the fair value of that advertising benefit received. Otherwise, such cooperative advertising obligations with customers are recorded as a reduction of revenue. Advertising expenses were $0.5 million , $0.6 million , and $0.1 million , respectively, in fiscal 2012 , fiscal 2011 , and fiscal 2010 .
Impact of Recently Issued Accounting Standards
In June 2011, the FASB issued ASU 2011-05, Comprehensive Income (Topic 220) : Presentation of Comprehensive Income . ASU 2011-05 requires one of two alternatives for presenting comprehensive income and eliminates the option to report other comprehensive income and its components as a part of the Consolidated Statements of Stockholders' Equity. Additionally, ASU 2011-05 requires presentation on the face of the financial statements reclassification adjustments for items that are reclassified from other comprehensive income to net income in the statement(s) where the components of net income and the components of other comprehensive income are presented. The requirement related to the reclassification adjustments from other comprehensive income to net income was deferred in December 2011, as a result of the issuance of ASU 2011-12, Deferral of the Effective Date for Amendments to the Presentation of Reclassifications of Items Out of Accumulated Other Comprehensive Income in Accounting Standards Update 2011-05 (Topic 220) . The amendments in ASU 2011-05, as amended by ASU 2011-12, do not change the items that must be reported in other comprehensive income or when an item of other comprehensive income must be reclassified to net
51
Table of Contents
EXTREME NETWORKS, INC.
NOTES TO CONSOLIDATED FINANCIAL STATEMENTS-(Continued)
income. ASU 2011-05, as amended by ASU 2011-12 is effective for fiscal years and interim periods within those years beginning after December 15, 2011 and is to be applied retrospectively. We will adopt ASU 2011-05 during the first quarter of fiscal 2013. We do not expect the adoption of ASU 2011-05, as amended by ASU 2011-12 to have a material impact on our Consolidated Financial Statements.
3. Commitments, Contingencies and Leases
Leases
The Company leases office space for its various United States and international sales offices. Certain leases contain rent escalation clauses and renewal options. The Company subleases certain of its leased facilities to third party tenants. Future annual minimum lease payments under all non-cancelable operating leases having initial or remaining lease terms in excess of one year at June 30, 2012 were as follows (in thousands):
| Future Lease Payments | ||
Fiscal 2013 | $ | 3,528 | |
Fiscal 2014 | 2,267 | | |
Fiscal 2015 | 1,298 | | |
Fiscal 2016 | 692 | | |
Fiscal 2017 | 506 | | |
Thereafter | 807 | | |
Total minimum payments | $ | 9,098 | |
Rent expense, was approximately $4.3 million in fiscal 2012 , $4.3 million in fiscal 2011 , and $4.2 million in fiscal 2010 .
Purchase Commitments
The Company currently has arrangements with contract manufacturers and suppliers for the manufacture of its products. The arrangements allow them to procure long lead-time component inventory based upon a rolling production forecast provided by the Company. The Company is obligated to the purchase of long lead-time component inventory that its contract manufacturer procures in accordance with the forecast, unless the Company gives notice of order cancellation outside of applicable component lead-times. As of June 30, 2012 , the Company had non-cancelable commitments to purchase approximately $38.8 million of such inventory during the first quarter of fiscal 2013.
Legal Proceedings
The Company may from time to time be party to litigation arising in the course of its business, including, without limitation, allegations relating to commercial transactions, business relationships or intellectual property rights. Such claims, even if not meritorious, could result in the expenditure of significant financial and managerial resources. Litigation in general, and intellectual property and securities litigation in particular, can be expensive and disruptive to normal business operations. Moreover, the results of legal proceedings are difficult to predict.
In accordance with applicable accounting guidance, the Company records accruals for certain of its outstanding legal proceedings, investigations or claims when it is probable that a liability will be incurred and the amount of loss can be reasonably estimated. The Company evaluates, at least on a quarterly basis, developments in legal proceedings, investigations or claims that could affect the amount of any accrual, as well as any developments that would result in a loss contingency to become both probable and reasonably estimable. When a loss contingency is not both probable and reasonably estimable, the Company does not record a loss accrual. However, if the loss (or an additional loss in excess of any prior accrual) is at least a reasonable possibility and material, then the Company would disclose an estimate of the possible loss or range of loss, if such estimate can be made, or disclose that an estimate cannot be made. The assessment whether a loss is probable or a reasonable possibility, and whether the loss or a range of loss is estimable, involves a series of complex judgments about future events. Even if a loss is reasonably possible, the Company may not be able to estimate a range of possible loss, particularly where (i) the damages sought are substantial or indeterminate, (ii) the proceedings are in the early stages, or (iii) the matters involve novel or unsettled legal theories or a large number of parties. In such cases, there is considerable uncertainty regarding the ultimate resolution of such matters, including the amount of any possible loss, fine or penalty. Accordingly, for current proceedings, the Company is currently unable to estimate any reasonably possible loss or range of possible loss. However, an adverse resolution of one or more of such matters could have a material adverse effect on the Company's results of operations in a particular quarter or fiscal year.
52
Table of Contents
EXTREME NETWORKS, INC.
NOTES TO CONSOLIDATED FINANCIAL STATEMENTS-(Continued)
Intellectual Property Litigation
Enterasys Networks
On April 20, 2007, the Company filed suit against Enterasys Networks in the United States District Court for the Western District of Wisconsin, Civil Action No. 07-C-0229-C. The complaint alleged willful infringement of U.S. Patents Nos. 6,104,700, 6,678,248, and 6,859,438, and sought injunctive relief against Enterasys' continuing sale of infringing goods and monetary damages. Enterasys responded to the complaint on May 30, 2007, and also filed counterclaims alleging infringement of three U.S. patents owned by Enterasys. On April 9, 2008, the Court dismissed Enterasys' counterclaims on one of its patents with prejudice. On May 5, 2008, the Court granted the Company's motion for summary judgment, finding that it does not infringe Enterasys' two remaining patents and dismissing all of Enterasys' remaining counterclaims with prejudice. On May 30, 2008, a jury found that Enterasys infringed all three of the Company's patents and awarded it damages in the amount of $0.2 million . The Court also ruled in the Company's favor on Enterasys' challenge to the validity of the Company's patents. On October 29, 2008, the Court denied Enterasys' post-trial motion for judgment as a matter of law, and granted Extreme Network's motion for a permanent injunction against Enterasys. The injunction order permanently enjoins Enterasys from manufacturing, using, offering to sell, selling in the U.S. and importing into the U.S. the Enterasys products accused of infringing Extreme Network's three patents. On March 16, 2009, the Court also denied Enterasys' motion for a new trial, but granted Enterasys' motion for a stay of the injunction pending appeal. On April 17, 2009, Enterasys filed its notice of appeal and on May 1, 2009, the Company filed its cross appeal. On September 30, 2010, the U.S. Court of Appeals for the Federal Circuit upheld the jury verdict of infringement by Enterasys of the Company's patents and the Districts Court's summary judgment of non-infringement by the Company of Enterasys' '727 patent. The Federal Circuit reversed the judgment of non-infringement by the Company of Enterasys '181 patent, holding that the District Court Judge applied an incorrect claim construction and reversed the District Court's denial of the Company's request for attorneys' fees as premature. On November 4, 2011, a jury returned a verdict of non-infringement by the Company of the '181 patent and found the patent to be valid. Both parties filed post-trial motions, including motions for a new trial, for judgment as a matter of law and for attorneys fees, all of which the Court denied on July 11, 2012. Enterasys did not file a notice of appeal by the August 10, 2012 deadline. Consequently, the judgment of non-infringement is final.
On June 21, 2005, Enterasys filed suit against Extreme and Foundry Networks, Inc. ("Foundry") in the United States District Court for the District of Massachusetts, Civil Action No. 05-11298 DPW. The complaint alleges willful infringement of U.S. Patent Nos. 5,251,205; 5,390,173; 6,128,665; 6,147,995; 6,539,022; and 6,560,236, and seeks: a) a judgment that the Company willfully infringes each of the patents; (b) a permanent injunction from infringement, inducement of infringement and contributory infringement of each of the six patents; (c) damages and a "reasonable royalty" to be determined at trial; (d) treble damages; (e) attorneys' fees, costs and interest; and (f) equitable relief at the Court's discretion. Petitions for reexamination were filed challenging five of the patents at issue to the U.S. Patent and Trademark Office, and a stay of the case was entered. Following the reexamination proceedings, Enterasys withdrew its allegations of infringement as to two of the patents, U.S. Patent Nos. 6,539,022 and 6,560,236. The stay was lifted on May 21, 2010, and the Court held claim construction hearings in December 2010. Fact discovery is ongoing. No trial date has been set. The Company intends to defend the lawsuit vigorously, but, due to the inherent uncertainties of litigation, it cannot predict the ultimate outcome of the matter at this time.
Chrimar Systems
On October 31, 2011, Chrimar Systems, Inc. dba CMS Technologies, and Chrimar Holding Company filed suit against the Company, Cisco Systems, Inc., and Cisco Consumer Products LLC. Cisco-Linksys LLC, Hewlett-Packard Company, 3Com Corporation and Avaya, Inc. in the United States District Court for the District of Delaware, Civil Action No. 11-1050 ("the Delaware action"). The complaint alleges infringement of U.S. Patent No. 7,457,250. The Delaware action has been stayed pursuant to 28 USC Section 1659(a) pending final determination of the International Trade Commission action described below, based on the fact that the allegations in both cases relate to the same patent.
On November 1, 2011, Chrimar filed a complaint with the International Trade Commission, pursuant to Section 337 of the Tariff Act of 1930, as amended, alleging that the Company imports into the United States, sells for importation and/or sells within the United States after importation of products and/or systems infringing U.S. Patent No. 7,457,250 patent, the same patent asserted in the Delaware action. On December 2, 2011, the International Trade Commission instituted an investigation of these allegations ("the ITC action"). The complaint in the ITC action seeks a permanent order excluding from entry into the United States all infringing articles that are manufactured, imported or sold by the Company that infringe U.S. Patent No. 7,457,250. On July 20, 2012, Chrimar filed a motion to withdraw its complaint in the ITC and the motion was granted on August 1, 2012 by the presiding administrative law judge. The ALJ's decision is pending review by the ITC Commissioners.
During the fourth quarter of the fiscal 2012, the Company engaged in settlement discussions with Chrimar Systems Inc. As part of the negotiations the Company determined that it is reasonably possible that a range of loss could be between $0.3 million and $1.4 million which is dependent on a number of factors including whether mutually acceptable settlement terms can be reached. As of June 30, 2012 the Company has recorded a charge of $0.3 million as an estimate for the probable loss in the matter.
53
Table of Contents
EXTREME NETWORKS, INC.
NOTES TO CONSOLIDATED FINANCIAL STATEMENTS-(Continued)
Other Legal Matters
Beginning on July 6, 2001, purported securities fraud class action complaints were filed in the United States District Court for the Southern District of New York. The cases were consolidated and the litigation is now captioned as In re Extreme Networks, Inc. Initial Public Offering Securities Litigation, Civ. No. 01-6143 (SAS) (S.D.N.Y.), related to In re Initial Public Offering Securities Litigation, 21 MC 92 (SAS) (S.D.N.Y.). The operative amended complaint names us as defendants; six of the Company's present and former officers and/or directors, including its former CEO; and several investment banking firms that served as underwriters of its initial public offering and October 1999 secondary offering. The complaint alleges liability under Sections 11 and 15 of the Securities Act of 1933 and Sections 10(b) and 20(a) of the Securities Exchange Act of 1934, on the grounds that the registration statement for the offerings did not disclose that: (1) the underwriters had agreed to allow certain customers to purchase shares in the offerings in exchange for excess commissions paid to the underwriters; and (2) the underwriters had arranged for certain customers to purchase additional shares in the after-market at predetermined prices. Similar allegations were made in other lawsuits challenging over 300 other initial public offerings and follow-on offerings conducted in 1999 and 2000. The cases were consolidated for pretrial purposes. The parties to the lawsuits have reached a settlement, which was approved by the Court on October 6, 2009. Extreme Networks is not required to make any cash payments in the settlement. The Court subsequently entered a final judgment of dismissal. Certain objectors appealed the judgment. Subsequently, the District Court ruled that all objectors lacked standing to appeal. One of the objectors appealed that ruling. In January 2012, the Court dismissed the pending appeal and the case has concluded. The Company has no financial liability associated with the settlement.
Indemnification Obligations
Subject to certain limitations, the Company may be obligated to indemnify its current and former directors, officers and employees. These obligations arise under the terms of its certificate of incorporation, its bylaws, applicable contracts, and Delaware and California law. The obligation to indemnify, where applicable, generally means that the Company is required to pay or reimburse, and in certain circumstances the Company has paid or reimbursed, the individuals' reasonable legal expenses and possibly damages and other liabilities incurred in connection with these matters. It is not possible to estimate the maximum potential amount under these indemnification agreements due to the limited history of these claims. The cost to defend the Company and the named individuals could have a material adverse effect on its consolidated financial position, results of operations and cash flows in the future. Recovery of such costs under its directors and officers insurance coverage is uncertain.
4. Stockholders' Equity
Preferred Stock
In April 2001, in connection with the Company's Stockholders' Rights Agreement, the Company authorized the issuance of preferred stock. The preferred stock may be issued from time to time in one or more series. The Board of Directors is authorized to provide for the rights, preferences and privileges of the shares of each series and any qualifications, limitations or restrictions on these shares. As of June 30, 2012 , no shares of preferred stock were outstanding.
Stockholders' Rights Agreement
On April 26, 2012, the Board of Directors (the "Board") of Extreme Networks, Inc. ("Extreme Networks" or the "Company") adopted an Amended and Restated Rights Agreement (the "Restated Rights Plan"), between Extreme Networks and Computershare Shareholder Services LLC as the rights agent (the "Rights Agent"). The Restated Rights Plan governs the terms of each right ("Right") that has been issued with respect to each share of Common Stock of Extreme Networks. Each Right initially represents the right to purchase one one-thousandth of a share of Series A Preferred Stock of Extreme Networks. The Restated Rights Plan replaces in its entirety the Rights Agreement, dated as of April 27, 2001, as amended on June 30, 2010 and April 26, 2011, between Extreme Networks and Mellon Investor Services LLC (the "Prior Rights Plan"). The Board reviewed the necessity of the provision of the Prior Rights Plan adopted to preserve the value of Extreme Networks' deferred tax assets, including its net operating loss carry forwards, with respect to its ability to fully use its tax benefits to offset future income may be limited if it experiences an "ownership change" for purposes of Section 382 of the Internal Revenue Code of 1986 as a result of ordinary buying and selling of Extreme Networks' common stock. Following its review, the Board decided it was necessary and in the best interests of Extreme Networks and its stockholders to enter into the Restated Rights Plan. The Restated Rights Plan incorporates the Prior Rights Plan and the amendments thereto into a single agreement and extends the term of the Prior Rights Plan from April 30, 2012 to April 30, 2013.
Comprehensive Income
The following are the components of comprehensive income, net of tax (in thousands):
| Year Ended | ||||||||||
| June 30, |
| July 3, |
| June 27, | ||||||
Net income | $ | 15,872 | |
| $ | 2,713 | |
| $ | 227 | |
Change in unrealized (loss) gain on investments: |
|
|
|
|
| ||||||
Net unrealized (loss) gain on other investments | (196 | ) |
| 109 | |
| (265 | ) | |||
|
|
|
|
|
| ||||||
Foreign currency translation adjustments: |
|
|
|
|
| ||||||
Beginning balance | 3,448 | |
| 954 | |
| 912 | | |||
Ending balance | (920 | ) |
| 3,448 | |
| 954 | | |||
Foreign currency translation adjustments change | (4,368 | ) |
| 2,494 | |
| 42 | | |||
Comprehensive income | $ | 11,308 | |
| $ | 5,316 | |
| $ | 4 | |
Changes in the foreign currency translation adjustments during fiscal 2012 include the effect of the Japan subsidiary liquidation of $1.9 million .
Shares Reserved for Issuance
The following are shares reserved for issuance (in thousands):
| June 30, | |
Employee stock purchase plan | 2,571 | |
Employee stock options | 18,524 | |
Total shares reserved for issuance | 21,095 | |
5. Employee Benefit Plans (including Share-based Compensation)
As of June 30, 2012 , the Company has the following share-based compensation plans:
2005 Equity Incentive Plan
The 2005 Equity Incentive Plan (the " 2005 Plan ") was adopted by the Company's Board of Directors on October 20, 2005, and approved by stockholders on December 2, 2005. The 2005 Plan replaces the 1996 Stock Option Plan (the " 1996 Plan "), 2000 Non-statutory Stock Option Plan (the " 2000 Plan ") and 2001 Non-statutory Stock Option Plan (the " 2001 Plan ").
Under the 2005 Plan, the Company may grant stock options, stock appreciation rights, restricted stock, restricted stock units, performance shares, performance units, and other share-based or cash-based awards to employees and consultants. The 2005 Plan also authorizes the grant of awards of stock options, stock appreciation rights, restricted stock and restricted stock units to non-employee members of the Board of Directors and deferred compensation awards to officers, directors and certain management or highly compensated employees. The 2005 Plan authorizes the issuance of up to 12,000,000 shares of the Company's common stock and on December 23, 2009, the Company's shareholders approved to increase the number of shares authorized by another 4,000,000 shares. In addition, up to 11,000,000 shares subject to awards outstanding under the 1996 Plan, the 2000 Plan, and the 2001 Plan that expired have been added to the number of shares available for future grant under the 2005 Plan. As of June 30, 2012 , total options and awards to acquire 10,022,770 shares were outstanding under the 2005 Plan and 9,873,560 shares are available for grant under the 2005 Plan. Options granted under this plan have a contractual term of seven years.
Amended 1996 Stock Option Plan
The 1996 Plan was originally adopted in September 1996, and provided for the grant of options for common stock to eligible participants. A total of 56,382,867 shares were reserved under the 1996 Plan. Options granted under this plan have a contractual term of ten years. Effective December 2, 2005, the 1996 Plan was terminated, and, as of June 30, 2012 , options to acquire 1,049,308 shares were outstanding under the 1996 Plan.
2000 Plan
In March 2000, the Board of Directors adopted the 2000 Plan which provided for the grant of options for common stock to eligible participants. A total of 4,000,000 shares were reserved under the 2000 Plan. Options granted under this plan have a contractual term of ten years. Effective December 2, 2005, the 2000 Plan was terminated, and, as of June 30, 2012 , options to acquire 74,002 shares were outstanding under the 2000 Plan.
2001 Plan
In May 2001, the Board of Directors adopted the 2001 Plan which provided for the grant of options for common stock to eligible participants. A total of 4,000,000 shares were reserved under the 2001 Plan. Options granted under this plan have a contractual term of ten years. Effective December 2, 2005, the 2001 Plan was terminated, and, as of June 30, 2012 , options to acquire 28,740 shares were outstanding under the 2001 Plan.
The following table summarizes stock option activity under all plans:
| Number of Shares (000's) |
| Weighted- Average Exercise Price Per Share |
| Weighted- Average Remaining Contractual Term (years) |
| Aggregate Intrinsic Value ($ 000's) | |||||
Options outstanding at June 28, 2009 | 17,639 | |
| $ | 4.65 | |
|
|
|
| ||
Granted | 936 | |
| $ | 2.31 | |
|
|
|
| ||
Exercised | (337 | ) |
| $ | 2.20 | |
|
|
|
| ||
Canceled | (8,652 | ) |
| $ | 4.94 | |
|
|
|
| ||
Options outstanding at June 27, 2010 | 9,586 | |
| $ | 4.24 | |
|
|
|
| ||
Granted | 2,748 | |
| $ | 3.28 | |
|
|
|
| ||
Exercised | (606 | ) |
| $ | 2.52 | |
|
|
|
| ||
Canceled | (2,596 | ) |
| $ | 4.40 | |
|
|
|
| ||
Options outstanding at July 3, 2011 | 9,132 | |
| $ | 4.01 | |
|
|
|
| ||
Granted | 2,593 | |
| $ | 3.30 | |
|
|
|
| ||
Exercised | (437 | ) |
| $ | 2.24 | |
|
|
|
| ||
Canceled | (2,282 | ) |
| $ | 4.85 | |
|
|
|
| ||
Options outstanding at June 30, 2012 | 9,006 | |
| $ | 3.68 | |
| 4.87 | |
| 2,280 | |
Exercisable at June 30, 2012 | 5,538 | |
| $ | 3.94 | |
| 4.20 | |
| 1,545 | |
Vested and expected to vest at June 30, 2012 | 8,697 | |
| $ | 3.70 | |
| 4.82 | |
| 2,226 | |
The following table summarizes significant ranges of outstanding and exercisable options at June 30, 2012 :
Options Outstanding |
| Options Exercisable | ||||||||||||||
Range of Exercise Prices | Number Outstanding (000's) |
| Weighted- Average Remaining Contractual Life |
| Weighted- Average Exercise Price |
| Number Exercisable (000's) |
| Weighted- Average Exercise Price | |||||||
|
|
| (In years) |
|
|
|
|
|
| |||||||
$1.69 – $2.82 | 983 | |
| 5.93 | |
| $ | 2.12 | |
| 904 | |
| $ | 2.12 | |
$2.95 – $3.02 | 249 | |
| 5.89 | |
| $ | 2.99 | |
| 152 | |
| $ | 3.00 | |
$3.03 – $3.03 | 1,217 | |
| 5.13 | |
| $ | 3.03 | |
| 567 | |
| $ | 3.03 | |
$3.17 – $3.25 | 383 | |
| 4.54 | |
| $ | 3.21 | |
| 140 | |
| $ | 3.17 | |
$3.29 – $3.29 | 1,881 | |
| 6.08 | |
| $ | 3.29 | |
| 97 | |
| $ | 3.29 | |
$3.43 – $3.68 | 1,210 | |
| 4.93 | |
| $ | 3.61 | |
| 735 | |
| $ | 3.58 | |
$3.74 – $4.18 | 955 | |
| 4.71 | |
| $ | 3.86 | |
| 864 | |
| $ | 3.86 | |
$4.22 – $4.22 | 7 | |
| 3.16 | |
| $ | 4.22 | |
| 7 | |
| $ | 4.22 | |
$4.25 – $4.25 | 935 | |
| 4.15 | |
| $ | 4.25 | |
| 886 | |
| $ | 4.25 | |
$4.26 – $9.80 | 1,186 | |
| 2.31 | |
| $ | 6.05 | |
| 1,186 | |
| $ | 6.05 | |
$1.69 – $9.80 | 9,006 | |
| 4.87 | |
| $ | 3.68 | |
| 5,538 | |
| $ | 3.94 | |
The total intrinsic value of options exercised in fiscal 2012 , fiscal 2011 and fiscal 2010 were $0.5 million , $0.5 million , and $0.2 million , respectively. The fair value of options vested in fiscal 2012 , fiscal 2011 and fiscal 2010 were $2.3 million , $1.0 million , and $1.4 million , respectively.
Stock Awards
Stock awards may be granted under the 2005 Plan on terms approved by the Board of Directors. Stock awards generally provide for the issuance of restricted stock which vests over a fixed period.
The following table summarizes stock award activity:
| Number of Shares (000's) |
| Weighted- Average Grant- Date Fair Value | |||
Non-vested stock outstanding at June 28, 2009 | 796 | |
| $ | 3.37 | |
Granted | 2,965 | |
| $ | 2.77 | |
Vested | (702 | ) |
| $ | 2.91 | |
Cancelled | (179 | ) |
| $ | 2.40 | |
Non-vested stock outstanding at June 27, 2010 | 2,880 | |
| $ | 2.92 | |
Granted | 818 | |
| $ | 3.18 | |
Vested | (1,376 | ) |
| $ | 3.21 | |
Cancelled | (452 | ) |
| $ | 3.03 | |
Non-vested stock outstanding at July 3, 2011 | 1,870 | |
| $ | 2.79 | |
Granted | 739 | |
| $ | 3.11 | |
Vested | (1,233 | ) |
| $ | 3.28 | |
Cancelled | (298 | ) |
| $ | 3.17 | |
Non-vested stock outstanding at June 30, 2012 | 1,078 | |
| $ | 2.35 | |
The shares were placed in an escrow account and will be released to the recipients as the shares vest over periods of up to twenty-four months. If a participant terminates employment prior to the vesting dates, the unvested shares will be canceled and returned to the 2005 Plan. The Company recognizes compensation expense on the awards over the vesting period based on an intrinsic value as of the date of grant. As of June 30, 2012 , there were approximately $2.2 million in unrecognized compensation costs related to non-vested stock awards. This cost is expected to be recognized over a weighted-average period of approximately 1.3 years.
1999 Employee Stock Purchase Plan
In January 1999, the Board of Directors approved the adoption of Extreme Network's 1999 Employee Stock Purchase Plan (the " Purchase Plan "). On December 2, 2005, the stockholders approved an amendment to the Purchase Plan to increase the maximum number of shares of common stock that may be issued under the plan by 5,000,000 to a total of 12,000,000 shares. The Purchase Plan permits eligible employees to acquire shares of the Company's common stock through periodic payroll deductions of up to 15% of total compensation. No more than 625 shares may be purchased on any purchase date per employee. Each offering period has a maximum duration of 3 months. The price at which the common stock may be purchased is 85% of the lesser of the fair market value of the Company's common stock on the first day of the applicable offering period or on the last day of the respective purchase period. On January 26, 2010, the Board of Directors approved an amendment to the Purchase Plan to increase the maximum number of shares that may be purchased on any purchase date per employee from 625 shares to 1,000 shares. Through June 30, 2012 , 9,428,787 shares had been purchased under the Purchase Plan.
Share Based Compensation
Share-based compensation expense recognized in the financial statements by line item caption is as follows (dollars in thousands):
| Year Ended | ||||||||||
| June 30, |
| July 3, |
| June 27, | ||||||
Cost of product revenue | $ | 463 | |
| $ | 435 | |
| $ | 489 | |
Cost of service revenue | 257 | |
| 232 | |
| 523 | | |||
Sales and marketing | 1,765 | |
| 1,948 | |
| 1,853 | | |||
Research and development | 1,363 | |
| 1,113 | |
| 1,695 | | |||
General and administrative | 2,341 | |
| 1,520 | |
| 1,675 | | |||
Total share-based compensation expense | 6,189 | |
| 5,248 | |
| 6,235 | | |||
The amount of stock based compensation expense capitalized in inventory has been immaterial for each of the periods presented. As of June 30, 2012 , there was $4.3 million of total unrecognized compensation cost related to unvested stock options. This cost is expected to be recognized over a weighted-average period of approximately 2.5 years.
The weighted-average grant-date per share fair value of options granted in fiscal 2012 , fiscal 2011 , and fiscal 2010 were $1.67 , $1.57 , and $0.94 , respectively. The weighted-average estimated per share fair value of shares purchased under the Company's 1999 Employee Stock Purchase Plan (" ESPP ") in fiscal 2012 , fiscal 2011 , and fiscal 2010 were $0.98 , $0.98 , and $0.66 , respectively.
The Company uses the straight-line method for expense attribution, and the Company estimates forfeitures and only recognizes expense for those shares expected to vest. The Company's estimated forfeiture rate in fiscal 2012 based on the Company's historical forfeiture experience is approximately 9% for non-executives and 7% for executives.
The fair value of each option award and share purchase option under the Company's ESPP is estimated on the date of grant using the Black-Scholes-Merton option valuation model with the weighted average assumptions noted in the following table. The expected term of options granted is derived from historical data on employee exercise and post-vesting employment termination behavior. The expected term of ESPP represents the contractual life of the ESPP purchase period. The risk-free rate based upon the estimated life of the option and ESPP is based on the U.S. Treasury yield curve in effect at the time of grant. Expected volatility is based on both the implied volatilities from traded options on the Company's stock and historical volatility on the Company's stock.
| Stock Option Plan |
| Employee Stock Purchase Plan | ||||||||||||||
| Year Ended |
| Year Ended | ||||||||||||||
| June 30, |
| July 3, |
| June 27, |
| June 30, |
| July 3, |
| June 27, | ||||||
Expected life | 5.06 yrs | |
| 4.43 yrs | |
| 3.03 yrs | |
| .25 yrs | |
| .24 yrs | |
| .25 yrs | |
Risk-free interest rate | 1.05 | % |
| 1.47 | % |
| 1.36 | % |
| 0.07 | % |
| 0.17 | % |
| 0.20 | % |
Volatility | 60 | % |
| 62 | % |
| 59 | % |
| 61 | % |
| 55 | % |
| 73 | % |
Dividend yield | 0.0 | % |
| 0.0 | % |
| 0.0 | % |
| 0.0 | % |
| 0.0 | % |
| 0.0 | % |
Employee Stock Option Exchange Program
On December 23, 2009, the Company's stockholders approved a voluntary program ("Exchange Program") that permitted eligible employees to exchange certain outstanding stock options that were "underwater" for a lesser number of shares of restricted stock units to be granted under the Extreme Networks, Inc. 2005 Equity Incentive Plan (the "2005 Plan") and to exchange certain other stock options that are more substantially underwater for a cash payment. The Exchange Program was open to all of the Company's United States employees, except for members of its Board of Directors and its executive officers. The Exchange Program commenced on February 4, 2010 and ended March 4, 2010. On March 5, 2010, the Company canceled a total of 3,058,761 tendered stock options, issued a total of 569,189 replacement restricted stock units under the 2005 Plan, and incurred a cash outlay of $8,769 which was paid out at the end of March 2010.
401(k) Plan
The Company provides a tax-qualified employee savings and retirement plan, commonly known as a 401(k) plan (the " Plan "), which covers the Company's eligible employees. Pursuant to the Plan, employees may elect to reduce their current compensation up to the IRS annual contribution limit of $17,000 for calendar year 2012 . Effective January 1, 2005, employees age 50 or over may elect to contribute an additional $5,500 . The amount contributed to the Plan is on a pre-tax basis.
The Company provides for discretionary matching contributions as determined by the Board of Directors for each calendar year. All matching contributions vest immediately. In addition, the Plan provides for discretionary contributions as determined by the Board of Directors each year. The program was to match $0.50 for every dollar contributed by the employee up to the first 2.5% of pay. The Company's matching contributions to the Plan totaled $475,025 , $569,825 , and $0 , for fiscal 2012 , fiscal 2011 and fiscal 2010 , respectively. No discretionary contributions were made in fiscal 2012 , fiscal 2011 and fiscal 2010 .
6. Income Taxes
Income (loss) before income taxes is as follows (in thousands):
| Year Ended | ||||||||||
| June 30, |
| July 3, |
| June 27, | ||||||
Domestic | $ | 20,839 | |
| $ | 4,416 | |
| $ | (10,024 | ) |
Foreign | (3,771 | ) |
| (704 | ) |
| 9,841 | | |||
Total | $ | 17,068 | |
| $ | 3,712 | |
| $ | (183 | ) |
The provision for (benefit from) income taxes for fiscal 2012 , 2011 and fiscal 2010 consisted of the following (in thousands):
| Year Ended | ||||||||||
| June 30, |
| July 3, |
| June 27, | ||||||
Current: |
|
|
|
|
| ||||||
Federal | $ | 114 | |
| $ | 142 | |
| $ | (1,062 | ) |
State | 79 | |
| 92 | |
| 106 | | |||
Foreign | 916 | |
| 1,613 | |
| 596 | | |||
Total current | 1,109 | |
| 1,847 | |
| (360 | ) | |||
Deferred: |
|
|
|
|
| ||||||
Federal | 30 | |
| (639 | ) |
| - | | |||
State | - | |
| - | |
| - | | |||
Foreign | 57 | |
| (209 | ) |
| (50 | ) | |||
Total deferred | 87 | |
| (848 | ) |
| (50 | ) | |||
Provision (benefit) for income taxes | $ | 1,196 | |
| $ | 999 | |
| $ | (410 | ) |
The difference between the provision for income taxes and the amount computed by applying the federal statutory income tax rate ( 35 percent ) to income (loss) before taxes is explained below (in thousands):
| Year Ended | ||||||||||
| June 30, |
| July 3, |
| June 27, | ||||||
Tax at federal statutory rate (benefit) | $ | 5,974 | |
| $ | 1,299 | |
| $ | (64 | ) |
State income tax, net of federal benefit | 51 | |
| 57 | |
| 66 | | |||
Valuation allowance | (8,035 | ) |
| (2,492 | ) |
| 607 | | |||
Foreign earnings taxed at other than U.S. rates | 3,607 | |
| 1,576 | |
| (3,348 | ) | |||
Deferred compensation | 170 | |
| 398 | |
| 2,196 | | |||
Other | (571 | ) |
| 161 | |
| 133 | | |||
Provision for income taxes | $ | 1,196 | |
| $ | 999 | |
| $ | (410 | ) |
Significant components of the Company's deferred tax assets are as follows (in thousands):
| June 30, |
| July 3, | ||||
Deferred tax assets: |
|
|
| ||||
Net operating loss carry-forwards | $ | 73,413 | |
| $ | 76,158 | |
Tax credit carry-forwards | 23,051 | |
| 23,335 | | ||
Depreciation | 14,074 | |
| 16,602 | | ||
Deferred revenue (net) | 8,722 | |
| 9,160 | | ||
Warrant amortization | 5,489 | |
| 6,854 | | ||
Inventory write-downs | 2,803 | |
| 3,685 | | ||
Other allowances and accruals | 2,901 | |
| 3,579 | | ||
Other | 10,895 | |
| 11,912 | | ||
Total deferred tax assets | 141,348 | |
| 151,285 | | ||
Valuation allowance | (140,641 | ) |
| (150,503 | ) | ||
Total net deferred tax assets | 707 | |
| 782 | | ||
Deferred tax liabilities: |
|
|
| ||||
Deferred tax liability on foreign withholdings | (120 | ) |
| (93 | ) | ||
Total deferred tax liabilities | (120 | ) |
| (93 | ) | ||
Net deferred tax assets | $ | 587 | |
| $ | 689 | |
Recorded as: |
|
|
| ||||
Net current deferred tax assets | $ | 644 | |
| $ | 681 | |
Net non-current deferred tax assets | 178 | |
| 101 | | ||
Net current deferred tax liabilities | (235 | ) |
| - | | ||
Net non-current deferred tax liabilities | - | |
| (93 | ) | ||
Net deferred tax assets (liabilities) | $ | 587 | |
| $ | 689 | |
The Company's valuation allowance decreased by $9.9 million in fiscal 2012, decreased by $4.6 million in fiscal 2011, and increased by $11.5 million in fiscal 2010. The Company has provided a full valuation allowance against all of its U.S. federal and state deferred tax assets, and no valuation allowance against any of its non-U.S. deferred tax assets. The valuation allowance is determined by assessing both negative and positive evidence to determine whether it is more likely than not that the deferred tax assets are recoverable; such assessment is required on a jurisdiction by jurisdiction basis. The Company's U.S. losses in recent periods we believe represent sufficient negative evidence to require a full valuation allowance against its U.S. federal and state net deferred tax assets. This valuation allowance will be evaluated periodically and can be reversed partially or totally if business results and the economic environment have sufficiently improved to support realization of the Company's deferred tax assets.
As of June 30, 2012 , the Company had net operating loss carry-forwards for federal and state tax purposes of $254.8 million and $90.0 million , respectively, of which $53.7 million and $32.3 million , respectively, represent deductions from share-based compensation for which a benefit would be recorded in additional paid-in capital when realized. The Company also had federal and state tax credit carry-forwards of $10.9 million and $18.7 million , respectively, as of June 30, 2012 . Federal net operating loss carry-forwards of $254.8 million will expire between 2020 through 2030 and state net operating losses of $90.0 million will expire between 2013 through 2031, if not utilized. Federal tax credits of $10.9 million will expire beginning in 2020, if not utilized and state tax credits of $0.8 million will expire beginning in 2013, if not utilized. The additional state tax credits of $18.0 million will carry forward indefinitely.
As of June 30, 2012 , the Company conducted an Internal Revenue Code Section 382 (" Sec. 382 ") analysis with respect to its net operating loss and credit carry-forwards and determined that there was no limitation. It is possible that subsequent ownership changes may limit the utilization of these tax attributes.
As of June 30, 2012 , the Company intends to indefinitely reinvest the earnings of certain foreign corporations. If such earnings were distributed, the Company would accrue an additional income tax expense of approximately $1.0 million .
As of June 30, 2012 , the Company had $25.7 million of unrecognized tax benefits. If fully recognized in the future, $0.5 million would impact the effective tax rate, and $25.2 million would result in adjustments to deferred tax assets and corresponding adjustments to the valuation allowance. It is reasonably possible that the amount of unrealized tax benefit could decrease by approximately $0.2 million during the next twelve months due to the expiration of the statute of limitations in certain foreign jurisdictions.
A reconciliation of the beginning and ending amount of total unrecognized tax benefits is as follows (in thousands):
Balance at June 28, 2009 | $ | 22,578 | |
Decrease related to prior year tax positions | (98 | ) | |
Increases related to prior year tax positions | 1,094 | | |
Increases related to current year tax positions | 1,414 | | |
Lapse of statute of limitations | (1,078 | ) | |
Balance at June 27, 2010 | $ | 23,910 | |
Increase related to prior year tax positions | 464 | | |
Increase related to current year tax positions | 1,636 | | |
Balance at July 3, 2011 | $ | 26,010 | |
Decrease related to prior year tax positions | (444 | ) | |
Increase related to current year tax positions | 729 | | |
Lapse of statute of limitations | (549 | ) | |
Balance at June 30, 2012 | $ | 25,746 | |
Estimated interest and penalties related to the underpayment of income taxes are classified as a component of tax expense in the Consolidated Statement of Operations and totaled approximately $28,000 , $30,000 , and $72,000 for the years ended June 30, 2012 , July 3, 2011 , and June 27, 2010 , respectively. Accrued interest and penalties were approximately $77,000 and $222,000 as of June 30, 2012 and July 3, 2011 , respectively.
In general, the Company's U.S. federal income tax returns are subject to examination by tax authorities for fiscal years 1999 forward due to net operating losses and the Company's state income tax returns are subject to examination for fiscal years 2001 forward due to net operating losses.
7. Disclosure about Segments of an Enterprise and Geographic Areas
Operating segments are defined as components of an enterprise about which separate financial information is available that is evaluated regularly by the chief operating decision makers with respect to the allocation of resources and performance.
The Company operates in one segment, the development and marketing of network infrastructure equipment. The Company conducts business globally and is managed geographically. Revenue is attributed to a geographical area based on the location of the customers. The Company operates in three geographical areas: Americas, which includes the United States, Canada, Mexico, Central America and South America; EMEA, which includes Europe, Middle East and Africa; and APAC which includes Asia Pacific, South Asia and Japan. Prior to fiscal 2012, South America was included as part of EMEA.
The Company attributes revenues to geographic regions based on the customer's ship-to location. Information regarding geographic areas is as follows (in thousands):
| Year Ended | ||||||||||
Net Revenues: | June 30, |
| July 3, |
| June 27, | ||||||
Americas: |
|
|
|
|
| ||||||
United States | $ | 106,110 | |
| $ | 103,087 | |
| $ | 105,532 | |
Other | 34,970 | |
| 30,487 | |
| 26,632 | | |||
Total Americas | 141,080 | |
| 133,574 | |
| 132,164 | | |||
EMEA | 128,093 | |
| 134,730 | |
| 125,357 | | |||
APAC | 53,549 | |
| 66,124 | |
| 51,833 | | |||
Total net revenues | $ | 322,722 | |
| $ | 334,428 | |
| $ | 309,354 | |
Substantially all of the Company's assets were attributable to North America operations at June 30, 2012 and July 3, 2011 .
8. Net Income (Loss) Per Share
Basic earnings per share is calculated by dividing net income by the weighted average number of common shares outstanding during the period, less shares subject to repurchase, and excludes any dilutive effects of options, warrants and unvested restricted stock. Dilutive earnings per share is calculated by dividing net income by the weighted average number of common shares used in the basic earnings per share calculation plus the dilutive effect of shares subject to repurchase, options, warrants and unvested restricted stock. The following table presents the calculation of basic and diluted net income per share (in thousands, except per share data):
| Year Ended | ||||||||||
| June 30, |
| July 3, |
| June 27, | ||||||
Net income | $ | 15,872 | |
| $ | 2,713 | |
| $ | 227 | |
Weighted-average shares used in per share calculation – basic | 93,451 | |
| 91,423 | |
| 89,281 | | |||
Incremental shares using the treasury stock method: |
|
|
|
|
| ||||||
Stock options | 372 | |
| 427 | |
| 171 | | |||
Unvested restricted awards | 554 | |
| 818 | |
| 25 | | |||
Employee Stock Purchase Plan | 113 | |
| 127 | |
| - | | |||
Weighted -average share used in per share calculation – diluted | 94,490 | |
| 92,795 | |
| 89,477 | | |||
Net income per share – basic | 0.17 | |
| 0.03 | |
| $ | - | | ||
Net income per share – diluted | 0.17 | |
| 0.03 | |
| $ | - | | ||
Potentially dilutive common shares from employee incentive plans are determined by applying the treasury stock method to the assumed exercise of outstanding stock options, the assumed vesting of outstanding restricted stock units, and the assumed issuance of common stock under the stock purchase plan. Weighted stock options outstanding with an exercise price higher than the Company's average stock price for the periods presented are excluded from the calculation of diluted net income per share since the effect of including them would have been anti-dilutive due to the net income position of the Company during the periods presented. For fiscal 2012, 2011, and 2010, the Company excluded 8.3 million , 8.0 million , and 12.2 million outstanding weighted average stock options, respectively, from the calculation of diluted earnings per common share because they would have been anti-dilutive.
9. Foreign Exchange Forward Contracts
The Company uses derivative financial instruments to manage exposures to foreign currency. The Company's objective for holding derivatives is to use the most effective methods to minimize the impact of these exposures. The Company does not enter into derivatives for speculative or trading purposes. The Company records all derivatives on the balance sheet as Other Assets, Net at fair value. Changes in the fair value of derivatives are recognized in earnings as Other Income (Expense). The Company enters into foreign exchange forward contracts to mitigate the effect of gains and losses generated by the foreign currency forecasted transactions related to certain operating expenses and re-measurement of certain assets and liabilities denominated in Japanese Yen, the Euro, the Swedish Krona, the Indian Rupee and the British Pound. These derivatives do not qualify as hedges. At June 30, 2012 , these forward foreign currency contracts had a notional principal amount of $16.9 million and unrealized gains on foreign exchange contracts of $0.2 million . These contracts have maturities of less than 60 days. Changes in the fair value of these foreign exchange forward contracts are offset largely by re-measurement of the underlying assets and liabilities.
Foreign currency transaction gains and losses from operations were a gain of $2.5 million in fiscal 2012 , a loss of $0.6 million in fiscal 2011 and a loss of $0.4 million in fiscal 2010 . Included is the 2012 gain is the $1.9 million adjustment resulting from Japan subsidiary liquidation.
10. Restructuring Charges
As of June 30, 2012 , restructuring liabilities were $0.5 million and consisted of obligations under excess facility operating leases, net of projected future sublease receipts and termination benefits. During fiscal 2012 , 2011 and 2010 , the Company recorded a restructuring charge of $1.6 million , restructuring charge of $3.8 million , and restructuring charge of $4.2 million , respectively. A portion of this restructuring activity is related to the liquidation of the Company's Japan subsidiary with a cost of $0.5 million at June 30, 2012. The Company substantially liquidated the subsidiary in Japan in the fourth quarter or fiscal 2012, as part of the Company's broad restructuring effort. The Company will dispose the remaining immaterial assets and liabilities and complete the liquidation process by the end of fiscal 2013.
Fiscal 2012 Restructuring
During fiscal 2012, the Company incurred total charges of $2.2 million , including $1.8 million of related severance, $0.1 million of contract termination fees, and $0.2 million other charges. The Company also made payments of $4.3 million . The associated restructuring costs were primarily termination benefits and contract termination costs. Termination benefits primarily consist of outplacement services, health insurance coverage, and legal costs. Contract termination costs primarily consist of costs to terminate operating leases and other contracts, including rent expense (less expected sublease income) on facilities under operating leases.
Fiscal 2011 Restructuring
During fiscal 2011, the Company commenced a strategy to focus on growing revenue in specific market verticals and on improving operational effectiveness. As part of the strategy, the Company reduced headcount by 139 and incurred total restructuring charges of $4.2 million , of which $1.0 million and $3.2 million were recognized in the third and fourth quarter of fiscal 2011, respectively. During the fourth quarter of fiscal 2011, the lease term for the excess leased facilities ended. The Company recognized a restructuring reversal of $0.4 million related to the true up of operating and rent expenses.
Fiscal 2010 Restructuring
During the second quarter of fiscal 2010 the Company restructured the organization, from a business unit organization to a functional organization. In connection with the restructuring, the Company had a reduction in force (" RIF ") and terminated 8% of the workforce incurring termination benefits of $4.1 million and eliminated certain redundant engineering projects of $0.5 million . Total restructuring charges related to the RIF and engineering projects recognized in fiscal 2010 was $4.6 million .
Additionally there were $0.2 million increase in facilities operating expenses related to one of the Company's restructured facilities along with a $0.5 million reversal of restructuring expense due to higher projected sublease receipt from a sublease renewal arrangement and $0.1 million reversal of restructuring expense related to the settlement of employment termination benefits incurred in the third fiscal quarter of 2009.
Restructuring liabilities consist of (in thousands):
| Excess Facilities |
| Asset Impairment |
| Contract Termination |
| Termination Benefits |
| Acceleration of Stock Awards |
| Other |
| Total | |||||||
Balance at June 28, 2009 | 6,337 | |
| - | |
| - | |
| 741 | |
| - | |
| - | |
| 7,078 | |
Period charges | 260 | |
| 449 | |
| 86 | |
| 3,763 | |
| 353 | |
| - | |
| 4,911 | |
Period reversals | (529 | ) |
| - | |
| - | |
| (139 | ) |
| - | |
| - | |
| (668 | ) |
Period impairments | - | |
| (65 | ) |
| - | |
| - | |
| (353 | ) |
| - | |
| (418 | ) |
Period payments | (2,928 | ) |
| (384 | ) |
| (77 | ) |
| (4,144 | ) |
| - | |
| - | |
| (7,533 | ) |
Balance at June 27, 2010 | 3,140 | |
| - | |
| 9 | |
| 221 | |
| - | |
| - | |
| 3,370 | |
Period charges | - | |
| - | |
| - | |
| 4,146 | |
| - | |
| 80 | |
| 4,226 | |
Period reversals | (381 | ) |
| - | |
| - | |
| (38 | ) |
| - | |
| - | |
| (419 | ) |
Period impairments | - | |
| - | |
| - | |
| - | |
| - | |
| - | |
| - | |
Period payments | (2,759 | ) |
| - | |
| (9 | ) |
| (1,226 | ) |
| - | |
| - | |
| (3,994 | ) |
Balance at July 3, 2011 | - | |
| - | |
| - | |
| 3,103 | |
| - | |
| 80 | |
| 3,183 | |
Period charges | - | |
| - | |
| 124 | |
| 1,832 | |
| - | |
| 206 | |
| 2,162 | |
Period reversals | - | |
| - | |
| (18 | ) |
| (499 | ) |
| - | |
| (51 | ) |
| (568 | ) |
Period impairments | - | |
| - | |
| - | |
| - | |
| - | |
| - | |
| - | |
Period payments | - | |
| - | |
| (13 | ) |
| (4,077 | ) |
| - | |
| (224 | ) |
| (4,314 | ) |
Restructuring liabilities at June 30, 2012 | - | |
| - | |
| 93 | |
| 359 | |
| - | |
| 11 | |
| 463 | |
11. Technology Agreements
On March 31, 2005, the Company entered into a Patent and Cross License Agreement (" Technology Agreement ") with IBM. The agreement provides for a release of prior claims and a cross license of patents extending into the future from the effective date of the agreement. On December 22, 2008, the Company amended the Technology Agreement to extend the term of the agreement over the remaining life of the patents. The Company capitalized the cost of the amendment in other assets and continued to amortize the remaining cost of the Technology Agreement and its amendment over the remaining life of the patents.
On July 16, 2010, the Company entered into a Memorandum of Understanding (" Network-1 MOU ") with Network-1 Security Solutions, Inc. The Network-1 MOU provides for a nonexclusive and worldwide license to certain patents of each party, and a release of claims based on any prior infringement of such patents. The license term is nine years and eight months and expires in March 2020. The release covers any potential claims arising out of the past use or practice of any of the patents. Total fees for the grant of the license under the Network-1 MOU were $2.4 million . The Company charged the estimated value of the release of prior claims of $0.2 million to Cost of Product Revenues for claims incurred in fiscal 2010 and $0.8 million to Litigation Settlement for claims incurred prior to fiscal 2010 in its fiscal 2010 consolidated financial statements. The remaining $1.4 million was recorded as other assets and is being recognized ratably over the license period in cost of product revenue.
12. Quarterly Financial Data (Unaudited)
Quarterly results for the years ended June 30, 2012 and July 3, 2011 follow:
| June 30, 2012(1) |
| April 1, 2012(2) |
| January 1, 2012(3) |
| Oct 2, 2011(4) | ||||||||
| (In thousands, except per share amounts) | ||||||||||||||
Net revenues | $ | 87,649 | |
| $ | 73,368 | |
| $ | 82,812 | |
| $ | 78,894 | |
Gross profit | $ | 48,833 | |
| $ | 41,211 | |
| $ | 46,268 | |
| $ | 43,536 | |
Net income | $ | 7,812 | |
| $ | 2,372 | |
| $ | 4,107 | |
| $ | 1,583 | |
Net income per share – basic | $ | 0.08 | |
| $ | 0.03 | |
| $ | 0.04 | |
| $ | 0.02 | |
Net income per share – diluted | $ | 0.08 | |
| $ | 0.03 | |
| $ | 0.04 | |
| $ | 0.02 | |
| July 3, 2011(5) |
| March 27, 2011(6) |
| Dec 26, 2010(7) |
| Sept 26, 2010 | ||||||||
| (In thousands, except per share amounts) | ||||||||||||||
Net revenues | $ | 89,761 | |
| $ | 75,699 | |
| $ | 85,131 | |
| $ | 83,837 | |
Gross profit | $ | 48,581 | |
| $ | 36,563 | |
| $ | 47,981 | |
| $ | 46,837 | |
Net (loss) income | $ | (2,087 | ) |
| $ | (6,841 | ) |
| $ | 8,929 | |
| $ | 2,712 | |
Net (loss) income per share – basic | $ | (0.02 | ) |
| $ | (0.07 | ) |
| $ | 0.10 | |
| $ | 0.03 | |
Net (loss) income per share – diluted | $ | (0.02 | ) |
| $ | (0.07 | ) |
| $ | 0.10 | |
| $ | 0.03 | |
____________________
(1) | Net income and net income per share include the effect of restructuring charge of $0.2 million , litigation settlement of $0.1 million and CTA gain of $1.9 million from Japan subsidiary liquidation |
(2) | Net income and net income per share include the effect of restructuring reversal of $35,000 . |
(3) | Net income and net income per share include the effect of restructuring charge of $0.4 million . |
(4) | Net income and net income per share include the effect of restructuring charge of $1.0 million . |
(5) | Net loss and net loss per share include the effect of restructuring charge of $2.8 million . |
(6) | Net loss and net loss per share include the effect of restructuring charge of $1.0 million and litigation settlement of $49,000 . |
(7) | Net income and net income per share include the effect of litigation settlement of $4.2 million . |
Quarterly and year-to-date computations of per share amounts are made independently. Therefore, the sum of per share amounts for the quarters may not agree with per share amounts for the year.
13. Subsequent Events
On September 23, 2010, the Company entered into an Option Agreement with Trumark Companies LLC ("Trumark"), under which the Company granted Trumark an option (the "Option") to purchase half of its corporate headquarters campus in Santa Clara, California (First Property), at a price of $24.0 million . Under the agreements, Trumark will have until December 18, 2012 to exercise the options to purchase the First Property and may extend the option if they make certain payments to the Company. In January 2012, the Company classified the First Property as "assets held for sale" on the consolidated balance sheet at a net book value of $17.1 million , which was the lesser of the fair value (less cost to sell) or carrying amount of the assets, and ceased recognizing depreciation expense on the assets.
54
Table of Contents
EXTREME NETWORKS, INC.
NOTES TO CONSOLIDATED FINANCIAL STATEMENTS-(Continued)
On January 25, 2012, Company entered into a new Option Agreement with Trumark, under which it granted Trumark an option to purchase the remaining portion of the Company's corporate campus (Second Property), at a price of $24.5 million . Under the agreement, Trumark will have until December 28, 2012 to exercise the options to purchase the Second Property and may extend the option if they make certain payments to the Company. As of June 30, 2012, the Second Property, with a net book value of $16.0 million , remains classified as "assets held for use" due to certain unresolved contingencies that may delay the completion date of this transaction.
As of the date of this filing, the Company had received option payments totaling $3.0 million from Trumark, which were classified as a deferred gain and included in other current liabilities on the consolidated balance sheet.
On August 20, 2012, Company entered into amendments to both of the Option Agreements for First Property and Second Property. These amendments are contingent on Trumark assigning on or before September 11, 2012, Trumark's interest in the Option Agreements to Catalina Investment Company, L.P. (an entity controlled by The Irvine Company) or an entity which controls, is controlled by, or under common control with The Irvine Company ("Irvine"). If the assignment to Irvine does not occur on or before September 11, 2012, then the amendments are of no force or effect. If the assignment does occur on or before September 11, 2012, then the closing under the Option Agreements shall be accelerated to the date on which the assignment to Irvine occurs and the combined purchase price for the First Property and the Second Property shall be reduced to $46.0 million .
Item 9. Changes in and Disagreements with Accountants on Accounting and Financial Disclosure
Not applicable.
Item 9A. Controls and Procedures
Evaluation of Disclosure Controls and Procedures
Disclosure controls and procedures are controls and procedures designed to reasonably assure that information required to be disclosed in the Company's reports filed under the Securities Exchange Act of 1934 as amended, (the " Exchange Act "), such as this Report, is recorded, processed, summarized and reported within the time periods specified in the SEC's rules and forms and to reasonably assure that such information is accumulated and communicated to the Company's management, including the Chief Executive Officer and the Chief Financial Officer, as appropriate to allow timely decisions regarding required disclosure.
Under the supervision and with the participation of our management, including our Chief Executive Officer and Chief Financial Officer, we evaluated the effectiveness of the design and operation of our disclosure controls and procedures as of the end of the period covered by this Report. Based on this evaluation, our Chief Executive Officer and Chief Financial Officer concluded that our disclosure controls and procedures were effective as of June 30, 2012 .
Management's Report on Internal Control over Financial Reporting
Our management is responsible for establishing and maintaining adequate internal control over our financial reporting. There are inherent limitations in the effectiveness of any system of internal control, including the possibility of human error and the circumvention or overriding of controls. Accordingly, even effective internal controls can provide only reasonable assurances with respect to financial statement preparation. Further because of changes in conditions, the effectiveness of internal control may vary over time.
We assessed the effectiveness of our internal control over financial reporting as of June 30, 2012 . In making this assessment, we used the criteria set forth by the Committee of Sponsoring Organizations of the Treadway Commission (COSO) in Internal Control-Integrated Framework.
Based on our assessment using those criteria, we concluded that, as of June 30, 2012 our internal control over financial reporting is effective.
Our independent registered public accounting firm, KPMG LLP, has audited the financial statements included in this Annual Report on Form 10-K and has issued its report on our internal control over financial reporting as of June 30, 2012 .
Changes in Internal Control over Financial Reporting
There were no changes in our internal control over financial reporting during the quarter ended June 30, 2012 that have materially affected, or are reasonably likely to materially affect, our internal control over financial reporting.
Inherent Limitations on Effectiveness of Controls
Our management, including the CEO and CFO, does not expect that our disclosure controls or our internal control over
55
Table of Contents
financial reporting will prevent or detect all error and all fraud. A control system, no matter how well designed and operated, can provide only reasonable, not absolute, assurance that the control system's objectives will be met. Our controls and procedures are designed to provide reasonable assurance that our control system's objective will be met and our CEO and CFO have concluded that our disclosure controls and procedures are effective at the reasonable assurance level. The design of a control system must reflect the fact that there are resource constraints, and the benefits of controls must be considered relative to their costs. Further, because of the inherent limitations in all control systems, no evaluation of controls can provide absolute assurance that misstatements due to error or fraud will not occur or that all control issues and instances of fraud, if any, within Extreme Networks have been detected. These inherent limitations include the realities that judgments in decision-making can be faulty and that breakdowns can occur because of simple error or mistake. Controls can also be circumvented by the individual acts of some persons, by collusion of two or more people, or by management override of the controls. The design of any system of controls is based in part on certain assumptions about the likelihood of future events. Projections of any evaluation of the effectiveness of controls in future periods are subject to risks. Over time, controls may become inadequate because of changes in conditions or deterioration in the degree of compliance with policies or procedures. Notwithstanding these limitations, our disclosure controls and procedures are designed to provide reasonable assurance of achieving their objectives. Our CEO and CFO have concluded that our disclosure controls and procedures are, in fact, effective at the "reasonable assurance" level.
Item 9B. Other Information
None.
56
Table of Contents
Report of Independent Registered Public Accounting Firm
The Board of Directors and Stockholders
Extreme Networks, Inc.
We have audited Extreme Networks, Inc. and subsidiaries' (the Company) internal control over financial reporting as of June 30, 2012, based on criteria established in Internal Control - Integrated Framework issued by the Committee of Sponsoring Organizations of the Treadway Commission (COSO). The Company's management is responsible for maintaining effective internal control over financial reporting, and for its assessment of the effectiveness of internal control over financial reporting, included in the accompanying Management's Report on Internal Control over Financial Reporting at Item 9A. Our responsibility is to express an opinion on the Company's internal control over financial reporting based on our audit.
We conducted our audit in accordance with the standards of the Public Company Accounting Oversight Board (United States). Those standards require that we plan and perform the audit to obtain reasonable assurance about whether effective internal control over financial reporting was maintained in all material respects. Our audit included obtaining an understanding of internal control over financial reporting, assessing the risk that a material weakness exists, and testing and evaluating the design and operating effectiveness of internal control based on the assessed risk. Our audit also included performing such other procedures as we considered necessary in the circumstances. We believe that our audit provides a reasonable basis for our opinion.
A company's internal control over financial reporting is a process designed to provide reasonable assurance regarding the reliability of financial reporting and the preparation of financial statements for external purposes in accordance with generally accepted accounting principles. A company's internal control over financial reporting includes those policies and procedures that (1) pertain to the maintenance of records that, in reasonable detail, accurately and fairly reflect the transactions and dispositions of the assets of the company; (2) provide reasonable assurance that transactions are recorded as necessary to permit preparation of financial statements in accordance with generally accepted accounting principles, and that receipts and expenditures of the company are being made only in accordance with authorizations of management and directors of the company; and (3) provide reasonable assurance regarding prevention or timely detection of unauthorized acquisition, use, or disposition of the company's assets that could have a material effect on the financial statements.
Because of its inherent limitations, internal control over financial reporting may not prevent or detect misstatements. Also, projections of any evaluation of effectiveness to future periods are subject to the risk that controls may become inadequate because of changes in conditions, or that the degree of compliance with the policies or procedures may deteriorate.
In our opinion, the Company maintained, in all material respects, effective internal control over financial reporting as of June 30, 2012, based on criteria established in Internal Control - Integrated Framework issued by the Committee of Sponsoring Organizations of the Treadway Commission.
We also have audited, in accordance with the standards of the Public Company Accounting Oversight Board (United States), the consolidated balance sheets of Extreme Networks, Inc. and subsidiaries as of June 30, 2012 and July 3, 2011, and the related consolidated statements of income, stockholders' equity and comprehensive income, and cash flows for the years then ended, and the related financial statement schedule. Our report dated August 22, 2012 expressed an unqualified opinion on those consolidated financial statements.
/s/ KPMG LLP
Santa Clara, California
August 22, 2012
57
Table of Contents
PART III
Certain information required by Part III is incorporated by reference from our definitive Proxy Statement to be filed with the Securities and Exchange Commission in connection with the solicitation of proxies for our 2010 Annual Meeting of Stockholders (the " Proxy Statement ") not later than 120 days after the end of the fiscal year covered by this report, and certain information therein is incorporated in this report by reference.
Item 10. Directors, Executive Officers and Corporate Governance
The information required by this section is incorporated by reference from the information in the section entitled "Proposal 1 – Election of Directors" in the Proxy Statement. The required information concerning our executive officers is contained in the section entitled "Executive Officers of the Registrant" in Part I, Item 1 of this Form 10-K.
Item 405 of Regulation S-K calls for disclosure of any known late filing or failure by an insider to file a report required by Section 16 of the Exchange Act. This disclosure is contained in the section entitled "Section 16(a) Beneficial Ownership Reporting Compliance" in the Proxy Statement and is incorporated herein by reference.
Information with respect to Item 406 of Regulation S-K is incorporated by reference to the information contained in the section captioned "Code of Ethics and Corporate Governance Materials" in the Proxy Statement.
Item 11. Executive Compensation
The information required by this section is incorporated by reference from the information in the sections entitled "Directors' Compensation", "Executive Compensation and Other Matters" and "Report of the Compensation Committee" in the Proxy Statement.
Item 12. Security Ownership of Certain Beneficial Owners and Management and Related Stockholder Matters
The information required by this section is incorporated by reference from the information in the section entitled "Security Ownership of Certain Beneficial Owners and Management" in the Proxy Statement.
The information required by this section regarding securities authorized for issuance under equity compensation plans is incorporated by reference from the information in the section entitled "Equity Compensation Plan Information" in the Proxy Statement.
Item 13. Certain Relationships and Related Transactions, and Director Independence
The information required by this section is incorporated by reference from the information in the section titled "Certain Relationships and Related Transactions" in the Proxy Statement.
Item 14. Principal Accounting Fees and Services
The information required by this section is incorporated by reference from the information in the section titled "Principal Accountant Fees and Services" in the Proxy Statement.
58
Table of Contents
PART IV
Item 15. Exhibits and Financial Statement Schedules
(a) | The following documents are filed as a part of this Form 10-K: |
(1) | Financial Statements: |
Reference is made to the Index to Consolidated Financial Statements of Extreme Networks, Inc. under Item 8 in Part II of this Form 10-K.
(2) | Financial Statement Schedules: |
The following financial statement schedule of Extreme Networks, Inc. for the fiscal years ended June 30, 2012 , July 3, 2011 and June 27, 2010 is filed as part of this Report and should be read in conjunction with the Consolidated Financial Statements of Extreme Networks, Inc.
| Page |
Schedule II – Valuation and Qualifying Accounts | 60 |
All other schedules are omitted because they are not applicable or the required information is shown in the financial statements or notes thereto.
(3) | Exhibits: |
The exhibits listed below are required by Item 601 of Regulation S-K. Each management contract or compensatory plan or arrangement required to be filed as an exhibit to this Form 10-K has been identified.
Exhibit Number |
|
|
| Incorporated by Reference |
| Filed Herewith | ||||
Description of Document |
| Form |
| Filing Date |
| Number |
| |||
3.1 |
| Amended and Restated Certificate of Incorporation of Extreme Networks, Inc. |
| 8-K |
| 12/17/2010 |
| 3.2 |
|
|
3.2 |
| Amended and Restated Bylaws of Extreme Networks, Inc. |
| 8-K |
| 3/31/2011 |
| 3.1 |
|
|
3.3 |
| Certificate of Designation, Preferences and Rights of the Terms of the Series A Preferred Stock |
| 10-K |
| 9/26/2001 |
| 3.7 |
|
|
4.1 |
| Rights Agreement dated April 26, 2012 between Extreme Networks, Inc. and Computershare Shareowner Services LLC. |
| 8-K |
| 4/30/2012 |
| 4.1 |
|
|
10.1 |
| Form of Indemnification Agreement for directors and officers. |
| 8-K |
| 10/24/2011 |
| 99.1 |
|
|
10.2* |
| Amended 1996 Stock Option Plan and forms of agreements thereunder. |
| S-1 |
| 2/5/1999 |
| 10.2 |
|
|
10.3* |
| 1999 Employee Stock Purchase Plan. |
| S-1 |
| 2/5/1999 |
| 10.3 |
|
|
10.4* |
| 2000 Nonstatutory Stock Option Plan. |
| 10-K |
| 9/24/2000 |
| 10.7 |
|
|
10.5* |
| 2001 Nonstatutory Stock Option Plan. |
| Schedule TO |
| 10/31/2001 |
| (d)(9) |
|
|
10.6* |
| Offer of Employment Letter dated August 18, 2006 from Extreme Networks, Inc. to Mark A. Canepa. |
| 8-K |
| 9/5/2006 |
| 99.1 |
|
|
10.7* |
| Extreme Networks, Inc. Amended and Restated Executive Change in Control Severance Plan. |
| 10-K |
| 8/30/2011 |
| 10.7 |
|
|
10.8* |
| Extreme Networks, Inc. 2005 Equity Incentive Plan. |
| 8-K |
| 12/8/2005 |
| 99.1 |
|
|
10.9* |
| Form of Restricted Stock Units Agreement Under the 2005 Equity Incentive Plan. |
| 10-Q |
| 11/7/2008 |
| 10.22 |
|
|
10.10* |
| Extreme Networks, Inc. Fiscal 2010 Executive Incentive Bonus Plan. |
| 8-K |
| 7/31/2009 |
| 10.24 |
|
|
10.11* |
| Extreme Networks, Inc. Fiscal 2011 Executive Incentive Bonus Plan. |
| 8-K |
| 7/30/2010 |
| 10.1 |
|
|
59
Table of Contents
Exhibit Number |
|
|
| Incorporated by Reference |
| Filed Herewith | ||||
Description of Document |
| Form |
| Filing Date |
| Number |
| |||
10.12* |
| Offer of Employment Letter Dated July 29, 2010 from Extreme Networks, Inc. to Oscar Rodriguez. |
| 10-K |
| 8/20/2010 |
| 10.32 |
|
|
10.13 |
| Agreement by and between Extreme Networks, Inc. and the Ramius Group dated as of October 13, 2010. |
| 8-K |
| 10/14/2010 |
| 10.1 |
|
|
10.14 |
| Option Agreement, dated September 23, 2010, between Extreme Networks, Inc. and Trumark Companies, LLC. |
| 10-Q |
| 11/3/2010 |
| 10.2 |
|
|
10.15* |
| Resignation Agreement and General Release of Claims, dated March 25, 2011, between Extreme Networks, Inc. and Suresh K. Gopalakrishnan. |
| 8-K |
| 3/31/2011 |
| 10.1 |
|
|
10.16* |
| Resignation Agreement and General Release of Claims, dated March 27, 2011, between Extreme Networks, Inc. and Bob L. Corey. |
| 8-K |
| 3/31/2011 |
| 10.2 |
|
|
10.17* |
| Offer of Employment Letter dated March 11, 2011 from Extreme Networks, Inc. to Jim Judson. |
| 10-Q |
| 5/2/2011 |
| 10.1 |
|
|
10.18* |
| Resignation Agreement and General Release of Claims, dated September 13, 2011, between Extreme Networks, Inc. and Justin DiMacchia. |
| 8-K |
| 9/15/2011 |
| 10.1 |
|
|
10.19* |
| Letter Agreement, dated September 13, 2011, between Extreme Networks, Inc. and James Judson. |
| 8-K |
| 9/15/2011 |
| 10.2 |
|
|
10.20* |
| Offer Letter Agreement, dated September 13, 2011, between Extreme Networks, Inc. and Margaret Echerd. |
| 8-K |
| 9/15/2011 |
| 10.3 |
|
|
10.21 |
| Option Agreement, dated January 25, 2012, between Extreme Networks, Inc. and Trumark Companies, LLC. |
| 10-Q |
| 2/7/2012 |
| 10.5 |
|
|
10.22 |
| Amendment to the Option Agreement, dated September 17, 2010, between Extreme Networks, Inc. and Trumark Companies, LLC. |
| 10-Q |
| 2/7/2012 |
| 10.6 |
|
|
10.23* |
| Letter Agreement, dated March 9, 2012, between Extreme Networks, Inc. and James Judson. |
| 8-K |
| 3/12/2012 |
| 10.1 |
|
|
10.24* |
| Resignation Agreement and General Release of Claims, dated May 7, 2012, between Extreme Networks, Inc. and Michael L. Seaton. |
| 8-K |
| 5/9/2012 |
| 10.1 |
|
|
10.25* |
| Resignation and Consulting Agreement, dated May 22, 2012, between Extreme Networks, Inc. and Jim Judson. |
| 8-K |
| 5/22/2012 |
| 10.1 |
|
|
10.26* |
| Offer Letter Agreement, executed May 18, 2012, between Extreme Networks, Inc. and John Kurtzweil. |
| 8-K |
| 5/22/2012 |
| 10.2 |
|
|
16.1 |
| Letter regarding change in certifying accountant from Ernst & Young LLP. |
| 8-K |
| 11/10/2010 |
| 16.1 |
|
|
21.10 |
| Subsidiaries of Registrant. |
|
|
|
|
|
|
| X |
23.1 |
| Consent of KPMG LLP, Independent Registered Public Accounting Firm. |
|
|
|
|
|
|
| X |
23.2 |
| Consent of Ernst & Young LLP, Independent Registered Public Accounting Firm. |
|
|
|
|
|
|
| X |
24.1 |
| Power of Attorney (see page 80 of this Form 10-K). |
|
|
|
|
|
|
| X |
31.1 |
| Section 302 Certification of Chief Executive Officer. |
|
|
|
|
|
|
| X |
31.2 |
| Section 302 Certification of Chief Financial Officer. |
|
|
|
|
|
|
| X |
32.1 |
| Section 906 Certification of Chief Executive Officer. |
|
|
|
|
|
|
| X |
32.2 |
| Section 906 Certification of Chief Financial Officer. |
|
|
|
|
|
|
| X |
____________________
* | Indicates management or board of directors contract or compensatory plan or arrangement. |
SCHEDULE II
VALUATION AND QUALIFYING ACCOUNTS
YEARS ENDED JUNE 30, 2012 , JULY 3, 2011 and JUNE 27, 2010
Description | Balance at beginning of period |
| Charges to costs and expenses |
| (Deductions)(1) |
| Balance at end of period | ||||||||
Year Ended June 27, 2010: |
|
|
|
|
|
|
| ||||||||
Allowance for doubtful accounts | $ | 1,205 | |
| $ | 26 | |
| $ | (199 | ) |
| $ | 1,032 | |
Allowance for sales returns | $ | 930 | |
| $ | 1,229 | |
| $ | (1,222 | ) |
| $ | 937 | |
Year Ended July 3, 2011: |
|
|
|
|
|
|
| ||||||||
Allowance for doubtful accounts | $ | 1,032 | |
| $ | (9 | ) |
| $ | (256 | ) |
| $ | 767 | |
Allowance for sales returns | $ | 937 | |
| $ | 647 | |
| $ | (939 | ) |
| $ | 645 | |
Year Ended June 30, 2012: |
|
|
|
|
|
|
| ||||||||
Allowance for doubtful accounts | $ | 767 | |
| $ | 127 | |
| $ | (510 | ) |
| $ | 384 | |
Allowance for sales returns | $ | 645 | |
| $ | 1,013 | |
| $ | (396 | ) |
| $ | 1,262 | |
____________________
(1) | Uncollectible accounts written off, net of recoveries |
60
Table of Contents
SIGNATURES
Pursuant to the requirements of Section 13 or 15(d) of the Securities Exchange Act of 1934, the Registrant has duly caused this report to be signed on its behalf by the undersigned, thereunto duly authorized, on August 22, 2012 .
| E XTREME N ETWORKS , I NC . (Registrant) | |
|
|
|
| By: | /s/ John Kurtzweil |
|
| John Kurtzweil |
|
| Senior Vice President and Chief Financial Officer |
|
| August 22, 2012 |
POWER OF ATTORNEY
KNOW ALL PERSONS BY THESE PRESENTS, that each person whose signature appears below constitutes and appoints John Kurtzweil, his true and lawful attorneys-in-fact, with full power of substitution, for him in any and all capacities, to sign any amendments to this report on Form 10-K and to file the same, with exhibits thereto and other documents in connection therewith, with the Securities and Exchange Commission, hereby ratifying and confirming all that each of said attorneys-in-fact or their substitute or substitutes may do or cause to be done by virtue hereof.
Pursuant to the requirements of the Securities Exchange Act of 1934, this report has been signed below by the following persons on behalf of the Registrant and in the capacities and on the date indicated:
/s/ E D M EYERCORD |
| /s/ O SCAR R ODRIGUEZ |
Ed Meyercord |
| Oscar Rodriguez |
Chairman of the Board |
| President and Chief Executive Officer |
August 22, 2012 |
| (Principal Executive Officer) |
|
| August 22, 2012 |
|
|
|
/s/ J OHN K URTZWEIL |
| /s/ M ARGARET E CHERD |
John Kurtzweil |
| Margaret Echerd |
Senior Vice President and Chief Financial Officer |
| Vice President, Corporate Controller |
(Principal Financial Officer) |
| (Principal Accounting Officer) |
August 22, 2012 |
| August 22, 2012 |
|
|
|
/s/ M AURY A USTIN |
| /s/ C HARLES C ARINALLI |
Maury Austin |
| Charles Carinalli |
Director |
| Director |
August 22, 2012 |
| August 22, 2012 |
|
|
|
/s/ E D K ENNEDY |
| /s/ J OHN K ISPERT |
Ed Kennedy |
| John Kispert |
Director |
| Director |
August 22, 2012 |
| August 22, 2012 |
|
|
|
/s/ J OHN C. S HOEMAKER |
| /s/ H ARRY S ILVERGLIDE |
John C. Shoemaker |
| Harry Silverglide |
Director |
| Director |
August 22, 2012 |
| August 22, 2012 |
|
|
|
61
Table of Contents
EXHIBIT INDEX | ||||||||||
Exhibit Number |
|
|
| Incorporated by Reference |
| Filed Herewith | ||||
Description of Document |
| Form |
| Filing Date |
| Number |
| |||
3.1 |
| Amended and Restated Certificate of Incorporation of Extreme Networks, Inc. |
| 8-K |
| 12/17/2010 |
| 3.2 |
|
|
3.2 |
| Amended and Restated Bylaws of Extreme Networks, Inc. |
| 8-K |
| 3/31/2011 |
| 3.1 |
|
|
3.3 |
| Certificate of Designation, Preferences and Rights of the Terms of the Series A Preferred Stock |
| 10-K |
| 9/26/2001 |
| 3.7 |
|
|
4.1 |
| Rights Agreement dated April 26, 2012 between Extreme Networks, Inc. and Computershare Shareowner Services LLC. |
| 8-K |
| 4/30/2012 |
| 4.1 |
|
|
10.1 |
| Form of Indemnification Agreement for directors and officers. |
| 8-K |
| 10/24/2011 |
| 99.1 |
|
|
10.2* |
| Amended 1996 Stock Option Plan and forms of agreements thereunder. |
| S-1 |
| 2/5/1999 |
| 10.2 |
|
|
10.3* |
| 1999 Employee Stock Purchase Plan. |
| S-1 |
| 2/5/1999 |
| 10.3 |
|
|
10.4* |
| 2000 Nonstatutory Stock Option Plan. |
| 10-K |
| 9/24/2000 |
| 10.7 |
|
|
10.5* |
| 2001 Nonstatutory Stock Option Plan. |
| Schedule TO |
| 10/31/2001 |
| (d)(9) |
|
|
10.6* |
| Offer of Employment Letter dated August 18, 2006 from Extreme Networks, Inc. to Mark A. Canepa. |
| 8-K |
| 9/5/2006 |
| 99.1 |
|
|
10.7* |
| Extreme Networks, Inc. Amended and Restated Executive Change in Control Severance Plan. |
| 10-K |
| 8/30/2011 |
| 10.7 |
|
|
10.8* |
| Extreme Networks, Inc. 2005 Equity Incentive Plan. |
| 8-K |
| 12/8/2005 |
| 99.1 |
|
|
10.9* |
| Form of Restricted Stock Units Agreement Under the 2005 Equity Incentive Plan. |
| 10-Q |
| 11/7/2008 |
| 10.22 |
|
|
10.10* |
| Extreme Networks, Inc. Fiscal 2010 Executive Incentive Bonus Plan. |
| 8-K |
| 7/31/2009 |
| 10.24 |
|
|
10.11* |
| Extreme Networks, Inc. Fiscal 2011 Executive Incentive Bonus Plan. |
| 8-K |
| 7/30/2010 |
| 10.1 |
|
|
10.12* |
| Offer of Employment Letter Dated July 29, 2010 from Extreme Networks, Inc. to Oscar Rodriguez. |
| 10-K |
| 8/20/2010 |
| 10.32 |
|
|
10.13 |
| Agreement by and between Extreme Networks, Inc. and the Ramius Group dated as of October 13, 2010. |
| 8-K |
| 10/14/2010 |
| 10.1 |
|
|
10.14 |
| Option Agreement, dated September 23, 2010, between Extreme Networks, Inc. and Trumark Companies, LLC. |
| 10-Q |
| 11/3/2010 |
| 10.2 |
|
|
10.15* |
| Resignation Agreement and General Release of Claims, dated March 25, 2011, between Extreme Networks, Inc. and Suresh K. Gopalakrishnan. |
| 8-K |
| 3/31/2011 |
| 10.1 |
|
|
10.16* |
| Resignation Agreement and General Release of Claims, dated March 27, 2011, between Extreme Networks, Inc. and Bob L. Corey. |
| 8-K |
| 3/31/2011 |
| 10.2 |
|
|
10.17* |
| Offer of Employment Letter dated March 11, 2011 from Extreme Networks, Inc. to Jim Judson. |
| 10-Q |
| 5/2/2011 |
| 10.1 |
|
|
10.18* |
| Resignation Agreement and General Release of Claims, dated September 13, 2011, between Extreme Networks, Inc. and Justin DiMacchia. |
| 8-K |
| 9/15/2011 |
| 10.1 |
|
|
10.19* |
| Letter Agreement, dated September 13, 2011, between Extreme Networks, Inc. and James Judson. |
| 8-K |
| 9/15/2011 |
| 10.2 |
|
|
10.20* |
| Offer Letter Agreement, dated September 13, 2011, between Extreme Networks, Inc. and Margaret Echerd. |
| 8-K |
| 9/15/2011 |
| 10.3 |
|
|
10.21 |
| Option Agreement, dated January 25, 2012, between Extreme Networks, Inc. and Trumark Companies, LLC. |
| 10-Q |
| 2/7/2012 |
| 10.50 |
|
|
10.22 |
| Amendment to the Option Agreement, dated September 17, 2010, between Extreme Networks, Inc. and Trumark Companies, LLC. |
| 10-Q |
| 2/7/2012 |
| 10.6 |
|
|
62
Table of Contents
EXHIBIT INDEX | ||||||||||
Exhibit Number |
|
|
| Incorporated by Reference |
| Filed Herewith | ||||
Description of Document |
| Form |
| Filing Date |
| Number |
| |||
10.23* |
| Letter Agreement, dated March 9, 2012, between Extreme Networks, Inc. and James Judson. |
| 8-K |
| 3/12/2012 |
| 10.1 |
|
|
10.24* |
| Resignation Agreement and General Release of Claims, dated May 7, 2012, between Extreme Networks, Inc. and Michael L. Seaton. |
| 8-K |
| 5/9/2012 |
| 10.1 |
|
|
10.25* |
| Resignation and Consulting Agreement, dated May 22, 2012, between Extreme Networks, Inc. and Jim Judson. |
| 8-K |
| 5/22/2012 |
| 10.1 |
|
|
10.26* |
| Offer Letter Agreement, executed May 18, 2012, between Extreme Networks, Inc. and John Kurtzweil. |
| 8-K |
| 5/22/2012 |
| 10.2 |
|
|
16.1 |
| Letter regarding change in certifying accountant from Ernst & Young LLP. |
| 8-K |
| 11/10/2010 |
| 16.1 |
|
|
21.1 |
| Subsidiaries of Registrant. |
|
|
|
|
|
|
| X |
23.1 |
| Consent of KPMG LLP, Independent Registered Public Accounting Firm. |
|
|
|
|
|
|
| X |
23.2 |
| Consent of Ernst & Young LLP, Independent Registered Public Accounting Firm. |
|
|
|
|
|
|
| X |
24.1 |
| Power of Attorney (see page 80 of this Form 10-K). |
|
|
|
|
|
|
| X |
31.1 |
| Section 302 Certification of Chief Executive Officer. |
|
|
|
|
|
|
| X |
31.2 |
| Section 302 Certification of Chief Financial Officer. |
|
|
|
|
|
|
| X |
32.1 |
| Section 906 Certification of Chief Executive Officer. |
|
|
|
|
|
|
| X |
32.2 |
| Section 906 Certification of Chief Financial Officer. |
|
|
|
|
|
|
| X |
___________________
* | Indicates management or board of directors contract or compensatory plan or arrangement. |
63