UNITED STATES
SECURITIES AND EXCHANGE COMMISSION
Washington, D.C. 20549
FORM 10-K
(Mark One)
| x | Annual Report pursuant to Section 13 or 15(d) of the Securities Exchange Act of 1934 |
For the fiscal year ended January 31, 2011
OR
| ¨ | Transition report pursuant to Section 13 or 15(d) of the Securities Exchange Act of 1934 |
Commission File Number: 001-32224
salesforce.com, inc.
(Exact name of registrant as specified in its charter)
| Delaware | 94-3320693 | |
(State or other jurisdiction of incorporation or organization) | (IRS Employer Identification No.) |
The Landmark @ One Market, Suite 300
San Francisco, California 94105
(Address of principal executive offices)
Telephone Number (415) 901-7000
(Registrant's telephone number, including area code)
Securities registered pursuant to Section 12(b) of the Act:
| Title of each class | Name of each exchange on which registered | |
| Common Stock, par value $0.001 per share | New York Stock Exchange, Inc. |
Securities registered pursuant to section 12(g) of the Act:
Not applicable
Indicate by check mark if the Registrant is a well-known seasoned issuer, as defined in Rule 405 of the Securities Act. Yes x No ¨
Indicate by check mark if the Registrant is not required to file reports pursuant to Section 13 or Section 15(d) of Act. Yes ¨ No x
Indicate by check mark whether the Registrant (1) has filed all reports required to be filed by Section 13 or 15(d) of the Securities Exchange Act of 1934 during the preceding 12 months (or for such shorter period that the registrant was required to file such reports), and (2) has been subject to such filing requirements for the past 90 days: Yes x No ¨
Indicate by check mark whether the registrant has submitted electronically and posted on its corporate Web site, if any, every Interactive Data File required to be submitted and posted pursuant to Rule 405 of Regulation S-T (§232.405 of this chapter) during the preceding 12 months (or for such shorter period that the registrant was required to submit and post such files). Yes x No ¨
Indicate by check mark if disclosure of delinquent filers pursuant to Item 405 of Regulation S-K (Section 229.405 of this chapter) is not contained herein, and will not be contained, to the best of Registrant's knowledge, in definitive proxy or information statements incorporated by reference in Part III of this Form 10-K or any amendment to this Form 10-K. ¨
Indicate by check mark whether the registrant is a large accelerated filer, an accelerated filer, a non-accelerated filer or a smaller reporting company. See the definitions of "large accelerated filer," "accelerated filer" and "smaller reporting company" in Rule 12b-2 of the Exchange Act. (Check one):
Large accelerated filer x Accelerated filer ¨ Non-accelerated filer ¨ Smaller reporting company ¨
Indicate by check mark whether the registrant is a shell company (as defined in Rule 12b-2 of the Act). Yes ¨ No x
Based on the closing price of the Registrant's common stock on the last business day of the Registrant's most recently completed second fiscal quarter, which was July 31, 2010, the aggregate market value of its shares (based on a closing price of $98.95 per share) held by non-affiliates was approximately $11.7 billion. Shares of the Registrant's common stock held by each executive officer and director and by each entity or person that owned 5 percent or more of the Registrant's outstanding common stock were excluded in that such persons may be deemed to be affiliates. This determination of affiliate status is not necessarily a conclusive determination for other purposes.
As of January 31, 2011, there were approximately 132.9 million shares of the Registrant's Common Stock outstanding.
DOCUMENTS INCORPORATED BY REFERENCE
Portions of the Registrant's definitive proxy statement for its 2011 Annual Meeting of Stockholders (the "Proxy Statement"), to be filed within 120 days of the Registrant's fiscal year ended January 31, 2011, are incorporated by reference in Part III of this Report on Form 10-K. Except with respect to information specifically incorporated by reference in this Form 10-K, the Proxy Statement is not deemed to be filed as part of this Form 10-K.
salesforce.com, inc.
INDEX
| Page No. | ||||||
| PART I | ||||||
Item 1. | Business | 1 | ||||
Item 1A. | Risk Factors | 13 | ||||
Item 1B. | Unresolved Staff Comments | 26 | ||||
Item 2. | Properties | 27 | ||||
Item 3. | Legal Proceedings | 27 | ||||
Item 4. | Reserved | 27 | ||||
Item 4A. | Executive Officers of the Registrant | 27 | ||||
| PART II | ||||||
Item 5. | Market for Registrant's Common Equity, Related Stockholder Matters and Issuer Purchases of Equity Securities | 29 | ||||
Item 6. | Selected Financial Data | 31 | ||||
Item 7. | Management's Discussion and Analysis of Financial Condition and Results of Operations | 33 | ||||
Item 7A. | Quantitative and Qualitative Disclosures About Market Risk | 51 | ||||
Item 8. | Consolidated Financial Statements and Supplementary Data | 53 | ||||
Item 9. | Changes in and Disagreements with Accountants on Accounting and Financial Disclosure | 89 | ||||
Item 9A. | Controls and Procedures | 89 | ||||
Item 9B. | Other Information | 90 | ||||
| PART III | ||||||
Item 10. | Directors, Executive Officers of the Registrant and Corporate Governance Matters | 91 | ||||
Item 11. | Executive Compensation | 91 | ||||
Item 12. | Security Ownership of Certain Beneficial Owners and Management and Related Stockholder Matters | 91 | ||||
Item 13. | Certain Relationships and Related Transactions and Director Independence | 91 | ||||
Item 14. | Principal Accounting Fees and Services | 91 | ||||
| PART IV | ||||||
Item 15. | Exhibits, Financial Statement Schedules | 92 | ||||
| Signatures | 93 | |||||
| Index to Exhibits | ||||||
i
FORWARD-LOOKING INFORMATION
This Annual Report on Form 10-K, including the section titled "Management's Discussion and Analysis of Financial Condition and Results of Operations" ("MD&A") in Item 7, contains forward-looking statements within the meaning of Section 27A of the Securities Act of 1933 and Section 21E of the Securities Exchange Act of 1934. Forward-looking statements consist of, among other things, trend analyses, statements regarding future events, future financial performance, our business strategy and our plan to build our business, including our strategy to be the leading provider of CRM application services and the leading platform on which customers and partners build enterprise cloud computing applications, our service performance and security, the expenses associated with our data center capacity, our operating results, our anticipated growth, trends in our business, new application service features, our strategy of acquiring or making investments in complementary companies, services and technologies, the effect of general economic and market conditions including sudden declines in the fair value of our investments in cash equivalents and marketable securities, our ability to protect our intellectual property rights, our ability to develop our brands, the effect of evolving government regulations, the effect of foreign currency exchange rate and interest rate fluctuations on our financial results, the potential availability of additional tax assets in the future and related matters, the impact of expensing stock options, the sufficiency of our capital resources, potential litigation involving us, our plan to build our new global headquarters in San Francisco, and our strategy to be the leading provider of CRM application services and the leading platform on which customers and partners build enterprise cloud computing applications, of which are based on current expectations, estimates, and forecasts, and the beliefs and assumptions of our management. Words such as "expects," "anticipates," "aims," "projects," "intends," "plans," "believes," "estimates," "seeks," variations of such words, and similar expressions are also intended to identify such forward-looking statements. These forward-looking statements are subject to risks, uncertainties and assumptions that are difficult to predict. Therefore, actual results may differ materially and adversely from those expressed in any forward-looking statements. Readers are directed to risks and uncertainties identified below, under "Risk Factors" in Item 1A and elsewhere in this report, for factors that may cause actual results to be different than those expressed in these forward-looking statements. Except as required by law, we undertake no obligation to revise or update publicly any forward-looking statements for any reason.
PART I
| ITEM 1. | BUSINESS |
Overview
We are a leading provider of enterprise cloud computing applications. We provide a comprehensive customer and collaboration relationship management, or CRM, service to businesses of all sizes and industries worldwide and we provide a technology platform for customers and developers to build and run business applications.
We were incorporated in Delaware in February 1999, and founded on the simple concept of delivering enterprise business applications via the Internet or "cloud." Cloud computing refers to the use of Internet-based computing, storage and connectivity technology for a variety of different services. We introduced our first service in February 2000. Since then, we have augmented our CRM service with new editions and enhanced features. We introduced our Force.com platform to customers and developers so they can build complementary applications to extend beyond CRM. In 2010 we introduced our AppExchange directory of enterprise cloud computing applications that are integrated with our CRM service and in most cases have been developed on our platform by third parties. We also introduced Chatter, a collaboration application for the enterprise to connect and share information securely and in real-time.
Our principal executive offices are located in San Francisco, California and our principal website address is www.salesforce.com . Our office address is The Landmark @ One Market, Suite 300, San Francisco, California 94105.
1
We designed and developed our applications to be easy-to-use and intuitive solutions that can be deployed rapidly, customized easily and integrated with other software applications. We deliver our service through any of the market-leading Web browsers. Customers who use our CRM and collaboration services and platform are able to avoid much of the expense and complexity of traditional enterprise software development and implementations. As a result, our customers incur less risk and lower upfront costs and benefit from increased productivity.
We market our service to businesses on a subscription basis, primarily through our direct sales efforts and indirectly through partners. Through our Force.com platform and developer tools and our AppExchange, we also encourage third parties to develop additional functionality and applications that run on our platform, but which are sold separately from, or in conjunction with, our CRM service.
Cloud Computing
Cloud computing fundamentally changes the way enterprise business software applications are developed and deployed. Application developers no longer need to create and manage their own infrastructure of servers, storage, network devices, operating system software and development tools in order to create a business application. Instead, the entire infrastructure is managed by third parties who specialize in infrastructure management, and developers simply use an Internet browser to access the development environment. Application users can gain access to a variety of business applications via an Internet browser or mobile device, and are able to take advantage of a robust, secure, scalable and highly available application, without the cost and complexity of managing the hardware or software infrastructure.
Our vision of enterprise cloud computing is based on a multi-tenant technology architecture and a subscription service business model. With multi-tenancy, multiple customers share application, platform and infrastructure services provided by the vendor.
Today, we believe that the next phase of cloud computing is transforming enterprise software again. Driven by the consumerization of information technology ("IT"), our next phase of cloud computing will have three key characteristics – it will be social, mobile and open. With the popularity of social networking websites, new ways to communicate and collaborate based on feeds and status updates have emerged. In the enterprise market, that means enabling employees to easily find, share and collaborate on information. In addition, with the wide adoption of mobile phones and tablets, our customers now expect cloud computing technologies to be built for business to work on these devices, regardless of the carrier or operating system. We are working to provide these new kinds of cloud computing technologies to enterprise customers around the world.
Cloud Applications
Cloud applications enable businesses to subscribe to a wide variety of application services that are developed specifically for, and delivered over, the Internet on an as-needed basis with few or no implementation services required and without the need to install and manage third-party software or hardware in-house.
Historically, only large businesses could afford to make investments in enterprise resource planning, CRM and collaboration applications to gain an enterprise-wide view of business information and automate and improve basic processes. However, cloud applications are available to businesses of all sizes and across all industries. Multi-tenant architectures enables cloud vendors like us to leverage a common infrastructure and software code base across all of our customers who benefit from access to the most current release of the application, periodic upgrades, more rapid innovation and the economies of a shared infrastructure.
We believe the shift to cloud applications provides significant benefits even beyond those associated with multi-tenant infrastructure. Businesses are able to realize many of the benefits offered by traditional enterprise
2
software vendors, such as a comprehensive set of features and functionality and the ability to customize and integrate with other applications, while at the same time reducing the risks and lowering the total costs associated with owning enterprise software. As a result, we believe the continued emergence of cloud applications is bringing about a fundamental transformation in the enterprise software industry as businesses are offered the choice of replacing their purchased software with subscriptions to a wide range of application services.
Cloud Platforms
We believe that cloud applications and their related success in the market are the most widely understood segment of enterprise cloud computing. However, enterprise cloud computing also includes building applications on a cloud-based application development platform, also referred to as cloud platforms.
Application developers use cloud platform technology to build both custom applications for individual businesses or vertical industries, and horizontal applications to address standard business processes that can be sold to a broad range of potential customers. Application developers include corporate IT departments that typically develop applications for a company's internal-use and independent software vendors ("ISVs") that develop applications to sell to customers. Traditionally, these developers have needed to purchase, install, test and maintain complex software and hardware infrastructure to develop and deliver their applications. This requirement resulted in more time and resources being spent maintaining infrastructure and less time and resources being available to actually develop applications, with a resulting reduction in innovation and productivity levels.
Cloud platforms enable corporate IT developers and ISVs to leverage the benefits of a multi-tenant platform for developing new applications. Cloud platforms allow developers to build applications using only a browser and an Internet connection, just as cloud applications allow users to use applications through a browser. In addition, developers typically pay no upfront costs when building cloud applications, with costs only to be incurred at the point of application deployment.
Our cloud platforms provide application developers access to new capabilities that can be built into their business applications. These platforms include features popularized by social networking companies, such as profiles, status updates and feeds; and also the capability to extend applications for use on mobile devices.
Our cloud platforms allow both IT departments and ISV developers to use several programming languages to build their applications. While there are many benefits to a language natively associated with a cloud platform, developers are able to use the most popular programming languages on our cloud platforms, such as Java and Ruby, to build their applications. Our cloud platforms support multiple languages to provide developers openness and choice.
Our Solution
Our CRM applications help companies better record, track, manage, analyze and share information regarding sales, customer service and support, and marketing operations. In 2010 we introduced Salesforce Chatter, a private social network for businesses. Our Force.com cloud computing platform, which was introduced in 2007, allows customers and partners to more extensively customize and integrate our applications or build entirely new cloud applications beyond CRM without having to invest in new software, hardware and related infrastructure. These newly developed applications, which run on our infrastructure, can then be used for internal operations or sold to third parties.
We also offer the AppExchange, an online directory for cloud applications, where customers can browse, test-drive and deploy applications from salesforce.com and our partners.
3
The majority of our subscription and support revenue comes from subscriptions to our core CRM application and Force.com application development platform. In order for customers to install and run custom applications, whether built by themselves or by our partners, they must be a subscriber to our service.
By subscribing to our service, our customers do not have to make large and potentially risky upfront investments in software, hardware, implementation services and IT staff as they would with traditional software solutions. We believe that our service enables businesses to rapidly achieve the benefits of higher productivity, and lower their total cost of ownership for their business application.
Key advantages of our solution include:
| • | Secure, scalable and reliable delivery platform. The delivery platform for our service has been designed to provide our customers with high levels of performance, reliability, and security. We have built, and continue to invest in, a comprehensive security infrastructure, including firewalls, intrusion detection systems, and encryption for transmissions over the Internet, which we monitor and test on a regular basis. We built and maintain a multi-tenant application architecture that has been designed to enable our service to scale securely, reliably, and cost-effectively. Our multi-tenant application architecture maintains the integrity and separation of customer data while still permitting all customers to use the same application functionality simultaneously. |
| • | Rapid deployment. Our service can be deployed rapidly since our customers do not have to spend time procuring, installing or maintaining the servers, storage, networking equipment, security products, or other infrastructure hardware and software necessary to ensure a scalable and reliable service. |
| • | Ease of integration. Our platform is designed to enable IT professionals to integrate our service with existing applications quickly and seamlessly. Our Force.com platform provides a set of application programming interfaces, or "APIs," that enable customers and independent developers to both integrate our service with existing third-party, custom, and legacy applications and write their own application services that integrate with our service. For example, many of our customers use the Force.com API to move customer-related data from custom-developed and legacy applications into our service on a periodic basis to provide greater visibility into their activities. Other customers and partners have, for example, developed their own talent management solutions and procurement solutions on the Force.com platform. |
| • | Rapid development of applications using the Force.com platform . Our customers and third party developers can develop applications rapidly because of the ease of use and the benefits of a multi-tenant platform. We provide the capability for business users to easily customize our applications to suit their specific needs, and also powerful programming language support so developers can code complex applications spanning multiple business processes. |
| • | Increasing innovation. By providing infrastructure and development environments on demand, we provide developers the opportunity to create new and innovative applications without having to invest in hardware and distribution. A developer with an idea for a new application can log onto our platform, develop, test and support their system on Force.com and make the application accessible for a fee to our customers. |
| • | Lower total cost of ownership. We enable customers to achieve significant upfront savings relative to the traditional enterprise software model. Customers benefit from the predictability of their future costs since they pay for the service on a per subscriber basis for the term of the subscription contract. All upgrades are included in our service, so customers are not burdened or disrupted by the periodic need to perform system upgrades. Because we implement all upgrades on our servers, new features and functionality automatically become part of our service on the release date and therefore benefit all of our customers immediately. |
| • | High levels of user adoption. We have designed our service to be intuitive and easy to use. Since our service contains many tools and features recognizable to users of popular websites such as those of Amazon, Facebook, Google and Twitter, it has a more familiar user interface than typical enterprise CRM applications. As a result, our users do not require substantial training on how to use and benefit from our service. |
4
Our Strategy
Our objective is to be the leading provider of CRM application services. We also want to be the leading cloud computing platform on which our customers and partners build applications.
Key elements of our strategy include:
| • | Strengthening our existing CRM applications and extending into new functional areas within CRM. We designed our service to easily accommodate new features and functions. We intend to continue to add CRM features and functionality to our core service that we will make available to customers at no additional charge. We offer advanced editions for an additional subscription fee to customers that require enhanced CRM capabilities. We have a growing portfolio of applications that serve different customer segments and markets. During fiscal 2011 we acquired several companies in complementary businesses, joint ventures, services and technologies in an effort to strengthen and extend our service CRM offerings. We expect to continue to make such investments and acquisitions in the future. |
| • | Pursuing new customers and new territories aggressively. We believe that our cloud application and platform offerings provide significant value for businesses of any size. As a result, we will continue to aggressively target businesses of all sizes, primarily through our direct sales force. We have steadily increased and plan to continue to increase the number of direct sales professionals we employ, and we intend to develop additional distribution channels for our service. We have created several editions of our service to address the distinct requirements of businesses of different sizes. We also believe that there is a substantial market opportunity for our service outside of North America. We plan to continue to aggressively market to customers outside of North America by recruiting local sales and support professionals and by building partnerships that help us add customers in these regions. |
| • | Deepening relationships with our existing customer base. We believe there is significant opportunity to leverage our relationships with existing customers. As the customer realizes the benefits of our service, we aim to either upgrade our customers to higher priced editions or sell more subscriptions by targeting additional functional areas and business units within the customer organization and ultimately pursuing enterprise-wide deployments. We aim to have our customers renew their subscriptions at the end of their contractual terms and we run customer success and other programs in an effort to secure renewals of existing customers. |
| • | Continuing to lead the industry transformation to the next phase of cloud computing . We believe that the market transformation to cloud applications and platforms is a growing trend in the information technology industry. With the popularity of social networking websites, new ways to communicate and collaborate based on feeds and status updates have emerged in the enterprise. We believe we have established a leadership position in the enterprise cloud computing industry as a successful vendor of CRM application services, an enabler for third parties to create their own cloud applications through our platform and a developer of cloud computing technologies with social, mobile and open characteristics to provide to enterprise customers around the world. |
| • | Encouraging the development of third-party applications on our Force.com cloud computing platform . Our Force.com cloud computing platform enables existing customers, ISVs and third-party developers to develop and deliver cloud applications they have built in our multi-tenant environment. It is a platform on which applications can be created, tested, published, and run. In addition, these applications can be listed on the AppExchange, our online marketplace of cloud applications, or sold by ISVs. We believe the ecosystem of cloud developers and ISVs will address the business requirements of both current and potential customers. |
The Salesforce CRM Service
Our comprehensive array of services enable customers and subscribers to systematically record, store, analyze, share, and act upon business data and to help businesses manage customer accounts, track sales leads, evaluate marketing campaigns, and provide post-sales service. We also enable companies to generate reports and
5
summaries of this data and share them with authorized individuals across functional areas. Most of the features of our service can be accessed through a variety of devices, including laptop computers, tablets and mobile devices. Additionally, our service is highly configurable in a short amount of time, enabling our customers to tailor its appearance, policy settings, language, workflow, reports, and other characteristics without the use of significant IT resources or consultants.
Our CRM services are primarily marketed under two brands, the Sales Cloud and the Service Cloud:
| • | Sales Cloud. The sales force automation features of our application services are marketed under our Sales Cloud brand. Through the Sales Cloud, users are able to be more productive through the automation of manual and repetitive tasks and access to better and more organized data about their current customers and prospects. Our customers are also able to establish a system and process for recording, tracking, and sharing information about sales opportunities, sales leads, sales forecasts, the sales process, and closed business, as well as managing sales territories. Our customers are also better able to manage unstructured information such as sales collateral, presentations, price lists, and video assets. In addition, the Sales Cloud encompasses partner relationship management functionality (including channel management and partner portals) and marketing automation (including campaigns, ROI tracking, and Google AdWords integration). |
| • | Service Cloud. Our customer service and support automation features are marketed under our Service Cloud brand. Through the Service Cloud, companies are able to maintain better relationships with their existing customers and more efficiently address a variety of service and support needs, such as advice about products and services, requests for repairs, complaints about faulty goods, and the need for additional goods and services. Using the Service Cloud, customers can leverage our complete cloud-computing platform to deliver a comprehensive solution for their customer service interactions across every service channel: call centers with phone, email, and chat; Web portals for self-service and customer collaboration; and community interactions within social networks. |
As of January 31, 2011, we offered five principal service editions: Contact Manager Edition, Group Edition, Professional Edition, Enterprise Edition, and Unlimited Edition. Chatter is included in each Edition. We derived over 90 percent of our revenues from subscriptions to, and support for, our service in fiscal 2011.
| • | Contact Manager Edition. Contact Manager Edition, which is limited to five subscribers, is targeted primarily at individuals and small businesses that seek basic contact and customer management. Users can track customer contacts and manage tasks and activities. |
| • | Group Edition. Group Edition, which is also limited to five subscribers, is targeted primarily at small businesses and workgroups that seek a basic sales force automation solution. Users can share important customer data and manage their customer relations-from the start of the sales cycle to closing the deal to providing basic customer service. In addition to everything available in Contact Manager Edition, Group Edition offers access to opportunities, accounts, contacts, tasks and basic reports. Using the Force.com platform, customers can further extend and customize Group Edition by adding additional custom tabs and/or a custom application. |
| • | Professional Edition. Professional Edition is targeted primarily at medium-sized and large businesses that need a robust and complete CRM solution but do not need some of the more advanced administrative features and integration capabilities. Professional Edition offers companies a comprehensive CRM suite that business users can use to manage every aspect of the customer lifecycle. In addition to everything available in Group Edition, it provides users more advanced CRM functionality such as: forecasts, lead management, contract management, solutions, and online case capture. Professional Edition also comes with standard, easy-to-use customization, security and sharing, integration, and administration tools to facilitate any small to mid-sized deployment. Using the Force.com platform, Professional Edition customers have more flexibility than Group Edition customers to further extend and customize their service by adding more custom applications, custom tabs, and/or custom objects. |
6
| • | Enterprise Edition. Enterprise Edition is designed to meet the complex business needs of large organizations with many divisions or departments. In addition to all of the functionality available in Professional Edition, Enterprise Edition offers customers: |
| • | advanced CRM functionality, such as territory management that uses a rule-based territory assignment engine to categorize accounts and users into territories, products, and schedules that track revenue and quantity by opportunities; |
| • | multi-divisional sharing and permissions such as profile-based departmental security and sharing; |
| • | workflow and business process control such as workflow automation tasks; and |
| • | enterprise customization and integration tools that can support large-scale deployments, such as APIs for back-office integration that enable companies to readily integrate Salesforce CRM with ERP applications and other data sources. Customers also have greater flexibility and control to fully extend and customize our service by adding more custom applications, custom tabs, and/or custom objects. |
| • | Unlimited Edition. Unlimited Edition is our most fully featured edition, with exclusive features available only in Unlimited Edition and bundled add-on features included at a significant cost saving over the total price of the individual features. In addition to all of the functionality available in Enterprise Edition, Unlimited Edition includes unlimited installations from the AppExchange, increased customization and extension possibilities that customers can implement on their own, Premier Support with Administration and additional storage. In addition to Chatter Unlimited Edition includes all the features of Chatter Plus. |
Each of the editions described above entitles customers to our standard customer support services. For advanced customers with more complex business needs, we provide additional levels of fee-based customer support.
In addition to the five editions, we continue to innovate and develop additional products and services as optional add-on subscriptions to better meet different customers' needs.
Collaboration Cloud
We offer various collaboration cloud products such as Chatter, Chatter Plus, Chatter Mobile, Chatter Free and Chatter.com. Each of these products provides a private and secure corporate social network for companies of all sizes. Chatter is a core attribute of our Force.com platform and its social capabilities are an integral part of each of our service offerings.
Force.com Platform
The Force.com cloud computing platform, which is marketed under our Custom Cloud brand, enhances the attractiveness of our service, particularly to enterprise customers. The Force.com platform provides a feature set and technology environment for building business applications, including data models and objects to manage data, a workflow engine for managing collaboration of data between users, a user interface model to handle forms and other interactions, and a Web services API for programmatic access and integration. The Force.com platform provides the tools and infrastructure required to:
| • | deploy our application service for CRM; |
| • | customize and integrate existing enterprise software applications; |
| • | create and deploy new business applications that are pre-integrated with our service and leverage the same user interface or customize the user interface specific to customer requirements; and |
| • | sample and deploy applications built by third parties from the AppExchange. |
7
The AppExchange
We offer the AppExchange, an online directory that provides customers a way to browse, test-drive, share, and install applications developed on our Force.com platform. Partners and developers can offer their applications on the AppExchange directory. This directory gives our users a way to find and install applications to expand their use of the Force.com platform to areas that are complementary to or extend beyond CRM.
When installing an enterprise cloud computing application built by a third-party partner or developer, customers authorize the third-party provider access to their data. Because they are built, managed and provisioned by third parties, we do not warrant the functionality, security and integrity of the data transmission or processing.
Professional Services
We offer consulting, implementation and training services to our customers to facilitate the adoption of our enterprise cloud computing CRM application and platform services. Consulting services consist of services such as business process mapping, project management services and guidance on best practices in using our service. Implementation services include systems integration, technical architecture and development, configuration and data conversion as well as developing and delivering customized education programs for our customers. Most of our consulting and implementation engagements are billed on a time and materials basis. We offer a number of traditional classroom and online educational classes that address topics such as implementing, using, administering and developing on our service. We also offer classes for our partners who implement our service on behalf of our customers. We bill the traditional classroom and some of the online educational classes on a per person, per class basis. There is a selection of online educational classes available at no charge to customers who subscribe to our service.
As the reach of our enterprise cloud computing application services has grown, partners and other third party consulting and professional service providers play an integral part in providing these services to our customers.
Technology, Development and Operations
Technology and Development
We do not provide software that must be written to different hardware, operating system and database platforms, or that depends upon a customer's unique systems environment. Rather, we have optimized our service to run on a specific database and operating system using the tools and platforms best suited to serve our customers. Performance, functional depth and the usability of our service drive our technology decisions and product direction.
We built our service as a highly scalable, multi-tenant application. We use commercially available hardware and a combination of proprietary and commercially available software to provide our service. The application server is custom-built and runs on a lightweight Java Servlet and Java Server Pages engine. We have custom-built core services such as database connection pooling and user session management tuned to our specific architecture and environment, allowing us to continue to scale our service. We have combined a stateless environment, in which a user is not bound to a single server but can be routed in the most optimal way to any number of servers, with an advanced data caching layer. Our customers can access the service through any Web browser.
Our service treats all customers as logically separate tenants in central applications and databases. As a result, we are able to spread the cost of delivering our service across our user base. In addition, because we do not have to manage thousands of distinct applications with their own business logic and database schemas, we believe that we can scale our business faster than traditional software vendors. Moreover, we can focus our resources on building new functionality to deliver to our customer base as a whole rather than on maintaining an infrastructure to support each of their distinct applications.
8
Our research and development efforts are focused on improving and enhancing the features, functionality and security of our existing service offerings as well as developing new proprietary services such as Force.com and Salesforce Chatter. In addition, from time to time we supplement our internal research and development activities with outside development resources and acquired technology. Because of our multi-tenant architecture, we are able to provide all of our customers with a service based on a single version of our application. We are able to upgrade all of our customers at the same time with each release. As a result, we do not have to maintain multiple versions of our application.
Operations
We currently serve our customers from third-party data center hosting facilities located in the United States and in Singapore. All of our hosting facilities are currently leased from Equinix, Dupont Fabros and NTT, except for offerings added through acquisitions, which are typically served through alternate facilities.
The Equinix, Dupont Fabros and NTT facilities are built to the same critical systems building codes as hospitals and other vital infrastructure. The facilities are secured by around-the-clock guards; biometric access screening and escort controlled access, and are supported by on-site backup generators in the event of a power failure. As part of our current disaster recovery arrangements, all of our customers' data is currently replicated in near real-time. This strategy is designed to both protect our customers' data and ensure service continuity in the event of a major disaster. Even with the disaster recovery arrangements, our service could be interrupted.
Our agreements with Equinix, Dupont Fabros and NTT are for them to supply space in its secure facilities as well as power or connection points for power and Internet connectivity. Bandwidth to the Internet is provided by multiple independent companies for all our facilities. We continuously monitor the performance of our service. The monitoring features we have built or licensed include centralized performance consoles, automated load distribution tools and various self-diagnostic tools and program.
Customers
We sell to businesses of all sizes. The number of paying subscriptions at each of our customers ranges from one to tens of thousands. None of our customers accounted for more than 5 percent of our revenues in fiscal 2011, 2010, or 2009.
Sources of Revenue
We generally recognize revenue ratably over the contract terms beginning on the commencement date of each contract. Amounts that have been invoiced are recorded in accounts receivable and in deferred revenue or revenue, depending on whether the revenue recognition criteria have been met. The deferred revenue balance on our consolidated balance sheet does not represent the total contract value of annual or multi-year, non-cancelable subscription agreements. Unbilled deferred revenue was over $1.5 billion as of January 31, 2011 and over $1.0 billion as of January 31, 2010. Unbilled deferred revenue represents future billings under our non-cancelable subscription agreements that have not been invoiced and, accordingly, are not recorded in deferred revenue. We expect that the amount of unbilled deferred revenue will change from year-to-year for several reasons, including the specific timing and duration of large customer subscription agreements, varying billing cycles of subscription agreements, the specific timing of customer renewals, foreign currency fluctuations, the timing of when unbilled deferred revenue is to be recognized as revenue, and changes in customer financial circumstances. For multi-year subscription agreements billed annually, the associated unbilled deferred revenue is typically high at the beginning of the contract period, zero just prior to renewal, and increases if the agreement is renewed. Low unbilled deferred revenue attributable to a particular subscription agreement is often associated with an impending renewal and may not be an indicator of the likelihood of renewal or future revenue from such customer. Accordingly, we expect that the amount of aggregate unbilled deferred revenue will change from year-to-year depending in part upon the number and dollar amount of subscription agreements at particular stages in their renewal cycle. Such fluctuations are not a reliable indicator of future revenues.
9
Sales, Marketing and Customer Support
We organize our sales and marketing programs by geographic regions, including North America, Europe, and Asia Pacific which includes Japan. Over 30 percent of our revenue comes from customers outside of North America.
Direct Sales
We sell subscriptions to our service primarily through our direct sales force comprised of inside sales, which consists of personnel that sell to customers primarily by phone, and field sales personnel, that are primarily based in geographic territories comprising customers and prospects. Both our inside sales and field sales personnel are supported by telesales representatives who are primarily responsible for generating qualifying leads. Our small business, general business and enterprise account executives and account managers focus their efforts on small, medium-size and large enterprises, respectively.
Referral and Indirect Sales
We have a network of partners who refer customer prospects to us and assist us in selling to these prospects.
The network includes consulting firms, other technology vendors, systems integrators and partners in markets where we do not have a large direct sales presence. In return, we typically pay these partners a fee based on the first-year subscription revenue generated by the customers they refer. We expense these fees at the time the customer signs the subscription service contract.
We also continue to develop distribution channels for our subscription service.
Marketing
Our marketing strategy is to continually elevate our brand and generate significant demand for our offerings. We use a variety of marketing programs to target our prospective and current customers, partners, and developers.
Our primary marketing activities include:
| • | press and industry analyst relations to garner third-party validation and generate positive coverage for our company and product strategy; |
| • | user conferences and launch events, as well as participation in trade shows and industry events, to create customer awareness and prospect enthusiasm; |
| • | search engine marketing and advertising to drive traffic to our Web properties; |
| • | Web site development to engage and educate prospects and generate interest through product information and demonstrations, free trials, case studies, white papers, and marketing collateral; |
| • | use of social network solutions such as YouTube; |
| • | email, direct mail, and phone campaigns to capture leads that can be funneled into our sales organization; |
| • | use of customer testimonials; and |
| • | sales tools and field marketing events to enable our sales organization to more effectively convert pipeline into completed transactions. |
10
Customer Service and Support
Our global customer support group responds to both business and technical inquires from our customers relating to how to use our products and is available to customers by the web, telephone and email.
Basic customer support during business hours is available at no charge to customers who purchase any of our paying editions. Premier customer support includes extended availability and additional services, such as an assigned support representative and/or administrator. Premier customer support is available for a separate fee, or is included in our Unlimited Edition. Additional support services include developer support and partner support.
Seasonality
Our fourth quarter has historically been our strongest quarter for new business. For a more detailed discussion, see the "Seasonal Nature of Deferred Revenue and Accounts Receivable" discussion in Management's Discussion and Analysis.
Competition
The market for enterprise CRM business applications and development platforms is highly competitive, rapidly evolving and fragmented, and subject to changing technology, shifting customer needs and frequent introductions of new products and services. Many prospective customers have invested substantial personnel and financial resources to implement and integrate traditional enterprise software into their businesses, and therefore may be reluctant or unwilling to migrate to an enterprise cloud computing application service. Additionally, third party developers may be reluctant to build application services on our platform since they have invested significantly in other competing technology products.
We compete primarily with vendors of packaged CRM software and companies offering on-demand CRM applications. We also compete with internally developed applications and face, or expect to face, competition from enterprise software vendors and online service providers who may develop toolsets and products that allow customers to build new applications that run on the customers' current infrastructure or as hosted services. Our current principal competitors include:
| • | enterprise software application vendors; |
| • | on-demand CRM application service providers; |
| • | enterprise software application service providers; |
| • | traditional platform development environment companies; and |
| • | cloud computing development platform companies. |
We believe that as enterprise software application and platform vendors shift more of their focus to cloud computing, they will be a greater competitive threat.
We believe the principal competitive factors in our market include the following:
| • | proven track record of customer success; |
| • | speed and ease of implementation; |
| • | product functionality; |
| • | financial stability and viability of the vendor; |
| • | product adoption; |
| • | ease of use and rates of user adoption; |
11
| • | low total cost of ownership and demonstrable cost-effective benefits for customers; |
| • | performance, security, scalability, flexibility and reliability of the service; |
| • | ease of integration with existing applications; |
| • | quality of customer support; |
| • | availability and quality of implementation, consulting and training services; and |
| • | vendor reputation and brand awareness. |
Intellectual Property
We rely on a combination of trademark, copyright, trade secret and patent laws in the United States and other jurisdictions as well as confidentiality procedures and contractual provisions to protect our proprietary technology and our brand. We also enter into confidentiality and proprietary rights agreements with our employees, consultants and other third parties and control access to software, documentation and other proprietary information.
As of January 31, 2011, we have a number of issued U.S. patents and hundreds of pending U.S. and international patent applications. We have received in the past, and may receive in the future, communications from third parties claiming that we have infringed the intellectual property rights of others. The cost to defend or settle these claims could be material to the net income or cash flows or both of a particular quarter. The outcome of any litigation is inherently uncertain. Any intellectual property claims, with or without merit, could be time-consuming and expensive to resolve, could divert management attention from executing our business plan and could require us to change our technology, change our business practices and/or pay monetary damages or enter into short- or long-term royalty or licensing agreements which may not be available in the future at the same terms or at all. In addition, many of our subscription agreements require us to indemnify our customers for third-party intellectual property infringement claims, which would increase the cost to us of an adverse ruling on such a claim. Any adverse determination related to intellectual property claims or litigation could prevent us from offering our service to others, or could otherwise adversely affect our operating results or cash flows or both in a particular quarter.
Employees
As of January 31, 2011, we had 5,306 employees. None of our employees is represented by a labor union.
Available Information
You can obtain copies of our Form 10-K, Quarterly Reports on Form 10-Q, Current Reports on Form 8-K, and other filings with the SEC, and all amendments to these filings, free of charge from our Web site at http://www.salesforce.com/company/investor/sec-filings/ as soon as reasonably practicable following our filing of any of these reports with the SEC. You can also obtain copies free of charge by contacting our Investor Relations department at our office address listed above.
12
| ITEM 1A. | RISK FACTORS |
The risks and uncertainties described below are not the only ones facing us. Other events that we do not currently anticipate or that we currently deem immaterial also may affect our results of operations, cash flows and financial condition.
Risks Related to Our Business and Industry
Defects or disruptions in our service could diminish demand for our service and subject us to substantial liability.
Because our service is complex and we have incorporated a variety of new computer hardware and software which is developed in-house and acquired from third party vendors, our service may have errors or defects that users identify after they begin using it that could result in unanticipated downtime for our subscribers and harm our reputation and our business. Internet-based services frequently contain undetected errors when first introduced or when new versions or enhancements are released. We have from time to time found defects in our service and new errors in our existing service may be detected in the future. In addition, our customers may use our service in unanticipated ways that may cause a disruption in service for other customers attempting to access their data. Since our customers use our service for important aspects of their business, any errors, defects, disruptions in service or other performance problems with our service could hurt our reputation and may damage our customers' businesses. If that occurs, customers could elect not to renew, or delay or withhold payment to us, we could lose future sales or customers may make warranty or other claims against us, which could result in an increase in our provision for doubtful accounts, an increase in collection cycles for accounts receivable or the expense and risk of litigation.
Interruptions or delays in service from our third-party data center hosting facilities could impair the delivery of our service and harm our business.
We currently serve our customers from third-party data center hosting facilities located in the United States and Singapore. Any damage to, or failure of, our systems generally could result in interruptions in our service. As we continue to add data centers and add capacity in our existing data centers, we may move or transfer our data and our customers' data. Despite precautions taken during this process, any unsuccessful data transfers may impair the delivery of our service. Further, any damage to, or failure of, our systems generally could result in interruptions in our service. Interruptions in our service may reduce our revenue, cause us to issue credits or pay penalties, cause customers to terminate their subscriptions and adversely affect our renewal rates and our ability to attract new customers. Our business will also be harmed if our customers and potential customers believe our service is unreliable.
As part of our current disaster recovery arrangements, our production environment and all of our customers' data is currently replicated in near real-time in a facility located on the east coast of the United States. Companies and products added through acquisition may be temporarily served through alternate facilities. We do not control the operation of any of these facilities, and they are vulnerable to damage or interruption from earthquakes, floods, fires, power loss, telecommunications failures and similar events. They may also be subject to break-ins, sabotage, intentional acts of vandalism and similar misconduct. Despite precautions taken at these facilities, the occurrence of a natural disaster or an act of terrorism, a decision to close the facilities without adequate notice or other unanticipated problems at these facilities could result in lengthy interruptions in our service. Even with the disaster recovery arrangements, our service could be interrupted.
If our security measures are breached and unauthorized access is obtained to a customer's data or our data or our information technology systems, our service may be perceived as not being secure, customers may curtail or stop using our service and we may incur significant legal and financial exposure and liabilities.
Our service involves the storage and transmission of customers' proprietary information, and security breaches could expose us to a risk of loss of this information, litigation and possible liability. These security
13
measures may be breached as a result of third-party action, including intentional misconduct by computer hackers, employee error, malfeasance or otherwise, during transfer of data to additional data centers or at any time, and result in someone obtaining unauthorized access to our customers' data or our data, including our intellectual property and other confidential business information, or our information technology systems. Additionally, third parties may attempt to fraudulently induce employees or customers into disclosing sensitive information such as user names, passwords or other information in order to gain access to our customers' data or our data, including our intellectual property and other confidential business information, or our information technology systems. Because the techniques used to obtain unauthorized access, or to sabotage systems, change frequently and generally are not recognized until launched against a target, we may be unable to anticipate these techniques or to implement adequate preventative measures. In addition, our customers may authorize third party technology providers, whose applications are available through our AppExchange directory, to access their customer data. Because we do not control the transmissions between our customers and third-party AppExchange technology providers, or the processing of such data by third-party AppExchange technology providers, we cannot ensure the complete integrity or security of such transmissions or processing. Any security breach could result in a loss of confidence in the security of our service, damage our reputation, disrupt our business, lead to legal liability and negatively impact our future sales.
Because we recognize revenue from subscriptions for our service over the term of the subscription, downturns or upturns in sales may not be immediately reflected in our operating results.
We generally recognize revenue from customers ratably over the terms of their subscription agreements, which are typically 12 to 24 months, although terms can range from one to 60 months. As a result, most of the revenue we report in each quarter is derived from the recognition of deferred revenue relating to subscription agreements entered into during previous quarters. Consequently, a decline in new or renewed subscriptions in any one quarter may not be immediately reflected in our revenue results for that quarter. Such a decline, however, will negatively affect our revenue in future quarters. Accordingly, the effect of significant downturns in sales and market acceptance of our service, and potential changes in our rate of renewals may not be fully reflected in our results of operations until future periods. Our subscription model also makes it difficult for us to rapidly increase our revenue through additional sales in any period, as revenue from new customers must be recognized over the applicable subscription term. In addition, we may be unable to adjust our cost structure to reflect the changes in revenues.
We cannot accurately predict subscription renewal or upgrade rates and the impact these rates may have on our future revenue and operating results.
Our customers have no obligation to renew their subscriptions for our service after the expiration of their initial subscription period, which is typically 12 to 24 months, and in fact, some customers have elected not to renew. In addition, our customers may renew for fewer subscriptions, renew for shorter contract lengths, or renew for lower cost editions of our service. We cannot accurately predict renewal rates, particularly for our enterprise customers who purchase a large number of subscriptions under multiyear contracts and for our small and medium size business customers. Our renewal rates may decline or fluctuate as a result of a number of factors, including customer dissatisfaction with our service, customers' ability to continue their operations and spending levels, decreases in the number of users at our customers and deteriorating general economic conditions. If our customers do not renew their subscriptions for our service or reduce the number of paying subscriptions at the time of renewal, our revenue will decline and our business will suffer.
Our future success also depends in part on our ability to sell additional features and services, more subscriptions or enhanced editions of our service to our current customers. This may also require increasingly sophisticated and costly sales efforts that are targeted at senior management. Similarly, the rate at which our customers purchase new or enhanced services depends on a number of factors, including general economic conditions. If our efforts to upsell to our customers are not successful, our business may suffer.
14
If we experience significant fluctuations in our rate of anticipated growth and fail to balance our expenses with our revenue forecasts, our results could be harmed.
Due to our evolving business model and the unpredictability of future general economic and financial market conditions, we may not be able to accurately forecast our rate of growth. We plan our expense levels and investment on estimates of future revenue and future anticipated rate of growth. We may not be able to adjust our spending quickly enough if the addition of new subscriptions or the renewal rate for existing subscriptions falls short of our expectations.
As a result, we expect that our revenues, operating results and cash flows may fluctuate significantly on a quarterly basis. Our recent revenue growth rates may not be sustainable and may decline in the future. We believe that period-to-period comparisons of our revenues, operating results and cash flows may not be meaningful and should not be relied upon as an indication of future performance.
We have been and may in the future be sued by third parties for alleged infringement of their proprietary rights.
The software and Internet industries are characterized by the existence of a large number of patents, trademarks and copyrights and by frequent litigation based on allegations of infringement or other violations of intellectual property rights. We have received in the past and may receive in the future communications from third parties claiming that we have infringed the intellectual property rights of others. In addition we have been, and may in the future be, sued by third parties for alleged infringement of their proprietary rights. Our technologies may be subject to injunction if they are held to infringe the rights of a third party or we may be required to pay damages or both.
The outcome of any litigation, regardless of its merits, is inherently uncertain. Any intellectual property claims and lawsuits could be time-consuming and expensive to resolve, divert management attention from executing our business plan and require us to change our technology, change our business practices and/or pay monetary damages or enter into short- or long-term royalty or licensing agreements.
Many of our subscription agreements require us to indemnify our customers for third-party intellectual property infringement claims, which would increase the cost to us of an adverse ruling on such a claim. Any adverse determination related to intellectual property claims or litigation could prevent us from offering our service to others, could be material to our net income or cash flows (or both) or could otherwise adversely affect our operating results.
Our exposure to risks associated with the use of intellectual property may be increased as a result of acquisitions, as we have a lower level of visibility into the development process with respect to such technology or the care taken to safeguard against infringement risks. In addition, third parties may make infringement and similar or related claims after we have acquired technology that had not been asserted prior to our acquisition.
Our quarterly results can fluctuate and our stock price and the value of your investment could decline substantially.
Our quarterly operating results are likely to fluctuate. For example, our fourth quarter has historically been our strongest quarter for new business and renewals. The year-over-year compounding effect of this seasonality in billing patterns and overall new business and renewal activity causes the value of invoices that we generate in the fourth quarter to continually increase in proportion to our billings in the other three quarters of our fiscal year.
Additionally, some of the important factors that may cause our revenues, operating results and cash flows to fluctuate from quarter to quarter include:
| • | our ability to retain and increase sales to existing customers, attract new customers and satisfy our customers' requirements; |
15
| • | the renewal rates for our service; |
| • | the amount and timing of operating costs and capital expenditures related to the operations and expansion of our business; |
| • | the number of new employees added; |
| • | changes in our pricing policies whether initiated by us or as a result of intense competition; |
| • | the cost, timing and management effort for the introduction of new features to our service; |
| • | the rate of expansion and productivity of our sales force; |
| • | the length of the sales cycle for our service; |
| • | new product and service introductions by our competitors; |
| • | our success in selling our service to large enterprises; |
| • | variations in the revenue mix of editions of our service; |
| • | technical difficulties or interruptions in our service; |
| • | expenses related to developing our new global headquarters and increasing our data center capacity and expanding our data centers domestically and internationally; |
| • | changes in foreign currency exchange rates; |
| • | changes in interest rates and our mix of investments, which would impact our return on our investments in cash and marketable securities; |
| • | conditions, particularly sudden changes, in the financial markets have and may continue to impact the value of and access to our investment portfolio; |
| • | changes in the effective tax rates; |
| • | general economic conditions that may adversely affect either our customers' ability or willingness to purchase additional subscriptions or upgrade their service, or delay a prospective customers' purchasing decision, or reduce the value of new subscription contracts, or affect renewal rates; |
| • | timing of additional investments in our enterprise cloud computing application and platform services and in our consulting service; |
| • | changes in deferred revenue balances due to the seasonal nature of our customer invoicing, changes in the average duration of our invoices, rate of renewals and the rate of new business growth; |
| • | regulatory compliance costs; |
| • | the timing of customer payments and payment defaults by customers; |
| • | costs associated with acquisitions of companies and technologies; |
| • | extraordinary expenses such as litigation or other dispute-related settlement payments; |
| • | the impact of new accounting pronouncements; and |
| • | the timing of stock awards to employees and the related adverse financial statement impact of having to expense those stock awards ratably over their vesting schedules. |
Many of these factors are outside of our control, and the occurrence of one or more of them might cause our operating results to vary widely. As such, we believe that quarter-to-quarter comparisons of our revenues, operating results and cash flows may not be meaningful and should not be relied upon as an indication of future performance.
16
Additionally, we may fail to meet or exceed the expectations of securities analysts and investors, and the market price of our common stock could decline. If one or more of the securities analysts who cover us change their recommendation regarding our stock adversely, the market price of our common stock could decline. Moreover, our stock price may be based on expectations, estimates or forecasts of our future performance that may be unrealistic or that may not be met. Further, our stock price may be affected by financial media, including television, radio and press reports and blogs.
Weakened global economic conditions may adversely affect our industry, business and results of operations.
Our overall performance depends in part on worldwide economic conditions. The United States and other key international economies have experienced in the past a downturn in which economic activity was impacted by falling demand for a variety of goods and services, restricted credit, poor liquidity, reduced corporate profitability, volatility in credit, equity and foreign exchange markets, bankruptcies and overall uncertainty with respect to the economy. These conditions affect the rate of information technology spending and could adversely affect our customers' ability or willingness to purchase our enterprise cloud computing services, delay prospective customers' purchasing decisions, reduce the value or duration of their subscription contracts, or affect renewal rates, all of which could adversely affect our operating results.
As we acquire companies or technologies, they could prove difficult to integrate, disrupt our business, dilute stockholder value and adversely affect our operating results and the value of your investment.
As part of our business strategy, we periodically make investments in, or acquisitions of, complementary businesses, joint ventures, services and technologies, and we expect that we will continue to make such investments and acquisitions in the future. Acquisitions and investments involve numerous risks, including:
| • | the potential failure to achieve the expected benefits of the combination or acquisition; |
| • | difficulties in and the cost of integrating operations, technologies, services and personnel; |
| • | diversion of financial and managerial resources from existing operations; |
| • | risk of entering new markets in which we have little or no experience or where competitors may have stronger market positions; |
| • | potential write-offs of acquired assets or investments; |
| • | potential loss of key employees; |
| • | inability to generate sufficient revenue to offset acquisition or investment costs; |
| • | the inability to maintain relationships with customers and partners of the acquired business; |
| • | the difficulty of incorporating acquired technology and rights into our products and services and of maintaining quality standards consistent with our brand; |
| • | potential unknown liabilities associated with the acquired businesses; |
| • | unanticipated expenses related to acquired technology and its integration into existing technology; |
| • | negative impact to our results of operations because of the depreciation and amortization of amounts related to acquired intangible assets, fixed assets and deferred compensation, and the loss of acquired deferred revenue; |
| • | delays in customer purchases due to uncertainty related to any acquisition; |
| • | the need to implement controls, procedures and policies appropriate for a public company at companies that prior to the acquisition lacked such controls, procedures and policies; and |
| • | challenges caused by distance, language and cultural differences. |
17
In addition, if we finance acquisitions by issuing equity or convertible debt securities, our existing stockholders may be diluted which could affect the market price of our common stock. Further, if we fail to properly evaluate and execute acquisitions or investments, our business and prospects may be seriously harmed and the value of your investment may decline.
We rely on third-party computer hardware and software that may be difficult to replace or which could cause errors or failures of our service.
We rely on computer hardware purchased or leased and software licensed from third parties in order to offer our service, including database software from Oracle Corporation. This hardware and software may not continue to be available at reasonable prices or on commercially reasonable terms, or at all. Any loss of the right to use any of this hardware or software could significantly increase our expenses and otherwise result in delays in the provisioning of our service until equivalent technology is either developed by us, or, if available, is identified, obtained and integrated. Any errors or defects in third-party hardware or software could result in errors or a failure of our service which could harm our business.
If the market for our technology delivery model and enterprise cloud computing services develops more slowly than we expect, our business could be harmed.
The market for enterprise cloud computing application services is not as mature as the market for packaged enterprise software, and it is uncertain whether these services will achieve and sustain high levels of demand and market acceptance. Our success will depend to a substantial extent on the willingness of enterprises, large and small, to increase their use of enterprise cloud computing application services in general, and for CRM in particular. Many enterprises have invested substantial personnel and financial resources to integrate traditional enterprise software into their businesses, and therefore may be reluctant or unwilling to migrate to an enterprise cloud computing application service. Furthermore, some enterprises may be reluctant or unwilling to use enterprise cloud computing application services because they have concerns regarding the risks associated with security capabilities, among other things, of the technology delivery model associated with these services. If enterprises do not perceive the benefits of enterprise cloud computing application services, then the market for these services may not develop at all, or it may develop more slowly than we expect, either of which would significantly adversely affect our operating results. In addition, we may make errors in predicting and reacting to relevant business trends, which could harm our business. Our success also depends on the willingness of third-party developers to build applications that are complementary to our service. Without the development of these applications, both current and potential customers may not find our service sufficiently attractive. In addition, for those customers who authorize third-party technology partner access to their data, we do not warrant the functionality, security and integrity of the data transmission or processing. Despite contract provisions to protect us, customers may look to us to support and warrant the third-party applications, which may expose us to potential claims, liabilities and obligations for applications we did not develop or sell.
The market in which we participate is intensely competitive, and if we do not compete effectively, our operating results could be harmed.
The market for enterprise CRM business applications and development platforms is highly competitive, rapidly evolving and fragmented, and subject to changing technology, shifting customer needs and frequent introductions of new products and services. We compete primarily with vendors of packaged CRM software and companies offering on-demand CRM applications. We also compete with internally developed applications and face, or expect to face, competition from enterprise software vendors and online service providers who may develop toolsets and products that allow customers to build new applications that run on the customers' current infrastructure or as hosted services. Our current competitors include:
| • | enterprise software application vendors; |
| • | on-demand CRM application service providers; |
18
| • | enterprise software application service providers; |
| • | traditional platform development environment companies; and |
| • | cloud computing development platform companies. |
Many of our current and potential competitors enjoy substantial competitive advantages, such as greater name recognition, longer operating histories and larger marketing budgets, as well as substantially greater financial, technical and other resources. In addition, many of our current and potential competitors have established marketing relationships and access to larger customer bases, and have major distribution agreements with consultants, system integrators and resellers.
As a result, our competitors may be able to respond more quickly and effectively than we can to new or changing opportunities, technologies, standards or customer requirements. Furthermore, because of these advantages, even if our service is more effective than the products that our competitors offer, potential customers might accept competitive products and services in lieu of purchasing our service. For all of these reasons, we may not be able to compete successfully against our current and future competitors.
Our efforts to expand our service beyond the CRM market and to develop our existing service in order to keep pace with technological developments may not succeed and may reduce our revenue growth rate and/or harm our business.
We derive substantially all of our revenue from subscriptions to our CRM enterprise cloud computing application service, and we expect this will continue for the foreseeable future. The market for our Force.com cloud computing platform is relatively new and it is uncertain whether our efforts will ever result in significant revenue for us. Further, the introduction of new services beyond the CRM market may not be successful, and early stage interest and adoption of such new services may not result in long term success or significant revenue for us. Our efforts to expand our service beyond the CRM market may not succeed and may reduce our revenue growth rate.
Additionally, if we are unable to develop enhancements to and new features for our existing service or new services that keep pace with rapid technological developments, our business will be harmed. The success of enhancements, new features and services depends on several factors, including the timely completion, introduction and market acceptance of the feature or edition. Failure in this regard may significantly impair our revenue growth. In addition, because our service is designed to operate on a variety of network hardware and software platforms using a standard browser, we will need to continuously modify and enhance our service to keep pace with changes in Internet-related hardware, software, communication, browser and database technologies. We may not be successful in either developing these modifications and enhancements or in timely bringing them to market. Furthermore, uncertainties about the timing and nature of new network platforms or technologies, or modifications to existing platforms or technologies, could increase our research and development or service delivery expenses. Any failure of our service to operate effectively with future network platforms and technologies could reduce the demand for our service, result in customer dissatisfaction and harm our business.
Supporting our existing and growing customer base could strain our personnel resources and infrastructure, and if we are unable to scale our operations and increase productivity, we may not be able to successfully implement our business plan.
We continue to experience significant growth in our customer base, which has placed a strain on our management, administrative, operational and financial infrastructure. We anticipate that additional investments in our infrastructure and research and development spending will be required to scale our operations and increase productivity, to address the needs of our customers, to further develop and enhance our service, and to expand into new geographic areas.
19
Our success will depend in part upon the ability of our senior management to manage our projected growth effectively. To do so, we must continue to increase the productivity of our existing employees and to hire, train and manage new employees as needed. To manage the expected domestic and international growth of our operations and personnel, we will need to continue to improve our operational, financial and management controls and our reporting systems and procedures. The additional investments we are making will increase our cost base, which will make it more difficult for us to offset any future revenue shortfalls by reducing expenses in the short term. If we fail to successfully scale our operations and increase productivity, we will be unable to execute our business plan.
As more of our sales efforts are targeted at larger enterprise customers, our sales cycle may become more time-consuming and expensive, we may encounter pricing pressure and implementation and customization challenges, and we may have to delay revenue recognition for some complex transactions, all of which could harm our business and operating results.
As we target more of our sales efforts at larger enterprise customers, we will face greater costs, longer sales cycles and less predictability in completing some of our sales. In this market segment, the customer's decision to use our service may be an enterprise-wide decision and, if so, these types of sales would require us to provide greater levels of education regarding the use and benefits of our service, as well as education regarding privacy and data protection laws and regulations to prospective customers with international operations. In addition, larger customers may demand more customization, integration services and features. As a result of these factors, these sales opportunities may require us to devote greater sales support and professional services resources to individual customers, driving up costs and time required to complete sales and diverting our own sales and professional services resources to a smaller number of larger transactions, while potentially requiring us to delay revenue recognition on some of these transactions until the technical or implementation requirements have been met.
Professional services may also be performed by a third party or a combination of our own staff and a third party. Our strategy is to work with third parties to increase the breadth of capability and depth of capacity for delivery of these services to our customers. If a customer is not satisfied with the quality of work performed by us or a third party or with the type of services or solutions delivered, then we could incur additional costs to address the situation, the profitability of that work might be impaired, and the customer's dissatisfaction with our services could damage our ability to obtain additional work from that customer. In addition, negative publicity related to our customer relationships, regardless of its accuracy, may further damage our business by affecting our ability to compete for new business with current and prospective customers.
Periodic changes of our sales organization can be disruptive and may negatively impact our revenues.
We periodically change and make adjustments to our sales organization in response to market opportunities, competitive threats, management changes, product introductions or enhancements, acquisitions, sales performance, increases in sales headcount, cost levels, and other internal and external considerations. In the past, these changes sometimes resulted in a temporary lack of focus and reduced productivity; these effects could recur in connection with any future sales changes we might undertake and our rate of revenue growth could be negatively affected. In addition, any significant change to the way we structure our compensation of our sales organization may be disruptive and may affect our revenue growth.
Any failure to protect our intellectual property rights could impair our ability to protect our proprietary technology and our brand.
If we fail to protect our intellectual property rights adequately, our competitors might gain access to our technology, and our business might be harmed. In addition, defending our intellectual property rights might entail significant expense. Any of our trademarks or other intellectual property rights may be challenged by others or invalidated through administrative process or litigation. While we have some U.S. patents and many
20
U.S. and international patent applications pending, we may be unable to obtain patent protection for the technology covered in our patent applications. In addition, our existing patents and any patents issued in the future may not provide us with competitive advantages, or may be successfully challenged by third parties. Furthermore, legal standards relating to the validity, enforceability and scope of protection of intellectual property rights are uncertain. Effective patent, trademark, copyright and trade secret protection may not be available to us in every country in which our service is available. The laws of some foreign countries may not be as protective of intellectual property rights as those in the U.S., and mechanisms for enforcement of intellectual property rights may be inadequate. Accordingly, despite our efforts, we may be unable to prevent third parties from infringing upon or misappropriating our intellectual property.
We might be required to spend significant resources to monitor and protect our intellectual property rights. We may initiate claims or litigation against third parties for infringement of our proprietary rights or to establish the validity of our proprietary rights. Any litigation, whether or not it is resolved in our favor, could result in significant expense to us and divert the efforts of our technical and management personnel.
If we fail to develop our brands, our business may suffer.
We believe that developing and maintaining awareness of the salesforce.com brand and our other brands is critical to achieving widespread acceptance of our existing and future services and is an important element in attracting new customers. In the past, our efforts to build our brands have involved significant expense. Brand promotion activities may not yield increased revenue, and even if they do, any increased revenue may not offset the expenses we incurred in building our brands. If we fail to successfully promote and maintain our brands, or incur substantial expenses in an unsuccessful attempt to promote and maintain our brands, we may fail to attract enough new customers or retain our existing customers to the extent necessary to realize a sufficient return on our brand-building efforts, and our business could suffer.
We may not realize the anticipated benefits in connection with our purchase of undeveloped land in San Francisco where we plan to develop our global headquarters. If we do not realize these benefits, our financial performance will be negatively impacted.
In November 2010, we purchased approximately 14 acres of undeveloped real estate in San Francisco, California, including entitlements and improvements associated with the land, which we plan to develop into our global headquarters. We may not realize the anticipated benefits with respect to the purchase and future development of such real estate. We have devoted significant capital resources to the purchase, and we will be required to devote substantial additional resources in the future to building our global headquarters on such land, which may impact our liquidity and financial flexibility. We may not be able to obtain financing for development projects on favorable terms, or at all, or complete construction on schedule or within budget. Any delay or lack of available financing could result in increased constructions costs and debt costs to fund such construction and development. In addition, our development efforts will otherwise be subject to various operational risks. We may not be able to obtain, or may experience delays in obtaining, all necessary zoning, land-use, building, occupancy and other governmental permits and authorizations. The construction costs and total investment amounts may exceed any estimates that we formulate, and projects may not be completed, or delivered as planned. Finally, real estate assets are not as liquid as certain other types of assets. In the event that we have a future need to sell this property, we may not be able to do so on favorable terms or at all.
Sales to customers outside the United States expose us to risks inherent in international sales.
Because we sell our service throughout the world, we are subject to risks and challenges that we would otherwise not face if we conducted our business only in the United States. For example, sales in Europe and Asia Pacific together represented approximately 30 percent of our total revenues for the year ended January 31, 2011, and we intend to continue to expand our international sales efforts. The risks and challenges associated with sales to customers outside the United States include:
21
| • | localization of our service, including translation into foreign languages and associated expenses; |
| • | laws and business practices favoring local competitors; |
| • | compliance with multiple, conflicting and changing governmental laws and regulations, including employment, tax, privacy and data protection laws and regulations; |
| • | treatment of revenue from international sources and changes to tax codes, including being subject to foreign tax laws and being liable for paying withholding income or other taxes in foreign jurisdictions; |
| • | regional data privacy laws that apply to the transmission of our customers' data across international borders; |
| • | foreign currency fluctuations and controls; |
| • | different pricing environments; |
| • | difficulties in staffing and managing foreign operations; |
| • | different or lesser protection of our intellectual property; |
| • | longer accounts receivable payment cycles and other collection difficulties; |
| • | regional economic conditions; and |
| • | regional political conditions. |
Any of these factors could negatively impact our business and results of operations.
Additionally, our international subscription fees are paid either in U.S. dollars or local currency. As a result, fluctuations in the value of the U.S. dollar and foreign currencies may make our service more expensive for international customers, which could harm our business.
From time to time, we may become defendants in legal proceedings about which we are unable to assess our exposure and which could become significant liabilities upon judgment.
We may become defendants in legal proceedings from time to time. Companies in our industry have been subject to claims related to patent infringement and product liability, as well as contract and employment-related claims. We may not be able to accurately assess the risk related to these suits, and we may be unable to accurately assess our level of exposure.
Privacy concerns and laws, evolving regulation of the Internet and other domestic or foreign regulations may reduce the effectiveness of our solution and adversely affect our business.
As Internet commerce continues to evolve, increasing regulation by federal, state or foreign agencies becomes more likely. For example, we believe increased regulation is likely in the area of data privacy, and laws and regulations applying to the solicitation, collection, processing or use of personal or consumer information could affect our customers' ability to use and share data, potentially reducing demand for CRM solutions and restricting our ability to store, process and share data with our customers.
Our customers can use our service to store contact and other personal or identifying information regarding their customers and contacts. Federal, state and foreign government bodies and agencies have adopted or are considering adopting laws and regulations regarding the collection, use and disclosure of personal information obtained from consumers and individuals. The costs of compliance with, and other burdens imposed by, such laws and regulations that are applicable to the businesses of our customers may limit the use and adoption of our service and reduce overall demand for it, or lead to significant fines, penalties or liabilities for any noncompliance with such privacy laws. Furthermore, privacy concerns may cause our customers' customers to resist providing the personal data necessary to allow our customers to use our service effectively. Even the perception of privacy concerns, whether or not valid, may inhibit market adoption of our service in certain industries.
22
For example, in the United States regulations such as the Gramm-Leach-Bliley Act, which protects and restricts the use of consumer credit and financial information, and the Health Insurance Portability and Accountability Act of 1996, which regulates the use and disclosure of personal health information, impose significant requirements and obligations on businesses that may affect the use and adoption of our service. The European Union has also adopted a data privacy directive that requires member states to impose restrictions on the collection and use of personal data that, in some respects, are more stringent, and impose more significant burdens on subject businesses, than current privacy standards in the United States.
All of these domestic and international legislative and regulatory initiatives may adversely affect our customers' ability to collect and/or use demographic and personal information from their customers, which could reduce demand for our service. Many other jurisdictions have similar stringent privacy laws and regulations.
In addition to government activity, privacy advocacy groups and the technology and other industries are considering various new, additional or different self-regulatory standards that may place additional burdens on us. If the gathering of personal information were to be curtailed in this manner, CRM solutions would be less effective, which may reduce demand for our service and harm our business.
We may lose key members of our management team and development and operations personnel, or may be unable to attract and retain employees we need to support our operations and growth.
Our success depends substantially upon the continued services of our executive officers and other key members of management, particularly our Chief Executive Officer. From time to time, there may be changes in our executive management team resulting from the hiring or departure of executives. Such changes in our executive management team may be disruptive to our business. We are also substantially dependent on the continued service of our existing development and operations personnel because of the complexity of our service and technologies. We do not have employment agreements with any of our executive officers, key management, development or operations personnel and, therefore, they could terminate their employment with us at any time. The loss of one or more of our key employees or groups could seriously harm our business.
In the technology industry, there is substantial and continuous competition for engineers with high levels of experience in designing, developing and managing software and Internet-related services, as well as competition for sales executives and operations personnel. We may not be successful in attracting and retaining qualified personnel. We have from time to time experienced, and we expect to continue to experience, difficulty in hiring and retaining highly skilled employees with appropriate qualifications. If we fail to attract new personnel or fail to retain and motivate our current personnel, our business and future growth prospects could be severely harmed.
Unanticipated changes in our effective tax rate could adversely affect our future results.
We are subject to income taxes in the United States and various foreign jurisdictions, and our domestic and international tax liabilities are subject to the allocation of expenses in differing jurisdictions.
Our effective tax rate could be adversely affected by changes in the mix of earnings and losses in countries with differing statutory tax rates, certain non-deductible expenses as a result of acquisitions, the valuation of deferred tax assets and liabilities and changes in federal, state or international tax laws and accounting principles. Increases in our effective tax rate could materially affect our net results.
In addition, we are subject to income tax audits by many tax jurisdictions throughout the world. Although we believe our income tax liabilities are reasonably estimated and accounted for in accordance with applicable laws and principles, an adverse resolution of one or more uncertain tax positions in any period could have a material impact on the results of operations for that period.
23
Natural disasters and other events beyond our control could materially adversely affect us.
Natural disasters or other catastrophic events may cause damage or disruption to our operations, international commerce and the global economy, and thus could have a strong negative effect on us. Our business operations are subject to interruption by natural disasters, fire, power shortages, pandemics and other events beyond our control. Although we maintain crisis management and disaster response plans, such events could make it difficult or impossible for us to deliver our services to our customers, and could decrease demand for our services. The majority of our research and development activities, corporate headquarters, information technology systems, and other critical business operations, are located near major seismic faults in the San Francisco Bay Area. Because we do not carry earthquake insurance for direct quake-related losses, and significant recovery time could be required to resume operations, our financial condition and operating results could be materially adversely affected in the event of a major earthquake or catastrophic event.
Risks Relating to Ownership of Our Common Stock and our Convertible Senior Notes due 2015
The market price of our common stock is likely to be volatile and could subject us to litigation.
The trading prices of the securities of technology companies have been highly volatile. Accordingly, the market price of our common stock has been and is likely to continue to be subject to wide fluctuations. Factors affecting the market price of our common stock include:
| • | variations in our operating results, earnings per share, cash flows from operating activities, deferred revenue, and other financial metrics and non-financial metrics, and how those results compare to analyst expectations; |
| • | forward looking guidance to industry and financial analysts related to future revenue and earnings per share; |
| • | the net increases in the number of customers, either independently or as compared with published expectations of industry, financial or other analysts that cover our company; |
| • | changes in the estimates of our operating results or changes in recommendations by securities analysts that elect to follow our common stock; |
| • | announcements of technological innovations, new services or service enhancements, strategic alliances or significant agreements by us or by our competitors; |
| • | announcements by us or by our competitors of mergers or other strategic acquisitions, or rumors of such transactions involving us or our competitors; |
| • | announcements of customer additions and customer cancellations or delays in customer purchases; |
| • | recruitment or departure of key personnel; |
| • | disruptions in our service due to computer hardware, software or network problems; |
| • | the economy as a whole, market conditions in our industry, and the industries of our customers; |
| • | trading activity by a limited number of stockholders who together beneficially own a majority of our outstanding common stock; |
| • | the issuance of shares of common stock by us, whether in connection with an acquisition, a capital raising transaction or upon conversion of some or all of our outstanding $575.0 million of 0.75% convertible senior notes due January 15, 2015 (the "Notes"); and |
| • | any other factors discussed herein. |
In addition, if the market for technology stocks or the stock market in general experiences uneven investor confidence, the market price of our common stock could decline for reasons unrelated to our business, operating
24
results or financial condition. The market price of our common stock might also decline in reaction to events that affect other companies within, or outside, our industry even if these events do not directly affect us. Some companies that have experienced volatility in the trading price of their stock have been the subject of securities class action litigation. If we are the subject of such litigation, it could result in substantial costs and a diversion of management's attention and resources.
Provisions in our amended and restated certificate of incorporation and bylaws, Delaware law and our outstanding Notes might discourage, delay or prevent a change of control of our company or changes in our management and, therefore, depress the market price of our common stock.
Our amended and restated certificate of incorporation and bylaws contain provisions that could depress the market price of our common stock by acting to discourage, delay or prevent a change in control of our company or changes in our management that the stockholders of our company may deem advantageous. These provisions among other things:
| • | establish a classified board of directors so that not all members of our board are elected at one time; |
| • | permit the board of directors to establish the number of directors; |
| • | provide that directors may only be removed "for cause" and only with the approval of 66 2/3 percent of our stockholders; |
| • | require super-majority voting to amend some provisions in our amended and restated certificate of incorporation and bylaws; |
| • | authorize the issuance of "blank check" preferred stock that our board could use to implement a stockholder rights plan (also known as a "poison pill"); |
| • | eliminate the ability of our stockholders to call special meetings of stockholders; |
| • | prohibit stockholder action by written consent, which requires all stockholder actions to be taken at a meeting of our stockholders; |
| • | provide that the board of directors is expressly authorized to make, alter or repeal our bylaws; and |
| • | establish advance notice requirements for nominations for election to our board or for proposing matters that can be acted upon by stockholders at annual stockholder meetings. |
In addition, Section 203 of the Delaware General Corporation Law may discourage, delay or prevent a change in control of our company. Section 203 imposes certain restrictions on merger, business combinations and other transactions between us and holders of 15 percent or more of our common stock.
In addition, the fundamental change purchase rights applicable to our convertible notes, which will allow note holders to require us to purchase all or a portion of their Notes upon the occurrence of a fundamental change, and the provisions requiring an increase to the conversion rate for conversions in connection with a make-whole fundamental change may in certain circumstances delay or prevent a takeover of us and the removal of incumbent management that might otherwise be beneficial to investors.
Our debt service obligations may adversely affect our financial condition and cash flows from operations.
As a result of our sale of the Notes in January 2010, we have a higher level of debt compared to historical periods. Our maintenance of this indebtedness could have important consequences because:
| • | it may impair our ability to obtain additional financing in the future; |
| • | an increased portion of our cash flows from operations may have to be dedicated towards repaying the principal in 2015 or earlier if necessary; and |
25
| • | it may make us more vulnerable to downturns in our business, our industry or the economy in general. |
Our ability to meet our expenses and debt obligations will depend on our future performance, which will be affected by financial, business, economic, regulatory and other factors. We will not be able to control many of these factors, such as economic conditions and governmental regulations. Our operations may not generate sufficient cash to enable us to service our debt. If we fail to make a payment on our debt, we could be in default on such debt.
The trading price of the Notes may be significantly affected by the market price of our common stock, which may be volatile, the general level of interest rates and our credit quality.
Because the Notes are convertible into cash equal to the principal amount of the Notes, and at our election, cash and/or shares of the Company's common stock for any amounts in excess of the principal amounts, the market price of our common stock may significantly affect the trading price of the Notes. See " The market price of our common stock is likely to be volatile and could subject us to litigation " above.
In addition, the general level of interest rates and our credit quality may significantly affect the trading price of the Notes.
We also cannot predict whether interest rates will rise or fall. During the term of the Notes, interest rates will be influenced by a number of factors, most of which are beyond our control. However, if interest rates increase, the option value of the Notes' convertibility feature will increase, but the yield of the Notes will decrease, and if interest rates decrease, the option value of the Notes' convertibility feature will decrease, but the yield of the notes will increase.
In addition, our credit quality may vary substantially during the term of the Notes and will be influenced by a number of factors, including variations in our cash flows and the amount of indebtedness we have outstanding. Any decrease in our credit quality could negatively impact the trading price of the Notes.
The convertible note hedge and warrant transactions may affect the trading price of the Notes and the market price of our common stock.
We entered into privately negotiated convertible note hedge transactions with the hedge counterparties concurrently with the issuance of the Notes. We also entered into privately negotiated warrant transactions with the hedge counterparties. Taken together, the convertible note hedge transactions and the warrant transactions are expected, but not guaranteed, to reduce the potential dilution with respect to our common stock upon conversion of the Notes.
As the hedge counterparties and their respective affiliates modify their hedge positions from time to time by entering into or unwinding various over-the-counter derivative transactions with respect to our common stock, and/or by purchasing or selling shares of our common stock or the Notes in privately negotiated transactions and/or open market transactions, their activities could adversely affect the market price of our common stock and the trading price of the Notes.
In addition, the hedge counterparties are financial institutions or affiliates of financial institutions, and we will be subject to the risk that these hedge counterparties may default under the convertible note hedge transactions.
| ITEM 1B. | UNRESOLVED STAFF COMMENTS |
None.
26
| ITEM 2. | PROPERTIES |
Our executive offices and principal office for domestic marketing, sales, professional services and development occupy over 625,000 square feet in the San Francisco Bay Area under leases that expire at various times through July 2020. We also lease space in various locations throughout the United States for local sales and professional services personnel. Our foreign subsidiaries lease office space for their operations including local sales and professional services personnel. In November 2010, we purchased approximately 14 acres of undeveloped land in San Francisco, California including entitlements and improvements associated with the land, and perpetual parking rights in an existing garage. We plan to use the land to build a facility that will become our new global headquarters.
We believe that our existing facilities and offices are adequate to meet our current requirements. See Note 8, "Commitments," in the Notes to the Consolidated Financial Statements for more information about our lease commitments. If we require additional space, we believe that we will be able to obtain such space on acceptable, commercially reasonable terms.
| ITEM 3. | LEGAL PROCEEDINGS |
We are involved in various legal proceedings arising from the normal course of business activities, including claims of alleged infringement of third-party patents and other intellectual property rights, commercial, employment and other matters. We make a provision for a liability relating to legal proceedings when it is both probable that a liability has been incurred and the amount of the loss can be reasonably estimated. These provisions are reviewed at least quarterly and adjusted to reflect the impacts of negotiations, settlements, rulings, advice of legal counsel and other information and events pertaining to a particular case. In management's opinion, resolution of these matters is not expected to have a material adverse impact on our consolidated results of operations, cash flows or financial position. However, depending on the nature and timing of any such dispute, an unfavorable resolution of a matter could materially affect our future results of operations or cash flows or both.
Many of our subscription agreements require us to indemnify our customers for third-party intellectual property infringement claims, which could increase the cost to us of an adverse ruling on such a claim. Any adverse determination related to intellectual property claims or litigation could prevent us from offering our service to others, could be material to our net income or cash flows or both or could otherwise adversely affect our operating results.
| ITEM 4. | RESERVED |
| ITEM 4A. | EXECUTIVE OFFICERS OF THE REGISTRANT |
The following sets forth certain information regarding our current executive officers (in alphabetical order):
Name | Age | Position | ||||
Marc Benioff | 46 | Chairman of the Board of Directors and Chief Executive Officer | ||||
Parker Harris | 44 | Executive Vice President, Technology | ||||
George Hu | 36 | Executive Vice President, Platform and Marketing | ||||
David Schellhase | 47 | Executive Vice President, Legal | ||||
Graham Smith | 51 | Executive Vice President and Chief Financial Officer | ||||
Frank van Veenendaal | 51 | President, Worldwide Sales and Services | ||||
Marc Benioff co-founded salesforce.com in February 1999 and has served as Chairman of the Board of Directors since inception. He has served as Chief Executive Officer since November 2001. From 1986 to 1999, Mr. Benioff was employed at Oracle Corporation where he held a number of positions in sales, marketing and product development, lastly as a Senior Vice President. Mr. Benioff also serves as Chairman of the Board of
27
Directors of the salesforce.com/foundation. Mr. Benioff received a Bachelor of Science in Business Administration (B. S. B. A.) from the University of Southern California, where he recently joined the Board of Trustees.
Parker Harris co-founded salesforce.com in February 1999 and served in senior technical positions since inception. Since December 2004, Mr. Harris has served as our Executive Vice President, Technology. From October 1996 to February 1999, Mr. Harris was a Vice President at Left Coast Software, a Java consulting firm he co-founded. Mr. Harris received a B.A. from Middlebury College.
George Hu has served as our Executive Vice President, Platform and Marketing, since August 2010. Previously, Mr. Hu served as our Executive Vice President, Marketing and Alliances from February 2009 to August 2010, our Executive Vice President, Marketing, Applications and Education from December 2007 to February 2009, our Chief Marketing Officer from October 2006 through December 2007, our Senior Vice President and General Manager, Applications from January to October 2006 and our Vice President, Product Marketing from October 2004 to January 2006. Mr. Hu has also served in various management positions in marketing since joining salesforce.com in March 2002. Mr. Hu received an A.B. from Harvard College and an M.B.A. from Stanford University.
David Schellhase has served as our Executive Vice President, Legal since March 2010. Previously, Mr. Schellhase served as our Senior Vice President and General Counsel from December 2004 to March 2010 and as our Vice President and General Counsel from July 2002 to December 2004. From December 2000 to June 2002, Mr. Schellhase was an independent legal consultant and authored a treatise entitled Corporate Law Department Handbook. Previously, he served as General Counsel at Linuxcare, Inc., The Vantive Corporation and Premenos Technology Corp. Mr. Schellhase received a B.A. from Columbia University and a J.D. from Cornell University.
Graham Smith has served as our Executive Vice President and Chief Financial Officer since March 2008. Prior to that, Mr. Smith served as our Executive Vice President and Chief Financial Officer Designate from December 2007 to March 2008. Prior to salesforce.com, Mr. Smith was at Advent Software Inc. and served as its Chief Financial Officer from January 2003 to December 2007. In addition to Advent Software, he served as Chief Financial Officer of Vitria Technology and Nuance Communications, and also served at Oracle Corporation in various senior finance roles, lastly as Vice President of Finance for worldwide operations. Mr. Smith holds a B.Sc. from Bristol University in England and qualified as a member of the Institute of chartered accountants in England and Wales.
Frank van Veenendaal has served as our President, Worldwide Sales and Services since October 2009. Prior to this position, he was our Chief Sales Officer and President, Worldwide Sales from September 2008 to October 2009, our President, Global Corporate Sales and North American Operations from December 2007 to September 2008 and our President, Worldwide Corporate Sales and Services from February 2007 to December 2007. Since joining us in 2001, Mr. van Veenendaal has also served in various sales management positions, including Senior Vice President, North America Sales. From 1995 to 2001, Mr. van Veenendaal was Senior Vice President of Sales of Actuate Corporation, a software company. Mr. van Veenendaal received a B.S. from Rensselaer Polytechnic Institute.
28
PART II
| ITEM 5. | MARKET FOR REGISTRANT'S COMMON EQUITY, RELATED STOCKHOLDER MATTERS AND ISSUER PURCHASES OF EQUITY SECURITIES |
Market Information for Common Stock
Our common stock has been quoted on the New York Stock Exchange under the symbol "CRM."
The following table sets forth for the indicated periods the high and low closing sales prices of our common stock as reported by the New York Stock Exchange.
| High | Low | |||||||
Fiscal year ending January 31, 2011 | ||||||||
First quarter | $ | 88.70 | $ | 62.08 | ||||
Second quarter | $ | 100.07 | $ | 77.52 | ||||
Third quarter | $ | 123.14 | $ | 96.41 | ||||
Fourth quarter | $ | 150.58 | $ | 110.15 | ||||
Fiscal year ending January 31, 2010 | ||||||||
First quarter | $ | 42.81 | $ | 25.77 | ||||
Second quarter | $ | 45.13 | $ | 35.57 | ||||
Third quarter | $ | 63.49 | $ | 44.30 | ||||
Fourth quarter | $ | 74.82 | $ | 57.81 | ||||
Dividend Policy
We have never paid any cash dividends on our common stock. Our board of directors currently intends to retain any future earnings to support operations and to finance the growth and development of our business and does not intend to pay cash dividends on our common stock for the foreseeable future. Any future determination related to our dividend policy will be made at the discretion of our board.
Stockholders
As of January 31, 2011 there were 123 registered stockholders of record of our common stock, including The Depository Trust Company, which holds shares of salesforce.com common stock on behalf of an indeterminate number of beneficial owners.
Securities Authorized for Issuance under Equity Compensation Plans
The information concerning our equity compensation plans is incorporated by reference herein to the section of the Proxy Statement entitled "Equity Compensation Plan Information."
Issued Warrants
During fiscal 2010 we issued 6.7 million warrants to purchase our common stock, as described in Note 2 "Balance Sheet Accounts" of the consolidated financial statements.
Stock Performance Graph
The following shall not be deemed incorporated by reference into any of our other filings under the Securities Exchange Act of 1934, as amended, or the Securities Act of 1933, as amended, except to the extent we specifically incorporate it by reference into such filing.
29
The graph below compares the cumulative total stockholder return on our common stock with the cumulative total return on the Standard & Poor's 500 Index and the Nasdaq Computer & Data Processing Index for the period beginning on June 23, 2004 (the date our common stock commenced trading on the New York Stock Exchange) through January 31, 2011, assuming an initial investment of $100. Data for the Standard & Poor's 500 Index and the Nasdaq Computer & Data Processing Index assume reinvestment of dividends.
The comparisons in the graph below are based upon historical data and are not indicative of, nor intended to forecast, future performance of our common stock.
Comparison of Cumulative Total Return of salesforce.com, inc.
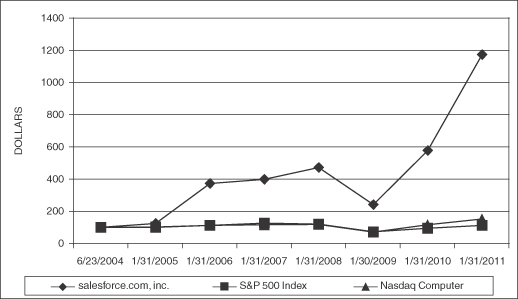
| 6 /23/2004 | 1/31/2005 | 1/31/2006 | 1/31/2007 | 1/31/2008 | 1/31/2009 | 1/31/2010 | 1/31/2011 | |||||||||||||||||||||||||
salesforce.com | 100.00 | 124.55 | 373.18 | 398.45 | 471.91 | 241.91 | 577.73 | 1,174.00 | ||||||||||||||||||||||||
S&P 500 Index | 100.00 | 103.25 | 111.89 | 125.71 | 120.50 | 72.19 | 93.86 | 112.42 | ||||||||||||||||||||||||
Nasdaq Computer & Data Processing Index | 100.00 | 100.45 | 111.93 | 116.62 | 117.84 | 71.02 | 116.00 | 153.34 | ||||||||||||||||||||||||
Recent Sales of Unregistered Securities
None
30
| ITEM 6. | SELECTED FINANCIAL DATA |
The following selected consolidated financial data should be read in conjunction with our audited consolidated financial statements and related notes thereto and with Management's Discussion and Analysis of Financial Condition and Results of Operation, which are included elsewhere in this Form 10-K. The consolidated statement of operations data for fiscal 2011, 2010, and 2009, and the selected consolidated balance sheet data as of January 31, 2011 and 2010 are derived from, and are qualified by reference to, the audited consolidated financial statements and are included in this Form 10-K. The consolidated statement of operations data for fiscal 2008 and 2007 and the consolidated balance sheet data as of January 31, 2009, 2008 and 2007 are derived from audited consolidated financial statements which are not included in this Form 10-K.
| (in thousands, except per share data) | Fiscal Year Ended January 31, | |||||||||||||||||||
| 2011 | 2010 | 2009(3) | 2008(3) | 2007(3) | ||||||||||||||||
Consolidated Statement of Operations: | ||||||||||||||||||||
Revenues: | ||||||||||||||||||||
Subscription and support | $ | 1,551,145 | $ | 1,209,472 | $ | 984,574 | $ | 680,581 | $ | 451,660 | ||||||||||
Professional services and other | 105,994 | 96,111 | 92,195 | 68,119 | 45,438 | |||||||||||||||
Total revenues | 1,657,139 | 1,305,583 | 1,076,769 | 748,700 | 497,098 | |||||||||||||||
Cost of revenues (1): | ||||||||||||||||||||
Subscription and support | 208,243 | 159,172 | 127,082 | 91,268 | 61,457 | |||||||||||||||
Professional services and other | 115,570 | 98,753 | 93,389 | 80,323 | 57,433 | |||||||||||||||
Total cost of revenues | 323,813 | 257,925 | 220,471 | 171,591 | 118,890 | |||||||||||||||
Gross profit | 1,333,326 | 1,047,658 | 856,298 | 577,109 | 378,208 | |||||||||||||||
Operating expenses (1): | ||||||||||||||||||||
Research and development | 187,887 | 131,897 | 99,530 | 63,812 | 44,614 | |||||||||||||||
Marketing and sales | 792,029 | 605,199 | 534,413 | 376,480 | 252,935 | |||||||||||||||
General and administrative | 255,913 | 195,290 | 158,613 | 116,508 | 84,257 | |||||||||||||||
Total operating expenses | 1,235,829 | 932,386 | 792,556 | 556,800 | 381,806 | |||||||||||||||
Income (loss) from operations | 97,497 | 115,272 | 63,742 | 20,309 | (3,598 | ) | ||||||||||||||
Investment income | 37,735 | 30,408 | 22,774 | 24,539 | 14,975 | |||||||||||||||
Interest expense | (24,909 | ) | (2,000 | ) | (107 | ) | (46 | ) | (191 | ) | ||||||||||
Gain on sale of investment | 0 | 0 | 0 | 1,272 | 0 | |||||||||||||||
Other income (expense) | (6,025 | ) | (1,299 | ) | (817 | ) | 139 | 1,310 | ||||||||||||
Income before provision for income taxes and noncontrolling interest | 104,298 | 142,381 | 85,592 | 46,213 | 12,496 | |||||||||||||||
Provision for income taxes | (34,601 | ) | (57,689 | ) | (37,557 | ) | (23,385 | ) | (9,795 | ) | ||||||||||
Consolidated net income | 69,697 | 84,692 | 48,035 | 22,828 | 2,701 | |||||||||||||||
Less: net income attributable to noncontrolling interest | (5,223 | ) | (3,973 | ) | (4,607 | ) | (4,472 | ) | (2,220 | ) | ||||||||||
Net income attributable to salesforce.com | $ | 64,474 | $ | 80,719 | $ | 43,428 | $ | 18,356 | $ | 481 | ||||||||||
Net earnings per share-basic and diluted: | ||||||||||||||||||||
Basic net income per share attributable to salesforce.com common shareholders | $ | 0.50 | $ | 0.65 | $ | 0.36 | $ | 0.16 | $ | 0.00 | ||||||||||
Diluted net income per share attributable to salesforce.com common shareholders | $ | 0.47 | $ | 0.63 | $ | 0.35 | $ | 0.15 | $ | 0.00 | ||||||||||
Shares used in computing basic net income per share | 130,222 | 124,462 | 121,183 | 116,840 | 112,386 | |||||||||||||||
Shares used in computing diluted net income per share | 136,598 | 128,114 | 125,228 | 122,422 | 120,154 | |||||||||||||||
31
| (1) | Cost of revenues and operating expenses include stock-based expenses, consisting of: |
| Fiscal Year Ended January 31, | ||||||||||||||||||||
| 2011 | 2010 | 2009 | 2008 | 2007 | ||||||||||||||||
Cost of revenues | $ | 12,158 | $ | 12,570 | $ | 11,051 | $ | 7,926 | $ | 5,522 | ||||||||||
Research and development | 18,897 | 13,129 | 9,852 | 6,336 | 4,523 | |||||||||||||||
Marketing and sales | 56,451 | 39,722 | 36,028 | 25,423 | 18,392 | |||||||||||||||
General and administrative | 32,923 | 23,471 | 20,435 | 15,522 | 10,768 | |||||||||||||||
| As of January 31, | ||||||||||||||||||||
| 2011 | 2010 | 2009(3) | 2008(3) | 2007(3) | ||||||||||||||||
Consolidated Balance Sheet Data: | ||||||||||||||||||||
Cash, cash equivalents and marketable securities | $ | 1,407,557 | $ | 1,727,048 | $ | 882,565 | $ | 669,800 | $ | 412,512 | ||||||||||
(Negative) working capital | (201,542 | ) | 798,029 | 301,591 | 134,894 | 45,905 | ||||||||||||||
Total assets | 3,091,165 | 2,460,201 | 1,479,822 | 1,089,593 | 664,832 | |||||||||||||||
Long-term obligations excluding deferred revenue and noncontrolling interest (2) | 516,506 | 481,234 | 20,106 | 10,601 | 1,408 | |||||||||||||||
Retained earnings (deficit) | 171,035 | 106,561 | 25,842 | (17,586 | ) | (35,633 | ) | |||||||||||||
Total stockholders' equity controlling interest | 1,276,491 | 1,043,802 | 671,784 | 452,059 | 281,791 | |||||||||||||||
| (2) | Long-term obligations excluding deferred revenue and noncontrolling interest includes the 0.75% convertible senior notes issued in January 2010. |
| (3) | Includes the effects of the retrospective adoption of the accounting guidance involving the presentation of noncontrolling interest. We adopted the accounting guidance in the first quarter of fiscal 2010. |
32
| ITEM 7. | MANAGEMENT'S DISCUSSION AND ANALYSIS OF FINANCIAL CONDITION AND RESULTS OF OPERATIONS |
The following discussion contains forward-looking statements, including, without limitation, our expectations and statements regarding our outlook and future revenues, expenses, results of operations, liquidity, plans, strategies and objectives of management and any assumptions underlying any of the foregoing. Our actual results may differ significantly from those projected in the forward-looking statements. Factors that might cause future actual results to differ materially from our recent results or those projected in the forward-looking statements include, but are not limited to, those discussed in the section titled of this Annual Report on Form 10-K "Risk Factors." Except as required by law, we assume no obligation to update the forward-looking statements or our risk factors for any reason.
Overview
We are a leading provider of enterprise cloud computing applications. We provide a comprehensive customer and collaboration relationship management, or CRM, service to businesses of all sizes and industries worldwide and we provide a technology platform for customers and developers to build and run business applications.
We were founded in February 1999 and began offering our enterprise CRM application service in February 2000. Since then, we have augmented our CRM service with new editions and enhanced features. We introduced our Force.com platform to customers and developers so they can build complementary applications to extend beyond CRM. In 2010 we introduced our AppExchange directory of enterprise cloud computing applications that are integrated with our CRM service and in most cases have been developed on our platform by third parties. We also introduced Chatter, a collaboration application for the enterprise to connect and share information securely and in real-time.
Our objective is to be the leading provider of CRM application services and to be the leading platform on which our customers and partners build cloud computing applications. Key elements of our strategy include:
| • | Strengthening our existing CRM applications and extending into new functional areas within CRM; |
| • | Pursuing new customers and new territories aggressively; |
| • | Deepening relationships with our existing customer base; |
| • | Continuing to lead the industry transformation to the next phase of cloud computing; and |
| • | Encouraging the development of third-party applications on our Force.com cloud computing platform. |
We believe the factors that will influence our ability to achieve our objectives include our prospective customers' willingness to migrate to an enterprise cloud computing application service; the performance and security of our service; our ability to continue to release, and gain customer acceptance of, new and improved features; our ability to successfully integrate acquired businesses and technologies; successful customer adoption and utilization of our service; acceptance of our service in markets where we have few customers; the emergence of additional competitors in our market and improved product offerings by existing and new competitors; the location of new data centers; third-party developers' willingness to develop applications on our platform; and general economic conditions which could affect our customers' ability and willingness to purchase our application service, delay the customers' purchasing decision or affect renewal rates.
To address these factors, we will need to, among other things, continue to add substantial numbers of paying subscriptions, upgrade our customers to fully featured versions such as our Unlimited Edition, provide high quality technical support to our customers and encourage the development of third-party applications on our Force.com platform. We plan to invest for future growth by expanding our data center capacity. We also plan to hire additional personnel, particularly in direct sales, other customer-related areas and research and development. As part of our growth plans, we intend to continue focus on retaining customers at the time of renewal.
33
Additionally, we plan to: expand our domestic and international selling and marketing activities; continue to develop our brands; add additional distribution channels; increase our research and development activities to upgrade and extend our service offerings; develop new services and technologies and integrate acquired technologies; and add to our global infrastructure to support our growth. We also regularly evaluate acquisitions or investment opportunities in complementary businesses, joint ventures, services and technologies in an effort to expand our service offerings. We expect to continue to make such investments and acquisitions in the future. As such, we plan to reinvest a significant portion of our incremental revenue in fiscal 2012 to grow our business and continue our leadership role in the cloud computing industry. We expect diluted earnings per share for fiscal 2012 to be significantly lower than diluted earnings per share for fiscal 2011.
In November 2010, we paid $278.0 million in cash for approximately 14 acres of undeveloped real estate in San Francisco, California, including entitlements and improvements associated with the land, and perpetual parking rights in an existing garage, which we plan to develop into our global headquarters.
During fiscal 2011 we acquired several companies to strengthen and extend our service offerings. We spent approximately $403.3 million, net of cash acquired, for these companies.
In December 2000, we established a Japanese joint venture, Kabushiki Kaisha salesforce.com ("Salesforce Japan"), with SunBridge, Inc., a Japanese corporation, to assist with our sales efforts in Japan. During fiscal 2011, we acquired SunBridge's and other shareholders' interest in, and increased our ownership from 72 percent to 100 percent of, Salesforce Japan for cash payments totaling $172.0 million.
In fiscal 2010, we issued at par $575.0 million 0.75% convertible senior notes ("notes") due on January 15, 2015. For 20 trading days during the 30 consecutive trading days ended January 31, 2011, our common stock traded at a price exceeding 130% of the conversion price of $85.36 per share applicable to the Notes. Accordingly, based on the terms of the Notes, the Notes are convertible at the holders' option for the quarter ending April 30, 2011. Upon conversion of any Notes, we will deliver cash up to the principal amount of the Notes and, with respect to any excess conversion value greater than the principal amount of the Notes, shares of our common stock, cash, or a combination of both. Therefore, for the quarter ending April 30, 2011, the Notes will be reclassified to a current liability on our consolidated balance sheet.
We expect marketing and sales costs, which were 48 percent of our total revenues for fiscal 2011 and 46 percent for the same period a year ago, to continue to represent a substantial portion of total revenues in the future as we seek to add and manage more paying subscribers, and build greater brand awareness.
Fiscal Year
Our fiscal year ends on January 31. References to fiscal 2011, for example, refer to the fiscal year ended January 31, 2011.
Sources of Revenues
We derive our revenues from two sources: (1) subscription revenues, which are comprised of subscription fees from customers accessing our enterprise cloud computing application service, and from customers purchasing additional support beyond the standard support that is included in the basic subscription fee; and (2) related professional services and other revenues consisting primarily of training fees. Subscription and support revenues accounted for approximately 94 percent of our total revenues during fiscal 2011. Subscription revenues are driven primarily by the number of paying subscribers of our service, varying service types of offering and the subscription price of our service. We define a "customer" as a separate and distinct buying entity (e.g., a company, a distinct business unit of a large corporation, a partnership, etc.) that has entered into a contract to access our enterprise cloud computing service. We define a "subscription" as a unique user account purchased by a customer for use by its employees or other customer-authorized users, and each such user is who we call a "subscriber." The number of paying subscriptions at each of our customers ranges from one to tens of thousands. None of our customers accounted for more than 5 percent of our revenues during fiscal 2011, 2010, or 2009.
34
Subscription and support revenues are recognized ratably over the contract terms beginning on the commencement dates of each contract. The typical subscription and support term is 12 to 24 months, although terms range from one to 60 months. Our subscription and support contracts are non-cancelable, though customers typically have the right to terminate their contracts for cause if we materially fail to perform. We generally invoice our customers in advance, in annual or quarterly installments, and typical payment terms provide that our customers pay us within 30 days of invoice. Amounts that have been invoiced are recorded in accounts receivable and in deferred revenue, or in revenue depending on whether the revenue recognition criteria have been met. In general, we collect our billings in advance of the subscription service period.
Professional services and other revenues consist of fees associated with consulting and implementation services and training. Our consulting and implementation engagements are typically billed on a time and materials basis. We also offer a number of classes on implementing, using and administering our service that are billed on a per person, per class basis. Our typical payment terms provide that our customers pay us within 30 days of invoice.
We generally recognize revenue ratably over the contract terms beginning on the commencement date of each contract. In determining whether professional services can be accounted for separately from subscription and support revenues, we consider a number of factors, which are described in "Critical Accounting Policies and Estimates-Revenue Recognition" below. As we introduce new service offerings, we may not be able to establish objective and reliable evidence of fair value for these elements of our sales arrangements. As a result, when the professional services are sold together with subscription services that do not have objective and reliable evidence of fair value, the professional services fees cannot be accounted for separately, and the entire arrangement is accounted for as a single unit of accounting. In such situations, we recognize the entire arrangement fee ratably over the term of the subscription contract. Approximately 6 percent of our total deferred revenue as of January 31, 2011 and 2010 respectively, related to deferred professional services revenue. At the start of fiscal 2012 we will be adopting the provisions of ASU 2009-13. Adopting this provision will change our accounting for multiple-element arrangements, see Recent Accounting Pronouncement.
Seasonal Nature of Deferred Revenue and Accounts Receivable
Deferred revenue primarily consists of billings to customers for our subscription service. Over 90 percent of the value of our billings to customers is for our subscription and support service. We generally invoice our customers in either quarterly or annual cycles, with a disproportionate weighting towards annual billings in the fourth quarter, primarily as a result of large enterprise account buying patterns. Additionally, our fourth quarter has historically been our strongest quarter for new business. The year on year compounding effect of this seasonality in both billing patterns and overall new business is causing the value of invoices that we generate in the fourth quarter for both new and existing customers to increase as a proportion of our total annual billings.
35
Accordingly, the sequential quarterly changes in accounts receivable and the related deferred revenue during the first three quarters of our fiscal year are not necessarily indicative of the billing activity that occurs in the fourth quarter.
(in thousands) | April 30, 2010 | July 31, 2010 | October 31, 2010 | January 31, 2011 | ||||||||||||
Fiscal 2011 | ||||||||||||||||
Accounts receivable, net | $ | 183,612 | $ | 228,550 | $ | 258,764 | $ | 426,943 | ||||||||
Deferred revenue, current and noncurrent | 664,529 | 683,019 | 694,557 | 934,941 | ||||||||||||
| April 30, 2009 | July 31, 2009 | October 31, 2009 | January 31, 2010 | |||||||||||||
Fiscal 2010 | ||||||||||||||||
Accounts receivable, net | $ | 145,869 | $ | 168,842 | $ | 191,297 | $ | 320,956 | ||||||||
Deferred revenue, current and noncurrent | 549,373 | 549,010 | 545,435 | 704,348 | ||||||||||||
| April 30, 2008 | July 31, 2008 | October 31, 2008 | January 31, 2009 | |||||||||||||
Fiscal 2009 | ||||||||||||||||
Accounts receivable, net | $ | 143,909 | $ | 146,982 | $ | 157,680 | $ | 266,555 | ||||||||
Deferred revenue, current and noncurrent | 470,297 | 479,546 | 469,534 | 594,026 | ||||||||||||
Cost of Revenues and Operating Expenses
Cost of Revenues. Cost of subscription and support revenues primarily consists of expenses related to hosting our service and providing support, the costs of data center capacity, depreciation or operating lease expense associated with computer equipment, allocated overhead and amortization expense associated with capitalized software related to our application service and acquired technology. We allocate overhead such as rent and occupancy charges based on headcount. Employee benefit costs and taxes are allocated based upon a percentage of total compensation expense. As such, general overhead expenses are reflected in each cost of revenue and operating expense category. Cost of professional services and other revenues consists primarily of employee-related costs associated with these services, including stock-based expenses, the cost of subcontractors and allocated overhead. The cost of providing professional services is significantly higher as a percentage of revenue than for our enterprise cloud computing subscription service due to the direct labor costs and costs of subcontractors.
We intend to continue to invest additional resources in our enterprise cloud computing application service. For example, we plan to open additional data centers in the future. Additionally, as we acquire new businesses and technologies, the amortization expense associated with this activity will be included in cost of revenues. The timing of these additional expenses will affect our cost of revenues, both in terms of absolute dollars and as a percentage of revenues, in the affected periods.
Research and Development . Research and development expenses consist primarily of salaries and related expenses, including stock-based expenses, the costs of our development and test data center and allocated overhead. We continue to focus our research and development efforts on adding new features and services, integrating acquired technologies, increasing the functionality and enhancing the ease of use of our enterprise cloud computing application service. Our proprietary, scalable and secure multi-tenant architecture enables us to provide all of our customers with a service based on a single version of our application. As a result, we do not have to maintain multiple versions, which enables us to have relatively lower research and development expenses as compared to traditional enterprise software companies. We expect that in the future, research and development expenses will increase in absolute dollars as we upgrade and extend our service offerings, develop new technologies and integrate acquired businesses and technologies.
36
Marketing and Sales. Marketing and sales expenses are our largest cost and consist primarily of salaries and related expenses, including stock-based expenses, for our sales and marketing staff, including commissions, payments to partners, marketing programs and allocated overhead. Marketing programs consist of advertising, events, corporate communications and brand building and product marketing activities.
We plan to continue to invest in marketing and sales by expanding our domestic and international selling and marketing activities, building brand awareness and sponsoring additional marketing events. We expect that in the future, marketing and sales expenses will increase in absolute dollars and continue to be our largest cost.
General and Administrative. General and administrative expenses consist of salaries and related expenses, including stock-based expenses, for finance and accounting, human resources and management information systems personnel, legal costs, professional fees, other corporate expenses and allocated overhead. We expect that in the future, general and administrative expenses will increase in absolute dollars as we invest in our infrastructure and we incur additional employee related costs, professional fees and insurance costs related to the growth of our business and international expansion. We expect general and administrative costs as a percentage of total revenues to remain flat for the next several quarters.
Stock-Based Expenses. Our cost of revenues and operating expenses include stock-based expenses related to option and stock awards to employees and non-employee directors. We recognize our share-based payments as an expense in the statement of operations based on their fair values and vesting periods. If our grant activity remains consistent and our stock price increases in the future, stock-based expenses will rise. These charges have been significant in the past and we expect that they will increase as we hire more employees and seek to retain existing employees.
Joint Venture
In December 2000, we established a Japanese joint venture, Kabushiki Kaisha salesforce.com ("Salesforce Japan"), with SunBridge, Inc., a Japanese corporation, to assist us with our sales efforts in Japan. During fiscal 2011, we acquired SunBridge's and other shareholders' interest in, and increased our ownership from 72 percent to 100 percent of, Salesforce Japan. As a result of our purchase of the shares held by SunBridge, the joint venture agreement terminated according to its terms. As we did not obtain 100 percent ownership until the fourth quarter of fiscal 2011, we recorded a noncontrolling interest in our consolidated statement of operations for fiscal 2011, which reflects the interest that we did not control in Salesforce Japan's results in fiscal 2011 and all prior years presented.
Critical Accounting Policies and Estimates
Our consolidated financial statements are prepared in accordance with accounting principles generally accepted in the United States. The preparation of these consolidated financial statements requires us to make estimates and assumptions that affect the reported amounts of assets, liabilities, revenues, costs and expenses, and related disclosures. On an ongoing basis, we evaluate our estimates and assumptions. Our actual results may differ from these estimates under different assumptions or conditions.
We believe that of our significant accounting policies, which are described in note 1 to our consolidated financial statements, the following accounting policies involve a greater degree of judgment and complexity. Accordingly, these are the policies we believe are the most critical to aid in fully understanding and evaluating our consolidated financial condition and results of operations.
Revenue Recognition . We recognize revenue when all of the following conditions are satisfied: (1) there is persuasive evidence of an arrangement; (2) the service has been provided to the customer; (3) the collection of our fees is reasonably assured; and (4) the amount of fees to be paid by the customer is fixed or determinable.
Our arrangements do not contain general rights of return.
37
We recognize subscription revenues ratably over the contract terms beginning on the commencement dates of each contract. Support revenues from customers who purchase our premium support offerings are recognized similarly over the term of the support contract. As part of their subscription agreements, customers generally benefit from new features and functionality with each release at no additional cost. In situations where we have contractually committed to an individual customer specific technology, we defer all of the revenue for that customer until the technology is delivered and accepted. Once delivery occurs, we then recognize the revenue over the remaining contract term.
Consulting services and training revenues are accounted for separately from subscription and support revenues when these services have value to the customer on a standalone basis and there is objective and reliable evidence of fair value of each deliverable. When accounted for separately, revenues are recognized as the services are rendered for time and material contracts, and when the milestones are achieved and accepted by the customer for fixed price contracts. The majority of our consulting service contracts are on a time and material basis. Training revenues are recognized after the services are performed. For revenue arrangements with multiple deliverables, such as an arrangement that includes subscription, premium support, consulting or training services, we allocate the total amount the customer will pay to the separate units of accounting based on their relative fair values, as determined by the price of the undelivered items when sold separately.
In determining whether the consulting services can be accounted for separately from subscription and support revenues, we consider the following factors for each consulting agreement: availability of the consulting services from other vendors, whether objective and reliable evidence of fair value exists for the undelivered elements, the nature of the consulting services, the timing of when the consulting contract was signed in comparison to the subscription service start date, and the contractual dependence of the subscription service on the customer's satisfaction with the consulting work. If a consulting arrangement does not qualify for separate accounting, we recognize the consulting revenue ratably over the remaining term of the subscription contract. Additionally, in these situations we defer the direct costs of the consulting arrangement and amortize those costs over the same time period as the consulting revenue is recognized. The deferred cost on our consolidated balance sheet totaled $28.1 million at January 31, 2011 and $19.1 million at January 31, 2010. Such amounts are included in prepaid expenses and other current assets and other assets, net.
Accounting for Deferred Commissions. We defer commission payments to our direct sales force. The commissions are deferred and amortized to sales expense over the non-cancelable terms of the related subscription contracts with our customers, which are typically 12 to 24 months. The commission payments, which are paid in full the month after the customer's service commences, are a direct and incremental cost of the revenue arrangements. The deferred commission amounts are recoverable through the future revenue streams under the non-cancelable customer contracts. We believe this is the preferable method of accounting as the commission charges are so closely related to the revenue from the non-cancelable customer contracts that they should be recorded as an asset and charged to expense over the same period that the subscription revenue is recognized.
During fiscal 2011, we deferred $121.2 million of commission expenditures and we amortized $80.2 million to sales expense. During the same period a year ago, we deferred $82.3 million of commission expenditures and we amortized $63.9 million to sales expense. Deferred commissions on our consolidated balance sheet totaled $116.6 million at January 31, 2011 and $75.5 million at January 31, 2010.
Business Combinations. We recognize separately from goodwill the fair value of assets acquired and the liabilities assumed. Goodwill as of the acquisition date is measured as the excess of consideration transferred and the net of the acquisition date fair values of the assets acquired and the liabilities assumed. We use the best estimates and assumptions as a part of the purchase price allocation process to accurately value assets acquired and liabilities assumed at the acquisition date. Our estimates are inherently uncertain and subject to refinement. As a result, during the measurement period, which may be up to one year from the acquisition date, we may record adjustments to the fair value of assets acquired and liabilities assumed, with the corresponding offset to
38
goodwill. Upon the conclusion of the measurement period or final determination of the fair value of assets acquired or liabilities assumed, whichever comes first, any subsequent adjustments are recorded to our consolidated statements of operations.
In addition, uncertain tax positions and tax related valuation allowances assumed in connection with a business combination are initially estimated as of the acquisition date. We reevaluate these items quarterly and record any adjustments to the preliminary estimates to goodwill provided that we are within the measurement period and we continue to collect information in order to determine their estimated fair values as of the date of acquisition. Subsequent to the measurement period or our final determination of the tax allowance's or contingency's estimated value, changes to these uncertain tax positions and tax related valuation allowances will affect our provision for income taxes in the consolidated statement of operations.
Accounting for Stock-Based Awards. We recognize the fair value of our stock awards on a straight-line basis over the requisite service period of the award which is the vesting term of four years.
We recognized stock-based expense of $120.4 million, or 7 percent of revenue, during fiscal 2011. The requirement to expense stock-based awards will continue to materially reduce our reported results of operations. As of January 31, 2011, we had an aggregate of $559.8 million of stock compensation remaining to be amortized to expense over the remaining requisite service period of the underlying awards. We currently expect this stock compensation balance to be amortized as follows: $195.1 million during fiscal 2012; $157.9 million during fiscal 2013; $129.6 million during fiscal 2014; $76.8 million during fiscal 2015 and $0.4 million during fiscal 2016. These amounts reflect only outstanding stock awards as of January 31, 2011 and assume no forfeiture activity. We expect to continue to issue share-based awards to our employees in future periods, which will increase the stock compensation amortization in such future periods.
We recognize as an operating expense the payroll and social tax costs, as applicable by jurisdiction, when stock options are exercised. The impact of stock-based expense in the future is dependent upon, among other things, the timing of when we hire additional employees, the effect of long-term incentive strategies involving stock awards in order to continue to attract and retain employees, the total number of stock awards granted, the fair value of the stock awards at the time of grant, changes in estimated forfeiture assumption rates and the tax benefit that we may or may not receive from stock-based expenses. Additionally, we are required to use an option-pricing model to determine the fair value of stock option awards. This determination of fair value is affected by our stock price as well as assumptions regarding a number of highly complex and subjective variables. These variables include, but are not limited to, our expected stock price volatility over the term of the awards.
As of January 31, 2011, there were 3.2 million restricted stock awards and units outstanding. We plan to continue awarding restricted stock to our employees in the future. The restricted stock, which upon vesting entitles the holder to one share of common stock for each restricted stock, has an exercise price of $0.001 per share, which is equal to the par value of our common stock, and vest over 4 years. The fair value of the restricted stock is based on our closing stock price on the date of grant, and compensation expense, net of estimated forfeitures, is recognized on a straight-line basis over the vesting period.
Accounting for Income Taxes. We account for income taxes using the liability method, which requires the recognition of deferred tax assets or liabilities for the tax-effected temporary differences between the financial reporting and tax bases of our assets and liabilities and for net operating loss and tax credit carryforwards. The tax expense or benefit for unusual items, or certain adjustments to the valuation allowance are treated as discrete items in the interim period in which the events occur.
Our effective tax rate could be adversely affected by changes in the mix of earnings and losses in countries with differing statutory tax rates, certain non-deductible expenses as a result of acquisitions, the calculation of deferred tax assets and liabilities, and changes in tax laws and accounting principles.
39
Results of Operations
The following tables set forth selected data for each of the periods indicated (in thousands).
| Fiscal Year Ended January 31, | ||||||||||||
| 2011 | 2010 | 2009 (1) | ||||||||||
Revenues: | ||||||||||||
Subscription and support | $ | 1,551,145 | $ | 1,209,472 | $ | 984,574 | ||||||
Professional services and other | 105,994 | 96,111 | 92,195 | |||||||||
Total revenues | 1,657,139 | 1,305,583 | 1,076,769 | |||||||||
Cost of revenues: | ||||||||||||
Subscription and support | 208,243 | 159,172 | 127,082 | |||||||||
Professional services and other | 115,570 | 98,753 | 93,389 | |||||||||
Total cost of revenues | 323,813 | 257,925 | 220,471 | |||||||||
Gross profit | 1,333,326 | 1,047,658 | 856,298 | |||||||||
Operating expenses: | ||||||||||||
Research and development | 187,887 | 131,897 | 99,530 | |||||||||
Marketing and sales | 792,029 | 605,199 | 534,413 | |||||||||
General and administrative | 255,913 | 195,290 | 158,613 | |||||||||
Total operating expenses | 1,235,829 | 932,386 | 792,556 | |||||||||
Income from operations | 97,497 | 115,272 | 63,742 | |||||||||
Investment income | 37,735 | 30,408 | 22,774 | |||||||||
Interest expense | (24,909 | ) | (2,000 | ) | (107 | ) | ||||||
Other expense | (6,025 | ) | (1,299 | ) | (817 | ) | ||||||
Income before provision for income taxes and noncontrolling interest | 104,298 | 142,381 | 85,592 | |||||||||
Provision for income taxes | (34,601 | ) | (57,689 | ) | (37,557 | ) | ||||||
Consolidated net income | 69,697 | 84,692 | 48,035 | |||||||||
Less: Net income attributable to noncontrolling interest | (5,223 | ) | (3,973 | ) | (4,607 | ) | ||||||
Net income attributable to salesforce.com | $ | 64,474 | $ | 80,719 | $ | 43,428 | ||||||
| As of January 31, | ||||||||
| 2011 | 2010 | |||||||
Balance Sheet Data: | ||||||||
Cash, cash equivalents and marketable securities | $ | 1,407,557 | $ | 1,727,048 | ||||
Deferred revenue, current and noncurrent | 934,941 | 704,348 | ||||||
| (1) | Includes the effects of the retrospective adoption of the accounting guidance involving the presentation guidance of noncontrolling interest. We adopted the accounting guidance in the first quarter of fiscal 2010. |
| Fiscal Year Ended January 31, | ||||||||||||
| 2011 | 2010 | 2009 | ||||||||||
Revenues by geography: | ||||||||||||
Americas | $ | 1,135,019 | $ | 923,823 | $ | 776,495 | ||||||
Europe | 291,784 | 232,367 | 190,685 | |||||||||
Asia Pacific | 230,336 | 149,393 | 109,589 | |||||||||
| $ | 1,657,139 | $ | 1,305,583 | $ | 1,076,769 | |||||||
40
Cost of revenues and operating expenses include the following amounts related to stock-based awards.
| Fiscal Year Ended January 31, | ||||||||||||
| 2011 | 2010 | 2009 | ||||||||||
Stock-based expenses: | ||||||||||||
Cost of revenues | $ | 12,158 | $ | 12,570 | $ | 11,051 | ||||||
Research and development | 18,897 | 13,129 | 9,852 | |||||||||
Marketing and sales | 56,451 | 39,722 | 36,028 | |||||||||
General and administrative | 32,923 | 23,471 | 20,435 | |||||||||
Cost of revenues and marketing and sales expenses include the following amounts related to amortization of purchased intangibles.
| Fiscal Year Ended January 31, | ||||||||||||
| 2011 | 2010 | 2009 | ||||||||||
Amortization of purchased intangibles: | ||||||||||||
Cost of revenues | $ | 15,459 | $ | 8,010 | $ | 6,980 | ||||||
Marketing and sales | 4,209 | 3,241 | 1,895 | |||||||||
The following tables set forth selected consolidated statements of operations data for each of the periods indicated as a percentage of total revenues.
| Fiscal Year Ended January 31, | ||||||||||||
| 2011 | 2010 | 2009 | ||||||||||
Revenues: | ||||||||||||
Subscription and support | 94 | % | 93 | % | 91 | % | ||||||
Professional services and other | 6 | 7 | 9 | |||||||||
Total revenues | 100 | 100 | 100 | |||||||||
Cost of revenues: | ||||||||||||
Subscription and support | 13 | 12 | 12 | |||||||||
Professional services and other | 7 | 8 | 8 | |||||||||
Total cost of revenues | 20 | 20 | 20 | |||||||||
Gross profit | 80 | 80 | 80 | |||||||||
Operating expenses: | ||||||||||||
Research and development | 11 | 10 | 9 | |||||||||
Marketing and sales | 48 | 46 | 50 | |||||||||
General and administrative | 15 | 15 | 15 | |||||||||
Total operating expenses | 74 | 71 | 74 | |||||||||
Income from operations | 6 | 9 | 6 | |||||||||
Investment income | 2 | 2 | 2 | |||||||||
Interest expense | (2 | ) | 0 | 0 | ||||||||
Other expense | 0 | 0 | 0 | |||||||||
Income before provision for income taxes and noncontrolling interest | 6 | 11 | 8 | |||||||||
Provision for income taxes | (2 | ) | (5 | ) | (4 | ) | ||||||
Consolidated net income | 4 | 6 | 4 | |||||||||
Less: Net income attributable to noncontrolling interest | 0 | 0 | 0 | |||||||||
Net income attributable to salesforce.com | 4 | % | 6 | % | 4 | % | ||||||
41
| Fiscal Year Ended January 31, | ||||||||||||
| 2011 | 2010 | 2009 | ||||||||||
Revenues by geography: | ||||||||||||
Americas | 68 | % | 71 | % | 72 | % | ||||||
Europe | 18 | 18 | 18 | |||||||||
Asia Pacific | 14 | 11 | 10 | |||||||||
| 100 | % | 100 | % | 100 | % | |||||||
| Fiscal Year Ended January 31, | ||||||||||||
| 2011 | 2010 | 2009 | ||||||||||
Stock-based expenses: | ||||||||||||
Cost of revenues | 1 | % | 1 | % | 1 | % | ||||||
Research and development | 1 | 1 | 1 | |||||||||
Marketing and sales | 3 | 3 | 3 | |||||||||
General and administrative | 2 | 2 | 2 | |||||||||
Fiscal Years Ended January 31, 2011 and 2010
Revenues.
| Fiscal Year Ended January 31, | Variance | |||||||||||||||
(In thousands) | 2011 | 2010 | Dollars | Percent | ||||||||||||
Subscription and support | $ | 1,551,145 | $ | 1,209,472 | $ | 341,673 | 28 | % | ||||||||
Professional services and other | 105,994 | 96,111 | 9,883 | 10 | % | |||||||||||
Total revenues | $ | 1,657,139 | $ | 1,305,583 | $ | 351,556 | 27 | % | ||||||||
Total revenues were $1.7 billion for fiscal 2011, compared to $1.3 billion during the same period a year ago, an increase of $351.6 million, or 27 percent. Subscription and support revenues were $1.6 billion, or 94 percent of total revenues, for fiscal 2011, compared to $1.2 billion, or 93 percent of total revenues, during the same period a year ago. The increase in subscription and support revenues was due primarily to new customers, upgrades and additional subscriptions from existing customers and improved renewal rates as compared to a year ago. The price per user per month for our three primary offerings, Professional Edition, Enterprise Edition and Unlimited Edition, in fiscal 2011 has remained substantially consistent relative to fiscal 2010. Professional services and other revenues were $106.0 million, or 6 percent of total revenues, for fiscal 2011, compared to $96.1 million, or 7 percent of total revenues, for the same period a year ago. The increase in professional services and other revenues was due primarily to the higher demand for services from an increased number of customers.
Revenues in Europe and Asia Pacific accounted for $522.1 million, or 32 percent of total revenues, for fiscal 2011, compared to $381.8 million, or 29 percent of total revenues, during the same period a year ago, an increase of $140.3 million, or 37 percent. The increase in revenues outside of the Americas was the result of the increasing acceptance of our service, and our focus on marketing our service internationally. Additionally, the value of the U.S. dollar relative to foreign currencies contributed to a slight decrease in U.S. dollar revenues outside of the Americas for fiscal 2011 as compared to the same period a year ago. The foreign currency impact had the effect of reducing our aggregate revenues by $7.6 million compared to the same period a year ago. As part of our overall growth, we expect the percentage of our revenue generated outside of the Americas to continue to increase as a percentage of our total revenues world wide.
42
Cost of Revenues.
| Fiscal Year Ended January 31, | Variance Dollars | |||||||||||
(In thousands) | 2011 | 2010 | ||||||||||
Subscription and support | $ | 208,243 | $ | 159,172 | $ | 49,071 | ||||||
Professional services and other | 115,570 | 98,753 | 16,817 | |||||||||
Total cost of revenues | $ | 323,813 | $ | 257,925 | $ | 65,888 | ||||||
Percent of total revenues | 20 | % | 20 | % | ||||||||
Cost of revenues was $323.8 million, or 20 percent of total revenues, during fiscal 2011, compared to $257.9 million, or 20 percent of total revenues, during the same period a year ago, an increase of $65.9 million. The increase in absolute dollars was primarily due to an increase of $22.6 million in employee-related costs, an increase of $9.2 million in service delivery costs, primarily due to our efforts in increasing data center capacity, an increase of $16.6 million in depreciation and amortization expenses, an increase of $13.2 million in outside subcontractor and other service costs, and an increase of $3.6 million in allocated overhead, offset by a decrease of $0.4 million in stock based expenses. The cost of professional services and other revenues exceeded the related revenue during fiscal 2011 by $9.6 million as compared to $2.6 million during fiscal 2010, primarily due to an increase in the cost related to professional services headcount.
We intend to continue to invest additional resources in our enterprise cloud computing application service. The timing of these additional expenses, will affect our cost of revenues, both in terms of absolute dollars and as a percentage of revenues in future periods.
We expect the cost of professional services to continue to exceed revenue from professional services during fiscal 2012. We believe that this investment in professional services facilitates the adoption of our application service.
Research and Development.
| Fiscal Year Ended January 31, | Variance Dollars | |||||||||||
(In thousands) | 2011 | 2010 | ||||||||||
Research and development | $ | 187,887 | $ | 131,897 | $ | 55,990 | ||||||
Percent of total revenues | 11 | % | 10 | % | ||||||||
Research and development expenses were $187.9 million, or 11 percent of total revenues, during fiscal 2011, compared to $131.9 million, or 10 percent of total revenues, during the same period a year ago, an increase of $56.0 million. The increase in absolute dollars was due to an increase of $42.0 million in employee-related costs, an increase of $5.8 million in stock-based expenses, and an increase of $5.6 million in allocated overhead. We increased our research and development headcount by 47 percent since January 31, 2010 in order to upgrade and extend our service offerings and develop new technologies. Some of the increase in headcount was due to acquired businesses.
Marketing and Sales.
| Fiscal Year Ended January 31, | Variance Dollars | |||||||||||
(In thousands) | 2011 | 2010 | ||||||||||
Marketing and sales | $ | 792,029 | $ | 605,199 | $ | 186,830 | ||||||
Percent of total revenues | 48 | % | 46 | % | ||||||||
43
Marketing and sales expenses were $792.0 million, or 48 percent of total revenues, during fiscal 2011, compared to $605.2 million, or 46 percent of total revenues, during the same period a year ago, an increase of $186.8 million. The increase in absolute dollars was primarily due to increases of $143.1 million in employee-related costs, $16.7 million in stock-based expenses, $12.1 million in advertising costs and marketing and event costs, $1.0 million in depreciation and amortization, and $12.6 million in allocated overhead. Our marketing and sales headcount increased by 34 percent since January 31, 2010 as we hired additional sales personnel to focus on adding new customers and increasing penetration within our existing customer base. Some of the increase in headcount was due to acquired businesses.
General and Administrative.
| Fiscal Year Ended January 31, | Variance Dollars | |||||||||||
(In thousands) | 2011 | 2010 | ||||||||||
General and administrative | $ | 255,913 | $ | 195,290 | $ | 60,623 | ||||||
Percent of total revenues | 15 | % | 15 | % | ||||||||
General and administrative expenses were $255.9 million, or 15 percent of total revenues, during fiscal 2011, compared to $195.3 million, or 15 percent of total revenues, during the same period a year ago, an increase of $60.6 million. The increase was primarily due to increases of $46.8 million in employee-related costs, $9.5 million in stock-based expenses, and increases in depreciation and amortization, service delivery costs, and professional and outside service costs. Our general and administrative headcount increased by 30 percent since January 31, 2010 as we added personnel to support our growth.
Income from operations.
| Fiscal Year Ended January 31, | Variance Dollars | |||||||||||
(In thousands) | 2011 | 2010 | ||||||||||
Income from operations | $ | 97,497 | $ | 115,272 | $ | (17,775 | ) | |||||
Percent of total revenues | 6 | % | 9 | % | ||||||||
Income from operations during fiscal 2011 was $97.5 million and included $120.4 million of stock-based expenses and $19.7 million of amortization of purchased intangibles. During the same period a year ago, operating income was $115.3 million and included $88.9 million of stock-based expenses and $11.3 million of amortization of purchased intangibles.
Investment income.
| Fiscal Year Ended January 31, | Variance Dollars | |||||||||||
(In thousands) | 2011 | 2010 | ||||||||||
Investment income | $ | 37,735 | $ | 30,408 | $ | 7,327 | ||||||
Percent of total revenues | 2 | % | 2 | % | ||||||||
Investment income consists of income on cash and marketable securities balances. Investment income was $37.7 million during fiscal 2011 and was $30.4 million during the same period a year ago. The increase was primarily due to increased realized gains from sales of marketable securities and the increase in marketable securities balances resulting from cash generated by operating activities and the proceeds from stock option exercises and the convertible senior notes.
Interest expense.
| Fiscal Year Ended January 31, | Variance Dollars | |||||||||||
(In thousands) | 2011 | 2010 | ||||||||||
Interest expense | $ | (24,909 | ) | $ | (2,000 | ) | $ | (22,909 | ) | |||
Percent of total revenues | 2 | % | 0 | % | ||||||||
44
Interest expense consists primarily of interest on our convertible senior notes and capital leases. Interest expense was $24.9 million, net of interest costs capitalized, during fiscal 2011 and was $2.0 million during the same period a year ago. The increase was primarily due to interest expense associated with the January 2010 issuance of $575.0 million of convertible senior notes and capital leases associated with equipment acquired to expand our data center capacity. During fiscal 2011, we capitalized $4.0 million of interest costs related to major construction projects, specifically our campus project and our capitalized internal-use software development costs. We will continue to capitalize interest on these projects until these assets are ready for service.
Other expense.
| Fiscal Year Ended January 31, | Variance Dollars | |||||||||||
(In thousands) | 2011 | 2010 | ||||||||||
Other expense | $ | (6,025 | ) | $ | (1,299 | ) | $ | (4,726 | ) | |||
Other expense primarily consists of foreign currency transaction gains and losses. Other expense increased due to realized and unrealized gains on foreign currency transactions for fiscal 2011 compared to the same period a year ago.
Provision for Income Taxes.
| Fiscal Year Ended January 31, | Variance Dollars | |||||||||||
(In thousands) | 2011 | 2010 | ||||||||||
Provision for income taxes | $ | (34,601 | ) | $ | (57,689 | ) | $ | 23,088 | ||||
Effective tax rate | 33 | % | 41 | % | ||||||||
The provision for income taxes was $34.6 million during fiscal 2011, compared to $57.7 million during the same period a year ago.
Our effective tax rate decreased to 33 percent for fiscal 2011 compared to 41 percent for the same period a year ago. The decrease was due to a higher proportion of income being generated in countries with lower income tax rates than the U.S statutory tax rate, as well as increased tax credits. The extension of the federal research credit provision was enacted in the Tax Relief Act of 2010. The total income tax benefit recognized in the accompanying consolidated statements of operations related to stock-based compensation was $44.1 million for the current fiscal year. See Note 7 "Income Taxes" to the Notes to the Consolidated Financial Statements for our reconciliation of income taxes at the statutory federal rate to the provision for income taxes.
In addition, in February 2009, the State of California enacted several income tax law changes which included an election to apply a single sales factor apportionment formula and adoption of a market sourcing approach for service income that will impact us beginning in fiscal 2012. As a result, we re-valued the anticipated future tax effects of our California temporary differences including stock-based compensation and purchased intangibles. Accordingly, we recorded an income tax expense of $2.2 million and $2.7 million related to this tax law change during 2011 and 2010 respectively.
Fiscal Years Ended January 31, 2010 and 2009
Revenues.
(In thousands) | Fiscal Year Ended January 31, | Variance | ||||||||||||||
| 2010 | 2009 | Dollars | Percent | |||||||||||||
Subscription and support | $ | 1,209,472 | $ | 984,574 | $ | 224,898 | 23 | % | ||||||||
Professional services and other | 96,111 | 92,195 | 3,916 | 4 | % | |||||||||||
Total revenues | $ | 1,305,583 | $ | 1,076,769 | $ | 228,814 | 21 | % | ||||||||
45
Total revenues were $1.3 billion for fiscal 2010, compared to $1.1 billion for fiscal 2009, an increase of $228.8 million, or 21 percent. Subscription and support revenues were $1.2 billion, or 93 percent of total revenues, for fiscal 2010, compared to $1.0 billion, or 91 percent of total revenues, during fiscal 2009. Professional services and other revenues were $96.1 million, or 7 percent of total revenues, for fiscal 2010, compared to $92.2 million, or 9 percent of total revenues, for fiscal 2009. The increase in professional services and other revenues was due primarily to the higher demand for services from an increased number of paying customers.
Revenues in Europe and Asia Pacific accounted for $381.8 million, or 29 percent of total revenues, for fiscal 2010, compared to $300.3 million, or 28 percent of total revenues, during fiscal 2009, an increase of $81.5 million, or 27 percent. The increase in revenues outside of the Americas was the result of our efforts to expand internationally. As part of our overall growth, we expect the percentage of our revenue generated in Europe and Asia Pacific to continue to increase as a percentage of our total revenues world wide.
Cost of Revenues.
| Fiscal Year Ended January 31, | Variance Dollars | |||||||||||
(In thousands) | 2010 | 2009 | ||||||||||
Subscription and support | $ | 159,172 | $ | 127,082 | $ | 32,090 | ||||||
Professional services and other | 98,753 | 93,389 | 5,364 | |||||||||
Total cost of revenues | $ | 257,925 | $ | 220,471 | $ | 37,454 | ||||||
Percent of total revenues | 20 | % | 20 | % | ||||||||
Cost of revenues was $257.9 million, or 20 percent of total revenues, during fiscal 2010, compared to $220.5 million, or 20 percent of total revenues, during fiscal 2009, an increase of $37.4 million. The increase in absolute dollars was primarily due to an increase of $8.4 million in employee-related costs, an increase of $1.5 million in stock-based expenses, an increase of $7.2 million in service delivery costs, primarily due to our investments in increasing data center capacity, an increase of $9.8 million in depreciation and amortization expenses, an increase of $6.7 million in outside subcontractor and other service costs and an increase of $1.6 million in allocated overhead. The cost of the professional services headcount resulted in the cost of professional services and other revenues to be in excess of the related revenue during fiscal 2010 by $2.6 million as compared to $1.2 million during fiscal 2009.
Research and Development.
| Fiscal Year Ended January 31, | Variance Dollars | |||||||||||
(In thousands) | 2010 | 2009 | ||||||||||
Research and development | $ | 131,897 | $ | 99,530 | $ | 32,367 | ||||||
Percent of total revenues | 10 | % | 9 | % | ||||||||
Research and development expenses were $131.9 million, or 10 percent of total revenues, during fiscal 2010, compared to $99.5 million, or 9 percent of total revenues, during fiscal 2009, an increase of $32.4 million. The increase in absolute dollars was due to an increase of $25.2 million in employee-related costs, an increase of $3.3 million in stock-based expenses, and an increase of $3.5 million in allocated overhead. We increased our research and development headcount by 24 percent between January 31, 2009 and January 31, 2010 in order to upgrade and extend our service offerings and develop new technologies.
Marketing and Sales .
| Fiscal Year Ended January 31, | Variance Dollars | |||||||||||
(In thousands) | 2010 | 2009 | ||||||||||
Marketing and sales | $ | 605,199 | $ | 534,413 | $ | 70,786 | ||||||
Percent of total revenues | 46 | % | 50 | % | ||||||||
46
Marketing and sales expenses were $605.2 million, or 46 percent of total revenues, during fiscal 2010, compared to $534.4 million, or 50 percent of total revenues, during fiscal 2009, an increase of $70.8 million. The increase in absolute dollars was primarily due to increases of $42.0 million in employee-related costs, $3.7 million in stock-based expenses, $17.1 million in advertising costs and marketing and event costs and $6.7 million in allocated overhead. Our marketing and sales headcount increased by 9 percent between January 31, 2009 and January 31, 2010 as we hired additional sales personnel to focus on adding new customers and increasing penetration within our existing customer base.
General and Administrative.
| Fiscal Year Ended January 31, | Variance Dollars | |||||||||||
(In thousands) | 2010 | 2009 | ||||||||||
General and administrative | $ | 195,290 | $ | 158,613 | $ | 36,677 | ||||||
Percent of total revenues | 15 | % | 15 | % | ||||||||
General and administrative expenses were $195.3 million, or 15 percent of total revenues, during fiscal 2010, compared to $158.6 million, or 15 percent of total revenues, during fiscal 2009, an increase of $36.7 million. The increase was primarily due to increases of $15.7 million in employee-related costs, $3.0 million in stock-based expenses, $4.7 million in infrastructure-related costs, and $10.1 million in professional and outside service costs. Our general and administrative headcount increased by 12 percent between January 31, 2009 and January 31, 2010 as we added personnel to support our growth.
Income from operations.
| Fiscal Year Ended January 31, | Variance Dollars | |||||||||||
(In thousands) | 2010 | 2009 | ||||||||||
Income from operations | $ | 115,272 | $ | 63,742 | $ | 51,530 | ||||||
Percent of total revenues | 9 | % | 6 | % | ||||||||
Income from operations during fiscal 2010 was $115.3 million and included $88.9 million of stock-based expenses. During the fiscal 2009, operating income was $63.7 million and included $77.4 million of stock-based expenses.
Investment income.
| Fiscal Year Ended January 31, | Variance Dollars | |||||||||||
(In thousands) | 2010 | 2009 | ||||||||||
Investment income | $ | 30,408 | $ | 22,774 | $ | 7,634 | ||||||
Percent of total revenues | 2 | % | 2 | % | ||||||||
Investment income consists of income on cash and marketable securities balances. Investment income was $30.4 million during fiscal 2010 and was $22.8 million during fiscal 2009. The increase was primarily due to increased realized gains and the increase in marketable securities balances resulting from cash generated by operating activities and the proceeds from stock option exercises.
Interest expense.
| Fiscal Year Ended January 31, | Variance Dollars | |||||||||||
(In thousands) | 2010 | 2009 | ||||||||||
Interest expense | $ | (2,000 | ) | $ | (107 | ) | $ | (1,893 | ) | |||
47
Interest expense consists primarily of interest on our capital leases. Interest expense was $2.0 million during fiscal 2010 and was $0.1 million during fiscal 2009. The increase was primarily due to capital leases associated with equipment in expanding our data center capacity.
Other expense.
| Fiscal Year Ended January 31, | Variance Dollars | |||||||||||
(In thousands) | 2010 | 2009 | ||||||||||
Other expense | $ | (1,299 | ) | $ | (817 | ) | $ | (482 | ) | |||
Other expense primarily consists of foreign currency translation gains and losses. Other expense increased due to realized and unrealized gains on foreign currency translations for fiscal 2010 compared to fiscal 2009.
Provision for Income Taxes.
| Fiscal Year Ended January 31, | ||||||||||||
(In thousands) | 2010 | 2009 | Dollars | |||||||||
Provision for income taxes | $ | (57,689 | ) | $ | (37,557 | ) | $ | (20,132 | ) | |||
Effective tax rate | 41 | % | 44 | % | ||||||||
The provision for income taxes was $57.7 million during fiscal 2010, compared to $37.6 million during fiscal 2009.
Our effective tax rate decreased to 41 percent for fiscal 2010 compared to 44 percent for fiscal 2009. The decrease was due to a higher proportion of income being generated in countries with lower income tax rates than the U.S. statutory tax rate as well as increased tax credits. The total income tax benefit recognized in the accompanying consolidated statements of operations related to stock-based compensation was $32.1 million for fiscal 2010.
Liquidity and Capital Resources
At January 31, 2011, our principal sources of liquidity were cash, cash equivalents and marketable securities totaling $1.4 billion and accounts receivable of $426.9 million.
Net cash provided by operating activities was $459.1 million during fiscal 2011 and $270.9 million during the same period a year ago. The improvement in cash flow was due primarily to the growth in our customer base, increases in the contract values of our subscription service contracts, improving renewal rates and the associated increase in billings and collections. Cash provided by operating activities has historically been affected by: the amount of net income; sales of subscriptions, support and professional services; changes in working capital accounts, particularly increases and seasonality in accounts receivable and deferred revenue as described above, the timing of commission and bonus payments, and the timing of collections from large enterprise customers; add-backs of non-cash expense items such as depreciation and amortization, amortization of debt discount and the expense associated with stock-based awards.
Net cash used in investing activities was $1.1 billion during fiscal 2011 and $378.6 million during the same period a year ago. The net cash used in investing activities during fiscal 2011 primarily related to the purchase of Jigsaw, Heroku, DimDim, the purchase of undeveloped land in San Francisco, California, investment of cash balances, and capital expenditures and strategic investments in public and private companies. During the fourth quarter of fiscal 2011, we purchased approximately 14 acres of undeveloped land in San Francisco, California, including entitlements and improvements associated with the land, and perpetual parking rights in an existing garage for approximately $278.0 million in cash. We plan to use the land to build our new global headquarters and therefore will devote additional financial resources in the future to build our new headquarters.
48
Net cash provided by financing activities was $14.1 million during fiscal 2011 and $637.2 million during the same period a year ago. Net cash provided by financing activities during fiscal 2011 consisted primarily of $160.4 million of proceeds from the exercise of employee stock options and $36.0 million of excess tax benefits from employee stock plans, offset by the $172.0 million in purchases of Salesforce Japan shares held by others and $10.4 million of principal payments on capital leases.
In January 2010, we issued $575.0 million of 0.75% convertible senior notes due January 15, 2015 (the "Notes") and concurrently entered into convertible notes hedges (the "Note Hedges") and separate warrant transactions (the "Warrants"). The Notes will mature on January 15, 2015, unless earlier converted. As of January 31, 2011, the Notes have not been repurchased or converted. We also have not received any shares under the Note Hedges or delivered cash or shares under the Warrants.
For 20 trading days during the 30 consecutive trading days ended January 31, 2011, our common stock traded at a price exceeding 130% of the conversion price of $85.36 per share applicable to the Notes. Accordingly, the Notes are convertible at the holders' option for the quarter ending April 30, 2011. Upon conversion of any Notes, we will deliver cash up to the principal amount of the Notes and, with respect to any excess conversion value greater than the principal amount of the Notes, shares of our common stock, cash, or a combination of both. Therefore, for the quarter ending April 30, 2011, the Notes will be reclassified to a current liability on our consolidated balance sheet so long as the Notes are convertible.
Our cash, cash equivalents and marketable securities are comprised primarily of corporate notes and obligations, U.S. agency obligations, U.S. treasury securities, mortgage backed securities, collateralized mortgage obligations, time deposits, money market mutual funds, government obligations and municipal securities.
As of January 31, 2011, we have a total of $8.9 million in letters of credit outstanding in favor of certain landlords for office space. To date, no amounts have been drawn against the letters of credit, which renew annually and mature at various dates through September 2021.
We do not have any special purpose entities, and other than operating leases for office space and computer equipment, we do not engage in off-balance sheet financing arrangements. Additionally, we currently do not have a bank line of credit.
Our principal commitments consist of obligations under leases for office space and co-location facilities for data center capacity and our development and test data center, and computer equipment and furniture and fixtures. At January 31, 2011, the future non-cancelable minimum payments under these commitments were as follows:
(In thousands) Contractual Obligations | Payments Due by Period | |||||||||||||||||||
| Total | Less than 1 Year | 1-3 Years | 3-5 Years | More than 5 Years | ||||||||||||||||
Capital lease obligations | $ | 18,637 | $ | 10,830 | $ | 7,807 | $ | 0 | $ | 0 | ||||||||||
Operating lease obligations: | ||||||||||||||||||||
Facilities space | 436,944 | 75,166 | 150,438 | 91,549 | 119,791 | |||||||||||||||
Computer equipment and furniture and fixtures | 62,340 | 32,177 | 30,163 | 0 | 0 | |||||||||||||||
Convertible Senior Notes, including interest | 592,251 | 4,313 | 8,625 | 579,313 | 0 | |||||||||||||||
Contractual commitments | 1,603 | 3 | 1,600 | 0 | 0 | |||||||||||||||
As of February 1, 2011 the Notes are convertible at the option of the noteholder. For 20 trading days during the 30 consecutive trading days ended January 31, 2011, our common stock traded at a price exceeding 130% of the conversion price of $85.36 per share applicable to the Notes. Accordingly, the Notes are convertible at the holders' option for the quarter ending April 30, 2011. Upon conversion of any Notes, we will deliver cash up to
49
the principal amount of the Notes and, with respect to any excess conversion value greater than the principal amount of the Notes, shares of our common stock, cash, or a combination of both. This potential repayment of the Notes is not reflected in the timing of the payments due by period above.
We have a contractual obligation to begin construction on the undeveloped land by September 2014. If we do not commence construction by this date we will be subject to certain penalties due to a third party. These potential penalties are not reflected in the timing of the payments due by period above. We do not believe we will be subject to these penalties.
Our lease agreements provide us with the option to renew. Our future operating lease obligations would change if we exercised these options and if we entered into additional operating lease agreements as we expand our operations.
Purchase orders are not included in the table above. Our purchase orders represent authorizations to purchase rather than binding agreements. The contractual commitment amounts in the table above are associated with agreements that are enforceable and legally binding and that specify all significant terms, including: fixed or minimum services to be used; fixed, minimum or variable price provisions; and the approximate timing of the transaction. Obligations under contracts that we can cancel without a significant penalty are not included in the table above.
The timing of tax settlements are not included in the table above. We are unable to make a reasonable estimate of the timing of payments in individual years beyond 12 months due to uncertainties in the timing of tax settlements. For further information, see Note 7 to the notes to consolidated financial statements. We recorded liabilities related to uncertain tax positions.
We believe our existing cash, cash equivalents and short-term marketable securities and cash provided by operating activities will be sufficient to meet our working capital and capital expenditure needs over the next 12 months.
During fiscal 2012, we may enter into arrangements to acquire or invest in complementary businesses or joint ventures, services or technologies. While we believe we have sufficient financial resources to do so, we may be required to seek additional equity or debt financing. Additional funds may not be available on terms favorable to us or at all.
Recent Accounting Pronouncement
In September 2009, the Financial Accounting Standards Board, or FASB, issued Update No. 2009-13, " Revenue Recognition (Topic 605) , Multiple-Deliverable Revenue Arrangements-a consensus of the FASB Emerging Issues Task Force" (ASU 2009-13). It updates the existing multiple-element revenue arrangements guidance currently included under ASC 605-25. The revised guidance primarily provides two significant changes: 1) eliminates the need for objective and reliable evidence of the fair value for the undelivered element in order for a delivered item to be treated as a separate unit of accounting, and 2) requires the use of the relative selling price method to allocate the entire arrangement consideration. In addition, the guidance also expands the disclosure requirements for revenue recognition. ASU 2009-13 will be effective for us at the start of fiscal 2012. We believe the future impact of this new accounting pronouncement will not be material to our consolidated net income.
50
| ITEM 7A. | QUANTITATIVE AND QUALITATIVE DISCLOSURES ABOUT MARKET RISK |
Foreign currency exchange risk
Our results of operations and cash flows are subject to fluctuations due to changes in foreign currency exchange rates, particularly changes in the Euro, British Pound Sterling, Canadian dollar, Swiss franc, Singapore dollar, Japanese Yen and Australian dollar. We seek to minimize the impact of certain foreign currency fluctuations by hedging certain balance sheet exposures with foreign currency forward contracts. Any gain or loss from settling these contracts is offset by the loss or gain derived from the underlying balance sheet exposures. In accordance with our policy, the hedging contracts we enter into have maturities of less than three months. Additionally, by policy, we do not enter into any hedging contracts for trading or speculative purposes.
Interest rate sensitivity
We had cash, cash equivalents and marketable securities totaling $1.4 billion at January 31, 2011. This amount was invested primarily in money market funds, time deposits, corporate notes and bonds, government securities and other debt securities with credit ratings of at least single A or better. The cash, cash equivalents and short-term marketable securities are held for working capital purposes. Our investments are made for capital preservation purposes. We do not enter into investments for trading or speculative purposes.
Our cash equivalents and our portfolio of marketable securities are subject to market risk due to changes in interest rates. Fixed rate securities may have their market value adversely impacted due to a rise in interest rates, while floating rate securities may produce less income than expected if interest rates fall. Due in part to these factors, our future investment income may fall short of expectation due to changes in interest rates or we may suffer losses in principal if we are forced to sell securities that decline in market value due to changes in interest rates. However because we classify our debt securities as "available for sale," no gains or losses are recognized due to changes in interest rates unless such securities are sold prior to maturity or declines in fair value are determined to be other-than-temporary. Our fixed-income portfolio is subject to interest rate risk.
An immediate increase or decrease in interest rates of 100-basis points at January 31, 2011 could result in a $27.7 million market value reduction or increase of the same amount. This estimate is based on a sensitivity model that measures market value changes when changes in interest rates occur. Fluctuations in the value of our investment securities caused by a change in interest rates (gains or losses on the carrying value) are recorded in other comprehensive income, and are realized only if we sell the underlying securities.
At January 31, 2010, we had cash, cash equivalents and marketable securities totaling $1.7 billion. The fixed-income portfolio was also subject to interest rate risk. Changes in interest rates of 100-basis points would have resulted in market value changes of $13.1 million.
Market Risk and Market Interest Risk
In January 2010, we issued at par value $575.0 million of 0.75% convertible senior notes due 2015 (the "Notes"). Holders may convert their Notes prior to maturity upon the occurrence of certain circumstances. Upon conversion, we would pay the holder an amount of cash equal to the principal amount of the Notes. Amounts in excess of the principal amount, if any, may be paid in cash or stock at our option. Concurrent with the issuance of the Notes, we entered into separate note hedging transactions and the sale of warrants. These separate transactions were completed to reduce the potential economic dilution from the conversion of the Notes.
As of February 1, 2011 the Notes are convertible at the option of the noteholder. For 20 trading days during the 30 consecutive trading days ended January 31, 2011, our common stock traded at a price exceeding 130% of the conversion price of $85.36 per share applicable to the Notes. Accordingly, the Notes are convertible at the holders' option for the quarter ending April 30, 2011. Upon conversion of any Notes, we will deliver cash up to the principal amount of the Notes and, with respect to any excess conversion value greater than the principal
51
amount of the Notes, shares of our common stock, cash, or a combination of both. Therefore, as of February 1, 2011, the Notes will be reclassified to a current liability on our consolidated balance sheet so long as the Notes are convertible.
The Notes have a fixed annual interest rate of 0.75% and therefore, we do not have economic interest rate exposure on the Notes. However, the value of the Notes are exposed to interest rate risk. Generally, the fair market value of our fixed interest rate Notes will increase as interest rates fall and decrease as interest rates rise. In addition, the fair value of our Notes is affected by our stock price. The carrying value of our Notes was $472.5 million as of January 31, 2011. This represents the liability component of the $575.0 million principal balance as of January 31, 2011. The total estimated fair value of our Notes at January 31, 2011 was $946.1 million and the fair value was determined based on the closing trading price per $100 of the Notes as of the last day of trading for the fourth quarter of fiscal 2011, which was $164.55.
We have an investment portfolio that includes strategic investments in public and privately-held companies, many of which are in the development stage. When our ownership interests are less than 20 percent and we do not have the ability to exert significant influence, we account for the minority equity investments using the cost method of accounting. Otherwise, we account for the investments using the equity method of accounting. At January 31, 2011, the fair value of these investments was $27.1 million.
52
| ITEM 8. | CONSOLIDATED FINANCIAL STATEMENTS AND SUPPLEMENTARY DATA |
INDEX TO CONSOLIDATED FINANCIAL STATEMENTS
The following financial statements are filed as part of this Annual Report on Form 10-K:
| Page No. | ||||
Reports of Ernst & Young LLP, Independent Registered Public Accounting Firm | 54 | |||
Consolidated Balance Sheets | 56 | |||
Consolidated Statements of Operations | 57 | |||
Consolidated Statements of Stockholders' Equity | 58 | |||
Consolidated Statements of Cash Flows | 59 | |||
Notes to Consolidated Financial Statements | 60 | |||
53
REPORT OF INDEPENDENT REGISTERED PUBLIC ACCOUNTING FIRM
The Board of Directors and Stockholders of
salesforce.com, inc.
We have audited the accompanying consolidated balance sheets of salesforce.com, inc. as of January 31, 2011 and 2010, and the related consolidated statements of operations, stockholders' equity, and cash flows for each of the three years in the period ended January 31, 2011. Our audits also included the financial statement schedule listed in the Index at Item 15(c). These financial statements and schedule are the responsibility of the Company's management. Our responsibility is to express an opinion on these financial statements and schedule based on our audits.
We conducted our audits in accordance with the standards of the Public Company Accounting Oversight Board (United States). Those standards require that we plan and perform the audit to obtain reasonable assurance about whether the financial statements are free of material misstatement. An audit includes examining, on a test basis, evidence supporting the amounts and disclosures in the financial statements. An audit also includes assessing the accounting principles used and significant estimates made by management, as well as evaluating the overall financial statement presentation. We believe that our audits provide a reasonable basis for our opinion.
In our opinion, the financial statements referred to above present fairly, in all material respects, the consolidated financial position of salesforce.com, inc. at January 31, 2011 and 2010, and the consolidated results of its operations and its cash flows for each of the three years in the period ended January 31, 2011, in conformity with U.S. generally accepted accounting principles. Also, in our opinion, the related financial statement schedule, when considered in relation to the basic financial statements taken as a whole, presents fairly in all material respects the information set forth therein.
We also have audited, in accordance with the standards of the Public Company Accounting Oversight Board (United States), salesforce.com, inc.'s internal control over financial reporting as of January 31, 2011, based on criteria established in Internal Control-Integrated Framework issued by the Committee of Sponsoring Organizations of the Treadway Commission and our report dated March 23, 2011 expressed an unqualified opinion thereon.
/s/ E RNST & Y OUNG LLP
San Jose, California
March 23, 2011
54
REPORT OF INDEPENDENT REGISTERED PUBLIC ACCOUNTING FIRM
The Board of Directors and Stockholders of
salesforce.com, inc.
We have audited salesforce.com, inc.'s internal control over financial reporting as of January 31, 2011, based on criteria established in Internal Control-Integrated Framework issued by the Committee of Sponsoring Organizations of the Treadway Commission (the COSO criteria). salesforce.com, inc.'s management is responsible for maintaining effective internal control over financial reporting, and for its assessment of the effectiveness of internal control over financial reporting included in the accompanying Management's Report on Internal Control Over Financial Reporting. Our responsibility is to express an opinion on the Company's internal control over financial reporting based on our audit.
We conducted our audit in accordance with the standards of the Public Company Accounting Oversight Board (United States). Those standards require that we plan and perform the audit to obtain reasonable assurance about whether effective internal control over financial reporting was maintained in all material respects. Our audit included obtaining an understanding of internal control over financial reporting, assessing the risk that a material weakness exists, testing and evaluating the design and operating effectiveness of internal control based on the assessed risk, and performing such other procedures as we considered necessary in the circumstances. We believe that our audit provides a reasonable basis for our opinion.
A company's internal control over financial reporting is a process designed to provide reasonable assurance regarding the reliability of financial reporting and the preparation of financial statements for external purposes in accordance with generally accepted accounting principles. A company's internal control over financial reporting includes those policies and procedures that (1) pertain to the maintenance of records that, in reasonable detail, accurately and fairly reflect the transactions and dispositions of the assets of the company; (2) provide reasonable assurance that transactions are recorded as necessary to permit preparation of financial statements in accordance with generally accepted accounting principles, and that receipts and expenditures of the Company are being made only in accordance with authorizations of management and directors of the company; and (3) provide reasonable assurance regarding prevention or timely detection of unauthorized acquisition, use or disposition of the company's assets that could have a material effect on the financial statements.
Because of its inherent limitations, internal control over financial reporting may not prevent or detect misstatements. Also, projections of any evaluation of effectiveness to future periods are subject to the risk that controls may become inadequate because of changes in conditions, or that the degree of compliance with the policies or procedures may deteriorate.
In our opinion, salesforce.com, inc. maintained, in all material respects, effective internal control over financial reporting as of January 31, 2011, based on the COSO criteria.
We also have audited, in accordance with the standards of the Public Company Accounting Oversight Board (United States), the consolidated balance sheets of salesforce.com, inc. as of January 31, 2011 and 2010, and the related consolidated statements of operations, stockholders' equity, and cash flows for each of the three years in the period ended January 31, 2011 of salesforce.com, inc. and our report dated March 23, 2011 expressed an unqualified opinion thereon.
/s/ E RNST & Y OUNG LLP
San Jose, California
March 23, 2011
55
salesforce.com, inc.
Consolidated Balance Sheets
(in thousands, except share and per share data)
| January 31, 2011 | January 31, 2010 | |||||||
Assets | ||||||||
Current assets: | ||||||||
Cash and cash equivalents | $ | 424,292 | $ | 1,011,306 | ||||
Short-term marketable securities | 72,678 | 230,659 | ||||||
Accounts receivable, net of allowance for doubtful accounts of $1,711 and $1,050 at January 31, 2011 and 2010, respectively | 426,943 | 320,956 | ||||||
Deferred commissions | 67,774 | 47,388 | ||||||
Deferred income taxes | 27,516 | 40,116 | ||||||
Prepaid expenses and other current assets | 55,721 | 55,734 | ||||||
Total current assets | 1,074,924 | 1,706,159 | ||||||
Marketable securities, noncurrent | 910,587 | 485,083 | ||||||
Property and equipment, net | 387,174 | 89,711 | ||||||
Deferred commissions, noncurrent | 48,842 | 28,140 | ||||||
Deferred income taxes, noncurrent | 41,199 | 27,579 | ||||||
Capitalized software, net | 127,987 | 34,809 | ||||||
Goodwill | 396,081 | 48,955 | ||||||
Other assets, net | 104,371 | 39,765 | ||||||
Total assets | $ | 3,091,165 | $ | 2,460,201 | ||||
Liabilities and stockholders' equity | ||||||||
Current liabilities: | ||||||||
Accounts payable | $ | 18,106 | $ | 14,791 | ||||
Accrued expenses and other current liabilities | 345,121 | 203,162 | ||||||
Deferred revenue | 913,239 | 690,177 | ||||||
Total current liabilities | 1,276,466 | 908,130 | ||||||
0.75% convertible senior notes due 2015, net | 472,538 | 450,198 | ||||||
Income taxes payable, noncurrent | 18,481 | 17,551 | ||||||
Long-term lease liabilities and other | 25,487 | 13,485 | ||||||
Deferred revenue, noncurrent | 21,702 | 14,171 | ||||||
Total liabilities | 1,814,674 | 1,403,535 | ||||||
Commitments and contingencies (Notes 8 and 9) | ||||||||
Salesforce.com stockholders' equity: | ||||||||
Preferred stock, $0.001 par value; 5,000,000 shares authorized and none issued and outstanding | 0 | 0 | ||||||
Common stock, $0.001 par value; 400,000,000 shares authorized, 132,921,147 and 127,152,449 issued and outstanding at January 31, 2011 and 2010, respectively | 133 | 127 | ||||||
Additional paid-in capital | 1,098,604 | 938,544 | ||||||
Accumulated other comprehensive income (loss) | 6,719 | (1,430 | ) | |||||
Retained earnings | 171,035 | 106,561 | ||||||
Total stockholders' equity controlling interest | 1,276,491 | 1,043,802 | ||||||
Total stockholders' equity noncontrolling interest | 0 | 12,864 | ||||||
Total stockholders' equity | 1,276,491 | 1,056,666 | ||||||
Total liabilities and stockholders' equity | $ | 3,091,165 | $ | 2,460,201 | ||||
See accompanying Notes.
56
salesforce.com, inc.
Consolidated Statements of Operations
(in thousands, except per share data)
| Fiscal Year Ended January 31, | ||||||||||||
| 2011 | 2010 | 2009 | ||||||||||
Revenues: | ||||||||||||
Subscription and support | $ | 1,551,145 | $ | 1,209,472 | $ | 984,574 | ||||||
Professional services and other | 105,994 | 96,111 | 92,195 | |||||||||
Total revenues | 1,657,139 | 1,305,583 | 1,076,769 | |||||||||
Cost of revenues (1): | ||||||||||||
Subscription and support | 208,243 | 159,172 | 127,082 | |||||||||
Professional services and other | 115,570 | 98,753 | 93,389 | |||||||||
Total cost of revenues | 323,813 | 257,925 | 220,471 | |||||||||
Gross profit | 1,333,326 | 1,047,658 | 856,298 | |||||||||
Operating expenses (1): | ||||||||||||
Research and development | 187,887 | 131,897 | 99,530 | |||||||||
Marketing and sales | 792,029 | 605,199 | 534,413 | |||||||||
General and administrative | 255,913 | 195,290 | 158,613 | |||||||||
Total operating expenses | 1,235,829 | 932,386 | 792,556 | |||||||||
Income from operations | 97,497 | 115,272 | 63,742 | |||||||||
Investment income | 37,735 | 30,408 | 22,774 | |||||||||
Interest expense | (24,909 | ) | (2,000 | ) | (107 | ) | ||||||
Other expense | (6,025 | ) | (1,299 | ) | (817 | ) | ||||||
Income before provision for income taxes and noncontrolling interest | 104,298 | 142,381 | 85,592 | |||||||||
Provision for income taxes | (34,601 | ) | (57,689 | ) | (37,557 | ) | ||||||
Consolidated net income | 69,697 | 84,692 | 48,035 | |||||||||
Less: Net income attributable to noncontrolling interest | (5,223 | ) | (3,973 | ) | (4,607 | ) | ||||||
Net income attributable to salesforce.com | $ | 64,474 | $ | 80,719 | $ | 43,428 | ||||||
Earnings per share-basic and diluted: | ||||||||||||
Basic net income per share attributable to salesforce.com common shareholders | $ | 0.50 | $ | 0.65 | $ | 0.36 | ||||||
Diluted net income per share attributable to salesforce.com common shareholders | 0.47 | 0.63 | 0.35 | |||||||||
Shares used in computing basic net income per share | 130,222 | 124,462 | 121,183 | |||||||||
Shares used in computing diluted net income per share | 136,598 | 128,114 | 125,228 | |||||||||
| (1) | Amounts include stock-based expenses, as follows (see Note 1): |
| Fiscal Year Ended January 31, | ||||||||||||
| 2011 | 2010 | 2009 | ||||||||||
Cost of revenues | $ | 12,158 | $ | 12,570 | $ | 11,051 | ||||||
Research and development | 18,897 | 13,129 | 9,852 | |||||||||
Marketing and sales | 56,451 | 39,722 | 36,028 | |||||||||
General and administrative | 32,923 | 23,471 | 20,435 | |||||||||
See accompanying Notes.
57
salesforce.com, inc.
Consolidated Statements of Stockholders' Equity
(in thousands, except share data)
| Common Stock | Additional Paid-in Capital | Accumulated Other Comprehensive Income/(Loss) | Retained Earnings (Deficit) | Total Stockholders' Equity Controlling Interest | Total Stockholders' Equity Noncontrolling Interest | Total Stockholders' Equity | ||||||||||||||||||||||||||
| Shares | Amount | |||||||||||||||||||||||||||||||
Balances at January 31, 2008 | 119,305,013 | $ | 119 | $ | 471,802 | $ | (2,276 | ) | $ | (17,586 | ) | $ | 452,059 | $ | 8,943 | $ | 461,002 | |||||||||||||||
Exercise of stock options, warrants and stock grants to board members for board services | 3,009,276 | 4 | 45,903 | 0 | 0 | 45,907 | 0 | 45,907 | ||||||||||||||||||||||||
Vested restricted stock units converted to shares | 535,773 | 0 | 0 | 0 | 0 | 0 | 0 | 0 | ||||||||||||||||||||||||
Tax benefits from employee stock plans | 0 | 0 | 55,421 | 0 | 0 | 55,421 | 0 | 55,421 | ||||||||||||||||||||||||
Stock-based expenses | 0 | 0 | 75,598 | 0 | 0 | 75,598 | 0 | 75,598 | ||||||||||||||||||||||||
Noncontrolling interest | 0 | 0 | 0 | 0 | 0 | 0 | 1,760 | 1,760 | ||||||||||||||||||||||||
Components of comprehensive income, net of tax: | ||||||||||||||||||||||||||||||||
Foreign currency translation adjustment | 0 | 0 | 0 | 260 | 0 | 260 | 0 | 260 | ||||||||||||||||||||||||
Unrealized loss on marketable securities and cash equivalents | 0 | 0 | 0 | (889 | ) | 0 | (889 | ) | 0 | (889 | ) | |||||||||||||||||||||
Net income attributable to salesforce.com | 0 | 0 | 0 | 0 | 43,428 | 43,428 | 0 | 43,428 | ||||||||||||||||||||||||
Total comprehensive income, year ended January 31, 2009 | 0 | 0 | 0 | 0 | 0 | 0 | 0 | 42,799 | ||||||||||||||||||||||||
Balances at January 31, 2009 | 122,850,062 | 123 | 648,724 | (2,905 | ) | 25,842 | 671,784 | 10,703 | 682,487 | |||||||||||||||||||||||
Exercise of stock options and stock grants to board members for board services | 3,472,826 | 4 | 96,153 | 0 | 0 | 96,157 | 0 | 96,157 | ||||||||||||||||||||||||
Vested restricted stock units converted to shares | 829,561 | 0 | 0 | 0 | 0 | 0 | 0 | 0 | ||||||||||||||||||||||||
Tax benefits from employee stock plans | 0 | 0 | 49,478 | 0 | 0 | 49,478 | 0 | 49,478 | ||||||||||||||||||||||||
Stock-based expenses | 0 | 0 | 86,570 | 0 | 0 | 86,570 | 0 | 86,570 | ||||||||||||||||||||||||
Equity component of the convertible notes issuance, net. | 0 | 0 | 124,836 | 0 | 0 | 124,836 | 0 | 124,836 | ||||||||||||||||||||||||
Purchase of convertible note hedges | 0 | 0 | (126,500 | ) | 0 | 0 | (126,500 | ) | 0 | (126,500 | ) | |||||||||||||||||||||
Sale of warrants | 0 | 0 | 59,283 | 0 | 0 | 59,283 | 0 | 59,283 | ||||||||||||||||||||||||
Noncontrolling interest | 0 | 0 | 0 | 0 | 0 | 0 | 2,161 | 2,161 | ||||||||||||||||||||||||
Components of comprehensive income, net of tax: | ||||||||||||||||||||||||||||||||
Foreign currency translation adjustment and other | 0 | 0 | 0 | (2,820 | ) | 0 | (2,820 | ) | 0 | (2,820 | ) | |||||||||||||||||||||
Unrealized gain on marketable securities and cash equivalents | 0 | 0 | 0 | 4,295 | 0 | 4,295 | 0 | 4,295 | ||||||||||||||||||||||||
Net income attributable to salesforce.com | 0 | 0 | 0 | 0 | 80,719 | 80,719 | 0 | 80,719 | ||||||||||||||||||||||||
Total comprehensive income, year ended January 31, 2010 | 0 | 0 | 0 | 0 | 0 | 0 | 0 | 82,194 | ||||||||||||||||||||||||
Balances at January 31, 2010 | 127,152,449 | 127 | 938,544 | (1,430 | ) | 106,561 | 1,043,802 | 12,864 | 1,056,666 | |||||||||||||||||||||||
Exercise of stock options and stock grants to board members for board services | 4,697,518 | 5 | 165,494 | 0 | 0 | 165,499 | 0 | 165,499 | ||||||||||||||||||||||||
Vested restricted stock units converted to shares | 1,071,180 | 1 | 0 | 0 | 0 | 1 | 0 | 1 | ||||||||||||||||||||||||
Tax benefits from employee stock plans | 0 | 0 | 36,069 | 0 | 0 | 36,069 | 0 | 36,069 | ||||||||||||||||||||||||
Stock-based expenses | 0 | 0 | 115,139 | 0 | 0 | 115,139 | 0 | 115,139 | ||||||||||||||||||||||||
Purchase of subsidiary stock, net | 0 | 0 | (156,187 | ) | 0 | 0 | (156,187 | ) | 0 | (156,187 | ) | |||||||||||||||||||||
Other | 0 | 0 | (455 | ) | 0 | 0 | (455 | ) | 0 | (455 | ) | |||||||||||||||||||||
Noncontrolling interest | 0 | 0 | 0 | 0 | 0 | 0 | (12,864 | ) | (12,864 | ) | ||||||||||||||||||||||
Components of comprehensive income, net of tax: | ||||||||||||||||||||||||||||||||
Foreign currency translation adjustment and other | 0 | 0 | 0 | 5,709 | 0 | 5,709 | 0 | 5,709 | ||||||||||||||||||||||||
Unrealized gain on marketable securities and cash equivalents and publicly traded strategic investments | 0 | 0 | 0 | 2,440 | 0 | 2,440 | 0 | 2,440 | ||||||||||||||||||||||||
Net income attributable to salesforce.com | 0 | 0 | 0 | 0 | 64,474 | 64,474 | 0 | 64,474 | ||||||||||||||||||||||||
Total comprehensive income, year ended January 31, 2011 | 0 | 0 | 0 | 0 | 0 | 0 | 0 | 72,623 | ||||||||||||||||||||||||
Balances at January 31, 2011 | 132,921,147 | $ | 133 | $ | 1,098,604 | $ | 6,719 | $ | 171,035 | $ | 1,276,491 | $ | 0 | $ | 1,276,491 | |||||||||||||||||
See accompanying Notes.
58
salesforce.com, inc.
Consolidated Statements of Cash Flows
(in thousands)
| Fiscal Year Ended January 31, | ||||||||||||
| 2011 | 2010 | 2009 | ||||||||||
Operating activities: | ||||||||||||
Consolidated net income | $ | 69,697 | $ | 84,692 | $ | 48,035 | ||||||
Adjustments to reconcile net income to net cash provided by operating activities: | ||||||||||||
Depreciation and amortization | 75,746 | 53,177 | 35,971 | |||||||||
Amortization of debt discount and transaction costs | 19,621 | 728 | 0 | |||||||||
Amortization of deferred commissions | 80,159 | 63,891 | 58,732 | |||||||||
Expenses related to stock-based awards | 120,429 | 88,892 | 77,366 | |||||||||
Excess tax benefits from employee stock plans | (35,991 | ) | (51,539 | ) | (54,597 | ) | ||||||
Loss on securities | 0 | 0 | 1,783 | |||||||||
Changes in assets and liabilities: | ||||||||||||
Accounts receivable, net | (102,507 | ) | (54,522 | ) | (44,798 | ) | ||||||
Deferred commissions | (121,247 | ) | (82,336 | ) | (63,701 | ) | ||||||
Prepaid expenses and other current assets | 2,001 | (3,899 | ) | (4,746 | ) | |||||||
Other assets | (9,770 | ) | (1,405 | ) | (1,292 | ) | ||||||
Accounts payable | 1,246 | (1,588 | ) | 8,512 | ||||||||
Accrued expenses and other current liabilities | 132,004 | 64,498 | 55,440 | |||||||||
Deferred revenue | 227,693 | 110,322 | 112,852 | |||||||||
Net cash provided by operating activities | 459,081 | 270,911 | 229,557 | |||||||||
Investing activities: | ||||||||||||
Business combinations, net of cash acquired | (403,331 | ) | (11,999 | ) | (27,907 | ) | ||||||
Land activity and building improvements | (277,944 | ) | 0 | 0 | ||||||||
Strategic investments | (20,105 | ) | (4,400 | ) | 0 | |||||||
Purchases of marketable securities | (1,682,549 | ) | (1,317,952 | ) | (449,035 | ) | ||||||
Sales of marketable securities | 1,197,492 | 874,573 | 154,287 | |||||||||
Maturities of marketable securities | 214,770 | 130,663 | 284,339 | |||||||||
Capital expenditures | (90,887 | ) | (49,501 | ) | (61,059 | ) | ||||||
Net cash used in investing activities | (1,062,554 | ) | (378,616 | ) | (99,375 | ) | ||||||
Financing activities: | ||||||||||||
Proceeds from borrowings on convertible debt | 0 | 567,094 | 0 | |||||||||
Proceeds from issuance of warrants | 0 | 59,283 | 0 | |||||||||
Purchase of convertible note hedge | 0 | (126,500 | ) | 0 | ||||||||
Purchase of subsidiary stock | (171,964 | ) | 0 | (21,622 | ) | |||||||
Proceeds from the exercise of stock options | 160,402 | 93,856 | 43,311 | |||||||||
Excess tax benefits from employee stock plans | 35,991 | 51,539 | 54,597 | |||||||||
Principal payments on capital lease obligations | (10,355 | ) | (8,119 | ) | (997 | ) | ||||||
Net cash provided by financing activities | 14,074 | 637,153 | 75,289 | |||||||||
Effect of exchange rate changes | 2,385 | (1,976 | ) | (732 | ) | |||||||
Net increase (decrease) in cash and cash equivalents | (587,014 | ) | 527,472 | 204,739 | ||||||||
Cash and cash equivalents, beginning of period | 1,011,306 | 483,834 | 279,095 | |||||||||
Cash and cash equivalents, end of period | $ | 424,292 | $ | 1,011,306 | $ | 483,834 | ||||||
Supplemental cash flow disclosure: | ||||||||||||
Cash paid during the period for: | ||||||||||||
Interest, net | $ | 1,250 | $ | 1,069 | $ | 107 | ||||||
Income taxes, net of tax refunds | $ | 90 | $ | 28,479 | $ | 9,600 | ||||||
Non-cash financing and investing activities | ||||||||||||
Fixed assets acquired under capital leases | $ | 13,224 | $ | 17,000 | $ | 6,406 | ||||||
See accompanying Notes.
59
salesforce.com, inc.
Notes to Consolidated Financial Statements
1. Summary of Business and Significant Accounting Policies
Description of Business
salesforce.com, inc. (the "Company") is a leading provider of enterprise cloud computing applications. The Company provides a comprehensive customer and collaboration relationship management ("CRM") service to businesses of all sizes and industries worldwide and provides a technology platform for customers and developers to build and run applications. The Company offers its services on a subscription basis.
Fiscal Year
The Company's fiscal year ends on January 31. References to fiscal 2011, for example, refer to the fiscal year ending January 31, 2011.
Use of Estimates
The preparation of financial statements in conformity with U.S. GAAP requires management to make estimates and assumptions in the Company's consolidated financial statements and notes thereto.
Significant estimates and assumptions made by management include the determination of the provision for income taxes, the fair value of stock awards issued, and the determination of the fair value of assets acquired and liabilities assumed for business acquisitions. Actual results could differ from those estimates.
Principles of Consolidation
The consolidated financial statements include the accounts of the Company and its wholly owned subsidiaries. All significant intercompany balances and transactions have been eliminated in consolidation.
In December 2000, the Company established a Japanese joint venture, Kabushiki Kaisha salesforce.com ("Salesforce Japan"), with SunBridge, Inc., a Japanese corporation, to assist the Company with its sales efforts in Japan. During fiscal 2011, the Company acquired SunBridge's and other shareholders' interest in Salesforce Japan, and increased the Company's ownership from 72 percent to 100 percent.
As the Company did not obtain 100 percent ownership until the fourth quarter of fiscal 2011, the Company recorded a noncontrolling interest in the consolidated statement of operations for the noncontrolling investors' interests in the net assets and operations of the Salesforce Japan. Noncontrolling interest of $0 and $12.9 million as of January 31, 2011 and 2010 is reflected in stockholders' equity, respectively.
Segments
The Company operates in one segment.
Foreign Currency Translation
The functional currency of the Company's major foreign subsidiaries is generally the local currency. Adjustments resulting from translating foreign functional currency financial statements into U.S. dollars are recorded as part of a separate component of stockholders' equity. Foreign currency transaction gains and losses are included in net income for the period. All assets and liabilities denominated in a foreign currency are
60
translated into U.S. dollars at the exchange rate on the balance sheet date. Revenues and expenses are translated at the average exchange rate during the period. Equity transactions are translated using historical exchange rates.
Concentrations of Credit Risk and Significant Customers
The Company's financial instruments that are exposed to concentrations of credit risk consist primarily of cash and cash equivalents, marketable securities and trade accounts receivable. Although the Company deposits its cash with multiple financial institutions, its deposits, at times, may exceed federally insured limits. Collateral is not required for accounts receivable. The Company maintains an allowance for doubtful accounts receivable balances. The allowance is based upon historical loss patterns, the number of days that billings are past due and an evaluation of the potential risk of loss associated with delinquent accounts.
No customer accounted for more than 5 percent of accounts receivable at January 31, 2011 and 2010. No single customer accounted for 5 percent or more of total revenue during fiscal 2011, 2010, and 2009.
As of January 31, 2011 and 2010, assets located outside the Americas were 16 percent and 12 percent of total assets, respectively. Revenues by geographical region are as follows (in thousands):
| Fiscal Year Ended January 31, | ||||||||||||
| 2011 | 2010 | 2009 | ||||||||||
Revenues by geography: | ||||||||||||
Americas | $ | 1,135,019 | $ | 923,823 | $ | 776,495 | ||||||
Europe | 291,784 | 232,367 | 190,685 | |||||||||
Asia Pacific | 230,336 | 149,393 | 109,589 | |||||||||
| $ | 1,657,139 | $ | 1,305,583 | $ | 1,076,769 | |||||||
Cash and Cash Equivalents
The Company considers all highly liquid investments purchased with an original maturity of three months or less to be cash equivalents. Cash and cash equivalents are stated at fair value.
Marketable Securities
Management determines the appropriate classification of marketable securities at the time of purchase and reevaluates such determination at each balance sheet date. Securities are classified as available for sale and are carried at fair value, with the unrealized gains and losses, net of tax, reported as a separate component of stockholders' equity. Fair value is determined based on quoted market rates when observable or utilizing data points that are observable, such as quoted prices, interest rates and yield curves. Declines in fair value judged to be other-than-temporary on securities available for sale are included as a component of investment income. In order to determine whether a decline in value is other-than-temporary, we evaluate, among other factors: the duration and extent to which the fair value has been less than the carrying value and our intent and ability to retain the investment for a period of time sufficient to allow for any anticipated recovery in fair market value. The cost of securities sold is based on the specific-identification method. Interest on securities classified as available for sale is also included as a component of investment income.
Fair Value Measurement
The Company reports its financial and non-financial assets and liabilities that are re-measured and reported at fair value at each reporting period.
61
The Company measures its cash equivalents, marketable securities, foreign currency derivative contracts and contingent considerations related to acquisitions at fair value. All of the Company's cash equivalents, marketable securities and foreign currency derivative contracts are classified within Level 1 or Level 2, which are described below. This is because the Company's cash equivalents, marketable securities and foreign currency derivative contracts are valued using quoted market prices or alternative pricing sources and models utilizing market observable inputs.
The Company established a three-tier fair value hierarchy, which prioritizes the inputs used in the valuation methodologies in measuring fair value:
Level 1. | Observable inputs that reflect quoted prices (unadjusted) for identical assets or liabilities in active markets. | |
Level 2. | Include other inputs that are directly or indirectly observable in the marketplace. | |
Level 3. | Unobservable inputs which are supported by little or no market activity. | |
The following table presents information about the Company's assets and liabilities that are measured at fair value as of January 31, 2011 and indicates the fair value hierarchy of the valuation (in thousands):
Description | Quoted Prices in Active Markets for Identical Assets (Level 1) | Significant Other Observable Inputs (Level 2) | Significant Unobservable Inputs (Level 3) | Balances as of January 31, 2011 | ||||||||||||
Cash equivalents (1): | ||||||||||||||||
Time deposits | $ | 26,565 | $ | 0 | $ | 0 | $ | 26,565 | ||||||||
Money market mutual funds | 122,516 | 0 | 0 | 122,516 | ||||||||||||
Marketable securities: | ||||||||||||||||
Corporate notes and obligations | 0 | 707,613 | 0 | 707,613 | ||||||||||||
U.S. agency obligations | 0 | 79,408 | 0 | 79,408 | ||||||||||||
U.S. treasury securities | 22,706 | 0 | 0 | 22,706 | ||||||||||||
Government obligations | 6,532 | 0 | 0 | 6,532 | ||||||||||||
Mortgage backed securities | 0 | 38,886 | 0 | 38,886 | ||||||||||||
Collateralized mortgage obligations | 0 | 105,039 | 0 | 105,039 | ||||||||||||
Municipal securities | 0 | 23,081 | 0 | 23,081 | ||||||||||||
Foreign currency derivative contracts (2) | 0 | 1,539 | 0 | 1,539 | ||||||||||||
Total Assets | $ | 178,319 | $ | 955,566 | $ | 0 | $ | 1,133,885 | ||||||||
Liabilities | ||||||||||||||||
Foreign currency derivative contracts (3) | $ | 0 | $ | 2,863 | $ | 0 | $ | 2,863 | ||||||||
Contingent considerations (related to acquisitions, see Note 6) (3) | 0 | 0 | 17,138 | 17,138 | ||||||||||||
Total Liabilities | $ | 0 | $ | 2,863 | $ | 17,138 | $ | 20,001 | ||||||||
| (1) | Included in "cash and cash equivalents" in the accompanying Consolidated Balance Sheet as of January 31, 2011, in addition to $275.2 million of cash. |
| (2) | Included in "prepaid expenses and other current assets" in the accompanying Consolidated Balance Sheet as of January 31, 2011. |
| (3) | Included in "accrued expenses and other current liabilities" in the accompanying Consolidated Balance Sheet as of January 31, 2011. |
62
The following table presents the Company's liabilities measured at fair value using significant unobservable inputs (Level 3) at January 31, 2011. These liabilities consist of the Company's contingent considerations related to acquisitions. During fiscal 2011, the Company recorded the fair value of the Company's contingent considerations using a discounted cash flow model (in thousands):
Balance at February 1, 2010 | $ | 0 | ||
Additions | 17,138 | |||
Balance at January 31, 2011 | $ | 17,138 | ||
The following table presents information about the Company's assets and liabilities that are measured at fair value on a recurring basis as of January 31, 2010 and indicates the fair value hierarchy of the valuation (in thousands):
Description | Quoted Prices in Active Markets for Identical Assets (Level 1) | Significant Other Observable Inputs (Level 2) | Significant Unobservable Inputs (Level 3) | Balances as of January 31, 2010 | ||||||||||||
Cash equivalents (1): | ||||||||||||||||
Time deposits | $ | 11,410 | $ | 0 | $ | 0 | $ | 11,410 | ||||||||
Money market mutual funds | 123,868 | 0 | 0 | 123,868 | ||||||||||||
U.S. treasury securities | 399,140 | 0 | 0 | 399,140 | ||||||||||||
U.S. agency obligations | 0 | 364,197 | 0 | 364,197 | ||||||||||||
Marketable securities: | ||||||||||||||||
Corporate notes and obligations | 0 | 337,574 | 0 | 337,574 | ||||||||||||
U.S. agency obligations | 0 | 163,455 | 0 | 163,455 | ||||||||||||
U.S. treasury securities | 136,660 | 0 | 0 | 136,660 | ||||||||||||
Mortgage backed securities | 0 | 40,865 | 0 | 40,865 | ||||||||||||
Collateralized mortgage obligations | 0 | 37,188 | 0 | 37,188 | ||||||||||||
Foreign currency derivative contracts (2) | 0 | 1,593 | 0 | 1,593 | ||||||||||||
Total Assets | $ | 671,078 | $ | 944,872 | $ | 0 | $ | 1,615,950 | ||||||||
Liabilities | ||||||||||||||||
Foreign currency derivative contracts (3) | $ | 0 | $ | 402 | $ | 0 | $ | 402 | ||||||||
Total Liabilities | $ | 0 | $ | 402 | $ | 0 | $ | 402 | ||||||||
| (1) | Included in "cash and cash equivalents" in the accompanying Consolidated Balance Sheet as of January 31, 2010, in addition to $112.7 million of cash. |
| (2) | Included in "prepaid expenses and other current assets" in the accompanying Consolidated Balance Sheet as of January 31, 2010. |
| (3) | Included in "accrued expenses and other current liabilities" in the accompanying Consolidated Balance Sheet as of January 31, 2010. |
Strategic Investments
The Company has one investment in a marketable security and certain interests in non-marketable securities that the Company considers strategic investments. The costs of the non-marketable securities included in strategic investments approximates their fair value. The total fair value of the Company's strategic investments was $27.1 million and $6.3 million as of January 31, 2011 and 2010, respectively. The fair value of the Company's marketable security of $6.0 million includes an unrealized gain of $5.2 million as of January 31, 2011. Strategic investments are recorded in Other Assets, net on the consolidated balance sheet.
63
Derivative Financial Instruments
The Company enters into foreign currency derivative contracts with financial institutions to reduce the risk that its cash flows and earnings will be adversely affected by foreign currency exchange rate fluctuations. The Company uses forward currency derivative contracts to minimize the Company's exposure of balances denominated in Euros, Swiss francs, Australian dollars, Singapore dollars, Japanese yen and British pounds. The Company's foreign currency derivative contracts which are not designated as hedging instruments are used to reduce the exchange rate risk associated primarily with intercompany receivables and payables. The Company's program is not designated for trading or speculative purposes. As of January 31, 2011 and 2010 the foreign currency derivative contracts that were not settled are recorded at fair value on the consolidated balance sheet.
Foreign currency derivative contracts are marked-to-market at the end of each reporting period with gains and losses recognized as other income (expense) to offset the gains or losses resulting from the settlement or remeasurement of the underlying foreign currency denominated receivables and payables. While the contract or notional amount is often used to express the volume of foreign currency derivative contracts, the amounts potentially subject to credit risk are generally limited to the amounts, if any, by which the counterparties' obligations under the agreements exceed the obligations of the Company to the counterparties.
Details on outstanding foreign currency derivative contracts related primarily to intercompany receivables and payables are presented below (in thousands):
| January 31, 2011 | January 31, 2010 | |||||||
Notional amount of foreign currency derivative contracts | $ | 202,491 | $ | 74,705 | ||||
Fair value of foreign currency derivative contracts | $ | (1,324 | ) | $ | 1,191 | |||
The Company's fair value of our outstanding derivative instruments are summarized below (in thousands):
| Fair Value of Derivative Instruments | ||||||||||||
| Balance Sheet Location | As of January 31, 2011 | As of January 31, 2010 | ||||||||||
Derivative Assets | ||||||||||||
Derivatives not designated as hedging instruments: | ||||||||||||
Foreign currency derivative contracts | | Prepaid expenses and other current assets | | $ | 1,539 | $ | 1,593 | |||||
Derivative Liabilities | ||||||||||||
Derivatives not designated as hedging instruments: | ||||||||||||
Foreign currency derivative contracts | | Accrued expenses and other current liabilities | | $ | 2,863 | $ | 402 | |||||
The effect of the derivative instruments not designated as hedging instruments on the Consolidated Statements of Operations for the year ended January 31, 2011, 2010 and 2009, respectively are summarized below (in thousands):
Derivatives Not Designated as Hedging Instruments | Gains (Losses) Recognized in Income on Derivative Instruments | |||||||||||||||
| Year ended January 31, | ||||||||||||||||
| Location | 2011 | 2010 | 2009 | |||||||||||||
Foreign currency derivative contracts | Other expense | $ | (1,324 | ) | $ | 1,191 | $ | (1,004 | ) | |||||||
64
Investment Income
Investment income consists of interest income, realized gains, and realized losses on the Company's cash, cash equivalents and marketable securities. The components of investment income are presented below (in thousands):
| Fiscal Year Ended January 31, | ||||||||||||
(In thousands) | 2011 | 2010 | 2009 | |||||||||
Interest income | $ | 28,273 | $ | 21,219 | $ | 24,295 | ||||||
Realized gains | 12,460 | 13,391 | 1,048 | |||||||||
Realized losses | (2,998 | ) | (4,202 | ) | (2,569 | ) | ||||||
Total investment income | $ | 37,735 | $ | 30,408 | $ | 22,774 | ||||||
Interest Expense
Interest expense consists of interest on the Company's capital lease commitments and 0.75% convertible senior notes (the "Notes"). As described in Note 2, in accounting for the Notes at the time of issuance in January 2010, the carrying amount of the liability component was calculated by measuring the fair value of a similar liability that did not have an associated convertible feature. The excess of the principal amount of the liability component over its carrying amount ("debt discount") is amortized, using an effective interest rate of 5.86%, to interest expense over the term of the Notes.
Property and Equipment
Fixed assets are stated at cost. Depreciation is calculated on a straight-line basis over the estimated useful lives of those assets as follows:
| Computers, equipment, and software | 3 to 5 years | |
| Furniture and fixtures | 5 years | |
| Leasehold improvements | Shorter of the estimated useful life or the lease term | |
| Buildings and improvements | Amortized over the estimated useful lives of the respective assets when they are ready for their intended use. |
When assets are retired, the cost and accumulated depreciation and amortization are removed from their respective accounts and any loss on such retirement is reflected in operating expenses. When assets are otherwise disposed of, the cost and related accumulated depreciation and amortization are removed from their respective accounts and any gain or loss on such sale or disposal is reflected in other income.
Capitalized Interest Cost
Interest costs related to major construction projects, specifically the Company's campus project and capitalized internal-use software development costs, are capitalized until the underlying asset is placed into service. Capitalized interest is calculated by multiplying the effective interest rate of the Notes by the qualifying costs. As the qualifying asset is placed into service, the qualifying asset and the related capitalized interest are amortized over the useful life of the related asset. Interest costs of $3.7 million related to the buildings and improvements and $0.3 million related to the Company's capitalized internal-use software development efforts were capitalized in fiscal 2011. No interest costs were capitalized in fiscal 2010.
65
Impairment of Long-Lived Assets
The Company evaluates the recoverability of its long-lived assets for possible impairment whenever events or circumstances indicate that the carrying amount of such assets may not be recoverable. If such review indicates that the carrying amount of long-lived assets is not recoverable, the carrying amount of such assets is reduced to fair value.
There was no impairment of long-lived assets during fiscal 2011, 2010, and 2009.
The Company evaluates and tests the recoverability of the goodwill for impairment annually in the fourth quarter or more often if and when circumstances indicate that goodwill may not be recoverable. There was no impairment of goodwill during fiscal 2011, 2010, and 2009.
Capitalized Software Costs
For its website development costs and the development costs related to its enterprise cloud computing services, the company capitalizes costs incurred during the application development stage. Costs related to preliminary project activities and post implementation activities were expensed as incurred. Internal-use software is amortized on a straight line basis over its estimated useful life, generally three years. Management evaluates the useful lives of these assets on an annual basis and tests for impairment whenever events or changes in circumstances occur that could impact the recoverability of these assets.
The Company capitalized $19.6 million, $15.1 million, and $10.2 million of costs during fiscal 2011, 2010, and 2009, respectively. Amortization expense totaled $13.1 million, $9.9 million, and $6.6 million during fiscal 2011, 2010 and 2009, respectively.
Comprehensive Income (loss)
Comprehensive income (loss) consists of net income and accumulated other comprehensive income (loss), which includes certain changes in equity that are excluded from net income. Specifically, cumulative foreign currency translation adjustments and unrealized gains and losses on marketable securities, net of taxes of $5.0 million in fiscal 2011 and $3.9 million in fiscal 2010, are included in accumulated other comprehensive income (loss). Accumulated other comprehensive income (loss) has been reflected in stockholders' equity.
The components of accumulated other comprehensive income (loss) were as follows (in thousands):
| As of January 31, | ||||||||
| 2011 | 2010 | |||||||
Foreign currency translation and other adjustments | $ | (1,357 | ) | $ | (7,066 | ) | ||
Net unrealized gain on marketable securities | 8,076 | 5,636 | ||||||
| $ | 6,719 | $ | (1,430 | ) | ||||
Net Income Per Share
Basic net income per share attributable to salesforce.com is computed by dividing net income attributable to salesforce.com by the weighted-average number of common shares outstanding for the fiscal period. Diluted net income per share attributable to salesforce.com is computed giving effect to all potential weighted average dilutive common stock, including options, restricted stock units, warrants and the convertible senior notes. The dilutive effect of outstanding awards is reflected in diluted earnings per share by application of the treasury stock method.
66
A reconciliation of the denominator used in the calculation of basic and diluted net income per share attributable to salesforce.com is as follows (in thousands):
| Fiscal Year Ended January 31, | ||||||||||||
| 2011 | 2010 | 2009 | ||||||||||
Numerator: | ||||||||||||
Net income attributable to salesforce.com | $ | 64,474 | $ | 80,719 | $ | 43,428 | ||||||
Denominator: | ||||||||||||
Weighted-average shares outstanding for basic earnings per share | 130,222 | 124,462 | 121,183 | |||||||||
Effect of dilutive securities: | ||||||||||||
0.75% convertible senior notes | 1,561 | 0 | 0 | |||||||||
Employee stock awards | 4,815 | 3,652 | 4,045 | |||||||||
Adjusted weighted-average shares outstanding and assumed conversions for diluted earnings per share | 136,598 | 128,114 | 125,228 | |||||||||
The following were excluded from the computation of diluted shares outstanding as they would have had an anti-dilutive impact. The dilutive securities are excluded when, for example, their exercise prices, unrecognized compensation and tax benefits are greater than the average fair values of the Company's common stock (in thousands). These securities could be included in the future if the average market value of the Company's common shares increases and is greater than the exercise price.
| Fiscal Year Ended January 31, | ||||||||||||
| 2011 | 2010 | 2009 | ||||||||||
Stock awards | 1,061 | 4,455 | 3,797 | |||||||||
Warrants | 6,736 | 6,736 | 0 | |||||||||
Income Taxes
The Company uses the liability method of accounting for income taxes. Under this method, deferred tax assets and liabilities are determined based on temporary differences between the financial statement and tax basis of assets and liabilities and net operating loss and credit carryforwards using enacted tax rates in effect for the year in which the differences are expected to reverse. The effect on deferred tax assets and liabilities of a change in tax rates is recognized in income in the period that includes the enactment date. Valuation allowances are established when necessary to reduce deferred tax assets to the amounts more likely than not expected to be realized.
Tax positions for the Company and its subsidiaries are subject to income tax audits by multiple tax jurisdictions throughout the world. The Company recognizes the tax benefit of an uncertain tax position only if it is more likely than not that the position is sustainable upon examination by the taxing authority, based on the technical merits. The tax benefit recognized is measured as the largest amount of benefit which is greater than 50 percent likely to be realized upon settlement with the taxing authority. The Company recognizes interest accrued and penalties related to unrecognized tax benefits in its tax provision.
The total income tax benefit recognized in the accompanying consolidated statements of operations related to stock-based awards was $44.1 million, $32.1 million and $26.3 million for fiscal 2011, 2010 and 2009, respectively.
Revenue Recognition
The Company derives its revenues from two sources: (1) subscription revenues, which are comprised of subscription fees from customers accessing its enterprise cloud computing application service, and from customers purchasing additional support beyond the standard support that is included in the basic subscription fee; and (2) related professional services and other revenue. "Other revenue" consists primarily of training fees. The Company recognizes revenue when all of the following conditions are met:
| • | There is persuasive evidence of an arrangement; |
67
| • | The service has been provided to the customer; |
| • | The collection of the fees is reasonably assured; and |
| • | The amount of fees to be paid by the customer is fixed or determinable. |
The Company's arrangements do not contain general rights of return.
Subscription and support revenues are recognized ratably over the contract terms beginning on the commencement date of each contract. Amounts that have been invoiced are recorded in accounts receivable and in deferred revenue or revenue, depending on whether the revenue recognition criteria have been met.
Professional services and other revenues, when sold with subscription and support offerings, are accounted for separately when these services have value to the customer on a standalone basis and there is objective and reliable evidence of fair value of each deliverable. When accounted for separately, revenues are recognized as the services are rendered for time and material contracts, and when the milestones are achieved and accepted by the customer for fixed price contracts. The majority of the Company's consulting contracts are on a time and materials basis. Training revenues are recognized after the services are performed. For revenue arrangements with multiple deliverables, such as an arrangement that includes subscription, premium support and consulting or training services, the Company allocates the total amount the customer will pay to the separate units of accounting based on their relative fair values, as determined by the price of the undelivered items when sold separately.
In determining whether the consulting services can be accounted for separately from subscription and support revenues, the Company considers the following factors for each consulting agreement: availability of the consulting services from other vendors, whether objective and reliable evidence for fair value exists for the undelivered elements, the nature of the consulting services, the timing of when the consulting contract was signed in comparison to the subscription service start date, and the contractual dependence of the subscription service on the customer's satisfaction with the consulting work. If a consulting arrangement does not qualify for separate accounting, the Company recognizes the consulting revenue ratably over the remaining term of the subscription contract. Additionally, in these situations, the Company defers only the direct costs of the consulting arrangement and amortizes those costs over the same time period as the consulting revenue is recognized. As of January 31, 2011 and 2010, the deferred cost on the accompanying consolidated balance sheet totaled $28.1 million and $19.1 million, respectively. These deferred costs are included in prepaid expenses and other current assets and other assets.
Deferred Revenue
Deferred revenue primarily consists of billings or payments received in advance of revenue recognition from the Company's subscription service described above and is recognized as the revenue recognition criteria are met. The Company generally invoices its customers in annual or quarterly installments. Accordingly, the deferred revenue balance does not represent the total contract value of annual or multi-year, non-cancelable subscription agreements. Deferred revenue also includes certain deferred professional services fees which are recognized as revenue ratably over the subscription contract term. The Company defers the professional service fees in situations where the professional services and subscription contracts are accounted for as a single unit of accounting. Deferred revenue that will be recognized during the succeeding 12-month period is recorded as current deferred revenue and the remaining portion is recorded as noncurrent. Approximately 6 percent of total deferred revenue as of both January 31, 2011 and 2010, related to deferred professional services revenue.
Deferred Commissions
Deferred commissions are the incremental costs that are directly associated with non-cancelable subscription contracts with customers and consist of sales commissions paid to the Company's direct sales force.
68
The commissions are deferred and amortized over the non-cancelable terms of the related customer contracts, which are typically 12 to 24 months. The commission payments are paid in full the month after the customer's service commences. The deferred commission amounts are recoverable through the future revenue streams under the non-cancelable customer contracts. The Company believes this is the preferable method of accounting as the commission charges are so closely related to the revenue from the non-cancelable customer contracts that they should be recorded as an asset and charged to expense over the same period that the subscription revenue is recognized. Amortization of deferred commissions is included in marketing and sales expense in the accompanying consolidated statements of operations.
Business Combinations
The Company recognizes separately from goodwill the fair value of assets acquired and the liabilities assumed. Goodwill as of the acquisition date is measured as the excess of consideration transferred and the net of the acquisition date fair values of the assets acquired and the liabilities assumed. While the Company uses its best estimates and assumptions as a part of the purchase price allocation process to accurately value assets acquired and liabilities assumed at the acquisition date, the Company's estimates are inherently uncertain and subject to refinement. As a result, during the measurement period, which may be up to one year from the acquisition date, the Company may record adjustments to the fair value of assets acquired and liabilities assumed, with the corresponding offset to goodwill. Upon the conclusion of the measurement period or final determination of the fair value of assets acquired or liabilities assumed, whichever comes first, any subsequent adjustments are recorded to the Company's consolidated statements of operations.
In addition, uncertain tax positions and tax related valuation allowances assumed in connection with a business combination are initially estimated as of the acquisition date. The Company reevaluates these items quarterly and records any adjustments to the Company's preliminary estimates to goodwill provided that the Company is within the measurement period and the Company continues to collect information in order to determine their estimated fair values as of the date of acquisition. Subsequent to the measurement period or the Company's final determination of the tax allowance's or contingency's estimated value, changes to these uncertain tax positions and tax related valuation allowances will affect the Company's provision for income taxes in the Company's consolidated statement of operations.
Accounting for Stock-Based Compensation
The Company recognizes share-based expenses on a straight-line over the requisite service period of the awards, which is the vesting term of four years. Stock-based expenses are recognized net of estimated forfeiture activity.
The fair value of each option grant was estimated on the date of grant using the Black-Scholes option pricing model with the following assumptions and fair value per share:
| 2011 | 2010 | 2009 | ||||
Volatility | 45 - 50% | 50 - 60% | 47 - 60% | |||
Estimated life | 3.7 - 3.8 years | 3.8 - 4 years | 4 years | |||
Weighted-average risk-free interest rate | 0.98 - 2.1% | 1.78 - 2.39% | 1.47 - 3.08% | |||
Dividend yield | 0 | 0 | 0 | |||
Weighted-average fair value per share of grants | $48.83 | $24.73 | $15.39 |
Since November 2009, the weighted-average estimated life was based on an actual analysis of expected life. Prior to November 2009, the weighted-average estimated life assumption of 4 years was based on the average of the vesting term and the 5 year contractual lives of options awarded. The weighted average risk free interest rate is based on the rate for a 4 year U.S. government security at the time of the option grant.
69
The Company estimated its future stock price volatility considering both its observed option-implied volatilities and its historical volatility calculations. Management believes this is the best estimate of the expected volatility over the weighted-average expected life of its option grants.
During fiscal 2011 and 2010, the Company capitalized $2.6 million and $2.4 million, respectively, of stock based expenses related to capitalized internal-use software development and deferred professional services costs.
During fiscal 2011, the Company recognized stock-based expense of $120.4 million. As of January 31, 2011, the aggregate stock compensation remaining to be amortized to costs and expenses was $559.8 million. The Company expects this stock compensation balance to be amortized as follows: $195.1 million during fiscal 2012; $157.9 million during fiscal 2013; $129.6 million during fiscal 2014; $76.8 million during fiscal 2015 and $0.4 million during fiscal 2016. The expected amortization reflects only outstanding stock awards as of January 31, 2011 and assumes no forfeiture activity. The Company expects to continue to issue share-based awards to its employees in future periods.
Warranties and Indemnification
The Company's enterprise cloud computing application service is typically warranted to perform in a manner consistent with general industry standards that are reasonably applicable and materially in accordance with the Company's online help documentation under normal use and circumstances.
The Company's arrangements generally include certain provisions for indemnifying customers against liabilities if its products or services infringe a third-party's intellectual property rights. To date, the Company has not incurred any material costs as a result of such indemnifications and has not accrued any liabilities related to such obligations in the accompanying consolidated financial statements.
The Company has also agreed to indemnify its directors and executive officers for costs associated with any fees, expenses, judgments, fines and settlement amounts incurred by any of these persons in any action or proceeding to which any of those persons is, or is threatened to be, made a party by reason of the person's service as a director or officer, including any action by the Company, arising out of that person's services as the Company's director or officer or that person's services provided to any other company or enterprise at the Company's request. The Company maintains director and officer insurance coverage that would generally enable the Company to recover a portion of any future amounts paid. The Company may also be subject to indemnification obligations by law with respect to the actions of its employees under certain circumstances and in certain jurisdictions.
Advertising Expenses
Advertising is expensed as incurred. Advertising expense was $61.4 million, $50.8 million and $43.7 million for fiscal 2011, 2010 and 2009, respectively.
Subsequent Events
The Company evaluated subsequent events through the date this Annual Report on Form 10-K was filed with the SEC.
In February 2011, the Company acquired a privately-held company for approximately $11.3 million in cash.
As of February 1, 2011 the Notes due 2015 are convertible at the option of the noteholder. For 20 trading days during the 30 consecutive trading days ended January 31, 2011, the Company's common stock traded at a price exceeding 130% of the conversion price of $85.36 per share applicable to the Notes. Accordingly, the
70
Notes are convertible at the holders' option for the quarter ending April 30, 2011. Upon conversion of any Notes, the Company will deliver cash up to the principal amount of the Notes and, with respect to any excess conversion value greater than the principal amount of the Notes, shares of the Company's common stock, cash, or a combination of both. Therefore, for the quarter ending April 30, 2011, the Notes will be reclassified to a current liability on the Company's consolidated balance sheet. In addition to the Notes being reclassified to a current liability as described above, a portion of the equity component of the Notes, as described in Note 2 of the consolidated financial statements, will be reclassified from additional paid-in capital to temporary salesforce.com stockholders' equity on the consolidated balance sheet.
New Accounting Pronouncement
In September 2009, the FASB issued Update No. 2009-13, "Multiple-Deliverable Revenue Arrangements-a consensus of the FASB Emerging Issues Task Force" (ASU 2009-13). It updates the existing multiple-element revenue arrangements guidance currently included under ASC 605-25, which originated primarily from the guidance in EITF Issue No. 00-21, "Revenue Arrangements with Multiple Deliverables" (EITF 00-21). The revised guidance primarily provides two significant changes: 1) eliminates the need for objective and reliable evidence of the fair value for the undelivered element in order for a delivered item to be treated as a separate unit of accounting, and 2) requires the use of the relative selling price method to allocate the entire arrangement consideration. In addition, the guidance also expands the disclosure requirements for revenue recognition. ASU 2009-13 will be effective for the Company at the start of fiscal 2012. The Company believes the future impact of this new accounting pronouncement will not be material to consolidated net income.
Reclassifications
Certain reclassifications to the fiscal 2010 and 2009 balances were made to conform to the current period presentation. These reclassifications include deferred income taxes, strategic investments and income taxes payable.
2. Balance Sheet Accounts
Marketable Securities
At January 31, 2011, marketable securities consisted of the following (in thousands):
Investments classified as Marketable Securities | Amortized Cost | Unrealized Gains | Unrealized Losses | Fair Value | ||||||||||||
Corporate notes and obligations | $ | 701,047 | $ | 7,356 | $ | (790 | ) | $ | 707,613 | |||||||
U.S. treasury securities | 22,631 | 85 | (10 | ) | 22,706 | |||||||||||
Mortgage backed securities | 38,348 | 656 | (118 | ) | 38,886 | |||||||||||
Government obligations | 6,414 | 118 | 0 | 6,532 | ||||||||||||
Municipal securities | 23,121 | 79 | (119 | ) | 23,081 | |||||||||||
Collateralized mortgage obligations | 104,285 | 1,098 | (344 | ) | 105,039 | |||||||||||
U.S. agency obligations | 79,242 | 190 | (24 | ) | 79,408 | |||||||||||
Total marketable securities | $ | 975,088 | $ | 9,582 | $ | (1,405 | ) | $ | 983,265 | |||||||
71
At January 31, 2010, marketable securities consisted of the following (in thousands):
Investments classified as Marketable Securities | Amortized Cost | Unrealized Gains | Unrealized Losses | Fair Value | ||||||||||||
Corporate notes and obligations | $ | 329,750 | $ | 7,889 | $ | (65 | ) | $ | 337,574 | |||||||
U.S. treasury securities | 136,606 | 170 | (116 | ) | 136,660 | |||||||||||
Mortgage backed securities | 40,187 | 719 | (41 | ) | 40,865 | |||||||||||
Collateralized mortgage obligations | 36,785 | 436 | (33 | ) | 37,188 | |||||||||||
U.S. agency obligations | 162,896 | 571 | (12 | ) | 163,455 | |||||||||||
Total marketable securities | $ | 706,224 | $ | 9,785 | $ | (267 | ) | $ | 715,742 | |||||||
The duration of the investments classified as marketable securities is as follows (in thousands):
| As of January 31, | ||||||||
| 2011 | 2010 | |||||||
Recorded as follows (in thousands): | ||||||||
Short-term (due in one year or less) | $ | 72,678 | $ | 230,659 | ||||
Long-term (due between one and 3 years) | 910,587 | 485,083 | ||||||
| $ | 983,265 | $ | 715,742 | |||||
As of January 31, 2011, the following marketable securities were in an unrealized loss position (in thousands):
| Less than 12 Months | 12 Months or Greater | Total | ||||||||||||||||||||||
| Fair Value | Unrealized Losses | Fair Value | Unrealized Losses | Fair Value | Unrealized Losses | |||||||||||||||||||
Corporate notes and obligations | $ | 126,053 | $ | (787 | ) | $ | 149 | $ | (3 | ) | $ | 126,202 | $ | (790 | ) | |||||||||
U.S. treasury securities | 2,031 | (10 | ) | 0 | 0 | 2,031 | (10 | ) | ||||||||||||||||
Mortgage backed securities | 13,258 | (115 | ) | 154 | (3 | ) | 13,412 | (118 | ) | |||||||||||||||
Municipal securities | 13,021 | (119 | ) | 0 | 0 | 13,021 | (119 | ) | ||||||||||||||||
Collateralized mortgage obligations | 38,577 | (344 | ) | 0 | 0 | 38,577 | (344 | ) | ||||||||||||||||
U.S. agency obligations | 17,254 | (24 | ) | 0 | 0 | 17,254 | (24 | ) | ||||||||||||||||
| $ | 210,194 | $ | (1,399 | ) | $ | 303 | $ | (6 | ) | $ | 210,497 | $ | (1,405 | ) | ||||||||||
The unrealized loss for each of these fixed rate marketable securities ranged from less than $1,000 to $116,000. The Company does not believe any of the unrealized losses represent an other-than-temporary impairment based on its evaluation of available evidence as of January 31, 2011. The Company expects to receive the full principal and interest on all of these marketable securities.
Prepaid Expenses and Other Current Assets
Prepaid expenses and other current assets consisted of the following (in thousands):
| As of January 31, | ||||||||
| 2011 | 2010 | |||||||
Deferred professional services costs | $ | 17,908 | $ | 13,420 | ||||
Prepaid expenses and other current assets | 37,813 | 42,314 | ||||||
| $ | 55,721 | $ | 55,734 | |||||
72
Property and Equipment
Property and equipment consisted of the following (in thousands):
| As of January 31, | ||||||||
| 2011 | 2010 | |||||||
Land | $ | 248,263 | $ | 0 | ||||
Buildings and improvements | 10,115 | 0 | ||||||
Computers, equipment and software | 115,736 | 87,608 | ||||||
Furniture and fixtures | 20,462 | 17,325 | ||||||
Leasehold improvements | 100,380 | 71,882 | ||||||
| 494,956 | 176,815 | |||||||
Less accumulated depreciation and amortization | (107,782 | ) | (87,104 | ) | ||||
| $ | 387,174 | $ | 89,711 | |||||
Depreciation and amortization expense totaled $41.4 million, $31.9 million and $21.0 million during fiscal 2011, 2010, and 2009, respectively.
Property and equipment at January 31, 2011 and January 31, 2010 included a total of $38.8 million and $27.1 million acquired under capital lease agreements, respectively. Accumulated amortization relating to equipment and software under capital leases totaled $18.5 million and $11.0 million, respectively, at January 31, 2011 and January 31, 2010. Amortization of assets under capital leases is included in depreciation and amortization expense.
Land and buildings and improvements
During the fourth quarter of fiscal 2011, the Company purchased approximately 14 acres of undeveloped land in San Francisco, California, including entitlements and improvements associated with the land, and perpetual parking rights in an existing garage for approximately $278.0 million in cash. The Company plans to use the land to build a new global headquarters. During fiscal 2011, the Company recorded $248.3 million to the undeveloped land and $6.4 million to buildings and improvements. The Company recorded $23.3 million for the perpetual parking rights as a purchased intangible asset in Other Assets on the consolidated balance sheet.
Capitalized Software
Capitalized software consisted of the following (in thousands):
| As of January 31, | ||||||||
| 2011 | 2010 | |||||||
Capitalized internal-use software development costs, net of accumulated amortization of $34,513 and $21,392, respectively | $ | 29,154 | $ | 22,675 | ||||
Acquired developed technology, net of accumulated amortization of $37,818 and $20,932, respectively | 98,833 | 12,134 | ||||||
| $ | 127,987 | $ | 34,809 | |||||
Capitalized internal-use software amortization expense totaled $13.1 million and $9.9 million for the years ended January 31, 2011 and 2010, respectively. Acquired developed technology amortization expense totaled $16.9 million and $8.0 million for the years ended January 31, 2011 and 2010, respectively.
73
Other Assets, net
Other assets consisted of the following (in thousands):
| As of January 31, | ||||||||
| 2011 | 2010 | |||||||
Deferred professional services costs, noncurrent portion | $ | 10,201 | $ | 5,639 | ||||
Long-term deposits | 12,114 | 11,084 | ||||||
Purchased intangible assets, net of accumulated amortization of $9,868 and $5,694, respectively | 31,660 | 6,613 | ||||||
Aquired intellectual property, net of accumulated amortization of $746 and $121, respectively. | 5,874 | 133 | ||||||
Strategic investments | 27,065 | 6,288 | ||||||
Other | 17,457 | 10,008 | ||||||
| $ | 104,371 | $ | 39,765 | |||||
During the fourth quarter of fiscal 2011, the Company purchased approximately 14 acres of undeveloped land in San Francisco, California, including entitlements and improvements associated with the land, and perpetual parking rights in an existing garage for approximately $278.0 million in cash. Of the purchase price, the Company recorded $23.3 million to the perpetual parking rights and classified such rights as a purchased intangible asset as it represents an intangible right to use the existing garage.
Goodwill
Goodwill represents the excess of the purchase price in a business combination over the fair value of net tangible and intangible assets acquired. Goodwill amounts are not amortized, but rather tested for impairment at least annually during the fourth quarter. There was no impairment of goodwill during fiscal 2011 and 2010.
Goodwill consisted of the following (in thousands):
| Total | ||||
Balance as of January 31, 2009 | $ | 44,872 | ||
Other acquisitions | 4,083 | |||
Balance as of January 31, 2010 | 48,955 | |||
Jigsaw Data Corporation | 133,254 | |||
Heroku, Inc. | 181,304 | |||
DimDim, Inc. | 23,373 | |||
Finalization of fiscal 2010 purchase price allocation | (1,150 | ) | ||
Other Acquisitions | 10,345 | |||
Balance as of January 31, 2011 | $ | 396,081 | ||
Accrued Expenses and Other Current Liabilities
Accrued expenses and other current liabilities consisted of the following (in thousands):
| As of January 31, | ||||||||
| 2 0 11 | 2 0 10 | |||||||
Accrued compensation | $ | 148,275 | $ | 90,223 | ||||
Accrued other liabilities | 112,840 | 46,188 | ||||||
Accrued other taxes payable | 41,355 | 27,757 | ||||||
Accrued professional costs | 12,548 | 10,740 | ||||||
Accrued rent | 22,323 | 19,830 | ||||||
Income taxes payable | 7,780 | 8,424 | ||||||
| $ | 345,121 | $ | 203,162 | |||||
74
0.75% Convertible Senior Notes
In January 2010, the Company issued at par value $575.0 million of 0.75% convertible senior notes due January 15, 2015 (the "Notes"). Interest is payable semi-annually in arrears on January 15 and July 15 of each year, commencing July 15, 2010.
The Notes are governed by an Indenture dated as of January 19, 2010, between the Company, as issuer, and U.S. Bank National Association, as trustee. The Notes do not contain any financial covenants or any restrictions on the payment of dividends, the incurrence of senior debt or other indebtedness, or the issuance or repurchase of securities by the Company. The Notes are unsecured and rank senior in right of payment to the Company's future indebtedness that is expressly subordinated in right of payment to the Notes and rank equal in right of payment to the Company's existing and future unsecured indebtedness that is not so subordinated and are effectively subordinated in right of payment to any of the Company's cash equal to the principal amount of the Notes, and secured indebtedness to the extent of the value of the assets securing such indebtedness and are structurally subordinated to all existing and future indebtedness and liabilities incurred by our subsidiaries, including trade payables.
If converted, holders will receive cash equal to the principal amount of the Notes, and at the Company's election, cash and/or shares of the Company's common stock for any amounts in excess of the principal amounts.
The initial conversion rate is 11.7147 shares of common stock per $1,000 principal amount of Notes, subject to anti-dilution adjustments. The initial conversion price is $85.36 per share of common stock. Throughout the term of the Notes, the conversion rate may be adjusted upon the occurrence of certain events, including for any cash dividends. Holders of the Notes will not receive any cash payment representing accrued and unpaid interest upon conversion of a Note. Accrued but unpaid interest will be deemed to be paid in full upon conversion rather than cancelled, extinguished or forfeited. Holders may convert their Notes under the following circumstances:
| • | during any fiscal quarter, if, for at least 20 trading days during the 30 consecutive trading day period ending on the last trading day of the immediately preceding fiscal quarter, the last reported sales price of the Company's common stock for such trading day is greater than or equal to 130% of the applicable conversion price on such trading day share of common stock on such last trading day; |
| • | in certain situations, when the trading price of the Notes is less than 98% of the product of the sale price of the Company's common stock and the conversion rate; |
| • | upon the occurrence of specified corporate transactions described under the Notes Indenture, such as a consolidation, merger or binding share exchange; or |
| • | at any time on or after October 15, 2014. |
As of January 31, 2011, the Notes are not yet convertible up to 6.7 million shares of the Company's common stock.
For at least 20 trading days during the 30 consecutive trading days ended January 31, 2011, the Company's common stock price exceeded the conversion price of $85.36 per share. Accordingly, the Notes are convertible at the holders' option for the quarter ending April 30, 2011. Upon conversion of any Notes, the Company will deliver cash up to the principal amount of the Notes and with respect to any excess conversion value greater than the principal amount of the Notes, shares of the Company's common stock, cash, or a combination of both at the Company's election.
Holders of the Notes have the right to require the Company to purchase with cash all or a portion of the Notes upon the occurrence of a fundamental change, such as a change of control at a purchase price equal to 100% of the principal amount of the Notes plus accrued and unpaid interest. Following certain corporate transactions that constitute a change of control, the Company will increase the conversion rate for a holder who elects to convert the Notes in connection with such change of control in certain circumstances.
75
In accounting for the issuance of the Notes, the Company separated the Notes into liability and equity components. The carrying amount of the liability component was calculated by measuring the fair value of a similar liability that does not have an associated convertible feature. The carrying amount of the equity component representing the conversion option was determined by deducting the fair value of the liability component from the par value of the Notes as a whole. The excess of the principal amount of the liability component over its carrying amount ("debt discount") is amortized to interest expense over the term of the Note. The equity component is not remeasured as long as it continues to meet the conditions for equity classification.
In accounting for the transaction costs related to the Note issuance, the Company allocated the total amount incurred to the liability and equity components. Transaction costs attributable to the liability component are being amortized to expense over the term of the Notes, and transaction costs attributable to the equity component were netted with the equity component in additional paid-in capital. Additionally, the Company recorded a deferred tax liability of $51.1 million in connection with the Notes. The Notes consisted of the following (in thousands):
| As of January 31, | ||||||||
| 2011 | 2010 | |||||||
Equity component (1) | $ | 125,530 | $ | 125,530 | ||||
Liability component : | ||||||||
Principal | $ | 575,000 | $ | 575,000 | ||||
Less: debt discount, net (2) | (102,462 | ) | (124,802 | ) | ||||
Net carrying amount | $ | 472,538 | $ | 450,198 | ||||
| (1) | Included in the consolidated balance sheets within additional paid-in capital, net of the $1.8 million in equity issuance costs. |
| (2) | Included in the consolidated balance sheets within 0.75% convertible senior notes and is amortized over the remaining life of the Notes using the effective interest rate method. |
As of January 31, 2011, the remaining life of the Notes is approximately 4 years.
The following table sets forth total interest expense recognized related to the Notes prior to capitalization of interest (in thousands):
| Fiscal Year Ended January 31, | ||||||||
| 2011 | 2010 | |||||||
Contractual interest expense | $ | 4,313 | $ | 144 | ||||
Amortization of debt issuance costs | 1,324 | 59 | ||||||
Amortization of debt discount | 22,396 | 728 | ||||||
| $ | 28,033 | $ | 931 | |||||
Effective interest rate of the liability component | 5.86 | % | 5.86 | % | ||||
Note Hedges
To minimize the impact of potential economic dilution upon conversion of the Notes, the Company entered into convertible note hedge transactions with respect to its common stock (the "Note Hedges"). The Company paid, in January 2010, an aggregate amount of $126.5 million for the Note Hedges. The Note Hedges cover, approximately 6.7 million shares of the Company's common stock at a strike price that corresponds to the initial conversion price of the Notes, also subject to adjustment, and are exercisable upon conversion of the Notes. The Note Hedges will expire upon the maturity of the Notes. The Note Hedges are intended to reduce the potential economic dilution upon conversion of the Notes in the event that the market value per share of the Company's common stock, as measured under the Notes, at the time of exercise is greater than the conversion price of the
76
Notes. The Note Hedges are separate transactions and are not part of the terms of the Notes. Holders of the Notes will not have any rights with respect to the Note Hedges. The Company in January 2010 recorded a deferred tax asset of $51.4 million in connection with these Note Hedges.
Warrants
Separately, the Company in January 2010 also entered into warrant transactions (the "Warrants"), whereby the Company sold warrants to acquire, subject to anti-dilution adjustments, up to 6.7 million shares of the Company's common stock at a strike price of $119.51 per share. The Company received aggregate proceeds of $59.2 million from the sale of the Warrants. If the average market value per share of the Company's common stock for the reporting period, as measured under the Warrants, exceeds the strike price of the Warrants, the Warrants will have a dilutive effect on the Company's earnings per share. The Warrants are separate transactions, entered into by the Company and are not part of the terms of the Notes or Note Hedges. Holders of the Notes and Note Hedges will not have any rights with respect to the Warrants.
3. Stockholders' Equity
Stock Options Issued to Employees
The Company maintains three stock plans; the 2004 Equity Incentive Plan, 2004 Employee Stock Purchase Plan and the 2004 Outside Directors Stock Plan. These plans, other than the 2004 Outside Directors Stock Plan, provide for annual automatic increases on February 1 to the shares reserved for issuance based on the lesser of (i) a specific percentage of the total number of shares outstanding at year end; (ii) a fixed number of shares; or (iii) a lesser number of shares set by the Company's Board of Directors, all as specified in the respective plans. The expiration of the 1999 Stock Option Plan in fiscal 2010 did not affect awards outstanding, which continue to be governed by the terms and conditions of the 1999 Plan.
On February 1, 2011, 3.5 million additional shares were reserved under the 2004 Equity Incentive Plan pursuant to the automatic increase. The 2004 Employee Stock Purchase Plan will not be implemented unless and until the Company's Board of Directors authorizes the commencement of one or more offerings under the plan. No offering periods have been authorized to date.
In April 2006, the Company's Board of Directors approved the 2006 Inducement Equity Incentive Plan (the "Inducement Plan") that allows for stock option and other equity incentive grants to employees in connection with merger or acquisition activity. In fiscal 2011, the Board of Directors amended the Inducement Plan to increase the share reserve by 300,000 shares to 1,000,000 shares in total. As of January 31, 2011, there were 362,102 shares of common stock available for grant under the Inducement Plan.
Prior to February 1, 2006, options issued under the Company's stock option plans were generally for periods which had a term of 10 years. After February 1, 2006, options issued have a term of 5 years.
77
Stock activity is as follows:
| Shares Available for Grant | Options Outstanding | |||||||||||||||
| Outstanding Stock Options | Weighted- Average Exercise Price | Aggregate Intrinsic Value (in thousands) | ||||||||||||||
Balance as of January 31, 2010 | 4,607,929 | 14,036,371 | $ | 40.36 | ||||||||||||
Increase in shares authorized: | ||||||||||||||||
2004 Equity Incentive Plan | 3,500,000 | 0 | 0 | |||||||||||||
Inducement Plan | 300,000 | 0 | 0 | |||||||||||||
Options granted under all plans | (3,113,276 | ) | 3,113,276 | 128.33 | ||||||||||||
Restricted stock activity | (1,775,505 | ) | 0 | 0 | ||||||||||||
Stock grants to board and advisory board members | (50,200 | ) | 0 | 0 | ||||||||||||
Exercised | 0 | (4,646,977 | ) | 34.52 | ||||||||||||
1999 Plan shares expired | (92,999 | ) | 0 | 0 | ||||||||||||
Cancelled | 719,511 | (719,511 | ) | 49.38 | ||||||||||||
Balance as of January 31, 2011 | 4,095,460 | 11,783,159 | $ | 65.35 | $ | 782,437 | ||||||||||
Vested or expected to vest | 11,358,774 | $ | 64.42 | $ | 763,923 | |||||||||||
Exercisable as of January 31, 2011 | 4,340,782 | $ | 36.32 | $ | 402,892 | |||||||||||
The total intrinsic value of the options exercised during the fiscal 2011, 2010, and 2009 were $322.5 million, $105.2 million, and $117.3 million, respectively. The intrinsic value is the difference of the current market value of the stock and the exercise price of the stock option.
The weighted-average remaining contractual life of vested and expected to vest options is approximately 3.3 years.
As of January 31, 2011, options to purchase 4,340,782 shares were vested at a weighted average exercise price of $36.32 per share and a remaining weighted-average remaining contractual life of approximately 2.6 years. The total intrinsic value of these vested options as of January 31, 2011 was $402.9 million.
The following table summarizes information about stock options outstanding as of January 31, 2011:
| Options Outstanding | Options Exercisable | |||||||||||||||||||
Range of Exercise | Number Outstanding | Weighted- Average Remaining Contractual Life (Years) | Weighted- Average Exercise Price | Number of Shares | Weighted- Average Exercise Price | |||||||||||||||
| $0.75 to $25.19 | 1,054,480 | 3.2 | $ | 10.29 | 1,054,480 | $ | 10.29 | |||||||||||||
| $25.97 | 2,195,260 | 2.8 | 25.97 | 848,361 | 25.97 | |||||||||||||||
| $27.20 to $52.48 | 2,309,582 | 2.0 | 45.79 | 1,528,138 | 44.65 | |||||||||||||||
| $52.76 to $65.41 | 669,778 | 2.5 | 56.09 | 321,878 | 55.38 | |||||||||||||||
| $65.44 | 2,301,557 | 3.8 | 65.44 | 489,953 | 65.44 | |||||||||||||||
| $65.68 to $133.32 | 957,126 | 4.0 | 84.78 | 97,972 | 68.15 | |||||||||||||||
| $142.50 to $148.49 | 2,295,376 | 4.8 | 142.52 | 0 | 0 | |||||||||||||||
| 11,783,159 | 3.3 | $ | 65.35 | 4,340,782 | $ | 36.32 | ||||||||||||||
78
Restricted stock activity is as follows:
| Restricted Stock Outstanding | ||||||||||||
| Outstanding | Weighted- Average Exercise Price | Aggregate Intrinsic Value (in thousands) | ||||||||||
Balance as of January 31, 2009 | 2,499,151 | $ | 0.001 | |||||||||
Granted | 859,636 | 0.001 | ||||||||||
Cancelled | (212,774 | ) | 0.001 | |||||||||
Vested and converted to shares | (829,561 | ) | 0.001 | |||||||||
Balance as of January 31, 2010 | 2,316,452 | 0.001 | ||||||||||
Granted | 2,048,925 | 0.001 | ||||||||||
Cancelled | (223,220 | ) | 0.001 | |||||||||
Vested and converted to shares | (926,054 | ) | 0.001 | |||||||||
Balance as of January 31, 2011 | 3,216,103 | $ | 0.001 | $ | 415,328 | |||||||
Expected to vest | 2,979,791 | $ | 384,810 | |||||||||
The restricted stock, which upon vesting entitles the holder to one share of common stock for each share of restricted stock, has an exercise price of $0.001 per share, which is equal to the par value of the Company's common stock, and vest over 4 years.
The weighed-average fair value of the restricted stock issued in fiscal 2011 and 2010 was $108.03 and $47.59, respectively.
The Company reduced its income taxes payable by the tax benefit realized from the exercise, sale or vesting of the stock options or similar instruments during fiscal 2011 in the amount of $76.1 million. Cash provided by financing activities due to excess tax benefits from employee stock plans was a result of a portion of such cash tax benefit and the tax benefit arising from the utilization of net operating losses generated primarily from the settlement of stock awards in prior years.
Common Stock
The following number of shares of common stock were reserved and available for future issuance at January 31, 2011:
Options outstanding | 11,783,159 | |||
Restricted stock awards and units outstanding | 3,216,103 | |||
Stock available for future grant: | ||||
2004 Equity Incentive Plan | 3,122,358 | |||
2006 Inducement Equity Incentive Plan | 362,102 | |||
2004 Employee Stock Purchase Plan | 1,000,000 | |||
2004 Outside Directors Stock Plan | 611,000 | |||
0.75% Convertible senior notes | 6,735,953 | |||
Warrants | 6,735,953 | |||
| 33,566,628 | ||||
During fiscal year 2011 and 2010, certain board members received stock grants totaling 48,000 shares of common stock, respectively for board services pursuant to the terms described in the 2004 Outside Directors Stock Plan. The expense related to these awards, which was expensed immediately at the time of the issuance, totaled $4.9 million and $2.2 million, in fiscal 2011 and 2010 respectively.
79
4. Preferred Stock
The Company's board of directors has the authority, without further action by stockholders, to issue up to 5,000,000 shares of preferred stock in one or more series. The Company's board of directors may designate the rights, preferences, privileges and restrictions of the preferred stock, including dividend rights, conversion rights, voting rights, terms of redemption, liquidation preference, sinking fund terms, and number of shares constituting any series or the designation of any series. The issuance of preferred stock could have the effect of restricting dividends on the Company's common stock, diluting the voting power of its common stock, impairing the liquidation rights of its common stock, or delaying or preventing a change in control. The ability to issue preferred stock could delay or impede a change in control. At January 31, 2011 and 2010, no shares of preferred stock were outstanding.
5. Joint Venture
In December 2000, the Company established a Japanese joint venture, Kabushiki Kaisha salesforce.com, ("Salesforce Japan), with SunBridge, Inc., a Japanese corporation, to assist the Company with its sales efforts in Japan. During fiscal 2011, the Company paid $172.0 million to acquire SunBridge's and other shareholders' interest in Salesforce Japan. The Company now owns 100 percent of Salesforce Japan. As a result of the Company's purchase of the shares held by SunBridge, the joint venture agreement terminated according to its terms. The purchase transaction, including transaction-related fees totaling $1.1 million, were accounted for as a reduction to additional paid-in capital and noncontrolling interest.
6. Acquisitions in fiscal year 2011
Jigsaw Data Corporation
In May 2010 the Company acquired for cash the stock of Jigsaw Data Corporation ("Jigsaw"), a cloud provider of crowd-sourced data services in the cloud. The Company acquired Jigsaw to combine the Company's CRM applications and enterprise cloud platform with Jigsaw's cloud-based model for the automation of acquiring, completing and cleansing business contact data. The Company has included the financial results of Jigsaw in the consolidated financial statements from the date of acquisition. The total cash consideration for Jigsaw was approximately $148.5 million. In addition, the Company will potentially make additional payments ("contingent consideration") totaling up to $14.4 million in cash, based on the achievement of certain billings targets related to Jigsaw's services for the one-year period from May 8, 2010 through May 7, 2011. The estimated fair value using a discounted cash flow model of the contingent consideration at May 7, 2010 was $13.4 million and is included in the total purchase price. The Company has recorded and will record the fair value of the contingent consideration each reporting period based on Jigsaw's achievement of meeting its billing targets as it relates to the contingent consideration. The Company's estimated fair value of the contingent consideration at January 31, 2011 was $14.1 million. The change in fair value of contingent consideration is recorded in general and administrative expenses.
The total preliminary purchase price and the fair value of the contingent consideration was allocated to the net tangible and intangible assets based upon their fair values as of May 7, 2010 as set forth below. The excess of the preliminary purchase price over the net tangible and intangible assets was recorded as goodwill. The following table summarizes the estimated fair values of the assets and liabilities assumed at the acquisition date. The primary areas of the preliminary purchase price allocation that are not yet finalized relate to both current and noncurrent deferred tax liabilities which are subject to change, pending the finalization of certain tax returns.
(in thousands) | ||||
Net tangible assets | $ | 4,347 | ||
Intangible assets | 28,140 | |||
Deferred tax liability | (3,864 | ) | ||
Goodwill | 133,254 | |||
Total purchase price | $ | 161,877 | ||
80
The following table sets forth the components of intangible assets acquired in connection with the Jigsaw acquisition:
(in thousands) | Fair value | Useful Life | ||||||
Developed service technology and database | $ | 23,560 | 3 years | |||||
Customer relationships | 2,440 | 5 years | ||||||
Trade name and trademark | 2,140 | 3 years | ||||||
Total intangible assets subject to amortization | $ | 28,140 | ||||||
Customer relationships represent the fair values of the underlying relationships and agreements with Jigsaw's customers. Developed service technology and database represents the fair values of the Jigsaw technology and database that contains the business contact data. Trade name and trademark represents the fair values of brand and name recognition associated with the marketing of Jigsaw's services. The goodwill balance is not deductible for tax purposes. The goodwill balance is primarily attributable to Jigsaw's assembled workforce and the expected synergies and revenue opportunities when combining the business contact data within the Jigsaw solution with the Company's CRM cloud applications.
The fair value of intangible assets was based on the income approach. The acquisition costs which were expensed were not material.
Heroku, Inc.
In January 2011 the Company acquired for cash the stock of Heroku, Inc. ("Heroku"), a platform-as-a-service cloud vendor, built to work in an open environment and take advantage of the Ruby language. Ruby has become one of the leading development languages used for applications that are social, collaborative and deliver real-time access to information across mobile devices. The Company has included the financial results of Heroku in the consolidated financial statements from the date of acquisition. The total cash consideration for Heroku was approximately $216.7 million.
The total preliminary purchase price was allocated to the net tangible and intangible assets and liabilities based upon their fair values as of January 3, 2011 as set forth below. The excess of the preliminary purchase price over the net tangible and intangible assets was recorded as goodwill. The following table summarizes the estimated fair values of the assets and liabilities assumed at the acquisition date. The primary areas of the preliminary purchase price allocation that are not yet finalized relate to both current and noncurrent deferred tax liabilities which are subject to change, pending the finalization of certain tax returns.
(in thousands) | ||||
Net tangible assets | $ | 5,411 | ||
Intangible assets | 40,060 | |||
Deferred tax liability | (10,060 | ) | ||
Goodwill | 181,304 | |||
Total purchase price | $ | 216,715 | ||
The following table sets forth the components of intangible assets acquired in connection with the Heroku acquisition:
(in thousands) | Fair value | Useful life | ||||||
Developed technology | $ | 39,280 | 3 years | |||||
Trade name and trademark | 780 | 3 years | ||||||
Total intangible assets subject to amortization | $ | 40,060 | ||||||
81
Developed product technology represents the fair value of the Heroku platform technology. Trade name and trademark represents the fair values of brand and name recognition associated with the marketing of Heroku's services. The goodwill balance is not deductible for tax purposes. The goodwill balance is primarily attributable to Heroku's assembled workforce and the Company's ability to now access a large community of developers and independent software vendors ("ISVs") who are building applications in the cloud using the Ruby language. Additionally, the goodwill balance also reflects the value of expanded market share opportunities that are expected to occur when combining the Company's cloud platform with Heroku's platform and enhancing the joint platform to allow developers and ISV's the freedom to choose among a variety of programming languages.
The fair value of intangible assets was based on the cost approach using a replacement cost method to value the developed technology. The replacement cost method estimates the fair value based upon an estimate of the costs that would be incurred to replace the developed technology. The acquisition costs which were expensed were not material.
DimDim, Inc.
In January 2011 the Company acquired for cash the stock of DimDim, Inc. ("DimDim"), a provider of online meeting solutions for business collaboration. The Company has included the financial results of DimDim in the consolidated financial statements from the date of acquisition. The total cash consideration for DimDim was approximately $37.1 million.
The total preliminary purchase price was allocated to the net tangible and intangible assets based upon their fair values as of January 6, 2011 as set forth below. The excess of the preliminary purchase price over the net tangible and intangible assets was recorded as goodwill. The following table summarizes the estimated fair values of the assets and liabilities assumed at the acquisition date. The primary areas of the preliminary purchase price allocation that are not yet finalized relate to both current and noncurrent deferred tax liabilities which are subject to change, pending the finalization of certain tax returns.
(in thousands) | ||||
Net tangible assets | $ | 1,951 | ||
Developed technology | 14,450 | |||
Deferred tax liability | (2,648 | ) | ||
Goodwill | 23,373 | |||
Total purchase price | $ | 37,126 | ||
The developed technology acquired in connection with the DimDim acquisition represents the fair value of the developed technology. The goodwill balance is not deductible for tax purposes. The goodwill balance is primarily attributable to DimDim's assembled workforce and the expected synergies and expanded market leadership opportunities when integrating DimDim's on-line meeting solution technology with the Company's collaboration cloud offering.
The fair value of intangible assets was based on the income approach. The acquisition costs which were expensed were not material.
Other Acquisitions
During fiscal 2011, the Company acquired three privately-held companies for $18.1 million in aggregate cash and $2.8 million in contingent consideration. The Company accounted for these transactions as business combinations. Of the $20.9 million, the Company allocated $10.0 million to acquired intangible assets with useful lives of 3 to 5 years and $10.3 million to goodwill. The goodwill balances are not deductible for tax purposes. These transactions were not material, individually or in aggregate.
82
Intangible assets acquired resulting from the acquisitions described above as of January 31, 2011 are as follows (in thousands):
| Gross Fair Value | Accumulated Amortization | Net Book Value | Weighted Average Remaining Useful Life | |||||||||||||
Acquired developed technology | $ | 86,710 | $ | (9,324 | ) | $ | 77,386 | 2.7 years | ||||||||
Customer relationships | 2,990 | (412 | ) | 2,578 | 4.3 years | |||||||||||
Trade name and trademark | 2,920 | (557 | ) | 2,363 | 2.4 years | |||||||||||
| $ | 92,620 | $ | (10,293 | ) | $ | 82,327 | ||||||||||
The expected future amortization expense for these intangible assets for each of the fiscal years ended thereafter is as follows (in thousands):
Fiscal Period: | ||||
Fiscal 2012 | $ | 30,475 | ||
Fiscal 2013 | 30,475 | |||
Fiscal 2014 | 20,598 | |||
Fiscal 2015 | 598 | |||
Fiscal 2016 | 181 | |||
Total amortization expense | $ | 82,327 | ||
Pro forma results of operations have not been presented because the effect of the acquisitions individually or in the aggregate were not significant.
7. Income Taxes
The domestic and foreign components of income before provision for income taxes and noncontrolling interest consisted of the following (in thousands):
| Fiscal Year Ended January 31, | ||||||||||||
| 2011 | 2010 | 2009 | ||||||||||
Domestic | $ | 75,515 | $ | 125,095 | $ | 83,590 | ||||||
Foreign | 28,783 | 17,286 | 2,002 | |||||||||
| $ | 104,298 | $ | 142,381 | $ | 85,592 | |||||||
The provision for income taxes consisted of the following (in thousands):
| Fiscal Year Ended January 31, | ||||||||||||
| 2011 | 2010 | 2009 | ||||||||||
Current: | ||||||||||||
Federal | $ | 29,992 | $ | 43,313 | $ | 55,228 | ||||||
State | 6,276 | 8,788 | 7,701 | |||||||||
Foreign | 13,239 | 12,179 | 7,699 | |||||||||
Total | 49,507 | 64,280 | 70,628 | |||||||||
Deferred: | ||||||||||||
Federal | (8,687 | ) | (4,506 | ) | (26,979 | ) | ||||||
State | (4,745 | ) | (979 | ) | (5,372 | ) | ||||||
Foreign | (1,474 | ) | (1,106 | ) | (720 | ) | ||||||
Total | (14,906 | ) | (6,591 | ) | (33,071 | ) | ||||||
Provision for income taxes | $ | 34,601 | $ | 57,689 | $ | 37,557 | ||||||
83
A reconciliation of income taxes at the statutory federal income tax rate to the provision for income taxes included in the accompanying consolidated statements of operations is as follows (in thousands):
| Fiscal Year Ended January 31, | ||||||||||||
| 2011 | 2010 | 2009 | ||||||||||
U.S. federal taxes at statutory rate | $ | 36,504 | $ | 49,833 | $ | 29,957 | ||||||
State, net of the federal benefit | 6,069 | 8,645 | 4,685 | |||||||||
Foreign losses providing no benefit | 0 | 0 | 3,091 | |||||||||
Foreign taxes in excess of the U.S. statutory rate | 3,412 | 6,748 | 3,537 | |||||||||
Tax credits | (13,625 | ) | (9,845 | ) | (5,222 | ) | ||||||
Non-deductible expenses | 2,621 | 755 | 901 | |||||||||
Impact of California tax law change | 2,199 | 2,747 | 0 | |||||||||
Tax-noncontrolling interest | (1,825 | ) | (1,390 | ) | 0 | |||||||
Other, net | (754 | ) | 196 | 608 | ||||||||
| $ | 34,601 | $ | 57,689 | $ | 37,557 | |||||||
Deferred income taxes reflect the net tax effect of temporary differences between the carrying amounts of assets and liabilities for financial reporting purposes and the amounts used for income tax purposes. Significant components of the Company's deferred tax assets and liabilities were as follows (in thousands):
| As of January 31, | ||||||||
| 2011 | 2010 | |||||||
Deferred tax assets: | ||||||||
Net operating loss carryforwards | $ | 21,929 | $ | 5,284 | ||||
Deferred stock compensation | 31,872 | 30,451 | ||||||
Tax credits | 39,065 | 20,836 | ||||||
Deferred rent expense | 8,371 | 7,360 | ||||||
Accrued liabilities | 29,549 | 22,006 | ||||||
Deferred revenue | 9,727 | 10,802 | ||||||
Other | 4,508 | 4,798 | ||||||
Total deferred tax assets | 145,021 | 101,537 | ||||||
Less valuation allowance | (1,142 | ) | (1,540 | ) | ||||
Net deferred tax assets | 143,879 | 99,997 | ||||||
Deferred tax liabilities: | ||||||||
Deferred commissions | (27,739 | ) | (22,613 | ) | ||||
Purchased intangibles | (24,856 | ) | (3,280 | ) | ||||
Unrealized gains on investments | (5,005 | ) | (3,873 | ) | ||||
Depreciation and amortization | (13,500 | ) | (229 | ) | ||||
Other | (4,064 | ) | (2,307 | ) | ||||
Total deferred tax liabilities | (75,164 | ) | (32,302 | ) | ||||
Net deferred tax assets | $ | 68,715 | $ | 67,695 | ||||
Realization of deferred tax assets is dependent on future earnings, if any, the timing and amount of which are uncertain. Accordingly, the deferred tax assets have been partially offset by a valuation allowance. The valuation allowance relates to net deferred tax assets from operating losses of certain foreign subsidiaries. The excess tax benefits associated with stock option exercises are recorded directly to stockholders' equity controlling interest only when realized. As a result, the excess tax benefits included in net operating loss carryforwards but not reflected in deferred tax assets for fiscal year 2011 and 2010 are $80.6 million and $8.5 million, respectively.
84
At January 31, 2011, the Company had net operating loss carryforwards for federal income tax purposes of approximately $257.6 million, which expire in 2024 through 2031, federal research and development tax credits of approximately $25.8 million, which expire in 2020 through 2031, foreign tax credits of $3.6 million, which expires in 2019, and minimum tax credits of $0.7 million, which have no expiration date.
The Company also has state net operating loss carryforwards of approximately $308.5 million which expire beginning in 2013 and state research and development tax credits of approximately $21.8 million and $4.0 million of state enterprise zone tax credits, which do not expire.
Utilization of the Company's net operating loss carryforwards may be subject to substantial annual limitation due to the ownership change limitations provided by the Internal Revenue Code and similar state provisions. Such an annual limitation could result in the expiration of the net operating loss and tax credit carryforwards before utilization.
The Company had gross unrecognized tax benefits of $27.5 million and $22.1 million as of January 31, 2011 and January 31, 2010 respectively.
A reconciliation of the beginning and ending balance of total unrecognized tax benefits for fiscal years 2011, 2010, and 2009 is as follows (in thousands):
| Fiscal Year Ended January 31, | ||||||||||||
| 2011 | 2010 | 2009 | ||||||||||
Balance as of February 1, | $ | 22,053 | $ | 16,472 | $ | 11,771 | ||||||
Tax positions taken in prior period: | ||||||||||||
Gross increases | 41 | 457 | 17 | |||||||||
Gross decreases | (811 | ) | (707 | ) | (148 | ) | ||||||
Tax positions taken in current period: | ||||||||||||
Gross increases | 8,047 | 5,401 | 5,955 | |||||||||
Settlements | (39 | ) | (212 | ) | (149 | ) | ||||||
Lapse of statute of limitations | (1,741 | ) | 0 | 0 | ||||||||
Currency translation effect | (88 | ) | 642 | (974 | ) | |||||||
Balance as of January 31, | $ | 27,462 | $ | 22,053 | $ | 16,472 | ||||||
For fiscal year 2011, 2010, and 2009 total unrecognized tax benefits in an amount of $20.4 million, $16.5 million and $11.8 million respectively, if recognized, would reduce income tax expense and the Company's effective tax rate.
The Company recognizes interest accrued and penalties related to unrecognized tax benefits in the income tax provision. The Company accrued no penalties and an immaterial amount of interest in income tax expense for fiscal 2011, 2010 and 2009.
Tax positions for the Company and its subsidiaries are subject to income tax audits by many tax jurisdictions throughout the world. The Company's U.S. federal and state tax returns for all tax years since February 1999, which was the inception of the Company, remain open to examination. With few exceptions, all tax years in most major jurisdictions, including Canada, United Kingdom and Australia, remain open for examinations, while Japan is open for examinations only for years after 2004. During the fiscal year ended January 31, 2011, the National Tax Agency of Japan completed the examination of the Company's fiscal 2010 tax return for Japan. No material adjustment was made as a result of the examination. Management does not believe that it is reasonably possible that the estimates of unrecognized tax benefits will change significantly in the next twelve months. However, an adverse resolution of one or more uncertain tax positions in any period could have a material impact on the results of operations for that period.
85
8. Commitments
Letters of Credit
As of January 31, 2011, the Company had a total of $8.9 million in letters of credit outstanding substantially in favor of certain landlords for office space. These letters of credit renew annually and mature at various dates through September 2021.
Leases
The Company leases office space and equipment under non-cancelable operating and capital leases with various expiration dates.
As of January 31, 2011, the future minimum lease payments under non-cancelable operating and capital leases are as follows (in thousands):
| Capital Leases | Operating Leases | |||||||
Fiscal Period: | ||||||||
Fiscal 2012 | $ | 11,503 | $ | 107,343 | ||||
Fiscal 2013 | 5,818 | 101,527 | ||||||
Fiscal 2014 | 2,292 | 79,074 | ||||||
Fiscal 2015 | 0 | 47,126 | ||||||
Fiscal 2016 | 0 | 44,423 | ||||||
Thereafter | 0 | 119,791 | ||||||
Total minimum lease payments | 19,613 | $ | 499,284 | |||||
Less: amount representing interest | (976 | ) | ||||||
Present value of capital lease obligation | $ | 18,637 | ||||||
The terms of the lease agreements provide for rental payments on a graduated basis. The Company recognizes rent expense on the straight-line basis over the lease period and has accrued for rent expense incurred but not paid. Of the total operating lease commitment balance of $499.3 million, $436.9 million is related to facilities space. The remaining $62.3 million commitment is related to computer equipment and other leases.
The Company's agreements for the facilities and certain services provide the Company with the option to renew. The Company's future contractual obligations would change if the Company exercised these options.
Rent expense for fiscal 2011, 2010 and 2009 was $52.8 million, $47.3 million and $36.0 million, respectively.
9. Legal Proceedings
The Company is involved in various legal proceedings arising from the normal course of business activities, including claims of alleged infringement of third-party patents and other intellectual property rights, commercial, employment and other matters. The Company makes a provision for a liability related to legal proceedings when it is both probable that a liability has been incurred and the amount of the loss can be reasonably estimated. These provisions are reviewed at least quarterly and adjusted to reflect the impacts of negotiations, settlements, rulings, advice of legal counsel and other information and events pertaining to a particular case. In management's opinion, resolution of these matters is not expected to have a material adverse impact on the Company's consolidated results of operations, cash flows or financial position. However, depending on the nature and timing of any such dispute, an unfavorable resolution of a matter could materially affect the Company's future results of operations or cash flows or both.
86
Many of the Company's subscription agreements require the Company to indemnify its customers for third-party intellectual property infringement claims, which could increase the cost to the Company of an adverse ruling on such a claim. Any adverse determination related to intellectual property claims or litigation could prevent the Company from offering its service to others, could be material to the Company's net income or cash flows or both or could otherwise adversely affect the Company's operating results.
10. Employee Benefit Plan
The Company has a 401(k) plan covering all eligible employees in the United States. Since January 1, 2006, the Company has been contributing to the plan. Total Company contributions during fiscal 2011, 2010 and 2009, were $11.0 million, $8.5 million and $6.7 million, respectively.
11. Related-Party Transactions
In January 1999, the salesforce.com/foundation, also referred to as the Foundation, a non-profit public charity, was chartered to build philanthropic programs that are focused on youth and technology. The Company's chairman is the chairman of the Foundation. He, one of the Company's employees and one of the Company's board members hold three of the Foundation's seven board seats. The Company is not the primary beneficiary of the Foundation's activities, and accordingly, the Company does not consolidate the Foundation's statement of activities with its financial results.
Since the Foundation's inception, the Company has provided at no charge certain resources to Foundation employees such as office space. The value of these items were in excess of $90,000 per quarter during fiscal year 2011.
In addition to the resource sharing with the Foundation, the Company issued the Foundation warrants in August 2002 to purchase shares of the Company's common stock. All of the warrants were exercised in prior years. As of January 31, 2011, the Foundation held 121,000 shares of salesforce.com common stock. Additionally, the Company has donated subscriptions to the Company's service to other qualified non-profit organizations. The Company also allows an affiliate of the Foundation to resell the Company's service to large non-profit organizations. The Company does not charge the affiliate for the subscriptions. The fair value of these and the subscriptions were in excess of $3.6 million per month during fiscal 2011. The Company currently plans to continue these programs.
87
12. Selected Quarterly Financial Data (Unaudited)
Selected summarized quarterly financial information for fiscal 2011 and 2010 is as follows:
| 1st Quarter | 2nd Quarter | 3rd Quarter | 4th Quarter | Fiscal Year | ||||||||||||||||
| (in thousands, except per share data) | ||||||||||||||||||||
Fiscal 2011 | ||||||||||||||||||||
Revenues | $ | 376,813 | $ | 394,372 | $ | 429,087 | $ | 456,867 | $ | 1,657,139 | ||||||||||
Gross profit | 305,232 | 316,582 | 346,956 | 364,556 | 1,333,326 | |||||||||||||||
Income (loss) from operations | 33,050 | 29,682 | 35,156 | (391 | ) | 97,497 | ||||||||||||||
Net income attributable to salesforce.com | 17,745 | 14,744 | 21,072 | 10,913 | 64,474 | |||||||||||||||
Basic net income per share attributable to salesforce.com common shareholders | $ | 0.14 | $ | 0.11 | $ | 0.16 | $ | 0.08 | $ | 0.50 | ||||||||||
Diluted net income per share attributable to salesforce.com common shareholders | $ | 0.13 | $ | 0.11 | $ | 0.15 | $ | 0.08 | $ | 0.47 | ||||||||||
Fiscal 2010 | ||||||||||||||||||||
Revenues | $ | 304,924 | $ | 316,061 | $ | 330,549 | $ | 354,049 | $ | 1,305,583 | ||||||||||
Gross profit | 243,124 | 253,565 | 264,979 | 285,990 | 1,047,658 | |||||||||||||||
Income from operations | 30,123 | 29,489 | 30,141 | 25,519 | 115,272 | |||||||||||||||
Net income attributable to salesforce.com | 18,436 | 21,198 | 20,691 | 20,394 | 80,719 | |||||||||||||||
Basic net income per share attributable to salesforce.com common shareholders | $ | 0.15 | $ | 0.17 | $ | 0.17 | $ | 0.16 | $ | 0.65 | ||||||||||
Diluted net income per share attributable to salesforce.com common shareholders | $ | 0.15 | $ | 0.17 | $ | 0.16 | $ | 0.16 | $ | 0.63 | ||||||||||
88
| ITEM 9. | CHANGES IN AND DISAGREEMENTS WITH ACCOUNTANTS ON ACCOUNTING AND FINANCIAL DISCLOSURE |
None.
| ITEM 9A. | CONTROLS AND PROCEDURES |
(a) Evaluation of disclosure controls and procedures
Under the supervision and with the participation of our management, including our principal executive officer and principal financial officer, we conducted an evaluation of the effectiveness of the design and operation of our disclosure controls and procedures, as defined in Rules 13a-15(e) and 15d-15(e) under the Securities Exchange Act of 1934, as amended (the "Exchange Act"), as of the end of the period covered by this report (the "Evaluation Date").
In designing and evaluating our disclosure controls and procedures, management recognizes that any disclosure controls and procedures, no matter how well designed and operated, can provide only reasonable assurance of achieving the desired control objectives. In addition, the design of disclosure controls and procedures must reflect the fact that there are resource constraints and that management is required to apply its judgment in evaluating the benefits of possible controls and procedures relative to their costs.
Based on management's evaluation, our chief executive officer and chief financial officer concluded that our disclosure controls and procedures are designed to, and are effective to, provide assurance at a reasonable level that the information we are required to disclose in reports that we file or submit under the Exchange Act is recorded, processed, summarized and reported within the time periods specified in Securities and Exchange Commission rules and forms, and that such information is accumulated and communicated to our management, including our chief executive officer and chief financial officer, as appropriate, to allow timely decisions regarding required disclosures.
(b) Management's Report on Internal Control Over Financial Reporting
Our management is responsible for establishing and maintaining adequate internal control over financial reporting, as such term is defined in Exchange Act Rules 13a-15(f) and 15d-15(f). Under the supervision and with the participation of our management, including our Chief Executive Officer and Chief Financial Officer, we conducted an evaluation of the effectiveness of our internal control over financial reporting as of January 31, 2011 based on the guidelines established in Internal Control-Integrated Framework issued by the Committee of Sponsoring Organizations of the Treadway Commission (COSO). Our internal control over financial reporting includes policies and procedures that provide reasonable assurance regarding the reliability of financial reporting and the preparation of financial statements for external reporting purposes in accordance with U.S. generally accepted accounting principles.
Based on the results of our evaluation, our management concluded that our internal control over financial reporting was effective as of January 31, 2011. We reviewed the results of management's assessment with our Audit Committee.
The effectiveness of our internal control over financial reporting as of January 31, 2011 has been audited by Ernst & Young LLP, an independent registered public accounting firm, as stated in its report which is included in Item 8 of this Annual Report on Form 10-K.
(c) Changes in internal control over financial reporting
There was no change in our internal control over financial reporting that occurred during the quarter ended January 31, 2011 that has materially affected, or is reasonably likely to materially affect, our internal control over financial reporting.
89
(d) Inherent Limitations on Effectiveness of Controls
Our management, including our Chief Executive Officer and Chief Financial Officer, do not expect that our disclosure controls or our internal control over financial reporting will prevent all errors and all fraud. A control system, no matter how well conceived and operated, can provide only reasonable, not absolute, assurance that the objectives of the control system are met. Further, the design of a control system must reflect the fact that there are resource constraints, and the benefits of controls must be considered relative to their costs. Because of the inherent limitations in all control systems, no evaluation of controls can provide absolute assurance that all control issues and instances of fraud, if any, within the Company have been detected. These inherent limitations include the realities that judgments in decision-making can be faulty, and that breakdowns can occur because of a simple error or mistake. Additionally, controls can be circumvented by the individual acts of some persons, by collusion of two or more people or by management override of the controls. The design of any system of controls also is based in part upon certain assumptions about the likelihood of future events, and there can be no assurance that any design will succeed in achieving its stated goals under all potential future conditions; over time, controls may become inadequate because of changes in conditions, or the degree of compliance with policies or procedures may deteriorate. Because of the inherent limitations in a cost-effective control system, misstatements due to error or fraud may occur and not be detected.
| ITEM 9B. | OTHER INFORMATION |
Not applicable.
90
PART III
| ITEM 10. | DIRECTORS, EXECUTIVE OFFICERS OF THE REGISTRANT AND CORPORATE GOVERNANCE MATTERS |
The information concerning our directors, compliance with Section 16(a) of the Securities Exchange Act of 1934, as amended, our audit committee and any changes to the process by which stockholders may recommend nominees to the Board required by this Item are incorporated herein by reference to information contained in the Proxy Statement, including "Directors and Corporate Governance" and "Section 16(a) Beneficial Ownership Reporting Compliance."
The information concerning our executive officers required by this Item is incorporated by reference herein to the section of this Report in Part I, entitled "Executive Officers of the Registrant."
We have adopted a code of ethics, our Code of Conduct, that applies to all employees, including our principal executive officer, Marc Benioff, principal financial and accounting officer, Graham Smith, and all other executive officers. The Code of Conduct is available on our Web site at http://www.salesforce.com/company/investor/governance/ . A copy may also be obtained without charge by contacting Investor Relations, salesforce.com, inc., The Landmark @ One Market, Suite 300, San Francisco, California 94105 or by calling (415) 901-7000.
We plan to post on our Web site at the address described above any future amendments or waivers of our Code of Conduct.
| ITEM 11. | EXECUTIVE COMPENSATION |
The information required by this Item is incorporated herein by reference to information contained in the Proxy Statement, including "Compensation Discussion and Analysis," "Committee Reports," "Directors and Corporate Governance" and "Executive Compensation and Other Matters."
| ITEM 12. | SECURITY OWNERSHIP OF CERTAIN BENEFICIAL OWNERS AND MANAGEMENT AND RELATED STOCKHOLDER MATTERS |
The information required by this Item is incorporated herein by reference to information contained in the Proxy Statement, including "Security Ownership of Certain Beneficial Owners and Management and Related Stockholder Matters" and "Equity Compensation Plan Information."
| ITEM 13. | CERTAIN RELATIONSHIPS AND RELATED TRANSACTIONS AND DIRECTOR INDEPENDENCE |
The information required by this Item is incorporated herein by reference to information contained in the Proxy Statement, including "Directors and Corporate Governance" and "Employment Contracts and Certain Transactions."
| ITEM 14. | PRINCIPAL ACCOUNTING FEES AND SERVICES |
The information required by this Item is incorporated herein by reference to information contained in the Proxy Statement, including "Ratification of Appointment of Independent Auditors."
91
PART IV
| ITEM 15. | EXHIBITS, FINANCIAL STATEMENT SCHEDULES |
(a) The following documents are filed as a part of this Report:
1. Financial Statements : The information concerning our financial statements, and Report of Independent Registered Public Accounting Firm required by this Item is incorporated by reference herein to the section of this Report in Item 8, entitled "Consolidated Financial Statements and Supplementary Data."
2. Financial Statement Schedules : Schedule II Valuation and Qualifying Accounts is filed as part of this Report and should be read in conjunction with the Consolidated Financial Statements and Notes thereto.
The Financial Statement Schedules not listed have been omitted because they are not applicable or are not required or the information required to be set forth herein is included in the Consolidated Financial Statements or Notes thereto.
3. Exhibits: See "Index to Exhibits."
(b) Exhibits. The exhibits listed below in the accompanying "Index to Exhibits" are filed or incorporated by reference as part of this Annual Report on Form 10-K.
(c) Financial Statement Schedules .
salesforce.com, inc.
Schedule II Valuation and Qualifying Accounts
Description | Balance at Beginning of Year | Additions | Deductions Write-offs | Balance at End of Year | ||||||||||||
Fiscal year ended January 31, 2011 | ||||||||||||||||
Allowance for doubtful accounts | $ | 1,050,000 | $ | 3,995,000 | $ | 3,334,000 | $ | 1,711,000 | ||||||||
Fiscal year ended January 31, 2010 | ||||||||||||||||
Allowance for doubtful accounts | $ | 1,527,000 | $ | 2,787,000 | $ | 3,264,000 | $ | 1,050,000 | ||||||||
Fiscal year ended January 31, 2009 | ||||||||||||||||
Allowance for doubtful accounts | $ | 906,000 | $ | 4,390,000 | $ | 3,769,000 | $ | 1,527,000 | ||||||||
92
SIGNATURES
Pursuant to the requirements of Section 13 or 15(d) of the Securities Exchange Act of 1934, the registrant has duly caused this report to be signed on its behalf by the undersigned thereunto duly authorized.
Dated: March 23, 2011
| salesforce.com, inc. |
| /s/ G RAHAM S MITH |
| Graham Smith |
Chief Financial Officer (Principal Financial Officer and Duly Authorized Officer) |
POWER OF ATTORNEY AND SIGNATURES
KNOW ALL PERSONS BY THESE PRESENT, that each person whose signature appears below constitutes and appoints Marc Benioff, Graham Smith and David Schellhase, his attorney-in-fact, each with the power of substitution, for him in any and all capacities, to sign any amendments to this annual report on Form 10-K, and to file the same, with exhibits thereto and other documents in connection therewith, with the Securities and Exchange Commission, hereby ratifying and confirming all that said attorney-in-fact, or his substitute or substitutes, may do or cause to be done by virtue hereof.
Pursuant to the requirements of the Securities Exchange Act of 1934, this report has been signed below by the following persons on behalf of the registrant and in the capacities and on the dates indicated.
Signature | Title | Date | ||
/S/ M ARC B ENIOFF Marc Benioff | Chairman of the Board of Directors and Chief Executive Officer (Principal Executive Officer) | March 23, 2011 | ||
/S/ G RAHAM S MITH Graham Smith | Chief Financial Officer (Principal Financial & Accounting Officer) | March 23, 2011 | ||
/S/ C RAIG C ONWAY Craig Conway | Director | March 23, 2011 | ||
/S/ A LAN H ASSENFELD Alan Hassenfeld | Director | March 23, 2011 | ||
/S/ C RAIG R AMSEY Craig Ramsey | Director | March 23, 2011 | ||
/S/ S ANFORD R. R OBERTSON Sanford R. Robertson | Director | March 23, 2011 | ||
/S/ S TRATTON S CLAVOS Stratton Sclavos | Director | March 23, 2011 | ||
/S/ L AWRENCE T OMLINSON Lawrence Tomlinson | Director | March 23, 2011 | ||
/S/ M AYNARD W EBB Maynard Webb | Director | March 23, 2011 | ||
/S/ S HIRLEY Y OUNG Shirley Young | Director | March 23, 2011 | ||
93
Index to Exhibits
Exhibit 2.1(1) | Agreement and Plan of Merger dated as of December 7, 2010, by and among salesforce.com, inc., Hi'iaka Acquisition Corporation, Heroku, Inc. and with respect to Articles VII, VIII and IX thereof only, John Connors as Stockholder Representative and U.S. Bank National Association as Escrow Agent | |
Exhibit 3.1(2) | Restated Certificate of Incorporation of salesforce.com, inc. | |
Exhibit 3.2(3) | Amended and Restated Bylaws of salesforce.com, inc. | |
Exhibit 4.1(2) | Specimen Common Stock Certificate | |
Exhibit 4.2(4) | Indenture between salesforce.com, inc. and U.S. Bank National Association, dated as of January 19, 2010 including the form of 0.75% Convertible Senior Notes due 2015 therein | |
Exhibit 10.1*(2) | Form of Indemnification Agreement between salesforce.com, inc. and its officers and directors | |
Exhibit 10.2*(5) | 1999 Stock Option Plan, as amended | |
Exhibit 10.3*(6) | 2004 Equity Incentive Plan, as amended | |
Exhibit 10.4*(2) | 2004 Employee Stock Purchase Plan | |
Exhibit 10.5* | 2004 Outside Directors Stock Plan, as amended | |
Exhibit 10.6*(3) | 2006 Inducement Equity Incentive Plan | |
Exhibit 10.7*(7) | Mahalo Bonus Plan | |
Exhibit 10.8**(5) | Master Service Agreement dated May 17, 2005 between salesforce.com, inc. and Equinix, Inc. | |
Exhibit 10.9(8) | Resource Sharing Agreement dated as of January 29, 2009 between salesforce.com, inc., salesforce.com foundation, and salesforce.org | |
Exhibit 10.10 | Reseller Agreement dated as of January 30, 2009 between salesforce.com, inc and salesforce.org | |
Exhibit 10.11* | Form of Offer Letter and schedule of omitted details thereto | |
Exhibit 10.12*(8) | Form of Change of Control and Retention Agreement as entered into with Marc Benioff | |
Exhibit 10.13*(8) | Form of Change of Control and Retention Agreement as entered into with Parker Harris, George Hu, Graham Smith, Jim Steele, Polly Sumner and Frank van Veenendaal | |
Exhibit 10.14*(8) | Form of Change of Control and Retention Agreement as entered into with David Schellhase | |
Exhibit 10.15(4) | Purchase Agreement dated January 12, 2010 between salesforce.com, inc. and Merrill Lynch, Pierce, Fenner & Smith Incorporated, as representative of the several initial purchasers named in Schedule A thereto | |
Exhibit 10.16(4) | Form of Convertible Bond Hedge Confirmation | |
Exhibit 10.17(4) | Form of Warrant Confirmation | |
Exhibit 10.18** | Agreement of Purchase and Sale and Joint Escrow Instructions dated as of October 21, 2010 by and between ARE-San Francisco No. 22, LLC and Bay Jacaranda No. 3334, LLC | |
Exhibit 10.19** | Agreement of Purchase and Sale and Joint Escrow Instructions dated as of October 21, 2010 by and between ARE-San Francisco No. 16, LLC and Bay Jacaranda No. 2932, LLC | |
Exhibit 10.20** | Agreement of Purchase and Sale and Joint Escrow Instructions dated as of October 21, 2010 by and between ARE-San Francisco No. 19, LLC and Bay Jacaranda No. 2627, LLC | |
Exhibit 21.1 | List of Subsidiaries | |
Exhibit 23.1 | Consent of Independent Registered Public Accounting Firm | |
Exhibit 24.1 | Power of Attorney. (See page 93) | |
Exhibit 31.1 | Certification of Chief Executive Officer pursuant to Exchange Act Rule 13a-14(a) or 15(d)-14(a), as adopted pursuant to Section 302 of the Sarbanes-Oxley Act of 2002 | |
Exhibit 31.2 | Certification of Chief Financial Officer pursuant to Exchange Act Rule 13a-14(a) or 15(d)-14(a), as adopted pursuant to Section 302 of the Sarbanes-Oxley Act of 2002 | |
Exhibit 32.1 | Certification of Chief Executive Officer and Chief Financial Officer pursuant to 18 U.S.C. Section 1350, as adopted pursuant to Section 906 of the Sarbanes-Oxley Act of 2002 | |
Exhibit 101.INS(9) | XBRL Instance Document | |
Exhibit 101.SCH(9) | XBRL Taxonomy Extension Schema Document | |
Exhibit 101.CAL(9) | XBRL Taxonomy Extension Calculation Linkbase Document | |
Exhibit 101.DEF(9) | XBRL Extension Definition | |
Exhibit 101.LAB(9) | XBRL Taxonomy Extension Label Linkbase Document | |
Exhibit 101.PRE(9) | XBRL Taxonomy Extension Presentation Linkbase Document | |
| * | Denotes a management contract or compensatory plan or arrangement. |
| ** | Confidential treatment has been requested for a portion of this exhibit. |
| (1) | Incorporated by reference from the company's Form 8-K as filed with the Securities and Exchange Commission on December 8, 2010. |
| (2) | Incorporated by reference from the Company's registration statement on Form S-1 (No. 333-111289), Amendment No. 3, as filed with the Securities and Exchange Commission on April 20, 2004. |
| (3) | Incorporated by reference from the Company's Form 8-K as filed with the Securities and Exchange Commission on January 14, 2011. |
| (4) | Incorporated by reference from the company's Form 8-K as filed with the Securities and Exchange Commission on January 19, 2010. |
| (5) | Incorporated by reference from the Company's Form 10-K for the annual period ended January 31, 2006 as filed with the Securities and Exchange Commission on March 15, 2006. |
| (6) | Incorporated by reference from the Company's Form 10-Q for the quarterly period ended July 31, 2006 as filed with the Securities and Exchange Commission on August 18, 2006. |
| (7) | Incorporated by reference from the Company's Form 10-Q for the quarterly period ended July 31, 2009 as filed with the Securities and Exchange Commission on August 25, 2009. |
| (8) | Incorporated by reference from the Company's Form 10-K for the annual period ended January 31, 2010 as filed with the Securities and Exchange Commission on March 11, 2010. |
| (9) | The financial information contained in these XBRL documents is unaudited and these are not the official publicly filed financial statements of salesforce.com, inc. The purpose of submitting these XBRL documents is to test the related format and technology, and, as a result, investors should continue to rely on the official filed version of the furnished documents and not rely on this information in making investment decisions. In accordance with Rule 402 of Regulation S-T, the information in these exhibits shall not be deemed to be "filed" for purposes of Section 18 of the Exchange Act, or otherwise subject to the liability of that section, and shall not be incorporated by reference into any registration statement or other document filed under the Securities Act, or the Exchange Act, except as shall be expressly set forth by specific reference in such filing. |