UNITED STATES
SECURITIES AND EXCHANGE COMMISSION
Washington, D.C. 20549
FORM 10-Q
(Mark One)
| ☒ | QUARTERLY REPORT PURSUANT TO SECTION 13 OR 15(d) OF THE SECURITIES EXCHANGE ACT OF 1934 |
For the quarterly period ended March 31, 2018
or
| ☐ | TRANSITION REPORT PURSUANT TO SECTION 13 OR 15(d) OF THE SECURITIES EXCHANGE ACT OF 1934 |
For the transition period from to
Commission file number: 001-32395
ConocoPhillips
(Exact name of registrant as specified in its charter)
| Delaware | 01-0562944 | |
| (State or other jurisdiction of incorporation or organization) | (I.R.S. Employer Identification No.) |
600 North Dairy Ashford, Houston, TX 77079
(Address of principal executive offices) (Zip Code)
281-293-1000
(Registrant's telephone number, including area code)
Indicate by check mark whether the registrant (1) has filed all reports required to be filed by Section 13 or 15(d) of the Securities Exchange Act of 1934 during the preceding 12 months (or for such shorter period that the registrant was required to file such reports), and (2) has been subject to such filing requirements for the past 90 days. Yes ☒ No ☐
Indicate by check mark whether the registrant has submitted electronically and posted on its corporate Web site, if any, every Interactive Data File required to be submitted and posted pursuant to Rule 405 of Regulation S-T during the preceding 12 months (or for such shorter period that the registrant was required to submit and post such files). Yes ☒ No ☐
Indicate by check mark whether the registrant is a large accelerated filer, an accelerated filer, a non-accelerated filer, a smaller reporting company, or an emerging growth company. See the definitions of "large accelerated filer," "accelerated filer," "smaller reporting company" and "emerging growth company" in Rule 12b-2 of the Exchange Act.
| Large accelerated filer | ☒ | Accelerated filer | ☐ | |||
| Non-accelerated filer | ☐ | Smaller reporting company | ☐ | |||
| Emerging growth company | ☐ | |||||
If an emerging growth company, indicate by check mark if the registrant has elected not to use the extended transition period for complying with any new or revised financial accounting standards provided pursuant to Section 13(a) of the Exchange Act. ☐
Indicate by check mark whether the registrant is a shell company (as defined in Rule 12b-2 of the Exchange Act). Yes ☐ No ☒
The registrant had 1,170,066,208 shares of common stock, $.01 par value, outstanding at March 31, 2018.
CONOCOPHILLIPS
TABLE OF CONTENTS
| Page | ||||
Part I-Financial Information | ||||
Item 1. Financial Statements | ||||
Consolidated Income Statement | 1 | |||
Consolidated Statement of Comprehensive Income | 2 | |||
Consolidated Balance Sheet | 3 | |||
Consolidated Statement of Cash Flows | 4 | |||
Notes to Consolidated Financial Statements | 5 | |||
Supplementary Information-Condensed Consolidating Financial Information | 32 | |||
Item 2. Management's Discussion and Analysis of Financial Condition and Results of Operations | 36 | |||
Item 3. Quantitative and Qualitative Disclosures About Market Risk | 55 | |||
Item 4. Controls and Procedures | 55 | |||
Part II-Other Information | ||||
Item 1. Legal Proceedings | 56 | |||
Item 1A. Risk Factors | 56 | |||
Item 2. Unregistered Sales of Equity Securities and Use of Proceeds | 57 | |||
Item 6. Exhibits | 58 | |||
Signature | 59 | |||
PART I. FINANCIAL INFORMATION
| Item 1. | FINANCIAL STATEMENTS |
| Consolidated Income Statement | ConocoPhillips |
| Millions of Dollars | ||||||||
| Three Months Ended March 31 | ||||||||
| 2018 | 2017 | * | ||||||
|
| |||||||
Revenues and Other Income | ||||||||
Sales and other operating revenues | $ | 8,798 | 7,518 | |||||
Equity in earnings of affiliates | 208 | 200 | ||||||
Gain on dispositions | 7 | 22 | ||||||
Other income (loss) | (52 | ) | 31 | |||||
| ||||||||
Total Revenues and Other Income | 8,961 | 7,771 | ||||||
| ||||||||
Costs and Expenses | ||||||||
Purchased commodities | 3,714 | 3,192 | ||||||
Production and operating expenses | 1,171 | 1,291 | ||||||
Selling, general and administrative expenses | 99 | 97 | ||||||
Exploration expenses | 95 | 550 | ||||||
Depreciation, depletion and amortization | 1,412 | 1,979 | ||||||
Impairments | 12 | 175 | ||||||
Taxes other than income taxes | 183 | 231 | ||||||
Accretion on discounted liabilities | 88 | 95 | ||||||
Interest and debt expense | 184 | 315 | ||||||
Foreign currency transaction losses | 30 | 10 | ||||||
Other expense | 197 | 68 | ||||||
| ||||||||
Total Costs and Expenses | 7,185 | 8,003 | ||||||
| ||||||||
Income (loss) before income taxes | 1,776 | (232 | ) | |||||
Income tax provision (benefit) | 876 | (831 | ) | |||||
| ||||||||
Net income | 900 | 599 | ||||||
Less: net income attributable to noncontrolling interests | (12 | ) | (13 | ) | ||||
| ||||||||
Net Income Attributable to ConocoPhillips | $ | 888 | 586 | |||||
| ||||||||
Net Income Attributable to ConocoPhillips Per Share of Common Stock (dollars) | ||||||||
Basic | $ | 0.75 | 0.47 | |||||
Diluted | 0.75 | 0.47 | ||||||
| ||||||||
Dividends Paid Per Share of Common Stock (dollars) | $ | 0.29 | 0.27 | |||||
| ||||||||
Average Common Shares Outstanding (in thousands) | ||||||||
Basic | 1,179,792 | 1,243,280 | ||||||
Diluted | 1,186,454 | 1,248,722 | ||||||
| ||||||||
*Certain amounts have been reclassified to conform to the current-period presentation resulting from the adoption of ASU No. 2017-07.
See Note 2-Changes in Accounting Principles, for additional information.
See Notes to Consolidated Financial Statements.
1
| Consolidated Statement of Comprehensive Income | ConocoPhillips |
| Millions of Dollars | ||||||||
| Three Months Ended March 31 | ||||||||
| 2018 | 2017 | |||||||
|
| |||||||
Net Income | $ | 900 | 599 | |||||
Other comprehensive income | ||||||||
Defined benefit plans | ||||||||
Reclassification adjustment for amortization of prior service credit included in net income | (10 | ) | (9 | ) | ||||
Net actuarial loss arising during the period | - | (7 | ) | |||||
Reclassification adjustment for amortization of net actuarial losses included in net income | 24 | 90 | ||||||
Income taxes on defined benefit plans | (3 | ) | (26 | ) | ||||
| ||||||||
Defined benefit plans, net of tax | 11 | 48 | ||||||
| ||||||||
Foreign currency translation adjustments | 78 | 184 | ||||||
| ||||||||
Foreign currency translation adjustments, net of tax | 78 | 184 | ||||||
| ||||||||
Other Comprehensive Income, Net of Tax | 89 | 232 | ||||||
| ||||||||
Comprehensive Income | 989 | 831 | ||||||
Less: comprehensive income attributable to noncontrolling interests | (12 | ) | (13 | ) | ||||
| ||||||||
Comprehensive Income Attributable to ConocoPhillips | $ | 977 | 818 | |||||
| ||||||||
See Notes to Consolidated Financial Statements.
2
| Consolidated Balance Sheet | ConocoPhillips |
| Millions of Dollars | ||||||||
| March 31 2018 | December 31 2017 | |||||||
|
| |||||||
Assets | ||||||||
Cash and cash equivalents | $ | 4,984 | 6,325 | |||||
Short-term investments | 288 | 1,873 | ||||||
Accounts and notes receivable (net of allowance of $3 million in 2018 and $4 million in 2017) | 4,032 | 4,179 | ||||||
Accounts and notes receivable-related parties | 160 | 141 | ||||||
Investment in Cenovus Energy | 1,776 | 1,899 | ||||||
Inventories | 1,053 | 1,060 | ||||||
Prepaid expenses and other current assets | 894 | 1,035 | ||||||
| ||||||||
Total Current Assets | 13,187 | 16,512 | ||||||
Investments and long-term receivables | 9,572 | 9,599 | ||||||
Loans and advances-related parties | 399 | 461 | ||||||
Net properties, plants and equipment (net of accumulated depreciation, depletion and amortization of $66,710 million in 2018 and $64,748 million in 2017) | 45,997 | 45,683 | ||||||
Other assets | 1,572 | 1,107 | ||||||
| ||||||||
Total Assets | $ | 70,727 | 73,362 | |||||
| ||||||||
Liabilities | ||||||||
Accounts payable | $ | 3,824 | 4,009 | |||||
Accounts payable-related parties | 62 | 21 | ||||||
Short-term debt | 337 | 2,575 | ||||||
Accrued income and other taxes | 1,341 | 1,038 | ||||||
Employee benefit obligations | 408 | 725 | ||||||
Other accruals | 1,137 | 1,029 | ||||||
| ||||||||
Total Current Liabilities | 7,109 | 9,397 | ||||||
Long-term debt | 16,709 | 17,128 | ||||||
Asset retirement obligations and accrued environmental costs | 7,789 | 7,631 | ||||||
Deferred income taxes | 5,409 | 5,282 | ||||||
Employee benefit obligations | 1,832 | 1,854 | ||||||
Other liabilities and deferred credits | 1,161 | 1,269 | ||||||
| ||||||||
Total Liabilities | 40,009 | 42,561 | ||||||
| ||||||||
Equity | ||||||||
Common stock (2,500,000,000 shares authorized at $.01 par value) | ||||||||
Issued (2018-1,787,239,080 shares; 2017-1,785,419,175 shares) | ||||||||
Par value | 18 | 18 | ||||||
Capital in excess of par | 46,642 | 46,622 | ||||||
Treasury stock (at cost: 2018-617,172,872 shares; 2017-608,312,034 shares) | (40,406 | ) | (39,906 | ) | ||||
Accumulated other comprehensive loss | (5,371 | ) | (5,518 | ) | ||||
Retained earnings | 29,663 | 29,391 | ||||||
| ||||||||
Total Common Stockholders' Equity | 30,546 | 30,607 | ||||||
Noncontrolling interests | 172 | 194 | ||||||
| ||||||||
Total Equity | 30,718 | 30,801 | ||||||
| ||||||||
Total Liabilities and Equity | $ | 70,727 | 73,362 | |||||
| ||||||||
See Notes to Consolidated Financial Statements.
3
| Consolidated Statement of Cash Flows | ConocoPhillips |
| Millions of Dollars | ||||||||
| Three Months Ended March 31 | ||||||||
| 2018 | 2017 | |||||||
|
| |||||||
Cash Flows From Operating Activities | ||||||||
Net Income | $ | 900 | 599 | |||||
Adjustments to reconcile net income to net cash provided by operating activities | ||||||||
Depreciation, depletion and amortization | 1,412 | 1,979 | ||||||
Impairments | 12 | 175 | ||||||
Dry hole costs and leasehold impairments | 20 | 406 | ||||||
Accretion on discounted liabilities | 88 | 95 | ||||||
Deferred taxes | 65 | (1,314 | ) | |||||
Undistributed equity earnings | (34 | ) | (43 | ) | ||||
Gain on dispositions | (7 | ) | (22 | ) | ||||
Other | 29 | (47 | ) | |||||
Working capital adjustments | ||||||||
Decrease in accounts and notes receivable | 139 | 78 | ||||||
Decrease (increase) in inventories | 12 | (76 | ) | |||||
Decrease (increase) in prepaid expenses and other current assets | (22 | ) | 10 | |||||
Decrease in accounts payable | (181 | ) | (129 | ) | ||||
Increase (decrease) in taxes and other accruals | (34 | ) | 79 | |||||
| ||||||||
Net Cash Provided by Operating Activities | 2,399 | 1,790 | ||||||
| ||||||||
Cash Flows From Investing Activities | ||||||||
Capital expenditures and investments | (1,535 | ) | (966 | ) | ||||
Working capital changes associated with investing activities | 28 | (26 | ) | |||||
Proceeds from asset dispositions | 169 | 35 | ||||||
Net sales (purchases) of short-term investments | 1,593 | (203 | ) | |||||
Collection of advances/loans-related parties | 59 | 57 | ||||||
Other | (392 | ) | 129 | |||||
| ||||||||
Net Cash Used in Investing Activities | (78 | ) | (974 | ) | ||||
| ||||||||
Cash Flows From Financing Activities | ||||||||
Repayment of debt | (2,888 | ) | (839 | ) | ||||
Issuance of company common stock | (18 | ) | (46 | ) | ||||
Repurchase of company common stock | (500 | ) | (112 | ) | ||||
Dividends paid | (338 | ) | (331 | ) | ||||
Other | (32 | ) | (16 | ) | ||||
| ||||||||
Net Cash Used in Financing Activities | (3,776 | ) | (1,344 | ) | ||||
| ||||||||
Effect of Exchange Rate Changes on Cash, Cash Equivalents and Restricted Cash | 125 | 27 | ||||||
| ||||||||
Net Change in Cash, Cash Equivalents and Restricted Cash | (1,330 | ) | (501 | ) | ||||
Cash, cash equivalents and restricted cash at beginning of period | 6,536 | * | 3,610 | |||||
| ||||||||
Cash, Cash Equivalents and Restricted Cash at End of Period | $ | 5,206 | 3,109 | |||||
| ||||||||
*Restated to include $211 million of restricted cash at January 1, 2018.
Restricted cash totaling $222 million is included in the "Other assets" line of our Consolidated Balance Sheet as of March 31, 2018.
See Notes to Consolidated Financial Statements.
4
| Notes to Consolidated Financial Statements | ConocoPhillips |
Note 1-Basis of Presentation
The interim-period financial information presented in the financial statements included in this report is unaudited and, in the opinion of management, includes all known accruals and adjustments necessary for a fair presentation of the consolidated financial position of ConocoPhillips and its results of operations and cash flows for such periods. All such adjustments are of a normal and recurring nature unless otherwise disclosed. Certain notes and other information have been condensed or omitted from the interim financial statements included in this report. Therefore, these financial statements should be read in conjunction with the consolidated financial statements and notes included in our 2017 Annual Report on Form 10-K.
Note 2-Changes in Accounting Principles
We adopted the provisions of Financial Accounting Standards Board (FASB) Accounting Standards Update (ASU) No. 2014-09, "Revenue from Contracts with Customers," and its amendments issued by the provisions of ASU No. 2016-08, "Principal versus Agent Considerations (Reporting Revenue Gross versus Net)," ASU No. 2016-10, "Identifying Performance Obligations and Licensing," ASU No. 2016-12, "Narrow-Scope Improvements and Practical Expedients," and ASU No. 2016-20, "Technical Corrections and Improvements to Topic 606, Revenue From Contracts with Customers," collectively Accounting Standards Codification (ASC) Topic 606, "Revenue from Contracts with Customers," (ASC Topic 606) beginning January 1, 2018. ASC Topic 606 outlines a single comprehensive model for an entity to use in accounting for revenue arising from all contracts with customers except where revenues are in scope of another accounting standard. The ASU superseded the revenue recognition requirements in ASC Topic 605, "Revenue Recognition," and most industry-specific guidance. ASC Topic 606 sets forth a five-step model for determining when and how revenue is recognized. Under the model, an entity is required to recognize revenue to depict the transfer of goods or services to a customer at an amount reflecting the consideration it expects to receive in exchange for those goods and services. ASC Topic 606 also requires certain additional revenue-related disclosures. The adoption of ASC Topic 606 did not have a material impact on our consolidated financial statements. See Note 20-Sales and Other Operating Revenues for additional information related to this ASC.
We adopted the provisions of FASB ASU No. 2016-01, "Recognition and Measurement of Financial Assets and Liabilities," (ASU No. 2016-01) beginning January 1, 2018. The ASU, among other things, requires an entity to record the changes in fair value of equity investments, other than investments accounted for using the equity method, within net income. Under this ASU, an entity is no longer able to recognize unrealized holding gains and losses on available-for-sale securities in other comprehensive income and instead must recognize them in the income statement. See Note 7-Investment in Cenovus Energy and Note 16-Accumulated Other Comprehensive Loss for additional information relating to this ASU.
5
The cumulative effect of the changes made to our consolidated balance sheet at January 1, 2018, for the adoption of ASC Topic 606 and ASU No. 2016-01 were as follows:
| Millions of Dollars | ||||||||||||||||
| December 31 2017 | ASC Topic 606 Adjustments | ASU No. 2016-01 Adjustments | January 1 2018 | |||||||||||||
|
| |||||||||||||||
Liabilities | ||||||||||||||||
Other accruals | $ | 1,029 | 104 | - | 1,133 | |||||||||||
Total current liabilities | 9,397 | 104 | - | 9,501 | ||||||||||||
Deferred income taxes | 5,282 | (31 | ) | - | 5,251 | |||||||||||
Other liabilities and deferred credits | 1,269 | 147 | - | 1,416 | ||||||||||||
Total liabilities | 42,561 | 220 | - | 42,781 | ||||||||||||
| ||||||||||||||||
Equity | ||||||||||||||||
Accumulated other comprehensive loss | $ | (5,518 | ) | - | 58 | (5,460 | ) | |||||||||
Retained earnings | 29,391 | (220 | ) | (58 | ) | 29,113 | ||||||||||
Total common stockholders' equity | 30,607 | (220 | ) | - | 30,387 | |||||||||||
Total equity | 30,801 | (220 | ) | - | 30,581 | |||||||||||
| ||||||||||||||||
For discussion of adjustments for ASU No. 2016-01 and ASC Topic 606, see Note 7-Investment in Cenovus Energy and Note 20-Sales and Other Operating Revenues, respectively.
We adopted the provisions of FASB ASU No. 2017-07, "Improving the Presentation of Net Periodic Pension Cost and Net Periodic Postretirement Benefit Cost," beginning January 1, 2018. We retrospectively applied the presentation of service cost separate from the other components of net periodic costs. The interest cost, expected return on plan assets, amortization of prior service cost/credit, recognized net actuarial loss/gain, settlement expense, curtailment loss/gain, and special termination benefits have been reclassified from the "Production and operating expenses," "Selling, general and administrative expenses," and "Exploration expenses" lines to the "Other expense" line on our consolidated income statement. We elected to apply the practical expedient which allows us to reclassify amounts disclosed previously in the employee benefit plans footnote as the basis for applying retrospective presentation for prior comparative periods as it is impracticable to determine the disaggregation of the cost components for amounts capitalized and amortized in those periods. On a prospective basis, the other components of net periodic benefit costs will not be included in amounts capitalized in inventory or properties, plants, and equipment (PP&E).
The effect of the retrospective presentation change related to the net periodic benefit cost of our defined benefit pension and other postretirement employee benefits plans on our consolidated income statement was as follows:
| Millions of Dollars | ||||||||||||
| Three Months Ended March 31, 2017 | ||||||||||||
| Previously Reported | Effect of Change Higher/(Lower) | As Revised | ||||||||||
|
| |||||||||||
Production and operating expenses | $ | 1,298 | (7 | ) | 1,291 | |||||||
Selling, general and administrative expenses | 157 | (60 | ) | 97 | ||||||||
Exploration expenses | 551 | (1 | ) | 550 | ||||||||
Other expense | - | 68 | 68 | |||||||||
| ||||||||||||
We adopted the provisions of FASB ASU No. 2016-15, "Classification of Certain Cash Receipts and Cash Payments," beginning January 1, 2018. This ASU clarifies how certain cash receipts and cash payments should be classified and presented in the statement of cash flows. We have made an accounting policy election
6
to classify distributions received from equity method investees using the nature of the distribution approach which classifies distributions received from investees as either cash inflows from operating activities or cash inflows from investing activities in the statement of cash flows based on the nature of the activities of the investee that generated the distribution. The impact of adopting this ASU was not material to prior presented periods.
We adopted the provisions of FASB ASU No. 2016-18, "Restricted Cash," beginning January 1, 2018. This ASU requires amounts deemed restricted cash to be included with cash and cash equivalents when reconciling the beginning-of-period and end-of-period total amounts shown on the statement of cash flows, and presentation should permit a reconciliation when cash, cash equivalents and restricted cash are presented in more than one line item on the balance sheet. We have amounts deposited in statutory bank accounts in certain countries to satisfy asset retirement obligations (ARO). These amounts are deemed restricted cash and are included in the "Other assets" line of our consolidated balance sheet. This standard is required to be applied retrospectively to all periods presented, but the impact in those periods was not material.
Note 3-Variable Interest Entities (VIEs)
We hold variable interests in VIEs that have not been consolidated because we are not considered the primary beneficiary. Information on our significant VIEs follows:
Australia Pacific LNG Pty Ltd (APLNG)
APLNG is considered a VIE, as it has entered into certain contractual arrangements that provide it with additional forms of subordinated financial support. We are not the primary beneficiary of APLNG because we share with Origin Energy and China Petrochemical Corporation (Sinopec) the power to direct the key activities of APLNG that most significantly impact its economic performance, which involve activities related to the production and commercialization of coalbed methane, as well as liquefied natural gas (LNG) processing and export marketing. As a result, we do not consolidate APLNG, and it is accounted for as an equity method investment.
As of March 31, 2018, we have not provided any financial support to APLNG other than amounts previously contractually required. Unless we elect otherwise, we have no requirement to provide liquidity or purchase the assets of APLNG. See Note 6-Investments, Loans and Long-Term Receivables, and Note 12-Guarantees, for additional information.
Marine Well Containment Company, LLC (MWCC)
MWCC provides well containment equipment and technology and related services in the deepwater U.S. Gulf of Mexico. Its principal activities involve the development and maintenance of rapid-response hydrocarbon well containment systems that are deployable in the Gulf of Mexico on a call-out basis. We have a 10 percent ownership interest in MWCC, and it is accounted for as an equity method investment because MWCC is a limited liability company in which we are a Founding Member and exercise significant influence through our permanent seat on the ten-member Executive Committee responsible for overseeing the affairs of MWCC. In 2016, MWCC executed a $154 million term loan financing arrangement with an external financial institution whose terms required the financing be secured by letters of credit provided by certain owners of MWCC, including ConocoPhillips. In connection with the financing transaction, we issued a letter of credit of $22 million which can be drawn upon in the event of a default by MWCC on its obligation to repay the proceeds of the term loan. The fair value of this letter of credit is immaterial and not recognized on our consolidated balance sheet. MWCC is considered a VIE, as it has entered into arrangements that provide it with additional forms of subordinated financial support. We are not the primary beneficiary and do not consolidate MWCC because we share the power to govern the business and operation of the company and to undertake certain obligations that most significantly impact its economic performance with nine other unaffiliated owners of MWCC.
7
At March 31, 2018, the carrying value of our equity method investment in MWCC was $135 million. We have not provided any financial support to MWCC other than amounts previously contractually required. Unless we elect otherwise, we have no requirement to provide liquidity or purchase the assets of MWCC.
Note 4-Inventories
Inventories consisted of the following:
| Millions of Dollars | ||||||||
| March 31 2018 | December 31 2017 | |||||||
|
| |||||||
Crude oil and natural gas | $ | 503 | 512 | |||||
Materials and supplies | 550 | 548 | ||||||
| ||||||||
| $ | 1,053 | 1,060 | ||||||
| ||||||||
Inventories valued on the last-in, first-out (LIFO) basis totaled $334 million and $341 million at March 31, 2018 and December 31, 2017, respectively. The estimated excess of current replacement cost over LIFO cost of inventories was approximately $13 million and $124 million at March 31, 2018 and December 31, 2017, respectively.
Note 5-Assets Held for Sale, Sold or Acquired
Assets Held for Sale
As of March 31, 2018, our interest in the Barnett met the criteria for assets held for sale and had a net carrying value of approximately $250 million after recording a before-tax impairment of $44 million in the first quarter of 2018 to reduce the carrying value to fair value. We reclassified $295 million of PP&E to "Prepaid expenses and other current assets" and $48 million of noncurrent liabilities, primarily ARO, to "Other accruals" on our consolidated balance sheet as a result of being held for sale. The before-tax loss associated with our interest in the Barnett, including the impairment noted above was $35 million and $10 million for the three months ended March 31, 2018 and March 31, 2017, respectively. Marketing efforts ceased in April 2018, and the assets were reclassified as held for use. The Barnett results of operations are reported in our Lower 48 segment.
In addition to the Barnett, certain other properties with a net carrying value of approximately $212 million in our Lower 48 segment met the criteria for assets held for sale as of December 31, 2017. A portion of these properties was sold in the first quarter of 2018, the details of which are discussed in the "Assets Sold" section below. The remaining held for sale properties had a net carrying value of approximately $104 million, which is reflected in the "Prepaid expenses and other current assets" line on our consolidated balance sheet as of March 31, 2018. In April 2018, these properties were sold for their carrying value.
Assets Sold
In the first quarter of 2018, we completed the sale of certain properties in the Lower 48 segment for net proceeds of $112 million. No gain or loss was recognized on the sale.
Acquisition
In the first quarter of 2018, we entered into an agreement with Anadarko Petroleum Corporation to acquire its nonoperated interest in the Western North Slope of Alaska, as well as its interest in the Alpine pipeline, for $400 million, before customary adjustments. In accordance with the agreement, we paid a deposit of $383 million which is reflected in the "Other assets" line of our consolidated balance sheet and the "Other" line in the "Cash Flows From Investing Activities" section of our consolidated statement of cash flows. The transaction is subject to regulatory approval and will be included in our Alaska segment.
8
Note 6-Investments, Loans and Long-Term Receivables
APLNG
APLNG's $8.5 billion project finance facility consists of financing agreements executed by APLNG with the Export-Import Bank of the United States for approximately $2.9 billion, the Export-Import Bank of China for approximately $2.7 billion, and a syndicate of Australian and international commercial banks for approximately $2.9 billion. All amounts have been drawn from the facility. APLNG made its first principal and interest repayment in March 2017 and will continue to make bi-annual payments until March 2029. At March 31, 2018, a balance of $7.5 billion was outstanding on the facility. See Note 12-Guarantees, for additional information.
APLNG is considered a VIE, as it has entered into certain contractual arrangements that provide it with additional forms of subordinated financial support. See Note 3-Variable Interest Entities (VIEs), for additional information.
At March 31, 2018, the carrying value of our equity method investment in APLNG was $7,707 million. The balance is included in the "Investments and long-term receivables" line on our consolidated balance sheet.
Subsequent to March 31, 2018, distributions from APLNG commenced with the receipt of an initial payment in April 2018.
FCCL
On May 17, 2017, we completed the sale of our 50 percent nonoperated interest in the Foster Creek Christina Lake (FCCL) Partnership, as well as the majority of our western Canada gas assets to Cenovus Energy. For additional information on the Canada disposition and our investment in Cenovus Energy, see Note 7-Investment in Cenovus Energy.
Loans and Long-Term Receivables
As part of our normal ongoing business operations, and consistent with industry practice, we enter into numerous agreements with other parties to pursue business opportunities. Included in such activity are loans made to certain affiliated and non-affiliated companies. At March 31, 2018, significant loans to affiliated companies included $522 million in project financing to Qatar Liquefied Gas Company Limited (3) (QG3).
On our consolidated balance sheet, the long-term portion of these loans is included in the "Loans and advances-related parties" line, while the short-term portion is in the "Accounts and notes receivable-related parties" line.
Note 7-Investment in Cenovus Energy
On May 17, 2017, we completed the sale of our 50 percent nonoperated interest in the FCCL Partnership, as well as the majority of our western Canada gas assets to Cenovus Energy. Consideration for the transaction included 208 million Cenovus Energy common shares, which approximated 16.9 percent of issued and outstanding Cenovus common stock at closing.
At closing, the fair value and cost basis of our investment in 208 million Cenovus Energy common shares was $1.96 billion based on a price of $9.41 per share on the New York Stock Exchange.
We adopted the provisions of ASU No. 2016-01, beginning January 1, 2018, using the cumulative-effect approach. Results for reporting periods beginning January 1, 2018, are presented under ASU No. 2016-01 with all changes in the fair value of our equity securities reflected within the "Other income (loss)" line of our consolidated income statement and within the "Other" line in the "Cash Flows From Operating Activities" section of our consolidated statement of cash flows. Prior period amounts are not adjusted under the cumulative-effect method of adopting ASU No. 2016-01. See Note 2-Changes in Accounting Principles and Note 16-Accumulated Other Comprehensive Loss for the effect on our consolidated balance sheet and the line items that have been impacted by the adoption of this standard.
9
The cumulative effect of applying the standard was the reclassification of accumulated unrealized holding losses of $58 million, recognized in 2017, related to our investment in Cenovus Energy from accumulated other comprehensive loss to retained earnings.
Our investment on our consolidated balance sheet as of March 31, 2018, is carried at fair value of $1.78 billion, reflecting the closing price of Cenovus Energy shares on the New York Stock Exchange of $8.54 per share, a decrease of $123 million from $1.90 billion at year-end 2017. This decrease relates solely to the net unrealized loss recorded in the first quarter of 2018 relating to the shares held at the reporting date. See Note 15-Fair Value Measurement, for additional information. Subject to market conditions, we intend to decrease our investment over time through market transactions, private agreements or otherwise.
Note 8-Suspended Wells
The capitalized cost of suspended wells at March 31, 2018, was $861 million, an increase of $8 million from $853 million at year-end 2017. No suspended wells were charged to dry hole expense during the first three months of 2018 relating to exploratory well costs capitalized for a period greater than one year as of December 31, 2017.
Note 9-Impairments
During the three-month periods ended March 31, 2018 and 2017, we recognized before-tax impairment charges within the following segments:
| Millions of Dollars | ||||||||
| Three Months Ended March 31 | ||||||||
| 2018 | 2017 | |||||||
|
| |||||||
Alaska | $ | - | 174 | |||||
Lower 48 | 11 | - | ||||||
Europe and North Africa | 1 | 1 | ||||||
| ||||||||
| $ | 12 | 175 | ||||||
| ||||||||
The first quarter of 2018 included impairments in our Lower 48 segment of $11 million related to developed properties in our Barnett asset which were written down to fair value less costs to sell, partly offset by a revision to reflect finalized proceeds. See Note 5-Assets Held for Sale, Sold or Acquired, for additional information on our dispositions.
The first quarter of 2017 included an impairment in our Alaska segment of $174 million for the associated PP&E carrying value of our small interest in the Point Thomson Unit.
The charges discussed below are included in the "Exploration expenses" line on our consolidated income statement and are not reflected in the table above.
In the first quarter of 2017, we recorded a before-tax impairment of $51 million in our Lower 48 segment for the associated carrying value of capitalized undeveloped leasehold costs of Shenandoah in deepwater Gulf of Mexico following the suspension of appraisal activity by the operator.
10
Note 10-Debt
As of March 31, 2018, our revolving credit facility, expiring in June 2019, was $6.75 billion. The revolving credit facility supports two commercial paper programs: the ConocoPhillips $6.25 billion program, primarily a funding source for short-term working capital needs, and the ConocoPhillips Qatar Funding Ltd. $500 million program, which is used to fund commitments relating to QG3. Commercial paper maturities are generally limited to 90 days.
At March 31, 2018 and December 31, 2017, we had no direct outstanding borrowings under the revolving credit facility and no letters of credit. We had no commercial paper outstanding at March 31, 2018 or December 31, 2017, under both the ConocoPhillips and the ConocoPhillips Qatar Funding Ltd. commercial paper programs. Since we had no commercial paper outstanding and had issued no letters of credit, we had access to $6.75 billion in borrowing capacity under our revolving credit facility at March 31, 2018.
In the first quarter of 2018, we redeemed or repurchased a total $2,650 million of debt as described below:
| • | 4.20% Notes due 2021 with remaining principal of $1.0 billion. |
| • | 2.875% Notes due 2021 with principal of $750 million. |
| • | 2.2% Notes due 2020 with principal of $500 million. |
| • | 8.125% Notes due 2030 with principal of $600 million (partial redemption of $210 million). |
| • | 7.8% Notes due 2027 with principal of $300 million (partial redemption of $97 million). |
| • | 7.9% Notes due 2047 with principal of $100 million (partial redemption of $40 million). |
| • | 9.125% Notes due 2021 with principal of $150 million (partial redemption of $27 million). |
| • | 8.20% Notes due 2025 with principal of $150 million (partial redemption of $16 million). |
| • | 7.65% Notes due 2023 with principal of $88 million (partial redemption of $10 million). |
We incurred premiums above book value to redeem or repurchase these debt instruments of $206 million.
At March 31, 2018, we had $283 million of certain variable rate demand bonds (VRDBs) outstanding with maturities ranging through 2035. The VRDBs are redeemable at the option of the bondholders on any business day. The VRDBs are included in the "Long-term debt" line on our consolidated balance sheet.
11
Note 11-Noncontrolling Interests
Activity attributable to common stockholders' equity and noncontrolling interests for the first three months of 2018 and 2017 was as follows:
| Millions of Dollars | ||||||||||||||||||||||||
| 2018 | 2017 | |||||||||||||||||||||||
| Common Stockholders' Equity | Non-Controlling Interest | Total Equity | Common Stockholders' Equity | Non-Controlling Interest | Total Equity | |||||||||||||||||||
|
|
|
| |||||||||||||||||||||
Balance at January 1 | $ | 30,607 | 194 | 30,801 | 34,974 | 252 | 35,226 | |||||||||||||||||
Net income | 888 | 12 | 900 | 586 | 13 | 599 | ||||||||||||||||||
Dividends | (338 | ) | - | (338 | ) | (331 | ) | - | (331 | ) | ||||||||||||||
Repurchase of company common stock | (500 | ) | - | (500 | ) | (112 | ) | - | (112 | ) | ||||||||||||||
Distributions to noncontrolling interests | - | (34 | ) | (34 | ) | - | (17 | ) | (17 | ) | ||||||||||||||
Changes in Accounting Principles* | (220 | ) | - | (220 | ) | - | - | - | ||||||||||||||||
Other changes, net** | 109 | - | 109 | 236 | - | 236 | ||||||||||||||||||
| ||||||||||||||||||||||||
Balance at March 31 | $ | 30,546 | 172 | 30,718 | 35,353 | 248 | 35,601 | |||||||||||||||||
| ||||||||||||||||||||||||
*See Note 2-Changes in Accounting Principles for additional information related to ASC Topic 606.
**Includes components of other comprehensive income, which are disclosed separately in our Consolidated Statement of Comprehensive Income.
Note 12-Guarantees
At March 31, 2018, we were liable for certain contingent obligations under various contractual arrangements as described below. We recognize a liability, at inception, for the fair value of our obligation as a guarantor for newly issued or modified guarantees. Unless the carrying amount of the liability is noted below, we have not recognized a liability because the fair value of the obligation is immaterial. In addition, unless otherwise stated, we are not currently performing with any significance under the guarantee and expect future performance to be either immaterial or have only a remote chance of occurrence.
APLNG Guarantees
At March 31, 2018, we had outstanding multiple guarantees in connection with our 37.5 percent ownership interest in APLNG. The following is a description of the guarantees with values calculated utilizing March 2018 exchange rates:
| • | During the third quarter of 2016, we issued a guarantee to facilitate the withdrawal of our pro-rata portion of the funds in a project finance reserve account. We estimate the remaining term of this guarantee is 11 years. Our maximum exposure under this guarantee is approximately $190 million and may become payable if an enforcement action is commenced by the project finance lenders against APLNG. At March 31, 2018, the carrying value of this guarantee was approximately $14 million. |
| • | In conjunction with our original purchase of an ownership interest in APLNG from Origin Energy in October 2008, we agreed to reimburse Origin Energy for our share of the existing contingent liability arising under guarantees of an existing obligation of APLNG to deliver natural gas under several sales agreements with remaining terms of up to 24 years. Our maximum potential liability for future payments, or cost of volume delivery, under these guarantees is estimated to be $940 million ($1.68 billion in the event of intentional or reckless breach), and would become payable if APLNG fails to meet its obligations under these agreements and the obligations cannot otherwise be mitigated. |
12
Future payments are considered unlikely, as the payments, or cost of volume delivery, would only be triggered if APLNG does not have enough natural gas to meet these sales commitments and if the co-venturers do not make necessary equity contributions into APLNG.
| • | We have guaranteed the performance of APLNG with regard to certain other contracts executed in connection with the project's continued development. The guarantees have remaining terms of up to 28 years or the life of the venture. Our maximum potential amount of future payments related to these guarantees is approximately $150 million and would become payable if APLNG does not perform. |
Other Guarantees
We have other guarantees with maximum future potential payment amounts totaling approximately $780 million, which consist primarily of guarantees of the residual value of leased office buildings, guarantees of the residual value of leased corporate aircraft, and a guarantee for our portion of a joint venture's project finance reserve accounts. These guarantees have remaining terms of up to five years and would become payable if, upon sale, certain asset values are lower than guaranteed amounts, business conditions decline at guaranteed entities, or as a result of nonperformance of contractual terms by guaranteed parties.
Indemnifications
Over the years, we have entered into agreements to sell ownership interests in certain corporations, joint ventures and assets that gave rise to qualifying indemnifications. These agreements include indemnifications for taxes, environmental liabilities, employee claims and litigation. The terms of these indemnifications vary greatly. The majority of these indemnifications are related to environmental issues, the term is generally indefinite and the maximum amount of future payments is generally unlimited. The carrying amount recorded for these indemnifications at March 31, 2018, was approximately $100 million. We amortize the indemnification liability over the relevant time period, if one exists, based on the facts and circumstances surrounding each type of indemnity. In cases where the indemnification term is indefinite, we will reverse the liability when we have information the liability is essentially relieved or amortize the liability over an appropriate time period as the fair value of our indemnification exposure declines. Although it is reasonably possible future payments may exceed amounts recorded, due to the nature of the indemnifications, it is not possible to make a reasonable estimate of the maximum potential amount of future payments. Included in the recorded carrying amount at March 31, 2018, were approximately $40 million of environmental accruals for known contamination that are included in the "Asset retirement obligations and accrued environmental costs" line on our consolidated balance sheet. For additional information about environmental liabilities, see Note 13-Contingencies and Commitments.
In 2012, we completed the separation of our downstream business, creating two independent energy companies: ConocoPhillips and Phillips 66. On March 1, 2015, a supplier to one of the refineries included in Phillips 66 as part of the separation of our downstream businesses formally registered Phillips 66 as a party to the supply agreement, thereby triggering a guarantee we provided at the time of separation. Our maximum potential liability for future payments under this guarantee, which would become payable if Phillips 66 does not perform its contractual obligations under the supply agreement, is approximately $1.27 billion. At March 31, 2018, the carrying value of this guarantee is approximately $98 million and the remaining term is seven years. Because Phillips 66 has indemnified us for losses incurred under this guarantee, we have recorded an indemnification asset from Phillips 66 of approximately $98 million. The recorded indemnification asset amount represents the estimated fair value of the guarantee; however, if we are required to perform under the guarantee, we would expect to recover from Phillips 66 any amounts in excess of that value, provided Phillips 66 is a going concern.
Note 13-Contingencies and Commitments
A number of lawsuits involving a variety of claims arising in the ordinary course of business have been filed against ConocoPhillips. We also may be required to remove or mitigate the effects on the environment of the placement, storage, disposal or release of certain chemical, mineral and petroleum substances at various active and inactive sites. We regularly assess the need for accounting recognition or disclosure of these
13
contingencies. In the case of all known contingencies (other than those related to income taxes), we accrue a liability when the loss is probable and the amount is reasonably estimable. If a range of amounts can be reasonably estimated and no amount within the range is a better estimate than any other amount, then the minimum of the range is accrued. We do not reduce these liabilities for potential insurance or third-party recoveries. If applicable, we accrue receivables for probable insurance or other third-party recoveries. With respect to income tax-related contingencies, we use a cumulative probability-weighted loss accrual in cases where sustaining a tax position is less than certain.
Based on currently available information, we believe it is remote that future costs related to known contingent liability exposures will exceed current accruals by an amount that would have a material adverse impact on our consolidated financial statements. As we learn new facts concerning contingencies, we reassess our position both with respect to accrued liabilities and other potential exposures. Estimates particularly sensitive to future changes include contingent liabilities recorded for environmental remediation, tax and legal matters. Estimated future environmental remediation costs are subject to change due to such factors as the uncertain magnitude of cleanup costs, the unknown time and extent of such remedial actions that may be required, and the determination of our liability in proportion to that of other responsible parties. Estimated future costs related to tax and legal matters are subject to change as events evolve and as additional information becomes available during the administrative and litigation processes.
Environmental
We are subject to international, federal, state and local environmental laws and regulations. When we prepare our consolidated financial statements, we record accruals for environmental liabilities based on management's best estimates, using all information that is available at the time. We measure estimates and base liabilities on currently available facts, existing technology, and presently enacted laws and regulations, taking into account stakeholder and business considerations. When measuring environmental liabilities, we also consider our prior experience in remediation of contaminated sites, other companies' cleanup experience, and data released by the U.S. Environmental Protection Agency (EPA) or other organizations. We consider unasserted claims in our determination of environmental liabilities, and we accrue them in the period they are both probable and reasonably estimable.
Although liability of those potentially responsible for environmental remediation costs is generally joint and several for federal sites and frequently so for other sites, we are usually only one of many companies cited at a particular site. Due to the joint and several liabilities, we could be responsible for all cleanup costs related to any site at which we have been designated as a potentially responsible party. We have been successful to date in sharing cleanup costs with other financially sound companies. Many of the sites at which we are potentially responsible are still under investigation by the EPA or the agency concerned. Prior to actual cleanup, those potentially responsible normally assess the site conditions, apportion responsibility and determine the appropriate remediation. In some instances, we may have no liability or may attain a settlement of liability. Where it appears that other potentially responsible parties may be financially unable to bear their proportional share, we consider this inability in estimating our potential liability, and we adjust our accruals accordingly. As a result of various acquisitions in the past, we assumed certain environmental obligations. Some of these environmental obligations are mitigated by indemnifications made by others for our benefit, and some of the indemnifications are subject to dollar limits and time limits.
We are currently participating in environmental assessments and cleanups at numerous federal Superfund and comparable state and international sites. After an assessment of environmental exposures for cleanup and other costs, we make accruals on an undiscounted basis (except those acquired in a purchase business combination, which we record on a discounted basis) for planned investigation and remediation activities for sites where it is probable future costs will be incurred and these costs can be reasonably estimated.
At March 31, 2018, our balance sheet included a total environmental accrual of $173 million, compared with $180 million at December 31, 2017, for remediation activities in the United States and Canada. We expect to incur a substantial amount of these expenditures within the next 30 years. In the future, we may be involved in additional environmental assessments, cleanups and proceedings.
14
Legal Proceedings
We are subject to various lawsuits and claims including but not limited to matters involving oil and gas royalty and severance tax payments, gas measurement and valuation methods, contract disputes, environmental damages, personal injury, and property damage. Our primary exposures for such matters relate to alleged royalty and tax underpayments on certain federal, state and privately owned properties and claims of alleged environmental contamination from historic operations. We will continue to defend ourselves vigorously in these matters.
Our legal organization applies its knowledge, experience and professional judgment to the specific characteristics of our cases, employing a litigation management process to manage and monitor the legal proceedings against us. Our process facilitates the early evaluation and quantification of potential exposures in individual cases. This process also enables us to track those cases that have been scheduled for trial and/or mediation. Based on professional judgment and experience in using these litigation management tools and available information about current developments in all our cases, our legal organization regularly assesses the adequacy of current accruals and determines if adjustment of existing accruals, or establishment of new accruals, is required.
Other Contingencies
We have contingent liabilities resulting from throughput agreements with pipeline and processing companies not associated with financing arrangements. Under these agreements, we may be required to provide any such company with additional funds through advances and penalties for fees related to throughput capacity not utilized. In addition, at March 31, 2018, we had performance obligations secured by letters of credit of $367 million (issued as direct bank letters of credit) related to various purchase commitments for materials, supplies, commercial activities and services incident to the ordinary conduct of business.
In 2007, we announced we had been unable to reach agreement with respect to our migration to an empresa mixta structure mandated by the Venezuelan government's Nationalization Decree. As a result, Venezuela's national oil company, Petróleos de Venezuela S.A. (PDVSA), or its affiliates, directly assumed control over ConocoPhillips' interests in the Petrozuata and Hamaca heavy oil ventures and the offshore Corocoro development project. In response to this expropriation, we filed a request for international arbitration on November 2, 2007, with the World Bank's International Centre for Settlement of Investment Disputes (ICSID). An arbitration hearing was held before an ICSID tribunal during the summer of 2010. On September 3, 2013, an ICSID arbitration tribunal held that Venezuela unlawfully expropriated ConocoPhillips' significant oil investments in June 2007. On January 17, 2017, the Tribunal reconfirmed the decision that the expropriation was unlawful. A separate arbitration phase is currently proceeding to determine the damages owed to ConocoPhillips for Venezuela's actions. In 2014, ConocoPhillips commenced a second arbitration under the rules of the International Chamber of Commerce (ICC) against PDVSA under the contracts that had established the Petrozuata and Hamaca projects (the Corocoro project is part of a separate ICC arbitration proceeding). In those proceedings, the ICC Tribunal ruled in April 2018 that PDVSA and two of its subsidiaries owed ConocoPhillips an indemnity of approximately $2.04 billion in connection with the expropriation of the projects and other pre-expropriation fiscal measures. Collection efforts are underway. In addition, ConocoPhillips brought fraudulent transfer actions in the U.S. District Court of Delaware, alleging that Venezuela and PDVSA have taken actions to improperly liquidate and expatriate assets from the United States to Venezuela in an effort to avoid judgment creditors.
In 2008, Burlington Resources, Inc., a wholly owned subsidiary of ConocoPhillips, initiated arbitration before ICSID against The Republic of Ecuador, challenging a windfall profits tax and subsequent expropriation of Blocks 7 and 21. On April 24, 2012, Ecuador filed environmental and infrastructure counterclaims against Burlington relating to the alleged impacts to Blocks 7 and 21. Ecuador also filed the environmental and infrastructure counterclaims relating to Blocks 7 and 21 in a separate, parallel ICSID arbitration brought by Perenco Ecuador Limited, Burlington's co-venturer and consortium operator. Perenco and Burlington each have joint liability for the counterclaims under their joint operating agreements. On December 14, 2012, the ICSID tribunal issued a decision in favor of Burlington, finding that Ecuador's seizure of Blocks 7 and 21 was an unlawful expropriation in violation of the Ecuador-U.S. Bilateral Investment Treaty. In February 2017, the ICSID tribunal unanimously awarded Burlington $380 million for Ecuador's unlawful expropriation and
15
breach of the U.S.-Ecuador Bilateral Investment Treaty. The tribunal also issued a separate decision finding Ecuador to be entitled to $42 million for environmental and infrastructure impacts to Blocks 7 and 21. In December 2017, Burlington and Ecuador entered into a settlement agreement by which Ecuador agreed to pay Burlington $337 million in two installments. The first installment of $75 million was paid on December 1, 2017, and the second installment of $262 million was paid on April 13, 2018. The settlement includes an offset for the counterclaims decision, of which Burlington is entitled to a $24 million contribution from Perenco pursuant to the joint operating agreement. The ICSID arbitration between Perenco and Ecuador remains pending.
In December 2016, ConocoPhillips Angola filed a notice of arbitration against Sonangol E.P. under the Block 36 Production Sharing Contract relating to disputes arising thereunder. The arbitration is being conducted under the United Nations Commission on International Trade Laws (UNCITRAL) rules using a three-person tribunal.
In June 2017, FAR Ltd. initiated arbitration before the ICC against ConocoPhillips Senegal B.V. in connection with the sale of ConocoPhillips Senegal B.V. to Woodside Energy Holdings (Senegal) Limited in 2016. This arbitration is ongoing.
In 2017 and early 2018, cities and/or counties in California and New York have filed lawsuits against oil and gas companies, including ConocoPhillips, seeking compensatory damages and equitable relief to abate alleged climate change impacts. ConocoPhillips is vigorously defending against these lawsuits.
Note 14-Derivative and Financial Instruments
Derivative Instruments
We use futures, forwards, swaps and options in various markets to meet our customer needs and capture market opportunities. Our commodity business primarily consists of natural gas, crude oil, bitumen, LNG and natural gas liquids.
Our derivative instruments are held at fair value on our consolidated balance sheet. Where these balances have the right of setoff, they are presented on a net basis. Related cash flows are recorded as operating activities on our consolidated statement of cash flows. On our consolidated income statement, realized and unrealized gains and losses are recognized either on a gross basis if directly related to our physical business or a net basis if held for trading. Gains and losses related to contracts that meet and are designated with the normal purchase normal sale (NPNS) exception are recognized upon settlement. We generally apply this exception to eligible crude contracts. We do not use hedge accounting for our commodity derivatives.
The following table presents the gross fair values of our commodity derivatives, excluding collateral, and the line items where they appear on our consolidated balance sheet:
| Millions of Dollars | ||||||||
| March 31 2018 | December 31 2017 | |||||||
|
| |||||||
Assets | ||||||||
Prepaid expenses and other current assets | $ | 233 | 275 | |||||
Other assets | 49 | 36 | ||||||
Liabilities | ||||||||
Other accruals | 238 | 282 | ||||||
Other liabilities and deferred credits | 41 | 28 | ||||||
| ||||||||
16
The gains (losses) from commodity derivatives incurred, and the line items where they appear on our consolidated income statement were:
| Millions of Dollars | ||||||||
| Three Months Ended March 31 | ||||||||
| 2018 | 2017 | |||||||
|
| |||||||
Sales and other operating revenues | $ | 43 | 51 | |||||
Other income (loss) | 4 | 1 | ||||||
Purchased commodities | (27 | ) | (38 | ) | ||||
| ||||||||
The table below summarizes our material net exposures resulting from outstanding commodity derivative contracts:
| Open Position Long/(Short) | ||||||||
| March 31 2018 | December 31 2017 | |||||||
|
| |||||||
Commodity | ||||||||
Natural gas and power (billions of cubic feet equivalent) | ||||||||
Fixed price | (12 | ) | (29 | ) | ||||
Basis | 2 | 12 | ||||||
| ||||||||
Foreign Currency Exchange Derivatives
We have foreign currency exchange rate risk resulting from international operations. Our foreign currency exchange derivative activity primarily relates to managing our cash-related and foreign currency exchange rate exposures, such as firm commitments for capital programs or local currency tax payments, dividends and cash returns from net investments in foreign affiliates, and investments in equity securities. We do not elect hedge accounting on our foreign currency exchange derivatives.
The following table presents the gross fair values of our foreign currency exchange derivatives, excluding collateral, and the line items where they appear on our consolidated balance sheet:
| Millions of Dollars | ||||||||
| March 31 2018 | December 31 2017 | |||||||
|
| |||||||
Assets | ||||||||
Prepaid expenses and other current assets | $ | 1 | 1 | |||||
Other assets | 7 | 6 | ||||||
Liabilities | ||||||||
Other liabilities and deferred credits | 8 | 15 | ||||||
| ||||||||
In December 2017, we entered into foreign exchange zero cost collars buying the right to sell $1.25 billion CAD at $0.707 CAD and selling the right to buy $1.25 billion CAD at $0.842 CAD against the U.S. dollar.
17
The (gains) losses from foreign currency exchange derivatives incurred and the line item where they appear on our consolidated income statement were:
| Millions of Dollars | ||||||||
| Three Months Ended March 31 | ||||||||
| 2018 | 2017 | |||||||
|
| |||||||
Foreign currency transaction (gains) losses | $ | (5 | ) | 7 | ||||
| ||||||||
We had the following net notional position of outstanding foreign currency exchange derivatives:
| In Millions Notional Currency | ||||||||||||
| March 31 2018 | December 31 2017 | |||||||||||
|
| |||||||||||
Foreign Currency Exchange Derivatives | ||||||||||||
Sell U.S. dollar, buy other currencies* | USD | 94 | - | |||||||||
Buy British pound, sell other currencies** | GBP | 33 | - | |||||||||
Sell British pound, buy other currencies*** | GBP | - | 1 | |||||||||
Sell Canadian dollar, buy U.S. dollar | CAD | 1,186 | 1,225 | |||||||||
| ||||||||||||
*Primarily British pound and Norwegian krone.
**Primarily Norwegian krone and euro.
***Primarily euro.
Financial Instruments
We invest excess cash in financial instruments with maturities based on our cash forecasts for the various currency pools we manage. The maturities of these investments may from time to time extend beyond 90 days. The types of financial instruments that we currently invest include:
| • | Time deposits: Interest bearing deposits placed with approved financial institutions. |
| • | Commercial paper: Unsecured promissory notes issued by a corporation, commercial bank or government agency purchased at a discount to mature at par. |
These financial instruments appear in the "Cash and cash equivalents" line of our consolidated balance sheet if the maturities at the time we made the investments were 90 days or less; otherwise, these financial instruments are included in the "Short-term investments" line on our consolidated balance sheet.
| Millions of Dollars | ||||||||||||||||
| Carrying Amount | ||||||||||||||||
| Cash and Cash Equivalents | Short-Term Investments | |||||||||||||||
| March 31 2018 | December 31 2017 | March 31 2018 | December 31 2017 | |||||||||||||
|
| |||||||||||||||
Cash | $ | 869 | 948 | |||||||||||||
Time deposits | ||||||||||||||||
Remaining maturities from 1 to 90 days | 3,873 | 5,004 | 170 | 821 | ||||||||||||
Commercial paper | ||||||||||||||||
Remaining maturities from 1 to 90 days | 242 | 373 | 118 | 978 | ||||||||||||
Remaining maturities from 91 to 180 days | - | - | - | 74 | ||||||||||||
| ||||||||||||||||
| $ | 4,984 | 6,325 | 288 | 1,873 | ||||||||||||
| ||||||||||||||||
18
Credit Risk
Financial instruments potentially exposed to concentrations of credit risk consist primarily of cash equivalents, short-term investments, over-the-counter (OTC) derivative contracts and trade receivables. Our cash equivalents and short-term investments are placed in high-quality commercial paper, government money market funds, government debt securities and time deposits with major international banks and financial institutions.
The credit risk from our OTC derivative contracts, such as forwards, swaps and options, derives from the counterparty to the transaction. Individual counterparty exposure is managed within predetermined credit limits and includes the use of cash-call margins when appropriate, thereby reducing the risk of significant nonperformance. We also use futures, swaps and option contracts that have a negligible credit risk because these trades are cleared with an exchange clearinghouse and subject to mandatory margin requirements until settled; however, we are exposed to the credit risk of those exchange brokers for receivables arising from daily margin cash calls, as well as for cash deposited to meet initial margin requirements.
Our trade receivables result primarily from our petroleum operations and reflect a broad national and international customer base, which limits our exposure to concentrations of credit risk. The majority of these receivables have payment terms of 30 days or less, and we continually monitor this exposure and the creditworthiness of the counterparties. We do not generally require collateral to limit the exposure to loss; however, we will sometimes use letters of credit, prepayments and master netting arrangements to mitigate credit risk with counterparties that both buy from and sell to us, as these agreements permit the amounts owed by us or owed to others to be offset against amounts due to us.
Certain of our derivative instruments contain provisions that require us to post collateral if the derivative exposure exceeds a threshold amount. We have contracts with fixed threshold amounts and other contracts with variable threshold amounts that are contingent on our credit rating. The variable threshold amounts typically decline for lower credit ratings, while both the variable and fixed threshold amounts typically revert to zero if we fall below investment grade. Cash is the primary collateral in all contracts; however, many also permit us to post letters of credit as collateral, such as transactions administered through the New York Mercantile Exchange.
The aggregate fair value of all derivative instruments with such credit risk-related contingent features that were in a liability position on March 31, 2018 and December 31, 2017, was $61 million and $55 million, respectively. For these instruments, no collateral was posted as of March 31, 2018 or December 31, 2017. If our credit rating had been downgraded below investment grade on March 31, 2018, we would be required to post $61 million of additional collateral, either with cash or letters of credit.
Note 15-Fair Value Measurement
We carry a portion of our assets and liabilities at fair value that are measured at a reporting date using an exit price (i.e., the price that would be received to sell an asset or paid to transfer a liability) and disclosed according to the quality of valuation inputs under the following hierarchy:
| • | Level 1: Quoted prices (unadjusted) in an active market for identical assets or liabilities. |
| • | Level 2: Inputs other than quoted prices that are directly or indirectly observable. |
| • | Level 3: Unobservable inputs that are significant to the fair value of assets or liabilities. |
The classification of an asset or liability is based on the lowest level of input significant to its fair value. Those that are initially classified as Level 3 are subsequently reported as Level 2 when the fair value derived from unobservable inputs is inconsequential to the overall fair value, or if corroborated market data becomes available. Assets and liabilities initially reported as Level 2 are subsequently reported as Level 3 if
19
corroborated market data is no longer available. Transfers occur at the end of the reporting period. At the end of the fourth quarter of 2017, our investment in Cenovus Energy transferred from Level 2 to Level 1 due to the lapsing of trading restrictions. There were no other material transfers between levels during 2018 or 2017.
Recurring Fair Value Measurement
Financial assets and liabilities reported at fair value on a recurring basis primarily include commodity derivatives. Level 1 derivative assets and liabilities primarily represent exchange-traded futures and options that are valued using unadjusted prices available from the underlying exchange. This also includes our investment in common shares of Cenovus Energy, which is valued using quotes for shares on the New York Stock Exchange. Level 2 derivative assets and liabilities primarily represent OTC swaps, options and forward purchase and sale contracts that are valued using adjusted exchange prices, prices provided by brokers or pricing service companies that are all corroborated by market data. Level 3 derivative assets and liabilities consist of OTC swaps, options and forward purchase and sale contracts where a significant portion of fair value is calculated from underlying market data that is not readily available. The derived value uses industry standard methodologies that may consider the historical relationships among various commodities, modeled market prices, time value, volatility factors and other relevant economic measures. The use of these inputs results in management's best estimate of fair value. Level 3 activity was not material for all periods presented.
The following table summarizes the fair value hierarchy for gross financial assets and liabilities (i.e., unadjusted where the right of setoff exists for commodity derivatives accounted for at fair value on a recurring basis):
| Millions of Dollars | ||||||||||||||||||||||||||||||||
| March 31, 2018 | December 31, 2017 | |||||||||||||||||||||||||||||||
| Level 1 | Level 2 | Level 3 | Total | Level 1 | Level 2 | Level 3 | Total | |||||||||||||||||||||||||
|
|
|
| |||||||||||||||||||||||||||||
Assets | ||||||||||||||||||||||||||||||||
Investment in Cenovus Energy | $ | 1,776 | - | - | 1,776 | 1,899 | - | - | 1,899 | |||||||||||||||||||||||
Commodity derivatives | 142 | 110 | 30 | 282 | 175 | 106 | 30 | 311 | ||||||||||||||||||||||||
| ||||||||||||||||||||||||||||||||
Total assets | $ | 1,918 | 110 | 30 | 2,058 | 2,074 | 106 | 30 | 2,210 | |||||||||||||||||||||||
| ||||||||||||||||||||||||||||||||
Liabilities | ||||||||||||||||||||||||||||||||
Commodity derivatives | $ | 151 | 109 | 19 | 279 | 158 | 111 | 41 | 310 | |||||||||||||||||||||||
| ||||||||||||||||||||||||||||||||
Total liabilities | $ | 151 | 109 | 19 | 279 | 158 | 111 | 41 | 310 | |||||||||||||||||||||||
| ||||||||||||||||||||||||||||||||
20
The following table summarizes those commodity derivative balances subject to the right of setoff as presented on our consolidated balance sheet. We have elected to offset the recognized fair value amounts for multiple derivative instruments executed with the same counterparty in our financial statements when a legal right of setoff exists.
| Millions of Dollars | ||||||||||||||||||||||||
| Gross Amounts Recognized | Gross Amounts Offset | Net Amounts Presented | Cash Collateral | Gross Amounts without Right of Setoff | Net Amounts | |||||||||||||||||||
|
| |||||||||||||||||||||||
March 31, 2018 | ||||||||||||||||||||||||
Assets | $ | 282 | 184 | 98 | - | 7 | 91 | |||||||||||||||||
Liabilities | 279 | 184 | 95 | 9 | 3 | 83 | ||||||||||||||||||
| ||||||||||||||||||||||||
December 31, 2017 | ||||||||||||||||||||||||
Assets | $ | 311 | 186 | 125 | - | 4 | 121 | |||||||||||||||||
Liabilities | 310 | 186 | 124 | 7 | 5 | 112 | ||||||||||||||||||
| ||||||||||||||||||||||||
At March 31, 2018 and December 31, 2017, we did not present any amounts gross on our consolidated balance sheet where we had the right of setoff.
Non-Recurring Fair Value Measurement
The following table summarizes the fair value hierarchy by major category and date of remeasurement for assets accounted for at fair value on a non-recurring basis:
| Millions of Dollars | ||||||||||||
| Fair Value Measurements Using | ||||||||||||
| Fair Value | Level 3 Inputs | Before-Tax Loss | ||||||||||
March 31, 2018 | ||||||||||||
Net PP&E (held for sale) | $ | 250 | 250 | 44 | ||||||||
| ||||||||||||
During the first quarter of 2018, net PP&E held for sale was written down to fair value, less costs to sell. The fair value was estimated using information gathered during recent marketing efforts. For additional information, see Note 5-Assets Held for Sale, Sold or Acquired.
Reported Fair Values of Financial Instruments
We used the following methods and assumptions to estimate the fair value of financial instruments:
| • | Cash and cash equivalents and short-term investments: The carrying amount reported on the balance sheet approximates fair value. |
| • | Accounts and notes receivable (including long-term and related parties): The carrying amount reported on the balance sheet approximates fair value. The valuation technique and methods used to estimate the fair value of the current portion of fixed-rate related party loans is consistent with Loans and advances-related parties. |
| • | Investment in Cenovus Energy shares: See Note 7-Investment in Cenovus Energy, for a discussion of the carrying value and fair value of our investment in Cenovus Energy shares. |
| • | Loans and advances-related parties: The carrying amount of floating-rate loans approximates fair value. The fair value of fixed-rate loan activity is measured using market observable data and is categorized as Level 2 in the fair value hierarchy. See Note 6-Investments, Loans and Long-Term Receivables, for additional information. |
21
| • | Accounts payable (including related parties) and floating-rate debt: The carrying amount of accounts payable and floating-rate debt reported on the balance sheet approximates fair value. |
| • | Fixed-rate debt: The estimated fair value of fixed-rate debt is measured using prices available from a pricing service that is corroborated by market data; therefore, these liabilities are categorized as Level 2 in the fair value hierarchy. |
The following table summarizes the net fair value of financial instruments (i.e., adjusted where the right of setoff exists for commodity derivatives):
| Millions of Dollars | ||||||||||||||||
| Carrying Amount | Fair Value | |||||||||||||||
| March 31 2018 | December 31 2017 | March 31 2018 | December 31 2017 | |||||||||||||
|
|
|
| |||||||||||||
Financial assets | ||||||||||||||||
Investment in Cenovus Energy | $ | 1,776 | 1,899 | 1,776 | 1,899 | |||||||||||
Commodity derivatives | 98 | 125 | 98 | 125 | ||||||||||||
Total loans and advances-related parties | 524 | 586 | 524 | 586 | ||||||||||||
Financial liabilities | ||||||||||||||||
Total debt, excluding capital leases | 16,260 | 18,929 | 18,908 | 22,435 | ||||||||||||
Commodity derivatives | 86 | 117 | 86 | 117 | ||||||||||||
| ||||||||||||||||
Note 16-Accumulated Other Comprehensive Loss
Accumulated other comprehensive loss in the equity section of our consolidated balance sheet included:
| Millions of Dollars | ||||||||||||||||
| Defined Benefit Plans | Net Unrealized Loss on Securities | Foreign Currency Translation | Accumulated Other Comprehensive Income (Loss) | |||||||||||||
|
| |||||||||||||||
December 31, 2017 | $ | (400 | ) | (58 | ) | (5,060 | ) | (5,518 | ) | |||||||
Cumulative effect of adopting ASU No. 2016-01* | - | 58 | - | 58 | ||||||||||||
Other comprehensive income | 11 | - | 78 | 89 | ||||||||||||
| ||||||||||||||||
March 31, 2018 | $ | (389 | ) | - | (4,982 | ) | (5,371 | ) | ||||||||
| ||||||||||||||||
*See Note 2-Changes in Accounting Principles for additional information.
There were no items within accumulated other comprehensive loss related to noncontrolling interests.
The following table summarizes reclassifications out of accumulated other comprehensive loss:
| Millions of Dollars | ||||||||
| Three Months Ended March 31 | ||||||||
| 2018 | 2017 | |||||||
|
| |||||||
Defined benefit plans | $ | 11 | 53 | |||||
| ||||||||
The above amounts are included in the computation of net periodic benefit cost and are presented net of tax expense of $3 million and $28 million for the three-month periods ended March 31, 2018 and 2017, respectively. See Note 18-Employee Benefit Plans, for additional information.
22
Note 17-Cash Flow Information
| Millions of Dollars | ||||||||
| Three Months Ended March 31 | ||||||||
| 2018 | 2017 | |||||||
|
| |||||||
Cash Payments | ||||||||
Interest | $ | 220 | 327 | |||||
Income taxes | 521 | 150 | ||||||
| ||||||||
Net Sales (Purchases) of Short-Term Investments | ||||||||
Short-term investments purchased | $ | (206 | ) | (243 | ) | |||
Short-term investments sold | 1,799 | 40 | ||||||
| ||||||||
| $ | 1,593 | (203 | ) | |||||
| ||||||||
Note 18-Employee Benefit Plans
Pension and Postretirement Plans
| Millions of Dollars | ||||||||||||||||||||||||
| Pension Benefits | Other Benefits | |||||||||||||||||||||||
| 2018 | 2017 | 2018 | 2017 | |||||||||||||||||||||
| U.S. | Int'l. | U.S. | Int'l. | |||||||||||||||||||||
|
|
|
|
|
|
|
| |||||||||||||||||
Components of Net Periodic Benefit Cost | ||||||||||||||||||||||||
Three Months Ended March 31 | ||||||||||||||||||||||||
Service cost | $ | 21 | 21 | 23 | 19 | - | - | |||||||||||||||||
Interest cost | 27 | 27 | 32 | 26 | 2 | 2 | ||||||||||||||||||
Expected return on plan assets | (34 | ) | (40 | ) | (34 | ) | (39 | ) | - | - | ||||||||||||||
Amortization of prior service cost (credit) | - | (1 | ) | 1 | (1 | ) | (9 | ) | (9 | ) | ||||||||||||||
Recognized net actuarial loss (gain) | 15 | 9 | 19 | 12 | - | (1 | ) | |||||||||||||||||
Settlements | - | - | 60 | - | - | - | ||||||||||||||||||
| ||||||||||||||||||||||||
Net periodic benefit cost | $ | 29 | 16 | 101 | 17 | (7 | ) | (8 | ) | |||||||||||||||
| ||||||||||||||||||||||||
The components of net periodic benefit cost, other than the service cost component, are included in the "Other expense" line item on our consolidated income statement.
During the first three months of 2018, we contributed $12 million to our domestic benefit plans and $63 million to our international benefit plans. In 2018, we expect to contribute approximately $70 million to our domestic qualified and nonqualified pension and postretirement benefit plans and $150 million to our international qualified and nonqualified pension and postretirement benefit plans.
23
Severance Accrual
The following table summarizes our severance accrual activity for the three-month period ended March 31, 2018:
| Millions of Dollars | ||||
Balance at December 31, 2017 | $ | 53 | ||
Accruals | 8 | |||
Benefit payments | (22 | ) | ||
Foreign currency translation adjustments | 1 | |||
| ||||
Balance at March 31, 2018 | $ | 40 | ||
| ||||
Of the remaining balance at March 31, 2018, $18 million is classified as short term.
Note 19-Related Party Transactions
Our related parties primarily include equity method investments and certain trusts for the benefit of employees.
Significant transactions with our equity affiliates were:
| Millions of Dollars | ||||||||
| Three Months Ended March 31 | ||||||||
| 2018 | 2017 | |||||||
|
| |||||||
Operating revenues and other income | $ | 23 | 29 | |||||
Purchases | 24 | 23 | ||||||
Operating expenses and selling, general and administrative expenses | 15 | 12 | ||||||
Net interest (income) expense* | (3 | ) | (3 | ) | ||||
| ||||||||
*We paid interest to, or received interest from, various affiliates. See Note 6-Investments, Loans and Long-Term Receivables, for additional
information on loans to affiliated companies.
Note 20-Sales and Other Operating Revenues
Transitional Arrangements
We adopted the provisions of ASC Topic 606 beginning January 1, 2018, using the modified retrospective approach, which we have applied to contracts within the scope of the standard that had not been completed as of January 1, 2018. Results for reporting periods beginning after January 1, 2018, are presented under ASC Topic 606, while prior period amounts are not adjusted and continue to be reported in accordance with ASC Topic 605. See Note 2-Changes in Accounting Principles for the effect on our consolidated balance sheet and the line items which have been impacted by the adoption of this standard.
The cumulative effect of applying the standard relates solely to certain licensing arrangements where revenue was previously recognized ($61 million in 2011, $146 million in 2015 and $44 million in 2017) based on contractual milestones. Under ASC Topic 606, such revenues are recognized when the customer has the ability to utilize and benefit from its right to use the license. As a result, such historically recognized revenues must be reversed through a cumulative effect adjustment and deferred until such time when the customer has the ability to utilize and benefit from the license. The cumulative effect adjustment relates to contracts that were not substantially completed at the date of implementation.
24
Accounting Policy
Revenues associated with the sales of crude oil, bitumen, natural gas, LNG, natural gas liquids and other items are recognized at the point in time when the customer obtains control of the asset. In evaluating when a customer has control of the asset we primarily consider whether the transfer of legal title and physical delivery has occurred, whether the customer has significant risks and rewards of ownership, and whether the customer has accepted delivery and a right to payment exists. These products are typically sold at prevailing market prices. We allocate variable market-based consideration to deliveries (performance obligations) in the current period as that consideration relates specifically to our efforts to transfer control of current period deliveries to the customer and represents the amount we expect to be entitled to in exchange for the related products. Payment is typically due within 30 days or less.
Practical Expedients
Typically, our commodity sales contracts are less than 12 months in duration; however, in certain specific cases may extend longer, which may be out to the end of field life. We have long-term commodity sales contracts which use prevailing market prices at the time of delivery, and under these contracts, the market-based variable consideration for each performance obligation (i.e. delivery of commodity) is allocated to each wholly unsatisfied performance obligation within the contract. Accordingly, we have applied the practical expedient allowed in ASC Topic 606 and do not disclose the aggregate amount of the transaction price allocated to performance obligations or when we expect to recognize revenues that are unsatisfied (or partially unsatisfied) as of the end of the reporting period.
Revenue from Contracts with Customers
The following table provides further disaggregation of our consolidated sales and other operating revenues:
| Millions of Dollars | ||||||||
| Three Months Ended March 31 | ||||||||
| 2018 | 2017 | * | ||||||
| ||||||||
Revenue from contracts with customers | $ | 6,545 | 5,158 | |||||
Revenue from contracts outside the scope of ASC Topic 606 | ||||||||
Physical contracts meeting the definition of a derivative | 2,261 | 2,425 | ||||||
Financial derivative contracts | (8 | ) | (65 | ) | ||||
| ||||||||
Consolidated sales and other operating revenues | $ | 8,798 | 7,518 | |||||
| ||||||||
*Under the modified retrospective approach, prior period amounts have not been adjusted upon adoption of ASC Topic 606.
25
Revenues from contracts outside the scope of ASC Topic 606 relate primarily to physical gas contracts at market prices which qualify as derivatives accounted for under ASC Topic 815, "Derivatives and Hedging," and for which we have not elected NPNS. There is no significant difference in contractual terms or the policy for recognition of revenue from these contracts and those within the scope of ASC Topic 606. The following disaggregation of revenues is provided in conjunction with Note 21-Segment Disclosures and Related Information:
| Millions of Dollars | ||||||||
| Three Months Ended March 31 | ||||||||
| 2018 | 2017 | * | ||||||
|
| |||||||
Revenue from Contracts Outside the Scope of ASC Topic 606 by Segment | ||||||||
Lower 48 | $ | 1,713 | 1,727 | |||||
Canada | 191 | 279 | ||||||
Europe and North Africa | 357 | 419 | ||||||
| ||||||||
Physical contracts meeting the definition of a derivative | $ | 2,261 | 2,425 | |||||
| ||||||||
*Under the modified retrospective approach, prior period amounts have not been adjusted upon adoption of ASC Topic 606.
| Millions of Dollars | ||||||||
| Three Months Ended March 31 | ||||||||
| 2018 | 2017 | * | ||||||
|
| |||||||
Revenue from Contracts Outside the Scope of ASC Topic 606 by Product | ||||||||
Crude oil | $ | 286 | 141 | |||||
Natural gas | 1,890 | 2,194 | ||||||
Other | 85 | 90 | ||||||
| ||||||||
Physical contracts meeting the definition of a derivative | $ | 2,261 | 2,425 | |||||
| ||||||||
*Under the modified retrospective approach, prior period amounts have not been adjusted upon adoption of ASC Topic 606.
Receivables and Contract Liabilities
Receivables from Contracts with Customers
At March 31, 2018, the "Accounts and notes receivable" line on our consolidated balance sheet, includes trade receivables of $2,625 million compared with $2,675 million at December 31, 2017, and includes both contracts with customers within the scope of ASC Topic 606 and those that are outside the scope of ASC Topic 606. We typically receive payment within 30 days or less (depending on the terms of the invoice) once delivery is made. Revenues that are outside the scope of ASC Topic 606 relate primarily to physical gas sales contracts at market prices for which we do not elect NPNS and are therefore accounted for as a derivative under ASC Topic 815. There is little distinction in the nature of the customer or credit quality of trade receivables associated with gas sold under contracts for which NPNS has not been elected compared to trade receivables where NPNS has been elected.
Contract Liabilities from Contracts with Customers
We have entered into contractual arrangements where we license proprietary technology to customers related to the optimization process for operating LNG plants. The agreements typically provide for negotiated payments to be made at stated milestones. The payments are not directly related to our performance under the contract and are recorded as deferred revenue to be recognized as revenue when the customer can utilize and benefit from their right to use the license. Payments are received in installments over the construction period.
26
| Millions of Dollars | ||||
Contract Liabilities | ||||
At January 1, 2018 | $ | 251 | ||
| ||||
At March 31, 2018 | $ | 251 | ||
| ||||
Amounts Recognized in the Consolidated Balance Sheet at March 31, 2018 | ||||
Current liabilities | $ | 153 | ||
Non-current liabilities | 98 | |||
| ||||
| $ | 251 | |||
| ||||
We expect to recognize such amounts between 2018 and 2019 as construction is completed.
Prior to the adoption of ASC Topic 606, contractual payments received would have been recognized as sales and other operating revenues in the current period.
Note 21-Segment Disclosures and Related Information
We explore for, produce, transport and market crude oil, bitumen, natural gas, LNG and natural gas liquids on a worldwide basis. We manage our operations through six operating segments, which are primarily defined by geographic region: Alaska, Lower 48, Canada, Europe and North Africa, Asia Pacific and Middle East, and Other International.
Corporate and Other represents costs not directly associated with an operating segment, such as most interest expense, corporate overhead and certain technology activities, including licensing revenues. Corporate assets include all cash and cash equivalents and short-term investments.
We evaluate performance and allocate resources based on net income attributable to ConocoPhillips. Intersegment sales are at prices that approximate market.
27
Analysis of Results by Operating Segment
| Millions of Dollars | ||||||||
| Three Months Ended March 31 | ||||||||
| 2018 | 2017 | * | ||||||
|
| |||||||
Sales and Other Operating Revenues | ||||||||
Alaska | $ | 1,385 | 1,007 | |||||
| ||||||||
Lower 48 | 3,952 | 3,230 | ||||||
Intersegment eliminations | (3 | ) | (3 | ) | ||||
| ||||||||
Lower 48 | 3,949 | 3,227 | ||||||
| ||||||||
Canada | 891 | 870 | ||||||
Intersegment eliminations | (255 | ) | (86 | ) | ||||
| ||||||||
Canada | 636 | 784 | ||||||
| ||||||||
Europe and North Africa | 1,608 | 1,443 | ||||||
Asia Pacific and Middle East | 1,216 | 1,022 | ||||||
Corporate and Other | 4 | 35 | ||||||
| ||||||||
Consolidated sales and other operating revenues | $ | 8,798 | 7,518 | |||||
| ||||||||
Sales and Other Operating Revenues by Geographic Location | ||||||||
United States | $ | 5,336 | 4,240 | |||||
Australia | 440 | 383 | ||||||
Canada | 636 | 784 | ||||||
China | 218 | 205 | ||||||
Indonesia | 215 | 199 | ||||||
Malaysia | 344 | 237 | ||||||
Norway | 663 | 689 | ||||||
United Kingdom | 669 | 622 | ||||||
Other foreign countries | 277 | 159 | ||||||
| ||||||||
Worldwide consolidated | $ | 8,798 | 7,518 | |||||
| ||||||||
Sales and Other Operating Revenues by Product | ||||||||
Crude oil | $ | 4,450 | 3,290 | |||||
Natural gas | 2,796 | 2,922 | ||||||
Natural gas liquids | 231 | 288 | ||||||
Other** | 1,321 | 1,018 | ||||||
| ||||||||
Consolidated sales and other operating revenues by product | $ | 8,798 | 7,518 | |||||
| ||||||||
*Under the modified retrospective approach, prior period amounts have not been adjusted upon adoption of ASC Topic 606.
**Includes LNG and bitumen.
28
| Millions of Dollars | ||||||||
| Three Months Ended March 31 | ||||||||
| 2018 | 2017 | |||||||
|
| |||||||
Net Income Attributable to ConocoPhillips | ||||||||
Alaska | $ | 524 | (11 | ) | ||||
Lower 48 | 308 | (362 | ) | |||||
Canada | (65 | ) | 948 | |||||
Europe and North Africa | 245 | 171 | ||||||
Asia Pacific and Middle East | 461 | 236 | ||||||
Other International | (44 | ) | (48 | ) | ||||
Corporate and Other | (541 | ) | (348 | ) | ||||
| ||||||||
Consolidated net income attributable to ConocoPhillips | $ | 888 | 586 | |||||
| ||||||||
| Millions of Dollars | ||||||||
| March 31 2018 | December 31 2017 | |||||||
|
| |||||||
Total Assets | ||||||||
Alaska | $ | 12,610 | 12,108 | |||||
Lower 48 | 14,584 | 14,632 | ||||||
Canada | 6,074 | 6,214 | ||||||
Europe and North Africa | 12,267 | 11,870 | ||||||
Asia Pacific and Middle East | 16,753 | 16,985 | ||||||
Other International | 97 | 97 | ||||||
Corporate and Other | 8,342 | 11,456 | ||||||
| ||||||||
Consolidated total assets | $ | 70,727 | 73,362 | |||||
| ||||||||
29
Note 22-Income Taxes
Our effective tax rate for the first quarter of 2018 was 49 percent compared with 358 percent for the first quarter of 2017.
| Millions of Dollars | Percent of Pre-Tax Income (Loss) | |||||||||||||||
| Three Months Ended March 31 | Three Months Ended March 31 | |||||||||||||||
| 2018 | 2017 | 2018 | 2017 | |||||||||||||
|
|
|
| |||||||||||||
Income (Loss) before income taxes | ||||||||||||||||
United States | $ | 786 | (794 | ) | 44.3 | % | 342.2 | |||||||||
Foreign | 990 | 562 | 55.7 | (242.2 | ) | |||||||||||
| ||||||||||||||||
| $ | 1,776 | (232 | ) | 100.0 | % | 100.0 | ||||||||||
| ||||||||||||||||
Federal statutory income tax | $ | 373 | (81 | ) | 21.0 | % | 35.0 | |||||||||
Non-U.S. effective tax rates | 446 | 266 | 25.1 | (114.7 | ) | |||||||||||
Canada disposition | - | (996 | ) | - | 429.3 | |||||||||||
Recovery of outside basis | - | (835 | ) | - | 359.9 | |||||||||||
Adjustment to tax reserves | (2 | ) | 822 | (0.1 | ) | (354.3 | ) | |||||||||
Adjustment to valuation allowance | 57 | 24 | 3.2 | (10.3 | ) | |||||||||||
State income tax | 19 | (13 | ) | 1.1 | 5.6 | |||||||||||
Enhanced oil recovery credit | (20 | ) | (16 | ) | (1.1 | ) | 6.9 | |||||||||
Other | 3 | (2 | ) | 0.1 | 0.8 | |||||||||||
| ||||||||||||||||
| $ | 876 | (831 | ) | 49.3 | % | 358.2 | ||||||||||
| ||||||||||||||||
The effective tax rate represents a blend of federal, state and foreign taxes and includes the impact of certain nondeductible items and adjustments to our valuation allowance. The effective tax rate for the three months ended March 31, 2018 also reflects the reduced federal corporate income tax rate as a result of the enactment of the Tax Cuts and Jobs Act (the Tax Legislation) in December 2017 and the impact of a change in the mix of our domestic and foreign earnings.
Our effective tax rate in the first quarter of 2017 was impacted by a tax benefit of $996 million related to our 2017 disposition of various assets in Canada. This tax benefit was primarily associated with a deferred tax recovery related to the Canadian capital gains exclusion component of the 2017 Canada disposition and the recognition of previously unrealizable Canadian capital asset tax basis. The Canada disposition, along with the associated restructuring of our Canadian operations, may generate an additional tax benefit of $822 million. However, since we believe it is not likely we will receive a corresponding cash tax savings, this $822 million benefit has been offset by a full tax reserve.
We have not revised any of our 2017 provisional estimates under Staff Accounting Bulletin 118 and ASU No. 2018-05, but we are continuing to gather information and are waiting for further guidance from the Internal Revenue Service, Securities Exchange Commission and FASB on the Tax Legislation.
The Tax Legislation subjects a U.S. shareholder to tax on Global Intangible Low-Taxed Income (GILTI) earned by certain foreign subsidiaries. The FASB Staff Q&A, Topic 740, No. 5, "Accounting for Global Intangible Low-Taxed Income," states that an entity can make an accounting policy election to either recognize deferred taxes for temporary basis differences expected to reverse as GILTI in future years or provide for the tax expense related to GILTI in the year the tax is incurred as a period expense only. Given the complexity of the GILTI provisions, we are still evaluating the effects of the GILTI provisions and have not yet determined our accounting policy. At March 31, 2018, the current year U.S. income tax impact related to GILTI activities is immaterial.
30
Note 23-New Accounting Standards
In February 2016, the FASB issued ASU No. 2016-02, "Leases" (ASU No. 2016-02), which establishes comprehensive accounting and financial reporting requirements for leasing arrangements. This ASU supersedes the existing requirements in FASB ASC Topic 840, "Leases," and requires lessees to recognize substantially all lease assets and lease liabilities on the balance sheet. The provisions of ASU No. 2016-02 also modify the definition of a lease and outline requirements for recognition, measurement, presentation and disclosure of leasing arrangements by both lessees and lessors. The ASU is effective for interim and annual periods beginning after December 15, 2018, and early adoption of the standard is permitted. Entities are required to adopt the ASU using a modified retrospective approach, subject to certain optional practical expedients, and apply the provisions of ASU No. 2016-02 to leasing arrangements existing at or entered into after the earliest comparative period presented in the financial statements. In January 2018, ASU No. 2016-02 was amended by the provisions of ASU No. 2018-01, "Land Easement Practical Expedient for Transition to Topic 842." We plan to adopt ASU No. 2016-02, as amended, effective January 1, 2019, and continue to evaluate the ASU to determine the impact of adoption on our consolidated financial statements and disclosures, accounting policies and systems, business processes, and internal controls. We are currently implementing a third-party lease accounting software solution to facilitate the ongoing accounting and financial reporting requirements of the ASU. We also continue to monitor proposals issued by the FASB to clarify the ASU and certain industry implementation issues. While our evaluation of ASU No. 2016-02 and related implementation activities are ongoing, we expect the adoption of the ASU to have a material impact on our consolidated financial statements and disclosures.
In June 2016, the FASB issued ASU No. 2016-13, "Measurement of Credit Losses on Financial Instruments" (ASU No. 2016-13), which sets forth the current expected credit loss model, a new forward-looking impairment model for certain financial instruments based on expected losses rather than incurred losses. The ASU is effective for interim and annual periods beginning after December 15, 2019, and early adoption of the standard is permitted. Entities are required to adopt ASU No. 2016-13 using a modified retrospective approach, subject to certain limited exceptions. We are currently evaluating the impact of the adoption of this ASU.
31
Supplementary Information-Condensed Consolidating Financial Information
We have various cross guarantees among ConocoPhillips, ConocoPhillips Company and ConocoPhillips Canada Funding Company I, with respect to publicly held debt securities. ConocoPhillips Company is 100 percent owned by ConocoPhillips. ConocoPhillips Canada Funding Company I is an indirect, 100 percent owned subsidiary of ConocoPhillips Company. ConocoPhillips and/or ConocoPhillips Company have fully and unconditionally guaranteed the payment obligations of ConocoPhillips Canada Funding Company I, with respect to its publicly held debt securities. Similarly, ConocoPhillips has fully and unconditionally guaranteed the payment obligations of ConocoPhillips Company with respect to its publicly held debt securities. In addition, ConocoPhillips Company has fully and unconditionally guaranteed the payment obligations of ConocoPhillips with respect to its publicly held debt securities. All guarantees are joint and several. The following condensed consolidating financial information presents the results of operations, financial position and cash flows for:
| • | ConocoPhillips, ConocoPhillips Company and ConocoPhillips Canada Funding Company I (in each case, reflecting investments in subsidiaries utilizing the equity method of accounting). |
| • | All other nonguarantor subsidiaries of ConocoPhillips. |
| • | The consolidating adjustments necessary to present ConocoPhillips' results on a consolidated basis. |
In March 2018, ConocoPhillips Company received a $1.2 billion loan repayment from a nonguarantor subsidiary to settle certain accumulated intercompany balances. This transaction had no impact on our consolidated financial statements.
This condensed consolidating financial information should be read in conjunction with the accompanying consolidated financial statements and notes.
32
| Millions of Dollars | ||||||||||||||||||||||||
| Three Months Ended March 31, 2018 | ||||||||||||||||||||||||
| Income Statement | ConocoPhillips | ConocoPhillips Company | ConocoPhillips Canada Funding Company I | All Other Subsidiaries | Consolidating Adjustments | Total Consolidated | ||||||||||||||||||
Revenues and Other Income | ||||||||||||||||||||||||
Sales and other operating revenues | $ | - | 3,764 | - | 5,034 | - | 8,798 | |||||||||||||||||
Equity in earnings of affiliates | 954 | 1,499 | - | 251 | (2,496 | ) | 208 | |||||||||||||||||
Gain on dispositions | - | 3 | - | 4 | - | 7 | ||||||||||||||||||
Other income (loss) | - | (103 | ) | - | 51 | - | (52 | ) | ||||||||||||||||
Intercompany revenues | 9 | 56 | 44 | 1,204 | (1,313 | ) | - | |||||||||||||||||
| ||||||||||||||||||||||||
Total Revenues and Other Income | 963 | 5,219 | 44 | 6,544 | (3,809 | ) | 8,961 | |||||||||||||||||
| ||||||||||||||||||||||||
Costs and Expenses | ||||||||||||||||||||||||
Purchased commodities | - | 3,410 | - | 1,433 | (1,129 | ) | 3,714 | |||||||||||||||||
Production and operating expenses | - | 172 | - | 1,032 | (33 | ) | 1,171 | |||||||||||||||||
Selling, general and administrative expenses | 4 | 74 | - | 26 | (5 | ) | 99 | |||||||||||||||||
Exploration expenses | - | 53 | - | 42 | - | 95 | ||||||||||||||||||
Depreciation, depletion and amortization | - | 132 | - | 1,280 | - | 1,412 | ||||||||||||||||||
Impairments | - | (9 | ) | - | 21 | - | 12 | |||||||||||||||||
Taxes other than income taxes | - | 50 | - | 133 | - | 183 | ||||||||||||||||||
Accretion on discounted liabilities | - | 4 | - | 84 | - | 88 | ||||||||||||||||||
Interest and debt expense | 71 | 159 | 37 | 63 | (146 | ) | 184 | |||||||||||||||||
Foreign currency transaction (gains) losses | 18 | (9 | ) | (27 | ) | 48 | - | 30 | ||||||||||||||||
Other expense | - | 194 | - | 3 | - | 197 | ||||||||||||||||||
| ||||||||||||||||||||||||
Total Costs and Expenses | 93 | 4,230 | 10 | 4,165 | (1,313 | ) | 7,185 | |||||||||||||||||
| ||||||||||||||||||||||||
Income before income taxes | 870 | 989 | 34 | 2,379 | (2,496 | ) | 1,776 | |||||||||||||||||
Income tax provision (benefit) | (18 | ) | 35 | (9 | ) | 868 | - | 876 | ||||||||||||||||
| ||||||||||||||||||||||||
Net income | 888 | 954 | 43 | 1,511 | (2,496 | ) | 900 | |||||||||||||||||
Less: net income attributable to noncontrolling interests | - | - | - | (12 | ) | - | (12 | ) | ||||||||||||||||
| ||||||||||||||||||||||||
Net Income Attributable to ConocoPhillips | $ | 888 | 954 | 43 | 1,499 | (2,496 | ) | 888 | ||||||||||||||||
| ||||||||||||||||||||||||
Comprehensive Income (Loss) Attributable to ConocoPhillips | $ | 977 | 1,043 | (25 | ) | 1,582 | (2,600 | ) | 977 | |||||||||||||||
| ||||||||||||||||||||||||
| Income Statement | Three Months Ended March 31, 2017* | |||||||||||||||||||||||
Revenues and Other Income | ||||||||||||||||||||||||
Sales and other operating revenues | $ | - | 3,115 | - | 4,403 | - | 7,518 | |||||||||||||||||
Equity in earnings of affiliates | 657 | 1,173 | - | 160 | (1,790 | ) | 200 | |||||||||||||||||
Gain on dispositions | - | 13 | - | 9 | - | 22 | ||||||||||||||||||
Other income | - | 2 | - | 29 | - | 31 | ||||||||||||||||||
Intercompany revenues | 17 | 71 | 42 | 794 | (924 | ) | - | |||||||||||||||||
| ||||||||||||||||||||||||
Total Revenues and Other Income | 674 | 4,374 | 42 | 5,395 | (2,714 | ) | 7,771 | |||||||||||||||||
| ||||||||||||||||||||||||
Costs and Expenses | ||||||||||||||||||||||||
Purchased commodities | - | 2,765 | - | 1,190 | (763 | ) | 3,192 | |||||||||||||||||
Production and operating expenses | - | 132 | - | 1,160 | (1 | ) | 1,291 | |||||||||||||||||
Selling, general and administrative expenses | 4 | 76 | - | 22 | (5 | ) | 97 | |||||||||||||||||
Exploration expenses | - | 371 | - | 179 | - | 550 | ||||||||||||||||||
Depreciation, depletion and amortization | - | 251 | - | 1,728 | - | 1,979 | ||||||||||||||||||
Impairments | - | - | - | 175 | - | 175 | ||||||||||||||||||
Taxes other than income taxes | - | 49 | - | 182 | - | 231 | ||||||||||||||||||
Accretion on discounted liabilities | - | 10 | - | 85 | - | 95 | ||||||||||||||||||
Interest and debt expense | 129 | 165 | 37 | 139 | (155 | ) | 315 | |||||||||||||||||
Foreign currency transaction (gains) losses | (7 | ) | - | 49 | (32 | ) | - | 10 | ||||||||||||||||
Other expense | - | 70 | - | (2 | ) | - | 68 | |||||||||||||||||
| ||||||||||||||||||||||||
Total Costs and Expenses | 126 | 3,889 | 86 | 4,826 | (924 | ) | 8,003 | |||||||||||||||||
| ||||||||||||||||||||||||
Income (Loss) before income taxes | 548 | 485 | (44 | ) | 569 | (1,790 | ) | (232 | ) | |||||||||||||||
Income tax benefit | (38 | ) | (172 | ) | (5 | ) | (616 | ) | - | (831 | ) | |||||||||||||
| ||||||||||||||||||||||||
Net income (loss) | 586 | 657 | (39 | ) | 1,185 | (1,790 | ) | 599 | ||||||||||||||||
Less: net income attributable to noncontrolling interests | - | - | - | (13 | ) | - | (13 | ) | ||||||||||||||||
| ||||||||||||||||||||||||
Net Income (Loss) Attributable to ConocoPhillips | $ | 586 | 657 | (39 | ) | 1,172 | (1,790 | ) | 586 | |||||||||||||||
| ||||||||||||||||||||||||
Comprehensive Income (Loss) Attributable to ConocoPhillips | $ | 818 | 889 | (13 | ) | 1,362 | (2,238 | ) | 818 | |||||||||||||||
| ||||||||||||||||||||||||
*Certain amounts have been reclassified to conform to the current-period presentation resulting from the adoption of ASU No. 2017-07.
See Note 2-Changes in Accounting Principles, for additional information.
See Notes to Consolidated Financial Statements.
33
| Millions of Dollars | ||||||||||||||||||||||||
| March 31, 2018 | ||||||||||||||||||||||||
| Balance Sheet | ConocoPhillips | ConocoPhillips Company | ConocoPhillips Canada Funding Company I | All Other Subsidiaries | Consolidating Adjustments | Total Consolidated | ||||||||||||||||||
Assets | ||||||||||||||||||||||||
Cash and cash equivalents | $ | - | 68 | 3 | 4,913 | - | 4,984 | |||||||||||||||||
Short-term investments | - | - | - | 288 | - | 288 | ||||||||||||||||||
Accounts and notes receivable | 6 | 1,974 | 36 | 4,817 | (2,641 | ) | 4,192 | |||||||||||||||||
Investment in Cenovus Energy | - | 1,776 | - | - | - | 1,776 | ||||||||||||||||||
Inventories | - | 139 | - | 914 | - | 1,053 | ||||||||||||||||||
Prepaid expenses and other current assets | 1 | 161 | 7 | 752 | (27 | ) | 894 | |||||||||||||||||
| ||||||||||||||||||||||||
Total Current Assets | 7 | 4,118 | 46 | 11,684 | (2,668 | ) | 13,187 | |||||||||||||||||
Investments, loans and long-term receivables* | 30,214 | 48,760 | 2,504 | 17,222 | (88,729 | ) | 9,971 | |||||||||||||||||
Net properties, plants and equipment | - | 4,280 | - | 42,192 | (475 | ) | 45,997 | |||||||||||||||||
Other assets | 19 | 1,036 | 188 | 1,729 | (1,400 | ) | 1,572 | |||||||||||||||||
| ||||||||||||||||||||||||
Total Assets | $ | 30,240 | 58,194 | 2,738 | 72,827 | (93,272 | ) | 70,727 | ||||||||||||||||
| ||||||||||||||||||||||||
Liabilities and Stockholders' Equity | ||||||||||||||||||||||||
Accounts payable | $ | - | 2,754 | 2 | 3,771 | (2,641 | ) | 3,886 | ||||||||||||||||
Short-term debt | (5 | ) | 263 | 7 | 82 | (10 | ) | 337 | ||||||||||||||||
Accrued income and other taxes | - | 163 | - | 1,178 | - | 1,341 | ||||||||||||||||||
Employee benefit obligations | - | 310 | - | 98 | - | 408 | ||||||||||||||||||
Other accruals | 57 | 420 | 52 | 634 | (26 | ) | 1,137 | |||||||||||||||||
| ||||||||||||||||||||||||
Total Current Liabilities | 52 | 3,910 | 61 | 5,763 | (2,677 | ) | 7,109 | |||||||||||||||||
Long-term debt | 3,788 | 8,956 | 1,701 | 2,742 | (478 | ) | 16,709 | |||||||||||||||||
Asset retirement obligations and accrued environmental costs | - | 435 | - | 7,354 | - | 7,789 | ||||||||||||||||||
Deferred income taxes | - | - | - | 6,281 | (872 | ) | 5,409 | |||||||||||||||||
Employee benefit obligations | - | 1,318 | - | 514 | - | 1,832 | ||||||||||||||||||
Other liabilities and deferred credits* | 2,416 | 7,467 | 922 | 7,407 | (17,051 | ) | 1,161 | |||||||||||||||||
| ||||||||||||||||||||||||
Total Liabilities | 6,256 | 22,086 | 2,684 | 30,061 | (21,078 | ) | 40,009 | |||||||||||||||||
Retained earnings | 23,139 | 13,990 | (638 | ) | 13,460 | (20,288 | ) | 29,663 | ||||||||||||||||
Other common stockholders' equity | 845 | 22,118 | 692 | 29,134 | (51,906 | ) | 883 | |||||||||||||||||
Noncontrolling interests | - | - | - | 172 | - | 172 | ||||||||||||||||||
| ||||||||||||||||||||||||
Total Liabilities and Stockholders' Equity | $ | 30,240 | 58,194 | 2,738 | 72,827 | (93,272 | ) | 70,727 | ||||||||||||||||
| ||||||||||||||||||||||||
*Includes intercompany loans. | ||||||||||||||||||||||||
| Balance Sheet | December 31, 2017 | |||||||||||||||||||||||
Assets | ||||||||||||||||||||||||
Cash and cash equivalents | $ | - | 234 | 4 | 6,087 | - | 6,325 | |||||||||||||||||
Short-term investments | - | - | - | 1,873 | - | 1,873 | ||||||||||||||||||
Accounts and notes receivable | 24 | 2,255 | 35 | 4,870 | (2,864 | ) | 4,320 | |||||||||||||||||
Investment in Cenovus Energy | - | 1,899 | - | - | - | 1,899 | ||||||||||||||||||
Inventories | - | 163 | - | 897 | - | 1,060 | ||||||||||||||||||
Prepaid expenses and other current assets | 1 | 278 | 6 | 779 | (29 | ) | 1,035 | |||||||||||||||||
| ||||||||||||||||||||||||
Total Current Assets | 25 | 4,829 | 45 | 14,506 | (2,893 | ) | 16,512 | |||||||||||||||||
Investments, loans and long-term receivables* | 29,400 | 47,974 | 2,533 | 15,050 | (84,897 | ) | 10,060 | |||||||||||||||||
Net properties, plants and equipment | - | 4,230 | - | 41,930 | (477 | ) | 45,683 | |||||||||||||||||
Other assets | 15 | 1,146 | 186 | 1,302 | (1,542 | ) | 1,107 | |||||||||||||||||
| ||||||||||||||||||||||||
Total Assets | $ | 29,440 | 58,179 | 2,764 | 72,788 | (89,809 | ) | 73,362 | ||||||||||||||||
| ||||||||||||||||||||||||
Liabilities and Stockholders' Equity | ||||||||||||||||||||||||
Accounts payable | $ | - | 3,094 | 1 | 3,799 | (2,864 | ) | 4,030 | ||||||||||||||||
Short-term debt | (5 | ) | 2,505 | 7 | 77 | (9 | ) | 2,575 | ||||||||||||||||
Accrued income and other taxes | - | 107 | - | 931 | - | 1,038 | ||||||||||||||||||
Employee benefit obligations | - | 554 | - | 171 | - | 725 | ||||||||||||||||||
Other accruals | 85 | 314 | 48 | 612 | (30 | ) | 1,029 | |||||||||||||||||
| ||||||||||||||||||||||||
Total Current Liabilities | 80 | 6,574 | 56 | 5,590 | (2,903 | ) | 9,397 | |||||||||||||||||
Long-term debt | 3,787 | 9,321 | 1,703 | 2,794 | (477 | ) | 17,128 | |||||||||||||||||
Asset retirement obligations and accrued environmental costs | - | 432 | - | 7,199 | - | 7,631 | ||||||||||||||||||
Deferred income taxes | - | - | - | 6,263 | (981 | ) | 5,282 | |||||||||||||||||
Employee benefit obligations | - | 1,335 | - | 519 | - | 1,854 | ||||||||||||||||||
Other liabilities and deferred credits* | 1,528 | 5,229 | 926 | 9,215 | (15,629 | ) | 1,269 | |||||||||||||||||
| ||||||||||||||||||||||||
Total Liabilities | 5,395 | 22,891 | 2,685 | 31,580 | (19,990 | ) | 42,561 | |||||||||||||||||
Retained earnings | 22,867 | 13,317 | (681 | ) | 11,958 | (18,070 | ) | 29,391 | ||||||||||||||||
Other common stockholders' equity | 1,178 | 21,971 | 760 | 29,056 | (51,749 | ) | 1,216 | |||||||||||||||||
Noncontrolling interests | - | - | - | 194 | - | 194 | ||||||||||||||||||
| ||||||||||||||||||||||||
Total Liabilities and Stockholders' Equity | $ | 29,440 | 58,179 | 2,764 | 72,788 | (89,809 | ) | 73,362 | ||||||||||||||||
| ||||||||||||||||||||||||
*Includes intercompany loans.
34
| Millions of Dollars | ||||||||||||||||||||||||
| Three Months Ended March 31, 2018 | ||||||||||||||||||||||||
| Statement of Cash Flows | ConocoPhillips | ConocoPhillips Company | ConocoPhillips Canada Funding Company I | All Other Subsidiaries | Consolidating Adjustments | Total Consolidated | ||||||||||||||||||
Cash Flows From Operating Activities | ||||||||||||||||||||||||
Net Cash Provided by (Used in) Operating Activities | $ | (69 | ) | (123 | ) | (30 | ) | 2,584 | 37 | 2,399 | ||||||||||||||
| ||||||||||||||||||||||||
Cash Flows From Investing Activities | ||||||||||||||||||||||||
Capital expenditures and investments | - | (233 | ) | - | (1,308 | ) | 6 | (1,535 | ) | |||||||||||||||
Working capital changes associated with investing activities | - | (93 | ) | - | 121 | - | 28 | |||||||||||||||||
Proceeds from asset dispositions | - | 141 | - | 39 | (11 | ) | 169 | |||||||||||||||||
Purchases of short-term investments | - | - | - | 1,593 | - | 1,593 | ||||||||||||||||||
Long-term advances/loans-related parties | - | (4 | ) | - | (29 | ) | 33 | - | ||||||||||||||||
Collection of advances/loans-related parties | - | 1,306 | - | 59 | (1,306 | ) | 59 | |||||||||||||||||
Intercompany cash management | 887 | 1,638 | - | (2,525 | ) | - | - | |||||||||||||||||
Other | - | - | - | (392 | ) | - | (392 | ) | ||||||||||||||||
| ||||||||||||||||||||||||
Net Cash Provided by (Used in) Investing Activities | 887 | 2,755 | - | (2,442 | ) | (1,278 | ) | (78 | ) | |||||||||||||||
| ||||||||||||||||||||||||
Cash Flows From Financing Activities | ||||||||||||||||||||||||
Issuance of debt | - | - | 29 | 4 | (33 | ) | - | |||||||||||||||||
Repayment of debt | - | (2,807 | ) | - | (1,387 | ) | 1,306 | (2,888 | ) | |||||||||||||||
Issuance of company common stock | 19 | - | - | - | (37 | ) | (18 | ) | ||||||||||||||||
Repurchase of company common stock | (500 | ) | - | - | - | - | (500 | ) | ||||||||||||||||
Dividends paid | (338 | ) | - | - | - | - | (338 | ) | ||||||||||||||||
Other | 1 | - | - | (38 | ) | 5 | (32 | ) | ||||||||||||||||
| ||||||||||||||||||||||||
Net Cash Provided by (Used in) Financing Activities | (818 | ) | (2,807 | ) | 29 | (1,421 | ) | 1,241 | (3,776 | ) | ||||||||||||||
| ||||||||||||||||||||||||
Effect of Exchange Rate Changes on Cash, Cash Equivalents and Restricted Cash | - | 9 | - | 116 | - | 125 | ||||||||||||||||||
| ||||||||||||||||||||||||
Net Change in Cash, Cash Equivalents and Restricted Cash | - | (166 | ) | (1 | ) | (1,163 | ) | - | (1,330 | ) | ||||||||||||||
Cash, cash equivalents and restricted cash at beginning of period* | - | 234 | 4 | 6,298 | - | 6,536 | ||||||||||||||||||
| ||||||||||||||||||||||||
Cash, Cash Equivalents and Restricted Cash at End of Period | $ | - | 68 | 3 | 5,135 | - | 5,206 | |||||||||||||||||
| ||||||||||||||||||||||||
| Statement of Cash Flows | Three Months Ended March 31, 2017 | |||||||||||||||||||||||
Cash Flows From Operating Activities | ||||||||||||||||||||||||
Net Cash Provided by (Used in) Operating Activities | $ | (97 | ) | 1,014 | 45 | 1,581 | (753 | ) | 1,790 | |||||||||||||||
| ||||||||||||||||||||||||
Cash Flows From Investing Activities | ||||||||||||||||||||||||
Capital expenditures and investments | - | (149 | ) | - | (819 | ) | 2 | (966 | ) | |||||||||||||||
Working capital changes associated with investing activities | - | 55 | - | (81 | ) | - | (26 | ) | ||||||||||||||||
Proceeds from asset dispositions | - | 46 | - | 18 | (29 | ) | 35 | |||||||||||||||||
Purchases of short-term investments | - | - | - | (203 | ) | - | (203 | ) | ||||||||||||||||
Long-term advances/loans-related parties | - | (30 | ) | - | - | 30 | - | |||||||||||||||||
Collection of advances/loans-related parties | - | 63 | - | 2,138 | (2,144 | ) | 57 | |||||||||||||||||
Intercompany cash management | 1,341 | 1,037 | - | (2,378 | ) | - | - | |||||||||||||||||
Other | - | - | - | 129 | - | 129 | ||||||||||||||||||
| ||||||||||||||||||||||||
Net Cash Provided by (Used in) Investing Activities | 1,341 | 1,022 | - | (1,196 | ) | (2,141 | ) | (974 | ) | |||||||||||||||
| ||||||||||||||||||||||||
Cash Flows From Financing Activities | ||||||||||||||||||||||||
Issuance of debt | - | - | - | 30 | (30 | ) | - | |||||||||||||||||
Repayment of debt | (805 | ) | (2,081 | ) | - | (97 | ) | 2,144 | (839 | ) | ||||||||||||||
Issuance of company common stock | 3 | - | - | - | (49 | ) | (46 | ) | ||||||||||||||||
Repurchase of company common stock | (112 | ) | - | - | - | - | (112 | ) | ||||||||||||||||
Dividends paid | (331 | ) | - | - | (802 | ) | 802 | (331 | ) | |||||||||||||||
Other | 1 | - | - | (44 | ) | 27 | (16 | ) | ||||||||||||||||
| ||||||||||||||||||||||||
Net Cash Used in Financing Activities | (1,244 | ) | (2,081 | ) | - | (913 | ) | 2,894 | (1,344 | ) | ||||||||||||||
| ||||||||||||||||||||||||
Effect of Exchange Rate Changes on Cash and Cash Equivalents | - | - | - | 27 | - | 27 | ||||||||||||||||||
| ||||||||||||||||||||||||
Net Change in Cash and Cash Equivalents | - | (45 | ) | 45 | (501 | ) | - | (501 | ) | |||||||||||||||
Cash and cash equivalents at beginning of period | - | 358 | 13 | 3,239 | - | 3,610 | ||||||||||||||||||
| ||||||||||||||||||||||||
Cash and Cash Equivalents at End of Period | $ | - | 313 | 58 | 2,738 | - | 3,109 | |||||||||||||||||
| ||||||||||||||||||||||||
*Restated to include $211 million of restricted cash at January 1, 2018
Restricted cash totaling $222 million is included in the "Other assets" line of our Consolidated Balance Sheet as of March 31, 2018.
35
| Item 2. | MANAGEMENT'S DISCUSSION AND ANALYSIS OF FINANCIAL CONDITION AND RESULTS OF OPERATIONS |
Management's Discussion and Analysis is the company's analysis of its financial performance and of significant trends that may affect future performance. It should be read in conjunction with the financial statements and notes. It contains forward-looking statements including, without limitation, statements relating to the company's plans, strategies, objectives, expectations and intentions that are made pursuant to the "safe harbor" provisions of the Private Securities Litigation Reform Act of 1995. The words "anticipate," "estimate," "believe," "budget," "continue," "could," "intend," "may," "plan," "potential," "predict," "seek," "should," "will," "would," "expect," "objective," "projection," "forecast," "goal," "guidance," "outlook," "effort," "target" and similar expressions identify forward-looking statements. The company does not undertake to update, revise or correct any of the forward-looking information unless required to do so under the federal securities laws. Readers are cautioned that such forward-looking statements should be read in conjunction with the company's disclosures under the heading: "CAUTIONARY STATEMENT FOR THE PURPOSES OF THE ‘SAFE HARBOR' PROVISIONS OF THE PRIVATE SECURITIES LITIGATION REFORM ACT OF 1995," beginning on page 54.
The terms "earnings" and "loss" as used in Management's Discussion and Analysis refer to net income attributable to ConocoPhillips.
BUSINESS ENVIRONMENT AND EXECUTIVE OVERVIEW
ConocoPhillips is the world's largest independent exploration and production (E&P) company, based on proved reserves and production of liquids and natural gas. Our diverse portfolio primarily includes resource-rich North American unconventional assets and oil sands assets in Canada; lower-risk conventional assets in North America, Europe, Asia and Australia; several liquefied natural gas (LNG) developments; and an inventory of global conventional and unconventional exploration prospects. Headquartered in Houston, Texas, we had operations and activities in 17 countries, approximately 11,200 employees worldwide and total assets of $71 billion as of March 31, 2018.
Overview
The global oil market is rebalancing. Crude oil prices continued to improve in the first quarter of 2018; however, we believe prices are likely to remain cyclical in the future. Our value proposition principles, namely to maintain financial strength, grow our dividend and pursue disciplined growth, remain essentially unchanged and we are executing in accordance with our priorities for allocating future cash flows. In order, these priorities are: invest capital at a level that maintains flat production volumes and pays our existing dividend; grow our existing dividend; reduce debt to a level we believe is sufficient to maintain a strong investment grade rating through price cycles; repurchase shares to provide value to our shareholders; and strategically invest capital to grow our cash from operations. We believe our commitment to our value proposition, as evidenced by the results discussed below, position us for success in an environment of price uncertainty and ongoing volatility.
In the first quarter of 2018, we continued to make notable progress on our stated priorities. We increased our quarterly dividend by 7.5 percent to $0.285 per share; reduced our debt by $2.65 billion; repurchased 8.9 million shares of our common stock; and entered into an agreement with Anadarko Petroleum Corporation to acquire its nonoperated interest in the Western North Slope of Alaska, as well as its interest in the Alpine pipeline, for $400 million, before customary adjustments.
Operationally, we remain focused on safely executing our capital program and remaining attentive to our costs. Production excluding Libya was 1,224 thousand barrels of oil equivalent per day (MBOED) in the first quarter of 2018, a decrease of 360 MBOED compared with the same period of 2017. Our underlying production, which excludes Libya and the first-quarter impact of dispositions of 402 MBOED in 2017, increased 42 MBOED or 4 percent compared with the same period of 2017. Underlying production on a per
36
debt-adjusted share basis grew by 26 percent compared with the first quarter of 2017. Production per debt-adjusted share is calculated on an underlying production basis using ending period debt divided by ending share price plus ending shares outstanding. We believe production per debt-adjusted share is useful to investors as it provides a consistent view of production on a total equity basis by converting debt to equity and allows for comparison across peer companies.
Business Environment
Global oil market fundamentals continued to trend toward a firmer balance in the first quarter of 2018. Crude oil prices improved in the period as a result of slower growth in global oil production, strong global oil demand and lower global inventory levels.
The energy industry has periodically experienced volatility due to fluctuating supply-and-demand conditions. Commodity prices are the most significant factor impacting our profitability and related reinvestment of operating cash flows into our business. Among other dynamics that could influence world energy markets and commodity prices are global economic health, supply disruptions or fears thereof caused by civil unrest or military conflicts, actions taken by Organization of Petroleum Exporting Countries (OPEC), environmental laws, tax regulations, governmental policies and weather-related disruptions. North America's energy landscape has been transformed from resource scarcity to an abundance of supply, primarily due to advances in technology responsible for the rapid growth of tight oil production, successful exploration and rising production from the Canadian oil sands. Our strategy is to create value through price cycles by delivering on the financial and operational priorities that underpin our value proposition.
Our earnings and operating cash flows generally correlate with industry price levels for crude oil and natural gas, the prices of which are subject to factors external to the company and over which we have no control. The following graph depicts the trend in average benchmark prices for West Texas Intermediate (WTI) crude oil, Dated Brent crude oil and Henry Hub natural gas:
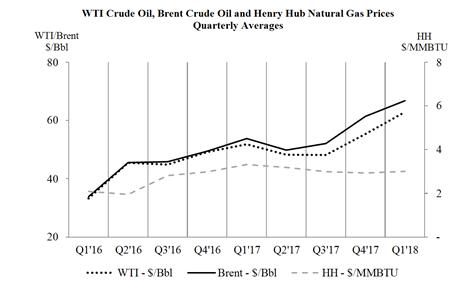
Brent crude oil prices averaged $66.76 per barrel in the first quarter of 2018, an increase of 24 percent compared with $53.78 per barrel in the first quarter of 2017, and an increase of 9 percent compared with $61.39 per barrel in the fourth quarter of 2017. Industry crude prices for WTI averaged $62.88 per barrel in the first quarter of 2018, an increase of 21 percent compared with $51.83 per barrel in the first quarter of 2017, and an increase of 14 percent compared with $55.35 per barrel in the fourth quarter of 2017.
37
Henry Hub natural gas prices averaged $3.01 per MMBTU in the first quarter of 2018, a decrease of 9 percent compared with $3.32 per MMBTU in the first quarter of 2017, and an increase of 3 percent compared with $2.93 per MMBTU in the fourth quarter of 2017. Prices decreased relative to the same period of 2017 due to higher associated gas production in the contiguous United States, but increased from the prior quarter as a result of weather-driven demand growth.
Our realized bitumen price decreased from $21.56 per barrel in the first quarter of 2017 and $25.20 per barrel in the fourth quarter of 2017, to $14.06 per barrel in the first quarter of 2018. The change, compared to both periods, was primarily due to a deterioration in the WCS differential resulting from high inventory levels stemming from the Keystone outage coupled with constrained pipeline and rail export capacity.
Our total average realized price was $50.49 per barrel of oil equivalent (BOE) in the first quarter of 2018, an increase of 40 percent compared with $36.18 per BOE in the first quarter of 2017 and a 10 percent increase compared to the fourth quarter of 2017, reflecting higher average realized oil and natural gas prices. Realized natural gas prices improved relative to the first quarter of 2017 primarily due to higher realized international gas prices.
Key Operating and Financial Summary
Significant items during the first quarter of 2018 included the following:
| • | Achieved first-quarter production excluding Libya of 1,224 MBOED; year-over-year underlying production excluding the impact of closed and planned dispositions grew 4 percent overall and 26 percent on a production per debt-adjusted share basis. |
| • | Grew year-over-year production in the Lower 48 Big 3-Eagle Ford, Bakken and Delaware-by 20 percent. |
| • | Increased quarterly dividend by 7.5 percent. |
| • | Paid down $2.7 billion of balance sheet debt. Ended the quarter with $17.0 billion of debt and $5.0 billion of cash and cash equivalents. |
| • | Increased planned share repurchases by 33 percent; repurchased $0.5 billion in the first quarter; on track for full-year share repurchases of $2 billion. |
| • | Cash provided by operating activities exceeded capital expenditures, dividends and share repurchases. |
| • | Acquired additional liquids-rich Montney acreage in Canada during the quarter and announced central Louisiana Austin Chalk entry. |
| • | Successfully completed six-well exploration and appraisal drilling program in Alaska. |
Outlook
Production and Capital Guidance
Second-quarter 2018 production is expected to be 1,170 to 1,210 MBOED, reflecting seasonal turnarounds.
Full-year 2018 production guidance increased to 1,200 to 1,240 MBOED to reflect first-quarter outperformance and a change in disposition assumptions. These and other improvements more than offset the impact from a third-party gas pipeline in Malaysia that is now assumed to be out of service for the entire year. Production guidance excludes Libya.
Capital expenditures guidance of $5.5 billion remains unchanged. Our capital guidance excludes acquisition investment for the previously announced $0.4 billion bolt-on transaction in Alaska and the $0.1 billion acquisition of additional acreage in the Montney in Canada.
38
RESULTS OF OPERATIONS
Unless otherwise indicated, discussion of results for the three-month period ended March 31, 2018, is based on a comparison with the corresponding period of 2017.
Consolidated Results
A summary of the company's net income attributable to ConocoPhillips by business segment follows:
| Millions of Dollars | ||||||||
| Three Months Ended March 31 | ||||||||
| 2018 | 2017 | |||||||
|
| |||||||
Alaska | $ | 524 | (11 | ) | ||||
Lower 48 | 308 | (362 | ) | |||||
Canada | (65 | ) | 948 | |||||
Europe and North Africa | 245 | 171 | ||||||
Asia Pacific and Middle East | 461 | 236 | ||||||
Other International | (44 | ) | (48 | ) | ||||
Corporate and Other | (541 | ) | (348 | ) | ||||
| ||||||||
Net income attributable to ConocoPhillips | $ | 888 | 586 | |||||
| ||||||||
Net income attributable to ConocoPhillips increased 52 percent in the first quarter of 2018, mainly due to:
| • | Higher realized crude oil and natural gas prices. |
| • | Lower depreciation, depletion and amortization (DD&A) expense, mainly due to lower unit-of-production rates from reserve additions and disposition impacts. |
| • | Lower exploration expenses mainly due to reduced dry hole costs and leasehold impairment expense in our Lower 48 segment, as well as reduced other exploration expenses in our Other International segment. |
| • | A $109 million after-tax benefit resulting from an accrual reduction given a transportation cost ruling in Alaska by the Federal Energy Regulatory Commission (FERC). |
| • | Lower impairment expense. |
| • | Lower production and operating expenses, primarily due to asset disposition impacts. |
| • | Lower interest and debt expense. |
The increases in net income were partly offset by:
| • | The absence of deferred tax benefits totaling $996 million, primarily related to the disposition of certain Canadian assets, recognized in the first quarter of 2017. |
| • | After-tax charges totaling $193 million for premiums on debt retirements in the first quarter of 2018. |
| • | Lower volumes primarily due to asset dispositions in our Canada and Lower 48 segments. |
| • | A $123 million unrealized loss, recognized in the first quarter of 2018, on our Cenovus Energy common shares held at March 31, 2018. |
See the "Segment Results" section for additional information.
39
Income Statement Analysis
Sales and other operating revenues increased 17 percent in the first quarter of 2018 mainly due to higher realized crude oil, LNG, natural gas and natural gas liquids prices, partly offset by lower sales volumes, primarily in our Canada and Lower 48 segments.
Purchased commodities increased 16 percent in the first quarter of 2018, mainly due to increased crude oil prices in the Lower 48. Additionally, purchased commodities increased due to higher diluent purchases in Canada.
Production and operating expenses decreased 9 percent in the first quarter of 2018 primarily due to asset disposition impacts.
Exploration expenses decreased 83 percent in the first quarter of 2018 due to lower dry hole costs, mainly driven by the absence of $291 million before-tax charges for multiple wells in Shenandoah in deepwater Gulf of Mexico in 2017; lower other exploration expenses mainly due to the absence of a $43 million before-tax charge in 2017 for the cancellation of our Athena drilling rig contract and other rig stacking costs in our Other International segment; and lower leasehold impairment expense mainly due to the absence of a $51 million before-tax charge for Shenandoah.
DD&A decreased 29 percent in the first quarter of 2018, mainly due to lower unit-of-production rates from reserve additions and disposition impacts in our Canada and Lower 48 segments.
Impairments decreased 93 percent in the first quarter of 2018. For additional information, see Note 9-Impairments, in the Notes to Consolidated Financial Statements.
Interest and debt expense decreased 42 percent in the first quarter of 2018 primarily due to lower interest on debt, given reduced debt levels, as well as lower interest from an accrual reduction given a transportation cost ruling by the FERC.
Other expense increased 190 percent in the first quarter of 2018 primarily due to before-tax charges of $206 million for premiums on early debt retirements.
See Note 22-Income Taxes, in the Notes to Consolidated Financial Statements, for information regarding our income tax provision (benefit) and effective tax rate.
40
Summary Operating Statistics
| Three Months Ended March 31 | ||||||||
| 2018 | 2017 | |||||||
|
| |||||||
Average Net Production | ||||||||
Crude oil (MBD) (1) | 636 | 601 | ||||||
Natural gas liquids (MBD) | 96 | 134 | ||||||
Bitumen (MBD) | 66 | 223 | ||||||
Natural gas (MMCFD) (2) | 2,828 | 3,809 | ||||||
| ||||||||
Total Production (MBOED) (3) | 1,269 | 1,593 | ||||||
| ||||||||
| Dollars Per Unit | ||||||||
Average Sales Prices | ||||||||
Crude oil (per barrel) | $ | 65.49 | 50.97 | |||||
Natural gas liquids (per barrel) | 28.37 | 24.87 | ||||||
Bitumen (per barrel) | 14.06 | 21.56 | ||||||
Natural gas (per thousand cubic feet) | 5.13 | 3.84 | ||||||
| ||||||||
| Millions of Dollars | ||||||||
Exploration Expenses | ||||||||
General administrative, geological and geophysical, and lease rental, and other | $ | 75 | 144 | (4) | ||||
Leasehold impairment | 5 | 63 | ||||||
Dry holes | 15 | 343 | ||||||
| ||||||||
| $ | 95 | 550 | ||||||
| ||||||||
(1) Thousands of barrels per day.
(2) Millions of cubic feet per day. Represents quantities available for sale and excludes gas equivalent of natural gas liquids included above.
(3) Thousands of barrels of oil equivalent per day.
(4) Certain amounts have been reclassified to conform to the current period presentation as a result of the adoption of ASU No. 2017-07. See
Note 2-Changes in Accounting Principles, in the Notes to Consolidated Financial Statements, for additional information.
We explore for, produce, transport and market crude oil, bitumen, natural gas, LNG and natural gas liquids on a worldwide basis. At March 31, 2018, our operations were producing in the United States, Norway, the United Kingdom, Canada, Australia, Timor-Leste, Indonesia, China, Malaysia, Qatar and Libya.
Total production from operations decreased 20 percent in the first quarter of 2018 compared with the same period of 2017. The decrease primarily resulted from noncore asset dispositions, including our Canada and San Juan transactions, both completed in 2017; normal field decline; and higher unplanned downtime mainly in Malaysia. The decrease in production was partly offset by production from major developments, including tight oil plays in the Lower 48; Malikai in Malaysia; Surmont and Montney in Canada; as well as Australia Pacific LNG Pty Ltd (APLNG). The continued ramp-up of production in Libya and improved drilling and well performance in Alaska, China, Lower 48 and Norway also partly offset the decrease in production. Excluding Libya, our first-quarter production was 1,224 MBOED. Adjusted for the first-quarter impact of dispositions of 402 MBOED in 2017, our underlying production increased 42 MBOED, or 4 percent, compared with the first quarter of 2017.
41
Segment Results
Alaska
| Three Months Ended March 31 | ||||||||
| 2018 | 2017 | |||||||
|
| |||||||
Net Income (Loss) Attributable to ConocoPhillips (millions of dollars) | $ | 524 | (11 | ) | ||||
| ||||||||
Average Net Production | ||||||||
Crude oil (MBD) | 174 | 175 | ||||||
Natural gas liquids (MBD) | 16 | 15 | ||||||
Natural gas (MMCFD) | 7 | 7 | ||||||
| ||||||||
Total Production (MBOED) | 191 | 191 | ||||||
| ||||||||
Average Sales Prices | ||||||||
Crude oil (dollars per barrel) | $ | 68.31 | 52.09 | |||||
Natural gas (dollars per thousand cubic feet) | 2.51 | 3.53 | ||||||
| ||||||||
The Alaska segment primarily explores for, produces, transports and markets crude oil, natural gas liquids and natural gas. As of March 31, 2018, Alaska contributed 24 percent of our worldwide liquids production and less than 1 percent of our worldwide natural gas production.
Earnings from Alaska increased $535 million in the first quarter of 2018, compared with the same period of 2017. The increase in earnings was mainly due to higher realized crude oil prices. Additionally, earnings improved due to the absence of a $110 million after-tax impairment charge, recognized in the first quarter of 2017, for the associated properties, plants and equipment of our small interest in the Point Thomson Unit; a $79 million after-tax benefit resulting from an accrual reduction given a transportation cost ruling by the FERC; lower DD&A expense from reserve additions; and lower exploration expense, primarily from lower dry hole expense and reduced seismic activity.
Average production was flat in the first quarter of 2018 compared with the same period of 2017.
Acquisition
In January 2018, we entered into an agreement with Anadarko Petroleum Corporation to acquire its nonoperated interest in the Western North Slope of Alaska, as well as its interest in the Alpine pipeline, for $400 million, before customary adjustments. The transaction is subject to regulatory approval.
42
Lower 48
| Three Months Ended March 31 | ||||||||
| 2018 | 2017 | |||||||
|
| |||||||
Net Income (Loss) Attributable to ConocoPhillips (millions of dollars) | $ | 308 | (362 | ) | ||||
| ||||||||
Average Net Production | ||||||||
Crude oil (MBD) | 197 | 176 | ||||||
Natural gas liquids (MBD) | 60 | 75 | ||||||
Natural gas (MMCFD) | 568 | 1,116 | ||||||
| ||||||||
Total Production (MBOED) | 352 | 437 | ||||||
| ||||||||
Average Sales Prices | ||||||||
Crude oil (dollars per barrel) | $ | 61.99 | 45.89 | |||||
Natural gas liquids (dollars per barrel) | 24.57 | 22.07 | ||||||
Natural gas (dollars per thousand cubic feet) | 2.76 | 2.83 | ||||||
| ||||||||
The Lower 48 segment consists of operations located in the U.S. Lower 48 states, as well as producing properties in the Gulf of Mexico. As of March 31, 2018, the Lower 48 contributed 32 percent of our worldwide liquids production and 20 percent of our worldwide natural gas production.
Earnings from the Lower 48 increased $670 million in the first quarter of 2018, compared with the same period of 2017, primarily due to lower DD&A expense from reserve additions and asset disposition impacts; higher realized crude oil and natural gas liquids prices; lower exploration expenses mainly resulting from the absence of 2017 after-tax dry hole charges totaling $189 million and $33 million, respectively, for multiple wells and associated leases in Shenandoah; and lower production and operating expenses mainly driven by asset dispositions. The earnings improvement in the period was partly offset by lower volumes from asset dispositions and normal field decline.
Total average production decreased 19 percent in the first quarter of 2018, compared with the same period of 2017, primarily due to the disposition of our interests in the San Juan Basin and other noncore assets within the segment, as well as normal field decline. The volume decrease was partly offset by new production, primarily from Eagle Ford, Bakken and the Permian Basin.
Asset Disposition Update
In the first quarter of 2018, we completed the sale of certain properties in the Lower 48 segment for net proceeds of $112 million. No gain or loss was recognized on the sale. Additionally, in April 2018, certain other noncore properties within the segment were sold. No gain or loss will be recognized on the sale.
In April 2018, we ceased marketing efforts on our interest in the Barnett and reclassified the asset to held for use.
Acquisition
During the fourth quarter of 2017, we acquired approximately 200,000 net acres of early life-cycle unconventional acreage in the Austin Chalk play in central Louisiana for approximately $200 million. We expect to drill several exploration wells in the new position later this year.
See Note 5-Assets Held for Sale, Sold or Acquired, in the Notes to Consolidated Financial Statements, for additional information regarding our asset dispositions and acquisitions.
43
Canada
| Three Months Ended March 31 | ||||||||
| 2018 | 2017 | |||||||
|
| |||||||
Net Income (Loss) Attributable to ConocoPhillips (millions of dollars) | $ | (65 | ) | 948 | ||||
| ||||||||
Average Net Production | ||||||||
Crude oil (MBD) | 2 | 6 | ||||||
Natural gas liquids (MBD) | - | 23 | ||||||
Bitumen (MBD) | ||||||||
Consolidated operations | 66 | 52 | ||||||
Equity affiliates | - | 171 | ||||||
| ||||||||
Total bitumen | 66 | 223 | ||||||
Natural gas (MMCFD) | 13 | 488 | ||||||
| ||||||||
Total Production (MBOED) | 70 | 333 | ||||||
| ||||||||
Average Sales Prices | ||||||||
Crude oil (dollars per barrel) | $ | - | 43.82 | |||||
Natural gas liquids (dollars per barrel) | - | 21.32 | ||||||
Bitumen (dollars per barrel) | ||||||||
Consolidated operations | 14.06 | 15.63 | ||||||
Equity affiliates | - | 23.63 | ||||||
Total bitumen | 14.06 | 21.56 | ||||||
Natural gas (dollars per thousand cubic feet) | - | 1.95 | ||||||
| ||||||||
Our Canadian operations mainly consist of an oil sands development in the Athabasca Region of northeastern Alberta and a liquids-rich unconventional play in western Canada. As of March 31, 2018, Canada contributed 8 percent of our worldwide liquids production and less than 1 percent of our worldwide natural gas production.
Earnings from Canada decreased $1,013 million in the first quarter of 2018, compared with the same period of 2017. The decrease in earnings was primarily due to:
| • | The absence of $996 million in deferred tax benefits related to the capital gains component of the disposition of our 50 percent nonoperated interest in the FCCL Partnership, and the recognition of previously unrealizable Canadian tax basis in 2017. |
| • | Lower equity earnings from the disposition of our interest in the FCCL Partnership. |
Total average production decreased 79 percent in the first quarter of 2018, compared with the same period of 2017. The production decrease was primarily due to our Canada disposition, partly offset by a production ramp-up at Surmont and Montney.
Acquisition
In February 2018, we acquired approximately 34,500 net acres of undeveloped land in the Montney in Canada for a net purchase price of approximately $120 million. The additional acreage is adjacent to our existing position in the liquids-rich portion of the Montney.
44
Europe and North Africa
| Three Months Ended March 31 | ||||||||
| 2018 | 2017 | |||||||
|
| |||||||
Net Income Attributable to ConocoPhillips (millions of dollars) | $ | 245 | 171 | |||||
| ||||||||
Average Net Production | ||||||||
Crude oil (MBD) | 158 | 140 | ||||||
Natural gas liquids (MBD) | 8 | 9 | ||||||
Natural gas (MMCFD) | 548 | 544 | ||||||
| ||||||||
Total Production (MBOED) | 258 | 240 | ||||||
| ||||||||
Average Sales Prices | ||||||||
Crude oil (dollars per barrel) | $ | 65.57 | 53.34 | |||||
Natural gas liquids (dollars per barrel) | 32.98 | 31.21 | ||||||
Natural gas (dollars per thousand cubic feet) | 7.38 | 5.86 | ||||||
| ||||||||
The Europe and North Africa segment consists of operations principally located in the Norwegian and U.K. sectors of the North Sea, the Norwegian Sea, and Libya. As of March 31, 2018, our Europe and North Africa operations contributed 21 percent of our worldwide liquids production and 19 percent of our worldwide natural gas production.
Earnings for Europe and North Africa operations increased by $74 million in the first quarter of 2018, compared with the same period of 2017, primarily due to higher realized crude oil and natural gas prices and lower DD&A from reserve additions, partly offset by lower sales volumes due to timing of liftings.
Average production increased 8 percent in the first quarter of 2018 compared with the same period of 2017. The production increase was primarily due to the ramp-up of production in Libya, lower unplanned downtime in the United Kingdom, and improved drilling and well performance in Norway, partly offset by normal field decline in Norway and the United Kingdom.
45
Asia Pacific and Middle East
| Three Months Ended March 31 | ||||||||
| 2018 | 2017 | |||||||
|
| |||||||
Net Income Attributable to ConocoPhillips (millions of dollars) | $ | 461 | 236 | |||||
| ||||||||
Average Net Production | ||||||||
Crude oil (MBD) | ||||||||
Consolidated operations | 90 | 91 | ||||||
Equity affiliates | 15 | 13 | ||||||
| ||||||||
Total crude oil | 105 | 104 | ||||||
| ||||||||
Natural gas liquids (MBD) | ||||||||
Consolidated operations | 4 | 5 | ||||||
Equity affiliates | 8 | 7 | ||||||
| ||||||||
Total natural gas liquids | 12 | 12 | ||||||
| ||||||||
Natural gas (MMCFD) | ||||||||
Consolidated operations | 639 | 719 | ||||||
Equity affiliates | 1,053 | 935 | ||||||
| ||||||||
Total natural gas | 1,692 | 1,654 | ||||||
| ||||||||
Total Production (MBOED) | 398 | 392 | ||||||
| ||||||||
Average Sales Prices | ||||||||
Crude oil (dollars per barrel) | ||||||||
Consolidated operations | $ | 67.07 | 53.74 | |||||
Equity affiliates | 66.50 | 55.58 | ||||||
Total crude oil | 66.99 | 53.98 | ||||||
Natural gas liquids (dollars per barrel) | ||||||||
Consolidated operations | 44.36 | 42.96 | ||||||
Equity affiliates | 43.99 | 43.20 | ||||||
Total natural gas liquids | 44.13 | 43.10 | ||||||
Natural gas (dollars per thousand cubic feet) | ||||||||
Consolidated operations | 5.57 | 4.96 | ||||||
Equity affiliates | 5.04 | 4.00 | ||||||
Total natural gas | 5.23 | 4.42 | ||||||
| ||||||||
The Asia Pacific and Middle East segment has operations in China, Indonesia, Malaysia, Australia, Timor-Leste and Qatar, as well as exploration activities in Brunei. As of March 31, 2018, Asia Pacific and Middle East contributed 15 percent of our worldwide liquids production and 60 percent of our worldwide natural gas production.
Earnings increased 95 percent in the first quarter of 2018, compared with the same period of 2017, primarily due to improved equity earnings, mainly as a result of higher realized prices and sales volumes at Qatar Liquefied Gas Company Limited (3) (QG3) and APLNG. Higher realized crude oil and LNG prices in Malaysia, China and Australia further improved earnings in the period.
Average production increased 2 percent in the first quarter of 2018, compared with the same period of 2017, primarily due to new production from the ramp-up of Malikai in Malaysia and APLNG in Australia, as well as lower planned downtime. The increase in production was partly offset by higher unplanned downtime due to the
46
rupture of a third-party pipeline which carries gas production from the Kebabangan gas field in Malaysia, as well as normal field decline, mainly in China.
Other International
| Three Months Ended March 31 | ||||||||
| 2018 | 2017 | |||||||
|
| |||||||
Net Loss Attributable to ConocoPhillips (millions of dollars) | $ | (44 | ) | (48 | ) | |||
| ||||||||
The Other International segment consists of exploration activities in Colombia and Chile.
Losses from our Other International operations decreased $4 million in the first quarter of 2018, compared with the same period of 2017, mainly due to the absences of a $28 million after-tax charge for the cancellation of our Athena drilling rig contract and rig stacking costs, both incurred in the first quarter of 2017. The reduction in losses was partly offset by a $34 million tax settlement in Nigeria in 2018 associated with prior operations.
Corporate and Other
| Millions of Dollars | ||||||||
| Three Months Ended March 31 | ||||||||
| 2018 | 2017 | |||||||
|
| |||||||
Net Income (Loss) Attributable to ConocoPhillips | ||||||||
Net interest | $ | (160 | ) | (253 | ) | |||
Corporate general and administrative expenses | (50 | ) | (51 | )* | ||||
Technology | (10 | ) | 9 | |||||
Other | (321 | ) | (53 | )* | ||||
| ||||||||
| $ | (541 | ) | (348 | ) | ||||
| ||||||||
*Certain amounts have been reclassified to reflect the adoption of ASU 2017-07 and ASU 2016-01. See Note 2-Changes in Accounting
Principles, in the Notes to Consolidated Financial Statements, for additional information.
Net interest consists of interest and financing expense, net of interest income and capitalized interest. Net interest decreased by $93 million in the first quarter of 2018, primarily due to lower interest on debt expense and lower interest due to an accrual reduction given a transportation cost ruling by the FERC. The decrease in net interest was partly offset by reduced tax benefit on interest expense following the Tax Cuts and Jobs Act ("Tax Legislation"), which lowered the U.S. corporate income tax rate from 35 percent to 21 percent effective January 1, 2018.
Technology includes our investment in new technologies or businesses, as well as licensing revenues. Activities are focused on tight oil reservoirs, heavy oil and oil sands, as well as LNG. Earnings from Technology decreased $19 million in the first quarter primarily due to lower licensing revenues.
The category "Other" includes certain foreign currency transaction gains and losses, environmental costs associated with sites no longer in operation, other costs not directly associated with an operating segment, premiums incurred on the early retirement of debt, unrealized holding gains or losses on equity securities, and pension settlement expense. "Other" expenses increased by $268 million in the first quarter of 2018, compared with the same period of 2017, primarily due to premiums on our early retirement of debt and a net unrealized loss on our Cenovus Energy common shares, partly offset by the absence of pension settlement expense recognized in the first quarter of 2017.
47
CAPITAL RESOURCES AND LIQUIDITY
Financial Indicators
| Millions of Dollars | ||||||||
| March 31 2018 | December 31 2017 | |||||||
|
| |||||||
Short-term debt | $ | 337 | 2,575 | |||||
Total debt | 17,046 | 19,703 | ||||||
Total equity | 30,718 | 30,801 | ||||||
Percent of total debt to capital* | 36 | % | 39 | |||||
Percent of floating-rate debt to total debt | 6 | % | 5 | |||||
| ||||||||
*Capital includes total debt and total equity.
To meet our short- and long-term liquidity requirements, we look to a variety of funding sources, including cash generated from operating activities, our commercial paper and credit facility programs, and our shelf registration statement. During the first quarter of 2018, the primary uses of our available cash were $2,888 million to reduce debt, $1,535 million to support our ongoing capital expenditures and investments program, $500 million to repurchase common stock, and $338 million to pay dividends. During the first quarter of 2018, our cash, cash equivalents and restricted cash decreased by $1,330 million to $5,206 million.
We believe current cash balances and cash generated by operations, together with access to external sources of funds as described below in the "Significant Sources of Capital" section, will be sufficient to meet our funding requirements in the near and long term, including our capital spending program, dividend payments and required debt payments.
Significant Sources of Capital
Operating Activities
Cash provided by operating activities was $2,399 million for the first quarter of 2018, compared with $1,790 million for the corresponding period of 2017. The increase was primarily due to higher realized crude oil, natural gas and natural gas liquids prices.
While the stability of our cash flows from operating activities benefits from geographic diversity, our short- and long-term operating cash flows are highly dependent upon prices for crude oil, bitumen, natural gas, LNG and natural gas liquids. Prices and margins in our industry have historically been volatile and are driven by market conditions over which we have no control. Absent other mitigating factors, as these prices and margins fluctuate, we would expect a corresponding change in our operating cash flows.
The level of absolute production volumes, as well as product and location mix, impacts our cash flows. Production levels are impacted by such factors as the volatile crude oil and natural gas price environment, which may impact investment decisions; the effects of price changes on production sharing and variable-royalty contracts; acquisition and disposition of fields; field production decline rates; new technologies; operating efficiencies; timing of startups and major turnarounds; political instability; weather-related disruptions; and the addition of proved reserves through exploratory success and their timely and cost-effective development. While we actively manage these factors, production levels can cause variability in cash flows, although generally this variability has not been as significant as that caused by commodity prices.
To maintain or grow our production volumes, we must continue to add to our proved reserve base. As we undertake cash prioritization efforts, our reserve replacement efforts could be delayed thus limiting our ability to replace depleted reserves.
48
Investing Activities
Proceeds from asset sales for the first quarter of 2018 were $169 million compared with $35 million for the corresponding period of 2017. All cash deposits and proceeds from asset dispositions are included in the "Cash Flows From Investing Activities" section of our consolidated statement of cash flows. In the first quarter of 2018, we completed the sale of certain properties in the Lower 48 segment for net proceeds of $112 million. No gain or loss was recognized on the sale.
Commercial Paper and Credit Facilities
We have a revolving credit facility totaling $6.75 billion, expiring in June 2019. Our revolving credit facility may be used for direct bank borrowings, the issuance of letters of credit totaling up to $500 million, or as support for our commercial paper programs. The revolving credit facility is broadly syndicated among financial institutions and does not contain any material adverse change provisions or any covenants requiring maintenance of specified financial ratios or credit ratings. The facility agreement contains a cross-default provision relating to the failure to pay principal or interest on other debt obligations of $200 million or more by ConocoPhillips, or any of its consolidated subsidiaries.
Credit facility borrowings may bear interest at a margin above rates offered by certain designated banks in the London interbank market or at a margin above the overnight federal funds rate or prime rates offered by certain designated banks in the United States. The agreement calls for commitment fees on available, but unused, amounts. The agreement also contains early termination rights if our current directors or their approved successors cease to be a majority of the Board of Directors.
We have two commercial paper programs. The ConocoPhillips $6.25 billion commercial paper program is available to fund short-term working capital needs. We also have the ConocoPhillips Qatar Funding Ltd. $500 million commercial paper program, which is used to fund commitments relating to QG3. Commercial paper maturities are generally limited to 90 days. We had no commercial paper outstanding at March 31, 2018 or December 31, 2017, under either the ConocoPhillips or the ConocoPhillips Qatar Funding Ltd. commercial paper program. We had no direct borrowings or letters of credit issued under the revolving credit facility. Since we had no commercial paper outstanding and had issued no letters of credit, we had access to $6.75 billion in borrowing capacity under our revolving credit facility at March 31, 2018.
In January 2018, Fitch affirmed our long-term debt rating at "A-" and improved their outlook for our debt from "stable" to "positive." In March 2018, Moody's Investors Services affirmed their rating on our long-term debt at "Baa1" and changed their outlook for our debt from "stable" to "positive." We do not have any ratings triggers on any of our corporate debt that would cause an automatic default, and thereby impact our access to liquidity, in the event of a downgrade of our credit rating. If our credit rating were downgraded, it could increase the cost of corporate debt available to us and restrict our access to the commercial paper markets. If our credit rating were to deteriorate to a level prohibiting us from accessing the commercial paper market, we would still be able to access funds under our revolving credit facility.
Certain of our project-related contracts, commercial contracts and derivative instruments contain provisions requiring us to post collateral. Many of these contracts and instruments permit us to post either cash or letters of credit as collateral. At March 31, 2018 and December 31, 2017, we had direct bank letters of credit of $367 million and $338 million, respectively, which secured performance obligations related to various purchase commitments incident to the ordinary conduct of business. In the event of credit ratings downgrades, we may be required to post additional letters of credit.
Shelf Registration
We have a universal shelf registration statement on file with the U.S. Securities and Exchange Commission (SEC) under which we, as a well-known seasoned issuer, have the ability to issue and sell an indeterminate amount of various types of debt and equity securities.
49
Off-Balance Sheet Arrangements
As part of our normal ongoing business operations and consistent with normal industry practice, we enter into numerous agreements with other parties to pursue business opportunities, which share costs and apportion risks among the parties as governed by the agreements.
For information about guarantees, see Note 12-Guarantees, in the Notes to Consolidated Financial Statements, which is incorporated herein by reference.
Capital Requirements
For information about our capital expenditures and investments, see the "Capital Expenditures" section.
Our debt balance at March 31, 2018, was $17.0 billion, a decrease of $2.7 billion from the balance at December 31, 2017.
In the first quarter of 2018, we redeemed or repurchased a total of $2,650 million of debt as described below:
| • | 4.20% Notes due 2021 with remaining principal of $1.0 billion. |
| • | 2.875% Notes due 2021 with principal of $750 million. |
| • | 2.2% Notes due 2020 with principal of $500 million. |
| • | 8.125% Notes due 2030 with principal of $600 million (partial redemption of $210 million). |
| • | 7.8% Notes due 2027 with principal of $300 million (partial redemption of $97 million). |
| • | 7.9% Notes due 2047 with principal of $100 million (partial redemption of $40 million). |
| • | 9.125% Notes due 2021 with principal of $150 million (partial redemption of $27 million). |
| • | 8.20% Notes due 2025 with principal of $150 million (partial redemption of $16 million). |
| • | 7.65% Notes due 2023 with principal of $88 million (partial redemption of $10 million). |
We incurred premiums above book value to redeem or repurchase these debt instruments of $206 million.
We have accelerated our debt target of $15 billion from year-end 2019 to year-end 2018. We may redeem debt instruments or purchase debt instruments in the open market or otherwise, as we seek to achieve this target. Any such redemptions or purchases would be subject to market conditions and other factors, and may be conducted or discontinued at any time without prior notice. For more information on debt, see Note 10-Debt, in the Notes to Consolidated Financial Statements.
On February 1, 2018, we announced an increase in the quarterly dividend to $0.285 per share, compared with the previous quarterly dividend of $0.265 per share. The dividend was paid on March 1, 2018, to stockholders of record at the close of business on February 12, 2018.
On November 10, 2016, we announced plans to purchase up to $3 billion of our common stock through 2019. On March 29, 2017, we announced plans to double our share repurchase program to $6 billion of common stock through 2019, with $3 billion allocated and purchased in 2017, and the remainder allocated evenly to 2018 and 2019. On February 1, 2018, we announced the acceleration of our previously stated 2018 share repurchases from $1.5 billion to $2.0 billion, with the remaining balance to be repurchased in 2019. In addition to the $6 billion approved share repurchase program above, we are currently planning to repurchase up to an additional $1.5 billion of our common stock through 2020. Whether we undertake these additional repurchases is ultimately subject to numerous considerations, including Board authorization, market conditions and other factors. See the "Our ability to declare and pay dividends and repurchase shares is subject to certain considerations" section in Risk Factors on pages 20–21 of our 2017 Annual Report on Form 10-K.
Since our share repurchase program began in November 2016, we have repurchased 75 million shares at a cost of $3.6 billion through March 31, 2018.
50
Capital Expenditures
| Millions of Dollars | ||||||||
| Three Months Ended March 31 | ||||||||
| 2018 | 2017 | |||||||
|
| |||||||
Alaska | $ | 263 | 228 | |||||
Lower 48 | 751 | 343 | ||||||
Canada | 173 | 62 | ||||||
Europe and North Africa | 216 | 200 | ||||||
Asia Pacific and Middle East | 99 | 109 | ||||||
Other International | 1 | 5 | ||||||
Corporate and Other | 32 | 19 | ||||||
| ||||||||
Capital expenditures and investments | $ | 1,535 | 966 | |||||
| ||||||||
During the first quarter of 2018, capital expenditures and investments supported key exploration and development programs, primarily:
| • | Development and appraisal activities in the Lower 48, including Eagle Ford, Bakken, and the Permian Basin. |
| • | Activities in Alaska related to exploration, appraisal and development in the Western North Slope; development activities in Greater Kuparuk Area and the Greater Prudhoe Area. |
| • | Development activities in Europe, including the Greater Ekofisk Area, Clair Ridge and Aasta Hansteen. |
| • | Leasehold acquisition, optimization of oil sands development and appraisal activities in liquids-rich plays in Canada. |
| • | Continued development in Malaysia, Indonesia, China and Australia. |
Our current capital budget outlook for 2018 is $5.5 billion, including $3.5 billion of sustaining capital and $2 billion in accretive, short-cycle unconventional programs, future major projects and exploration activities. This guidance excludes acquisition investment for the previously announced $0.4 billion bolt-on transaction in Alaska and the $0.1 billion acquisition of additional acreage in the Montney in Canada.
Contingencies
A number of lawsuits involving a variety of claims arising in the ordinary course of business have been filed against ConocoPhillips. We also may be required to remove or mitigate the effects on the environment of the placement, storage, disposal or release of certain chemical, mineral and petroleum substances at various active and inactive sites. We regularly assess the need for accounting recognition or disclosure of these contingencies. In the case of all known contingencies (other than those related to income taxes), we accrue a liability when the loss is probable and the amount is reasonably estimable. If a range of amounts can be reasonably estimated and no amount within the range is a better estimate than any other amount, then the minimum of the range is accrued. We do not reduce these liabilities for potential insurance or third-party recoveries. If applicable, we accrue receivables for probable insurance or other third-party recoveries. With respect to income-tax-related contingencies, we use a cumulative probability-weighted loss accrual in cases where sustaining a tax position is less than certain.
Based on currently available information, we believe it is remote that future costs related to known contingent liability exposures will exceed current accruals by an amount that would have a material adverse impact on our consolidated financial statements. As we learn new facts concerning contingencies, we reassess our position
51
both with respect to accrued liabilities and other potential exposures. Estimates particularly sensitive to future changes include contingent liabilities recorded for environmental remediation, tax and legal matters. Estimated future environmental remediation costs are subject to change due to such factors as the uncertain magnitude of cleanup costs, the unknown time and extent of such remedial actions that may be required, and the determination of our liability in proportion to that of other responsible parties. Estimated future costs related to tax and legal matters are subject to change as events evolve and as additional information becomes available during the administrative and litigation processes. For information on other contingencies, see Note 13-Contingencies and Commitments, in the Notes to Consolidated Financial Statements.
Legal Matters
We are subject to various lawsuits and claims including but not limited to matters involving oil and gas royalty and severance tax payments, gas measurement and valuation methods, contract disputes, environmental damages, personal injury and property damage. Our primary exposures for such matters relate to alleged royalty and tax underpayments on certain federal, state and privately owned properties and claims of alleged environmental contamination from historic operations. We will continue to defend ourselves vigorously in these matters.
Our legal organization applies its knowledge, experience and professional judgment to the specific characteristics of our cases, employing a litigation management process to manage and monitor the legal proceedings against us. Our process facilitates the early evaluation and quantification of potential exposures in individual cases. This process also enables us to track those cases that have been scheduled for trial and/or mediation. Based on professional judgment and experience in using these litigation management tools and available information about current developments in all our cases, our legal organization regularly assesses the adequacy of current accruals and determines if adjustment of existing accruals, or establishment of new accruals, is required.
Environmental
We are subject to the same numerous international, federal, state and local environmental laws and regulations as other companies in our industry. For a discussion of the most significant of these environmental laws and regulations, including those with associated remediation obligations, see the "Environmental" section in Management's Discussion and Analysis of Financial Condition and Results of Operations on pages 61–63 of our 2017 Annual Report on Form 10-K.
We occasionally receive requests for information or notices of potential liability from the Environmental Protection Agency (EPA) and state environmental agencies alleging that we are a potentially responsible party under the Federal Comprehensive Environmental Response, Compensation and Liability Act (CERCLA) or an equivalent state statute. On occasion, we also have been made a party to cost recovery litigation by those agencies or by private parties. These requests, notices and lawsuits assert potential liability for remediation costs at various sites that typically are not owned by us, but allegedly contain waste attributable to our past operations. As of March 31, 2018, there were 14 sites around the United States in which we were identified as a potentially responsible party under CERCLA and comparable state laws.
At March 31, 2018, our balance sheet included a total environmental accrual of $173 million, compared with $180 million at December 31, 2017, for remediation activities in the United States and Canada. We expect to incur a substantial amount of these expenditures within the next 30 years.
Notwithstanding any of the foregoing, and as with other companies engaged in similar businesses, environmental costs and liabilities are inherent concerns in our operations and products, and there can be no assurance that material costs and liabilities will not be incurred. However, we currently do not expect any material adverse effect upon our results of operations or financial position as a result of compliance with current environmental laws and regulations.
52
Climate Change
There has been a broad range of proposed or promulgated state, national and international laws focusing on greenhouse gas (GHG) reduction. These proposed or promulgated laws apply or could apply in countries where we have interests or may have interests in the future. Laws in this field continue to evolve, and while it is not possible to accurately estimate either a timetable for implementation or our future compliance costs relating to implementation, such laws, if enacted, could have a material impact on our results of operations and financial condition. Examples of legislation and precursors for possible regulation that do or could affect our operations include the EPA's announcement on March 29, 2010 (published as "Interpretation of Regulations that Determine Pollutants Covered by Clean Air Act Permitting Programs," 75 Fed. Reg. 17004 (April 2, 2010)) and the EPA's and U.S. Department of Transportation's joint promulgation of a Final Rule on April 1, 2010, that trigger regulation of GHGs under the Clean Air Act, may trigger more climate-based claims for damages, and may result in longer agency review time for development projects.
For other examples of legislation or precursors for possible regulation and factors on which the ultimate impact on our financial performance will depend, see the "Climate Change" section in Management's Discussion and Analysis of Financial Condition and Results of Operations on pages 63–64 of our 2017 Annual Report on Form 10-K.
In 2017 and early 2018, cities and/or counties in California and New York have filed lawsuits against oil and gas companies, including ConocoPhillips, seeking compensatory damages and equitable relief to abate alleged climate change impacts. ConocoPhillips is vigorously defending against these lawsuits.
NEW ACCOUNTING STANDARDS
In February 2016, the Financial Accounting Standards Board (FASB) issued Accounting Standards Update (ASU) No. 2016-02, "Leases" (ASU No. 2016-02), which establishes comprehensive accounting and financial reporting requirements for leasing arrangements. This ASU supersedes the existing requirements in FASB Accounting Standards Codification (ASC) Topic 840, "Leases," and requires lessees to recognize substantially all lease assets and lease liabilities on the balance sheet. The provisions of ASU No. 2016-02 also modify the definition of a lease and outline requirements for recognition, measurement, presentation, and disclosure of leasing arrangements by both lessees and lessors. The ASU is effective for interim and annual periods beginning after December 15, 2018, and early adoption of the standard is permitted. Entities are required to adopt the ASU using a modified retrospective approach, subject to certain optional practical expedients, and apply the provisions of ASU No. 2016-02 to leasing arrangements existing at or entered into after the earliest comparative period presented in the financial statements. In January 2018, ASU No. 2016-02 was amended by the provisions of ASU No. 2018-01, "Land Easement Practical Expedient for Transition to Topic 842." We plan to adopt ASU No. 2016-02, as amended, effective January 1, 2019, and continue to evaluate the ASU to determine the impact of adoption on our consolidated financial statements and disclosures, accounting policies and systems, business processes, and internal controls. We are currently implementing a third-party lease accounting software solution to facilitate the ongoing accounting and financial reporting requirements of the ASU. We also continue to monitor proposals issued by the FASB to clarify the ASU and certain industry implementation issues. While our evaluation of ASU No. 2016-02 and related implementation activities are ongoing, we expect the adoption of the ASU to have a material impact on our consolidated financial statements and disclosures. For additional information, see Note 23-New Accounting Standards, in the Notes to Consolidated Financial Statements.
53
CAUTIONARY STATEMENT FOR THE PURPOSES OF THE "SAFE HARBOR" PROVISIONS OF THE PRIVATE SECURITIES LITIGATION REFORM ACT OF 1995
This report includes forward-looking statements within the meaning of Section 27A of the Securities Act of 1933 and Section 21E of the Securities Exchange Act of 1934. All statements other than statements of historical fact included or incorporated by reference in this report, including, without limitation, statements regarding our future financial position, business strategy, budgets, projected revenues, projected costs and plans, and objectives of management for future operations, are forward-looking statements. Examples of forward-looking statements contained in this report include our expected production growth and outlook on the business environment generally, our expected capital budget and capital expenditures, and discussions concerning future dividends. You can often identify our forward-looking statements by the words "anticipate," "estimate," "believe," "budget," "continue," "could," "intend," "may," "plan," "potential," "predict," "seek," "should," "will," "would," "expect," "objective," "projection," "forecast," "goal," "guidance," "outlook," "effort," "target" and similar expressions.
We based the forward-looking statements on our current expectations, estimates and projections about ourselves and the industries in which we operate in general. We caution you these statements are not guarantees of future performance as they involve assumptions that, while made in good faith, may prove to be incorrect, and involve risks and uncertainties we cannot predict. In addition, we based many of these forward-looking statements on assumptions about future events that may prove to be inaccurate. Accordingly, our actual outcomes and results may differ materially from what we have expressed or forecast in the forward-looking statements. Any differences could result from a variety of factors, including, but not limited to, the following:
| • | Fluctuations in crude oil, bitumen, natural gas, LNG and natural gas liquids prices, including a prolonged decline in these prices relative to historical or future expected levels. |
| • | The impact of significant declines in prices for crude oil, bitumen, natural gas, LNG and natural gas liquids, which may result in recognition of impairment costs on our long-lived assets, leaseholds and nonconsolidated equity investments. |
| • | Potential failures or delays in achieving expected reserve or production levels from existing and future oil and gas developments, including due to operating hazards, drilling risks and the inherent uncertainties in predicting reserves and reservoir performance. |
| • | Reductions in reserves replacement rates, whether as a result of the significant declines in commodity prices or otherwise. |
| • | Unsuccessful exploratory drilling activities or the inability to obtain access to exploratory acreage. |
| • | Unexpected changes in costs or technical requirements for constructing, modifying or operating exploration and production facilities. |
| • | Legislative and regulatory initiatives addressing environmental concerns, including initiatives addressing the impact of global climate change or further regulating hydraulic fracturing, methane emissions, flaring or water disposal. |
| • | Lack of, or disruptions in, adequate and reliable transportation for our crude oil, bitumen, natural gas, LNG and natural gas liquids. |
| • | Inability to timely obtain or maintain permits, including those necessary for construction, drilling and/or development; failure to comply with applicable laws and regulations; or inability to make capital expenditures required to maintain compliance with any necessary permits or applicable laws or regulations. |
| • | Failure to complete definitive agreements and feasibility studies for, and to complete construction of, announced and future exploration and production and LNG development in a timely manner (if at all) or on budget. |
| • | Potential disruption or interruption of our operations due to accidents, extraordinary weather events, civil unrest, political events, war, terrorism, cyber attacks, and information technology failures, constraints or disruptions. |
| • | Changes in international monetary conditions and foreign currency exchange rate fluctuations. |
54
| • | Reduced demand for our products or the use of competing energy products, including alternative energy sources. |
| • | Substantial investment in and development of alternative energy sources, including as a result of existing or future environmental rules and regulations. |
| • | Liability for remedial actions, including removal and reclamation obligations, under environmental regulations. |
| • | Liability resulting from litigation. |
| • | General domestic and international economic and political developments, including armed hostilities; expropriation of assets; changes in governmental policies relating to crude oil, bitumen, natural gas, LNG and natural gas liquids pricing, regulation or taxation; and other political, economic or diplomatic developments. |
| • | Volatility in the commodity futures markets. |
| • | Changes in tax and other laws, regulations (including alternative energy mandates), or royalty rules applicable to our business, including changes resulting from the implementation and interpretation of the Tax Cuts and Jobs Act. |
| • | Competition in the oil and gas exploration and production industry. |
| • | Any limitations on our access to capital or increase in our cost of capital related to illiquidity or uncertainty in the domestic or international financial markets. |
| • | Our inability to execute, or delays in the completion, of any asset dispositions we elect to pursue. |
| • | Potential failure to obtain, or delays in obtaining, any necessary regulatory approvals for asset dispositions or that such approvals may require modification to the terms of the transactions or the operation of our remaining business. |
| • | Potential disruption of our operations as a result of asset dispositions, including the diversion of management time and attention. |
| • | Our inability to deploy the net proceeds from any asset dispositions we undertake in the manner and timeframe we currently anticipate, if at all. |
| • | Our inability to liquidate the common stock issued to us by Cenovus Energy as part of our sale of certain assets in western Canada at prices we deem acceptable, or at all. |
| • | Our inability to obtain economical financing for development, construction or modification of facilities and general corporate purposes. |
| • | The operation and financing of our joint ventures. |
| • | The ability of our customers and other contractual counterparties to satisfy their obligations to us. |
| • | Our inability to realize anticipated cost savings and expenditure reductions. |
| • | The factors generally described in Item 1A-Risk Factors in our 2017 Annual Report on Form 10-K and any additional risks described in our other filings with the SEC. |
| Item 3. | QUANTITATIVE AND QUALITATIVE DISCLOSURES ABOUT MARKET RISK |
Information about market risks for the three months ended March 31, 2018, does not differ materially from that discussed under Item 7A in our 2017 Annual Report on Form 10-K.
| Item 4. | CONTROLS AND PROCEDURES |
We maintain disclosure controls and procedures designed to ensure information required to be disclosed in reports we file or submit under the Securities Exchange Act of 1934, as amended (the Act), is recorded, processed, summarized and reported within the time periods specified in Securities and Exchange Commission rules and forms, and that such information is accumulated and communicated to management, including our principal executive and principal financial officers, as appropriate, to allow timely decisions regarding required disclosure. As of March 31, 2018, with the participation of our management, our Chairman and Chief Executive Officer (principal executive officer) and our Executive Vice President, Finance, Commercial and Chief Financial Officer (principal financial officer) carried out an evaluation, pursuant to Rule 13a-15(b) of the
55
Act, of ConocoPhillips' disclosure controls and procedures (as defined in Rule 13a-15(e) of the Act). Based upon that evaluation, our Chairman and Chief Executive Officer and our Executive Vice President, Finance, Commercial and Chief Financial Officer concluded our disclosure controls and procedures were operating effectively as of March 31, 2018.
There have been no changes in our internal control over financial reporting, as defined in Rule 13a-15(f) of the Act, in the period covered by this report that have materially affected, or are reasonably likely to materially affect, our internal control over financial reporting.
PART II. OTHER INFORMATION
| Item 1. | LEGAL PROCEEDINGS |
The following is a description of reportable legal proceedings including those involving governmental authorities under federal, state and local laws regulating the discharge of materials into the environment for this reporting period. The following proceedings include those matters that arose during the first quarter of 2018 and any material developments with respect to matters previously reported in ConocoPhillips' 2017 Annual Report on Form 10-K. While it is not possible to accurately predict the final outcome of these pending proceedings, if any one or more of such proceedings were to be decided adversely to ConocoPhillips, we expect there would be no material effect on our consolidated financial position. Nevertheless, such proceedings are reported pursuant to U.S. Securities and Exchange Commission regulations.
On April 30, 2012, the separation of our downstream business was completed, creating two independent energy companies: ConocoPhillips and Phillips 66. In connection with the separation, we entered into an Indemnification and Release Agreement, which provides for cross-indemnities between Phillips 66 and us and established procedures for handling claims subject to indemnification and related matters, such as legal proceedings. We have included matters where we remain or have subsequently become a party to a proceeding relating to Phillips 66, in accordance with SEC regulations. We do not expect any of those matters to result in a net claim against us.
Matters Previously Reported-Phillips 66
In October 2016, after Phillips 66 received a Notice of Intent to Sue from the Sierra Club, Phillips 66 entered into a voluntary settlement with the Illinois Environmental Protection Agency for alleged violations of wastewater requirements at the Wood River Refinery. The settlement involves certain capital projects and payment of $125,000. After the settlement was filed with the Court for final approval, the Sierra Club sought and was granted approval to intervene in the case. The settlement and a first modification were entered by the Court, but the Sierra Club still sought to reopen and challenge the settlement. On February 9, 2018, the Court denied the Sierra Club's motion to reopen the settlement. The Sierra Club did not appeal the Court's denial and the matter is now resolved.
New Matters-ConocoPhillips
On March 22, 2018, an investigator with the Alberta Energy Regulator issued to ConocoPhillips Canada a preliminary notice recommending that the regulator issue an administrative penalty of $180,000 CAD in connection with an estimated 2,400 barrel condensate release discovered on June 9, 2016. The release was from a transmission pipeline leading from the ConocoPhillips Resthaven gas plant located south of Grande Cache, Alberta. Subject to a review meeting, a formal penalty is expected to be issued in the second quarter of 2018.
| Item 1A. | RISK FACTORS |
There have been no material changes from the risk factors disclosed in Item 1A of our 2017 Annual Report on Form 10-K.
56
| Item 2. | UNREGISTERED SALES OF EQUITY SECURITIES AND USE OF PROCEEDS |
Issuer Purchases of Equity Securities
| Millions of Dollars | ||||||||||||||||
| Period | Total Number of Shares Purchased* | Average Price Paid per Share | Total Number of Shares Purchased as Part of Publicly Announced Plans or Programs | Approximate Dollar Value of Shares That May Yet Be Purchased Under the Plans or Programs | ||||||||||||
| ||||||||||||||||
January 1-31, 2018 | 2,842,699 | $ | 58.56 | 2,842,699 | $ | 2,708 | ||||||||||
February 1-28, 2018 | 2,845,268 | 55.69 | 2,845,268 | 2,549 | ||||||||||||
March 1-31, 2018 | 3,172,871 | 55.20 | 3,172,871 | 2,374 | ||||||||||||
| ||||||||||||||||
Total | 8,860,838 | $ | 56.43 | 8,860,838 | $ | 2,374 | ||||||||||
| ||||||||||||||||
* There were no repurchases of common stock from company employees in connection with the company's broad-based employee incentive plans.
On November 10, 2016, we announced plans to purchase up to $3 billion of our common stock through 2019. On March 29, 2017, we announced plans to double our share repurchase program to $6 billion of common stock through 2019, with $3 billion allocated and purchased in 2017, and the remainder allocated evenly to 2018 and 2019. On February 1, 2018, we announced the acceleration of our previously stated 2018 share repurchases from $1.5 billion to $2.0 billion, with the remaining balance to be repurchased in 2019. Acquisitions for the share repurchase program are made at management's discretion, at prevailing prices, subject to market conditions and other factors. Repurchases may be increased, decreased or discontinued at any time without prior notice. Shares of stock repurchased under the plan are held as treasury shares.
In addition to our previously announced share repurchase program above, we are currently planning to purchase up to an additional $1.5 billion of our common stock through 2020. Whether we undertake these additional repurchases is ultimately subject to numerous considerations, including Board authorization, market conditions and other factors. See the "Our ability to declare and pay dividends and repurchase shares is subject to certain considerations" section in Risk Factors on pages 20–21 of our 2017 Annual Report on Form 10-K.
57
| Item 6. | EXHIBITS |
| 12* | Computation of Ratio of Earnings to Fixed Charges. | |
| 31.1* | Certification of Chief Executive Officer pursuant to Rule 13a-14(a) under the Securities Exchange Act of 1934. | |
| 31.2* | Certification of Chief Financial Officer pursuant to Rule 13a-14(a) under the Securities Exchange Act of 1934. | |
| 32* | Certifications pursuant to 18 U.S.C. Section 1350. | |
| 101.INS* | XBRL Instance Document. | |
| 101.SCH* | XBRL Schema Document. | |
| 101.CAL* | XBRL Calculation Linkbase Document. | |
| 101.LAB* | XBRL Labels Linkbase Document. | |
| 101.PRE* | XBRL Presentation Linkbase Document. | |
| 101.DEF* | XBRL Definition Linkbase Document. | |
* Filed herewith.
58
SIGNATURE
Pursuant to the requirements of the Securities Exchange Act of 1934, the registrant has duly caused this report to be signed on its behalf by the undersigned thereunto duly authorized.
| CONOCOPHILLIPS |
| /s/ Glenda M. Schwarz |
Glenda M. Schwarz Vice President and Controller (Chief Accounting and Duly Authorized Officer) |
May 1, 2018
59