2017
UNITED STATES
SECURITIES AND EXCHANGE COMMISSION
Washington, D.C. 20549
Form 10-K
(Mark One)
| [x] | ANNUAL REPORT PURSUANT TO SECTION 13 OR 15(d) OF THE SECURITIES EXCHANGE ACT OF 1934 |
For the fiscal year ended December 31, 2017
OR
| [ ] | TRANSITION REPORT PURSUANT TO SECTION 13 OR 15(d) OF THE SECURITIES EXCHANGE ACT OF 1934 |
For the transition period from to
Commission file number: 001-32395
ConocoPhillips
(Exact name of registrant as specified in its charter)
| Delaware | 01-0562944 | |
| (State or other jurisdiction of | (I.R.S. Employer | |
| incorporation or organization) | Identification No.) |
600 North Dairy Ashford
Houston, TX 77079
(Address of principal executive offices) (Zip Code)
Registrant's telephone number, including area code: 281-293-1000
Securities registered pursuant to Section 12(b) of the Act:
Title of each class | Name of each exchange on which registered | |||
| Common Stock, $.01 Par Value | New York Stock Exchange | |||
| 7% Debentures due 2029 | New York Stock Exchange |
Securities registered pursuant to Section 12(g) of the Act: None
Indicate by check mark if the registrant is a well-known seasoned issuer, as defined in Rule 405 of the Securities Act.
[x] Yes [ ] No
Indicate by check mark if the registrant is not required to file reports pursuant to Section 13 or Section 15(d) of the Act.
[ ] Yes [x] No
Indicate by check mark whether the registrant (1) has filed all reports required to be filed by Section 13 or 15(d) of the Securities Exchange Act of 1934 during the preceding 12 months (or for such shorter period that the registrant was required to file such reports), and (2) has been subject to such filing requirements for the past 90 days.
[x] Yes [ ] No
Indicate by check mark whether the registrant has submitted electronically and posted on its corporate Web site, if any, every Interactive Data File required to be submitted and posted pursuant to Rule 405 of Regulation S-T during the preceding 12 months (or for such shorter period that the registrant was required to submit and post such files).
[x] Yes [ ] No
Indicate by check mark if disclosure of delinquent filers pursuant to Item 405 of Regulation S-K is not contained herein, and will not be contained, to the best of the registrant's knowledge, in definitive proxy or information statements incorporated by reference in Part III of this Form 10-K or any amendment to this Form 10-K. [ ]
Indicate by check mark whether the registrant is a large accelerated filer, an accelerated filer, a non-accelerated filer, a smaller reporting company, or an emerging growth company. See the definitions of "large accelerated filer," "accelerated filer," "smaller reporting company" and "emerging growth company" in Rule 12b-2 of the Exchange Act.
Large accelerated filer [x] Accelerated filer [ ] Non-accelerated filer [ ] Smaller reporting company [ ]
Emerging growth company [ ]
If an emerging growth company, indicate by check mark if the registrant has elected not to use the extended transition period for complying with any new or revised financial accounting standards provided pursuant to Section 13(a) of the Exchange Act. [ ]
Indicate by check mark whether the registrant is a shell company (as defined in Rule 12b-2 of the Act). [ ] Yes [x] No
The aggregate market value of common stock held by non-affiliates of the registrant on June 30, 2017, the last business day of the registrant's most recently completed second fiscal quarter, based on the closing price on that date of $43.96, was $54.0 billion.
The registrant had 1,174,577,506 shares of common stock outstanding at January 31, 2018.
Documents incorporated by reference:
Portions of the Proxy Statement for the Annual Meeting of Stockholders to be held on May 15, 2018 (Part III)
TABLE OF CONTENTS
Item | Page | |||||
| PART I | ||||||
1 and 2. | Business and Properties | 1 | ||||
Corporate Structure | 1 | |||||
Segment and Geographic Information | 2 | |||||
Alaska | 3 | |||||
Lower 48 | 5 | |||||
Canada | 7 | |||||
Europe and North Africa | 8 | |||||
Asia Pacific and Middle East | 11 | |||||
Other International | 15 | |||||
Competition | 18 | |||||
General | 18 | |||||
1A. | Risk Factors | 20 | ||||
1B. | Unresolved Staff Comments | 25 | ||||
3. | Legal Proceedings | 25 | ||||
4. | Mine Safety Disclosures | 25 | ||||
Executive Officers of the Registrant | 26 | |||||
PART II
| ||||||
5. | Market for Registrant's Common Equity, Related Stockholder Matters and Issuer Purchases of Equity Securities | 27 | ||||
6. | Selected Financial Data | 29 | ||||
7. | Management's Discussion and Analysis of Financial Condition and Results of Operations | 30 | ||||
7A. | Quantitative and Qualitative Disclosures About Market Risk | 72 | ||||
8. | Financial Statements and Supplementary Data | 75 | ||||
9. | Changes in and Disagreements with Accountants on Accounting and Financial Disclosure | 174 | ||||
9A. | Controls and Procedures | 174 | ||||
9B. | Other Information | 174 | ||||
PART III
| ||||||
10. | Directors, Executive Officers and Corporate Governance | 175 | ||||
11. | Executive Compensation | 175 | ||||
12. | Security Ownership of Certain Beneficial Owners and Management and Related Stockholder Matters | 175 | ||||
13. | Certain Relationships and Related Transactions, and Director Independence | 175 | ||||
14. | Principal Accounting Fees and Services | 175 | ||||
PART IV
| ||||||
15. | Exhibits, Financial Statement Schedules | 176 | ||||
Signatures | 188 | |||||
PART I
Unless otherwise indicated, "the company," "we," "our," "us" and "ConocoPhillips" are used in this report to refer to the businesses of ConocoPhillips and its consolidated subsidiaries. Items 1 and 2-Business and Properties, contain forward-looking statements including, without limitation, statements relating to our plans, strategies, objectives, expectations and intentions that are made pursuant to the "safe harbor" provisions of the Private Securities Litigation Reform Act of 1995. The words "anticipate," "estimate," "believe," "budget," "continue," "could," "intend," "may," "plan," "potential," "predict," "seek," "should," "will," "would," "expect," "objective," "projection," "forecast," "goal," "guidance," "outlook," "effort," "target" and similar expressions identify forward-looking statements. The company does not undertake to update, revise or correct any forward-looking information unless required to do so under the federal securities laws. Readers are cautioned that such forward-looking statements should be read in conjunction with the company's disclosures under the heading "CAUTIONARY STATEMENT FOR THE PURPOSES OF THE ‘SAFE HARBOR' PROVISIONS OF THE PRIVATE SECURITIES LITIGATION REFORM ACT OF 1995," beginning on page 70.
Items 1 and 2. BUSINESS AND PROPERTIES
CORPORATE STRUCTURE
ConocoPhillips is the world's largest independent exploration and production (E&P) company, based on proved reserves and production of liquids and natural gas. ConocoPhillips was incorporated in the state of Delaware on November 16, 2001, in connection with, and in anticipation of, the merger between Conoco Inc. and Phillips Petroleum Company. The merger between Conoco and Phillips was consummated on August 30, 2002.
In April 2012, ConocoPhillips completed the separation of the downstream business into an independent, publicly traded energy company, Phillips 66.
Headquartered in Houston, Texas, we have operations and activities in 17 countries. Our diverse portfolio includes resource-rich North American tight oil and oil sands assets; lower-risk conventional assets in North America, Europe, Asia and Australia; several liquefied natural gas (LNG) developments; and an inventory of global conventional and unconventional exploration prospects.
At December 31, 2017, ConocoPhillips employed approximately 11,400 people worldwide.
We operate in a commodity-price driven industry, subject to volatility. In line with this view, we set our operating plan for 2017, defining our cash allocation priorities which would be reinforced and partly funded by sales of noncore assets during the year. In November 2016, we announced our plan to generate $5 billion to $8 billon of proceeds over two years by optimizing our portfolio to focus on value-preserving, low cost-of-supply projects that strategically fit our development plans. In 2017, our total consideration from asset dispositions was approximately $16 billion. We disposed of assets including our 50 percent nonoperated interest in the Foster Creek Christina Lake (FCCL) Partnership, as well as the majority of our western Canada gas assets, and our interest in the San Juan Basin gas asset. Proceeds from dispositions were directed towards our cash allocation priorities and for general corporate purposes. For additional information on our cash allocation priorities and our asset sales, see the Business Environment and Executive Overview section within Management's Discussion and Analysis and Note 4-Assets Held for Sale, Sold or Acquired, in the Notes to Consolidated Financial Statements, respectively.
1
SEGMENT AND GEOGRAPHIC INFORMATION
For operating segment and geographic information, see Note 23-Segment Disclosures and Related Information, in the Notes to Consolidated Financial Statements, which is incorporated herein by reference.
We explore for, produce, transport and market crude oil, bitumen, natural gas, LNG and natural gas liquids on a worldwide basis. At December 31, 2017, our operations were producing in the United States, Norway, the United Kingdom, Canada, Australia, Timor-Leste, Indonesia, China, Malaysia, Qatar and Libya.
The information listed below appears in the "Oil and Gas Operations" disclosures following the Notes to Consolidated Financial Statements and is incorporated herein by reference:
| • | Proved worldwide crude oil, natural gas liquids, natural gas and bitumen reserves. |
| • | Net production of crude oil, natural gas liquids, natural gas and bitumen. |
| • | Average sales prices of crude oil, natural gas liquids, natural gas and bitumen. |
| • | Average production costs per barrel of oil equivalent (BOE). |
| • | Net wells completed, wells in progress and productive wells. |
| • | Developed and undeveloped acreage. |
The following table is a summary of the proved reserves information included in the "Oil and Gas Operations" disclosures following the Notes to Consolidated Financial Statements. Approximately 77 percent of our proved reserves are located in politically stable countries that belong to the Organization for Economic Cooperation and Development. Natural gas reserves are converted to BOE based on a 6:1 ratio: six thousand cubic feet (MCF) of natural gas converts to one BOE. See Management's Discussion and Analysis of Financial Condition and Results of Operations for a discussion of factors that will enhance the understanding of the following summary reserves table.
| Millions of Barrels of Oil Equivalent | ||||||||||||
Net Proved Reserves at December 31 | 2017 | 2016 | 2015 | |||||||||
|
| |||||||||||
Crude oil | ||||||||||||
Consolidated operations | 2,322 | 2,047 | 2,270 | |||||||||
Equity affiliates | 83 | 88 | 93 | |||||||||
| ||||||||||||
Total Crude Oil | 2,405 | 2,135 | 2,363 | |||||||||
| ||||||||||||
Natural gas liquids | ||||||||||||
Consolidated operations | 354 | 457 | 508 | |||||||||
Equity affiliates | 45 | 47 | 50 | |||||||||
| ||||||||||||
Total Natural Gas Liquids | 399 | 504 | 558 | |||||||||
| ||||||||||||
Natural gas | ||||||||||||
Consolidated operations | 1,267 | 1,807 | 1,988 | |||||||||
Equity affiliates | 717 | 730 | 878 | |||||||||
| ||||||||||||
Total Natural Gas | 1,984 | 2,537 | 2,866 | |||||||||
| ||||||||||||
Bitumen | ||||||||||||
Consolidated operations | 250 | 159 | 687 | |||||||||
Equity affiliates | - | 1,089 | 1,706 | |||||||||
| ||||||||||||
Total Bitumen | 250 | 1,248 | 2,393 | |||||||||
| ||||||||||||
Total consolidated operations | 4,193 | 4,470 | 5,453 | |||||||||
Total equity affiliates | 845 | 1,954 | 2,727 | |||||||||
| ||||||||||||
Total company | 5,038 | 6,424 | 8,180 | |||||||||
| ||||||||||||
2
Total production, including Libya, of 1,377 thousand barrels of oil equivalent per day (MBOED) decreased 12 percent in 2017 compared with 2016. The decrease in total average production primarily resulted from noncore asset dispositions, including our Canada and San Juan transactions in 2017 and the sale of our interest in the Block B production sharing contract (PSC) in Indonesia in 2016, and normal field decline. The decrease in production was partly offset by production from major developments, including tight oil plays in the Lower 48; Malikai and the Kebabangan gas field in Malaysia; Surmont in Canada; and APLNG in Australia. Improved drilling and well performance in Alaska, Norway and China also partly offset the decrease in production. Excluding Libya, our 2017 production was 1,356 MBOED. Adjusted for the impact of closed and planned dispositions of 191 MBOED in 2017 and 434 MBOED in 2016 and Libya, underlying production increased 32 MBOED, or 3 percent, compared with 2016.
Our worldwide annual average realized price was $39.19 per BOE in 2017, an increase of 38 percent compared with $28.35 per BOE in 2016, reflecting higher average realized prices across all commodities. Our worldwide annual average crude oil price increased 27 percent in 2017, from $40.86 per barrel in 2016 to $51.96 per barrel in 2017. Additionally, our worldwide annual average natural gas liquids prices increased 51 percent, from $16.68 per barrel in 2016 to $25.22 per barrel in 2017. Our worldwide annual average natural gas price increased 36 percent, from $3.00 per MCF in 2016 to $4.07 per MCF in 2017. Average annual bitumen prices also increased 48 percent, from $15.27 per barrel in 2016 to $22.66 per barrel in 2017.
ALASKA
The Alaska segment primarily explores for, produces, transports and markets crude oil, natural gas and natural gas liquids. We are the largest crude oil producer in Alaska and have major ownership interests in two of North America's largest oil fields located on Alaska's North Slope: Prudhoe Bay and Kuparuk. We also have a significant operating interest in the Alpine Field, located on the Western North Slope. Additionally, we are one of Alaska's largest owners of state, federal and fee exploration leases, with approximately 1 million net undeveloped acres at year-end 2017. Alaska operations contributed 22 percent of our worldwide liquids production and less than 1 percent of our natural gas production.
| 2017 | ||||||||||||||||||||
| Interest | Operator | Liquids MBD | * | Natural Gas MMCFD | ** | Total MBOED | ||||||||||||||
|
|
|
|
|
| |||||||||||||||
Average Daily Net Production | ||||||||||||||||||||
Greater Prudhoe Area | 36.1 | % | BP | 88 | 5 | 89 | ||||||||||||||
Greater Kuparuk Area | 52.2–55.5 | ConocoPhillips | 53 | 1 | 53 | |||||||||||||||
Western North Slope | 78.0 | ConocoPhillips | 40 | 1 | 40 | |||||||||||||||
| ||||||||||||||||||||
Total Alaska | 181 | 7 | 182 | |||||||||||||||||
| ||||||||||||||||||||
*Thousands of barrels per day.
**Millions of cubic feet per day.
Greater Prudhoe Area
The Greater Prudhoe Area includes the Prudhoe Bay Field and five satellite fields, as well as the Greater Point McIntyre Area fields. Prudhoe Bay, the largest oil field on Alaska's North Slope, is the site of a large waterflood and enhanced oil recovery operation, as well as a gas plant which processes natural gas to recover natural gas liquids before reinjection into the reservoir. Prudhoe Bay's satellites are Aurora, Borealis, Polaris, Midnight Sun and Orion, while the Point McIntyre, Niakuk, Raven, Lisburne and North Prudhoe Bay State fields are part of the Greater Point McIntyre Area.
3
Greater Kuparuk Area
We operate the Greater Kuparuk Area, which consists of the Kuparuk Field and four satellite fields: Tarn, Tabasco, Meltwater and West Sak. Kuparuk is located 40 miles west of Prudhoe Bay. Field installations include three central production facilities which separate oil, natural gas and water, as well as a separate seawater treatment plant. Development drilling at Kuparuk consists of rotary-drilled wells and horizontal multi-laterals from existing well bores utilizing coiled-tubing drilling.
Drill Site 2S, in the southwestern area of the Kuparuk Field, was sanctioned in October 2014. First oil was achieved in October 2015, and completion of the first phase of the project was achieved in 2016.
The 1H Northeast West Sak (NEWS) oil development targeting the West Sak reservoir in the Kuparuk River Unit, was sanctioned in March 2015. First production was achieved in the fourth quarter of 2017.
Western North Slope
On the Western North Slope, we operate the Colville River Unit, which includes the Alpine Field and three satellite fields: Nanuq, Fiord and Qannik. Alpine is located 34 miles west of Kuparuk. In 2015, first oil was achieved at Alpine West CD5, a new drill site which extends the Alpine reservoir west into the National Petroleum Reserve-Alaska (NPR-A). During the year, we continued drilling additional wells using the available well slots on the pad.
The Greater Mooses Tooth Unit, the first unit established entirely within the NPR-A, was formed in 2008. In 2017, we began construction in the unit, which is currently planned to have two drill sites; Greater Mooses Tooth #1 and #2, with expected first oil in 2018 and 2021, respectively.
Cook Inlet Area
In January 2018, we sold our interest in the Kenai LNG Facility in the Cook Inlet Area. The facility, which consisted of a 1.6 million-tons-per-year capacity plant, as well as docking and loading facilities for LNG tankers, had no LNG export program in 2017 due to market conditions.
Point Thomson
In the first quarter of 2017, we recorded an asset impairment and assigned our 4.9 percent interest in the Point Thomson unit, located approximately 60 miles east of Prudhoe Bay, to the other owners of the field.
Alaska North Slope Gas
In 2016, we, along with affiliates of Exxon Mobil Corporation, BP p.l.c. and Alaska Gasline Development Corporation (AGDC), a state-owned corporation (collectively, the "AKLNG co-venturers"), completed preliminary front-end engineering and design (pre-FEED) technical work for a potential LNG project which would liquefy and export natural gas from Alaska's North Slope and deliver it to market. In September 2016, we, along with the affiliates of ExxonMobil and BP, indicated our intention not to progress into the next phase of the project due to changes in the economic environment. AGDC is continuing to progress the project and has recently signed several Memorandums of Understanding with various potential LNG buyers in Asia. We remain supportive of AGDC's efforts to advance the project and intend to make our equity gas available for sale to the project at mutually agreed, commercially reasonable terms.
Exploration
Appraisal of the Willow Discovery, located in the northeast portion of the National Petroleum Reserve-Alaska, continued throughout 2017 with the acquisition of 3-D seismic which is currently being processed. In 2018, we will continue appraisal of the discovery with drilling of additional wells. Further exploration of other state and federal leases is planned in 2018.
We were successful in state and federal lease sales in the North Slope in the fourth quarter of 2017, where we were the high bidder on 13 tracts for a total of approximately 78,000 net acres.
4
Acquisition
In January 2018, we entered into an agreement to acquire certain oil and gas assets in Alaska. The acquisition is subject to regulatory approval. We will have a 100 percent interest in approximately 1.2 million acres of exploration and development lands, including the Willow Discovery. For additional information, see Note 4-Assets Held for Sale, Sold or Acquired, in the Notes to Consolidated Financial Statements.
Transportation
We transport the petroleum liquids produced on the North Slope to south central Alaska through an 800-mile pipeline that is part of Trans-Alaska Pipeline System (TAPS). We have a 29.1 percent ownership interest in TAPS, and we also have ownership interests in the Alpine, Kuparuk and Oliktok pipelines on the North Slope.
Our wholly owned subsidiary, Polar Tankers, Inc., manages the marine transportation of our North Slope production, using five company-owned, double-hulled tankers, and charters third-party vessels as necessary. The tankers deliver oil from Valdez, Alaska, primarily to refineries on the west coast of the United States.
LOWER 48
The Lower 48 segment consists of operations located in the U.S. Lower 48 states and the Gulf of Mexico. The Lower 48 business is organized within three regions covering the Gulf Coast, Mid-Continent and Rockies. As a result of tight oil opportunities, we have directed our investments toward certain shorter cycle time, low cost-of-supply plays. We disposed of several noncore assets within the Lower 48 in 2017, including our interests in the San Juan Basin and the Panhandle. We hold 10.4 million net onshore and offshore acres in the Lower 48. In 2017, the Lower 48 contributed 30 percent of our worldwide liquids production and 27 percent of our natural gas production.
| 2017 | ||||||||||||||||||||
| Interest | Operator | Liquids MBD | Natural Gas MMCFD | Total MBOED | ||||||||||||||||
|
|
|
|
|
| |||||||||||||||
Average Daily Net Production | ||||||||||||||||||||
Eagle Ford | Various | % | Various | 107 | 155 | 133 | ||||||||||||||
Gulf of Mexico | Various | Various | 15 | 13 | 17 | |||||||||||||||
Gulf Coast-Other | Various | Various | 5 | 11 | 7 | |||||||||||||||
| ||||||||||||||||||||
Total Gulf Coast | 127 | 179 | 157 | |||||||||||||||||
| ||||||||||||||||||||
Permian | Various | Various | 41 | 132 | 63 | |||||||||||||||
Barnett | Various | Various | 4 | 34 | 10 | |||||||||||||||
Anadarko Basin | Various | Various | 4 | 91 | 19 | |||||||||||||||
| ||||||||||||||||||||
Total Mid-Continent | 49 | 257 | 92 | |||||||||||||||||
| ||||||||||||||||||||
Bakken | Various | Various | 56 | 56 | 65 | |||||||||||||||
Wyoming/Uinta | Various | Various | - | 84 | 14 | |||||||||||||||
Niobrara | Various | Various | 2 | 3 | 3 | |||||||||||||||
San Juan | Various | Various | 15 | 319 | 68 | |||||||||||||||
| ||||||||||||||||||||
Total Rockies | 73 | 462 | 150 | |||||||||||||||||
| ||||||||||||||||||||
Total U.S. Lower 48 | 249 | 898 | 399 | |||||||||||||||||
| ||||||||||||||||||||
Onshore
We hold 10.4 million net acres of onshore conventional and unconventional acreage in the Lower 48, the majority of which is either held by production or owned by the company. Our unconventional holdings total approximately 1.8 million net acres in the following areas:
| • | 630,000 net acres in the Bakken, located in North Dakota and eastern Montana. |
| • | 210,000 net acres in the Eagle Ford, located in South Texas. |
| • | 134,000 net acres in the Permian, located in West Texas and southeastern New Mexico. |
5
| • | 98,000 net acres in the Niobrara, located in northeastern Colorado. |
| • | 66,000 net acres in the Barnett, located in north central Texas. |
| • | 639,000 net acres in other unconventional exploration plays. |
The majority of our 2017 onshore production originated from the Eagle Ford; San Juan, which we disposed of during the year; Bakken; and Permian. Onshore activities in 2017 were centered mostly on continued development of assets, with an emphasis on areas with low cost of supply, particularly in growing unconventional plays. The 2017 drilling activity levels increased relative to 2016 due to higher capital spending. Our major focus areas in 2017 included the following:
| • | Eagle Ford-The Eagle Ford continued full-field development in 2017. We operated six rigs on average in 2017, resulting in 133 operated wells drilled and 94 operated wells brought online. Production decreased 17 percent in 2017 compared with 2016, and reached a net peak of 164 MBOED, compared with 176 MBOED in 2016. |
| • | Bakken-We operated four rigs throughout the year in the Bakken. We continued our pad drilling with 87 operated wells drilled during the year and 64 operated wells brought online. We achieved net peak production of 75 MBOED in 2017, compared with 72 MBOED in 2016. |
| • | Permian Basin-The Permian Basin is an area where we are leveraging our conventional legacy position by utilizing new technology to improve the ultimate recovery and value from these fields. This technology should also identify new, unconventional plays across the region. We hold approximately 1 million net acres in the Permian, which includes 134,000 net unconventional acres. The Permian Basin produced 63 MBOED in 2017, staying essentially flat with 2016, including 19 MBOED of unconventional production. |
We completed the sale of our interests in the San Juan Basin on July 31, 2017, and Panhandle assets on September 29, 2017. Production from the assets sold was 74 MBOED, approximately 19 percent of total Lower 48 segment production in 2017. For additional information on our asset dispositions, see Note 4-Assets Held for Sale, Sold or Acquired, in the Notes to Consolidated Financial Statements.
Gulf of Mexico
At year-end 2017, our portfolio of producing properties in the Gulf of Mexico primarily consisted of one operated field and three fields operated by co-venturers, totaling approximately 68,000 net acres, including:
| • | 75 percent operated working interest in the Magnolia Field in Garden Banks Blocks 783 and 784. |
| • | 15.9 percent nonoperated working interest in the unitized Ursa Field located in the Mississippi Canyon Area. |
| • | 15.9 percent nonoperated working interest in the Princess Field, a northern subsalt extension of the Ursa Field. |
| • | 12.4 percent nonoperated working interest in the unitized K2 Field, comprised of seven blocks in the Green Canyon Area. |
Exploration
| • | Conventional Exploration |
At December 31, 2017, we held approximately 5,000 net acres in the deepwater Gulf of Mexico.
Our 30 percent nonoperated working interest in the Shenandoah discovery was announced in 2009. In early 2017, the sixth Shenandoah well, Shenandoah WR52-3, reached total depth and was followed by the drilling of a sidetrack well from Shenandoah WR52-3. Following the suspension of appraisal activity by the operator during the year, we recorded dry hole and leasehold impairment expense for the entire development. On December 19, 2017, we elected to withdraw from the Shenandoah leases. The withdrawal was effective February 17, 2018.
6
| • | Unconventional Exploration |
Our onshore focus areas include the Niobrara in the Denver-Julesburg Basin and the Permian in the Delaware Basin, as well as several emerging plays. We continue to assess and appraise these and other unconventional opportunities. In 2016 and 2017, we drilled a total of five operated unconventional wells in the Powder River Basin, four of which were expensed as dry holes in November 2017. The fifth Powder River Basin well was expensed as a dry hole in January 2018.
Facilities
Golden Pass LNG Terminal
We have a 12.4 percent ownership interest in the Golden Pass LNG Terminal and affiliated Golden Pass Pipeline, with a combined net book value of approximately $247 million at December 31, 2017. It is located adjacent to the Sabine-Neches Industrial Ship Channel northwest of Sabine Pass, Texas. The terminal became commercially operational in May 2011. We hold terminal and pipeline capacity for the receipt, storage and regasification of the LNG purchased from Qatar Liquefied Gas Company Limited (3) (QG3) and the transportation of regasified LNG to interconnect with major interstate natural gas pipelines. Utilization of the terminal has been and is expected to be limited, as market conditions currently favor the flow of LNG to European and Asian markets. As a result, we are evaluating opportunities to optimize the value of the terminal facilities.
Other
| • | Lost Cabin Gas Plant-We operate and own a 46 percent interest in the Lost Cabin Gas Plant, a 246 million cubic-feet-per-day capacity natural gas processing facility in Lysite, Wyoming. |
| • | Helena Condensate Processing Facility-We operate and own the Helena Condensate Processing Facility, a 110,000 barrel-per-day condensate processing plant located in Kenedy, Texas. |
| • | Sugarloaf Condensate Processing Facility-We operate and own an 87.5 percent interest in the Sugarloaf Condensate Processing Facility, a 30,000 barrel-per-day condensate processing plant located near Pawnee, Texas. |
| • | Bordovsky Condensate Processing Facility-We operate and own the Bordovsky Condensate Processing Facility, a 15,000 barrel-per-day condensate processing plant located in Kenedy, Texas. |
CANADA
Our Canadian operations mainly consist of an oil sands development in the Athabasca Region of northeastern Alberta and a liquids-rich unconventional play in western Canada. In 2017, operations in Canada contributed 16 percent of our worldwide liquids production and 6 percent of our natural gas production.
| 2017 | ||||||||||||||||||||||||
| Interest | Operator | Liquids MBD | Natural Gas MMCFD | Bitumen MBD | Total MBOED | |||||||||||||||||||
|
|
|
|
|
| |||||||||||||||||||
Average Daily Net Production | ||||||||||||||||||||||||
Western Canada | Various | % | Various | 12 | 187 | - | 43 | |||||||||||||||||
Surmont | 50.0 | ConocoPhillips | - | - | 59 | 59 | ||||||||||||||||||
Foster Creek | 50.0 | Cenovus | - | - | 26 | 26 | ||||||||||||||||||
Christina Lake | 50.0 | Cenovus | - | - | 37 | 37 | ||||||||||||||||||
| ||||||||||||||||||||||||
Total Canada | 12 | 187 | 122 | 165 | ||||||||||||||||||||
| ||||||||||||||||||||||||
7
On May 17, 2017, we completed the sale of our 50 percent nonoperated interest in the FCCL Partnership, as well as the majority of our western Canada gas assets to Cenovus Energy. Production from the assets sold was 103 MBOED, approximately 62 percent of the total Canada segment production in 2017. For additional information on our asset dispositions, see Note 4-Assets Held for Sale, Sold or Acquired, in the Notes to Consolidated Financial Statements.
Oil Sands
Our bitumen resources in Canada are produced via an enhanced thermal oil recovery method called steam-assisted gravity drainage (SAGD), whereby steam is injected into the reservoir, effectively liquefying the heavy bitumen, which is recovered and pumped to the surface for further processing. We hold approximately 0.6 million net acres of land in the Athabasca Region of northeastern Alberta.
Surmont-The Surmont oil sands leases are located approximately 35 miles south of Fort McMurray, Alberta. Surmont is a 50/50 joint venture with Total S.A. The second phase of the Surmont project achieved first production in 2015, and production continued to ramp up in 2017.
Exploration
We hold exploration acreage in three areas of Canada: onshore western Canada, the Mackenzie Delta/Beaufort Sea Region and the Arctic Islands. Our primary exploration focus is on unconventional plays in western Canada.
| • | Unconventional Exploration |
We hold approximately 0.1 million net acres in the emerging Montney play in northeast British Columbia and 0.2 million net acres in Canol Northwest Territories. Our Montney activity in 2017 included completing two and bringing onstream six appraisal wells and acquiring approximately 27,000 additional net acres. Late appraisal drilling activity will continue in 2018 to further explore the area's resource potential.
| • | Conventional Exploration |
Surrender of Interest documents for our 30 percent nonoperated working interest in six exploration licenses in the Shelburne Basin, offshore Nova Scotia, were submitted on December 15, 2017, to initiate the exit process, following previously announced results of the two-well exploration drilling campaign at Cheshire and Monterey Jack.
EUROPE AND NORTH AFRICA
The Europe and North Africa segment consists of operations and exploration activities in Norway, the United Kingdom and Libya. In 2017, operations in Europe and North Africa contributed 18 percent of our worldwide liquids production and 15 percent of natural gas production.
Norway
2017 | ||||||||||||
| Interest | Operator | Liquids MBD | Natural Gas MMCFD | Total MBOED | ||||||||
|
|
|
| |||||||||
Average Daily Net Production | ||||||||||||
Greater Ekofisk Area | 35.1 | % | ConocoPhillips | 57 | 50 | 65 | ||||||
Alvheim | 20.0 | Aker BP | 15 | 13 | 17 | |||||||
Heidrun | 24.0 | Statoil | 13 | 30 | 18 | |||||||
Other | Various | Statoil | 16 | 107 | 34 | |||||||
| ||||||||||||
Total Norway | 101 | 200 | 134 | |||||||||
| ||||||||||||
8
The Greater Ekofisk Area is located approximately 200 miles offshore Stavanger, Norway, in the North Sea, and comprises three producing fields: Ekofisk, Eldfisk and Embla. Crude oil is exported to Teesside, England, and the natural gas is exported to Emden, Germany. The Ekofisk and Eldfisk fields consist of several production platforms and facilities, including the Ekofisk South and Eldfisk II developments which achieved first production in 2013 and 2015, respectively. Continued development drilling in the Greater Ekofisk Area will contribute additional production over the coming years, as additional wells come online.
The Alvheim Field is located in the northern part of the North Sea near the border with the U.K. sector, and consists of a floating production, storage and offloading (FPSO) vessel and subsea installations. Produced crude oil is exported via shuttle tankers, and natural gas is transported to the Scottish Area Gas Evacuation (SAGE) terminal at St. Fergus, Scotland, through the SAGE pipeline.
The Heidrun Field is located in the Norwegian Sea. Produced crude oil is stored in a floating storage unit and exported via shuttle tankers. Part of the natural gas is currently injected into the reservoir for optimization of crude oil production, some gas is transported to Europe via gas processing terminals in Norway, while the remainder is transported for use as feedstock in a methanol plant in Norway, in which we own an 18 percent interest.
We also have varying ownership interests in five other producing fields in the Norway sector of the North Sea, as well as the Aasta Hansteen development in the Norwegian Sea. The operator is planning for first gas for Aasta Hansteen by late 2018.
Exploration
In 2017, we participated in the Korpfjell Well in the Barents Sea and the Carmen Well in the Heidrun Area of Norway, both of which made gas discoveries. The Carmen Well was considered a discovery and is currently under evaluation, while the Korpfjell Well is not considered commercial. In 2017, we were awarded four new exploration licenses including the PL865, PL888, PL890 and PL891; and two acreage additions PL053C and PL782SC. Additionally, two new licenses, PL775 and PL626, were captured through farm-in.
Transportation
We own a 35.1 percent interest in the Norpipe Oil Pipeline System, a 220-mile pipeline which carries crude oil from Ekofisk to a crude oil stabilization and natural gas liquids processing facility in Teesside, England.
United Kingdom
| 2017 | ||||||||||||||||||||
| Interest | Operator | Liquids MBD | Natural Gas MMCFD | Total MBOED | ||||||||||||||||
|
|
|
|
|
| |||||||||||||||
Average Daily Net Production | ||||||||||||||||||||
Britannia | 58.7 | % | ConocoPhillips | 3 | 68 | 14 | ||||||||||||||
Britannia Satellites | 26.3–87.5 | * | ConocoPhillips | 13 | 84 | 27 | ||||||||||||||
J-Area | 32.5–36.5 | ConocoPhillips | 9 | 60 | 19 | |||||||||||||||
Southern North Sea | Various | ConocoPhillips | - | 46 | 8 | |||||||||||||||
East Irish Sea | 100.0 | Spirit Energy | - | 14 | 2 | |||||||||||||||
Other | Various | Various | 4 | 4 | 5 | |||||||||||||||
Total United Kingdom | 29 | 276 | 75 | |||||||||||||||||
| ||||||||||||||||||||
* Includes the Chevron-operated Alder Field, ConocoPhillips equity 26.3%.
Britannia is one of the largest natural gas and condensate fields in the North Sea. We assumed operatorship of Britannia in August 2015, following the acquisition of third-party equity in Britannia Operator Limited, which is now wholly owned by ConocoPhillips. Condensate is delivered through the Forties Pipeline to an oil stabilization and processing plant near the Grangemouth Refinery in Scotland, while natural gas is transported through Britannia's line to St. Fergus, Scotland. The Britannia satellite fields, Callanish, Brodgar, Enochdhu and Alder, produce via subsea manifolds and pipelines linked to the Britannia Platform.
9
The J-Area consists of the Judy/Joanne, Jade and Jasmine fields, located in the U.K. Central North Sea. The J-Area gas is processed on the Judy Platform and transported through the Central Area Transmission System Pipeline, while liquids are transported to Teesside through the Norpipe system. A J-Area development drilling campaign commenced in 2017, which is expected to provide additional volumes in the coming years as wells are brought online.
We have various ownership interests in several producing gas fields in the Rotliegendes and Carboniferous areas of the Southern North Sea. Decommissioning activity in the Southern North Sea is ongoing. Our interests in the East Irish Sea include the Millom, Dalton and Calder fields, which are operated on our behalf by a third party.
We own a 24 percent interest in the Clair Field, located in the Atlantic Margin. Clair Ridge is the second phase of development for the Clair Field and is comprised of a 36-slot drilling and production facility with a bridge-linked accommodation and utilities platform. The new facilities will tie into existing oil and gas export pipelines to the Shetland Islands. Initial production for Clair Ridge is expected in 2018.
Transportation
We operate the Teesside oil and Theddlethorpe gas terminals in which we have 29.3 percent and 50 percent ownership interests, respectively. We also have a 100 percent ownership interest in the Rivers Gas Terminal, operated by a third party.
Libya
| 2017 | ||||||||||||||||||||
|
| |||||||||||||||||||
| Interest | Operator | Liquids MBD | Natural Gas MMCFD | Total MBOED | ||||||||||||||||
|
|
|
|
|
| |||||||||||||||
Average Daily Net Production | ||||||||||||||||||||
Waha Concession | 16.3 | % | Waha Oil Co. | 20 | 8 | 21 | ||||||||||||||
| ||||||||||||||||||||
Total Libya | 20 | 8 | 21 | |||||||||||||||||
| ||||||||||||||||||||
The Waha Concession consists of multiple concessions and encompasses nearly 13 million gross acres in the Sirte Basin. Our production operations in Libya and related oil exports were interrupted in mid-2013, as a result of the shutdown of the Es Sider crude oil export terminal at the end of July 2013. The Es Sider Terminal briefly reopened in the third quarter of 2014 and production and liftings resumed temporarily; however, further disruptions occurred in December 2014, and production was shut in again. Production resumed in Libya in October 2016. In 2017, we had 17 crude liftings from Es Sider. We expect a gradual, continued ramp-up in activity.
10
ASIA PACIFIC AND MIDDLE EAST
The Asia Pacific and Middle East segment has exploration and production operations in China, Indonesia, Malaysia and Australia; producing operations in Qatar and Timor-Leste; and exploration activities in Brunei. In 2017, operations in the Asia Pacific and Middle East segment contributed 14 percent of our worldwide liquids production and 52 percent of natural gas production.
Australia and Timor Sea
| 2017 | ||||||||||||||||||||
|
| |||||||||||||||||||
| Interest | Operator | Liquids MBD | Natural Gas MMCFD | Total MBOED | ||||||||||||||||
|
|
|
|
|
| |||||||||||||||
Average Daily Net Production | ||||||||||||||||||||
Australia Pacific LNG | 37.5 | % |
| ConocoPhillips/ Origin Energy |
| - | 638 | 106 | ||||||||||||
Bayu-Undan | 56.9 | ConocoPhillips | 10 | 233 | 49 | |||||||||||||||
Athena/Perseus | 50.0 | ExxonMobil | - | 34 | 6 | |||||||||||||||
| ||||||||||||||||||||
Total Australia and Timor Sea | 10 | 905 | 161 | |||||||||||||||||
| ||||||||||||||||||||
Australia Pacific LNG
Australia Pacific LNG Pty Ltd (APLNG), our joint venture with Origin Energy Limited and China Petrochemical Corporation (Sinopec), is focused on producing coalbed methane (CBM) from the Bowen and Surat basins in Queensland, Australia, to supply the domestic gas market and convert the CBM into LNG for export. Origin operates APLNG's upstream production and pipeline system, and we operate the downstream LNG facility, located on Curtis Island near Gladstone, Queensland, as well as the LNG export sales business.
Two fully subscribed 4.5-million-metric-tonnes-per-year LNG trains have been completed. Approximately 3,900 net wells are ultimately envisioned to supply both the domestic gas market and the LNG sales contracts. The wells are supported by gathering systems, central gas processing and compression stations, water treatment facilities, and an export pipeline connecting the gas fields to the LNG facilities. The first APLNG Train 1 cargo sailed in January 2016, and LNG sales continued throughout the year. APLNG Train 2 achieved first production in the third quarter of 2016. The LNG is being sold to Sinopec under 20-year sales agreements for 7.6 million metric tonnes of LNG per year, and Japan-based Kansai Electric Power Co., Inc. under a 20-year sales agreement for approximately 1 million metric tonnes of LNG per year.
APLNG has an $8.5 billion project finance facility, which was fully drawn down and had an outstanding balance of $7.9 billion at December 31, 2017. In connection with the execution of the project financing, we provided a completion guarantee for our pro-rata share of the project finance facility until the project achieves financial completion. In October 2016, we reached financial completion for Train 1, which reduced our associated guarantee by 60 percent. In August 2017, we reached financial completion for Train 2, which removed the remaining guarantee. For additional information, see Note 2-Variable Interest Entities (VIEs), Note 5-Investments, Loans and Long-Term Receivables, and Note 11-Guarantees, in the Notes to Consolidated Financial Statements.
Bayu-Undan
The Bayu-Undan gas condensate field is located in the Timor Sea Joint Petroleum Development Area between Timor-Leste and Australia. We also operate and own a 56.9 percent interest in the associated Darwin LNG Facility, located at Wickham Point, Darwin.
The Bayu-Undan natural gas recycle facility processes wet gas; separates, stores and offloads condensate, propane and butane; and re-injects dry gas back into the reservoir. In addition, a 310-mile natural gas pipeline connects the facility to the 3.5-million-metric-tonnes-per-year capacity Darwin LNG Facility. Produced natural gas is piped to the Darwin LNG Plant, where it is converted into LNG before being transported to international markets. In 2017, we sold 150 billion gross cubic feet of LNG primarily to utility customers in Japan.
11
A continuation of the Bayu-Undan Phase Three Development has been sanctioned with internal, joint venture and regulatory approval in March 2017. The project premise consists of one subsea and two platform wells, with drilling to commence in April 2018. Production is expected to commence in the third quarter of 2018.
Athena/Perseus
The Athena production license (WA-17-L) is located offshore Western Australia and contains part of the Perseus Field, which straddles the boundary with WA-1-L, an adjoining license area. Natural gas is produced from these licenses, which are due to expire in 2019.
Greater Sunrise
We have a 30 percent interest in the Greater Sunrise natural gas and condensate field located in the Timor Sea. Timor-Leste and Australia through engagement in a conciliation process under the United Nations Convention on the Law of the Sea have reached agreement on the central elements of a maritime boundary delimitation between them in the Timor Sea. The Governments' agreement, to be formalized in a new treaty, constitutes a package that addresses boundaries, the legal status of the Greater Sunrise gas field, the establishment of a Special Regime for Greater Sunrise, a pathway to development of the resource and the sharing of resulting revenue. Discussions are ongoing between the two Governments and the Sunrise co-venturers with respect to the development concept for Greater Sunrise. Until the Governments and the Sunrise co-venturers are aligned on a development concept, activities are currently restricted to compliance and social investment, maintaining relationships and continued engagement with the Governments for a future development option.
Exploration
| • | Conventional Exploration |
We operate three exploration permits in the Browse Basin, offshore northwest Australia, in which we own a 40 percent interest in permits WA-315-P, WA-398-P and TP 28, of the Greater Poseidon Area. The TP 28 Western Australia State exploration permit was granted for five years from January 2017, with a 40 percent working interest and was excised from the existing permits as agreed between state and federal regulators. Phase I of the Browse Basin drilling campaign in 2009/2010 resulted in three discoveries in the Greater Poseidon Area: Poseidon-1, Poseidon-2 and Kronos-1. Phase II of the drilling campaign resulted in five additional discoveries: Boreas-1, Zephyros-1, Proteus-1 SD2, Poseidon-North-1 and Pharos-1. All wells have been completed, plugged and abandoned.
We operate two retention leases in the Bonaparte Basin, offshore northern Australia, where we own a 37.5 percent interest in leases NT/RL5 and NT/RL6, containing the Barossa and Caldita discoveries. A 3-D seismic survey was completed over the Barossa and Caldita fields in 2016. The drilling of the Barossa-5 and Barossa-6 appraisal wells was completed in 2017 with good quality, gas-bearing reservoir intersected at both. Additionally, the retention lease over the Barossa Discovery was renewed during the year.
Indonesia
| 2017 | ||||||||||||||||||||
|
| |||||||||||||||||||
| Interest | Operator | Liquids MBD | Natural Gas MMCFD | Total MBOED | ||||||||||||||||
|
|
|
|
|
| |||||||||||||||
Average Daily Net Production | ||||||||||||||||||||
South Sumatra | 45.0–54.0 | % | ConocoPhillips | 2 | 308 | 53 | ||||||||||||||
| ||||||||||||||||||||
Total Indonesia | 2 | 308 | 53 | |||||||||||||||||
| ||||||||||||||||||||
12
We operate three PSCs in Indonesia: The Corridor Block and South Jambi "B," both located in South Sumatra, and Kualakurun in Central Kalimantan. Currently there is production from the Corridor Block.
South Sumatra
The Corridor PSC consists of five oil fields and seven natural gas fields in various stages of development. Natural gas is supplied from the Grissik and Suban gas processing plants to the Duri steamflood in central Sumatra and to markets in Singapore, Batam and West Java. Production from the South Jambi "B" PSC has reached depletion and field development has been suspended.
Exploration
We have a 60 percent working interest in the Kualakurun PSC, located in Central Kalimantan, which was signed in May 2015. This block has an area of approximately 2 million gross acres. During 2017, we acquired 2-D seismic data in the area.
Transportation
We are a 35 percent owner of a consortium company that has a 40 percent ownership in PT Transportasi Gas Indonesia, which owns and operates the Grissik to Duri and Grissik to Singapore natural gas pipelines.
China
| 2017 | ||||||||||||||||||||
|
| |||||||||||||||||||
| Interest | Operator | Liquids MBD | Natural Gas MMCFD | Total MBOED | ||||||||||||||||
|
|
|
|
|
| |||||||||||||||
Average Daily Net Production | ||||||||||||||||||||
Penglai | 49.0 | % | CNOOC | 30 | - | 30 | ||||||||||||||
Panyu | 24.5 | CNOOC | 8 | - | 8 | |||||||||||||||
| ||||||||||||||||||||
Total China | 38 | - | 38 | |||||||||||||||||
| ||||||||||||||||||||
The Penglai 19-3, 19-9 and 25-6 fields are located in Bohai Bay Block 11/05. Production from the Phase 1 development of the Penglai 19-3 Field began in 2002. Phase 2 included six additional wellhead platforms and an FPSO vessel, and was fully operational by 2009.
As part of further development of the Penglai 19-9 Field, a new wellhead platform, which adds up to 62 wells, is progressing according to schedule, with 19 wells completed and brought online through December 2017.
We sanctioned the Penglai 19-3/19-9 Phase 3 Project in December 2015. This project will consist of three new wellhead platforms and a central processing platform. First oil from Phase 3 is expected in 2018.
The Panyu development, located in Block 15/34 in the South China Sea, is comprised of three oil fields: Panyu 4-2, Panyu 5-1 and Panyu 11-6. The production period for Panyu 4-2 and 5-1 will expire in 2018, and the production period for Panyu 11-6 will expire in 2022.
Exploration
In 2017, we participated in a successful appraisal well in the Penglai Field, which will support future development plans. In late 2017, we began a full-field 3-D seismic program at Penglai, covering Phase 3 and other future development opportunities. The program is expected to continue in 2018.
13
Malaysia
| 2017 | ||||||||||||||||||||
|
| |||||||||||||||||||
| Interest | Operator |
| Liquids MBD |
|
| Natural Gas MMCFD |
|
| Total MBOED |
| ||||||||||
|
|
|
|
|
| |||||||||||||||
Average Daily Net Production | ||||||||||||||||||||
Siakap North-Petai | 21.0 | % | Murphy | 3 | 1 | 3 | ||||||||||||||
Gumusut | 29.0 | Shell | 29 | - | 29 | |||||||||||||||
KBB | 30.0 | KPOC | 3 | 111 | 22 | |||||||||||||||
Malikai | 35.0 | Shell | 12 | - | 12 | |||||||||||||||
| ||||||||||||||||||||
Total Malaysia | 47 | 112 | 66 | |||||||||||||||||
| ||||||||||||||||||||
We own interests in six PSCs in Malaysia. Three are located off the eastern Malaysian state of Sabah: Block G, Block J and the Kebabangan Cluster (KBBC). Three other blocks, Deepwater Block 3E, Block SK313 and Block WL4-00 are located off the eastern Malaysian state of Sarawak.
Block G
We have a 21 percent interest in the unitized Siakap North-Petai oil field, which began producing in the first quarter of 2014.
First production from the Malikai oil field was achieved in December 2016, with estimated net annual peak production of 21 MBOED expected in 2018. We own a 35 percent interest in Malikai. The Limbayong-2 appraisal well was drilled in 2013 and resulted in an oil discovery. The well was expensed in 2017.
Block J
First production from the Gumusut Field occurred from an early production system in 2012. Production from a permanent, semi-submersible floating production vessel was achieved in October 2014. Our ownership in the Gumusut Field is currently at 29 percent following the finalization of the unitization with Brunei and a redetermination of the Block J and Block K Malaysia Unit, both in 2017. Gumusut Phase 2 infill drilling is planned to start in 2018.
KBBC
We own a 30 percent interest in the KBBC PSC. Development of the KBB gas field commenced in 2011, and first production was achieved in November 2014. Development options for the Kamunsu East gas field are being evaluated.
Exploration
We own a 50 percent operated interest in Deepwater Block 3E, which encompasses approximately 480,000 gross acres offshore Sarawak. Seismic processing was completed in 2015. The Langsat-1 exploration well was drilled and expensed as a dry hole in 2017.
In the fourth quarter of 2016, we entered into a farm-in agreement to acquire a 50 percent interest in Block SK 313, a 1.4 million gross-acre exploration block, effective January 2017. Following completion of the Sadok-1 exploration well in January 2017, we assumed operatorship of the block from PETRONAS.
We were awarded Block WL4-00, which encompasses approximately 629,000 gross acres, in January 2017. We have a 50 percent operated interest in this block which includes the Salam-1 oil discovery.
We completed a 3-D seismic survey in Block SK 313 and Block WL4-00 in 2017. Further exploration drilling is expected to occur in 2018.
14
Brunei
Exploration
We have a 6.25 percent working interest in the deepwater Block CA-2 PSC. Exploration has been ongoing since September 2011, with natural gas discovered at the Kelidang NE-1 and Keratau-1 wells in 2013 and at the Keratau SW-1 Well in 2015. Evaluation of the results is ongoing.
Qatar
| 2017 | ||||||||||||||||||||
|
| |||||||||||||||||||
| Interest | Operator | Liquids MBD | Natural Gas MMCFD | Total MBOED | ||||||||||||||||
|
|
|
|
|
| |||||||||||||||
Average Daily Net Production | ||||||||||||||||||||
| Qatargas Operating | ||||||||||||||||||||
QG3 | 30.0 | % | Company Limited | 21 | 369 | 83 | ||||||||||||||
| ||||||||||||||||||||
Total Qatar | 21 | 369 | 83 | |||||||||||||||||
| ||||||||||||||||||||
QG3 is an integrated development jointly owned by Qatar Petroleum (68.5 percent), ConocoPhillips (30 percent) and Mitsui & Co., Ltd. (1.5 percent). QG3 consists of upstream natural gas production facilities, which produce approximately 1.4 billion gross cubic feet per day of natural gas from Qatar's North Field over a 25-year life, in addition to a 7.8 million gross tonnes-per-year LNG facility. LNG is shipped in leased LNG carriers destined for sale globally.
QG3 executed the development of the onshore and offshore assets as a single integrated development with Qatargas 4 (QG4), a joint venture between Qatar Petroleum and Royal Dutch Shell plc. This included the joint development of offshore facilities situated in a common offshore block in the North Field, as well as the construction of two identical LNG process trains and associated gas treating facilities for both the QG3 and QG4 joint ventures. Production from the LNG trains and associated facilities is combined and shared.
OTHER INTERNATIONAL
The Other International segment includes exploration activities in Colombia and Chile.
Colombia
Unconventional Exploration
We have an 80 percent operated interest in the Middle Magdalena Basin Block VMM-3. The block extends over approximately 67,000 net acres and contains the Picoplata-1 well, which completed drilling in 2015 and testing in 2017. Socialization and environmental permitting activities are expected to continue throughout 2018.
In July 2017, ConocoPhillips Colombia Ventures Ltd. and Canacol Energy Colombia S.A. executed an Additional Contract for the exploration and exploitation of unconventional reservoirs in an area identified as the VMM-2 Block. As a result, ConocoPhillips Colombia Ventures Ltd. and Canacol Energy Colombia S.A. also executed a joint operating agreement. We have an 80 percent operated working interest in the block which extends over approximately 58,000 net acres and is contiguous to the VMM-3 Block.
In 2017, we relinquished our 70 percent nonoperated interests in the deep rights in the Santa Isabel Block and terminated the exploration and production contract for the VMM27 Block, both in the Middle Magdalena Basin.
15
Chile
Exploration
We have a 49 percent interest in the Coiron Block located in the Magallanes Basin in southern Chile. In December 2017, two wells drilled in 2016, were expensed as dry holes.
Venezuela and Ecuador
For discussion of our contingencies in Venezuela and Ecuador, see Note 12-Contingencies and Commitments, in the Notes to Consolidated Financial Statements.
OTHER
Marketing Activities
Our Commercial organization manages our worldwide commodity portfolio, which mainly includes natural gas, crude oil, bitumen, natural gas liquids and LNG. Marketing activities are performed through offices in the United States, Canada, Europe and Asia. In marketing our production, we attempt to minimize flow disruptions, maximize realized prices and manage credit-risk exposure. Commodity sales are generally made at prevailing market prices at the time of sale. We also purchase and sell third-party volumes to better position the company to satisfy customer demand while fully utilizing transportation and storage capacity.
Natural Gas
Our natural gas production, along with third-party purchased gas, is primarily marketed in the United States, Canada, Europe and Asia. Our natural gas is sold to a diverse client portfolio which includes local distribution companies; gas and power utilities; large industrials; independent, integrated or state-owned oil and gas companies; as well as marketing companies. To reduce our market exposure and credit risk, we also transport natural gas via firm and interruptible transportation agreements to major market hubs.
Crude Oil, Bitumen and Natural Gas Liquids
Our crude oil, bitumen and natural gas liquids revenues are derived from production in the United States, Canada, Australia, Asia, Africa and Europe. These commodities are primarily sold under contracts with prices based on market indices, adjusted for location, quality and transportation.
LNG
LNG marketing efforts are focused on equity LNG production facilities located in Australia and Qatar. LNG is primarily sold under long-term contracts with prices based on market indices.
Energy Partnerships
Marine Well Containment Company (MWCC)
We are a founding member of the MWCC, a non-profit organization formed in 2010, which provides well containment equipment and technology in the deepwater U.S. Gulf of Mexico. MWCC's containment system meets the U.S. Bureau of Safety and Environmental Enforcement requirements for a subsea well containment system that can respond to a deepwater well control incident in the U.S. Gulf of Mexico. For additional information, see Note 2-Variable Interest Entities (VIEs), in the Notes to Consolidated Financial Statements.
Subsea Well Response Project (SWRP)
In 2011, we, along with several leading oil and gas companies, launched the SWRP, a non-profit organization based in Stavanger, Norway, which was created to enhance the industry's capability to respond to international subsea well control incidents. Through collaboration with Oil Spill Response Limited, a non-profit organization in the United Kingdom, subsea well intervention equipment is available for the industry to use in the event of a subsea well incident. This complements the work being undertaken in the United States by MWCC.
16
Oil Spill Response Removal Organizations (OSROs)
We maintain memberships in several OSROs across the globe as a key element of our preparedness program in addition to internal response resources. Many of the OSROs are not-for-profit cooperatives owned by the member companies wherein we may actively participate as a member of the board of directors, steering committee, work group or other supporting role. Globally, our primary OSRO is Oil Spill Response Ltd. based in the U.K., with facilities in several other countries and the ability to respond anywhere in the world. In North America, our primary OSROs include the Marine Spill Response Corporation for the continental U.S. and Alaska Clean Seas and Ship Escort/Response Vessel System for the Alaska North Slope and Prince William Sound, respectively. Internationally, we maintain memberships in various regional OSROs including the Norwegian Clean Seas Association for Operating Companies, Australian Marine Oil Spill Center and Petroleum Industry of Malaysia Mutual Aid Group.
Technology
We have several technology programs that improve our ability to develop unconventional reservoirs, produce heavy oil economically with fewer emissions, improve the efficiency of our company's exploration program, increase recoveries from our legacy fields, and implement sustainability measures.
Our Optimized Cascade ® LNG liquefaction technology business continues to be successful with the demand for new LNG plants. The technology has been licensed for use in 25 LNG trains around the world, with feasibility studies ongoing for additional trains.
17
RESERVES
We have not filed any information with any other federal authority or agency with respect to our estimated total proved reserves at December 31, 2017. No difference exists between our estimated total proved reserves for year-end 2016 and year-end 2015, which are shown in this filing, and estimates of these reserves shown in a filing with another federal agency in 2017.
DELIVERY COMMITMENTS
We sell crude oil and natural gas from our producing operations under a variety of contractual arrangements, some of which specify the delivery of a fixed and determinable quantity. Our commercial organization also enters into natural gas sales contracts where the source of the natural gas used to fulfill the contract can be the spot market or a combination of our reserves and the spot market. Worldwide, we are contractually committed to deliver approximately 1.7 trillion cubic feet of natural gas, including approximately 303 billion cubic feet related to the noncontrolling interests of consolidated subsidiaries, and 99 million barrels of crude oil in the future. These contracts have various expiration dates through the year 2029. We expect to fulfill the majority of these delivery commitments with proved developed reserves. In addition, we anticipate using proved undeveloped reserves and spot market purchases to fulfill any remaining commitments. See the disclosure on "Proved Undeveloped Reserves" in the "Oil and Gas Operations" section following the Notes to Consolidated Financial Statements, for information on the development of proved undeveloped reserves.
COMPETITION
We compete with private, public and state-owned companies in all facets of the E&P business. Some of our competitors are larger and have greater resources. Each of our segments is highly competitive, with no single competitor, or small group of competitors, dominating.
We compete with numerous other companies in the industry, including state-owned companies, to locate and obtain new sources of supply and to produce oil, bitumen, natural gas liquids and natural gas in an efficient, cost-effective manner. Based on statistics published in the September 4, 2017, issue of the Oil and Gas Journal , we were the third-largest U.S.-based oil and gas company in worldwide liquids production and reserves, and the fourth-largest U.S.-based oil and gas company in worldwide natural gas production and reserves in 2016. We deliver our production into the worldwide commodity markets. Principal methods of competing include geological, geophysical and engineering research and technology; experience and expertise; economic analysis in connection with portfolio management; and safely operating oil and gas producing properties.
GENERAL
At the end of 2017, we held a total of 734 active patents in 47 countries worldwide, including 328 active U.S. patents. During 2017, we received 32 patents in the United States and 40 foreign patents. Our products and processes generated licensing revenues of $79 million in 2017. The overall profitability of any business segment is not dependent on any single patent, trademark, license, franchise or concession.
Company-sponsored research and development activities charged against earnings were $100 million, $116 million and $222 million in 2017, 2016 and 2015, respectively.
Health, Safety and Environment
Our Health, Safety and Environment (HSE) organization provides tools and support to our business units and staff groups to help them ensure world class health, safety and environmental performance. The framework through which we safely manage our operations, the HSE Management System Standard, emphasizes process safety, risk management, emergency preparedness and environmental performance, with an intense focus on
18
process and occupational safety. In support of the goal of zero incidents, HSE milestones and criteria are established annually to drive strong safety performance. Progress toward these milestones and criteria are measured and reported. HSE audits are conducted on business functions periodically, and improvement actions are established and tracked to completion. We also have detailed processes in place to address sustainable development in our economic, environmental and social performance. Our processes, related tools and requirements focus on water, biodiversity and climate change, as well as social and stakeholder issues.
The environmental information contained in Management's Discussion and Analysis of Financial Condition and Results of Operations on pages 61 through 64 under the captions "Environmental" and "Climate Change" is incorporated herein by reference. It includes information on expensed and capitalized environmental costs for 2017 and those expected for 2018 and 2019.
Website Access to SEC Reports
Our internet website address is www.conocophillips.com . Information contained on our internet website is not part of this report on Form 10-K.
Our Annual Reports on Form 10-K, Quarterly Reports on Form 10-Q, Current Reports on Form 8-K and any amendments to these reports filed or furnished pursuant to Section 13(a) or 15(d) of the Securities Exchange Act of 1934 are available on our website, free of charge, as soon as reasonably practicable after such reports are filed with, or furnished to, the U.S. Securities and Exchange Commission (SEC). Alternatively, you may access these reports at the SEC's website at www.sec.gov .
19
Item 1A. RISK FACTORS
You should carefully consider the following risk factors in addition to the other information included in this Annual Report on Form 10-K. Each of these risk factors could adversely affect our business, operating results and financial condition, as well as adversely affect the value of an investment in our common stock.
Our operating results, our future rate of growth and the carrying value of our assets are exposed to the effects of changing commodity prices.
Prices for crude oil, bitumen, natural gas, natural gas liquids and LNG can fluctuate widely. Globally, prices for crude oil, bitumen, natural gas, natural gas liquids and LNG have experienced significant declines from their historic levels during 2013 and 2014, with excess of supply relative to global demand leading to global inventory builds. Total average annual prices in 2017 for Brent crude oil, WTI crude oil, Henry Hub natural gas and our realized natural gas liquids all decreased by at least 30 percent when compared with 2014 despite having improved by at least 18 percent when compared with 2016. Given volatility in commodity price drivers and the business environment, price trends may not continue or reverse themselves.
Our revenues, operating results and future rate of growth are highly dependent on the prices we receive for our crude oil, bitumen, natural gas, natural gas liquids and LNG. The factors influencing these prices are beyond our control. Lower crude oil, bitumen, natural gas, natural gas liquids and LNG prices may have a material adverse effect on our revenues, operating income, cash flows and liquidity and on the amount of dividends we elect to declare and pay on our common stock. Lower prices may also limit the amount of reserves we can produce economically, adversely affecting our reserve replacement ratio and accelerating the reduction in our existing reserve levels as we continue production from upstream fields.
Significant reductions in crude oil, bitumen, natural gas, natural gas liquids and LNG prices could also require us to reduce our capital expenditures or impair the carrying value of our assets. In the past three years, we recognized several impairments, which are described in Note 8-Impairments and the "APLNG" section of Note 5-Investments, Loans and Long-Term Receivables, in the Notes to Consolidated Financial Statements. If commodity prices remain low relative to their historic levels, and as we continue to optimize our investments and exercise capital flexibility, it is reasonably likely we will incur future impairments to long-lived assets used in operations, investments in nonconsolidated entities accounted for under the equity method and unproved properties. Although it is not reasonably practicable to quantify the impact of any future impairments at this time, our results of operations could be adversely affected as a result.
Our ability to declare and pay dividends and repurchase shares is subject to certain considerations.
Dividends are authorized and determined by our Board of Directors in its sole discretion and depend upon a number of factors, including:
| • | Cash available for distribution. |
| • | Our results of operations and anticipated future results of operations. |
| • | Our financial condition, especially in relation to the anticipated future capital needs of our properties. |
| • | The level of reserves we establish for future capital expenditures. |
| • | The level of distributions paid by comparable companies. |
| • | Our operating expenses. |
| • | Other factors our Board of Directors deems relevant. |
We expect to continue to pay quarterly distributions to our stockholders; however, we bear all expenses incurred by our operations, and our funds generated by operations, after deducting these expenses, may not be sufficient to cover desired levels of distributions to our stockholders.
20
Additionally, our share repurchase program does not obligate us to acquire any specific number of shares. Any downward revision in our distribution or share repurchase program could have a material adverse effect on the market price of our common stock.
We may need additional capital in the future, and it may not be available on acceptable terms.
We have historically relied primarily upon cash generated by our operations to fund our operations and strategy, however we have also relied from time to time on access to the debt and equity capital markets for funding. There can be no assurance that additional debt or equity financing will be available in the future on acceptable terms, or at all. In addition, although we anticipate we will be able to repay our existing indebtedness when it matures or in accordance with our stated plans, there can be no assurance we will be able to do so. Our ability to obtain additional financing, or refinance our existing indebtedness when it matures or in accordance with our stated plans, will be subject to a number of factors, including market conditions, our operating performance, investor sentiment and our ability to incur additional debt in compliance with agreements governing our then-outstanding debt. If we are unable to generate sufficient funds from operations or raise additional capital, our growth could be impeded.
In addition, we are regularly evaluated by the major rating agencies based on a number of factors, including our financial strength and conditions affecting the oil and gas industry generally. For example, due to the significant decline in prices for crude oil, bitumen, natural gas, natural gas liquids and LNG in 2015, and the expectation that these prices could remain depressed, the major ratings agencies conducted a review of the oil and gas industry and downgraded our debt ratings and those of several companies operating in the industry in 2016. Any downgrade in our credit rating, could increase the cost associated with any additional indebtedness we incur.
Our business may be adversely affected by deterioration in the credit quality of, or defaults under our contracts with, third parties with whom we do business.
The operation of our business requires us to engage in transactions with numerous counterparties operating in a variety of industries, including other companies operating in the oil and gas industry. These counterparties may default on their obligations to us as a result of operational failures or a lack of liquidity, or for other reasons, including bankruptcy. Market speculation about the credit quality of these counterparties, or their ability to continue performing on their existing obligations, may also exacerbate any operational difficulties or liquidity issues they are experiencing, particularly as it relates to other companies in the oil and gas industry as a result of the volatility in commodity prices. Any default by any of our counterparties may result in our inability to perform obligations under agreements we have made with third parties or may otherwise adversely affect our business or results of operations. In addition, our rights against any of our counterparties as a result of a default may not be adequate to compensate us for the resulting harm caused or may not be enforceable at all in some circumstances.
Unless we successfully add to our existing proved reserves, our future crude oil, bitumen, natural gas and natural gas liquids production will decline, resulting in an adverse impact to our business.
The rate of production from upstream fields generally declines as reserves are depleted. Except to the extent that we conduct successful exploration and development activities, or, through engineering studies, optimize production performance or identify additional or secondary recovery reserves, our proved reserves will decline materially as we produce crude oil, bitumen, natural gas and natural gas liquids. Accordingly, to the extent we are unsuccessful in replacing the crude oil, bitumen, natural gas and natural gas liquids we produce with good prospects for future production, our business will experience reduced cash flows and results of operations. Any cash conservation efforts we may undertake as a result of commodity price declines may further limit our ability to replace depleted reserves.
21
The exploration and production of oil and gas is a highly competitive industry.
The exploration and production of crude oil, bitumen, natural gas and natural gas liquids is a highly competitive business. We compete with private, public and state-owned companies in all facets of the exploration and production business, including to locate and obtain new sources of supply and to produce oil, bitumen, natural gas and natural gas liquids in an efficient, cost-effective manner. Some of our competitors are larger and have greater resources than we do or may be willing to incur a higher level of risk than we are willing to incur to obtain potential sources of supply. If we are not successful in our competition for new reserves, our financial condition and results of operations may be adversely affected.
Any material change in the factors and assumptions underlying our estimates of crude oil, bitumen, natural gas and natural gas liquids reserves could impair the quantity and value of those reserves.
Our proved reserve information included in this annual report has been derived from engineering estimates prepared by our personnel. Reserve estimation is a process that involves estimating volumes to be recovered from underground accumulations of crude oil, bitumen, natural gas and natural gas liquids that cannot be directly measured. As a result, different petroleum engineers, each using industry-accepted geologic and engineering practices and scientific methods, may produce different estimates of reserves and future net cash flows based on the same available data. Any significant future price changes could have a material effect on the quantity and present value of our proved reserves. Any material changes in the factors and assumptions underlying our estimates of these items could result in a material negative impact to the volume of reserves reported or could cause us to incur impairment expenses on property associated with the production of those reserves. Future reserve revisions could also result from changes in, among other things, governmental regulation. In addition to changes in the quantity and value of our proved reserves, the amount of crude oil, bitumen, natural gas and natural gas liquids that can be obtained from any proved reserve may ultimately be different from those estimated prior to extraction.
We expect to continue to incur substantial capital expenditures and operating costs as a result of our compliance with existing and future environmental laws and regulations. Likewise, future environmental laws and regulations, such as limitations on greenhouse gas emissions, may impact or limit our current business plans and reduce demand for our products.
Our businesses are subject to numerous laws and regulations relating to the protection of the environment. These laws and regulations continue to increase in both number and complexity and affect our operations with respect to, among other things:
| • | The discharge of pollutants into the environment. |
| • | Emissions into the atmosphere, such as nitrogen oxides, sulfur dioxide, mercury and greenhouse gas emissions. |
| • | Carbon taxes. |
| • | The handling, use, storage, transportation, disposal and cleanup of hazardous materials and hazardous and nonhazardous wastes. |
| • | The dismantlement, abandonment and restoration of our properties and facilities at the end of their useful lives. |
| • | Exploration and production activities in certain areas, such as offshore environments, arctic fields, oil sands reservoirs and tight oil plays. |
We have incurred and will continue to incur substantial capital, operating and maintenance, and remediation expenditures as a result of these laws and regulations. To the extent these expenditures, as with all costs, are not ultimately reflected in the prices of our products and services, our business, financial condition, results of operations and cash flows in future periods could be materially adversely affected.
Although our business operations are designed and operated to accommodate expected climatic conditions, to the extent there are significant changes in the Earth's climate, such as more severe or frequent weather
22
conditions in the markets we serve or the areas where our assets reside, we could incur increased expenses, our operations could be materially impacted, and demand for our products could fall. Demand for our products may also be adversely affected by conservation plans and efforts undertaken in response to global climate change, including plans developed in connection with the Paris climate conference in December 2015. Many governments also provide, or may in the future provide, tax advantages and other subsidies to support the use and development of alternative energy technologies. Our operations and the demand for our products could be materially impacted by the development and adoption of these technologies.
Domestic and worldwide political and economic developments could damage our operations and materially reduce our profitability and cash flows.
Actions of the U.S., state, local and foreign governments, through tax and other legislation, executive order and commercial restrictions, including changes resulting from the implementation and interpretation of the Tax Cuts and Jobs Act, could reduce our operating profitability both in the United States and abroad. In certain locations, governments have imposed or proposed restrictions on our operations; special taxes or tax assessments; and payment transparency regulations that could require us to disclose competitively sensitive information or might cause us to violate non-disclosure laws of other countries. U.S. federal, state and local legislative and regulatory agencies' initiatives regarding the hydraulic fracturing process could result in operating restrictions or delays in the completion of our oil and gas wells.
The U.S. government can also prevent or restrict us from doing business in foreign countries. These restrictions and those of foreign governments have in the past limited our ability to operate in, or gain access to, opportunities in various countries. Actions by host governments have affected operations significantly in the past, such as the expropriation of our oil assets by the Venezuelan government, and may continue to do so in the future. Changes in domestic and international regulations may affect our ability to obtain or maintain permits, including those necessary for drilling and development of wells in various locations.
Local political and economic factors in international markets could have a material adverse effect on us. Approximately 58 percent of our hydrocarbon production was derived from production outside the United States in 2017, and 45 percent of our proved reserves, as of December 31, 2017, was located outside the United States. We are subject to risks associated with operations in international markets, including changes in foreign governmental policies relating to crude oil, natural gas, bitumen, natural gas liquids or LNG pricing and taxation, other political, economic or diplomatic developments, changing political conditions and international monetary fluctuations. In particular, some countries where we operate lack well-developed legal systems or have not adopted clear legal and regulatory frameworks for oil and gas exploration and production. This lack of legal certainty exposes our operations to increased risks, including increased difficulty in enforcing our agreements in those jurisdictions and increased risks of adverse actions by local government authorities, such as expropriations.
Changes in governmental regulations may impose price controls and limitations on production of crude oil, bitumen, natural gas and natural gas liquids.
Our operations are subject to extensive governmental regulations. From time to time, regulatory agencies have imposed price controls and limitations on production by restricting the rate of flow of crude oil, bitumen, natural gas and natural gas liquids wells below actual production capacity. Because legal requirements are frequently changed and subject to interpretation, we cannot predict the effect of these requirements.
Our investments in joint ventures decrease our ability to manage risk.
We conduct many of our operations through joint ventures in which we may share control with our joint venture partners. There is a risk our joint venture participants may at any time have economic, business or legal interests or goals that are inconsistent with those of the joint venture or us, or our joint venture partners may be unable to meet their economic or other obligations and we may be required to fulfill those obligations alone. Failure by us, or an entity in which we have a joint venture interest, to adequately manage the risks associated with any acquisitions or joint ventures could have a material adverse effect on the financial condition or results of operations of our joint ventures and, in turn, our business and operations.
23
We may not be able to successfully complete any disposition we elect to pursue.
From time to time, we may seek to divest portions of our business or investments that are not important to our ongoing strategic objectives. Any dispositions we undertake may involve numerous risks and uncertainties, any of which could adversely affect our results of operations or financial condition. In particular, we may not be able to successfully complete any disposition on a timeline or on terms acceptable to us, if at all, whether due to market conditions, regulatory challenges or other concerns. In addition, the reinvestment of capital from disposition proceeds may not ultimately yield investment returns in line with our internal or external expectations. Any dispositions we pursue may also result in disruption to other parts of our business, including through the diversion of resources and management attention from our ongoing business and other strategic matters, or through the disruption of relationships with our employees and key vendors. Further, in connection with any disposition, we may enter into transition services agreements or undertake indemnity or other obligations that may result in additional expenses for us.
As part of our disposition strategy, on May 17, 2017, we completed the sale of our 50 percent nonoperated interest in the FCCL Partnership, as well as the majority of our western Canada gas assets to Cenovus Energy. Consideration for the transaction included 208 million Cenovus Energy common shares. We may not be able to liquidate the shares issued to us by Cenovus Energy at prices we deem acceptable, or at all.
We do not insure against all potential losses; therefore, we could be harmed by unexpected liabilities and increased costs.
We maintain insurance against many, but not all, potential losses or liabilities arising from operating risks. As such, our insurance coverage may not be sufficient to fully cover us against potential losses arising from such risks. Uninsured losses and liabilities arising from operating risks could reduce the funds available to us for capital, exploration and investment spending and could have a material adverse effect on our business, financial condition, results of operations and cash flows.
Our operations present hazards and risks that require significant and continuous oversight.
The scope and nature of our operations present a variety of significant hazards and risks, including operational hazards and risks such as explosions, fires, crude oil spills, severe weather, geological events, labor disputes, terrorist attacks, sabotage, civil unrest or cyber attacks. Our operations may also be adversely affected by unavailability, interruptions or accidents involving services or infrastructure required to develop, produce, process or transport our production, such as contract labor, drilling rigs, pipelines, railcars, tankers, barges or other infrastructure. Our operations are subject to the additional hazards of pollution, releases of toxic gas and other environmental hazards and risks. Activities in deepwater areas may pose incrementally greater risks because of complex subsurface conditions such as higher reservoir pressures, water depths and metocean conditions. All such hazards could result in loss of human life, significant property and equipment damage, environmental pollution, impairment of operations, substantial losses to us and damage to our reputation. Further, our business and operations may be disrupted if we do not respond, or are perceived not to respond, in an appropriate manner to any of these hazards and risks or any other major crisis or if we are unable to efficiently restore or replace affected operational components and capacity.
Our technologies, systems and networks may be subject to cybersecurity breaches. Although we have experienced occasional, actual or attempted breaches of our cybersecurity, none of these breaches has had a material effect on our business, operations or reputation. If our systems for protecting against cybersecurity risks prove to be insufficient, we could be adversely affected by having our business systems compromised, our proprietary information altered, lost or stolen, or our business operations disrupted. As cyber attacks continue to evolve, we may be required to expend significant additional resources to continue to modify or enhance our protective measures or to investigate and remediate any information systems and related infrastructure security vulnerabilities.
24
Item 1B. UNRESOLVED STAFF COMMENTS
None.
| Item 3. | LEGAL PROCEEDINGS |
The following is a description of reportable legal proceedings, including those involving governmental authorities under federal, state and local laws regulating the discharge of materials into the environment for this reporting period. The following proceedings include those matters that arose during the fourth quarter of 2017, as well as matters previously reported in our 2016 Form 10-K and our first-, second- and third-quarter 2017 Form 10-Qs that were not resolved prior to the fourth quarter of 2017. Material developments to the previously reported matters have been included in the descriptions below. While it is not possible to accurately predict the final outcome of these pending proceedings, if any one or more of such proceedings were to be decided adversely to ConocoPhillips, we expect there would be no material effect on our consolidated financial position. Nevertheless, such proceedings are reported pursuant to SEC regulations.
On April 30, 2012, the separation of our downstream business was completed, creating two independent energy companies: ConocoPhillips and Phillips 66. In connection with the separation, we entered into an Indemnification and Release Agreement, which provides for cross-indemnities between Phillips 66 and us and established procedures for handling claims subject to indemnification and related matters, such as legal proceedings. We have included matters where we remain or have subsequently become a party to a proceeding relating to Phillips 66, in accordance with SEC regulations. We do not expect any of those matters to result in a net claim against us.
Matters Previously Reported-Phillips 66
In May 2012, the Illinois Attorney General's office filed and notified ConocoPhillips of a complaint with respect to operations at the Phillips 66 Wood River Refinery alleging violations of the Illinois groundwater standards and a third-party's hazardous waste permit. The complaint seeks as relief remediation of area groundwater; compliance with the hazardous waste permit; enhanced pipeline and tank integrity measures; additional spill reporting; and fines and penalties exceeding $100,000.
In October 2016, after Phillips 66 received a Notice of Intent to Sue from the Sierra Club, Phillips 66 entered into a voluntary settlement with the Illinois Environmental Protection Agency for alleged violations of wastewater requirements at the Wood River Refinery. The settlement involves certain capital projects and payment of $125,000. After the settlement was filed with the Court for final approval, the Sierra Club sought and was granted approval to intervene in the case. The settlement and a first modification have been entered by the Court, but the Sierra Club still seeks to reopen and challenge the settlement.
| Item 4. | MINE SAFETY DISCLOSURES |
Not applicable.
25
EXECUTIVE OFFICERS OF THE REGISTRANT
| Name | Position Held | Age* | ||||
Janet L. Carrig | Senior Vice President, Legal, General Counsel and Corporate Secretary | 60 | ||||
Ellen R. DeSanctis | Vice President, Investor Relations and Communications | 61 | ||||
Matt J. Fox | Executive Vice President, Strategy, Exploration and Technology | 57 | ||||
Alan J. Hirshberg | Executive Vice President, Production, Drilling and Projects | 56 | ||||
Ryan M. Lance | Chairman of the Board of Directors and Chief Executive Officer | 55 | ||||
Andrew D. Lundquist | Senior Vice President, Government Affairs | 57 | ||||
James D. McMorran | Vice President, Human Resources, Real Estate and Facilities Services | 60 | ||||
Glenda M. Schwarz | Vice President and Controller | 52 | ||||
Don E. Wallette, Jr. | Executive Vice President, Finance, Commercial and Chief Financial Officer | 59 | ||||
*On February 15, 2018.
There are no family relationships among any of the officers named above. Each officer of the company is elected by the Board of Directors at its first meeting after the Annual Meeting of Stockholders and thereafter as appropriate. Each officer of the company holds office from the date of election until the first meeting of the directors held after the next Annual Meeting of Stockholders or until a successor is elected. The date of the next annual meeting is May 15, 2018. Set forth below is information about the executive officers.
Janet L. Carrig was appointed Senior Vice President, Legal, General Counsel and Corporate Secretary in 2007. On February 14, 2018, Ms. Carrig announced her decision to retire as Senior Vice President, Legal, General Counsel and Corporate Secretary. Ms. Carrig plans to remain in her current position until her successor is appointed.
Ellen R. DeSanctis was appointed Vice President, Investor Relations and Communications in May 2012. She was previously employed by Petrohawk Energy Corp. and served as Senior Vice President, Corporate Communications since 2010.
Matt J. Fox was appointed as Executive Vice President, Strategy, Exploration and Technology in April 2016. He previously served as the Executive Vice President, Exploration and Production, from 2012 to 2016. Prior to that, he was employed by Nexen, Inc. and served as Executive Vice President, International since 2010.
Alan J. Hirshberg was appointed Executive Vice President, Production, Drilling and Projects in April 2016. He previously served as Executive Vice President, Technology and Projects, from 2012 to 2016. Prior to that, he served as Senior Vice President, Planning and Strategy since 2010.
Ryan M. Lance was appointed Chairman of the Board of Directors and Chief Executive Officer in May 2012, having previously served as Senior Vice President, Exploration and Production-International since May 2009.
Andrew D. Lundquist was appointed Senior Vice President, Government Affairs in 2013. Prior to that, he served as managing partner of BlueWater Strategies LLC, since 2002.
James D. McMorran was appointed Vice President, Human Resources, Real Estate and Facilities Services in August 2015. Prior to that, he served as Manager, Compensation and Benefits, since 2004.
Glenda M. Schwarz was appointed Vice President and Controller in 2009.
Don E. Wallette, Jr. was appointed Executive Vice President, Finance, Commercial and Chief Financial Officer in April 2016. He previously served as Executive Vice President, Commercial, Business Development and Corporate Planning from 2012 to 2016. Prior to that, he served as President, Asia Pacific since 2010 and President, Russia/Caspian from 2006 to 2010.
26
PART II
| Item 5. | MARKET FOR REGISTRANT'S COMMON EQUITY, RELATED STOCKHOLDER MATTERS AND ISSUER PURCHASES OF EQUITY SECURITIES |
Quarterly Common Stock Prices and Cash Dividends Per Share
ConocoPhillips' common stock is traded on the New York Stock Exchange, under the symbol "COP."
| Stock Price | ||||||||||||
|
| |||||||||||
| High | Low | Dividends | ||||||||||
|
|
|
| |||||||||
2017 | ||||||||||||
First | $ | 51.68 | 43.26 | 0.265 | ||||||||
Second | 50.62 | 43.02 | 0.265 | |||||||||
Third | 50.83 | 42.27 | 0.265 | |||||||||
Fourth | 56.37 | 48.70 | 0.265 | |||||||||
| ||||||||||||
2016 | ||||||||||||
First | $ | 47.77 | 31.05 | 0.25 | ||||||||
Second | 49.35 | 38.19 | 0.25 | |||||||||
Third | 44.42 | 38.80 | 0.25 | |||||||||
Fourth | 53.17 | 40.37 | 0.25 | |||||||||
| ||||||||||||
Closing Stock Price at December 31, 2017 | $ | 54.89 | ||||||||||
Closing Stock Price at January 31, 2018 | $ | 58.46 | ||||||||||
Number of Stockholders of Record at January 31, 2018* | 46,680 | |||||||||||
| ||||||||||||
| *In | determining the number of stockholders, we consider clearing agencies and security position listings as one stockholder for each agency listing. |
The declaration of dividends is subject to the discretion of our Board of Directors, and may be affected by various factors, including our future earnings, financial condition, capital requirements, levels of indebtedness, credit ratings and other considerations our Board of Directors deems relevant. Our Board of Directors has adopted a quarterly dividend declaration policy providing that the declaration of any dividends will be determined quarterly by the Board of Directors taking into account such factors as our business model, prevailing business conditions and our financial results and capital requirements, without a predetermined annual net income payout ratio.
On February 4, 2016, we announced that our Board of Directors approved a reduction in the quarterly dividend to $0.25 per share, compared with the previous quarterly dividend of $0.74 per share.
On January 31, 2017, we announced that our Board of Directors approved an increase in the quarterly dividend to $0.265 per share, compared with the previous quarterly dividend of $0.25 per share.
On February 1, 2018, we announced that our Board of Directors approved an increase in the quarterly dividend to $0.285 per share, compared with the previous quarterly dividend of $0.265 per share.
27
Issuer Purchases of Equity Securities
| Millions of Dollars | ||||||||||||||||
|
| |||||||||||||||
Period |
| Total Number of Shares Purchased | * |
| Average Price Paid Per Share |
|
| Shares Purchased as Part of Publicly Announced Plans or Programs |
|
| Approximate Dollar Value of Shares that May Yet Be Purchased Under the Plans or Programs |
| ||||
| ||||||||||||||||
October 1-31, 2017 | 6,678,455 | $ | 49.94 | 6,678,455 | $ | 3,496 | ||||||||||
November 1-30, 2017 | 6,180,482 | 51.51 | 6,180,482 | 3,177 | ||||||||||||
December 1-31, 2017 | 5,773,183 | 52.52 | 5,773,183 | 2,874 | ||||||||||||
| ||||||||||||||||
Total fourth-quarter 2017 | 18,632,120 | $ | 51.26 | 18,632,120 | $ | 2,874 | ||||||||||
| ||||||||||||||||
*There were no repurchases of common stock from company employees in connection with the company's broad-based employee incentive plans.
On November 10, 2016, we announced plans to purchase up to $3 billion of our common stock through 2019. On March 29, 2017, we announced plans to double our share repurchase program to $6 billion of common stock through 2019, with $3 billion allocated and purchased in 2017, and the remainder allocated evenly to 2018 and 2019. On February 1, 2018, we announced the acceleration of our previously stated 2018 share repurchases from $1.5 billion to $2.0 billion, with the remaining balance to be repurchased in 2019. Acquisitions for the share repurchase program are made at management's discretion, at prevailing prices, subject to market conditions and other factors. Repurchases may be increased, decreased or discontinued at any time without prior notice. Shares of stock repurchased under the plan are held as treasury shares.
In addition to our previously announced share repurchase program above, we are currently planning to purchase up to an additional $1.5 billion of our common stock through 2020. Whether we undertake these additional repurchases is ultimately subject to numerous considerations, including Board authorization, market conditions and other factors. See Risk Factors "Our ability to declare and pay dividends and repurchase shares is subject to certain considerations."
Stock Performance Graph
The following graph shows the cumulative total shareholder return (TSR) for ConocoPhillips' common stock in each of the five years from December 31, 2012, to December 31, 2017. The graph also compares the cumulative total returns for the same five-year period with the S&P 500 Index and our performance peer group consisting of BP, Chevron, ExxonMobil, Royal Dutch Shell, Total, Anadarko, Apache, Marathon Oil Corporation, Devon and Occidental, weighted according to the respective peer's stock market capitalization at the beginning of each annual period. The comparison assumes $100 was invested on December 31, 2012, in ConocoPhillips stock, the S&P 500 Index and ConocoPhillips' peer group and assumes that all dividends were reinvested.
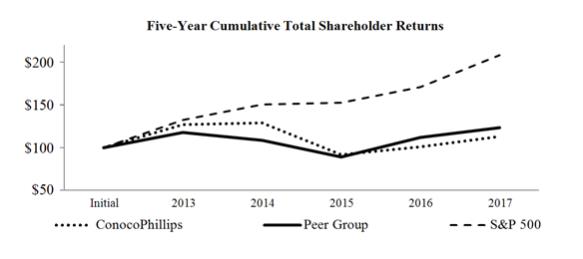
28
Item 6. SELECTED FINANCIAL DATA
| Millions of Dollars Except Per Share Amounts | ||||||||||||||||||||
|
| |||||||||||||||||||
| 2017 | 2016 | 2015 | 2014 | 2013 | ||||||||||||||||
|
| |||||||||||||||||||
Sales and other operating revenues | $ | 29,106 | 23,693 | 29,564 | 52,524 | 54,413 | ||||||||||||||
Income (loss) from continuing operations | (793 | ) | (3,559 | ) | (4,371 | ) | 5,807 | 8,037 | ||||||||||||
Per common share | ||||||||||||||||||||
Basic | (0.70 | ) | (2.91 | ) | (3.58 | ) | 4.63 | 6.47 | ||||||||||||
Diluted | (0.70 | ) | (2.91 | ) | (3.58 | ) | 4.60 | 6.43 | ||||||||||||
Income from discontinued operations | - | - | - | 1,131 | 1,178 | |||||||||||||||
Net income (loss) | (793 | ) | (3,559 | ) | (4,371 | ) | 6,938 | 9,215 | ||||||||||||
Net income (loss) attributable to ConocoPhillips | (855 | ) | (3,615 | ) | (4,428 | ) | 6,869 | 9,156 | ||||||||||||
Per common share | ||||||||||||||||||||
Basic | (0.70 | ) | (2.91 | ) | (3.58 | ) | 5.54 | 7.43 | ||||||||||||
Diluted | (0.70 | ) | (2.91 | ) | (3.58 | ) | 5.51 | 7.38 | ||||||||||||
Total assets | 73,362 | 89,772 | 97,484 | 116,539 | 118,057 | |||||||||||||||
Long-term debt | 17,128 | 26,186 | 23,453 | 22,383 | 21,073 | |||||||||||||||
Joint venture acquisition obligation-Cash dividends declared per common share | 1.06 | 1.00 | 2.94 | 2.84 | 2.70 | |||||||||||||||
| ||||||||||||||||||||
Net income (loss) and net income (loss) attributable to ConocoPhillips from 2013 to 2014 includes income from discontinued operations as a result of the sale of our interest in Kashagan, and the sales of our Algeria and Nigeria businesses. These factors impact the comparability of this information.
See Management's Discussion and Analysis of Financial Condition and Results of Operations and the Notes to Consolidated Financial Statements for a discussion of factors that will enhance an understanding of this data.
29
| Item 7. | MANAGEMENT'S DISCUSSION AND ANALYSIS OF FINANCIAL CONDITION AND RESULTS OF OPERATIONS |
Management's Discussion and Analysis is the company's analysis of its financial performance and of significant trends that may affect future performance. It should be read in conjunction with the financial statements and notes, and supplemental oil and gas disclosures included elsewhere in this report. It contains forward-looking statements including, without limitation, statements relating to the company's plans, strategies, objectives, expectations and intentions that are made pursuant to the "safe harbor" provisions of the Private Securities Litigation Reform Act of 1995. The words "anticipate," "estimate," "believe," "budget," "continue," "could," "intend," "may," "plan," "potential," "predict," "seek," "should," "will," "would," "expect," "objective," "projection," "forecast," "goal," "guidance," "outlook," "effort," "target" and similar expressions identify forward-looking statements. The company does not undertake to update, revise or correct any of the forward-looking information unless required to do so under the federal securities laws. Readers are cautioned that such forward-looking statements should be read in conjunction with the company's disclosures under the heading: "CAUTIONARY STATEMENT FOR THE PURPOSES OF THE ‘SAFE HARBOR' PROVISIONS OF THE PRIVATE SECURITIES LITIGATION REFORM ACT OF 1995," beginning on page 70.
The terms "earnings" and "loss" as used in Management's Discussion and Analysis refer to net income (loss) attributable to ConocoPhillips.
BUSINESS ENVIRONMENT AND EXECUTIVE OVERVIEW
ConocoPhillips is the world's largest independent exploration and production (E&P) company, based on proved reserves and production of liquids and natural gas. Headquartered in Houston, Texas, we have operations and activities in 17 countries. Our diverse portfolio primarily includes resource-rich North American tight oil and oil sands assets in Canada; lower-risk conventional assets in North America, Europe, Asia and Australia; several liquefied natural gas (LNG) developments; and an inventory of global conventional and unconventional exploration prospects. At December 31, 2017, we employed approximately 11,400 people worldwide and had total assets of $73 billion. Our common stock is listed on the New York Stock Exchange under the symbol "COP."
Overview
The global oil market is rebalancing. Crude oil prices improved in 2017, particularly during the latter half of the year; however, we believe prices are likely to remain cyclical in the future. In 2016, we updated our value proposition to position the company for long-term success, given our expectations. Our value proposition principles, namely to maintain financial strength, grow our distributions and pursue disciplined growth, remain essentially unchanged. However, we took steps to improve our competitiveness and resilience by establishing clear priorities for cash allocation.
In order, the cash allocation priorities are: invest capital at a level that maintains flat production volumes and pays our existing dividend; grow our existing dividend; reduce debt to a level we believe is sufficient to maintain a strong investment grade rating through price cycles; repurchase shares to provide value to our shareholders; and strategically invest capital to grow our cash from operations.
In 2017, we took significant actions that allowed us to make substantial progress on our stated priorities. We believe that our commitment to our value proposition, as evidenced by the results discussed below, position the company for success in an environment of price uncertainty and ongoing volatility.
30
Key Operating and Financial Summary
Significant items during 2017 included the following:
| • | Achieved full-year production excluding Libya of 1,356 thousand barrels of oil equivalent per day (MBOED); underlying production excluding the impact of closed and planned dispositions grew 19 percent on a production per debt-adjusted share basis and 3 percent overall. |
| • | Cash provided by operating activities exceeded capital expenditures by $2.5 billion, and exceeded capital expenditures and dividends by $1.2 billion. |
| • | Paid down $7.6 billion of balance sheet debt, ending the year with debt of $19.7 billion. |
| • | Generated approximately $16 billion from asset dispositions. |
| • | Announced year-end proved reserves of 5.0 billion barrels of oil equivalent (BOE). |
| • | Repurchased $3 billion of shares; reduced ending share count by 5 percent year over year. |
| • | Reached settlement on Ecuador arbitration for $337 million. |
Operationally, we continue to focus on safely executing our capital program and remaining attentive to our costs. Production excluding Libya was 1,356 MBOED in 2017 compared with 1,567 MBOED in 2016. Our underlying production, which excludes the full-year impact of closed and planned dispositions of 191 MBOED in 2017 and 434 MBOED in 2016 and Libya, increased 32 MBOED, or 3 percent year over year. Underlying production on a per debt-adjusted share basis grew by 19 percent compared to 2016. Production per debt-adjusted share is calculated on an underlying production basis using ending period debt divided by ending share price plus ending shares outstanding. We believe production per debt-adjusted share is useful to investors as it provides a consistent view of production on a total equity basis by converting debt to equity and allows for comparisons across peer companies.
We accomplished several strategic milestones in 2017, including progressing our efforts to optimize our portfolio. Our asset dispositions are in line with our strategy, announced in November 2016, to focus on low cost-of-supply projects in our portfolio that strategically fit our development plans. We generated approximately $16 billion in total consideration from the disposition of certain noncore assets which were directed to our stated cash priorities and general corporate purposes. For additional information on our dispositions, see Note 4-Assets Held for Sale, Sold or Acquired in the Notes to Consolidated Financial Statements.
In 2017, we reduced debt by $7.6 billion to $19.7 billion at year-end and repurchased 64 million shares of our common stock totaling $3 billion. Consistent with our commitment to grow our distributions, in the first quarter of 2017, we increased our quarterly dividend by 6 percent to $0.265 per share. We are managing our business to optimize and deliver on our value propositions and cash priorities in a demanding business environment.
Business Environment
After elevated levels of volatility in 2016, global market fundamentals trended towards a firmer balance in 2017. Crude oil prices improved in 2017 as a result of slower growth in global oil production, strong global oil demand and lower global inventory levels.
The energy industry has periodically experienced this type of extreme volatility due to fluctuating supply-and-demand conditions. Commodity prices are the most significant factor impacting our profitability and related reinvestment of operating cash flows into our business. Our strategy is to create value through price cycles by delivering on the disciplined financial and operational priorities that underpin our value proposition.
31
Priorities
The priorities we believe will drive our success through the price cycles include:
| • | Focus on financial returns . This is a core aspect of our value proposition. Our goal is to achieve strong financial returns by controlling our costs, exercising capital discipline and continually optimizing our portfolio. |
| ¡ | Control costs and expenses . Controlling operating and overhead costs, without compromising safety and environmental stewardship, is a high priority. We monitor these costs using various methodologies that are reported to senior management monthly, on both an absolute-dollar basis and a per-unit basis. Managing operating and overhead costs is critical to maintaining a competitive position in our industry, particularly in a low commodity price environment. The ability to control our operating and overhead costs impacts our ability to deliver strong cash from operations. In 2017, including asset disposition impacts, we reduced our production and operating expenses by 9 percent as compared to 2016. |
| ¡ | Maintain capital discipline . We participate in a commodity price-driven and capital-intensive industry, with varying lead times from when an investment decision is made to the time an asset is operational and generates cash flow. As a result, we must invest significant capital dollars to explore for new oil and gas fields, develop newly discovered fields, maintain existing fields, and construct pipelines and LNG facilities. Given our view of greater price volatility, we have shifted our capital allocation to focus on shorter cycle time, low cost-of-supply, unconventional programs in our resource base. Our cash allocation priorities call for the investment of sufficient capital to maintain production and pay the existing dividend. Additional allocations of capital toward growth projects will be dependent on satisfaction of other financial priorities. We use a disciplined approach, focused on value maximization and cash flow expansion, to set our capital plans. |
In November 2017, we announced a 2018 capital budget of $5.5 billion, including $3.5 billion of sustaining capital and $2 billion in accretive, short-cycle unconventional programs, future major projects and exploration activities.
| ¡ | Optimize our portfolio . We continue to optimize our asset portfolio by focusing on low cost-of-supply assets which strategically fit our development plans. In 2017, we generated approximately $16 billion in total consideration from dispositions of certain noncore assets in our portfolio, including our 50 percent nonoperated interest in the FCCL Partnership, as well as the majority of our western Canada gas assets; our interests in the San Juan Basin; and our interest in the Panhandle assets. We will continue to evaluate our assets to determine whether they fit our strategic direction and will optimize the portfolio as necessary, directing our capital investments to areas that align with our objectives. |
| • | Maintain financial strength . We believe financial strength is critical in a cyclical business such as ours. In 2017, using proceeds from asset dispositions and cash flow from operations, we reduced our debt by $7.6 billion to $19.7 billion at year-end. On a longer-term basis, in November 2017, we announced our plan to reduce debt to $15 billion by year-end 2019, a significant acceleration from the previously stated expectation of $20 billion in the same timeframe. We expect to retire outstanding debt as it matures and exercise flexibility in paying down our other debt instruments. |
| • | Return capital to shareholders . In 2017, we paid dividends on our common stock of $1.3 billion and repurchased $3 billion of our common stock. We believe in delivering value to our shareholders through the price cycles. As a result, we set a priority to increase our dividend rate annually and purchase up to approximately $3 billion of our common stock evenly from 2018 through 2019. |
32
| On February 1, 2018, we announced that our Board of Directors approved an increase in the quarterly dividend to $0.285 per share, compared with the previous quarterly dividend of $0.265 per share. Additionally, we announced the acceleration of our previously stated 2018 share repurchases from $1.5 billion to $2.0 billion. |
In addition to our previously announced share repurchase program above, we are currently planning to purchase up to an additional $1.5 billion of our common stock through 2020. Whether we undertake these additional repurchases is ultimately subject to numerous considerations, including Board authorization, market conditions and other factors. See Risk Factors "Our ability to declare and pay dividends and repurchase shares is subject to certain considerations."
| • | Maintain a relentless focus on safety and environmental stewardship . Safety and environmental stewardship, including the operating integrity of our assets, remain our highest priorities, and we are committed to protecting the health and safety of everyone who has a role in our operations and the communities in which we operate. We strive to conduct our business with respect and care for both the local and global environment and systematically manage risk to drive sustainable business growth. Our sustainability efforts in 2017 focused on implementing our action plans for climate change, biodiversity, water and human rights, as well as revamping public reporting to be more informative, searchable and responsive to common questions. To demonstrate our commitment to sustainability and environmental stewardship, on November 2017, we announced our intention to target a 5 to 15 percent reduction in our greenhouse gas emission intensity by 2030. We are committed to building a learning organization using human performance principles as we relentlessly pursue improved Health, Safety and Environment and operational performance. |
| • | Add to our proved reserve base . We primarily add to our proved reserve base in two ways: |
| ¡ | Successful exploration, exploitation and development of new and existing fields. |
| ¡ | Application of new technologies and processes to improve recovery from existing fields. |
Proved reserve estimates require economic production based on historical 12-month, first-of-month, average prices and current costs. Therefore, our proved reserves generally increase as prices rise and decrease as prices decline. Asset dispositions in 2017 reduced our reported year-end proved reserves, but were partly offset by increased commodity prices. In 2017, our reserve replacement, which included a reduction of 1.9 billion BOE from dispositions, was negative 168 percent. Our organic reserve replacement, which excludes the impact of sales and purchases, was 200 percent in 2017. In the five years ended December 31, 2017, our reserve replacement was negative 24 percent, reflecting the impact of asset dispositions and lower prices.
Access to additional resources may become increasingly difficult as commodity prices can make projects uneconomic or unattractive. In addition, prohibition of direct investment in some nations, national fiscal terms, political instability, competition from national oil companies, and lack of access to high-potential areas due to environmental or other regulation may negatively impact our ability to increase our reserve base. As such, the timing and level at which we add to our reserve base may, or may not, allow us to replace our production over subsequent years. Additionally, as we continue cash conservation efforts, our reserve replacement efforts could be delayed thus limiting our ability to replace depleted reserves.
| • | Apply technical capability . We leverage our knowledge and technology to create value and safely deliver on our plans. Technical strength is part of our heritage, and we are evolving our technical approach to optimally apply best practices. Companywide, we continue to evaluate potential solutions to leverage knowledge of technological successes across our operations. Such innovations enable us to economically convert additional resources to reserves, achieve greater operating efficiencies and reduce our environmental impact. |
| • | Develop and retain a talented work force . We strive to attract, train, develop and retain individuals with the knowledge and skills to implement our business strategy and who support our values and ethics. To this end, we offer university internships across multiple disciplines to attract the best talent and, as needed, recruit experienced hires to maintain a broad range of skills and experience. We promote continued learning, development and technical training through structured development programs designed to enhance the technical and functional skills of our employees. |
33
Other Factors Affecting Profitability
Other significant factors that can affect our profitability include:
| • | Energy commodity prices . Our earnings and operating cash flows generally correlate with industry price levels for crude oil and natural gas. Industry price levels are subject to factors external to the company and over which we have no control, including but not limited to global economic health, supply disruptions or fears thereof caused by civil unrest or military conflicts, actions taken by Organization of Petroleum Exporting Countries (OPEC), environmental laws, tax regulations, governmental policies and weather-related disruptions. The following graph depicts the average benchmark prices for West Texas Intermediate (WTI) crude oil, Dated Brent crude oil and U.S. Henry Hub natural gas: |
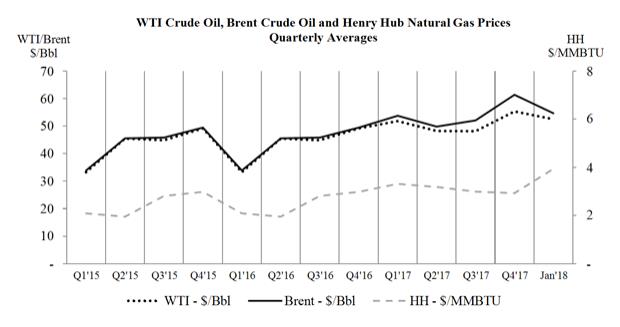
Brent crude oil prices averaged $61.39 per barrel in the fourth quarter of 2017, an increase of 24 percent compared with $49.46 per barrel in the fourth quarter of 2016. Similarly, WTI crude oil prices increased 13 percent from $49.18 per barrel in the fourth quarter of 2016 to $55.35 per barrel in the same period of 2017. Global oil prices began to improve at the end of 2016 and continued trending upward in response to stronger global demand and slower production growth.
Henry Hub natural gas prices averaged $2.93 per million British thermal units (MMBTU) in the fourth quarter of 2017, a decrease of 2 percent compared with $2.98 per MMBTU in the fourth quarter of 2016. However, on an annual basis, Henry Hub natural gas prices improved 26 percent from $2.46 per MMBTU in 2016, to $3.11 per MMBTU in 2017. The price improvement was as a result of growth in domestic demand, increased exports and lower U.S. inventories.
Our realized natural gas liquids prices averaged $32.79 per barrel in the fourth quarter of 2017, an increase of 50 percent compared with $21.82 per barrel in the same quarter of 2016.
Improving global crude oil prices resulted in the Western Canada Select benchmark price experiencing a 33 percent increase, from $29.36 per barrel in 2016 to $38.92 per barrel in 2017. The WCS benchmark price improvement, coupled with changes in costs per barrel resulting from the disposition of our interest in the FCCL Partnership, caused our realized bitumen price to increase relative to 2016. Our realized bitumen price was $22.66 per barrel in 2017, an increase of 48 percent compared with $15.27 per barrel in the same period of 2016.
34
Our worldwide annual average realized price was $46.10 per barrel of oil equivalent (BOE) in the fourth quarter of 2017, an increase of 40 percent compared with $32.93 per BOE in the fourth quarter of 2016. Similarly, our worldwide annual average realized price was $39.19 per BOE in 2017, an increase of 38 percent compared with $28.35 per BOE in 2016, reflecting higher average realized prices across all commodities.
North America's energy landscape has been transformed from resource scarcity to an abundance of supply. In recent years, the use of hydraulic fracturing and horizontal drilling in tight oil formations has led to increased industry actual and forecasted crude oil and natural gas production in the United States. Although providing significant short- and long-term growth opportunities for our company, the increased abundance of crude oil and natural gas due to development of tight oil plays could also have adverse financial implications to us, including: an extended period of low commodity prices; production curtailments; delay of plans to develop areas such as unconventional fields or Alaska North Slope natural gas fields; and underutilization of LNG regasification facilities. Should one or more of these events occur, our revenues would be reduced and additional asset impairments might be possible.
| • | Impairments . As mentioned earlier, we participate in a capital-intensive industry. At times, our properties, plants and equipment and investments become impaired when, for example, commodity prices decline significantly for long periods of time, our reserve estimates are revised downward, or a decision to dispose of an asset leads to a write-down to its fair value. We may also invest large amounts of money in exploration which, if exploratory drilling proves unsuccessful, could lead to a material impairment of leasehold values. In 2017, we recorded before-tax impairments of $6,601 million for proved properties and $136 million for unproved properties. As we optimize our assets in the future, it is reasonably possible we may incur future losses upon sale or impairment charges to long-lived assets used in operations, investments in nonconsolidated entities accounted for under the equity method, and unproved properties. For additional information on our impairments in 2017, 2016 and 2015, see Note 8-Impairments, in the Notes to Consolidated Financial Statements. |
| • | Effective tax rate . Our operations are located in countries with different tax rates and fiscal structures. Accordingly, even in a stable commodity price and fiscal/regulatory environment, our overall effective tax rate can vary significantly between periods based on the "mix" of before-tax earnings within our global operations. Recent changes in the U.S. corporate income tax law, further discussed below, additionally impacted our effective tax rate in 2017. |
| • | Fiscal and regulatory environment. Our operations can be affected by changing economic, regulatory and political environments in the various countries in which we operate, including the United States. Civil unrest or strained relationships with governments may impact our operations or investments. These changing environments have generally negatively impacted our results of operations, and further changes to government fiscal take could have a negative impact on future operations. Our assets in Venezuela were expropriated in 2007. Our production operations in Libya and related oil exports were suspended or significantly curtailed from July 2013 to October 2016 due to the closure of the Es Sider crude oil export terminal, and they were also suspended in 2011 during Libya's period of civil unrest. In 2016, the United Kingdom government enacted tax legislation which reduced our U.K. corporate tax rate by 10 percent. |
On December 22, 2017, the Tax Cuts and Jobs Act ("Tax Legislation") was enacted, significantly revising the U.S. corporate income tax law by, among other things, lowering the corporate income tax rate from 35 percent to 21 percent, implementing a territorial tax system and imposing a one-time deemed repatriation tax on untaxed accumulated foreign earnings. We recognized a provisional, noncash tax benefit of $852 million, which is included as a component of our 2017 income tax expense, primarily related to the revaluation of deferred taxes at the lower 21 percent federal statutory rate. We did not incur nor expect to incur a tax cost related to the one-time repatriation of accumulated foreign earnings. While we anticipate the Tax Legislation will provide a positive impact
35
to our U.S. operations in the future primarily because of the reduced U.S. federal statutory rate, we do not expect to realize cash tax benefits from the Tax Legislation until we move into a U.S. tax paying position. The ultimate impact of the Tax Legislation may differ from our current expectations, due to, among other things, changes in interpretations and assumptions the company has made or additional regulatory or accounting guidance that may be issued with respect to the Tax Legislation. For additional information, see Note 18-Income Taxes, in the Notes to Consolidated Financial Statements.
Our management carefully considers the fiscal and regulatory environment when evaluating projects or determining the levels and locations of our activity.
Outlook
Full-year 2018 production is expected to be 1,195 to 1,235 MBOED. This results in approximately 5 percent growth compared with full-year 2017 underlying production, which excludes the impact of closed and planned dispositions of 191 MBOED. First-quarter 2018 production is expected to be 1,180 to 1,220 MBOED. Production guidance for 2018 excludes Libya.
Operating Segments
We manage our operations through six operating segments, which are primarily defined by geographic region: Alaska, Lower 48, Canada, Europe and North Africa, Asia Pacific and Middle East, and Other International.
Corporate and Other represents costs not directly associated with an operating segment, such as most interest expense, premiums incurred on the early retirement of debt, corporate overhead, certain technology activities, as well as licensing revenues received.
Our key performance indicators, shown in the statistical tables provided at the beginning of the operating segment sections that follow, reflect results from our operations, including commodity prices and production.
36
RESULTS OF OPERATIONS
Consolidated Results
A summary of the company's net loss attributable to ConocoPhillips by business segment follows:
| Millions of Dollars | ||||||||||||
| Years Ended December 31 | 2017 | 2016 | 2015 | |||||||||
|
| |||||||||||
Alaska | $ | 1,466 | 319 | 4 | ||||||||
Lower 48 | (2,371 | ) | (2,257 | ) | (1,932 | ) | ||||||
Canada | 2,564 | (935 | ) | (1,044 | ) | |||||||
Europe and North Africa | 553 | 394 | 409 | |||||||||
Asia Pacific and Middle East | (1,098 | ) | 209 | (463 | ) | |||||||
Other International | 167 | (16 | ) | (593 | ) | |||||||
Corporate and Other | (2,136 | ) | (1,329 | ) | (809 | ) | ||||||
| ||||||||||||
Net loss attributable to ConocoPhillips | $ | (855 | ) | (3,615 | ) | (4,428 | ) | |||||
| ||||||||||||
2017 vs. 2016
Loss attributable to ConocoPhillips decreased $2,760 million in 2017. The decrease was mainly due to:
| • | Higher commodity prices. |
| • | Lower depreciation, depletion and amortization (DD&A) expense, mainly due to lower unit-of-production rates from reserve revisions and disposition impacts. |
| • | Higher gains on dispositions, primarily due to a $1.6 billion after-tax gain in 2017 on the sale of certain Canadian assets. |
| • | Recognition of deferred tax benefits totaling $996 million, primarily related to the disposition of certain Canadian assets. |
| • | Recognition of deferred tax benefits totaling $852 million related to the Tax Legislation enacted on December 22, 2017. |
| • | Improved equity earnings, mainly due to higher realized prices, lower DD&A from asset disposition impacts, and the absence of a 2016 deferred tax charge of $174 million resulting from the change of the tax functional currency for APLNG to the U.S. dollar. These increases were partly offset by lower volumes from the disposition of our interest in the FCCL Partnership. |
| • | Lower exploration expenses mainly due to reduced leasehold impairment expense, dry hole costs and other exploration expenses. |
| • | A $337 million award from an arbitration settlement with The Republic of Ecuador. |
| • | Lower production and operating expenses, primarily due to asset disposition impacts. |
| • | Lower net interest expense, primarily due to impacts from the fair market value method of apportioning interest expense in the United States and reduced debt. |
The reduction in loss was partly offset by:
| • | Higher proved property and equity investment impairments, including a combined $2.5 billion after-tax impairment related to the sale of our interests in the San Juan Basin and the ongoing marketing of the Barnett, as well as a $2.4 billion before- and after-tax impairment of our equity investment in APLNG. |
| • | Lower volumes primarily due to asset dispositions in our Lower 48, Asia Pacific and Middle East, and Canada segments, as well as normal field decline. |
| • | A $238 million after-tax charge associated with our early retirements of debt in 2017. |
37
2016 vs. 2015
Loss attributable to ConocoPhillips decreased $813 million in 2016. The decrease was mainly due to:
| • | Lower exploration expenses. Exploration expenses decreased mainly due to reduced leasehold impairment expense and dry hole costs. |
| • | Lower proved property and equity investment impairments, including the absence of a $1.5 billion before- and after-tax impairment of our equity investment in APLNG in 2015. |
| • | Lower production and operating expenses. |
| • | A $161 million net deferred tax benefit resulting from a reduction in the U.K. tax rate, which was enacted in September 2016 and effective January 1, 2016. |
| • | The absence of a $129 million deferred tax charge from increased corporate tax rates in Canada in 2015. |
The decrease in loss was partly offset by:
| • | Lower commodity prices. |
| • | The absence of a $555 million net deferred tax benefit resulting from a change in the U.K. tax rate in 2015. |
| • | Lower crude oil, natural gas liquids, and gas sales volumes. |
| • | Lower equity earnings, primarily driven by increased DD&A expense, as well as a 2016 deferred tax charge of $174 million resulting from the change of the tax functional currency for APLNG to U.S. dollar. |
| • | Higher interest and debt expense. |
| • | Lower gain on dispositions, mainly due to the absence of a $368 million after-tax gain on the disposition of certain properties in our Lower 48 segment. |
Income Statement Analysis
2017 vs. 2016
Sales and other operating revenues increased 23 percent in 2017, mainly due to higher realized prices across all commodities, partly offset by lower sales volumes, primarily in our Lower 48, Asia Pacific and Middle East, and Canada segments as a result of dispositions.
Equity in earnings of affiliates increased $720 million in 2017. The increase in equity earnings was primarily due to higher realized commodity prices at QG3, APLNG and FCCL; the absence of a 2016 deferred tax charge of $174 million resulting from a tax functional currency change; and reduced costs mainly from the disposition of our interest in the FCCL Partnership. The increase in earnings was partly offset by lower volumes as a result of our FCCL disposition.
Gain on dispositions increased 505 percent in 2017. The increase was primarily due to a before-tax gain of $2.1 billion on the sale of our 50 percent nonoperated interest in the FCCL Partnership, as well as the majority of our western Canada gas assets. For additional information on gains on dispositions, see Note 4-Assets Held for Sale, Sold or Acquired, in the Notes to Consolidated Financial Statements.
Other income increased 107 percent in 2017, mainly due to a $337 million before- and after-tax International Centre for Settlement of Investment Disputes (ICSID) arbitration award from The Republic of Ecuador. The increase was partly offset by the absence of a gain of $88 million from our receipt of mineral properties and active leases from the Greater Northern Iron Ore Properties Trust and a $76 million before-tax damage claim settlement, both in our Lower 48 segment in 2016.
Purchased commodities increased 25 percent in 2017, mainly due to higher commodity prices and increased activity.
38
Selling, general and administrative (SG&A) expenses decreased 22 percent in 2017, primarily due to reduced restructuring expenses, lower headcount and reduced activity.
Exploration expenses decreased 51 percent in 2017, primarily as a result of lower leasehold impairment expense, dry hole costs and other exploration expenses.
Leasehold impairment expense was reduced mainly due to the absence of 2016 before-tax charges of $203 million for our Gibson and Tiber leaseholds. The expense was further reduced by the absence of before-tax charges of $95 million for our Melmar leasehold and $79 million for various Gulf of Mexico leases after completion of marketing efforts. The reduction was partly offset by a before-tax charge of $51 million for Shenandoah in deepwater Gulf of Mexico and a before-tax charge of $38 million for certain mineral assets in our Lower 48 segment, both in 2017.
Dry hole costs were reduced primarily due to the absence of 2016 before-tax charges in deepwater Gulf of Mexico of $249 million for our Gibson and Tiber wells, and $128 million for our Melmar well. The absence of a $256 million before-tax charge in 2016 for two dry holes in Nova Scotia further reduced costs. The reduction in dry hole costs was partly offset by 2017 before-tax charges of $288 million for multiple wells in Shenandoah, including wells previously suspended, and $63 million for several wells in the Powder River Basin.
Other exploration expenses were reduced mainly due to the absence of a $146 million before-tax expense in 2016 related to the cancellation of our final Gulf of Mexico deepwater drillship contract, as well as lower rig stacking costs in Angola. The decrease in expense was partly offset by a $43 million net before-tax charge in 2017 for the settlement of our drilling rig contract in Angola.
For additional information on leasehold impairments and other exploration expenses, see Note 7-Suspended Wells and Other Exploration Expenses, and Note 8-Impairments, in the Notes to Consolidated Financial Statements.
DD&A decreased 24 percent in 2017, mainly due to lower unit-of-production rates from reserve revisions and disposition impacts in our Canada and Lower 48 segments.
Impairments increased $6,462 million in 2017. For additional information, see Note 8-Impairments, in the Notes to Consolidated Financial Statements.
Interest and debt expense decreased 12 percent in 2017, primarily due to impacts from the fair market value method of apportioning interest expense in the United States and lower interest on debt.
Other expense included before-tax charges of $302 million in 2017 for premiums on early debt retirements.
See Note 18-Income Taxes, in the Notes to Consolidated Financial Statements, for information regarding our income tax benefit and effective tax rate.
2016 vs. 2015
Sales and other operating revenues decreased 20 percent in 2016, mainly as a result of lower prices across all commodities. Additionally, sales and other operating revenues decreased due to lower natural gas, crude oil and natural gas liquids sales volumes, mainly from dispositions and field decline, partly offset by increased bitumen sales volumes.
Equity in earnings of affiliates decreased 92 percent in 2016. The decrease was primarily due to lower commodity prices, increased DD&A mainly from Trains 1 and 2 being placed in service at APLNG, and a 2016 deferred tax charge of $174 million resulting from a tax functional currency change. The decrease in earnings was partly offset by higher sales volumes at APLNG and FCCL Partnership, as well as lower production taxes at QG3.
39
Gain on dispositions decreased 39 percent in 2016. The decrease resulted from the absence of a $583 million before-tax gain in 2015 from the sales of producing properties in East Texas and North Louisiana, South Texas, and a certain pipeline and gathering assets in South Texas, as well as a $26 million before-tax loss on the sale of our interest in the Block B PSC in Indonesia in 2016. The decrease was partly offset by the absence of a $149 million before-tax loss on the disposition of noncore assets in western Canada in the fourth quarter of 2015; and gains on the 2016 dispositions of ConocoPhillips Senegal B.V., the entity that held our interests in three exploration blocks offshore Senegal, the Alaska Beluga River Unit natural gas field, and noncore assets in the Lower 48. For additional information on gains on dispositions, see Note 4-Assets Held for Sale, Sold or Acquired, in the Notes to Consolidated Financial Statements.
Other income increased 104 percent in 2016, mainly due to a gain of $88 million from our receipt of mineral properties and active leases from the Greater Northern Iron Ore Properties Trust in the fourth quarter of 2016. Other income was further increased $76 million before-tax for a damage claim settlement in our Lower 48 segment.
Purchased commodities decreased 20 percent in 2016, mainly due to lower natural gas prices.
Production and operating expenses decreased 19 percent in 2016, mainly due to lower operating expense activity, reduced headcount and dispositions of noncore assets, as well as favorable foreign currency impacts.
SG&A expenses decreased 24 percent in 2016, primarily due to reduced restructuring expenses, lower headcount and reduced activity. The decrease was partly offset by increases from market impacts on certain compensation programs.
Exploration expenses decreased 54 percent in 2016, primarily as a result of lower leasehold impairment expense, dry hole costs, and other exploration expenses.
Leasehold impairment expense was reduced, mainly due to the absence of 2015 before-tax charges of $575 million for our Chukchi Sea leasehold and capitalized interest; $493 million for Angola Blocks 36 and 37; and $447 million for certain Gulf of Mexico leases, partly offset by 2016 impairments of our Melmar, Gibson, Tiber and other Gulf of Mexico leaseholds.
Dry hole costs were reduced due to the absence of before-tax charges of $1,141 million in 2015, mainly from wells in deepwater Gulf of Mexico, Horn River and Northwest Territories in Canada, Angola Blocks 36 and 37, and Malaysia. The reduction in costs was partly offset by before-tax charges in 2016, including $434 million from several wells in deepwater Gulf of Mexico and $256 million for two wells in Nova Scotia.
Other exploration expenses were reduced mainly due to the absence of a $335 million before-tax charge in 2015 related to the termination of our Ensco Gulf of Mexico deepwater drillship contract, partly offset by before-tax rig cancellation charges and third-party costs of $146 million for our final Gulf of Mexico deepwater drillship contract in 2016.
For additional information on leasehold impairments and other exploration expenses, see Note 7-Suspended Wells and Other Exploration Expenses, and Note 8-Impairments, in the Notes to Consolidated Financial Statements.
Impairments decreased 94 percent in 2016. For additional information, see Note 8-Impairments, in the Notes to Consolidated Financial Statements.
Taxes other than income taxes decreased 18 percent in 2016, primarily as a result of lower production taxes, mainly in our Alaska and Lower 48 segments, given reduced commodity prices and the absence of the impact of a transportation cost ruling by the Federal Energy Regulatory Commission in the fourth quarter of 2015 in Alaska. Taxes other than income taxes were additionally decreased due to lower property taxes in 2016 in our Alaska and Lower 48 segments.
40
Interest and debt expense increased 35 percent in 2016, primarily due to lower capitalized interest on projects and increased debt.
See Note 18-Income Taxes, in the Notes to Consolidated Financial Statements, for information regarding our income tax benefit and effective tax rate.
Summary Operating Statistics
| 2017 | 2016 | 2015 | ||||||||||
|
| |||||||||||
Average Net Production | ||||||||||||
Crude oil (MBD)* | 599 | 598 | 605 | |||||||||
Natural gas liquids (MBD) | 111 | 145 | 156 | |||||||||
Bitumen (MBD) | 122 | 183 | 151 | |||||||||
Natural gas (MMCFD)** | 3,270 | 3,857 | 4,060 | |||||||||
| ||||||||||||
Total Production (MBOED)*** | 1,377 | 1,569 | 1,589 | |||||||||
| ||||||||||||
| Dollars Per Unit | ||||||||||||
|
| |||||||||||
Average Sales Prices | ||||||||||||
Crude oil (per barrel) | $ | 51.96 | 40.86 | 48.26 | ||||||||
Natural gas liquids (per barrel) | 25.22 | 16.68 | 17.79 | |||||||||
Bitumen (per barrel) | 22.66 | 15.27 | 18.72 | |||||||||
Natural gas (per thousand cubic feet) | 4.07 | 3.00 | 3.96 | |||||||||
| ||||||||||||
| Millions of Dollars | ||||||||||||
|
| |||||||||||
Worldwide Exploration Expenses | ||||||||||||
General and administrative; geological and geophysical, lease rental, and other | $ | 372 | 731 | 1,127 | ||||||||
Leasehold impairment | 136 | 466 | 1,924 | |||||||||
Dry holes | 430 | 718 | 1,141 | |||||||||
| ||||||||||||
| $ | 938 | 1,915 | 4,192 | |||||||||
| ||||||||||||
*Thousands of barrels per day.
**Millions of cubic feet per day. Represents quantities available for sale and excludes gas equivalent of natural gas liquids included above.
***Thousands of barrels of oil equivalent per day.
We explore for, produce, transport and market crude oil, bitumen, natural gas, LNG and natural gas liquids on a worldwide basis. At December 31, 2017, our operations were producing in the United States, Norway, the United Kingdom, Canada, Australia, Timor-Leste, Indonesia, China, Malaysia, Qatar and Libya.
Total production, including Libya, of 1,377 MBOED decreased 12 percent in 2017 compared with 2016. The decrease in total average production primarily resulted from noncore asset dispositions, including our Canada and San Juan transactions in 2017 and the sale of our interest in the Block B production sharing contract (PSC) in Indonesia in 2016, and normal field decline. The decrease in production was partly offset by production from major developments, including tight oil plays in the Lower 48; Malikai and the Kebabangan gas field in Malaysia; Surmont in Canada; and APLNG in Australia. Improved drilling and well performance in Alaska, Norway and China also partly offset the decrease in production. Excluding Libya, our 2017 production was 1,356 MBOED. Adjusted for the impact of closed and planned dispositions of 191 MBOED in 2017 and 434 MBOED in 2016 and Libya, our underlying production increased 32 MBOED, or 3 percent, compared with 2016.
In 2016, total production, including Libya, of 1,569 MBOED decreased 1 percent compared with 2015. The decrease in total average production primarily resulted from normal field decline and the loss of 72 MBOED
41
mainly attributable to the 2015 dispositions of several noncore assets in the Lower 48, western Canada and the sale of our interest in the Polar Lights Company in Russia. The decrease in production was partly offset by additional production from major developments, including tight oil plays in the Lower 48; APLNG in Australia; the Western North Slope in Alaska; the Kebabangan gas field in Malaysia; and the Greater Ekofisk Area in Norway. Improved drilling and well performance in Canada, Norway, the Lower 48, and China, as well as lower unplanned downtime in the Lower 48 also partly offset the decrease in production. Assets sold in 2016 produced 27 MBOED and 36 MBOED in 2016 and 2015, respectively.
Alaska
| 2017 | 2016 | 2015 | ||||||||||
|
| |||||||||||
Net Income Attributable to ConocoPhillips (millions of dollars) | $ | 1,466 | 319 | 4 | ||||||||
| ||||||||||||
Average Net Production | ||||||||||||
Crude oil (MBD) | 167 | 163 | 158 | |||||||||
Natural gas liquids (MBD) | 14 | 12 | 13 | |||||||||
Natural gas (MMCFD) | 7 | 25 | 42 | |||||||||
| ||||||||||||
Total Production (MBOED) | 182 | 179 | 178 | |||||||||
| ||||||||||||
Average Sales Prices | ||||||||||||
Crude oil (per barrel) | $ | 53.33 | 41.93 | 51.61 | ||||||||
Natural gas (per thousand cubic feet) | 2.72 | 5.22 | 4.33 | |||||||||
| ||||||||||||
The Alaska segment primarily explores for, produces, transports and markets crude oil, natural gas liquids, natural gas and LNG. In 2017, Alaska contributed 22 percent of our worldwide liquids production and less than 1 percent of our natural gas production.
2017 vs. 2016
Alaska reported earnings of $1,466 million in 2017, compared with earnings of $319 million in 2016. The increase in earnings was mainly due to an $892 million tax benefit from the revaluation of allocated U.S. deferred taxes at a lower federal statutory rate, in accordance with the newly enacted Tax Legislation. Earnings were additionally improved due to higher crude oil prices in 2017. The earnings increase was partly offset by a $110 million after-tax impairment charge for the associated properties, plants and equipment of our small interest in the Point Thomson unit.
Average production increased 2 percent in 2017 compared with 2016, as the impact of normal field decline was more than offset by well performance in the Western North Slope, Greater Prudhoe and Greater Kuparuk areas and lower unplanned downtime.
2016 vs. 2015
Alaska reported earnings of $319 million in 2016, compared with earnings of $4 million in 2015. The increase in earnings was mainly due to:
| • | Lower exploration expenses, primarily due to the absence of the 2015 impairment charge for our Chukchi Sea leasehold and capitalized interest. For additional information on our impairments, see Note 8-Impairments, in the Notes to Consolidated Financial Statements. |
| • | Reduced production and operating expense, mainly from lower maintenance costs and general and administrative expenses. |
| • | Enhanced oil recovery tax credits. |
42
| • | Higher crude oil sales volumes, partly offset by the absence of LNG sales volumes. |
| • | A $57 million after-tax impact for the recognition of state deferred tax assets. |
| • | A $36 million after-tax gain on the sale of our interest in the Alaska Beluga River Unit natural gas field. |
The increase in earnings was partly offset by lower crude oil prices and higher DD&A expense, mainly due to capital additions.
Average production increased 1 percent in 2016 compared with 2015, primarily due to new production from the Alpine CD5 drill site and strong well performance in the Greater Prudhoe Area. The production increase was partly offset by normal field decline.
Acquisition
In January 2018, we entered into an agreement to acquire certain oil and gas assets in Alaska for $400 million, subject to customary adjustments. The acquisition is subject to regulatory approval. We will have a 100 percent interest in approximately 1.2 million acres of exploration and development lands, including the Willow Discovery.
Lower 48
| 2017 | 2016 | 2015 | ||||||||||
|
| |||||||||||
Net Loss Attributable to ConocoPhillips (millions of dollars) | $ | (2,371 | ) | (2,257 | ) | (1,932 | ) | |||||
| ||||||||||||
Average Net Production | ||||||||||||
Crude oil (MBD) | 180 | 195 | 206 | |||||||||
Natural gas liquids (MBD) | 69 | 88 | 94 | |||||||||
Natural gas (MMCFD) | 898 | 1,219 | 1,472 | |||||||||
| ||||||||||||
Total Production (MBOED) | 399 | 486 | 545 | |||||||||
| ||||||||||||
Average Sales Prices | ||||||||||||
Crude oil (per barrel) | $ | 47.36 | 37.49 | 42.62 | ||||||||
Natural gas liquids (per barrel) | 22.20 | 14.34 | 14.01 | |||||||||
Natural gas (per thousand cubic feet) | 2.73 | 2.20 | 2.43 | |||||||||
| ||||||||||||
The Lower 48 segment consists of operations located in the U.S. Lower 48 states and exploration activities in the Gulf of Mexico. During 2017, the Lower 48 contributed 30 percent of our worldwide liquids production and 27 percent of our natural gas production.
2017 vs. 2016
Lower 48 reported a loss of $2,371 million after-tax in 2017, compared with a loss of $2,257 million after-tax in 2016. The increase in loss was primarily due to proved property impairments in 2017, totaling $2.5 billion after-tax, for our interests in the San Juan Basin and the Barnett which were written down to fair value less costs to sell. Lower natural gas, crude oil and natural gas liquids sales volumes from asset dispositions and normal field decline further increased losses during the year.
43
The increase in losses was partly offset by:
| • | Lower DD&A expense, mainly resulting from a lower unit-of-production rate from reserve revisions, disposition impacts and lower volumes. |
| • | A $689 million tax benefit, primarily related to the revaluation of allocated U.S. deferred taxes at a lower federal statutory rate, in accordance with the newly enacted Tax Legislation. |
| • | Higher realized crude oil, natural gas liquids and natural gas prices. |
| • | Lower exploration expenses mainly due to: |
| ¡ | Lower leasehold impairment expense, primarily the absence of 2016 after-tax charges of $132 million for our Gibson and Tiber leaseholds; $62 million for our Melmar leasehold and $52 million for various Gulf of Mexico leases after completion of marketing efforts. The reduction was partly offset by an after-tax charge of $33 million for Shenandoah in deepwater Gulf of Mexico and an after-tax charge of $24 million for certain mineral assets, both in 2017. |
| ¡ | Lower other exploration expenses, mainly due to the absence of a $95 million after-tax expense in 2016 related to the cancellation of our final Gulf of Mexico deepwater drillship contract. |
| ¡ | Lower dry hole costs primarily due to the absence of 2016 after-tax charges in deepwater Gulf of Mexico of $162 million for our Gibson and Tiber wells, and $83 million for our Melmar well, partly offset by 2017 after-tax charges of $187 million for multiple wells in Shenandoah and $41 million for several wells in the Powder River Basin. |
In 2017, our average realized crude oil price of $47.36 per barrel was 7 percent less than WTI of $50.90 per barrel. The differential is driven primarily by local market dynamics in the Gulf Coast and Bakken.
Total average production decreased 18 percent in 2017 compared with 2016. The decrease was mainly attributable to normal field decline and the disposition of our interests in the San Juan Basin, partly offset by new production, primarily from Eagle Ford and Bakken.
Asset Disposition
On July 31, 2017, we completed the sale of our interests in the San Juan Basin for total proceeds comprised of $2.5 billion in cash after customary adjustments and a contingent payment of up to $300 million. The six-year contingent payment, effective beginning January 1, 2018, is due annually for the periods in which the monthly U.S. Henry Hub price is at or above $3.20 per million British thermal units.
On September 29, 2017, we completed the sale of our interest in the Panhandle assets for $178 million in cash after customary adjustments.
For additional information on our asset sales in the Lower 48, see Note 4-Assets Held for Sale, Sold or Acquired, in the Notes to Consolidated Financial Statements.
2016 vs. 2015
Lower 48 reported a loss of $2,257 million after-tax in 2016, compared with a loss of $1,932 million after-tax in 2015. The increase in losses was primarily due to:
| • | The absence of a $368 million after-tax gain on the disposition of certain properties in South Texas, East Texas and North Louisiana. |
| • | Lower crude oil and natural gas prices. |
| • | Lower sales volumes across all commodities due to dispositions and field decline. |
| • | Higher proved property impairments, including a $49 million after-tax impairment associated with changes to development plans for Eagle Ford infrastructure. |
44
The increase in losses was partly offset by:
| • | Lower production and operating expenses, mainly due to reduced activity and cost efficiencies. |
| • | Lower exploration expenses, mainly due to: |
| ¡ | Reduced other exploration costs, mainly due to the absence of a $216 million after-tax charge related to the termination of our Gulf of Mexico deepwater drillship contract with Ensco in 2015, partly offset by 2016 rig cancellation and related third party costs of $95 million after-tax for our final Gulf of Mexico deepwater drillship contract. |
| ¡ | Lower general and administrative, and geological and geophysical expenses. |
| ¡ | Lower leasehold impairment expense, including the absence of 2015 after-tax charges of $154 million for certain leases in the Gulf of Mexico and $100 million for various blocks in the Gila Prospect. The decrease in leasehold impairment was partly offset by 2016 after-tax charges of $132 million for our Gibson and Tiber leaseholds and $62 million for the Melmar Prospect, all in the Gulf of Mexico. |
| ¡ | Lower exploration expenses were partly offset by slightly increased dry hole costs in 2016, including after-tax charges in deepwater Gulf of Mexico of $162 million for our Gibson and Tiber wells and $83 million associated with our Melmar well. Dry hole costs in 2016 were partly offset by the absence of a $111 million after-tax charge in 2015 associated with two wells in the Gila Prospect in the deepwater Gulf of Mexico. |
| • | An $88 million gain associated with our receipt of Greater Northern Iron Ore Properties Trust assets in the fourth quarter of 2016. |
| • | A $48 million after-tax benefit from a damage claim settlement. |
| • | A $38 million after-tax gain from the disposition of noncore assets and lease exchanges. |
| • | Lower DD&A, mainly due to 2016 reserve additions and reduced volumes, partly offset by price-related reserve revisions. |
Total average production decreased 11 percent in 2016 compared with 2015. The decrease was mainly attributable to normal field decline and the 2015 disposition of noncore properties in East Texas and North Louisiana, as well as South Texas. The reduction was partly offset by new production and well performance, primarily from Eagle Ford, Bakken and the Permian Basin, as well as lower unplanned downtime.
45
Canada
| 2017 | 2016 | 2015 | ||||||||||
|
| |||||||||||
Net Income (Loss) Attributable to ConocoPhillips (millions of dollars) | $ | 2,564 | (935) | (1,044) | ||||||||
| ||||||||||||
Average Net Production | ||||||||||||
Crude oil (MBD) | 3 | 7 | 12 | |||||||||
Natural gas liquids (MBD) | 9 | 23 | 26 | |||||||||
Bitumen (MBD) | ||||||||||||
Consolidated operations | 59 | 35 | 13 | |||||||||
Equity affiliates | 63 | 148 | 138 | |||||||||
| ||||||||||||
Total bitumen | 122 | 183 | 151 | |||||||||
| ||||||||||||
Natural gas (MMCFD) | 187 | 524 | 715 | |||||||||
| ||||||||||||
Total Production (MBOED) | 165 | 300 | 308 | |||||||||
| ||||||||||||
Average Sales Prices | ||||||||||||
Crude oil (per barrel) | $ | 43.69 | 35.25 | 39.52 | ||||||||
Natural gas liquids (per barrel) | 21.51 | 14.82 | 17.02 | |||||||||
Bitumen (dollars per barrel) | ||||||||||||
Consolidated operations | 21.43 | 12.91 | 20.13 | |||||||||
Equity affiliates | 23.83 | 15.80 | 18.58 | |||||||||
Total bitumen | 22.66 | 15.27 | 18.72 | |||||||||
Natural gas (per thousand cubic feet) | 1.93 | 1.49 | 1.91 | |||||||||
| ||||||||||||
Our Canadian operations mainly consist of an oil sands development in the Athabasca region of northeastern Alberta and a liquids-rich unconventional play in western Canada. In 2017, Canada contributed 16 percent of our worldwide liquids production and 6 percent of our worldwide natural gas production.
2017 vs. 2016
Canada operations reported earnings of $2,564 million in 2017, an increase of $3,499 million compared with 2016. The earnings increase was mainly due to an after-tax gain of $1.6 billion on the sale of certain Canadian assets, further discussed below, as well as the recognition of $996 million in deferred tax benefits related to the capital gains component of our disposition and the recognition of previously unrealizable Canadian tax basis.
In addition to the items discussed above, earnings were further increased due to:
| • | Lower DD&A, mainly from disposition impacts. |
| • | Lower dry hole costs, mainly due to the absence of 2016 combined after-tax charges in offshore Nova Scotia of $187 million for our Cheshire and Monterey Jack wells. |
| • | Higher realized prices across all commodities. |
| • | A $114 million tax benefit related to our prior decision to exit Nova Scotia deepwater exploration. |
| • | Lower production and operating expenses. |
| • | Improved equity earnings, as improved prices and reduced DD&A more than offset the volume loss from our Canada disposition. |
46
The earnings increase was partly offset by additional volume reductions from the disposition of our western Canada gas assets.
Total average production decreased 45 percent in 2017 compared with 2016. The production decrease was primarily due to the Canada disposition, partly offset by production ramp-up at Surmont.
Asset Disposition
On May 17, 2017, we completed the sale of our 50 percent nonoperated interest in the FCCL Partnership, as well as the majority of our western Canada gas assets to Cenovus Energy. Consideration for the transaction was $11.0 billion in cash after customary adjustments, 208 million Cenovus Energy common shares and a five-year uncapped contingent payment. The contingent payment, calculated and paid on a quarterly basis, is $6 million Canadian dollars (CAD) for every $1 CAD by which the Western Canada Select (WCS) quarterly average crude price exceeds $52 CAD per barrel. See Note 4-Assets Held for Sale, Sold or Acquired and Note 6-Investment in Cenovus Energy, in the Notes to Consolidated Financial Statements, for additional information regarding our Canada disposition.
2016 vs. 2015
Canada operations reported a loss of $935 million in 2016, a decrease in loss of $109 million compared with 2015. The decrease in loss was primarily due to:
| • | The absence of a $136 million impact of a 2 percent increase in Alberta corporate tax rates on deferred taxes in 2015. |
| • | Lower production and operating expenses, mainly due to reduced headcount and the disposition of noncore assets in western Canada. |
| • | Lower exploration expenses, mainly due to: |
| ¡ | Reduced leasehold impairment expense, including the absence of an impairment charge for undeveloped leasehold in the Duvernay, Thornbury, Saleski and Crow Lake areas. The reduction in leasehold impairment expense was partly offset by a $23 million after-tax charge in the fourth quarter of 2016 primarily due to decisions to discontinue further testing on undeveloped leaseholds. |
| ¡ | Lower general and administrative, and geological and geophysical expenses. |
| ¡ | Lower dry hole costs, mainly due to the absence of 2015 charges associated with our Horn River, Northwest Territories, Thornbury and Saleski properties, partly offset by dry hole costs in 2016, including total after-tax charges in offshore Nova Scotia of $187 million for our Cheshire and Monterey Jack wells. |
| • | Higher gains on dispositions, including the absence of a $103 million net after-tax loss on the disposition of noncore assets in western Canada in 2015. |
The decrease in loss was partly offset by lower commodity prices; higher DD&A expense, mainly from price-related reserve revisions; and a $42 million after-tax impairment charge related to certain developed properties in central Alberta, which were classified as held for sale, being written down to fair value less costs to sell.
Total average production decreased 3 percent in 2016 compared with 2015, while bitumen production increased 21 percent over the same periods. The decrease in total production was mainly attributable to the disposition of noncore assets in western Canada and normal field decline. The production decrease was partly offset by strong well performance in western Canada, Surmont and FCCL.
47
Europe and North Africa
| 2017 | 2016 | 2015 | ||||||||||
|
| |||||||||||
Net Income Attributable to ConocoPhillips (millions of dollars) | $ | 553 | 394 | 409 | ||||||||
Average Net Production | ||||||||||||
Crude oil (MBD) | 142 | 122 | 120 | |||||||||
Natural gas liquids (MBD) | 8 | 7 | 7 | |||||||||
Natural gas (MMCFD) | 484 | 460 | 476 | |||||||||
Total Production (MBOED) | 230 | 205 | 207 | |||||||||
Average Sales Prices | ||||||||||||
Crude oil (dollars per barrel) | $ | 54.21 | 43.66 | 52.75 | ||||||||
Natural gas liquids (per barrel) | 34.07 | 22.62 | 27.56 | |||||||||
Natural gas (per thousand cubic feet) | 5.70 | 4.71 | 7.14 | |||||||||
The Europe and North Africa segment consists of operations principally located in the Norwegian and U.K. sectors of the North Sea, the Norwegian Sea and Libya. In 2017, our Europe and North Africa operations contributed 18 percent of our worldwide liquids production and 15 percent of our natural gas production.
2017 vs. 2016
Earnings for Europe and North Africa operations of $553 million increased 40 percent in 2017. The increase in earnings was primarily due to higher realized crude oil, natural gas and natural gas liquids prices. Earnings were additionally improved by lower DD&A, mainly due to reserve revisions; a $60 million tax benefit from the revaluation of allocated U.S. deferred taxes at a lower U.S. federal statutory rate, in accordance with the newly enacted Tax Legislation; and a $41 million tax benefit in Norway.
The increase in earnings was partly offset by the absence of a 2016 net deferred tax benefit of $161 million resulting from a change in the U.K. tax rate and a lower credit to impairment in 2017, compared to 2016, reflecting the annual updates to asset retirement obligations (ARO) on fields at or nearing the end of life which were impaired in prior years. The earnings improvement was further reduced by a net deferred tax charge of $65 million in the U.K. resulting from updated assumptions regarding applicable tax rates.
Average production increased 12 percent in 2017, compared with 2016. The increase was mainly due to the resumption and ramp-up of production in Libya; improved drilling and well performance in Norway; new production from the Greater Britannia Area and Norway; and higher Norway gas offtake, partly offset by normal field decline.
2016 vs. 2015
Earnings for Europe and North Africa operations of $394 million decreased 4 percent in 2016. The decrease in earnings was primarily due to the absence of a $555 million net deferred tax benefit as a result of a change in the U.K. tax rate, effective at the beginning of 2015; lower crude oil and natural gas prices; lower sales volumes; and the absence of a 2015 after-tax gain of $49 million on the sale of our 1.9 percent interest in Norwegian Continental Shelf Gas Transportation (Gassled).
48
The decrease in earnings was partly offset by:
| • | Lower property impairments, including the absence of 2015 after-tax charges of $317 million in the U.K. due to lower crude oil and natural gas prices, and a $180 million credit to impairment in 2016 due to decreased ARO estimates on fields at or nearing the end of life which were impaired in prior years. The reduction in property impairments was partly offset by a $59 million after-tax charge associated with our Calder Field and Rivers terminal in the U.K. For additional information on our impairments, see Note 8-Impairments, in the Notes to Consolidated Financial Statements. |
| • | Lower DD&A expense in the U.K. driven by reduced rate, as a result of completed depreciation on the Brodgar H3 tie-back well in 2015, and lower volumes. |
| • | A $161 million net deferred tax benefit resulting from a reduction in the U.K. tax rate, which was enacted in September 2016 and effective January 1, 2016. |
| • | Reduced operating expenses across the segment. |
Average production decreased 1 percent in 2016, compared with 2015. The decrease in production was mainly due to normal field decline, partly offset by improved drilling and well performance in Norway and new production from the Greater Ekofisk and Greater Britannia areas. Libya production remained largely shut in, as the Es Sider crude oil export terminal closure continued throughout the third quarter of 2016. Production resumed in Libya in October 2016.
49
Asia Pacific and Middle East
| 2017 | 2016 | 2015 | ||||||||||
|
| |||||||||||
Net Income (Loss) Attributable to ConocoPhillips (millions of dollars) | $ | (1,098) | 209 | (463) | ||||||||
Average Net Production | ||||||||||||
Crude oil (MBD) | ||||||||||||
Consolidated operations | 93 | 97 | 91 | |||||||||
Equity affiliates | 14 | 14 | 14 | |||||||||
| ||||||||||||
Total crude oil | 107 | 111 | 105 | |||||||||
| ||||||||||||
Natural gas liquids (MBD) | ||||||||||||
Consolidated operations | 4 | 7 | 9 | |||||||||
Equity affiliates | 7 | 8 | 7 | |||||||||
| ||||||||||||
Total natural gas liquids | 11 | 15 | 16 | |||||||||
| ||||||||||||
Natural gas (MMCFD) | ||||||||||||
Consolidated operations | 687 | 730 | 717 | |||||||||
Equity affiliates | 1,007 | 899 | 638 | |||||||||
| ||||||||||||
Total natural gas | 1,694 | 1,629 | 1,355 | |||||||||
| ||||||||||||
Total Production (MBOED) | 401 | 399 | 347 | |||||||||
| ||||||||||||
Average Sales Prices | ||||||||||||
Crude oil (dollars per barrel) | ||||||||||||
Consolidated operations | $ | 54.38 | 42.23 | 49.70 | ||||||||
Equity affiliates | 54.76 | 44.11 | 53.12 | |||||||||
Total crude oil | 54.43 | 42.47 | 50.16 | |||||||||
Natural gas liquids (dollars per barrel) | ||||||||||||
Consolidated operations | 41.37 | 29.00 | 37.78 | |||||||||
Equity affiliates | 38.74 | 31.13 | 35.79 | |||||||||
Total natural gas liquids | 39.75 | 30.11 | 36.88 | |||||||||
Natural gas (dollars per thousand cubic feet) | ||||||||||||
Consolidated operations | 4.98 | 4.31 | 6.23 | |||||||||
Equity affiliates | 4.27 | 2.97 | 4.83 | |||||||||
Total natural gas | 4.55 | 3.57 | 5.58 | |||||||||
| ||||||||||||
The Asia Pacific and Middle East segment has operations in China, Indonesia, Malaysia, Australia, Timor-Leste and Qatar, as well as exploration activities in Brunei. During 2017, Asia Pacific and Middle East contributed 14 percent of our worldwide liquids production and 52 percent of our natural gas production.
2017 vs. 2016
Asia Pacific and Middle East reported a loss of $1,098 million in 2017, compared with earnings of $209 million in 2016. The increase in loss was mainly due to a $2,384 million before- and after-tax charge for the impairment of our APLNG investment in 2017. For additional information on our APLNG impairment, see the "APLNG" section of Note 5-Investments, Loans and Long-Term Receivables, in the Notes to Consolidated Financial Statements. Additionally, lower sales volumes in Indonesia, Australia and China further increased losses.
50
The increase in losses was partly offset by higher equity earnings, mainly as a result of higher commodity prices, increased sales volumes at APLNG and the absence of a 2016 deferred tax charge of $174 million resulting from the change of our APLNG tax functional currency. Higher realized crude oil and natural gas prices on non-equity volumes further reduced the loss.
Average production was essentially flat in 2017.
2016 vs. 2015
Asia Pacific and Middle East reported earnings of $209 million in 2016, compared with a loss of $463 million in 2015. The earnings increase was mainly due to:
| • | The absence of a $1,502 million before- and after-tax charge for the impairment of our APLNG investment in 2015. For additional information on our APLNG impairment, see the "APLNG" section of Note 5-Investments, Loans and Long-Term Receivables, in the Notes to Consolidated Financial Statements. |
| • | Higher LNG sales volumes. |
| • | Lower production taxes. |
| • | Reduced feedstock costs at Darwin LNG. |
| • | Lower operating expenses, mainly due to lower general and administrative spend, maintenance costs and transportation expenses across the segment. |
| • | Lower exploration expenses, mainly due to lower dry hole costs, as well as the absence of a $41 million after-tax charge in 2015 for the impairment of our relinquished Palangkaraya PSC, and reduced exploration general and administrative expense. |
The earnings increase was partly offset by lower prices across all commodities; lower equity earnings from APLNG, mainly as a result of higher DD&A expense from APLNG Trains 1 and 2 coming online; and a third-quarter 2016 deferred tax charge of $174 million resulting from APLNG's tax functional currency change.
Average production increased 15 percent in 2016, compared with 2015. The production increase in 2016 was mainly attributable to new production from the ramp-up of APLNG in Australia and the Kebabangan gas field in Malaysia, improved drilling and well performance in China and Malaysia, and increased recoveries from production sharing contracts in Indonesia. The production increase was partially offset by normal field decline across the segment.
Other International
| 2017 | 2016 | 2015 | ||||||||||
|
| |||||||||||
Net Income (Loss) Attributable to ConocoPhillips (millions of dollars) | $ | 167 | (16) | (593) | ||||||||
| ||||||||||||
Average Net Production | ||||||||||||
Crude oil (MBD) | ||||||||||||
Equity affiliates | - | - | 4 | |||||||||
| ||||||||||||
Total Production (MBOED) | - | - | 4 | |||||||||
| ||||||||||||
Average Sales Prices | ||||||||||||
Crude oil (dollars per barrel) | ||||||||||||
Equity affiliates | - | - | 37.21 | |||||||||
| ||||||||||||
The Other International segment includes exploration activities in Colombia and Chile.
51
2017 vs. 2016
Other International operations reported earnings of $167 million in 2017, compared with a loss of $16 million in 2016. The increase in earnings was primarily due to a $320 million before- and after-tax ICSID award from an arbitration with The Republic of Ecuador. Earnings were additionally increased due to lower rig stacking costs in Angola. The increase in earnings was partly offset by the absence of a $138 million gain in 2016 on the disposition of ConocoPhillips Senegal B.V., the entity that held our interest in three exploration blocks offshore Senegal, and a $45 million tax charge from the revaluation of allocated U.S. deferred taxes at a lower U.S. federal statutory rate, in accordance with the newly enacted Tax Legislation.
2016 vs. 2015
Other International operations reported a loss of $16 million in 2016, compared with a loss of $593 million in 2015. The decrease in losses was primarily due to the absence of after-tax charges in 2015 of $235 million, $75 million and $32 million net for property impairments on our Angola Block 36, Angola Block 37 and Poland leasehold, respectively. Additionally, losses decreased due to the absence of the 2015 after-tax dry hole expenses offshore Angola of $81 million for the Omosi-1 well and $59 million for the Vali-1 well, combined with a $138 million gain on the 2016 disposition of ConocoPhillips Senegal B.V., the entity that held our interest in three exploration blocks offshore Senegal.
Corporate and Other
| Millions of Dollars | ||||||||||||
|
| |||||||||||
| 2017 | 2016 | 2015 | ||||||||||
|
| |||||||||||
Net Loss Attributable to ConocoPhillips | ||||||||||||
Net interest | $ | (739 | ) | (980 | ) | (518 | ) | |||||
Corporate general and administrative expenses | (284 | ) | (289 | ) | (246 | ) | ||||||
Technology | 20 | 50 | 122 | |||||||||
Other | (1,133 | ) | (110 | ) | (167 | ) | ||||||
| ||||||||||||
| $ | (2,136 | ) | (1,329 | ) | (809 | ) | ||||||
| ||||||||||||
2017 vs. 2016
Net interest consists of interest and financing expense, net of interest income and capitalized interest. Net interest decreased 25 percent in 2017 compared with 2016, primarily due to impacts from the fair market value method of apportioning interest expense in the United States and lower interest as a result of reduced debt. Higher interest income further drove the decrease in net interest, which was partly offset by lower capitalized interest on projects.
Corporate general and administrative expenses which include pension settlement expenses and compensation program costs was essentially flat in 2017.
Technology includes our investment in new technologies or businesses, as well as licensing revenues received. Activities are focused on tight oil reservoirs, LNG, oil sands and other production operations. Earnings from Technology were $20 million in 2017, compared with $50 million in 2016. The decrease in earnings primarily resulted from lower licensing revenues, partly offset by reduced technology program spend.
The category "Other" includes certain foreign currency transaction gains and losses, environmental costs associated with sites no longer in operation, other costs not directly associated with an operating segment and premiums incurred on the early retirement of debt. "Other" expenses increased $1,023 million in 2017, mainly due to an $813 million tax charge from the revaluation of deferred taxes at a lower federal statutory rate, in accordance with the newly enacted Tax Legislation and premiums on our early retirement of debt.
52
2016 vs. 2015
Net interest increased 89 percent in 2016 compared with 2015, primarily as a result of the absence of the 2015 impacts from the fair market value of apportioning interest expense in the United States, lower capitalized interest on projects, and increased debt.
Corporate general and administrative expenses increased 17 percent in 2016, mainly due to increases from market impacts on certain compensation programs, partly offset by lower staff expenses.
Earnings from Technology were $50 million in 2016, compared with $122 million in 2015. The decrease in earnings primarily resulted from lower licensing revenues, partly offset by reduced technology program spend.
"Other" expenses decreased 34 percent in 2016, mainly due to lower restructuring costs and favorable foreign currency impacts, partly offset by the absence of a 2015 tax benefit.
53
CAPITAL RESOURCES AND LIQUIDITY
Financial Indicators
Millions of Dollars Except as Indicated | ||||||||||||
|
| |||||||||||
| 2017 | 2016 | 2015 | ||||||||||
|
| |||||||||||
Net cash provided by operating activities | $ | 7,077 | 4,403 | 7,572 | ||||||||
Cash and cash equivalents | 6,325 | 3,610 | 2,368 | |||||||||
Short-term debt | 2,575 | 1,089 | 1,427 | |||||||||
Total debt | 19,703 | 27,275 | 24,880 | |||||||||
Total equity | 30,801 | 35,226 | 40,082 | |||||||||
Percent of total debt to capital* | 39 | % | 44 | 38 | ||||||||
Percent of floating-rate debt to total debt | 5 | % | 9 | 7 | ||||||||
*Capital includes total debt and total equity.
To meet our short- and long-term liquidity requirements, we look to a variety of funding sources, including cash generated from operating activities, proceeds from asset sales, our commercial paper and credit facility programs and our shelf registration statement. In 2017, the primary uses of our available cash were $7,876 million to reduce debt; $4,591 million to support our ongoing capital expenditures and investments program; $1,305 million to pay dividends on our common stock; $1,790 million net purchases of short-term investments; $3,000 million to repurchase our common stock; and a $600 million contribution to our domestic qualified pension plan. During 2017, cash and cash equivalents increased by $2,715 million to $6,325 million.
We believe current cash balances and cash generated by operations, together with access to external sources of funds as described below in the "Significant Sources of Capital" section, will be sufficient to meet our funding requirements in the near and long term, including our capital spending program, share repurchases, dividend payments and required debt payments.
Significant Sources of Capital
Operating Activities
During 2017, cash provided by operating activities was $7,077 million, a 61 percent increase from 2016. The increase was primarily due to higher prices across all commodities.
While the stability of our cash flows from operating activities benefits from geographic diversity, our short- and long-term operating cash flows are highly dependent upon prices for crude oil, bitumen, natural gas, LNG and natural gas liquids. Prices and margins in our industry have historically been volatile and are driven by market conditions over which we have no control. Absent other mitigating factors, as these prices and margins fluctuate, we would expect a corresponding change in our operating cash flows.
The level of absolute production volumes, as well as product and location mix, impacts our cash flows. Our 2017 production averaged 1,377 MBOED. Full-year 2018 production is expected to be 1,195 to 1,235 MBOED. This results in approximately 5 percent growth compared with full-year 2017 underlying production, which excludes the impact of closed and planned dispositions of 191 MBOED. Production guidance for 2018 excludes Libya. Future production is subject to numerous uncertainties, including, among others, the volatile crude oil and natural gas price environment, which may impact investment decisions; the effects of price changes on production sharing and variable-royalty contracts; acquisition and disposition of fields; field production decline rates; new technologies; operating efficiencies; timing of startups and major turnarounds; political instability; weather-related disruptions; and the addition of proved reserves through exploratory success and their timely and cost-effective development. While we actively manage these factors, production levels can cause variability in cash flows, although generally this variability has not been as significant as that caused by commodity prices.
54
To maintain or grow our production volumes on an ongoing basis, we must continue to add to our proved reserve base. Our total reserve replacement in 2017 was negative 168 percent. Our organic reserve replacement, which excludes the impact of sales and purchases, was 200 percent in 2017. Over the five-year period ended December 31, 2017, our reserve replacement was a negative 24 percent (including 3 percent from consolidated operations) reflecting the impact of asset dispositions and lower prices. The total reserve replacement amount above is based on the sum of our net additions (revisions, improved recovery, purchases, extensions and discoveries, and sales) divided by our production, as shown in our reserve table disclosures. For additional information about our 2018 capital budget, see the "2018 Capital Budget" section within "Capital Resources and Liquidity" and for additional information on proved reserves, including both developed and undeveloped reserves, see the "Oil and Gas Operations" section of this report.
As discussed in the "Critical Accounting Estimates" section, engineering estimates of proved reserves are imprecise; therefore, each year reserves may be revised upward or downward due to the impact of changes in commodity prices or as more technical data becomes available on reservoirs. In 2017, revisions increased reserves, while in 2016 and 2015, revisions decreased reserves. It is not possible to reliably predict how revisions will impact reserve quantities in the future.
Investing Activities
Proceeds from asset sales in 2017 were $13.9 billion. We completed the sale of our 50 percent nonoperated interest in the FCCL Partnership, as well as the majority of our western Canada gas assets to Cenovus Energy. Consideration for the transaction included $11.0 billion in cash after customary adjustments and 208 million Cenovus Energy common shares. We completed the sale of our interests in the San Juan Basin to an affiliate of Hilcorp Energy Company. Total proceeds for the sale was $2.5 billion in cash after customary adjustments. We also completed the sale of our interest in the Panhandle assets for $178 million in cash after customary adjustments.
Proceeds from asset dispositions in 2016 were $1.3 billion, primarily from the sales of ConocoPhillips Senegal B.V., the entity that held our 35 percent interest in three exploration blocks offshore Senegal; our 40 percent interest in South Natuna Sea Block B in Indonesia; our interest in the Alaska Beluga River Unit natural gas field in the Cook Inlet; and certain mineral and non-mineral fee lands in northeastern Minnesota.
For additional information on our dispositions and investment in Cenovus common shares, see Note 4-Assets Held for Sale, Sold or Acquired and Note 6-Investment in Cenovus Energy, in the Notes to Consolidated Financial Statements, and the Results of Operations section within Management's Discussion and Analysis.
Commercial Paper and Credit Facilities
We have a revolving credit facility totaling $6.75 billion, expiring in June 2019. Our revolving credit facility may be used for direct bank borrowings, the issuance of letters of credit totaling up to $500 million, or as support for our commercial paper programs. The revolving credit facility is broadly syndicated among financial institutions and does not contain any material adverse change provisions or any covenants requiring maintenance of specified financial ratios or credit ratings. The facility agreement contains a cross-default provision relating to the failure to pay principal or interest on other debt obligations of $200 million or more by ConocoPhillips, or any of its consolidated subsidiaries.
Credit facility borrowings may bear interest at a margin above rates offered by certain designated banks in the London interbank market or at a margin above the overnight federal funds rate or prime rates offered by certain designated banks in the United States. The agreement calls for commitment fees on available, but unused, amounts. The agreement also contains early termination rights if our current directors or their approved successors cease to be a majority of the Board of Directors.
We have two commercial paper programs. The ConocoPhillips $6.25 billion commercial paper program is available to fund short-term working capital needs. We also have the ConocoPhillips Qatar Funding Ltd. $500 million commercial paper program, which is used to fund commitments relating to QG3. Commercial paper maturities are generally limited to 90 days. We had no commercial paper outstanding at December 31, 2017 or 2016, under either the ConocoPhillips or the ConocoPhillips Qatar Funding Ltd. commercial paper
55
program. We had no direct borrowings or letters of credit issued under the revolving credit facility. Since we had no commercial paper outstanding and had issued no letters of credit, we had access to $6.75 billion in borrowing capacity under our revolving credit facility at December 31, 2017.
In the first quarter of 2017, Fitch and Standard & Poor's reflected an improvement in their outlook for our debt from "negative" to "stable" and affirmed our long-term debt rating at "A-." In January 2018, Fitch further improved their outlook for our debt from "stable" to "positive." After improving their outlook for our debt from "negative" to "positive" in the first quarter of 2017, Moody's Investor Services upgraded our long-term debt rating from "Baa2" to "Baa1" with a stable outlook in the third quarter of 2017 in response to our debt reduction. We do not have any ratings triggers on any of our corporate debt that would cause an automatic default, and thereby impact our access to liquidity, in the event of a downgrade of our credit rating. If our credit rating were downgraded, it could increase the cost of corporate debt available to us and restrict our access to the commercial paper markets. If our credit rating were to deteriorate to a level prohibiting us from accessing the commercial paper market, we would still be able to access funds under our revolving credit facility.
Certain of our project-related contracts, commercial contracts and derivative instruments contain provisions requiring us to post collateral. Many of these contracts and instruments permit us to post either cash or letters of credit as collateral. At December 31, 2017 and 2016, we had direct bank letters of credit of $338 million and $304 million, respectively, which secured performance obligations related to various purchase commitments incident to the ordinary conduct of business. In the event of credit ratings downgrades, we may be required to post additional letters of credit.
Shelf Registration
We have a universal shelf registration statement on file with the U.S. Securities and Exchange Commission (SEC) under which we, as a well-known seasoned issuer, have the ability to issue and sell an indeterminate amount of various types of debt and equity securities.
Off-Balance Sheet Arrangements
As part of our normal ongoing business operations and consistent with normal industry practice, we enter into numerous agreements with other parties to pursue business opportunities, which share costs and apportion risks among the parties as governed by the agreements.
For information about guarantees, see Note 11-Guarantees, in the Notes to Consolidated Financial Statements, which is incorporated herein by reference.
56
Capital Requirements
For information about our capital expenditures and investments, see the "Capital Expenditures" section.
Our debt balance at December 31, 2017, was $19.7 billion, a decrease of $7.6 billion from the balance at December 31, 2016.
In 2017, two notes totaling $1,001 million were paid at maturity, including the $1.0 billion 1.05% Notes due 2017. Also in 2017, we prepaid the $1,450 million term loan facility due in 2019. We also redeemed a total $5.0 billion of debt, described below, incurring $301 million in premiums above book value, which are reported in the "Other expense" line on our consolidated income statement.
| • | 6.65% Debentures due 2018 with principal of $297 million. |
| • | 5.20% Notes due 2018 with principal of $500 million. |
| • | 1.5% Notes due 2018 with principal of $750 million. |
| • | 5.75% Notes due 2019 with principal of $2.25 billion. |
| • | 6.00% Notes due 2020 with principal of $1.0 billion. |
| • | 4.20% Notes due 2021 with principal of $1.25 billion (partial redemption of $250 million). |
In the fourth quarter of 2017, we gave notice to redeem the following debt instruments totaling $2.25 billion.
| • | 2.2% Notes due 2020 with principal of $500 million. |
| • | 4.20% Notes due 2021 with remaining principal of $1.0 billion. |
| • | 2.875% Notes due 2021 with principal of $750 million. |
The prepayments occurred on January 22, 2018, and we incurred premiums above book value of $75 million.
On a longer-term basis our debt target is $15 billion by year-end 2019. In the future, we may redeem other debt instruments or purchase debt instruments in the open market or otherwise, as we seek to achieve this target. Any such redemptions or purchases would be subject to market conditions and other factors, and may be conducted or discontinued at any time without prior notice. For more information on Debt, see Note 10-Debt, in the Notes to Consolidated Financial Statements.
On January 31, 2017, we announced a 6 percent increase in the quarterly dividend to $0.265 per share. The dividend was paid on March 1, 2017, to stockholders of record at the close of business on February 14, 2017. On May 5, 2017, we announced a quarterly dividend of $0.265 per share. The dividend was paid on June 1, 2017, to stockholders of record at the close of business on May 15, 2017. On July 12, 2017, we announced a quarterly dividend of $0.265 per share. The dividend was paid on September 1, 2017, to stockholders of record at the close of business on July 24, 2017. On October 6, 2017, we announced a quarterly dividend of $0.265 per share which was paid on December 1, 2017, to stockholders of record at the close of business on October 16, 2017. Additionally, on February 1, 2018, we announced an increase in the quarterly dividend to $0.285 per share, compared with the previous quarterly dividend of $0.265 per share. The dividend is payable on March 1, 2018, to stockholders of record at the close of business on February 12, 2018.
On November 10, 2016, we announced plans to purchase up to $3 billion of our common stock through 2019. On March 29, 2017, we announced plans to double our share repurchase program to $6 billion of common stock through 2019, with $3 billion allocated and purchased in 2017, and the remainder allocated evenly to 2018 and 2019. On February 1, 2018, we announced the acceleration of our previously stated 2018 share repurchases from $1.5 billion to $2.0 billion, with the remaining balance to be repurchased in 2019. Since our share repurchase program began in November 2016, we have repurchased 66 million shares at a cost of $3.1 billion through December 31, 2017.
In addition to our previously announced share repurchase program above, we are currently planning to purchase up to an additional $1.5 billion of our common stock through 2020. Whether we undertake these additional repurchases is ultimately subject to numerous considerations, including Board authorization, market conditions and other factors. See Risk Factors "Our ability to declare and pay dividends and repurchase shares is subject to certain considerations."
During the third quarter of 2017, we made a $600 million contribution to our domestic qualified pension plan, which is included in the "Other" line in the "Cash Flows From Operating Activities" section of our
57
consolidated statement of cash flows. This additional contribution significantly lowers our domestic pension deficit which will reduce future premiums charged by the Pension Benefit Guaranty Corporation. It also mitigates the need for contributions in future quarters.
Contractual Obligations
The table below summarizes our aggregate contractual fixed and variable obligations as of December 31, 2017:
| Millions of Dollars | ||||||||||||||||||||
|
| |||||||||||||||||||
| Payments Due by Period | ||||||||||||||||||||
|
| |||||||||||||||||||
| Total | Up to 1 Year | Years 2–3 | Years 4–5 | After 5 Years | ||||||||||||||||
|
| |||||||||||||||||||
Debt obligations (a) | $ | 18,929 | 2,508 | 63 | 1,706 | 14,652 | ||||||||||||||
Capital lease obligations (b) | 774 | 67 | 147 | 132 | 428 | |||||||||||||||
| ||||||||||||||||||||
Total debt | 19,703 | 2,575 | 210 | 1,838 | 15,080 | |||||||||||||||
| ||||||||||||||||||||
Interest on debt and other obligations | 13,884 | 955 | 1,881 | 1,834 | 9,214 | |||||||||||||||
Operating lease obligations (c) | 1,548 | 278 | 628 | 433 | 209 | |||||||||||||||
Purchase obligations (d) | 10,102 | 4,210 | 1,833 | 945 | 3,114 | |||||||||||||||
Other long-term liabilities | ||||||||||||||||||||
Pension and postretirement benefit contributions (e) | 1,312 | 210 | 491 | 611 | – | |||||||||||||||
Asset retirement obligations (f) | 7,798 | 251 | 687 | 575 | 6,285 | |||||||||||||||
Accrued environmental costs (g) | 180 | 25 | 36 | 29 | 90 | |||||||||||||||
Unrecognized tax benefits (h) | 51 | 51 | (h) | (h) | (h) | |||||||||||||||
| ||||||||||||||||||||
Total | $ | 54,578 | 8,555 | 5,766 | 6,265 | 33,992 | ||||||||||||||
| ||||||||||||||||||||
| (a) | Includes $252 million of net unamortized premiums, discounts and debt issuance costs. See Note 10-Debt, in the Notes to Consolidated Financial Statements, for additional information. |
| (b) | Capital lease obligations are presented on a discounted basis. |
| (c) | Operating lease obligations are presented on an undiscounted basis. |
| (d) | Represents any agreement to purchase goods or services that is enforceable and legally binding and that specifies all significant terms, presented on an undiscounted basis. Does not include purchase commitments for jointly owned fields and facilities where we are not the operator. |
The majority of the purchase obligations are market-based contracts related to our commodity business. Product purchase commitments with third parties totaled $3,487 million.
Purchase obligations of $5,443 million are related to agreements to access and utilize the capacity of third-party equipment and facilities, including pipelines and LNG and product terminals, to transport, process, treat and store commodities. The remainder is primarily our net share of purchase commitments for materials and services for jointly owned fields and facilities where we are the operator.
| (e) | Represents contributions to qualified and nonqualified pension and postretirement benefit plans for the years 2018 through 2022. For additional information related to expected benefit payments subsequent to 2022, see Note 17-Employee Benefit Plans, in the Notes to Consolidated Financial Statements. |
58
| (f) | Represents estimated discounted costs to retire and remove long-lived assets at the end of their operations. |
| (g) | Represents estimated costs for accrued environmental expenditures presented on a discounted basis for costs acquired in various business combinations and an undiscounted basis for all other accrued environmental costs. |
| (h) | Excludes unrecognized tax benefits of $831 million because the ultimate disposition and timing of any payments to be made with regard to such amounts are not reasonably estimable. Although unrecognized tax benefits are not a contractual obligation, they are presented in this table because they represent potential demands on our liquidity. |
Capital Expenditures
| ||||||||||||
| Millions of Dollars | ||||||||||||
| 2017 | 2016 | 2015 | ||||||||||
|
| |||||||||||
Alaska | $ | 815 | 883 | 1,352 | ||||||||
Lower 48 | 2,136 | 1,262 | 3,765 | |||||||||
Canada | 202 | 698 | 1,255 | |||||||||
Europe and North Africa | 872 | 1,020 | 1,573 | |||||||||
Asia Pacific and Middle East | 482 | 838 | 1,812 | |||||||||
Other International | 21 | 104 | 173 | |||||||||
Corporate and Other | 63 | 64 | 120 | |||||||||
| ||||||||||||
Capital Program | $ | 4,591 | 4,869 | 10,050 | ||||||||
| ||||||||||||
Our capital expenditures and investments for the three-year period ended December 31, 2017, totaled $19.5 billion. The 2017 expenditures supported key exploration and developments, primarily:
| • | Oil and natural gas development and exploration and appraisal activities in the Lower 48, including Eagle Ford, Bakken, the Permian Basin, the Niobrara in the Denver-Julesburg Basin and several emerging plays. |
| • | Alaska activities related to development in the Western North Slope, Greater Kuparuk Area, and the Greater Prudhoe Area. |
| • | Development activities in Europe, including the Greater Ekofisk Area, Clair Ridge, Aasta Hansteen, and Heidrun. |
| • | Continued oil sands development and appraisal activities in liquids-rich plays in Canada. |
| • | Continued development in Malaysia, Indonesia, China, and Australia; appraisal activity in Australia and exploration activity in Malaysia. |
2018 CAPITAL BUDGET
In November 2017, we announced a 2018 capital budget of $5.5 billion, including $3.5 billion of sustaining capital and $2 billion in accretive, short-cycle unconventional programs, future major projects and exploration activities.
We are planning to allocate approximately:
| • | 51 percent of our 2018 capital expenditures budget to development drilling programs. These funds will focus predominantly on the Lower 48 unconventionals including the Eagle Ford, Bakken and Permian, as well as development drilling in Australia/Timor-Leste, Norway and Alaska. |
59
| • | 18 percent of our 2018 capital expenditures budget to maintain base production and corporate expenditures. |
| • | 17 percent of our 2018 capital expenditures budget to major projects. These funds will focus on major projects in China, Alaska, Europe and Malaysia. |
| • | 8 percent of our 2018 capital expenditures budget to new exploration activity, primarily in Alaska and the Lower 48. |
| • | 6 percent of our 2018 capital expenditures budget to development appraisal, including the Lower 48, Canada and Alaska. |
For information on proved undeveloped reserves and the associated costs to develop these reserves, see the "Oil and Gas Operations" section.
Contingencies
A number of lawsuits involving a variety of claims arising in the ordinary course of business have been filed against ConocoPhillips. We also may be required to remove or mitigate the effects on the environment of the placement, storage, disposal or release of certain chemical, mineral and petroleum substances at various active and inactive sites. We regularly assess the need for accounting recognition or disclosure of these contingencies. In the case of all known contingencies (other than those related to income taxes), we accrue a liability when the loss is probable and the amount is reasonably estimable. If a range of amounts can be reasonably estimated and no amount within the range is a better estimate than any other amount, then the minimum of the range is accrued. We do not reduce these liabilities for potential insurance or third-party recoveries. If applicable, we accrue receivables for probable insurance or other third-party recoveries. With respect to income tax related contingencies, we use a cumulative probability-weighted loss accrual in cases where sustaining a tax position is less than certain.
Based on currently available information, we believe it is remote that future costs related to known contingent liability exposures will exceed current accruals by an amount that would have a material adverse impact on our consolidated financial statements. For information on other contingencies, see "Critical Accounting Estimates" and Note 12-Contingencies and Commitments, in the Notes to Consolidated Financial Statements.
Legal and Tax Matters
We are subject to various lawsuits and claims including but not limited to matters involving oil and gas royalty and severance tax payments, gas measurement and valuation methods, contract disputes, environmental damages, personal injury, and property damage. Our primary exposures for such matters relate to alleged royalty and tax underpayments on certain federal, state and privately owned properties and claims of alleged environmental contamination from historic operations. We will continue to defend ourselves vigorously in these matters.
Our legal organization applies its knowledge, experience and professional judgment to the specific characteristics of our cases, employing a litigation management process to manage and monitor the legal proceedings against us. Our process facilitates the early evaluation and quantification of potential exposures in individual cases. This process also enables us to track those cases that have been scheduled for trial and/or mediation. Based on professional judgment and experience in using these litigation management tools and available information about current developments in all our cases, our legal organization regularly assesses the adequacy of current accruals and determines if adjustment of existing accruals, or establishment of new accruals, is required. See Note 18-Income Taxes, in the Notes to Consolidated Financial Statements, for additional information about income tax-related contingencies.
60
Environmental
We are subject to the same numerous international, federal, state and local environmental laws and regulations as other companies in our industry. The most significant of these environmental laws and regulations include, among others, the:
| • | U.S. Federal Clean Air Act, which governs air emissions. |
| • | U.S. Federal Clean Water Act, which governs discharges to water bodies. |
| • | European Union Regulation for Registration, Evaluation, Authorization and Restriction of Chemicals (REACH). |
| • | U.S. Federal Comprehensive Environmental Response, Compensation and Liability Act (CERCLA or Superfund), which imposes liability on generators, transporters and arrangers of hazardous substances at sites where hazardous substance releases have occurred or are threatening to occur. |
| • | U.S. Federal Resource Conservation and Recovery Act (RCRA), which governs the treatment, storage and disposal of solid waste. |
| • | U.S. Federal Oil Pollution Act of 1990 (OPA90), under which owners and operators of onshore facilities and pipelines, lessees or permittees of an area in which an offshore facility is located, and owners and operators of vessels are liable for removal costs and damages that result from a discharge of oil into navigable waters of the United States. |
| • | U.S. Federal Emergency Planning and Community Right-to-Know Act (EPCRA), which requires facilities to report toxic chemical inventories with local emergency planning committees and response departments. |
| • | U.S. Federal Safe Drinking Water Act, which governs the disposal of wastewater in underground injection wells. |
| • | U.S. Department of the Interior regulations, which relate to offshore oil and gas operations in U.S. waters and impose liability for the cost of pollution cleanup resulting from operations, as well as potential liability for pollution damages. |
| • | European Union Trading Directive resulting in European Emissions Trading Scheme. |
These laws and their implementing regulations set limits on emissions and, in the case of discharges to water, establish water quality limits. They also, in most cases, require permits in association with new or modified operations. These permits can require an applicant to collect substantial information in connection with the application process, which can be expensive and time consuming. In addition, there can be delays associated with notice and comment periods and the agency's processing of the application. Many of the delays associated with the permitting process are beyond the control of the applicant.
Many states and foreign countries where we operate also have, or are developing, similar environmental laws and regulations governing these same types of activities. While similar, in some cases these regulations may impose additional, or more stringent, requirements that can add to the cost and difficulty of marketing or transporting products across state and international borders.
The ultimate financial impact arising from environmental laws and regulations is neither clearly known nor easily determinable as new standards, such as air emission standards, water quality standards and stricter fuel regulations, continue to evolve. However, environmental laws and regulations, including those that may arise to address concerns about global climate change, are expected to continue to have an increasing impact on our operations in the United States and in other countries in which we operate. Notable areas of potential impacts include air emission compliance and remediation obligations in the United States and Canada.
An example is the use of hydraulic fracturing, an essential completion technique that facilitates production of oil and natural gas otherwise trapped in lower permeability rock formations. A range of local, state, federal or national laws and regulations currently govern hydraulic fracturing operations, with hydraulic fracturing currently prohibited in some jurisdictions. Although hydraulic fracturing has been conducted for many decades, a number of new laws, regulations and permitting requirements are under consideration by the U.S. Environmental Protection Agency (EPA), the U.S. Department of the Interior, and others which could result in increased costs, operating restrictions, operational delays and/or limit the ability to develop oil and natural gas
61
resources. Governmental restrictions on hydraulic fracturing could impact the overall profitability or viability of certain of our oil and natural gas investments. We have adopted operating principles that incorporate established industry standards designed to meet or exceed government requirements. Our practices continually evolve as technology improves and regulations change.
We also are subject to certain laws and regulations relating to environmental remediation obligations associated with current and past operations. Such laws and regulations include CERCLA and RCRA and their state equivalents. Longer-term expenditures are subject to considerable uncertainty and may fluctuate significantly.
We occasionally receive requests for information or notices of potential liability from the EPA and state environmental agencies alleging we are a potentially responsible party under CERCLA or an equivalent state statute. On occasion, we also have been made a party to cost recovery litigation by those agencies or by private parties. These requests, notices and lawsuits assert potential liability for remediation costs at various sites that typically are not owned by us, but allegedly contain wastes attributable to our past operations. As of December 31, 2017, there were 14 sites around the United States in which we were identified as a potentially responsible party under CERCLA and comparable state laws.
For most Superfund sites, our potential liability will be significantly less than the total site remediation costs because the percentage of waste attributable to us, versus that attributable to all other potentially responsible parties, is relatively low. Although liability of those potentially responsible is generally joint and several for federal sites and frequently so for state sites, other potentially responsible parties at sites where we are a party typically have had the financial strength to meet their obligations, and where they have not, or where potentially responsible parties could not be located, our share of liability has not increased materially. Many of the sites at which we are potentially responsible are still under investigation by the EPA or the state agencies concerned. Prior to actual cleanup, those potentially responsible normally assess site conditions, apportion responsibility and determine the appropriate remediation. In some instances, we may have no liability or attain a settlement of liability. Actual cleanup costs generally occur after the parties obtain EPA or equivalent state agency approval. There are relatively few sites where we are a major participant, and given the timing and amounts of anticipated expenditures, neither the cost of remediation at those sites nor such costs at all CERCLA sites, in the aggregate, is expected to have a material adverse effect on our competitive or financial condition.
Expensed environmental costs were $398 million in 2017 and are expected to be about $451 million per year in 2018 and 2019. Capitalized environmental costs were $170 million in 2017 and are expected to be about $223 million per year in 2018 and 2019.
Accrued liabilities for remediation activities are not reduced for potential recoveries from insurers or other third parties and are not discounted (except those assumed in a purchase business combination, which we do record on a discounted basis).
Many of these liabilities result from CERCLA, RCRA and similar state or international laws that require us to undertake certain investigative and remedial activities at sites where we conduct, or once conducted, operations or at sites where ConocoPhillips-generated waste was disposed. The accrual also includes a number of sites we identified that may require environmental remediation, but which are not currently the subject of CERCLA, RCRA or other agency enforcement activities. If applicable, we accrue receivables for probable insurance or other third-party recoveries. In the future, we may incur significant costs under both CERCLA and RCRA.
Remediation activities vary substantially in duration and cost from site to site, depending on the mix of unique site characteristics, evolving remediation technologies, diverse regulatory agencies and enforcement policies, and the presence or absence of potentially liable third parties. Therefore, it is difficult to develop reasonable estimates of future site remediation costs.
62
At December 31, 2017, our balance sheet included total accrued environmental costs of $180 million, compared with $247 million at December 31, 2016, for remediation activities in the U.S. and Canada. We expect to incur a substantial amount of these expenditures within the next 30 years.
Notwithstanding any of the foregoing, and as with other companies engaged in similar businesses, environmental costs and liabilities are inherent concerns in our operations and products, and there can be no assurance that material costs and liabilities will not be incurred. However, we currently do not expect any material adverse effect upon our results of operations or financial position as a result of compliance with current environmental laws and regulations.
Climate Change
There has been a broad range of proposed or promulgated state, national and international laws focusing on greenhouse gas (GHG) reduction. These proposed or promulgated laws apply or could apply in countries where we have interests or may have interests in the future. Laws in this field continue to evolve, and while it is not possible to accurately estimate either a timetable for implementation or our future compliance costs relating to implementation, such laws, if enacted, could have a material impact on our results of operations and financial condition. Examples of legislation or precursors for possible regulation that do or could affect our operations include:
| • | European Emissions Trading Scheme (ETS), the program through which many of the European Union (EU) member states are implementing the Kyoto Protocol. Our cost of compliance with the EU ETS in 2017 was approximately $1.5 million (net share before-tax). |
| • | The Alberta Specified Gas Emitter regulations require any existing facility with emissions equal to or greater than 100,000 metric tonnes of carbon dioxide or equivalent per year to reduce its net emissions intensity from its baseline. The reduction requirement increased from 15 percent in 2016 to 20 percent in 2017. The total cost of compliance with these regulations in 2017 was approximately $3 million. |
| • | The U.S. Supreme Court decision in Massachusetts v. EPA , 549 U.S. 497, 127 S.Ct. 1438 (2007), confirming that the EPA has the authority to regulate carbon dioxide as an "air pollutant" under the Federal Clean Air Act. |
| • | The U.S. EPA's announcement on March 29, 2010 (published as "Interpretation of Regulations that Determine Pollutants Covered by Clean Air Act Permitting Programs," 75 Fed. Reg. 17004 (April 2, 2010)), and the EPA's and U.S. Department of Transportation's joint promulgation of a Final Rule on April 1, 2010, that triggers regulation of GHGs under the Clean Air Act, may trigger more climate-based claims for damages, and may result in longer agency review time for development projects. |
| • | The U.S. EPA's announcement on January 14, 2015, outlining a series of steps it plans to take to address methane and smog-forming volatile organic compound emissions from the oil and gas industry. The former U.S. administration established a goal of reducing the 2012 levels in methane emissions from the oil and gas industry by 40 to 45 percent by 2025. |
| • | Carbon taxes in certain jurisdictions. Our cost of compliance with Norwegian carbon tax legislation in 2017 was approximately $29 million (net share before-tax). We also incur a carbon tax for emissions from fossil fuel combustion in our British Columbia and Alberta Operations totaling just over $1 million (net share before-tax). |
| • | The agreement reached in Paris in December 2015 at the 21st Conference of the Parties to the United Nations Framework on Climate Change, setting out a new process for achieving global emission reductions. |
In the United States, some additional form of regulation may be forthcoming in the future at the federal and state levels with respect to GHG emissions. Such regulation could take any of several forms that may result in the creation of additional costs in the form of taxes, the restriction of output, investments of capital to maintain compliance with laws and regulations, or required acquisition or trading of emission allowances. We are working to continuously improve operational and energy efficiency through resource and energy conservation throughout our operations.
63
Compliance with changes in laws and regulations that create a GHG tax, emission trading scheme or GHG reduction policies could significantly increase our costs, reduce demand for fossil energy derived products, impact the cost and availability of capital and increase our exposure to litigation. Such laws and regulations could also increase demand for less carbon intensive energy sources, including natural gas. The ultimate impact on our financial performance, either positive or negative, will depend on a number of factors, including but not limited to:
| • | Whether and to what extent legislation or regulation is enacted. |
| • | The timing of the introduction of such legislation or regulation. |
| • | The nature of the legislation (such as a cap and trade system or a tax on emissions) or regulation. |
| • | The price placed on GHG emissions (either by the market or through a tax). |
| • | The GHG reductions required. |
| • | The price and availability of offsets. |
| • | The amount and allocation of allowances. |
| • | Technological and scientific developments leading to new products or services. |
| • | Any potential significant physical effects of climate change (such as increased severe weather events, changes in sea levels and changes in temperature). |
| • | Whether, and the extent to which, increased compliance costs are ultimately reflected in the prices of our products and services. |
The company has responded by putting in place a corporate Climate Change Action Plan, together with individual business unit climate change management plans in order to undertake actions in four major areas:
| • | Equipping the company for a low emission world, for example by integrating GHG forecasting and reporting into company procedures; utilizing GHG pricing in planning economics; and developing systems to handle GHG market transactions. |
| • | Reducing GHG emissions-In 2016, the company reduced or avoided GHG emissions by approximately 114,000 metric tonnes by carrying out a range of programs across our business units. In 2017, we set a long-term target to reduce our greenhouse gas emissions intensity between 5 percent and 15 percent by 2030 from a 2017 baseline. Setting such a target demonstrates our continuing systematic approach to managing climate-related risks throughout the business. |
| • | Evaluating business opportunities such as the creation of offsets and allowances, the use of low carbon energy and the development of low carbon technologies. |
| • | Engaging externally-The company is a sponsor of MIT's Joint Program on the Science and Policy of Global Change; constructively engages in the development of climate change legislation and regulation; and discloses our progress and performance through the Carbon Disclosure Project and the Dow Jones Sustainability Index. |
The company uses an estimated market cost of GHG emissions of $40 per metric tonne to evaluate future projects and opportunities.
In 2017 and early 2018, cities and/or counties in California and New York have filed lawsuits against oil and gas companies, including ConocoPhillips, seeking compensatory damages and equitable relief to abate alleged climate change impacts. ConocoPhillips will be vigorously defending against these lawsuits.
Other
We have deferred tax assets related to certain accrued liabilities, loss carryforwards and credit carryforwards. Valuation allowances have been established to reduce these deferred tax assets to an amount that will, more likely than not, be realized. Based on our historical taxable income, our expectations for the future, and available tax-planning strategies, management expects the net deferred tax assets will be realized as offsets to reversing deferred tax liabilities.
64
NEW ACCOUNTING STANDARDS
In February 2016, the Financial Accounting Standards Board (FASB) issued Accounting Standards Update (ASU) No. 2016-02, "Leases" (ASU No. 2016-02), which establishes comprehensive accounting and financial reporting requirements for leasing arrangements. This ASU supersedes the existing requirements in FASB Accounting Standards Codification (ASC) Topic 840, "Leases," and requires lessees to recognize substantially all lease assets and lease liabilities on the balance sheet. The provisions of ASU No. 2016-02 also modify the definition of a lease and outline requirements for recognition, measurement, presentation, and disclosure of leasing arrangements by both lessees and lessors. The ASU is effective for interim and annual periods beginning after December 15, 2018, and early adoption of the standard is permitted. Entities are required to adopt the ASU using a modified retrospective approach, subject to certain optional practical expedients, and apply the provisions of ASU No. 2016-02 to leasing arrangements existing at or entered into after the earliest comparative period presented in the financial statements. In January 2018, ASU No. 2016-02 was amended by the provisions of ASU No. 2018-01, "Land Easement Practical Expedient for Transition to Topic 842." We plan to adopt ASU No. 2016-02, as amended, effective January 1, 2019, and continue to evaluate the ASU to determine the impact of adoption on our consolidated financial statements and disclosures, accounting policies and systems, business processes, and internal controls. We also continue to monitor proposals issued by the FASB to clarify the ASU and certain industry implementation issues. While our evaluation of ASU No. 2016-02 and related implementation activities are ongoing, we expect the adoption of the ASU to have a material impact on our consolidated financial statements and disclosures. For additional information, see Note 24-New Accounting Standards, in the Notes to Consolidated Financial Statements.
CRITICAL ACCOUNTING ESTIMATES
The preparation of financial statements in conformity with generally accepted accounting principles requires management to select appropriate accounting policies and to make estimates and assumptions that affect the reported amounts of assets, liabilities, revenues and expenses. See Note 1-Accounting Policies, in the Notes to Consolidated Financial Statements, for descriptions of our major accounting policies. Certain of these accounting policies involve judgments and uncertainties to such an extent there is a reasonable likelihood materially different amounts would have been reported under different conditions, or if different assumptions had been used. These critical accounting estimates are discussed with the Audit and Finance Committee of the Board of Directors at least annually. We believe the following discussions of critical accounting estimates, along with the discussions of contingencies and of deferred tax asset valuation allowances in this report, address all important accounting areas where the nature of accounting estimates or assumptions is material due to the levels of subjectivity and judgment necessary to account for highly uncertain matters or the susceptibility of such matters to change.
Oil and Gas Accounting
Accounting for oil and gas exploratory activity is subject to special accounting rules unique to the oil and gas industry. The acquisition of geological and geophysical seismic information, prior to the discovery of proved reserves, is expensed as incurred, similar to accounting for research and development costs. However, leasehold acquisition costs and exploratory well costs are capitalized on the balance sheet pending determination of whether proved oil and gas reserves have been discovered on the prospect.
Property Acquisition Costs
For individually significant leaseholds, management periodically assesses for impairment based on exploration and drilling efforts to date. For relatively small individual leasehold acquisition costs, management exercises judgment and determines a percentage probability that the prospect ultimately will fail to find proved oil and gas reserves and pools that leasehold information with others in the geographic area. For prospects in areas with limited, or no, previous exploratory drilling, the percentage probability of ultimate failure is normally judged to be quite high. This judgmental percentage is multiplied by the leasehold acquisition cost, and that product is divided by the contractual period of the leasehold to determine a periodic leasehold impairment charge that is reported in exploration expense.
65
This judgmental probability percentage is reassessed and adjusted throughout the contractual period of the leasehold based on favorable or unfavorable exploratory activity on the leasehold or on adjacent leaseholds, and leasehold impairment amortization expense is adjusted prospectively. At year-end 2017, the book value of the pools of property acquisition costs, that individually are relatively small and thus subject to the above-described periodic leasehold impairment calculation, was $503 million and the accumulated impairment reserve was $130 million. The weighted-average judgmental percentage probability of ultimate failure was approximately 57 percent, and the weighted-average amortization period was approximately three years. If that judgmental percentage were to be raised by 5 percent across all calculations, before-tax leasehold impairment expense in 2018 would increase by approximately $6 million. At year-end 2017, the remaining $3,249 million of net capitalized unproved property costs consisted primarily of individually significant leaseholds, mineral rights held in perpetuity by title ownership, exploratory wells currently being drilled, suspended exploratory wells, and capitalized interest. Of this amount, approximately $2.4 billion is concentrated in nine major development areas, the majority of which are not expected to move to proved properties in 2018. Management periodically assesses individually significant leaseholds for impairment based on the results of exploration and drilling efforts and the outlook for commercialization.
Exploratory Costs
For exploratory wells, drilling costs are temporarily capitalized, or "suspended," on the balance sheet, pending a determination of whether potentially economic oil and gas reserves have been discovered by the drilling effort to justify development.
If exploratory wells encounter potentially economic quantities of oil and gas, the well costs remain capitalized on the balance sheet as long as sufficient progress assessing the reserves and the economic and operating viability of the project is being made. The accounting notion of "sufficient progress" is a judgmental area, but the accounting rules do prohibit continued capitalization of suspended well costs on the expectation future market conditions will improve or new technologies will be found that would make the development economically profitable. Often, the ability to move into the development phase and record proved reserves is dependent on obtaining permits and government or co-venturer approvals, the timing of which is ultimately beyond our control. Exploratory well costs remain suspended as long as we are actively pursuing such approvals and permits, and believe they will be obtained. Once all required approvals and permits have been obtained, the projects are moved into the development phase, and the oil and gas reserves are designated as proved reserves. For complex exploratory discoveries, it is not unusual to have exploratory wells remain suspended on the balance sheet for several years while we perform additional appraisal drilling and seismic work on the potential oil and gas field or while we seek government or co-venturer approval of development plans or seek environmental permitting. Once a determination is made the well did not encounter potentially economic oil and gas quantities, the well costs are expensed as a dry hole and reported in exploration expense.
Management reviews suspended well balances quarterly, continuously monitors the results of the additional appraisal drilling and seismic work, and expenses the suspended well costs as a dry hole when it determines the potential field does not warrant further investment in the near term. Criteria utilized in making this determination include evaluation of the reservoir characteristics and hydrocarbon properties, expected development costs, ability to apply existing technology to produce the reserves, fiscal terms, regulations or contract negotiations, and our expected return on investment.
At year-end 2017, total suspended well costs were $853 million, compared with $1,063 million at year-end 2016. For additional information on suspended wells, including an aging analysis, see Note 7-Suspended Wells and Other Exploration Expenses, in the Notes to Consolidated Financial Statements.
Proved Reserves
Engineering estimates of the quantities of proved reserves are inherently imprecise and represent only approximate amounts because of the judgments involved in developing such information. Reserve estimates are based on geological and engineering assessments of in-place hydrocarbon volumes, the production plan, historical extraction recovery and processing yield factors, installed plant operating capacity and approved operating limits. The reliability of these estimates at any point in time depends on both the quality and quantity of the technical and economic data and the efficiency of extracting and processing the hydrocarbons.
66
Despite the inherent imprecision in these engineering estimates, accounting rules require disclosure of "proved" reserve estimates due to the importance of these estimates to better understand the perceived value and future cash flows of a company's operations. There are several authoritative guidelines regarding the engineering criteria that must be met before estimated reserves can be designated as "proved." Our geosciences and reservoir engineering organization has policies and procedures in place consistent with these authoritative guidelines. We have trained and experienced internal engineering personnel who estimate our proved reserves held by consolidated companies, as well as our share of equity affiliates.
Proved reserve estimates are adjusted annually in the fourth quarter and during the year if significant changes occur, and take into account recent production and subsurface information about each field. Also, as required by current authoritative guidelines, the estimated future date when an asset will be permanently shut down for economic reasons is based on 12-month average prices and current costs. This estimated date when production will end affects the amount of estimated reserves. Therefore, as prices and cost levels change from year to year, the estimate of proved reserves also changes. Generally, our proved reserves decrease as prices decline and increase as prices rise.
Our proved reserves include estimated quantities related to production sharing contracts, reported under the "economic interest" method, as well as variable-royalty regimes, and are subject to fluctuations in commodity prices; recoverable operating expenses; and capital costs. If costs remain stable, reserve quantities attributable to recovery of costs will change inversely to changes in commodity prices. We would expect reserves from these contracts to decrease when product prices rise and increase when prices decline.
The estimation of proved developed reserves also is important to the income statement because the proved developed reserve estimate for a field serves as the denominator in the unit-of-production calculation of the DD&A of the capitalized costs for that asset. At year-end 2017, the net book value of productive properties, plants and equipment (PP&E) subject to a unit-of-production calculation was approximately $41 billion and the DD&A recorded on these assets in 2017 was approximately $6.4 billion. The estimated proved developed reserves for our consolidated operations were 3.7 billion BOE at the end of 2016 and 3.0 billion BOE at the end of 2017. If the estimates of proved reserves used in the unit-of-production calculations had been lower by 10 percent across all calculations, before-tax DD&A in 2017 would have increased by an estimated $726 million.
Impairments
Long-lived assets used in operations are assessed for impairment whenever changes in facts and circumstances indicate a possible significant deterioration in future cash flows expected to be generated by an asset group and annually in the fourth quarter following updates to corporate planning assumptions. If there is an indication the carrying amount of an asset may not be recovered, the asset is monitored by management through an established process where changes to significant assumptions such as prices, volumes and future development plans are reviewed. If, upon review, the sum of the undiscounted before-tax cash flows is less than the carrying value of the asset group, the carrying value is written down to estimated fair value. Individual assets are grouped for impairment purposes based on a judgmental assessment of the lowest level for which there are identifiable cash flows that are largely independent of the cash flows of other groups of assets-generally on a field-by-field basis for exploration and production assets. Because there usually is a lack of quoted market prices for long-lived assets, the fair value of impaired assets is typically determined based on the present values of expected future cash flows using discount rates believed to be consistent with those used by principal market participants, or based on a multiple of operating cash flow validated with historical market transactions of similar assets where possible. The expected future cash flows used for impairment reviews and related fair value calculations are based on judgmental assessments of future production volumes, commodity prices, operating costs and capital decisions, considering all available information at the date of review. Differing assumptions could affect the timing and the amount of an impairment in any period. See Note 8-Impairments, in the Notes to Consolidated Financial Statements, for additional information.
67
Investments in nonconsolidated entities accounted for under the equity method are reviewed for impairment when there is evidence of a loss in value and annually following updates to corporate planning assumptions. Such evidence of a loss in value might include our inability to recover the carrying amount, the lack of sustained earnings capacity which would justify the current investment amount, or a current fair value less than the investment's carrying amount. When it is determined such a loss in value is other than temporary, an impairment charge is recognized for the difference between the investment's carrying value and its estimated fair value. When determining whether a decline in value is other than temporary, management considers factors such as the length of time and extent of the decline, the investee's financial condition and near-term prospects, and our ability and intention to retain our investment for a period that will be sufficient to allow for any anticipated recovery in the market value of the investment. Since quoted market prices are usually not available, the fair value is typically based on the present value of expected future cash flows using discount rates believed to be consistent with those used by principal market participants, plus market analysis of comparable assets owned by the investee, if appropriate. Differing assumptions could affect the timing and the amount of an impairment of an investment in any period. See the "APLNG" section of Note 5-Investments, Loans and Long-Term Receivables, in the Notes to Consolidated Financial Statements, for additional information.
Asset Retirement Obligations and Environmental Costs
Under various contracts, permits and regulations, we have material legal obligations to remove tangible equipment and restore the land or seabed at the end of operations at operational sites. Our largest asset removal obligations involve plugging and abandonment of wells, removal and disposal of offshore oil and gas platforms around the world, as well as oil and gas production facilities and pipelines in Alaska. The fair values of obligations for dismantling and removing these facilities are recorded as a liability and an increase to PP&E at the time of installation of the asset based on estimated discounted costs. Estimating future asset removal costs is difficult. Most of these removal obligations are many years, or decades, in the future and the contracts and regulations often have vague descriptions of what removal practices and criteria must be met when the removal event actually occurs. Asset removal technologies and costs, regulatory and other compliance considerations, expenditure timing, and other inputs into valuation of the obligation, including discount and inflation rates, are also subject to change.
Normally, changes in asset removal obligations are reflected in the income statement as increases or decreases to DD&A over the remaining life of the assets. However, for assets at or nearing the end of their operations, as well as previously sold assets for which we retained the asset removal obligation, an increase in the asset removal obligation can result in an immediate charge to earnings, because any increase in PP&E due to the increased obligation would immediately be subject to impairment, due to the low fair value of these properties.
In addition to asset removal obligations, under the above or similar contracts, permits and regulations, we have certain environmental-related projects. These are primarily related to remediation activities required by Canada and various states within the United States at exploration and production sites. Future environmental remediation costs are difficult to estimate because they are subject to change due to such factors as the uncertain magnitude of cleanup costs, the unknown time and extent of such remedial actions that may be required, and the determination of our liability in proportion to that of other responsible parties. See Note 9-Asset Retirement Obligations and Accrued Environmental Costs, in the Notes to Consolidated Financial Statements, for additional information.
Projected Benefit Obligations
Determination of the projected benefit obligations for our defined benefit pension and postretirement plans are important to the recorded amounts for such obligations on the balance sheet and to the amount of benefit expense in the income statement. The actuarial determination of projected benefit obligations and company contribution requirements involves judgment about uncertain future events, including estimated retirement dates, salary levels at retirement, mortality rates, lump-sum election rates, rates of return on plan assets, future health care cost-trend rates, and rates of utilization of health care services by retirees. Due to the specialized nature of these calculations, we engage outside actuarial firms to assist in the determination of these projected
68
benefit obligations and company contribution requirements. For Employee Retirement Income Security Act-governed pension plans, the actuary exercises fiduciary care on behalf of plan participants in the determination of the judgmental assumptions used in determining required company contributions into the plans. Due to differing objectives and requirements between financial accounting rules and the pension plan funding regulations promulgated by governmental agencies, the actuarial methods and assumptions for the two purposes differ in certain important respects. Ultimately, we will be required to fund all vested benefits under pension and postretirement benefit plans not funded by plan assets or investment returns, but the judgmental assumptions used in the actuarial calculations significantly affect periodic financial statements and funding patterns over time. Projected benefit obligations are particularly sensitive to the discount rate assumption. A 1 percent decrease in the discount rate assumption would increase projected benefit obligations by $1,200 million. Benefit expense is particularly sensitive to the discount rate and return on plan assets assumptions. A 1 percent decrease in the discount rate assumption would increase annual benefit expense by $110 million, while a 1 percent decrease in the return on plan assets assumption would increase annual benefit expense by $60 million. In determining the discount rate, we use yields on high-quality fixed income investments matched to the estimated benefit cash flows of our plans. We are also exposed to the possibility that lump sum retirement benefits taken from pension plans during the year could exceed the total of service and interest components of annual pension expense and trigger accelerated recognition of a portion of unrecognized net actuarial losses and gains. These benefit payments are based on decisions by plan participants and are therefore difficult to predict. In the event there is a significant reduction in the expected years of future service of present employees or elimination for a significant number of employees the accrual of defined benefits for some or all of their future services, we could recognize a curtailment gain or loss. See Note 17-Employee Benefit Plans, in the Notes to Consolidated Financial Statements, for additional information.
Contingencies
A number of claims and lawsuits are made against the company arising in the ordinary course of business. Management exercises judgment related to accounting and disclosure of these claims which includes losses, damages, and underpayments associated with environmental remediation, tax, contracts, and other legal disputes. As we learn new facts concerning contingencies, we reassess our position both with respect to amounts recognized and disclosed considering changes to the probability of additional losses and potential exposure. However, actual losses can and do vary from estimates for a variety of reasons including legal, arbitration, or other third-party decisions; settlement discussions; evaluation of scope of damages; interpretation of regulatory or contractual terms; expected timing of future actions; and proportion of liability shared with other responsible parties. Estimated future costs related to contingencies are subject to change as events evolve and as additional information becomes available during the administrative and litigation processes. For additional information on contingent liabilities, see the "Contingencies" section within "Capital Resources and Liquidity."
69
CAUTIONARY STATEMENT FOR THE PURPOSES OF THE "SAFE HARBOR" PROVISIONS OF THE PRIVATE SECURITIES LITIGATION REFORM ACT OF 1995
This report includes forward-looking statements within the meaning of Section 27A of the Securities Act of 1933 and Section 21E of the Securities Exchange Act of 1934. All statements other than statements of historical fact included or incorporated by reference in this report, including, without limitation, statements regarding our future financial position, business strategy, budgets, projected revenues, projected costs and plans, and objectives of management for future operations, are forward-looking statements. Examples of forward-looking statements contained in this report include our expected production growth and outlook on the business environment generally, our expected capital budget and capital expenditures, and discussions concerning future dividends. You can often identify our forward-looking statements by the words "anticipate," "estimate," "believe," "budget," "continue," "could," "intend," "may," "plan," "potential," "predict," "seek," "should," "will," "would," "expect," "objective," "projection," "forecast," "goal," "guidance," "outlook," "effort," "target" and similar expressions.
We based the forward-looking statements on our current expectations, estimates and projections about ourselves and the industries in which we operate in general. We caution you these statements are not guarantees of future performance as they involve assumptions that, while made in good faith, may prove to be incorrect, and involve risks and uncertainties we cannot predict. In addition, we based many of these forward-looking statements on assumptions about future events that may prove to be inaccurate. Accordingly, our actual outcomes and results may differ materially from what we have expressed or forecast in the forward-looking statements. Any differences could result from a variety of factors, including, but not limited to, the following:
| • | Fluctuations in crude oil, bitumen, natural gas, LNG and natural gas liquids prices, including a prolonged decline in these prices relative to historical or future expected levels. |
| • | The impact of significant declines in prices for crude oil, bitumen, natural gas, LNG and natural gas liquids, which may result in recognition of impairment costs on our long-lived assets, leaseholds and nonconsolidated equity investments. |
| • | Potential failures or delays in achieving expected reserve or production levels from existing and future oil and gas developments, including due to operating hazards, drilling risks and the inherent uncertainties in predicting reserves and reservoir performance. |
| • | Reductions in reserves replacement rates, whether as a result of the significant declines in commodity prices or otherwise. |
| • | Unsuccessful exploratory drilling activities or the inability to obtain access to exploratory acreage. |
| • | Unexpected changes in costs or technical requirements for constructing, modifying or operating exploration and production facilities. |
| • | Legislative and regulatory initiatives addressing environmental concerns, including initiatives addressing the impact of global climate change or further regulating hydraulic fracturing, methane emissions, flaring or water disposal. |
| • | Lack of, or disruptions in, adequate and reliable transportation for our crude oil, bitumen, natural gas, LNG and natural gas liquids. |
| • | Inability to timely obtain or maintain permits, including those necessary for construction, drilling and/or development; failure to comply with applicable laws and regulations; or inability to make capital expenditures required to maintain compliance with any necessary permits or applicable laws or regulations. |
| • | Failure to complete definitive agreements and feasibility studies for, and to complete construction of, announced and future exploration and production and LNG development in a timely manner (if at all) or on budget. |
| • | Potential disruption or interruption of our operations due to accidents, extraordinary weather events, civil unrest, political events, war, terrorism, cyber attacks, and information technology failures, constraints or disruptions. |
| • | Changes in international monetary conditions and foreign currency exchange rate fluctuations. |
70
| • | Reduced demand for our products or the use of competing energy products, including alternative energy sources. |
| • | Substantial investment in and development of alternative energy sources, including as a result of existing or future environmental rules and regulations. |
| • | Liability for remedial actions, including removal and reclamation obligations, under environmental regulations. |
| • | Liability resulting from litigation. |
| • | General domestic and international economic and political developments, including armed hostilities; expropriation of assets; changes in governmental policies relating to crude oil, bitumen, natural gas, LNG and natural gas liquids pricing, regulation or taxation; and other political, economic or diplomatic developments. |
| • | Volatility in the commodity futures markets. |
| • | Changes in tax and other laws, regulations (including alternative energy mandates), or royalty rules applicable to our business, including changes resulting from the implementation and interpretation of the Tax Cuts and Jobs Act. |
| • | Competition in the oil and gas exploration and production industry. |
| • | Any limitations on our access to capital or increase in our cost of capital related to illiquidity or uncertainty in the domestic or international financial markets. |
| • | Our inability to execute, or delays in the completion, of any asset dispositions we elect to pursue. |
| • | Potential failure to obtain, or delays in obtaining, any necessary regulatory approvals for asset dispositions or that such approvals may require modification to the terms of the transactions or the operation of our remaining business. |
| • | Potential disruption of our operations as a result of asset dispositions, including the diversion of management time and attention. |
| • | Our inability to deploy the net proceeds from any asset dispositions we undertake in the manner and timeframe we currently anticipate, if at all. |
| • | Our inability to liquidate the common stock issued to us by Cenovus Energy as part of our sale of certain assets in western Canada at prices we deem acceptable, or at all. |
| • | Our inability to obtain economical financing for development, construction or modification of facilities and general corporate purposes. |
| • | The operation and financing of our joint ventures. |
| • | The ability of our customers and other contractual counterparties to satisfy their obligations to us. |
| • | Our inability to realize anticipated cost savings and expenditure reductions. |
| • | The factors generally described in Item 1A-Risk Factors in our 2017 Annual Report on Form 10-K and any additional risks described in our other filings with the SEC. |
71
Item 7A. QUANTITATIVE AND QUALITATIVE DISCLOSURES ABOUT MARKET RISK
Financial Instrument Market Risk
We and certain of our subsidiaries hold and issue derivative contracts and financial instruments that expose our cash flows or earnings to changes in commodity prices, foreign currency exchange rates or interest rates. We may use financial and commodity-based derivative contracts to manage the risks produced by changes in the prices of natural gas, crude oil and related products; fluctuations in interest rates and foreign currency exchange rates; or to capture market opportunities.
Our use of derivative instruments is governed by an "Authority Limitations" document approved by our Board of Directors that prohibits the use of highly leveraged derivatives or derivative instruments without sufficient liquidity. The Authority Limitations document also establishes the Value at Risk (VaR) limits for the company, and compliance with these limits is monitored daily. The Executive Vice President of Finance, Commercial, and Chief Financial Officer, who reports to the Chief Executive Officer, monitor commodity price risk and risks resulting from foreign currency exchange rates and interest rates. The Commercial organization manages our commercial marketing, optimizes our commodity flows and positions, and monitors risks.
Commodity Price Risk
Our Commercial organization uses futures, forwards, swaps and options in various markets to accomplish the following objectives:
| • | Meet customer needs. Consistent with our policy to generally remain exposed to market prices, we use swap contracts to convert fixed-price sales contracts, which are often requested by natural gas consumers, to floating market prices. |
| • | Enable us to use market knowledge to capture opportunities such as moving physical commodities to more profitable locations and storing commodities to capture seasonal or time premiums. We may use derivatives to optimize these activities. |
We use a VaR model to estimate the loss in fair value that could potentially result on a single day from the effect of adverse changes in market conditions on the derivative financial instruments and derivative commodity instruments we hold or issue, including commodity purchases and sales contracts recorded on the balance sheet at December 31, 2017, as derivative instruments. Using Monte Carlo simulation, a 95 percent confidence level and a one-day holding period, the VaR for those instruments issued or held for trading purposes or held for purposes other than trading at December 31, 2017 and 2016, was immaterial to our consolidated cash flows and net income attributable to ConocoPhillips.
Interest Rate Risk
The following table provides information about our financial instruments that are sensitive to changes in U.S. interest rates. The debt portion of the table presents principal cash flows and related weighted-average interest rates by expected maturity dates. Weighted-average variable rates are based on effective rates at the reporting date. The carrying amount of our floating-rate debt approximates its fair value. The fair value of the fixed-rate financial instruments is estimated based on quoted market prices.
72
| Millions of Dollars Except as Indicated | ||||||||||||||||
|
| |||||||||||||||
| Debt | ||||||||||||||||
|
| |||||||||||||||
Expected Maturity Date |
| Fixed Rate Maturity |
|
| Average Interest Rate |
|
| Floating Rate Maturity |
|
| Average Interest Rate |
| ||||
|
|
|
|
| ||||||||||||
Year-End 2017 | ||||||||||||||||
2018 | $ | 2,250 | 3.31 | % | $ | 250 | 1.75 | % | ||||||||
2019 | 23 | - | - | - | ||||||||||||
2020 | - | - | - | - | ||||||||||||
2021 | 150 | 9.13 | - | - | ||||||||||||
2022 | 1,014 | 2.45 | 500 | 2.32 | ||||||||||||
Remaining years | 14,207 | 6.00 | 283 | 1.70 | ||||||||||||
| ||||||||||||||||
Total | $ | 17,644 | $ | 1,033 | ||||||||||||
| ||||||||||||||||
Fair value | $ | 21,402 | $ | 1,033 | ||||||||||||
| ||||||||||||||||
Year-End 2016 | ||||||||||||||||
2017 | $ | 1,001 | 1.06 | % | $ | - | - | % | ||||||||
2018 | 1,570 | 3.63 | 250 | 1.24 | ||||||||||||
2019 | 2,250 | 5.75 | 1,450 | 2.31 | ||||||||||||
2020 | 1,500 | 4.73 | - | - | ||||||||||||
2021 | 2,150 | 4.08 | - | - | ||||||||||||
Remaining years | 15,221 | 5.77 | 783 | 1.43 | ||||||||||||
| ||||||||||||||||
Total | $ | 23,692 | $ | 2,483 | ||||||||||||
| ||||||||||||||||
Fair value | $ | 26,824 | $ | 2,483 | ||||||||||||
| ||||||||||||||||
Foreign Currency Exchange Risk
We have foreign currency exchange rate risk resulting from international operations. We do not comprehensively hedge the exposure to currency exchange rate changes although we may choose to selectively hedge certain foreign currency exchange rate exposures, such as firm commitments for capital projects or local currency tax payments, dividends and cash returns from net investments in foreign affiliates to be remitted within the coming year, and investments in available-for-sale securities.
At December 31, 2017 and 2016, we held foreign currency exchange forwards hedging cross-border commercial activity and foreign currency exchange swaps and options for purposes of mitigating our cash-related exposures. Although these forwards, swaps and options hedge exposures to fluctuations in exchange rates, we elected not to utilize hedge accounting. As a result, the change in the fair value of these foreign currency exchange derivatives is recorded directly in earnings.
At December 31, 2017, we had outstanding foreign currency zero-cost collars buying the right to sell $1.25 billion Canadian dollars (CAD) at $0.707 CAD and selling the right to buy $1.25 billion CAD at $0.842 CAD against the U.S. dollar. Based on the assumed volatility in the fair value calculation, the net fair value of these foreign currency contracts as at December 31, 2017, was a before-tax loss of $9 million. Based on an adverse hypothetical 10 percent change in the December 2017 exchange rate, this would result in an additional before-tax loss of $74 million. The sensitivity analysis is based on changing one assumption while holding all other assumptions constant, which in practice may be unlikely to occur, as changes in some of the assumptions may be correlated.
At December 31, 2016, we had outstanding foreign currency exchange forward-swap contracts. Since the gain or loss on the swaps was offset from remeasuring the related cash balances and since our aggregate position in the forwards was not material, there would have been no impact to our income from an adverse hypothetical 10 percent change in the December 2016 exchange rates.
73
The gross notional and fair market values of these positions at December 31, 2017 and 2016, were as follows:
| In Millions | ||||||||||||||||||||
|
| |||||||||||||||||||
Foreign Currency Exchange Derivatives | Notional* | Fair Market Value** | ||||||||||||||||||
|
|
|
| |||||||||||||||||
| 2017 | 2016 | 2017 | 2016 | |||||||||||||||||
|
|
|
| |||||||||||||||||
Sell U.S. dollar, buy Canadian dollar | USD | - | 13 | - | - | |||||||||||||||
Buy U.S. dollar, sell British pound | USD | - | 25 | - | - | |||||||||||||||
Sell Canadian dollar, buy U.S. dollar | CAD | 1,250 | - | (9 | ) | - | ||||||||||||||
Buy Canadian dollar, sell U.S. dollar | CAD | 25 | - | 1 | - | |||||||||||||||
Buy British pound, sell Canadian dollar | GBP | - | 1,069 | - | (168 | ) | ||||||||||||||
Sell British pound, buy Norwegian krone | GBP | - | 51 | - | 1 | |||||||||||||||
Sell British pound, buy Euro | GBP | 1 | - | - | - | |||||||||||||||
| ||||||||||||||||||||
*Denominated in U.S. dollars (USD), British pound (GBP) and Canadian dollars (CAD).
**Denominated in U.S. dollars.
For additional information about our use of derivative instruments, see Note 13-Derivative and Financial Instruments, in the Notes to Consolidated Financial Statements.
74
| Item 8. | FINANCIAL STATEMENTS AND SUPPLEMENTARY DATA |
CONOCOPHILLIPS
INDEX TO FINANCIAL STATEMENTS
| Page | ||||
Report of Management | 76 | |||
Reports of Independent Registered Public Accounting Firm | 78 | |||
Consolidated Income Statement for the years ended December 31, 2017, 2016 and 2015 | 79 | |||
Consolidated Statement of Comprehensive Income for the years ended December 31, 2017, 2016 and 2015 | 80 | |||
Consolidated Balance Sheet at December 31, 2017 and 2016 | 81 | |||
Consolidated Statement of Cash Flows for the years ended December 31, 2017, 2016 and 2015 | 82 | |||
Consolidated Statement of Changes in Equity for the years ended December 31, 2017, 2016 and 2015 | 83 | |||
Notes to Consolidated Financial Statements | 84 | |||
Supplementary Information | ||||
Oil and Gas Operations | 140 | |||
Selected Quarterly Financial Data | 167 | |||
Condensed Consolidating Financial Information | 168 | |||
75
Report of Management
Management prepared, and is responsible for, the consolidated financial statements and the other information appearing in this annual report. The consolidated financial statements present fairly the company's financial position, results of operations and cash flows in conformity with accounting principles generally accepted in the United States. In preparing its consolidated financial statements, the company includes amounts that are based on estimates and judgments management believes are reasonable under the circumstances. The company's financial statements have been audited by Ernst & Young LLP, an independent registered public accounting firm appointed by the Audit and Finance Committee of the Board of Directors and ratified by stockholders. Management has made available to Ernst & Young LLP all of the company's financial records and related data, as well as the minutes of stockholders' and directors' meetings.
Assessment of Internal Control Over Financial Reporting
Management is also responsible for establishing and maintaining adequate internal control over financial reporting. ConocoPhillips' internal control system was designed to provide reasonable assurance to the company's management and directors regarding the preparation and fair presentation of published financial statements.
All internal control systems, no matter how well designed, have inherent limitations. Therefore, even those systems determined to be effective can provide only reasonable assurance with respect to financial statement preparation and presentation.
Management assessed the effectiveness of the company's internal control over financial reporting as of December 31, 2017. In making this assessment, it used the criteria set forth by the Committee of Sponsoring Organizations of the Treadway Commission in Internal Control-Integrated Framework (2013) . Based on our assessment, we believe the company's internal control over financial reporting was effective as of December 31, 2017.
Ernst & Young LLP has issued an audit report on the company's internal control over financial reporting as of December 31, 2017, and their report is included herein.
| /s/ Ryan M. Lance | /s/ Don E. Wallette, Jr. | |||
| Ryan M. Lance | Don E. Wallette, Jr. | |||
Chairman and Chief Executive Officer | Executive Vice President, Finance, Commercial and Chief Financial Officer | |||
February 20, 2018
76
Report of Independent Registered Public Accounting Firm
To the Stockholders and the Board of Directors of ConocoPhillips
Opinion on the Financial Statements
We have audited the accompanying consolidated balance sheets of ConocoPhillips as of December 31, 2017 and 2016, and the related consolidated income statement, consolidated statements of comprehensive income, changes in equity and cash flows for each of the three years in the period ended December 31, 2017, and the related notes, condensed consolidating financial information listed in the Index at Item 8, and financial statement schedule listed in Item 15(a) (collectively referred to as the "financial statements"). In our opinion, the financial statements referred to above present fairly, in all material respects, the consolidated financial position of ConocoPhillips at December 31, 2017 and 2016, and the consolidated results of its operations and its cash flows for each of the three years in the period ended December 31, 2017, in conformity with U.S. generally accepted accounting principles.
We also have audited, in accordance with the standards of the Public Company Accounting Oversight Board (United States) (PCAOB), ConocoPhillips' internal control over financial reporting as of December 31, 2017, based on criteria established in Internal Control-Integrated Framework issued by the Committee of Sponsoring Organizations of the Treadway Commission (2013 framework) and our report dated February 20, 2018, expressed an unqualified opinion thereon.
Basis for Opinion
These financial statements are the responsibility of ConocoPhillips' management. Our responsibility is to express an opinion on ConocoPhillips' financial statements based on our audits. We are a public accounting firm registered with the PCAOB and are required to be independent with respect to ConocoPhillips in accordance with the U.S. federal securities laws and the applicable rules and regulations of the Securities and Exchange Commission and the PCAOB.
We conducted our audits in accordance with the standards of the PCAOB. Those standards require that we plan and perform the audit to obtain reasonable assurance about whether the financial statements are free of material misstatement, whether due to error or fraud. Our audits included performing procedures to assess the risks of material misstatement of the financial statements, whether due to error or fraud, and performing procedures that respond to those risks. Such procedures included examining, on a test basis, evidence regarding the amounts and disclosures in the financial statements. Our audits also included evaluating the accounting principles used and significant estimates made by management, as well as evaluating the overall presentation of the financial statements. We believe that our audits provide a reasonable basis for our opinion.
| /s/ Ernst & Young LLP |
We have served as ConocoPhillips' auditor since 1949. |
Houston, Texas |
February 20, 2018 |
77
Report of Independent Registered Public Accounting Firm
To the Stockholders and the Board of Directors of ConocoPhillips
Opinion on Internal Control over Financial Reporting
We have audited ConocoPhillips' internal control over financial reporting as of December 31, 2017, based on criteria established in Internal Control-Integrated Framework issued by the Committee of Sponsoring Organizations of the Treadway Commission (2013 framework) (the COSO criteria). In our opinion, ConocoPhillips maintained, in all material respects, effective internal control over financial reporting as of December 31, 2017, based on the COSO criteria.
We also have audited, in accordance with the standards of the Public Company Accounting Oversight Board (United States) (PCAOB), the consolidated balance sheets as of December 31, 2017 and 2016, and the related consolidated income statement, consolidated statements of comprehensive income, changes in equity and cash flows for each of the three years in the period ended December 31, 2017, and the related notes, condensed consolidating financial information listed in the Index at Item 8, and financial statement schedule listed in Item 15(a) of ConocoPhillips and our report dated February 20, 2018, expressed an unqualified opinion thereon.
Basis for Opinion
ConocoPhillips' management is responsible for maintaining effective internal control over financial reporting and for its assessment of the effectiveness of internal control over financial reporting included under the heading "Assessment of Internal Control Over Financial Reporting" in the accompanying "Report of Management." Our responsibility is to express an opinion on ConocoPhillips' internal control over financial reporting based on our audit. We are a public accounting firm registered with the PCAOB and are required to be independent with respect to ConocoPhillips in accordance with the U.S. federal securities laws and the applicable rules and regulations of the Securities and Exchange Commission and the PCAOB.
We conducted our audit in accordance with the standards of the PCAOB. Those standards require that we plan and perform the audit to obtain reasonable assurance about whether effective internal control over financial reporting was maintained in all material respects.
Our audit included obtaining an understanding of internal control over financial reporting, assessing the risk that a material weakness exists, testing and evaluating the design and operating effectiveness of internal control based on the assessed risk, and performing such other procedures as we considered necessary in the circumstances. We believe that our audit provides a reasonable basis for our opinion.
Definition and Limitations of Internal Control Over Financial Reporting
A company's internal control over financial reporting is a process designed to provide reasonable assurance regarding the reliability of financial reporting and the preparation of financial statements for external purposes in accordance with generally accepted accounting principles. A company's internal control over financial reporting includes those policies and procedures that (1) pertain to the maintenance of records that, in reasonable detail, accurately and fairly reflect the transactions and dispositions of the assets of the company; (2) provide reasonable assurance that transactions are recorded as necessary to permit preparation of financial statements in accordance with generally accepted accounting principles, and that receipts and expenditures of the company are being made only in accordance with authorizations of management and directors of the company; and (3) provide reasonable assurance regarding prevention or timely detection of unauthorized acquisition, use, or disposition of the company's assets that could have a material effect on the financial statements.
Because of its inherent limitations, internal control over financial reporting may not prevent or detect misstatements. Also, projections of any evaluation of effectiveness to future periods are subject to the risk that controls may become inadequate because of changes in conditions, or that the degree of compliance with the policies or procedures may deteriorate.
| /s/ Ernst & Young LLP |
Houston, Texas |
February 20, 2018 |
78
| Consolidated Income Statement | ConocoPhillips | |||||
Years Ended December 31
| Millions of Dollars | ||||||||||||
|
| |||||||||||
| 2017 | 2016 | 2015 | ||||||||||
|
| |||||||||||
Revenues and Other Income | ||||||||||||
Sales and other operating revenues | $ | 29,106 | 23,693 | 29,564 | ||||||||
Equity in earnings of affiliates | 772 | 52 | 655 | |||||||||
Gain on dispositions | 2,177 | 360 | 591 | |||||||||
Other income | 529 | 255 | 125 | |||||||||
| ||||||||||||
Total Revenues and Other Income | 32,584 | 24,360 | 30,935 | |||||||||
| ||||||||||||
Costs and Expenses | ||||||||||||
Purchased commodities | 12,475 | 9,994 | 12,426 | |||||||||
Production and operating expenses | 5,173 | 5,667 | 7,016 | |||||||||
Selling, general and administrative expenses | 561 | 723 | 953 | |||||||||
Exploration expenses | 938 | 1,915 | 4,192 | |||||||||
Depreciation, depletion and amortization | 6,845 | 9,062 | 9,113 | |||||||||
Impairments | 6,601 | 139 | 2,245 | |||||||||
Taxes other than income taxes | 809 | 739 | 901 | |||||||||
Accretion on discounted liabilities | 362 | 425 | 483 | |||||||||
Interest and debt expense | 1,098 | 1,245 | 920 | |||||||||
Foreign currency transaction (gains) losses | 35 | (19 | ) | (75 | ) | |||||||
Other expense | 302 | - | - | |||||||||
| ||||||||||||
Total Costs and Expenses | 35,199 | 29,890 | 38,174 | |||||||||
| ||||||||||||
Loss before income taxes | (2,615 | ) | (5,530 | ) | (7,239 | ) | ||||||
Income tax benefit | (1,822 | ) | (1,971 | ) | (2,868 | ) | ||||||
| ||||||||||||
Net loss | (793 | ) | (3,559 | ) | (4,371 | ) | ||||||
Less: net income attributable to noncontrolling interests | (62 | ) | (56 | ) | (57 | ) | ||||||
| ||||||||||||
Net Loss Attributable to ConocoPhillips | $ | (855 | ) | (3,615 | ) | (4,428 | ) | |||||
| ||||||||||||
Net Loss Attributable to ConocoPhillips Per Share of Common Stock (dollars) | ||||||||||||
Basic | $ | (0.70 | ) | (2.91 | ) | (3.58 | ) | |||||
Diluted | (0.70 | ) | (2.91 | ) | (3.58 | ) | ||||||
| ||||||||||||
Dividends Paid Per Share of Common Stock (dollars) | $ | 1.06 | 1.00 | 2.94 | ||||||||
| ||||||||||||
Average Common Shares Outstanding (in thousands) | ||||||||||||
Basic | 1,221,038 | 1,245,440 | 1,241,919 | |||||||||
Diluted | 1,221,038 | 1,245,440 | 1,241,919 | |||||||||
| ||||||||||||
See Notes to Consolidated Financial Statements.
79
Consolidated Statement of Comprehensive Income | ConocoPhillips | |||
Years Ended December 31
| Millions of Dollars | ||||||||||||
|
| |||||||||||
| 2017 | 2016 | 2015 | ||||||||||
|
| |||||||||||
Net Loss | $ | (793 | ) | (3,559 | ) | (4,371 | ) | |||||
Other comprehensive income (loss) | ||||||||||||
Defined benefit plans | ||||||||||||
Prior service credit arising during the period | 2 | 23 | 301 | |||||||||
Reclassification adjustment for amortization of prior service credit included in net loss | (38 | ) | (35 | ) | (19 | ) | ||||||
| ||||||||||||
Net change | (36 | ) | (12 | ) | 282 | |||||||
| ||||||||||||
Net actuarial gain (loss) arising during the period | 19 | (481 | ) | 592 | ||||||||
Reclassification adjustment for amortization of net actuarial losses included in net loss | 247 | 309 | 403 | |||||||||
| ||||||||||||
Net change | 266 | (172 | ) | 995 | ||||||||
Nonsponsored plans* | (2 | ) | 2 | 1 | ||||||||
Income taxes on defined benefit plans | (81 | ) | 78 | (460 | ) | |||||||
| ||||||||||||
Defined benefit plans, net of tax | 147 | (104 | ) | 818 | ||||||||
| ||||||||||||
Unrealized holding loss on securities | (58 | ) | - | - | ||||||||
| ||||||||||||
Unrealized loss on securities, net of tax | (58 | ) | - | - | ||||||||
| ||||||||||||
Foreign currency translation adjustments | 586 | 153 | (5,199 | ) | ||||||||
Reclassification adjustment for gain included in net loss | - | 5 | - | |||||||||
Income taxes on foreign currency translation adjustments | - | - | 36 | |||||||||
| ||||||||||||
Foreign currency translation adjustments, net of tax | 586 | 158 | (5,163 | ) | ||||||||
| ||||||||||||
Other Comprehensive Income (Loss), Net of Tax | 675 | 54 | (4,345 | ) | ||||||||
| ||||||||||||
Comprehensive Loss | (118 | ) | (3,505 | ) | (8,716 | ) | ||||||
Less: comprehensive income attributable to noncontrolling interests | (62 | ) | (56 | ) | (57 | ) | ||||||
| ||||||||||||
Comprehensive Loss Attributable to ConocoPhillips | $ | (180 | ) | (3,561 | ) | (8,773 | ) | |||||
| ||||||||||||
*Plans for which ConocoPhillips is not the primary obligor-primarily those administered by equity affiliates.
See Notes to Consolidated Financial Statements.
80
| Consolidated Balance Sheet | ConocoPhillips |
| At December 31 | Millions of Dollars | |||||||
|
| |||||||
| 2017 | 2016 | |||||||
|
| |||||||
Assets | ||||||||
Cash and cash equivalents | $ | 6,325 | 3,610 | |||||
Short-term investments | 1,873 | 50 | ||||||
Accounts and notes receivable (net of allowance of $4 million in 2017 and $5 million in 2016) | 4,179 | 3,249 | ||||||
Accounts and notes receivable-related parties | 141 | 165 | ||||||
Investment in Cenovus Energy | 1,899 | - | ||||||
Inventories | 1,060 | 1,018 | ||||||
Prepaid expenses and other current assets | 1,035 | 517 | ||||||
| ||||||||
Total Current Assets | 16,512 | 8,609 | ||||||
Investments and long-term receivables | 9,599 | 21,091 | ||||||
Loans and advances-related parties | 461 | 581 | ||||||
Net properties, plants and equipment (net of accumulated depreciation, depletion and amortization of $64,748 million in 2017 and $73,075 million in 2016) | 45,683 | 58,331 | ||||||
Other assets | 1,107 | 1,160 | ||||||
| ||||||||
Total Assets | $ | 73,362 | 89,772 | |||||
| ||||||||
Liabilities | ||||||||
Accounts payable | $ | 4,009 | 3,631 | |||||
Accounts payable-related parties | 21 | 22 | ||||||
Short-term debt | 2,575 | 1,089 | ||||||
Accrued income and other taxes | 1,038 | 484 | ||||||
Employee benefit obligations | 725 | 689 | ||||||
Other accruals | 1,029 | 994 | ||||||
| ||||||||
Total Current Liabilities | 9,397 | 6,909 | ||||||
Long-term debt | 17,128 | 26,186 | ||||||
Asset retirement obligations and accrued environmental costs | 7,631 | 8,425 | ||||||
Deferred income taxes | 5,282 | 8,949 | ||||||
Employee benefit obligations | 1,854 | 2,552 | ||||||
Other liabilities and deferred credits | 1,269 | 1,525 | ||||||
| ||||||||
Total Liabilities | 42,561 | 54,546 | ||||||
| ||||||||
Equity | ||||||||
Common stock (2,500,000,000 shares authorized at $.01 par value) | ||||||||
Issued (2017-1,785,419,175 shares; 2016-1,782,079,107 shares) | ||||||||
Par value | 18 | 18 | ||||||
Capital in excess of par | 46,622 | 46,507 | ||||||
Treasury stock (at cost: 2017-608,312,034 shares; 2016-544,809,771 shares) | (39,906 | ) | (36,906 | ) | ||||
Accumulated other comprehensive loss | (5,518 | ) | (6,193 | ) | ||||
Retained earnings | 29,391 | 31,548 | ||||||
| ||||||||
Total Common Stockholders' Equity | 30,607 | 34,974 | ||||||
Noncontrolling interests | 194 | 252 | ||||||
| ||||||||
Total Equity | 30,801 | 35,226 | ||||||
| ||||||||
Total Liabilities and Equity | $ | 73,362 | 89,772 | |||||
| ||||||||
See Notes to Consolidated Financial Statements.
81
| Consolidated Statement of Cash Flows | ConocoPhillips |
| Years Ended December 31 | Millions of Dollars | |||||||||||
|
| |||||||||||
| 2017 | 2016 | 2015 | ||||||||||
|
| |||||||||||
Cash Flows From Operating Activities | ||||||||||||
Net loss | $ | (793 | ) | (3,559 | ) | (4,371 | ) | |||||
Adjustments to reconcile net loss to net cash provided by operating activities | ||||||||||||
Depreciation, depletion and amortization | 6,845 | 9,062 | 9,113 | |||||||||
Impairments | 6,601 | 139 | 2,245 | |||||||||
Dry hole costs and leasehold impairments | 566 | 1,184 | 3,065 | |||||||||
Accretion on discounted liabilities | 362 | 425 | 483 | |||||||||
Deferred taxes | (3,681 | ) | (2,221 | ) | (2,772 | ) | ||||||
Undistributed equity earnings | (232 | ) | 299 | 101 | ||||||||
Gain on dispositions | (2,177 | ) | (360 | ) | (591 | ) | ||||||
Other | (429 | ) | (85 | ) | 321 | |||||||
Working capital adjustments | ||||||||||||
Decrease (increase) in accounts and notes receivable | (886 | ) | 820 | 1,810 | ||||||||
Decrease (increase) in inventories | (55 | ) | 44 | 166 | ||||||||
Decrease in prepaid expenses and other current assets | 69 | 105 | 239 | |||||||||
Increase (decrease) in accounts payable | 265 | (524 | ) | (1,647 | ) | |||||||
Increase (decrease) in taxes and other accruals | 622 | (926 | ) | (590 | ) | |||||||
| ||||||||||||
Net Cash Provided by Operating Activities | 7,077 | 4,403 | 7,572 | |||||||||
| ||||||||||||
Cash Flows From Investing Activities | ||||||||||||
Capital expenditures and investments | (4,591 | ) | (4,869 | ) | (10,050 | ) | ||||||
Working capital changes associated with investing activities | 132 | (331 | ) | (968 | ) | |||||||
Proceeds from asset dispositions | 13,860 | 1,286 | 1,952 | |||||||||
Net purchases of short-term investments | (1,790 | ) | (51 | ) | - | |||||||
Collection of advances/loans-related parties | 115 | 108 | 105 | |||||||||
Other | 36 | (2 | ) | 306 | ||||||||
| ||||||||||||
Net Cash Provided by (Used in) Investing Activities | 7,762 | (3,859 | ) | (8,655 | ) | |||||||
| ||||||||||||
Cash Flows From Financing Activities | ||||||||||||
Issuance of debt | - | 4,594 | 2,498 | |||||||||
Repayment of debt | (7,876 | ) | (2,251 | ) | (103 | ) | ||||||
Issuance of company common stock | (63 | ) | (63 | ) | (82 | ) | ||||||
Repurchase of company common stock | (3,000 | ) | (126 | ) | - | |||||||
Dividends paid | (1,305 | ) | (1,253 | ) | (3,664 | ) | ||||||
Other | (112 | ) | (137 | ) | (78 | ) | ||||||
| ||||||||||||
Net Cash Provided by (Used in) Financing Activities | (12,356 | ) | 764 | (1,429 | ) | |||||||
| ||||||||||||
Effect of Exchange Rate Changes on Cash and Cash Equivalents | 232 | (66 | ) | (182 | ) | |||||||
| ||||||||||||
Net Change in Cash and Cash Equivalents | 2,715 | 1,242 | (2,694 | ) | ||||||||
Cash and cash equivalents at beginning of period | 3,610 | 2,368 | 5,062 | |||||||||
| ||||||||||||
Cash and Cash Equivalents at End of Period | $ | 6,325 | 3,610 | 2,368 | ||||||||
| ||||||||||||
See Notes to Consolidated Financial Statements.
82
| Consolidated Statement of Changes in Equity | ConocoPhillips | |||||||||||||||
| Millions of Dollars | ||||||||||||||||||||||||||||
|
| |||||||||||||||||||||||||||
| Attributable to ConocoPhillips | ||||||||||||||||||||||||||||
|
| |||||||||||||||||||||||||||
| Common Stock | ||||||||||||||||||||||||||||
|
| |||||||||||||||||||||||||||
| Par Value | Capital in Excess of Par | Treasury Stock | Accum. Other Comprehensive Income (Loss) | Retained Earnings | Non- Controlling Interests | Total | ||||||||||||||||||||||
|
| |||||||||||||||||||||||||||
December 31, 2014 | $ | 18 | 46,071 | (36,780 | ) | (1,902 | ) | 44,504 | 362 | 52,273 | ||||||||||||||||||
Net income (loss) | (4,428 | ) | 57 | (4,371 | ) | |||||||||||||||||||||||
Other comprehensive loss | (4,345 | ) | (4,345 | ) | ||||||||||||||||||||||||
Dividends paid | (3,664 | ) | (3,664 | ) | ||||||||||||||||||||||||
Distributions to noncontrolling interests and other | (100 | ) | (100 | ) | ||||||||||||||||||||||||
Distributed under benefit plans | 286 | 286 | ||||||||||||||||||||||||||
Other | 2 | 1 | 3 | |||||||||||||||||||||||||
| ||||||||||||||||||||||||||||
December 31, 2015 | $ | 18 | 46,357 | (36,780 | ) | (6,247 | ) | 36,414 | 320 | 40,082 | ||||||||||||||||||
Net income (loss) | (3,615 | ) | 56 | (3,559 | ) | |||||||||||||||||||||||
Other comprehensive income | 54 | 54 | ||||||||||||||||||||||||||
Dividends paid | (1,253 | ) | (1,253 | ) | ||||||||||||||||||||||||
Repurchase of company common stock | (126 | ) | (126 | ) | ||||||||||||||||||||||||
Distributions to noncontrolling interests and other | (124 | ) | (124 | ) | ||||||||||||||||||||||||
Distributed under benefit plans | 150 | 150 | ||||||||||||||||||||||||||
Other | 2 | 2 | ||||||||||||||||||||||||||
| ||||||||||||||||||||||||||||
December 31, 2016 | $ | 18 | 46,507 | (36,906 | ) | (6,193 | ) | 31,548 | 252 | 35,226 | ||||||||||||||||||
Net income (loss) | (855 | ) | 62 | (793 | ) | |||||||||||||||||||||||
Other comprehensive income | 675 | 675 | ||||||||||||||||||||||||||
Dividends paid | (1,305 | ) | (1,305 | ) | ||||||||||||||||||||||||
Repurchase of company common stock | (3,000 | ) | (3,000 | ) | ||||||||||||||||||||||||
Distributions to noncontrolling interests and other | (120 | ) | (120 | ) | ||||||||||||||||||||||||
Distributed under benefit plans | 115 | 115 | ||||||||||||||||||||||||||
Other | 3 | 3 | ||||||||||||||||||||||||||
| ||||||||||||||||||||||||||||
December 31, 2017 | $ | 18 | 46,622 | (39,906 | ) | (5,518 | ) | 29,391 | 194 | 30,801 | ||||||||||||||||||
| ||||||||||||||||||||||||||||
See Notes to Consolidated Financial Statements.
83
| Notes to Consolidated Financial Statements | ConocoPhillips |
Note 1-Accounting Policies
| ∎ | Consolidation Principles and Investments -Our consolidated financial statements include the accounts of majority-owned, controlled subsidiaries and variable interest entities where we are the primary beneficiary. The equity method is used to account for investments in affiliates in which we have the ability to exert significant influence over the affiliates' operating and financial policies. When we do not have the ability to exert significant influence, the investment is either classified as available-for-sale if fair value is readily determinable, or the cost method is used if fair value is not readily determinable. Undivided interests in oil and gas joint ventures, pipelines, natural gas plants and terminals are consolidated on a proportionate basis. Other securities and investments are generally carried at cost. |
We manage our operations through six operating segments, defined by geographic region: Alaska, Lower 48, Canada, Europe and North Africa, Asia Pacific and Middle East, and Other International. For additional information, see Note 23-Segment Disclosures and Related Information.
| ∎ | Foreign Currency Translation -Adjustments resulting from the process of translating foreign functional currency financial statements into U.S. dollars are included in accumulated other comprehensive income in common stockholders' equity. Foreign currency transaction gains and losses are included in current earnings. Most of our foreign operations use their local currency as the functional currency. |
| ∎ | Use of Estimates -The preparation of financial statements in conformity with accounting principles generally accepted in the United States requires management to make estimates and assumptions that affect the reported amounts of assets, liabilities, revenues and expenses, and the disclosures of contingent assets and liabilities. Actual results could differ from these estimates. |
| ∎ | Revenue Recognition -Revenues associated with sales of crude oil, bitumen, natural gas, liquefied natural gas (LNG), natural gas liquids and other items are recognized when title passes to the customer, which is when the risk of ownership passes to the purchaser and physical delivery of goods occurs, either immediately or within a fixed delivery schedule that is reasonable and customary in the industry. |
Revenues associated with producing properties in which we have an interest with other producers are recognized based on the actual volumes we sold during the period. Any differences between volumes sold and entitlement volumes, based on our net working interest, which are deemed to be nonrecoverable through remaining production, are recognized as accounts receivable or accounts payable, as appropriate. Cumulative differences between volumes sold and entitlement volumes are generally not significant.
Revenues associated with transactions commonly called buy/sell contracts, in which the purchase and sale of inventory with the same counterparty are entered into "in contemplation" of one another, are combined and reported net (i.e., on the same income statement line).
| ∎ | Shipping and Handling Costs -We include shipping and handling costs in production and operating expenses for production activities. Transportation costs related to marketing activities are recorded in purchased commodities. Freight costs billed to customers are recorded as a component of revenue. |
| ∎ | Cash Equivalents -Cash equivalents are highly liquid, short-term investments that are readily convertible to known amounts of cash and have original maturities of 90 days or less from their date of purchase. They are carried at cost plus accrued interest, which approximates fair value. |
| ∎ | Short-Term Investments -Investments in bank time deposits and marketable securities (commercial paper and government obligations) with original maturities of greater than 90 days but less than one year are classified as short-term investments. |
84
| ∎ | Inventories -We have several valuation methods for our various types of inventories and consistently use the following methods for each type of inventory. Our commodity-related inventories are recorded at cost primarily using the last-in, first-out (LIFO) basis. We measure these inventories at the lower-of-cost-or-market in the aggregate. Any necessary lower-of-cost-or-market write-downs at year end are recorded as permanent adjustments to the LIFO cost basis. LIFO is used to better match current inventory costs with current revenues. Costs include both direct and indirect expenditures incurred in bringing an item or product to its existing condition and location, but not unusual/nonrecurring costs or research and development costs. Materials, supplies and other miscellaneous inventories, such as tubular goods and well equipment, are valued using various methods, including the weighted-average-cost method, and the first-in, first-out (FIFO) method, consistent with industry practice. |
| ∎ | Fair Value Measurements -Assets and liabilities measured at fair value and required to be categorized within the fair value hierarchy are categorized into one of three different levels depending on the observability of the inputs employed in the measurement. Level 1 inputs are quoted prices in active markets for identical assets or liabilities. Level 2 inputs are observable inputs other than quoted prices included within Level 1 for the asset or liability, either directly or indirectly through market-corroborated inputs. Level 3 inputs are unobservable inputs for the asset or liability reflecting significant modifications to observable related market data or our assumptions about pricing by market participants. |
| ∎ | Derivative Instruments -Derivative instruments are recorded on the balance sheet at fair value. If the right of offset exists and certain other criteria are met, derivative assets and liabilities with the same counterparty are netted on the balance sheet and the collateral payable or receivable is netted against derivative assets and derivative liabilities, respectively. |
Recognition and classification of the gain or loss that results from recording and adjusting a derivative to fair value depends on the purpose for issuing or holding the derivative. Gains and losses from derivatives not accounted for as hedges are recognized immediately in earnings.
| ∎ | Oil and Gas Exploration and Development -Oil and gas exploration and development costs are accounted for using the successful efforts method of accounting. |
Property Acquisition Costs -Oil and gas leasehold acquisition costs are capitalized and included in the balance sheet caption properties, plants and equipment (PP&E). Leasehold impairment is recognized based on exploratory experience and management's judgment. Upon achievement of all conditions necessary for reserves to be classified as proved, the associated leasehold costs are reclassified to proved properties.
Exploratory Costs -Geological and geophysical costs and the costs of carrying and retaining undeveloped properties are expensed as incurred. Exploratory well costs are capitalized, or "suspended," on the balance sheet pending further evaluation of whether economically recoverable reserves have been found. If economically recoverable reserves are not found, exploratory well costs are expensed as dry holes. If exploratory wells encounter potentially economic quantities of oil and gas, the well costs remain capitalized on the balance sheet as long as sufficient progress assessing the reserves and the economic and operating viability of the project is being made. For complex exploratory discoveries, it is not unusual to have exploratory wells remain suspended on the balance sheet for several years while we perform additional appraisal drilling and seismic work on the potential oil and gas field or while we seek government or co-venturer approval of development plans or seek environmental permitting. Once all required approvals and permits have been obtained, the projects are moved into the development phase, and the oil and gas resources are designated as proved reserves.
Management reviews suspended well balances quarterly, continuously monitors the results of the additional appraisal drilling and seismic work, and expenses the suspended well costs as dry holes when it judges the potential field does not warrant further investment in the near term. See Note 7-Suspended Wells and Other Exploration Expenses, for additional information on suspended wells.
85
Development Costs -Costs incurred to drill and equip development wells, including unsuccessful development wells, are capitalized.
Depletion and Amortization -Leasehold costs of producing properties are depleted using the unit-of-production method based on estimated proved oil and gas reserves. Amortization of intangible development costs is based on the unit-of-production method using estimated proved developed oil and gas reserves.
| ∎ | Capitalized Interest -Interest from external borrowings is capitalized on major projects with an expected construction period of one year or longer. Capitalized interest is added to the cost of the underlying asset and is amortized over the useful lives of the assets in the same manner as the underlying assets. |
| ∎ | Depreciation and Amortization -Depreciation and amortization of PP&E on producing hydrocarbon properties and certain pipeline assets (those which are expected to have a declining utilization pattern), are determined by the unit-of-production method. Depreciation and amortization of all other PP&E are determined by either the individual-unit-straight-line method or the group-straight-line method (for those individual units that are highly integrated with other units). |
| ∎ | Impairment of Properties, Plants and Equipment -PP&E used in operations are assessed for impairment whenever changes in facts and circumstances indicate a possible significant deterioration in the future cash flows expected to be generated by an asset group and annually in the fourth quarter following updates to corporate planning assumptions. If there is an indication the carrying amount of an asset may not be recovered, the asset is monitored by management through an established process where changes to significant assumptions such as prices, volumes and future development plans are reviewed. If, upon review, the sum of the undiscounted before-tax cash flows is less than the carrying value of the asset group, the carrying value is written down to estimated fair value through additional amortization or depreciation provisions and reported as impairments in the periods in which the determination of the impairment is made. Individual assets are grouped for impairment purposes at the lowest level for which there are identifiable cash flows that are largely independent of the cash flows of other groups of assets-generally on a field-by-field basis for exploration and production assets. Because there usually is a lack of quoted market prices for long-lived assets, the fair value of impaired assets is typically determined based on the present values of expected future cash flows using discount rates believed to be consistent with those used by principal market participants or based on a multiple of operating cash flow validated with historical market transactions of similar assets where possible. Long-lived assets committed by management for disposal within one year are accounted for at the lower of amortized cost or fair value, less cost to sell, with fair value determined using a binding negotiated price, if available, or present value of expected future cash flows as previously described. |
The expected future cash flows used for impairment reviews and related fair value calculations are based on estimated future production volumes, prices and costs, considering all available evidence at the date of review. The impairment review includes cash flows from proved developed and undeveloped reserves, including any development expenditures necessary to achieve that production. Additionally, when probable and possible reserves exist, an appropriate risk-adjusted amount of these reserves may be included in the impairment calculation.
| ∎ | Impairment of Investments in Nonconsolidated Entities -Investments in nonconsolidated entities are assessed for impairment whenever changes in the facts and circumstances indicate a loss in value has occurred and annually following updates to corporate planning assumptions. When such a condition is judgmentally determined to be other than temporary, the carrying value of the investment is written down to fair value. The fair value of the impaired investment is based on quoted market prices, if available, or upon the present value of expected future cash flows using discount rates believed to be consistent with those used by principal market participants, plus market analysis of comparable assets owned by the investee, if appropriate. |
86
| ∎ | Maintenance and Repairs -Costs of maintenance and repairs, which are not significant improvements, are expensed when incurred. |
| ∎ | Property Dispositions -When complete units of depreciable property are sold, the asset cost and related accumulated depreciation are eliminated, with any gain or loss reflected in the "Gain on dispositions" line of our consolidated income statement. When less than complete units of depreciable property are disposed of or retired, the difference between asset cost and salvage value is charged or credited to accumulated depreciation. |
| ∎ | Asset Retirement Obligations and Environmental Costs -The fair value of legal obligations to retire and remove long-lived assets are recorded in the period in which the obligation is incurred (typically when the asset is installed at the production location). When the liability is initially recorded, we capitalize this cost by increasing the carrying amount of the related PP&E. If, in subsequent periods, our estimate of this liability changes, we will record an adjustment to both the liability and PP&E. Over time the liability is increased for the change in its present value, and the capitalized cost in PP&E is depreciated over the useful life of the related asset. For additional information, see Note 9-Asset Retirement Obligations and Accrued Environmental Costs. |
Environmental expenditures are expensed or capitalized, depending upon their future economic benefit. Expenditures relating to an existing condition caused by past operations, and those having no future economic benefit, are expensed. Liabilities for environmental expenditures are recorded on an undiscounted basis (unless acquired in a purchase business combination, which we record on a discounted basis) when environmental assessments or cleanups are probable and the costs can be reasonably estimated. Recoveries of environmental remediation costs from other parties are recorded as assets when their receipt is probable and estimable.
| ∎ | Guarantees -The fair value of a guarantee is determined and recorded as a liability at the time the guarantee is given. The initial liability is subsequently reduced as we are released from exposure under the guarantee. We amortize the guarantee liability over the relevant time period, if one exists, based on the facts and circumstances surrounding each type of guarantee. In cases where the guarantee term is indefinite, we reverse the liability when we have information indicating the liability is essentially relieved or amortize it over an appropriate time period as the fair value of our guarantee exposure declines over time. We amortize the guarantee liability to the related income statement line item based on the nature of the guarantee. When it becomes probable that we will have to perform on a guarantee, we accrue a separate liability if it is reasonably estimable, based on the facts and circumstances at that time. We reverse the fair value liability only when there is no further exposure under the guarantee. |
| ∎ | Share-Based Compensation -We recognize share-based compensation expense over the shorter of the service period (i.e., the stated period of time required to earn the award) or the period beginning at the start of the service period and ending when an employee first becomes eligible for retirement. We have elected to recognize expense on a straight-line basis over the service period for the entire award, whether the award was granted with ratable or cliff vesting. |
| ∎ | Income Taxes -Deferred income taxes are computed using the liability method and are provided on all temporary differences between the financial reporting basis and the tax basis of our assets and liabilities, except for deferred taxes on income and temporary differences related to the cumulative translation adjustment considered to be permanently reinvested in certain foreign subsidiaries and foreign corporate joint ventures. Allowable tax credits are applied currently as reductions of the provision for income taxes. Interest related to unrecognized tax benefits is reflected in interest and debt expense, and penalties related to unrecognized tax benefits are reflected in production and operating expenses. |
| ∎ | Taxes Collected from Customers and Remitted to Governmental Authorities -Sales and value-added taxes are recorded net. |
87
| ∎ | Net Income (Loss) Per Share of Common Stock -Basic net income (loss) per share of common stock is calculated based upon the daily weighted-average number of common shares outstanding during the year. Also, this calculation includes fully vested stock and unit awards that have not yet been issued as common stock, along with an adjustment to net income (loss) for dividend equivalents paid on unvested unit awards that are considered participating securities. Diluted net income per share of common stock includes unvested stock, unit or option awards granted under our compensation plans and vested but unexercised stock options, but only to the extent these instruments dilute net income per share, primarily under the treasury-stock method. Diluted net loss per share, which is calculated the same as basic net loss per share, does not assume conversion or exercise of securities that would have an antidilutive effect. Treasury stock is excluded from the daily weighted-average number of common shares outstanding in both calculations. The earnings per share impact of the participating securities is immaterial. |
Note 2-Variable Interest Entities (VIEs)
We hold variable interests in VIEs that have not been consolidated because we are not considered the primary beneficiary. Information on our significant VIEs follows:
Australia Pacific LNG Pty Ltd (APLNG)
APLNG is considered a VIE, as it has entered into certain contractual arrangements that provide it with additional forms of subordinated financial support. We are not the primary beneficiary of APLNG because we share with Origin Energy and China Petrochemical Corporation (Sinopec) the power to direct the key activities of APLNG that most significantly impact its economic performance, which involve activities related to the production and commercialization of coalbed methane, as well as LNG processing and export marketing. As a result, we do not consolidate APLNG, and it is accounted for as an equity method investment.
As of December 31, 2017, we have not provided any financial support to APLNG other than amounts previously contractually required. Unless we elect otherwise, we have no requirement to provide liquidity or purchase the assets of APLNG. See Note 5-Investments, Loans and Long-Term Receivables, and Note 11-Guarantees, for additional information.
Marine Well Containment Company, LLC (MWCC)
MWCC provides well containment equipment and technology and related services in the deepwater U.S. Gulf of Mexico. Its principal activities involve the development and maintenance of rapid-response hydrocarbon well containment systems that are deployable in the Gulf of Mexico on a call-out basis. We have a 10 percent ownership interest in MWCC, and it is accounted for as an equity method investment because MWCC is a limited liability company in which we are a Founding Member and exercise significant influence through our permanent seat on the ten-member Executive Committee responsible for overseeing the affairs of MWCC. In 2016, MWCC executed a $154 million term loan financing arrangement with an external financial institution whose terms required the financing be secured by letters of credit provided by certain owners of MWCC, including ConocoPhillips. In connection with the financing transaction, we issued a letter of credit of $22 million which can be drawn upon in the event of a default by MWCC on its obligation to repay the proceeds of the term loan. The fair value of this letter of credit is immaterial and not recognized on our consolidated balance sheet. MWCC is considered a VIE, as it has entered into arrangements that provide it with additional forms of subordinated financial support. We are not the primary beneficiary and do not consolidate MWCC because we share the power to govern the business and operation of the company and to undertake certain obligations that most significantly impact its economic performance with nine other unaffiliated owners of MWCC.
At December 31, 2017, the book value of our equity method investment in MWCC was $139 million. We have not provided any financial support to MWCC other than amounts previously contractually required. Unless we elect otherwise, we have no requirement to provide liquidity or purchase the assets of MWCC.
88
Note 3-Inventories
Inventories at December 31 were:
| Millions of Dollars | ||||||||
|
| |||||||
| 2017 | 2016 | |||||||
|
| |||||||
Crude oil and natural gas | $ | 512 | 418 | |||||
Materials and supplies | 548 | 600 | ||||||
| $ | 1,060 | 1,018 | ||||||
| ||||||||
Inventories valued on the LIFO basis totaled $341 million and $269 million at December 31, 2017 and 2016, respectively. The estimated excess of current replacement cost over LIFO cost of inventories was approximately $124 million and $104 million at December 31, 2017 and December 31, 2016, respectively. In 2017, liquidation of LIFO inventory values increased the net loss attributable to ConocoPhillips by $1 million.
Note 4-Assets Held for Sale, Sold or Acquired
Assets Held for Sale
In the second quarter of 2017, we signed a definitive agreement to sell our interest in the Barnett. We terminated this agreement in the fourth quarter of 2017 and are continuing to market the asset in 2018. In connection with the signing of the definitive agreement, we recorded a before-tax impairment of $572 million to reduce the carrying value of our investment to estimated fair value. As of December 31, 2017, our Barnett interests had a net carrying value of approximately $291 million and were considered held for sale resulting in the reclassification of $339 million of PP&E to "Prepaid expenses and other current assets" and $48 million of noncurrent liabilities, primarily asset retirement obligations (ARO), to "Other accruals" on our consolidated balance sheet. The before-tax loss associated with our interests in the Barnett, including the $572 million impairment noted above, was $566 million, $66 million, and $58 million for the years ended December 31, 2017, 2016 and 2015, respectively. The Barnett results of operations are reported within our Lower 48 segment.
In addition to the Barnett, certain other properties in our Lower 48 segment met the criteria for assets held for sale at December 31, 2017. These properties had a net carrying value of approximately $212 million after recording a before-tax impairment of $78 million to reduce the carrying value to estimated fair value in the fourth quarter of 2017. We reclassified $238 million of PP&E to "Prepaid expenses and other current assets" and $26 million of noncurrent liabilities, primarily AROs, to "Other accruals" on our consolidated balance sheet. In January 2018, we completed the sale of a portion of these properties for net proceeds of $112 million.
Assets Sold
All gains or losses are reported before-tax and are included net in the "Gain on dispositions" line on our consolidated income statement. All cash proceeds are included in the "Cash Flows From Investing Activities" section of our consolidated statement of cash flows.
2017
On May 17, 2017, we completed the sale of our 50 percent nonoperated interest in the Foster Creek Christina Lake (FCCL) Partnership, as well as the majority of our western Canada gas assets to Cenovus Energy. Consideration for the transaction was $11.0 billion in cash after customary adjustments, 208 million Cenovus Energy common shares and a five-year uncapped contingent payment. The value of the shares at closing was $1.96 billion based on a price of $9.41 per share on the New York Stock Exchange. The contingent payment, calculated and paid on a quarterly basis, is $6 million Canadian dollars (CAD) for every $1 CAD by which the Western Canada Select (WCS) quarterly average crude price exceeds $52 CAD per barrel.
89
At closing, the carrying value of our equity investment in FCCL was $8.9 billion. The carrying value of our interest in the western Canada gas assets was $1.9 billion consisting primarily of $2.6 billion of PP&E, partly offset by AROs of $585 million and approximately $100 million of environmental and other accruals. A before-tax gain of $2.1 billion was included in the "Gain on disposition" line on our consolidated income statement in 2017. We reported before-tax losses of $26 million, $572 million and $582 million for the western Canada gas producing properties for the years ended December 31, 2017, 2016 and 2015, respectively. We reported before-tax equity earnings of $197 million, $89 million and $78 million for FCCL for the same periods, respectively. Both FCCL and the western Canada gas assets were reported within our Canada segment.
For more information on the Canada disposition and our investment in Cenovus Energy see Note 6-Investment in Cenovus Energy, Note 14-Fair Value Measurement, and Note 19-Accumulated Other Comprehensive Loss.
On July 31, 2017, we completed the sale of our interests in the San Juan Basin to an affiliate of Hilcorp Energy Company for $2.5 billion in cash after customary adjustments, and recognized a loss on disposition of $22 million. The transaction includes a contingent payment of up to $300 million. The six-year contingent payment, effective beginning January 1, 2018, is due annually for the periods in which the monthly U.S. Henry Hub price is at or above $3.20 per million British thermal units.
In the second quarter of 2017, we recorded a before-tax impairment of $3.3 billion to reduce the carrying value of our interests in the San Juan Basin to fair value. At the time of disposition, the San Juan Basin interests had a net carrying value of approximately $2.5 billion, consisting of $2.9 billion of PP&E and $406 million of liabilities, primarily AROs. The before-tax loss associated with our interests in the San Juan Basin, including both the $3.3 billion impairment and $22 million loss on disposition noted above, was $3.2 billion, $239 million and $99 million for the years ended December 31, 2017, 2016 and 2015, respectively. The San Juan Basin results of operations were reported within our Lower 48 segment.
On September 29, 2017, we completed the sale of our interest in the Panhandle assets for $178 million in cash after customary adjustments, and recognized a before-tax loss on disposition of $28 million. At the time of the disposition, the carrying value of our interest was $206 million, consisting primarily of $279 million of PP&E and $72 million of AROs. Including the $28 million loss on disposition noted above, we reported before-tax losses for the Panhandle properties of $14 million, $21 million, and $41 million for the years ended December 31, 2017, 2016 and 2015, respectively. The Panhandle results were reported within our Lower 48 segment.
2016
In April 2016, we sold our interest in the Alaska Beluga River Unit natural gas field in the Cook Inlet for $134 million, net of settlement of gas imbalances and customary adjustments, and recognized a gain on disposition of $56 million. At the time of disposition, the net carrying value of our Beluga River Unit interest, which was included in the Alaska segment, was $78 million, consisting primarily of $100 million of PP&E and $19 million of AROs.
In October 2016, we completed an asset exchange with Bonavista Energy in which we gave up approximately 141,000 net acres of noncore developed properties in central Alberta in exchange for approximately 40,000 net acres of primarily undeveloped properties in northeast British Columbia. The fair value of the transaction was determined to be approximately $69 million and a before-tax impairment of $57 million was recognized in the third quarter of 2016 when the assets were considered held for sale, to reduce the carrying value to fair value. A loss on disposition of approximately $1 million was recognized upon completion of the transaction. The divested properties were included in the Canada segment.
Also in October 2016, we sold ConocoPhillips Senegal B.V., the entity that held our 35 percent interest in three exploration blocks offshore Senegal for $442 million and recognized a gain on disposition of $146 million. At the time of disposition, the carrying value of our interest was $286 million, which was primarily PP&E. Senegal results of operations were reported within our Other International segment.
90
In November 2016, we completed the sale of our 40 percent interest in South Natuna Sea Block B for $225 million and recognized a loss on disposition of $26 million. Our interest in Block B was included in the Asia Pacific and Middle East segment. In 2016, we recognized a before-tax impairment of $42 million at the time it was considered held for sale to reduce the carrying value to fair value. At the time of the disposition, the carrying value of our interest was approximately $251 million, which included primarily $154 million of PP&E, $178 million of accounts receivable, $25 million of inventory, $54 million of deferred tax assets, $130 million of accounts payable and other accruals, and $38 million of employee benefit obligations.
In December 2016, we completed the sale of certain mineral and non-mineral fee lands in northeastern Minnesota, which were included in the Lower 48 segment, for $148 million and recorded a gain on disposition of $4 million. The majority of the assets sold were acquired during the fourth quarter of 2016 as a result of ConocoPhillips holding a reversionary interest in the Greater Northern Iron Ore Properties Trust (the Trust), a grantor trust that owned mineral and surface interests in the Mesabi Iron Range in northeastern Minnesota and certain other personal property. Pursuant to the terms of the Trust Agreement, the Trust terminated on April 6, 2015. In November 2016, upon completion of the wind-down period, documents memorializing ConocoPhillips' ownership of certain Trust property, including all of the Trust's mineral properties and active leases, were delivered to us and we recognized the fair value of the net assets resulting in a gain of $88 million recorded in the "Other income" line on our consolidated income statement. At the time of the disposition, the carrying value of our interests, which included the assets obtained from the Trust, consisted of $144 million of PP&E.
2015
In November 2015, we sold a portion of our western Canadian properties located in British Columbia, Alberta, and Saskatchewan for $198 million and recognized a gain on disposition of $66 million. At the time of the disposition, the carrying value of our interest, which was included in the Canada segment, was $132 million, which included primarily $379 million of PP&E and $248 million of ARO.
In December 2015, we sold a portion of our western Canadian properties located in central Alberta for $130 million and recognized a loss on disposition of $235 million. At the time of the disposition, the carrying value of our interest, which was included in the Canada segment, was approximately $365 million, which included primarily $488 million of PP&E and $126 million of ARO.
Additionally, other December 2015 disposition transactions are summarized below.
We sold producing properties in East Texas and North Louisiana for $412 million and recognized a gain on disposition of $189 million. At the time of the disposition, the carrying value of our interest, which was included in the Lower 48 segment, was $223 million, which included $351 million of PP&E and $128 million of ARO.
We sold certain gas producing properties in South Texas for $358 million and recognized a gain on disposition of $201 million. At the time of the disposition, the carrying value of our interest, which was included in the Lower 48 segment, was $157 million, which included $369 million of PP&E and $212 million of ARO.
We sold certain pipeline and gathering assets in South Texas for $201 million and recognized a gain on disposition of $193 million. At the time of the disposition, the carrying value of our interest, which was included in the Lower 48 segment, was $8 million, which primarily included $24 million of PP&E and $18 million of ARO.
We also sold our 50 percent interest in the Russian joint venture, Polar Lights Company, for $98 million and recognized a gain on disposition of $58 million. At the time of the disposition, the carrying value of our equity method investment in Polar Lights Company, which was included in our Other International segment, was approximately $40 million.
91
Acquisition
In January 2018, we entered into an agreement to acquire certain oil and gas assets in Alaska for $400 million, subject to customary adjustments. The acquisition is subject to regulatory approval.
Note 5-Investments, Loans and Long-Term Receivables
Components of investments, loans and long-term receivables at December 31 were:
| Millions of Dollars | ||||||||
|
| |||||||
| 2017 | 2016 | |||||||
|
| |||||||
Equity investments | $ | 9,129 | 20,364 | |||||
Loans and advances-related parties | 461 | 581 | ||||||
Long-term receivables | 375 | 631 | ||||||
Other investments | 95 | 96 | ||||||
| $ | 10,060 | 21,672 | ||||||
| ||||||||
Equity Investments
Affiliated companies in which we had a significant equity investment at December 31, 2017, included:
| • | APLNG-37.5 percent owned joint venture with Origin Energy (37.5 percent) and Sinopec (25 percent)-to develop coalbed methane production from the Bowen and Surat basins in Queensland, Australia, as well as process and export LNG. |
| • | Qatar Liquefied Gas Company Limited (3) (QG3)-30 percent owned joint venture with affiliates of Qatar Petroleum (68.5 percent) and Mitsui & Co., Ltd. (1.5 percent)-produces and liquefies natural gas from Qatar's North Field, as well as exports LNG. |
Summarized 100 percent earnings information for equity method investments in affiliated companies, combined, was as follows:
| Millions of Dollars | ||||||||||||
|
| |||||||||||
| 2017 | 2016 | 2015 | ||||||||||
|
| |||||||||||
Revenues | $ | 11,554 | 10,149 | 11,003 | ||||||||
Income (loss) before income taxes | (2,875 | ) | 660 | 1,866 | ||||||||
Net income (loss) | (1,431 | ) | 799 | 1,801 | ||||||||
Summarized 100 percent balance sheet information for equity method investments in affiliated companies, combined, was as follows:
| Millions of Dollars | ||||||||
|
| |||||||
| 2017 | 2016 | |||||||
|
| |||||||
Current assets | $ | 2,920 | 3,578 | |||||
Noncurrent assets | 42,693 | 60,243 | ||||||
Current liabilities | 2,453 | 2,352 | ||||||
Noncurrent liabilities | 25,522 | 23,764 | ||||||
Our share of income taxes incurred directly by an equity company is reported in equity in earnings of affiliates, and as such is not included in income taxes in our consolidated financial statements.
92
At December 31, 2017, retained earnings included $20 million related to the undistributed earnings of affiliated companies. Dividends received from affiliates were $605 million, $398 million and $876 million in 2017, 2016 and 2015, respectively.
APLNG
APLNG is focused on coalbed methane production from the Bowen and Surat basins in Queensland, Australia, to supply the domestic gas market and on LNG processing and export sales. Our investment in APLNG gives us access to coalbed methane resources in Australia and enhances our LNG position. The majority of APLNG LNG is sold under two long- term sales and purchase agreements, supplemented with sales of additional LNG spot cargoes targeting the Asia Pacific markets. Origin Energy, an integrated Australian energy company, is the operator of APLNG's production and pipeline system, while we operate the LNG facility.
APLNG executed project financing agreements for an $8.5 billion project finance facility in 2012. The $8.5 billion project finance facility is composed of financing agreements executed by APLNG with the Export-Import Bank of the United States for approximately $2.9 billion, the Export-Import Bank of China for approximately $2.7 billion, and a syndicate of Australian and international commercial banks for approximately $2.9 billion. At December 31, 2017, all amounts have been drawn from the facility. APLNG made its first principal and interest repayment in March 2017, and will continue to make bi-annual payments until March 2029. At December 31, 2017, a balance of $7.9 billion was outstanding on the facility. In connection with the execution of the project financing, we provided a completion guarantee for our pro-rata share of the project finance facility until the project achieves financial completion. In October 2016, we reached financial completion for Train 1, which reduced our associated guarantee by 60 percent. In August 2017, we reached financial completion for Train 2, which removed the remaining guarantee. See Note 11-Guarantees, for additional information.
APLNG is considered a VIE, as it has entered into certain contractual arrangements that provide it with additional forms of subordinated financial support. See Note 2-Variable Interest Entities (VIEs) for additional information.
On July 1, 2016, APLNG changed its tax functional currency from Australian dollar to U.S. dollar and translated all APLNG assets and liabilities into U.S. dollar, utilizing the exchange rate as of that date. As a result of this change, we recorded a reduction to our investment in APLNG for the deferred tax effect of $174 million in the "Equity in earnings of affiliates" line of our consolidated income statement.
During the fourth quarter of 2015, due to the outlook for crude oil and natural gas prices at that time, the estimated fair value of our investment in APLNG declined to an amount below book value. Accordingly, we recorded a noncash $1,502 million before- and after-tax impairment, in our fourth-quarter 2015 results.
During the first and second quarters of 2017, the outlook for crude oil prices deteriorated, and as a result of significantly reduced price outlooks, the estimated fair value of our investment in APLNG declined to an amount below carrying value. Based on a review of the facts and circumstances surrounding this decline in fair value, we concluded in the second quarter of 2017 the impairment was other than temporary under the guidance of Financial Accounting Standards Board (FASB) Accounting Standards Codification (ASC) Topic 323, "Investments – Equity Method and Joint Ventures," and the recognition of an impairment of our investment to fair value was necessary. Accordingly, we recorded a noncash $2,384 million, before- and after- tax impairment in our second-quarter 2017 results. Fair value was estimated based on an internal discounted cash flow model using estimated future production, an outlook of future prices from a combination of exchanges (short-term) and pricing service companies (long-term), costs, a market outlook of foreign exchange rates provided by a third party, and a discount rate believed to be consistent with those used by principal market participants. The impairment was included in the "Impairments" line on our consolidated income statement.
At December 31, 2017, the carrying value of our equity method investment in APLNG was $7,669 million. The historical cost basis of our 37.5 percent share of net assets on the books of APLNG was $7,213 million, resulting in a basis difference of $456 million on our books. The basis difference, which is substantially all
93
associated with PP&E and subject to amortization, has been allocated on a relative fair value basis to individual exploration and production license areas owned by APLNG, some of which are not currently in production. Any future additional payments are expected to be allocated in a similar manner. Each exploration license area will periodically be reviewed for any indicators of potential impairment, which, if required, would result in acceleration of basis difference amortization. As the joint venture produces natural gas from each license, we amortize the basis difference allocated to that license using the unit-of-production method. Included in net loss attributable to ConocoPhillips for 2017, 2016 and 2015 was after-tax expense of $100 million, $92 million and $21 million, respectively, representing the amortization of this basis difference on currently producing licenses.
FCCL
FCCL Partnership, a Canadian upstream 50/50 general partnership with Cenovus Energy Inc., produces bitumen in the Athabasca oil sands in northeastern Alberta and sells the bitumen blend. Cenovus is the operator and managing partner of FCCL.
On May 17, 2017, we completed the sale of our 50 percent nonoperated interest in the FCCL Partnership, as well as the majority of our western Canada gas assets to Cenovus Energy. Financial information presented within this footnote includes our historical interest up to the date of sale. For additional information on the Canada disposition and our investment in Cenovus Energy, see Note 4-Assets Held for Sale, Sold or Acquired and Note 6-Investment in Cenovus Energy.
QG3
QG3 is a joint venture that owns an integrated large-scale LNG project located in Qatar. We provided project financing, with a current outstanding balance of $581 million as described below under "Loans and Long-Term Receivables." At December 31, 2017, the book value of our equity method investment in QG3, excluding the project financing, was $886 million. We have terminal and pipeline use agreements with Golden Pass LNG Terminal and affiliated Golden Pass Pipeline near Sabine Pass, Texas, in which we have a 12.4 percent interest, intended to provide us with terminal and pipeline capacity for the receipt, storage and regasification of LNG purchased from QG3. However, currently the LNG from QG3 is being sold to markets outside of the United States.
Loans and Long-Term Receivables
As part of our normal ongoing business operations and consistent with industry practice, we enter into numerous agreements with other parties to pursue business opportunities. Included in such activity are loans and long-term receivables to certain affiliated and non-affiliated companies. Loans are recorded when cash is transferred or seller financing is provided to the affiliated or non-affiliated company pursuant to a loan agreement. The loan balance will increase as interest is earned on the outstanding loan balance and will decrease as interest and principal payments are received. Interest is earned at the loan agreement's stated interest rate. Loans and long-term receivables are assessed for impairment when events indicate the loan balance may not be fully recovered.
At December 31, 2017, significant loans to affiliated companies include $581 million in project financing to QG3. We own a 30 percent interest in QG3, for which we use the equity method of accounting. The other participants in the project are affiliates of Qatar Petroleum and Mitsui. QG3 secured project financing of $4.0 billion in December 2005, consisting of $1.3 billion of loans from export credit agencies (ECA), $1.5 billion from commercial banks, and $1.2 billion from ConocoPhillips. The ConocoPhillips loan facilities have substantially the same terms as the ECA and commercial bank facilities. On December 15, 2011, QG3 achieved financial completion and all project loan facilities became nonrecourse to the project participants. Semi-annual repayments began in January 2011 and will extend through July 2022.
The long-term portion of these loans is included in the "Loans and advances-related parties" line on our consolidated balance sheet, while the short-term portion is in "Accounts and notes receivable-related parties."
94
Note 6-Investment in Cenovus Energy
On May 17, 2017, we completed the sale of our 50 percent nonoperated interest in the FCCL Partnership, as well as the majority of our western Canada gas assets to Cenovus Energy. Consideration for the transaction included 208 million Cenovus Energy common shares, which approximated 16.9 percent of issued and outstanding Cenovus common shares at closing. See Note 4-Assets Held for Sale, Sold or Acquired, for additional information on the Canada disposition.
At closing, the fair value and cost basis of our investment in 208 million Cenovus Energy common shares was $1.96 billion based on a price of $9.41 per share on the New York Stock Exchange.
We have classified our investment as an available-for-sale equity security on our consolidated balance sheet and, as of December 31, 2017, our investment is carried at fair value of $1.90 billion, reflecting the closing price of Cenovus Energy shares on the New York Stock Exchange of $9.13 per share. The carrying value reflects a before-tax and after-tax unrealized loss of $58 million over our cost basis of $1.96 billion. The unrealized loss is reported as a component of accumulated other comprehensive loss. See Note 14-Fair Value Measurement, for additional information. We intend to decrease our investment over time through market transactions, private agreements or otherwise.
Note 7-Suspended Wells and Other Exploration Expenses
The following table reflects the net changes in suspended exploratory well costs during 2017, 2016 and 2015:
| Millions of Dollars | ||||||||||||
|
| |||||||||||
| 2017 | 2016 | 2015 | ||||||||||
|
| |||||||||||
Beginning balance at January 1 | $ | 1,063 | 1,260 | 1,299 | ||||||||
Additions pending the determination of proved reserves | 118 | 225 | 331 | |||||||||
Reclassifications to proved properties | (66) | (27) | (28) | |||||||||
Sales of suspended well investment | - | (247) | - | |||||||||
Charged to dry hole expense | (262) | (148) | (342) | |||||||||
Ending balance at December 31 | $ | 853 | 1,063 | 1,260 | ||||||||
| ||||||||||||
The following table provides an aging of suspended well balances at December 31:
| Millions of Dollars | ||||||||||||
|
| |||||||||||
| 2017 | 2016 | 2015 | ||||||||||
|
| |||||||||||
Exploratory well costs capitalized for a period of one year or less | $ | 67 | 132 | 235 | ||||||||
Exploratory well costs capitalized for a period greater than one year | 786 | 931 | 1,025 | |||||||||
Ending balance | $ | 853 | 1,063 | 1,260 | ||||||||
| ||||||||||||
Number of projects with exploratory well costs capitalized for a period greater than one year | 23 | 26 | 28 | |||||||||
95
The following table provides a further aging of those exploratory well costs that have been capitalized for more than one year since the completion of drilling as of December 31, 2017:
| Millions of Dollars | ||||||||||||||||
|
| |||||||||||||||
| Suspended Since | ||||||||||||||||
|
| |||||||||||||||
| Total | 2014–2016 | 2011–2013 | 2004–2010 | |||||||||||||
|
| |||||||||||||||
Greater Poseidon-Australia (2) | 177 | 63 | 102 | 12 | ||||||||||||
Greater Clair-UK (2) | 144 | 99 | 45 | - | ||||||||||||
Surmont-Canada (1) | 117 | 34 | 59 | 24 | ||||||||||||
NPRA-Alaska (1) | 114 | 66 | 42 | 6 | ||||||||||||
Barossa/Caldita-Australia (2) | 77 | - | - | 77 | ||||||||||||
Middle Magdalena Basin-Colombia (1) | 48 | 48 | - | - | ||||||||||||
Bohai-China (2) | 19 | 19 | - | - | ||||||||||||
Kamunsu East-Malaysia (2) | 19 | - | 19 | - | ||||||||||||
NC 98-Libya (2) | 15 | 11 | - | 4 | ||||||||||||
Sunrise-Australia (2) | 13 | - | - | 13 | ||||||||||||
Other of $10 million or less each (1)(2) | 43 | 20 | 6 | 17 | ||||||||||||
Total | $ | 786 | 360 | 273 | 153 | |||||||||||
| ||||||||||||||||
(1)Additional appraisal wells planned.
(2)Appraisal drilling complete; costs being incurred to assess development.
In line with our July 2015 announcement of plans to reduce future deepwater exploration spending, we recognized before-tax cancellation costs of $335 million and wrote off $48 million of before-tax capitalized rig costs in relation to the termination of our Gulf of Mexico deepwater drillship contract with Ensco in the Lower 48 segment in 2015. In July 2016, we entered into an agreement to terminate our final Gulf of Mexico deepwater drillship contract. The drillship, used to drill our operated deepwater well inventory in the Gulf of Mexico through April 2016, was contracted on a shared, three-year term. Accordingly, we recorded before-tax rig cancellation charges and third-party costs of $146 million in our Lower 48 segment in 2016.
In February 2017, we reached a settlement agreement on our contract for the Athena drilling rig, initially secured for our four-well commitment program in Angola. As a result of the cancellation, we recognized a before-tax charge of $43 million net in the first quarter of 2017. These charges are included in the "Exploration expenses" line on our consolidated income statement.
Note 8-Impairments
During 2017, 2016 and 2015, we recognized the following before-tax impairment charges:
| Millions of Dollars | ||||||||||||
|
| |||||||||||
| 2017 | 2016 | 2015 | ||||||||||
|
| |||||||||||
Alaska | $ | 180 | 1 | 10 | ||||||||
Lower 48 | 3,969 | 149 | (2 | ) | ||||||||
Canada | 22 | 88 | 4 | |||||||||
Europe and North Africa | 46 | (160 | ) | 724 | ||||||||
Asia Pacific and Middle East | 2,384 | 44 | 1,508 | |||||||||
Corporate | - | 17 | 1 | |||||||||
| $ | 6,601 | 139 | 2,245 | |||||||||
| ||||||||||||
96
2017
In Alaska, we recorded impairments of $180 million primarily for the associated PP&E carrying value of our small interest in the Point Thomson unit.
In the Lower 48, we recorded impairments of $3,969 million primarily due to certain developed properties which were written down to fair value less costs to sell. See Note 4-Assets Held for Sale, Sold or Acquired, for additional information on our dispositions.
In Canada, we recorded impairments of $22 million primarily due to cancelled projects.
In Europe and North Africa, we recorded impairments of $46 million primarily due to reduced volume forecasts for a field in the United Kingdom and restructured ownership and a change in commercial premises for a gas processing plant in Norway, partly offset by decreased ARO estimates on fields at or nearing the end of life which were impaired in prior years.
In Asia Pacific and Middle East, we recorded impairments of $2,384 million, including the impairment of our APLNG investment. For more information, see the "APLNG" section of Note 5-Investments, Loans and Long-Term Receivables.
The charges discussed below, within this section, are included in the "Exploration expenses" line on our consolidated income statement and are not reflected in the table above.
In our Lower 48 segment, we recorded a before-tax impairment of $51 million for the associated carrying value of capitalized undeveloped leasehold costs of Shenandoah in deepwater Gulf of Mexico following the suspension of appraisal activity by the operator. Additionally, we recorded a $38 million before-tax impairment for mineral assets primarily due to plan of development changes.
2016
In the Lower 48, we recorded impairments of $149 million primarily due to cancelled projects associated with plan of development changes for Eagle Ford infrastructure, as well as lower natural gas prices and increased ARO estimates.
In Canada, we recorded impairments of $88 million mainly due to plan of development changes, as well as certain developed properties being written down to fair value less costs to sell.
In Europe and North Africa, we recorded a credit to impairment of $160 million, primarily in the United Kingdom, due to decreased ARO estimates on fields at or nearing the end of life which were impaired in prior years, partly offset by asset impairments due to lower natural gas prices in the United Kingdom.
In Asia Pacific and Middle East, we recorded impairments of $44 million, mainly due to a write-down to fair value less costs to sell of our developed properties in Block B, offshore Indonesia, in the third quarter of 2016.
In Corporate, we recorded impairments of $17 million due to cancelled projects in our Houston and Bartlesville offices.
The charges discussed below, within this section, are included in the "Exploration expenses" line on our consolidated income statement and are not reflected in the table above.
Charges recorded in exploration expenses in 2016 were related to our decision announced in 2015 to reduce deepwater exploration spending.
97
In our Lower 48 segment, we recorded a $203 million before-tax impairment for the associated carrying value of our Gibson and Tiber undeveloped leaseholds in deepwater Gulf of Mexico. Additionally, we recorded a $95 million before-tax impairment for the associated carrying value of capitalized undeveloped leasehold costs of the Melmar prospect and a $79 million before-tax impairment, primarily as a result of changes in the estimated market value following the completion of marketing efforts.
In our Canada segment, we recorded before-tax unproved property impairments of $31 million, primarily due to decisions to discontinue additional testing of undeveloped leaseholds.
2015
See the "APLNG" section of Note 5-Investments, Loans and Long-Term Receivables, for information on the impairment of our APLNG investment included within the Asia Pacific and Middle East segment.
In Europe and North Africa, we recorded impairments of $724 million, primarily in the United Kingdom as a result of lower natural gas prices and increases to AROs.
The charges discussed below, within this section, are included in the "Exploration expenses" line on our consolidated income statement and are not reflected in the table above.
In our Other International segment, we decided not to pursue further evaluation of our Block 36 and Block 37 leases in Angola due to lack of commerciality of wells. Accordingly, we recorded before-tax impairments of $377 million and $116 million, respectively, for the associated carrying values of capitalized undeveloped leasehold costs.
In our Lower 48 segment, we decided not to conduct further activity on certain Gulf of Mexico leases, given our strategic plans to reduce deepwater exploration spending, and accordingly recorded before-tax impairments of $399 million for the associated carrying value of certain capitalized undeveloped leasehold costs.
In our Asia Pacific and Middle East segment, we decided to relinquish our Palangkaraya PSC in Indonesia. Accordingly, we recorded a before-tax impairment of $105 million for the associated carrying values of capitalized undeveloped leasehold cost.
In our Alaska segment, we recorded a before-tax impairment of $575 million for the associated carrying value of capitalized undeveloped leasehold cost in the Chukchi Sea in Alaska.
In our Canada segment, we recorded a before-tax impairment of $102 million for the Duvernay, Thornbury, Saleski and Crow Lake areas driven primarily by the lack of commerciality of wells.
Note 9-Asset Retirement Obligations and Accrued Environmental Costs
Asset retirement obligations and accrued environmental costs at December 31 were:
| Millions of Dollars | ||||||||
|
| |||||||
| 2017 | 2016 | |||||||
|
| |||||||
Asset retirement obligations | $ | 7,798 | 8,405 | |||||
Accrued environmental costs | 180 | 247 | ||||||
| ||||||||
Total asset retirement obligations and accrued environmental costs | 7,978 | 8,652 | ||||||
Asset retirement obligations and accrued environmental costs due within one year* | (347 | ) | (227 | ) | ||||
| ||||||||
Long-term asset retirement obligations and accrued environmental costs | $ | 7,631 | 8,425 | |||||
| ||||||||
*Classified as a current liability on the balance sheet under "Other accruals."
98
Asset Retirement Obligations
We record the fair value of a liability for an ARO when it is incurred (typically when the asset is installed at the production location). When the liability is initially recorded, we capitalize the associated asset retirement cost by increasing the carrying amount of the related PP&E. If, in subsequent periods, our estimate of this liability changes, we will record an adjustment to both the liability and PP&E. Over time, the liability increases for the change in its present value, while the capitalized cost depreciates over the useful life of the related asset.
We have numerous AROs we are required to perform under law or contract once an asset is permanently taken out of service. Most of these obligations are not expected to be paid until several years, or decades, in the future and will be funded from general company resources at the time of removal. Our largest individual obligations involve plugging and abandonment of wells and removal and disposal of offshore oil and gas platforms around the world, as well as oil and gas production facilities and pipelines in Alaska.
During 2017 and 2016, our overall ARO changed as follows:
| Millions of Dollars | ||||||||
|
| |||||||
| 2017 | 2016 | |||||||
|
| |||||||
Balance at January 1 | $ | 8,405 | 9,911 | |||||
Accretion of discount | 358 | 420 | ||||||
New obligations | 113 | 180 | ||||||
Changes in estimates of existing obligations | (150 | ) | (1,197 | ) | ||||
Spending on existing obligations | (152 | ) | (314 | ) | ||||
Property dispositions | (1,065 | ) | (150 | ) | ||||
Foreign currency translation | 289 | (445 | ) | |||||
| ||||||||
Balance at December 31 | $ | 7,798 | 8,405 | |||||
| ||||||||
Accrued Environmental Costs
Total accrued environmental costs at December 31, 2017 and 2016, were $180 million and $247 million, respectively.
We had accrued environmental costs of $105 million and $183 million at December 31, 2017 and 2016, respectively, related to remediation activities in the United States and Canada. We had also accrued in Corporate and Other $60 million and $51 million of environmental costs associated with sites no longer in operation at December 31, 2017 and 2016, respectively. In addition, $15 million and $13 million were included at both December 31, 2017 and 2016, respectively, where the company has been named a potentially responsible party under the Federal Comprehensive Environmental Response, Compensation and Liability Act, or similar state laws. Accrued environmental liabilities are expected to be paid over periods extending up to 30 years.
Expected expenditures for environmental obligations acquired in various business combinations are discounted using a weighted-average 5 percent discount factor, resulting in an accrued balance for acquired environmental liabilities of $96 million at December 31, 2017. The expected future undiscounted payments related to the portion of the accrued environmental costs that have been discounted are: $12 million in 2018, $10 million in 2019, $5 million in 2020, $10 million in 2021, $3 million in 2022, and $106 million for all future years after 2022.
99
Note 10-Debt
Long-term debt at December 31 was:
| Millions of Dollars | ||||||||
|
| |||||||
| 2017 | 2016 | |||||||
|
| |||||||
9.125% Debentures due 2021 | $ | 150 | 150 | |||||
8.20% Debentures due 2025 | 150 | 150 | ||||||
8.125% Notes due 2030 | 600 | 600 | ||||||
7.9% Debentures due 2047 | 100 | 100 | ||||||
7.8% Debentures due 2027 | 300 | 300 | ||||||
7.65% Debentures due 2023 | 88 | 88 | ||||||
7.40% Notes due 2031 | 500 | 500 | ||||||
7.375% Debentures due 2029 | 92 | 92 | ||||||
7.25% Notes due 2031 | 500 | 500 | ||||||
7.20% Notes due 2031 | 575 | 575 | ||||||
7% Debentures due 2029 | 200 | 200 | ||||||
6.95% Notes due 2029 | 1,549 | 1,549 | ||||||
6.875% Debentures due 2026 | 67 | 67 | ||||||
6.65% Debentures due 2018 | - | 297 | ||||||
6.50% Notes due 2039 | 2,750 | 2,750 | ||||||
6.00% Notes due 2020 | - | 1,000 | ||||||
5.951% Notes due 2037 | 645 | 645 | ||||||
5.95% Notes due 2036 | 500 | 500 | ||||||
5.95% Notes due 2046 | 500 | 500 | ||||||
5.90% Notes due 2032 | 505 | 505 | ||||||
5.90% Notes due 2038 | 600 | 600 | ||||||
5.75% Notes due 2019 | - | 2,250 | ||||||
5.20% Notes due 2018 | - | 500 | ||||||
4.95% Notes due 2026 | 1,250 | 1,250 | ||||||
4.30% Notes due 2044 | 750 | 750 | ||||||
4.20% Notes due 2021 | 1,000 | 1,250 | ||||||
4.15% Notes due 2034 | 500 | 500 | ||||||
3.35% Notes due 2024 | 1,000 | 1,000 | ||||||
3.35% Notes due 2025 | 500 | 500 | ||||||
2.875% Notes due 2021 | 750 | 750 | ||||||
2.4% Notes due 2022 | 1,000 | 1,000 | ||||||
2.2% Notes due 2020 | 500 | 500 | ||||||
1.5% Notes due 2018 | - | 750 | ||||||
1.05% Notes due 2017 | - | 1,000 | ||||||
Floating rate term loan due 2019 at 2.31% – 2.75% during 2017 and 1.94% – 2.31% during 2016 | - | 1,450 | ||||||
Floating rate notes due 2018 at 1.24% – 1.75% during 2017 and 0.69% – 1.24% during 2016 | 250 | 250 | ||||||
Floating rate notes due 2022 at 1.81% – 2.32% during 2017 and 1.26% – 1.81% during 2016 | 500 | 500 | ||||||
Industrial Development Bonds due 2017 through 2038 at 0.64% – 1.74% during 2017 and 0.01% – 0.91% during 2016 | 18 | 18 | ||||||
Marine Terminal Revenue Refunding Bonds due 2031 at 0.64% – 1.74% during 2017 and 0.01% – 0.95% during 2016 | 265 | 265 | ||||||
Other | 23 | 24 | ||||||
| ||||||||
Debt at face value | 18,677 | 26,175 | ||||||
Capitalized leases | 774 | 852 | ||||||
Net unamortized premiums, discounts and debt issuance costs | 252 | 248 | ||||||
| ||||||||
Total debt | 19,703 | 27,275 | ||||||
Short-term debt | (2,575 | ) | (1,089 | ) | ||||
| ||||||||
Long-term debt | $ | 17,128 | 26,186 | |||||
| ||||||||
100
Maturities of long-term borrowings, inclusive of net unamortized premiums and discounts, in 2018 through 2022 are: $2,575 million, $113 million, $97 million, $236 million and $1,602 million, respectively.
We have a revolving credit facility totaling $6.75 billion, expiring in June 2019. Our revolving credit facility may be used for direct bank borrowings, the issuance of letters of credit totaling up to $500 million, or as support for our commercial paper programs. The revolving credit facility is broadly syndicated among financial institutions and does not contain any material adverse change provisions or any covenants requiring maintenance of specified financial ratios or credit ratings. The facility agreement contains a cross-default provision relating to the failure to pay principal or interest on other debt obligations of $200 million or more by ConocoPhillips, or any of its consolidated subsidiaries.
Credit facility borrowings may bear interest at a margin above rates offered by certain designated banks in the London interbank market or at a margin above the overnight federal funds rate or prime rates offered by certain designated banks in the United States. The agreement calls for commitment fees on available, but unused, amounts. The agreement also contains early termination rights if our current directors or their approved successors cease to be a majority of the Board of Directors.
We have two commercial paper programs. The ConocoPhillips $6.25 billion commercial paper program is available to fund short-term working capital needs. We also have the ConocoPhillips Qatar Funding Ltd. $500 million commercial paper program, which is used to fund commitments relating to QG3. Commercial paper maturities are generally limited to 90 days. We had no commercial paper outstanding at December 31, 2017 or 2016, under either the ConocoPhillips or the ConocoPhillips Qatar Funding Ltd. commercial paper program. We had no direct borrowings or letters of credit issued under the revolving credit facility. Since we had no commercial paper outstanding and had issued no letters of credit, we had access to $6.75 billion in borrowing capacity under our revolving credit facility at December 31, 2017.
In 2017, two notes totaling $1,001 million were paid at maturity, including the $1.0 billion 1.05% Notes due 2017. Also in 2017, we prepaid the $1,450 million term loan facility due in 2019.
We also redeemed a total $5.0 billion of debt, described below, incurring $301 million in premiums above book value, which are reported in the "Other expense" line on our consolidated income statement.
| • | 6.65% Debentures due 2018 with principal of $297 million. |
| • | 5.20% Notes due 2018 with principal of $500 million. |
| • | 1.5% Notes due 2018 with principal of $750 million. |
| • | 5.75% Notes due 2019 with principal of $2.25 billion. |
| • | 6.00% Notes due 2020 with principal of $1.0 billion. |
| • | 4.20% Notes due 2021 with principal of $1.25 billion (partial redemption of $250 million). |
In the fourth quarter of 2017, we gave notice to redeem the following debt instruments totaling $2.25 billion.
| • | 2.2% Notes due 2020 with principal of $500 million. |
| • | 4.20% Notes due 2021 with remaining principal of $1.0 billion. |
| • | 2.875% Notes due 2021 with principal of $750 million. |
The prepayments occurred on January 22, 2018, and we incurred premiums above book value of $75 million.
At both December 31, 2017 and 2016, we had $283 million of certain variable rate demand bonds (VRDBs) outstanding with maturities ranging through 2035. The VRDBs are redeemable at the option of the bondholders on any business day. The VRDBs are included in the "Long-term debt" line on our consolidated balance sheet.
During 2013, a lease of a semi-submersible floating production system (FPS) commenced for the Gumusut development, located in Malaysia, in which we are a co-venturer. The FPS lease provides for an initial
101
noncancelable term of 15 years, a subsequent 5-year cancelable term with no required lease payments, and an additional 5-year term with terms and conditions to be agreed at a later date. The lease has no ongoing purchase options or escalation clauses. Adjustments to provisional contingent rental payments may occur due to the finalization of actual commissioning costs. The lease does not impose any significant restrictions concerning dividends, debt or further leasing activities.
A capital lease asset and capital lease obligation were recognized for our proportionate interest in the FPS of $906 million, based on the present value of the future minimum lease payments using our before-tax incremental borrowing rate of 3.58 percent for debt with similar terms. Our proportionate interest in the FPS is 29 percent as of December 31, 2017. The net carrying value of the capital lease asset was approximately $434 million and $540 million as of December 31, 2017 and 2016, respectively. The capital lease asset is being depreciated over a period consistent with the estimated proved reserves of Gumusut using the unit-of-production method with the associated depreciation included in the "Depreciation, depletion and amortization" line on our consolidated income statement. As of December 31, 2017 and 2016, accumulated depreciation of the capital lease asset amounted to approximately $381 million and $268 million, respectively.
At December 31, 2017, future minimum payments due under capital leases were:
| Millions of Dollars |
| ||
|
| |||
2018 | $ | 108 | ||
2019 | 106 | |||
2020 | 106 | |||
2021 | 88 | |||
2022 | 88 | |||
Remaining years | 487 | |||
| ||||
Total | 983 | |||
Less: portion representing imputed interest | (209 | ) | ||
| ||||
Capital lease obligations | $ | 774 | ||
| ||||
Note 11-Guarantees
At December 31, 2017, we were liable for certain contingent obligations under various contractual arrangements as described below. We recognize a liability, at inception, for the fair value of our obligation as a guarantor for newly issued or modified guarantees. Unless the carrying amount of the liability is noted below, we have not recognized a liability because the fair value of the obligation is immaterial. In addition, unless otherwise stated, we are not currently performing with any significance under the guarantee and expect future performance to be either immaterial or have only a remote chance of occurrence.
APLNG Guarantees
At December 31, 2017, we had outstanding multiple guarantees in connection with our 37.5 percent ownership interest in APLNG. The following is a description of the guarantees with values calculated utilizing December 2017 exchange rates:
| • | We guaranteed APLNG's performance with regard to a construction contract executed in connection with APLNG's issuance of the Train 1 and Train 2 Notices to Proceed. Our maximum potential amount of future payments related to this guarantee became immaterial in the second quarter of 2017. |
| • | We issued a construction completion guarantee related to the third-party project financing secured by APLNG. In October 2016, we reached financial completion for Train 1, releasing a portion of our guarantee. In August 2017, the two-train project finance lenders' test was completed, releasing the remaining guarantee. |
102
| • | During the third quarter of 2016, we issued a guarantee to facilitate the withdrawal of our pro-rata portion of the funds in a project finance reserve account. We estimate the remaining term of this guarantee is 12 years. Our maximum exposure under this guarantee is approximately $200 million and may become payable if an enforcement action is commenced by the project finance lenders against APLNG. At December 31, 2017, the carrying value of this guarantee is approximately $14 million. |
| • | In conjunction with our original purchase of an ownership interest in APLNG from Origin Energy in October 2008, we agreed to reimburse Origin Energy for our share of the existing contingent liability arising under guarantees of an existing obligation of APLNG to deliver natural gas under several sales agreements with remaining terms of up to 24 years. Our maximum potential liability for future payments, or cost of volume delivery, under these guarantees is estimated to be $960 million ($1.71 billion in the event of intentional or reckless breach) and would become payable if APLNG fails to meet its obligations under these agreements and the obligations cannot otherwise be mitigated. Future payments are considered unlikely, as the payments, or cost of volume delivery, would only be triggered if APLNG does not have enough natural gas to meet these sales commitments and if the co-venturers do not make necessary equity contributions into APLNG. |
| • | We have guaranteed the performance of APLNG with regard to certain other contracts executed in connection with the project's continued development. The guarantees have remaining terms of up to 28 years or the life of the venture. Our maximum potential amount of future payments related to these guarantees is approximately $150 million and would become payable if APLNG does not perform. |
Other Guarantees
We have other guarantees with maximum future potential payment amounts totaling approximately $780 million, which consist primarily of guarantees of the residual value of leased office buildings, guarantees of the residual value of leased corporate aircraft, and a guarantee for our portion of a joint venture's project finance reserve accounts. These guarantees have remaining terms of up to 5 years and would become payable if, upon sale, certain asset values are lower than guaranteed amounts, business conditions decline at guaranteed entities, or as a result of nonperformance of contractual terms by guaranteed parties.
Indemnifications
Over the years, we have entered into agreements to sell ownership interests in certain corporations, joint ventures and assets that gave rise to qualifying indemnifications. These agreements include indemnifications for taxes, environmental liabilities, employee claims and litigation. The terms of these indemnifications vary greatly. The majority of these indemnifications are related to environmental issues, the term is generally indefinite and the maximum amount of future payments is generally unlimited. The carrying amount recorded for these indemnifications at December 31, 2017, was approximately $100 million. We amortize the indemnification liability over the relevant time period, if one exists, based on the facts and circumstances surrounding each type of indemnity. In cases where the indemnification term is indefinite, we will reverse the liability when we have information the liability is essentially relieved or amortize the liability over an appropriate time period as the fair value of our indemnification exposure declines. Although it is reasonably possible future payments may exceed amounts recorded, due to the nature of the indemnifications, it is not possible to make a reasonable estimate of the maximum potential amount of future payments. Included in the recorded carrying amount at December 31, 2017, were approximately $40 million of environmental accruals for known contamination that are included in the "Asset retirement obligations and accrued environmental costs" line on our consolidated balance sheet. For additional information about environmental liabilities, see Note 12-Contingencies and Commitments.
In 2012, we completed the separation of our downstream business, creating two independent energy companies: ConocoPhillips and Phillips 66. On March 1, 2015, a supplier to one of the refineries included in Phillips 66 as part of the separation of our downstream business formally registered Phillips 66 as a party to the supply agreement, thereby triggering a guarantee we provided at the time of separation. Our maximum potential liability for future payments under this guarantee, which would become payable if Phillips 66 does not perform its contractual obligations under the supply agreement, is approximately $1.31 billion. At
103
December 31, 2017, the carrying value of this guarantee is approximately $98 million and the remaining term is seven years. Because Phillips 66 has indemnified us for losses incurred under this guarantee, we have recorded an indemnification asset from Phillips 66 of approximately $98 million. The recorded indemnification asset amount represents the estimated fair value of the guarantee; however, if we are required to perform under the guarantee, we would expect to recover from Phillips 66 any amounts in excess of that value, provided Phillips 66 is a going concern.
Note 12-Contingencies and Commitments
A number of lawsuits involving a variety of claims arising in the ordinary course of business have been filed against ConocoPhillips. We also may be required to remove or mitigate the effects on the environment of the placement, storage, disposal or release of certain chemical, mineral and petroleum substances at various active and inactive sites. We regularly assess the need for accounting recognition or disclosure of these contingencies. In the case of all known contingencies (other than those related to income taxes), we accrue a liability when the loss is probable and the amount is reasonably estimable. If a range of amounts can be reasonably estimated and no amount within the range is a better estimate than any other amount, then the minimum of the range is accrued. We do not reduce these liabilities for potential insurance or third-party recoveries. If applicable, we accrue receivables for probable insurance or other third-party recoveries. With respect to income tax-related contingencies, we use a cumulative probability-weighted loss accrual in cases where sustaining a tax position is less than certain. See Note 18-Income Taxes, for additional information about income tax-related contingencies.
Based on currently available information, we believe it is remote that future costs related to known contingent liability exposures will exceed current accruals by an amount that would have a material adverse impact on our consolidated financial statements. As we learn new facts concerning contingencies, we reassess our position both with respect to accrued liabilities and other potential exposures. Estimates particularly sensitive to future changes include contingent liabilities recorded for environmental remediation, tax and legal matters. Estimated future environmental remediation costs are subject to change due to such factors as the uncertain magnitude of cleanup costs, the unknown time and extent of such remedial actions that may be required, and the determination of our liability in proportion to that of other responsible parties. Estimated future costs related to tax and legal matters are subject to change as events evolve and as additional information becomes available during the administrative and litigation processes.
Environmental
We are subject to international, federal, state and local environmental laws and regulations. When we prepare our consolidated financial statements, we record accruals for environmental liabilities based on management's best estimates, using all information that is available at the time. We measure estimates and base liabilities on currently available facts, existing technology, and presently enacted laws and regulations, taking into account stakeholder and business considerations. When measuring environmental liabilities, we also consider our prior experience in remediation of contaminated sites, other companies' cleanup experience, and data released by the U.S. Environmental Protection Agency (EPA) or other organizations. We consider unasserted claims in our determination of environmental liabilities, and we accrue them in the period they are both probable and reasonably estimable.
Although liability of those potentially responsible for environmental remediation costs is generally joint and several for federal sites and frequently so for other sites, we are usually only one of many companies cited at a particular site. Due to the joint and several liabilities, we could be responsible for all cleanup costs related to any site at which we have been designated as a potentially responsible party. We have been successful to date in sharing cleanup costs with other financially sound companies. Many of the sites at which we are potentially responsible are still under investigation by the EPA or the agency concerned. Prior to actual cleanup, those potentially responsible normally assess the site conditions, apportion responsibility and determine the appropriate remediation. In some instances, we may have no liability or may attain a settlement of liability. Where it appears that other potentially responsible parties may be financially unable to bear their proportional share, we consider this inability in estimating our potential liability, and we adjust our accruals accordingly.
104
As a result of various acquisitions in the past, we assumed certain environmental obligations. Some of these environmental obligations are mitigated by indemnifications made by others for our benefit, and some of the indemnifications are subject to dollar limits and time limits.
We are currently participating in environmental assessments and cleanups at numerous federal Superfund and comparable state and international sites. After an assessment of environmental exposures for cleanup and other costs, we make accruals on an undiscounted basis (except those acquired in a purchase business combination, which we record on a discounted basis) for planned investigation and remediation activities for sites where it is probable future costs will be incurred and these costs can be reasonably estimated. We have not reduced these accruals for possible insurance recoveries. In the future, we may be involved in additional environmental assessments, cleanups and proceedings. See Note 9-Asset Retirement Obligations and Accrued Environmental Costs, for a summary of our accrued environmental liabilities.
Legal Proceedings
We are subject to various lawsuits and claims including but not limited to matters involving oil and gas royalty and severance tax payments, gas measurement and valuation methods, contract disputes, environmental damages, personal injury, and property damage. Our primary exposures for such matters relate to alleged royalty and tax underpayments on certain federal, state and privately owned properties and claims of alleged environmental contamination from historic operations. We will continue to defend ourselves vigorously in these matters.
Our legal organization applies its knowledge, experience and professional judgment to the specific characteristics of our cases, employing a litigation management process to manage and monitor the legal proceedings against us. Our process facilitates the early evaluation and quantification of potential exposures in individual cases. This process also enables us to track those cases that have been scheduled for trial and/or mediation. Based on professional judgment and experience in using these litigation management tools and available information about current developments in all our cases, our legal organization regularly assesses the adequacy of current accruals and determines if adjustment of existing accruals, or establishment of new accruals, is required.
Other Contingencies
We have contingent liabilities resulting from throughput agreements with pipeline and processing companies not associated with financing arrangements. Under these agreements, we may be required to provide any such company with additional funds through advances and penalties for fees related to throughput capacity not utilized. In addition, at December 31, 2017, we had performance obligations secured by letters of credit of $338 million (issued as direct bank letters of credit) related to various purchase commitments for materials, supplies, commercial activities and services incident to the ordinary conduct of business.
In 2007, we announced we had been unable to reach agreement with respect to our migration to an empresa mixta structure mandated by the Venezuelan government's Nationalization Decree. As a result, Venezuela's national oil company, Petróleos de Venezuela S.A. (PDVSA), or its affiliates, directly assumed control over ConocoPhillips' interests in the Petrozuata and Hamaca heavy oil ventures and the offshore Corocoro development project. In response to this expropriation, we filed a request for international arbitration on November 2, 2007, with the World Bank's International Centre for Settlement of Investment Disputes (ICSID). An arbitration hearing was held before an ICSID tribunal during the summer of 2010. On September 3, 2013, an ICSID arbitration tribunal held that Venezuela unlawfully expropriated ConocoPhillips' significant oil investments in June 2007. On January 17, 2017, the Tribunal reconfirmed the decision that the expropriation was unlawful. A separate arbitration phase is currently proceeding to determine the damages owed to ConocoPhillips for Venezuela's actions. Separate arbitrations for contractual compensation against PDVSA are also pending before an International Chamber of Commerce (ICC) arbitration tribunal. In addition, ConocoPhillips brought fraudulent transfer actions in the U.S. District Court of Delaware, alleging that PDVSA has taken actions to improperly expatriate assets from the United States to Venezuela in an effort to avoid judgment creditors.
105
In 2008, Burlington Resources, Inc., a wholly owned subsidiary of ConocoPhillips, initiated arbitration before ICSID against The Republic of Ecuador challenging a windfall profits tax and subsequent expropriation of Blocks 7 and 21. On April 24, 2012, Ecuador filed environmental and infrastructure counterclaims against Burlington relating to alleged impacts to Blocks 7 and 21. Ecuador also filed the environmental and infrastructure counterclaims relating to Blocks 7 and 21 in a separate, parallel ICSID arbitration brought by Perenco Ecuador Limited, Burlington's co-venturer and consortium operator. Perenco and Burlington each have joint liability for the counterclaims under their joint operating agreements. On December 14, 2012, the ICSID tribunal issued a decision in favor of Burlington, finding that Ecuador's seizure of Blocks 7 and 21 was an unlawful expropriation in violation of the Ecuador-U.S. Bilateral Investment Treaty. In February 2017, the ICSID tribunal unanimously awarded Burlington $380 million for Ecuador's unlawful expropriation and breach of the U.S.-Ecuador bilateral investment treaty. The tribunal also issued a separate decision finding Ecuador to be entitled to $42 million for environmental and infrastructure impacts to Blocks 7 and 21. In December 2017, Burlington and Ecuador entered into a settlement agreement by which Ecuador agreed to pay Burlington $337 million in two installments. The first installment of $75 million was timely paid on December 1, 2017. The second installment of $262 million is to be paid by April 2018. The settlement includes an offset for the counterclaims decision, of which Burlington is entitled to a $24 million contribution from Perenco pursuant to the joint operating agreement. The ICSID arbitration between Perenco and Ecuador remains pending.
In December 2016, ConocoPhillips Angola filed a notice of arbitration against Sonangol E.P. under the Block 36 Production Sharing Contract relating to disputes arising thereunder. The arbitration is being conducted under the United Nations Commission on International Trade Laws (UNCITRAL) rules using a three-person tribunal.
In June 2017, FAR Ltd. initiated arbitration before the ICC against ConocoPhillips Senegal B.V. in connection with the sale of ConocoPhillips Senegal B.V. to Woodside Energy Holdings (Senegal) Limited in 2016. The arbitral tribunal is in the process of being constituted.
In 2017 and early 2018, cities and/or counties in California and New York have filed lawsuits against oil and gas companies, including ConocoPhillips, seeking compensatory damages and equitable relief to abate alleged climate change impacts. ConocoPhillips will be vigorously defending against these lawsuits.
Long-Term Throughput Agreements and Take-or-Pay Agreements
We have certain throughput agreements and take-or-pay agreements in support of financing arrangements. The agreements typically provide for natural gas or crude oil transportation to be used in the ordinary course of the company's business. The aggregate amounts of estimated payments under these various agreements are: 2018-$21 million; 2019-$7 million; 2020-$7 million; 2021-$7 million; 2022-$7 million; and 2023 and after-$74 million. Total payments under the agreements were $43 million in 2017, $42 million in 2016 and $27 million in 2015.
Note 13-Derivative and Financial Instruments
We use futures, forwards, swaps and options in various markets to meet our customer needs and capture market opportunities. Our commodity business primarily consists of natural gas, crude oil, bitumen, LNG and natural gas liquids.
Our derivative instruments are held at fair value on our consolidated balance sheet. Where these balances have the right of setoff, they are presented on a net basis. Related cash flows are recorded as operating activities on our consolidated statement of cash flows. On our consolidated income statement, realized and unrealized gains and losses are recognized either on a gross basis if directly related to our physical business or a net basis if held for trading. Gains and losses related to contracts that meet and are designated with the normal purchase normal sale exception are recognized upon settlement. We generally apply this exception to eligible crude contracts. We do not use hedge accounting for our commodity derivatives.
106
The following table presents the gross fair values of our commodity derivatives, excluding collateral, and the line items where they appear on our consolidated balance sheet:
| Millions of Dollars | ||||||||
|
| |||||||
| 2017 | 2016 | |||||||
|
| |||||||
Assets | ||||||||
Prepaid expenses and other current assets | $ | 275 | 268 | |||||
Other assets | 36 | 44 | ||||||
Liabilities | ||||||||
Other accruals | 282 | 300 | ||||||
Other liabilities and deferred credits | 28 | 34 | ||||||
| ||||||||
The gains (losses) from commodity derivatives incurred, and the line items where they appear on our consolidated income statement were:
| Millions of Dollars | ||||||||||||
|
| |||||||||||
| 2017 | 2016 | 2015 | ||||||||||
|
| |||||||||||
Sales and other operating revenues | $ | 77 | (198) | 231 | ||||||||
Other income | - | (1) | 2 | |||||||||
Purchased commodities | (61) | 161 | (201) | |||||||||
| ||||||||||||
The table below summarizes our material net exposures resulting from outstanding commodity derivative contracts:
Open Position Long/(Short) | ||||||||
|
| |||||||
| 2017 | 2016 | |||||||
|
| |||||||
Commodity | ||||||||
Natural gas and power (billions of cubic feet equivalent) | ||||||||
Fixed price | (29) | (31) | ||||||
Basis | 12 | 2 | ||||||
| ||||||||
Foreign Currency Exchange Derivatives
We have foreign currency exchange rate risk resulting from international operations. Our foreign currency exchange derivative activity primarily relates to managing our cash-related foreign currency exchange rate exposures, such as firm commitments for capital programs or local currency tax payments, dividends and cash returns from net investments in foreign affiliates, and investments in available-for-sale securities. We do not elect hedge accounting on our foreign currency exchange derivatives.
107
The following table presents the gross fair values of our foreign currency exchange derivatives, excluding collateral, and the line items where they appear on our consolidated balance sheet:
| Millions of Dollars | ||||||||
|
| |||||||
| 2017 | 2016 | |||||||
|
| |||||||
Assets | ||||||||
Prepaid expenses and other current assets | $ | 1 | 1 | |||||
Other assets | 6 | - | ||||||
Liabilities | ||||||||
Other accruals | - | 168 | ||||||
Other liabilities and deferred credits | 15 | - | ||||||
| ||||||||
In December 2017, we entered into foreign exchange zero cost collars buying the right to sell $1.25 billion CAD at $0.707 CAD and selling the right to buy $1.25 billion CAD at $0.842 CAD against the U.S. dollar.
The (gains) losses from foreign currency exchange derivatives incurred and the line item where they appear on our consolidated income statement were:
| Millions of Dollars | ||||||||||||
|
| |||||||||||
| 2017 | 2016 | 2015 | ||||||||||
|
| |||||||||||
Foreign currency transaction (gains) losses | $ | 13 | 247 | (33) | ||||||||
| ||||||||||||
We had the following net notional position of outstanding foreign currency exchange derivatives:
In Millions Notional Currency | ||||||||
|
| |||||||
| 2017 | 2016 | |||||||
|
| |||||||
Foreign Currency Exchange Derivatives | ||||||||
Sell U.S. dollar, buy other currencies (1) | USD - | 13 | ||||||
Buy U.S. dollar, sell other currencies (2) | USD - | 25 | ||||||
Buy British pound, sell other currencies (3) | GBP - | 1,069 | ||||||
Sell British pound, buy other currencies (4) | GBP 1 | 51 | ||||||
Sell Canadian dollar, buy U.S. dollar | CAD 1,225 | - | ||||||
| ||||||||
(1)Primarily Canadian dollar.
(2)Primarily British pound.
(3)Primarily Canadian dollar.
(4)Primarily euro and Norwegian krone.
Financial Instruments
We invest excess cash in financial instruments with maturities based on our cash forecasts for the various currency pools we manage. The maturities of these investments may from time to time extend beyond 90 days. The types of financial instruments that we currently invest include:
| • | Time deposits: Interest bearing deposits placed with approved financial institutions. |
| • | Commercial paper: Unsecured promissory notes issued by a corporation, commercial bank or government agency purchased at a discount to mature at par. |
These financial instruments appear in the "Cash and cash equivalents" line of our consolidated balance sheet if the maturities at the time we made the investments were 90 days or less; otherwise, these financial instruments are included in the "Short-term investments" line on our consolidated balance sheet.
108
| Millions of Dollars | ||||||||||||||||
|
| |||||||||||||||
| Carrying Amount | ||||||||||||||||
|
| |||||||||||||||
| Cash and Cash Equivalents | Short-Term Investments | |||||||||||||||
|
|
|
| |||||||||||||
| 2017 | 2016 | 2017 | 2016 | |||||||||||||
|
|
|
| |||||||||||||
Cash | $ | 948 | 623 | - | - | |||||||||||
Time deposits | ||||||||||||||||
Remaining maturities from 1 to 90 days | 5,004 | 2,987 | 821 | 39 | ||||||||||||
Remaining maturities from 91 to 180 days | - | - | - | 11 | ||||||||||||
Commercial paper | ||||||||||||||||
Remaining maturities from 1 to 90 days | 373 | - | 978 | - | ||||||||||||
Remaining maturities from 91 to 180 days | - | - | 74 | - | ||||||||||||
| ||||||||||||||||
| $ | 6,325 | 3,610 | 1,873 | 50 | ||||||||||||
| ||||||||||||||||
Credit Risk
Financial instruments potentially exposed to concentrations of credit risk consist primarily of cash equivalents, short-term investments, over-the-counter (OTC) derivative contracts and trade receivables. Our cash equivalents and short-term investments are placed in high-quality commercial paper, government money market funds, government debt securities and time deposits with major international banks and financial institutions.
The credit risk from our OTC derivative contracts, such as forwards, swaps and options, derives from the counterparty to the transaction. Individual counterparty exposure is managed within predetermined credit limits and includes the use of cash-call margins when appropriate, thereby reducing the risk of significant nonperformance. We also use futures, swaps and option contracts that have a negligible credit risk because these trades are cleared with an exchange clearinghouse and subject to mandatory margin requirements until settled; however, we are exposed to the credit risk of those exchange brokers for receivables arising from daily margin cash calls, as well as for cash deposited to meet initial margin requirements.
Our trade receivables result primarily from our petroleum operations and reflect a broad national and international customer base, which limits our exposure to concentrations of credit risk. The majority of these receivables have payment terms of 30 days or less, and we continually monitor this exposure and the creditworthiness of the counterparties. We do not generally require collateral to limit the exposure to loss; however, we will sometimes use letters of credit, prepayments and master netting arrangements to mitigate credit risk with counterparties that both buy from and sell to us, as these agreements permit the amounts owed by us or owed to others to be offset against amounts due to us.
Certain of our derivative instruments contain provisions that require us to post collateral if the derivative exposure exceeds a threshold amount. We have contracts with fixed threshold amounts and other contracts with variable threshold amounts that are contingent on our credit rating. The variable threshold amounts typically decline for lower credit ratings, while both the variable and fixed threshold amounts typically revert to zero if we fall below investment grade. Cash is the primary collateral in all contracts; however, many also permit us to post letters of credit as collateral, such as transactions administered through the New York Mercantile Exchange.
The aggregate fair value of all derivative instruments with such credit risk-related contingent features that were in a liability position on December 31, 2017 and December 31, 2016, was $55 million and $42 million, respectively. For these instruments, no collateral was posted as of December 31, 2017, or December 31, 2016. If our credit rating had been downgraded below investment grade on December 31, 2017, we would be required to post $55 million of additional collateral, either with cash or letters of credit.
109
Note 14-Fair Value Measurement
We carry a portion of our assets and liabilities at fair value that are measured at a reporting date using an exit price (i.e., the price that would be received to sell an asset or paid to transfer a liability) and disclosed according to the quality of valuation inputs under the following hierarchy:
| • | Level 1: Quoted prices (unadjusted) in an active market for identical assets or liabilities. |
| • | Level 2: Inputs other than quoted prices that are directly or indirectly observable. |
| • | Level 3: Unobservable inputs that are significant to the fair value of assets or liabilities. |
The classification of an asset or liability is based on the lowest level of input significant to its fair value. Those that are initially classified as Level 3 are subsequently reported as Level 2 when the fair value derived from unobservable inputs is inconsequential to the overall fair value, or if corroborated market data becomes available. Assets and liabilities initially reported as Level 2 are subsequently reported as Level 3 if corroborated market data is no longer available. Transfers occur at the end of the reporting period. At the end of the fourth quarter of 2017, our $1,899 million investment in Cenovus Energy was transferred from Level 2 to Level 1 due to the lapsing of trading restrictions. There were no other material transfers in or out of Level 1 during 2017 or 2016.
Recurring Fair Value Measurement
Financial assets and liabilities reported at fair value on a recurring basis primarily include commodity derivatives. Level 1 derivative assets and liabilities primarily represent exchange-traded futures and options that are valued using unadjusted prices available from the underlying exchange. This also includes our investment in common shares of Cenovus Energy, which is valued using quotes for shares on the New York Stock Exchange. Level 2 derivative assets and liabilities primarily represent OTC swaps, options and forward purchase and sale contracts that are valued using adjusted exchange prices, prices provided by brokers or pricing service companies that are all corroborated by market data. Level 3 derivative assets and liabilities consist of OTC swaps, options and forward purchase and sale contracts where a significant portion of fair value is calculated from underlying market data that is not readily available. The derived value uses industry standard methodologies that may consider the historical relationships among various commodities, modeled market prices, time value, volatility factors and other relevant economic measures. The use of these inputs results in management's best estimate of fair value. Level 3 activity was not material for all periods presented.
The following table summarizes the fair value hierarchy for gross financial assets and liabilities (i.e., unadjusted where the right of setoff exists for commodity derivatives accounted for at fair value on a recurring basis):
| Millions of Dollars | ||||||||||||||||||||||||||||||||
| December 31, 2017 | December 31, 2016 | |||||||||||||||||||||||||||||||
| Level 1 | Level 2 | Level 3 | Total | Level 1 | Level 2 | Level 3 | Total | |||||||||||||||||||||||||
|
|
|
| |||||||||||||||||||||||||||||
Assets | ||||||||||||||||||||||||||||||||
Investment in Cenovus Energy | $ | 1,899 | - | - | 1,899 | - | - | - | - | |||||||||||||||||||||||
Commodity derivatives | 175 | 106 | 30 | 311 | 194 | 96 | 22 | 312 | ||||||||||||||||||||||||
| ||||||||||||||||||||||||||||||||
Total assets | $ | 2,074 | 106 | 30 | 2,210 | 194 | 96 | 22 | 312 | |||||||||||||||||||||||
| ||||||||||||||||||||||||||||||||
Liabilities | ||||||||||||||||||||||||||||||||
Commodity derivatives | $ | 158 | 111 | 41 | 310 | 207 | 105 | 22 | 334 | |||||||||||||||||||||||
| ||||||||||||||||||||||||||||||||
Total liabilities | $ | 158 | 111 | 41 | 310 | 207 | 105 | 22 | 334 | |||||||||||||||||||||||
| ||||||||||||||||||||||||||||||||
110
The following table summarizes those commodity derivative balances subject to the right of setoff as presented on our consolidated balance sheet. We have elected to offset the recognized fair value amounts for multiple derivative instruments executed with the same counterparty in our financial statements when a legal right of offset exists.
| Millions of Dollars | ||||||||||||||||||||||||
| Gross Amounts Recognized | Gross Amounts Offset | Net Amounts Presented | Cash Collateral | Gross Amounts without Right of Setoff | Net Amounts | |||||||||||||||||||
|
| |||||||||||||||||||||||
December 31, 2017 | ||||||||||||||||||||||||
Assets | $ | 311 | 186 | 125 | - | 4 | 121 | |||||||||||||||||
Liabilities | 310 | 186 | 124 | 7 | 5 | 112 | ||||||||||||||||||
| ||||||||||||||||||||||||
December 31, 2016 | ||||||||||||||||||||||||
Assets | $ | 312 | 221 | 91 | - | 5 | 86 | |||||||||||||||||
Liabilities | 334 | 221 | 113 | 12 | 12 | 89 | ||||||||||||||||||
| ||||||||||||||||||||||||
At December 31, 2017 and December 31, 2016, we did not present any amounts gross on our consolidated balance sheet where we had the right of setoff.
Non-Recurring Fair Value Measurement
The following table summarizes the fair value hierarchy by major category and date of remeasurement for assets accounted for at fair value on a non-recurring basis:
| Millions of Dollars | ||||||||||||||||
|
| |||||||||||||||
| Fair Value Measurements Using | ||||||||||||||||
|
| |||||||||||||||
| Fair Value | Level 1 Inputs | Level 3 Inputs | Before-Tax Loss | |||||||||||||
|
|
|
|
|
|
|
| |||||||||
Year ended December 31, 2017 | ||||||||||||||||
Net PP&E (held for use) | ||||||||||||||||
December 31, 2017 | $ | 75 | - | 75 | 154 | |||||||||||
Net PP&E (held for sale) | ||||||||||||||||
June 30, 2017 | 2,830 | 2,830 | - | 3,882 | ||||||||||||
December 31, 2017 | 113 | 113 | - | 78 | ||||||||||||
Cost and equity method investments | ||||||||||||||||
June 30, 2017 | 7,656 | - | 7,656 | 2,384 | ||||||||||||
| ||||||||||||||||
Year ended December 31, 2016 | ||||||||||||||||
Net PP&E (held for use) | ||||||||||||||||
March 31, 2016 | $ | 217 | - | 217 | 129 | |||||||||||
June 30, 2016 | 23 | - | 23 | 53 | ||||||||||||
December 31, 2016 | 13 | - | 13 | 29 | ||||||||||||
Net PP&E (held for sale) | ||||||||||||||||
September 30, 2016 | 217 | 217 | - | 99 | ||||||||||||
Cost and equity method investments | ||||||||||||||||
December 31, 2016 | 90 | 4 | 86 | 40 | ||||||||||||
| ||||||||||||||||
Net PP&E (held for use)
Net PP&E held for use is comprised of various producing properties impaired to their individual fair values less costs to sell. The fair values were determined by internal discounted cash flow models using estimates of future production, prices from futures exchanges and pricing service companies, costs, and a discount rate believed to be consistent with those used by principal market participants.
111
Net PP&E (held for sale)
Net PP&E held for sale was written down to fair value, less costs to sell. The fair value of each asset was determined by its negotiated selling price.
Equity Method Investments
Certain cost and equity method investments were determined to have fair values below their carrying amounts, and the impairments were considered to be other than temporary under the guidance of FASB ASC Topic 323. During 2017, this included our investment in APLNG, which was written down to its fair value of $7,656 million, resulting in a before-tax-charge of $2,384 million. For additional information on APLNG, see Note 5-Investments, Loans and Long-Term Receivables. During 2016, an investment using Level 1 inputs was written down to fair value, less costs to sell, determined by its negotiated selling price. Investments using Level 3 inputs had fair values determined primarily by internal discounted cash flow models using estimates of future production, prices from futures exchanges and pricing service companies, costs, and a discount factor believed to be consistent with those used by principal market participants.
Reported Fair Values of Financial Instruments
We used the following methods and assumptions to estimate the fair value of financial instruments:
| • | Cash and cash equivalents and short-term investments: The carrying amount reported on the balance sheet approximates fair value. |
| • | Accounts and notes receivable (including long-term and related parties): The carrying amount reported on the balance sheet approximates fair value. The valuation technique and methods used to estimate the fair value of the current portion of fixed-rate related party loans is consistent with Loans and advances-related parties. |
| • | Investment in Cenovus Energy shares: See Note 6-Investment in Cenovus Energy for a discussion of the carrying value and fair value of our investment in Cenovus Energy shares. |
| • | Loans and advances-related parties: The carrying amount of floating-rate loans approximates fair value. The fair value of fixed-rate loan activity is measured using market observable data and is categorized as Level 2 in the fair value hierarchy. See Note 5-Investments, Loans and Long-Term Receivables, for additional information. |
| • | Accounts payable (including related parties) and floating-rate debt: The carrying amount of accounts payable and floating-rate debt reported on the balance sheet approximates fair value. |
| • | Fixed-rate debt: The estimated fair value of fixed-rate debt is measured using prices available from a pricing service that is corroborated by market data; therefore, these liabilities are categorized as Level 2 in the fair value hierarchy. |
The following table summarizes the net fair value of financial instruments (i.e., adjusted where the right of setoff exists for commodity derivatives):
| Millions of Dollars | ||||||||||||||||
| Carrying Amount | Fair Value | |||||||||||||||
| 2017 | 2016 | 2017 | 2016 | |||||||||||||
|
|
|
| |||||||||||||
Financial assets | ||||||||||||||||
Investment in Cenovus Energy | $ | 1,899 | - | 1,899 | - | |||||||||||
Commodity derivatives | 125 | 91 | 125 | 91 | ||||||||||||
Total loans and advances-related parties | 586 | 701 | 586 | 701 | ||||||||||||
Financial liabilities | ||||||||||||||||
Total debt, excluding capital leases | 18,929 | 26,423 | 22,435 | 29,307 | ||||||||||||
Commodity derivatives | 117 | 101 | 117 | 101 | ||||||||||||
| ||||||||||||||||
112
Commodity derivatives
At December 31, 2017, commodity derivative assets and liabilities appear net with no obligations to return cash collateral and $7 million of rights to reclaim cash collateral, respectively. At December 31, 2016, commodity derivative assets and liabilities appear net with no obligations to return cash collateral and $12 million of rights to reclaim cash collateral, respectively.
Note 15-Equity
Common Stock
The changes in our shares of common stock, as categorized in the equity section of the balance sheet, were:
| Shares | ||||||||||||
| 2017 | 2016 | 2015 | ||||||||||
|
| |||||||||||
Issued | ||||||||||||
Beginning of year | 1,782,079,107 | 1,778,226,388 | 1,773,583,368 | |||||||||
Distributed under benefit plans | 3,340,068 | 3,852,719 | 4,643,020 | |||||||||
| ||||||||||||
End of year | 1,785,419,175 | 1,782,079,107 | 1,778,226,388 | |||||||||
| ||||||||||||
Held in Treasury | ||||||||||||
Beginning of year | 544,809,771 | 542,230,673 | 542,230,673 | |||||||||
Repurchase of common stock | 63,502,263 | 2,579,098 | - | |||||||||
| ||||||||||||
End of year | 608,312,034 | 544,809,771 | 542,230,673 | |||||||||
| ||||||||||||
Preferred Stock
We have authorized 500 million shares of preferred stock, par value $.01 per share, none of which was issued or outstanding at December 31, 2017 or 2016.
Noncontrolling Interests
At December 31, 2017 and 2016, we had $194 million and $252 million outstanding, respectively, of equity in less-than-wholly owned consolidated subsidiaries held by noncontrolling interest owners. For both periods, the amounts were related to the Darwin LNG and Bayu-Darwin Pipeline operating joint ventures we control.
Repurchase of Common Stock
On November 10, 2016, we announced plans to purchase up to $3 billion of our common stock through 2019. On March 29, 2017, we announced plans to double our share repurchase program to $6 billion of common stock through 2019, with $3 billion allocated and purchased in 2017, and the remainder allocated evenly to 2018 and 2019. On February 1, 2018, we announced the acceleration of our previously stated 2018 share repurchases from $1.5 billion to $2.0 billion, with the remaining balance to be repurchased in 2019. Repurchase of shares began in November 2016, and totaled 66,081,361 shares at a cost of $3,126 million, through December 31, 2017.
113
Note 16-Non-Mineral Leases
The company primarily leases drilling equipment and office buildings, as well as ocean transport vessels, tugboats, barges, corporate aircraft, computers and other facilities and equipment. Certain leases include escalation clauses for adjusting rental payments to reflect changes in price indices, as well as renewal options and/or options to purchase the leased property for the fair market value at the end of the lease term. There are no significant restrictions imposed on us by the leasing agreements with regard to dividends, asset dispositions or borrowing ability. For additional information on leased assets under capital leases, see Note 10-Debt.
At December 31, 2017, future minimum rental payments due under noncancelable leases were:
| Millions of Dollars | ||||
2018 | $ | 278 | ||
2019 | 214 | |||
2020 | 414 | |||
2021 | 126 | |||
2022 | 307 | |||
Remaining years | 209 | |||
| ||||
Total | 1,548 | |||
Less: income from subleases | (11) | |||
| ||||
Net minimum operating lease payments | $ | 1,537 | ||
| ||||
Operating lease rental expense for the years ended December 31 was:
| Millions of Dollars | ||||||||||||
|
| |||||||||||
| 2017 | 2016 | 2015 | ||||||||||
|
| |||||||||||
Total rentals | $ | 264 | 537 | 432 | ||||||||
Less: sublease rentals | (20) | (10) | * | (9) | ||||||||
| ||||||||||||
| $ | 244 | 527 | 423 | |||||||||
| ||||||||||||
*Amount updated to reflect additional sublease income in 2016.
114
Note 17-Employee Benefit Plans
Pension and Postretirement Plans
An analysis of the projected benefit obligations for our pension plans and accumulated benefit obligations for our postretirement health and life insurance plans follows:
| Millions of Dollars | ||||||||||||||||||||||||
| Pension Benefits | Other Benefits | |||||||||||||||||||||||
| 2017 | 2016 | 2017 | 2016 | |||||||||||||||||||||
|
|
|
|
|
| |||||||||||||||||||
| U.S. | Int'l. | U.S. | Int'l. | |||||||||||||||||||||
|
|
|
| |||||||||||||||||||||
Change in Benefit Obligation | ||||||||||||||||||||||||
Benefit obligation at January 1 | $ | 3,416 | 3,445 | 3,772 | 3,321 | 286 | 352 | |||||||||||||||||
Service cost | 89 | 77 | 108 | 76 | 2 | 2 | ||||||||||||||||||
Interest cost | 118 | 103 | 133 | 120 | 9 | 13 | ||||||||||||||||||
Plan participant contributions | - | 2 | - | 3 | 23 | 24 | ||||||||||||||||||
Plan amendments | - | - | - | - | - | (27) | ||||||||||||||||||
Actuarial (gain) loss | 244 | 52 | 247 | 466 | 12 | (14) | ||||||||||||||||||
Benefits paid | (631) | (117) | (872) | (148) | (68) | (68) | ||||||||||||||||||
Curtailment | - | - | 14 | 10 | - | 3 | ||||||||||||||||||
Settlement | - | - | - | (46) | - | - | ||||||||||||||||||
Recognition of termination benefits | - | - | 14 | 1 | - | - | ||||||||||||||||||
Foreign currency exchange rate change | - | 283 | - | (358) | 1 | 1 | ||||||||||||||||||
| ||||||||||||||||||||||||
Benefit obligation at December 31* | $ | 3,236 | 3,845 | 3,416 | 3,445 | 265 | 286 | |||||||||||||||||
| ||||||||||||||||||||||||
*Accumulated benefit obligation portion of above at December 31: | $ | 3,076 | 3,404 | 3,246 | 3,067 | |||||||||||||||||||
Change in Fair Value of Plan Assets | ||||||||||||||||||||||||
Fair value of plan assets at January 1 | $ | 2,081 | 3,068 | 2,606 | 3,063 | - | - | |||||||||||||||||
Actual return on plan assets | 336 | 313 | 133 | 397 | - | - | ||||||||||||||||||
Company contributions | 755 | 114 | 214 | 125 | 45 | 44 | ||||||||||||||||||
Plan participant contributions | - | 2 | - | 3 | 23 | 24 | ||||||||||||||||||
Benefits paid | (631) | (117) | (872) | (148) | (68) | (68) | ||||||||||||||||||
Foreign currency exchange rate change | - | 267 | - | (372) | - | - | ||||||||||||||||||
| ||||||||||||||||||||||||
Fair value of plan assets at December 31 | $ | 2,541 | 3,647 | 2,081 | 3,068 | - | - | |||||||||||||||||
| ||||||||||||||||||||||||
Funded Status | $ | (695) | (198) | (1,335) | (377) | (265) | (286) | |||||||||||||||||
| ||||||||||||||||||||||||
115
| Millions of Dollars | ||||||||||||||||||||||||
| Pension Benefits | Other Benefits | |||||||||||||||||||||||
| 2017 | 2016 | 2017 | 2016 | |||||||||||||||||||||
|
|
|
|
|
| |||||||||||||||||||
| U.S. | Int'l. | U.S. | Int'l. | |||||||||||||||||||||
|
|
|
| |||||||||||||||||||||
Amounts Recognized in the Consolidated Balance Sheet at December 31 | ||||||||||||||||||||||||
Noncurrent assets | $ | - | 205 | - | 164 | - | - | |||||||||||||||||
Current liabilities | (38) | (4) | (101) | (7) | (45) | (44) | ||||||||||||||||||
Noncurrent liabilities | (657) | (399) | (1,234) | (534) | (220) | (242) | ||||||||||||||||||
| ||||||||||||||||||||||||
Total recognized | $ | (695) | (198) | (1,335) | (377) | (265) | (286) | |||||||||||||||||
| ||||||||||||||||||||||||
Weighted-Average Assumptions Used to Determine Benefit Obligations at December 31 | ||||||||||||||||||||||||
Discount rate | 3.55% | 2.80 | 3.95 | 3.00 | 3.30 | 3.60 | ||||||||||||||||||
Rate of compensation increase | 4.00 | 3.75 | 4.00 | 3.85 | - | - | ||||||||||||||||||
| ||||||||||||||||||||||||
Weighted-Average Assumptions Used to Determine Net Periodic Benefit Cost for Years Ended December 31 | ||||||||||||||||||||||||
Discount rate | 3.80% | 3.00 | 3.90 | 3.95 | 3.60 | 3.75 | ||||||||||||||||||
Expected return on plan assets | 6.55 | 5.05 | 7.00 | 5.45 | - | - | ||||||||||||||||||
Rate of compensation increase | 4.00 | 3.85 | 4.00 | 4.05 | - | - | ||||||||||||||||||
| ||||||||||||||||||||||||
For both U.S. and international pensions, the overall expected long-term rate of return is developed from the expected future return of each asset class, weighted by the expected allocation of pension assets to that asset class. We rely on a variety of independent market forecasts in developing the expected rate of return for each class of assets.
Included in accumulated other comprehensive income (loss) at December 31 were the following before-tax amounts that had not been recognized in net periodic benefit cost:
| Millions of Dollars | ||||||||||||||||||||||||
| Pension Benefits | Other Benefits | |||||||||||||||||||||||
| 2017 | 2016 | 2017 | 2016 | |||||||||||||||||||||
|
|
|
|
|
| |||||||||||||||||||
| U.S. | Int'l. | U.S. | Int'l. | |||||||||||||||||||||
|
|
|
| |||||||||||||||||||||
Unrecognized net actuarial (gain) loss | $ | 588 | 358 | 748 | 479 | (12) | (27) | |||||||||||||||||
Unrecognized prior service cost (credit) | - | (16) | 4 | (20) | (249) | (285) | ||||||||||||||||||
| ||||||||||||||||||||||||
116
| Millions of Dollars | ||||||||||||||||||||||||
| Pension Benefits | Other Benefits | |||||||||||||||||||||||
| 2017 | 2016 | 2017 | 2016 | |||||||||||||||||||||
|
|
|
|
|
| |||||||||||||||||||
| U.S. | Int'l. | U.S. | Int'l. | |||||||||||||||||||||
|
|
|
| |||||||||||||||||||||
Sources of Change in Other Comprehensive Income (Loss) | ||||||||||||||||||||||||
Net gain (loss) arising during the period | $ | (40) | 71 | (263) | (232) | (12) | 14 | |||||||||||||||||
Amortization of (gain) loss included in income (loss)* | 200 | 50 | 288 | 26 | (3) | (5) | ||||||||||||||||||
| ||||||||||||||||||||||||
Net change during the period | $ | 160 | 121 | 25 | (206) | (15) | 9 | |||||||||||||||||
| ||||||||||||||||||||||||
Prior service credit (cost) arising during the period | $ | - | 2 | - | (4) | - | 27 | |||||||||||||||||
Amortization of prior service cost (credit) included in income (loss) | 4 | (6) | 5 | (6) | (36) | (34) | ||||||||||||||||||
| ||||||||||||||||||||||||
Net change during the period | $ | 4 | (4) | 5 | (10) | (36) | (7) | |||||||||||||||||
| ||||||||||||||||||||||||
*Includes settlement losses recognized in 2017 and 2016.
During the year ended December 31, 2016, there was an amendment to the U.S. other postretirement benefit plan. The benefit obligation decreased by $27 million for changes in the plan made to post-65 retiree medical benefits related to updated cost sharing assumption changes for retirees. The $27 million decrease in the benefit obligation resulted in a corresponding increase in other comprehensive income.
Included in accumulated other comprehensive loss at December 31, 2017, were the following before-tax amounts that are expected to be amortized into net periodic benefit cost during 2018:
| Millions of Dollars | ||||||||||||
| Pension Benefits | Other Benefits | |||||||||||
| U.S. | Int'l. | |||||||||||
|
| |||||||||||
Unrecognized net actuarial (gain) loss | $ | 59 | 36 | (1) | ||||||||
Unrecognized prior service credit | - | (5) | (34) | |||||||||
For our tax-qualified pension plans with projected benefit obligations in excess of plan assets, the projected benefit obligation, the accumulated benefit obligation, and the fair value of plan assets were $5,634 million, $5,226 million, and $5,113 million, respectively, at December 31, 2017, and $5,498 million, $5,145 million, and $4,208 million, respectively, at December 31, 2016.
For our unfunded nonqualified key employee supplemental pension plans, the projected benefit obligation and the accumulated benefit obligation were $578 million and $503 million, respectively, at December 31, 2017, and were $586 million and $496 million, respectively, at December 31, 2016.
117
The components of net periodic benefit cost of all defined benefit plans are presented in the following table:
| Millions of Dollars | ||||||||||||||||||||||||||||||||||||
| Pension Benefits | Other Benefits | |||||||||||||||||||||||||||||||||||
| 2017 | 2016 | 2015 | 2017 | 2016 | 2015 | |||||||||||||||||||||||||||||||
|
|
|
|
|
|
|
| |||||||||||||||||||||||||||||
| U.S. | Int'l. | U.S. | Int'l. | U.S. | Int'l. | |||||||||||||||||||||||||||||||
|
|
|
|
|
| |||||||||||||||||||||||||||||||
Components of Net Periodic Benefit Cost | ||||||||||||||||||||||||||||||||||||
Service cost | $ | 89 | 77 | 108 | 76 | 138 | 124 | 2 | 2 | 4 | ||||||||||||||||||||||||||
Interest cost | 118 | 103 | 133 | 120 | 161 | 135 | 9 | 13 | 22 | |||||||||||||||||||||||||||
Expected return on plan assets | (132) | (158) | (149) | (147) | (201) | (164) | - | - | - | |||||||||||||||||||||||||||
Amortization of prior service cost (credit) | 4 | (6) | 5 | (6) | 6 | (7) | (36) | (34) | (17) | |||||||||||||||||||||||||||
Recognized net actuarial loss (gain) | 69 | 50 | 86 | 26 | 115 | 82 | (3) | (2) | 2 | |||||||||||||||||||||||||||
Settlements | 131 | - | 202 | - | 197 | 7 | - | - | - | |||||||||||||||||||||||||||
Curtailment (gain) loss | - | - | 14 | - | 35 | (4) | - | 1 | 2 | |||||||||||||||||||||||||||
| ||||||||||||||||||||||||||||||||||||
Net periodic benefit cost | $ | 279 | 66 | 399 | 69 | 451 | 173 | (28) | (20) | 13 | ||||||||||||||||||||||||||
| ||||||||||||||||||||||||||||||||||||
We recognized pension settlement losses of $131 million in 2017, $202 million in 2016 and $204 million in 2015 as lump-sum benefit payments from certain U.S. and international pension plans exceeded the sum of service and interest costs for those plans and led to recognition of settlement losses.
As part of the 2016 and 2015 restructuring programs, we concluded that actions taken during those years resulted in a significant reduction of future services of active employees primarily in the U.S. qualified pension plan and a U.S. nonqualified supplemental retirement plan. As a result, we recognized an increase in the benefit obligation and a proportionate share of prior service cost from other comprehensive income (loss) as curtailment losses of $15 million and $33 million during the years ended December 31, 2016 and 2015, respectively.
Also as part of the 2016 and 2015 restructuring programs in the U.S. and Europe, we recognized expense for special termination benefits of $15 million during the year ended December 31, 2016, consisting of $14 million in the U.S. and $1 million in Europe, and $124 million during the year ended December 31, 2015, consisting of $46 million in the U.S. and $78 million in Europe. Approximately 62 percent of the 2015 Europe amount was recovered from joint venture partners.
In determining net pension and other postretirement benefit costs, we amortize prior service costs on a straight-line basis over the average remaining service period of employees expected to receive benefits under the plan. For net actuarial gains and losses, we amortize 10 percent of the unamortized balance each year.
We have multiple nonpension postretirement benefit plans for health and life insurance. The health care plans are contributory and subject to various cost sharing features, with participant and company contributions adjusted annually; the life insurance plans are noncontributory. The measurement of the U.S. pre-65 retiree medical accumulated postretirement benefit obligation assumes a health care cost trend rate of 6.25 percent in 2018 that declines to 5 percent by 2023. The measurement of the U.S. post-65 retiree medical accumulated postretirement benefit obligation assumes an ultimate health care cost trend rate of 5 percent achieved in 2018. A one-percentage-point change in the assumed health care cost trend rate would be immaterial to ConocoPhillips.
118
Plan Assets -We follow a policy of broadly diversifying pension plan assets across asset classes and individual holdings. As a result, our plan assets have no significant concentrations of credit risk. Asset classes that are considered appropriate include U.S. equities, non-U.S. equities, U.S. fixed income, non-U.S. fixed income, real estate and private equity investments. Plan fiduciaries may consider and add other asset classes to the investment program from time to time. The target allocations for plan assets are 43 percent equity securities, 50 percent debt securities, 6 percent real estate and 1 percent other. Generally, the plan investments are publicly traded, therefore minimizing liquidity risk in the portfolio.
The following is a description of the valuation methodologies used for the pension plan assets. There have been no changes in the methodologies used at December 31, 2017 and 2016.
| • | Fair values of equity securities and government debt securities categorized in Level 1 are primarily based on quoted market prices in active markets for identical assets and liabilities. |
| • | Fair values of corporate debt securities, agency and mortgage-backed securities and government debt securities categorized in Level 2 are estimated using recently executed transactions and quoted market prices for similar assets and liabilities in active markets and for identical assets and liabilities in markets that are not active. If there have been no market transactions in a particular fixed income security, its fair value is calculated by pricing models that benchmark the security against other securities with actual market prices. When observable quoted market prices are not available, fair value is based on pricing models that use something other than actual market prices (e.g., observable inputs such as benchmark yields, reported trades and issuer spreads for similar securities), and these securities are categorized in Level 3 of the fair value hierarchy. |
| • | Fair values of investments in common/collective trusts are determined by the issuer of each fund based on the fair value of the underlying assets. |
| • | Fair values of mutual funds are based on quoted market prices, which represent the net asset value of shares held. |
| • | Time deposits are valued at cost, which approximates fair value. |
| • | Cash is valued at cost, which approximates fair value. Fair values of international cash equivalents categorized in Level 2 are valued using observable yield curves, discounting and interest rates. U.S. cash balances held in the form of short-term fund units that are redeemable at the measurement date are categorized as Level 2. |
| • | Fair values of exchange-traded derivatives classified in Level 1 are based on quoted market prices. For other derivatives classified in Level 2, the values are generally calculated from pricing models with market input parameters from third-party sources. |
| • | Fair values of insurance contracts are valued at the present value of the future benefit payments owed by the insurance company to the plans' participants. |
| • | Fair values of real estate investments are valued using real estate valuation techniques and other methods that include reference to third-party sources and sales comparables where available. |
| • | A portion of U.S. pension plan assets is held as a participating interest in an insurance annuity contract, which is calculated as the market value of investments held under this contract, less the accumulated benefit obligation covered by the contract. The participating interest is classified as Level 3 in the fair value hierarchy as the fair value is determined via a combination of quoted market prices, recently executed transactions, and an actuarial present value computation for contract obligations. At December 31, 2017, the participating interest in the annuity contract was valued at $99 million and consisted of $265 million in debt securities, less $166 million for the accumulated benefit obligation covered by the contract. At December 31, 2016, the participating interest in the annuity contract was valued at $121 million and consisted of $288 million in debt securities, less $167 million for the accumulated benefit obligation covered by the contract. The net change from 2016 to 2017 is due to a decrease in the fair value of the underlying investments of $23 million offset by a decrease in the present value of the contract obligation of $1 million. The participating interest is not available for meeting general pension benefit obligations in the near term. No future company contributions are required and no new benefits are being accrued under this insurance annuity contract. |
119
The fair values of our pension plan assets at December 31, by asset class were as follows:
| Millions of Dollars | ||||||||||||||||||||||||||||||||||||
|
| |||||||||||||||||||||||||||||||||||
| U.S. | International | |||||||||||||||||||||||||||||||||||
|
|
|
| |||||||||||||||||||||||||||||||||
| Level 1 | Level 2 | Level 3 | Total | Level 1 | Level 2 | Level 3 | Total | |||||||||||||||||||||||||||||
|
|
|
| |||||||||||||||||||||||||||||||||
2017 | ||||||||||||||||||||||||||||||||||||
Equity Securities | ||||||||||||||||||||||||||||||||||||
U.S. | $ | 161 | - | 14 | 175 | 440 | - | - | 440 | |||||||||||||||||||||||||||
International | 178 | - | - | 178 | 315 | - | - | 315 | ||||||||||||||||||||||||||||
Common/collective trusts | - | - | - | - | - | 183 | - | 183 | ||||||||||||||||||||||||||||
Mutual funds | 146 | - | - | 146 | 292 | 165 | - | 457 | ||||||||||||||||||||||||||||
Debt Securities | ||||||||||||||||||||||||||||||||||||
Government | - | - | - | - | 902 | - | - | 902 | ||||||||||||||||||||||||||||
Corporate | - | 2 | - | 2 | - | - | - | - | ||||||||||||||||||||||||||||
Common/collective trusts | - | - | - | - | - | 648 | - | 648 | ||||||||||||||||||||||||||||
Mutual funds | - | - | - | - | 144 | - | - | 144 | ||||||||||||||||||||||||||||
Cash and cash equivalents | - | - | - | - | 111 | - | - | 111 | ||||||||||||||||||||||||||||
Time deposits | - | - | - | - | 3 | - | - | 3 | ||||||||||||||||||||||||||||
Derivatives | - | - | - | - | 5 | - | - | 5 | ||||||||||||||||||||||||||||
Real estate | - | - | - | - | - | - | 123 | 123 | ||||||||||||||||||||||||||||
Total in fair value hierarchy | $ | 485 | 2 | 14 | 501 | 2,212 | 996 | 123 | 3,331 | |||||||||||||||||||||||||||
Investments measured at net asset value* | ||||||||||||||||||||||||||||||||||||
Equity Securities | ||||||||||||||||||||||||||||||||||||
Common/collective trusts | $ | - | - | - | 805 | - | - | - | - | |||||||||||||||||||||||||||
Debt Securities | ||||||||||||||||||||||||||||||||||||
Corporate | - | - | - | - | - | - | - | 172 | ||||||||||||||||||||||||||||
Agency and mortgage-backed securities | - | - | - | - | - | - | - | 15 | ||||||||||||||||||||||||||||
Common/collective trusts | - | - | - | 1,042 | - | - | - | - | ||||||||||||||||||||||||||||
Cash and cash equivalents | - | - | - | 17 | - | - | - | 24 | ||||||||||||||||||||||||||||
Real estate | - | - | - | 74 | - | - | - | 94 | ||||||||||||||||||||||||||||
| ||||||||||||||||||||||||||||||||||||
Total** | $ | 485 | 2 | 14 | 2,439 | 2,212 | 996 | 123 | 3,636 | |||||||||||||||||||||||||||
| ||||||||||||||||||||||||||||||||||||
*In accordance with FASB ASC Topic 715, "Compensation-Retirement Benefits," certain investments that are to be measured at fair value using the net asset value per share (or its equivalent) practical expedient have not been classified in the fair value hierarchy. The fair value amounts presented in this table are intended to permit reconciliation of the fair value hierarchy to the amounts presented in the Change in Fair Value of Plan Assets.
**Excludes the participating interest in the insurance annuity contract with a net asset value of $99 million and net receivables related to security transactions of $14 million.
120
The fair values of our pension plan assets at December 31, by asset class were as follows:
| Millions of Dollars | ||||||||||||||||||||||||||||||||||||
|
| |||||||||||||||||||||||||||||||||||
| U.S. | International | |||||||||||||||||||||||||||||||||||
|
|
|
| |||||||||||||||||||||||||||||||||
| Level 1 | Level 2 | Level 3 | Total | Level 1 | Level 2 | Level 3 | Total | |||||||||||||||||||||||||||||
|
|
|
| |||||||||||||||||||||||||||||||||
2016 | ||||||||||||||||||||||||||||||||||||
Equity Securities | ||||||||||||||||||||||||||||||||||||
U.S. | $ | 632 | - | 14 | 646 | 628 | - | - | 628 | |||||||||||||||||||||||||||
International | 342 | - | - | 342 | 428 | - | - | 428 | ||||||||||||||||||||||||||||
Common/collective trusts | - | - | - | - | - | 156 | - | 156 | ||||||||||||||||||||||||||||
Mutual funds | 62 | - | - | 62 | 268 | 139 | - | 407 | ||||||||||||||||||||||||||||
Debt Securities | ||||||||||||||||||||||||||||||||||||
Government | - | 38 | - | 38 | 470 | - | - | 470 | ||||||||||||||||||||||||||||
Corporate | - | 54 | 3 | 57 | - | - | - | - | ||||||||||||||||||||||||||||
Common/collective trusts | - | - | - | - | - | 385 | - | 385 | ||||||||||||||||||||||||||||
Mutual funds | - | - | - | - | 137 | - | - | 137 | ||||||||||||||||||||||||||||
Cash and cash equivalents | - | - | - | - | 48 | - | - | 48 | ||||||||||||||||||||||||||||
Derivatives | - | - | - | - | 18 | - | - | 18 | ||||||||||||||||||||||||||||
Real estate | - | - | - | - | - | - | 111 | 111 | ||||||||||||||||||||||||||||
| ||||||||||||||||||||||||||||||||||||
Total in fair value hierarchy | $ | 1,036 | 92 | 17 | 1,145 | 1,997 | 680 | 111 | 2,788 | |||||||||||||||||||||||||||
Investments measured at net asset value* | ||||||||||||||||||||||||||||||||||||
Equity Securities | ||||||||||||||||||||||||||||||||||||
Common/collective trusts | $ | - | - | - | 410 | - | - | - | - | |||||||||||||||||||||||||||
Debt Securities | ||||||||||||||||||||||||||||||||||||
Corporate | - | - | - | - | - | - | - | 155 | ||||||||||||||||||||||||||||
Agency and mortgage-backed securities | - | - | - | - | - | - | - | 27 | ||||||||||||||||||||||||||||
Common/collective trusts | - | - | - | 312 | - | - | - | - | ||||||||||||||||||||||||||||
Cash and cash equivalents | - | - | - | 36 | - | - | - | 11 | ||||||||||||||||||||||||||||
Real estate | - | - | - | 69 | - | - | - | 76 | ||||||||||||||||||||||||||||
| ||||||||||||||||||||||||||||||||||||
Total** | $ | 1,036 | 92 | 17 | 1,972 | 1,997 | 680 | 111 | 3,057 | |||||||||||||||||||||||||||
| ||||||||||||||||||||||||||||||||||||
*In accordance with FASB ASC Topic 715, "Compensation-Retirement Benefits," certain investments that are to be measured at fair value using the net asset
value per share (or its equivalent) practical expedient have not been classified in the fair value hierarchy. The fair value amounts presented in this table are
intended to permit reconciliation of the fair value hierarchy to the amounts presented in the Change in Fair Value of Plan Assets.
**Excludes the participating interest in the insurance annuity contract with a net asset value of $121 million and net payables related to security transactions of $1 million.
Level 3 activity was not material for all periods.
Our funding policy for U.S. plans is to contribute at least the minimum required by the Employee Retirement Income Security Act of 1974 and the Internal Revenue Code of 1986, as amended. Contributions to foreign plans are dependent upon local laws and tax regulations. In 2018, we expect to contribute approximately $80 million to our domestic nonqualified pension and postretirement benefit plans and $130 million to our international qualified and nonqualified pension and postretirement benefit plans.
121
The following benefit payments, which are exclusive of amounts to be paid from the insurance annuity contract and which reflect expected future service, as appropriate, are expected to be paid:
| Millions of Dollars | ||||||||||||||||
|
| |||||||||||||||
Pension Benefits | Other Benefits | |||||||||||||||
|
|
|
| |||||||||||||
| U.S. | Int'l. | |||||||||||||||
|
| |||||||||||||||
2018 | $ 383 | 122 | 40 | |||||||||||||
2019 | 302 | 141 | 37 | |||||||||||||
2020 | 290 | 135 | 34 | |||||||||||||
2021 | 286 | 144 | 31 | |||||||||||||
2022 | 291 | 144 | 28 | |||||||||||||
2023–2027 | 1,247 | 780 | 91 | |||||||||||||
| ||||||||||||||||
Severance Accrual
As a result of selling our 50 percent nonoperated interest in the FCCL Partnership and the majority of our western Canada gas assets, as well as our interest in the San Juan Basin, a reduction in our overall employee workforce occurred during 2017. Severance accruals of $65 million were recorded in 2017. The following table summarizes our severance accrual activity for the year ended December 31, 2017:
| Millions of Dollars | ||||
Balance at December 31, 2016 | $ | 80 | ||
Accruals | 65 | |||
Benefit payments | (93) | |||
Foreign currency translation adjustments | 1 | |||
| ||||
Balance at December 31, 2017 | $ | 53 | ||
| ||||
Of the remaining balance at December 31, 2017, $30 million is classified as short-term.
Defined Contribution Plans
Most U.S. employees are eligible to participate in the ConocoPhillips Savings Plan (CPSP). Employees can deposit up to 75 percent of their eligible pay, subject to statutory limits, in the CPSP to a choice of approximately 34 investment options. Employees who participate in the CPSP and contribute 1 percent of their eligible pay receive a 6 percent company cash match with a potential company discretionary cash contribution of up to 6 percent. Company contributions charged to expense for the CPSP and predecessor plans were $51 million in 2017, $58 million in 2016, and $109 million in 2015.
We have several defined contribution plans for our international employees, each with its own terms and eligibility depending on location. Total compensation expense recognized for these international plans was approximately $35 million in 2017, $44 million in 2016, and $55 million in 2015.
Share-Based Compensation Plans
The 2014 Omnibus Stock and Performance Incentive Plan of ConocoPhillips (the Plan) was approved by shareholders in May 2014. Over its 10-year life, the Plan allows the issuance of up to 79 million shares of our common stock for compensation to our employees and directors; however, as of the effective date of the Plan, (i) any shares of common stock available for future awards under the prior plans and (ii) any shares of common stock represented by awards granted under the prior plans that are forfeited, expire or are cancelled without delivery of shares of common stock or which result in the forfeiture of shares of common stock back to the company shall be available for awards under the Plan, and no new awards shall be granted under the prior plans. Of the 79 million shares available for issuance under the Plan, no more than 40 million shares of common stock are available for incentive stock options. The Human Resources and Compensation Committee
122
of our Board of Directors is authorized to determine the types, terms, conditions and limitations of awards granted. Awards may be granted in the form of, but not limited to, stock options, restricted stock units and performance share units to employees and non-employee directors who contribute to the company's continued success and profitability.
Total share-based compensation expense is measured using the grant date fair value for our equity-classified awards and the settlement date fair value for our liability-classified awards. We recognize share-based compensation expense over the shorter of the service period (i.e., the stated period of time required to earn the award); or the period beginning at the start of the service period and ending when an employee first becomes eligible for retirement, but not less than six months, as this is the minimum period of time required for an award to not be subject to forfeiture. Our share-based compensation programs generally provide accelerated vesting (i.e., a waiver of the remaining period of service required to earn an award) for awards held by employees at the time of their retirement. Some of our share-based awards vest ratably (i.e., portions of the award vest at different times) while some of our awards cliff vest (i.e., all of the award vests at the same time). We recognize expense on a straight-line basis over the service period for the entire award, whether the award was granted with ratable or cliff vesting.
Compensation Expense -Total share-based compensation expense recognized in loss and the associated tax benefit for the years ended December 31 were as follows:
| Millions of Dollars | ||||||||||||
|
| |||||||||||
| 2017 | 2016 | 2015 | ||||||||||
|
| |||||||||||
Compensation cost | $ | 227 | 272 | 362 | ||||||||
Tax benefit | 76 | 92 | 123 | |||||||||
| ||||||||||||
Stock Options -Stock options granted under the provisions of the Plan and prior plans permit purchase of our common stock at exercise prices equivalent to the average market price of ConocoPhillips common stock on the date the options were granted. The options have terms of 10 years and generally vest ratably, with one-third of the options awarded vesting and becoming exercisable on each anniversary date following the date of grant. Options awarded to certain employees already eligible for retirement vest within six months of the grant date, but those options do not become exercisable until the end of the normal vesting period.
The fair market values of the options granted over the past three years were measured on the date of grant using the Black-Scholes-Merton option-pricing model. The weighted-average assumptions used were as follows:
| 2017 | 2016 | 2015 | ||||||||||
|
| |||||||||||
Assumptions used | ||||||||||||
Risk-free interest rate | 2.24 | % | 1.55 | 1.79 | ||||||||
Dividend yield | 4.00 | % | 4.00 | 4.00 | ||||||||
Volatility factor | 28.12 | % | 26.80 | 23.32 | ||||||||
Expected life (years) | 6.39 | 6.37 | 5.79 | |||||||||
| ||||||||||||
There were no ranges in the assumptions used to determine the fair market values of our options granted over the past three years.
We believe our historical volatility for periods prior to the 2012 separation of our Downstream businesses is no longer relevant in estimating expected volatility. For 2015 through 2017, expected volatility was based on the weighted-average blend of the company's historical stock price volatility from May 1, 2012 (the date of separation of our Downstream businesses) through the stock option grant date and the average historical stock price volatility of a group of peer companies for the expected term of the options.
123
The following summarizes our stock option activity for the year ended December 31, 2017:
| Options | Weighted- Average Exercise Price | Weighted- Average | Millions of Dollars | |||||||||||||
| Grant Date Fair Value | Aggregate Intrinsic Value | |||||||||||||||
Outstanding at December 31, 2016 | 23,712,112 | $ | 52.14 | $ | 128 | |||||||||||
Granted | 2,670,200 | 49.76 | $ | 9.18 | ||||||||||||
Exercised | (360,396) | 37.24 | 4 | |||||||||||||
Forfeited | (50,696) | 48.55 | ||||||||||||||
Expired or cancelled | (1,248,417) | 50.61 | ||||||||||||||
|
|
| ||||||||||||||
Outstanding at December 31, 2017 | 24,722,803 | $ | 52.18 | $ | 177 | |||||||||||
|
|
| ||||||||||||||
Vested at December 31, 2017 | 23,424,010 | $ | 52.52 | $ | 162 | |||||||||||
|
|
| ||||||||||||||
Exercisable at December 31, 2017 | 18,074,088 | $ | 54.34 | $ | 101 | |||||||||||
|
|
| ||||||||||||||
The weighted-average remaining contractual term of outstanding options, vested options and exercisable options at December 31, 2017, was 5.52 years, 5.36 years and 4.50 years, respectively. The weighted-average grant date fair value of stock option awards granted during 2016 and 2015 was $5.39 and $9.54, respectively. The aggregate intrinsic value of options exercised was zero in 2016 and $10 million in 2015.
During 2017, we received $13 million in cash and realized a tax benefit of $12 million from the exercise of options. At December 31, 2017, the remaining unrecognized compensation expense from unvested options was $5 million, which will be recognized over a weighted-average period of 1.33 years, the longest period being 2.12 years.
Beginning in 2018, stock option grants will be discontinued and replaced with three-year, time-vested restricted stock units which will be cash-settled.
Stock Unit Program- Generally, restricted stock units are granted annually under the provisions of the Plan. Restricted stock units granted prior to 2013 generally vest ratably in three equal annual installments beginning on the third anniversary of the grant date. Beginning in 2013, restricted stock units granted will vest in an aggregate installment on the third anniversary of the grant date. In addition, beginning in 2012, restricted stock units granted under the Plan for a variable long-term incentive program vest ratably in three equal annual installments beginning on the first anniversary of the grant date. Restricted stock units are also granted ad hoc to attract or retain key personnel, and the terms and conditions under which these restricted stock units vest vary by award. Upon vesting, the restricted stock units are settled by issuing one share of ConocoPhillips common stock per unit. Units awarded to retirement eligible employees vest six months from the grant date; however, those units are not issued as common stock until the earlier of separation from the company or the end of the regularly scheduled vesting period. Until issued as stock, most recipients of the restricted stock units receive a quarterly cash payment of a dividend equivalent that is charged to retained earnings. The grant date fair market value of these restricted stock units is deemed equal to the average ConocoPhillips stock price on the grant date. The grant date fair market value of units that do not receive a dividend equivalent while unvested is deemed equal to the average ConocoPhillips stock price on the grant date, less the net present value of the dividends that will not be received.
124
The following summarizes our stock unit activity for the year ended December 31, 2017:
Stock Units | Weighted-Average | Millions of Dollars | ||||||||||
|
| |||||||||||
| Grant Date Fair Value | Total Fair Value | |||||||||||
|
|
|
|
|
| |||||||
Outstanding at December 31, 2016 | 8,507,504 | $ | 48.65 | |||||||||
Granted | 3,011,903 | 48.77 | ||||||||||
Forfeited | (372,871 | ) | 45.99 | |||||||||
Issued | (3,319,684 | ) | $ | 159 | ||||||||
|
|
| ||||||||||
Outstanding at December 31, 2017 | 7,826,852 | $ | 45.75 | |||||||||
|
|
| ||||||||||
Not Vested at December 31, 2017 | 5,396,027 | $ | 45.58 | |||||||||
|
|
| ||||||||||
At December 31, 2017, the remaining unrecognized compensation cost from the unvested units was $93 million, which will be recognized over a weighted-average period of 1.67 years, the longest period being 2.75 years. The weighted-average grant date fair value of stock unit awards granted during 2016 and 2015 was $32.15 and $65.40, respectively. The total fair value of stock units issued during 2016 and 2015 was $191 million and $316 million, respectively.
Performance Share Program -Under the Plan, we also annually grant restricted performance share units (PSUs) to senior management. These PSUs are authorized three years prior to their effective grant date (the performance period). Compensation expense is initially measured using the average fair market value of ConocoPhillips common stock and is subsequently adjusted, based on changes in the ConocoPhillips stock price through the end of each subsequent reporting period, through the grant date for stock-settled awards and the settlement date for cash-settled awards.
Stock-Settled
For performance periods beginning before 2009, PSUs do not vest until the employee becomes eligible for retirement by reaching age 55 with five years of service, and restrictions do not lapse until the employee separates from the company. With respect to awards for performance periods beginning in 2009 through 2012, PSUs do not vest until the earlier of the date the employee becomes eligible for retirement by reaching age 55 with five years of service or five years after the grant date of the award, and restrictions do not lapse until the earlier of the employee's separation from the company or five years after the grant date (although recipients can elect to defer the lapsing of restrictions until separation). We recognize compensation expense for these awards beginning on the grant date and ending on the date the PSUs are scheduled to vest. Since these awards are authorized three years prior to the grant date, for employees eligible for retirement by or shortly after the grant date, we recognize compensation expense over the period beginning on the date of authorization and ending on the date of grant. Until issued as stock, recipients of the PSUs receive a quarterly cash payment of a dividend equivalent that is charged to retained earnings. Beginning in 2013, PSUs authorized for future grants will vest, absent employee election to defer, upon settlement following the conclusion of the three-year performance period. We recognize compensation expense over the period beginning on the date of authorization and ending on the conclusion of the performance period. PSUs are settled by issuing one share of ConocoPhillips common stock per unit.
125
The following summarizes our stock-settled Performance Share Program activity for the year ended December 31, 2017:
| Stock Units | Weighted-Average | Millions of Dollars | ||||||||||
| Grant Date Fair Value | Total Fair Value | |||||||||||
Outstanding at December 31, 2016 | 3,889,524 | $ 51.93 | ||||||||||
Granted | 30,953 | 49.76 | ||||||||||
Issued | (1,167,012 | ) | $ 57 | |||||||||
|
|
| ||||||||||
Outstanding at December 31, 2017 | 2,753,465 | $ 50.79 | ||||||||||
|
|
| ||||||||||
Not Vested at December 31, 2017 | 67,083 | $ 48.17 | ||||||||||
|
|
| ||||||||||
At December 31, 2017, the remaining unrecognized compensation cost from unvested stock-settled performance share awards was $1 million, which will be recognized over a weighted-average period of 2.00 years, the longest period being 3.00 years. The weighted-average grant date fair value of stock-settled PSUs granted during 2016 and 2015 was $33.13 and $69.25, respectively. The total fair value of stock-settled PSUs issued during 2016 and 2015 was $17 million and $25 million, respectively.
Cash-Settled
In connection with and immediately following the separation of our Downstream businesses in 2012, grants of new PSUs, subject to a shortened performance period, were authorized. Once granted, these PSUs vest, absent employee election to defer, on the earlier of five years after the grant date of the award or the date the employee becomes eligible for retirement. For employees eligible for retirement by or shortly after the grant date, we recognize compensation expense over the period beginning on the date of authorization and ending on the date of grant. Otherwise, we recognize compensation expense beginning on the grant date and ending on the date the PSUs are scheduled to vest. These PSUs are settled in cash equal to the fair market value of a share of ConocoPhillips common stock per unit on the settlement date and thus are classified as liabilities on the balance sheet. Until settlement occurs, recipients of the PSUs receive a quarterly cash payment of a dividend equivalent that is charged to compensation expense.
Beginning in 2013, PSUs authorized for future grants will vest upon settlement following the conclusion of the three-year performance period. We recognize compensation expense over the period beginning on the date of authorization and ending at the conclusion of the performance period. These PSUs will be settled in cash equal to the fair market value of a share of ConocoPhillips common stock per unit on the settlement date and are classified as liabilities on the balance sheet. During the performance period, recipients of the PSUs do not receive a quarterly cash payment of a dividend equivalent, but after the performance period ends, until settlement in cash occurs, recipients of the PSUs receive a quarterly cash payment of a dividend equivalent that is charged to compensation expense.
The following summarizes our cash-settled Performance Share Program activity for the year ended December 31, 2017:
|
Stock Units |
| Weighted-Average | Millions of Dollars | ||||||||
| Grant Date Fair Value | Total Fair Value | |||||||||||
Outstanding at December 31, 2016 | 1,274,762 | $ 50.39 | ||||||||||
Granted | 456,909 | 49.76 | ||||||||||
Settled | (517,138 | ) | $ 24 | |||||||||
|
|
| ||||||||||
Outstanding at December 31, 2017 | 1,214,533 | $ 55.19 | ||||||||||
|
|
| ||||||||||
Not Vested at December 31, 2017 | 122,228 | $ 55.19 | ||||||||||
|
|
| ||||||||||
126
At December 31, 2017, the remaining unrecognized compensation cost from unvested cash-settled performance share awards was $2 million, which will be recognized over a weighted-average period of 1.64 years, the longest period being 2.13 years. The weighted-average grant date fair value of cash-settled PSUs granted during 2016 and 2015 was $33.13 and $69.25, respectively. The total fair value of cash-settled performance share awards settled during 2016 and 2015 was $31 million and $6 million, respectively.
From inception of the Performance Share Program through 2013, approved PSU awards were granted after the conclusion of performance periods. Beginning in February 2014, initial target PSU awards are issued near the beginning of new performance periods. These initial target PSU awards will terminate at the end of the performance periods and will be settled after the performance periods have ended. Also in 2014, initial target PSU awards were issued for open performance periods that began in prior years. For the open performance period beginning in 2012, the initial target PSU awards terminated at the end of the three-year performance period and were replaced with approved PSU awards. For the open performance period beginning in 2013, the initial target PSU awards terminated at the end of the three-year performance period and were settled after the performance period ended. There is no effect on recognition of compensation expense.
Other -In addition to the above active programs, we have outstanding shares of restricted stock and restricted stock units that were either issued as part of our non-employee director compensation program for current and former members of the company's Board of Directors or as part of an executive compensation program that has been discontinued. Generally, the recipients of the restricted shares or units receive a quarterly dividend or dividend equivalent.
The following summarizes the aggregate activity of these restricted shares and units for the year ended December 31, 2017:
| Weighted-Average | Millions of Dollars | |||||||||||
|
| |||||||||||
| Stock Units | Grant Date Fair Value | Total Fair Value | ||||||||||
|
|
|
|
|
| |||||||
Outstanding at December 31, 2016 | 1,317,964 | $ 33.16 | ||||||||||
Granted | 87,980 | 48.87 | ||||||||||
Cancelled | (24,486 | ) | 21.37 | |||||||||
Issued | (80,418 | ) | $ 4 | |||||||||
|
|
| ||||||||||
Outstanding at December 31, 2017 | 1,301,040 | $ 32.66 | ||||||||||
|
|
| ||||||||||
Not Vested at December 31, 2017 | - | |||||||||||
| ||||||||||||
At December 31, 2017, all outstanding restricted stock and restricted stock units were fully vested and there was no remaining compensation cost to be recorded. The weighted-average grant date fair value of awards granted during 2016 and 2015 was $40.36 and $58.66, respectively. The total fair value of awards issued during 2016 and 2015 was $2 million and $3 million, respectively.
127
Note 18-Income Taxes
Income tax benefits included in net loss were:
| Millions of Dollars | ||||||||||||
|
| |||||||||||
| 2017 | 2016 | 2015 | ||||||||||
|
| |||||||||||
Income Taxes | ||||||||||||
Federal | ||||||||||||
Current | $ | 79 | (9 | ) | (718 | ) | ||||||
Deferred | (3,046 | ) | (1,634 | ) | (1,443 | ) | ||||||
Foreign | ||||||||||||
Current | 1,729 | 393 | 745 | |||||||||
Deferred | (510 | ) | (519 | ) | (1,315 | ) | ||||||
State and local | ||||||||||||
Current | 51 | (135 | ) | 8 | ||||||||
Deferred | (125 | ) | (67 | ) | (145 | ) | ||||||
| ||||||||||||
| $ | (1,822 | ) | (1,971 | ) | (2,868 | ) | ||||||
| ||||||||||||
Deferred income taxes reflect the net tax effect of temporary differences between the carrying amounts of assets and liabilities for financial reporting purposes and the amounts used for tax purposes. Major components of deferred tax liabilities and assets at December 31 were:
| Millions of Dollars | ||||||||
|
| |||||||
| 2017 | 2016 | |||||||
|
| |||||||
Deferred Tax Liabilities | ||||||||
PP&E and intangibles | $ | 9,692 | 15,099 | |||||
Investments in joint ventures | - | 933 | ||||||
Inventory | 61 | 36 | ||||||
Deferred state income tax | 178 | 203 | ||||||
Other | 464 | 486 | ||||||
| ||||||||
Total deferred tax liabilities | 10,395 | 16,757 | ||||||
| ||||||||
Deferred Tax Assets | ||||||||
Benefit plan accruals | 786 | 1,280 | ||||||
Asset retirement obligations and accrued environmental costs | 3,060 | 3,514 | ||||||
Investments in joint ventures | 57 | - | ||||||
Other financial accruals and deferrals | 166 | 317 | ||||||
Loss and credit carryforwards | 2,310 | 3,522 | ||||||
Other | 152 | 250 | ||||||
| ||||||||
Total deferred tax assets | 6,531 | 8,883 | ||||||
Less: valuation allowance | (1,254 | ) | (675 | ) | ||||
| ||||||||
Net deferred tax assets | 5,277 | 8,208 | ||||||
| ||||||||
Net deferred tax liabilities | $ | 5,118 | 8,549 | |||||
| ||||||||
At December 31, 2017, noncurrent assets and liabilities included deferred taxes of $164 million and $5,282 million, respectively. At December 31, 2016, noncurrent assets and liabilities included deferred taxes of $400 million and $8,949 million, respectively.
128
At December 31, 2017, the components of our loss and credit carryforwards before and after consideration of the applicable valuation allowances are:
| Millions of Dollars | ||||||||||||
|
| |||||||||||
Gross Deferred Tax Asset | Net Deferred Tax Asset After Valuation Allowance | Expiration of Net Deferred Tax Asset | ||||||||||
|
| |||||||||||
U.S. foreign tax credits | $ | 856 | 567 | 2025-2027 | ||||||||
U.S. general business credits | 227 | 227 | 2036-2037 | |||||||||
State net operating losses and tax credits | 420 | - | ||||||||||
Foreign net operating losses and tax credits | 807 | 786 | Post 2025 | |||||||||
| ||||||||||||
| $ | 2,310 | 1,580 | ||||||||||
| ||||||||||||
Valuation allowances have been established to reduce deferred tax assets to an amount that will, more likely than not, be realized. During 2017, valuation allowances increased a total of $579 million. This increase primarily relates to the expected realization of certain deferred tax assets, including foreign tax credits; U.S. tax basis associated with foreign assets; and state net operating losses and tax credits not expected to be realized. Based on our historical taxable income, expectations for the future, and available tax-planning strategies, management expects deferred tax assets, net of valuation allowance, will primarily be realized as offsets to reversing deferred tax liabilities.
At December 31, 2017, unremitted income considered to be permanently reinvested in certain foreign subsidiaries and foreign corporate joint ventures totaled approximately $2,600 million. Deferred income taxes have not been provided on this amount, as we do not plan to initiate any action that would require the payment of income taxes. The estimated amount of additional tax that would be payable on this income if distributed is approximately $130 million.
The following table shows a reconciliation of the beginning and ending unrecognized tax benefits for 2017, 2016 and 2015:
| Millions of Dollars | ||||||||||||
|
| |||||||||||
| 2017 | 2016 | 2015 | ||||||||||
|
| |||||||||||
Balance at January 1 | $ | 381 | 459 | 442 | ||||||||
Additions based on tax positions related to the current year | 612 | 32 | 54 | |||||||||
Additions for tax positions of prior years | 109 | 19 | 4 | |||||||||
Reductions for tax positions of prior years | (129 | ) | (118 | ) | (37 | ) | ||||||
Settlements | (5 | ) | (9 | ) | (4 | ) | ||||||
Lapse of statute | (86 | ) | (2 | ) | - | |||||||
| ||||||||||||
Balance at December 31 | $ | 882 | 381 | 459 | ||||||||
| ||||||||||||
Included in the balance of unrecognized tax benefits for 2017, 2016 and 2015 were $882 million, $359 million and $354 million, respectively, which, if recognized, would impact our effective tax rate. The balance of unrecognized tax benefits increased in 2017 mainly due to the recognition of a U.S. worthless securities deduction that we do not believe will generate a cash tax benefit.
At December 31, 2017, 2016 and 2015, accrued liabilities for interest and penalties totaled $54 million, $54 million and $79 million, respectively, net of accrued income taxes. Interest and penalties resulted in no impact to earnings in 2017, a benefit to earnings of $18 million in 2016, and a reduction to earnings of $11 million in 2015.
129
We and our subsidiaries file tax returns in the U.S. federal jurisdiction and in many foreign and state jurisdictions. Audits in major jurisdictions are generally complete as follows: United Kingdom (2014), Canada (2009), United States (2010) and Norway (2016). Issues in dispute for audited years and audits for subsequent years are ongoing and in various stages of completion in the many jurisdictions in which we operate around the world. As a consequence, the balance in unrecognized tax benefits can be expected to fluctuate from period to period. It is reasonably possible such changes could be significant when compared with our total unrecognized tax benefits, but the amount of change is not estimable.
The amounts of U.S. and foreign income (loss) before income taxes, with a reconciliation of tax at the federal statutory rate with the provision for income taxes, were:
| Millions of Dollars | Percent of Pre-Tax Income (Loss) | |||||||||||||||||||||||
|
|
|
| |||||||||||||||||||||
| 2017 | 2016 | 2015 | 2017 | 2016 | 2015 | |||||||||||||||||||
|
|
|
| |||||||||||||||||||||
Loss before income taxes | ||||||||||||||||||||||||
United States | $ | (5,250 | ) | (4,410 | ) | (4,150 | ) | 200.8 | % | 79.7 | 57.3 | |||||||||||||
Foreign | 2,635 | (1,120 | ) | (3,089 | ) | (100.8 | ) | 20.3 | 42.7 | |||||||||||||||
| ||||||||||||||||||||||||
| $ | (2,615 | ) | (5,530 | ) | (7,239 | ) | 100.0 | % | 100.0 | 100.0 | ||||||||||||||
| ||||||||||||||||||||||||
Federal statutory income tax | $ | (915 | ) | (1,936 | ) | (2,534 | ) | 35.0 | % | 35.0 | 35.0 | |||||||||||||
Non-U.S. effective tax rates | 625 | 361 | 301 | (23.9 | ) | (6.5 | ) | (4.2 | ) | |||||||||||||||
Impact of U.S. tax legislation | (852 | ) | - | - | 32.6 | - | - | |||||||||||||||||
Canada disposition | (1,277 | ) | - | - | 48.8 | - | - | |||||||||||||||||
Recovery of outside basis | (962 | ) | (60 | ) | (491 | ) | 36.8 | 1.1 | 6.8 | |||||||||||||||
Adjustment to tax reserves | 881 | 55 | 42 | (33.7 | ) | (1.0 | ) | (0.6 | ) | |||||||||||||||
APLNG impairment | 834 | - | 525 | (31.9 | ) | - | (7.3 | ) | ||||||||||||||||
State income tax | (84 | ) | (122 | ) | (85 | ) | 3.2 | 2.2 | 1.2 | |||||||||||||||
Enhanced oil recovery credit | (68 | ) | (62 | ) | - | 2.6 | 1.1 | - | ||||||||||||||||
U.K. rate change | - | (161 | ) | (555 | ) | - | 2.9 | 7.7 | ||||||||||||||||
Canada rate change | - | - | 129 | - | - | (1.8 | ) | |||||||||||||||||
U.S. fair value election | - | - | (185 | ) | - | - | 2.6 | |||||||||||||||||
Other | (4 | ) | (46 | ) | (15 | ) | 0.2 | 0.8 | 0.2 | |||||||||||||||
| ||||||||||||||||||||||||
| $ | (1,822 | ) | (1,971 | ) | (2,868 | ) | 69.7 | % | 35.6 | 39.6 | ||||||||||||||
| ||||||||||||||||||||||||
The increase in the effective tax rate for 2017 was primarily due to the impact of the Tax Cuts and Jobs Act (Tax Legislation) and the impact of the Canada disposition, partially offset by the impact of the APLNG impairment and our mix of income among taxing jurisdictions.
The Tax Legislation, enacted on December 22, 2017, reduces the U.S. federal corporate tax rate from 35 percent to 21 percent, requires companies to pay a one-time transition tax on earnings of certain foreign subsidiaries that were previously tax deferred and creates new taxes on certain foreign-sourced earnings. At December 31, 2017, we have not completed our accounting for the tax effects of enactment of the Tax Legislation; however, as described below, we have made a reasonable estimate of the effects on our existing deferred tax balances and the one-time transition tax and recorded a provisional tax benefit of $852 million.
Provisional Amount-Deferred tax assets and liabilities
In the fourth quarter of 2017, we remeasured certain U.S. deferred tax assets and liabilities based on the rates at which they are expected to reverse in the future, which is generally 21 percent. However, we are still analyzing certain aspects of the Tax Legislation and refining our calculations, which could potentially affect the measurement of these balances or potentially give rise to new deferred tax amounts. The provisional amount recorded related to the remeasurement of our U.S. deferred tax balance was a tax benefit of $908 million.
130
Provisional Amount-Foreign tax effects
The one-time transition tax is based on our total post-1986 earnings and profits which we have previously deferred from U.S. income taxes. We reasonably estimate that we will not incur a one-time transition tax. This assumption may change when we finalize the calculation of post-1986 foreign earnings and profits, previously deferred from U.S. federal taxation, and finalize the amounts held in cash or other specified assets. As a result of the Tax Legislation, we have removed the indefinite reinvestment assertion on one of our foreign subsidiaries and recorded a tax expense of $56 million in the fourth quarter of 2017.
Our effective tax rate in 2017 was favorably impacted by a tax benefit of $1,277 million related to the Canada disposition. This tax benefit was primarily associated with a deferred tax recovery related to the Canadian capital gains exclusion component of the 2017 Canada disposition and the recognition of previously unrealizable Canadian capital asset tax basis. The Canada disposition, along with the associated restructuring of our Canadian operations, may generate an additional tax benefit of $822 million. However, since we believe it is not likely we will receive a corresponding cash tax savings, this $822 million benefit has been offset by a full tax reserve. See Note 4-Assets Held for Sale, Sold or Acquired for additional information on our Canada disposition.
The impairment of our APLNG investment in the second quarter of 2017 did not generate a tax benefit. See the "APLNG" section of Note 5-Investments, Loans and Long-Term Receivables, for information on the impairment of our APLNG investment.
The decrease in the effective tax rate for 2016 was primarily due to our mix of income among taxing jurisdictions, reduced net tax benefit from the tax law changes discussed below, and the absence of a tax benefit associated with electing the fair market value method of apportioning interest expense for prior years.
In the United Kingdom, legislation was enacted on September 15, 2016, to decrease the overall U.K. upstream corporation tax rate from 50 percent to 40 percent effective January 1, 2016. As a result, we recorded a $161 million net tax benefit related to the remeasurement of our U.K. deferred tax balance in 2016.
In the United Kingdom, legislation was enacted on March 26, 2015, to decrease the overall U.K. upstream corporation tax rate from 62 percent to 50 percent effective January 1, 2015. As a result, we recorded a $555 million net tax benefit related to the remeasurement of our U.K. deferred tax balance in 2015.
In Canada, legislation was enacted on June 29, 2015, to increase the overall Canadian corporation tax rate from 25 percent to 27 percent effective July 1, 2015. As a result, we recorded a $129 million net tax expense related to the remeasurement of our Canadian deferred tax balance in 2015.
In December 2015, we filed refund claims for prior years electing the fair market value method of apportioning interest in the United States. As a result, we recorded a $185 million tax benefit associated with these refund claims in 2015.
Certain operating losses in jurisdictions outside of the U.S. only yield a tax benefit in the U.S. as a worthless security deduction. For 2017, 2016 and 2015 the amount of the tax benefit was $962 million, $60 million and $491 million, respectively.
131
Note 19-Accumulated Other Comprehensive Loss
Accumulated other comprehensive loss in the equity section of the balance sheet included:
| Millions of Dollars | ||||||||||||||||
|
| |||||||||||||||
Defined Benefit Plans | Net Unrealized Loss on Securities | Foreign Currency Translation | Accumulated Other Comprehensive Loss | |||||||||||||
|
| |||||||||||||||
December 31, 2014 | $ | (1,261) | - | (641) | (1,902) | |||||||||||
Other comprehensive income (loss) | 818 | - | (5,163) | (4,345) | ||||||||||||
| ||||||||||||||||
December 31, 2015 | (443) | - | (5,804) | (6,247) | ||||||||||||
Other comprehensive income (loss) | (104) | - | 158 | 54 | ||||||||||||
| ||||||||||||||||
December 31, 2016 | (547) | - | (5,646) | (6,193) | ||||||||||||
Other comprehensive income (loss) | 147 | (58) | 586 | 675 | ||||||||||||
| ||||||||||||||||
December 31, 2017 | $ | (400) | (58) | (5,060) | (5,518) | |||||||||||
| ||||||||||||||||
There were no items within accumulated other comprehensive loss related to noncontrolling interests.
The following table summarizes reclassifications out of accumulated other comprehensive loss during the years ended December 31:
| Millions of Dollars | ||||||||
|
| |||||||
| 2017 | 2016 | |||||||
|
| |||||||
Defined Benefit Plans | $ | 135 | 179 | |||||
| ||||||||
| Above amounts are included in the computation of net periodic benefit cost and are presented net of tax expense of: | $ | 74 | 95 | |||||
See Note 17-Employee Benefit Plans, for additional information.
Note 20-Cash Flow Information
| Millions of Dollars | ||||||||||||
|
| |||||||||||
| 2017 | 2016 | 2015 | ||||||||||
|
| |||||||||||
Noncash Investing Activities | ||||||||||||
Increase (decrease) in PP&E related to an increase (decrease) in asset retirement obligations | $ | (37 | ) | (1,017 | ) | 402 | ||||||
| ||||||||||||
Cash Payments (Receipts) | ||||||||||||
Interest | $ | 1,163 | 1,151 | 920 | ||||||||
Income taxes | 1,168 | (318 | )* | 523 | * | |||||||
| ||||||||||||
Net Sales (Purchases) of Short-Term Investments | ||||||||||||
Short-term investments purchased | $ | (6,617 | ) | (1,753 | ) | - | ||||||
Short-term investments sold | 4,827 | 1,702 | - | |||||||||
| ||||||||||||
| $ | (1,790 | ) | (51 | ) | - | |||||||
| ||||||||||||
*Net of $585 million and $642 million in 2016 and 2015, respectively, related to refunds received from the Internal Revenue Service.
132
Note 21-Other Financial Information
| Millions of Dollars | ||||||||||||
|
| |||||||||||
| 2017 | 2016 | 2015 | ||||||||||
|
| |||||||||||
Interest and Debt Expense | ||||||||||||
Incurred | ||||||||||||
Debt | $ | 1,114 | 1,279 | 1,130 | ||||||||
Other | 103 | 123 | 84 | |||||||||
| ||||||||||||
| 1,217 | 1,402 | 1,214 | ||||||||||
Capitalized | (119 | ) | (157 | ) | (294 | ) | ||||||
| ||||||||||||
Expensed | $ | 1,098 | 1,245 | 920 | ||||||||
| ||||||||||||
Other Income | ||||||||||||
Interest income | $ | 112 | 57 | 45 | ||||||||
Other, net | 417 | 198 | 80 | |||||||||
| ||||||||||||
| $ | 529 | 255 | 125 | |||||||||
| ||||||||||||
Research and Development Expenditures -expensed | $ | 100 | 116 | 222 | ||||||||
| ||||||||||||
Shipping and Handling Costs* | $ | 1,058 | 1,139 | 1,181 | ||||||||
| ||||||||||||
| *Amounts included in production and operating expenses. | ||||||||||||
Foreign Currency Transaction (Gains) Losses -after-tax | ||||||||||||
Alaska | $ | - | - | - | ||||||||
Lower 48 | - | - | - | |||||||||
Canada | 3 | 1 | - | |||||||||
Europe and North Africa | 7 | (7 | ) | (22 | ) | |||||||
Asia Pacific and Middle East | 23 | (9 | ) | (78 | ) | |||||||
Other International | 1 | 7 | (9 | ) | ||||||||
Corporate and Other | (3 | ) | (18 | ) | 45 | |||||||
| ||||||||||||
| $ | 31 | (26 | ) | (64 | ) | |||||||
| ||||||||||||
| Millions of Dollars | ||||||||
|
| |||||||
| 2017 | 2016 | |||||||
|
| |||||||
Properties, Plants and Equipment | ||||||||
Proved properties | $ | 102,044 | 119,970 | |||||
Unproved properties | 4,491 | 5,150 | ||||||
Other | 3,896 | 6,286 | ||||||
| ||||||||
Gross properties, plants and equipment | 110,431 | 131,406 | ||||||
Less: Accumulated depreciation, depletion and amortization | (64,748 | ) | (73,075 | ) | ||||
| ||||||||
Net properties, plants and equipment | $ | 45,683 | 58,331 | |||||
| ||||||||
133
Note 22-Related Party Transactions
Our related parties primarily include equity method investments and certain trusts for the benefit of employees.
Significant transactions with our equity affiliates were:
| Millions of Dollars | ||||||||||||
|
| |||||||||||
| 2017 | 2016 | 2015 | ||||||||||
|
| |||||||||||
Operating revenues and other income | $ | 107 | 133 | 118 | ||||||||
Purchases | 99 | 101 | 97 | |||||||||
Operating expenses and selling, general and administrative expenses | 59 | 63 | 62 | |||||||||
Net interest (income) expense* | (13 | ) | (12 | ) | (9 | ) | ||||||
| ||||||||||||
*We paid interest to, or received interest from, various affiliates. See Note 5-Investments, Loans and Long-Term Receivables, for additional information on loans to affiliated companies.
The table above includes transactions with the FCCL Partnership through the date of the sale. See Note 5-Investments, Loans and Long-Term Receivables, for additional information.
Note 23-Segment Disclosures and Related Information
We explore for, produce, transport and market crude oil, bitumen, natural gas, LNG and natural gas liquids on a worldwide basis. We manage our operations through six operating segments, which are primarily defined by geographic region: Alaska, Lower 48, Canada, Europe and North Africa, Asia Pacific and Middle East, and Other International.
Corporate and Other represents costs not directly associated with an operating segment, such as most interest expense, premiums on early retirement of debt, corporate overhead and certain technology activities, including licensing revenues. Corporate assets include all cash and cash equivalents and short-term investments.
We evaluate performance and allocate resources based on net income (loss) attributable to ConocoPhillips. Segment accounting policies are the same as those in Note 1-Accounting Policies. Intersegment sales are at prices that approximate market.
134
Analysis of Results by Operating Segment
| Millions of Dollars | ||||||||||||
|
| |||||||||||
| 2017 | 2016 | 2015 | ||||||||||
|
| |||||||||||
Sales and Other Operating Revenues | ||||||||||||
Alaska | $ | 4,224 | 3,681 | 4,351 | ||||||||
| ||||||||||||
Lower 48 | 12,968 | 10,719 | 11,976 | |||||||||
Intersegment eliminations | (4) | (17) | (63) | |||||||||
| ||||||||||||
Lower 48 | 12,964 | 10,702 | 11,913 | |||||||||
| ||||||||||||
Canada | 3,178 | 2,192 | 2,454 | |||||||||
Intersegment eliminations | (559) | (218) | (318) | |||||||||
| ||||||||||||
Canada | 2,619 | 1,974 | 2,136 | |||||||||
| ||||||||||||
Europe and North Africa | 5,181 | 3,462 | 6,110 | |||||||||
Intersegment eliminations | - | - | (4) | |||||||||
| ||||||||||||
Europe and North Africa | 5,181 | 3,462 | 6,106 | |||||||||
| ||||||||||||
Asia Pacific and Middle East | 4,014 | 3,705 | 4,746 | |||||||||
Intersegment eliminations | - | - | (1) | |||||||||
| ||||||||||||
Asia Pacific and Middle East | 4,014 | 3,705 | 4,745 | |||||||||
| ||||||||||||
Other International | - | - | 1 | |||||||||
Corporate and Other | 104 | 169 | 312 | |||||||||
| ||||||||||||
Consolidated sales and other operating revenues | $ | 29,106 | 23,693 | 29,564 | ||||||||
| ||||||||||||
Depreciation, Depletion, Amortization and Impairments | ||||||||||||
Alaska | $ | 1,026 | 868 | 690 | ||||||||
Lower 48 | 6,693 | 4,358 | 4,227 | |||||||||
Canada | 461 | 975 | 788 | |||||||||
Europe and North Africa | 1,313 | 1,253 | 2,565 | |||||||||
Asia Pacific and Middle East | 3,819 | 1,606 | 2,981 | |||||||||
Other International | - | 1 | - | |||||||||
Corporate and Other | 134 | 140 | 107 | |||||||||
| ||||||||||||
Consolidated depreciation, depletion, amortization and impairments | $ | 13,446 | 9,201 | 11,358 | ||||||||
| ||||||||||||
In 2017, sales by our Lower 48, Alaska and Canada segments to a certain refining company accounted for approximately $3 billion or 11 percent of our total consolidated sales and other operating revenues.
135
| Millions of Dollars | ||||||||||||
|
| |||||||||||
| 2017 | 2016 | 2015 | ||||||||||
|
| |||||||||||
Equity in Earnings of Affiliates | ||||||||||||
Alaska | $ | 7 | 9 | 4 | ||||||||
Lower 48 | 5 | (6 | ) | (5 | ) | |||||||
Canada | 197 | 89 | 78 | |||||||||
Europe and North Africa | 10 | 22 | 23 | |||||||||
Asia Pacific and Middle East | 553 | (51 | ) | 550 | ||||||||
Other International | - | - | 8 | |||||||||
Corporate and Other | - | (11 | ) | (3 | ) | |||||||
| ||||||||||||
Consolidated equity in earnings of affiliates | $ | 772 | 52 | 655 | ||||||||
| ||||||||||||
Income Taxes | ||||||||||||
Alaska | $ | (689 | ) | (59 | ) | (71 | ) | |||||
Lower 48 | (2,453 | ) | (1,328 | ) | (1,119 | ) | ||||||
Canada | (616 | ) | (383 | ) | (223 | ) | ||||||
Europe and North Africa | 1,165 | (46 | ) | (854 | ) | |||||||
Asia Pacific and Middle East | 351 | 306 | 467 | |||||||||
Other International | 21 | (40 | ) | (456 | ) | |||||||
Corporate and Other | 399 | (421 | ) | (612 | ) | |||||||
| ||||||||||||
Consolidated income taxes | $ | (1,822 | ) | (1,971 | ) | (2,868 | ) | |||||
| ||||||||||||
Net Income (Loss) Attributable to ConocoPhillips | ||||||||||||
Alaska | $ | 1,466 | 319 | 4 | ||||||||
Lower 48 | (2,371 | ) | (2,257 | ) | (1,932 | ) | ||||||
Canada | 2,564 | (935 | ) | (1,044 | ) | |||||||
Europe and North Africa | 553 | 394 | 409 | |||||||||
Asia Pacific and Middle East | (1,098 | ) | 209 | (463 | ) | |||||||
Other International | 167 | (16 | ) | (593 | ) | |||||||
Corporate and Other | (2,136 | ) | (1,329 | ) | (809 | ) | ||||||
| ||||||||||||
Consolidated net loss attributable to ConocoPhillips | $ | (855 | ) | (3,615 | ) | (4,428 | ) | |||||
| ||||||||||||
Investments In and Advances To Affiliates | ||||||||||||
Alaska | $ | 56 | 58 | 61 | ||||||||
Lower 48 | 402 | 426 | 455 | |||||||||
Canada | - | 8,784 | 8,165 | |||||||||
Europe and North Africa | 55 | 62 | 70 | |||||||||
Asia Pacific and Middle East | 9,077 | 11,611 | 11,780 | |||||||||
Other International | - | - | - | |||||||||
Corporate and Other | - | 4 | 15 | |||||||||
| ||||||||||||
Consolidated investments in and advances to affiliates | $ | 9,590 | 20,945 | 20,546 | ||||||||
| ||||||||||||
136
| Millions of Dollars | ||||||||||||
|
| |||||||||||
| 2017 | 2016 | 2015 | ||||||||||
|
| |||||||||||
Total Assets | ||||||||||||
Alaska | $ | 12,108 | 12,314 | 12,555 | ||||||||
Lower 48 | 14,632 | 22,673 | 26,932 | |||||||||
Canada | 6,214 | 17,548 | 17,221 | |||||||||
Europe and North Africa | 11,870 | 11,727 | 13,703 | |||||||||
Asia Pacific and Middle East | 16,985 | 20,451 | 22,318 | |||||||||
Other International | 97 | 97 | 282 | |||||||||
Corporate and Other | 11,456 | 4,962 | 4,473 | |||||||||
| ||||||||||||
Consolidated total assets | $ | 73,362 | 89,772 | 97,484 | ||||||||
| ||||||||||||
Capital Expenditures and Investments | ||||||||||||
Alaska | $ | 815 | 883 | 1,352 | ||||||||
Lower 48 | 2,136 | 1,262 | 3,765 | |||||||||
Canada | 202 | 698 | 1,255 | |||||||||
Europe and North Africa | 872 | 1,020 | 1,573 | |||||||||
Asia Pacific and Middle East | 482 | 838 | 1,812 | |||||||||
Other International | 21 | 104 | 173 | |||||||||
Corporate and Other | 63 | 64 | 120 | |||||||||
| ||||||||||||
Consolidated capital expenditures and investments | $ | 4,591 | 4,869 | 10,050 | ||||||||
| ||||||||||||
Interest Income and Expense | ||||||||||||
Interest income | ||||||||||||
Corporate | $ | 101 | 47 | 36 | ||||||||
Lower 48 | - | - | - | |||||||||
Europe and North Africa | 2 | 2 | 2 | |||||||||
Asia Pacific and Middle East | 9 | 8 | 6 | |||||||||
Other International | - | - | 1 | |||||||||
| ||||||||||||
Interest and debt expense | ||||||||||||
Corporate | $ | 1,098 | 1,245 | 920 | ||||||||
| ||||||||||||
Sales and Other Operating Revenues by Product | ||||||||||||
Crude oil | $ | 13,260 | 10,801 | 12,830 | ||||||||
Natural gas | 10,773 | 9,401 | 11,888 | |||||||||
Natural gas liquids | 1,102 | 837 | 952 | |||||||||
Other* | 3,971 | 2,654 | 3,894 | |||||||||
| ||||||||||||
Consolidated sales and other operating revenues by product | $ | 29,106 | 23,693 | 29,564 | ||||||||
| ||||||||||||
*Includes LNG and bitumen.
137
Geographic Information
| Millions of Dollars | ||||||||||||||||||||||||||||
|
| |||||||||||||||||||||||||||
| Sales and Other Operating Revenues (1) | Long-Lived Assets (2) | |||||||||||||||||||||||||||
|
|
|
| |||||||||||||||||||||||||
| 2017 | 2016 | 2015 | 2017 | 2016 | 2015 | |||||||||||||||||||||||
|
|
|
| |||||||||||||||||||||||||
United States | $ | 17,204 | 14,400 | 16,284 | 23,623 | 32,949 | 37,445 | |||||||||||||||||||||
Australia (3) | 1,448 | 1,353 | 2,127 | 9,657 | 12,259 | 12,788 | ||||||||||||||||||||||
Canada | 2,619 | 1,974 | 2,136 | 5,613 | 16,846 | 16,766 | ||||||||||||||||||||||
China | 712 | 551 | 782 | 1,275 | 1,372 | 1,647 | ||||||||||||||||||||||
Indonesia | 757 | 938 | 1,165 | 758 | 856 | 1,191 | ||||||||||||||||||||||
Malaysia | 1,103 | 735 | 598 | 2,736 | 3,323 | 3,599 | ||||||||||||||||||||||
Norway | 2,348 | 1,645 | 2,107 | 6,154 | 6,228 | 6,933 | ||||||||||||||||||||||
United Kingdom | 2,248 | 1,816 | 4,005 | 3,335 | 3,209 | 4,154 | ||||||||||||||||||||||
Other foreign countries | 667 | 281 | 360 | 2,122 | 2,234 | 2,469 | ||||||||||||||||||||||
| ||||||||||||||||||||||||||||
Worldwide consolidated | $ | 29,106 | 23,693 | 29,564 | 55,273 | 79,276 | 86,992 | |||||||||||||||||||||
| ||||||||||||||||||||||||||||
(1)Sales and other operating revenues are attributable to countries based on the location of the selling operation.
(2)Defined as net PP&E plus investments in and advances to affiliated companies.
(3)Includes amounts related to the joint petroleum development area with shared ownership held by Australia and Timor-Leste.
Note 24-New Accounting Standards
In May 2014, the FASB issued Accounting Standards Update (ASU) No. 2014-09, "Revenue from Contracts with Customers" (ASU No. 2014-09), which outlines a single comprehensive model for entities to use in accounting for revenue arising from contracts with customers. This ASU supersedes the revenue recognition requirements in FASB ASC Topic 605, "Revenue Recognition," and most industry-specific guidance. This ASU sets forth a five-step model for determining when and how revenue is recognized. Under the model, an entity will be required to recognize revenue to depict the transfer of goods or services to a customer at an amount reflecting the consideration it expects to receive in exchange for those goods or services. Additional disclosures will be required to describe the nature, amount, timing and uncertainty of revenue and cash flows arising from customer contracts.
In August 2015, the FASB issued ASU No. 2015-14, "Deferral of the Effective Date," which defers the effective date of ASU No. 2014-09. The ASU is now effective for interim and annual periods beginning after December 15, 2017. Early adoption is permitted for interim and annual periods beginning after December 15, 2016. Entities may choose to adopt the standard using either a full retrospective approach or a modified retrospective approach.
ASU No. 2014-09 was amended in March 2016 by the provisions of ASU No. 2016-08, "Principal versus Agent Considerations (Reporting Revenue Gross versus Net)," in April 2016 by the provisions of ASU No. 2016-10, "Identifying Performance Obligations and Licensing," in May 2016 by the provisions of ASU No. 2016-12, "Narrow-Scope Improvements and Practical Expedients," and in December 2016 by the provisions of ASU No. 2016-20, "Technical Corrections and Improvements to Topic 606, Revenue From Contracts With Customers."
We will adopt the provisions of ASU No. 2014-09, as amended, with effect from January 1, 2018, and have elected not to early adopt the standard. We will adopt the new standard using the modified retrospective approach which we will apply only to contracts within the scope of the standard that are not complete at the date of initial application. Under this approach, we will apply the guidance retrospectively only to the most current period presented in the financial statements. The impact to our financial statements is immaterial but will include a cumulative effect reduction of $220 million to retained earnings from initially applying the new revenue standard relating to licensing revenues previously recognized. Under the new revenue standard licensing revenue will be recognized when the customer can utilize and benefit from their right to use the license.
138
In January 2016, the FASB issued ASU No. 2016-01, "Recognition and Measurement of Financial Assets and Financial Liabilities" (ASU No. 2016-01), to meet its objective of providing more decision-useful information about financial instruments. The ASU, among other things, requires entities to record the changes in fair value of equity investments, other than investments accounted for using the equity method, within net income. Under this ASU, entities will no longer be able to recognize unrealized holding gains and losses on available-for-sale securities in other comprehensive income. The ASU also requires additional disclosures relating to fair value measurement categories for financial assets and liabilities and eliminates certain disclosure requirements related to financial instruments measured at amortized cost. ASU No. 2016-01 is effective for interim and annual periods beginning after December 15, 2017, and the ASU should be adopted using a cumulative-effect adjustment to retained earnings as of the date of adoption.
Upon adoption of the standard, we will make a cumulative-effect adjustment to reclassify the accumulated unrealized holding gains and losses of $58 million related to our investment in Cenovus Energy from other comprehensive income to retained earnings. From January 1, 2018, we will begin reporting the changes in the fair value of our investment within net income. For additional information on our investment in Cenovus Energy, see Note 6-Investment in Cenovus Energy, Note 14-Fair Value Measurement, and Note 19 -Accumulated Other Comprehensive Loss.
In February 2016, the FASB issued ASU No. 2016-02, "Leases" (ASU No. 2016-02), which establishes comprehensive accounting and financial reporting requirements for leasing arrangements. This ASU supersedes the existing requirements in FASB ASC Topic 840, "Leases," and requires lessees to recognize substantially all lease assets and lease liabilities on the balance sheet. The provisions of ASU No. 2016-02 also modify the definition of a lease and outline requirements for recognition, measurement, presentation and disclosure of leasing arrangements by both lessees and lessors. The ASU is effective for interim and annual periods beginning after December 15, 2018, and early adoption of the standard is permitted. Entities are required to adopt the ASU using a modified retrospective approach, subject to certain optional practical expedients, and apply the provisions of ASU No. 2016-02 to leasing arrangements existing at or entered into after the earliest comparative period presented in the financial statements. In January 2018, ASU No. 2016-02 was amended by the provisions of ASU No. 2018-01, "Land Easement Practical Expedient for Transition to Topic 842." We plan to adopt ASU No. 2016-02, as amended, effective January 1, 2019, and continue to evaluate the ASU to determine the impact of adoption on our consolidated financial statements and disclosures, accounting policies and systems, business processes, and internal controls. We also continue to monitor proposals issued by the FASB to clarify the ASU and certain industry implementation issues. While our evaluation of ASU No. 2016-02 and related implementation activities are ongoing, we expect the adoption of the ASU to have a material impact on our consolidated financial statements and disclosures.
In June 2016, the FASB issued ASU No. 2016-13, "Measurement of Credit Losses on Financial Instruments" (ASU No. 2016-13), which sets forth the current expected credit loss model, a new forward-looking impairment model for certain financial instruments based on expected losses rather than incurred losses. The ASU is effective for interim and annual periods beginning after December 15, 2019, and early adoption of the standard is permitted. Entities are required to adopt ASU No. 2016-13 using a modified retrospective approach, subject to certain limited exceptions. We are currently evaluating the impact of the adoption of this ASU.
139
Oil and Gas Operations (Unaudited)
In accordance with Financial Accounting Standards Board (FASB) Accounting Standards Codification Topic 932, "Extractive Activities-Oil and Gas," and regulations of the U.S. Securities and Exchange Commission (SEC), we are making certain supplemental disclosures about our oil and gas exploration and production operations.
These disclosures include information about our consolidated oil and gas activities and our proportionate share of our equity affiliates' oil and gas activities in our operating segments. As a result, amounts reported as equity affiliates in Oil and Gas Operations may differ from those shown in the individual segment disclosures reported elsewhere in this report.
As required by current authoritative guidelines, the estimated future date when an asset will be permanently shut down for economic reasons is based on historical 12-month first-of-month average prices and current costs. This estimated date when production will end affects the amount of estimated reserves. Therefore, as prices and cost levels change from year to year, the estimate of proved reserves also changes. Generally, our proved reserves decrease as prices decline and increase as prices rise.
Our proved reserves include estimated quantities related to production sharing contracts (PSCs), which are reported under the "economic interest" method, as well as variable-royalty regimes, and are subject to fluctuations in commodity prices, recoverable operating expenses and capital costs. If costs remain stable, reserve quantities attributable to recovery of costs will change inversely to changes in commodity prices. For example, if prices increase, then our applicable reserve quantities would decline. At December 31, 2017, approximately 8 percent of our total proved reserves were under PSCs, located in our Asia Pacific/Middle East geographic reporting area, and 5 percent of our total proved reserves were under a variable-royalty regime, located in our Canada geographic reporting area.
Our reserves disclosures by geographic area include the United States, Canada, Europe (Norway and the United Kingdom), Asia Pacific/Middle East, Africa and Other Areas. Other Areas primarily consists of Russia, which we exited in 2015.
Reserves Governance
The recording and reporting of proved reserves are governed by criteria established by regulations of the SEC and FASB. Proved reserves are those quantities of oil and gas, which, by analysis of geoscience and engineering data, can be estimated with reasonable certainty to be economically producible-from a given date forward, from known reservoirs, and under existing economic conditions, operating methods, and government regulations-prior to the time at which contracts providing the right to operate expire, unless evidence indicates renewal is reasonably certain, regardless of whether deterministic or probabilistic methods are used for the estimation. The project to extract the hydrocarbons must have commenced or the operator must be reasonably certain it will commence the project within a reasonable time.
Proved reserves are further classified as either developed or undeveloped. Proved developed reserves are proved reserves that can be expected to be recovered through existing wells with existing equipment and operating methods, or in which the cost of the required equipment is relatively minor compared with the cost of a new well, and through installed extraction equipment and infrastructure operational at the time of the reserves estimate if the extraction is by means not involving a well. Proved undeveloped reserves are proved reserves expected to be recovered from new wells on undrilled acreage, or from existing wells where a relatively major expenditure is required for recompletion.
We have a companywide, comprehensive, SEC-compliant internal policy that governs the determination and reporting of proved reserves. This policy is applied by the geoscientists and reservoir engineers in our
140
business units around the world. As part of our internal control process, each business unit's reserves processes and controls are reviewed annually by an internal team which is headed by the company's Manager of Reserves Compliance and Reporting. This team, composed of internal reservoir engineers, geoscientists, finance personnel and a senior representative from DeGolyer and MacNaughton (D&M), a third-party petroleum engineering consulting firm, reviews the business units' reserves for adherence to SEC guidelines and company policy through on-site visits, teleconferences and review of documentation. In addition to providing independent reviews, this internal team also ensures reserves are calculated using consistent and appropriate standards and procedures. This team is independent of business unit line management and is responsible for reporting its findings to senior management. The team is responsible for communicating our reserves policy and procedures and is available for internal peer reviews and consultation on major projects or technical issues throughout the year. All of our proved reserves held by consolidated companies and our share of equity affiliates have been estimated by ConocoPhillips.
During 2017, our processes and controls used to assess over 90 percent of proved reserves as of December 31, 2017, were reviewed by D&M. The purpose of their review was to assess whether the adequacy and effectiveness of our internal processes and controls used to determine estimates of proved reserves are in accordance with SEC regulations. In such review, ConocoPhillips' technical staff presented D&M with an overview of the reserves data, as well as the methods and assumptions used in estimating reserves. The data presented included pertinent seismic information, geologic maps, well logs, production tests, material balance calculations, reservoir simulation models, well performance data, operating procedures and relevant economic criteria. Management's intent in retaining D&M to review its processes and controls was to provide objective third-party input on these processes and controls. D&M's opinion was the general processes and controls employed by ConocoPhillips in estimating its December 31, 2017, proved reserves for the properties reviewed are in accordance with the SEC reserves definitions. D&M's report is included as Exhibit 99 of this Annual Report on Form 10-K.
The technical person primarily responsible for overseeing the processes and internal controls used in the preparation of the company's reserves estimates is the Manager of Reserves Compliance and Reporting. This individual holds a master's degree in petroleum engineering. He is a member of the Society of Petroleum Engineers with over 25 years of oil and gas industry experience and has held positions of increasing responsibility in reservoir engineering, subsurface and asset management in the United States and several international field locations.
Engineering estimates of the quantities of proved reserves are inherently imprecise. See the "Critical Accounting Estimates" section of Management's Discussion and Analysis of Financial Condition and Results of Operations for additional discussion of the sensitivities surrounding these estimates.
141
Proved Reserves
| Years Ended | Crude Oil | |||||||||||||||||||||||||||||||||||
| December 31 | Millions of Barrels | |||||||||||||||||||||||||||||||||||
| Alaska | Lower 48 | Total U.S. | Canada | Europe | Asia Pacific/ Middle East | Africa | Other Areas | Total | ||||||||||||||||||||||||||||
|
| |||||||||||||||||||||||||||||||||||
Developed and Undeveloped | ||||||||||||||||||||||||||||||||||||
Consolidated operations | ||||||||||||||||||||||||||||||||||||
End of 2014 | 1,063 | 676 | 1,739 | 24 | 411 | 227 | 204 | - | 2,605 | |||||||||||||||||||||||||||
Revisions | (115 | ) | (69 | ) | (184 | ) | - | (21 | ) | (29 | ) | - | - | (234 | ) | |||||||||||||||||||||
Improved recovery | 4 | 4 | 8 | 1 | - | 31 | - | - | 40 | |||||||||||||||||||||||||||
Purchases | - | - | - | - | - | - | - | - | - | |||||||||||||||||||||||||||
Extensions and discoveries | 20 | 57 | 77 | 1 | - | 7 | - | - | 85 | |||||||||||||||||||||||||||
Production | (57 | ) | (78 | ) | (135 | ) | (4 | ) | (44 | ) | (33 | ) | - | - | (216 | ) | ||||||||||||||||||||
Sales | - | (2 | ) | (2 | ) | (8 | ) | - | - | - | - | (10 | ) | |||||||||||||||||||||||
| ||||||||||||||||||||||||||||||||||||
End of 2015 | 915 | 588 | 1,503 | 14 | 346 | 203 | 204 | - | 2,270 | |||||||||||||||||||||||||||
Revisions | (57 | ) | (93 | ) | (150 | ) | 3 | - | 6 | - | - | (141 | ) | |||||||||||||||||||||||
Improved recovery | 6 | 3 | 9 | - | - | 7 | - | - | 16 | |||||||||||||||||||||||||||
Purchases | - | - | - | - | - | - | - | - | - | |||||||||||||||||||||||||||
Extensions and discoveries | 33 | 79 | 112 | - | - | 7 | - | - | 119 | |||||||||||||||||||||||||||
Production | (60 | ) | (71 | ) | (131 | ) | (3 | ) | (43 | ) | (35 | ) | (1 | ) | - | (213 | ) | |||||||||||||||||||
Sales | - | - | - | (1 | ) | - | (3 | ) | - | - | (4 | ) | ||||||||||||||||||||||||
| ||||||||||||||||||||||||||||||||||||
End of 2016 | 837 | 506 | 1,343 | 13 | 303 | 185 | 203 | - | 2,047 | |||||||||||||||||||||||||||
Revisions | 113 | 65 | 178 | 1 | 38 | 32 | - | - | 249 | |||||||||||||||||||||||||||
Improved recovery | 6 | - | 6 | - | - | - | - | - | 6 | |||||||||||||||||||||||||||
Purchases | - | - | - | - | - | - | - | - | - | |||||||||||||||||||||||||||
Extensions and discoveries | 41 | 210 | 251 | - | - | 2 | - | - | 253 | |||||||||||||||||||||||||||
Production | (60 | ) | (64 | ) | (124 | ) | (1 | ) | (45 | ) | (34 | ) | (7 | ) | - | (211 | ) | |||||||||||||||||||
Sales | - | (10 | ) | (10 | ) | (12 | ) | - | - | - | - | (22 | ) | |||||||||||||||||||||||
| ||||||||||||||||||||||||||||||||||||
End of 2017 | 937 | 707 | 1,644 | 1 | 296 | 185 | 196 | - | 2,322 | |||||||||||||||||||||||||||
| ||||||||||||||||||||||||||||||||||||
Equity affiliates | ||||||||||||||||||||||||||||||||||||
End of 2014 | - | - | - | - | - | 98 | - | 5 | 103 | |||||||||||||||||||||||||||
Revisions | - | - | - | - | - | - | - | - | - | |||||||||||||||||||||||||||
Improved recovery | - | - | - | - | - | - | - | - | - | |||||||||||||||||||||||||||
Purchases | - | - | - | - | - | - | - | - | - | |||||||||||||||||||||||||||
Extensions and discoveries | - | - | - | - | - | - | - | - | - | |||||||||||||||||||||||||||
Production | - | - | - | - | - | (5 | ) | - | (1 | ) | (6 | ) | ||||||||||||||||||||||||
Sales | - | - | - | - | - | - | - | (4 | ) | (4 | ) | |||||||||||||||||||||||||
| ||||||||||||||||||||||||||||||||||||
End of 2015 | - | - | - | - | - | 93 | - | - | 93 | |||||||||||||||||||||||||||
Revisions | - | - | - | - | - | - | - | - | - | |||||||||||||||||||||||||||
Improved recovery | - | - | - | - | - | - | - | - | - | |||||||||||||||||||||||||||
Purchases | - | - | - | - | - | - | - | - | - | |||||||||||||||||||||||||||
Extensions and discoveries | - | - | - | - | - | - | - | - | - | |||||||||||||||||||||||||||
Production | - | - | - | - | - | (5 | ) | - | - | (5 | ) | |||||||||||||||||||||||||
Sales | - | - | - | - | - | - | - | - | - | |||||||||||||||||||||||||||
| ||||||||||||||||||||||||||||||||||||
End of 2016 | - | - | - | - | - | 88 | - | - | 88 | |||||||||||||||||||||||||||
Revisions | - | - | - | - | - | - | - | - | - | |||||||||||||||||||||||||||
Improved recovery | - | - | - | - | - | - | - | - | - | |||||||||||||||||||||||||||
Purchases | - | - | - | - | - | - | - | - | - | |||||||||||||||||||||||||||
Extensions and discoveries | - | - | - | - | - | - | - | - | - | |||||||||||||||||||||||||||
Production | - | - | - | - | - | (5 | ) | - | - | (5 | ) | |||||||||||||||||||||||||
Sales | - | - | - | - | - | - | - | - | - | |||||||||||||||||||||||||||
| ||||||||||||||||||||||||||||||||||||
End of 2017 | - | - | - | - | - | 83 | - | - | 83 | |||||||||||||||||||||||||||
| ||||||||||||||||||||||||||||||||||||
Total company | ||||||||||||||||||||||||||||||||||||
End of 2014 | 1,063 | 676 | 1,739 | 24 | 411 | 325 | 204 | 5 | 2,708 | |||||||||||||||||||||||||||
End of 2015 | 915 | 588 | 1,503 | 14 | 346 | 296 | 204 | - | 2,363 | |||||||||||||||||||||||||||
End of 2016 | 837 | 506 | 1,343 | 13 | 303 | 273 | 203 | - | 2,135 | |||||||||||||||||||||||||||
End of 2017 | 937 | 707 | 1,644 | 1 | 296 | 268 | 196 | - | 2,405 | |||||||||||||||||||||||||||
| ||||||||||||||||||||||||||||||||||||
142
| Years Ended | Crude Oil | |||||||||||||||||||||||||||||||||||
| December 31 | Millions of Barrels | |||||||||||||||||||||||||||||||||||
| Alaska | Lower 48 | Total U.S. | Canada | Europe | Asia Pacific/ Middle East | Africa | Other Areas | Total | ||||||||||||||||||||||||||||
|
| |||||||||||||||||||||||||||||||||||
Developed | ||||||||||||||||||||||||||||||||||||
Consolidated operations | ||||||||||||||||||||||||||||||||||||
End of 2014 | 950 | 313 | 1,263 | 23 | 237 | 142 | 199 | - | 1,864 | |||||||||||||||||||||||||||
End of 2015 | 819 | 283 | 1,102 | 13 | 200 | 139 | 204 | - | 1,658 | |||||||||||||||||||||||||||
End of 2016 | 747 | 256 | 1,003 | 13 | 184 | 106 | 203 | - | 1,509 | |||||||||||||||||||||||||||
End of 2017 | 828 | 315 | 1,143 | 1 | 190 | 121 | 196 | - | 1,651 | |||||||||||||||||||||||||||
| ||||||||||||||||||||||||||||||||||||
Equity affiliates | ||||||||||||||||||||||||||||||||||||
End of 2014 | - | - | - | - | - | 98 | - | 5 | 103 | |||||||||||||||||||||||||||
End of 2015 | - | - | - | - | - | 93 | - | - | 93 | |||||||||||||||||||||||||||
End of 2016 | - | - | - | - | - | 88 | - | - | 88 | |||||||||||||||||||||||||||
End of 2017 | - | - | - | - | - | 83 | - | - | 83 | |||||||||||||||||||||||||||
| ||||||||||||||||||||||||||||||||||||
Undeveloped | ||||||||||||||||||||||||||||||||||||
Consolidated operations | ||||||||||||||||||||||||||||||||||||
End of 2014 | 113 | 363 | 476 | 1 | 174 | 85 | 5 | - | 741 | |||||||||||||||||||||||||||
End of 2015 | 96 | 305 | 401 | 1 | 146 | 64 | - | - | 612 | |||||||||||||||||||||||||||
End of 2016 | 90 | 250 | 340 | - | 119 | 79 | - | - | 538 | |||||||||||||||||||||||||||
End of 2017 | 109 | 392 | 501 | - | 106 | 64 | - | - | 671 | |||||||||||||||||||||||||||
| ||||||||||||||||||||||||||||||||||||
Equity affiliates | ||||||||||||||||||||||||||||||||||||
End of 2014 | - | - | - | - | - | - | - | - | - | |||||||||||||||||||||||||||
End of 2015 | - | - | - | - | - | - | - | - | - | |||||||||||||||||||||||||||
End of 2016 | - | - | - | - | - | - | - | - | - | |||||||||||||||||||||||||||
End of 2017 | - | - | - | - | - | - | - | - | - | |||||||||||||||||||||||||||
| ||||||||||||||||||||||||||||||||||||
Notable changes in proved crude oil reserves in the three years ended December 31, 2017, included:
| • | Revisions : In 2017, revisions in Alaska, Lower 48, Europe and Asia Pacific/Middle East were primarily due to higher prices. In 2016, revisions in Lower 48 and Alaska were primarily due to lower prices. In 2015, revisions in Alaska, Lower 48 and Asia Pacific/Middle East were primarily due to lower prices. |
| • | Extensions and discoveries : In 2017, extensions and discoveries in Lower 48 were primarily due to continued drilling success in the Permian Unconventional, Eagle Ford and Bakken. In 2016, extensions and discoveries in Alaska were primarily due to drilling success in the Western North Slope, and extensions and discoveries in Lower 48 were primarily due to continued drilling success in Eagle Ford and Bakken. |
| • | Sales : In 2017, Canada sales were due to the disposition of a majority of our western Canada assets. |
143
Years Ended | Natural Gas Liquids | |||||||||||||||||||||||||||
December 31 | Millions of Barrels | |||||||||||||||||||||||||||
| Alaska | Lower 48 | Total U.S. | Canada | Europe | Asia Pacific/ Middle East | Total | ||||||||||||||||||||||
Developed and Undeveloped | ||||||||||||||||||||||||||||
Consolidated operations | ||||||||||||||||||||||||||||
End of 2014 | 120 | 440 | 560 | 65 | 24 | 13 | 662 | |||||||||||||||||||||
Revisions | (1 | ) | (84 | ) | (85 | ) | (10 | ) | (1 | ) | (2 | ) | (98 | ) | ||||||||||||||
Improved recovery | - | - | - | - | - | - | - | |||||||||||||||||||||
Purchases | - | - | - | - | - | - | - | |||||||||||||||||||||
Extensions and discoveries | - | 10 | 10 | 2 | - | - | 12 | |||||||||||||||||||||
Production | (5 | ) | (36 | ) | (41 | ) | (9 | ) | (3 | ) | (3 | ) | (56 | ) | ||||||||||||||
Sales | - | (9 | ) | (9 | ) | (3 | ) | - | - | (12 | ) | |||||||||||||||||
End of 2015 | 114 | 321 | 435 | 45 | 20 | 8 | 508 | |||||||||||||||||||||
Revisions | (3 | ) | (29 | ) | (32 | ) | 9 | 2 | - | (21 | ) | |||||||||||||||||
Improved recovery | - | - | - | - | - | - | - | |||||||||||||||||||||
Purchases | - | - | - | - | - | - | - | |||||||||||||||||||||
Extensions and discoveries | - | 18 | 18 | 2 | - | - | 20 | |||||||||||||||||||||
Production | (4 | ) | (32 | ) | (36 | ) | (8 | ) | (3 | ) | (3 | ) | (50 | ) | ||||||||||||||
Sales | - | - | - | - | - | - | - | |||||||||||||||||||||
End of 2016 | 107 | 278 | 385 | 48 | 19 | 5 | 457 | |||||||||||||||||||||
Revisions | 4 | 29 | 33 | - | 2 | 1 | 36 | |||||||||||||||||||||
Improved recovery | - | - | - | - | - | - | - | |||||||||||||||||||||
Purchases | - | - | - | - | - | - | - | |||||||||||||||||||||
Extensions and discoveries | - | 71 | 71 | - | - | 1 | 72 | |||||||||||||||||||||
Production | (5 | ) | (24 | ) | (29 | ) | (3 | ) | (3 | ) | (2 | ) | (37 | ) | ||||||||||||||
Sales | - | (130 | ) | (130 | ) | (44 | ) | - | - | (174 | ) | |||||||||||||||||
End of 2017 | 106 | 224 | 330 | 1 | 18 | 5 | 354 | |||||||||||||||||||||
Equity affiliates | ||||||||||||||||||||||||||||
End of 2014 | - | - | - | - | - | 53 | 53 | |||||||||||||||||||||
Revisions | - | - | - | - | - | - | - | |||||||||||||||||||||
Improved recovery | - | - | - | - | - | - | - | |||||||||||||||||||||
Purchases | - | - | - | - | - | - | - | |||||||||||||||||||||
Extensions and discoveries | - | - | - | - | - | - | - | |||||||||||||||||||||
Production | - | - | - | - | - | (3 | ) | (3 | ) | |||||||||||||||||||
Sales | - | - | - | - | - | - | - | |||||||||||||||||||||
End of 2015 | - | - | - | - | - | 50 | 50 | |||||||||||||||||||||
Revisions | - | - | - | - | - | - | - | |||||||||||||||||||||
Improved recovery | - | - | - | - | - | - | - | |||||||||||||||||||||
Purchases | - | - | - | - | - | - | - | |||||||||||||||||||||
Extensions and discoveries | - | - | - | - | - | - | - | |||||||||||||||||||||
Production | - | - | - | - | - | (3 | ) | (3 | ) | |||||||||||||||||||
Sales | - | - | - | - | - | - | - | |||||||||||||||||||||
End of 2016 | - | - | - | - | - | 47 | 47 | |||||||||||||||||||||
Revisions | - | - | - | - | - | - | - | |||||||||||||||||||||
Improved recovery | - | - | - | - | - | - | - | |||||||||||||||||||||
Purchases | - | - | - | - | - | - | - | |||||||||||||||||||||
Extensions and discoveries | - | - | - | - | - | - | - | |||||||||||||||||||||
Production | - | - | - | - | - | (2 | ) | (2 | ) | |||||||||||||||||||
Sales | - | - | - | - | - | - | - | |||||||||||||||||||||
End of 2017 | - | - | - | - | - | 45 | 45 | |||||||||||||||||||||
Total company | ||||||||||||||||||||||||||||
End of 2014 | 120 | 440 | 560 | 65 | 24 | 66 | 715 | |||||||||||||||||||||
End of 2015 | 114 | 321 | 435 | 45 | 20 | 58 | 558 | |||||||||||||||||||||
End of 2016 | 107 | 278 | 385 | 48 | 19 | 52 | 504 | |||||||||||||||||||||
End of 2017 | 106 | 224 | 330 | 1 | 18 | 50 | 399 | |||||||||||||||||||||
144
| Years Ended | Natural Gas Liquids | |||||||||||||||||||||||||||
| December 31 | Millions of Barrels | |||||||||||||||||||||||||||
| Alaska | Lower 48 | Total U.S. | Canada | Europe | Asia Pacific/ Middle East | Total | ||||||||||||||||||||||
Developed | ||||||||||||||||||||||||||||
Consolidated operations | ||||||||||||||||||||||||||||
End of 2014 | 120 | 337 | 457 | 57 | 18 | 11 | 543 | |||||||||||||||||||||
End of 2015 | 114 | 235 | 349 | 45 | 16 | 8 | 418 | |||||||||||||||||||||
End of 2016 | 107 | 209 | 316 | 47 | 15 | 5 | 383 | |||||||||||||||||||||
End of 2017 | 106 | 101 | 207 | 1 | 16 | 2 | 226 | |||||||||||||||||||||
Equity affiliates | ||||||||||||||||||||||||||||
End of 2014 | - | - | - | - | - | 53 | 53 | |||||||||||||||||||||
End of 2015 | - | - | - | - | - | 50 | 50 | |||||||||||||||||||||
End of 2016 | - | - | - | - | - | 47 | 47 | |||||||||||||||||||||
End of 2017 | - | - | - | - | - | 45 | 45 | |||||||||||||||||||||
Undeveloped | ||||||||||||||||||||||||||||
Consolidated operations | ||||||||||||||||||||||||||||
End of 2014 | - | 103 | 103 | 8 | 6 | 2 | 119 | |||||||||||||||||||||
End of 2015 | - | 86 | 86 | - | 4 | - | 90 | |||||||||||||||||||||
End of 2016 | - | 69 | 69 | 1 | 4 | - | 74 | |||||||||||||||||||||
End of 2017 | - | 123 | 123 | - | 2 | 3 | 128 | |||||||||||||||||||||
Equity affiliates | ||||||||||||||||||||||||||||
End of 2014 | - | - | - | - | - | - | - | |||||||||||||||||||||
End of 2015 | - | - | - | - | - | - | - | |||||||||||||||||||||
End of 2016 | - | - | - | - | - | - | - | |||||||||||||||||||||
End of 2017 | - | - | - | - | - | - | - | |||||||||||||||||||||
Notable changes in proved natural gas liquids reserves in the three years ended December 31, 2017, included:
| • | Revisions : In 2017, revisions in Lower 48 were primarily due to higher prices. In 2015, revisions in Lower 48 and Canada were primarily due to lower prices. |
| • | Extensions and discoveries : In 2017, extensions and discoveries in Lower 48 were primarily due to continued drilling success in the Permian Unconventional, Eagle Ford and Bakken. |
| • | Sales : In 2017, Lower 48 sales were due to the disposition of our interests in the San Juan Basin and Panhandle assets, while Canada sales were due to the disposition of a majority of our western Canada assets. |
145
Years Ended | Natural Gas | |||||||||||||||||||||||||||||||
December 31 | Billions of Cubic Feet | |||||||||||||||||||||||||||||||
| Alaska | Lower 48 | Total U.S. | Canada | Europe | Asia Pacific/ Middle East | Africa | Total | |||||||||||||||||||||||||
Developed and Undeveloped | ||||||||||||||||||||||||||||||||
Consolidated operations | ||||||||||||||||||||||||||||||||
End of 2014 | 2,719 | 6,945 | 9,664 | 1,916 | 1,573 | 1,878 | 227 | 15,258 | ||||||||||||||||||||||||
Revisions | (293 | ) | (884 | ) | (1,177 | ) | (111 | ) | (27 | ) | 110 | - | (1,205) | |||||||||||||||||||
Improved recovery | - | - | - | 1 | - | 8 | - | 9 | ||||||||||||||||||||||||
Purchases | - | - | - | - | - | - | - | - | ||||||||||||||||||||||||
Extensions and discoveries | 4 | 103 | 107 | 44 | - | 2 | - | 153 | ||||||||||||||||||||||||
Production | (83 | ) | (588 | ) | (671 | ) | (261 | ) | (187 | ) | (285 | ) | - | (1,404) | ||||||||||||||||||
Sales | - | (405 | ) | (405 | ) | (482 | ) | - | - | - | (887) | |||||||||||||||||||||
End of 2015 | 2,347 | 5,171 | 7,518 | 1,107 | 1,359 | 1,713 | 227 | 11,924 | ||||||||||||||||||||||||
Revisions | (105 | ) | (124 | ) | (229 | ) | 111 | 56 | 18 | - | (44) | |||||||||||||||||||||
Improved recovery | - | - | - | - | - | 1 | - | 1 | ||||||||||||||||||||||||
Purchases | - | - | - | 1 | - | - | - | 1 | ||||||||||||||||||||||||
Extensions and discoveries | 2 | 162 | 164 | 43 | - | 124 | - | 331 | ||||||||||||||||||||||||
Production | (73 | ) | (494 | ) | (567 | ) | (192 | ) | (177 | ) | (288 | ) | - | (1,224) | ||||||||||||||||||
Sales | (69 | ) | (1 | ) | (70 | ) | (33 | ) | - | (42 | ) | - | (145) | |||||||||||||||||||
End of 2016 | 2,102 | 4,714 | 6,816 | 1,037 | 1,238 | 1,526 | 227 | 10,844 | ||||||||||||||||||||||||
Revisions | 287 | 460 | 747 | 8 | 167 | 16 | - | 938 | ||||||||||||||||||||||||
Improved recovery | - | - | - | - | - | - | - | - | ||||||||||||||||||||||||
Purchases | - | - | - | - | - | - | - | - | ||||||||||||||||||||||||
Extensions and discoveries | 2 | 582 | 584 | 3 | - | 23 | - | 610 | ||||||||||||||||||||||||
Production | (71 | ) | (338 | ) | (409 | ) | (71 | ) | (188 | ) | (267 | ) | (3 | ) | (938) | |||||||||||||||||
Sales | - | (2,885 | ) | (2,885 | ) | (966 | ) | - | - | - | (3,851) | |||||||||||||||||||||
End of 2017 | 2,320 | 2,533 | 4,853 | 11 | 1,217 | 1,298 | 224 | 7,603 | ||||||||||||||||||||||||
Equity affiliates | ||||||||||||||||||||||||||||||||
End of 2014 | - | - | - | - | - | 5,242 | - | 5,242 | ||||||||||||||||||||||||
Revisions | - | - | - | - | - | (2 | ) | - | (2) | |||||||||||||||||||||||
Improved recovery | - | - | - | - | - | - | - | - | ||||||||||||||||||||||||
Purchases | - | - | - | - | - | - | - | - | ||||||||||||||||||||||||
Extensions and discoveries | - | - | - | - | - | 268 | - | 268 | ||||||||||||||||||||||||
Production | - | - | - | - | - | (239 | ) | - | (239) | |||||||||||||||||||||||
Sales | - | - | - | - | - | - | - | - | ||||||||||||||||||||||||
End of 2015 | - | - | - | - | - | 5,269 | - | 5,269 | ||||||||||||||||||||||||
Revisions | - | - | - | - | - | (676 | ) | - | (676) | |||||||||||||||||||||||
Improved recovery | - | - | - | - | - | - | - | - | ||||||||||||||||||||||||
Purchases | - | - | - | - | - | - | - | - | ||||||||||||||||||||||||
Extensions and discoveries | - | - | - | - | - | 125 | - | 125 | ||||||||||||||||||||||||
Production | - | - | - | - | - | (337 | ) | - | (337) | |||||||||||||||||||||||
Sales | - | - | - | - | - | - | - | - | ||||||||||||||||||||||||
End of 2016 | - | - | - | - | - | 4,381 | - | 4,381 | ||||||||||||||||||||||||
Revisions | - | - | - | - | - | 111 | - | 111 | ||||||||||||||||||||||||
Improved recovery | - | - | - | - | - | - | - | - | ||||||||||||||||||||||||
Purchases | - | - | - | - | - | - | - | - | ||||||||||||||||||||||||
Extensions and discoveries | - | - | - | - | - | 185 | - | 185 | ||||||||||||||||||||||||
Production | - | - | - | - | - | (374 | ) | - | (374) | |||||||||||||||||||||||
Sales | - | - | - | - | - | - | - | - | ||||||||||||||||||||||||
End of 2017 | - | - | - | - | - | 4,303 | - | 4,303 | ||||||||||||||||||||||||
Total company | ||||||||||||||||||||||||||||||||
End of 2014 | 2,719 | 6,945 | 9,664 | 1,916 | 1,573 | 7,120 | 227 | 20,500 | ||||||||||||||||||||||||
End of 2015 | 2,347 | 5,171 | 7,518 | 1,107 | 1,359 | 6,982 | 227 | 17,193 | ||||||||||||||||||||||||
End of 2016 | 2,102 | 4,714 | 6,816 | 1,037 | 1,238 | 5,907 | 227 | 15,225 | ||||||||||||||||||||||||
End of 2017 | 2,320 | 2,533 | 4,853 | 11 | 1,217 | 5,601 | 224 | 11,906 | ||||||||||||||||||||||||
146
| Years Ended | Natural Gas | |||||||||||||||||||||||||||||||
| December 31 | Billions of Cubic Feet | |||||||||||||||||||||||||||||||
| Alaska | Lower 48 | Total U.S. | Canada | Europe | Asia Pacific/ Middle East | Africa | Total | |||||||||||||||||||||||||
Developed | ||||||||||||||||||||||||||||||||
Consolidated operations | ||||||||||||||||||||||||||||||||
End of 2014 | 2,663 | 5,922 | 8,585 | 1,801 | 1,182 | 1,553 | 226 | 13,347 | ||||||||||||||||||||||||
End of 2015 | 2,313 | 4,458 | 6,771 | 1,101 | 1,088 | 1,421 | 227 | 10,608 | ||||||||||||||||||||||||
End of 2016 | 2,094 | 4,199 | 6,293 | 1,031 | 998 | 1,188 | 227 | 9,737 | ||||||||||||||||||||||||
End of 2017 | 2,310 | 1,597 | 3,907 | 11 | 997 | 945 | 224 |
| 6,084 |
| ||||||||||||||||||||||
Equity affiliates | ||||||||||||||||||||||||||||||||
End of 2014 | - | - | - | - | - | 3,954 | - | 3,954 | ||||||||||||||||||||||||
End of 2015 | - | - | - | - | - | 4,482 | - | 4,482 | ||||||||||||||||||||||||
End of 2016 | - | - | - | - | - | 4,110 | - | 4,110 | ||||||||||||||||||||||||
End of 2017 | - | - | - | - | - | 4,044 | - | 4,044 | ||||||||||||||||||||||||
Undeveloped | ||||||||||||||||||||||||||||||||
Consolidated operations | ||||||||||||||||||||||||||||||||
End of 2014 | 56 | 1,023 | 1,079 | 115 | 391 | 325 | 1 | 1,911 | ||||||||||||||||||||||||
End of 2015 | 34 | 713 | 747 | 6 | 271 | 292 | - | 1,316 | ||||||||||||||||||||||||
End of 2016 | 8 | 515 | 523 | 6 | 240 | 338 | - | 1,107 | ||||||||||||||||||||||||
End of 2017 | 10 | 936 | 946 | - | 220 | 353 | - | 1,519 | ||||||||||||||||||||||||
Equity affiliates | ||||||||||||||||||||||||||||||||
End of 2014 | - | - | - | - | - | 1,288 | - | 1,288 | ||||||||||||||||||||||||
End of 2015 | - | - | - | - | - | 787 | - | 787 | ||||||||||||||||||||||||
End of 2016 | - | - | - | - | - | 271 | - | 271 | ||||||||||||||||||||||||
End of 2017 | - | - | - | - | - | 259 | - | 259 | ||||||||||||||||||||||||
Natural gas production in the reserves table may differ from gas production (delivered for sale) in our statistics disclosure, primarily because the quantities above include gas consumed in production operations.
Natural gas reserves are computed at 14.65 pounds per square inch absolute and 60 degrees Fahrenheit.
Notable changes in proved natural gas reserves in the three years ended December 31, 2017, included:
| • | Revisions : In 2017, revisions in Alaska, Lower 48 and Europe were primarily due to higher prices. In 2016, revisions in our equity affiliates in Asia Pacific/Middle East were primarily due to lower prices. In 2015, revisions in Lower 48, Alaska and Canada were primarily due to lower prices, partially offset by positive revisions in Asia Pacific/Middle East from Indonesia. |
| • | Extensions and discoveries : In 2017, extensions and discoveries in Lower 48 were primarily due to continued drilling success in the Permian Unconventional, Eagle Ford and Bakken. In 2015, for our equity affiliates in Asia Pacific/Middle East, extensions and discoveries were due to APLNG's ongoing development drilling onshore Australia. |
| • | Sales : In 2017, Lower 48 sales were due to the disposition of our interests in the San Juan Basin and Panhandle assets, while Canada sales were due to the disposition of a majority of our western Canada assets. In 2015, Lower 48 sales were due to the disposition of noncore assets in South Texas, East Texas and North Louisiana and sales of assets in British Columbia, Saskatchewan and Alberta impacted Canada. |
147
| Years Ended | Bitumen | |||
| December 31 | Millions of Barrels | |||
| Canada | ||||
Developed and Undeveloped | ||||
Consolidated operations | ||||
End of 2014 | 598 | |||
Revisions | 94 | |||
Improved recovery | - | |||
Purchases | - | |||
Extensions and discoveries | - | |||
Production | (5) | |||
Sales | - | |||
| ||||
End of 2015 | 687 | |||
Revisions | (515) | |||
Improved recovery | - | |||
Purchases | - | |||
Extensions and discoveries | - | |||
Production | (13) | |||
Sales | - | |||
| ||||
End of 2016 | 159 | |||
Revisions | 16 | |||
Improved recovery | - | |||
Purchases | - | |||
Extensions and discoveries | 96 | |||
Production | (21) | |||
Sales | - | |||
| ||||
End of 2017 | 250 | |||
| ||||
Equity affiliates | ||||
End of 2014 | 1,468 | |||
Revisions | 190 | |||
Improved recovery | - | |||
Purchases | - | |||
Extensions and discoveries | 99 | |||
Production | (51) | |||
Sales | - | |||
| ||||
End of 2015 | 1,706 | |||
Revisions | (573) | |||
Improved recovery | - | |||
Purchases | - | |||
Extensions and discoveries | 10 | |||
Production | (54) | |||
Sales | - | |||
| ||||
End of 2016 | 1,089 | |||
Revisions | - | |||
Improved recovery | - | |||
Purchases | - | |||
Extensions and discoveries | - | |||
Production | (23) | |||
Sales | (1,066) | |||
| ||||
End of 2017 | - | |||
| ||||
Total company | ||||
End of 2014 | 2,066 | |||
End of 2015 | 2,393 | |||
End of 2016 | 1,248 | |||
End of 2017 | 250 | |||
| ||||
148
| Years Ended | Bitumen | |||
| December 31 | Millions of Barrels | |||
| Canada | ||||
Developed | ||||
Consolidated operations | ||||
End of 2014 | 13 | |||
End of 2015 | 111 | |||
End of 2016 | 159 | |||
End of 2017 | 154 | |||
| ||||
Equity affiliates | ||||
End of 2014 | 187 | |||
End of 2015 | 311 | |||
End of 2016 | 322 | |||
End of 2017 | - | |||
| ||||
Undeveloped | ||||
Consolidated operations | ||||
End of 2014 | 585 | |||
End of 2015 | 576 | |||
End of 2016 | - | |||
End of 2017 | 96 | |||
| ||||
Equity affiliates | ||||
End of 2014 | 1,281 | |||
End of 2015 | 1,395 | |||
End of 2016 | 767 | |||
End of 2017 | - | |||
| ||||
Notable changes in proved bitumen reserves in the three years ended December 31, 2017, included:
| • | Revisions : In 2017, revisions were primarily due to higher prices at Surmont. In 2016, for both our consolidated operations and equity affiliates revisions were primarily related to lower prices which resulted in reserve reductions at Surmont, Foster Creek, Christina Lake and Narrows Lake. In 2015, for both our consolidated operations and equity affiliates revisions were primarily related to reduced royalties from lower prices at Surmont, Foster Creek, Christina Lake and Narrows Lake. |
| • | Extensions and discoveries : In 2017, extensions and discoveries were primarily due to higher prices at Surmont, which allowed undeveloped reserves previously de-booked due to low prices to be recognized. In 2015, for our equity affiliates extensions and discoveries were related to approval of development at Christina Lake. |
| • | Sales : In 2017, sales were due to the disposition of our 50 percent interest in the FCCL Partnership. |
149
| Years Ended | Total Proved Reserves | |||||||||||||||||||||||||||||||||||
| December 31 | Millions of Barrels of Oil Equivalent | |||||||||||||||||||||||||||||||||||
| Alaska | Lower 48 | Total U.S. | Canada | Europe | Asia Pacific/ Middle East | Africa | Other Areas | Total | ||||||||||||||||||||||||||||
|
| |||||||||||||||||||||||||||||||||||
Developed and Undeveloped |
| |||||||||||||||||||||||||||||||||||
Consolidated operations |
| |||||||||||||||||||||||||||||||||||
End of 2014 | 1,636 | 2,274 | 3,910 | 1,006 | 697 | 553 | 242 | - | 6,408 | |||||||||||||||||||||||||||
Revisions | (165) | (301) | (466) | 66 | (26) | (12) | - | - | (438) | |||||||||||||||||||||||||||
Improved recovery | 4 | 4 | 8 | 2 | - | 32 | - | - | 42 | |||||||||||||||||||||||||||
Purchases | - | - | - | - | - | - | - | - | - | |||||||||||||||||||||||||||
Extensions and discoveries | 20 | 84 | 104 | 10 | - | 8 | - | - | 122 | |||||||||||||||||||||||||||
Production | (75) | (211) | (286) | (62) | (78) | (84) | - | - | (510) | |||||||||||||||||||||||||||
Sales | - | (79) | (79) | (92) | - | - | - | - | (171) | |||||||||||||||||||||||||||
| ||||||||||||||||||||||||||||||||||||
End of 2015 | 1,420 | 1,771 | 3,191 | 930 | 593 | 497 | 242 | - | 5,453 | |||||||||||||||||||||||||||
Revisions | (77) | (143) | (220) | (484) | 11 | 9 | - | - | (684) | |||||||||||||||||||||||||||
Improved recovery | 6 | 3 | 9 | - | - | 7 | - | - | 16 | |||||||||||||||||||||||||||
Purchases | - | - | - | - | - | - | - | - | - | |||||||||||||||||||||||||||
Extensions and discoveries | 33 | 124 | 157 | 9 | - | 28 | - | - | 194 | |||||||||||||||||||||||||||
Production | (76) | (185) | (261) | (55) | (76) | (87) | (1) | - | (480) | |||||||||||||||||||||||||||
Sales | (12) | - | (12) | (7) | - | (10) | - | - | (29) | |||||||||||||||||||||||||||
| ||||||||||||||||||||||||||||||||||||
End of 2016 | 1,294 | 1,570 | 2,864 | 393 | 528 | 444 | 241 | - | 4,470 | |||||||||||||||||||||||||||
Revisions | 166 | 170 | 336 | 18 | 68 | 36 | - | - | 458 | |||||||||||||||||||||||||||
Improved recovery | 6 | - | 6 | - | - | - | - | - | 6 | |||||||||||||||||||||||||||
Purchases | - | - | - | - | - | - | - | - | - | |||||||||||||||||||||||||||
Extensions and discoveries | 41 | 378 | 419 | 97 | - | 7 | - | - | 523 | |||||||||||||||||||||||||||
Production | (77) | (144) | (221) | (37) | (79) | (81) | (8) | - | (426) | |||||||||||||||||||||||||||
Sales | - | (621) | (621) | (217) | - | - | - | - | (838) | |||||||||||||||||||||||||||
| ||||||||||||||||||||||||||||||||||||
End of 2017 | 1,430 | 1,353 | 2,783 | 254 | 517 | 406 | 233 | - | 4,193 | |||||||||||||||||||||||||||
| ||||||||||||||||||||||||||||||||||||
Equity affiliates | ||||||||||||||||||||||||||||||||||||
End of 2014 | - | - | - | 1,468 | - | 1,025 | - | 5 | 2,498 | |||||||||||||||||||||||||||
Revisions | - | - | - | 190 | - | (1) | - | - | 189 | |||||||||||||||||||||||||||
Improved recovery | - | - | - | - | - | - | - | - | - | |||||||||||||||||||||||||||
Purchases | - | - | - | - | - | - | - | - | - | |||||||||||||||||||||||||||
Extensions and discoveries | - | - | - | 99 | - | 45 | - | - | 144 | |||||||||||||||||||||||||||
Production | - | - | - | (51) | - | (48) | - | (1) | (100) | |||||||||||||||||||||||||||
Sales | - | - | - | - | - | - | - | (4) | (4) | |||||||||||||||||||||||||||
| ||||||||||||||||||||||||||||||||||||
End of 2015 | - | - | - | 1,706 | - | 1,021 | - | - | 2,727 | |||||||||||||||||||||||||||
Revisions | - | - | - | (573) | - | (113) | - | - | (686) | |||||||||||||||||||||||||||
Improved recovery | - | - | - | - | - | - | - | - | - | |||||||||||||||||||||||||||
Purchases | - | - | - | - | - | - | - | - | - | |||||||||||||||||||||||||||
Extensions and discoveries | - | - | - | 10 | - | 21 | - | - | 31 | |||||||||||||||||||||||||||
Production | - | - | - | (54) | - | (64) | - | - | (118) | |||||||||||||||||||||||||||
Sales | - | - | - | - | - | - | - | - | - | |||||||||||||||||||||||||||
| ||||||||||||||||||||||||||||||||||||
End of 2016 | - | - | - | 1,089 | - | 865 | - | - | 1,954 | |||||||||||||||||||||||||||
Revisions | - | - | - | - | - | 18 | - | - | 18 | |||||||||||||||||||||||||||
Improved recovery | - | - | - | - | - | - | - | - | - | |||||||||||||||||||||||||||
Purchases | - | - | - | - | - | - | - | - | - | |||||||||||||||||||||||||||
Extensions and discoveries | - | - | - | - | - | 31 | - | - | 31 | |||||||||||||||||||||||||||
Production | - | - | - | (23) | - | (69) | - | - | (92) | |||||||||||||||||||||||||||
Sales | - | - | - | (1,066) | - | - | - | - | (1,066) | |||||||||||||||||||||||||||
| ||||||||||||||||||||||||||||||||||||
End of 2017 | - | - | - | - | - | 845 | - | - | 845 | |||||||||||||||||||||||||||
| ||||||||||||||||||||||||||||||||||||
Total company | ||||||||||||||||||||||||||||||||||||
End of 2014 | 1,636 | 2,274 | 3,910 | 2,474 | 697 | 1,578 | 242 | 5 | 8,906 | |||||||||||||||||||||||||||
End of 2015 | 1,420 | 1,771 | 3,191 | 2,636 | 593 | 1,518 | 242 | - | 8,180 | |||||||||||||||||||||||||||
End of 2016 | 1,294 | 1,570 | 2,864 | 1,482 | 528 | 1,309 | 241 | - | 6,424 | |||||||||||||||||||||||||||
End of 2017 | 1,430 | 1,353 | 2,783 | 254 | 517 | 1,251 | 233 | - | 5,038 | |||||||||||||||||||||||||||
| ||||||||||||||||||||||||||||||||||||
150
| Years Ended | Total Proved Reserves | |||||||||||||||||||||||||||||||||||
| December 31 | Millions of Barrels of Oil Equivalent | |||||||||||||||||||||||||||||||||||
| Alaska | Lower 48 | Total U.S. | Canada | Europe | Asia Pacific/ Middle East | Africa | Other Areas | Total | ||||||||||||||||||||||||||||
|
| |||||||||||||||||||||||||||||||||||
Developed | ||||||||||||||||||||||||||||||||||||
Consolidated operations | ||||||||||||||||||||||||||||||||||||
End of 2014 | 1,514 | 1,637 | 3,151 | 393 | 452 | 412 | 237 | - | 4,645 | |||||||||||||||||||||||||||
End of 2015 | 1,318 | 1,261 | 2,579 | 352 | 398 | 384 | 242 | - | 3,955 | |||||||||||||||||||||||||||
End of 2016 | 1,203 | 1,165 | 2,368 | 391 | 365 | 309 | 241 | - | 3,674 | |||||||||||||||||||||||||||
End of 2017 | 1,319 | 682 | 2,001 | 158 | 372 | 281 | 233 | - | 3,045 | |||||||||||||||||||||||||||
Equity affiliates | ||||||||||||||||||||||||||||||||||||
End of 2014 | - | - | - | 187 | - | 810 | - | 5 | 1,002 | |||||||||||||||||||||||||||
End of 2015 | - | - | - | 311 | - | 890 | - | - | 1,201 | |||||||||||||||||||||||||||
End of 2016 | - | - | - | 322 | - | 820 | - | - | 1,142 | |||||||||||||||||||||||||||
End of 2017 | - | - | - | - | - | 802 | - | - | 802 | |||||||||||||||||||||||||||
Undeveloped | ||||||||||||||||||||||||||||||||||||
Consolidated operations | ||||||||||||||||||||||||||||||||||||
End of 2014 | 122 | 637 | 759 | 613 | 245 | 141 | 5 | - | 1,763 | |||||||||||||||||||||||||||
End of 2015 | 102 | 510 | 612 | 578 | 195 | 113 | - | - | 1,498 | |||||||||||||||||||||||||||
End of 2016 | 91 | 405 | 496 | 2 | 163 | 135 | - | - | 796 | |||||||||||||||||||||||||||
End of 2017 | 111 | 671 | 782 | 96 | 145 | 125 | - | - | 1,148 | |||||||||||||||||||||||||||
Equity affiliates | ||||||||||||||||||||||||||||||||||||
End of 2014 | - | - | - | 1,281 | - | 215 | - | - | 1,496 | |||||||||||||||||||||||||||
End of 2015 | - | - | - | 1,395 | - | 131 | - | - | 1,526 | |||||||||||||||||||||||||||
End of 2016 | - | - | - | 767 | - | 45 | - | - | 812 | |||||||||||||||||||||||||||
End of 2017 | - | - | - | - | - | 43 | - | - | 43 | |||||||||||||||||||||||||||
Natural gas reserves are converted to barrels of oil equivalent (BOE) based on a 6:1 ratio: six thousand cubic feet of natural gas converts to one BOE.
Proved Undeveloped Reserves
We had 1,191 million BOE of proved undeveloped reserves at year-end 2017, compared with 1,608 million BOE at year-end 2016. The following table shows changes in total proved undeveloped reserves for 2017:
| Proved Undeveloped Reserves | ||||
| Millions of Barrels of | ||||
| Oil Equivalent | ||||
End of 2016 | 1,608 | |||
Transfers to proved developed | (194 | ) | ||
Revisions | 29 | |||
Improved recovery | 6 | |||
Purchases | - | |||
Extensions and discoveries | 527 | |||
Sales | (785 | ) | ||
End of 2017 | 1,191 | |||
| ||||
Sales were primarily due to the disposition of our 50 percent interest in the FCCL Partnership, which were partially offset by extensions and discoveries primarily in the Lower 48, Alaska, Canada and Asia Pacific/Middle East.
As a result, at December 31, 2017, our proved undeveloped reserves represented 24 percent of total proved reserves, compared with 25 percent at December 31, 2016. Costs incurred for the year ended December 31, 2017, relating to the development of proved undeveloped reserves were $3.5 billion. A portion of our costs incurred each year relates to development projects where the proved undeveloped reserves will be converted to proved developed reserves in future years.
151
At the end of 2017, more than 90 percent of total proved undeveloped reserves are currently under development or scheduled for development within five years of initial disclosure. The remainder are to be developed as parts of major projects ongoing in our Europe and Asia Pacific/Middle East regions. All major development areas are currently producing and are expected to have proved undeveloped reserves convert to proved developed over time. Approximately 74 percent of our total proved undeveloped reserves at year-end 2017 are in North America, and all of these reserve volumes are planned for development within five years of initial disclosure.
Results of Operations
The company's results of operations from oil and gas activities for the years 2017, 2016 and 2015 are shown in the following tables. Non-oil and gas activities, such as pipeline and marine operations, liquefied natural gas operations, crude oil and gas marketing activities, and the profit element of transportation operations in which we have an ownership interest are excluded. Additional information about selected line items within the results of operations tables is shown below:
| • | Sales include sales to unaffiliated entities attributable primarily to the company's net working interests and royalty interests. Sales are net of fees to transport our produced hydrocarbons beyond the production function to a final delivery point using transportation operations which are not consolidated. |
| • | Transportation costs reflect fees to transport our produced hydrocarbons beyond the production function to a final delivery point using transportation operations which are consolidated. |
| • | Other revenues include gains and losses from asset sales, certain amounts resulting from the purchase and sale of hydrocarbons, and other miscellaneous income. |
| • | Production costs include costs incurred to operate and maintain wells, related equipment and facilities used in the production of petroleum liquids and natural gas. |
| • | Taxes other than income taxes include production, property and other non-income taxes. |
| • | Depreciation of support equipment is reclassified as applicable. |
| • | Other related expenses include inventory fluctuations, foreign currency transaction gains and losses and other miscellaneous expenses. |
152
Results of Operations
| Year Ended | Millions of Dollars | |||||||||||||||||||||||||||||||||||
December 31, 2017 | Alaska | Lower 48 | Total U.S. | Canada | Europe | Asia Pacific/ Middle East | Africa | Other Areas | Total | |||||||||||||||||||||||||||
|
| |||||||||||||||||||||||||||||||||||
Consolidated operations | ||||||||||||||||||||||||||||||||||||
Sales | $ | 3,542 | 4,557 | 8,099 | 705 | 3,527 | 2,752 | 487 | - | 15,570 | ||||||||||||||||||||||||||
Transfers | 4 | - | 4 | - | - | 411 | - | - | 415 | |||||||||||||||||||||||||||
Transportation costs | (706 | ) | - | (706 | ) | - | - | (80 | ) | - | - | (786 | ) | |||||||||||||||||||||||
Other revenues | 14 | 28 | 42 | 2,158 | 68 | 11 | 48 | 322 | 2,649 | |||||||||||||||||||||||||||
| ||||||||||||||||||||||||||||||||||||
Total revenues | 2,854 | 4,585 | 7,439 | 2,863 | 3,595 | 3,094 | 535 | 322 | 17,848 | |||||||||||||||||||||||||||
Production costs excluding taxes | 985 | 1,669 | 2,654 | 609 | 775 | 574 | 44 | - | 4,656 | |||||||||||||||||||||||||||
Taxes other than income taxes | 275 | 318 | 593 | 33 | 32 | 39 | 2 | - | 699 | |||||||||||||||||||||||||||
Exploration expenses | 83 | 584 | 667 | 22 | 45 | 97 | 61 | 45 | 937 | |||||||||||||||||||||||||||
Depreciation, depletion and amortization | 730 | 2,685 | 3,415 | 438 | 1,234 | 1,283 | 16 | - | 6,386 | |||||||||||||||||||||||||||
Impairments | 179 | 3,969 | 4,148 | 22 | 46 | - | - | - | 4,216 | |||||||||||||||||||||||||||
Other related expenses | (7 | ) | 62 | 55 | 7 | 57 | 60 | 6 | - | 185 | ||||||||||||||||||||||||||
Accretion | 52 | 63 | 115 | 16 | 172 | 37 | - | - | 340 | |||||||||||||||||||||||||||
| ||||||||||||||||||||||||||||||||||||
| 557 | (4,765 | ) | (4,208 | ) | 1,716 | 1,234 | 1,004 | 406 | 277 | 429 | ||||||||||||||||||||||||||
Income tax provision (benefit) | (678 | ) | (2,424 | ) | (3,102 | ) | (651 | ) | 702 | 363 | 428 | 11 | (2,249 | ) | ||||||||||||||||||||||
| ||||||||||||||||||||||||||||||||||||
Results of operations | $ | 1,235 | (2,341 | ) | (1,106 | ) | 2,367 | 532 | 641 | (22 | ) | 266 | 2,678 | |||||||||||||||||||||||
| ||||||||||||||||||||||||||||||||||||
Equity affiliates | ||||||||||||||||||||||||||||||||||||
Sales | $ | - | - | - | 528 | - | 563 | - | - | 1,091 | ||||||||||||||||||||||||||
Transfers | - | - | - | - | - | 1,398 | - | - | 1,398 | |||||||||||||||||||||||||||
Transportation costs | - | - | - | - | - | - | - | - | - | |||||||||||||||||||||||||||
Other revenues | - | - | - | 5 | - | - | - | - | 5 | |||||||||||||||||||||||||||
| ||||||||||||||||||||||||||||||||||||
Total revenues | - | - | - | 533 | - | 1,961 | - | - | 2,494 | |||||||||||||||||||||||||||
Production costs excluding taxes | - | - | - | 174 | - | 363 | - | - | 537 | |||||||||||||||||||||||||||
Taxes other than income taxes | - | - | - | 7 | - | 604 | - | - | 611 | |||||||||||||||||||||||||||
Exploration expenses | - | - | - | 1 | - | 1,699 | - | - | 1,700 | |||||||||||||||||||||||||||
Depreciation, depletion and amortization | - | - | - | 150 | - | 617 | - | - | 767 | |||||||||||||||||||||||||||
Impairments | - | - | - | - | - | 1,717 | - | - | 1,717 | |||||||||||||||||||||||||||
Other related expenses | - | - | - | 4 | - | 22 | - | 19 | 45 | |||||||||||||||||||||||||||
Accretion | - | - | - | 2 | - | 11 | - | - | 13 | |||||||||||||||||||||||||||
| ||||||||||||||||||||||||||||||||||||
| - | - | - | 195 | - | (3,072 | ) | - | (19 | ) | (2,896 | ) | |||||||||||||||||||||||||
Income tax provision (benefit) | - | - | - | 26 | - | (998 | ) | - | 13 | (959 | ) | |||||||||||||||||||||||||
| ||||||||||||||||||||||||||||||||||||
Results of operations | $ | - | - | - | 169 | - | (2,074 | ) | - | (32 | ) | (1,937 | ) | |||||||||||||||||||||||
| ||||||||||||||||||||||||||||||||||||
153
| Year Ended | Millions of Dollars | |||||||||||||||||||||||||||||||||||
December 31, 2016 | Alaska | Lower 48 | Total U.S. | Canada | Europe | Asia Pacific/ Middle East | Africa | Other Areas | Total | |||||||||||||||||||||||||||
|
| |||||||||||||||||||||||||||||||||||
Consolidated operations | ||||||||||||||||||||||||||||||||||||
Sales | $ | 2,793 | 4,117 | 6,910 | 661 | 2,678 | 2,350 | - | - | 12,599 | ||||||||||||||||||||||||||
Transfers | 8 | - | 8 | - | - | 347 | - | - | 355 | |||||||||||||||||||||||||||
Transportation costs | (676 | ) | - | (676 | ) | - | - | (40 | ) | - | - | (716 | ) | |||||||||||||||||||||||
Other revenues | 375 | 111 | 486 | 48 | (34 | ) | (25 | ) | 147 | 9 | 631 | |||||||||||||||||||||||||
| ||||||||||||||||||||||||||||||||||||
Total revenues | 2,500 | 4,228 | 6,728 | 709 | 2,644 | 2,632 | 147 | 9 | 12,869 | |||||||||||||||||||||||||||
Production costs excluding taxes | 1,056 | 1,967 | 3,023 | 790 | 795 | 640 | 23 | (2 | ) | 5,269 | ||||||||||||||||||||||||||
Taxes other than income taxes | 231 | 308 | 539 | 55 | 31 | 30 | 1 | - | 656 | |||||||||||||||||||||||||||
Exploration expenses | 45 | 1,227 | 1,272 | 332 | 90 | 38 | 138 | 41 | 1,911 | |||||||||||||||||||||||||||
Depreciation, depletion and amortization | 738 | 4,167 | 4,905 | 881 | 1,390 | 1,402 | 2 | - | 8,580 | |||||||||||||||||||||||||||
Impairments | 1 | 148 | 149 | 88 | (161 | ) | 44 | - | - | 120 | ||||||||||||||||||||||||||
Other related expenses | 52 | 70 | 122 | (51 | ) | (77 | ) | (13 | ) | 4 | 4 | (11 | ) | |||||||||||||||||||||||
Accretion | 52 | 72 | 124 | 32 | 210 | 35 | - | - | 401 | |||||||||||||||||||||||||||
| ||||||||||||||||||||||||||||||||||||
| 325 | (3,731 | ) | (3,406 | ) | (1,418 | ) | 366 | 456 | (21 | ) | (34 | ) | (4,057 | ) | ||||||||||||||||||||||
Income tax provision (benefit) | (29 | ) | (1,349 | ) | (1,378 | ) | (406 | ) | 3 | 250 | (72 | ) | (13 | ) | (1,616 | ) | ||||||||||||||||||||
| ||||||||||||||||||||||||||||||||||||
Results of operations | $ | 354 | (2,382 | ) | (2,028 | ) | (1,012 | ) | 363 | 206 | 51 | (21 | ) | (2,441 | ) | |||||||||||||||||||||
| ||||||||||||||||||||||||||||||||||||
Equity affiliates | ||||||||||||||||||||||||||||||||||||
Sales | $ | - | - | - | 860 | - | 449 | - | - | 1,309 | ||||||||||||||||||||||||||
Transfers | - | - | - | - | - | 825 | - | - | 825 | |||||||||||||||||||||||||||
Transportation costs | - | - | - | - | - | - | - | - | - | |||||||||||||||||||||||||||
Other revenues | - | - | - | - | - | (2 | ) | - | - | (2 | ) | |||||||||||||||||||||||||
| ||||||||||||||||||||||||||||||||||||
Total revenues | - | - | - | 860 | - | 1,272 | - | - | 2,132 | |||||||||||||||||||||||||||
Production costs excluding taxes | - | - | - | 431 | - | 256 | - | - | 687 | |||||||||||||||||||||||||||
Taxes other than income taxes | - | - | - | 15 | - | 476 | - | - | 491 | |||||||||||||||||||||||||||
Exploration expenses | - | - | - | 6 | - | - | - | - | 6 | |||||||||||||||||||||||||||
Depreciation, depletion and amortization | - | - | - | 309 | - | 548 | - | - | 857 | |||||||||||||||||||||||||||
Impairments | - | - | - | 9 | - | - | - | - | 9 | |||||||||||||||||||||||||||
Other related expenses | - | - | - | (7 | ) | - | 8 | - | 24 | 25 | ||||||||||||||||||||||||||
Accretion | - | - | - | 8 | - | 7 | - | - | 15 | |||||||||||||||||||||||||||
| ||||||||||||||||||||||||||||||||||||
| - | - | - | 89 | - | (23 | ) | - | (24 | ) | 42 | ||||||||||||||||||||||||||
Income tax provision (benefit) | - | - | - | 24 | - | (201 | ) | - | - | (177 | ) | |||||||||||||||||||||||||
| ||||||||||||||||||||||||||||||||||||
Results of operations | $ | - | - | - | 65 | - | 178 | - | (24 | ) | 219 | |||||||||||||||||||||||||
| ||||||||||||||||||||||||||||||||||||
154
| Year Ended | Millions of Dollars | |||||||||||||||||||||||||||||||||||
|
| |||||||||||||||||||||||||||||||||||
December 31, 2015 | Alaska | Lower 48 | Total U.S. | Canada | Europe | Asia Pacific/ Middle East | Africa | Other Areas | Total | |||||||||||||||||||||||||||
|
| |||||||||||||||||||||||||||||||||||
Consolidated operations | ||||||||||||||||||||||||||||||||||||
Sales | $ | 3,206 | 4,992 | 8,198 | 930 | 3,637 | 2,741 | - | - | 15,506 | ||||||||||||||||||||||||||
Transfers | 15 | - | 15 | - | - | 629 | - | - | 644 | |||||||||||||||||||||||||||
Transportation costs | (599 | ) | - | (599 | ) | - | - | (40 | ) | - | - | (639) | ||||||||||||||||||||||||
Other revenues | (5 | ) | 452 | 447 | (19 | ) | (28 | ) | 6 | 13 | 2 | 421 | ||||||||||||||||||||||||
| ||||||||||||||||||||||||||||||||||||
Total revenues | 2,617 | 5,444 | 8,061 | 911 | 3,609 | 3,336 | 13 | 2 | 15,932 | |||||||||||||||||||||||||||
Production costs excluding taxes | 1,242 | 2,420 | 3,662 | 923 | 1,137 | 815 | 42 | 1 | 6,580 | |||||||||||||||||||||||||||
Taxes other than income taxes | 281 | 358 | 639 | 62 | 35 | 33 | 3 | 1 | 773 | |||||||||||||||||||||||||||
Exploration expenses | 682 | 1,583 | 2,265 | 457 | 170 | 268 | 990 | 43 | 4,193 | |||||||||||||||||||||||||||
Depreciation, depletion and amortization | 548 | 4,192 | 4,740 | 777 | 1,813 | 1,321 | - | - | 8,651 | |||||||||||||||||||||||||||
Impairments | 8 | (2 | ) | 6 | 3 | 724 | 3 | - | - | 736 | ||||||||||||||||||||||||||
Other related expenses | (30 | ) | 78 | 48 | 8 | 9 | (2 | ) | (8 | ) | 5 | 60 | ||||||||||||||||||||||||
Accretion | 52 | 83 | 135 | 49 | 240 | 34 | - | - | 458 | |||||||||||||||||||||||||||
| ||||||||||||||||||||||||||||||||||||
| (166 | ) | (3,268 | ) | (3,434 | ) | (1,368 | ) | (519 | ) | 864 | (1,014 | ) | (48 | ) | (5,519) | |||||||||||||||||||||
Income tax provision (benefit) | (89 | ) | (1,193 | ) | (1,282 | ) | (244 | ) | (816 | ) | 430 | (406 | ) | (27 | ) | (2,345) | ||||||||||||||||||||
| ||||||||||||||||||||||||||||||||||||
Results of operations | $ | (77 | ) | (2,075 | ) | (2,152 | ) | (1,124 | ) | 297 | 434 | (608 | ) | (21 | ) | (3,174) | ||||||||||||||||||||
| ||||||||||||||||||||||||||||||||||||
Equity affiliates | ||||||||||||||||||||||||||||||||||||
Sales | $ | - | - | - | 917 | - | 536 | - | 50 | 1,503 | ||||||||||||||||||||||||||
Transfers | - | - | - | - | - | 950 | - | - | 950 | |||||||||||||||||||||||||||
Transportation costs | - | - | - | - | - | - | - | - | - | |||||||||||||||||||||||||||
Other revenues | - | - | - | 34 | - | 4 | - | 58 | 96 | |||||||||||||||||||||||||||
| ||||||||||||||||||||||||||||||||||||
Total revenues | - | - | - | 951 | - | 1,490 | - | 108 | 2,549 | |||||||||||||||||||||||||||
Production costs excluding taxes | - | - | - | 474 | - | 248 | - | 13 | 735 | |||||||||||||||||||||||||||
Taxes other than income taxes | - | - | - | 15 | - | 723 | - | 13 | 751 | |||||||||||||||||||||||||||
Exploration expenses | - | - | - | 12 | - | 190 | - | - | 202 | |||||||||||||||||||||||||||
Depreciation, depletion and amortization | - | - | - | 367 | - | 197 | - | 5 | 569 | |||||||||||||||||||||||||||
Impairments | - | - | - | - | - | 1,396 | - | 3 | 1,399 | |||||||||||||||||||||||||||
Other related expenses | - | - | - | (2 | ) | - | (13 | ) | - | 23 | 8 | |||||||||||||||||||||||||
Accretion | - | - | - | 7 | - | 10 | - | 1 | 18 | |||||||||||||||||||||||||||
| ||||||||||||||||||||||||||||||||||||
| - | - | - | 78 | - | (1,261 | ) | - | 50 | (1,133) | |||||||||||||||||||||||||||
Income tax provision (benefit) | - | - | - | 20 | - | (155 | ) | - | 10 | (125) | ||||||||||||||||||||||||||
| ||||||||||||||||||||||||||||||||||||
Results of operations | $ | - | - | - | 58 | - | (1,106 | ) | - | 40 | (1,008) | |||||||||||||||||||||||||
| ||||||||||||||||||||||||||||||||||||
155
Statistics
Net Production | 2017 | 2016 | 2015 | |||||||||
|
| |||||||||||
| Thousands of Barrels Daily | ||||||||||||
|
| |||||||||||
Crude Oil | ||||||||||||
Consolidated operations | ||||||||||||
Alaska | 167 | 163 | 158 | |||||||||
Lower 48 | 180 | 195 | 206 | |||||||||
| ||||||||||||
United States | 347 | 358 | 364 | |||||||||
Canada | 3 | 7 | 12 | |||||||||
Europe | 122 | 120 | 120 | |||||||||
Asia Pacific/Middle East | 93 | 97 | 91 | |||||||||
Africa | 20 | 2 | - | |||||||||
| ||||||||||||
Total consolidated operations | 585 | 584 | 587 | |||||||||
| ||||||||||||
Equity affiliates | ||||||||||||
Asia Pacific/Middle East | 14 | 14 | 14 | |||||||||
Other areas | - | - | 4 | |||||||||
| ||||||||||||
Total equity affiliates | 14 | 14 | 18 | |||||||||
| ||||||||||||
Total company | 599 | 598 | 605 | |||||||||
| ||||||||||||
Natural Gas Liquids | ||||||||||||
Consolidated operations | ||||||||||||
Alaska | 14 | 12 | 13 | |||||||||
Lower 48 | 69 | 88 | 94 | |||||||||
| ||||||||||||
United States | 83 | 100 | 107 | |||||||||
Canada | 9 | 23 | 26 | |||||||||
Europe | 8 | 7 | 7 | |||||||||
Asia Pacific/Middle East | 4 | 7 | 9 | |||||||||
| ||||||||||||
Total consolidated operations | 104 | 137 | 149 | |||||||||
| ||||||||||||
Equity affiliates- Asia Pacific/Middle East | 7 | 8 | 7 | |||||||||
| ||||||||||||
Total company | 111 | 145 | 156 | |||||||||
| ||||||||||||
Bitumen | ||||||||||||
Consolidated operations- Canada | 59 | 35 | 13 | |||||||||
Equity affiliates- Canada | 63 | 148 | 138 | |||||||||
| ||||||||||||
Total company | 122 | 183 | 151 | |||||||||
| ||||||||||||
Natural Gas | Millions of Cubic Feet Daily | |||||||||||
|
| |||||||||||
Consolidated operations | ||||||||||||
Alaska | 7 | 25 | 42 | |||||||||
Lower 48 | 898 | 1,219 | 1,472 | |||||||||
| ||||||||||||
United States | 905 | 1,244 | 1,514 | |||||||||
Canada | 187 | 524 | 715 | |||||||||
Europe | 476 | 459 | 475 | |||||||||
Asia Pacific/Middle East | 687 | 730 | 717 | |||||||||
Africa | 8 | 1 | 1 | |||||||||
| ||||||||||||
Total consolidated operations | 2,263 | 2,958 | 3,422 | |||||||||
| ||||||||||||
Equity affiliates- Asia Pacific/Middle East | 1,007 | 899 | 638 | |||||||||
| ||||||||||||
Total company | 3,270 | 3,857 | 4,060 | |||||||||
| ||||||||||||
156
Average Sales Prices | 2017 | 2016 | 2015 | |||||||||
|
| |||||||||||
Crude Oil Per Barrel | ||||||||||||
Consolidated operations | ||||||||||||
Alaska | $ | 42.69 | 31.68 | 41.84 | ||||||||
Lower 48 | 47.36 | 37.49 | 42.62 | |||||||||
United States | 45.01 | 34.70 | 42.27 | |||||||||
Canada | 43.69 | 35.25 | 39.52 | |||||||||
Europe | 54.04 | 43.66 | 52.75 | |||||||||
Asia Pacific/Middle East | 54.38 | 42.23 | 49.70 | |||||||||
Africa | 55.11 | - | 60.79 | |||||||||
Total international | 54.16 | 42.76 | 50.79 | |||||||||
Total consolidated operations | 48.70 | 37.67 | 45.48 | |||||||||
| ||||||||||||
Equity affiliates | ||||||||||||
Asia Pacific/Middle East | 54.76 | 44.11 | 53.12 | |||||||||
Other areas | - | - | 37.21 | |||||||||
Total equity affiliates | 54.76 | 44.11 | 49.92 | |||||||||
| ||||||||||||
Total operations | 48.84 | 37.82 | 45.61 | |||||||||
Natural Gas Liquids Per Barrel | ||||||||||||
Consolidated operations | ||||||||||||
Lower 48 | $ | 22.20 | 14.34 | 14.01 | ||||||||
United States | 22.20 | 14.34 | 14.01 | |||||||||
Canada | 21.51 | 14.82 | 17.02 | |||||||||
Europe | 34.07 | 22.62 | 27.56 | |||||||||
Asia Pacific/Middle East | 41.37 | 29.00 | 37.78 | |||||||||
Total international | 30.34 | 19.06 | 23.21 | |||||||||
Total consolidated operations | 24.21 | 15.72 | 16.83 | |||||||||
| ||||||||||||
Equity affiliates -Asia Pacific/Middle East | 38.74 | 31.13 | 35.79 | |||||||||
| ||||||||||||
Total operations | 25.22 | 16.68 | 17.79 | |||||||||
Bitumen Per Barrel | ||||||||||||
Consolidated operations- Canada | $ | 21.43 | 12.91 | 20.13 | ||||||||
Equity affiliates- Canada | 23.83 | 15.80 | 18.58 | |||||||||
| ||||||||||||
Natural Gas Per Thousand Cubic Feet | ||||||||||||
Consolidated operations | ||||||||||||
Alaska | $ | 2.72 | 5.22 | 4.33 | ||||||||
Lower 48 | 2.73 | 2.20 | 2.43 | |||||||||
United States | 2.73 | 2.24 | 2.47 | |||||||||
Canada | 1.93 | 1.49 | 1.91 | |||||||||
Europe | 5.72 | 4.71 | 7.14 | |||||||||
Asia Pacific/Middle East | 4.66 | 4.15 | 6.08 | |||||||||
Africa | 3.53 | - | - | |||||||||
Total international | 4.64 | 3.49 | 4.78 | |||||||||
Total consolidated operations | 3.87 | 2.97 | 3.77 | |||||||||
| ||||||||||||
Equity affiliates -Asia Pacific/Middle East | 4.27 | 2.97 | 4.83 | |||||||||
| ||||||||||||
Total operations | 4.00 | 2.97 | 3.93 | |||||||||
| ||||||||||||
Average sales prices for Alaska crude oil and Asia Pacific/Middle East natural gas above reflect a reduction for transportation costs in which we have an ownership interest that are incurred subsequent to the terminal point of the production function. Accordingly, the average sales prices differ from those discussed in Item 7 of Management's Discussion and Analysis of Financial Condition and Results of Operations.
157
| 2017 | 2016 | 2015 | ||||||||||
|
| |||||||||||
Average Production Costs Per Barrel of Oil Equivalent* | ||||||||||||
Consolidated operations | ||||||||||||
Alaska | $ | 14.83 | 16.12 | 19.12 | ||||||||
Lower 48 | 11.46 | 11.06 | 12.17 | |||||||||
United States | 12.52 | 12.42 | 13.88 | |||||||||
Canada | 16.36 | 14.20 | 14.88 | |||||||||
Europe | 10.16 | 10.70 | 15.05 | |||||||||
Asia Pacific/Middle East | 7.42 | 7.74 | 10.20 | |||||||||
Africa | 5.74 | 31.42 | - | |||||||||
Total international | 10.08 | 10.53 | 13.41 | |||||||||
Total consolidated operations | 11.34 | 11.54 | 13.67 | |||||||||
| ||||||||||||
Equity affiliates | ||||||||||||
Canada | 7.57 | 7.96 | 9.41 | |||||||||
Asia Pacific/Middle East | 5.26 | 4.04 | 5.31 | |||||||||
Other areas | - | - | 8.90 | |||||||||
Total equity affiliates | 5.84 | 5.85 | 7.46 | |||||||||
| ||||||||||||
Average Production Costs Per Barrel-Bitumen | ||||||||||||
Consolidated operations- Canada | $ | 14.63 | 24.59 | 61.87 | ||||||||
Equity affiliates- Canada | 18.74 | 7.96 | 9.41 | |||||||||
| ||||||||||||
Taxes Other Than Income Taxes Per Barrel of Oil Equivalent | ||||||||||||
Consolidated operations | ||||||||||||
Alaska | $ | 4.14 | 3.53 | 4.33 | ||||||||
Lower 48 | 2.18 | 1.73 | 1.80 | |||||||||
United States | 2.80 | 2.21 | 2.42 | |||||||||
Canada | 0.89 | 0.99 | 1.00 | |||||||||
Europe | 0.42 | 0.42 | 0.46 | |||||||||
Asia Pacific/Middle East | 0.50 | 0.36 | 0.41 | |||||||||
Africa | 0.26 | 1.37 | - | |||||||||
Total international | 0.53 | 0.55 | 0.62 | |||||||||
Total consolidated operations | 1.70 | 1.44 | 1.61 | |||||||||
| ||||||||||||
Equity affiliates | ||||||||||||
Canada | 0.30 | 0.28 | 0.30 | |||||||||
Asia Pacific/Middle East | 8.76 | 7.52 | 15.48 | |||||||||
Other areas | - | - | 8.90 | |||||||||
Total equity affiliates | 6.64 | 4.18 | 7.62 | |||||||||
| ||||||||||||
Depreciation, Depletion and Amortization Per Barrel of Oil Equivalent | ||||||||||||
Consolidated operations | ||||||||||||
Alaska | $ | 10.99 | 11.26 | 8.43 | ||||||||
Lower 48 | 18.44 | 23.43 | 21.07 | |||||||||
United States | 16.10 | 20.15 | 17.96 | |||||||||
Canada | 11.76 | 15.84 | 12.52 | |||||||||
Europe | 16.18 | 18.71 | 24.00 | |||||||||
Asia Pacific/Middle East | 16.58 | 16.95 | 16.53 | |||||||||
Africa | 2.09 | 2.73 | - | |||||||||
Total international | 14.96 | 17.22 | 17.98 | |||||||||
Total consolidated operations | 15.55 | 18.78 | 17.97 | |||||||||
| ||||||||||||
Equity affiliates | ||||||||||||
Canada | 6.52 | 5.70 | 7.29 | |||||||||
Asia Pacific/Middle East | 8.94 | 8.65 | 4.22 | |||||||||
Other areas | - | - | 3.42 | |||||||||
Total equity affiliates | 8.34 | 7.29 | 5.77 | |||||||||
| ||||||||||||
*Includes bitumen.
158
Development and Exploration Activities
The following two tables summarize our net interest in productive and dry exploratory and development wells in the years ended December 31, 2017, 2016 and 2015. A "development well" is a well drilled within the proved area of a reservoir to the depth of a stratigraphic horizon known to be productive. An "exploratory well" is a well drilled to find and produce crude oil or natural gas in an unknown field or a new reservoir within a proven field. Exploratory wells also include wells drilled in areas near or offsetting current production, or in areas where well density or production history have not achieved statistical certainty of results. Excluded from the exploratory well count are stratigraphic-type exploratory wells, primarily relating to oil sands delineation wells located in Canada and coalbed methane test wells located in Asia Pacific/Middle East.
Net Wells Completed | Productive | Dry | ||||||||||||||||||||||||||
|
|
|
| |||||||||||||||||||||||||
| 2017 | 2016 | 2015 | 2017 | 2016 | 2015 | |||||||||||||||||||||||
|
|
|
| |||||||||||||||||||||||||
Exploratory | ||||||||||||||||||||||||||||
Consolidated operations | ||||||||||||||||||||||||||||
Alaska | - | 2 | - | - | 1 | - | ||||||||||||||||||||||
Lower 48 | 13 | 8 | 47 | 3 | 1 | 4 | ||||||||||||||||||||||
| ||||||||||||||||||||||||||||
United States | 13 | 10 | 47 | 3 | 2 | 4 | ||||||||||||||||||||||
Canada | 13 | 8 | 16 | - | 1 | 3 | ||||||||||||||||||||||
Europe | * | * | * | * | 1 | * | ||||||||||||||||||||||
Asia Pacific/Middle East | 1 | 1 | 1 | 1 | - | 2 | ||||||||||||||||||||||
Africa | - | 1 | * | - | - | * | ||||||||||||||||||||||
Other areas | - | - | - | 1 | - | - | ||||||||||||||||||||||
| ||||||||||||||||||||||||||||
Total consolidated operations | 27 | 20 | 64 | 5 | 4 | 9 | ||||||||||||||||||||||
| ||||||||||||||||||||||||||||
Equity affiliates | ||||||||||||||||||||||||||||
Asia Pacific/Middle East | 14 | 20 | 19 | - | - | * | ||||||||||||||||||||||
| ||||||||||||||||||||||||||||
Total equity affiliates | 14 | 20 | 19 | - | - | - | ||||||||||||||||||||||
| ||||||||||||||||||||||||||||
Development | ||||||||||||||||||||||||||||
Consolidated operations | ||||||||||||||||||||||||||||
Alaska | 9 | 9 | 18 | - | - | - | ||||||||||||||||||||||
Lower 48 | 161 | 119 | 347 | - | - | - | ||||||||||||||||||||||
| ||||||||||||||||||||||||||||
United States | 170 | 128 | 365 | - | - | - | ||||||||||||||||||||||
Canada | 13 | 47 | 47 | - | 2 | - | ||||||||||||||||||||||
Europe | 7 | 7 | 10 | - | - | - | ||||||||||||||||||||||
Asia Pacific/Middle East | 8 | 6 | 3 | - | - | * | ||||||||||||||||||||||
Africa | - | - | - | - | - | - | ||||||||||||||||||||||
Other areas | - | - | - | - | - | - | ||||||||||||||||||||||
| ||||||||||||||||||||||||||||
Total consolidated operations | 198 | 188 | 425 | - | 2 | - | ||||||||||||||||||||||
| ||||||||||||||||||||||||||||
Equity affiliates | ||||||||||||||||||||||||||||
Canada | 19 | 48 | 22 | - | - | - | ||||||||||||||||||||||
Asia Pacific/Middle East | 84 | 108 | 166 | - | - | 2 | ||||||||||||||||||||||
Other areas | - | - | * | - | - | - | ||||||||||||||||||||||
| ||||||||||||||||||||||||||||
Total equity affiliates | 103 | 156 | 188 | - | - | 2 | ||||||||||||||||||||||
| ||||||||||||||||||||||||||||
*Our total proportionate interest was less than one.
159
The table below represents the status of our wells drilling at December 31, 2017, and includes wells in the process of drilling or in active completion. It also represents gross and net productive wells, including producing wells and wells capable of production at December 31, 2017.
| Wells at December 31, 2017 | Productive * | |||||||||||||||||||||||||||||||
|
| |||||||||||||||||||||||||||||||
| In Progress | Oil | Gas | ||||||||||||||||||||||||||||||
|
|
|
|
|
| |||||||||||||||||||||||||||
| Gross | Net | Gross | Net | Gross | Net | |||||||||||||||||||||||||||
|
|
|
|
|
| |||||||||||||||||||||||||||
Consolidated operations |
| |||||||||||||||||||||||||||||||
Alaska | 1 | 1 | 1,721 | 769 | - | - | ||||||||||||||||||||||||||
Lower 48 | 354 | 179 | 9,984 | 4,781 | 5,222 | 2,364 | ||||||||||||||||||||||||||
| ||||||||||||||||||||||||||||||||
United States | 355 | 180 | 11,705 | 5,550 | 5,222 | 2,364 | ||||||||||||||||||||||||||
Canada | 1 | 1 | 182 | 91 | 42 | 34 | ||||||||||||||||||||||||||
Europe | 22 | 3 | 486 | 86 | 181 | 68 | ||||||||||||||||||||||||||
Asia Pacific/Middle East | 3 | 1 | 370 | 153 | 55 | 28 | ||||||||||||||||||||||||||
Africa | - | - | 825 | 135 | 9 | 2 | ||||||||||||||||||||||||||
| ||||||||||||||||||||||||||||||||
Total consolidated operations | 381 | 185 | 13,568 | 6,015 | 5,509 | 2,496 | ||||||||||||||||||||||||||
| ||||||||||||||||||||||||||||||||
Equity affiliates | ||||||||||||||||||||||||||||||||
Asia Pacific/Middle East | 176 | 47 | - | - | 3,749 | 907 | ||||||||||||||||||||||||||
| ||||||||||||||||||||||||||||||||
Total equity affiliates | 176 | 47 | - | - | 3,749 | 907 | ||||||||||||||||||||||||||
| ||||||||||||||||||||||||||||||||
*Includes 18 gross and 6 net multiple completion wells.
Acreage at December 31, 2017 | Thousands of Acres | |||||||||||||||||||
|
| |||||||||||||||||||
| Developed | Undeveloped | |||||||||||||||||||
|
|
|
| |||||||||||||||||
| Gross | Net | Gross | Net | |||||||||||||||||
|
| |||||||||||||||||||
Consolidated operations | ||||||||||||||||||||
Alaska | 592 | 294 | 1,345 | 1,014 | ||||||||||||||||
Lower 48 | 2,278 | 1,934 | 10,632 | 8,509 | ||||||||||||||||
| ||||||||||||||||||||
United States | 2,870 | 2,228 | 11,977 | 9,523 | ||||||||||||||||
Canada | 187 | 105 | 3,251 | 1,772 | ||||||||||||||||
Europe | 797 | 244 | 2,454 | 720 | ||||||||||||||||
Asia Pacific/Middle East | 1,596 | 742 | 12,568 | 6,462 | ||||||||||||||||
Africa | 358 | 59 | 12,545 | 2,049 | ||||||||||||||||
Other areas | - | - | 560 | 323 | ||||||||||||||||
| ||||||||||||||||||||
Total consolidated operations | 5,808 | 3,378 | 43,355 | 20,849 | ||||||||||||||||
| ||||||||||||||||||||
Equity affiliates | ||||||||||||||||||||
Asia Pacific/Middle East | 872 | 201 | 5,445 | 1,432 | ||||||||||||||||
| ||||||||||||||||||||
Total equity affiliates | 872 | 201 | 5,445 | 1,432 | ||||||||||||||||
| ||||||||||||||||||||
160
Costs Incurred
| Year Ended | Millions of Dollars | |||||||||||||||||||||||||||||||||||
|
| |||||||||||||||||||||||||||||||||||
December 31 | Alaska | Lower 48 | Total U.S. | Canada | Europe | Asia Pacific/ Middle East | * | Africa | Other Areas | Total | ||||||||||||||||||||||||||
|
| |||||||||||||||||||||||||||||||||||
2017 | ||||||||||||||||||||||||||||||||||||
Consolidated operations | ||||||||||||||||||||||||||||||||||||
Unproved property acquisition | $ | 18 | 267 | 285 | 76 | - | 15 | - | - | 376 | ||||||||||||||||||||||||||
Proved property acquisition | - | 35 | 35 | - | - | - | - | - | 35 | |||||||||||||||||||||||||||
| ||||||||||||||||||||||||||||||||||||
| 18 | 302 | 320 | 76 | - | 15 | - | - | 411 | ||||||||||||||||||||||||||||
Exploration | 74 | 399 | 473 | 56 | 52 | 139 | 61 | 42 | 823 | |||||||||||||||||||||||||||
Development | 736 | 1,559 | 2,295 | 102 | 784 | 388 | 10 | - | 3,579 | |||||||||||||||||||||||||||
| ||||||||||||||||||||||||||||||||||||
| $ | 828 | 2,260 | 3,088 | 234 | 836 | 542 | 71 | 42 | 4,813 | |||||||||||||||||||||||||||
| ||||||||||||||||||||||||||||||||||||
Equity affiliates | ||||||||||||||||||||||||||||||||||||
Unproved property acquisition | $ | - | - | - | - | - | - | - | - | - | ||||||||||||||||||||||||||
Proved property acquisition | - | - | - | - | - | - | - | - | - | |||||||||||||||||||||||||||
| ||||||||||||||||||||||||||||||||||||
| - | - | - | - | - | - | - | - | - | ||||||||||||||||||||||||||||
Exploration | - | - | - | 6 | - | 38 | - | - | 44 | |||||||||||||||||||||||||||
Development | - | - | - | 150 | - | 403 | - | - | 553 | |||||||||||||||||||||||||||
| ||||||||||||||||||||||||||||||||||||
| $ | - | - | - | 156 | - | 441 | - | - | 597 | |||||||||||||||||||||||||||
| ||||||||||||||||||||||||||||||||||||
2016 | ||||||||||||||||||||||||||||||||||||
Consolidated operations | ||||||||||||||||||||||||||||||||||||
Unproved property acquisition | $ | - | 127 | 127 | 59 | - | - | - | - | 186 | ||||||||||||||||||||||||||
Proved property acquisition | - | 5 | 5 | 19 | - | - | - | - | 24 | |||||||||||||||||||||||||||
| ||||||||||||||||||||||||||||||||||||
| - | 132 | 132 | 78 | - | - | - | - | 210 | ||||||||||||||||||||||||||||
Exploration | 110 | 656 | 766 | 286 | 65 | 52 | 215 | 67 | 1,451 | |||||||||||||||||||||||||||
Development | 720 | 782 | 1,502 | 209 | 62 | 387 | 6 | - | 2,166 | |||||||||||||||||||||||||||
| ||||||||||||||||||||||||||||||||||||
| $ | 830 | 1,570 | 2,400 | 573 | 127 | 439 | 221 | 67 | 3,827 | |||||||||||||||||||||||||||
| ||||||||||||||||||||||||||||||||||||
Equity affiliates | ||||||||||||||||||||||||||||||||||||
Unproved property acquisition | $ | - | - | - | - | - | 2 | - | - | 2 | ||||||||||||||||||||||||||
Proved property acquisition | - | - | - | - | - | - | - | - | - | |||||||||||||||||||||||||||
| ||||||||||||||||||||||||||||||||||||
| - | - | - | - | - | 2 | - | - | 2 | ||||||||||||||||||||||||||||
Exploration | - | - | - | 15 | - | 19 | - | - | 34 | |||||||||||||||||||||||||||
Development | - | - | - | 367 | - | 320 | - | - | 687 | |||||||||||||||||||||||||||
| ||||||||||||||||||||||||||||||||||||
| $ | - | - | - | 382 | - | 341 | - | - | 723 | |||||||||||||||||||||||||||
| ||||||||||||||||||||||||||||||||||||
2015 | ||||||||||||||||||||||||||||||||||||
Consolidated operations | ||||||||||||||||||||||||||||||||||||
Unproved property acquisition | $ | - | 168 | 168 | 52 | - | - | - | - | 220 | ||||||||||||||||||||||||||
Proved property acquisition | - | 5 | 5 | 1 | - | - | - | - | 6 | |||||||||||||||||||||||||||
| ||||||||||||||||||||||||||||||||||||
| - | 173 | 173 | 53 | - | - | - | - | 226 | ||||||||||||||||||||||||||||
Exploration | 87 | 1,369 | 1,456 | 298 | 107 | 118 | 394 | 47 | 2,420 | |||||||||||||||||||||||||||
Development | 1,217 | 2,875 | 4,092 | 827 | 1,742 | 587 | 4 | - | 7,252 | |||||||||||||||||||||||||||
| ||||||||||||||||||||||||||||||||||||
| $ | 1,304 | 4,417 | 5,721 | 1,178 | 1,849 | 705 | 398 | 47 | 9,898 | |||||||||||||||||||||||||||
| ||||||||||||||||||||||||||||||||||||
Equity affiliates | ||||||||||||||||||||||||||||||||||||
Unproved property acquisition | $ | - | - | - | - | - | - | - | - | - | ||||||||||||||||||||||||||
Proved property acquisition | - | - | - | - | - | - | - | - | - | |||||||||||||||||||||||||||
| ||||||||||||||||||||||||||||||||||||
| - | - | - | - | - | - | - | - | - | ||||||||||||||||||||||||||||
Exploration | - | - | - | 17 | - | 60 | - | - | 77 | |||||||||||||||||||||||||||
Development | - | - | - | 847 | - | 753 | - | 3 | 1,603 | |||||||||||||||||||||||||||
| ||||||||||||||||||||||||||||||||||||
| $ | - | - | - | 864 | - | 813 | - | 3 | 1,680 | |||||||||||||||||||||||||||
| ||||||||||||||||||||||||||||||||||||
* Certain amounts in Asia Pacific/Middle East equity affiliates have been revised in 2016 and 2015 to reflect additional abandonment obligations.
161
Capitalized Costs
| At December 31 | Millions of Dollars | |||||||||||||||||||||||||||||||||||
|
| |||||||||||||||||||||||||||||||||||
| Alaska | Lower 48 | Total U.S. | Canada | Europe | Asia Pacific/ Middle East | * | Africa | Other Areas | Total | |||||||||||||||||||||||||||
|
| |||||||||||||||||||||||||||||||||||
2017 | ||||||||||||||||||||||||||||||||||||
Consolidated operations | ||||||||||||||||||||||||||||||||||||
Proved property | $ | 18,149 | 35,332 | 53,481 | 6,217 | 27,221 | 14,236 | 889 | - | 102,044 | ||||||||||||||||||||||||||
Unproved property | 1,068 | 1,137 | 2,205 | 985 | 290 | 822 | 122 | 67 | 4,491 | |||||||||||||||||||||||||||
| ||||||||||||||||||||||||||||||||||||
| 19,217 | 36,469 | 55,686 | 7,202 | 27,511 | 15,058 | 1,011 | 67 | 106,535 | ||||||||||||||||||||||||||||
Accumulated depreciation, depletion and amortization | 9,497 | 24,211 | 33,708 | 1,582 | 18,068 | 8,916 | 312 | 9 | 62,595 | |||||||||||||||||||||||||||
| ||||||||||||||||||||||||||||||||||||
| $ | 9,720 | 12,258 | 21,978 | 5,620 | 9,443 | 6,142 | 699 | 58 | 43,940 | |||||||||||||||||||||||||||
| ||||||||||||||||||||||||||||||||||||
Equity affiliates | ||||||||||||||||||||||||||||||||||||
Proved property | $ | - | - | - | - | - | 9,750 | - | - | 9,750 | ||||||||||||||||||||||||||
Unproved property | - | - | - | - | - | 2,215 | - | - | 2,215 | |||||||||||||||||||||||||||
| ||||||||||||||||||||||||||||||||||||
| - | - | - | - | - | 11,965 | - | - | 11,965 | ||||||||||||||||||||||||||||
Accumulated depreciation, depletion and amortization | - | - | - | - | - | 5,342 | - | - | 5,342 | |||||||||||||||||||||||||||
| ||||||||||||||||||||||||||||||||||||
| $ | - | - | - | - | - | 6,623 | - | - | 6,623 | |||||||||||||||||||||||||||
| ||||||||||||||||||||||||||||||||||||
2016 | ||||||||||||||||||||||||||||||||||||
Consolidated operations | ||||||||||||||||||||||||||||||||||||
Proved property | $ | 17,376 | 46,050 | 63,426 | 16,970 | 24,858 | 13,837 | 879 | - | 119,970 | ||||||||||||||||||||||||||
Unproved property | 1,099 | 1,376 | 2,475 | 1,435 | 269 | 787 | 123 | 61 | 5,150 | |||||||||||||||||||||||||||
| ||||||||||||||||||||||||||||||||||||
| 18,475 | 47,426 | 65,901 | 18,405 | 25,127 | 14,624 | 1,002 | 61 | 125,120 | ||||||||||||||||||||||||||||
Accumulated depreciation, depletion and amortization | 8,548 | 26,858 | 35,406 | 10,344 | 15,754 | 7,635 | 297 | 1 | 69,437 | |||||||||||||||||||||||||||
| ||||||||||||||||||||||||||||||||||||
| $ | 9,927 | 20,568 | 30,495 | 8,061 | 9,373 | 6,989 | 705 | 60 | 55,683 | |||||||||||||||||||||||||||
| ||||||||||||||||||||||||||||||||||||
Equity affiliates | ||||||||||||||||||||||||||||||||||||
Proved property | $ | - | - | - | 9,459 | - | 8,839 | - | - | 18,298 | ||||||||||||||||||||||||||
Unproved property | - | - | - | 891 | - | 2,756 | - | - | 3,647 | |||||||||||||||||||||||||||
| ||||||||||||||||||||||||||||||||||||
| - | - | - | 10,350 | - | 11,595 | - | - | 21,945 | ||||||||||||||||||||||||||||
Accumulated depreciation, depletion and amortization | - | - | - | 1,906 | - | 1,369 | - | - | 3,275 | |||||||||||||||||||||||||||
| ||||||||||||||||||||||||||||||||||||
| $ | - | - | - | 8,444 | - | 10,226 | - | - | 18,670 | |||||||||||||||||||||||||||
| ||||||||||||||||||||||||||||||||||||
*Certain amounts in Asia Pacific/Middle East equity affiliates have been revised in 2016 to reflect additional abandonment obligations.
162
Standardized Measure of Discounted Future Net Cash Flows Relating to Proved Oil and Gas Reserve Quantities
In accordance with SEC and FASB requirements, amounts were computed using 12-month average prices (adjusted only for existing contractual terms) and end-of-year costs, appropriate statutory tax rates and a prescribed 10 percent discount factor. Twelve-month average prices are calculated as the unweighted arithmetic average of the first-day-of-the-month price for each month within the 12-month period prior to the end of the reporting period. For all years, continuation of year-end economic conditions was assumed. The calculations were based on estimates of proved reserves, which are revised over time as new data becomes available. Probable or possible reserves, which may become proved in the future, were not considered. The calculations also require assumptions as to the timing of future production of proved reserves and the timing and amount of future development costs, including dismantlement, and future production costs, including taxes other than income taxes.
While due care was taken in its preparation, we do not represent that this data is the fair value of our oil and gas properties, or a fair estimate of the present value of cash flows to be obtained from their development and production.
Discounted Future Net Cash Flows
| Millions of Dollars | ||||||||||||||||||||||||||||||||
|
| |||||||||||||||||||||||||||||||
| Alaska | Lower 48 | Total U.S. | Canada | Europe | Asia Pacific/ Middle East | Africa | Total | |||||||||||||||||||||||||
|
| |||||||||||||||||||||||||||||||
2017 | ||||||||||||||||||||||||||||||||
Consolidated operations | ||||||||||||||||||||||||||||||||
Future cash inflows | $ | 44,969 | 44,556 | 89,525 | 5,479 | 23,137 | 15,207 | 13,181 | 146,529 | |||||||||||||||||||||||
Less: | ||||||||||||||||||||||||||||||||
Future production costs | 29,524 | 18,947 | 48,471 | 4,417 | 8,128 | 5,398 | 1,401 | 67,815 | ||||||||||||||||||||||||
Future development costs | 7,255 | 10,881 | 18,136 | 696 | 8,758 | 2,511 | 537 | 30,638 | ||||||||||||||||||||||||
Future income tax provisions | 53 | 2,375 | 2,428 | - | 3,333 | 2,459 | 10,356 | 18,576 | ||||||||||||||||||||||||
| ||||||||||||||||||||||||||||||||
Future net cash flows | 8,137 | 12,353 | 20,490 | 366 | 2,918 | 4,839 | 887 | 29,500 | ||||||||||||||||||||||||
10 percent annual discount | 2,712 | 4,358 | 7,070 | 78 | 289 | 1,032 | 422 | 8,891 | ||||||||||||||||||||||||
| ||||||||||||||||||||||||||||||||
Discounted future net cash flows | $ | 5,425 | 7,995 | 13,420 | 288 | 2,629 | 3,807 | 465 | 20,609 | |||||||||||||||||||||||
| ||||||||||||||||||||||||||||||||
Equity affiliates | ||||||||||||||||||||||||||||||||
Future cash inflows | $ | - | - | - | - | - | 23,222 | - | 23,222 | |||||||||||||||||||||||
Less: | ||||||||||||||||||||||||||||||||
Future production costs | - | - | - | - | - | 12,984 | - | 12,984 | ||||||||||||||||||||||||
Future development costs | - | - | - | - | - | 1,444 | - | 1,444 | ||||||||||||||||||||||||
Future income tax provisions | - | - | - | - | - | 2,083 | - | 2,083 | ||||||||||||||||||||||||
| ||||||||||||||||||||||||||||||||
Future net cash flows | - | - | - | - | - | 6,711 | - | 6,711 | ||||||||||||||||||||||||
10 percent annual discount | - | - | - | - | - | 2,316 | - | 2,316 | ||||||||||||||||||||||||
| ||||||||||||||||||||||||||||||||
Discounted future net cash flows | $ | - | - | - | - | - | 4,395 | - | 4,395 | |||||||||||||||||||||||
| ||||||||||||||||||||||||||||||||
Total company | ||||||||||||||||||||||||||||||||
Discounted future net cash flows | $ | 5,425 | 7,995 | 13,420 | 288 | 2,629 | 8,202 | 465 | 25,004 | |||||||||||||||||||||||
| ||||||||||||||||||||||||||||||||
163
| Millions of Dollars | ||||||||||||||||||||||||||||||||
|
| |||||||||||||||||||||||||||||||
| Alaska | Lower 48 | Total U.S. | Canada | Europe | Asia Pacific/ Middle East | Africa | Total | |||||||||||||||||||||||||
|
| |||||||||||||||||||||||||||||||
2016 |
| |||||||||||||||||||||||||||||||
Consolidated operations | ||||||||||||||||||||||||||||||||
Future cash inflows | $ | 29,697 | 31,963 | 61,660 | 4,739 | 18,533 | 12,770 | 10,715 | 108,417 | |||||||||||||||||||||||
Less: | ||||||||||||||||||||||||||||||||
Future production costs | 24,965 | 16,936 | 41,901 | 5,103 | 7,469 | 5,288 | 1,420 | 61,181 | ||||||||||||||||||||||||
Future development costs | 7,961 | 8,932 | 16,893 | 1,586 | 9,949 | 2,777 | 537 | 31,742 | ||||||||||||||||||||||||
Future income tax provisions (benefit) | - | 744 | 744 | - | (325 | ) | 1,563 | 7,885 | 9,867 | |||||||||||||||||||||||
| ||||||||||||||||||||||||||||||||
Future net cash flows | (3,229 | ) | 5,351 | 2,122 | (1,950 | ) | 1,440 | 3,142 | 873 | 5,627 | ||||||||||||||||||||||
10 percent annual discount | (3,143 | ) | 976 | (2,167 | ) | (1,297 | ) | (2 | ) | 572 | 370 | (2,524 | ) | |||||||||||||||||||
| ||||||||||||||||||||||||||||||||
Discounted future net cash flows | $ | (86 | ) | 4,375 | 4,289 | (653 | ) | 1,442 | 2,570 | 503 | 8,151 | |||||||||||||||||||||
| ||||||||||||||||||||||||||||||||
Equity affiliates | ||||||||||||||||||||||||||||||||
Future cash inflows | $ | - | - | - | 15,139 | - | 17,829 | - | 32,968 | |||||||||||||||||||||||
Less: | ||||||||||||||||||||||||||||||||
Future production costs | - | - | - | 8,514 | - | 10,620 | - | 19,134 | ||||||||||||||||||||||||
Future development costs | - | - | - | 4,993 | - | 980 | - | 5,973 | ||||||||||||||||||||||||
Future income tax provisions | - | - | - | 164 | - | 1,309 | - | 1,473 | ||||||||||||||||||||||||
| ||||||||||||||||||||||||||||||||
Future net cash flows | - | - | - | 1,468 | - | 4,920 | - | 6,388 | ||||||||||||||||||||||||
10 percent annual discount | - | - | - | 540 | - | 1,911 | - | 2,451 | ||||||||||||||||||||||||
| ||||||||||||||||||||||||||||||||
Discounted future net cash flows | $ | - | - | - | 928 | - | 3,009 | - | 3,937 | |||||||||||||||||||||||
| ||||||||||||||||||||||||||||||||
Total company | ||||||||||||||||||||||||||||||||
Discounted future net cash flows | $ | (86 | ) | 4,375 | 4,289 | 275 | 1,442 | 5,579 | 503 | 12,088 | ||||||||||||||||||||||
| ||||||||||||||||||||||||||||||||
164
| Millions of Dollars | ||||||||||||||||||||||||||||||||
|
| |||||||||||||||||||||||||||||||
| Alaska | Lower 48 | Total U.S. | Canada | Europe | Asia Pacific/ Middle East | Africa | Total | |||||||||||||||||||||||||
|
| |||||||||||||||||||||||||||||||
2015 |
| |||||||||||||||||||||||||||||||
Consolidated operations | ||||||||||||||||||||||||||||||||
Future cash inflows | $ | 44,054 | 42,575 | 86,629 | 22,317 | 27,782 | 19,368 | 13,875 | 169,971 | |||||||||||||||||||||||
Less: | ||||||||||||||||||||||||||||||||
Future production costs | 32,732 | 21,638 | 54,370 | 13,103 | 10,574 | 7,529 | 1,422 | 86,998 | ||||||||||||||||||||||||
Future development costs | 9,885 | 12,967 | 22,852 | 6,471 | 12,793 | 2,884 | 437 | 45,437 | ||||||||||||||||||||||||
Future income tax provisions | - | 844 | 844 | - | 1,506 | 2,708 | 10,998 | 16,056 | ||||||||||||||||||||||||
| ||||||||||||||||||||||||||||||||
Future net cash flows | 1,437 | 7,126 | 8,563 | 2,743 | 2,909 | 6,247 | 1,018 | 21,480 | ||||||||||||||||||||||||
10 percent annual discount | (502 | ) | 1,573 | 1,071 | 1,265 | 733 | 1,349 | 500 | 4,918 | |||||||||||||||||||||||
| ||||||||||||||||||||||||||||||||
Discounted future net cash flows | $ | 1,939 | 5,553 | 7,492 | 1,478 | 2,176 | 4,898 | 518 | 16,562 | |||||||||||||||||||||||
| ||||||||||||||||||||||||||||||||
Equity affiliates | ||||||||||||||||||||||||||||||||
Future cash inflows | $ | - | - | - | 36,211 | - | 34,257 | - | 70,468 | |||||||||||||||||||||||
Less: | ||||||||||||||||||||||||||||||||
Future production costs | - | - | - | 16,417 | - | 17,874 | - | 34,291 | ||||||||||||||||||||||||
Future development costs | - | - | - | 11,869 | - | 2,391 | - | 14,260 | ||||||||||||||||||||||||
Future income tax provisions | - | - | - | 1,648 | - | 3,117 | - | 4,765 | ||||||||||||||||||||||||
| ||||||||||||||||||||||||||||||||
Future net cash flows | - | - | - | 6,277 | - | 10,875 | - | 17,152 | ||||||||||||||||||||||||
10 percent annual discount | - | - | - | 3,827 | - | 4,298 | - | 8,125 | ||||||||||||||||||||||||
| ||||||||||||||||||||||||||||||||
Discounted future net cash flows | $ | - | - | - | 2,450 | - | 6,577 | - | 9,027 | |||||||||||||||||||||||
| ||||||||||||||||||||||||||||||||
Total company | ||||||||||||||||||||||||||||||||
Discounted future net cash flows | $ | 1,939 | 5,553 | 7,492 | 3,928 | 2,176 | 11,475 | 518 | 25,589 | |||||||||||||||||||||||
| ||||||||||||||||||||||||||||||||
165
Sources of Change in Discounted Future Net Cash Flows
| Millions of Dollars | ||||||||||||||||||||||||||||||||||||||||||||
|
| |||||||||||||||||||||||||||||||||||||||||||
| Consolidated Operations | Equity Affiliates | Total Company | ||||||||||||||||||||||||||||||||||||||||||
|
|
|
|
|
| |||||||||||||||||||||||||||||||||||||||
| 2017 | 2016 | 2015 | 2017 | 2016 | 2015 | 2017 | 2016 | 2015 | ||||||||||||||||||||||||||||||||||||
|
| |||||||||||||||||||||||||||||||||||||||||||
Discounted future net cash flows at the beginning of the year | $ | 8,151 | 16,562 | 56,348 | 3,937 | 9,027 | 26,869 | 12,088 | 25,589 | 83,217 | ||||||||||||||||||||||||||||||||||
| ||||||||||||||||||||||||||||||||||||||||||||
Changes during the year | ||||||||||||||||||||||||||||||||||||||||||||
Revenues less production costs for the year | (9,844 | ) | (6,313 | ) | (8,158 | ) | (1,341 | ) | (956 | ) | (966 | ) | (11,185 | ) | (7,269 | ) | (9,124 | ) | ||||||||||||||||||||||||||
Net change in prices and production costs | 19,310 | (16,476 | ) | (82,923 | ) | 2,750 | (9,317 | ) | (27,670 | ) | 22,060 | (25,793 | ) | (110,593 | ) | |||||||||||||||||||||||||||||
Extensions, discoveries and improved recovery, less estimated future costs | 1,445 | 1,358 | 1,791 | (4 | ) | (77 | ) | 319 | 1,441 | 1,281 | 2,110 | |||||||||||||||||||||||||||||||||
Development costs for the year | 3,653 | 3,118 | 6,854 | 426 | 722 | 1,493 | 4,079 | 3,840 | 8,347 | |||||||||||||||||||||||||||||||||||
Changes in estimated future development costs | 1,225 | 6,646 | 2,073 | (64 | ) | 2,435 | (227 | ) | 1,161 | 9,081 | 1,846 | |||||||||||||||||||||||||||||||||
Purchases of reserves in place, less estimated future costs | - | 2 | - | - | - | - | - | 2 | - | |||||||||||||||||||||||||||||||||||
Sales of reserves in place, less estimated future costs | (855 | ) | (123 | ) | (424 | ) | (786 | ) | - | (38 | ) | (1,641 | ) | (123 | ) | (462 | ) | |||||||||||||||||||||||||||
Revisions of previous quantity estimates | 2,300 | (3,252 | ) | (1,790 | ) | (648 | ) | (436 | ) | 938 | 1,652 | (3,688 | ) | (852 | ) | |||||||||||||||||||||||||||||
Accretion of discount | 1,313 | 2,540 | 9,342 | 413 | 1,058 | 3,297 | 1,726 | 3,598 | 12,639 | |||||||||||||||||||||||||||||||||||
Net change in income taxes | (6,089 | ) | 4,089 | 33,449 | (288 | ) | 1,481 | 5,012 | (6,377 | ) | 5,570 | 38,461 | ||||||||||||||||||||||||||||||||
| ||||||||||||||||||||||||||||||||||||||||||||
Total changes | 12,458 | (8,411 | ) | (39,786 | ) | 458 | (5,090 | ) | (17,842 | ) | 12,916 | (13,501 | ) | (57,628 | ) | |||||||||||||||||||||||||||||
| ||||||||||||||||||||||||||||||||||||||||||||
Discounted future net cash flows at year end | $ | 20,609 | 8,151 | 16,562 | 4,395 | 3,937 | 9,027 | 25,004 | 12,088 | 25,589 | ||||||||||||||||||||||||||||||||||
| ||||||||||||||||||||||||||||||||||||||||||||
| • | The net change in prices and production costs is the beginning-of-year reserve-production forecast multiplied by the net annual change in the per-unit sales price and production cost, discounted at 10 percent. |
| • | Purchases and sales of reserves in place, along with extensions, discoveries and improved recovery, are calculated using production forecasts of the applicable reserve quantities for the year multiplied by the 12-month average sales prices, less future estimated costs, discounted at 10 percent. |
| • | Revisions of previous quantity estimates are calculated using production forecast changes for the year, including changes in the timing of production, multiplied by the 12-month average sales prices, less future estimated costs, discounted at 10 percent. |
| • | The accretion of discount is 10 percent of the prior year's discounted future cash inflows, less future production and development costs. |
| • | The net change in income taxes is the annual change in the discounted future income tax provisions. |
166
Selected Quarterly Financial Data (Unaudited)
| Millions of Dollars | Per Share of Common Stock | |||||||||||||||||||||||
| Sales and Other Operating Revenues |
|
| Income (Loss) Before Income Taxes |
|
| Net Income (Loss) |
|
| Net Income (Loss) Attributable to ConocoPhillips |
|
| Net Income (Loss) Attributable to ConocoPhillips |
| ||||||||||
| Basic | Diluted | |||||||||||||||||||||||
|
|
|
| |||||||||||||||||||||
2017 | ||||||||||||||||||||||||
First | $ | 7,518 | (232) | 599 | 586 | 0.47 | 0.47 | |||||||||||||||||
Second | 6,781 | (4,361) | (3,426) | (3,440) | (2.78) | (2.78) | ||||||||||||||||||
Third | 6,688 | 653 | 436 | 420 | 0.35 | 0.34 | ||||||||||||||||||
Fourth | 8,119 | 1,325 | 1,598 | 1,579 | 1.32 | 1.32 | ||||||||||||||||||
| ||||||||||||||||||||||||
2016 | ||||||||||||||||||||||||
First | $ | 5,121 | (2,224) | (1,456) | (1,469) | (1.18) | (1.18) | |||||||||||||||||
Second | 5,348 | (1,644) | (1,058) | (1,071) | (0.86) | (0.86) | ||||||||||||||||||
Third | 6,415 | (1,654) | (1,026) | (1,040) | (0.84) | (0.84) | ||||||||||||||||||
Fourth | 6,809 | (8) | (19) | (35) | (0.03) | (0.03) | ||||||||||||||||||
| ||||||||||||||||||||||||
For additional information on the commodity price environment, see the Business Environment and Executive Overview section of Management's Discussion and Analysis of Financial Condition and Results of Operations.
167
Supplementary Information-Condensed Consolidating Financial Information
We have various cross guarantees among ConocoPhillips, ConocoPhillips Company and ConocoPhillips Canada Funding Company I, with respect to publicly held debt securities. ConocoPhillips Company is 100 percent owned by ConocoPhillips. ConocoPhillips Canada Funding Company I is an indirect, 100 percent owned subsidiary of ConocoPhillips Company. ConocoPhillips and ConocoPhillips Company have fully and unconditionally guaranteed the payment obligations of ConocoPhillips Canada Funding Company I, with respect to their publicly held debt securities. Similarly, ConocoPhillips has fully and unconditionally guaranteed the payment obligations of ConocoPhillips Company with respect to its publicly held debt securities. In addition, ConocoPhillips Company has fully and unconditionally guaranteed the payment obligations of ConocoPhillips with respect to its publicly held debt securities. All guarantees are joint and several. The following condensed consolidating financial information presents the results of operations, financial position and cash flows for:
| • | ConocoPhillips, ConocoPhillips Company and ConocoPhillips Canada Funding Company I (in each case, reflecting investments in subsidiaries utilizing the equity method of accounting). |
| • | All other nonguarantor subsidiaries of ConocoPhillips. |
| • | The consolidating adjustments necessary to present ConocoPhillips' results on a consolidated basis. |
In 2015, ConocoPhillips received a $3.5 billion return of capital from ConocoPhillips Company to settle certain accumulated intercompany balances. The transaction had no impact on our consolidated financial statements.
In 2016, ConocoPhillips received a $2.3 billion return of capital from ConocoPhillips Company to settle certain accumulated intercompany balances. The transaction had no impact on our consolidated financial statements.
In 2016, ConocoPhillips Canada Funding Company I repaid $1.25 billion of external debt. This transaction was reflected in the full-year 2016 condensed consolidating financial statements.
In 2017, ConocoPhillips Company received a $9.8 billion return of capital from a nonguarantor subsidiary to settle certain accumulated intercompany balances. The transaction had no impact on our consolidated financial statements.
In 2017, ConocoPhillips received a $5.0 billion return of capital from ConocoPhillips Company to settle certain accumulated intercompany balances. The transaction had no impact on our consolidated financial statements.
In 2017, ConocoPhillips received a $3.0 billion distribution from ConocoPhillips Company to settle certain accumulated intercompany balances. This consisted of a $2.8 billion return of capital and a $0.2 billion return of earnings. This transaction had no impact on our consolidated financial statements.
In 2017, ConocoPhillips Company received a $1.4 billion loan repayment from a nonguarantor subsidiary to settle certain accumulated intercompany balances. This transaction had no impact on our consolidated financial statements.
This condensed consolidating financial information should be read in conjunction with the accompanying consolidated financial statements and notes.
168
| Millions of Dollars | ||||||||||||||||||||||||
|
| |||||||||||||||||||||||
| Year Ended December 31, 2017 | ||||||||||||||||||||||||
|
| |||||||||||||||||||||||
Income Statement | ConocoPhillips | ConocoPhillips Company | ConocoPhillips Canada Funding Company I | All Other Subsidiaries | Consolidating Adjustments | Total Consolidated | ||||||||||||||||||
|
|
|
|
|
|
|
|
|
|
|
| |||||||||||||
Revenues and Other Income | ||||||||||||||||||||||||
Sales and other operating revenues | $ | - | 12,433 | - | 16,673 | - | 29,106 | |||||||||||||||||
Equity in earnings (losses) of affiliates | (454) | 2,047 | - | 630 | (1,451) | 772 | ||||||||||||||||||
Gain on dispositions | - | 916 | - | 1,261 | - | 2,177 | ||||||||||||||||||
Other income | 2 | 35 | - | 492 | - | 529 | ||||||||||||||||||
Intercompany revenues | 48 | 291 | 170 | 3,405 | (3,914) | - | ||||||||||||||||||
| ||||||||||||||||||||||||
Total Revenues and Other Income | (404) | 15,722 | 170 | 22,461 | (5,365) | 32,584 | ||||||||||||||||||
| ||||||||||||||||||||||||
Costs and Expenses | ||||||||||||||||||||||||
Purchased commodities | - | 11,145 | - | 4,580 | (3,250) | 12,475 | ||||||||||||||||||
Production and operating expenses | - | 832 | - | 4,358 | (17) | 5,173 | ||||||||||||||||||
Selling, general and administrative expenses | 9 | 476 | - | 82 | (6) | 561 | ||||||||||||||||||
Exploration expenses | - | 544 | - | 394 | - | 938 | ||||||||||||||||||
Depreciation, depletion and amortization | - | 855 | - | 5,990 | - | 6,845 | ||||||||||||||||||
Impairments | - | 1,159 | - | 5,442 | - | 6,601 | ||||||||||||||||||
Taxes other than income taxes | - | 140 | - | 669 | - | 809 | ||||||||||||||||||
Accretion on discounted liabilities | - | 32 | - | 330 | - | 362 | ||||||||||||||||||
Interest and debt expense | 420 | 664 | 147 | 508 | (641) | 1,098 | ||||||||||||||||||
Foreign currency transaction (gains) losses | (43) | 11 | 156 | (89) | - | 35 | ||||||||||||||||||
Other expense | 267 | 35 | - | - | - | 302 | ||||||||||||||||||
| ||||||||||||||||||||||||
Total Costs and Expenses | 653 | 15,893 | 303 | 22,264 | (3,914) | 35,199 | ||||||||||||||||||
| ||||||||||||||||||||||||
Income (Loss) before income taxes | (1,057) | (171) | (133) | 197 | (1,451) | (2,615) | ||||||||||||||||||
Income tax provision (benefit) | (202) | 283 | 7 | (1,910) | - | (1,822) | ||||||||||||||||||
| ||||||||||||||||||||||||
Net income (loss) | (855) | (454) | (140) | 2,107 | (1,451) | (793) | ||||||||||||||||||
Less: net income attributable to noncontrolling interests | - | - | - | (62) | - | (62) | ||||||||||||||||||
| ||||||||||||||||||||||||
Net Income (Loss) Attributable to ConocoPhillips | $ | (855) | (454) | (140) | 2,045 | (1,451) | (855) | |||||||||||||||||
| ||||||||||||||||||||||||
Comprehensive Income (Loss) Attributable to ConocoPhillips | $ | (180) | 221 | 23 | 2,703 | (2,947) | (180) | |||||||||||||||||
| ||||||||||||||||||||||||
Income Statement | Year Ended December 31, 2016 | |||||||||||||||||||||||
Revenues and Other Income | ||||||||||||||||||||||||
Sales and other operating revenues | $ | - | 10,352 | - | 13,341 | - | 23,693 | |||||||||||||||||
Equity in earnings (losses) of affiliates | (3,351) | (1,051) | - | (91) | 4,545 | 52 | ||||||||||||||||||
Gain on dispositions | - | 120 | - | 240 | - | 360 | ||||||||||||||||||
Other income | 1 | (11) | - | 265 | - | 255 | ||||||||||||||||||
Intercompany revenues | 88 | 277 | 220 | 3,036 | (3,621) | - | ||||||||||||||||||
| ||||||||||||||||||||||||
Total Revenues and Other Income | (3,262) | 9,687 | 220 | 16,791 | 924 | 24,360 | ||||||||||||||||||
| ||||||||||||||||||||||||
Costs and Expenses | ||||||||||||||||||||||||
Purchased commodities | - | 9,144 | - | 3,562 | (2,712) | 9,994 | ||||||||||||||||||
Production and operating expenses | - | 779 | - | 5,131 | (243) | 5,667 | ||||||||||||||||||
Selling, general and administrative expenses | 8 | 581 | - | 140 | (6) | 723 | ||||||||||||||||||
Exploration expenses | - | 1,231 | - | 684 | - | 1,915 | ||||||||||||||||||
Depreciation, depletion and amortization | - | 1,178 | - | 7,884 | - | 9,062 | ||||||||||||||||||
Impairments | - | 67 | - | 72 | - | 139 | ||||||||||||||||||
Taxes other than income taxes | - | 162 | - | 577 | - | 739 | ||||||||||||||||||
Accretion on discounted liabilities | - | 46 | - | 379 | - | 425 | ||||||||||||||||||
Interest and debt expense | 506 | 622 | 207 | 570 | (660) | 1,245 | ||||||||||||||||||
Foreign currency transaction (gains) losses | (19) | 2 | 174 | (176) | - | (19) | ||||||||||||||||||
| ||||||||||||||||||||||||
Total Costs and Expenses | 495 | 13,812 | 381 | 18,823 | (3,621) | 29,890 | ||||||||||||||||||
| ||||||||||||||||||||||||
Loss before income taxes | (3,757) | (4,125) | (161) | (2,032) | 4,545 | (5,530) | ||||||||||||||||||
Income tax benefit | (142) | (774) | (9) | (1,046) | - | (1,971) | ||||||||||||||||||
| ||||||||||||||||||||||||
Net loss | (3,615) | (3,351) | (152) | (986) | 4,545 | (3,559) | ||||||||||||||||||
Less: net income attributable to noncontrolling interests | - | - | - | (56) | - | (56) | ||||||||||||||||||
| ||||||||||||||||||||||||
Net Loss Attributable to ConocoPhillips | $ | (3,615) | (3,351) | (152) | (1,042) | 4,545 | (3,615) | |||||||||||||||||
| ||||||||||||||||||||||||
Comprehensive Loss Attributable to ConocoPhillips | $ | (3,561) | (3,297) | (27) | (952) | 4,276 | (3,561) | |||||||||||||||||
| ||||||||||||||||||||||||
169
| Millions of Dollars | ||||||||||||||||||||||||
|
| |||||||||||||||||||||||
| Year Ended December 31, 2015 | ||||||||||||||||||||||||
|
| |||||||||||||||||||||||
Income Statement | ConocoPhillips | ConocoPhillips Company | ConocoPhillips Canada Funding Company I | All Other Subsidiaries | Consolidating Adjustments | Total Consolidated | ||||||||||||||||||
|
|
|
|
|
|
|
|
|
|
|
| |||||||||||||
Revenues and Other Income | ||||||||||||||||||||||||
Sales and other operating revenues | $ | - | 11,473 | - | 18,091 | - | 29,564 | |||||||||||||||||
Equity in earnings (losses) of affiliates | (4,081 | ) | (1,950 | ) | - | 1,364 | 5,322 | 655 | ||||||||||||||||
Gain on dispositions | - | 332 | - | 259 | - | 591 | ||||||||||||||||||
Other income | - | 12 | - | 113 | - | 125 | ||||||||||||||||||
Intercompany revenues | 74 | 341 | 246 | 3,365 | (4,026 | ) | - | |||||||||||||||||
| ||||||||||||||||||||||||
Total Revenues and Other Income | (4,007 | ) | 10,208 | 246 | 23,192 | 1,296 | 30,935 | |||||||||||||||||
| ||||||||||||||||||||||||
Costs and Expenses | ||||||||||||||||||||||||
Purchased commodities | - | 9,905 | - | 5,838 | (3,317 | ) | 12,426 | |||||||||||||||||
Production and operating expenses | - | 1,469 | - | 5,585 | (38 | ) | 7,016 | |||||||||||||||||
Selling, general and administrative expenses | 9 | 744 | 1 | 209 | (10 | ) | 953 | |||||||||||||||||
Exploration expenses | - | 2,093 | - | 2,099 | - | 4,192 | ||||||||||||||||||
Depreciation, depletion and amortization | - | 1,201 | - | 7,912 | - | 9,113 | ||||||||||||||||||
Impairments | - | 15 | - | 2,230 | - | 2,245 | ||||||||||||||||||
Taxes other than income taxes | - | 173 | - | 728 | - | 901 | ||||||||||||||||||
Accretion on discounted liabilities | - | 58 | - | 425 | - | 483 | ||||||||||||||||||
Interest and debt expense | 485 | 423 | 226 | 447 | (661 | ) | 920 | |||||||||||||||||
Foreign currency transaction (gains) losses | 114 | 1 | (708 | ) | 518 | - | (75 | ) | ||||||||||||||||
| ||||||||||||||||||||||||
Total Costs and Expenses | 608 | 16,082 | (481 | ) | 25,991 | (4,026 | ) | 38,174 | ||||||||||||||||
| ||||||||||||||||||||||||
Income (loss) before income taxes | (4,615 | ) | (5,874 | ) | 727 | (2,799 | ) | 5,322 | (7,239 | ) | ||||||||||||||
Income tax provision (benefit) | (187 | ) | (1,793 | ) | 21 | (909 | ) | - | (2,868 | ) | ||||||||||||||
| ||||||||||||||||||||||||
Net income (loss) | (4,428 | ) | (4,081 | ) | 706 | (1,890 | ) | 5,322 | (4,371 | ) | ||||||||||||||
Less: net income attributable to noncontrolling interests | - | - | - | (57 | ) | - | (57 | ) | ||||||||||||||||
| ||||||||||||||||||||||||
Net Income (Loss) Attributable to ConocoPhillips | $ | (4,428 | ) | (4,081 | ) | 706 | (1,947 | ) | 5,322 | (4,428 | ) | |||||||||||||
| ||||||||||||||||||||||||
Comprehensive Income (Loss) Attributable to ConocoPhillips | $ | (8,773 | ) | (8,426 | ) | 71 | (6,705 | ) | 15,060 | (8,773 | ) | |||||||||||||
| ||||||||||||||||||||||||
170
| Millions of Dollars | ||||||||||||||||||||||||
|
| |||||||||||||||||||||||
| At December 31, 2017 | ||||||||||||||||||||||||
|
| |||||||||||||||||||||||
Balance Sheet | ConocoPhillips | ConocoPhillips Company | ConocoPhillips Canada Funding Company I | All Other Subsidiaries | Consolidating Adjustments | Total Consolidated | ||||||||||||||||||
|
|
|
|
|
|
|
|
|
|
|
| |||||||||||||
Assets | ||||||||||||||||||||||||
Cash and cash equivalents | $ | - | 234 | 4 | 6,087 | - | 6,325 | |||||||||||||||||
Short-term investments | - | - | - | 1,873 | - | 1,873 | ||||||||||||||||||
Accounts and notes receivable | 24 | 2,255 | 35 | 4,870 | (2,864 | ) | 4,320 | |||||||||||||||||
Investment in Cenovus Energy | - | 1,899 | - | - | - | 1,899 | ||||||||||||||||||
Inventories | - | 163 | - | 897 | - | 1,060 | ||||||||||||||||||
Prepaid expenses and other current assets | 1 | 278 | 6 | 779 | (29 | ) | 1,035 | |||||||||||||||||
| ||||||||||||||||||||||||
Total Current Assets | 25 | 4,829 | 45 | 14,506 | (2,893 | ) | 16,512 | |||||||||||||||||
Investments, loans and long-term receivables* | 29,400 | 47,974 | 2,533 | 15,050 | (84,897 | ) | 10,060 | |||||||||||||||||
Net properties, plants and equipment | - | 4,230 | - | 41,930 | (477 | ) | 45,683 | |||||||||||||||||
Other assets | 15 | 1,146 | 186 | 1,302 | (1,542 | ) | 1,107 | |||||||||||||||||
| ||||||||||||||||||||||||
Total Assets | $ | 29,440 | 58,179 | 2,764 | 72,788 | (89,809 | ) | 73,362 | ||||||||||||||||
| ||||||||||||||||||||||||
Liabilities and Stockholders' Equity | ||||||||||||||||||||||||
Accounts payable | $ | - | 3,094 | 1 | 3,799 | (2,864 | ) | 4,030 | ||||||||||||||||
Short-term debt | (5 | ) | 2,505 | 7 | 77 | (9 | ) | 2,575 | ||||||||||||||||
Accrued income and other taxes | - | 107 | - | 931 | - | 1,038 | ||||||||||||||||||
Employee benefit obligations | - | 554 | - | 171 | - | 725 | ||||||||||||||||||
Other accruals | 85 | 314 | 48 | 612 | (30 | ) | 1,029 | |||||||||||||||||
| ||||||||||||||||||||||||
Total Current Liabilities | 80 | 6,574 | 56 | 5,590 | (2,903 | ) | 9,397 | |||||||||||||||||
Long-term debt | 3,787 | 9,321 | 1,703 | 2,794 | (477 | ) | 17,128 | |||||||||||||||||
Asset retirement obligations and accrued environmental costs | - | 432 | - | 7,199 | - | 7,631 | ||||||||||||||||||
Deferred income taxes | - | - | - | 6,263 | (981 | ) | 5,282 | |||||||||||||||||
Employee benefit obligations | - | 1,335 | - | 519 | - | 1,854 | ||||||||||||||||||
Other liabilities and deferred credits* | 1,528 | 5,229 | 926 | 9,215 | (15,629 | ) | 1,269 | |||||||||||||||||
| ||||||||||||||||||||||||
Total Liabilities | 5,395 | 22,891 | 2,685 | 31,580 | (19,990 | ) | 42,561 | |||||||||||||||||
Retained earnings | 22,867 | 13,317 | (681 | ) | 11,958 | (18,070 | ) | 29,391 | ||||||||||||||||
Other common stockholders' equity | 1,178 | 21,971 | 760 | 29,056 | (51,749 | ) | 1,216 | |||||||||||||||||
Noncontrolling interests | - | - | - | 194 | - | 194 | ||||||||||||||||||
| ||||||||||||||||||||||||
Total Liabilities and Stockholders' Equity | $ | 29,440 | 58,179 | 2,764 | 72,788 | (89,809 | ) | 73,362 | ||||||||||||||||
| ||||||||||||||||||||||||
Balance Sheet | At December 31, 2016 | |||||||||||||||||||||||
|
| |||||||||||||||||||||||
Assets | ||||||||||||||||||||||||
Cash and cash equivalents | $ | - | 358 | 13 | 3,239 | - | 3,610 | |||||||||||||||||
Short-term investments | - | - | - | 50 | - | 50 | ||||||||||||||||||
Accounts and notes receivable | 22 | 1,968 | 23 | 6,103 | (4,702 | ) | 3,414 | |||||||||||||||||
Inventories | - | 84 | - | 934 | - | 1,018 | ||||||||||||||||||
Prepaid expenses and other current assets | 2 | 116 | 8 | 415 | (24 | ) | 517 | |||||||||||||||||
| ||||||||||||||||||||||||
Total Current Assets | 24 | 2,526 | 44 | 10,741 | (4,726 | ) | 8,609 | |||||||||||||||||
Investments, loans and long-term receivables* | 37,901 | 64,434 | 2,296 | 31,643 | (114,602 | ) | 21,672 | |||||||||||||||||
Net properties, plants and equipment | - | 6,301 | - | 52,030 | - | 58,331 | ||||||||||||||||||
Other assets | 40 | 2,194 | 220 | 1,240 | (2,534 | ) | 1,160 | |||||||||||||||||
| ||||||||||||||||||||||||
Total Assets | $ | 37,965 | 75,455 | 2,560 | 95,654 | (121,862 | ) | 89,772 | ||||||||||||||||
| ||||||||||||||||||||||||
Liabilities and Stockholders' Equity | ||||||||||||||||||||||||
Accounts payable | $ | - | 4,683 | 1 | 3,671 | (4,702 | ) | 3,653 | ||||||||||||||||
Short-term debt | (10 | ) | 999 | 6 | 94 | - | 1,089 | |||||||||||||||||
Accrued income and other taxes | - | 85 | - | 399 | - | 484 | ||||||||||||||||||
Employee benefit obligations | - | 489 | - | 200 | - | 689 | ||||||||||||||||||
Other accruals | 171 | 271 | 40 | 536 | (24 | ) | 994 | |||||||||||||||||
| ||||||||||||||||||||||||
Total Current Liabilities | 161 | 6,527 | 47 | 4,900 | (4,726 | ) | 6,909 | |||||||||||||||||
Long-term debt | 8,975 | 12,635 | 1,710 | 2,866 | - | 26,186 | ||||||||||||||||||
Asset retirement obligations and accrued environmental costs | - | 925 | - | 7,500 | - | 8,425 | ||||||||||||||||||
Deferred income taxes | - | - | - | 10,972 | (2,023 | ) | 8,949 | |||||||||||||||||
Employee benefit obligations | - | 1,901 | - | 651 | - | 2,552 | ||||||||||||||||||
Other liabilities and deferred credits* | 417 | 10,391 | 748 | 17,832 | (27,863 | ) | 1,525 | |||||||||||||||||
| ||||||||||||||||||||||||
Total Liabilities | 9,553 | 32,379 | 2,505 | 44,721 | (34,612 | ) | 54,546 | |||||||||||||||||
Retained earnings | 25,025 | 14,015 | (541 | ) | 12,883 | (19,834 | ) | 31,548 | ||||||||||||||||
Other common stockholders' equity | 3,387 | 29,061 | 596 | 37,798 | (67,416 | ) | 3,426 | |||||||||||||||||
Noncontrolling interests | - | - | - | 252 | - | 252 | ||||||||||||||||||
| ||||||||||||||||||||||||
Total Liabilities and Stockholders' Equity | $ | 37,965 | 75,455 | 2,560 | 95,654 | (121,862 | ) | 89,772 | ||||||||||||||||
| ||||||||||||||||||||||||
*Includes intercompany loans.
171
| Millions of Dollars | ||||||||||||||||||||||||
|
| |||||||||||||||||||||||
| Statement of Cash Flows | Year Ended December 31, 2017 | |||||||||||||||||||||||
|
| |||||||||||||||||||||||
| ConocoPhillips | ConocoPhillips Company | ConocoPhillips Canada Funding Company I | All Other Subsidiaries | Consolidating Adjustments | Total Consolidated | |||||||||||||||||||
|
|
|
|
|
|
|
|
|
|
|
| |||||||||||||
Cash Flows From Operating Activities | ||||||||||||||||||||||||
Net Cash Provided by (Used in) Operating Activities | $ | 71 | 1,183 | (74) | 8,931 | (3,034) | 7,077 | |||||||||||||||||
| ||||||||||||||||||||||||
Cash Flows From Investing Activities | ||||||||||||||||||||||||
Capital expenditures and investments | - | (1,663) | - | (3,795) | 867 | (4,591) | ||||||||||||||||||
Working capital changes associated with investing activities | - | 194 | - | (62) | - | 132 | ||||||||||||||||||
Proceeds from asset dispositions | 7,765 | 11,146 | - | 12,796 | (17,847) | 13,860 | ||||||||||||||||||
Net purchases of short-term investments | - | - | - | (1,790) | - | (1,790) | ||||||||||||||||||
Long-term advances/loans-related parties | - | (214) | - | (85) | 299 | - | ||||||||||||||||||
Collection of advances/loans-related parties | 658 | 1,527 | - | 2,196 | (4,266) | 115 | ||||||||||||||||||
Intercompany cash management | 1,151 | 101 | - | (1,252) | - | - | ||||||||||||||||||
Other | - | (8) | - | 44 | - | 36 | ||||||||||||||||||
| ||||||||||||||||||||||||
Net Cash Provided by Investing Activities | 9,574 | 11,083 | - | 8,052 | (20,947) | 7,762 | ||||||||||||||||||
| ||||||||||||||||||||||||
Cash Flows From Financing Activities | ||||||||||||||||||||||||
Issuance of debt | - | 20 | 65 | 214 | (299) | - | ||||||||||||||||||
Repayment of debt | (5,459) | (4,411) | - | (2,272) | 4,266 | (7,876) | ||||||||||||||||||
Issuance of company common stock | 115 | - | - | - | (178) | (63) | ||||||||||||||||||
Repurchase of company common stock | (3,000) | - | - | - | - | (3,000) | ||||||||||||||||||
Dividends paid | (1,305) | (235) | - | (2,977) | 3,212 | (1,305) | ||||||||||||||||||
Other | 4 | (7,765) | - | (9,331) | 16,980 | (112) | ||||||||||||||||||
| ||||||||||||||||||||||||
Net Cash Provided by (Used in) Financing Activities | (9,645) | (12,391) | 65 | (14,366) | 23,981 | (12,356) | ||||||||||||||||||
| ||||||||||||||||||||||||
Effect of Exchange Rate Changes on Cash and Cash Equivalents | - | 1 | - | 231 | - | 232 | ||||||||||||||||||
| ||||||||||||||||||||||||
Net Change in Cash and Cash Equivalents | - | (124) | (9) | 2,848 | - | 2,715 | ||||||||||||||||||
Cash and cash equivalents at beginning of period | - | 358 | 13 | 3,239 | - | 3,610 | ||||||||||||||||||
| ||||||||||||||||||||||||
Cash and Cash Equivalents at End of Period | $ | - | 234 | 4 | 6,087 | - | 6,325 | |||||||||||||||||
| ||||||||||||||||||||||||
Statement of Cash Flows | Year Ended December 31, 2016 | |||||||||||||||||||||||
|
| |||||||||||||||||||||||
Cash Flows From Operating Activities | ||||||||||||||||||||||||
Net Cash Provided by (Used in) Operating Activities | $ | (306) | (322) | (2) | 5,903 | (870) | 4,403 | |||||||||||||||||
| ||||||||||||||||||||||||
Cash Flows From Investing Activities | ||||||||||||||||||||||||
Capital expenditures and investments | - | (989) | - | (4,281) | 401 | (4,869) | ||||||||||||||||||
Working capital changes associated with investing activities | - | (126) | - | (205) | - | (331) | ||||||||||||||||||
Proceeds from asset dispositions | 2,300 | 266 | - | 1,114 | (2,394) | 1,286 | ||||||||||||||||||
Net purchases of short-term investments | - | - | - | (51) | - | (51) | ||||||||||||||||||
Long-term advances/loans-related parties | - | (812) | - | - | 812 | - | ||||||||||||||||||
Collection of advances/loans-related parties | - | 391 | 1,250 | 272 | (1,805) | 108 | ||||||||||||||||||
Intercompany cash management | (2,214) | 1,433 | - | 781 | - | - | ||||||||||||||||||
Other | - | 1 | - | (3) | - | (2) | ||||||||||||||||||
| ||||||||||||||||||||||||
Net Cash Provided by (Used in) Investing Activities | 86 | 164 | 1,250 | (2,373) | (2,986) | (3,859) | ||||||||||||||||||
| ||||||||||||||||||||||||
Cash Flows From Financing Activities | ||||||||||||||||||||||||
Issuance of debt | 1,600 | 2,994 | - | 812 | (812) | 4,594 | ||||||||||||||||||
Repayment of debt | (150) | (164) | (1,250) | (2,492) | 1,805 | (2,251) | ||||||||||||||||||
Issuance of company common stock | 148 | - | - | - | (211) | (63) | ||||||||||||||||||
Repurchase of company common stock | (126) | - | - | - | - | (126) | ||||||||||||||||||
Dividends paid | (1,253) | - | - | (1,081) | 1,081 | (1,253) | ||||||||||||||||||
Other | 1 | (2,315) | - | 184 | 1,993 | (137) | ||||||||||||||||||
| ||||||||||||||||||||||||
Net Cash Provided by (Used in) Financing Activities | 220 | 515 | (1,250) | (2,577) | 3,856 | 764 | ||||||||||||||||||
| ||||||||||||||||||||||||
Effect of Exchange Rate Changes on Cash and Cash Equivalents | - | (3) | - | (63) | - | (66) | ||||||||||||||||||
| ||||||||||||||||||||||||
Net Change in Cash and Cash Equivalents | - | 354 | (2) | 890 | - | 1,242 | ||||||||||||||||||
Cash and cash equivalents at beginning of period | - | 4 | 15 | 2,349 | - | 2,368 | ||||||||||||||||||
| ||||||||||||||||||||||||
Cash and Cash Equivalents at End of Period | $ | - | 358 | 13 | 3,239 | - | 3,610 | |||||||||||||||||
| ||||||||||||||||||||||||
172
| Millions of Dollars | ||||||||||||||||||||||||
|
| |||||||||||||||||||||||
| Statement of Cash Flows | Year Ended December 31, 2015 | |||||||||||||||||||||||
|
| |||||||||||||||||||||||
| ConocoPhillips | | ConocoPhillips Company | | | ConocoPhillips Canada Funding Company I | | | All Other Subsidiaries | | | Consolidating Adjustments | | | Total Consolidated | | |||||||||
|
|
|
|
|
|
|
|
|
|
|
| |||||||||||||
Cash Flows From Operating Activities | ||||||||||||||||||||||||
Net Cash Provided by (Used in) Operating Activities | $ | (225) | 245 | 9 | 7,519 | 24 | 7,572 | |||||||||||||||||
| ||||||||||||||||||||||||
Cash Flows From Investing Activities | ||||||||||||||||||||||||
Capital expenditures and investments | - | (3,064) | - | (8,386) | 1,400 | (10,050) | ||||||||||||||||||
Working capital changes associated with investing activities | - | (4) | - | (964) | - | (968) | ||||||||||||||||||
Proceeds from asset dispositions | 3,500 | 826 | - | 1,225 | (3,599) | 1,952 | ||||||||||||||||||
Long-term advances/loans-related parties | - | (278) | - | (2,245) | 2,523 | - | ||||||||||||||||||
Collection of advances/loans-related parties | - | - | - | 205 | (100) | 105 | ||||||||||||||||||
Intercompany cash management | 102 | 46 | - | (148) | - | - | ||||||||||||||||||
Other | - | 304 | - | 1 | 1 | 306 | ||||||||||||||||||
| ||||||||||||||||||||||||
Net Cash Provided by (Used in) Investing Activities | 3,602 | (2,170) | - | (10,312) | 225 | (8,655) | ||||||||||||||||||
| ||||||||||||||||||||||||
Cash Flows From Financing Activities | ||||||||||||||||||||||||
Issuance of debt | - | 4,743 | - | 278 | (2,523) | 2,498 | ||||||||||||||||||
Repayment of debt | - | (100) | - | (103) | 100 | (103) | ||||||||||||||||||
Issuance of company common stock | 283 | - | - | (2) | (363) | (82) | ||||||||||||||||||
Dividends paid | (3,664) | - | - | (339) | 339 | (3,664) | ||||||||||||||||||
Other | 4 | (3,484) | - | 1,204 | 2,198 | (78) | ||||||||||||||||||
| ||||||||||||||||||||||||
Net Cash Provided by (Used in) Financing Activities | (3,377) | 1,159 | - | 1,038 | (249) | (1,429) | ||||||||||||||||||
| ||||||||||||||||||||||||
Effect of Exchange Rate Changes on Cash and Cash Equivalents | - | - | (1) | (181) | - | (182) | ||||||||||||||||||
| ||||||||||||||||||||||||
Net Change in Cash and Cash Equivalents | - | (766) | 8 | (1,936) | - | (2,694) | ||||||||||||||||||
Cash and cash equivalents at beginning of period | - | 770 | 7 | 4,285 | - | 5,062 | ||||||||||||||||||
| ||||||||||||||||||||||||
Cash and Cash Equivalents at End of Period | $ | - | 4 | 15 | 2,349 | - | 2,368 | |||||||||||||||||
| ||||||||||||||||||||||||
173
| Item 9. | CHANGES IN AND DISAGREEMENTS WITH ACCOUNTANTS ON ACCOUNTING AND FINANCIAL DISCLOSURE |
None.
| Item 9A. | CONTROLS AND PROCEDURES |
We maintain disclosure controls and procedures designed to ensure information required to be disclosed in reports we file or submit under the Securities Exchange Act of 1934, as amended (the Act), is recorded, processed, summarized and reported within the time periods specified in Securities and Exchange Commission rules and forms, and that such information is accumulated and communicated to management, including our principal executive and principal financial officers, as appropriate, to allow timely decisions regarding required disclosure. As of December 31, 2017, with the participation of our management, our Chairman and Chief Executive Officer (principal executive officer) and our Executive Vice President, Finance, Commercial and Chief Financial Officer (principal financial officer) carried out an evaluation, pursuant to Rule 13a-15(b) of the Act, of ConocoPhillips' disclosure controls and procedures (as defined in Rule 13a-15(e) of the Act). Based upon that evaluation, our Chairman and Chief Executive Officer and our Executive Vice President, Finance, Commercial and Chief Financial Officer concluded our disclosure controls and procedures were operating effectively as of December 31, 2017.
There have been no changes in our internal control over financial reporting, as defined in Rule 13a-15(f) of the Act, in the period covered by this report that have materially affected, or are reasonably likely to materially affect, our internal control over financial reporting.
Management's Annual Report on Internal Control Over Financial Reporting
This report is included in Item 8 on page 76 and is incorporated herein by reference.
Report of Independent Registered Public Accounting Firm
This report is included in Item 8 on page 78 and is incorporated herein by reference.
| Item 9B. | OTHER INFORMATION |
None.
174
PART III
| It em 10. | DIRECTORS, EXECUTIVE OFFICERS AND CORPORATE GOVERNANCE |
Information regarding our executive officers appears in Part I of this report on page 26.
Code of Business Ethics and Conduct for Directors and Employees
We have a Code of Business Ethics and Conduct for Directors and Employees (Code of Ethics), including our principal executive officer, principal financial officer, principal accounting officer and persons performing similar functions. We have posted a copy of our Code of Ethics on the "Corporate Governance" section of our internet website at www.conocophillips.com (within the Investors>Corporate Governance section) . Any waivers of the Code of Ethics must be approved, in advance, by our full Board of Directors. Any amendments to, or waivers from, the Code of Ethics that apply to our executive officers and directors will be posted on the "Corporate Governance" section of our internet website.
All other information required by Item 10 of Part III will be included in our Proxy Statement relating to our 2018 Annual Meeting of Stockholders, to be filed pursuant to Regulation 14A on or before April 30, 2018, and is incorporated herein by reference.*
| Item 11. | EXECUTIVE COMPENSATION |
Information required by Item 11 of Part III will be included in our Proxy Statement relating to our 2018 Annual Meeting of Stockholders, to be filed pursuant to Regulation 14A on or before April 30, 2018, and is incorporated herein by reference.*
| Item 12. | SECURITY OWNERSHIP OF CERTAIN BENEFICIAL OWNERS AND MANAGEMENT AND RELATED STOCKHOLDER MATTERS |
Information required by Item 12 of Part III will be included in our Proxy Statement relating to our 2018 Annual Meeting of Stockholders, to be filed pursuant to Regulation 14A on or before April 30, 2018, and is incorporated herein by reference.*
| Item 13. | CERTAIN RELATIONSHIPS AND RELATED TRANSACTIONS, AND DIRECTOR INDEPENDENCE |
Information required by Item 13 of Part III will be included in our Proxy Statement relating to our 2018 Annual Meeting of Stockholders, to be filed pursuant to Regulation 14A on or before April 30, 2018, and is incorporated herein by reference.*
| Item 14. | PRINCIPAL ACCOUNTING FEES AND SERVICES |
Information required by Item 14 of Part III will be included in our Proxy Statement relating to our 2018 Annual Meeting of Stockholders, to be filed pursuant to Regulation 14A on or before April 30, 2018, and is incorporated herein by reference.*
*Except for information or data specifically incorporated herein by reference under Items 10 through 14, other information and data appearing in our 2018 Proxy Statement are not deemed to be a part of this Annual Report on Form 10-K or deemed to be filed with the Commission as a part of this report.
175
PART IV
| Item 15. | EXHIBITS, FINANCIAL STATEMENT SCHEDULES |
| (a) 1. | Financial Statements and Supplementary Data |
The financial statements and supplementary information listed in the Index to Financial Statements, which appears on page 75, are filed as part of this annual report.
| 2. | Financial Statement Schedules |
Schedule II-Valuation and Qualifying Accounts, appears below. All other schedules are omitted because they are not required, not significant, not applicable or the information is shown in another schedule, the financial statements or the notes to consolidated financial statements.
| 3. | Exhibits |
The exhibits listed in the Index to Exhibits, which appears on pages 177 through 187, are filed as part of this annual report.
SCHEDULE II-VALUATION AND QUALIFYING ACCOUNTS (Consolidated)
ConocoPhillips
| Millions of Dollars | ||||||||||||||||||||
Description |
| Balance at January 1 |
| Charged to Expense | Other(a) | Deductions | Balance at December 31 | |||||||||||||
2017 | ||||||||||||||||||||
Deducted from asset accounts: | ||||||||||||||||||||
Allowance for doubtful accounts and notes receivable | $ | 5 | 2 | - | (3 | )(b) | 4 | |||||||||||||
Deferred tax asset valuation allowance | 675 | 560 | (c) | 19 | - | 1,254 | ||||||||||||||
Included in other liabilities: | ||||||||||||||||||||
Restructuring accruals | 80 | 65 | 1 | (93 | )(d) | 53 | ||||||||||||||
| ||||||||||||||||||||
2016 | ||||||||||||||||||||
Deducted from asset accounts: | ||||||||||||||||||||
Allowance for doubtful accounts and notes receivable | $ | 7 | 3 | (1) | (4 | )(b) | 5 | |||||||||||||
Deferred tax asset valuation allowance | 734 | (31) | (12) | (16 | ) | 675 | ||||||||||||||
Included in other liabilities: | ||||||||||||||||||||
Restructuring accruals | 156 | 129 | 1 | (206 | )(d) | 80 | ||||||||||||||
2015 | ||||||||||||||||||||
Deducted from asset accounts: | ||||||||||||||||||||
Allowance for doubtful accounts and notes receivable | $ | 5 | 4 | (2) | - | (b) | 7 | |||||||||||||
Deferred tax asset valuation allowance | 970 | 6 | (21) | (221 | ) | 734 | ||||||||||||||
Included in other liabilities: | ||||||||||||||||||||
Restructuring accruals | 61 | 303 | (8) | (200 | )(d) | 156 | ||||||||||||||
(a)Represents acquisitions/dispositions/revisions and the effect of translating foreign financial statements.
(b)Amounts charged off less recoveries of amounts previously charged off.
(c)Includes an adjustment to the U.S. tax basis due to U.S. Tax Legislation.
(d)Benefit payments.
176
CONOCOPHILLIPS
INDEX TO EXHIBITS
Exhibit Number | Description | |
| 2.1 | Separation and Distribution Agreement Between ConocoPhillips and Phillips 66, dated April 26, 2012 (incorporated by reference to Exhibit 2.1 to the Current Report of ConocoPhillips on Form 8-K filed on May 1, 2012; File No. 001-32395). | |
| 2.2†‡ | Purchase and Sale Agreement, dated March 29, 2017, by and among ConocoPhillips Company, ConocoPhillips Canada Resources Corp., ConocoPhillips Canada Energy Partnership, ConocoPhillips Western Canada Partnership, ConocoPhillips Canada (BRC) Partnership, ConocoPhillips Canada E&P ULC, and Cenovus Energy Inc. (incorporated by reference to Exhibit 2.1 to the Quarterly Report on Form 10-Q for the quarter ended March 31, 2017 filed by ConocoPhillips on May 4, 2017). | |
| 2.3†‡ | Asset Purchase and Sale Agreement Amending Agreement, dated as of May 16, 2017, by and among ConocoPhillips Company, ConocoPhillips Canada Resources Corp., ConocoPhillips Canada Energy Partnership, ConocoPhillips Western Canada Partnership, ConocoPhillips Canada (BRC) Partnership, ConocoPhillips Canada E&P ULC, and Cenovus Energy Inc. (incorporated by reference to Exhibit 2.2 to the Current Report of ConocoPhillips on Form 8-K filed on May 18, 2017; File No. 001-32395). | |
| 3.1 | Amended and Restated Certificate of Incorporation (incorporated by reference to Exhibit 3.1 to the Quarterly Report of ConocoPhillips on Form 10-Q for the quarterly period ended June 30, 2008; File No. 001-32395). | |
| 3.2 | Certificate of Designations of Series A Junior Participating Preferred Stock of ConocoPhillips (incorporated by reference to Exhibit 3.2 to the Current Report of ConocoPhillips on Form 8-K filed on August 30, 2002; File No. 000-49987). | |
| 3.3 | Amended and Restated By-Laws of ConocoPhillips, as amended and restated as of October 9, 2015 (incorporated by reference to Exhibit 3.1 to the Current Report of ConocoPhillips on Form 8-K filed on October 13, 2015; File No. 001-32395). | |
| ConocoPhillips and its subsidiaries are parties to several debt instruments under which the total amount of securities authorized does not exceed 10 percent of the total assets of ConocoPhillips and its subsidiaries on a consolidated basis. Pursuant to paragraph 4(iii)(A) of Item 601(b) of Regulation S-K, ConocoPhillips agrees to furnish a copy of such instruments to the SEC upon request. | ||
| 10.1 | 1986 Stock Plan of Phillips Petroleum Company (incorporated by reference to Exhibit 10.11 to the Annual Report of ConocoPhillips on Form 10-K for the year ended December 31, 2002; File No. 000-49987). | |
| 10.2 | 1990 Stock Plan of Phillips Petroleum Company (incorporated by reference to Exhibit 10.12 to the Annual Report of ConocoPhillips on Form 10-K for the year ended December 31, 2002; File No. 000-49987). | |
177
| Exhibit Number | Description | |
| 10.3 | Annual Incentive Compensation Plan of Phillips Petroleum Company (incorporated by reference to Exhibit 10.13 to the Annual Report of ConocoPhillips on Form 10-K for the year ended December 31, 2002; File No. 000-49987). | |
| 10.4 | Incentive Compensation Plan of Phillips Petroleum Company (incorporated by reference to Exhibit 10(g) to the Annual Report of ConocoPhillips Company on Form 10-K for the year ended December 31, 1999; File No. 001-00720). | |
| 10.5 | Amendment and Restatement of ConocoPhillips Supplemental Executive Retirement Plan, dated April 19, 2012 (incorporated by reference to Exhibit 10.14 to the Quarterly Report of ConocoPhillips on Form 10-Q for the quarter ended June 30, 2012; File No. 001-32395). | |
| 10.6 | Non-Employee Director Retirement Plan of Phillips Petroleum Company (incorporated by reference to Exhibit 10.18 to the Annual Report of ConocoPhillips on Form 10-K for the year ended December 31, 2002; File No. 000-49987). | |
| 10.7 | Omnibus Securities Plan of Phillips Petroleum Company (incorporated by reference to Exhibit 10.19 to the Annual Report of ConocoPhillips on Form 10-K for the year ended December 31, 2002; File No. 000-49987). | |
| 10.8 | Key Employee Missed Credited Service Retirement Plan of ConocoPhillips (incorporated by reference to Exhibit 10.10 to the Annual Report of ConocoPhillips on Form 10-K for the year ended December 31, 2005; File No. 001-32395). | |
| 10.9 | Phillips Petroleum Company Stock Plan for Non-Employee Directors (incorporated by reference to Exhibit 10.22 to the Annual Report of ConocoPhillips on Form 10-K for the year ended December 31, 2002; File No. 000-49987). | |
| 10.10.1 | Amendment and Restatement of ConocoPhillips Key Employee Supplemental Retirement Plan, dated April 19, 2012 (incorporated by reference to Exhibit 10.13 to the Quarterly Report of ConocoPhillips on Form 10-Q for the quarter ended June 30, 2012; File No. 001-32395). | |
| 10.10.2 | First Amendment to the ConocoPhillips Key Employee Supplemental Retirement Plan, dated July 20, 2015 (incorporated by reference to Exhibit 10.10.2 to the Annual Report of ConocoPhillips on Form 10-K for the year ended December 31, 2015; File No. 001-32395). | |
| 10.10.3 | Second Amendment to the ConocoPhillips Key Employee Supplemental Retirement Plan, dated March 14, 2016 (incorporated by reference to Exhibit 10.1 to the Quarterly Report of ConocoPhillips on Form 10-Q for the quarter ended March 31, 2016; File No. 001-32395). | |
| 10.11.1 | Amendment and Restatement of Defined Contribution Make-Up Plan of ConocoPhillips-Title I, dated April 19, 2012 (incorporated by reference to Exhibit 10.11.1 to the Quarterly Report of ConocoPhillips on Form 10-Q for the quarter ended June 30, 2012; File No. 001-32395). | |
| 10.11.2 | Amendment and Restatement of Defined Contribution Make-Up Plan of ConocoPhillips-Title II, dated April 19, 2012 (incorporated by reference to Exhibit 10.11.2 to the Quarterly Report of ConocoPhillips on Form 10-Q for the quarter ended June 30, 2012; File No. 001-32395). | |
| 10.11.3 | First Amendment to the Defined Contribution Make-Up Plan of ConocoPhillips-Title II, dated October 11, 2012 (incorporated by reference to Exhibit 10.2 to the Quarterly Report of ConocoPhillips on Form 10-Q for the quarter ended September 30, 2012; File No. 001-32395). | |
178
| Exhibit Number | Description | |
| 10.11.4 | Second Amendment to the Defined Contribution Make-Up Plan of ConocoPhillips-Title II, dated December 17, 2015 (incorporated by reference to Exhibit 10.11.4 to the Annual Report of ConocoPhillips on Form 10-K for the year ended December 31, 2015; File No. 001-32395). | |
| 10.12 | 2002 Omnibus Securities Plan of Phillips Petroleum Company (incorporated by reference to Exhibit 10.26 to the Annual Report of ConocoPhillips on Form 10-K for the year ended December 31, 2002; File No. 000-49987). | |
| 10.13 | Amendment and Restatement of 1998 Stock and Performance Incentive Plan of ConocoPhillips (incorporated by reference to Exhibit 10.27 to the Annual Report of ConocoPhillips on Form 10-K for the year ended December 31, 2002; File No. 000-49987). | |
| 10.14 | Amendment and Restatement of 1998 Key Employee Stock Performance Plan of ConocoPhillips (incorporated by reference to Exhibit 10.28 to the Annual Report of ConocoPhillips on Form 10-K for the year ended December 31, 2002; File No. 000-49987). | |
| 10.15 | Deferred Compensation Plan for Non-Employee Directors of ConocoPhillips (incorporated by reference to Exhibit 10.17 to the Annual Report of ConocoPhillips on Form 10-K for the year ended December 31, 2005; File No. 001-32395). | |
| 10.16 | ConocoPhillips Form Indemnity Agreement with Directors (incorporated by reference to Exhibit 10.34 to the Annual Report of ConocoPhillips on Form 10-K for the year ended December 31, 2002; File No. 000-49987). | |
| 10.17.1 | Rabbi Trust Agreement dated December 17, 1999 (incorporated by reference to Exhibit 10.11 of the Annual Report of ConocoPhillips Holding Company on Form 10-K for the year ended December 31, 1999; File No. 001-14521). | |
| 10.17.2 | Amendment to Rabbi Trust Agreement dated February 25, 2002 (incorporated by reference to Exhibit 10.39.1 to the Annual Report of ConocoPhillips on Form 10-K for the year ended December 31, 2002; File No. 000-49987). | |
| 10.17.3 | Phillips Petroleum Company Grantor Trust Agreement, dated June 1, 1998 (incorporated by reference to Exhibit 10.17.3 to the Annual Report of ConocoPhillips on Form 10-K for the year ended December 31, 2015; File No. 001-32395). | |
| 10.17.4 | First Amendment to the Trust Agreement under the Phillips Petroleum Company Grantor Trust Agreement, dated May 3, 1999 (incorporated by reference to Exhibit 10.17.4 to the Annual Report of ConocoPhillips on Form 10-K for the year ended December 31, 2015; File No. 001-32395). | |
| 10.17.5 | Second Amendment to the Trust Agreement under the Phillips Petroleum Company Grantor Trust Agreement, dated January 15, 2002 (incorporated by reference to Exhibit 10.17.5 to the Annual Report of ConocoPhillips on Form 10-K for the year ended December 31, 2015; File No. 001-32395). | |
| 10.17.6 | Third Amendment to the Trust Agreement under the Phillips Petroleum Company Grantor Trust Agreement, dated October 5, 2006 (incorporated by reference to Exhibit 10.17.6 to the Annual Report of ConocoPhillips on Form 10-K for the year ended December 31, 2015; File No. 001-32395). | |
179
| Exhibit Number | Description | |
| 10.17.7 | Fourth Amendment to the Trust Agreement under the ConocoPhillips Company Grantor Trust Agreement, dated May 1, 2012 (incorporated by reference to Exhibit 10.17.7 to the Annual Report of ConocoPhillips on Form 10-K for the year ended December 31, 2015; File No. 001-32395). | |
| 10.17.8 | Fifth Amendment to the Trust Agreement under the ConocoPhillips Company Grantor Trust Agreement, dated May 20, 2015 (incorporated by reference to Exhibit 10.17.8 to the Annual Report of ConocoPhillips on Form 10-K for the year ended December 31, 2015; File No. 001-32395). | |
| 10.18.1 | ConocoPhillips Directors' Charitable Gift Program (incorporated by reference to Exhibit 10.40 to the Annual Report of ConocoPhillips on Form 10-K for the year ended December 31, 2003; File No. 000-49987). | |
| 10.18.2 | First and Second Amendments to the ConocoPhillips Directors' Charitable Gift Program (incorporated by reference to Exhibit 10 to the Quarterly Report of ConocoPhillips on Form 10-Q for the quarterly period ended June 30, 2008; File No. 001-32395). | |
| 10.19 | ConocoPhillips Matching Gift Plan for Directors and Executives (incorporated by reference to Exhibit 10.41 to the Annual Report of ConocoPhillips on Form 10-K for the year ended December 31, 2003; File No. 000-49987). | |
| 10.20.1 | Amendment and Restatement of Key Employee Deferred Compensation Plan of ConocoPhillips-Title I, dated April 19, 2012 (incorporated by reference to Exhibit 10.12.1 to the Quarterly Report of ConocoPhillips on Form 10-Q for the quarter ended June 30, 2012; File No. 001-32395). | |
| 10.20.2 | Amendment and Restatement of Key Employee Deferred Compensation Plan of ConocoPhillips-Title II, dated April 19, 2012 (incorporated by reference to Exhibit 10.12.2 to the Quarterly Report of ConocoPhillips on Form 10-Q for the quarter ended June 30, 2012; File No. 001-32395). | |
| 10.20.3 | First Amendment to the Key Employee Deferred Compensation Plan of ConocoPhillips-Title II (incorporated by reference to Exhibit 10.20.3 to the Annual Report of ConocoPhillips on Form 10-K for the year ended December 31, 2010; File No. 001-32395). | |
| 10.20.4 | Second Amendment to the Key Employee Deferred Compensation Plan of ConocoPhillips-Title II (incorporated by reference to Exhibit 10.20.4 to the Annual Report of ConocoPhillips on Form 10-K for the year ended December 31, 2010; File No. 001-32395). | |
| 10.20.5 | Amendment and Restatement of Key Employee Deferred Compensation Plan of ConocoPhillips-Title II, 2013 Restatement dated November 17, 2014 (Amended and Restated effective as of January 1, 2013) (incorporated by reference to Exhibit 10.20.5 to the Annual Report of ConocoPhillips on Form 10-K for the year ended December 31, 2014; File No. 001-32395). | |
| 10.21 | Amendment and Restatement of ConocoPhillips Key Employee Change in Control Severance Plan, effective January 1, 2014 (incorporated by reference to Exhibit 10.21 to the Annual Report of ConocoPhillips on Form 10-K for the year ended December 31, 2013; File No. 001-32395). | |
180
| Exhibit Number | Description | |
| 10.22 | ConocoPhillips Executive Severance Plan (incorporated by reference to Exhibit 10.23 to the Annual Report of ConocoPhillips on Form 10-K for the year ended December 31, 2008; File No. 001-32395). | |
| 10.23.1 | 2004 Omnibus Stock and Performance Incentive Plan of ConocoPhillips (incorporated by reference to Appendix C of ConocoPhillips' Proxy Statement on Schedule 14A relating to the 2004 Annual Meeting of Shareholders; File No. 000-49987). | |
| 10.23.2 | Form of Stock Option Award Agreement under the Stock Option and Stock Appreciation Rights Program under the 2004 Omnibus Stock and Performance Incentive Plan of ConocoPhillips (incorporated by reference to Exhibit 10.26 to the Annual Report of ConocoPhillips on Form 10-K for the year ended December 31, 2008; File No. 001-32395). | |
| 10.23.3 | Form of Performance Share Unit Award Agreement under the Performance Share Program under the 2004 Omnibus Stock and Performance Incentive Plan of ConocoPhillips (incorporated by reference to Exhibit 10.27 to the Annual Report of ConocoPhillips on Form 10-K for the year ended December 31, 2008; File No. 001-32395). | |
| 10.24 | Omnibus Amendments to certain ConocoPhillips employee benefit plans, adopted December 7, 2007 (incorporated by reference to Exhibit 10.30 to the Annual Report of ConocoPhillips on Form 10-K for the year ended December 31, 2007; File No. 001-32395). | |
| 10.25 | 2009 Omnibus Stock and Performance Incentive Plan of ConocoPhillips (incorporated by reference to Appendix A of ConocoPhillips' Proxy Statement on Schedule 14A relating to the 2009 Annual Meeting of Shareholders; File No. 001-32395). | |
| 10.26.1 | 2011 Omnibus Stock and Performance Incentive Plan of ConocoPhillips (incorporated by reference to Appendix A of ConocoPhillips' Proxy Statement on Schedule 14A relating to the 2011 Annual Meeting of Shareholders; File No. 001-32395). | |
| 10.26.2 | Form of Stock Option Award Agreement under the Stock Option and Stock Appreciation Rights Program under the 2011 Omnibus Stock and Performance Incentive Plan of ConocoPhillips, effective February 9, 2012 (incorporated by reference to Exhibit 10 to the Quarterly Report of ConocoPhillips on Form 10-Q for the quarter ended March 31, 2012; File No. 001-32395). | |
| 10.26.3 | Form of Restricted Stock Units Agreement under the Restricted Stock Program under the 2011 Omnibus Stock and Performance Incentive Plan of ConocoPhillips, effective April 4, 2012 (incorporated by reference to Exhibit 10.6 to the Quarterly Report of ConocoPhillips on Form 10-Q for the quarter ended June 30, 2012; File No. 001-32395). | |
| 10.26.4 | Form of Restricted Stock Award Agreement under the Restricted Stock Program under the 2011 Omnibus Stock and Performance Incentive Plan of ConocoPhillips, effective May 8, 2012 (incorporated by reference to Exhibit 10.7 to the Quarterly Report of ConocoPhillips on Form 10-Q for the quarter ended June 30, 2012; File No. 001-32395). | |
| 10.26.5 | Form of Restricted Stock Award Agreement under the Restricted Stock Program under the 2011 Omnibus Stock and Performance Incentive Plan of ConocoPhillips, dated September 18, 2012 (incorporated by reference to Exhibit 10.26.5 to the Annual Report of ConocoPhillips on Form 10-K for the year ended December 31, 2012; File No. 001-32395). | |
181
| Exhibit Number | Description | |
| 10.26.6 | Form of Performance Share Unit Agreement under the Restricted Stock Program under the 2011 Omnibus Stock and Performance Incentive Plan of ConocoPhillips, dated February 5, 2013 (incorporated by reference to Exhibit 10.26.6 to the Annual Report of ConocoPhillips on Form 10-K for the year ended December 31, 2012; File No. 001-32395). | |
| 10.26.7 | Form of Performance Share Unit Agreement-Canada under the Restricted Stock Program under the 2011 Omnibus Stock and Performance Incentive Plan of ConocoPhillips, dated February 5, 2013 (incorporated by reference to Exhibit 10.26.7 to the Annual Report of ConocoPhillips on Form 10-K for the year ended December 31, 2012; File No. 001-32395). | |
| 10.26.8 | Form of Restricted Stock Award Agreement under the Restricted Stock Program under the 2011 Omnibus Stock and Performance Incentive Plan of ConocoPhillips, dated February 5, 2013 (incorporated by reference to Exhibit 10.26.8 to the Annual Report of ConocoPhillips on Form 10-K for the year ended December 31, 2012; File No. 001-32395). | |
| 10.26.9 | Form of Stock Option Award Agreement under the Stock Option and Stock Appreciation Rights Program under the 2011 Omnibus Stock and Performance Incentive Plan of ConocoPhillips, dated February 5, 2013 (incorporated by reference to Exhibit 10.26.9 to the Annual Report of ConocoPhillips on Form 10-K for the year ended December 31, 2012; File No. 001-32395). | |
| 10.26.10 | Form of Make-up Grant Award Agreement under the 2011 Omnibus Stock and Performance Incentive Plan of ConocoPhillips, dated January 1, 2012 (incorporated by reference to Exhibit 10.1 to the Quarterly Report of ConocoPhillips on Form 10-Q for the quarter ended March 31, 2013; File No. 001-32395). | |
| 10.26.11 | Form of Key Employee Award Agreement, as part of the ConocoPhillips Stock Option Program granted under the 2011 Omnibus Stock and Performance Incentive Plan of ConocoPhillips, dated February 18, 2014 (incorporated by reference to Exhibit 10.1 to the Quarterly Report of ConocoPhillips on Form 10-Q for the quarter ended March 31, 2014; File No. 001-32395). | |
| 10.26.12 | Form of Key Employee Award Agreement, as part of the ConocoPhillips Stock Option Program granted under the 2014 Omnibus Stock and Performance Incentive Plan of ConocoPhillips, dated February 16, 2016 (incorporated by reference to Exhibit 10.26.12 to the Annual Report of ConocoPhillips on Form 10-K for the year ended December 31, 2015; File No. 001-32395). | |
| 10.26.13 | Form of Key Employee Award Agreement, as part of the ConocoPhillips Restricted Stock Program granted under the 2011 Omnibus Stock and Performance Incentive Plan of ConocoPhillips, dated February 18, 2014 (incorporated by reference to Exhibit 10.2 to the Quarterly Report of ConocoPhillips on Form 10-Q for the quarter ended March 31, 2014; File No. 001-32395). | |
| 10.26.14 | Form of Key Employee Award Agreement, as part of the ConocoPhillips Restricted Stock Program granted under the 2014 Omnibus Stock and Performance Incentive Plan of ConocoPhillips, dated February 16, 2016 (incorporated by reference to Exhibit 10.26.14 to the Annual Report of ConocoPhillips on Form 10-K for the year ended December 31, 2015; File No. 001-32395). | |
| 10.26.15 | Form of Performance Period IX Award Agreement, as part of the ConocoPhillips Performance Share Program granted under the 2011 Omnibus Stock and Performance Incentive Plan of ConocoPhillips, dated February 18, 2014 (incorporated by reference to Exhibit 10.3 to the Quarterly Report of ConocoPhillips on Form 10-Q for the quarter ended March 31, 2014; File No. 001-32395). | |
182
| Exhibit Number | Description | |
| 10.26.16 | Form of Performance Period IX Award Agreement-Canada, as part of the ConocoPhillips Performance Share Program granted under the 2011 Omnibus Stock and Performance Incentive Plan of ConocoPhillips, dated February 18, 2014 (incorporated by reference to Exhibit 10.4 to the Quarterly Report of ConocoPhillips on Form 10-Q for the quarter ended March 31, 2014; File No. 001-32395). | |
| 10.26.17 | Form of Performance Period X Award Agreement, as part of the ConocoPhillips Performance Share Program granted under the 2011 Omnibus Stock and Performance Incentive Plan of ConocoPhillips, dated February 18, 2014 (incorporated by reference to Exhibit 10.5 to the Quarterly Report of ConocoPhillips on Form 10-Q for the quarter ended March 31, 2014; File No. 001-32395). | |
| 10.26.18 | Form of Performance Period X Award Agreement-Canada, as part of the ConocoPhillips Performance Share Program granted under the 2011 Omnibus Stock and Performance Incentive Plan of ConocoPhillips, dated February 18, 2014 (incorporated by reference to Exhibit 10.6 to the Quarterly Report of ConocoPhillips on Form 10-Q for the quarter ended March 31, 2014; File No. 001-32395). | |
| 10.26.19 | Form of Performance Period XII Award Agreement, as part of the ConocoPhillips Performance Share Program granted under the 2011 Omnibus Stock and Performance Incentive Plan of ConocoPhillips, dated February 18, 2014 (incorporated by reference to Exhibit 10.9 to the Quarterly Report of ConocoPhillips on Form 10-Q for the quarter ended March 31, 2014; File No. 001-32395). | |
| 10.26.20 | Form of Performance Period XII Award Agreement-Canada, as part of the ConocoPhillips Performance Share Program granted under the 2011 Omnibus Stock and Performance Incentive Plan of ConocoPhillips, dated February 18, 2014 (incorporated by reference to Exhibit 10.10 to the Quarterly Report of ConocoPhillips on Form 10-Q for the quarter ended March 31, 2014; File No. 001-32395). | |
| 10.26.21 | Form of Performance Period XIV Award Agreement, as part of the ConocoPhillips Performance Share Program granted under the 2014 Omnibus Stock and Performance Incentive Plan of ConocoPhillips, dated February 16, 2016 (incorporated by reference to Exhibit 10.26.23 to the Annual Report of ConocoPhillips on Form 10-K for the year ended December 31, 2015; File No. 001-32395). | |
| 10.26.22 | Form of Performance Period XIV Award Agreement-Canada, as part of the ConocoPhillips Performance Share Program granted under the 2014 Omnibus Stock and Performance Incentive Plan of ConocoPhillips, dated February 16, 2016 (incorporated by reference to Exhibit 10.26.24 to the Annual Report of ConocoPhillips on Form 10-K for the year ended December 31, 2015; File No. 001-32395). | |
| 10.26.23 | Form of Inducement Grant Award Agreement under the 2011 Omnibus Stock and Performance Incentive Plan of ConocoPhillips, dated March 31, 2014 (incorporated by reference to Exhibit 10.11 to the Quarterly Report of ConocoPhillips on Form 10-Q for the quarter ended March 31, 2014; File No. 001-32395). | |
| 10.26.24* | Form of Performance Share Unit Award Terms and Conditions for Performance Period 18, as part of the ConocoPhillips Performance Share Program granted under the 2014 Omnibus Stock and Performance Incentive Plan of ConocoPhillips, dated February 13, 2018. | |
183
| Exhibit Number | Description | |
| 10.26.25* | Form of Performance Share Unit Award Terms and Conditions for Performance Period 18 for eligible employees on the Canada payroll, as part of the ConocoPhillips Performance Share Program granted under the 2014 Omnibus Stock and Performance Incentive Plan of ConocoPhillips, dated February 13, 2018. | |
| 10.27.1 | 2014 Omnibus Stock and Performance Incentive Plan of ConocoPhillips (incorporated by reference to Exhibit 10.1 to the Current Report of ConocoPhillips on Form 8-K filed on May 14, 2014; File No. 001-32395). | |
| 10.27.2 | Form of Key Employee Award Terms and Conditions, as part of the ConocoPhillips Targeted Variable Long Term Incentive Program of ConocoPhillips, granted under the 2014 Omnibus Stock and Performance Incentive Plan of ConocoPhillips, dated September 15, 2014 (incorporated by reference to Exhibit 10.1 to the Quarterly Report of ConocoPhillips on Form 10-Q for the quarter ended September 30, 2014; File No. 001-32395). | |
| 10.27.3 | Form of Key Employee Award Terms and Conditions, as part of the ConocoPhillips Targeted Variable Long Term Incentive Program, granted under the 2014 Omnibus Stock and Performance Incentive Plan of ConocoPhillips, dated September 3, 2015 (incorporated by reference to Exhibit 10.1 to the Quarterly Report of ConocoPhillips on Form 10-Q for the quarter ended September 30, 2015; File No. 001-32395). | |
| 10.27.4 | Form of Retention Award Terms and Conditions, as part of the Restricted Stock Unit Award, granted under the 2014 Omnibus Stock and Performance Incentive Plan of ConocoPhillips (incorporated by reference to Exhibit 10.1 to the Quarterly Report of ConocoPhillips on Form 10-Q for the quarter ended March 31, 2015; File No. 001-32395). | |
| 10.27.5 | Form of Non-Employee Director Restricted Stock Units Terms and Conditions, as part of the Deferred Compensation Plan for Non-Employee Directors of ConocoPhillips, dated January 15, 2016 (incorporated by reference to Exhibit 10.3 to the Quarterly Report of ConocoPhillips on Form 10-Q for the quarter ended March 31, 2016; File No. 001-32395). | |
| 10.27.6 | Form of Non-Employee Director Restricted Stock Units Terms and Conditions – Canadian Non-Employee Directors, as part of the Deferred Compensation Plan for Non-Employee Directors of ConocoPhillips, dated January 15, 2016 (incorporated by reference to Exhibit 10.4 to the Quarterly Report of ConocoPhillips on Form 10-Q for the quarter ended March 31, 2016; File No. 001-32395). | |
| 10.27.7 | Form of Non-Employee Director Restricted Stock Units Terms and Conditions – Norwegian Non-Employee Directors, as part of the Deferred Compensation Plan for Non-Employee Directors of ConocoPhillips, dated January 15, 2016 (incorporated by reference to Exhibit 10.5 to the Quarterly Report of ConocoPhillips on Form 10-Q for the quarter ended March 31, 2016; File No. 001-32395). | |
| 10.27.8 | Form of Key Employee Award Terms and Conditions, as part of the ConocoPhillips Stock Option Program granted under the 2014 Omnibus Stock and Performance Incentive Plan of ConocoPhillips, dated February 14, 2017 (incorporated by reference to Exhibit 10.1 to the Quarterly Report of ConocoPhillips on Form 10-Q for the quarter ended March 31, 2017; File No. 001-32395). | |
184
| Exhibit Number | Description | |
| 10.27.9 | Form of Performance Share Unit Award Terms and Conditions for Performance Period 17, as part of the ConocoPhillips Performance Share Program granted under the 2014 Omnibus Stock and Performance Incentive Plan of ConocoPhillips, dated February 14, 2017 (incorporated by reference to Exhibit 10.2 to the Quarterly Report of ConocoPhillips on Form 10-Q for the quarter ended March 31, 2017; File No. 001-32395). | |
| 10.27.10 | Form of Performance Share Unit Award Terms and Conditions for Performance Period 17 for eligible employees on the Canada payroll, as part of the ConocoPhillips Performance Share Program granted under the 2014 Omnibus Stock and Performance Incentive Plan of ConocoPhillips, dated February 14, 2017 (incorporated by reference to Exhibit 10.3 to the Quarterly Report of ConocoPhillips on Form 10-Q for the quarter ended March 31, 2017; File No. 001-32395). | |
| 10.27.11 | Form of Key Employee Award Terms and Conditions as part of the ConocoPhillips Restricted Stock Program granted under the 2014 Omnibus Stock and Performance Incentive Plan of ConocoPhillips, dated February 14, 2017 (incorporated by reference to Exhibit 10.4 to the Quarterly Report of ConocoPhillips on Form 10-Q for the quarter ended March 31, 2017; File No. 001-32395). | |
| 10.27.12* | Form of Key Employee Award Terms and Conditions as part of the ConocoPhillips Executive Restricted Stock Unit Program granted under the 2014 Omnibus Stock and Performance Incentive Plan of ConocoPhillips, dated February 13, 2018. | |
| 10.27.13* | Form of Key Employee Award Terms and Conditions for eligible employees on the Canada payroll, as part of the ConocoPhillips Executive Restricted Stock Unit Program granted under the 2014 Omnibus Stock and Performance Incentive Plan of ConocoPhillips, dated February 13, 2018. | |
| 10.27.14* | Form of Key Employee Award Terms and Conditions as part of the ConocoPhillips Restricted Stock Program granted under the 2014 Omnibus Stock and Performance Incentive Plan of ConocoPhillips, dated February 13, 2018. | |
| 10.27.15* | Form of Retention Award Terms and Conditions, 2017 revision, as part of the Restricted Stock Unit Award, granted under the 2014 Omnibus Stock and Performance Incentive Plan of ConocoPhillips. | |
| 10.28 | Amendment and Restatement of Annex to Nonqualified Deferred Compensation Arrangements of ConocoPhillips, dated April 19, 2012 (incorporated by reference to Exhibit 10.8 to the Quarterly Report of ConocoPhillips on Form 10-Q for the quarter ended June 30, 2012; File No. 001-32395). | |
| 10.29 | Amendment, Change of Sponsorship, and Restatement of Certain Nonqualified Deferred Compensation Plans of ConocoPhillips, dated April 19, 2012 (incorporated by reference to Exhibit 10.10 to the Quarterly Report of ConocoPhillips on Form 10-Q for the quarter ended June 30, 2012; File No. 001-32395). | |
| 10.30 | Amendment and Restatement of the Burlington Resources Inc. Management Supplemental Benefits Plan, dated April 19, 2012 (incorporated by reference to Exhibit 10.9 to the Quarterly Report of ConocoPhillips on Form 10-Q for the quarter ended June 30, 2012; File No. 001-32395). | |
185
| Exhibit Number | Description | |
| 10.31 | Amendment and Restatement of Deferred Compensation Trust Agreement for Non-Employee Directors of Phillips Petroleum Company, dated June 23, 1995 (incorporated by reference to Exhibit 10.2 to the Quarterly Report of ConocoPhillips on Form 10-Q for the quarter ended March 31, 2016; File No. 001-32395). | |
| 10.32 | Indemnification and Release Agreement between ConocoPhillips and Phillips 66, dated April 26, 2012 (incorporated by reference to Exhibit 10.1 to the Current Report of ConocoPhillips on Form 8-K filed on May 1, 2012; File No. 001-32395). | |
| 10.33 | Intellectual Property Assignment and License Agreement between ConocoPhillips and Phillips 66, dated April 26, 2012 (incorporated by reference to Exhibit 10.2 to the Current Report of ConocoPhillips on Form 8-K filed on May 1, 2012; File No. 001-32395). | |
| 10.34 | Tax Sharing Agreement between ConocoPhillips and Phillips 66, dated April 26, 2012 (incorporated by reference to Exhibit 10.3 to the Current Report of ConocoPhillips on Form 8-K filed on May 1, 2012; File No. 001-32395). | |
| 10.35 | Employee Matters Agreement between ConocoPhillips and Phillips 66, dated April 26, 2012 (incorporated by reference to Exhibit 10.4 to the Current Report of ConocoPhillips on Form 8-K filed on May 1, 2012; File No. 001-32395). | |
| 10.36 | Transition Services Agreement between ConocoPhillips and Phillips 66, dated April 26, 2012 (incorporated by reference to Exhibit 10.5 to the Current Report of ConocoPhillips on Form 8-K filed on May 1, 2012; File No. 001-32395). | |
| 10.37 | ConocoPhillips Clawback Policy dated October 3, 2012 (incorporated by reference to Exhibit 10.3 to the Quarterly Report of ConocoPhillips on Form 10-Q for the quarter ended September 30, 2012; File No. 001-32395). | |
| 10.38 | Term Loan Agreement, between ConocoPhillips, as borrower, ConocoPhillips Company, as guarantor, Toronto Dominion (Texas) LLC, as administrative agent and the banks party thereto, with TD Securities (USA) LLC, as lead arranger and bookrunner, dated March 18, 2016 (incorporated by reference to Exhibit 10.1 to the Current Report of ConocoPhillips on Form 8-K filed on March 21, 2016; File No. 001-32395). | |
| 12* | Computation of Ratio of Earnings to Fixed Charges. | |
| 21* | List of Subsidiaries of ConocoPhillips. | |
| 23.1* | Consent of Ernst & Young LLP. | |
| 23.2* | Consent of DeGolyer and MacNaughton. | |
| 31.1* | Certification of Chief Executive Officer pursuant to Rule 13a-14(a) under the Securities Exchange Act of 1934. | |
| 31.2* | Certification of Chief Financial Officer pursuant to Rule 13a-14(a) under the Securities Exchange Act of 1934. | |
| 32* | Certifications pursuant to 18 U.S.C. Section 1350. | |
| 99* | Report of DeGolyer and MacNaughton. | |
186
Exhibit Number | Description | |
| 101.INS* | XBRL Instance Document. | |
| 101.SCH* | XBRL Schema Document. | |
| 101.CAL* | XBRL Calculation Linkbase Document. | |
| 101.DEF* | XBRL Definition Linkbase Document. | |
| 101.LAB* | XBRL Labels Linkbase Document. | |
| 101.PRE* | XBRL Presentation Linkbase Document. | |
| * | Filed herewith . |
| † | The schedules to this exhibit have been omitted pursuant to Item 601(b)(2) of Regulation S-K. ConocoPhillips agrees to furnish a copy of any schedule omitted from this exhibit to the SEC upon request. |
| ‡ | ConocoPhillips has previously been granted confidential treatment for certain portions of this exhibit pursuant to Rule 24b-2 under the Securities Exchange Act of 1934, as amended. |
187
SIGNATURES
Pursuant to the requirements of Section 13 or 15(d) of the Securities Exchange Act of 1934, the registrant has duly caused this report to be signed on its behalf by the undersigned, thereunto duly authorized.
| CONOCOPHILLIPS | ||
| February 20, 2018 | /s/ Ryan M. Lance | |
Ryan M. Lance Chairman of the Board of Directors and Chief Executive Officer | ||
Pursuant to the requirements of the Securities Exchange Act of 1934, this report has been signed, as of February 20, 2018, on behalf of the registrant by the following officers in the capacity indicated and by a majority of directors.
| Signature | Title | |
/s/ Ryan M. Lance Ryan M. Lance | Chairman of the Board of Directors and Chief Executive Officer (Principal executive officer) | |
/s/ Don E. Wallette, Jr. Don E. Wallette, Jr. | Executive Vice President, Finance, Commercial and Chief Financial Officer (Principal financial officer) | |
/s/ Glenda M. Schwarz Glenda M. Schwarz | Vice President and Controller (Principal accounting officer) | |
188
/s/ Richard L. Armitage Richard L. Armitage | Director | |
/s/ Richard H. Auchinleck Richard H. Auchinleck | Director | |
/s/ Charles E. Bunch Charles E. Bunch | Director | |
/s/ Caroline M. Devine Caroline M. Devine | Director | |
/s/ Gay Huey Evans Gay Huey Evans | Director | |
/s/ John V. Faraci John V. Faraci | Director | |
/s/ Jody Freeman Jody Freeman | Director | |
/s/ Sharmila Mulligan Sharmila Mulligan | Director | |
/s/ Arjun N. Murti Arjun N. Murti | Director | |
/s/ Robert A. Niblock Robert A. Niblock | Director | |
/s/ Harald J. Norvik Harald J. Norvik | Director | |
189