Table of Contents
UNITED STATES
SECURITIES AND EXCHANGE COMMISSION
Washington, D.C. 20549
FORM 10-K
ANNUAL REPORT PURSUANT TO SECTION 13 OR 15 (d)
OF THE SECURITIES EXCHANGE ACT OF 1934
For the fiscal year ended August 31, 2011
Commission File Number: 1-9852
CHASE CORPORATION
(Exact name of registrant as specified in its charter)
| Massachusetts | 11-1797126 | |
| (State or other jurisdiction of incorporation of organization) | (I.R.S. Employer Identification No.) |
26 Summer Street, Bridgewater, Massachusetts 02324
(Address of Principal Executive Offices, Including Zip Code)
(508) 819-4200
(Registrant's Telephone Number, Including Area Code)
Securities registered pursuant to section 12(b) of the Act:
Title of Each Class: | Name of Each Exchange on Which Registered | |
|---|---|---|
| Common Stock ($0.10 Par Value) | NYSE Amex |
Securities registered pursuant to section 12(g) of the Act: None
Indicate by check mark if the registrant is a well-known seasoned issuer (as defined in Rule 405 of the Securities Act). YES o NO ý
Indicate by check mark if the registrant is not required to file reports pursuant to Section 13 or Section 15(d) of the Exchange Act. YES o NO ý
Indicate by check mark whether the registrant (1) has filed all reports required to be filed by Section 13 or 15(d) of the Securities Exchange Act of 1934 during the preceding 12 months, and (2) has been subject to such filing requirements for the past 90 days. YES ý NO o
Indicate by check mark whether the registrant has submitted electronically and posted on its corporate Web site, if any, every Interactive Data File required to be submitted and posted pursuant to Rule 405 of Regulation S-T (§232.405 of this chapter) during the preceding 12 months (or for such shorter period that the registrant was required to submit and post such files). YES o NO o
Indicate by check mark if disclosure of delinquent filers pursuant to Item 405 of Regulation S-K is not contained herein, and will not be contained, to the best of registrant's knowledge, in definitive proxy or information statements incorporated by reference in Part III of this Form 10-K or any amendment to this Form 10-K. o
Indicate by check mark whether the registrant is a large accelerated filer, an accelerated filer, a non-accelerated filer or a smaller reporting company. See the definitions of "large accelerated filer", "accelerated filer" and "smaller reporting company" in Rule 12b-2 of the Exchange Act.
| Large accelerated filer o | Accelerated filer ý | Non-accelerated filer o (Do not check if a smaller reporting company) | Smaller reporting company o |
Indicate by checkmark whether the registrant is a shell company (as defined in Rule 12b-2 of the Exchange Act). YES o NO ý
The aggregate market value of the common stock held by non-affiliates of the registrant, as of February 28, 2011 (the last business day of the registrant's second quarter of fiscal 2011), was approximately $103,932,655.
As of October 31, 2011, the Company had outstanding 8,953,584 shares of common stock, $.10 par value, which is its only class of common stock.
Documents Incorporated By Reference:
Portions of the registrant's definitive proxy statement for the Annual Meeting of Shareholders, which is expected to be filed within 120 days after the registrant's fiscal year ended August 31, 2011, are incorporated by reference into Part III hereof.
Table of Contents
CHASE CORPORATION
INDEX TO ANNUAL REPORT ON FORM 10-K
For the Year Ended August 31, 2011
| | | Page No. | ||||
|---|---|---|---|---|---|---|
PART I | ||||||
Item 1 | Business | 3 | ||||
Item 1A | Risk Factors | 7 | ||||
Item 1B | Unresolved Staff Comments | 10 | ||||
Item 2 | Properties | 11 | ||||
Item 3 | Legal Proceedings | 12 | ||||
Item 4 | [Removed and Reserved] | 12 | ||||
Item 4A | Executive Officers of the Registrant | 12 | ||||
PART II | ||||||
Item 5 | Market for the Registrant's Common Equity, Related Stockholder Matters and Issuer Purchases of Equity Securities | 13 | ||||
Item 6 | Selected Financial Data | 14 | ||||
Item 7 | Management's Discussion and Analysis of Financial Condition and Results of Operations | 15 | ||||
Item 7A | Quantitative and Qualitative Disclosures About Market Risk | 27 | ||||
Item 8 | Financial Statements and Supplementary Data | 28 | ||||
Item 9 | Changes in and Disagreements with Accountants on Accounting and Financial Disclosure | 66 | ||||
Item 9A | Controls and Procedures | 66 | ||||
Item 9B | Other Information | 66 | ||||
PART III | ||||||
Item 10 | Directors, Executive Officers and Corporate Governance | 67 | ||||
Item 11 | Executive Compensation | 67 | ||||
Item 12 | Security Ownership of Certain Beneficial Owners and Management and Related Stockholder Matters | 67 | ||||
Item 13 | Certain Relationships and Related Transactions, and Director Independence | 67 | ||||
Item 14 | Principal Accountant Fees and Services | 67 | ||||
PART IV | ||||||
Item 15 | Exhibits and Financial Statement Schedules | 68 | ||||
SIGNATURES | 71 | |||||
2
Table of Contents
PART I
ITEM 1-BUSINESS
Primary Operating Divisions and Facilities and Industry Segment
Chase Corporation (the "Company," "Chase," "we," or "us") is a leading manufacturer of protective materials for high reliability applications. Our strategy is to maximize the performance of our core businesses and brands while seeking future opportunities through strategic acquisitions. In the fourth quarter of our 2011 fiscal year, we reorganized into two operating segments, an Industrial Materials segment and a Construction Materials segment. The basis for our segmentation is distinguished by the nature of the products we manufacture and how they are delivered to their respective markets. The Industrial Materials segment represents our specified products which are used in or integrated into another company's product with demand dependent upon general economic conditions. The Construction Materials segment reflects our construction project oriented product offerings which are primarily sold and used as "Chase" branded products in final form. Our manufacturing facilities are distinct to their respective segments with the exception of our Pittsburgh, PA facility which produces products related to both operating segments. A summary of our operating structure as of August 31, 2011 is as follows:
INDUSTRIAL MATERIALS SEGMENT
| Key Products & Services | Primary Manufacturing Location | Background/History | ||
|---|---|---|---|---|
| Electrical cable insulation tapes using the brand name Chase & Sons® and related products such as Chase BLH 2 OCK®, a water blocking compound sold to the wire and cable industry. Insulating and conducting materials for the manufacture of electrical and telephone wire and cable, electrical splicing, and terminating and repair tapes, which are marketed to wire and cable manufacturers and public utilities. | Randolph, MA | This was one of our first operating facilities and has been producing products for the wire and cable industry for more than fifty years. In October 2011, we announced the planned closing of this manufacturing facility effective December 1, 2012. The manufacturing of products produced in this facility will be transitioned to our other facilities over the course of a 15 month transition period. | ||
Specialty tapes and related products for the electronic and telecommunications industries using the brand name Chase & Sons®. PaperTyger® is a trademark for laminated durable papers sold to the envelope converting and commercial printing industries. | | Oxford, MA | | In August 2011, we moved our manufacturing processes that had been previously conducted at our Webster, MA facility to this location. In December 2003, we acquired the assets of PaperTyger, LLC ("PaperTyger"). The PaperTyger product lines are also manufactured at this facility. |
3
Table of Contents
| Key Products & Services | Primary Manufacturing Location | Background/History | ||
|---|---|---|---|---|
| Flexible packaging for industrial and retail use. Slit film for the building wire market and for telecommunication cable. Flexible composites and laminates for the wire & cable, aerospace and industrial laminate markets including Insulfab®, an insulation material used in the aerospace industry. | Taylorsville, NC | In January 2004, we purchased certain manufacturing equipment and began operations at this facility. In March 2009, we moved the majority of our manufacturing processes that had been conducted at our Paterson, NJ facility to this location. | ||
Protective conformal coatings under the brand name HumiSeal®, moisture protective electronic coatings sold to the electronics industry. | | Pittsburgh, PA | | The HumiSeal business and product lines were acquired in the early 1970's. |
Protective conformal coatings under the brand name HumiSeal®, moisture protective electronic coatings sold to the electronics industry. HumiSeal Europe SARL operates a sales/technical service office and warehouse near Paris. This business works closely with the HumiSeal operation in Camberley, Surrey, England allowing direct sales and service to the French market. | | Camberley, Surrey, England | | In October 2005, we acquired all of the capital stock of Concoat Holdings Ltd. and its subsidiaries. In 2006 Concoat was renamed HumiSeal Europe. In March 2007, we expanded our international presence with the formation of HumiSeal Europe SARL in France. In conjunction with establishing the new company, certain assets were acquired from Metronelec SARL, a former distributor of HumiSeal products. |
CONSTRUCTION MATERIALS SEGMENT
| Key Products & Services | Primary Manufacturing Location | Background/History | ||
|---|---|---|---|---|
| Protective pipe coating tapes and other protectants for valves, regulators, casings, joints, metals, concrete, and wood which are sold under the brand name Royston®, to oil companies, gas utilities, and pipeline
companies. Rosphalt50® is a polymer additive that provides long term cost effective solutions in many applications such as waterproofing of approaches and bridges, ramps, race tracks, airports and specialty road applications. Waterproofing sealants, expansion joints and accessories for the transportation, industrial and architectural markets. | Pittsburgh, PA | The Royston business was acquired in the early 1970's. In April 2005, we acquired certain assets of E-Poxy Engineered Materials. Additionally, in September 2006, we acquired all of the capital stock of Capital Services Joint Systems. Both of these acquisitions were combined to form the Expansion Joints product line which is now manufactured in Pittsburgh. |
4
Table of Contents
| Key Products & Services | Primary Manufacturing Location | Background/History | ||
|---|---|---|---|---|
| Manufacturer of technologically advanced products, including the brand Tapecoat®, for demanding anti-corrosion applications in the gas, oil and marine pipeline market segments, as well as tapes and membranes for roofing and other construction related applications. | Evanston, IL | In November 2001, we acquired substantially all of the assets of Tapecoat, a division of T.C. Manufacturing Inc. | ||
Specialized manufacturer of high performance coating and lining systems used worldwide in the liquid storage and containment applications. | | Houston, TX | | In September 2009, we acquired all of the outstanding capital stock of C.I.M. Industries Inc. ("CIM"). |
Manufacturer of waterproofing and corrosion protection systems for oil, gas and water pipelines and a supplier to Europe, the Middle East and Southeast Asia. This facility joins Chase's North American based Tapecoat® and Royston® brands to broaden the protective coatings product line and better address increasing global demand. The ServiWrap product line complements the portfolio of our pipeline protection tapes, coatings and accessories and will extend our global customer base. | | Rye, East Sussex, England | | In September 2007, we purchased certain product lines and a related manufacturing facility in Rye, East Sussex, England through our wholly owned subsidiary, Chase Protective Coatings Ltd. In December 2009, we acquired the full range of ServiWrap® pipeline protection products ("ServiWrap") from Grace Construction Products Limited, a UK based unit of W.R. Grace & Co. |
Other Business Developments
Announced closing of Randolph, MA manufacturing facility
On October 5, 2011, we announced to our employees the planned closing of our Randolph, MA manufacturing facility effective December 1, 2012. This is in line with our ongoing efforts to consolidate our manufacturing plants and streamline our existing processes. The manufacturing of products produced in the Randolph, MA facility will be transitioned to our other facilities over the course of a 15 month transition period. We estimate total pre-tax charges of approximately $700,000 associated with these facility closing activities which will be recognized over the course of the transition period. Of this amount, severance and other employee related costs are estimated to be $550,000. We expect the transition to be substantially completed and the majority of these cash expenditures to be incurred in the first quarter of fiscal 2013.
Products and Markets
Our principal products are specialty tapes, laminates, sealants and coatings that are sold by our salespeople, manufacturers' representatives and distributors. In our Industrial Materials segment, these products consist of:
(i) insulating and conducting materials for the manufacture of electrical and telephone wire and cable, electrical splicing, and terminating and repair tapes, which are marketed to wire and cable manufacturers;(ii) moisture protective coatings, which are sold to the electronics industry including circuitry used in automobiles and home appliances;
(iii) laminated durable papers, including laminated paper with an inner security barrier used in personal and mail-stream privacy protection, which are sold primarily to the envelope converting and commercial printing industries; and
(iv) flexible composites and laminates for the wire & cable, aerospace, packaging and industrial laminate markets.
5
Table of Contents
In our Construction Materials segment, these products consist of:
(i) protective pipe coating tapes and other protectants for valves, regulators, casings, joints, metals, concrete and wood, which are sold to oil companies, gas utilities and pipeline companies;(ii) protectants for highway bridge deck metal supported surfaces, which are sold to municipal transportation authorities;
(iii) fluid applied coating and lining systems for use in the water and wastewater industry; and
(iv) expansion and control joint systems designed for roads, bridges, stadiums and airport runways.
There is some seasonality with our product offerings sold into the construction market as increased demand is often experienced when temperatures are warmer (April through October) with less demand occurring when temperatures are colder (typically our second fiscal quarter). We did not introduce any new products or segments requiring an investment of a material amount of our assets during fiscal year 2011.
Employees
As of October 31, 2011, we employed approximately 324 people (including union employees). We consider our employee relations to be good. In the U.S., we offer our employees a wide array of company-paid benefits, which we believe are competitive relative to others in our industry. In our operations outside the U.S., we offer benefits that may vary from those offered to our U.S. employees due to customary local practices and statutory requirements.
Backlog, Customers and Competition
As of October 31, 2011, the backlog of customer orders believed to be firm was approximately $9,599,000. This compared with a total of $11,451,000 as of October 31, 2010. The decrease in backlog over the prior year amount is primarily due to an overall decrease in order activity across our pipeline and construction product lines. The backlog of orders has some seasonality due to the construction season. During fiscal 2011, 2010 and 2009, no customer accounted for more than 10% of sales. No material portion of our business is subject to renegotiation or termination of profits or contracts at the election of the United States Federal Government.
There are other companies that manufacture or sell products and services similar to those made and sold by us. Many of those companies are larger and have greater financial resources than we have. We compete principally on the basis of technical performance, service reliability, quality and price.
Raw Materials
We obtain raw materials from a wide variety of suppliers with alternative sources of most essential materials available within reasonable lead times.
Patents, Trademarks, Licenses, Franchises and Concessions
We own the following trademarks that we believe are of material importance to our business: Chase Corporation®, C-Spray (Logo), a trademark used in conjunction with most of the Company's business segment and product line marketing material and communications; HumiSeal®, a trademark for moisture protective coatings sold to the electronics industry; Chase & Sons® and Chase Facile®, trademarks for barrier and insulating tapes sold to the wire and cable industry; Chase BLH 2 OCK®, a trademark for a water blocking compound sold to the wire and cable industry; Rosphalt50®, a trademark for an asphalt additive used predominantly on bridge decks for waterproofing protection; Insulfab®, a trademark for insulation material used in the aerospace industry; PaperTyger®, a trademark for laminated durable papers sold to the envelope converting and commercial printing industries; Tapecoat®, a trademark for corrosion preventative surface coatings and primers; Royston®, a trademark for corrosion inhibiting coating composition for use on pipes; Eva-Pox® and Ceva®, trademarks for epoxy pastes/gels/mortars and elastomeric concrete used in the construction industry; CIM® trademarks for fluid applied coating and lining systems used in the water and wastewater industry; and ServiWrap® trademarks for pipeline protection tapes, coatings and accessories. We do not have any other material trademarks, licenses, franchises, or concessions. While we do hold various patents, at this time, we do not believe that they are material to the success of our business.
6
Table of Contents
Working Capital
We fund our business operations through a combination of available cash and cash equivalents, short-term investments and cash flows generated from operations. In addition, our revolving credit facility is available for additional working capital needs or investment opportunities.
Research and Development
Approximately $2,452,000, $1,748,000 and $1,632,000 was spent for Company-sponsored research and development during fiscal 2011, 2010 and 2009, respectively. Research and development increased by $704,000 in fiscal 2011 primarily due to our continued product development efforts that are directed towards seizing new business opportunities for our established product lines.
Available Information
Chase maintains a website at http://www.chasecorp.com . Our annual reports on Form 10-K, quarterly reports on Form 10-Q, current reports on Form 8-K and amendments to such reports filed or furnished pursuant to section 13(a) or 15(d) of the Securities Exchange Act of 1934, as well as section 16 reports on Form 3, 4, or 5, are available free of charge on this site as soon as is reasonably practicable after they are filed or furnished with the SEC. Our Financial Code of Ethics and the charters for the Audit Committee, the Nominating and Governance Committee and the Compensation and Management Development Committee of our Board of Directors are also available on our Internet site. The Code of Ethics and charters are also available in print to any shareholder upon request. Requests for such documents should be directed to Paula Myers, Shareholder and Investor Relations Department, at 26 Summer Street, Bridgewater, Massachusetts 02324. Our Internet site and the information contained on it or connected to it are not part of or incorporated by reference into this Form 10-K. Our filings with the SEC are also available on the SEC's website at http://www.sec.gov.
Financial Information About Segment and Geographic Areas
Please see Notes 11 and 12 to the Company's Consolidated Financial Statements for financial information about the Company's operating segments and domestic and foreign operations for each of the last three fiscal years.
ITEM 1A-RISK FACTORS
The following risk factors should be read carefully in connection with evaluating our business and the forward-looking information contained in this Annual Report on Form 10-K. We feel that any of the following risks could materially adversely affect our business, operations, industry, financial position or our future financial performance. While we believe that we have identified and discussed below the key risk factors affecting our business, there may be additional risks and uncertainties that are not presently known or that are not currently believed to be significant that may adversely affect our business, operations, industry, financial position and financial performance in the future.
We currently operate in mature markets where increases or decreases in market share could be significant.
Our sales and net income are largely dependent on recurring sales from a consistent and well established customer base. Organic growth opportunities are minimal; however, we have used and will continue to use strategic acquisitions as a means to build and grow the business. In this business environment, increases or decreases in market share could have a material effect on our business condition or results of operation. We face intense competition from a diverse range of competitors, including operating divisions of companies much larger and with far greater resources than we have. If we are unable to maintain our market share, our business could suffer.
Our business strategy includes the pursuit of strategic acquisitions, which may not be successful if they happen at all.
From time to time, we engage in discussions with potential target companies concerning potential acquisitions. In executing our acquisition strategy, we may be unable to identify suitable acquisition candidates. In addition, we
7
Table of Contents
may face competition from other companies for acquisition candidates, making it more difficult to acquire suitable companies on favorable terms.
Even if we do identify a suitable acquisition target and are able to negotiate and close a transaction, the integration of an acquired business into our operations involves numerous risks, including potential difficulties in integrating an acquired company's product line with ours; the diversion of our resources and management's attention from other business concerns; the potential loss of key employees; limitations imposed by antitrust or merger control laws in the United States or other jurisdictions; risks associated with entering a new geographical or product market; and the day-to-day management of a larger and more diverse combined company.
We may not realize the synergies, operating efficiencies, market position or revenue growth we anticipate from acquisitions and our failure to effectively manage the above risks and other problems associated with acquisitions could have a material adverse effect on our business, growth prospects and financial performance.
General economic factors, domestically and internationally, may adversely affect our financial performance through increased raw material costs or other expenses and by making access to capital more difficult.
The cumulative effect of higher interest rates, energy costs, inflation, levels of unemployment, healthcare costs, unsettled financial markets, and other economic factors could adversely affect our financial condition by increasing our manufacturing costs and other expenses at the same time that our customers may be scaling back demand for our products. Prices of certain commodity products, including oil and petroleum-based products, are historically volatile and are subject to fluctuations arising from changes in domestic and international supply and demand, labor costs, competition, weather events, market speculation, government regulations and periodic delays in delivery. Rapid and significant changes in commodity prices may affect our sales and profit margins. These factors can also increase our merchandise costs and/or selling, general and administrative expenses, and otherwise adversely affect our operations and results. Recent turmoil in the credit markets may limit our ability to access debt capital for use in acquisitions or other purposes on advantageous terms or at all. If we are unable to manage our expenses in response to general economic conditions and margin pressures, or if we are unable to obtain capital for strategic acquisitions or other needs, then our results of operations would be negatively affected.
Fluctuations in the supply and prices of raw materials may negatively impact our financial results.
We obtain raw materials needed to manufacture our products from a number of suppliers. Many of these raw materials are petroleum-based derivatives. Under normal market conditions, these materials are generally available on the open market and from a variety of producers. From time to time, however, the prices and availability of these raw materials fluctuate, which could impair our ability to procure necessary materials, or increase the cost of manufacturing our products. If the prices of raw materials increase, and we are unable to pass these increases on to our customers, we could experience reduced profit margins.
If our products fail to perform as expected, or if we experience product recalls, we could incur significant and unexpected costs and lose existing and future business.
Our products are complex and could have defects or errors presently unknown to us, which may give rise to claims against us, diminish our brands or divert our resources from other purposes. Despite testing, new and existing products could contain defects and errors and may in the future contain manufacturing or design defects, errors or performance problems when first introduced, or even after these products have been used by our customers for a period of time. These problems could result in expensive and time-consuming design modifications or warranty charges, changes to our manufacturing processes, product recalls, significant increases in our maintenance costs, or exposure to liability for damages, any of which may result in substantial and unexpected expenditures, require significant management attention, damage our reputation and customer relationships, and adversely affect our business, our operating results and our cash flow.
We are dependent on key personnel.
We depend significantly on our executive officers including Chairman and Chief Executive Officer, Peter R. Chase, and on other key employees. The loss of the services of any of these key employees could have a material impact on our business and results of operations. In addition, our acquisition strategy will require that we attract, motivate and retain additional skilled and experienced personnel. The inability to satisfy such requirements could have a negative impact on our ability to remain competitive in the future.
8
Table of Contents
If we cannot successfully manage the unique challenges presented by international markets, we may not be successful in expanding our international operations.
Our strategy includes expansion of our operations in existing and new international markets by selective acquisitions and strategic alliances. Our ability to successfully execute our strategy in international markets is affected by many of the same operational risks we face in expanding our U.S. operations. In addition, our international expansion may be adversely affected by our ability to identify and gain access to local suppliers as well as by local laws and customs, legal and regulatory constraints, political and economic conditions and currency regulations of the countries or regions in which we currently operate or intend to operate in the future. Risks inherent in our international operations also include, among others, the costs and difficulties of managing international operations, adverse tax consequences and greater difficulty in enforcing intellectual property rights. Additionally, foreign currency exchange rates and fluctuations may have an impact on future costs or on future cash flows from our international operations.
Our results of operations could be adversely affected by uncertain economic and political conditions and the effects of these conditions on our customers' businesses and levels of business activity.
Global economic and political conditions can affect the businesses of our customers and the markets they serve. A severe or prolonged economic downturn or a negative or uncertain political climate could adversely affect the levels of business activity of our customers and the industries they serve, including the automotive, aerospace, housing, construction, pipeline, energy, transportation infrastructure and electronics industries. This may reduce demand for our products or depress pricing of those products, either of which may have a material adverse effect on our results of operations. Changes in global economic conditions could also shift demand to products for which we do not have competitive advantages, and this could negatively affect the amount of business that we are able to obtain. In addition, if we are unable to successfully anticipate changing economic and political conditions, we may be unable to effectively plan for and respond to those changes and our business could be negatively affected.
Financial market performance may have a material adverse effect on our pension plan assets and require additional funding requirements.
Significant and sustained declines in the financial markets may have a material adverse effect on the fair market value of our pension plan assets. While these pension plan assets are considered non-financial assets since they are not carried on our balance sheet, the fair market valuation of these assets could impact our funding requirements, funded status or net periodic pension cost. Any significant and sustained declines in the fair market value of these pension assets could require us to increase our funding requirements which would have an impact on our cash flow, and could also lead to additional pension expense.
We may experience difficulties in the redesign and consolidation of our manufacturing facilities which could impact shipments to customers, product quality, and our ability to realize cost savings.
We currently have several ongoing projects to streamline our manufacturing operations, which include the redesign and consolidation of certain manufacturing facilities. We anticipate a reduction of overhead costs as a result of these projects, to the extent that we can effectively leverage assets, personnel, and operating processes in the transition of production between manufacturing facilities. However, uncertainty is inherent within the facility redesign and consolidation process, and unforeseen circumstances could offset the anticipated benefits, disrupt service to customers, and impact product quality.
Failure of an operating or information system or a compromise of security with respect to an operating or information system or portable electronic device could adversely affect our results of operations and financial condition or the effectiveness of our internal controls over operations and financial reporting.
We are highly dependent on automated systems to record and process our daily transactions and certain other components of our financial statements. We could experience either a failure of one or more of these systems, or a compromise of our security due to technical system flaws, data input or record-keeping errors, or tampering or manipulation of our systems by employees or unauthorized third parties. Information security risks also exist with respect to the use of portable electronic devices, such as laptops and smartphones, which are particularly vulnerable to loss and theft. We may also be subject to disruptions of any of these systems arising from events that are wholly or partially beyond our control (for example, natural disasters, acts of terrorism, epidemics, computer
9
Table of Contents
viruses, and electrical/telecommunications outages). All of these risks are also applicable wherever we rely on outside vendors to provide services. Operating system failures, disruptions, or the compromise of security with respect to operating systems or portable electronic devices could subject us to liability claims, harm our reputation, interrupt our operations, or adversely affect our internal control over financial reporting, business, results from operations, financial condition or cash flow.
Changes in accounting standards and subjective assumptions, estimates and judgments by management related to complex accounting matters could significantly affect our financial results.
Generally accepted accounting principles and related accounting pronouncements, implementation guidelines and interpretations with regard to a wide range of matters that are relevant to our business, such as revenue recognition, asset impairment, inventories, pensions valuation and tax matters, are highly complex and involve many subjective assumptions, estimates and judgments. Changes in these rules or their interpretation or changes in underlying assumptions, estimates, or judgments could significantly change our reported or expected financial performance or financial condition.
ITEM 1B-UNRESOLVED STAFF COMMENTS
Not applicable
10
Table of Contents
ITEM 2-PROPERTIES
We own and lease office and manufacturing properties as outlined in the table below.
Location | Square Feet | Owned/ Leased | Principal Use | |||||
|---|---|---|---|---|---|---|---|---|
| Bridgewater, MA | 5,200 | Owned | Corporate headquarters and executive office | |||||
Westwood, MA | | | 20,200 | | | Leased | | Global Operations Center including research and development, sales and administrative services |
Randolph, MA (a) | | | 77,500 | | | Owned | | Manufacture of electrical protective coatings and tape products |
Webster, MA (b) | | | 25,000 | | | Owned | | Recently vacated and currently being held for potential lease or sale |
Oxford, MA | | | 73,600 | | | Owned | | Manufacture of tape and related products for the electronic and telecommunications industries, as well as laminated durable papers |
Paterson, NJ | | | 40,000 | | | Owned/Leased | | We own the building and lease the land from the landowner. Currently, the building is being leased to a tenant and the land is being sub-leased. |
Taylorsville, NC | | | 50,000 | | | Leased | | Manufacture of flexible packaging for industrial and retail use, as well as tape and related products for the electronic and telecommunications industries |
Taylorsville, NC | | | 2,500 | | | Leased | | Storage warehouse |
Cranston, RI | | | 500 | | | Leased | | Sales office |
Pittsburgh, PA | | | 44,000 | | | Owned | | Manufacture and sale of protective coatings and tape products |
O'Hara Township, PA | | | 109,000 | | | Owned | | Manufacture and sale of protective coatings, expansion joints and accessories |
Evanston, IL (c) | | | 100,000 | | | Leased | | Manufacture and sale of protective coatings and tape products |
Peterborough, NH | | | 8,800 | | | Leased | | Sales and administrative facility |
Houston, TX | | | 45,000 | | | Owned | | Manufacture of coating and lining systems for use in liquid storage and containment applications. |
Camberley, Surrey, England | | | 6,700 | | | Leased | | Manufacture and sales of protective electronic coatings |
Winnersh, Berkshire, England (d) | | | 18,800 | | | Leased | | Under renovation for future manufacture and sales of protective electronic coatings |
Rye, East Sussex, England | | | 36,600 | | | Owned | | Manufacture and sales of protective coatings and tape products |
Paris, France | | | 1,350 | | | Leased | | Sales/technical service office and warehouse allowing direct sales and service to the French market |
(a) In
October 2011, we announced our intention to close our Randolph, MA facility effective December 1, 2012. The manufacturing of products produced in
the Randolph, MA facility will be transitioned to our other facilities over the course of a 15 month transition period.
(b) In
August 2011, we ceased manufacturing operations at our Webster, MA manufacturing facility and have transitioned production of this facility's products to
our Oxford, MA manufacturing facility.
(c) In
June 2009, we entered into a sale leaseback transaction whereby we sold our real property (land and building) located in Evanston, IL. We have agreed to
provide financing to the purchaser, and the purchaser has agreed to lease the property back to us for a term of 49 months ending July 2013. The term coincides with the period over which the
financing will be repaid to us.
(d) In
December 2010, we entered into a lease in Winnersh, Berkshire, England and we are working to renovate this property into a modern manufacturing and sales
facility. We are planning to transition the manufacture and sales of protective electronic coatings from our Camberley, Surrey, England facility over to this new facility by December 2011.
The above facilities range in age from new to about 100 years, are generally in good condition and, in the opinion of management, adequate and suitable for present operations. We also own equipment and machinery that is in good repair and, in the opinion of management, adequate and suitable for present operations. We could
11
Table of Contents
significantly add to our capacity by increasing shift operations. Availability of machine hours through additional shifts would provide expansion of current product volume without significant additional capital investment.
ITEM 3-LEGAL PROCEEDINGS
We are one of over 100 defendants in a lawsuit pending in Ohio which alleges personal injury from exposure to asbestos contained in certain Chase products. The case is captioned Marie Lou Scott, Executrix of the Estate of James T. Scott v. A-Best Products, et al., No. 312901 in the Court of Common Pleas for Cuyahoga County, Ohio. The plaintiff in the case issued discovery requests to us in August 2005, to which we timely responded in September 2005. The trial had initially been scheduled to begin on April 30, 2007. However, that date had been postponed and no new trial date has been set. As of October 2011, there have been no new developments as this Ohio lawsuit has been inactive with respect to us.
We were named as one of the defendants in a complaint filed on June 25, 2009, in a lawsuit captioned Lois Jansen, Individually and as Special Administrator of the Estate of Thomas Jansen v. Beazer East, Inc., et al., No: 09-CV-6248 in the Milwaukee County (Wisconsin) Circuit Court. The plaintiff alleges that her husband suffered and died from malignant mesothelioma resulting from exposure to asbestos in his workplace. The plaintiff has sued seven alleged manufacturers or distributors of asbestos-containing products, including Royston Laboratories (formerly an independent company and now a division of Chase Corporation). We have filed an answer to the claim denying the material allegations in the complaint. The parties are currently engaged in discovery.
In addition to the matters described above, we are involved from time to time in litigation incidental to the conduct of our business. Although we do not expect that the outcome in any of these matters, individually or collectively, will have a material adverse effect on our financial condition or results of operations, litigation is inherently unpredictable. Therefore, judgments could be rendered or settlements entered, that could adversely affect our operating results or cash flows in a particular period. We routinely assess all of our litigation and threatened litigation as to the probability of ultimately incurring a liability, and record our best estimate of the ultimate loss in situations where we assess the likelihood of loss as probable.
ITEM 4-[REMOVED AND RESERVED]
ITEM 4A-EXECUTIVE OFFICERS OF THE REGISTRANT
The following table sets forth information concerning our Executive Officers as of August 31, 2011. Each of our Executive Officers is selected by our Board of Directors and holds office until his successor is elected and qualified.
Name | Age | Offices Held and Business Experience during the Past Five Years | |||
|---|---|---|---|---|---|
| Peter R. Chase | 63 | Chairman of the Board of the Company since February 2007, and Chief Executive Officer of the Company since September 1993. | |||
Adam P. Chase | | | 39 | | President of the Company since January 2008, Chief Operating Officer of the Company since February 2007, Vice President Operations February 2006 through February 2007, and Vice President Chase Coating & Laminating Division March 2003 through February 2007. Adam Chase is the son of Peter Chase. |
Kenneth L. Dumas | | | 40 | | Chief Financial Officer and Treasurer of the Company since February 2007, Director of Finance February 2006 through January 2007, and Corporate Controller January 2004 through January 2007. |
12
Table of Contents
PART II
ITEM 5-MARKET FOR THE REGISTRANT'S COMMON EQUITY, RELATED STOCKHOLDER MATTERS AND ISSUER PURCHASES OF EQUITY SECURITIES
Our common stock is traded on the NYSE Amex under the symbol CCF. As of October 31, 2011, there were 443 shareholders of record of our Common Stock and approximately 3,037 beneficial shareholders who held shares in nominee name. On that date, the closing price of our common stock was $14.00 per share as reported by the NYSE Amex.
The following table sets forth the high and low daily sales prices for our common stock as reported by the NYSE Amex for each quarter in the fiscal years ended August 31, 2011 and 2010:
| | Fiscal 2011 | Fiscal 2010 | |||||||||||
|---|---|---|---|---|---|---|---|---|---|---|---|---|---|
| | High | Low | High | Low | |||||||||
First Quarter | $ | 18.59 | $ | 12.23 | $ | 14.90 | $ | 10.60 | |||||
Second Quarter | 16.60 | 14.06 | 12.50 | 10.21 | |||||||||
Third Quarter | 19.00 | 15.27 | 14.45 | 10.66 | |||||||||
Fourth Quarter | 17.21 | 11.39 | 14.65 | 10.61 | |||||||||
Single annual cash dividend payments were declared and paid subsequent to year end in the amounts of $0.35, $0.35, and $0.20 per common share, for the years ended August 31, 2011, 2010 and 2009, respectively. Certain borrowing facilities of ours contain financial covenants which may have the effect of limiting the amount of dividends that we can pay.
Comparative Stock Performance
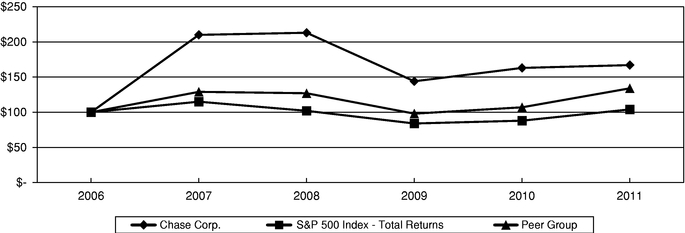
The following line graph compares the yearly percentage change in our cumulative total shareholder return on the Common Stock for the last five fiscal years with the cumulative total return on the Standard & Poor's 500 Stock Index (the "S&P 500 Index"), and a composite peer index that is weighted by market equity capitalization (the "Peer Group Index"). The companies included in the Peer Group Index are American Biltrite Inc., Material Sciences Corporation, H.B. Fuller Company, Quaker Chemical Corporation and RPM International, Inc. Cumulative total returns are calculated assuming that $100 was invested on August 31, 2006 in each of the Common Stock, the S&P 500 Index and the Peer Group Index, and that all dividends were reinvested.
Comparison of 5 Year Cumulative Total Return
Assumes Initial Investment of $100 on August 31, 2006
| | 2006 | 2007 | 2008 | 2009 | 2010 | 2011 | |||||||||||||
|---|---|---|---|---|---|---|---|---|---|---|---|---|---|---|---|---|---|---|---|
Chase Corp | $ | 100 | $ | 210 | $ | 213 | $ | 144 | $ | 163 | $ | 167 | |||||||
S&P 500 Index | $ | 100 | $ | 115 | $ | 102 | $ | 84 | $ | 88 | $ | 104 | |||||||
Peer Group Index | $ | 100 | $ | 129 | $ | 127 | $ | 98 | $ | 107 | $ | 134 | |||||||
The information under the caption "Comparative Stock Performance" above is not deemed to be "filed" as part of this Annual Report, and is not subject to the liability provisions of Section 18 of the Securities Exchange Act of 1934. Such information will not be deemed to be incorporated by reference into any filing we make under the Securities Act of 1933 unless we explicitly incorporate it into such a filing at the time.
13
Table of Contents
ITEM 6-SELECTED FINANCIAL DATA
The following selected financial data should be read in conjunction with "Item 7-Management's Discussion and Analysis of Financial Condition and Results of Operations" and "Item 8-Financial Statements and Supplementary Data."
| | Fiscal Years Ended August 31, | |||||||||||||||||
|---|---|---|---|---|---|---|---|---|---|---|---|---|---|---|---|---|---|---|
| | 2011 | 2010 | 2009 | 2008 | 2007 | |||||||||||||
| | (In thousands, except per share amounts) | |||||||||||||||||
Statement of Operations Data | ||||||||||||||||||
Revenues from continuing operations | $ | 123,040 | $ | 118,743 | $ | 91,236 | $ | 113,177 | $ | 109,195 | ||||||||
Income from continuing operations, net of taxes | $ | 10,931 | $ | 10,726 | $ | 5,315 | $ | 11,061 | $ | 8,965 | ||||||||
Income from discontinued operations, net of taxes | - | 1,790 | 1,070 | 1,313 | 1,228 | |||||||||||||
Net income | $ | 10,931 | $ | 12,516 | $ | 6,385 | $ | 12,374 | $ | 10,193 | ||||||||
Net income available to common shareholders, per common and common equivalent share: | ||||||||||||||||||
Basic: | ||||||||||||||||||
Continuing operations | $ | 1.22 | $ | 1.22 | $ | 0.62 | $ | 1.32 | $ | 1.11 | ||||||||
Discontinued operations | - | 0.20 | 0.13 | 0.16 | 0.15 | |||||||||||||
Net income per common and common equivalent share | $ | 1.22 | $ | 1.42 | $ | 0.75 | $ | 1.48 | $ | 1.26 | ||||||||
Diluted: | ||||||||||||||||||
Continuing operations | $ | 1.22 | $ | 1.21 | $ | 0.60 | $ | 1.27 | $ | 1.07 | ||||||||
Discontinued operations | - | 0.20 | 0.12 | 0.15 | 0.15 | |||||||||||||
Net income per common and common equivalent share | $ | 1.22 | $ | 1.41 | $ | 0.72 | $ | 1.42 | $ | 1.22 | ||||||||
The sum of individual share amounts may not equal due to rounding | ||||||||||||||||||
Balance Sheet Data | ||||||||||||||||||
Total assets | $ | 128,909 | $ | 123,201 | $ | 91,066 | $ | 90,297 | $ | 83,965 | ||||||||
Long-term debt and capital leases | 8,267 | 12,667 | - | - | 3,823 | |||||||||||||
Total stockholders' equity | 91,880 | 81,531 | 70,213 | 66,186 | 56,212 | |||||||||||||
Cash dividends paid per common and common equivalent share | $ | 0.35 | $ | 0.20 | $ | 0.35 | $ | 0.25 | $ | 0.20 | ||||||||
As further detailed in Note 15 to the Consolidated Financial Statements included in this Report, the Electronic Manufacturing Services business was sold in June 2010 and the financial results of this previously reported segment are classified as discontinued operations. We have reflected the results of this business as discontinued operations in the consolidated statement of operations for all periods presented.
14
Table of Contents
ITEM 7-MANAGEMENT'S DISCUSSION AND ANALYSIS OF FINANCIAL CONDITION AND RESULTS OF OPERATIONS
The following discussion provides an analysis of our financial condition and results of operations and should be read in conjunction with the Consolidated Financial Statements and notes thereto included in Item 8 of this Annual Report on Form 10-K.
Selected Relationships within the Consolidated Statements of Operations
| | Years Ended August 31, | |||||||||||
|---|---|---|---|---|---|---|---|---|---|---|---|---|
| | 2011 | 2010 | 2009 | |||||||||
| | (Dollars in thousands) | |||||||||||
Revenues from continuing operations | $ | 123,040 | $ | 118,743 | $ | 91,236 | ||||||
Income from continuing operations, net of taxes | $ | 10,931 | $ | 10,726 | $ | 5,315 | ||||||
Income from discontinued operations, net of taxes | - | 1,790 | 1,070 | |||||||||
Net income | $ | 10,931 | $ | 12,516 | $ | 6,385 | ||||||
Increase/(Decrease) in revenues from continuing operations from prior year | ||||||||||||
Amount | $ | 4,297 | $ | 27,507 | $ | (21,941 | ) | |||||
Percentage | 4 | % | 30 | % | (19 | )% | ||||||
Increase/(Decrease) in income from continuing operations, net of taxes from prior year | ||||||||||||
Amount | $ | 205 | $ | 5,411 | $ | (5,746 | ) | |||||
Percentage | 2 | % | 102 | % | (52 | )% | ||||||
Percentage of revenues from continuing operations: | ||||||||||||
Revenues from continuing operations | 100 | % | 100 | % | 100 | % | ||||||
Expenses: | ||||||||||||
Cost of products and services sold | 65 | % | 63 | % | 68 | % | ||||||
Selling, general and administrative expenses | 22 | 23 | 23 | |||||||||
Loss on impairment of assets | - | - | 1 | |||||||||
Other (income) | - | - | (1 | ) | ||||||||
Income from continuing operations before income taxes | 13 | 14 | 9 | |||||||||
Income taxes | 4 | 5 | 3 | |||||||||
Income from continuing operations, net of taxes | 9 | 9 | 6 | |||||||||
Income from discontinued operations, net of taxes | - | 2 | 1 | |||||||||
Net income | 9 | % | 11 | % | 7 | % | ||||||
Overview
Greater demand in the industrial controls, automotive and electrical cable markets resulted in increased revenues from continuing operations for fiscal 2011. Despite these increased revenues, the rising cost of raw materials, including petroleum related goods, had a direct impact on the profitability of our core product lines and net income from continuing operations increased slightly from the prior year. We continue to monitor raw material prices closely and implement sales price increases where possible, but the volatility of the cost of these raw materials remains uncertain. Revenues from our Industrial Materials segment exceeded prior year results due to increased sales from our wire & cable and electronic coatings product lines. We completed our plant move from Webster, MA to Oxford, MA ahead of schedule this past year, and recently announced the next phase of our consolidation plan, closing the Randolph, MA facility over the next twelve to fifteen months. Additionally, in the first half of fiscal 2012, we will be transitioning our HumiSeal Europe LTD manufacturing operations from Camberley, UK to a modern facility in Winnersh, UK.
Revenues from our Construction Materials segment were below prior year results due to poor market conditions in the construction and building sectors, which had a direct impact on sales of our private label products. This segment was also impacted this past year by some production issues at our Rye, UK facility primarily due to challenges in meeting heavy Middle East demand for pipeline products. These issues were rectified by process improvements implemented in the fourth quarter, but they resulted in higher costs and decreased production from
15
Table of Contents
that facility. We will continue to monitor our production processes to ensure that we deliver high quality goods to meet market needs as they arise.
In the upcoming fiscal year, our key objectives will include continuous efficiency improvements, long term consolidation and investment in R&D and marketing as this long-term commitment is expected to pay off in new products and increased business in future years. Our balance sheet continues to remain strong, with cash on hand of $15.0 million and a current ratio of 2.9. Although the current economic climate remains uncertain, we remain focused on our long term strategic goals. The balance of our unsecured term debt is currently $12.7 million. This term debt was used to finance our acquisitions in fiscal 2010. Our $10 million line of credit is fully available.
The Company has two reportable segments summarized below:
Segment | Product Lines | Manufacturing Focus and Products | |||
|---|---|---|---|---|---|
Industrial Materials | • Wire and Cable • Electronic Coatings • Custom Products | Protective coatings and tape products including insulating and conducting materials for wire and cable manufacturers, moisture protective coatings for electronics and printing services, laminated durable papers, and flexible composites and laminates for the aerospace, packaging and industrial laminate markets. | |||
Construction Materials | • Pipeline • Construction Products • Private Label | Protective coatings and tape products including coating and lining systems for use in liquid storage and containment applications, protective coatings for pipeline and general construction applications, high performance polymeric asphalt additives, and expansion and control joint systems for use in the transportation and architectural markets. | |||
As further detailed in Note 15 to the Consolidated Financial Statements included in this Report, the Electronic Manufacturing Services business was sold in June 2010 and the financial results of this previously reported segment are classified as discontinued operations. We have reflected the results of this business as discontinued operations in the consolidated statement of operations for all periods presented.
16
Table of Contents
Results of Operations
Revenues and Operating Profit by Segment are as follows:
| | Revenues | Income from Continuing Operations Before Income Taxes | % of Revenues | ||||||||
|---|---|---|---|---|---|---|---|---|---|---|---|
| | (Dollars in thousands) | | |||||||||
Fiscal 2011 | |||||||||||
Industrial Materials | $ | 75,744 | $ | 16,450 | (a) | 22 | % | ||||
Construction Materials | 47,296 | 3,972 | 8 | % | |||||||
| $ | 123,040 | 20,422 | 17 | % | ||||||
Less corporate and common costs | (4,249 | ) | |||||||||
Income from continuing operations before income taxes | $ | 16,173 | |||||||||
Fiscal 2010 | |||||||||||
Industrial Materials | $ | 64,645 | $ | 16,328 | (b) | 25 | % | ||||
Construction Materials | 54,098 | 6,367 | 12 | % | |||||||
| $ | 118,743 | 22,695 | 19 | % | ||||||
Less corporate and common costs | (6,239 | ) | |||||||||
Income from continuing operations before income taxes | $ | 16,456 | |||||||||
Fiscal 2009 | |||||||||||
Industrial Materials | $ | 60,678 | $ | 11,753 | (c) | 19 | % | ||||
Construction Materials | 30,558 | 2,146 | 7 | % | |||||||
| $ | 91,236 | 13,899 | 15 | % | ||||||
Less corporate and common costs | (5,796 | ) (d) | |||||||||
Income from continuing operations before income taxes | $ | 8,103 | |||||||||
(b) Includes idle facility costs of $392 from our Paterson, NJ and Oxford, MA facilities
(c) Includes loss on impairment of goodwill of $237
(d) Includes loss on impairment of assets of $262
Total Revenues
Total revenues in fiscal 2011 increased $4,297,000 or 4% to $123,040,000 from $118,743,000 in the prior year. Revenues in our Industrial Materials segment increased $11,099,000 or 17% to $75,744,000 for the year ended August 31, 2011 compared to $64,645,000 in fiscal 2010. The increase in revenues from our Industrial Materials segment in fiscal 2011 was primarily due to increased sales of: (a) $6,967,000 from our wire & cable product line as we benefitted from increased demand in the electrical cable market; (b) $2,219,000 in the electronic coatings product line, primarily due to increased demand in the industrial controls and automotive markets; and (c) $1,793,000 from our custom products product lines.
Revenues from our Construction Materials segment decreased $6,802,000 or 13% to $47,296,000 for the year ended August 31, 2011 compared to $54,098,000 for fiscal 2010. The reduced sales from our Construction Materials segment in fiscal 2011 was primarily due to decreased sales of: (a) $4,603,000 from our private label products due to less demand for these products; (b) $1,230,000 from pipeline products produced at our UK facility as we experienced production challenges in meeting heavy Middle East demand in the latter half of fiscal 2011; and (c) $999,000 from our construction product lines as a result of decreased demand in the transportation and architectural markets.
Royalties and commissions in the Industrial Materials segment were $2,122,000, $1,664,000 and $1,077,000 for the years ended August 31, 2011, 2010 and 2009, respectively. The increase in royalties and
17
Table of Contents
commissions in fiscal 2011 over the prior two fiscal years was due to increased sales of electronic coatings by our licensed manufacturer in Asia.
Export sales from domestic operations to unaffiliated third parties were $19,715,000, $17,946,000 and $14,611,000 for the years ended August 31, 2011, 2010 and 2009, respectively. The growth in our export sales in fiscal 2011 was primarily due to increased demand from our foreign customers in the aerospace and wire & cable markets.
Total revenues in fiscal 2010 increased $27,507,000 or 30% to $118,743,000 from $91,236,000 in fiscal 2009. Revenues in our Industrial Materials segment increased $3,967,000 or 7% to $64,645,000 for the year ended August 31, 2010 compared to $60,678,000 in fiscal 2009. The increase in revenues from our Industrial Materials segment in fiscal 2010 was primarily due to increased sales of $6,672,000 in the electronic coatings product line from both the worldwide automotive sector and protective products used in domestic infrastructure applications. This increase was partially offset by decreased sales of $2,947,000 from our custom products product lines primarily due to decreased demand in the transportation market. Revenues from our Construction Materials segment increased $23,540,000 or 77% to $54,098,000 for the year ended August 31, 2010 compared to $30,558,000 for fiscal 2009. The increase in revenues from our Construction Materials segment in fiscal 2010 was primarily due to increased sales of: (a) $12,354,000 from CIM which we acquired in September 2009; (b) $4,991,000 from ServiWrap which was acquired in December 2009; (c) $3,354,000 from our pipeline and construction product lines; and (d) $2,793,000 from our private label products due to increased demand for these products.
Cost of Products and Services Sold
Cost of products and services sold increased $5,489,000 or 7% to $80,317,000 for the fiscal year ended August 31, 2011 compared to $74,828,000 in fiscal 2010. As a percentage of revenues, cost of products and services sold increased to 65% in fiscal 2011 compared to 63% for fiscal 2010.
The following table summarizes the relative percentages of costs of products and services sold to revenues for both of our reporting segments:
| | Fiscal Years Ended August 31, | ||||||
|---|---|---|---|---|---|---|---|
Cost of products and services sold | 2011 | 2010 | 2009 | ||||
Industrial Materials | 64% | 61% | 66% | ||||
Construction Materials | 67% | 66% | 72% | ||||
Total | 65% | 63% | 68% | ||||
Cost of products and services sold in our Industrial Materials segment was $48,474,000 for the fiscal year ended August 31, 2011 compared to $39,340,000 in fiscal 2010. As a percentage of revenues, cost of products and services sold in the Industrial Materials segment increased primarily due to rising prices in certain commodity and petroleum based raw materials impacting many of our product lines throughout the year. Additionally, we incurred incremental one-time expenses in the latter half of fiscal 2011 related to the transition of our Webster, MA production processes over to the Oxford, MA facility. While we continue to face challenges with margin pressures across many of our key product lines, we anticipate a favorable future impact as a result of this transition.
Cost of products and services sold in our Construction Materials segment was $31,843,000 for the fiscal year ended August 31, 2011 compared to $35,488,000 in fiscal 2010. As a percentage of revenues, cost of products and services sold in the Construction Materials segment increased primarily due to higher raw material costs which were partially offset by increased sales of our higher margin products and the resulting lower share of total sales that were made up of lower margin products.
In fiscal 2010, cost of products and services sold increased $12,567,000 or 20% to $74,828,000 compared to $62,261,000 in the prior fiscal year. As a percentage of revenues, cost of products and services sold decreased to 63% in fiscal 2010 compared to 68% for fiscal 2009. Cost of products and services sold in our Industrial Materials segment were $39,340,000 for the fiscal year ended August 31, 2010 compared to $40,162,000 in fiscal 2009. The percentage of revenues decrease in the cost of products and services sold for the Industrial Materials segment was primarily due to increased sales of higher margin products, management's ability to leverage its fixed overhead costs on a higher revenue base, and the favorable impact of ongoing cost reduction efforts. Cost
18
Table of Contents
of products and services sold in our Construction Materials segment were $35,488,000 for the fiscal year ended August 31, 2010 compared to $22,099,000 in fiscal 2009. The large dollar value increase in cost of products and services sold in this Construction Materials segment during fiscal 2010 was primarily attributable to the fiscal 2010 acquisitions of the CIM business and the Serviwrap product lines. The decrease in cost of products and services sold as a percentage of revenues in this segment during fiscal 2010 was a direct result of a favorable product mix coupled with continued focus and scrutiny on material purchases that helped stabilize margins on many of our key product lines.
Selling, General and Administrative Expenses
Selling, general and administrative expenses decreased $371,000 or 1% to $26,780,000 during fiscal 2011 compared to $27,151,000 in fiscal 2010. As a percentage of revenues, selling, general and administrative expenses decreased to 22% in fiscal 2011 compared to 23% for fiscal 2010. This decrease was primarily due to acquisition costs of $434,000 incurred in fiscal 2010 and lower stock based compensation expense in fiscal 2011. These were partially offset by increased research and development, sales commissions and other selling related expenses resulting from increased revenues in the current year.
During fiscal 2010, selling, general and administrative expenses increased $6,337,000 or 30% to $27,151,000, compared to $20,814,000 in fiscal 2009. As a percentage of revenues, selling, general and administrative expenses remained flat at 23% in both fiscal 2010 and 2009. The dollar increase in fiscal 2010 was primarily attributable to incremental expenses from the CIM and ServiWrap acquisitions, including acquisition costs of $434,000 and amortization of intangible assets of $1,170,000. Additionally, increased revenues and profitability in fiscal 2010 compared to the prior year led to increased sales commissions and other selling related expenses and increased incentive compensation expense. These increases were partially offset by management's continued emphasis on controlling costs, including reduced travel and external consulting costs.
In fiscal 2011, bad debt expense, net of recoveries, decreased $51,000 or 29% to $127,000, compared to $178,000 in fiscal 2010. The improvement in fiscal 2011 was a result of our strict adherence to our established credit policies as well as closely monitoring the accounts receivable function and taking a proactive approach to the collections process. Bad debt expense, net of recoveries, increased $219,000 to $178,000 in fiscal 2010 compared to a net gain of $41,000 in fiscal 2009 that was due to recoveries of previously identified bad debt that exceeded additions to bad debt expense for the fiscal year. The increase in bad debt expense in fiscal 2010 was primarily due to financial difficulties for several of our customers as well as overall increased receivable balances due to higher sales.
Loss on Impairment of Fixed Assets
In fiscal 2009, we recorded a $262,000 charge related to the impairment of real property (land and building) located in West Bridgewater, MA which was being leased to Sunburst Electronics Manufacturing Solutions, Inc. The real property, having a pre-impairment book value of $1,632,000, was written down to its fair value of $1,370,000, which was realized upon the June 2009 sale of the property.
Loss on Impairment of Goodwill
In fiscal 2009, based on the decrease in sales activity in the fiscal year and the completion of the fiscal 2010 budget, we determined that the carrying value of goodwill associated with our Northeast Quality Products ("NEQP") division may not be recoverable. Accordingly, we performed a goodwill impairment analysis. Based on the present value of future cash flows utilizing projected results for the balance of fiscal year 2009 and projections for future years based on the fiscal year 2010 budgeting process, the goodwill impairment analysis yielded results that did not support the current book value of the goodwill associated with this division. As a result, we concluded that the carrying amount of goodwill for the NEQP division was not fully recoverable and an impairment charge of $237,000 was recorded as of May 31, 2009. Goodwill related to NEQP, having a pre-impairment book value of $349,000, was written down to its fair value of $112,000 in accordance with generally accepted accounting principles. The NEQP division was sold on August 14, 2009, and the adjusted fair value of $112,000 was realized upon the sale.
Interest Expense
Interest expense decreased $164,000 to $196,000 in fiscal 2011 compared to $360,000 in fiscal 2010. The decrease in interest expense in fiscal 2011 compared to the prior fiscal year is primarily due to the capitalization of
19
Table of Contents
imputed interest on construction in process projects related to our Oxford, MA and Pittsburgh, PA facilities. Interest expense increased $343,000 to $360,000 in fiscal 2010 compared to $17,000 in fiscal 2009. The increase in interest expense in fiscal 2010 compared to fiscal 2009 is a direct result of the $10,000,000 term note and $3,000,000 promissory notes related to the acquisition of CIM, and the $7,000,000 term loan related to the acquisition of ServiWrap.
Other Income
Other income increased $374,000 to $426,000 in fiscal 2011 compared to $52,000 in fiscal 2010. Other income primarily includes interest income and foreign exchange gains caused by changes in exchange rates on transactions or balances denominated in currencies other than the functional currency of our subsidiaries. The increase in other income in fiscal 2011 from the prior year is primarily due to foreign exchange gains (losses) caused by the volatility of the pound sterling and the euro, and the subsequent revaluation of some of our European sales transactions completed in other functional currencies (and subsequently translated to the pound sterling and the euro). Other income decreased $406,000 to $52,000 in fiscal 2010 compared to $458,000 in fiscal 2009. The decrease in other income in fiscal 2010 from the prior year is primarily due to the fiscal 2009 inclusion of rental income that we received from real property sold in June 2009.
Income Taxes
The effective tax rate for fiscal 2011 was 32.4% compared to 34.8% and 34.4% in fiscal 2010 and 2009, respectively. In all three years, we have received the benefit of the domestic production deduction and foreign rate differential. The effective tax rate of 32.4% for fiscal 2011 compares favorably to 2010 due to an increase in the applicable domestic production deduction for the year to 9% (increased from 6% in fiscal 2010) and a more favorable effective state income tax rate in 2011. The increase in the effective tax rate in fiscal 2010 as compared to fiscal 2009 is primarily due to a less favorable foreign tax rate differential and research credit in fiscal 2010 as compared to fiscal 2009.
Net Income
Consolidated net income in fiscal 2011 decreased $1,585,000 or 13% to $10,931,000 compared to $12,516,000 in fiscal 2010. Income from continuing operations increased $205,000 or 2% to $10,931,000 for the year ended August 31, 2011 compared to $10,726,000 in fiscal 2010. The increase in net income from continuing operations in fiscal 2011 was a result of increased revenues offset by increased raw material costs. Income from discontinued operations of $1,790,000 for the year ended August 31, 2010 was from our Chase EMS business which was sold in June 2010.
Consolidated net income in fiscal 2010 increased $6,131,000 or 96% to $12,516,000 compared to $6,385,000 in fiscal 2009. Income from continuing operations increased $5,411,000 or 102% to $10,726,000 for the year ended August 31, 2010 compared to $5,315,000 in fiscal 2009. The increase in net income from continuing operations in fiscal 2010 was a result of the revenue growth discussed previously. Income from discontinued operations increased $720,000 or 67% to $1,790,000 for the year ended August 31, 2010 compared to $1,070,000 in fiscal 2009. The increase in income from discontinued operations in fiscal 2010 was primarily a result of the $429,000 gain on the sale of the Chase EMS business as well as the overall growth in sales in fiscal 2010.
Liquidity and Sources of Capital
Our overall cash balance decreased $2,358,000 to $14,982,000 at August 31, 2011 from $17,340,000 at August 31, 2010. The decreased cash balance at August 31, 2011 was a result of cash on hand used for strategic purchases of key raw materials, payment of our annual dividend in December 2010, debt repayments and purchases of machinery and equipment including improvements made to our Oxford, MA facility. These cash outflows were partially offset by cash generated from operations during the year. Our overall cash balance increased $5,697,000 to $17,340,000 at August 31, 2010 from $11,643,000 at August 31, 2009. The increased cash balance at August 31, 2010 was a result of the June 2010 sale of our Electronic Manufacturing Services business as well as cash flows generated from operations during the year, offset by cash used for acquisitions.
Cash flow provided by operations was $9,303,000 for the year ended August 31, 2011 compared to $11,346,000 in fiscal 2010 and $16,877,000 in fiscal 2009. Cash provided by operations during fiscal 2011, was
20
Table of Contents
primarily due to operating income offset by increased purchases of inventory, as we strategically built up our inventory to facilitate certain manufacturing plant transition plans as well as making bulk purchases of key raw materials to take advantage of favorable pricing terms. Cash provided by operations during fiscal 2010 was primarily due to operating income and decreased accounts payable and accrued expense balances, offset by increased accounts receivable and inventory balances. Cash provided by operations during fiscal 2009 was primarily due to operating income and decreased accounts receivable and inventory balances, offset by reduced accounts payable balances.
The ratio of current assets to current liabilities was 2.9 as of August 31, 2011 compared to 2.6 as of August 31, 2010. The increase in our current ratio at August 31, 2011 was primarily attributable to the increases in our raw material and finished goods inventories as well as a decrease in our accrued income taxes, which were partially offset by an overall decrease in our cash balance as noted above.
Cash flow used in investing activities was $4,172,000 for the year ended August 31, 2011 compared to $17,329,000 in fiscal 2010 and $5,204,000 in fiscal 2009. During fiscal 2011, cash flow used in investing activities was primarily due to $1,930,000 paid for machinery and equipment and improvements made for our Oxford, MA facility, $827,000 paid for machinery and equipment and improvements made for our facility in O'Hara Township, PA, $605,000 paid related to the build out of our newly leased property in Winnersh, UK, and cash paid for purchases of machinery and equipment at our other manufacturing locations. These cash outflows were partially offset by additional proceeds during fiscal 2011 of $1,478,000 received from the sale of our Chase EMS business. During fiscal 2010, cash flow used in investing activities was primarily due to payments totaling $25,592,000 for the acquisitions of CIM and ServiWrap, and $3,572,000 paid for purchases of machinery and equipment at our other manufacturing locations during fiscal 2010. This was partially offset by the $12,689,000 of net proceeds received from the sale of our discontinued operations. During fiscal 2009, cash flow used in investing activities was primarily due to $2,509,000 used to pay for the purchase of real property in Oxford, MA, $1,280,000 paid for purchases related to the build out of our manufacturing facility in Pittsburgh, PA, and purchases of machinery and equipment at our other manufacturing locations.
Cash flow used in financing activities was $7,729,000 for the year ended August 31, 2011 as compared to cash flow provided by financing activities of $11,664,000 in fiscal 2010 and cash flow used in financing activities of $3,856,000 in fiscal 2009. During fiscal 2011, cash flow used in financing activities reflected our annual dividend payment and payments made on the bank loans we used to finance our prior year acquisitions of CIM and ServiWrap. Additionally, we paid the first of three scheduled promissory note payments of $1,000,000 to the CIM shareholders in accordance with the CIM stock purchase agreement, described in more detail below. During fiscal 2010, cash flow provided by financing activities primarily resulted from a total of $17,000,000 in term debt used to finance our acquisitions of CIM and ServiWrap. These were partially offset by payments made on the acquisition loans and our line of credit arrangement, as well as our annual dividend. During fiscal 2009, cash flow used in financing activities reflected the payment of the annual dividend and payments of statutory minimum taxes on restricted stock.
On October 14, 2010, we announced a cash dividend of $0.35 per share (totaling $3,131,000), comprised of $0.30 related to earnings from continuing operations and $0.05 related to earnings from discontinued operations, to shareholders of record on October 31, 2010 and paid on December 3, 2010.
On October 13, 2011, we announced a cash dividend of $0.35 per share (totaling approximately $3,134,000), to shareholders of record on October 31, 2011 and payable on December 5, 2011.
We continue to have long-term unsecured credit available up to $10,000,000 with Bank of America at the bank's base lending rate or, at the option of the Company, at the effective London Interbank Offered Rate (LIBOR) plus 150 basis points. On June 8, 2010, we executed an amendment to this credit facility, extending its maturity to March 31, 2013. As part of this amendment, the interest rate was increased by 25 basis points, from its original rate of LIBOR plus 125 basis points. All other terms of the credit facility remain the same. As of August 31, 2011 and October 31, 2011, the entire amount of $10,000,000 was available for use. We plan to use this availability to help finance our cash needs, including potential acquisitions, in fiscal 2012 and future periods.
Under the terms of our credit facility, we must comply with certain debt covenants related to (a) the ratio of total liabilities to tangible net worth and (b) the ratio of operating cash flow to debt service on a rolling twelve month basis. We were in compliance with our debt covenants as of August 31, 2011.
21
Table of Contents
We borrowed $10,000,000 from Bank of America in September 2009 in order to fund our acquisition of CIM. This borrowing involved an unsecured, three year term note (the "Term Note") with interest and principal payments due monthly. Interest is calculated at the applicable LIBOR rate plus a margin of 175 basis points, with interest payments due on the last day of each month. At August 31, 2011, the applicable interest rate was 1.94% per annum and the outstanding principal amount was $6,000,000. In addition to monthly interest payments, we are repaying the principal in equal installments of $167,000 per month, beginning on September 30, 2009, and on the last day of each month thereafter, ending on August 31, 2012, when we will repay the remaining principal balance plus any interest then due. The Term Note is subject to the same debt covenants as our line of credit discussed above. Prepayment of the Term Note is allowed at any time during the term of the loan. In November 2011, we executed an amendment to this Term Note, extending the maturity to August 31, 2014. Monthly payments of $167,000 will continue through August 2014, at which time we will repay the remaining principal balance plus any interest then due. All other terms of the Term Note remain the same.
As part of the CIM acquisition in September 2009, we also delivered $3,000,000 in non-negotiable promissory notes (the "Notes") payable to five CIM shareholders, who were the holders of all of the issued and outstanding shares of capital stock of CIM as of the acquisition date. The principal of the Notes will be paid in three consecutive annual installments of $1,000,000 each, with the initial payment due on September 4, 2010. Interest on the unpaid principal balance of the Notes is accruing at a rate per annum equal to the applicable Federal rate, and will be paid annually with each principal payment. At August 31, 2011, the applicable interest rate was 0.84% per annum. We paid the first installment on the Notes in September 2010 and the second installment was paid in September 2011.
In December 2009, we borrowed $7,000,000 from RBS Citizens in order to fund our acquisition of the ServiWrap product lines. This borrowing involved an unsecured, three year term note (the "Term Loan") with interest and principal payments due monthly. Interest is calculated at the applicable LIBOR rate plus a margin of 190 basis points, with interest payments due on the last day of each month. In addition to monthly interest payments, we are repaying the principal in equal installments of $117,000 each, beginning on January 15, 2010, and on the 15th day of each month thereafter, ending on December 15, 2012, when we will repay the remaining principal balance plus any interest then due. The Term Loan is subject to the same debt covenants as our line of credit discussed above. Prepayment of the Term Loan is allowed at any time. At August 31, 2011, the applicable interest rate was 2.11% per annum, and the outstanding principal amount was approximately $4,700,000.
We currently have several on-going capital projects that are important to our long term strategic goals. These projects include the upcoming move of our HumiSeal Europe LTD manufacturing operations from Camberley, UK to a modern facility in Winnersh, UK. Additionally, we have the continued renovations to our Oxford, MA facility, as well as the recently announced closing of our Randolph, MA plant which will be transitioned to our other facilities over the course of a fifteen month transition period. Machinery and equipment will also be added as needed to increase capacity or enhance operating efficiencies in our other manufacturing plants.
We may consider the acquisition of companies or other assets this year or in future periods which are complementary to our business. We believe that our existing resources, including cash on hand and our line of credit, together with cash generated from operations and additional bank borrowings, will be sufficient to fund our cash flow requirements through at least the next twelve months. However, there can be no assurances that additional financing will be available on favorable terms, if at all.
To the extent that interest rates increase in future periods, we will assess the impact of these higher interest rates on the financial and cash flow projections of our potential acquisitions.
We have no significant off balance sheet arrangements.
22
Table of Contents
Contractual Obligations
The following table summarizes our contractual cash obligations at August 31, 2011 and the effect such obligations are expected to have on our liquidity and cash flow in future periods.
Contractual Obligations | Total | Payments Due Less than 1 Year | Payments Due 1 - 3 Years | Payments Due 4 - 5 Years | Payments After 5 Years | ||||||||||||
|---|---|---|---|---|---|---|---|---|---|---|---|---|---|---|---|---|---|
| | (Dollars in thousands) | ||||||||||||||||
Long-term debt including estimated interest | $ | 13,006 | $ | 4,583 | $ | 7,954 | $ | 469 | $ | - | |||||||
Operating leases | 9,377 | 773 | 1,600 | 1,482 | 5,522 | ||||||||||||
Purchase Obligations | 4,680 | 4,680 | - | - | - | ||||||||||||
Total (1) | $ | 27,063 | $ | 10,036 | $ | 9,554 | $ | 1,951 | $ | 5,522 | |||||||
Recently Issued Accounting Standards
In January 2010, the Financial Accounting Standards Board ("FASB") issued Accounting Standards Update ("ASU") No. 2010-06, "Fair Value Measurements and Disclosures (Accounting Standards Codification "ASC" Topic 820)-Improving Disclosures about Fair Value Measurements" ("ASU 2010-06"). The updated standard requires new disclosures around transfers into and out of Levels 1 and 2 in the fair value hierarchy and separate disclosures about purchases, sales, issuances, and settlements to be presented separately on a gross basis in the reconciliation of Level 3 fair value measurements. The three-level fair value hierarchy is described in more detail in Note 16 to the financial statements filed as part of this Annual Report on Form 10-K. ASU 2010-06 is effective for interim and annual reporting periods beginning after December 15, 2009 with early adoption permitted, except for the Level 3 reconciliation disclosures which are effective for fiscal years beginning after December 15, 2010. The portion of the update which was effective for fiscal years beginning after December 15, 2009 was adopted by us effective March 1, 2010 and the adoption did not have any effect on our consolidated financial position, results of operations or cash flows. The portion of the update which is effective for fiscal years beginning after December 15, 2010 will not have an impact on our consolidated financial position, results of operations or cash flows.
In December 2010, the FASB issued ASU No. 2010-29, "Business Combinations (ASC Topic 805)-Disclosure of Supplementary Pro Forma Information for Business Combinations" ("ASU 2010-29"). This standard update clarifies that, when presenting comparative financial statements, SEC registrants should disclose revenue and earnings of the combined entity as though the current period business combinations had occurred as of the beginning of the comparable prior annual reporting period only. The update also expands the supplemental pro forma disclosures to include a description of the nature and amount of material, nonrecurring pro forma adjustments directly attributable to the business combination included in the reported pro forma revenue and earnings. ASU 2010-29 is effective prospectively for material (either on an individual or aggregate basis) business combinations entered into in fiscal years beginning on or after December 15, 2010, with early adoption permitted. The adoption of ASU 2010-29 will not have an impact on our consolidated financial position, results of operations or cash flows; however, we may have additional disclosure requirements if a material acquisition occurs.
In June 2011, the FASB issued ASU No. 2011-05, "Comprehensive Income (ASC Topic 220): Presentation of Comprehensive Income," ("ASU 2011-05") which amends current comprehensive income guidance. This accounting update eliminates the option to present the components of other comprehensive income as part of the statement of shareholders' equity. Instead, we must report comprehensive income in either a single continuous statement of comprehensive income which contains two sections, net income and other comprehensive income, or in two separate but consecutive statements. ASU 2011-05 will be effective for public companies during the interim and annual periods beginning after December 15, 2011 with early adoption permitted. The adoption of ASU 2011-05 will not have an impact on our consolidated financial position, results of operations or cash flows as it only requires a change in the format of our current presentation.
23
Table of Contents
In September 2011, the FASB issued ASU No. 2011-08, "Intangibles-Goodwill and Other (ASC Topic 350)-Testing Goodwill for Impairment," ("ASU 2011-08") which gives companies the option to first perform a qualitative assessment to determine whether it is more likely than not that the fair value of a reporting unit is less than its carrying amount before performing the two-step test mandated prior to this update. ASU 2011-08 also provides companies with a revised list of examples of events and circumstances to consider, in their totality, to determine whether it is more likely than not that the fair value of a reporting unit is less than its carrying amount. If a company concludes that this is the case, it must perform the two-step test. Otherwise, a company may skip the two-step test. Companies are not required to perform the qualitative assessment and may instead proceed directly to the first step of the two-part test. ASU 2011-08 is effective for annual and interim goodwill impairment tests performed for fiscal years beginning after December 15, 2011, with early adoption permitted. We do not expect that the adoption of ASU 2011-08 to have a material impact on our consolidated financial position, results of operations or cash flows.
Critical Accounting Policies, Judgments, and Estimates
The U.S. Securities and Exchange Commission ("SEC") requires companies to provide additional disclosure and commentary on their most critical accounting policies. The SEC has defined the most critical accounting policies as the ones that are most important to the portrayal of a company's financial condition and operating results, and requires management to make its most significant estimates and judgments in the preparation of its consolidated financial statements. Our critical accounting policies are described below.
Accounts Receivable
We evaluate the collectability of accounts receivable balances based on a combination of factors. In cases where we are aware of circumstances that may impair a specific customer's ability to meet its financial obligations to us, a specific allowance against amounts due to us is recorded, and thereby reduces the net recognized receivable to the amount we reasonably believe will be collected. For all other customers, we recognize allowances for doubtful accounts based on the length of time the receivables are past due, industry and geographic concentrations, the current business environment and our historical experience. If the financial condition of our customers deteriorates or if economic conditions worsen, additional allowances may be required in the future, which could have an adverse impact on our future operating results.
Inventories
We value inventory at the lower of cost or market using the first-in, first-out (FIFO) method. Management assesses the recoverability of inventory based on types and levels of inventory held, forecasted demand and changes in technology. These assessments require management judgments and estimates, and valuation adjustments for excess and obsolete inventory may be recorded based on these assessments. We estimate excess and obsolescence exposures based upon assumptions about future demand, product transitions, and market conditions and record reserves to reduce inventories to their estimated net realizable value. The failure to accurately forecast demand may lead to additional excess and obsolete inventory and future charges.
Business Combinations
We assign the value of the consideration transferred to acquire a business to the tangible assets and identifiable intangible assets acquired and liabilities assumed on the basis of their fair values at the date of acquisition. We assess the fair value of assets, including intangible assets, using a variety of methods and each asset is measured at fair value from the perspective of a market participant. The method used to estimate the fair values of intangible assets incorporates significant assumptions regarding the estimates a market participant would make in order to evaluate an asset, including a market participant's use of the asset and the appropriate discount rates for a market participant. Assets recorded from the perspective of a market participant that are determined to not have economic use for us are expensed immediately. Any excess purchase price over the fair value of the net tangible and intangible assets acquired is allocated to goodwill. Transaction costs and restructuring costs associated with a transaction to acquire a business are expensed as incurred.
24
Table of Contents
Goodwill, Intangible Assets, and Other Long-Lived Assets
Long-lived assets consist of goodwill, identifiable intangible assets, trademarks, patents and agreements and property, plant, and equipment. Intangible assets and property, plant, and equipment, excluding goodwill, are amortized using the straight-line method over their estimated useful life. We review long-lived assets and all intangible assets for impairment whenever events or changes in circumstances indicate the carrying amount of such assets may not be recoverable. Goodwill is also reviewed at least annually for impairment. Factors which we consider important and that could trigger an impairment review include significant underperformance relative to expected historical or projected future operating results and significant negative industry or economic trends. We determine whether an impairment has occurred based on gross expected future cash flows for each reporting unit and measure the amount of the impairment based on the related future discounted cash flows for the respective reporting unit. The cash flow estimates used to determine impairment, if any, contain management's best estimates, using appropriate and customary assumptions and projections at the time. (See notes to consolidated financial statements.)
The estimates of expected cash flows require us to make significant judgments regarding future periods that are subject to some factors outside of our control. Changes in these estimates can result in significant revisions to the carrying value of these assets and may result in material charges to the results of operations.
Revenue Recognition
We recognize revenue when persuasive evidence of an arrangement exists, performance of our obligation is complete, our price to the buyer is fixed or determinable, and we are reasonably assured of collecting. This is typically at the time of shipment. If a loss is anticipated on any contract, a provision for the entire loss is made immediately. Revenue recognition involves judgments and assessments of expected returns, and the likelihood of nonpayment due to insolvent customers. We analyze various factors, including a review of specific customer contracts and shipment terms, historical experience, creditworthiness of customers and current market and economic conditions in determining when to recognize revenue. Changes in judgments on these factors could impact the timing and amount of revenue recognized with a resulting impact on the timing and amount of associated income. Commissions are recognized when earned and payments are received from the manufacturers represented. Royalty revenue is recognized based on licensee production statements received from the authorized manufacturers. Billed shipping and handling fees are recorded as sales revenue with the associated costs recorded as costs of products and services sold.
Contingent Income Tax Liabilities
We are subject to routine income tax audits that occur periodically in the normal course of business. Our contingent income tax liabilities are estimated based on the methodology prescribed in the guidance for accounting for uncertain tax positions, which we adopted as of the beginning of fiscal 2008. The guidance prescribes a minimum recognition threshold a tax position is required to meet before being recognized in the financial statements. Our liabilities related to uncertain tax positions require an assessment of the probability of the income-tax-related exposures and settlements and are influenced by our historical audit experiences with various state and federal taxing authorities as well as by current income tax trends. If circumstances change, we may be required to record adjustments that could be material to our reported financial condition and results of operations. See Note 7 to the Consolidated Financial Statements included in this Report for more information on our accounting for uncertain tax positions.
Deferred Income Taxes
We evaluate the need for a valuation allowance to reduce our deferred tax assets to the amount that is more likely than not to be realized. We have considered future taxable income and ongoing prudent and feasible tax planning strategies in assessing the need for a valuation allowance. Should we determine that we would not be able to realize all or part of our net deferred tax asset in the future, an adjustment to the deferred tax asset would be charged to income in the period such determination was made.
Stock Based Compensation
We measure compensation cost for share-based compensation at fair value, including estimated forfeitures, and recognize the expense over the period that the recipient is required to provide service in exchange for the
25
Table of Contents
award, which generally is the vesting period. We use the Black-Scholes option pricing model to measure the fair value of stock options. This model requires significant estimates related to the award's expected life and future stock price volatility of the underlying equity security. In determining the amount of expense to be recorded, we are also required to estimate forfeiture rates for awards, based on the probability that employees will complete the required service period. We estimate the forfeiture rate based on historical experience. If actual forfeitures differ significantly from our estimates, additional adjustments to compensation expense may be required in future periods.
Pension Benefits
We sponsor a non-contributory defined benefit pension plan covering substantially all employees of certain divisions of the Company. In calculating our retirement plan obligations and related expense, we make various assumptions and estimates. These assumptions include discount rates, benefits earned, expected return on plan assets, mortality rates, and other factors. While we believe that the assumptions used are appropriate, differences in actual experience or changes in assumptions may affect our pension obligations and future expense.
Effective December 1, 2008, the defined benefit pension plan was amended to include a soft freeze whereby any employee hired after the effective date of December 1, 2008 will not be admitted to the plan. The only exception relates to employees of the International Association of Machinists and Aerospace Workers Union. All participants who were previously admitted to the plan prior to the December 1, 2008 soft freeze will continue to accrue benefits as detailed in the plan agreements.
We account for our pension plan following the requirements of ASC Topic 715, "Compensation-Retirement Benefits" ("ASC 715"). ASC 715 requires an employer to: (a) recognize in its statement of financial position the funded status of a benefit plan; (b) measure defined benefit plan assets and obligations as of the end of the employer's fiscal year (with limited exceptions); and (c) recognize as a component of other comprehensive income, net of tax, the gains or losses and prior service costs or credits that arise but are not recognized as components of net periodic benefit costs pursuant to prior existing guidance.
Impact of Inflation
Inflation has not had a significant long-term impact on our earnings. In the event of significant inflation, our efforts to recover cost increases would be hampered as a result of the competitive nature of the industries in which we operate.
Forward-Looking Information
From time to time, we may publish, verbally or in written form, forward-looking statements relating to such matters as anticipated financial performance, business prospects, technological developments, new products, acquisition or consolidation strategies, anticipated sources of capital, research and development activities and similar matters. In fact, this Form 10-K (or any other periodic reporting documents required by the Securities Exchange Act of 1934, as amended) may contain forward-looking statements reflecting our current views concerning potential or anticipated future events or developments, including our strategic goals for future fiscal periods. The Private Securities Litigation Reform Act of 1995 provides a "safe harbor" for forward-looking statements. We caution investors that any forward-looking statements made by us are not guarantees of future performance and that a variety of factors could cause our actual results and experience to differ materially from the anticipated results or other expectations expressed in our forward-looking statements. The risks and uncertainties which may affect the operations, performance, development and results of our business include, but are not limited to, the following: uncertainties relating to economic conditions; uncertainties relating to customer plans and commitments; the pricing and availability of equipment, materials and inventories; the impact of acquisitions on our business and results of operations; technological developments; performance issues with suppliers and subcontractors; our ability to renew existing credit facilities or to obtain new or additional financing as needed; economic growth; delays in testing of new products; rapid technology changes and the highly competitive environment in which we operate. These risks and uncertainties also include those risks outlined under Item 1A (Risk Factors) of this Annual Report on Form 10-K. Readers are cautioned not to place undue reliance on these forward-looking statements, which speak only as of the date the statement was made.
26
Table of Contents
ITEM 7A-QUANTITATIVE AND QUALITATIVE DISCLOSURES ABOUT MARKET RISK
We limit the amount of credit exposure to any one issuer. At August 31, 2011, other than our restricted investments (which are restricted for use in a non-qualified retirement savings plan for certain key employees and members of the Board of Directors), all of our funds were either in demand deposit accounts or investment instruments that meet high credit quality standards such as money market funds, government securities, or commercial paper.
Our domestic operations have limited currency exposure since substantially all transactions are denominated in U.S. dollars. However, our European operations are subject to currency exchange fluctuations. We continue to review our policies and procedures to reduce this exposure while maintaining the benefit from these operations and sales to other European customers. As of August 31, 2011, we had cash balances in the United Kingdom for our UK operations denominated primarily in pounds sterling and equal to $4,924,000 and cash balances in France for our HumiSeal Europe SARL division denominated primarily in euros and equal to $566,000. We will continue to review our current cash balances denominated in foreign currency in light of current tax guidelines and potential acquisitions.
We recognized a foreign currency translation gain for the year ended August 31, 2011 in the amount of $1,418,000 related to our European operations which is recorded in other comprehensive income (loss) within our Statement of Stockholders' Equity. We do not have or utilize any derivative financial instruments.
27
Table of Contents
ITEM 8-FINANCIAL STATEMENTS AND SUPPLEMENTARY DATA
The following Consolidated Financial Statements of Chase Corporation are filed as part of this Annual Report on Form 10-K:
Index to Consolidated Financial Statements:
| | Page No. | |||||
|---|---|---|---|---|---|---|
Report of Independent Registered Public Accounting Firm-PricewaterhouseCoopers LLP | ||||||