UNITED STATES SECURITIES AND EXCHANGE COMMISSION
Washington, D.C. 20549
FORM 10-K
| x | ANNUAL REPORT PURSUANT TO SECTION 13 OR 15(d) OF THE SECURITIES EXCHANGE ACT OF 1934 FOR THE FISCAL YEAR ENDED DECEMBER 31, 2014 |
OR
| ¨ | TRANSITION REPORT PURSUANT TO SECTION 13 OR 15(d) OF THE SECURITIES EXCHANGE ACT OF 1934 FOR THE TRANSITION PERIOD FROM ________ TO ________ |
Commission File No. 1-8661
The Chubb Corporation
(Exact name of registrant as specified in its charter)
| New Jersey | 13-2595722 | |
| (State or other jurisdiction of incorporation or organization) | (I.R.S. Employer Identification No.) | |
| 15 Mountain View Road | ||
| Warren, New Jersey | 07059 | |
| (Address of principal executive offices) | (Zip Code) |
(908) 903-2000
(Registrant's telephone number, including area code)
Securities registered pursuant to Section 12(b) of the Act:
| (Title of each class) | (Name of each exchange on which registered) | |
| Common Stock, par value $1 per share | New York Stock Exchange |
Securities registered pursuant to Section 12(g) of the Act:
None
(Title of class)
Indicate by check mark if the registrant is a well-known seasoned issuer, as defined in Rule 405 of the Securities Act. Yes [ ü ] No [ ]
Indicate by check mark if the registrant is not required to file reports pursuant to Section 13 or Section 15(d) of the Act. Yes [ ] No [ ü ]
Indicate by check mark whether the registrant (1) has filed all reports required to be filed by Section 13 or 15(d) of the Securities Exchange Act of 1934 during the preceding 12 months (or for such shorter period that the registrant was required to file such reports), and (2) has been subject to such filing requirements for the past 90 days. Yes [ ü ] No [ ]
Indicate by check mark whether the registrant has submitted electronically and posted on its corporate Website, if any, every Interactive Data File required to be submitted and posted pursuant to Rule 405 of Regulation S-T (§232.405 of this chapter) during the preceding 12 months (or for such shorter period that the registrant was required to submit and post such files). Yes [ ü ] No [ ]
Indicate by check mark if disclosure of delinquent filers pursuant to Item 405 of Regulation S-K (§229.405 of this chapter) is not contained herein, and will not be contained, to the best of the registrant's knowledge, in definitive proxy or information statements incorporated by reference in Part III of this Form 10-K or any amendment to this Form 10-K. [ ]
Indicate by check mark whether the registrant is a large accelerated filer, an accelerated filer, a non-accelerated filer, or a smaller reporting company. See the definitions of "large accelerated filer," "accelerated filer" and "smaller reporting company" in Rule 12b-2 of the Exchange Act.
| Large accelerated filer [ ü ] | Accelerated filer [ ] | |
| Non-accelerated filer [ ] | Smaller reporting company [ ] | |
| (Do not check if a smaller reporting company) |
Indicate by check mark whether the registrant is a shell company (as defined in Rule 12b-2 of the Act). Yes [ ] No [ ü ]
The aggregate market value of common stock held by non-affiliates of the registrant was $22,076,309,172 as of June 30, 2014, computed on the basis of the closing sale price of the common stock on that date.
230,856,872
Number of shares of common stock outstanding as of February 13, 2015
Documents Incorporated by Reference
Portions of the definitive Proxy Statement for the 2015 Annual Meeting of Shareholders are incorporated by reference in Part III of this Form 10-K.
CONTENTS
ITEM | DESCRIPTION | PAGE | ||||
PART I | 1 | Business | 3 | |||
1A | Risk Factors | 14 | ||||
1B | Unresolved Staff Comments | 25 | ||||
2 | Properties | 25 | ||||
3 | Legal Proceedings | 25 | ||||
PART II | 5 | Market for the Registrant's Common Equity, | 27 | |||
6 | Selected Financial Data | 29 | ||||
7 | Management's Discussion and Analysis of Financial Condition and Results of Operations | 30 | ||||
7A | Quantitative and Qualitative Disclosures About Market Risk | 73 | ||||
8 | Consolidated Financial Statements and Supplementary Data | 76 | ||||
9 | Changes in and Disagreements with Accountants | 76 | ||||
9A | Controls and Procedures | 76 | ||||
9B | Other Information | 77 | ||||
PART III | 10 | Directors, Executive Officers and Corporate Governance | 79 | |||
11 | Executive Compensation | 79 | ||||
12 | Security Ownership of Certain Beneficial Owners and Management and Related Stockholder Matters | 79 | ||||
13 | Certain Relationships and Related Transactions, and Director Independence | 79 | ||||
14 | Principal Accounting Fees and Services | 79 | ||||
PART IV | 15 | Exhibits, Financial Statements and Schedules | 79 | |||
Signatures | 80 | |||||
Index to Financial Statements and Financial Statement Schedules | F-1 | |||||
Exhibits Index | E-1 | |||||
EX-10.33 | ||
EX-12.1 | ||
EX-21.1 | ||
EX-23.1 | ||
EX-31.1 | ||
EX-31.2 | ||
EX-32.1 | ||
EX-32.2 | ||
EX-101 | Instance Document | |
EX-101 | Schema Document | |
EX-101 | Calculation Linkbase Document | |
EX-101 | Labels Linkbase Document | |
EX-101 | Presentation Linkbase Document | |
EX-101 | Definition Linkbase Document | |
2
PART I.
| Item 1. | Business |
General
The Chubb Corporation (Chubb) was incorporated as a business corporation under the laws of the State of New Jersey in June 1967. In this report, Chubb and its subsidiaries are referred to collectively as the Corporation. Chubb is a holding company for several, separately organized, property and casualty insurance companies referred to informally as the Chubb Group of Insurance Companies (the P&C Group). Since 1882, insurance companies or predecessor companies included in the P&C Group have provided property and casualty insurance to businesses and individuals around the world. According to A.M. Best, the U.S. companies of the P&C Group constitute the 12th largest U.S. property and casualty insurance group based on 2013 net premiums written.
At December 31, 2014, the Corporation had total assets of $51.3 billion and shareholders' equity of $16.3 billion. Revenues, income before income tax and assets for each operating segment for the three years ended December 31, 2014 are included in Note (13) of the Notes to Consolidated Financial Statements. The Corporation employed approximately 10,200 persons worldwide on December 31, 2014.
Chubb's principal executive offices are located at 15 Mountain View Road, Warren, New Jersey 07059, and the telephone number is (908) 903-2000.
The Corporation's website address is www.chubb.com. Chubb's annual report on Form 10-K, quarterly reports on Form 10-Q, current reports on Form 8-K and amendments to those reports, if any, filed or furnished pursuant to Section 13(a) of the Securities Exchange Act of 1934, as well as Chubb's other filings with the Securities and Exchange Commission (SEC), are available free of charge on the Corporation's website as soon as reasonably practicable after they have been electronically filed with or furnished to the SEC. Chubb's Corporate Governance Guidelines, charters of the independent committees of its Board of Directors (Board), Restated Certificate of Incorporation, By-Laws, Code of Business Conduct and Code of Ethics for CEO and Senior Financial Officers are also available on the Corporation's website or by writing to Chubb's Corporate Secretary at Chubb's principal executive offices noted above. The Corporation will post on its website any amendment or waiver of the Code of Ethics for CEO and Senior Financial Officers and any waiver of the Code of Business Conduct for Chubb's executive officers or directors within the time period required by the SEC. Except for the documents specifically incorporated by reference into this Form 10-K, information contained on the Corporation's website or that can be accessed through its website is not incorporated by reference into this Form 10-K.
Property and Casualty Insurance
The P&C Group consists of subsidiaries domiciled both inside and outside the United States. Federal Insurance Company (Federal) is the largest insurance subsidiary in the P&C Group and is the parent company of most of the Corporation's other insurance subsidiaries. Chubb & Son, a division of Federal (Chubb & Son), is the manager of several U.S. subsidiaries in the P&C Group. Chubb & Son also provides certain services to other insurance companies included in the P&C Group. Acting subject to the supervision and control of the respective boards of directors of the insurance companies included in the P&C Group, Chubb & Son provides day to day management and operating personnel. This arrangement offers the P&C Group operational efficiencies through economies of scale and flexibility.
The insurance companies included in the P&C Group that are based in the United States are:
Federal Insurance Company | Chubb Custom Insurance Company | |
Pacific Indemnity Company | Chubb National Insurance Company | |
Executive Risk Indemnity Inc. | Executive Risk Specialty Insurance Company | |
Great Northern Insurance Company | Chubb Lloyds Insurance Company of Texas | |
| Vigilant Insurance Company | Chubb Insurance Company of New Jersey | |
Chubb Indemnity Insurance Company | Texas Pacific Indemnity Company |
3
The principal insurance companies included in the P&C Group that are based outside the United States are:
Chubb Insurance Company of Europe SE | Chubb Insurance Company of Australia Ltd. | |
Chubb Insurance Company of Canada | Chubb Argentina de Seguros, S.A. | |
Chubb do Brasil Companhia de Seguros |
In addition to the subsidiaries listed above, the P&C Group has insurance subsidiaries based in locations outside the United States, including Mexico, Colombia and Chile. Federal has several branches based in locations outside the United States, including Korea, Singapore and Hong Kong.
Property and casualty insurance policies are separately issued by individual companies included within the P&C Group. The P&C Group operates through three business units: Chubb Personal Insurance, Chubb Commercial Insurance and Chubb Specialty Insurance. For the year ended December 31, 2014, Chubb Personal Insurance, Chubb Commercial Insurance and Chubb Specialty Insurance represented 36%, 43% and 21%, respectively, of the Corporation's total net premiums written.
Chubb Personal Insurance offers personal insurance products for homes and valuable articles (such as art and jewelry), primarily for high net worth individuals. Our homeowners business represents more than half of the total net premiums written of Chubb Personal Insurance. Chubb Personal Insurance also offers personal insurance products for fine automobiles and yachts as well as personal liability insurance (both primary and excess). In addition, it provides personal accident and limited supplemental health insurance to a wide range of customers including businesses.
The largest market for Chubb Personal Insurance products is the United States. The largest markets for our homeowners and automobile insurance products outside the United States are Canada, Europe and Brazil. The largest markets for our accident and health insurance products are the United States, Latin America (primarily Brazil) and Europe.
Chubb Commercial Insurance offers a broad range of commercial insurance products. Our underwriting strategy focuses on specific industry segments and niches. Much of our commercial customer base comprises mid-sized commercial entities. Our insurance offerings include multiple peril, primary liability, excess and umbrella liability, automobile, workers' compensation and property and marine. The largest market for Chubb Commercial Insurance products is the United States. The largest markets for our commercial products outside the United States are Europe, Canada and Australia.
Chubb Specialty Insurance offers a wide variety of specialized professional liability products for privately held and publicly traded companies, financial institutions, professional firms, healthcare and not-for-profit organizations. Chubb Specialty Insurance products primarily include directors and officers liability insurance, errors and omissions liability insurance, employment practices liability insurance, fiduciary liability insurance and commercial and financial fidelity insurance. The largest market for these products is the United States. Outside the United States, the largest markets for these products are Europe, Australia and Canada. Chubb Specialty Insurance also offers surety products, primarily in the United States and Latin America.
Premiums Written
A summary of the P&C Group's premiums written during the past three years is shown in the following table:
Year | Direct Premiums Written | Assumed Reinsurance Premiums (a) | Ceded Reinsurance Premiums (a) | Net Premiums Written | ||||||||||||
| (in millions) | ||||||||||||||||
2014 | $ | 12,976 | $ | 596 | $ | 980 | $ | 12,592 | ||||||||
2013 | 12,804 | 503 | 1,083 | 12,224 | ||||||||||||
2012 | 12,647 | 423 | 1,200 | 11,870 | ||||||||||||
| (a) | Intercompany items eliminated. |
4
The net premiums written during the last three years for major classes of the P&C Group's business are included in the Property and Casualty Insurance - Underwriting Operations section of Management's Discussion and Analysis of Financial Condition and Results of Operations (MD&A).
One or more members of the P&C Group are licensed and transact business in each of the 50 states of the United States, the District of Columbia, some of the territories of the United States, Canada, Europe, Australia, and parts of Latin America and Asia. In accordance with applicable licensing laws, members of the P&C Group are permitted to write business in jurisdictions beyond their state or country of domicile. In 2014, approximately 78% of the P&C Group's total direct premiums written were produced in the United States, where the P&C Group's businesses enjoy broad geographic distribution with a particularly strong market presence in the Northeast. The five states in the United States accounting for the largest amounts of the P&C Group's total direct premiums written in 2014 were New York with 13%, California with 9%, Texas with 6%, Florida with 5% and New Jersey with 4%. In 2014, approximately 22% of the P&C Group's total direct premiums written were produced outside of the United States. The P&C Group produced approximately 5%, 5%, 3% and 3% of its total direct premiums written in the United Kingdom, Canada, Australia and Brazil, respectively. The P&C Group also produced business outside the United States in additional locations, including other countries in Europe, Mexico, Colombia, Argentina, Korea, Singapore, Chile, Hong Kong, China, Malaysia and Japan. The location of where premiums are produced is generally defined as the location of the risk associated with the underlying policies. The method of determining location of risk varies by class of business. Location of risk for property classes is typically based on the physical location of the covered property, while location of risk for liability classes may be based on the main location of the insured, or in the case of the workers' compensation line, the primary work location of the covered employee. Revenues of the P&C Group by geographic zone for the three years ended December 31, 2014, 2013 and 2012 are included in Note (13) of the Notes to Consolidated Financial Statements.
Underwriting Results
A frequently used industry measurement of property and casualty insurance underwriting results is the combined loss and expense ratio. The P&C Group uses the combined loss and expense ratio calculated in accordance with U.S. statutory accounting principles applicable to property and casualty insurance companies. This ratio is the sum of the ratio of losses and loss expenses to premiums earned (loss ratio) and the ratio of statutory underwriting expenses to premiums written (expense ratio) after reducing both premium amounts by dividends to policyholders. When the combined ratio is under 100%, underwriting results are generally considered profitable; when the combined ratio is over 100%, underwriting results are generally considered unprofitable. Investment income is not reflected in the combined ratio. The profitability of property and casualty insurance companies depends on the results of both underwriting and investments operations.
The combined loss and expense ratios during the last three years in total and for the major classes of the P&C Group's business are included in the Property and Casualty Insurance - Underwriting Operations section of MD&A.
Another frequently used measurement in the property and casualty insurance industry is the ratio of statutory net premiums written to policyholders' surplus. At December 31, 2014 and 2013, the ratio for the P&C Group was 0.83 and 0.81, respectively.
Producing and Servicing of Business
In the United States, the P&C Group primarily offers products through independent insurance agencies and accepts business on a regular basis from insurance brokers. These include major international, national, regional and local agencies and brokers. In most instances, our agents and brokers also offer insurance products of other companies that compete with the P&C Group's insurance products. Certain of our products are also distributed through program managers and other wholesale agencies and brokers. Chubb & Son maintains administrative offices in Warren and Whitehouse Station, New Jersey, as well as local offices throughout the United States. These local offices assist in producing and servicing the P&C Group's business.
5
Certain business of the P&C Group in the United States is produced through participation in certain underwriting pools and syndicates. Such pools and syndicates provide underwriting capacity for risks which an individual insurer cannot prudently underwrite because of the magnitude of the risk assumed or which can be more effectively handled by one organization due to the need for specialized loss control and other services.
Outside the United States, the P&C Group primarily offers products through international, national, regional and local insurance brokers. Local offices of the P&C Group assist the brokers in producing and servicing the business. Certain products (in particular, personal automobile and accident and health products) also are distributed through program managers, business centers, alliances with financial institutions and other businesses, automobile dealers, affinity groups and direct marketing operations. In addition, the Corporation has a Lloyds syndicate, Chubb Syndicate 1882, to enhance the P&C Group's product distribution and ability to offer certain products.
In addition to insurance products issued directly to insureds, the P&C Group, to a far lesser extent, assumes reinsurance from other insurance carriers for some lines of business both inside and outside the United States. The P&C Group assumes reinsurance on a risk-by-risk, or facultative, basis and on a treaty basis where an agreed-upon portion of business is automatically reinsured.
Ceded Reinsurance
In accordance with the standard practice of the insurance industry, the P&C Group purchases reinsurance from reinsurers. The P&C Group cedes reinsurance to provide greater diversification of risk and to limit the P&C Group's maximum net loss arising from large risks or from catastrophic events.
A large portion of the P&C Group's ceded reinsurance is effected under contracts known as treaties under which all risks meeting prescribed criteria are automatically covered. Most of the P&C Group's treaty reinsurance arrangements consist of excess of loss and catastrophe contracts that protect against a specified part or all of certain types of losses over stipulated amounts arising from any one occurrence or event. In certain circumstances, reinsurance is also effected by negotiation on individual risks, referred to as facultative reinsurance. The amount of each risk retained by the P&C Group is subject to maximum limits that vary by line of business and type of coverage. Retention limits are regularly reviewed and are revised periodically as the P&C Group's capacity to underwrite risks changes. For a discussion of the P&C Group's reinsurance program and the cost and availability of reinsurance, see the Property and Casualty Insurance - Underwriting Results section of MD&A.
Ceded reinsurance contracts do not relieve the P&C Group of the primary obligation to its policyholders. Consequently, an exposure exists with respect to reinsurance recoverable to the extent that any reinsurer is unable to meet its obligations or disputes the liabilities assumed under the reinsurance contracts. The collectibility of reinsurance is subject to the solvency of the reinsurers, coverage interpretations and other factors. The P&C Group is selective in regard to its reinsurers, placing reinsurance with only those reinsurers that the P&C Group believes have strong balance sheets and superior underwriting ability. The P&C Group monitors the financial strength of its reinsurers and its concentration of risk with reinsurers on an ongoing basis.
Unpaid Losses and Loss Adjustment Expenses and Related Amounts Recoverable from Reinsurers
Insurance companies are required to establish a liability in their accounts for the ultimate costs (including loss adjustment expenses) of claims that have been reported but not settled and of claims that have been incurred but not reported. Insurance companies are also required to report as assets the portion of such liability that will be recovered from reinsurers.
The process of establishing the liability for unpaid losses and loss adjustment expenses is complex and imprecise as it must take into consideration many variables that are subject to the outcome of future events. As a result, informed subjective estimates and judgments as to our ultimate exposure to losses are an integral component of our loss reserving process.
6
The anticipated effect of inflation is implicitly considered when estimating liabilities for unpaid losses and loss adjustment expenses. Estimates of the ultimate value of all unpaid losses are based in part on the development of paid losses, which reflect actual inflation. Inflation is also reflected in the case estimates established on reported open claims which, when combined with paid losses, form another basis to derive estimates of reserves for all unpaid losses. There is no precise method for subsequently evaluating the adequacy of the consideration given to inflation, since claim settlements are affected by many factors.
Additional information related to the P&C Group's estimates related to unpaid losses and loss adjustment expenses and the uncertainties in the estimation process is presented in the Property and Casualty Insurance - Loss Reserves section of MD&A.
The table on page 8 presents the subsequent development of the estimated year-end liability for unpaid losses and loss adjustment expenses, net of reinsurance recoverable, for the ten years prior to 2014.
The top line of the table shows the estimated net liability for unpaid losses and loss adjustment expenses recorded at the balance sheet date for each of the indicated years. This liability represents the estimated amount of losses and loss adjustment expenses for claims arising in all years prior to the balance sheet date that were unpaid at the balance sheet date, including losses that had been incurred but not yet reported to the P&C Group.
The upper section of the table shows the reestimated amount of the previously recorded net liability based on experience as of the end of each succeeding year. The estimate is increased or decreased as more information becomes known about the frequency and severity of losses for each individual year. The increase or decrease is reflected in operating results of the period in which the estimate is changed. The "cumulative net deficiency (redundancy)" as shown in the table represents the aggregate change in the reserve estimates from the original balance sheet dates through December 31, 2014. The amounts noted are cumulative in nature; that is, an increase in a loss estimate that is related to a prior period occurrence generates a deficiency in each intermediate year. For example, a deficiency recognized in 2014 relating to losses incurred prior to December 31, 2004 would be included in the cumulative deficiency (redundancy) amount for each year in the period 2004 through 2013. Yet, the deficiency would be reflected in operating results only in 2014. The effect of changes in estimates of the liabilities for losses occurring in prior years on income before income taxes in each of the past three years is shown in the reconciliation of the beginning and ending liability for unpaid losses and loss adjustment expenses in the Property and Casualty Insurance - Loss Reserves section of MD&A.
The cumulative overall development for the estimated net liability at each year end from 2004 through 2013 was substantially favorable through December 31, 2014. This favorable development was primarily driven by the professional liability classes other than fidelity and the commercial and personal liability classes. These classes require long periods of time for relevant allegations, facts and circumstances to be established and for liabilities to be resolved. In general, the severity of such long-tail liability claims was lower than expected and loss trends were more modest than expected, partly due to external factors and partly due to the effects of underwriting changes. To a lesser extent, the commercial and personal property classes also contributed to the cumulative overall favorable development due to lower than expected emergence of losses. The cumulative overall favorable development was partially offset by continued adverse development related to asbestos and toxic waste liabilities, which were more costly than expected over this period. The emergence of asbestos and toxic waste claims has generally continued to decline but at a slower pace than was expected and in some instances at higher severities than expected, as some claims have presented more significant defense and/or indemnification exposure than was previously anticipated.
Conditions and trends that have affected development of the liability for unpaid losses and loss adjustment expenses in the past will not necessarily recur in the future. Accordingly, it is not appropriate to extrapolate future redundancies or deficiencies based on the data in this table.
7
ANALYSIS OF LOSS AND LOSS ADJUSTMENT EXPENSE DEVELOPMENT
December 31 | ||||||||||||||||||||||||||||||||||||||||||||
Year Ended | 2004 | 2005 | 2006 | 2007 | 2008 | 2009 | 2010 | 2011 | 2012 | 2013 | 2014 | |||||||||||||||||||||||||||||||||
| (in millions) | ||||||||||||||||||||||||||||||||||||||||||||
Net Liability for Unpaid Losses and Loss Adjustment Expenses | $ | 16,809 | $ | 18,713 | $ | 19,699 | $ | 20,316 | $ | 20,155 | $ | 20,786 | $ | 20,901 | $ | 21,329 | $ | 22,022 | $ | 21,344 | $ | 21,039 | ||||||||||||||||||||||
Net Liability Reestimated as of: | ||||||||||||||||||||||||||||||||||||||||||||
One year later | 16,972 | 18,417 | 19,002 | 19,443 | 19,393 | 20,040 | 20,134 | 20,715 | 21,310 | 20,708 | ||||||||||||||||||||||||||||||||||
Two years later | 17,048 | 17,861 | 18,215 | 18,619 | 18,685 | 19,229 | 19,494 | 20,141 | 20,717 | |||||||||||||||||||||||||||||||||||
Three years later | 16,725 | 17,298 | 17,571 | 18,049 | 17,965 | 18,638 | 18,953 | 19,602 | ||||||||||||||||||||||||||||||||||||
Four years later | 16,526 | 16,884 | 17,184 | 17,510 | 17,463 | 18,180 | 18,496 | |||||||||||||||||||||||||||||||||||||
Five years later | 16,411 | 16,636 | 16,829 | 17,139 | 17,116 | 17,866 | ||||||||||||||||||||||||||||||||||||||
Six years later | 16,310 | 16,459 | 16,605 | 16,893 | 16,907 | |||||||||||||||||||||||||||||||||||||||
Seven years later | 16,231 | 16,350 | 16,501 | 16,788 | ||||||||||||||||||||||||||||||||||||||||
Eight years later | 16,178 | 16,298 | 16,464 | |||||||||||||||||||||||||||||||||||||||||
Nine years later | 16,183 | 16,303 | ||||||||||||||||||||||||||||||||||||||||||
Ten years later | 16,227 | |||||||||||||||||||||||||||||||||||||||||||
Total Cumulative Net Deficiency (Redundancy) | (582 | ) | (2,410 | ) | (3,235 | ) | (3,528 | ) | (3,248 | ) | (2,920 | ) | (2,405 | ) | (1,727 | ) | (1,305 | ) | (636 | ) | ||||||||||||||||||||||||
Cumulative Net Deficiency Related to Asbestos and Toxic Waste Claims (Included in Above Total) | 744 | 709 | 685 | 597 | 512 | 422 | 361 | 289 | 206 | 100 | ||||||||||||||||||||||||||||||||||
Cumulative Amount of Net Liability Paid as of: | ||||||||||||||||||||||||||||||||||||||||||||
One year later | 3,932 | 4,118 | 4,066 | 4,108 | 4,063 | 4,074 | 4,300 | 4,493 | 4,952 | 4,534 | ||||||||||||||||||||||||||||||||||
Two years later | 6,616 | 6,896 | 6,789 | 6,565 | 6,711 | 6,831 | 7,011 | 7,416 | 7,915 | |||||||||||||||||||||||||||||||||||
Three years later | 8,612 | 8,850 | 8,554 | 8,436 | 8,605 | 8,696 | 8,992 | 9,487 | ||||||||||||||||||||||||||||||||||||
Four years later | 10,048 | 10,089 | 9,884 | 9,734 | 9,840 | 10,104 | 10,415 | |||||||||||||||||||||||||||||||||||||
Five years later | 10,977 | 10,994 | 10,821 | 10,588 | 10,836 | 11,147 | ||||||||||||||||||||||||||||||||||||||
Six years later | 11,606 | 11,697 | 11,426 | 11,316 | 11,583 | |||||||||||||||||||||||||||||||||||||||
Seven years later | 12,149 | 12,163 | 12,017 | 11,895 | ||||||||||||||||||||||||||||||||||||||||
Eight years later | 12,519 | 12,594 | 12,465 | |||||||||||||||||||||||||||||||||||||||||
Nine years later | 12,862 | 12,988 | ||||||||||||||||||||||||||||||||||||||||||
Ten years later | 13,208 | |||||||||||||||||||||||||||||||||||||||||||
Gross Liability, End of Year | $ | 20,292 | $ | 22,482 | $ | 22,293 | $ | 22,623 | $ | 22,367 | $ | 22,839 | $ | 22,718 | $ | 23,068 | $ | 23,963 | $ | 23,146 | $ | 22,678 | ||||||||||||||||||||||
Reinsurance Recoverable, End of Year | 3,483 | 3,769 | 2,594 | 2,307 | 2,212 | 2,053 | 1,817 | 1,739 | 1,941 | 1,802 | 1,639 | |||||||||||||||||||||||||||||||||
|
|
|
|
|
|
|
|
|
|
|
|
|
|
|
|
|
|
|
|
|
| |||||||||||||||||||||||
Net Liability, End of Year | $ | 16,809 | $ | 18,713 | $ | 19,699 | $ | 20,316 | $ | 20,155 | $ | 20,786 | $ | 20,901 | $ | 21,329 | $ | 22,022 | $ | 21,344 | $ | 21,039 | ||||||||||||||||||||||
|
|
|
|
|
|
|
|
|
|
|
|
|
|
|
|
|
|
|
|
|
| |||||||||||||||||||||||
Reestimated Gross Liability | $ | 19,691 | $ | 19,822 | $ | 18,920 | $ | 18,921 | $ | 18,982 | $ | 19,794 | $ | 20,196 | $ | 21,238 | $ | 22,641 | $ | 22,468 | ||||||||||||||||||||||||
Reestimated Reinsurance | 3,464 | 3,519 | 2,456 | 2,133 | 2,075 | 1,928 | 1,700 | 1,636 | 1,924 | 1,760 | ||||||||||||||||||||||||||||||||||
|
|
|
|
|
|
|
|
|
|
|
|
|
|
|
|
|
|
|
| |||||||||||||||||||||||||
Reestimated Net Liability | $ | 16,227 | $ | 16,303 | $ | 16,464 | $ | 16,788 | $ | 16,907 | $ | 17,866 | $ | 18,496 | $ | 19,602 | $ | 20,717 | $ | 20,708 | ||||||||||||||||||||||||
|
|
|
|
|
|
|
|
|
|
|
|
|
|
|
|
|
|
|
| |||||||||||||||||||||||||
Cumulative Gross Deficiency (Redundancy) | $ | (601 | ) | $ | (2,660 | ) | $ | (3,373 | ) | $ | (3,702 | ) | $ | (3,385 | ) | $ | (3,045 | ) | $ | (2,522 | ) | $ | (1,830 | ) | $ | (1,322 | ) | $ | (678 | ) | ||||||||||||||
|
|
|
|
|
|
|
|
|
|
|
|
|
|
|
|
|
|
|
| |||||||||||||||||||||||||
8
The middle section of the table on page 8 shows the cumulative amount paid with respect to the reestimated net liability as of the end of each succeeding year. For example, in the 2004 column, as of December 31, 2014 the P&C Group had paid $13,208 million of the currently estimated $16,227 million of net losses and loss adjustment expenses that were unpaid at the end of 2004; thus, an estimated $3,019 million of net losses incurred on or before December 31, 2004 remain unpaid as of December 31, 2014, approximately 28% of which relates to asbestos and toxic waste claims.
The lower section of the table on page 8 shows the gross liability, reinsurance recoverable and net liability recorded at the balance sheet date for each of the indicated years and the reestimation of these amounts as of December 31, 2014.
The liability for unpaid losses and loss adjustment expenses, net of reinsurance recoverable, reported in the accompanying consolidated financial statements prepared in accordance with generally accepted accounting principles (GAAP) comprises the liabilities of the member companies, both inside and outside the United States, of the P&C Group as follows:
| December 31 | ||||||||
| 2014 | 2013 | |||||||
(in millions) | ||||||||
U.S. subsidiaries | $ | 17,302 | $ | 17,295 | ||||
Outside U.S. subsidiaries | 3,737 | 4,049 | ||||||
|
|
|
| |||||
| $ | 21,039 | $ | 21,344 | |||||
|
|
|
| |||||
Members of the P&C Group are required to file annual statements with insurance regulatory authorities prepared on an accounting basis prescribed or permitted by such authorities (statutory basis). The difference between the liability for unpaid losses and loss expenses, net of reinsurance recoverable, reported in the statutory basis financial statements of the U.S. members of the P&C Group and such liability reported on a GAAP basis in the consolidated financial statements is not significant.
Investments
Investment decisions are centrally managed by the Corporation's investment professionals based on guidelines established by management and approved by the respective boards of directors for each company in the P&C Group. The P&C Group's investment portfolio primarily comprises high quality bonds, principally tax exempt securities, corporate bonds, U.S. Treasury securities and mortgage-backed securities, as well as foreign government and corporate bonds that support operations outside the United States. The portfolio also includes equity securities, primarily publicly traded common stocks, and other invested assets, primarily private equity limited partnerships, all of which are held with the primary objective of capital appreciation.
Additional information about the Corporation's investment portfolio as well as its approach to managing risks is presented in the Invested Assets section of MD&A, the Investment Portfolio section of Quantitative and Qualitative Disclosures About Market Risk and Note (2) of the Notes to Consolidated Financial Statements.
The investment results of the P&C Group for each of the past three years are shown in the following table:
| Average Invested Assets(a) | Investment Income(b) | Percent Earned | ||||||||||||||
Year | Before Tax | After Tax | ||||||||||||||
| (in millions) | ||||||||||||||||
2014 | $ | 39,869 | $ | 1,329 | 3.33 | % | 2.73 | % | ||||||||
2013 | 39,565 | 1,391 | 3.52 | 2.88 | ||||||||||||
2012 | 38,598 | 1,482 | 3.84 | 3.12 | ||||||||||||
| (a) | Average of amounts with fixed maturity securities at amortized cost, equity securities at fair value and other invested assets, which include private equity limited partnerships carried at the P&C Group's equity in the net assets of the partnerships. |
| (b) | Investment income after deduction of investment expenses, but before applicable income tax. |
9
Competition
The property and casualty insurance industry is highly competitive both as to price and service with numerous property and casualty insurance companies operating in the United States and in most of the jurisdictions outside the United States in which the P&C Group writes business. These other insurers may operate independently or in groups. We do not believe that any single company or group is dominant across all lines of business or jurisdictions.
Members of the P&C Group compete not only with other stock companies but also with mutual companies, other underwriting organizations and alternative risk sharing mechanisms. Some competitors produce their business at a lower cost through the use of salaried personnel rather than independent agents and brokers. Rates are not uniform among insurers and vary according to the types of insurers, product coverage and methods of operation. The P&C Group competes for business not only on the basis of price, but also on the basis of financial strength, availability of coverage desired by customers and quality of service, including claim adjustment service. The P&C Group works closely with its distribution network of agents and brokers, as well as customers, to reinforce with them the stability, expertise and added value the P&C Group provides. The relatively large size and underwriting capacity of the P&C Group provide it opportunities not available to smaller companies.
The P&C Group's products and services are generally designed to serve specific customer groups or needs and to offer a degree of customization that is of value to the insured. The P&C Group's presence in many countries around the globe enables it to deliver products that satisfy the property and casualty insurance needs of both local and multinational customers.
Regulation and Premium Rates
Regulation in the United States
In the United States, Chubb and the companies within the P&C Group are subject to regulation by certain states as members of an insurance holding company system. All states have enacted legislation that regulates insurance holding company systems such as the Corporation. This legislation generally provides that each insurance company in the system is required to register with the department of insurance (or its equivalent) of its state of domicile and furnish information concerning the operations of companies within the holding company system that may materially affect the operations, management or financial condition of the insurers within the system. Notice to the insurance commissioners is required prior to the consummation of transactions affecting the ownership or control of an insurer and of certain material transactions between an insurer and any person in its holding company system and, in addition, certain of such transactions cannot be consummated without the commissioners' prior approval.
Companies within the P&C Group are subject to regulation and supervision in the respective states in which they do business. In general, such regulation is designed to protect the interests of policyholders, and not necessarily the interests of insurers, their shareholders and other stakeholders. The extent of such regulation varies but generally has its source in statutes that delegate regulatory, supervisory and administrative powers to a department of insurance (or its equivalent). Federal is incorporated as an Indiana stock insurance company. As such, the State of Indiana's Department of Insurance is the P&C Group's primary regulator.
State insurance departments impose regulations that, among other things, establish the standards of solvency that must be met and maintained. The National Association of Insurance Commissioners (NAIC) has a risk-based capital requirement for property and casualty insurance companies. The risk-based capital formula is used by all state regulatory authorities to identify insurance companies that may be undercapitalized and that merit further regulatory attention. The formula prescribes a series of risk measurements to determine a minimum capital amount for an insurance company, based on the profile of the individual company. The ratio of a company's actual policyholders' surplus to its minimum capital requirement will determine whether any state regulatory action is required. At December 31, 2014, the policyholders' surplus of each of the U.S. companies in the P&C Group exceeded the applicable
10
risk-based capital requirement. The NAIC periodically reviews the risk-based capital formula and is considering changes to the formula. The NAIC has undertaken a Solvency Modernization Initiative focused on updating the U.S. insurance solvency regulation framework, including capital requirements, governance and risk management, group supervision, accounting and financial reporting and reinsurance. Among the changes adopted by the NAIC and enacted into law by some states, including Indiana, is implementation of an Own Risk and Solvency Assessment (ORSA) rule that requires insurers to measure and share with solvency regulators a summary of their internal assessment of capital needs for the entire holding company group, including non-insurance subsidiaries. The P&C group will be required to provide a summary of its ORSA to the state of Indiana's Department of Insurance by the end of 2015. Both the ORSA requirements and other Solvency Modernization Initiative efforts place a significant focus on the adequacy and quality of insurance company enterprise risk management.
State insurance departments administer aspects of insurance regulation and supervision that affect the P&C Group's operations including: the licensing of insurers and their agents; restrictions on insurance policy terminations; unfair trade practices; the nature of and limitations on investments; premium rates; restrictions on the size of risks that may be insured under a single policy; deposits of securities for the benefit of policyholders; approval of policy forms; periodic examinations of the affairs of insurance companies; annual and other reports required to be filed on the financial condition of companies or for other purposes; limitations on dividends to policyholders and shareholders; and the adequacy of provisions for unearned premiums, unpaid losses and loss adjustment expenses, both reported and unreported, and other liabilities.
Regulatory requirements applying to premium rates vary from state to state, but generally provide that rates cannot be excessive, inadequate or unfairly discriminatory. In many states, these regulatory requirements can impact the P&C Group's ability to change rates, particularly with respect to personal lines products such as automobile and homeowners insurance, without prior regulatory approval. For example, in certain states there are measures that limit the use of catastrophe models or credit scoring in ratemaking and, at times, some states have adopted premium rate freezes or rate rollbacks. State limitations on the ability to cancel or non-renew certain policies also can affect the P&C Group's ability to charge adequate rates.
Subject to legislative and regulatory requirements, the P&C Group's management determines the prices charged for its policies based on a variety of factors including loss and loss adjustment expense experience, inflation, anticipated changes in the legal environment, both judicial and legislative, and tax law and rate changes. Methods for arriving at prices vary by type of business, exposure assumed and size of risk. Underwriting profitability is affected by the accuracy of these assumptions, by the willingness of insurance regulators to approve changes in those rates that they control and by certain other matters, such as underwriting selectivity and expense control.
In all states, insurers authorized to transact certain classes of property and casualty insurance are required to become members of an insolvency fund. In the event of the insolvency of a licensed insurer writing a class of insurance covered by the fund in the state, companies in the P&C Group, together with the other fund members, are assessed in order to provide the funds necessary to pay certain claims against the insolvent insurer. Generally, fund assessments are proportionately based on the members' premiums written for the classes of insurance written by the insolvent insurer. In certain states, the P&C Group can recover a portion of these assessments through premium tax offsets or policyholder surcharges. In 2014, assessments of the members of the P&C Group were insignificant. The amount of future assessments cannot be reasonably estimated and can vary significantly from year to year.
Insurance regulation in certain states requires the companies in the P&C Group, together with other insurers operating in the state, to participate in assigned risk plans, reinsurance facilities and joint underwriting associations, which are mechanisms that generally provide applicants with various basic insurance coverages when they are not available in voluntary markets. Such mechanisms are most prevalent for automobile and workers' compensation insurance, but a majority of states also mandate that insurers, such as the P&C Group, participate in Fair Plans or Windstorm Plans, which offer basic property coverages to insureds where not otherwise available. Some states also require insurers to
11
participate in facilities that provide homeowners, crime and other classes of insurance when periodic market constrictions may occur. Participation is based upon the amount of a company's voluntary premiums written in a particular state for the classes of insurance involved. These involuntary market plans generally are underpriced and produce unprofitable underwriting results.
In several states, insurers, including members of the P&C Group, participate in market assistance plans. Typically, a market assistance plan is voluntary, of limited duration and operates under the supervision of the insurance commissioner to provide assistance to applicants unable to obtain commercial and personal liability and property insurance. The assistance may range from identifying sources where coverage may be obtained to pooling of risks among the participating insurers. A few states require insurers, including members of the P&C Group, to purchase reinsurance from a mandatory reinsurance fund.
Although the federal government and its regulatory authorities generally do not directly regulate the business of insurance, federal initiatives often have an impact on the business in a variety of ways. Under the Dodd-Frank Wall Street Reform and Consumer Protection Act, two federal government bodies, the Federal Insurance Office (FIO) and the Financial Stability Oversight Council (FSOC), were created, which may impact the regulation of insurance. Although the FIO is prohibited from directly regulating the business of insurance, it has authority to represent the United States in international insurance matters and has limited powers to preempt certain types of state insurance laws. The FIO also can recommend to the FSOC that it designate an insurer a systemically important financial institution posing risks to U.S. financial stability in the event of the insurer's material financial distress or failure. An insurer so designated by FSOC could be subject to Federal Reserve supervision and heightened prudential standards. The P&C Group has not been so designated. Other current and proposed federal measures that may significantly affect the P&C Group's business and the market as a whole include those concerning terrorism insurance, tort law, natural catastrophes, corporate governance, ergonomics, health care reform including the containment of medical costs, privacy, cyber security practices, e-commerce, international trade, federal regulation of insurance companies and the taxation of insurance companies.
Companies in the P&C Group are also affected by a variety of other federal and state legislative and regulatory measures as well as by decisions of courts that define and extend the risks and benefits for which insurance is provided. These include: redefinitions of risk exposure in areas such as water damage, including mold, flood and storm surge; products liability and commercial general liability; credit scoring; application of a fair housing disparate impact discrimination standard to insurance; and extension and protection of employee benefits, including workers' compensation and disability benefits.
Regulation outside the United States
Outside the United States, the approach to insurance regulation varies significantly among the countries in which the P&C Group operates, and regulatory and political developments in international markets could impact the P&C Group's business. Some countries, such as Australia, Canada and the United Kingdom, generally do not regulate premium rates or require approval of policy forms, while others, such as Brazil, impose extensive premium rate and policy form requirements on insurers. Virtually all countries, however, impose some form of licensing, solvency, auditing and financial reporting requirements. Overall, there appears to be a general movement towards greater regulatory oversight of insurance carriers, particularly with respect to capital adequacy and solvency requirements. In some jurisdictions, foreign insurers are subject to greater restrictions than domestic companies, including requirements related to records, limitations on reinsurance ceded to affiliated insurers/reinsurers and local retention of funds.
Regulators in many countries are working with the International Association of Insurance Supervisors (IAIS) to develop global insurance company solvency standards and a framework for group supervision of companies in a holding company system, including non-insurance companies. These IAIS initiatives include a set of Insurance Core Principles (ICPs) for a globally-accepted framework for insurance sector regulation and supervision, a Common Framework for the Supervision of
12
Internationally Active Insurance Groups (ComFrame) and a global insurance capital standard (ICS). The IAIS has adopted a process and has recommended insurers for designation by the Financial Stability Board (FSB) as Global Systemically Important Insurers (G-SIIs), as well as policy measures that could be applied to any insurer designated as a G-SII. These policy measures may include heightened supervision and prudential standards. The P&C Group has not been designated as a G-SII.
In addition to these IAIS initiatives, the European Union Solvency II directive is being implemented to harmonize insurance regulation across the European Union member states. The Solvency II directive will require regulated companies, such as the P&C Group's European operations, to meet new requirements in relation to risk and capital management. The European operations of a U.S. parent company could be subject to greater capital and regulatory requirements if the U.S. state-based regulatory system is not deemed "equivalent" to its European counterpart pursuant to Solvency II. Discussions between U.S. representatives and the European Union are ongoing regarding equivalency and/or a mutual recognition for the U.S. system under Solvency II. The Solvency II directive is currently scheduled to take effect January 1, 2016. Interim measures, however, came into force on January 1, 2014, which require some of the requirements to be met ahead of the January 1, 2016 implementation date, notably the production of an own risk and solvency assessment and regulatory reporting. Some regulators outside of the European Union have imposed or are considering imposing requirements similar to those set forth in the Solvency II directive.
Regulatory Coordination
State regulators in the United States and regulatory authorities outside the United States are increasingly coordinating the regulation of multinational insurers by conducting supervisory colleges. A supervisory college is a forum for key regulators of an insurance group to share information and promote the coordination of supervision of the group. It is intended to facilitate supervision of the group at the group-wide level, as well as to enhance supervision of each of the entities included in the group. Regulators of the P&C Group conducted a supervisory college for the P&C Group in 2013 and 2014.
Real Estate
The Corporation's wholly owned subsidiary, Bellemead Development Corporation, and its subsidiaries were involved in commercial development activities primarily in New Jersey and residential development activities primarily in central Florida. The real estate operations are in runoff.
Chubb Financial Solutions
Chubb Financial Solutions (CFS) provided customized financial products, primarily derivative financial instruments, to corporate clients. CFS has been in runoff since 2003. Since that date, CFS has terminated early or run off nearly all of its contractual obligations within its financial products portfolio. Additional information related to CFS's contractual obligations is included in Note (12) of the Notes to Consolidated Financial Statements.
Enterprise Risk Management
The Corporation considers risk management an integral part of managing its business. The Corporation manages enterprise-wide risk through its Enterprise Risk Management (ERM) framework, which is the totality of the systems, structures, controls, processes and people within the Corporation that identify, assess, quantify, mitigate and monitor all internal and external sources of risk that are reasonably expected to have a material impact on the Corporation's operations, financial condition or reputation. The ERM framework includes a formal ERM policy statement that sets forth the Corporation's approach to risk management and applies to the Corporation's global operations.
Chubb's Board is responsible for the oversight of the ERM framework and, directly or through one or more of its committees, for reviewing significant enterprise-wide risks and supporting management in the maintenance, monitoring and enhancement of the Corporation's risk management process.
13
Managing and evaluating the effectiveness of the ERM framework, as well as reviewing and setting the Corporation's risk appetite, is the responsibility of the management executive committee (Executive Committee), which comprises the Corporation's most senior executives, including Chubb's chief executive officer and chief financial officer. Reporting to the Executive Committee is the ERM Group, which supports and leads the Corporation's overall ERM efforts. The ERM Group oversees the ERM process and the ongoing assessment of risks and risk mitigation, and comprises the Corporation's chief risk officer, general counsel and corporate controller. The ERM Group is supported by various committees throughout the Corporation in managing and assessing risk, including committees relating to credit, information technology, business continuity, legal compliance and ethics, and emerging risks.
The chief risk officer, who is independent from the Corporation's operations, has the responsibility for recommending the Corporation's risk appetite and risk tolerance limitations, and, individually or with other ERM Group members, updating the Executive Committee and the Board or a designated Board committee, as applicable, on existing and potential material risks the Corporation is facing and the prioritization of such risks. Additionally, key risk owners of the Corporation's most significant risks report to the Board, or appropriate Board committee, at least annually, assessments of inherent risk, mitigation controls and residual risk, and assessments of actual and estimated exposure amounts for relevant risks.
To assist in the management of risk on a global basis, under the guidance of the chief risk officer and the ERM Group, the Corporation applies, among other things, modeling and other quantification techniques to analyze estimated probable maximum exposure, including with respect to catastrophe, underwriting, credit and asset risk, and employs a global risk and compliance reporting process designed to allow for a uniform approach to enterprise risk management and compliance and standardizes procedures for documenting, identifying, assessing, reporting and mitigating risks.
| Item 1A. | Risk Factors |
The Corporation's business is subject to a number of risks and uncertainties, including those described below, that could have a material adverse effect on the Corporation's results of operations, profitability, financial condition, liquidity or cash flows and that could cause our operating results to vary significantly from period to period. Additional risks and uncertainties not currently known to us or that we currently deem to be immaterial also could have a material adverse effect on our results of operations, profitability, financial condition, liquidity or cashflows. References to "we," "us" and "our" appearing in this Form 10-K should be read as referring to the Corporation.
If our property and casualty loss reserves are insufficient, it could have a material adverse effect on our results.
The process of establishing loss reserves is complex and imprecise because it must take into consideration many variables that are subject to the outcome of future events. As a result, informed subjective estimates and judgments as to our ultimate exposure to losses are an integral component of our loss reserving process. Variations between our loss reserve estimates and the actual emergence of losses could be material and could have a material adverse effect on our results of operations or financial condition.
A further discussion of the risks and uncertainties related to the estimation of our property and casualty loss reserves is presented in the Property and Casualty Insurance - Loss Reserves section of MD&A.
Cyclicality of the property and casualty insurance industry may cause fluctuations in our results.
The property and casualty insurance business historically has been cyclical, experiencing periods characterized by intense price competition, relatively low premium rates and less restrictive underwriting standards followed by periods of relatively low levels of competition, high premium rates and more selective underwriting standards. We expect this cyclicality to continue. The periods of
14
intense price competition, relatively low premium rates and less restrictive underwriting standards in the cycle could adversely affect our financial condition, results of operations or cash flows.
A number of other factors, including many that may be volatile and unpredictable, also can have a significant impact on cyclical trends in the property and casualty insurance industry and the industry's profitability. These factors include:
| • | a trend of courts granting increasingly larger awards for certain damages; |
| • | catastrophic hurricanes, windstorms, earthquakes and other natural disasters, as well as the occurrence of man-made disasters (e.g., a terrorist attack); |
| • | availability, price and terms of reinsurance; |
| • | fluctuations in interest rates; |
| • | changes in the investment environment that affect market prices of and income and returns on investments; and |
| • | inflationary pressures that may tend to affect the size of losses experienced by insurance companies. |
We cannot predict whether or when market conditions will improve, remain constant or deteriorate. Negative market conditions may impair our ability to write insurance at rates that we consider appropriate relative to the risk assumed. If we cannot write insurance at appropriate rates, our results of operations would be materially and adversely affected.
The effects of emerging claim and coverage issues on our business are uncertain.
As industry practices and legal, judicial, social, environmental and other conditions change, unexpected or unintended issues related to claims and coverage may emerge. These issues may adversely affect our business by either extending coverage beyond our underwriting intent or by increasing the number or size of claims. In some instances, these issues may not become apparent for some time after we have written the insurance policies that are affected by such issues. As a result, the full extent of liability under our insurance policies may not be known for many years after the policies are issued. Emerging claim and coverage issues therefore could have a material adverse effect on our results of operations or financial condition.
Catastrophe losses could have a material adverse effect on our business.
As a property and casualty insurance holding company, our insurance operations expose us to claims arising out of catastrophes. Catastrophes can be caused by various natural perils, including hurricanes and other windstorms, earthquakes, tsunamis, tidal waves, severe winter weather and brush fires. Catastrophes can also be man-made, such as a terrorist attack. The frequency and severity of catastrophes are inherently unpredictable. It is possible that both the frequency and severity of natural and man-made catastrophic events will increase.
The extent of losses from a catastrophe is a function of both the total amount of exposure under our insurance policies in the area affected by the event and the severity of the event. Most catastrophes are restricted to relatively small geographic areas. Hurricanes and earthquakes, however, may produce significant damage over larger areas, especially those that are heavily populated.
We are exposed to natural and man-made catastrophe risks in both our U.S. and international operations. Catastrophe risks include hurricanes and cyclones along the coastlines of North America, the Caribbean region, Latin America, Asia and Australia. Catastrophe risks also include winter storms, northeasters, thunderstorms, hail storms, tornadoes, flooding and other water damage, earthquakes, other seismic or volcanic eruption, wildfires, and terrorism that may occur in locations inside and outside the United States where we insure properties.
15
We utilize proprietary and third party catastrophe modeling tools to assist us in managing our catastrophe exposures. These models rely on various methodologies and assumptions that are subjective and subject to uncertainty. The methodologies and assumptions also may be changed from time to time by the third party modeling companies. The use of different methodologies or assumptions would result in the models generating substantially different estimations of our catastrophe exposures. Moreover, modeled loss estimates may be materially different from actual results.
Managing terrorism risks is particularly challenging, given the unpredictability of the targets, the frequency and severity of potential terrorist events, the limited availability of terrorism reinsurance and limited government provided protections. Although we use modeling tools to try to manage our risk aggregations, the estimates generated may be substantially different from the actual results if the event were to occur. In addition, for certain classes of business, insurance for terrorism losses is mandatory so we are not able to exclude terrorism from our policies. The U.S. federal government and the governments of some countries outside the United States provide some assistance for certain terrorist events. This assistance, however, is limited. For example, under the Terrorism Risk Insurance Act of 2002, and most recently the Terrorism Risk Insurance Program Reauthorization Act of 2015 (collectively TRIA), the U.S. federal government shares the risk of loss arising from certain acts of terrorism, but the program is applicable only to select lines of commercial business and benefits under it are subject to a substantial deductible and other limitations. Our deductible for 2015 is approximately $1.0 billion. Even with government-provided assistance, however limited, and the measures we have taken or may take to mitigate terrorism exposure, the occurrence of a terrorist event could have a material adverse effect on our results of operations, financial condition or liquidity.
Natural or man-made catastrophic events could cause claims under our insurance policies to be higher than we anticipated and could cause substantial volatility in our financial results for any fiscal quarter or year. Our ability to write new business could also be adversely affected. Increases in the value and geographic concentration of insured property and the effects of inflation could increase the severity of claims from catastrophic events in the future. In addition, states and other jurisdictions have from time to time passed legislation that has the effect of limiting the ability of insurers to manage catastrophe risk, such as legislation limiting insurers' ability to increase rates and prohibiting insurers from withdrawing from catastrophe-exposed areas.
As a result of the foregoing, it is possible that the occurrence of any natural or man-made catastrophic event could have a material adverse effect on our business, results of operations, financial condition and liquidity. A further discussion of the risks and uncertainties related to catastrophes is presented in the Property and Casualty Insurance - Catastrophe Risk Management section of MD&A.
We cannot predict the impact that changing climate conditions, including legal, regulatory and social responses to those conditions, may have on our business, results of operations or financial condition.
The changing climate around the globe has added, and will continue to add, to the unpredictability, frequency and severity of natural disasters (including, but not limited to, hurricanes, tornadoes, freezes, other storms and fires) around the world. In response, a number of legal and regulatory measures as well as social initiatives have been introduced in an effort to reduce greenhouse gas and other carbon emissions, which various organizations believe may be one of the chief contributors to global climate change. We cannot predict how legal, regulatory and social responses to concerns about global climate change will impact our business.
Changing climate conditions could potentially have significant implications for the insurance industry in areas such as risk perception, pricing and modeling assumptions. We cannot predict the impact that changing climate conditions will have on our results of operations or our financial condition. Increases in the frequency or severity of natural catastrophes in the future could result in substantial volatility in our results of operations or financial condition for any fiscal quarter or year and could materially reduce our profitability.
16
Payment of obligations under surety bonds could have a material adverse effect on our results of operations.
The surety business tends to be characterized by infrequent but potentially high severity losses. The majority of our surety obligations are intended to be performance-based guarantees. When losses occur, they may be mitigated, at times, by recovery rights to the customer's assets, contract payments, collateral and bankruptcy recoveries. We have substantial commercial and construction surety exposure for current and prior customers. In that regard, we have exposures related to surety bonds issued on behalf of companies that have experienced or may experience deterioration in creditworthiness. If the financial condition of these companies were adversely affected by the economy or otherwise, we may experience an increase in filed claims and may incur high severity losses, which could have a material adverse effect on our results of operations.
We rely on pricing and capital models, but actual results could differ materially from the model outputs.
We employ various predictive modeling, stochastic modeling and/or forecasting techniques to analyze and estimate loss trends and the risks associated with our assets and liabilities. We utilize the modeled outputs and related analyses to assist us in making underwriting, pricing, reinsurance and capital decisions. The modeled outputs and related analyses are subject to numerous assumptions, uncertainties and the inherent limitations of any statistical analysis. Consequently, modeled results may differ materially from our actual experience. If, based upon these models or otherwise, we under price our products or underestimate the frequency and/or severity of loss events, it could have a material adverse effect on our results of operations or financial condition. If, based upon these models or otherwise, we over price our products or overestimate the risks we are exposed to, new business growth and retention of our existing business may be adversely affected, which could have a material adverse effect on our results of operations.
The failure of the risk mitigation strategies we utilize could have a material adverse effect on our results of operations or financial condition.
We utilize a number of strategies to mitigate our risk exposure, such as:
| • | rigorous underwriting; |
| • | carefully evaluating the terms and conditions of our policies; |
| • | focusing on our risk aggregations by geographic zone, industry type, credit exposure and other bases; and |
| • | ceding reinsurance. |
However, there are inherent limitations in all of these tactics and no assurance can be given that an event or series of events will not result in loss levels that could have a material adverse effect on our financial condition or results of operations. It is also possible that losses could manifest themselves in ways that we do not anticipate and that our risk mitigation strategies are not designed to address. Such a manifestation of losses could have a material adverse effect on our financial condition or results of operations. These risks may be heightened during difficult economic conditions such as those recently experienced in the United States and elsewhere.
We may not be able to collect all amounts due to us from reinsurers and reinsurance coverage may not be available to us in the future at commercially reasonable rates or at all.
The P&C Group cedes reinsurance to provide greater diversification of risk and to limit the P&C Group's maximum net loss arising from large risks or from catastrophic events. Although the reinsurer is liable to us to the extent of the ceded reinsurance, we remain liable as the direct insurer on all risks reinsured. As a result, ceded reinsurance arrangements do not fully eliminate our obligation to pay claims and we are subject to the credit risk with respect to our ability to recover amounts due from reinsurers. Consequently, we may not be able to collect all amounts due to us from reinsurers, which could have a material adverse effect on our results of operations or financial condition.
17
The availability and cost of reinsurance are subject to prevailing market conditions that are beyond our control. For example, reinsurance may be more difficult or costly to obtain following a period with a large number of major catastrophic events. No assurances can be made that reinsurance will remain continuously available to us in amounts that we consider sufficient and at rates that we consider acceptable, which would cause us to increase the amount of risk we retain, reduce the amount of business we underwrite or look for alternatives to reinsurance. This, in turn, could have a material adverse effect on our financial condition or results of operations.
A downgrade in our credit ratings and financial strength ratings could adversely impact the competitive positions of our operating businesses.
Credit ratings and financial strength ratings can be important factors in establishing our competitive position in the insurance markets. There can be no assurance that our ratings will continue for any given period of time or that they will not be changed. If our credit ratings were downgraded in the future, we could incur higher borrowing costs and may have more limited means to access capital. In addition, a downgrade in our financial strength ratings could adversely affect the competitive position of our insurance operations, including a possible reduction in demand for our products in certain markets.
We may be unsuccessful in our efforts to sell new products and/or to expand our existing product offerings to new markets.
Our strategy for enhancing profitable growth includes new product initiatives as well as expanding existing product offerings to new markets. We may not be successful in these efforts, which could have a material adverse effect on our results of operations or financial condition. Even if we are successful, results attributable to these product offerings could be different than we had expected and could have an adverse effect on our results of operations or financial condition.
We are dependent on a distribution network that comprises independent insurance brokers and agents to distribute our products.
We generally do not use salaried employees to promote or distribute our insurance products. Instead, we rely on a large number of independent insurance agents and brokers. Accordingly, our business is dependent on the willingness of these agents and brokers to recommend our products to their customers, who may also promote and distribute the products of our competitors. Deterioration in relationships with our agent and broker distribution network or their increased promotion and distribution of our competitors' products could materially and adversely affect our ability to sell our products, which, in turn, could have a material adverse effect on our results of operations or financial condition.
Intense competition related to the products we sell could reduce our premium volume or adversely affect our results of operations.
The property and casualty insurance industry is highly competitive. We compete not only with other stock companies but also with mutual companies, other underwriting organizations and alternative risk sharing mechanisms. We compete for business not only on the basis of price, but also on the basis of financial strength, availability of coverage desired by customers and quality of service, including claim adjustment service. We may have difficulty in continuing to compete successfully on any of these bases in the future. If competition limits our ability to write new or renewal business at adequate rates, our total premiums could decline and our results of operations could be adversely affected.
We may be adversely affected if we are unable to hire qualified employees or manage key employee succession and retention.
There is significant competition from within the property and casualty insurance industry and from businesses outside the industry for qualified employees, especially those in key positions and those possessing highly specialized knowledge. Our performance is largely dependent on the talents, efforts
18
and proper conduct of highly-skilled individuals, including our senior executives, many of whom have decades of experience in the insurance industry. See the Executive Officers of the Registrant section of this Form 10-K for more information relating to Chubb's executive officers. The loss of the services of any of our senior executives or the inability to hire and retain other highly qualified personnel in the future could adversely affect our ability to conduct or grow our business.
For many of our senior positions, we compete for talent not just with insurance or financial service companies, but with other large companies and other businesses. Our continued ability to compete effectively in our business depends on our ability to attract new employees and to retain and motivate our existing employees. If we are not able to successfully attract, retain and motivate our employees, our business, results of operations and reputation could be adversely affected.
Additionally, we would be adversely affected if we fail to adequately plan for the succession of our senior management. As previously disclosed, John D. Finnegan, our Chairman, President and Chief Executive Officer, and Chubb's Board of Directors have agreed that Mr. Finnegan will retire from Chubb on December 31, 2016. While we have succession plans for our senior management positions and long-term compensation plans designed to retain our senior employees, if our succession plans do not operate effectively, our business could be adversely affected.
We are subject to an extensive legal and regulatory framework in the United States. Compliance with current and future regulation may reduce our profitability and limit our growth. Moreover, our failure to comply with applicable laws and regulations could result in restrictions on our ability to do business, subject us to fines and penalties and have other adverse effects on our business.
Our insurance subsidiaries are subject to extensive regulation and supervision in the jurisdictions in the United States in which they conduct business. This regulation is generally designed to protect the interests of policyholders, and not necessarily the interests of insurers, their shareholders or other investors. The regulation relates to authorization for lines of business, capital and surplus requirements, investment limitations, underwriting limitations, limitations on transactions with affiliates, dividend limitations, changes in control, premium rates and a variety of other financial and nonfinancial components of an insurance company's business. Complying with applicable laws and regulations may increase our cost of doing business and limit our opportunities for business growth. Failure to comply with, or to obtain, appropriate authorizations and/or exemptions under any applicable laws and regulations could result in restrictions on our ability to do business or undertake activities that are regulated in one or more of the jurisdictions in which we conduct business and could subject us to fines and other sanctions.
Virtually all states in which the P&C Group operates require that we, together with other insurers licensed to do business in such states, bear a portion of the loss suffered by some insureds as the result of impaired or insolvent insurance companies. In addition, in various states, our insurance subsidiaries must participate in mandatory arrangements to provide various types of insurance coverage to individuals or entities that otherwise are unable to purchase that coverage from private insurers. A few states also require us to purchase reinsurance from mandatory reinsurance funds, which can create a credit risk for insurers if such funds are not adequately funded by the state. In addition, in some cases, the existence of a reinsurance fund could affect the prices we can charge for our policies. The effect of these and similar arrangements could reduce our profitability in any given period and/or limit our ability to grow our business.
In recent years, the regulatory framework in the United States has come under increased scrutiny, including scrutiny by federal officials, and some state legislatures have considered or enacted laws that may alter or increase state authority to regulate insurance companies as well as insurance holding companies. Further, the NAIC and state insurance regulators are continually reexamining existing laws and regulations, focusing on modifications to statutory accounting principles, interpretations of existing laws and the development of new laws and regulations. The NAIC has undertaken a Solvency
19
Modernization Initiative focused on updating the U.S. insurance solvency regulation framework, including capital requirements, governance and risk management, group supervision, accounting and financial reporting and reinsurance. Among the changes adopted by the NAIC and enacted into law by some states, including Indiana, is implementation of an ORSA rule that requires insurers to measure and share with solvency regulators a summary of their internal assessment of capital needs for the entire holding company group, including non-insurance subsidiaries. The P&C Group will be required to provide a summary of its ORSA to Indiana's Department of Insurance by the end of 2015. Any proposed or future legislation or regulations, including NAIC initiatives, if adopted, may be more restrictive on our ability to conduct business than current legal and regulatory requirements and may result in higher costs of compliance or increased capital requirements, which could have a material adverse effect on our results of operations.
Under the Dodd-Frank Wall Street Reform and Consumer Protection Act, two federal government bodies, the FIO and the FSOC, were created, which may impact the regulation of insurance. Although the FIO is prohibited from directly regulating the business of insurance, it has authority to represent the United States in international insurance matters and has limited powers to preempt certain types of state insurance laws. The FIO also can recommend to the FSOC that it designate an insurer a systemically important financial institution posing risks to U.S. financial stability in the event of the insurer's material financial distress or failure. An insurer so designated by FSOC could be subject to Federal Reserve supervision and heightened prudential standards. While we do not believe the P&C Group or any of its affiliated companies are systemically important financial institutions, it is possible the FSOC could conclude otherwise. If the FSOC were to designate the P&C Group or any of its affiliated companies for supervision by the Federal Reserve, it could place more restrictions on our ability to conduct business and may result in higher costs, increased capital requirements and/or lower profitability. Even if an insurance company is not designated as a systemically important financial institution, it still could be adversely impacted by new rules governing such institutions. For example, non-bank financial institutions may, under certain circumstances, be subject to possible assessment to fund the orderly resolution of a financially distressed systemically important financial institution.
Although the federal government and its regulatory authorities generally do not directly regulate the business of insurance, federal initiatives often have an impact on the insurance business in a variety of ways. Current and proposed federal measures that may significantly affect the P&C Group's business and the insurance market as a whole include measures concerning terrorism insurance, systemic risk regulation, tort law, natural catastrophes, corporate governance, ergonomics, health care reform, including containment of medical costs, privacy, cyber security practices, e-commerce, international trade, federal regulation of insurance companies and taxation of insurance companies.
The P&C Group is subject to regulation and supervision in jurisdictions outside the United States where we do business. Compliance with current and future laws and regulations in these jurisdictions may reduce our profitability and limit our growth. Our noncompliance with these laws and regulations also could result in restrictions on our business, subject us to fines or penalties or have other adverse effects.
Insurers in the P&C Group doing business outside the United States also are subject to regulation and supervision in the jurisdictions within which they operate. The extent of insurance regulation varies from country to country. Complying with applicable laws and regulations may increase our costs of doing business and limit our opportunities to grow our business. Moreover, failure to comply with all of the laws and regulations to which we are subject could result in restrictions on our ability to do business, subject us to fines or penalties or have other adverse effects on our business.
Regulators in many countries are working with the IAIS to develop global insurance company solvency standards and a framework for group supervision of companies in a holding company system, including noninsurance companies. Some IAIS initiatives are particularly focused on the supervision of internationally active insurance groups, such as the P&C Group. In addition to these IAIS initiatives, the European Union Solvency II directive will require regulated companies, such as the P&C Group's
20
European operations, to meet new requirements in relation to risk and capital management. The European operations of a U.S. parent company could be subject to greater capital and regulatory requirements if the U.S. state-based regulatory system is not deemed "equivalent" to its European counterpart pursuant to Solvency II. Discussions between U.S. representatives and the European Union are ongoing regarding equivalency and/or a mutual recognition for the U.S. system under Solvency II, so we are not currently able to predict the impact of Solvency II on the Corporation. The Solvency II directive is currently scheduled to take effect January 1, 2016. Interim measures, however, came into force on January 1, 2014, which require some of the requirements to be met ahead of the January 1, 2016 implementation date, notably the production of an own risk and solvency assessment and regulatory reporting. Some regulators outside the European Union have imposed or are considering imposing similar risk and capital management requirements that could impact the P&C Group's operations. Such proposed or future legislation and regulation in countries where we operate, if adopted, may be more restrictive on our ability to conduct business than current regulatory requirements or may result in higher costs, increased capital requirements and/or lower profitability.
The IAIS, working with the FSB, also has developed a process to designate globally systemically important insurers (G-SII). Although certain insurance groups have been so designated, we do not believe the P&C Group or any of its affiliated companies are G-SIIs, and neither the P&C Group nor its affiliated companies have been designated as a G-SII. It is possible, however, the FSB, in the future, could conclude otherwise. The ramifications of a G-SII designation for the P&C Group or any of its affiliated companies are unknown at this time. It would, however, likely result in greater regulatory scrutiny and could place more restrictions on our ability to conduct business, result in higher costs, increased capital requirements or lower profitability.
State regulators in the United States and regulatory authorities outside the United States are increasingly coordinating the regulation of multinational insurers. We cannot predict the impact that decisions of these coordinated regulatory efforts will have on our business.
State regulators in the United States and regulatory authorities outside the United States are increasingly coordinating the regulation of multinational insurers by conducting supervisory colleges. A supervisory college is a forum for key regulators of an insurance group to share information and promote the coordination of supervision of the group. It is intended to facilitate supervision of the group at the group-wide level, as well as to enhance supervision of each of the entities included in the group. In both 2013 and 2014, regulators of the P&C Group conducted a supervisory college for the P&C Group. We cannot predict the impact that decisions of a supervisory college or other coordinated regulatory efforts will have on our business.
We are subject to a number of risks associated with our business outside the United States.
A significant portion of our business is conducted outside the United States, including in Asia, Australia, Canada, Europe and Latin America. By doing business outside the United States, we are subject to a number of risks, including without limitation, dealing with jurisdictions, especially in emerging markets in Latin America and Asia, that may lack political, financial or social stability and/or a strong legal and regulatory framework, which may make it difficult to do business and comply with local laws and regulations in such jurisdictions. Failure to comply with local laws in a particular jurisdiction or doing business in a country that becomes increasingly unstable could have a material adverse effect on our business and operations in that market as well as on our reputation generally.
As part of our international operations, we engage in transactions denominated in currencies other than the U.S. dollar. To reduce our exposure to currency fluctuation, we attempt to match the currency of the liabilities we incur under insurance policies with assets denominated in the same local currency. However, in the event that we underestimate our exposure, negative movements in the U.S. dollar versus the local currency will exacerbate the impact of the exposure on our results of operations and financial condition. In addition, holding local currencies subjects us to the monetary policies and currency controls of the issuing government. The devaluation of a currency we hold or the imposition of controls that prevent the export of such currency could negatively impact our business.
21
We report the results of our international operations on a consolidated basis with our U.S. business. These results are reported in U.S. dollars. A significant portion of the business we write outside the United States, however, is transacted in local currencies. Consequently, fluctuations in the relative value of local currencies in which the policies are written versus the U.S. dollar can mask the underlying trends in our international business.
The United States and other jurisdictions in which we operate have adopted various laws and regulations that may apply to the business we conduct outside of the United States, including those relating to antibribery and economic sanctions compliance. These laws and regulations often apply not only to our direct activities, but also to those activities we conduct through intermediaries, such as agents, brokers and other business partners. Although we have policies and controls in place that are designed to ensure compliance with these laws and regulations, it is possible that one or more of our employees or intermediaries could fail to comply with applicable laws and regulations. In such event, we could be exposed to civil penalties, criminal penalties and other sanctions. In addition, such violations could damage our business and/or our reputation. Such civil penalties, criminal penalties, other sanctions and damage to our business and/or reputation could have a material adverse effect on our results of operations or financial condition.
The inability of our property and casualty insurance subsidiaries to pay dividends in sufficient amounts would limit our ability to meet our obligations, to pay future dividends and to repurchase shares of our common stock.
As a holding company, Chubb relies primarily on dividends from its property and casualty insurance subsidiaries to meet its obligations for payment of interest and principal on outstanding debt obligations, to pay dividends to shareholders and to repurchase shares of our common stock. The ability of our property and casualty insurance subsidiaries to pay dividends in the future will depend on their statutory surplus, on earnings and on regulatory restrictions. We are subject to regulation by some states as an insurance holding company system. Such regulation generally provides that transactions between companies within the holding company system must be fair and equitable. Transfers of assets among affiliated companies, certain dividend payments from property and casualty insurance subsidiaries and certain material transactions between companies within the system may be subject to prior notice to, or prior approval by, state and other regulatory authorities. The ability of our property and casualty insurance subsidiaries to pay dividends is also restricted by regulations that set standards of solvency that must be met and maintained, that limit investments and that limit dividends to shareholders. These regulations may affect Chubb's insurance subsidiaries' ability to provide Chubb with dividends.
We may experience reduced returns or losses on our investments, especially during periods of heightened volatility, which could have a material adverse effect on our results of operations or financial condition.
The returns on our investment portfolio may be reduced or we may incur losses as a result of changes in general economic conditions, interest rates, real estate markets, fixed income markets, equity markets, alternative investment markets, credit markets, exchange rates, global capital market conditions and numerous other factors that are beyond our control.
During prolonged periods of low interest rates and investment returns, we may not be able to invest new money generated by our operations or reinvest funds at rates that generate the same level of investment income generated by our existing invested assets, which could have a material adverse effect on our results of operations or financial condition. In addition, during periods of rising interest rates, the market values of our existing fixed maturity securities will likely decline, which could decrease our book value and result in unrealized and/or realized losses that have a material adverse effect on our results of operations or financial condition.
The worldwide financial markets experience high levels of volatility during certain periods, which could have an increasingly adverse impact on the U.S. and foreign economies. If the financial market volatility and the resulting negative economic impact are prolonged, they could adversely affect our
22
current investment portfolio, make it difficult to determine the value of certain assets in our portfolio and/or make it difficult for us to purchase suitable investments that meet our risk and return criteria. These factors could cause us to realize less than expected returns on invested assets, sell investments for a loss or write off or write down investments, any of which could have a material adverse effect on our results of operations or financial condition.
A significant portion of our investment portfolio is invested in obligations of states, municipalities and political subdivisions (often collectively referred to as municipal bonds). Issuers of municipal bonds can face decreasing revenue and tax bases in economic downturns, which could result in the risk of default or impairment of municipal bonds we hold that could adversely affect our results of operations or financial condition.
Our investment portfolio also includes commercial mortgage-backed securities, residential mortgage-backed securities, collateralized mortgage obligations and pass-through securities. Prolonged stress in the U.S. housing market and/or financial market disruption could adversely impact these investments.
Our investment portfolio includes securities that may be more volatile than fixed maturity instruments and certain of these instruments may be illiquid.
Our investment portfolio includes equity securities and private equity limited partnership interests which may experience significant volatility in their investment returns and valuation. Moreover, our private equity limited partnership interests are subject to transfer restrictions and may be illiquid. If the investment returns or value of these investments decline, or if we are unable to dispose of these investments at their carrying value, it could have a material adverse effect on our results of operations or financial condition.
Changes to federal and/or state tax laws could adversely affect the value of our investment portfolio.
A significant portion of our investment portfolio consists of tax exempt securities and we receive certain tax benefits relating to such securities based on current laws and regulations. Our portfolio has also benefited from certain other laws and regulations, including without limitation, tax credits. Federal and/or state tax legislation could be enacted that would lessen or eliminate some or all of the tax advantages currently benefiting us and could negatively impact the value of our investment portfolio.
We are exposed to credit risk and foreign currency risk in our business operations and in our investment portfolio.
We are exposed to credit risk in several areas of our business operations, including, without limitation, credit risk relating to reinsurance, co-sureties on surety bonds, policyholders of certain of our insurance products, independent agents and brokers, issuers of securities, insurers of certain securities and certain other counterparties relating to our investment portfolio.
With respect to reinsurance coverages that we have purchased, our ability to recover amounts due from reinsurers may be affected by the creditworthiness and willingness of the reinsurers to pay. Although certain reinsurance we have purchased is collateralized, the collateral is exposed to credit risk of the counterparty that has guaranteed an investment return on such collateral.
It is customary practice in the surety business for multiple insurers to participate as co-sureties on large surety bonds, meaning that each insurer (each referred to as a co-surety) assumes its proportionate share of the risk and receives a corresponding percentage of the bond premium. Under these arrangements, the co-sureties' obligations are joint and several. Consequently, if a co-surety defaults on its obligations, the remaining co-surety or co-sureties are obligated to make up the shortfall to the beneficiary of the surety bond even though the non-defaulting co-sureties did not receive the premium for that portion of the risk. Therefore, we are subject to credit risk with respect to the insurers with whom we are co-sureties on surety bonds.
23
In accordance with industry practice, when insureds purchase our insurance products through independent agents and brokers, they generally pay the premiums to the agent or broker, which in turn is required to remit the collected premium to us. In many jurisdictions, we are deemed to have received payment upon the receipt of the payment by the agent or broker, regardless of whether the agent or broker actually remits payment to us. As a result, we assume credit risk associated with amounts due from independent agents and brokers.
The value of our investment portfolio is subject to credit risk from the issuers and/or guarantors of the securities in the portfolio, other counterparties in certain transactions and, for certain securities, insurers that guarantee specific issuer's obligations. Defaults by the issuer and, where applicable, an issuer's guarantor, insurer or other counterparties with regard to any of such investments could reduce our net investment income and net realized investment gains or result in investment losses.
We report our financial results in U.S. dollars, but a significant amount of the business we write and expenses we incur outside the United States are denominated in currencies other than the U.S. dollar. In addition, a substantial portion of our investment portfolio is denominated in non-U.S. dollar currencies. As a result, changes in the strength of the U.S. dollar relative to these foreign currencies could adversely affect our results of operations and financial condition.
Our exposure to any of the above credit risks and foreign currency risk could have a material adverse effect on our results of operations or financial condition.
Changes in accounting principles and financial reporting requirements may impact the manner in which we present our results of operations and financial condition.
The Financial Accounting Standards Board and the Securities and Exchange Commission may issue from time to time new accounting and reporting standards or changes in the interpretation of existing standards. These new standards or changes in interpretation, particularly those that specifically apply to insurance company operations, could have an effect on how we report our results of operations and financial condition in the future.
If we experience difficulties with outsourcing and similar third party relationships, our ability to conduct our business might be negatively impacted.
We outsource certain business and administrative functions and rely on third parties to perform certain services on our behalf. We may do so increasingly in the future. If we fail to develop and implement our outsourcing strategies or our third party providers fail to perform as anticipated, we may experience operational difficulties, increased costs, reputational damage and a loss of business that may have a material adverse effect on our results of operations or financial condition. By utilizing third parties to perform certain business and administrative functions, we may be exposed to greater risk of data security breaches. Any breach of data security could damage our reputation and/or result in monetary damages, which, in turn, could have a material adverse effect on our results of operations or financial condition.
The occurrence of certain events could have a materially adverse effect on our systems and could impact our ability to conduct business effectively.
Our computer, information technology and telecommunications systems, which we use to conduct our business, interface with and rely upon third party systems. Systems failures or outages could compromise our ability to perform business functions in a timely manner, which could harm our ability to conduct business and hurt our relationships with our business partners and customers.
In the event of a disaster such as a natural catastrophe, an industrial accident, a blackout, a computer virus, a terrorist attack or war, our systems may be inaccessible to our employees, customers or business partners for an extended period of time. Even if our employees or third party providers are able to report to work, they might be unable to perform their duties for an extended period of time if our computer, information technology or telecommunication systems were disabled or destroyed.
24
Our systems could be subject to physical break-ins, electronic hacking and similar disruptions from unauthorized access or tampering. This may impede or interrupt our business operations, and may result in monetary damages and/or damages to our reputation which could have a material adverse effect on our results of operations or financial condition.
Loss of sensitive data and other security breaches could damage our reputation and harm our business.
We routinely transmit, receive and store personal, confidential and proprietary information by email and other electronic means. Although we attempt to protect this confidential and proprietary information, we may be unable to do so in all events, especially with customers, business partners and other third parties who may not have or use appropriate controls to protect confidential information.
In addition, we are subject to numerous data privacy laws, such as those enacted by the U.S. federal government, various state governments, the European Union and other jurisdictions in which we do business relating to the privacy of the information of clients, employees or others. A misuse or mishandling of confidential or proprietary information being sent to or received from a client, employee or third party could result in legal liability, regulatory action and reputational harm. Third parties to whom we outsource certain of our functions are also subject to these risks, and their failure to adhere to these laws and regulations could negatively impact us.
Like other companies, we have on occasion experienced, and will continue to experience, threats to our data and systems, including malicious codes and viruses, and other cyber-attacks. The number and complexity of these threats continue to increase over time. To date, we are not aware of any material cyber security breach with respect to our systems or data. We deploy administrative and technical controls designed to reduce the risk associated with these cyber security threats. Such controls may be insufficient to prevent events like physical and electronic break-ins, denial of service and other cyber-attacks or other security breaches to our computer systems and those of third parties upon which we may rely. In some cases, such events may not be immediately detected. Such events could compromise our personal, confidential and proprietary information as well as that of our customers and business partners, impede or interrupt our business operations and may result in other negative consequences including remediation costs, loss of revenue, additional regulatory scrutiny and fines, litigation and monetary and reputational damages. While we maintain cyber insurance providing first party and third party coverages, such insurance may not cover all costs associated with the consequences of personal and confidential and proprietary information being compromised. As a result, in the event of a material cyber security breach, our results of operations could be materially, adversely affected.
| Item 1B. | Unresolved Staff Comments |
None.
| Item 2. | Properties |
The executive offices of the Corporation are in Warren, New Jersey. The administrative offices of the P&C Group are located in Warren and Whitehouse Station, New Jersey. The P&C Group maintains territory, branch and service offices in major cities throughout the United States and also has offices in Canada, Europe, Australia, Latin America and Asia. Office facilities are leased with the exception of buildings in Whitehouse Station, New Jersey and Simsbury, Connecticut. Management considers its office facilities suitable and adequate for the current level of operations.
| Item 3. | Legal Proceedings |
Chubb and its subsidiaries are defendants in various lawsuits arising out of their businesses. It is the opinion of management that the final outcome of these matters will not materially affect the consolidated financial position of the registrant.
25
Executive Officers of the Registrant
Name | Position | Age(a) | Year of Election(b) | |||||||||
John D. Finnegan | Chairman, President and Chief Executive Officer | 66 | 2002 | |||||||||
W. Brian Barnes | Senior Vice President and Chief Actuary of Chubb & Son, a division of Federal | 52 | 2008 | |||||||||
Maureen A. Brundage | Executive Vice President, General Counsel and Corporate Secretary | 58 | 2005 | |||||||||
Robert C. Cox | Executive Vice President of Chubb & Son, a division of Federal | 56 | 2003 | |||||||||
John J. Kennedy | Senior Vice President and Chief Accounting Officer | 59 | 2008 | |||||||||
Mark P. Korsgaard | Executive Vice President of Chubb & Son, a division of Federal | 59 | 2010 | |||||||||
Paul J. Krump | President of Personal Lines and Claims of Chubb & Son, a division of Federal | 55 | 2001 | |||||||||
Harold L. Morrison, Jr. | Executive Vice President, Chief Global Field Officer and Chief Administrative Officer of Chubb & Son, a division of Federal | 57 | 2008 | |||||||||
Steven R. Pozzi | Executive Vice President of Chubb & Son, a division of Federal | 58 | 2009 | |||||||||
Dino E. Robusto | President of Commercial and Specialty Lines of Chubb & Son, a division of Federal | 56 | 2006 | |||||||||
Richard G. Spiro | Executive Vice President and Chief Financial Officer | 50 | 2008 | |||||||||
Kathleen M. Tierney | Executive Vice President of Chubb & Son, a division of Federal | 46 | 2010 | |||||||||
| (a) | Ages listed above are as of February 26, 2015. |
| (b) | Date indicates year first elected or designated as an executive officer. |
All of the foregoing officers serve at the pleasure of the Board of Directors of the Corporation and have been employees of the Corporation for more than five years.
26
PART II.
| Item 5. | Market for the Registrant's Common Equity, Related Stockholder Matters and Issuer Purchases of Equity Securities |
The common stock of Chubb is listed and principally traded on the New York Stock Exchange (NYSE) under the trading symbol "CB". The following are the high and low closing sale prices as reported on the NYSE Composite Tape and the quarterly dividends declared per share for each quarter of 2014 and 2013.
| 2014 | ||||||||||||||||
| First Quarter | Second Quarter | Third Quarter | Fourth Quarter | |||||||||||||
Common stock prices | ||||||||||||||||
High | $ | 95.00 | $ | 94.08 | $ | 94.04 | $ | 105.00 | ||||||||
Low | 83.00 | 88.40 | 86.71 | 90.77 | ||||||||||||
Dividends declared | .50 | .50 | .50 | .50 | ||||||||||||
| 2013 | ||||||||||||||||
| First Quarter | Second Quarter | Third Quarter | Fourth Quarter | |||||||||||||
Common stock prices | ||||||||||||||||
High | $ | 87.53 | $ | 90.60 | $ | 90.10 | $ | 97.34 | ||||||||
Low | 76.09 | 81.79 | 83.17 | 87.58 | ||||||||||||
Dividends declared | .44 | .44 | .44 | .44 | ||||||||||||
At February 13, 2015, there were approximately 6,900 common shareholders of record.
The declaration and payment of future dividends to Chubb's shareholders will be at the discretion of Chubb's Board of Directors and will depend upon many factors, including the Corporation's operating results, financial condition and capital requirements, and the impact of regulatory constraints discussed in Note (16)(e) of the Notes to Consolidated Financial Statements.
The following table summarizes Chubb's repurchases of its common stock during each month in the quarter ended December 31, 2014.
Period | Total Number of Shares Purchased | Average Price Paid Per Share | Total Number of Shares Purchased as Part of Publicly Announced Plans or Programs | Maximum Approximate Dollar Value of Shares that May Yet Be Purchased Under the Plans or Programs(a) | ||||||||||||
| (in millions) | ||||||||||||||||
October 1 - October 31 | 780,757 | $ | 92.55 | 780,757 | $ | 327 | ||||||||||
November 1 - November 30 | 698,155 | 101.94 | 698,155 | 255 | ||||||||||||
December 1 - December 31 | 1,966,462 | 103.28 | 1,966,462 | 52 | ||||||||||||
|
|
|
| |||||||||||||
Total | 3,445,374 | 100.58 | 3,445,374 | |||||||||||||
|
|
|
| |||||||||||||
| (a) | On January 30, 2014, the Board of Directors authorized the repurchase of up to $1.5 billion of Chubb's common stock. In January 2015, Chubb repurchased $52 million of its common stock remaining under the January 30, 2014 authorization. On January 29, 2015, the Board of Directors authorized the repurchase of up to $1.3 billion of Chubb's common stock. The January 29, 2015 authorization has no expiration date. |
27
Stock Performance Graph
The following performance graph compares the performance of Chubb's common stock during the five-year period from December 31, 2009 through December 31, 2014 with the performance of the Standard & Poor's 500 Index and the Standard & Poor's Property & Casualty Insurance Index. The graph plots the changes in value of an initial $100 investment over the indicated time periods, assuming all dividends are reinvested.
Cumulative Total Return
Based upon an initial investment of $100 on December 31,
2009
with dividends reinvested
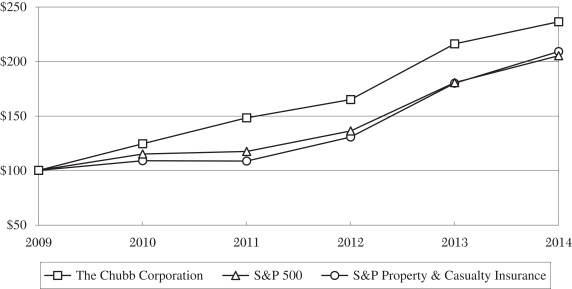
| December 31 | ||||||||||||||||||||||||
| 2009 | 2010 | 2011 | 2012 | 2013 | 2014 | |||||||||||||||||||
Chubb | $ | 100 | $ | 125 | $ | 148 | $ | 165 | $ | 216 | $ | 236 | ||||||||||||
S&P 500 | 100 | 115 | 117 | 136 | 180 | 205 | ||||||||||||||||||
S&P 500 Property & Casualty Insurance | 100 | 109 | 109 | 131 | 181 | 209 | ||||||||||||||||||
Our filings with the SEC may incorporate information by reference, including this Form 10-K. Unless we specifically state otherwise, the information under this heading "Stock Performance Graph" shall not be deemed to be "soliciting materials" and shall not be deemed to be "filed" with the SEC or incorporated by reference into any of our filings under the Securities Act of 1933, as amended, or the Securities Exchange Act of 1934, as amended.
28
| Item 6. | Selected Financial Data |
2014 | 2013 | 2012 | 2011 | 2010 | ||||||||||||||||
| (in millions except for per share amounts) | ||||||||||||||||||||
FOR THE YEARS ENDED DECEMBER 31 |
| |||||||||||||||||||
Revenues | ||||||||||||||||||||
Property and Casualty Insurance | ||||||||||||||||||||
Premiums Earned | $ | 12,328 | $ | 12,066 | $ | 11,838 | $ | 11,644 | $ | 11,215 | ||||||||||
Investment Income | 1,368 | 1,436 | 1,518 | 1,598 | 1,590 | |||||||||||||||
Corporate and Other | 33 | 43 | 46 | 55 | 88 | |||||||||||||||
Realized Investment Gains, Net | 369 | 402 | 193 | 288 | 426 | |||||||||||||||
|
|
|
|
|
|
|
|
|
| |||||||||||
Total Revenues | $ | 14,098 | $ | 13,947 | $ | 13,595 | $ | 13,585 | $ | 13,319 | ||||||||||
|
|
|
|
|
|
|
|
|
| |||||||||||
Income | ||||||||||||||||||||
Property and Casualty Insurance | ||||||||||||||||||||
Underwriting Income | $ | 1,402 | $ | 1,675 | $ | 548 | $ | 574 | $ | 1,222 | ||||||||||
Investment Income | 1,329 | 1,391 | 1,482 | 1,562 | 1,558 | |||||||||||||||
Other Income (Charges) | (4 | ) | 6 | 10 | 21 | 2 | ||||||||||||||
|
|
|
|
|
|
|
|
|
| |||||||||||
Property and Casualty | 2,727 | 3,072 | 2,040 | 2,157 | 2,782 | |||||||||||||||
Corporate and Other | (235 | ) | (237 | ) | (237 | ) | (246 | ) | (220 | ) | ||||||||||
Realized Investment Gains, Net | 369 | 402 | 193 | 288 | 426 | |||||||||||||||
|
|
|
|
|
|
|
|
|
| |||||||||||
Income Before Income Tax | 2,861 | 3,237 | 1,996 | 2,199 | 2,988 | |||||||||||||||
Federal and Foreign Income Tax | 761 | 892 | 451 | 521 | 814 | |||||||||||||||
|
|
|
|
|
|
|
|
|
| |||||||||||
Net Income | $ | 2,100 | $ | 2,345 | $ | 1,545 | $ | 1,678 | $ | 2,174 | ||||||||||
|
|
|
|
|
|
|
|
|
| |||||||||||
Per Share | ||||||||||||||||||||
Net Income | $ | 8.62 | $ | 9.04 | $ | 5.69 | $ | 5.76 | $ | 6.76 | ||||||||||
Dividends Declared on | 2.00 | 1.76 | 1.64 | 1.56 | 1.48 | |||||||||||||||
AT DECEMBER 31 | ||||||||||||||||||||
Total Assets | $ | 51,286 | $ | 50,433 | $ | 52,184 | $ | 50,445 | $ | 49,976 | ||||||||||
Long Term Debt | 3,300 | 3,300 | 3,575 | 3,575 | 3,975 | |||||||||||||||
Total Shareholders' Equity | 16,296 | 16,097 | 15,827 | 15,301 | 15,257 | |||||||||||||||
Book Value Per Share | 70.12 | 64.83 | 60.45 | 56.15 | 51.32 | |||||||||||||||
29
| Item 7. | Management's Discussion and Analysis of Financial Condition and Results of Operations |
Management's Discussion and Analysis of Financial Condition and Results of Operations addresses the financial condition of the Corporation as of December 31, 2014 compared with December 31, 2013 and the results of operations for each of the three years in the period ended December 31, 2014. This discussion should be read in conjunction with the consolidated financial statements and related notes and the other information contained in this report.
INDEX
| PAGE | ||||
Cautionary Statement Regarding Forward-Looking Information | 31 | |||
Critical Accounting Estimates and Judgments | 33 | |||
Overview | 33 | |||
Property and Casualty Insurance | 35 | |||
Underwriting Operations | 36 | |||
Underwriting Results | 36 | |||
Net Premiums Written | 36 | |||
Ceded Reinsurance | 38 | |||
Profitability | 40 | |||
Review of Underwriting Results by Business Unit | 42 | |||
Personal Insurance | 42 | |||
Commercial Insurance | 44 | |||
Specialty Insurance | 46 | |||
Reinsurance Assumed | 48 | |||
Catastrophe Risk Management | 48 | |||
Natural Catastrophes | 48 | |||
Terrorism Risk and Legislation | 49 | |||
Loss Reserves | 50 | |||
Estimates and Uncertainties | 52 | |||
Reserves Other than Those Relating to Asbestos and Toxic Waste Claims | 52 | |||
Reserves Relating to Asbestos and Toxic Waste Claims | 56 | |||
Asbestos Reserves | 56 | |||
Toxic Waste Reserves | 59 | |||
Reinsurance Recoverable | 60 | |||
Prior Year Loss Development | 61 | |||
Investment Results | 63 | |||
Other Income and Charges | 64 | |||
Corporate and Other | 64 | |||
Realized Investment Gains and Losses | 65 | |||
Capital Resources and Liquidity | 66 | |||
Capital Resources | 66 | |||
Ratings | 67 | |||
Liquidity | 68 | |||
Contractual Obligations and Off-Balance Sheet Arrangements | 69 | |||
Invested Assets | 70 | |||
Fair Values of Financial Instruments | 71 | |||
Pension and Other Postretirement Benefits | 72 | |||
30
CAUTIONARY STATEMENT REGARDING FORWARD-LOOKING INFORMATION
Certain statements in this document are "forward-looking statements" as that term is defined in the Private Securities Litigation Reform Act of 1995 (PSLRA). These forward-looking statements are made pursuant to the safe harbor provisions of the PSLRA and include statements regarding our loss reserve and reinsurance recoverable estimates; asbestos and toxic waste liabilities and related developments; the impact of the economy on our business; the impact of changes to our reinsurance program in 2014 and the cost of, and market for, reinsurance in 2015; the adequacy of the rates at which we renewed and wrote new business; market conditions affecting us and our competitors in 2015, including premium volume, rate trends, pricing and competition; property and casualty investment income during 2015; cash flows generated by our investments; currency rate fluctuations; the repurchase of common stock under our share repurchase program; our capital adequacy and funding of liquidity needs; the funding and timing of loss payments; and the redemption of our capital securities. Forward-looking statements frequently can be identified by words such as "believe," "expect," "anticipate," "intend," "plan," "will," "may," "should," "could," "would," "likely," "estimate," "predict," "potential," "continue," or other similar expressions. Forward-looking statements are made based upon management's current expectations and beliefs concerning trends and future developments and their potential effects on us. These statements are not guarantees of future performance. Actual results may differ materially from those suggested by forward-looking statements as a result of risks and uncertainties, which include, among others, those discussed or identified from time to time in our public filings with the Securities and Exchange Commission and those associated with:
| • | global political, economic and market conditions, particularly in the jurisdictions in which we operate and/or invest, including: |
| • | changes in credit ratings, interest rates, market credit spreads and the performance of the financial markets; |
| • | currency fluctuations; |
| • | the effects of inflation; |
| • | changes in domestic and foreign laws, regulations and taxes; |
| • | changes in competition and pricing environments; |
| • | regional or general changes in asset valuations; |
| • | the inability to reinsure certain risks economically; and |
| • | changes in the litigation environment; |
| • | the effects of the outbreak or escalation of war or hostilities; |
| • | the occurrence of terrorist attacks, including any nuclear, biological, chemical or radiological events; |
| • | premium pricing and profitability or growth estimates overall or by lines of business or geographic area, and related expectations with respect to the timing and terms of any required regulatory approvals; |
| • | adverse changes in loss cost trends; |
| • | our ability to retain existing business and attract new business at acceptable rates; |
| • | our expectations with respect to cash flow and investment income and with respect to other income; |
| • | the adequacy of our loss reserves, including: |
| • | our expectations relating to reinsurance recoverables; |
| • | the willingness of parties, including us, to settle disputes; |
31
| • | developments in judicial decisions or regulatory or legislative actions relating to coverage and liability, in particular, for asbestos, toxic waste and other mass tort claims; |
| • | development of new theories of liability; |
| • | our estimates relating to ultimate asbestos liabilities; and |
| • | the impact from the bankruptcy protection sought by various asbestos producers and other related businesses; |
| • | the availability and cost of reinsurance coverage; |
| • | the occurrence of significant weather-related or other natural or human-made disasters, particularly in locations where we have concentrations of risk or changes to our estimates (or the assessments of rating agencies and other third parties) of our potential exposure to such events; |
| • | the impact of economic factors on companies on whose behalf we have issued surety bonds, and in particular, on those companies that file for bankruptcy or otherwise experience deterioration in creditworthiness; |
| • | the effects of disclosures by, and investigations of, companies we insure, particularly with respect to our lines of business that have a longer time span, or tail, between the incidence of a loss and the settlement of the claim; |
| • | the impact of legislative, regulatory, judicial and similar developments on companies we insure, particularly with respect to our longer tail lines of business; |
| • | the impact of legislative, regulatory, judicial and similar developments on our business, including those relating to insurance industry reform, terrorism, catastrophes, the financial markets, solvency standards, capital requirements, accounting guidance and taxation; |
| • | any downgrade in our claims-paying, financial strength or other credit ratings; |
| • | the ability of our subsidiaries to pay us dividends; |
| • | our ability and the ability of our third party vendors to maintain the availability of systems and safeguard the security of our data in the event of a disaster or other information security incident; |
| • | our plans to repurchase shares of our common stock, including as a result of changes in: |
| • | our financial position and financial results; |
| • | our capital position and/or capital adequacy levels required to maintain our existing ratings from independent rating agencies; |
| • | our share price; |
| • | investment opportunities; |
| • | opportunities to profitably grow our property and casualty insurance business; and |
| • | corporate and regulatory requirements; and |
| • | our ability to implement management's strategic plans and initiatives. |
Chubb assumes no obligation to update any forward-looking statement set forth in this document, which speak as of the date hereof.
32
CRITICAL ACCOUNTING ESTIMATES AND JUDGMENTS
The consolidated financial statements include amounts based on informed estimates and judgments of management for transactions that are not yet complete. Such estimates and judgments affect the reported amounts in the financial statements. Those estimates and judgments that were most critical to the preparation of the financial statements involved the determination of loss reserves and the recoverability of related reinsurance recoverables and the evaluation of whether a decline in value of any investment is temporary or other than temporary. These estimates and judgments, which are discussed within the following analysis of our results of operations, require the use of assumptions about matters that are highly uncertain and therefore are subject to change as facts and circumstances develop. If different estimates and judgments had been applied, materially different amounts might have been reported in the financial statements.
OVERVIEW
The following highlights do not address all of the matters covered in the other sections of Management's Discussion and Analysis of Financial Condition and Results of Operations or contain all of the information that may be important to Chubb's shareholders or the investing public. This overview should be read in conjunction with the other sections of Management's Discussion and Analysis of Financial Condition and Results of Operations.
| • | Net income was $2.1 billion in 2014, $2.3 billion in 2013 and $1.5 billion in 2012. The lower net income in 2014 compared with 2013 was due to lower operating income, which we define as net income excluding realized investment gains and losses after tax. The higher net income in 2013 compared with 2012 was due to higher operating income and, to a lesser extent, higher net realized investment gains. |
| • | Operating income was $1.9 billion in 2014, $2.1 billion in 2013 and $1.4 billion in 2012. The lower operating income in 2014 compared with 2013 was due primarily to lower underwriting income in our property and casualty insurance business and, to a lesser extent, a decrease in property and casualty investment income. The higher operating income in 2013 compared with 2012 was due to substantially higher underwriting income in our property and casualty insurance business, offset in part by a decrease in property and casualty investment income. Management uses operating income, a non-GAAP financial measure, among other measures, to evaluate its performance because the realization of investment gains and losses in any period could be discretionary as to timing and can fluctuate significantly, which could distort the analysis of operating trends. |
| • | Underwriting results were profitable in each of the past three years, but less so in 2012. The combined loss and expense ratio was 88.3% in 2014, 86.1% in 2013 and 95.3% in 2012. The 2.2 percentage point increase in the combined loss and expense ratio in 2014 compared with 2013 was due primarily to a higher current accident year loss ratio excluding catastrophes. The 9.2 percentage point decrease in the combined loss and expense ratio in 2013 compared with 2012 was due primarily to a substantially lower impact of catastrophes and a lower current accident year loss ratio excluding catastrophes. The impact of catastrophes accounted for 3.6 percentage points of the combined ratio in 2014 compared with 3.4 percentage points in 2013 and 9.6 percentage points in 2012. |
| • | During 2014, 2013 and 2012, we experienced overall favorable development of $636 million, $712 million and $614 million, respectively, on loss reserves established as of the previous year end. In each year we experienced favorable prior year loss development in each segment of our insurance business. |
33
| • | Total net premiums written increased by 3% in both 2014 and 2013. Total net premiums written excluding the effect of foreign currency translation increased by 4% in 2014 and 3% in 2013. Net premiums written in the United States increased by 4% in both 2014 and 2013. Net premiums written outside the United States decreased by 1% in 2014 and were flat in 2013, when measured in U.S. dollars. Excluding the effect of foreign currency translation, such premiums increased by 2% in both 2014 and 2013. Management uses growth in net premiums written excluding the effect of foreign currency translation, a non-GAAP financial measure, to evaluate the trends in net premiums written, exclusive of the effect of fluctuations in exchange rates between the U.S. dollar and the foreign currencies in which business is transacted. The impact of foreign currency translation is excluded as exchange rates may fluctuate significantly and the effect of fluctuations could distort the analysis of trends. When excluding the effect of foreign currency translation on growth, management uses the current period average exchange rates to translate both the current period and the prior period foreign currency denominated net premiums written amounts. |
| • | Property and casualty investment income before taxes decreased by 4% in 2014 compared with 2013 and decreased by 6% in 2013 compared with 2012. Property and casualty investment income after tax decreased by 4% in 2014 and 5% in 2013 compared with the respective prior year. The decreases were primarily due to a decline in the average yield on our investment portfolio. Management uses property and casualty investment income after tax, a non-GAAP financial measure, to evaluate its investment results because it reflects the impact of any change in the proportion of tax exempt investment income to total investment income and is therefore more meaningful for analysis purposes than investment income before income tax. |
| • | Net realized investment gains before tax were $369 million ($242 million after tax) in 2014 compared with $402 million ($261 million after tax) in 2013 and $193 million ($125 million after tax) in 2012. The net realized investment gains in 2014 were primarily related to investments in limited partnerships, sales of equity securities and, to a lesser extent, sales of fixed maturities. In 2013, net realized investment gains included the recognition of a gain in connection with the business combination of an issuer in which we held equity securities and warrants. The remaining net realized gains in 2013 were primarily related to investments in limited partnerships and sales of equity securities. The net realized gains in 2012 were primarily related to sales of fixed maturities and investments in limited partnerships. |
A summary of our consolidated net income is as follows:
| Years Ended December 31 | ||||||||||||
| 2014 | 2013 | 2012 | ||||||||||
| (in millions) | ||||||||||||
Property and casualty insurance | $ | 2,727 | $ | 3,072 | $ | 2,040 | ||||||
Corporate and other | (235 | ) | (237 | ) | (237 | ) | ||||||
|
|
|
|
|
| |||||||
Consolidated operating income before income tax | 2,492 | 2,835 | 1,803 | |||||||||
Federal and foreign income tax | 634 | 751 | 383 | |||||||||
|
|
|
|
|
| |||||||
Consolidated operating income | 1,858 | 2,084 | 1,420 | |||||||||
Realized investment gains after income tax | 242 | 261 | 125 | |||||||||
|
|
|
|
|
| |||||||
Consolidated net income | $ | 2,100 | $ | 2,345 | $ | 1,545 | ||||||
|
|
|
|
|
| |||||||
34
PROPERTY AND CASUALTY INSURANCE
A summary of the results of operations of our property and casualty insurance business is as follows:
| Years Ended December 31 | ||||||||||||
| 2014 | 2013 | 2012 | ||||||||||
| (in millions) | ||||||||||||
Underwriting | ||||||||||||
Net premiums written | $ | 12,592 | $ | 12,224 | $ | 11,870 | ||||||
Increase in unearned premiums | (264 | ) | (158 | ) | (32 | ) | ||||||
|
|
|
|
|
| |||||||
Premiums earned | 12,328 | 12,066 | 11,838 | |||||||||
|
|
|
|
|
| |||||||
Losses and loss expenses | 6,985 | 6,520 | 7,507 | |||||||||
Operating costs and expenses | 3,941 | 3,893 | 3,756 | |||||||||
Increase in deferred policy acquisition costs | (45 | ) | (59 | ) | (3 | ) | ||||||
Dividends to policyholders | 45 | 37 | 30 | |||||||||
|
|
|
|
|
| |||||||
Underwriting income | 1,402 | 1,675 | 548 | |||||||||
|
|
|
|
|
| |||||||
Investments | ||||||||||||
Investment income before expenses | 1,368 | 1,436 | 1,518 | |||||||||
Investment expenses | 39 | 45 | 36 | |||||||||
|
|
|
|
|
| |||||||
Investment income | 1,329 | 1,391 | 1,482 | |||||||||
|
|
|
|
|
| |||||||
Other income (charges) | (4 | ) | 6 | 10 | ||||||||
|
|
|
|
|
| |||||||
Property and casualty income before tax | $ | 2,727 | $ | 3,072 | $ | 2,040 | ||||||
|
|
|
|
|
| |||||||
Property and casualty investment income after tax | $ | 1,089 | $ | 1,138 | $ | 1,204 | ||||||
|
|
|
|
|
| |||||||
Property and casualty income before tax was lower in 2014 compared with 2013, due to lower underwriting income and, to a lesser extent, a decrease in investment income. The decrease in underwriting income in 2014 compared with 2013 was primarily attributable to a higher current accident year loss ratio excluding catastrophes. Property and casualty income before tax was higher in 2013 compared with 2012, due to substantially higher underwriting income, offset in part by a decline in investment income. The increase in underwriting income in 2013 was primarily attributable to a substantially lower impact of catastrophes and a lower current accident year loss ratio excluding catastrophes. The decrease in investment income in 2014 and 2013, compared with the respective prior year, was due to a decline in the average yield on our investment portfolio.
The profitability of our property and casualty insurance business depends on the results of both our underwriting and investment operations. We view these as two distinct operations since the underwriting functions are managed separately from the investment function. Accordingly, in assessing our performance, we evaluate underwriting results separately from investment results.
35
Underwriting Operations
Underwriting Results
We evaluate the underwriting results of our property and casualty insurance business in the aggregate and for each of our business units.
Net Premiums Written
Net premiums written were $12.6 billion in 2014, $12.2 billion in 2013 and $11.9 billion in 2012. Net premiums written by business unit were as follows:
| Years Ended December 31 | ||||||||||||||||||||
| 2014 | % Increase 2014 vs. 2013 | 2013 | % Increase 2013 vs. 2012 | 2012 | ||||||||||||||||
| (dollars in millions) | ||||||||||||||||||||
Personal insurance | $ | 4,508 | 4% | $ | 4,322 | 5% | $ | 4,125 | ||||||||||||
Commercial insurance | 5,402 | 2 | 5,273 | 2 | 5,174 | |||||||||||||||
Specialty insurance | 2,681 | 2 | 2,633 | 3 | 2,568 | |||||||||||||||
|
|
|
|
|
| |||||||||||||||
Total insurance | 12,591 | 3 | 12,228 | 3 | 11,867 | |||||||||||||||
Reinsurance assumed | 1 | * | (4 | ) | * | 3 | ||||||||||||||
|
|
|
|
|
| |||||||||||||||
Total | $ | 12,592 | 3 | $ | 12,224 | 3 | $ | 11,870 | ||||||||||||
|
|
|
|
|
| |||||||||||||||
| * | The change in net premiums written is not presented for this business unit since it is in runoff. |
Net premiums written increased by 3% in both 2014 and 2013 compared with the respective prior year as a result of growth in premiums written in the United States. Net premiums written excluding the effect of foreign currency translation increased by 4% in 2014 and 3% in 2013. Net premiums written in the United States, which in 2014 represented 76% of our total net premiums, increased by 4% in both 2014 and 2013 compared with the respective prior year. Net premiums written outside the United States decreased by 1% in 2014 and were flat in 2013, when measured in U.S. dollars. Excluding the effect of foreign currency translation, net premiums written outside the United States grew by 2% in both 2014 and 2013. In both 2014 and 2013, foreign currency translation had a negative effect on growth of net premiums written outside the United States, reflecting the impact of the stronger U.S. dollar relative to several currencies in which we wrote business in each year compared to the respective prior year.
The countries outside the United States that were significant contributors to net premiums written in each of the past three years were the United Kingdom, Canada, Brazil, Australia and Germany.
We classify business as written inside or outside the United States based on the location of the risks associated with the underlying policies. The method of determining location of risk varies by class of business. Location of risk for property classes is typically based on the physical location of the covered property, while location of risk for liability classes may be based on the main location of the insured, or in the case of the workers' compensation class, the primary work location of the covered employee.
Net premiums written in the United States grew in each segment of our insurance business in 2014, with the most significant growth occurring in our personal insurance segment. Net premiums written in the United States increased to a lesser extent in our commercial insurance segment and our specialty insurance segment, of which the predominant component is our professional liability business. Growth in our personal insurance segment was attributable to higher rates upon renewal, higher insured exposures, strong retention of existing business, and new business. Growth in our commercial insurance segment and our professional liability business reflected renewal rate increases, increased retention of existing business, as well as new business.
Net premiums written in the United States also grew in each segment of our insurance business in 2013. The most significant growth occurred in our personal insurance segment. Growth in our personal insurance segment was attributable to higher rates upon renewal, higher insured exposures, strong
36
retention of existing business, and new business. Growth in our commercial insurance segment and our professional liability business, while reflecting higher rates and strong retention, was constrained by our underwriting actions and judicious approach to new business.
Average renewal rates in the United States in our personal insurance segment were up modestly in both 2014 and 2013 compared with expiring rates. The most significant rate increases in 2014 occurred in the homeowners and excess liability classes of business. In 2013, the most significant rate increases occurred in the homeowners class, although rate increases also occurred in the excess liability and automobile classes. The amounts of coverage purchased or the insured exposures, both of which are bases on which we calculate the premiums we charge, were up modestly in the United States in both years. The level of new business in the United States in our personal insurance segment was up in both 2014 and 2013 compared with the respective prior year, but more so in 2013. We continued to retain a high percentage of our customers in both years.
Average renewal rates in 2014 and 2013 in the United States were up in both our commercial insurance segment and professional liability business compared with expiring rates, but more significantly in 2013. The amounts of coverage purchased or the insured exposures were down slightly in the United States in both of these components of our business in both 2014 and 2013 compared with the respective prior year. We continued to retain a high percentage of our existing commercial insurance and professional liability business in the United States in both years. Renewal retention levels in our commercial insurance segment were modestly higher in 2014 compared with those in 2013, which were similar to the levels in 2012. Renewal retention levels in our professional liability business were modestly higher in 2014 compared with 2013, which in turn were slightly higher than those in 2012. As portions of our business have approached rate adequacy due to pricing and underwriting actions over the past several years, the level of rate increases has moderated and we have achieved higher retention levels. The level of new business was up significantly in our commercial insurance segment in 2014 after declining slightly in 2013 compared with the respective prior year. New business in our professional liability business increased in 2014 compared with 2013, which in turn was higher than 2012.
The decrease in net premiums written outside the United States in 2014 compared with 2013 reflected a modest decrease in our personal insurance segment and a slight decrease in our specialty insurance segment, which were partially offset by a modest increase in our commercial insurance segment. Net premiums written outside the United States excluding the effect of foreign currency translation increased by 2% in 2014, with growth occurring in our commercial insurance segment and, to a lesser extent, in our personal insurance segment.
Net premiums written outside the United States were flat in 2013, as modest growth in our specialty insurance segment was offset by a slight decrease in our personal insurance segment, due to the negative effect of foreign currency translation. Net premiums written in our commercial insurance segment were flat. Net premiums written outside the United States excluding the effect of foreign currency translation increased by 2% in 2013, with modest growth occurring in our personal and specialty insurance segments and slight growth occurring in our commercial insurance segment.
Average renewal rates in our personal insurance segment outside the United States were modestly higher in both 2014 and 2013 compared with expiring rates.
Average renewal rates outside the United States were up slightly in our commercial insurance segment in both 2014 and 2013 compared with expiring rates. In our professional liability business, such rates were flat in 2014 and up slightly in 2013 compared with expiring rates. The amounts of coverage purchased or the insured exposures were down slightly in 2014 and down modestly in 2013 in both our commercial insurance segment and professional liability business compared with the respective prior year. We continued to retain a high percentage of our existing commercial and professional liability business in both years. Retention levels in 2014 compared with 2013 increased modestly in our commercial insurance segment and were similar in our professional liability business. Retention levels in 2013 compared with 2012 were similar in our commercial insurance segment, but increased modestly in our professional liability business. The level of new business in 2014 compared to 2013 was up in both
37
our commercial insurance segment and professional liability business, but more so in our commercial insurance segment. The level of new business in 2013 compared with 2012 was up slightly in our commercial insurance segment, but down in our professional liability business.
Our reinsurance assumed business has been in runoff since its sale in 2005. In our insurance business, most of our premiums written relate to insurance policies that are issued on a direct basis to our personal, commercial and specialty insurance customers, but we do opportunistically participate in the business of other insurance carriers for some lines of business. The business that is assumed from other insurance carriers is included in our insurance operations within the personal, commercial and specialty insurance segment results. Information regarding the amount of premiums written on a direct and assumed basis is presented in Note (8) of the Notes to Consolidated Financial Statements.
For several years, a positive pricing environment for most of our commercial and professional liability insurance products sold in the United States has supported our efforts to increase rates in order to maintain or improve profitability in these classes of business. We expect positive pricing to continue into 2015 in the United States. However, we expect that the average rate increases we achieve in 2015 in our commercial and professional liability classes will be at lower levels than the rate increases we achieved in 2014. Portions of our business have approached rate adequacy and the competitive market for these products is expected to continue to exert downward pressure on rates. In our personal insurance business in the United States we also expect rates to increase overall in 2015, but at lower levels than those achieved in 2014. Outside the United States, weak economic conditions have placed downward pressure on the pricing environment for several years. We expect that the overall rate environment outside the United States will be similar in 2015 compared to 2014 with rates remaining near flat. During 2014, the U.S. dollar strengthened against the currencies used in many locations outside the United States in which we transact business. The effect of a stronger U.S. dollar in 2015 compared to 2014 could result in lower premiums written when foreign currency denominated premium amounts are expressed in U.S. currency. We expect that our overall net premiums written in 2015 will be slightly to modestly higher compared with 2014, assuming average foreign currency to U.S. dollar exchange rates in 2015 remain similar to 2014 year-end levels.
Ceded Reinsurance
Our premiums written are net of amounts ceded to reinsurers who assume a portion of the risk under the insurance policies we write that are subject to reinsurance. Most of our ceded reinsurance arrangements consist of excess of loss and catastrophe contracts that protect against a specified part or all of certain types of losses over stipulated amounts arising from any one occurrence or event. Therefore, unless we incur losses that exceed our initial retention under these contracts, we do not receive any loss recoveries. As a result, in some years, we cede premiums to reinsurers and receive few, if any, loss recoveries related to these contracts. However, in a year in which there is a significant catastrophic event, such as Storm Sandy in 2012, or a series of large individual losses, we may receive substantial loss recoveries. The impact of ceded reinsurance on net premiums written and net premiums earned and on net losses and loss expenses incurred for the three years ended December 31, 2014 is presented in Note (8) of the Notes to Consolidated Financial Statements.
The most significant component of our ceded reinsurance program is property reinsurance. We purchase two main types of property reinsurance: catastrophe and property per risk.
For property risks in the United States and Canada we purchase traditional catastrophe reinsurance, including our primary treaty, which we refer to as the North American catastrophe treaty, as well as supplemental catastrophe reinsurance that provides additional coverage for our exposures in the northeast United States. For certain exposures in the United States, we have also arranged for the purchase of multi-year, collateralized reinsurance funded through the issuance of collateralized risk-linked securities, known as catastrophe bonds. For events outside the United States, we also purchase traditional catastrophe reinsurance.
The North American catastrophe treaty has an initial retention of $500 million and provides coverage for exposures in the United States and Canada of approximately 34% of losses (net of
38
recoveries from other available reinsurance) between $500 million and $900 million and approximately 75% of losses (net of recoveries from other available reinsurance) between $900 million and $1.75 billion. For certain catastrophic events in the northeast United States or along the southern U.S. coastline, the combination of the North American catastrophe treaty, supplemental catastrophe reinsurance and/or the catastrophe bond arrangements provide additional coverages as discussed below.
The catastrophe bond arrangements provide reinsurance coverage for specific types of losses in specific geographic locations. They are generally designed to supplement coverage provided under the North American catastrophe treaty. A $225 million catastrophe bond arrangement that we had in place expired in March 2014. We currently have three catastrophe bond arrangements in effect that expire between 2015 and 2018. We have a $250 million reinsurance arrangement that expires in March 2015 and a $270 million reinsurance arrangement that incepted in March 2014 and expires in March 2018. Both of these catastrophe bond arrangements provide coverage for our exposure to homeowners and commercial losses related to certain perils, including hurricanes, earthquakes, severe thunderstorms and winter storms in twelve states in the northeast United States and the District of Columbia. The $270 million reinsurance arrangement provides similar coverage for named storms in addition to hurricanes. We also have a $150 million reinsurance arrangement that expires in March 2016 that provides coverage for our exposure to homeowners-related hurricane and severe thunderstorm losses in eight states along the southern U.S. coastline.
For the indicated catastrophic events in the northeast United States, the combination of the North American catastrophe treaty, the supplemental catastrophe reinsurance, and the $250 million and $270 million catastrophe bond arrangements provides additional coverage of approximately 63% of losses (net of recoveries from other available reinsurance) between $1.75 billion and $3.65 billion.
For hurricane and severe thunderstorm events along the southern U.S. coastline, the $150 million catastrophe bond arrangement provides additional coverage of approximately 50% of homeowners-related hurricane and severe thunderstorm losses (net of recoveries from other available reinsurance) between $855 million and $1.15 billion.
For hurricane events in Florida, in addition to the coverage provided by the North American catastrophe treaty and the $150 million catastrophe bond arrangement discussed above, we have reinsurance from the Florida Hurricane Catastrophe Fund, which is a state-mandated fund designed to reimburse insurers for a portion of their residential catastrophic hurricane losses. Our participation in this program, for which the most recent annual period began on June 1, 2014, provides coverage of 90% of homeowners-related hurricane losses in Florida in excess of our initial retention of $160 million per event. Under the terms of the program, our aggregate recoveries during the annual coverage period are limited to approximately $380 million, based on our current level of participation.
Our primary property catastrophe treaty for events outside the United States, including Canada, provides coverage of approximately 75% of losses (net of recoveries from other available reinsurance) between $100 million and $350 million. For catastrophic events in Australia and Canada, additional reinsurance provides coverage of 80% of losses (net of recoveries from other available reinsurance) between $350 million and $475 million.
Our commercial property per risk treaty provides coverage for property exposures both inside and outside the United States. Depending upon the currency in which the covered insurance policy was issued, the treaty provides coverage per risk of approximately $510 million to $750 million in excess of our initial retention, which is generally between $20 million and $30 million.
In addition to our major property catastrophe and property per risk treaties, we purchase several smaller property treaties that only provide coverage for specific classes of business or locations having concentrations of risk.
Recoveries under our property reinsurance treaties are subject to certain coinsurance requirements that affect the interaction of some elements of our reinsurance program.
39
Our property reinsurance treaties generally contain terrorism exclusions for acts perpetrated by foreign terrorists, and for nuclear, biological, chemical and radiological loss causes whether such acts are perpetrated by foreign or domestic terrorists.
As a result of lower renewal rates compared to expiring rates associated with the North American catastrophe treaty, the primary property catastrophe treaty that covers events outside the United States, the commercial property per risk treaty and the supplemental catastrophe reinsurance, as well as the lower rates associated with the $270 million catastrophe bond compared to those of the expiring bond, the overall cost of our property reinsurance program was lower in 2014 than in 2013. We do not expect the changes we made to our property reinsurance program during 2014 to have a material effect on the Corporation's results of operations, financial condition or liquidity.
Our major, traditional property reinsurance treaties expire on April 1, 2015. We expect that the property reinsurance treaty market will remain competitive with respect to price as well as terms and conditions. The final structure of our reinsurance program and amount of coverage purchased, including the mixture of traditional catastrophe reinsurance and collateralized reinsurance coverage funded through the issuance of collateralized risk linked securities, is still being determined and will affect our total reinsurance costs in 2015.
Profitability
The combined loss and expense ratio (or combined ratio), expressed as a percentage, is the key measure of underwriting profitability traditionally used in the property and casualty insurance business. Management evaluates the performance of our underwriting operations and of each of our business units using, among other measures, the combined loss and expense ratio calculated in accordance with U.S. statutory accounting principles. It is the sum of the ratio of losses and loss expenses to premiums earned (loss ratio) and the ratio of statutory underwriting expenses to premiums written (expense ratio) after reducing both premium amounts by dividends to policyholders. When the combined ratio is under 100%, underwriting results are generally considered profitable; when the combined ratio is over 100%, underwriting results are generally considered unprofitable.
Statutory accounting principles applicable to U.S. property and casualty insurance companies differ in certain respects from generally accepted accounting principles in the United States (GAAP). Under statutory accounting principles, policy acquisition and other underwriting expenses are recognized immediately, not at the time premiums are earned. Management uses underwriting results determined in accordance with GAAP, among other measures, to assess the overall performance of our underwriting operations. To convert statutory underwriting results to a GAAP basis, certain policy acquisition expenses are deferred and amortized over the period in which the related premiums are earned. Underwriting income determined in accordance with GAAP is defined as premiums earned less losses and loss expenses incurred and GAAP underwriting expenses incurred.
An accident year is the calendar year in which a loss is incurred or, in the case of claims-made policies, the calendar year in which a loss is reported. The total losses and loss expenses incurred for a particular calendar year include current accident year losses and loss expenses as well as any increases or decreases to our estimates of losses and loss expenses that occurred in all prior accident years, which we refer to as prior year loss development.
Underwriting results for our property and casualty insurance business were profitable in each of the past three years, but less so in 2012. The combined loss and expense ratio was as follows:
| Years Ended December 31 | ||||||||||||
| 2014 | 2013 | 2012 | ||||||||||
Loss ratio | 56.9 | % | 54.2 | % | 63.6 | % | ||||||
Expense ratio | 31.4 | 31.9 | 31.7 | |||||||||
|
|
|
|
|
| |||||||
Combined loss and expense ratio | 88.3 | % | 86.1 | % | 95.3 | % | ||||||
|
|
|
|
|
| |||||||
40
The 2.7 percentage point increase in the loss ratio in 2014 compared with 2013 was due primarily to a higher current accident year loss ratio excluding catastrophes. The current accident year loss ratio excluding catastrophes was modestly higher in 2014 in our personal insurance segment, slightly higher in our commercial insurance segment and similar in our specialty insurance segment compared to 2013. The 9.4 percentage point decrease in the loss ratio in 2013 compared with 2012 was due primarily to a substantially lower impact of catastrophes and a lower current accident year loss ratio excluding catastrophes. The current accident year loss ratio excluding catastrophes was lower in 2013 for each of our insurance segments compared to 2012.
While the loss ratio in each of the past three years included an impact from catastrophes, which was particularly significant in 2012, it also reflected favorable loss experience excluding catastrophes that we believe resulted from our disciplined underwriting in recent years. The loss ratio in each of the past three years also benefited from relatively moderate loss trends and the positive impact of rate increases on premiums earned in most classes of business. Results in all three years also benefited from favorable prior year loss development. For more information on prior year loss development, see "Property and Casualty Insurance - Loss Reserves, Prior Year Loss Development ."
Our underwriting profitability in any given period will be affected by the impact of catastrophes in that period. We define a catastrophe as an event that is estimated to cause $25 million or more in industry-wide insured property losses and affects a significant number of policyholders and insurers.
The net impact of catastrophes in 2014 was $444 million, which represented 3.6 percentage points of the combined ratio. Most of the catastrophe losses in 2014 related to weather-related events in the United States, including a severe winter freeze event that affected a widespread area of the United States. In 2013, the net impact of catastrophes was $412 million, which represented 3.4 percentage points of the combined ratio. A significant portion of the catastrophe losses in 2013 related to flooding in Alberta, Canada, as well as several severe storms in the central United States and flooding in Ontario, Canada. In 2012, the net impact of catastrophes was $1.1 billion, which represented 9.6 percentage points of the combined ratio. We incurred just under $1.1 billion of catastrophe losses and $53 million of related reinsurance reinstatement premium costs. Most of the impact of catastrophes in 2012 was due to Storm Sandy, but there were also catastrophe losses related to other events, including several severe hail and wind storms in the United States.
The impact of catastrophes, including losses and any related reinsurance reinstatement premiums, for individually significant events and all other events was as follows:
Years Ended December 31 | Impact of Catastrophes | |||
| (in millions) | ||||
2014 | ||||
Winter freeze - 17 states in the United States | $ | 117 | ||
Other events | 327 | |||
|
| |||
Total | $ | 444 | ||
|
| |||
2013 | ||||
Flooding - Alberta, Canada | $ | 85 | ||
Other events | 327 | |||
|
| |||
Total | $ | 412 | ||
|
| |||
2012 | ||||
Storm Sandy - U.S. Northeast and Southern Atlantic states | $ | 882 | ||
Other events | 258 | |||
|
| |||
Total | $ | 1,140 | ||
|
| |||
The net impact of catastrophes in 2014 reflected $11 million of unfavorable prior year loss development. This compares with $24 million and $37 million of favorable prior year loss development in 2013 and 2012, respectively.
41
At the end of 2012, we estimated that net losses from Storm Sandy were $829 million and our reinsurance reinstatement premium costs related to the storm were $53 million. Our estimated gross losses from Storm Sandy were about $1.1 billion, with almost all of the losses from property claims, both commercial and homeowners, and only a modest impact from automobile and other claims. Our net losses of $829 million were lower than the gross amount due primarily to our traditional property catastrophe treaty and, to a much lesser extent, per risk and quota share reinsurance treaties as well as facultative reinsurance placed on an individual risk basis. At December 31, 2014, only a small percentage of our claims related to Storm Sandy remained unsettled. Our overall estimate of net losses related to Storm Sandy did not change significantly during 2013 or 2014. We do not expect that any change to our estimate of ultimate net losses related to Storm Sandy in the future would have a material effect on the Corporation's consolidated financial condition or liquidity.
The only reinsurance recoverable we had from our primary catastrophe reinsurance treaties during the three year period ended December 31, 2014 was that related to Storm Sandy because there was no other individual catastrophe event for which our losses exceeded our initial retention under the treaties.
The expense ratio decreased by 0.5 of a percentage point in 2014 compared with 2013, due primarily to growth in net premiums written and a slight decrease in overhead expenses, offset in part by a slight increase in commission expense. The expense ratio increased by 0.2 of a percentage point in 2013 compared with 2012.
Review of Underwriting Results by Business Unit
Personal Insurance
Net premiums written in our personal insurance segment, which represented 36% of our net premiums written in 2014, increased by 4% in 2014 and 5% in 2013 compared with the respective prior year. Net premiums written for the classes of business within the personal insurance segment were as follows:
| Years Ended December 31 | ||||||||||||||||||||
| 2014 | % Increase 2014 vs. 2013 | 2013 | % Increase 2013 vs. 2012 | 2012 | ||||||||||||||||
| (dollars in millions) | ||||||||||||||||||||
Automobile | $ | 740 | 1% | $ | 731 | 6% | $ | 691 | ||||||||||||
Homeowners | 2,765 | 4 | 2,662 | 4 | 2,554 | |||||||||||||||
Other | 1,003 | 8 | 929 | 6 | 880 | |||||||||||||||
|
|
|
|
|
| |||||||||||||||
Total personal | $ | 4,508 | 4 | $ | 4,322 | 5 | $ | 4,125 | ||||||||||||
|
|
|
|
|
| |||||||||||||||
Growth in net premiums written in our personal insurance segment in both 2014 and 2013 compared with the respective prior year occurred in all classes of this business, driven by growth in the United States. Net premiums written outside the United States decreased modestly in 2014 and slightly in 2013, due to the negative effect of foreign currency translation. The overall growth in our personal insurance segment in both years was attributable to higher rates upon renewal, higher insured exposures, strong retention of existing business, and new business.
Personal automobile net premiums written increased in both 2014 and 2013 compared with the respective prior year, but more so in 2013, driven in both years by growth in the United States. Growth in the United States in both years was attributable to higher average renewal rates, existing personal lines customers adding automobile coverage and new customers. Personal automobile net premiums written outside the United States decreased in 2014 and grew modestly in 2013 compared with the respective prior year. In both years, premium growth reflected the negative effect of foreign currency translation. Approximately 40% of our personal automobile net premiums written in 2014 were written outside the United States, with more than half of such premiums written in Brazil. Net premiums written for our homeowners business increased in 2014 and 2013 compared with the respective prior year, driven by growth in the United States. Net premiums written outside the United States for our homeowners business decreased slightly in 2014 and decreased modestly in 2013 compared with the
42
respective prior year, reflecting the negative effect of foreign currency translation. Growth both inside and outside the United States in both years reflected higher renewal rates as well as increases in coverage on existing policies. Premiums for our other personal business, which includes accident and health, excess liability and yacht coverages, increased in 2014 and 2013 compared with the respective prior year, driven by growth in the accident and health and the excess liability components of this business. Growth in our accident and health business was higher in 2014 than in 2013. In both years, premiums for our accident and health business increased significantly in the United States, due primarily to new business, but decreased outside the United States. In our excess liability business, which is predominantly written in the United States, growth was also higher in 2014 than in 2013.
Our personal insurance segment produced profitable underwriting results in each of the past three years. The combined loss and expense ratios for the classes of business within the personal insurance segment were as follows:
| Years Ended December 31 | ||||||||||||
| 2014 | 2013 | 2012 | ||||||||||
Automobile | 96.8 | % | 94.8 | % | 93.4 | % | ||||||
Homeowners | 88.3 | 82.3 | 94.2 | |||||||||
Other | 94.0 | 94.8 | 95.6 | |||||||||
Total personal | 90.9 | 87.0 | 94.4 | |||||||||
The 3.9 percentage point increase in the combined loss and expense ratio for our personal insurance segment in 2014 compared with 2013 was driven mainly by deterioration in the results in our homeowners business, due to a higher impact of fire losses and non-catastrophe weather-related losses. The 7.4 percentage point decrease in the combined loss and expense ratio in 2013 compared with 2012 was due to better results in our homeowners business, driven primarily by a lower impact of catastrophes. The impact of catastrophes accounted for 5.5 percentage points of the combined loss and expense ratio for our personal insurance segment in 2014, compared with 7.2 percentage points in 2013 and 13.7 percentage points in 2012. A significant portion of the catastrophe losses in 2014 related to weather-related events in the United States, including the severe winter freeze event. A significant portion of the catastrophe losses in 2013 related to water damage associated with flooding in Alberta and Ontario, Canada as well as several severe storms in the central United States. Most of the catastrophe losses in 2012 related to storms in the United States, particularly Storm Sandy.
Our personal automobile results were profitable in each of the past three years, although less so in each successive year. The 2.0 percentage point increase in the combined ratio in 2014 compared with 2013 was driven mainly by less profitable results in the United States. The 1.4 percentage point increase in the combined ratio in 2013 compared with 2012 was driven by less profitable results outside the United States. Results in all three years benefited from moderate claim frequency and favorable prior year loss development, although favorable prior year loss development was less significant in 2014.
Homeowners results were profitable in each of the past three years. The combined ratio was 6.0 percentage points higher in 2014 compared with 2013, which in turn was 11.9 percentage points lower compared with 2012. The higher combined ratio in 2014 compared with 2013 was due primarily to a higher current accident year loss ratio excluding catastrophes, driven by an increase in fire losses and non-catastrophe weather-related losses. The lower combined ratio in 2013 compared with 2012 was due in large part to a lower impact from catastrophes and, to a lesser extent, a lower current accident year loss ratio excluding catastrophes. The impact of catastrophes accounted for 8.9 percentage points of the combined loss and expense ratio for this class in 2014 compared with 11.5 percentage points in 2013 and 21.0 percentage points in 2012.
Our other personal business produced profitable results in each of the past three years, slightly more so in each successive year. The combined ratio was 0.8 of a percentage point lower in both 2014 and 2013 compared with the respective prior year. The lower combined ratio in both 2014 and 2013 was driven by better results in the excess liability and yacht components of this business, offset in part in 2014 by less profitable results in the accident and health component. Results for the excess liability component of this business were profitable in all three years, more so in each successive year. Results
43
for this component of our other personal business benefited from favorable prior year loss development in each year, partly as a result of better than expected claim severity. The accident and health component of our other personal business produced slightly unprofitable results in 2014 compared with slightly profitable results in 2013 and 2012. The yacht component of this business was highly profitable in each of the past three years, but more so in 2014.
Commercial Insurance
Net premiums written in our commercial insurance segment, which represented 43% of our net premiums written in 2014, increased by 2% in both 2014 and 2013 compared with the respective prior year. Net premiums written for the classes of business within the commercial insurance segment were as follows:
| Years Ended December 31 | ||||||||||||||||||||
| 2014 | % Increase 2014 vs. 2013 | 2013 | % Increase (Decrease) 2013 vs. 2012 | 2012 | ||||||||||||||||
| (dollars in millions) | ||||||||||||||||||||
Multiple peril | $ | 1,121 | 1% | $ | 1,113 | (1)% | $ | 1,119 | ||||||||||||
Casualty | 1,644 | 1 | 1,635 | - | 1,641 | |||||||||||||||
Workers' compensation. | 1,158 | 6 | 1,091 | 8 | 1,014 | |||||||||||||||
Property and marine | 1,479 | 3 | 1,434 | 2 | 1,400 | |||||||||||||||
|
|
|
|
|
| |||||||||||||||
Total commercial | $ | 5,402 | 2 | $ | 5,273 | 2 | $ | 5,174 | ||||||||||||
|
|
|
|
|
| |||||||||||||||
Growth in net premiums written in our commercial insurance segment in 2014 occurred both inside and outside the United States, while in 2013 growth was driven by an increase in net premiums written in the United States. Net premiums written outside the United States were flat in 2013 compared with 2012. Premium growth in our commercial insurance segment in both years reflected higher rates, particularly in the United States. Premium growth in 2014 also reflected an increase in new business. In both 2014 and 2013, premium growth in our commercial insurance segment was constrained by lower renewal exposure and our continued efforts to secure adequate rates on renewal business in a market that remained competitive. In 2013, premium growth in most classes of business was also limited by a market that offered only limited attractive new business opportunities. In both 2014 and 2013, the most significant growth occurred in the workers' compensation class, reflecting high retention, new business, as well as renewal rate increases. During each of the past three years, the overall rate environment in the commercial insurance market in the United States was positive. Average renewal rates in the United States were up in both 2014 and 2013 compared with expiring rates, but the level of increase was lower in 2014 than in 2013. Increases occurred in both years in all major classes of this business. Average renewal rates outside the United States also increased compared with expiring rates in both 2014 and 2013, but the level of increase was lower than the level achieved in the United States. Retention levels of our existing policyholders both inside and outside the United States were strong in each of the past three years. The average renewal exposure was down slightly in both 2014 and 2013, both inside and outside the United States. The amount of new business increased significantly in 2014 compared with 2013, both inside and outside the United States, as a result of more opportunities to write new business at appropriate rates. The amount of new business decreased slightly in 2013 compared with 2012 in the United States, due to our focus on obtaining adequate rates in the competitive market, but increased slightly outside the United States.
44
Our commercial insurance segment produced profitable underwriting results in each of the past three years, but less so in 2012. The combined loss and expense ratios for the classes of business within the commercial insurance segment were as follows:
| Years Ended December 31 | ||||||||||||
| 2014 | 2013 | 2012 | ||||||||||
Multiple peril | 87.6 | % | 83.3 | % | 93.7 | % | ||||||
Casualty | 92.5 | 97.3 | 92.1 | |||||||||
Workers' compensation | 83.1 | 89.6 | 93.7 | |||||||||
Property and marine | 94.0 | 74.6 | 115.0 | |||||||||
Total commercial | 89.9 | 86.5 | 99.0 | |||||||||
The 3.4 percentage point increase in the combined loss and expense ratio for our commercial insurance segment in 2014 compared with 2013 was due to a higher impact of catastrophes, a lower amount of favorable prior year loss development as well as a higher current accident year loss ratio excluding catastrophes. The 12.5 percentage point decrease in the combined ratio in 2013 compared with 2012 was due in large part to a lower impact of catastrophes and, to a lesser extent, a lower current accident year loss ratio excluding catastrophes and a higher amount of favorable prior year loss development. The impact of catastrophes accounted for 3.8 percentage points of the combined loss and expense ratio for our commercial insurance segment in 2014, compared with 2.1 percentage points in 2013 and 11.4 percentage points in 2012.
Multiple peril results were profitable in each of the past three years, but more so in 2014 and 2013. The 4.3 percentage point increase in the combined ratio in 2014 compared with 2013 was due to less profitable results in the property component of this business, reflecting a higher loss ratio excluding catastrophes. The 10.4 percentage point decrease in the combined ratio in 2013 compared with 2012 was due primarily to a lower impact of catastrophes in the property component of this business. Results for the liability component were profitable in each of the past three years, benefiting in each year from favorable prior year loss development. The impact of catastrophes accounted for 4.9 percentage points of the combined loss and expense ratio for the multiple peril class in 2014 compared with 3.3 percentage points in 2013 and 10.9 percentage points in 2012.
Casualty results were profitable in each of the past three years, but less so in 2013. The 4.8 percentage point decrease in the combined ratio in 2014 compared with 2013 was due primarily to better results in the primary liability component of this business. The 5.2 percentage point increase in the combined ratio in 2013 compared with 2012 was mainly due to less profitable results in the excess liability component and to a greater adverse impact from asbestos and toxic waste claims. Results for the automobile component of our casualty business were modestly unprofitable in 2014 compared with modestly profitable results in 2013 and near breakeven results in 2012. Results for the primary liability component of our casualty business were slightly profitable in 2014 compared with unprofitable results in 2013 and 2012, which were adversely affected by a higher number of large reported losses, many of which related to prior accident years. Results for the excess liability component were highly profitable in each of the past three years. Excess liability results in all three years, but more so in 2012, benefited from substantial favorable prior year loss development mainly driven by lower than expected claim severity. Results for our casualty business were adversely affected in each of the past three years by incurred losses related to asbestos and toxic waste claims. Our analysis of these exposures resulted in increases in the estimate of our ultimate liabilities. Such losses represented 6.0 percentage points of the combined ratio for our casualty business in 2014, 5.1 percentage points in 2013 and 3.4 percentage points in 2012.
Workers' compensation results were profitable in each of the past three years, more so in each successive year. The 6.5 and 4.1 percentage point decreases in the combined ratio in 2014 and 2013, respectively, compared with the respective prior year were due to increasingly better current accident year results and more favorable prior year loss development. Results in each year reflected improved pricing and our disciplined risk selection during the past several years.
45
Property and marine results were profitable in 2014 and 2013, but less so in 2014, compared with unprofitable results in 2012. The 19.4 percentage point increase in the combined ratio in 2014 compared with 2013 reflected a higher current accident year loss ratio excluding catastrophes, a lower amount of favorable prior year loss development and a higher impact of catastrophes. The 40.4 percentage point decrease in the combined ratio in 2013 compared with 2012 was primarily due to a significantly lower impact of catastrophes. The lower combined ratio in 2013 also reflected a lower current accident year loss ratio excluding catastrophes, partly due to improved pricing and a lower impact from large losses, as well as a significant amount of favorable prior year loss development. The impact of catastrophes accounted for 9.6 percentage points of the combined loss and expense ratio in 2014 compared with 4.3 percentage points in 2013 and 31.6 percentage points in 2012.
Specialty Insurance
Net premiums written in our specialty insurance segment, which represented 21% of our net premiums written in 2014, increased by 2% in 2014 and 3% in 2013 compared with the respective prior year. Net premiums written for the classes of business within the specialty insurance segment were as follows:
| Years Ended December 31 | ||||||||||||||||||||
| 2014 | %
Increase (Decrease) 2014 vs. 2013 | 2013 | % Increase 2013 vs. 2012 | 2012 | ||||||||||||||||
| (dollars in millions) | ||||||||||||||||||||
Professional liability | $ | 2,381 | 3 | % | $ | 2,319 | 2% | $ | 2,273 | |||||||||||
Surety | 300 | (4 | ) | 314 | 6 | 295 | ||||||||||||||
|
|
|
|
|
| |||||||||||||||
Total specialty | $ | 2,681 | 2 | $ | 2,633 | 3 | $ | 2,568 | ||||||||||||
|
|
|
|
|
| |||||||||||||||
The increase in net premiums written for our professional liability business in 2014 was driven by growth in the United States. Net premiums written outside the United States in our professional liability business decreased slightly in 2014, due to the negative effect of foreign currency translation. In 2013, net premiums written increased modestly both inside and outside the United States. Premium growth in both years included the modestly positive effect of our decision not to renew a reinsurance program, which expired July 1, 2013, that provided coverage for a portion of our professional liability business. Premium growth in our professional liability business in both years reflected our focus on profitability in the pricing of renewal policies and new business, in what has remained a competitive market place. Nevertheless, the overall rate environment was positive in both 2014 and 2013, particularly in the United States. Retention levels for this business remained strong. Retention levels in the United States were higher in 2014 compared with those in 2013 and 2012. Retention levels outside the United States were similar in 2014 and 2013 following a modest increase in 2013 compared to 2012. New business in the United States increased in both 2014 and 2013 compared with the respective prior year. New business outside the United States also increased in 2014 following a decline in 2013. The increase in new business in 2014 reflected opportunities to write suitably-priced business in select classes due to the positive pricing trends in the market over the past few years. Renewal retention levels and new business volume in 2013 and 2012 reflected the selective reduction of our exposure in some customer segments where rate levels were not attractive. Average renewal rates for our professional liability business in the United States were up in both 2014 and 2013 compared with expiring rates, but the level of increase was less in 2014 than in 2013. Rate increases occurred in most classes of this business in both years. Average renewal rates outside the United States were flat in 2014 and up slightly in 2013 compared with expiring rates. The amounts of insured exposures in the United States were down slightly in both 2014 and 2013 compared with the respective prior year. Such amounts outside the United States were down in both years, but more so in 2013.
46
Net premiums written for our surety business decreased in 2014 and increased in 2013 compared with the respective prior year. Premiums written in our surety business depend significantly on the extent to which our existing customers are awarded contracts to perform services. As a result, premium growth in our surety business can often vary from year to year. In 2014, net premiums written decreased both inside and outside the United States, reflecting a reduction in the volume of large premium transactions compared with 2013. Premiums written outside the United States in 2014 also reflected the negative effect of foreign currency translation. In 2013, net premiums written increased both inside and outside the United States. The growth in net premiums written outside the United States in 2013 was driven by growth in Latin America.
Our specialty insurance segment produced profitable underwriting results in each of the past three years, more so in each successive year. The combined loss and expense ratios for the classes of business within the specialty insurance segment were as follows:
| Years Ended December 31 | ||||||||||||
| 2014 | 2013 | 2012 | ||||||||||
Professional liability | 82.2 | % | 89.3 | % | 96.7 | % | ||||||
Surety | 67.3 | 47.2 | 51.4 | |||||||||
Total specialty | 80.5 | 84.3 | 91.3 | |||||||||
The 3.8 percentage point decrease in the combined loss and expense ratio for our specialty insurance segment in 2014 and the 7.0 percentage point decrease in 2013, compared with the respective prior year, were both driven mainly by more profitable results in our professional liability business.
Our professional liability business produced profitable results in each of the past three years, more so in each successive year. The combined loss and expense ratio for this business decreased by 7.1 and 7.4 percentage points in 2014 and 2013, respectively, compared to the respective prior year. The lower combined ratio in 2014 compared with 2013 was due to a higher amount of favorable prior year loss development and, to a lesser extent, a lower current accident year combined ratio. The lower combined ratio in 2013 compared with 2012 was due to a lower current accident year combined ratio and, to a lesser extent, a higher amount of favorable prior year loss development. The lower current accident year combined ratio in 2014 and 2013 compared with the respective prior year reflected both higher premium rates and positive underwriting actions taken to improve the profitability of this business. The current accident year combined ratio in 2012 reflected adverse loss trends in certain classes within this component of our business. The favorable prior year loss development over the past three years was driven by positive loss experience, primarily related to accident years 2010 and prior. The fiduciary liability class produced highly profitable results in each of the past three years. Results for the directors and officers liability class were also highly profitable in all three years, more so in each successive year. Results for both the fiduciary liability and directors and officers liability classes reflected favorable prior year loss development in each of the past three years. For the fidelity class, results were profitable in 2014, breakeven in 2013 and unprofitable in 2012. Results for this class include loss activity resulting from alleged third party and insured-employee criminal activity, which included several large losses in recent years. Results for the employment practices liability class were unprofitable in each of the past three years, but much less so in 2014. Results in 2013 and 2012 were adversely impacted by unfavorable prior year loss development. Employment practices liability claims have been more numerous and protracted in recent years due primarily to the lingering effect of the economic downturn and resulting unemployment levels. Our errors and omissions liability class produced unprofitable results in each of the past three years, but much less so in 2014. Results in 2013 and 2012 reflected unfavorable prior year loss development, mostly outside the United States.
Our surety business produced profitable results in each of the past three years due to favorable loss experience. The combined loss and expense ratio was 20.1 percentage points higher in 2014 compared with 2013, which in turn was 4.2 percentage points lower compared with 2012. The higher combined ratio in 2014 compared to 2013 and 2012 was due to one large loss outside the United States. Our surety business tends to be characterized by losses that are infrequent but have the potential to be highly severe. When losses occur, they are sometimes mitigated by recovery rights to the customer's assets, contract payments, collateral and bankruptcy recoveries.
47
The majority of our surety obligations are intended to be performance-based guarantees. We manage our exposure by individual account and by specific bond type. We have substantial commercial and construction surety exposure for current and prior customers, including exposures related to surety bonds issued on behalf of companies that have experienced deterioration in creditworthiness since we issued bonds to them. We therefore may experience an increase in filed claims and may incur high severity losses, especially in periods of weak economic conditions. Such losses would be recognized if and when claims are filed and determined to be valid, and could have a material adverse effect on the Corporation's results of operations.
Reinsurance Assumed
In 2005, we transferred our ongoing reinsurance assumed business and certain related assets, including renewal rights, to a reinsurance company. The reinsurer generally did not assume our reinsurance liabilities relating to reinsurance contracts incepting prior to December 31, 2005. We retained those liabilities and the related assets. For a transition period of about two years, the same reinsurer underwrote specific reinsurance business on our behalf. We retained a portion of this business and ceded the balance to the reinsurer.
Net premiums written in our runoff reinsurance assumed business were not significant during the past three years. Results for this business were breakeven in 2014 compared with profitable results in 2013 and 2012. The profitable results in 2013 and 2012 were due to favorable prior year loss development.
Catastrophe Risk Management
Our property and casualty subsidiaries have exposure to losses caused by natural perils such as hurricanes and other windstorms, earthquakes, severe winter weather and brush fires as well as from man-made catastrophic events such as terrorism. The frequency and severity of catastrophes are inherently unpredictable.
Natural Catastrophes
The extent of losses from a natural catastrophe is a function of both the total amount of insured exposure in an area affected by the event and the severity of the event. We regularly assess our concentrations of risk in natural catastrophe exposed areas globally and have strategies and underwriting standards to manage these exposures through individual risk selection, subject to regulatory constraints, and through the purchase of catastrophe reinsurance coverage. We use catastrophe modeling and a risk concentration management tool to monitor and control our accumulations of potential losses in natural catastrophe exposed areas in the United States, such as California and the gulf and east coasts, as well as in natural catastrophe exposed areas in other countries. The information provided by the catastrophe modeling and the risk concentration management tool has resulted in our non-renewing or reducing our exposure on some accounts and refraining from writing others.
Catastrophe modeling generally relies on multiple inputs based on experience, science, engineering and history, and the selection of those inputs requires a significant amount of judgment. The modeling results may also fail to account for risks that are outside the range of normal probability or are otherwise unforeseen. Because of this, actual results may differ materially from those derived from our modeling exercises.
We also continue to assess and explore how changes in catastrophe risk, including the potential impact of global climate change, may affect our ability to manage our exposure under the insurance policies we issue, as well as how laws and regulations intended to combat climate change may affect us.
Despite our efforts to manage our catastrophe exposure, the occurrence of one or more severe natural catastrophic events could have a material effect on the Corporation's results of operations, financial condition or liquidity.
48
Terrorism Risk and Legislation
The September 11, 2001 attack changed the way the property and casualty insurance industry views catastrophic risk. That tragic event demonstrated that numerous classes of business we write are subject to terrorism related catastrophic risks in addition to the catastrophic risks related to natural occurrences. This, together with the limited availability of terrorism reinsurance, required us to change how we identify and evaluate risk accumulations. We have licensed a terrorism model that provides loss estimates under numerous event scenarios.
Actual results may differ materially from those suggested by the model. The risk concentration management tool referred to above also enables us to identify locations and geographic areas that are exposed to risk accumulations. The information provided by the terrorism model and the risk concentration management tool has resulted in our non-renewing or reducing our exposure on some accounts, subject to regulatory constraints, and refraining from writing others.
The Terrorism Risk Insurance Act of 2002, as amended (TRIA), is a limited duration program under which the U.S. federal government shares the risk of loss arising from certain acts of terrorism with the insurance industry. In January 2015, the federal government amended and reauthorized TRIA through December 31, 2020. TRIA is applicable only to select lines of commercial business and excludes, among others, commercial automobile, surety and professional liability insurance, other than directors and officers liability. The program applies to both foreign and domestic acts of terrorism.
As a precondition to recovery under TRIA, insurance companies with direct commercial insurance exposure in the United States for TRIA lines of business are required to make insurance for covered acts of terrorism available under their policies. In the event of an act of terrorism, each insurer has a separate deductible that it must meet before federal assistance becomes available. The deductible is based on a percentage of direct U.S. premiums earned for the covered lines of business in the previous calendar year. For 2015, that deductible is 20% of direct premiums earned in 2014 for these lines of business. For losses above the deductible, the federal government will pay for 85% of covered losses, while the insurer retains 15%. Under the 2015 reauthorization, the insurer share of losses in excess of the deductible will increase by 1% each year, beginning in 2016, until it reaches 20% in 2020. There is a combined annual aggregate limit for the federal government and all insurers of $100 billion. If acts of terrorism result in covered losses exceeding the $100 billion annual limit, insurers are not liable for additional losses. While we expect the provisions of TRIA will mitigate our exposure in the event of a large-scale terrorist attack, our deductible is substantial, approximating $1.0 billion in 2015.
For certain classes of business, such as workers' compensation, terrorism coverage is mandatory. For those classes of business where it is not mandatory, policyholders may choose not to purchase terrorism coverage, which would, subject to other statutory or regulatory restrictions, reduce our exposure.
We also have exposure outside the United States to risk of loss from acts of terrorism. In some jurisdictions, we have access to government mechanisms that would mitigate our exposure.
We will continue to manage this type of catastrophic risk by monitoring terrorism risk aggregations. If TRIA is not extended beyond its current December 31, 2020 termination date and a robust reinsurance market for terrorism risks does not develop so we can continue to mitigate our exposure to a large scale terrorism attack, we may not renew or we may reduce our exposure on some policies in some locations and we may curtail new business writing in some major U.S. cities and other geographic areas where our exposure aggregations could become unacceptable. Given the unpredictability of potential targets, the frequency and severity of potential terrorist events, and notwithstanding the measures we have taken or may take to mitigate terrorism exposure as well as the programs that governmental entities provide, however limited, to cover some of that exposure, the occurrence of a terrorist event could have a material adverse effect on the Corporation's results of operations, financial condition or liquidity.
49
Loss Reserves
Unpaid losses and loss expenses, also referred to as loss reserves, are the largest liability of our property and casualty insurance subsidiaries.
Our loss reserves include case estimates for claims that have been reported and estimates for claims that have been incurred but not reported at the balance sheet date as well as estimates of the expenses associated with processing and settling all reported and unreported claims, less estimates of anticipated salvage and subrogation recoveries. Estimates are based upon past loss experience modified for current trends as well as prevailing economic, legal and social conditions. Our loss reserves are not discounted to present value.
We regularly review our loss reserves using a variety of actuarial techniques. We update the reserve estimates as historical loss experience develops, additional claims are reported and/or settled and new information becomes available. Any changes in estimates are reflected in operating results in the period in which the estimates are changed.
Incurred but not reported (IBNR) reserve estimates are generally calculated by first projecting the ultimate cost of all claims that have occurred and then subtracting reported losses and loss expenses. Reported losses include cumulative paid losses and loss expenses plus case reserves. The IBNR reserve includes a provision for claims that have occurred but have not yet been reported to us, some of which are not yet known to the insured, as well as a provision for future development on reported claims. A relatively large proportion of our net loss reserves, particularly for long tail liability classes, are reserves for IBNR losses. In fact, about 75% of our aggregate net loss reserves at December 31, 2014 were for IBNR losses.
Our gross case and IBNR loss reserves and related reinsurance recoverable by class of business were as follows:
| Gross Loss Reserves | Reinsurance Recoverable | Net Loss Reserves | ||||||||||||||||||
December 31, 2014 | Case | IBNR | Total | |||||||||||||||||
| (in millions) | ||||||||||||||||||||
Personal insurance | ||||||||||||||||||||
Automobile | $ | 260 | $ | 151 | $ | 411 | $ | 14 | $ | 397 | ||||||||||
Homeowners | 438 | 353 | 791 | 43 | 748 | |||||||||||||||
Other | 331 | 739 | 1,070 | 70 | 1,000 | |||||||||||||||
|
|
|
|
|
|
|
|
|
| |||||||||||
Total personal | 1,029 | 1,243 | 2,272 | 127 | 2,145 | |||||||||||||||
|
|
|
|
|
|
|
|
|
| |||||||||||
Commercial insurance | ||||||||||||||||||||
Multiple peril | 596 | 1,194 | 1,790 | 40 | 1,750 | |||||||||||||||
Casualty | 1,412 | 5,514 | 6,926 | 412 | 6,514 | |||||||||||||||
Workers' compensation | 1,116 | 2,091 | 3,207 | 289 | 2,918 | |||||||||||||||
Property and marine | 773 | 465 | 1,238 | 355 | 883 | |||||||||||||||
|
|
|
|
|
|
|
|
|
| |||||||||||
Total commercial | 3,897 | 9,264 | 13,161 | 1,096 | 12,065 | |||||||||||||||
|
|
|
|
|
|
|
|
|
| |||||||||||
Specialty insurance | ||||||||||||||||||||
Professional liability | 1,180 | 5,587 | 6,767 | 287 | 6,480 | |||||||||||||||
Surety | 18 | 62 | 80 | 5 | 75 | |||||||||||||||
|
|
|
|
|
|
|
|
|
| |||||||||||
Total specialty | 1,198 | 5,649 | 6,847 | 292 | 6,555 | |||||||||||||||
|
|
|
|
|
|
|
|
|
| |||||||||||
Total insurance | 6,124 | 16,156 | 22,280 | 1,515 | 20,765 | |||||||||||||||
Reinsurance assumed | 145 | 253 | 398 | 124 | 274 | |||||||||||||||
|
|
|
|
|
|
|
|
|
| |||||||||||
Total | $ | 6,269 | $ | 16,409 | $ | 22,678 | $ | 1,639 | $ | 21,039 | ||||||||||
|
|
|
|
|
|
|
|
|
| |||||||||||
50
| Gross Loss Reserves | Reinsurance Recoverable | Net Loss Reserves | ||||||||||||||||||
December 31, 2013 | Case | IBNR | Total | |||||||||||||||||
| (in millions) | ||||||||||||||||||||
Personal insurance | ||||||||||||||||||||
Automobile | $ | 265 | $ | 141 | $ | 406 | $ | 16 | $ | 390 | ||||||||||
Homeowners | 414 | 357 | 771 | 56 | 715 | |||||||||||||||
Other | 345 | 713 | 1,058 | 90 | 968 | |||||||||||||||
|
|
|
|
|
|
|
|
|
| |||||||||||
Total personal | 1,024 | 1,211 | 2,235 | 162 | 2,073 | |||||||||||||||
|
|
|
|
|
|
|
|
|
| |||||||||||
Commercial insurance | ||||||||||||||||||||
Multiple peril | 598 | 1,190 | 1,788 | 43 | 1,745 | |||||||||||||||
Casualty | 1,565 | 5,398 | 6,963 | 387 | 6,576 | |||||||||||||||
Workers' compensation | 1,023 | 2,047 | 3,070 | 277 | 2,793 | |||||||||||||||
Property and marine | 834 | 492 | 1,326 | 440 | 886 | |||||||||||||||
|
|
|
|
|
|
|
|
|
| |||||||||||
Total commercial | 4,020 | 9,127 | 13,147 | 1,147 | 12,000 | |||||||||||||||
|
|
|
|
|
|
|
|
|
| |||||||||||
Specialty insurance | ||||||||||||||||||||
Professional liability | 1,390 | 5,842 | 7,232 | 343 | 6,889 | |||||||||||||||
Surety | 19 | 56 | 75 | 4 | 71 | |||||||||||||||
|
|
|
|
|
|
|
|
|
| |||||||||||
Total specialty | 1,409 | 5,898 | 7,307 | 347 | 6,960 | |||||||||||||||
|
|
|
|
|
|
|
|
|
| |||||||||||
Total insurance | 6,453 | 16,236 | 22,689 | 1,656 | 21,033 | |||||||||||||||
Reinsurance assumed | 169 | 288 | 457 | 146 | 311 | |||||||||||||||
|
|
|
|
|
|
|
|
|
| |||||||||||
Total | $ | 6,622 | $ | 16,524 | $ | 23,146 | $ | 1,802 | $ | 21,344 | ||||||||||
|
|
|
|
|
|
|
|
|
| |||||||||||
Loss reserves, net of reinsurance recoverable, decreased by $305 million or 1% in 2014. Loss reserves related to our insurance business decreased by $268 million, including $260 million related to the effect of foreign currency translation, due to a stronger U.S. dollar relative to the currencies in which our loss reserves were held at December 31, 2014 compared with December 31, 2013, and $33 million related to catastrophe losses. Loss reserves related to our runoff reinsurance assumed business decreased by $37 million.
Total gross loss reserves related to our insurance business decreased by $409 million in 2014, driven by significant decreases in gross case and IBNR reserves in the professional liability classes reflecting paid claim activity, favorable prior year loss development and reduced exposures. A significant decrease in gross loss reserves also occurred in the property and marine class of business, driven mainly by a decrease in case reserves, due in large part to the continuing resolution and payment of claims related to Storm Sandy. The most significant increases in gross loss reserves occurred in the workers' compensation class, mainly due to increased exposures. Reinsurance recoverable related to our insurance business decreased by $141 million in 2014, with the largest decreases occurring in the property and marine class of business due in large part to recoveries received from reinsurers related to Storm Sandy, and in the professional liability classes of business, driven by recoveries from reinsurers.
In establishing the loss reserves of our property and casualty subsidiaries, we consider facts currently known and the present state of the law and coverage litigation. Based on all information currently available, we believe that the aggregate net loss reserves at December 31, 2014 were adequate to cover claims for losses that had occurred as of that date, including both those known to us and those yet to be reported. However, as described below, there are significant uncertainties inherent in the loss reserving process. It is therefore possible that management's estimate of the ultimate liability for losses that had occurred as of December 31, 2014 may change, which could have a material effect on the Corporation's results of operations and financial condition.
51
Estimates and Uncertainties
The process of establishing loss reserves is complex and imprecise as it must take into consideration many variables that are subject to the outcome of future events. As a result, informed subjective estimates and judgments as to our ultimate exposure to losses are an integral component of our loss reserving process.
Given the inherent complexity of the loss reserving process and the potential variability of the assumptions used, the actual emergence of losses could vary, perhaps substantially, from the estimate of losses included in our financial statements, particularly in those instances where settlements do not occur until well into the future. Our net loss reserves at December 31, 2014 were $21.0 billion. Therefore, a relatively small percentage change in the estimate of net loss reserves would have a material effect on the Corporation's results of operations.
Reserves Other than Those Relating to Asbestos and Toxic Waste Claims. Our loss reserves include amounts related to short tail and long tail classes of business. "Tail" refers to the time period between the occurrence of a loss and the settlement of the claim. The longer the time span between the incidence of a loss and the settlement of the claim, the more the ultimate settlement amount can vary.
Short tail classes consist principally of homeowners, commercial property and marine business. For these classes, claims are generally reported and settled shortly after the loss occurs and the claims usually relate to tangible property. Consequently, the estimation of loss reserves for these classes is less complex.
Most of our loss reserves relate to long tail liability classes of business. Long tail classes include directors and officers liability, errors and omissions liability and other professional liability coverages, commercial primary and excess liability, workers' compensation and other liability coverages. For many liability claims significant periods of time, ranging up to several years or even decades, may elapse between the occurrence of the loss, the reporting of the loss to us and the settlement of the claim. As a result, loss experience in the more recent accident years for the long tail liability classes has limited statistical credibility because a relatively small proportion of losses in these accident years are reported claims and an even smaller proportion are paid losses. An accident year is the calendar year in which a loss is incurred or, in the case of claims-made policies, the calendar year in which a loss is reported.
Liability claims are also more susceptible to litigation and can be significantly affected by changing contract interpretations and the legal and economic environment. Consequently, the estimation of loss reserves for these classes is more complex and typically subject to a higher degree of variability than for short tail classes. As a result, the role of judgment is much greater for these reserve estimates.
Most of our runoff reinsurance assumed business is long tail casualty reinsurance. Reserve estimates for this business are therefore subject to the variability caused by extended loss emergence periods. The estimation of loss reserves for this business is further complicated by delays between the time the claim is reported to the ceding insurer and when it is reported by the ceding insurer to us and by our dependence on the quality and consistency of the loss reporting by the ceding company.
Our actuaries perform a comprehensive review of loss reserves for each of the numerous classes of business we write at least once a year. The timing of such review varies by class of business and, for some classes, the jurisdiction in which the policy was written. The review process takes into consideration the variety of trends that impact the ultimate settlement of claims in each particular class of business. Additionally, each quarter our actuaries review the emergence of paid and reported losses relative to expectations and, as necessary, conduct reserve reviews for particular classes of business.
The loss reserve estimation process relies on the basic assumption that past experience, adjusted for the effects of current developments and likely trends, is an appropriate basis for predicting future outcomes. As part of that process, our actuaries use a variety of actuarial methods that analyze experience, trends and other relevant factors. The principal standard actuarial methods used by our actuaries in the loss reserve reviews include loss development factor methods, expected loss ratio methods, Bornheutter-Ferguson methods and frequency/severity methods.
52
Loss development factor methods generally assume that the losses yet to emerge for an accident year are proportional to the paid or reported loss amounts observed so far. Historical patterns of the development of paid and reported losses by accident year can be predictive of the expected future patterns that are applied to current paid and reported losses to generate estimated ultimate losses by accident year.
Expected loss ratio methods use loss ratios for prior accident years, adjusted to reflect our evaluation of recent loss trends, the current risk environment, changes in our book of business and changes in our pricing and underwriting, to determine the appropriate expected loss ratio for a given accident year. The expected loss ratio for each accident year is multiplied by the premiums earned for that year to calculate estimated ultimate losses.
Bornheutter-Ferguson methods are combinations of an expected loss ratio method and a loss development factor method, where the loss development factor method is given more weight as an accident year matures.
Frequency/severity methods first project ultimate claim counts (using one or more of the other methods described above) and then multiply those counts by an estimated average claim cost to calculate estimated ultimate losses. The average claim costs are often estimated through a regression analysis of historical severity data. Generally, these methods work best for high frequency, low severity classes of business.
In completing their loss reserve analysis, our actuaries are required to determine the most appropriate actuarial methods to employ for each class of business. Within each class, the business is further segregated by accident year and, where appropriate, by jurisdiction. Each estimation method has its own pattern, parameter and/or judgmental dependencies, with no estimation method being better than the others in all situations. The relative strengths and weaknesses of the various estimation methods when applied to a particular class of business can also change over time, depending on the underlying circumstances. In many cases, multiple estimation methods will be valid for the particular facts and circumstances of the relevant class of business. The manner of application and the degree of reliance on a given method will vary by class of business, by accident year and by jurisdiction based on our actuaries' evaluation of the above dependencies and the potential volatility of the loss frequency and severity patterns. The estimation methods selected or given weight by our actuaries at a particular valuation date are those that are believed to produce the most reliable indication for the loss reserves being evaluated. These selections incorporate input from claims personnel, pricing actuaries and underwriting management on loss cost trends and other factors that could affect the reserve estimates.
For short tail classes, the emergence of paid and incurred losses generally exhibits a reasonably stable pattern of loss development on average over time. For these classes, the loss development factor method is generally relatively straightforward to apply and usually requires only modest extrapolation. For long tail classes, applying the loss development factor method often requires more judgment in selecting development factors as well as more significant extrapolation. For those long tail classes with high frequency and relatively low per-loss severity (e.g., workers' compensation), volatility will often be sufficiently modest for the loss development factor method to be given significant weight, except in the most recent accident years.
For certain long tail classes of business, however, anticipated loss experience is less predictable because of the small number of claims and erratic claim severity patterns. These classes include directors and officers liability, errors and omissions liability and commercial excess liability, among others. For these classes, the loss development factor methods may not produce a reliable estimate of ultimate losses in the most recent accident years since many claims either have not yet been reported to us or are only in the early stages of the settlement process. Therefore, the actuarial estimates for these accident years are based on less extrapolatory methods, such as expected loss ratio and Bornheutter-Ferguson methods. Over time, as a greater number of claims are reported and the statistical credibility of loss experience increases, loss development factor methods are given increasingly more weight.
53
Using all the available data, our actuaries select an indicated loss reserve amount for each class of business based on the various assumptions, projections and methods. The total indicated reserve amount determined by our actuaries is an aggregate of the indicated reserve amounts for the individual classes of business. The ultimate outcome is likely to fall within a range of potential outcomes around this indicated amount, but the indicated amount is not expected to be precisely the ultimate liability.
Senior management meets with our actuaries each quarter to review the results of the latest loss reserve analysis. Based on this review, management determines the carried reserve for each class of business. In making the determination, management considers numerous factors, such as changes in actuarial indications in the period, the maturity of the accident year, trends observed over the recent past and the level of volatility within a particular class of business. In doing so, management must evaluate whether a change in the data represents credible actionable information or an anomaly. Such an assessment requires considerable judgment. Even if a change is determined to be permanent, it is not always possible to determine the extent of the change until sometime later. As a result, there can be a time lag between the emergence of a change and a determination that the change should be reflected in the carried loss reserves.
Among the numerous factors that contribute to the inherent uncertainty in the process of establishing loss reserves are the following:
| • | changes in the inflation rate for goods and services related to covered damages such as medical care and home repair costs, |
| • | changes in the judicial interpretation of policy provisions relating to the determination of coverage, |
| • | changes in the general attitude of juries in the determination of liability and damages, |
| • | legislative actions, |
| • | changes in the medical condition of claimants, |
| • | changes in our estimates of the number and/or severity of claims that have been incurred but not reported as of the date of the financial statements, |
| • | changes in our book of business, |
| • | changes in our underwriting standards, and |
| • | changes in our claim handling procedures. |
In addition, we must consider the uncertain effects of emerging or potential claims and coverage issues that arise as legal, judicial, economic and social conditions change. These issues have had, and may continue to have, a negative effect on our loss reserves by either extending coverage beyond the original underwriting intent or by increasing the number or size of claims. Examples of such issues include professional liability claims arising out of volatility in the financial markets, directors and officers liability and errors and omissions liability claims arising out of accounting and other corporate malfeasance, and exposure to claims asserted for bodily injury as a result of long term exposure to harmful products or substances. As a result of issues such as these, the uncertainties inherent in estimating ultimate claim costs on the basis of past experience have grown, further complicating the already complex loss reserving process.
As part of our loss reserving analysis, we take into consideration the various factors that contribute to the uncertainty in the loss reserving process. Those factors that could materially affect our loss reserve estimates include loss development patterns and loss cost trends, rate and exposure level changes, the effects of changes in coverage and policy limits, business mix shifts, the effects of regulatory and legislative developments, the effects of changes in judicial interpretations, the effects of emerging claims and coverage issues and the effects of changes in claim handling practices. In making estimates of reserves, however, we do not necessarily make an explicit assumption for each of these factors. Moreover, all estimation methods do not utilize the same assumptions and typically no single
54
method is determinative in the reserve analysis for a class of business. Consequently, changes in our loss reserve estimates generally are not the result of changes in any one assumption. Instead, the variability will be affected by the interplay of changes in numerous assumptions, many of which are implicit to the approaches used.
For each class of business, we regularly adjust the assumptions and actuarial methods used in the estimation of loss reserves in response to our actual loss experience as well as our judgments regarding changes in trends and/or emerging patterns. In those instances where we primarily utilize analyses of historical patterns of the development of paid and reported losses, this may be reflected, for example, in the selection of revised loss development factors. In those long tail classes of business that comprise a majority of our loss reserves and for which loss experience is less predictable due to potential changes in judicial interpretations, potential legislative actions and potential claims issues, this may be reflected in a judgmental change in our estimate of ultimate losses for particular accident years.
The future impact of the various factors that contribute to the uncertainty in the loss reserving process is extremely difficult to predict. There is potential for significant variation in the development of loss reserves, particularly for long tail classes of business. We do not derive statistical loss distributions or outcome confidence levels around our loss reserve estimate. Actuarial ranges of reasonable estimates are not a true reflection of the potential volatility between carried loss reserves and the ultimate settlement amount of losses incurred prior to the balance sheet date. This is due, among other reasons, to the fact that actuarial ranges are developed based on known events as of the valuation date whereas the ultimate disposition of losses is subject to the outcome of events and circumstances that were unknown as of the valuation date.
The following discussion includes disclosure of possible variation from current estimates of loss reserves due to a change in certain key assumptions for particular classes of business. These impacts are estimated individually, without consideration for any correlation among such assumptions or among lines of business. Therefore, it would be inappropriate to take the amounts and add them together in an attempt to estimate volatility for our loss reserves in total. We believe that the estimated variation in reserves detailed below is a reasonable estimate of the possible variation that may occur in the future. However, if such variation did occur, it would likely occur over a period of several years and therefore its impact on the Corporation's results of operations would occur over the same period. It is important to note, however, that there is the potential for future variation greater than the amounts discussed below.
Two of the larger components of our loss reserves relate to the professional liability classes other than fidelity and to the commercial excess liability class. The respective reported loss development patterns are key assumptions in estimating loss reserves for these classes of business, both as applied directly to more mature accident years and as applied indirectly (e.g., via Bornheutter-Ferguson methods) to less mature accident years.
Reserves for the professional liability classes other than fidelity were $6.0 billion, net of reinsurance, at December 31, 2014. Based on a review of our loss experience, if the loss development factor for each accident year changed incrementally such that the cumulative loss development factor for the most recent accident year changed by 10%, we estimate that the net reserves for the professional liability classes other than fidelity would change by approximately $575 million, in either direction. This degree of change in the reported loss development pattern is within the historical variation around the averages in our data.
Reserves for the commercial excess liability class (excluding asbestos and toxic waste claims) were $3.0 billion, net of reinsurance, at December 31, 2014. These reserves are included within commercial casualty. Based on a review of our loss experience, if the loss development factor for each accident year changed incrementally such that the cumulative loss development factor for the most recent accident year changed by 20%, we estimate that the net reserves for the commercial excess liability class would change by approximately $375 million, in either direction. This degree of change in the reported loss development pattern is within the historical variation around the averages in our data.
55
Reserves Relating to Asbestos and Toxic Waste Claims. The estimation of loss reserves relating to asbestos and toxic waste claims on insurance policies written many years ago is subject to greater uncertainty than other types of claims due to inconsistent court decisions as well as judicial interpretations and legislative actions that in some instances have tended to broaden coverage beyond the original intent of such policies and in others have expanded theories of liability. The insurance industry as a whole remains engaged in extensive litigation over coverage, accident year allocation and liability issues and is thus confronted with a continuing uncertainty in its efforts to quantify these exposures.
Reserves for asbestos and toxic waste claims cannot be estimated with traditional actuarial loss reserving techniques that rely on historical accident year loss development factors. Instead, we rely on an exposure-based analysis that involves a detailed review of individual policy terms and exposures. Because each policyholder presents different liability and coverage issues, we generally evaluate our exposure on a policyholder-by-policyholder basis, considering a variety of factors that are unique to each policyholder. Quantitative techniques have to be supplemented by subjective considerations including management's judgment.
We establish case reserves and expense reserves for costs of related litigation where sufficient information has been developed to indicate the involvement of a specific insurance policy. In addition, IBNR reserves are established to cover additional exposures on both known and unasserted claims.
Based on facts currently known and the present state of the law and coverage litigation, we believe that the loss reserves carried at December 31, 2014 for asbestos and toxic waste claims were adequate. However, given the inherent uncertainties, as well as the judicial decisions and legislative actions that have broadened the scope of coverage and expanded theories of liability in the past and the possibilities of similar interpretations in the future, it is possible that our estimate of loss reserves relating to these exposures may increase in future periods as new information becomes available and as claims develop.
Asbestos Reserves. Asbestos remains the most significant and difficult mass tort for the insurance industry in terms of claims volume and dollar exposure. Asbestos claims relate primarily to bodily injuries asserted by those who came in contact with asbestos or products containing asbestos. Tort theory affecting asbestos litigation has evolved over the years. Early court cases established the "continuous trigger" theory with respect to insurance coverage. Under this theory, insurance coverage is deemed to be triggered from the time a claimant is first exposed to asbestos until the manifestation of any disease. This interpretation of a policy trigger can involve insurance policies over many years and increases insurance companies' exposure to liability. Generally, judicial interpretations and legislative actions have attempted to maximize insurance availability from both a coverage and liability standpoint.
New asbestos claims and new exposures on existing claims have continued despite the fact that usage of asbestos has declined since the mid-1970s. Many claimants were exposed to multiple asbestos products over an extended period of time. As a result, claim filings typically name dozens of defendants. The plaintiffs' bar has solicited new claimants through extensive advertising and through asbestos medical screenings. A vast majority of asbestos bodily injury claims have been filed by claimants who do not show any signs of asbestos related disease. New asbestos cases are often filed in those jurisdictions with a reputation for judges and juries that are sympathetic to plaintiffs.
Approximately 110 manufacturers and distributors of asbestos products have filed for bankruptcy protection as a result of asbestos related liabilities. A bankruptcy sometimes involves an agreement to a plan between the debtor and its creditors, including the creation of a trust to pay current and future asbestos claimants for their injuries. Although the debtor is negotiating in part with its insurers' money, insurers are generally given only limited opportunity to be heard. In addition to contributing to the overall number of claims, bankruptcy proceedings not only result in increased settlement demands against remaining solvent defendants, but also create the potential for recoveries from multiple trusts by the same claimant for the same alleged injuries.
56
There have been some positive legislative and judicial developments in the asbestos environment over the past several years:
| • | Various challenges to the mass screening of claimants have occurred, which have led to higher medical evidentiary standards for asbestos and other exposure-type claims. |
| • | A number of states have implemented legislative and judicial reforms that focus the courts' resources on the claims of the most seriously injured. Those who allege serious injury and can present credible evidence of their injuries are receiving priority trial settings in the courts, while those who have not shown any credible disease manifestation are having their hearing dates delayed or placed on an inactive docket, which preserves the right to pursue litigation in the future. |
| • | A number of jurisdictions have adopted venue reform that requires plaintiffs to have a connection to the jurisdiction in order to file a complaint, although in more recent years, this type of reform has slowed. |
| • | In recognition that many aspects of bankruptcy plans are unfair to certain classes of claimants and to the insurance industry, these plans are being more closely scrutinized by the courts and rejected when appropriate. |
| • | A number of jurisdictions have passed or are considering legislation that will require fuller disclosure by plaintiffs of amounts received from asbestos bankruptcy trusts. |
Our most significant individual asbestos exposures involve products liability on the part of "traditional" defendants who were engaged in the manufacture, distribution or installation of asbestos products. We wrote primary general liability and/or excess liability coverages for these insureds. While these insureds are relatively few in number, their exposure has been substantial due to the high volume of claims, the erosion of the underlying limits and the bankruptcies of target defendants.
Our other asbestos exposures involve products and non-products liability on the part of "peripheral" defendants, including a mix of manufacturers, distributors and installers of certain products that contain asbestos in small quantities and owners or operators of properties where asbestos was present. Generally, these insureds are named defendants on a regional rather than a nationwide basis. As the financial resources of traditional asbestos defendants have been depleted, plaintiffs are targeting these viable peripheral parties with greater frequency and, in many cases, for large awards.
Asbestos claims against the major manufacturers, distributors or installers of asbestos products were typically presented under the products liability section of primary general liability policies as well as under excess liability policies, both of which typically had aggregate limits that capped an insurer's exposure. In recent years, a number of asbestos claims by insureds are being presented as "non-products" claims. In these instances, claimants contend that they came into contact with asbestos at premises owned or operated by our insureds and/or were exposed to asbestos during asbestos installation at a particular location. These non-products claims are presented under the premises or operations section of primary general liability policies. Unlike products coverage, the premises or operations coverages in these older policies typically had no aggregate limits on coverage, creating potentially greater exposure. Further, in an effort to seek additional insurance coverage, some insureds with installation activities who have substantially eroded their products coverage are presenting new asbestos claims as non-products operations claims or attempting to reclassify previously settled products claims as non-products claims to restore a portion of previously exhausted products aggregate limits. It is difficult to predict whether insureds will be successful in asserting claims under non-products coverage or whether insurers will be successful in asserting additional defenses. Accordingly, the ultimate cost to insurers of the claims for coverage not subject to aggregate limits is uncertain.
In establishing our asbestos reserves, we evaluate the exposure presented by each insured. As part of this evaluation, we consider a variety of factors including: the available insurance coverage; limits and deductibles; the jurisdictions involved; the number of claimants; the disease mix exhibited by the claimants; the past settlement values of similar claims; the potential role of other insurance, particularly
57
underlying coverage below our excess liability policies; potential bankruptcy impact; relevant judicial interpretations; and applicable coverage defenses, including asbestos exclusions.
Various U.S. federal proposals to solve the ongoing asbestos litigation crisis have been considered by the U.S. Congress over the years, but none have yet been enacted. The prospect of federal asbestos reform legislation remains uncertain. As a result, in establishing our asbestos reserves, we have assumed a continuation of the current legal environment with no benefit from any federal asbestos reform legislation.
Our actuaries and claim personnel perform periodic analyses of our asbestos related exposures. The analyses performed in each of the past three years noted modest adverse developments mostly related to a small number of existing cases. The analyses also indicated a slower than expected decline in the number of insureds with first-time asbestos claim activity. Based on these developments, we increased our net loss reserves related to asbestos claims by $25 million in 2014, $51 million in 2013 and $28 million in 2012.
A reconciliation of the beginning and ending loss reserves related to asbestos claims is as follows:
| Years Ended December 31 | ||||||||||||
| 2014 | 2013 | 2012 | ||||||||||
| (in millions) | ||||||||||||
Gross loss reserves, beginning of year | $ | 586 | $ | 608 | $ | 627 | ||||||
Reinsurance recoverable, beginning of year | 20 | 19 | 22 | |||||||||
|
|
|
|
|
| |||||||
Net loss reserves, beginning of year | 566 | 589 | 605 | |||||||||
Net incurred losses | 25 | 51 | 28 | |||||||||
Net losses paid | 91 | 74 | 44 | |||||||||
|
|
|
|
|
| |||||||
Net loss reserves, end of year | 500 | 566 | 589 | |||||||||
Reinsurance recoverable, end of year | 21 | 20 | 19 | |||||||||
|
|
|
|
|
| |||||||
Gross loss reserves, end of year | $ | 521 | $ | 586 | $ | 608 | ||||||
|
|
|
|
|
| |||||||
At December 31, 2014, $321 million of the net loss reserves related to asbestos claims were IBNR reserves.
The following table presents the number of policyholders with open asbestos claims and the related net loss reserves at December 31, 2014 as well as the net losses paid during 2014 by component.
| Number of Policyholders | Net Loss Reserves | Net Losses Paid | ||||||||||
| (in millions) | ||||||||||||
Traditional defendants | 9 | $ | 79 | $ | 42 | |||||||
Peripheral defendants and all other | 333 | 287 | 49 | |||||||||
Future claims from unknown policyholders | 134 | |||||||||||
|
|
|
| |||||||||
| $ | 500 | $ | 91 | |||||||||
|
|
|
| |||||||||
Significant uncertainty remains as to our ultimate liability related to asbestos related claims. This uncertainty is due to several factors including:
| • | the long latency period between asbestos exposure and disease manifestation and the resulting potential for involvement of multiple policy periods for individual claims; |
| • | plaintiffs' expanding theories of liability and increased focus on peripheral defendants; |
| • | the volume of claims by unimpaired plaintiffs and the extent to which they can be precluded from making claims; |
| • | the volume of claims by severely impaired plaintiffs, such as those with mesothelioma, and the size of settlements and judgments received by those plaintiffs; |
| • | the volume of claims by plaintiffs suffering from other malignancies such as lung cancer and their ability to establish a causal link between their disease and exposure to asbestos; |
58
| • | the efforts by insureds to claim the right to non-products coverage not subject to aggregate limits; |
| • | the number of insureds seeking bankruptcy protection as a result of asbestos related liabilities; |
| • | the ability of claimants to bring a claim in a state in which they have no residency or exposure; |
| • | the impact of the exhaustion of primary limits and the resulting increase in claims on excess liability policies we have issued; |
| • | inconsistent court decisions and diverging legal interpretations; and |
| • | the possibility, however remote, of federal legislation that would address the asbestos problem. |
These significant uncertainties are not likely to be resolved in the near future.
Toxic Waste Reserves. Toxic waste claims relate primarily to pollution and associated cleanup costs. Our insureds have two potential areas of exposure-hazardous waste dump sites and pollution at the insured site primarily from underground storage tanks and manufacturing processes.
The U.S. federal Comprehensive Environmental Response Compensation and Liability Act of 1980 (Superfund) has been interpreted to impose strict, retroactive and joint and several liability on potentially responsible parties (PRPs) for the cost of remediating hazardous waste sites.
Most PRPs named to date are parties who have been generators, transporters, past or present landowners or past or present site operators. Most sites have multiple PRPs. These PRPs had proper government authorization in many instances. However, relative fault has not been a factor in establishing liability. While the volume of new claims is significantly reduced from the activity in the 1980s, PRPs continue to tender claims to insurers on newly identified hazardous waste sites. Insurance policies issued to PRPs were not intended to cover claims arising from gradual pollution. Since 1986, most policies have specifically excluded such exposures.
Environmental remediation claims tendered by PRPs and others to insurers have frequently resulted in disputes over insurers' contractual obligations with respect to pollution claims. The resulting litigation against insurers extends to issues of liability, coverage and other policy provisions.
There is substantial uncertainty involved in estimating our liabilities related to these claims. First, the liabilities of the claimants are extremely difficult to estimate. At any given waste site, the allocation of remediation costs among governmental authorities and the PRPs varies greatly depending on a variety of factors. Second, different courts have addressed liability and coverage issues regarding pollution claims and have reached inconsistent conclusions in their interpretation of several issues. These significant uncertainties are not likely to be resolved definitively in the near future.
Uncertainties also remain as to the Superfund law itself. Superfund's taxing authority expired on December 31, 1995 and has not been re-enacted. Federal legislation appears to be at a standstill. At this time, it is not possible to predict the direction that any reforms may take, when they may occur or the effect that any changes may have on the insurance industry.
Without federal movement on Superfund reform, the enforcement of Superfund liability has occasionally shifted to the states. States are being forced to reconsider state-level cleanup statutes and regulations. As individual states move forward, the potential for conflicting state regulation becomes greater. In a few states, we have seen cases brought against insureds or directly against insurance companies for environmental pollution and natural resources damages. To date, only a few natural resource claims have been filed and they are being vigorously defended. Significant uncertainty remains as to the cost of remediating the state sites. Because of the large number of state sites, such sites could prove even more costly in the aggregate than Superfund sites.
In establishing our toxic waste reserves, we evaluate the exposure presented by each insured. As part of this evaluation, we consider a variety of factors including: the probable liability, available insurance coverage, allocation of potential loss to the appropriate accident year, past settlement values of similar claims, relevant judicial interpretations, applicable coverage defenses as well as facts that are unique to each insured.
59
Our actuaries and claim personnel perform periodic analyses of our toxic waste exposures. In each of the past three years, the analyses of our toxic waste exposures indicated that some of our insureds had become responsible for the remediation of additional polluted sites and that, as cleanup standards continue to evolve as a result of technology advances, the estimated cost of remediation of certain sites had increased. Defense costs associated with some of these cases have also increased. Based on these developments, we increased our net loss reserves related to toxic waste claims by $75 million in 2014 and $55 million in both 2013 and 2012.
A reconciliation of the beginning and ending loss reserves, net of reinsurance recoverable, related to toxic waste claims is as follows:
| Years Ended December 31 | ||||||||||||
| 2014 | 2013 | 2012 | ||||||||||
| (in millions) | ||||||||||||
Reserves, beginning of year | $ | 292 | $ | 268 | $ | 261 | ||||||
Incurred losses | 75 | 55 | 55 | |||||||||
Losses paid | 24 | 31 | 48 | |||||||||
|
|
|
|
|
| |||||||
Reserves, end of year | $ | 343 | $ | 292 | $ | 268 | ||||||
|
|
|
|
|
| |||||||
Reinsurance recoverable related to these claims is minimal. At December 31, 2014, $269 million of the net loss reserves related to toxic waste claims were IBNR reserves.
Reinsurance Recoverable. Reinsurance recoverable is the estimated amount recoverable from reinsurers related to the losses we have incurred. At December 31, 2014, reinsurance recoverable included $116 million recoverable with respect to paid losses and loss expenses, which is included in other assets, and $1.6 billion recoverable on unpaid losses and loss expenses, including reinsurance losses incurred but not reported. None of the reinsurance recoverable on unpaid losses and loss expenses is currently due for collection from reinsurers.
Reinsurance recoverable on unpaid losses and loss expenses represents an estimate of the portion of our gross loss reserves that will be recovered from reinsurers. Such reinsurance recoverable is estimated as part of our loss reserving process using assumptions that are consistent with the assumptions used in estimating the gross loss reserves. Consequently, the estimation of reinsurance recoverable is subject to similar judgments and uncertainties as the estimation of gross loss reserves.
Ceded reinsurance contracts do not relieve us of our primary obligation to our policyholders. Consequently, an exposure exists with respect to reinsurance recoverable to the extent that any reinsurer is unable to meet its obligations or disputes the liabilities we believe it has assumed under the reinsurance contracts.
We are selective in regard to our reinsurers, placing reinsurance with only those reinsurers that we believe have strong balance sheets and superior underwriting ability. We monitor the financial strength of our reinsurers and our concentration of risk with reinsurers on an ongoing basis. We obtain collateral from certain of our reinsurers in the form of letters of credit, trust agreements and cash advances, in order to mitigate potential collectibility exposure. The total amount of collateral held at December 31, 2014 related to reinsurance recoverable on paid and unpaid losses and loss expenses was $533 million. As of December 31, 2014, the largest amount of reinsurance recoverable on paid and unpaid losses and loss expenses from any individual reinsurer represented one percent of shareholders' equity. Nevertheless, in recent years, certain of our reinsurers have experienced financial difficulties or exited the reinsurance business. In addition, we may become involved in coverage disputes with our reinsurers. A provision for estimated uncollectible reinsurance is recorded based on periodic evaluations of balances due from reinsurers, the financial condition of the reinsurers, coverage disputes and other relevant factors, including collateral held.
60
Prior Year Loss Development
Changes in loss reserve estimates are unavoidable because such estimates are subject to the outcome of future events. Loss trends vary and time is required for changes in trends to be recognized and confirmed. Reserve changes that increase previous estimates of ultimate cost are referred to as unfavorable or adverse development or reserve strengthening. Reserve changes that decrease previous estimates of ultimate cost are referred to as favorable development or reserve releases.
A reconciliation of the beginning and ending loss reserves, net of reinsurance, is as follows:
| Years Ended December 31 | ||||||||||||
| 2014 | 2013 | 2012 | ||||||||||
| (in millions) | ||||||||||||
Net loss reserves, beginning of year | $ | 21,344 | $ | 22,022 | $ | 21,329 | ||||||
|
|
|
|
|
| |||||||
Net incurred losses and loss expenses related to | ||||||||||||
Current year | 7,621 | 7,232 | 8,121 | |||||||||
Prior years | (636 | ) | (712 | ) | (614 | ) | ||||||
|
|
|
|
|
| |||||||
| 6,985 | 6,520 | 7,507 | ||||||||||
|
|
|
|
|
| |||||||
Net payments for losses and loss expenses related to | ||||||||||||
Current year | 2,496 | 2,150 | 2,323 | |||||||||
Prior years | 4,534 | 4,952 | 4,493 | |||||||||
|
|
|
|
|
| |||||||
| 7,030 | 7,102 | 6,816 | ||||||||||
|
|
|
|
|
| |||||||
Foreign currency translation effect | (260 | ) | (96 | ) | 2 | |||||||
|
|
|
|
|
| |||||||
Net loss reserves, end of year | $ | 21,039 | $ | 21,344 | $ | 22,022 | ||||||
|
|
|
|
|
| |||||||
During 2014, we experienced overall favorable prior year development of $636 million, which represented 3.0% of the net loss reserves as of December 31, 2013. This compares with favorable prior year development of $712 million during 2013, which represented 3.2% of the net loss reserves at December 31, 2012, and favorable prior year development of $614 million during 2012, which represented 2.9% of the net loss reserves at December 31, 2011. Such favorable development was reflected in operating results in these respective years.
The overall prior year loss development by accident year was as follows:
| Calendar Year (Favorable) Unfavorable Development | ||||||||||||
Accident Year | 2014 | 2013 | 2012 | |||||||||
| (in millions) | ||||||||||||
2013 | $ | (43 | ) | |||||||||
2012 | (54 | ) | $ | (138 | ) | |||||||
2011 | (82 | ) | (33 | ) | $ | 26 | ||||||
2010 | (143 | ) | (83 | ) | (49 | ) | ||||||
2009 | (105 | ) | (111 | ) | (89 | ) | ||||||
2008 | (104 | ) | (101 | ) | (131 | ) | ||||||
2007 | (68 | ) | (142 | ) | (147 | ) | ||||||
2006 | (42 | ) | (52 | ) | (115 | ) | ||||||
2005 | (39 | ) | (57 | ) | (56 | ) | ||||||
2004 and prior | 44 | 5 | (53 | ) | ||||||||
|
|
|
|
|
| |||||||
| $ | (636 | ) | $ | (712 | ) | $ | (614 | ) | ||||
|
|
|
|
|
| |||||||
The classes of business having the most significant impact on prior year loss development in 2014 were as follows:
| • | We experienced overall favorable development of about $320 million in the professional liability classes other than fidelity. This favorable development was driven mainly by the directors and officers liability and fiduciary liability classes. Overall, the reported loss activity for these classes was less than expected, mostly in terms of claim severity. The aggregate favorable emergence was |
61
driven by accident years 2010 and prior. This emergence was recognized as one among many factors in the determination of carried loss reserves for these classes at December 31, 2014. Among other important factors were the uncertainty from the crisis in the financial markets and its aftermath, the effects of the ensuing economic downturn, other recent litigation dynamics, and the positive pricing trends experienced in the past three years. |
| • | We experienced favorable development of about $205 million in the aggregate in the personal and commercial liability classes. The most significant favorable development occurred in the excess liability classes, particularly in accident years 2011 and prior. This was partially offset by adverse development in other liability classes, most notably due to $100 million of incurred losses related to asbestos and toxic waste claims in older accident years. Overall, prior accident year claim activity for the personal and commercial liability classes was less severe than expected. These factors were reflected in the determination of the carried loss reserves for these classes at December 31, 2014. |
| • | We experienced favorable development of about $60 million in the aggregate in the personal and commercial property classes, with the most significant amounts related to the 2013 and 2012 accident years. The severity of late developing property claims that emerged during 2014 was lower than expected. Reserve estimates for these claims are based on an analysis of past loss experience on average over a period of years because the incidence of large property losses in any year is subject to a considerable element of fortuity. As a result, this lower emergence had only a modest effect on the determination of carried loss reserves for these classes at December 31, 2014. |
| • | We experienced favorable development of about $50 million in the workers' compensation class, with favorable development occurring in most accident years. The severity of prior accident year claim activity for this class was lower than expected overall. This factor was reflected in the determination of carried loss reserves for this class at December 31, 2014. |
The classes of business having the most significant impact on prior year loss development in 2013 were as follows:
| • | We experienced favorable development of about $265 million in the aggregate, including $30 million related to catastrophes, in the personal and commercial property classes, mostly related to the 2012 and 2011 accident years. The severity and frequency of late developing property claims that emerged during 2013 were lower than expected, including those related to catastrophes, and the development of existing case reserves was more favorable than expected. |
| • | We experienced overall favorable development of about $260 million in the professional liability classes other than fidelity. This favorable development was driven by the directors and officers liability and fiduciary liability classes, partially offset by adverse development in the errors and omissions liability and employment practices liability classes. Overall, the reported loss activity was less than expected, with aggregate favorable emergence from accident years 2010 and prior. |
| • | We experienced favorable development of about $160 million in the aggregate in the personal and commercial liability classes. The most significant favorable development occurred in the excess liability classes, particularly in accident years 2010 and prior. There was some offsetting adverse development in other liability classes, most notably due to $106 million of incurred losses related to asbestos and toxic waste claims in older accident years. Overall, prior period liability claims were lower than expected, particularly the severity of such claims, and the effects of underwriting changes that affected these years have been more positive than expected. |
| • | We experienced unfavorable development of about $50 million in the fidelity class due to higher than expected reported loss emergence, related mostly to accident years subsequent to 2007. |
| • | We experienced favorable development of about $35 million in the personal automobile business due primarily to more favorable case reserve development and lower severity of prior period claims than expected. |
62
| • | We experienced favorable development of about $30 million in the surety business due to lower than expected loss emergence in recent accident years. |
The classes of business having the most significant impact on prior year loss development in 2012 were as follows:
| • | We experienced favorable development of about $250 million in the aggregate in the personal and commercial liability classes. The most significant favorable development occurred in accident years 2006 to 2009, which more than offset adverse development in accident years 2002 and prior, which included $83 million of incurred losses related to asbestos and toxic waste claims. The overall frequency and severity of prior period liability claims were lower than expected and the effects of underwriting changes that affected these years have been more positive than expected, especially in the commercial excess liability class. |
| • | We experienced overall favorable development of about $200 million in the professional liability classes other than fidelity. This favorable development was driven by the directors and officers liability and fiduciary liability classes, partially offset by adverse development in the errors and omissions liability and employment practices liability classes. Overall, the reported loss activity was less than expected, with aggregate favorable emergence from accident years 2008 and prior partly offset by some adverse emergence in the more recent accident years. |
| • | We experienced favorable development of about $125 million, including $50 million related to catastrophes, in the aggregate in the personal and commercial property classes, mostly related to the 2007 through 2011 accident years. The severity and frequency of late developing property claims that emerged during 2012 were lower than expected, including those related to catastrophes, and the development of existing case reserves was more favorable than expected. |
| • | We experienced unfavorable development of about $60 million in the fidelity class due to higher than expected reported loss emergence, related mostly to accident years 2008 through 2010. |
| • | We experienced favorable development of about $45 million in the runoff of our reinsurance assumed business due primarily to better than expected reported loss activity from cedants. |
| • | We experienced favorable development of about $40 million in the personal automobile business due primarily to lower than expected frequency of prior period claims. |
| • | We experienced favorable development of about $25 million in the surety business due to lower than expected loss emergence in recent accident years. |
In Item 1 of this report, we present an analysis of our consolidated loss reserve development on a calendar year basis for each of the ten years prior to 2014. The variability in reserve development over the ten year period illustrates the uncertainty of the loss reserving process. Conditions and trends that have affected reserve development in the past will not necessarily recur in the future. It is not appropriate to extrapolate future favorable or unfavorable reserve development based on amounts experienced in prior years.
Our U.S. property and casualty insurance subsidiaries are required to file annual statements with insurance regulatory authorities prepared on an accounting basis prescribed or permitted by such authorities. These annual statements include an analysis of loss reserves, referred to as Schedule P, that presents accident year loss development information for the nine years prior to 2014. It is our intention to post the Schedule P for our combined U.S. property and casualty insurance subsidiaries on our website as soon as it becomes available.
Investment Results
Property and casualty investment income before taxes decreased by 4% in 2014 compared with 2013 and decreased by 6% in 2013 compared with 2012. In 2014 and 2013, the decrease was primarily due to a decline in the average yield of our property and casualty subsidiaries' investment portfolio, partially offset by the impact of an increase in our average invested assets. In both years, the decrease in the average yield on the investment portfolio primarily resulted from lower reinvestment yields on
63
securities that we purchased to replace fixed maturities that matured, were redeemed by the issuer or were sold during the year. While the property and casualty subsidiaries generated substantial operating cash flows during each of the past three years, average invested assets in the three years were impacted by substantial dividend distributions made by the property and casualty subsidiaries to Chubb during the period. As a result of the dividend distributions, our property and casualty subsidiaries held only a slightly higher amount of average invested assets in both years compared with the respective prior year.
The effective tax rate on our investment income was 18.1% in 2014 compared with 18.2% in 2013 and 18.8% in 2012. The effective tax rate on our investment income is lower than the U.S. statutory tax rate since a portion of our investment income is tax exempt interest income. The effective tax rate fluctuates as the proportion of tax exempt investment income relative to total investment income changes from period to period.
On an after-tax basis, property and casualty investment income decreased by 4% in 2014 compared with 2013 and decreased by 5% in 2013 compared with 2012.
The after-tax annualized yield on our property and casualty subsidiaries' investment portfolio was 2.73% in 2014 compared with 2.88% in 2013 and 3.12% in 2012.
Our ability to grow our property and casualty investment income is a function of several variables, including investable cash flows, available reinvestment rates and foreign currency to U.S. dollar exchange rates. The property and casualty subsidiaries' investable cash flows are impacted by many factors, including operating activities, the payment of dividends to Chubb and the timing of maturities, calls and redemptions of fixed maturities. Economic conditions and national monetary policies both inside and outside the United States have resulted in a low interest rate environment in recent years that is expected to continue to adversely affect our ability to increase our investment income.
We expect that property and casualty investment income after taxes will decline in 2015 compared with 2014. The expected decline is primarily due to the decrease in the yield on our investment portfolio during 2014 as a result of investing available funds in securities with yields lower than the yields of the securities that matured or were sold in 2014. Assuming the average yield on fixed maturities available in the market in 2015 is similar to the year-end 2014 level, the decline in the yield on our investment portfolio is expected to continue in 2015 as the funds from securities that mature, are called or are redeemed are reinvested. The expected decline in property and casualty investment income after taxes in 2015 also reflects an assumption that average invested assets in 2015 will be similar to the level in 2014, based on our expectations of investable cash flows during the year. During 2014, the U.S. dollar strengthened against the major currencies in which investments we hold are denominated. If those exchange rates in 2015 remain at the same levels as at December 31, 2014, our investment income growth in 2015 would be adversely affected.
Other Income and Charges
Other income and charges, which includes miscellaneous income and expenses of the property and casualty subsidiaries, were not significant in 2014, 2013 or 2012.
CORPORATE AND OTHER
Corporate and other comprises investment income earned on corporate invested assets, interest expense and other expenses not allocated to our operating subsidiaries and the results of our non-insurance subsidiaries.
Corporate and other produced a loss before taxes of $235 million in 2014 compared with a loss of $237 million in both 2013 and 2012.
64
REALIZED INVESTMENT GAINS AND LOSSES
Net realized investment gains and losses were as follows:
| Years Ended December 31 | ||||||||||||
| 2014 | 2013 | 2012 | ||||||||||
| (in millions) | ||||||||||||
Net realized gains | ||||||||||||
Fixed maturities | $ | 90 | $ | 20 | $ | 104 | ||||||
Equity securities | 137 | 203 | 68 | |||||||||
Other invested assets | 149 | 190 | 66 | |||||||||
|
|
|
|
|
| |||||||
| 376 | 413 | 238 | ||||||||||
|
|
|
|
|
| |||||||
Other-than-temporary impairment losses | ||||||||||||
Fixed maturities | (5 | ) | (2 | ) | (5 | ) | ||||||
Equity securities | (2 | ) | (9 | ) | (40 | ) | ||||||
|
|
|
|
|
| |||||||
| (7 | ) | (11 | ) | (45 | ) | |||||||
|
|
|
|
|
| |||||||
Realized investment gains before tax | $ | 369 | $ | 402 | $ | 193 | ||||||
|
|
|
|
|
| |||||||
Realized investment gains after tax | $ | 242 | $ | 261 | $ | 125 | ||||||
|
|
|
|
|
| |||||||
Decisions to sell equity securities and fixed maturities are governed principally by considerations of investment opportunities and tax consequences. As a result, realized gains and losses on the sale of these investments may vary significantly from period to period. However, such gains and losses generally have little, if any, impact on shareholders' equity as all of these investments are carried at fair value, with the unrealized appreciation or depreciation after tax reflected in accumulated other comprehensive income.
The net realized gains of equity securities and other invested assets in 2013 included $74 million and $10 million, respectively, related to the exchange of our holdings of common stock and warrants of Alterra Capital Holdings Limited for common stock of Markel Corporation and cash as a result of a business combination that took place during the second quarter of 2013.
The net realized gains and losses of other invested assets primarily include the aggregate of realized gain distributions to us from the private equity limited partnerships in which we have an interest and changes in our equity in the net assets of those partnerships based on valuations provided to us by the manager of each partnership. Due to the timing of our receipt of valuation data from the investment managers, the value of these investments and any related realized gains and losses are generally reported on a one quarter lag.
The net realized gains of the limited partnerships reported in 2014 primarily reflected the positive performance of the global equity and high yield investment markets in the first six months of 2014 and the fourth quarter of 2013. The net realized gains of the limited partnerships reported in 2013 primarily reflected the positive performance of the global equity and high yield investment markets in the first and third quarters of 2013 and the fourth quarter of 2012. The net realized gains of the limited partnerships reported in 2012 primarily reflected the strong performance of the U.S. equity and high yield investment markets in the first and third quarters of 2012, partially offset by the negative performance of several non-U.S. equity markets, particularly in Asia, in the fourth quarter of 2011 and the global equity markets in the second quarter of 2012.
We regularly review invested assets that have a fair value less than cost to determine if an other-than-temporary decline in value has occurred. We have a monitoring process overseen by a committee of investment and accounting professionals that is responsible for identifying those securities to be specifically evaluated for a potential other-than-temporary impairment.
The determination of whether a decline in value of any investment is temporary or other than temporary requires the judgment of management. The assessment of other-than-temporary impairment of fixed maturities and equity securities is based on both quantitative criteria and qualitative
65
information. A number of factors are considered including, but not limited to, the length of time and the extent to which the fair value has been less than the cost, the financial condition and near term prospects of the issuer, whether the issuer is current on contractually obligated interest and principal payments, general market conditions and industry or sector specific factors. The decision to recognize a decline in the value of a security carried at fair value as other than temporary rather than temporary has no impact on shareholders' equity.
In determining whether fixed maturities are other than temporarily impaired, we are required to recognize an other-than-temporary impairment loss when we conclude that we have the intent to sell or it is more likely than not that we will be required to sell an impaired fixed maturity before the security recovers to its amortized cost value or it is likely we will not recover the entire amortized cost value of an impaired security. If we have the intent to sell or it is more likely than not that we will be required to sell an impaired fixed maturity before the security recovers to its amortized cost value, the security is written down to fair value and the entire amount of the writedown is included in net income as a realized investment loss. For all other impaired fixed maturities, when the impairment is determined to be other than temporary, the impairment loss is separated into the amount representing the credit loss and the amount representing the loss related to all other factors. The amount of the impairment loss that represents the credit loss is included in net income as a realized investment loss and the amount of the impairment loss that relates to all other factors is included in other comprehensive income.
In determining whether equity securities are other than temporarily impaired, we consider our intent and ability to hold a security for a period of time sufficient to allow us to recover our cost. If a decline in the fair value of an equity security is deemed to be other than temporary, the security is written down to fair value and the amount of the writedown is included in net income as a realized investment loss.
During each of the past three years, the fair value of some of our investments were at a level below our cost. Some of these investments were deemed to be other than temporarily impaired. In 2012, about 65% of the $40 million of other-than-temporary impairment losses recognized for equity securities related to issuers in the financial services industry.
Information related to investment securities in an unrealized loss position at December 31, 2014 and 2013 is included in Note (2)(b) of the Notes to Consolidated Financial Statements.
CAPITAL RESOURCES AND LIQUIDITY
Capital resources and liquidity represent a company's overall financial strength and its ability to generate cash flows, borrow funds at competitive rates and raise new capital to meet operating and growth needs.
Capital Resources
Capital resources provide protection for policyholders, furnish the financial strength to support the business of underwriting insurance risks and facilitate continued business growth. At December 31, 2014, the Corporation had shareholders' equity of $16.3 billion and total debt of $3.3 billion.
Chubb has outstanding $600 million of 5.75% notes and $100 million of 6.6% debentures due in 2018, $200 million of 6.8% debentures due in 2031, $800 million of 6% notes due in 2037, and $600 million of 6.5% notes due in 2038, all of which are unsecured.
Chubb also has outstanding $1.0 billion of unsecured junior subordinated capital securities that will become due on April 15, 2037, the scheduled maturity date, but only to the extent that Chubb has received sufficient net proceeds from the sale of certain qualifying capital securities. Chubb must use its commercially reasonable efforts, subject to certain market disruption events, to sell enough qualifying capital securities to permit repayment of the capital securities on the scheduled maturity date or as soon thereafter as possible. Any remaining outstanding principal amount will be due on March 29, 2067, the final maturity date. The capital securities bear interest at a fixed rate of 6.375% through April 14, 2017. Thereafter, the capital securities will bear interest at a rate equal to the three-month LIBOR rate plus
66
2.25%. Subject to certain conditions, Chubb has the right to defer the payment of interest on the capital securities for a period not exceeding ten consecutive years. During any such period, interest will continue to accrue and Chubb generally may not declare or pay any dividends on or purchase any shares of its capital stock.
In connection with the issuance of the capital securities, Chubb entered into a replacement capital covenant in which it agreed that it will not repay, redeem or purchase the capital securities before March 29, 2047, unless, subject to certain limitations, it has received proceeds from the sale of specified replacement capital securities. Subject to the replacement capital covenant, the capital securities may be redeemed, in whole or in part, at any time on or after April 15, 2017 at a redemption price equal to the principal amount plus any accrued interest on or prior to April 15, 2017 at a redemption price equal to the greater of (i) the principal amount or (ii) a make-whole amount, in each case plus any accrued interest.
Management regularly monitors the Corporation's capital resources. In connection with our long term capital strategy, from time to time Chubb may contribute capital to its property and casualty subsidiaries. In addition, in order to satisfy capital needs as a result of any rating agency capital adequacy or other future rating issues, or in the event we were to need additional capital to make strategic investments in light of market opportunities, we may take a variety of actions, which could include the issuance of additional debt and/or equity securities. We believe that our strong financial position and current debt level provide us with the flexibility and capacity to obtain funds externally through debt or equity financings on both a short term and long term basis.
In December 2010, the Board of Directors authorized the repurchase of up to 30,000,000 shares of common stock. In January 2012, the Board of Directors authorized the repurchase of up to $1.2 billion of Chubb's common stock. In January 2013, the Board of Directors authorized the repurchase of up to $1.3 billion of Chubb's common stock, which authorization replaced the January 2012 authorization. In January 2014, the Board of Directors authorized the repurchase of up to $1.5 billion of Chubb's common stock.
Pursuant to these authorizations, Chubb repurchased shares of its common stock in open market transactions as follows: in 2012, repurchased 13,094,640 shares at a cost of $935 million; in 2013, repurchased 14,887,701 shares at a cost of $1,300 million; and in 2014, repurchased 16,893,455 shares at a cost of $1,555 million.
As of December 31, 2014, $52 million remained under the January 2014 share repurchase authorization. In January 2015, Chubb repurchased $52 million of its common stock under this authorization.
On January 29, 2015, the Board of Directors authorized the repurchase of up to $1.3 billion of Chubb's common stock. The authorization has no expiration date. We expect to complete the repurchase of shares under this authorization by the end of January 2016, subject to market conditions and other factors.
Ratings
Chubb and its property and casualty insurance subsidiaries are rated by major rating agencies. These ratings reflect the rating agency's opinion of our financial strength, operating performance, strategic position and ability to meet our obligations to policyholders.
Credit ratings assess a company's ability to make timely payments of interest and principal on its debt. The following table presents Chubb's credit ratings as determined by the major independent rating organizations as of February 26, 2015.
| A.M. Best | Standard & Poor's | Moody's | Fitch | |||||||||||||
Senior unsecured debt | aa- | A+ | A2 | A+ | ||||||||||||
Junior subordinated capital securities | a | A- | A3 | A- | ||||||||||||
Commercial paper | AMB-1+ | A-1 | P-1 | F1+ | ||||||||||||
67
Financial strength ratings assess an insurer's ability to meet its financial obligations to policyholders. The following table presents our property and casualty subsidiaries' financial strength ratings as determined by the major independent rating organizations as of February 26, 2015.
| A.M. Best | Standard & Poor's | Moody's | Fitch | |||||||||||||
Financial strength | A++ | AA | Aa2 | AA | ||||||||||||
Ratings are an important factor in establishing our competitive position in the insurance markets. There can be no assurance that our ratings will continue for any given period of time or that they will not be changed.
It is possible that one or more of the rating agencies may raise or lower our existing ratings in the future. If our credit ratings were downgraded, we might incur higher borrowing costs and might have more limited means to access capital. A downgrade in our financial strength ratings could adversely affect the competitive position of our insurance operations, including a possible reduction in demand for our products in certain markets.
Liquidity
Liquidity is a measure of a company's ability to generate sufficient cash flows to meet the short and long term cash requirements of its business operations.
The Corporation's liquidity requirements in the past have generally been met by funds from operations and we expect that funds from operations will continue to be sufficient to meet such requirements in the future. Liquidity requirements could also be met by funds received upon the maturity or sale of marketable securities in our investment portfolio. The Corporation also has the ability to borrow under its $500 million credit facility and we believe we could issue debt or equity securities.
Our property and casualty operations provide liquidity in that insurance premiums are generally received months or even years before losses are paid under the policies purchased by such premiums. Cash receipts from operations, consisting of insurance premiums and investment income, provide funds to pay losses, operating expenses and dividends to Chubb. Cash receipts in excess of required cash outflows can be used to build the investment portfolio with the expectation of generating additional investment income in the future.
Our property and casualty subsidiaries maintain substantial investments in highly liquid, short term marketable securities. Accordingly, we do not anticipate selling long term fixed maturities to meet any liquidity needs.
Chubb's liquidity requirements primarily include the payment of dividends to shareholders and interest and principal on debt obligations. The declaration and payment of dividends to Chubb's shareholders is at the discretion of Chubb's Board of Directors and depends upon many factors, including our operating results, financial condition, capital requirements and any regulatory constraints.
As a holding company, Chubb's ability to continue to pay dividends to shareholders and to satisfy its debt obligations relies on the availability of liquid assets, which is dependent in large part on the dividend paying ability of its property and casualty subsidiaries. The timing and amount of dividends paid by the property and casualty subsidiaries to Chubb may vary from year to year. In the United States, our property and casualty subsidiaries are subject to laws and regulations in the jurisdictions in which they operate that restrict the amount and timing of dividends they may pay within twelve consecutive months without the prior approval of regulatory authorities. The restrictions are generally based on net income and on certain levels of policyholders' surplus as determined in accordance with statutory accounting principles. Dividends in excess of such thresholds are considered "extraordinary" and require prior regulatory approval.
During 2014, 2013 and 2012, the property and casualty subsidiaries paid dividends to Chubb of $2.0 billion, $1.6 billion and $1.8 billion, respectively, which were the maximum dividend distributions that these subsidiaries could have paid to Chubb during each year without prior regulatory approval.
68
Nevertheless, the dividends paid in 2012 included two interim payments totaling $830 million that were deemed to be extraordinary under applicable insurance regulations due to the limitation on the amount of dividends that may be paid within twelve consecutive months. Regulatory approval was required and obtained for the payment of these dividends. Whether any dividends the property and casualty subsidiaries may pay in 2015 require regulatory approval will depend on the amount and timing of the dividend payments. The maximum aggregate dividend distribution that may be made by the subsidiaries to Chubb during 2015 without prior regulatory approval is approximately $1.9 billion.
The Corporation's strong underwriting and investment results generated substantial positive operating cash flows of $2.2 billion, $1.7 billion and $2.3 billion in 2014, 2013 and 2012, respectively. In 2014, cash provided by operating activities increased approximately $420 million compared with 2013 primarily as a result of higher premium collections and lower tax payments. The lower tax payments in 2014 were attributable to lower taxable income compared with 2013. In 2013, cash provided by operating activities decreased approximately $570 million compared with 2012 primarily as a result of higher tax payments and higher loss payments, partially offset by modestly higher premium collections. The higher tax payments in 2013 were attributable to higher taxable income compared with 2012. The higher amount of loss payments in 2013 compared with 2012 reflected substantially higher catastrophe-related payments during the year, including payments related to Storm Sandy.
Chubb has a revolving credit agreement with a syndicate of banks that provides for up to $500 million of unsecured borrowings. The revolving credit facility is available for general corporate purposes. The agreement has a maturity date of September 24, 2017. Various interest rate options are available to Chubb, all of which are based on market interest rates. The agreement contains customary restrictive covenants, including a covenant to maintain a minimum adjusted consolidated shareholders' equity. At December 31, 2014, Chubb was in compliance with all such covenants. Chubb is permitted to request an increase in the credit available under the agreement, no more than two times per year, up to a maximum facility amount of $750 million. Chubb is permitted to request on two occasions, at any time during the term of the agreement, an extension of the maturity date for an additional one year period. There have been no borrowings under this agreement. On the maturity date of the agreement, any borrowings then outstanding become payable.
Contractual Obligations and Off-Balance Sheet Arrangements
The following table provides our future payments due by period under contractual obligations as of December 31, 2014, aggregated by type of obligation.
| 2015 | 2016 and 2017 | 2018 and 2019 | Thereafter | Total | ||||||||||||||||
| (in millions) | ||||||||||||||||||||
Principal due under long term debt | $ | - | $ | - | $ | 700 | $ | 2,600 | $ | 3,300 | ||||||||||
Interest payments on long term debt (a) | 205 | 392 | 275 | 2,163 | 3,035 | |||||||||||||||
Purchase obligations (b) | 142 | 173 | 77 | 16 | 408 | |||||||||||||||
Future minimum rental payments under operating leases | 63 | 99 | 70 | 81 | 313 | |||||||||||||||
|
|
|
|
|
|
|
|
|
| |||||||||||
| 410 | 664 | 1,122 | 4,860 | 7,056 | ||||||||||||||||
Loss and loss expense reserves (c) | 4,876 | 5,556 | 3,062 | 9,184 | 22,678 | |||||||||||||||
|
|
|
|
|
|
|
|
|
| |||||||||||
Total | $ | 5,286 | $ | 6,220 | $ | 4,184 | $ | 14,044 | $ | 29,734 | ||||||||||
|
|
|
|
|
|
|
|
|
| |||||||||||
| (a) | Junior subordinated capital securities of $1 billion bear interest at a fixed rate of 6.375% through April 14, 2017 and at a rate equal to the three-month LIBOR rate plus 2.25% thereafter. For purposes of the above table, interest after April 14, 2017 was calculated using the three-month LIBOR rate as of December 31, 2014. The table includes future interest payments through the scheduled maturity date, April 15, 2037. Interest payments for the period from the scheduled maturity date through the final maturity date, March 29, 2067, would increase the contractual obligation by $751 million. It is our expectation that the capital securities will be redeemed at the end of the fixed interest rate period. |
69
| (b) | Includes agreements with vendors to purchase various goods and services such as information technology, human resources and administrative services. |
| (c) | There is typically no stated contractual commitment associated with property and casualty insurance loss reserves. The obligation to pay a claim arises only when a covered loss event occurs and a settlement is reached. The vast majority of our loss reserves relate to claims for which settlements have not yet been reached. Our loss reserves therefore represent estimates of future payments. These estimates are dependent on the outcome of claim settlements that will occur over many years. Accordingly, the payment of the loss reserves is not fixed as to either amount or timing. The estimate of the timing of future payments is based on our historical loss payment patterns. The ultimate amount and timing of loss payments will likely differ from our estimate and the differences could be material. We expect that these loss payments will be funded, in large part, by future cash receipts from operations. |
The above table excludes certain commitments totaling approximately $860 million at December 31, 2014 to fund limited partnership investments. These commitments can be called by the partnerships (generally over a period of five years or less), if and when needed by the partnerships to fund certain partnership expenses or the purchase of investments. It is uncertain whether and, if so, when we will be required to fund these commitments. There is no predetermined payment schedule.
The Corporation does not have any off-balance sheet arrangements that are reasonably likely to have a material effect on the Corporation's financial condition, results of operations, liquidity or capital resources, other than as disclosed in Note (12) of the Notes to Consolidated Financial Statements.
INVESTED ASSETS
The main objectives in managing our investment portfolios are to maximize after-tax investment income and total investment return while managing credit risk and interest rate risk in order to ensure that funds will be available to meet our insurance obligations. Investment strategies are developed based on many factors including underwriting results and our resulting tax position, regulatory requirements, fluctuations in interest rates and consideration of other market risks. Investment decisions are centrally managed by investment professionals based on guidelines established by management and approved by the boards of directors of Chubb and its respective operating companies.
Our investment portfolio primarily comprises high quality bonds, principally tax exempt securities, corporate bonds, U.S. Treasury securities and mortgage-backed securities, as well as foreign government and corporate bonds that support our operations outside the United States. The portfolio also includes equity securities, primarily publicly traded common stocks, and other invested assets, primarily private equity limited partnerships, all of which are held with the primary objective of capital appreciation.
Limited partnership investments by their nature are less liquid and may involve more risk than other investments. We actively manage our risk through diversification of asset class and geographic location. At December 31, 2014, we had investments in about 95 separate partnerships. We review the performance of these investments on a quarterly basis and we obtain audited financial statements annually.
During 2014, we increased our holdings of U.S. Treasury securities and tax exempt fixed maturities and we reduced our holdings of mortgage-backed securities and corporate bonds. During 2013 and 2012, we increased our holdings of corporate bonds and we reduced our holdings of tax exempt fixed maturities, mortgage-backed securities and private equity limited partnerships. Our objective is to achieve the appropriate mix of taxable and tax exempt securities in our portfolio to balance both investment and tax strategies. At December 31, 2014, 63% of our U.S. fixed maturity portfolio was invested in tax exempt securities compared with 62% and 65% at December 31, 2013 and December 31, 2012, respectively.
We classify our fixed maturities, which may be sold prior to maturity to support our investment strategies, such as in response to changes in interest rates and the yield curve or to maximize after-tax returns, as available-for-sale. Fixed maturities classified as available-for-sale are carried at fair value.
70
Changes in the general interest rate environment affect the returns available on new fixed maturities. While a rising interest rate environment enhances the returns available on new investments, it reduces the fair value of existing fixed maturities and thus the availability of gains on disposition. A decline in interest rates reduces the returns available on new investments but increases the fair value of existing investments, creating the opportunity for realized investment gains on disposition.
The net unrealized appreciation before tax of our fixed maturities and equity securities carried at fair value was $2.7 billion at December 31, 2014, $1.9 billion at December 31, 2013 and $3.1 billion at December 31, 2012. Such unrealized appreciation is reflected in accumulated other comprehensive income, net of applicable deferred income taxes.
In 2014 and 2012, market yields on fixed maturities declined, resulting in an increase in the fair value of many of our fixed maturities. In 2013, market yields on fixed maturities increased, resulting in a decrease in the fair value of many of our fixed maturities.
FAIR VALUES OF FINANCIAL INSTRUMENTS
Fair values of financial instruments are determined by management using valuation techniques that maximize the use of observable inputs and minimize the use of unobservable inputs. Fair values are generally measured using quoted prices in active markets for identical assets or liabilities or other inputs, such as quoted prices for similar assets or liabilities, that are observable, either directly or indirectly. In those instances where observable inputs are not available, fair values are measured using unobservable inputs for the asset or liability. Unobservable inputs reflect our own assumptions about the assumptions that market participants would use in pricing the asset or liability and are developed based on the best information available in the circumstances. Fair value estimates derived from unobservable inputs are affected by the assumptions used, including the discount rates and the estimated amounts and timing of future cash flows. The derived fair value estimates cannot be substantiated by comparison to independent markets and are not necessarily indicative of the amounts that would be realized in a current market exchange.
The fair value hierarchy prioritizes the inputs to valuation techniques used to measure fair value into three broad levels as follows:
Level 1 | - | Unadjusted quoted prices in active markets for identical financial instruments. | ||||
Level 2 | - | Other inputs that are observable for the financial instrument, either directly or indirectly. | ||||
Level 3 | - | Significant unobservable inputs. |
The methods and assumptions used to estimate the fair values of financial instruments are as follows:
The carrying value of short term investments approximates fair value due to the short maturities of these investments.
Fair values of fixed maturities are determined by management, utilizing prices obtained from a third party, nationally recognized pricing service or, in the case of securities for which prices are not provided by a pricing service, from third party brokers. For fixed maturities that have quoted prices in active markets, market quotations are provided. For fixed maturities that do not trade on a daily basis, the pricing service and brokers provide fair value estimates using a variety of inputs including, but not limited to, benchmark yields, reported trades, broker/dealer quotes, issuer spreads, bids, offers, reference data, prepayment rates and measures of volatility. Management reviews on an ongoing basis the reasonableness of the methodologies used by the relevant pricing service and brokers. In addition, management, using the prices received for the securities from the pricing service and brokers, determines the aggregate portfolio price performance and reviews it against applicable indices. If management believes that significant discrepancies exist, it will discuss these with the relevant pricing service or broker to resolve the discrepancies.
Fair values of equity securities are determined by management, utilizing quoted market prices.
71
Fair values of long term debt issued by Chubb are determined by management, utilizing prices obtained from a third party, nationally recognized pricing service.
At December 31, 2014 and 2013, a pricing service provided fair value amounts for approximately 99% of our fixed maturities. The prices we obtain from a pricing service and brokers generally are non-binding, but are reflective of current market transactions in the applicable financial instruments. At December 31, 2014 and 2013, we held an insignificant amount of financial instruments in our investment portfolio for which a lack of market liquidity impacted our determination of fair value.
The methods and assumptions used to estimate the fair value of the Corporation's pension plan and other postretirement benefit plan assets, other than assets invested in pooled funds, are similar to the methods and assumptions used for our other financial instruments. The fair value of pooled funds is based on the net asset value of the funds. At December 31, 2014 and 2013, approximately 99% of the pension plan and other postretirement benefit plan assets were categorized as Level 1 or Level 2 in the fair value hierarchy.
PENSION AND OTHER POSTRETIREMENT BENEFITS
In 2014, the liability related to our pension and other postretirement benefit plans increased, primarily as a result of actuarial losses attributable to the decrease in the discount rates used to value our pension and other postretirement obligations and, to a lesser extent, a change in our mortality assumption. The change in our mortality assumption reflects the consideration given to the October 2014 revision of the Society of Actuaries' mortality tables. Postretirement benefit costs not recognized in net income increased by $515 million before tax, which was reflected in other comprehensive income, net of applicable deferred income taxes.
In 2013, the liability related to our pension and other postretirement benefit plans decreased, primarily as a result of actuarial gains attributable to the increase in the discount rates used to value our pension and other postretirement obligations and an increase in the fair value of the assets held by our pension and other postretirement benefit plans in excess of the expected return on plan assets. In 2012, the liability related to our pension and other postretirement benefit plans increased, primarily as a result of actuarial losses attributable to the decrease in the discount rates used to value our pension and other postretirement obligations, partially offset by an increase in the fair value of the assets held by our pension and other postretirement benefit plans in excess of the expected return on plan assets. Postretirement benefit costs not recognized in net income decreased by $715 million before tax in 2013 and increased by $45 million before tax in 2012, which were reflected in other comprehensive income, net of applicable deferred income taxes.
Employee benefits are discussed further in Note (10) of the Notes to Consolidated Financial Statements.
72
| Item 7A. | Quantitative and Qualitative Disclosures About Market Risk |
Market risk represents the potential for loss due to adverse changes in the fair value of financial instruments. Our primary exposure to market risks relates to our investment portfolio, which is sensitive to changes in interest rates and, to a lesser extent, credit quality, prepayment, foreign currency exchange rates and equity prices. We also have exposure to market risks through our debt obligations. Analytical tools and monitoring systems are in place to assess each of these elements of market risk.
INVESTMENT PORTFOLIO
Interest Rate Risk
Interest rate risk is the price sensitivity of a security that promises a fixed return to changes in interest rates. When market interest rates rise, the fair value of our fixed income securities decreases. We view the potential changes in price of our fixed income investments within the overall context of asset and liability management. Our actuaries estimate the payout pattern of our liabilities, primarily our property and casualty loss reserves, to determine their duration. Expressed in years, duration is the weighted average payment period of cash flows, where the weighting is based on the present value of the cash flows. We set duration targets for our fixed income investment portfolios after consideration of the estimated duration of these liabilities and other factors, which allows us to prudently manage the overall effect of interest rate risk for the Corporation.
The following table provides information about our fixed maturities, which are sensitive to changes in interest rates. The table presents cash flows of principal amounts and related weighted average interest rates by expected maturity dates at December 31, 2014 and 2013. Consideration is given to the call dates of securities trading above par value and the expected prepayment patterns of mortgage-backed securities. Actual cash flows could differ from the expected amounts, primarily due to future changes in interest rates.
| At December 31, 2014 | ||||||||||||||||||||||||||||||||
| Total | ||||||||||||||||||||||||||||||||
| 2015 | 2016 | 2017 | 2018 | 2019 | Thereafter | Amortized Cost | Fair Value | |||||||||||||||||||||||||
| (in millions) | ||||||||||||||||||||||||||||||||
Tax exempt | $ | 2,106 | $ | 1,745 | $ | 1,602 | $ | 1,255 | $ | 1,696 | $ | 10,210 | $ | 18,614 | $ | 19,772 | ||||||||||||||||
Average interest rate | 4.1 | % | 4.2 | % | 4.3 | % | 4.5 | % | 4.4 | % | 3.3 | % | ||||||||||||||||||||
Taxable - other than mortgage-backed securities | 2,309 | 2,089 | 2,794 | 2,228 | 1,766 | 5,897 | 17,083 | 17,707 | ||||||||||||||||||||||||
Average interest rate | 2.6 | % | 2.2 | % | 2.8 | % | 3.2 | % | 3.6 | % | 3.5 | % | ||||||||||||||||||||
Mortgage-backed securities | 558 | 181 | 72 | 53 | 62 | 335 | 1,261 | 1,301 | ||||||||||||||||||||||||
Average interest rate | 5.3 | % | 4.8 | % | 4.3 | % | 3.9 | % | 3.6 | % | 3.4 | % | ||||||||||||||||||||
|
|
|
|
|
|
|
|
|
|
|
|
|
|
|
| |||||||||||||||||
Total | $ | 4,973 | $ | 4,015 | $ | 4,468 | $ | 3,536 | $ | 3,524 | $ | 16,442 | $ | 36,958 | $ | 38,780 | ||||||||||||||||
|
|
|
|
|
|
|
|
|
|
|
|
|
|
|
| |||||||||||||||||
| At December 31, 2013 | ||||||||||||||||||||||||||||||||
| Total | ||||||||||||||||||||||||||||||||
| 2014 | 2015 | 2016 | 2017 | 2018 | Thereafter | Amortized Cost | Fair Value | |||||||||||||||||||||||||
| (in millions) | ||||||||||||||||||||||||||||||||
Tax exempt | $ | 2,118 | $ | 2,036 | $ | 1,831 | $ | 1,656 | $ | 1,265 | $ | 8,902 | $ | 17,808 | $ | 18,421 | ||||||||||||||||
Average interest rate | 4.1 | % | 4.0 | % | 4.2 | % | 4.3 | % | 4.5 | % | 3.7 | % | ||||||||||||||||||||
Taxable - other than mortgage-backed securities | 1,563 | 2,153 | 1,837 | 2,841 | 2,183 | 5,958 | 16,535 | 17,006 | ||||||||||||||||||||||||
Average interest rate | 3.9 | % | 3.1 | % | 3.0 | % | 3.1 | % | 3.2 | % | 3.7 | % | ||||||||||||||||||||
Mortgage-backed securities | 723 | 311 | 194 | 104 | 55 | 229 | 1,616 | 1,664 | ||||||||||||||||||||||||
Average interest rate | 5.2 | % | 5.1 | % | 4.9 | % | 4.4 | % | 4.0 | % | 3.8 | % | ||||||||||||||||||||
|
|
|
|
|
|
|
|
|
|
|
|
|
|
|
| |||||||||||||||||
Total | $ | 4,404 | $ | 4,500 | $ | 3,862 | $ | 4,601 | $ | 3,503 | $ | 15,089 | $ | 35,959 | $ | 37,091 | ||||||||||||||||
|
|
|
|
|
|
|
|
|
|
|
|
|
|
|
| |||||||||||||||||
73
At December 31, 2014, our tax exempt fixed maturity portfolio had an average expected maturity of about five years. Our taxable fixed maturity portfolio had an average expected maturity of about four years.
Credit Risk
Credit risk is the potential loss resulting from adverse changes in an issuer's ability to repay its debt obligations. We have consistently invested in high quality marketable securities. At December 31, 2014, less than 2% of our fixed maturity portfolio was below investment grade. Our investment portfolio did not have any direct exposure to either sub-prime mortgages or collateralized debt obligations.
Our decisions to acquire and hold specific tax exempt fixed maturities and taxable fixed maturities are primarily based on an initial and ongoing evaluation of the underlying characteristics, including credit quality, sector, structure and liquidity of the issuer, performed by our internal investment professionals. Third party credit ratings are also used by our investment professionals to help assess the relative credit quality of the issuer and manage the overall credit risk of our fixed maturity portfolio. About 95% of the third party credit ratings of our fixed maturity portfolio are obtained from Moody's Investors Service.
Our tax exempt fixed maturities comprise bonds issued by states, municipalities and political subdivisions within the United States. Our holdings consist of: special revenue bonds issued by state and local government agencies; state, municipal and political subdivision general obligation bonds; and pre-refunded bonds for which an irrevocable trust containing U.S. government or government agency obligations has been established to fund the remaining payment of principal and interest.
Our evaluation of a special revenue bond includes analyzing key credit factors such as the structure of the revenue pledge, the rate covenant, debt service reserve fund, margin of debt service coverage and the issuer's historic financial performance. Our evaluation of a general obligation bond issued by a state, municipality or political subdivision includes analyzing key credit factors such as the economic and financial condition of the issuer and its ability and commitment to service its debt.
At December 31, 2014, about 75% of our tax exempt securities were rated Aa or better with about 20% rated Aaa. The average rating of our tax exempt securities was Aa. While about 10% of our tax exempt securities were insured, the effect of insurance on the average credit rating of these securities was insignificant. The insured tax exempt securities in our portfolio have been selected based on the quality of the underlying credit and not the value of the credit insurance enhancement.
At December 31, 2014, 11% of our taxable fixed maturity portfolio was invested in U.S. government and government agency and authority obligations other than mortgage-backed securities and had an average rating of Aaa. About 80% of the U.S. government and government agency and authority obligations other than mortgage-backed securities were U.S. Treasury securities with an average rating of Aaa and the remainder were taxable bonds issued by states, municipalities and political subdivisions within the United States with an average rating of Aa.
At December 31, 2014, 47% of our taxable fixed maturity portfolio consisted of corporate bonds that were issued by a diverse group of U.S. and foreign issuers and had an average rating of A. About 60% of our corporate bonds were issued by U.S. companies and about 40% were issued by foreign companies. At December 31, 2014, about 2% of our foreign corporate bonds were below investment grade.
At December 31, 2014, 35% of our taxable fixed maturity portfolio was invested in foreign government and government agency obligations, which had an average rating of Aa. The foreign government and government agency obligations consisted of high quality securities, primarily issued by national governments and, to a lesser extent, government agencies, regional governments and supranational organizations. The five largest sovereign issuers within our portfolio were Canada, the United Kingdom, Germany, Australia and Brazil, which collectively accounted for about 75% of our total foreign government and government agency obligations. Another 7% of our total foreign government and government agency obligations were issued by supranational organizations. At December 31, 2014, none of our foreign government and government agency obligations were below investment grade. We did not hold any foreign government or government agency obligations that have third party guarantees.
74
At December 31, 2014, 7% of our taxable fixed maturity portfolio was invested in mortgage-backed securities. About 95% of the mortgage-backed securities were rated Aaa. About half of the remaining 5% were below investment grade. Of the Aaa rated securities, 88% were call protected, commercial mortgage-backed securities (CMBS). All of our CMBS were senior securities with the highest level of credit support. The other 12% of the Aaa rated securities were residential mortgage-backed securities, consisting of government agency pass-through securities guaranteed by a government agency or a government sponsored enterprise and collateralized mortgage obligations backed by single family home mortgages.
Prepayment risk refers to the changes in prepayment patterns related to decreases and increases in interest rates that can either shorten or lengthen the expected timing of the principal repayments and thus the average life of a security, potentially reducing or increasing its effective yield. Such risk exists primarily within our portfolio of residential mortgage-backed securities. We monitor such risk regularly.
Foreign Currency Risk
Foreign currency risk is the sensitivity to foreign exchange rate fluctuations of the fair value and investment income related to foreign currency denominated financial instruments. The functional currency of our foreign operations is generally the currency of the local operating environment since business is primarily transacted in such local currency. We seek to mitigate the risks relating to currency fluctuations by generally maintaining investments in those foreign currencies in which our property and casualty subsidiaries have loss reserves and other liabilities, thereby limiting exchange rate risk to the net assets denominated in foreign currencies.
At December 31, 2014, the property and casualty subsidiaries held foreign currency denominated investments of $7.3 billion supporting our international operations. The principal currencies creating foreign exchange rate risk for the property and casualty subsidiaries were the Canadian dollar, the British pound sterling, the euro and the Australian dollar. The following table provides information about those fixed maturities that are denominated in these currencies. The table presents cash flows of principal amounts in U.S. dollar equivalents by expected maturity dates at December 31, 2014. Actual cash flows could differ from the expected amounts.
| At December 31, 2014 | ||||||||||||||||||||||||||||||||
| Total | ||||||||||||||||||||||||||||||||
| 2015 | 2016 | 2017 | 2018 | 2019 | Thereafter | Amortized Cost | Fair Value | |||||||||||||||||||||||||
| (in millions) | ||||||||||||||||||||||||||||||||
Canadian dollar | $ | 204 | $ | 363 | $ | 235 | $ | 249 | $ | 212 | $ | 545 | $ | 1,808 | $ | 1,874 | ||||||||||||||||
British pound sterling | 215 | 137 | 246 | 197 | 235 | 665 | 1,695 | 1,782 | ||||||||||||||||||||||||
Euro | 108 | 103 | 181 | 143 | 162 | 565 | 1,262 | 1,352 | ||||||||||||||||||||||||
Australian dollar | 59 | 69 | 166 | 43 | 150 | 549 | 1,036 | 1,098 | ||||||||||||||||||||||||
Equity Price Risk
Equity price risk is the potential loss in fair value of our equity securities resulting from adverse changes in stock prices. In general, equities have more year-to-year price variability than intermediate term high grade bonds. However, returns over longer time frames have generally been higher. Our publicly traded equity securities are high quality, diversified across industries and readily marketable. A hypothetical decrease of 10% in the market price of each of the equity securities held at December 31, 2014 and 2013 would have resulted in a decrease of $196 million and $181 million, respectively, in the fair value of the equity securities portfolio.
All of the above risks are monitored on an ongoing basis. A combination of in-house systems and proprietary models and externally licensed software are used to analyze individual securities as well as each portfolio. These tools provide the portfolio managers with information to assist them in the evaluation of the market risks of the portfolio.
75
DEBT
Interest Rate Risk
We also have interest rate risk on our debt obligations. The following table presents expected cash flow of principal amounts and related weighted average interest rates by maturity date of our long term debt obligations at December 31, 2014.
| At December 31, 2014 | ||||||||||||||||||||||||||||||||
| 2015 | 2016 | 2017 | 2018 | 2019 | Thereafter | Total | Fair Value | |||||||||||||||||||||||||
| (in millions) | ||||||||||||||||||||||||||||||||
Expected cash flows of principal amounts | $ | - | $ | - | $ | - | $ | 700 | $ | - | $ | 2,600 | $ | 3,300 | $ | 4,013 | ||||||||||||||||
Average interest rate | - | - | - | 5.9 | % | - | 6.3 | % | ||||||||||||||||||||||||
| Item 8. | Consolidated Financial Statements and Supplementary Data |
Consolidated financial statements of the Corporation at December 31, 2014 and 2013 and for each of the three years in the period ended December 31, 2014 and the report thereon of our independent registered public accounting firm, and the Corporation's unaudited quarterly financial data for the two-year period ended December 31, 2014 are listed in Item 15(a) of this report.
| Item 9. | Changes in and Disagreements with Accountants on Accounting and Financial Disclosure |
None.
| Item 9A. | Controls and Procedures |
As of December 31, 2014, an evaluation of the effectiveness of the design and operation of the Corporation's disclosure controls and procedures, as such term is defined in Rule 13a-15(e) of the Securities Exchange Act of 1934, was performed under the supervision and with the participation of the Corporation's management, including Chubb's chief executive officer and chief financial officer. Based on that evaluation, the chief executive officer and chief financial officer concluded that the Corporation's disclosure controls and procedures were effective as of December 31, 2014.
During the three month period ended December 31, 2014, there were no changes in internal control over financial reporting that have materially affected, or are reasonably likely to materially affect, the Corporation's internal control over financial reporting.
76
Management's Report on Internal Control over Financial Reporting
Management of the Corporation is responsible for establishing and maintaining adequate internal control over financial reporting, as such term is defined in Rule 13a-15(f) of the Securities Exchange Act of 1934. The Corporation's internal control over financial reporting is a process designed under the supervision of and with the participation of the Corporation's management, including Chubb's chief executive officer and chief financial officer, to provide reasonable assurance regarding the reliability of the Corporation's financial reporting and the preparation and fair presentation of published financial statements in accordance with U.S. generally accepted accounting principles.
Because of its inherent limitations, internal control over financial reporting may not prevent or detect all misstatements. Therefore, even those systems determined to be effective can provide only reasonable assurance with respect to financial statement preparation and presentation. Also, projections of any evaluation of effectiveness to future periods are subject to the risk that controls may become inadequate because of changes in conditions, or that the degree of compliance with the policies or procedures may deteriorate.
Management conducted an assessment of the effectiveness of the Corporation's internal control over financial reporting as of December 31, 2014. In making this assessment, management used the framework set forth in Internal Control - Integrated Framework issued in 2013 by the Committee of Sponsoring Organizations of the Treadway Commission. Based on this assessment, management has determined that, as of December 31, 2014, the Corporation's internal control over financial reporting was effective.
The Corporation's internal control over financial reporting as of December 31, 2014 has been audited by Ernst & Young LLP, the independent registered public accounting firm who also audited the Corporation's consolidated financial statements. Their attestation report on the Corporation's internal control over financial reporting is shown on the following page.
| Item 9B. | Other Information |
None.
77
Report of Independent Registered Public Accounting Firm
The Board of Directors and Shareholders
The Chubb Corporation
We have audited The Chubb Corporation's internal control over financial reporting as of December 31, 2014, based on criteria established in Internal Control - Integrated Framework issued by the Committee of Sponsoring Organizations of the Treadway Commission (2013 framework) (the COSO criteria). The Chubb Corporation's management is responsible for maintaining effective internal control over financial reporting, and for its assessment of the effectiveness of internal control over financial reporting included in the accompanying Management's Report on Internal Control over Financial Reporting. Our responsibility is to express an opinion on the Corporation's internal control over financial reporting based on our audit.
We conducted our audit in accordance with the standards of the Public Company Accounting Oversight Board (United States). Those standards require that we plan and perform the audit to obtain reasonable assurance about whether effective internal control over financial reporting was maintained in all material respects. Our audit included obtaining an understanding of internal control over financial reporting, assessing the risk that a material weakness exists, testing and evaluating the design and operating effectiveness of internal control based on the assessed risk, and performing such other procedures as we considered necessary in the circumstances. We believe that our audit provides a reasonable basis for our opinion.
A company's internal control over financial reporting is a process designed to provide reasonable assurance regarding the reliability of financial reporting and the preparation of financial statements for external purposes in accordance with generally accepted accounting principles. A company's internal control over financial reporting includes those policies and procedures that (1) pertain to the maintenance of records that, in reasonable detail, accurately and fairly reflect the transactions and dispositions of the assets of the company; (2) provide reasonable assurance that transactions are recorded as necessary to permit preparation of financial statements in accordance with generally accepted accounting principles, and that receipts and expenditures of the company are being made only in accordance with authorizations of management and directors of the company; and (3) provide reasonable assurance regarding prevention or timely detection of unauthorized acquisition, use, or disposition of the company's assets that could have a material effect on the financial statements.
Because of its inherent limitations, internal control over financial reporting may not prevent or detect misstatements. Also, projections of any evaluation of effectiveness to future periods are subject to the risk that controls may become inadequate because of changes in conditions, or that the degree of compliance with the policies or procedures may deteriorate.
In our opinion, The Chubb Corporation maintained, in all material respects, effective internal control over financial reporting as of December 31, 2014, based on the COSO criteria.
We also have audited, in accordance with the standards of the Public Company Accounting Oversight Board (United States), the consolidated balance sheets of The Chubb Corporation as of December 31, 2014 and 2013, and the related consolidated statements of income, comprehensive income, shareholders' equity and cash flows for each of the three years in the period ended December 31, 2014, and our report dated February 26, 2015 expressed an unqualified opinion thereon.
/s/ E RNST & Y OUNG LLP
New York, New York
February 26, 2015
78
PART III.
| Item 10. | Directors, Executive Officers and Corporate Governance |
Information regarding Chubb's directors is incorporated by reference from Chubb's definitive Proxy Statement for the 2015 Annual Meeting of Shareholders under the caption "Our Board of Directors." Information regarding Chubb's executive officers is included in Part I of this report under the caption "Executive Officers of the Registrant." Information regarding Section 16 reporting compliance of Chubb's directors, executive officers and greater than 10% beneficial owners is incorporated by reference from Chubb's definitive Proxy Statement for the 2015 Annual Meeting of Shareholders under the caption "Section 16(a) Beneficial Ownership Reporting Compliance." Information regarding Chubb's Code of Ethics for CEO and Senior Financial Officers is included in Item 1 of this report under the caption "Business - General." Information regarding the Audit Committee of Chubb's Board of Directors and its Audit Committee financial experts is incorporated by reference from Chubb's definitive Proxy Statement for the 2015 Annual Meeting of Shareholders under the captions "Corporate Governance - Audit Committee" and "Committee Assignments."
| Item 11. | Executive Compensation |
Incorporated by reference from Chubb's definitive Proxy Statement for the 2015 Annual Meeting of Shareholders, under the captions "Corporate Governance - Compensation Committee Interlocks and Insider Participation," "Corporate Governance - Directors' Compensation," "Compensation Committee Report," "Compensation Discussion and Analysis" and "Executive Compensation."
| Item 12. | Security Ownership of Certain Beneficial Owners and Management and Related Stockholder Matters |
Incorporated by reference from Chubb's definitive Proxy Statement for the 2015 Annual Meeting of Shareholders, under the captions "Security Ownership of Certain Beneficial Owners and Management" and "Equity Compensation Plan Information."
| Item 13. | Certain Relationships and Related Transactions, and Director Independence |
Incorporated by reference from Chubb's definitive Proxy Statement for the 2015 Annual Meeting of Shareholders, under the captions "Corporate Governance - Director Independence," "Corporate Governance - Related Person Transactions" and "Certain Transactions and Other Matters."
| Item 14. | Principal Accounting Fees and Services |
Incorporated by reference from Chubb's definitive Proxy Statement for the 2015 Annual Meeting of Shareholders, under the caption "Proposal 2: Ratification of Appointment of Independent Auditor."
PART IV.
| Item 15. | Exhibits, Financial Statements and Schedules |
The financial statements and schedules listed in the accompanying index to financial statements and financial statement schedules are filed as part of this report.
The exhibits listed in the accompanying index to exhibits are filed as part of this report.
79
SIGNATURES
Pursuant to the requirements of Section 13 or 15(d) of the Securities Exchange Act of 1934, the registrant has duly caused this report to be signed on its behalf by the undersigned, thereunto duly authorized.
| T HE C HUBB C ORPORATION | ||
(Registrant) | ||
February 26, 2015
| By | / S / J OHN D. F INNEGAN | |
| (John D. Finnegan Chairman, President and | ||
| Chief Executive Officer) |
Pursuant to the requirements of the Securities Exchange Act of 1934, this report has been signed below by the following persons on behalf of the registrant and in the capacities and on the dates indicated:
Signature | Title | Date | ||
/ S / J OHN D. F INNEGAN (John D. Finnegan) | Chairman, President, Chief Executive Officer and Director | February 26, 2015 | ||
/ S / Z OË B AIRD B UDINGER (Zoë Baird Budinger) | Director | February 26, 2015 | ||
/ S / S HEILA P. B URKE (Sheila P. Burke) | Director | February 26, 2015 | ||
/ S / J AMES I. C ASH , J R . (James I. Cash, Jr.) | Director | February 26, 2015 | ||
/ S / T IMOTHY P. F LYNN (Timothy P. Flynn) | Director | February 26, 2015 | ||
/ S / K AREN M. H OGUET (Karen M. Hoguet) | Director | February 26, 2015 | ||
/ S / L AWRENCE W. K ELLNER (Lawrence W. Kellner) | Director | February 26, 2015 | ||
/ S / M ARTIN G. M C G UINN (Martin G. McGuinn) | Director | February 26, 2015 | ||
/ S / L AWRENCE M. S MALL (Lawrence M. Small) | Director | February 26, 2015 | ||
/ S / J ESS S ØDERBERG (Jess Søderberg) | Director | February 26, 2015 | ||
80
Signature | Title | Date | ||
/ S / D ANIEL E. S OMERS (Daniel E. Somers) | Director | February 26, 2015 | ||
/ S / W ILLIAM C. W ELDON (William C. Weldon) | Director | February 26, 2015 | ||
/ S / J AMES M. Z IMMERMAN (James M. Zimmerman) | Director | February 26, 2015 | ||
/ S / A LFRED W. Z OLLAR (Alfred W. Zollar) | Director | February 26, 2015 | ||
/ S / R ICHARD G. S PIRO (Richard G. Spiro) | Executive Vice President and Chief Financial Officer | February 26, 2015 | ||
/ S / J OHN J. K ENNEDY (John J. Kennedy) | Senior Vice President and Chief Accounting Officer | February 26, 2015 | ||
81
THE CHUBB CORPORATION
INDEX TO FINANCIAL STATEMENTS AND FINANCIAL STATEMENT SCHEDULES
(Item 15(a))
| Form 10-K Page | ||||||
Report of Independent Registered Public Accounting Firm | F-2 | |||||
Consolidated Statements of Income for the Years Ended | F-3 | |||||
Consolidated Statements of Comprehensive Income for the Years Ended | F-4 | |||||
Consolidated Balance Sheets at December 31, 2014 and 2013 | F-5 | |||||
Consolidated Statements of Shareholders' Equity for the Years Ended | F-6 | |||||
Consolidated Statements of Cash Flows for the Years Ended | F-7 | |||||
Notes to Consolidated Financial Statements | ||||||
(1) – Summary of Significant Accounting Policies | F-8 | |||||
(2) – Invested Assets and Related Income | F-12 | |||||
(3) – Deferred Policy Acquisition Costs | F-17 | |||||
(4) – Property and Equipment | F-17 | |||||
(5) – Unpaid Losses and Loss Expenses | F-18 | |||||
(6) – Debt and Credit Arrangements | F-23 | |||||
(7) – Federal and Foreign Income Tax | F-25 | |||||
(8) – Reinsurance | F-26 | |||||
(9) – Stock-Based Employee Compensation Plans | F-27 | |||||
(10) – Employee Benefits | F-29 | |||||
(11) – Comprehensive Income | F-32 | |||||
(12) – Commitments and Contingent Liabilities | F-33 | |||||
(13) – Segments Information | F-34 | |||||
(14) – Fair Value of Financial Instruments | F-36 | |||||
(15) – Earnings Per Share | F-39 | |||||
(16) – Shareholders' Equity | F-40 | |||||
Supplementary Information (unaudited) | ||||||
Quarterly Financial Data | F-42 | |||||
Schedules: | ||||||
| I - | Consolidated Summary of Investments - Other than Investments in Related Parties at December 31, 2014 | S-1 | ||||
| II - | Condensed Financial Information of Registrant at December 31, 2014 and 2013 and for the Years Ended December 31, 2014, 2013 and 2012 | S-2 | ||||
| III - | Consolidated Supplementary Insurance Information at and for the Years | S-5 | ||||
All other schedules are omitted since the required information is not present or is not present in amounts sufficient to require submission of the schedule, or because the information required is included in the financial statements and notes thereto.
F-1
REPORT OF INDEPENDENT REGISTERED PUBLIC ACCOUNTING FIRM
The Board of Directors and Shareholders
The Chubb Corporation
We have audited the accompanying consolidated balance sheets of The Chubb Corporation as of December 31, 2014 and 2013, and the related consolidated statements of income, comprehensive income, shareholders' equity and cash flows for each of the three years in the period ended December 31, 2014. Our audits also included the financial statement schedules listed in the Index at Item 15(a). These financial statements and schedules are the responsibility of the Corporation's management. Our responsibility is to express an opinion on these financial statements and schedules based on our audits.
We conducted our audits in accordance with the standards of the Public Company Accounting Oversight Board (United States). Those standards require that we plan and perform the audit to obtain reasonable assurance about whether the financial statements are free of material misstatement. An audit includes examining, on a test basis, evidence supporting the amounts and disclosures in the financial statements. An audit also includes assessing the accounting principles used and significant estimates made by management, as well as evaluating the overall financial statement presentation. We believe that our audits provide a reasonable basis for our opinion.
In our opinion, the financial statements referred to above present fairly, in all material respects, the consolidated financial position of The Chubb Corporation at December 31, 2014 and 2013, and the consolidated results of its operations and its cash flows for each of the three years in the period ended December 31, 2014, in conformity with U.S. generally accepted accounting principles. Also, in our opinion, the related financial statement schedules, when considered in relation to the basic financial statements taken as a whole, present fairly in all material respects the information set forth therein.
We also have audited, in accordance with the standards of the Public Company Accounting Oversight Board (United States), The Chubb Corporation's internal control over financial reporting as of December 31, 2014, based on criteria established in Internal Control - Integrated Framework issued by the Committee of Sponsoring Organizations of the Treadway Commission (2013 framework) and our report dated February 26, 2015 expressed an unqualified opinion thereon.
/s/ E RNST & Y OUNG LLP
New York, New York
February 26, 2015
F-2
THE CHUBB CORPORATION
Consolidated Statements of Income
In Millions, Except For Per Share Amounts Years Ended December 31 | ||||||||||||
| 2014 | 2013 | 2012 | ||||||||||
Revenues | ||||||||||||
Premiums Earned | $ | 12,328 | $ | 12,066 | $ | 11,838 | ||||||
Investment Income | 1,394 | 1,465 | 1,556 | |||||||||
Other Revenues | 7 | 14 | 8 | |||||||||
Realized Investment Gains (Losses), Net | ||||||||||||
Total Other-Than-Temporary Impairment | (7 | ) | (11 | ) | (40 | ) | ||||||
Other-Than-Temporary Impairment Losses on Investments Recognized in Other Comprehensive Income | - | - | (5 | ) | ||||||||
Other Realized Investment Gains, Net | 376 | 413 | 238 | |||||||||
|
|
|
|
|
| |||||||
Total Realized Investment Gains, Net | 369 | 402 | 193 | |||||||||
|
|
|
|
|
| |||||||
TOTAL REVENUES | 14,098 | 13,947 | 13,595 | |||||||||
|
|
|
|
|
| |||||||
Losses and Expenses | ||||||||||||
Losses and Loss Expenses | 6,985 | 6,520 | 7,507 | |||||||||
Amortization of Deferred Policy Acquisition Costs | 2,548 | 2,454 | 2,411 | |||||||||
Other Insurance Operating Costs and Expenses | 1,397 | 1,411 | 1,362 | |||||||||
Investment Expenses | 42 | 49 | 38 | |||||||||
Other Expenses | 16 | 22 | 11 | |||||||||
Corporate Expenses | 249 | 254 | 270 | |||||||||
|
|
|
|
|
| |||||||
TOTAL LOSSES AND EXPENSES | 11,237 | 10,710 | 11,599 | |||||||||
|
|
|
|
|
| |||||||
INCOME BEFORE FEDERAL AND | 2,861 | 3,237 | 1,996 | |||||||||
Federal and Foreign Income Tax | 761 | 892 | 451 | |||||||||
|
|
|
|
|
| |||||||
NET INCOME | $ | 2,100 | $ | 2,345 | $ | 1,545 | ||||||
|
|
|
|
|
| |||||||
Net Income Per Share | ||||||||||||
Basic | $ | 8.65 | $ | 9.08 | $ | 5.73 | ||||||
Diluted | 8.62 | 9.04 | 5.69 | |||||||||
See accompanying notes.
F-3
THE CHUBB CORPORATION
Consolidated Statements of Comprehensive Income
In Millions Years Ended December 31 | ||||||||||||
| 2014 | 2013 | 2012 | ||||||||||
Net Income | $ | 2,100 | $ | 2,345 | $ | 1,545 | ||||||
|
|
|
|
|
| |||||||
Other Comprehensive Income (Loss), Net of Tax | ||||||||||||
Change in Unrealized Appreciation of Investments | 528 | (788 | ) | 275 | ||||||||
Change in Unrealized Other-Than-Temporary | - | - | 2 | |||||||||
Change in Postretirement Benefit Costs Not Yet | (336 | ) | 464 | (30 | ) | |||||||
Foreign Currency Translation Losses | (117 | ) | (72 | ) | (11 | ) | ||||||
|
|
|
|
|
| |||||||
| 75 | (396 | ) | 236 | |||||||||
|
|
|
|
|
| |||||||
COMPREHENSIVE INCOME | $ | 2,175 | $ | 1,949 | $ | 1,781 | ||||||
|
|
|
|
|
| |||||||
See accompanying notes.
F-4
THE CHUBB CORPORATION
Consolidated Balance Sheets
| In Millions | ||||||||
| December 31 | ||||||||
2014 | 2013 | |||||||
Assets | ||||||||
Invested Assets | ||||||||
Short Term Investments | $ | 1,318 | $ | 2,114 | ||||
Fixed Maturities (cost $36,958 and $35,959) | 38,780 | 37,091 | ||||||
Equity Securities (cost $1,089 and $1,057) | 1,964 | 1,810 | ||||||
Other Invested Assets | 1,423 | 1,598 | ||||||
|
|
|
| |||||
TOTAL INVESTED ASSETS | 43,485 | 42,613 | ||||||
Cash | 47 | 52 | ||||||
Accrued Investment Income | 410 | 418 | ||||||
Premiums Receivable | 2,560 | 2,284 | ||||||
Reinsurance Recoverable on Unpaid Losses and Loss Expenses | 1,639 | 1,802 | ||||||
Prepaid Reinsurance Premiums | 256 | 290 | ||||||
Deferred Policy Acquisition Costs | 1,284 | 1,255 | ||||||
Deferred Income Tax | - | | 47 | | ||||
Goodwill | 467 | 467 | ||||||
Other Assets | 1,138 | 1,205 | ||||||
|
|
|
| |||||
TOTAL ASSETS | $ | 51,286 | $ | 50,433 | ||||
|
|
|
| |||||
Liabilities | ||||||||
Unpaid Losses and Loss Expenses | $ | 22,678 | $ | 23,146 | ||||
Unearned Premiums | 6,581 | 6,423 | ||||||
Long Term Debt | 3,300 | 3,300 | ||||||
Dividend Payable to Shareholders | 117 | 110 | ||||||
Deferred Income Tax | 15 | - | ||||||
Accrued Expenses and Other Liabilities | 2,299 | 1,357 | ||||||
|
|
|
| |||||
TOTAL LIABILITIES | 34,990 | 34,336 | ||||||
|
|
|
| |||||
Commitments and Contingent Liabilities (Notes 5 and 12) | ||||||||
Shareholders' Equity | ||||||||
Preferred Stock - Authorized 8,000,000 Shares; | - | - | ||||||
Common Stock - Authorized 1,200,000,000 Shares; | 372 | 372 | ||||||
Paid-In Surplus | 171 | 171 | ||||||
Retained Earnings | 23,520 | 21,902 | ||||||
Accumulated Other Comprehensive Income | 1,110 | 1,035 | ||||||
Treasury Stock, at Cost - 139,551,071 and 123,673,969 Shares | (8,877 | ) | (7,383 | ) | ||||
|
|
|
| |||||
TOTAL SHAREHOLDERS' EQUITY | 16,296 | 16,097 | ||||||
|
|
|
| |||||
TOTAL LIABILITIES AND SHAREHOLDERS' EQUITY | $ | 51,286 | $ | 50,433 | ||||
|
|
|
| |||||
See accompanying notes.
F-5
THE CHUBB CORPORATION
Consolidated Statements of Shareholders' Equity
| In Millions | ||||||||||||
| Years Ended December 31 | ||||||||||||
| 2014 | 2013 | 2012 | ||||||||||
Preferred Stock | ||||||||||||
Balance, Beginning and End of Year | $ | - | $ | - | $ | - | ||||||
|
|
|
|
|
| |||||||
Common Stock | ||||||||||||
Balance, Beginning and End of Year | 372 | 372 | 372 | |||||||||
|
|
|
|
|
| |||||||
Paid-In Surplus | ||||||||||||
Balance, Beginning of Year | 171 | 178 | 190 | |||||||||
Changes Related to Stock-Based Employee Compensation (includes tax benefit of $17, $28 and $27) | - | (7 | ) | (12 | ) | |||||||
|
|
|
|
|
| |||||||
Balance, End of Year | 171 | 171 | 178 | |||||||||
|
|
|
|
|
| |||||||
Retained Earnings | ||||||||||||
Balance, Beginning of Year | 21,902 | 20,009 | 18,903 | |||||||||
Net Income | 2,100 | 2,345 | 1,545 | |||||||||
Dividends Declared (per share $2.00, $1.76 and $1.64) | (482 | ) | (452 | ) | (439 | ) | ||||||
|
|
|
|
|
| |||||||
Balance, End of Year | 23,520 | 21,902 | 20,009 | |||||||||
|
|
|
|
|
| |||||||
Accumulated Other Comprehensive Income | ||||||||||||
Unrealized Appreciation of Investments Including | ||||||||||||
Balance, Beginning of Year | 1,225 | 2,013 | 1,736 | |||||||||
Change During Year, Net of Tax | 528 | (788 | ) | 277 | ||||||||
|
|
|
|
|
| |||||||
Balance, End of Year | 1,753 | 1,225 | 2,013 | |||||||||
|
|
|
|
|
| |||||||
Postretirement Benefit Costs Not Yet Recognized | ||||||||||||
Balance, Beginning of Year | (253 | ) | (717 | ) | (687 | ) | ||||||
Change During Year, Net of Tax | (336 | ) | 464 | (30 | ) | |||||||
|
|
|
|
|
| |||||||
Balance, End of Year | (589 | ) | (253 | ) | (717 | ) | ||||||
|
|
|
|
|
| |||||||
Foreign Currency Translation Gains (Losses) | ||||||||||||
Balance, Beginning of Year | 63 | 135 | 146 | |||||||||
Change During Year, Net of Tax | (117 | ) | (72 | ) | (11 | ) | ||||||
|
|
|
|
|
| |||||||
Balance, End of Year | (54 | ) | 63 | 135 | ||||||||
|
|
|
|
|
| |||||||
Accumulated Other Comprehensive Income, | 1,110 | 1,035 | 1,431 | |||||||||
|
|
|
|
|
| |||||||
Treasury Stock, at Cost | ||||||||||||
Balance, Beginning of Year | (7,383 | ) | (6,163 | ) | (5,359 | ) | ||||||
Repurchase of Shares | (1,555 | ) | (1,300 | ) | (935 | ) | ||||||
Shares Issued Under Stock-Based Employee | 61 | 80 | 131 | |||||||||
|
|
|
|
|
| |||||||
Balance, End of Year | (8,877 | ) | (7,383 | ) | (6,163 | ) | ||||||
|
|
|
|
|
| |||||||
TOTAL SHAREHOLDERS' EQUITY | $ | 16,296 | $ | 16,097 | $ | 15,827 | ||||||
|
|
|
|
|
| |||||||
See accompanying notes.
F-6
THE CHUBB CORPORATION
Consolidated Statements of Cash Flows
| In Millions | ||||||||||||
| Years Ended December 31 | ||||||||||||
| 2014 | 2013 | 2012 | ||||||||||
Cash Flows from Operating Activities | ||||||||||||
Net Income | $ | 2,100 | $ | 2,345 | $ | 1,545 | ||||||
Adjustments to Reconcile Net Income to Net Cash | ||||||||||||
Increase (Decrease) in Unpaid Losses and Loss | (45 | ) | (582 | ) | 691 | |||||||
Increase in Unearned Premiums, Net | 264 | 158 | 32 | |||||||||
Amortization of Premiums and Discounts on | 196 | 183 | 163 | |||||||||
Depreciation | 54 | 55 | 54 | |||||||||
Realized Investment Gains, Net | (369 | ) | (402 | ) | (193 | ) | ||||||
Other, Net | (47 | ) | (26 | ) | 7 | |||||||
|
|
|
|
|
| |||||||
NET CASH PROVIDED BY OPERATING | 2,153 | 1,731 | 2,299 | |||||||||
|
|
|
|
|
| |||||||
Cash Flows from Investing Activities | ||||||||||||
Proceeds from Fixed Maturities | ||||||||||||
Sales | 4,229 | 2,449 | 2,271 | |||||||||
Maturities, Calls and Redemptions | 4,231 | 4,909 | 4,290 | |||||||||
Proceeds from Sales of Equity Securities | 213 | 545 | 160 | |||||||||
Purchases of Fixed Maturities | (9,987 | ) | (8,275 | ) | (7,247 | ) | ||||||
Purchases of Equity Securities | (110 | ) | (113 | ) | (112 | ) | ||||||
Investments in Other Invested Assets, Net | 315 | 498 | 293 | |||||||||
Decrease (Increase) in Short Term Investments, Net | 780 | 383 | (629 | ) | ||||||||
Change in Receivable or Payable from Security | 222 | (86 | ) | 45 | ||||||||
Purchases of Property and Equipment, Net | (49 | ) | (52 | ) | (43 | ) | ||||||
Other, Net | - | (6 | ) | - | ||||||||
|
|
|
|
|
| |||||||
NET CASH PROVIDED BY (USED IN) INVESTING | (156 | ) | 252 | (972 | ) | |||||||
|
|
|
|
|
| |||||||
Cash Flows from Financing Activities | ||||||||||||
Repayment of Long Term Debt | - | (275 | ) | - | ||||||||
Decrease in Funds Held under Deposit Contracts | (2 | ) | (6 | ) | (12 | ) | ||||||
Proceeds from Issuance of Common Stock Under | 22 | 38 | 74 | |||||||||
Repurchase of Shares | (1,547 | ) | (1,288 | ) | (959 | ) | ||||||
Dividends Paid to Shareholders | (475 | ) | (450 | ) | (438 | ) | ||||||
|
|
|
|
|
| |||||||
NET CASH USED IN FINANCING ACTIVITIES | (2,002 | ) | (1,981 | ) | (1,335 | ) | ||||||
|
|
|
|
|
| |||||||
Net Increase (Decrease) in Cash | (5 | ) | 2 | (8 | ) | |||||||
Cash at Beginning of Year | 52 | 50 | 58 | |||||||||
|
|
|
|
|
| |||||||
CASH AT END OF YEAR | $ | 47 | $ | 52 | $ | 50 | ||||||
|
|
|
|
|
| |||||||
See accompanying notes.
F-7
NOTES TO CONSOLIDATED FINANCIAL STATEMENTS
(1) Summary of Significant Accounting Policies
| (a) | Basis of Presentation |
The Chubb Corporation (Chubb) is a holding company with subsidiaries principally engaged in the property and casualty insurance business. The property and casualty insurance subsidiaries (the P&C Group) underwrite most lines of property and casualty insurance in the United States, Canada, Europe, Australia and parts of Latin America and Asia. The geographic distribution of property and casualty business in the United States is broad with a particularly strong market presence in the Northeast.
The accompanying consolidated financial statements have been prepared in accordance with U.S. generally accepted accounting principles (GAAP) and include the accounts of Chubb and its subsidiaries (collectively, the Corporation). Significant intercompany transactions have been eliminated in consolidation. The results of our operations in Australia, Brazil and other smaller foreign locations are recorded on a three month lag in our consolidated financial statements. Specific events having significant financial impact that occur during the lag period are included in the current period results.
The consolidated financial statements include amounts based on informed estimates and judgments of management for transactions that are not yet complete. Such estimates and judgments affect the reported amounts of assets and liabilities and disclosure of contingent assets and liabilities at the date of the financial statements and the reported amounts of revenues and expenses during the reporting period. Actual results could differ from those estimates.
Certain amounts in the consolidated financial statements for prior years have been reclassified to conform with the 2014 presentation.
| (b) | Invested Assets |
Short term investments, which have an original maturity of one year or less, are carried at amortized cost, which approximates fair value.
Fixed maturities, which include taxable and tax exempt bonds, are classified as available-for-sale and carried at fair value as of the balance sheet date. Taxable bonds include U.S. government and government agency and authority obligations, including taxable bonds issued by states, municipalities and political subdivisions within the United States, and foreign government and government agency obligations, corporate bonds and mortgage-backed securities. Corporate bonds include redeemable preferred stocks. Tax exempt bonds consist of bonds issued by states, municipalities and political subdivisions within the United States. Fixed maturities are purchased to support the investment strategies of the Corporation. These strategies are developed based on many factors including rate of return, maturity, credit risk, tax considerations and regulatory requirements. Fixed maturities may be sold prior to maturity to support the investment strategies of the Corporation.
Premiums and discounts arising from the purchase of fixed maturities are amortized using the interest method over the estimated remaining term of the securities. For mortgage-backed securities, prepayment assumptions are reviewed periodically and revised as necessary.
Equity securities, which include common stocks and non-redeemable preferred stocks, are carried at fair value as of the balance sheet date.
Unrealized appreciation or depreciation, including unrealized other-than-temporary impairment losses, of fixed maturities and equity securities carried at fair value is excluded from net income and is included, net of applicable deferred income tax, in other comprehensive income.
F-8
(1) Summary of Significant Accounting Policies (continued)
Other invested assets primarily include private equity limited partnerships, which are carried at the Corporation's equity in the net assets of the partnerships based on valuations provided by the manager of each partnership. As a result of the timing of the receipt of valuation data from the investment managers, these investments are generally reported on a three month lag. Changes in the Corporation's equity in the net assets of the partnerships are included in net income as realized investment gains or losses. Other invested assets also include warrants, which are carried at fair value as of the balance sheet date. Changes in the fair value of warrants are included in net income as realized investment gains or losses.
Realized gains and losses on the sale of investments are determined on the basis of the cost of the specific investments sold and are included in net income.
When the fair value of an investment is lower than its cost, an assessment is made to determine whether the decline is temporary or other than temporary. The assessment of other-than-temporary impairment of fixed maturities and equity securities is based on both quantitative criteria and qualitative information. A number of factors are considered including, but not limited to, the length of time and the extent to which the fair value has been less than the cost, the financial condition and near term prospects of the issuer, whether the issuer is current on contractually obligated interest and principal payments, general market conditions and industry or sector specific factors.
In determining whether fixed maturities are other than temporarily impaired, the Corporation is required to recognize an other-than-temporary impairment loss when it concludes it has the intent to sell or it is more likely than not it will be required to sell an impaired fixed maturity before the security recovers to its amortized cost value or it is likely it will not recover the entire amortized cost value of an impaired security. If the Corporation has the intent to sell or it is more likely than not that the Corporation will be required to sell an impaired fixed maturity before the security recovers to its amortized cost value, the security is written down to fair value and the entire amount of the writedown is included in net income as a realized investment loss. For all other impaired fixed maturities, when the impairment is determined to be other than temporary, the impairment loss is separated into the amount representing the credit loss and the amount representing the loss related to all other factors. The amount of the impairment loss that represents the credit loss is included in net income as a realized investment loss and the amount of the impairment loss that relates to all other factors is included in other comprehensive income.
For fixed maturities, the split between the amount of other-than-temporary impairment losses that represents credit losses and the amount that relates to all other factors is principally based on assumptions regarding the amount and timing of projected cash flows. For fixed maturities other than mortgage-backed securities, cash flow estimates are based on assumptions regarding the probability of default and estimates regarding the timing and amount of recoveries associated with a default. For mortgage-backed securities, cash flow estimates are based on assumptions regarding future prepayment rates, default rates, loss severity and timing of recoveries. The Corporation has developed the estimates of projected cash flows using information based on historical market data, industry analyst reports and forecasts and other data relevant to the collectibility of a security.
In determining whether equity securities are other than temporarily impaired, the Corporation considers its intent and ability to hold a security for a period of time sufficient to allow for the recovery of cost. If the decline in the fair value of an equity security is deemed to be other than temporary, the security is written down to fair value and the amount of the writedown is included in net income as a realized investment loss.
F-9
(1) Summary of Significant Accounting Policies (continued)
| (c) | Premium Revenues and Related Expenses |
Insurance premiums are earned on a monthly pro rata basis over the terms of the policies and include estimates of audit premiums and premiums on retrospectively rated policies. Assumed reinsurance premiums are earned over the terms of the reinsurance contracts. Unearned premiums represent the portion of direct and assumed premiums written applicable to the unexpired terms of the insurance policies and reinsurance contracts in force.
Ceded reinsurance premiums are reflected in operating results over the terms of the reinsurance contracts. Prepaid reinsurance premiums represent the portion of premiums ceded to reinsurers applicable to the unexpired terms of the reinsurance contracts in force.
Reinsurance reinstatement premiums are recognized in the same period as the loss event that gave rise to the reinstatement premiums.
Acquisition costs that are directly related to the successful acquisition of new or renewal insurance contracts are deferred and amortized over the period in which the related premiums are earned. Such costs include commissions, premium taxes and certain other underwriting and policy issuance costs. Commissions received related to reinsurance premiums ceded are considered in determining net acquisition costs eligible for deferral. Deferred policy acquisition costs are reviewed to determine whether they are recoverable from future income. If such costs are deemed to be unrecoverable, they are expensed. Anticipated investment income is considered in the determination of the recoverability of deferred policy acquisition costs.
| (d) | Unpaid Losses and Loss Expenses |
Unpaid losses and loss expenses (also referred to as loss reserves) include the accumulation of individual case estimates for claims that have been reported and estimates of claims that have been incurred but not reported as well as estimates of the expenses associated with processing and settling all reported and unreported claims, less estimates of anticipated salvage and subrogation recoveries. Estimates are based upon past loss experience modified for current trends as well as prevailing economic, legal and social conditions. Loss reserves are not discounted to present value.
Loss reserves are regularly reviewed using a variety of actuarial techniques. Reserve estimates are updated as historical loss experience develops, additional claims are reported and/or settled and new information becomes available. Any changes in estimates are reflected in operating results in the period in which the estimates are changed.
Reinsurance recoverable on unpaid losses and loss expenses represents an estimate of the portion of gross loss reserves that will be recovered from reinsurers. Amounts recoverable from reinsurers are estimated using assumptions that are consistent with those used in estimating the gross losses associated with the reinsured policies. A provision for estimated uncollectible reinsurance is recorded based on periodic evaluations of balances due from reinsurers, the financial condition of the reinsurers, coverage disputes and other relevant factors.
| (e) | Financial Products |
Derivatives are carried at fair value as of the balance sheet date. Changes in fair value are recognized in net income in the period of the change and are included in other revenues.
Assets and liabilities related to these derivatives are included in other assets and other liabilities.
| (f) | Goodwill |
Goodwill represents the excess of the cost of an acquired entity over the fair value of net assets acquired. Goodwill is tested for impairment at least annually.
F-10
(1) Summary of Significant Accounting Policies (continued)
| (g) | Property and Equipment |
Property and equipment used in operations, including certain costs incurred to develop or obtain computer software for internal use, are capitalized and carried at cost less accumulated depreciation. Depreciation is calculated using the straight-line method over the estimated useful lives of the assets. Property and equipment are included in other assets.
| (h) | Real Estate |
Real estate properties are carried at cost less accumulated depreciation and any writedowns for impairment. Real estate properties are reviewed for impairment whenever events or circumstances indicate that the carrying value of such properties may not be recoverable. Measurement of such impairment is based on the fair value of the property. Real estate properties are included in other assets.
| (i) | Income Taxes |
Deferred income tax assets and liabilities are recognized for the expected future tax effects attributable to temporary differences between the financial reporting and tax bases of assets and liabilities, based on enacted tax rates and other provisions of tax law. The effect on deferred tax assets and liabilities of a change in tax laws or rates is recognized in net income in the period in which such change is enacted. Deferred tax assets are reduced by a valuation allowance if it is more likely than not that all or some portion of the deferred tax assets will not be realized.
The Corporation does not consider the earnings of its foreign subsidiaries to be permanently reinvested. Accordingly, provision has been made for the expected U.S. federal income tax liabilities applicable to undistributed earnings of foreign subsidiaries.
| (j) | Stock-Based Employee Compensation |
The fair value method of accounting is used for stock-based employee compensation plans. Under the fair value method, compensation cost is measured based on the fair value of the award at the grant date and recognized over the requisite service period.
| (k) | Foreign Exchange |
Assets and liabilities relating to foreign operations are translated into U.S. dollars using current exchange rates as of the balance sheet date. Revenues and expenses are translated into U.S. dollars using the average exchange rates during the year.
The functional currency of foreign operations is generally the currency of the local operating environment since business is primarily transacted in such local currency. Translation gains and losses, net of applicable income tax, are excluded from net income and are credited or charged directly to other comprehensive income.
| (l) | Cash Flow Information |
In the statement of cash flows, short term investments are not considered to be cash equivalents. The effect of changes in foreign exchange rates on cash balances was insignificant.
In 2013, the Corporation exchanged its holdings of common stock and warrants of Alterra Capital Holdings Limited, with a cost basis of $177 million and a carrying value of $63 million, respectively, for common stock of Markel Corporation, valued at $226 million, and cash of $98 million, as a result of a business combination. The noncash portions of the transaction have been excluded from the statement of cash flows.
F-11
(2) Invested Assets and Related Income
(a) The amortized cost and fair value of fixed maturities and equity securities were as follows:
| December 31, 2014 | ||||||||||||||||
| Amortized Cost | Gross Unrealized Appreciation | Gross Unrealized Depreciation | Fair Value | |||||||||||||
| (in millions) | ||||||||||||||||
Fixed maturities | ||||||||||||||||
Tax exempt | $ | 18,614 | $ | 1,174 | $ | 16 | $ | 19,772 | ||||||||
|
|
|
|
|
|
|
| |||||||||
Taxable | ||||||||||||||||
U.S. government and government agency and | 1,962 | 46 | 1 | 2,007 | ||||||||||||
Corporate bonds | 8,741 | 327 | 40 | 9,028 | ||||||||||||
Foreign government and government agency obligations | 6,380 | 295 | 3 | 6,672 | ||||||||||||
Residential mortgage-backed securities | 192 | 20 | 1 | 211 | ||||||||||||
Commercial mortgage-backed securities | 1,069 | 22 | 1 | 1,090 | ||||||||||||
|
|
|
|
|
|
|
| |||||||||
| 18,344 | 710 | 46 | 19,008 | |||||||||||||
|
|
|
|
|
|
|
| |||||||||
Total fixed maturities | $ | 36,958 | $ | 1,884 | $ | 62 | $ | 38,780 | ||||||||
|
|
|
|
|
|
|
| |||||||||
Equity securities | $ | 1,089 | $ | 894 | $ | 19 | $ | 1,964 | ||||||||
|
|
|
|
|
|
|
| |||||||||
| December 31, 2013 | ||||||||||||||||
| Amortized Cost | Gross Unrealized Appreciation | Gross Unrealized Depreciation | Fair Value | |||||||||||||
| (in millions) | ||||||||||||||||
Fixed maturities | ||||||||||||||||
Tax exempt | $ | 17,808 | $ | 802 | $ | 189 | $ | 18,421 | ||||||||
|
|
|
|
|
|
|
| |||||||||
Taxable | ||||||||||||||||
U.S. government and government agency and authority obligations | 784 | 27 | 9 | 802 | ||||||||||||
Corporate bonds | 9,032 | 370 | 88 | 9,314 | ||||||||||||
Foreign government and government agency obligations | 6,719 | 206 | 35 | 6,890 | ||||||||||||
Residential mortgage-backed securities | 277 | 23 | 1 | 299 | ||||||||||||
Commercial mortgage-backed securities | 1,339 | 29 | 3 | 1,365 | ||||||||||||
|
|
|
|
|
|
|
| |||||||||
| 18,151 | 655 | 136 | 18,670 | |||||||||||||
|
|
|
|
|
|
|
| |||||||||
Total fixed maturities | $ | 35,959 | $ | 1,457 | $ | 325 | $ | 37,091 | ||||||||
|
|
|
|
|
|
|
| |||||||||
Equity securities | $ | 1,057 | $ | 756 | $ | 3 | $ | 1,810 | ||||||||
|
|
|
|
|
|
|
| |||||||||
The following table summarizes the fair value of the tax exempt fixed maturities at December 31, 2014 and 2013:
| 2014 | 2013 | |||||||
| (in millions) | ||||||||
Special revenue bonds | $ | 12,936 | $ | 11,717 | ||||
State general obligation bonds | 2,415 | 2,292 | ||||||
Municipal and political subdivision general obligation bonds | 2,378 | 2,220 | ||||||
Pre-refunded bonds | 2,043 | 2,192 | ||||||
|
|
|
| |||||
| $ | 19,772 | $ | 18,421 | |||||
|
|
|
| |||||
F-12
(2) Invested Assets and Related Income (continued)
Special revenue bonds are supported by income streams generated in a broad range of sectors, primarily highways, water and sewer utilities, hospitals, electric utilities, airports, universities and housing, as well as specifically pledged tax revenues. The special revenue bond holdings are well-diversified and spread relatively evenly over these sectors. An irrevocable trust containing U.S. government or government agency obligations has been established to fund the remaining principal and interest payments of the pre-refunded bonds.
The following table summarizes the fair value and amortized cost of the tax exempt fixed maturities other than pre-refunded bonds held at December 31, 2014 and 2013, for the five states having the largest concentration of issuers within the tax exempt fixed maturity portfolio. The remainder of tax exempt fixed maturities were issued by a broad range of other states and municipalities and political subdivisions within those states. In the following table, "state" identifies the issuer or the location of the issuing municipality or political subdivision within a state.
| December 31, 2014 | ||||||||||||||||||||
| Fair Value | ||||||||||||||||||||
State | Special Revenue Bonds | Municipal and Political Subdivision General Obligations | State General Obligations | Total | Amortized Cost | |||||||||||||||
| (in millions) | ||||||||||||||||||||
New York | $ | 2,046 | $ | 173 | $ | 43 | $ | 2,262 | $ | 2,135 | ||||||||||
Texas | 883 | 852 | 211 | 1,946 | 1,829 | |||||||||||||||
California | 1,098 | 153 | 256 | 1,507 | 1,422 | |||||||||||||||
Illinois | 608 | 381 | 97 | 1,086 | 1,022 | |||||||||||||||
Florida | 850 | 63 | 167 | 1,080 | 1,017 | |||||||||||||||
| December 31, 2013 | ||||||||||||||||||||
| Fair Value | ||||||||||||||||||||
State | Special Revenue Bonds | Municipal and Political Subdivision General Obligations | State General Obligations | Total | Amortized Cost | |||||||||||||||
| (in millions) | ||||||||||||||||||||
Texas | $ | 930 | $ | 830 | $ | 230 | $ | 1,990 | $ | 1,904 | ||||||||||
New York | 1,611 | 197 | 31 | 1,839 | 1,809 | |||||||||||||||
California | 859 | 82 | 198 | 1,139 | 1,093 | |||||||||||||||
Illinois | 577 | 483 | 56 | 1,116 | 1,094 | |||||||||||||||
Florida | 757 | 38 | 108 | 903 | 877 | |||||||||||||||
At December 31, 2014 and 2013, foreign government and government agency fixed maturities consisted of high quality fixed maturities primarily issued by national governments and, to a lesser extent, government agencies, regional governments and supranational organizations.
The following table summarizes the fair value and amortized cost of the foreign government and government agency fixed maturities held at December 31, 2014 and 2013, for the five countries having the largest concentration of issuers within the foreign government and government agency fixed maturity portfolio. In the following table, "country" identifies the issuer or the location of the issuing government agency or regional government within a country.
| 2014 | 2013 | |||||||||||||||
Country | Fair Value | Amortized Cost | Fair Value | Amortized Cost | ||||||||||||
| (in millions) | ||||||||||||||||
Canada | $ | 1,893 | $ | 1,823 | $ | 1,993 | $ | 1,953 | ||||||||
United Kingdom | 1,230 | 1,163 | 1,026 | 1,004 | ||||||||||||
Germany | 1,102 | 1,045 | 1,241 | 1,211 | ||||||||||||
Australia | 746 | 700 | 739 | 700 | ||||||||||||
Brazil | 232 | 231 | 270 | 270 | ||||||||||||
F-13
(2) Invested Assets and Related Income (continued)
At December 31, 2014 and 2013, the foreign government and government agency fixed maturities also included $469 million and $547 million, respectively, of fixed maturities issued by supranational organizations.
The fair value and amortized cost of fixed maturities at December 31, 2014 by contractual maturity were as follows:
| Fair Value | Amortized Cost | |||||||
| (in millions) | ||||||||
Due in one year or less | $ | 2,947 | $ | 2,922 | ||||
Due after one year through five years | 12,906 | 12,406 | ||||||
Due after five years through ten years | 12,814 | 12,041 | ||||||
Due after ten years | 8,812 | 8,328 | ||||||
|
|
|
| |||||
| 37,479 | 35,697 | |||||||
Residential mortgage-backed securities | 211 | 192 | ||||||
Commercial mortgage-backed securities | 1,090 | 1,069 | ||||||
|
|
|
| |||||
| $ | 38,780 | $ | 36,958 | |||||
|
|
|
| |||||
Actual maturities could differ from contractual maturities because borrowers may have the right to call or prepay obligations.
The Corporation's equity securities comprise a diversified portfolio of primarily U.S. publicly-traded common stocks.
The Corporation is involved in the normal course of business with variable interest entities (VIEs) primarily as a passive investor in residential mortgage-backed securities, commercial mortgage-backed securities and private equity limited partnerships issued by third party VIEs. The Corporation is not the primary beneficiary of these VIEs. The Corporation's maximum exposure to loss with respect to these investments is limited to the investment carrying values included in the Corporation's consolidated balance sheet and any unfunded partnership commitments.
(b) The components of unrealized appreciation or depreciation, including unrealized other-than-temporary impairment losses, of investments carried at fair value were as follows:
| December 31 | ||||||||
| 2014 | 2013 | |||||||
| (in millions) | ||||||||
Fixed maturities | ||||||||
Gross unrealized appreciation | $ | 1,884 | $ | 1,457 | ||||
Gross unrealized depreciation | 62 | 325 | ||||||
|
|
|
| |||||
| 1,822 | 1,132 | |||||||
|
|
|
| |||||
Equity securities | ||||||||
Gross unrealized appreciation | 894 | 756 | ||||||
Gross unrealized depreciation | 19 | 3 | ||||||
|
|
|
| |||||
| 875 | 753 | |||||||
|
|
|
| |||||
| 2,697 | 1,885 | |||||||
Deferred income tax liability | 944 | 660 | ||||||
|
|
|
| |||||
| $ | 1,753 | $ | 1,225 | |||||
|
|
|
| |||||
F-14
(2) Invested Assets and Related Income (continued)
The following table summarizes, for all investment securities in an unrealized loss position at December 31, 2014, the aggregate fair value and gross unrealized depreciation, including unrealized other-than-temporary impairment losses, by investment category and length of time that individual securities have continuously been in an unrealized loss position.
| Less Than 12 Months | 12 Months or More | Total | ||||||||||||||||||||||
| Fair Value | Gross Unrealized Depreciation | Fair Value | Gross Unrealized Depreciation | Fair Value | Gross Unrealized Depreciation | |||||||||||||||||||
| (in millions) | ||||||||||||||||||||||||
Fixed maturities | ||||||||||||||||||||||||
Tax exempt | $ | 422 | $ | 3 | $ | 305 | $ | 13 | $ | 727 | $ | 16 | ||||||||||||
|
|
|
|
|
|
|
|
|
|
|
| |||||||||||||
Taxable | ||||||||||||||||||||||||
U.S. government and government agency | 936 | 1 | 36 | - | 972 | 1 | ||||||||||||||||||
Corporate bonds | 1,327 | 23 | 888 | 17 | 2,215 | 40 | ||||||||||||||||||
Foreign government and government | 318 | 1 | 207 | 2 | 525 | 3 | ||||||||||||||||||
Residential mortgage-backed securities | - | - | 7 | 1 | 7 | 1 | ||||||||||||||||||
Commercial mortgage-backed securities | 106 | - | 67 | 1 | 173 | 1 | ||||||||||||||||||
|
|
|
|
|
|
|
|
|
|
|
| |||||||||||||
| 2,687 | 25 | 1,205 | 21 | 3,892 | 46 | |||||||||||||||||||
|
|
|
|
|
|
|
|
|
|
|
| |||||||||||||
Total fixed maturities | 3,109 | 28 | 1,510 | 34 | 4,619 | 62 | ||||||||||||||||||
Equity securities | 67 | 11 | 11 | 8 | 78 | 19 | ||||||||||||||||||
|
|
|
|
|
|
|
|
|
|
|
| |||||||||||||
| $ | 3,176 | $ | 39 | $ | 1,521 | $ | 42 | $ | 4,697 | $ | 81 | |||||||||||||
|
|
|
|
|
|
|
|
|
|
|
| |||||||||||||
At December 31, 2014, approximately 735 individual fixed maturities and 15 individual equity securities were in an unrealized loss position. The Corporation does not have the intent to sell and it is not more likely than not that the Corporation will be required to sell these fixed maturities before the securities recover to their amortized cost value. In addition, the Corporation believes that none of the declines in the fair values of these fixed maturities relate to credit losses. The Corporation has the intent and ability to hold the equity securities in an unrealized loss position for a period of time sufficient to allow for the recovery of cost. The Corporation believes that none of the declines in the fair value of these fixed maturities and equity securities were other than temporary at December 31, 2014.
The following table summarizes, for all investment securities in an unrealized loss position at December 31, 2013, the aggregate fair value and gross unrealized depreciation, including unrealized other-than-temporary impairment losses, by investment category and length of time that individual securities have continuously been in an unrealized loss position.
| Less Than 12 Months | 12 Months or More | Total | ||||||||||||||||||||||
| Fair Value | Gross Unrealized Depreciation | Fair Value | Gross Unrealized Depreciation | Fair Value | Gross Unrealized Depreciation | |||||||||||||||||||
| (in millions) | ||||||||||||||||||||||||
Fixed maturities | ||||||||||||||||||||||||
Tax exempt | $ | 3,417 | $ | 144 | $ | 307 | $ | 45 | $ | 3,724 | $ | 189 | ||||||||||||
|
|
|
|
|
|
|
|
|
|
|
| |||||||||||||
Taxable | ||||||||||||||||||||||||
U.S. government and government agency and authority obligations | 213 | 6 | 35 | 3 | 248 | 9 | ||||||||||||||||||
Corporate bonds | 2,526 | 76 | 222 | 12 | 2,748 | 88 | ||||||||||||||||||
Foreign government and government agency obligations | 1,735 | 32 | 75 | 3 | 1,810 | 35 | ||||||||||||||||||
Residential mortgage-backed securities | 4 | - | 14 | 1 | 18 | 1 | ||||||||||||||||||
Commercial mortgage-backed securities | 153 | 1 | 39 | 2 | 192 | 3 | ||||||||||||||||||
|
|
|
|
|
|
|
|
|
|
|
| |||||||||||||
| 4,631 | 115 | 385 | 21 | 5,016 | 136 | |||||||||||||||||||
|
|
|
|
|
|
|
|
|
|
|
| |||||||||||||
Total fixed maturities | 8,048 | 259 | 692 | 66 | 8,740 | 325 | ||||||||||||||||||
Equity securities | 41 | 3 | - | - | 41 | 3 | ||||||||||||||||||
|
|
|
|
|
|
|
|
|
|
|
| |||||||||||||
| $ | 8,089 | $ | 262 | $ | 692 | $ | 66 | $ | 8,781 | $ | 328 | |||||||||||||
|
|
|
|
|
|
|
|
|
|
|
| |||||||||||||
F-15
(2) Invested Assets and Related Income (continued)
The change in unrealized appreciation or depreciation of investments carried at fair value, including the change in unrealized other-than-temporary impairment losses, was as follows:
| Years Ended December 31 | ||||||||||||
| 2014 | 2013 | 2012 | ||||||||||
| (in millions) | ||||||||||||
Change in unrealized appreciation of fixed maturities | $ | 690 | $ | (1,546 | ) | $ | 256 | |||||
Change in unrealized appreciation of equity securities | 122 | 334 | 171 | |||||||||
|
|
|
|
|
| |||||||
| 812 | (1,212 | ) | 427 | |||||||||
Deferred income tax (credit) | 284 | (424 | ) | 150 | ||||||||
|
|
|
|
|
| |||||||
| $ | 528 | $ | (788 | ) | $ | 277 | ||||||
|
|
|
|
|
| |||||||
(c) The sources of net investment income were as follows:
| Years Ended December 31 | ||||||||||||
| 2014 | 2013 | 2012 | ||||||||||
| (in millions) | ||||||||||||
Fixed maturities | $ | 1,314 | $ | 1,380 | $ | 1,465 | ||||||
Equity securities | 41 | 38 | 40 | |||||||||
Short term investments | 18 | 16 | 18 | |||||||||
Other | 21 | 31 | 33 | |||||||||
|
|
|
|
|
| |||||||
Gross investment income | 1,394 | 1,465 | 1,556 | |||||||||
Investment expenses | 42 | 49 | 38 | |||||||||
|
|
|
|
|
| |||||||
| $ | 1,352 | $ | 1,416 | $ | 1,518 | |||||||
|
|
|
|
|
| |||||||
(d) Realized investment gains and losses were as follows:
| Years Ended December 31 | ||||||||||||
| 2014 | 2013 | 2012 | ||||||||||
| (in millions) | ||||||||||||
Fixed maturities | ||||||||||||
Gross realized gains | $ | 126 | $ | 62 | $ | 124 | ||||||
Gross realized losses | (36 | ) | (42 | ) | (20 | ) | ||||||
Other-than-temporary impairment losses | (5 | ) | (2 | ) | (5 | ) | ||||||
|
|
|
|
|
| |||||||
| 85 | 18 | 99 | ||||||||||
|
|
|
|
|
| |||||||
Equity securities | ||||||||||||
Gross realized gains | 137 | 204 | 68 | |||||||||
Gross realized losses | - | (1 | ) | - | ||||||||
Other-than-temporary impairment losses | (2 | ) | (9 | ) | (40 | ) | ||||||
|
|
|
|
|
| |||||||
| 135 | 194 | 28 | ||||||||||
|
|
|
|
|
| |||||||
Other invested assets | 149 | 190 | 66 | |||||||||
|
|
|
|
|
| |||||||
| $ | 369 | $ | 402 | $ | 193 | |||||||
|
|
|
|
|
| |||||||
(e) As of December 31, 2014 and 2013, fixed maturities still held by the Corporation for which a portion of their other-than-temporary impairment losses were recognized in other comprehensive income had cumulative credit-related losses of $18 million and $20 million, respectively, recognized in net income.
F-16
(3) Deferred Policy Acquisition Costs
Policy acquisition costs deferred and the related amortization reflected in operating results were as follows:
| Years Ended December 31 | ||||||||||||
| 2014 | 2013 | 2012 | ||||||||||
| (in millions) | ||||||||||||
Balance, beginning of year | $ | 1,255 | $ | 1,206 | $ | 1,210 | ||||||
|
|
|
|
|
| |||||||
Costs deferred during year | ||||||||||||
Commissions and brokerage | 2,073 | 1,979 | 1,919 | |||||||||
Premium taxes and assessments | 258 | 263 | 247 | |||||||||
Underwriting and policy issuance costs | 262 | 271 | 248 | |||||||||
|
|
|
|
|
| |||||||
| 2,593 | 2,513 | 2,414 | ||||||||||
|
|
|
|
|
| |||||||
Foreign currency translation effect | (16 | ) | (10 | ) | (7 | ) | ||||||
|
|
|
|
|
| |||||||
Amortization during year | (2,548 | ) | (2,454 | ) | (2,411 | ) | ||||||
|
|
|
|
|
| |||||||
Balance, end of year | $ | 1,284 | $ | 1,255 | $ | 1,206 | ||||||
|
|
|
|
|
| |||||||
(4) Property and Equipment
Property and equipment included in other assets were as follows:
| December 31 | ||||||||
| 2014 | 2013 | |||||||
| (in millions) | ||||||||
Cost | $ | 488 | $ | 501 | ||||
Accumulated depreciation | 239 | 243 | ||||||
|
|
|
| |||||
| $ | 249 | $ | 258 | |||||
|
|
|
| |||||
Depreciation expense related to property and equipment was $54 million, $55 million and $54 million for 2014, 2013, and 2012, respectively.
F-17
(5) Unpaid Losses and Loss Expenses
(a) The process of establishing loss reserves is complex and imprecise as it must take into consideration many variables that are subject to the outcome of future events. As a result, informed subjective estimates and judgments as to the P&C Group's ultimate exposure to losses are an integral component of the loss reserving process. The loss reserve estimation process relies on the basic assumption that past experience, adjusted for the effects of current developments and likely trends, is an appropriate basis for predicting future outcomes.
Most of the P&C Group's loss reserves relate to long tail liability classes of business. For many liability claims significant periods of time, ranging up to several years or even decades, may elapse between the occurrence of the loss, the reporting of the loss and the settlement of the claim. The longer the time span between the incidence of a loss and the settlement of the claim, the more the ultimate settlement amount can vary.
There are numerous factors that contribute to the inherent uncertainty in the process of establishing loss reserves. Among these factors are changes in the inflation rate for goods and services related to covered damages such as medical care and home repair costs; changes in the judicial interpretation of policy provisions relating to the determination of coverage; changes in the general attitude of juries in the determination of liability and damages; legislative actions; changes in the medical condition of claimants; changes in the estimates of the number and/or severity of claims that have been incurred but not reported as of the date of the financial statements; and changes in the P&C Group's book of business, underwriting standards and/or claim handling procedures.
In addition, the uncertain effects of emerging or potential claims and coverage issues that arise as legal, judicial, economic and social conditions change must be taken into consideration. These issues have had, and may continue to have, a negative effect on loss reserves by either extending coverage beyond the original underwriting intent or by increasing the number or size of claims. As a result of such issues, the uncertainties inherent in estimating ultimate claim costs on the basis of past experience have grown, further complicating the already complex loss reserving process.
Management believes that the aggregate net loss reserves of the P&C Group at December 31, 2014 were adequate to cover claims for losses that had occurred as of that date, including both those known and those yet to be reported. In establishing such reserves, management considers facts currently known and the present state of the law and coverage litigation. However, given the significant uncertainties inherent in the loss reserving process, it is possible that management's estimate of the ultimate liability for losses that had occurred as of December 31, 2014 may change, which could have a material effect on the Corporation's results of operations and financial condition.
F-18
(5) Unpaid Losses and Loss Expenses (continued)
(b) A reconciliation of the beginning and ending liability for unpaid losses and loss expenses, net of reinsurance recoverable, and a reconciliation of the net liability to the corresponding liability on a gross basis is as follows:
| 2014 | 2013 | 2012 | ||||||||||
| (in millions) | ||||||||||||
Gross liability, beginning of year | $ | 23,146 | $ | 23,963 | $ | 23,068 | ||||||
Reinsurance recoverable, beginning of year | 1,802 | 1,941 | 1,739 | |||||||||
|
|
|
|
|
| |||||||
Net liability, beginning of year | 21,344 | 22,022 | 21,329 | |||||||||
|
|
|
|
|
| |||||||
Net incurred losses and loss expenses related to | ||||||||||||
Current year | 7,621 | 7,232 | 8,121 | |||||||||
Prior years | (636 | ) | (712 | ) | (614 | ) | ||||||
|
|
|
|
|
| |||||||
| 6,985 | 6,520 | 7,507 | ||||||||||
|
|
|
|
|
| |||||||
Net payments for losses and loss expenses related to | ||||||||||||
Current year | 2,496 | 2,150 | 2,323 | |||||||||
Prior years | 4,534 | 4,952 | 4,493 | |||||||||
|
|
|
|
|
| |||||||
| 7,030 | 7,102 | 6,816 | ||||||||||
|
|
|
|
|
| |||||||
Foreign currency translation effect | (260 | ) | (96 | ) | 2 | |||||||
|
|
|
|
|
| |||||||
Net liability, end of year | 21,039 | 21,344 | 22,022 | |||||||||
Reinsurance recoverable, end of year | 1,639 | 1,802 | 1,941 | |||||||||
|
|
|
|
|
| |||||||
Gross liability, end of year | $ | 22,678 | $ | 23,146 | $ | 23,963 | ||||||
|
|
|
|
|
| |||||||
Changes in loss reserve estimates are unavoidable because such estimates are subject to the outcome of future events. Loss trends vary and time is required for changes in trends to be recognized and confirmed. During 2014, the P&C Group experienced overall favorable development of $636 million on net unpaid losses and loss expenses established as of the previous year end. This compares with favorable prior year development of $712 million in 2013 and $614 million in 2012. Such favorable development was reflected in operating results in these respective years.
The net favorable development of $636 million in 2014 was due to various factors. Overall favorable development of about $320 million was experienced in the professional liability classes other than fidelity. This favorable development was driven mainly by the directors and officers liability and fiduciary liability classes. The reported loss activity for these classes was less than expected, mostly in terms of claim severity. The aggregate favorable emergence was driven by accident years 2010 and prior. Favorable development of about $205 million in the aggregate was experienced in the personal and commercial liability classes. The most significant favorable development occurred in the excess liability classes, particularly in accident years 2011 and prior. This was partially offset by adverse development experienced in other liability classes, most notably due to $100 million of incurred losses related to asbestos and toxic waste claims in older accident years. Overall, prior accident year claim activity for the personal and commercial liability classes was less severe than expected. Favorable development of about $60 million in the aggregate was experienced in the personal and commercial property classes, with the most significant amounts related to the 2013 and 2012 accident years. The severity of late developing property claims that emerged during 2014 was lower than expected. Favorable development of about $50 million was experienced in the workers' compensation class, with favorable development occurring in most accident years. The severity of prior accident year claim activity for this class was lower than expected.
F-19
(5) Unpaid Losses and Loss Expenses (continued)
The net favorable development of $712 million in 2013 was due to various factors. Favorable development of about $265 million in the aggregate, including $30 million related to catastrophes, was experienced in the personal and commercial property classes, mostly related to the 2012 and 2011 accident years. The severity and frequency of late developing property claims that emerged during 2013 were lower than expected, including those related to catastrophes, and the development of existing case reserves was more favorable than expected. Overall favorable development of about $260 million was experienced in the professional liability classes other than fidelity. This favorable development was driven by the directors and officers liability and fiduciary liability classes, partially offset by adverse development in the errors and omissions liability and employment practices liability classes. The reported loss activity was less than expected, with aggregate favorable emergence from accident years 2010 and prior. Favorable development of about $160 million in the aggregate was experienced in the personal and commercial liability classes. The most significant favorable development occurred in the excess liability classes, particularly in accident years 2010 and prior. There was some offsetting adverse development in other liability classes, most notably due to $106 million of incurred losses related to asbestos and toxic waste claims in older accident years. Overall, prior period liability claims were lower than expected, particularly the severity of such claims, and the effects of underwriting changes that affected these years have been more positive than expected. Unfavorable development of about $50 million was experienced in the fidelity class due to higher than expected reported loss emergence, related mostly to accident years subsequent to 2007. Favorable development of about $35 million was experienced in the personal automobile business due primarily to more favorable case reserve development and lower severity of prior period claims than expected. Favorable development of about $30 million was experienced in the surety business due to lower than expected loss emergence in recent accident years.
The net favorable development of $614 million in 2012 was due to various factors. Favorable development of about $250 million in the aggregate was experienced in the personal and commercial liability classes. The most significant favorable development occurred in accident years 2006 to 2009, which more than offset adverse development in accident years 2002 and prior, which included $83 million of incurred losses related to asbestos and toxic waste claims. The overall frequency and severity of prior period liability claims were lower than expected and the effects of underwriting changes that affected these years have been more positive than expected, especially in the commercial excess liability class. Overall favorable development of about $200 million was experienced in the professional liability classes other than fidelity. This favorable development was driven by the directors and officers liability and fiduciary liability classes, partially offset by adverse development experienced in the errors and omissions liability and employment practices liability classes. The reported loss activity was less than expected, with aggregate favorable emergence from accident years 2008 and prior partly offset by some adverse emergence in the more recent accident years. Favorable development of about $125 million in the aggregate was experienced in the personal and commercial property classes, mostly related to the 2007 through 2011 accident years. The severity and frequency of late developing property claims that emerged during 2012 were lower than expected, including those related to catastrophes, and the development of existing case reserves was more favorable than expected. Unfavorable development of about $60 million was experienced in the fidelity class due to higher than expected reported loss emergence, related mostly to accident years 2008 through 2010. Favorable development of about $45 million was experienced in the runoff of our reinsurance assumed business due primarily to better than expected reported loss activity from cedants. Favorable development of about $40 million was experienced in the personal automobile business due primarily to lower than expected frequency of prior period claims. Favorable development of about $25 million was experienced in the surety business due to lower than expected loss emergence in recent accident years.
F-20
(5) Unpaid Losses and Loss Expenses (continued)
(c) The estimation of loss reserves relating to asbestos and toxic waste claims on insurance policies written many years ago is subject to greater uncertainty than other types of claims due to inconsistent court decisions as well as judicial interpretations and legislative actions that in some instances have tended to broaden coverage beyond the original intent of such policies and in others have expanded theories of liability. The insurance industry as a whole remains engaged in extensive litigation over coverage, accident year allocation and liability issues and is thus confronted with a continuing uncertainty in its efforts to quantify these exposures.
Asbestos remains the most significant and difficult mass tort for the insurance industry in terms of claims volume and dollar exposure. Asbestos claims relate primarily to bodily injuries asserted by those who came in contact with asbestos or products containing asbestos. Tort theory affecting asbestos litigation has evolved over the years. Early court cases established the "continuous trigger" theory with respect to insurance coverage. Under this theory, insurance coverage is deemed to be triggered from the time a claimant is first exposed to asbestos until the manifestation of any disease. This interpretation of a policy trigger can involve insurance policies over many years and increases insurance companies' exposure to liability.
New asbestos claims and new exposures on existing claims have continued despite the fact that usage of asbestos has declined since the mid-1970s. Many claimants were exposed to multiple asbestos products over an extended period of time. As a result, claim filings typically name dozens of defendants. The plaintiffs' bar has solicited new claimants through extensive advertising and through asbestos medical screenings. A vast majority of asbestos bodily injury claims have been filed by claimants who do not show any signs of asbestos related disease. New asbestos cases are often filed in those jurisdictions with a reputation for judges and juries that are sympathetic to plaintiffs.
Approximately 110 manufacturers and distributors of asbestos products have filed for bankruptcy protection as a result of asbestos related liabilities. A bankruptcy sometimes involves an agreement to a plan between the debtor and its creditors, including the creation of a trust to pay current and future asbestos claimants for their injuries. Although the debtor is negotiating in part with its insurers' money, insurers are generally given only limited opportunity to be heard. In addition to contributing to the overall number of claims, bankruptcy proceedings not only result in increased settlement demands against remaining solvent defendants, but also create the potential for recoveries from multiple trusts by the same claimant for the same alleged injuries.
There have been some positive legislative and judicial developments in the asbestos environment over the past several years. Various challenges to the mass screening of claimants have occurred which have led to higher medical evidentiary standards for asbestos and other exposure-type claims. Also, a number of states have implemented legislative and judicial reforms that focus the courts' resources on the claims of the most seriously injured. Those who allege serious injury and can present credible evidence of their injuries are receiving priority trial settings in the courts, while those who have not shown any credible disease manifestation are having their hearing dates delayed or placed on an inactive docket, which preserves the right to pursue litigation in the future. Further, a number of jurisdictions have adopted venue reform that requires plaintiffs to have a connection to the jurisdiction in order to file a complaint, although in more recent years, this type of reform has slowed. In recognition that many aspects of bankruptcy plans are unfair to certain classes of claimants and to the insurance industry, these plans are being more closely scrutinized by the courts and rejected when appropriate. Finally, a number of jurisdictions have passed or are considering legislation that will require fuller disclosure by plaintiffs of amounts received from asbestos bankruptcy trusts.
The P&C Group's most significant individual asbestos exposures involve products liability on the part of "traditional" defendants who were engaged in the manufacture, distribution or installation of asbestos products. The P&C Group wrote primary general liability and/or excess liability coverages for these insureds. While these insureds are relatively few in number, their exposure has been substantial due to the high volume of claims, the erosion of the underlying limits and the bankruptcies of target defendants.
F-21
(5) Unpaid Losses and Loss Expenses (continued)
The P&C Group's other asbestos exposures involve products and non-products liability on the part of "peripheral" defendants, including a mix of manufacturers, distributors and installers of certain products that contain asbestos in small quantities and owners or operators of properties where asbestos was present. Generally, these insureds are named defendants on a regional rather than a nationwide basis. As the financial resources of traditional asbestos defendants have been depleted, plaintiffs are targeting these viable peripheral parties with greater frequency and, in many cases, for large awards.
Asbestos claims against the major manufacturers, distributors or installers of asbestos products were typically presented under the products liability section of primary general liability policies as well as under excess liability policies, both of which typically had aggregate limits that capped an insurer's exposure. In recent years, a number of asbestos claims by insureds are being presented as "non-products" claims. In these instances, claimants contend that they came into contact with asbestos at premises owned or operated by the P&C Group's insureds and/or were exposed to asbestos during asbestos installation at a particular location. These non-products claims are presented under the premises or operations section of primary general liability policies. Unlike products coverage, the premises or operations coverages in these older policies typically had no aggregate limits on coverage, creating potentially greater exposure. Further, in an effort to seek additional insurance coverage, some insureds with installation activities who have substantially eroded their products coverage are presenting new asbestos claims as non-products operations claims or attempting to reclassify previously settled products claims as non-products claims to restore a portion of previously exhausted products aggregate limits. It is difficult to predict whether insureds will be successful in asserting claims under non-products coverage or whether insurers will be successful in asserting additional defenses. Accordingly, the ultimate cost to insurers of the claims for coverage not subject to aggregate limits is uncertain.
Various U.S. federal proposals to solve the ongoing asbestos litigation crisis have been considered by the U.S. Congress over the years, but none have yet been enacted. The prospect of federal asbestos reform legislation remains uncertain.
In establishing asbestos reserves, the exposure presented by each insured is evaluated. As part of this evaluation, consideration is given to a variety of factors including: the available insurance coverage; limits and deductibles; the jurisdictions involved; the number of claimants; the disease mix exhibited by the claimants; the past settlement values of similar claims; the potential role of other insurance, particularly underlying coverage below excess liability policies; potential bankruptcy impact; relevant judicial interpretations; and applicable coverage defenses, including asbestos exclusions.
Significant uncertainty remains as to the ultimate liability of the P&C Group related to asbestos related claims. This uncertainty is due to several factors including the long latency period between asbestos exposure and disease manifestation and the resulting potential for involvement of multiple policy periods for individual claims; plaintiffs' expanding theories of liability and increased focus on peripheral defendants; the volume of claims by unimpaired plaintiffs and the extent to which they can be precluded from making claims; the volume of claims by severely impaired plaintiffs, such as those with mesothelioma, and the size of settlements and judgments received by those plaintiffs; the volume of claims by plaintiffs suffering from other malignancies such as lung cancer and their ability to establish a causal link between their disease and exposure to asbestos; the efforts by insureds to claim the right to non-products coverage not subject to aggregate limits; the number of insureds seeking bankruptcy protection as a result of asbestos related liabilities; the ability of claimants to bring a claim in a state in which they have no residency or exposure; the impact of the exhaustion of primary limits and the resulting increase in claims on excess liability policies that the P&C Group has issued; inconsistent court decisions and diverging legal interpretations; and the possibility, however remote, of federal legislation that would address the asbestos problem. These significant uncertainties are not likely to be resolved in the near future.
Toxic waste claims relate primarily to pollution and associated cleanup costs. The P&C Group's insureds have two potential areas of exposure: hazardous waste dump sites and pollution at the insured site primarily from underground storage tanks and manufacturing processes.
F-22
(5) Unpaid Losses and Loss Expenses (continued)
The U.S. federal Comprehensive Environmental Response Compensation and Liability Act of 1980 (Superfund) has been interpreted to impose strict, retroactive and joint and several liability on potentially responsible parties (PRPs) for the cost of remediating hazardous waste sites.
Most PRPs named to date are parties who have been generators, transporters, past or present landowners or past or present site operators. Most sites have multiple PRPs. Insurance policies issued to PRPs were not intended to cover claims arising from gradual pollution. Environmental remediation claims tendered by PRPs and others to insurers have frequently resulted in disputes over insurers' contractual obligations with respect to pollution claims. The resulting litigation against insurers extends to issues of liability, coverage and other policy provisions.
There is substantial uncertainty involved in estimating the P&C Group's liabilities related to these claims. First, the liabilities of the claimants are extremely difficult to estimate. At any given waste site, the allocation of remediation costs among governmental authorities and the PRPs varies greatly depending on a variety of factors. Second, different courts have addressed liability and coverage issues regarding pollution claims and have reached inconsistent conclusions in their interpretation of several issues. These significant uncertainties are not likely to be resolved definitively in the near future.
Uncertainties also remain as to the Superfund law itself. Superfund's taxing authority expired on December 31, 1995 and has not been re-enacted. Federal legislation appears to be at a standstill. At this time, it is not possible to predict the direction that any reforms may take, when they may occur or the effect that any changes may have on the insurance industry.
Without federal movement on Superfund reform, the enforcement of Superfund liability has occasionally shifted to the states. States are being forced to reconsider state-level cleanup statutes and regulations. As individual states move forward, the potential for conflicting state regulation becomes greater. In a few states, cases have been brought against insureds or directly against insurance companies for environmental pollution and natural resources damages. To date, only a few natural resource claims have been filed and they are being vigorously defended. Significant uncertainty remains as to the cost of remediating the state sites. Because of the large number of state sites, such sites could prove even more costly in the aggregate than Superfund sites.
In establishing toxic waste reserves, the exposure presented by each insured is evaluated. As part of this evaluation, consideration is given to a variety of factors including: the probable liability, available insurance coverage, allocation of potential loss to the appropriate accident year, past settlement values of similar claims, relevant judicial interpretations, applicable coverage defenses as well as facts that are unique to each insured.
Based on facts currently known and the present state of the law and coverage litigation, management believes that the loss reserves carried at December 31, 2014 for asbestos and toxic waste claims were adequate. However, given the inherent uncertainties, as well as the judicial decisions and legislative actions that have broadened the scope of coverage and expanded theories of liability in the past and the possibilities of similar interpretations in the future, it is possible that the estimate of loss reserves relating to these exposures may increase in future periods as new information becomes available and as claims develop.
(6) Debt and Credit Arrangements
(a) Long term debt consisted of the following:
| December 31 | ||||||||
| 2014 | 2013 | |||||||
| (in millions) | ||||||||
5.75% notes due May 15, 2018 | $ | 600 | $ | 600 | ||||
6.6% debentures due August 15, 2018 | 100 | 100 | ||||||
6.8% debentures due November 15, 2031 | 200 | 200 | ||||||
6% notes due May 11, 2037 | 800 | 800 | ||||||
6.5% notes due May 15, 2038 | 600 | 600 | ||||||
6.375% capital securities due March 29, 2067 | 1,000 | 1,000 | ||||||
|
|
|
| |||||
| $ | 3,300 | $ | 3,300 | |||||
|
|
|
| |||||
F-23
(6) Debt and Credit Arrangements (continued)
All of the outstanding notes and debentures are unsecured obligations of Chubb. Chubb generally may redeem some or all of the notes and debentures prior to maturity in accordance with the terms of each debt instrument.
Chubb has outstanding $1.0 billion of unsecured junior subordinated capital securities. The capital securities will become due on April 15, 2037, the scheduled maturity date, but only to the extent that Chubb has received sufficient net proceeds from the sale of certain qualifying capital securities. Chubb must use its commercially reasonable efforts, subject to certain market disruption events, to sell enough qualifying capital securities to permit repayment of the capital securities on the scheduled maturity date or as soon thereafter as possible. Any remaining outstanding principal amount will be due on March 29, 2067, the final maturity date. The capital securities bear interest at a fixed rate of 6.375% through April 14, 2017. Thereafter, the capital securities will bear interest at a rate equal to the three-month LIBOR rate plus 2.25%. Subject to certain conditions, Chubb has the right to defer the payment of interest on the capital securities for a period not exceeding ten consecutive years. During any such period, interest will continue to accrue and Chubb generally may not declare or pay any dividends on or purchase any shares of its capital stock.
In connection with the issuance of the capital securities, Chubb entered into a replacement capital covenant in which it agreed that it will not repay, redeem, or purchase the capital securities before March 29, 2047, unless, subject to certain limitations, it has received proceeds from the sale of specified replacement capital securities. The replacement capital covenant is not intended for the benefit of holders of the capital securities and may not be enforced by them. The replacement capital covenant is for the benefit of holders of one or more designated series of Chubb's indebtedness, which initially was and continues to be its 6.8% debentures due November 15, 2031.
Subject to the replacement capital covenant, the capital securities may be redeemed, in whole or in part, at any time on or after April 15, 2017 at a redemption price equal to the principal amount plus any accrued interest or prior to April 15, 2017 at a redemption price equal to the greater of (i) the principal amount or (ii) a make-whole amount, in each case plus any accrued interest.
The amounts of long term debt due annually during the five years subsequent to December 31, 2014 are as follows:
Years Ending December 31 | (in millions) | |||
2015 | $ | - | ||
2016 | - | |||
2017 | - | |||
2018 | 700 | |||
2019 | - | |||
(b) Interest costs of $209 million, $213 million and $224 million were incurred in 2014, 2013 and 2012, respectively. Interest paid was $205 million, $213 million and $220 million in 2014, 2013 and 2012, respectively.
(c) Chubb has a revolving credit agreement with a syndicate of banks that provides for up to $500 million of unsecured borrowings. The revolving credit facility is available for general corporate purposes. The agreement has a maturity date of September 24, 2017. Various interest rate options are available to Chubb, all of which are based on market interest rates. The agreement contains customary restrictive covenants, including a covenant to maintain a minimum adjusted consolidated shareholders' equity. At December 31, 2014, Chubb was in compliance with all such covenants. Chubb is permitted to request an increase in the credit available under the agreement, no more than two times per year, up to a maximum facility amount of $750 million. Chubb is permitted to request on two occasions, at any time during the term of the agreement, an extension of the maturity date for an additional one year period. There have been no borrowings under this agreement. On the maturity date of the agreement, any borrowings then outstanding become payable.
F-24
(7) Federal and Foreign Income Tax
(a) Income tax expense and taxes paid consisted of the following components:
| Years Ended December 31 | ||||||||||||
| 2014 | 2013 | 2012 | ||||||||||
| (in millions) | ||||||||||||
Income tax expense | ||||||||||||
Current tax | ||||||||||||
United States | $ | 617 | $ | 791 | $ | 276 | ||||||
Foreign | 124 | 91 | 143 | |||||||||
Deferred tax, principally United States | 20 | 10 | 32 | |||||||||
|
|
|
|
|
| |||||||
| $ | 761 | $ | 892 | $ | 451 | |||||||
|
|
|
|
|
| |||||||
Federal and foreign income taxes paid | $ | 571 | $ | 789 | $ | 472 | ||||||
|
|
|
|
|
| |||||||
Income before federal and foreign income taxes from U.S. operations was $2,424 million, $2,766 million and $1,373 million in 2014, 2013 and 2012, respectively. Income before federal and foreign income taxes from foreign operations was $437 million, $471 million and $623 million in 2014, 2013 and 2012, respectively.
(b) The effective income tax rate is different than the statutory federal corporate tax rate. The reasons for the different effective tax rate were as follows:
| Years Ended December 31 | ||||||||||||||||||||||||
| 2014 | 2013 | 2012 | ||||||||||||||||||||||
| Amount | % of Pre-Tax Income | Amount | % of Pre-Tax Income | Amount | % of Pre-Tax Income | |||||||||||||||||||
| (in millions) | ||||||||||||||||||||||||
Income before federal and foreign income tax | $ | 2,861 | $ | 3,237 | $ | 1,996 | ||||||||||||||||||
|
|
|
|
|
| |||||||||||||||||||
Tax at statutory federal income tax rate | $ | 1,001 | 35.0 | % | $ | 1,133 | 35.0 | % | $ | 699 | 35.0 | % | ||||||||||||
Tax exempt interest income | (212 | ) | (7.4 | ) | (222 | ) | (6.8 | ) | (233 | ) | (11.7 | ) | ||||||||||||
Other, net | (28 | ) | (1.0 | ) | (19 | ) | (.6 | ) | (15 | ) | (.7 | ) | ||||||||||||
|
|
|
|
|
|
|
|
|
|
|
| |||||||||||||
Federal and foreign income tax | $ | 761 | 26.6 | % | $ | 892 | 27.6 | % | $ | 451 | 22.6 | % | ||||||||||||
|
|
|
|
|
|
|
|
|
|
|
| |||||||||||||
(c) The tax effects of temporary differences that gave rise to deferred income tax assets and liabilities were as follows:
| December 31 | ||||||||
| 2014 | 2013 | |||||||
| (in millions) | ||||||||
Deferred income tax assets | ||||||||
Unpaid losses and loss expenses | $ | 509 | $ | 524 | ||||
Unearned premiums | 364 | 350 | ||||||
Foreign tax credits | 963 | 867 | ||||||
Employee compensation | 144 | 142 | ||||||
Postretirement benefits | 272 | 95 | ||||||
Other-than-temporary impairment losses | 298 | 291 | ||||||
Other, net | 29 | - | ||||||
|
|
|
| |||||
Total | 2,579 | 2,269 | ||||||
|
|
|
| |||||
Deferred income tax liabilities | ||||||||
Deferred policy acquisition costs | 367 | 356 | ||||||
Unremitted earnings of foreign subsidiaries | 1,075 | 970 | ||||||
Unrealized appreciation of investments | 944 | 660 | ||||||
Other invested assets | 208 | 184 | ||||||
Other, net | - | 52 | ||||||
|
|
|
| |||||
Total | 2,594 | 2,222 | ||||||
|
|
|
| |||||
Net deferred income tax asset (liability) | $ | (15 | ) | $ | 47 | |||
|
|
|
| |||||
F-25
(7) Federal and Foreign Income Tax (continued)
Deferred income tax assets were established related to the expected future U.S. tax benefit of losses incurred by a foreign subsidiary of the Corporation. Realization of these deferred tax assets depends on the subsidiary's ability to generate sufficient taxable income in future periods. A valuation allowance of $13 million was recorded at December 31, 2014 and 2013 to reflect management's assessment that the realization of a portion of the deferred tax assets is uncertain due to the inability of the foreign subsidiary to generate sufficient taxable income in the near term. Although realization of the remaining deferred tax assets is not assured, management believes it is more likely than not that such deferred tax assets will be realized.
(d) Chubb and its U.S. subsidiaries file a consolidated federal income tax return with the U.S. Internal Revenue Service (IRS). The Corporation also files income tax returns with various state and foreign tax authorities. The U.S. income tax returns for years prior to 2010 are no longer subject to examination by the IRS. The examination of the U.S. income tax returns for 2010 and 2011 is expected to be completed in 2015. Management does not anticipate any assessments for tax years that remain subject to examination that would have a material effect on the Corporation's financial position or results of operations.
(8) Reinsurance
In the ordinary course of business, the P&C Group assumes and cedes reinsurance with other insurance companies. Reinsurance is ceded to provide greater diversification of risk and to limit the P&C Group's maximum net loss arising from large risks or catastrophic events.
A large portion of the P&C Group's ceded reinsurance is effected under contracts known as treaties under which all risks meeting prescribed criteria are automatically covered. Most of these arrangements consist of excess of loss and catastrophe contracts that protect against a specified part or all of certain types of losses over stipulated amounts arising from any one occurrence or event. In certain circumstances, reinsurance is also effected by negotiation on individual risks.
Ceded reinsurance contracts do not relieve the P&C Group of the primary obligation to its policyholders. Thus, an exposure exists with respect to reinsurance ceded to the extent that any reinsurer is unable or unwilling to meet its obligations assumed under the reinsurance contracts. The P&C Group monitors the financial strength of its reinsurers on an ongoing basis.
Premiums earned and insurance losses and loss expenses are reported net of reinsurance in the consolidated statements of income.
The effect of reinsurance on the premiums written and earned of the P&C Group was as follows:
| Years Ended December 31 | ||||||||||||
| 2014 | 2013 | 2012 | ||||||||||
| (in millions) | ||||||||||||
Direct premiums written | $ | 12,976 | $ | 12,804 | $ | 12,647 | ||||||
Assumed reinsurance | 596 | 503 | 423 | |||||||||
Ceded reinsurance | (980 | ) | (1,083 | ) | (1,200 | ) | ||||||
|
|
|
|
|
| |||||||
Net premiums written | $ | 12,592 | $ | 12,224 | $ | 11,870 | ||||||
|
|
|
|
|
| |||||||
Direct premiums earned | $ | 12,776 | $ | 12,717 | $ | 12,596 | ||||||
Assumed reinsurance | 562 | 476 | 422 | |||||||||
Ceded reinsurance | (1,010 | ) | (1,127 | ) | (1,180 | ) | ||||||
|
|
|
|
|
| |||||||
Net premiums earned | $ | 12,328 | $ | 12,066 | $ | 11,838 | ||||||
|
|
|
|
|
| |||||||
Ceded losses and loss expenses, which reduce losses and loss expenses incurred, were $273 million, $400 million and $586 million in 2014, 2013 and 2012, respectively.
F-26
(9) Stock-Based Employee Compensation Plans
The Corporation has a stock-based employee compensation plan, The Chubb Corporation Long-Term Incentive Plan. The compensation cost with respect to the plan was $85 million, $89 million and $84 million in 2014, 2013 and 2012, respectively. The total income tax benefit included in net income with respect to the stock-based compensation arrangement was $30 million, $31 million and $29 million in 2014, 2013 and 2012, respectively.
As of December 31, 2014, there was $78 million of unrecognized compensation cost related to nonvested awards. That cost is expected to be reflected in operating results over a weighted average period of 1.7 years.
The Long-Term Incentive Plan provides for the granting of restricted stock units, restricted stock, performance units, stock options and other stock-based awards to the Corporation's employees. The maximum number of shares of Chubb's common stock with respect to which stock-based awards may be granted under the plan most recently approved by shareholders is 7.4 million shares. Additional shares of Chubb's common stock may also become available for grant in connection with the cancellation, forfeiture and/or settlement of awards previously granted. At December 31, 2014, 8.2 million shares were available for grant.
Restricted Stock Units, Performance Units and Restricted Stock
Restricted stock unit awards are payable in cash, in shares of Chubb's common stock or in a combination of both. Restricted stock units are not considered to be outstanding shares of common stock, have no voting rights and are subject to forfeiture during the restriction period. Holders of restricted stock units may receive dividend equivalents. Performance unit awards are based on the achievement of performance goals over three year performance periods. Performance unit awards are payable in cash, in shares of Chubb's common stock or in a combination of both. Restricted stock awards consist of shares of Chubb's common stock granted at no cost to the employees. Shares of restricted stock become outstanding when granted, receive dividends and have voting rights. The shares are subject to forfeiture and to restrictions that prevent their sale or transfer during the restriction period.
An amount equal to the fair value at the date of grant of restricted stock unit awards and performance unit awards is expensed over the vesting period. The weighted average fair value per share of the restricted stock units granted was $86.67, $83.75 and $68.64 in 2014, 2013 and 2012, respectively. The weighted average fair value per share of the performance units granted was $76.32, $98.46 and $63.38 in 2014, 2013 and 2012, respectively.
Additional information with respect to restricted stock units and performance units is as follows:
| Restricted Stock Units | Performance Units* | |||||||||||||||
| Number of Shares | Weighted Average Grant Date Fair Value | Number of Shares | Weighted Average Grant Date Fair Value | |||||||||||||
Nonvested, January 1, 2014 | 2,127,647 | $ | 70.23 | 861,141 | $ | 79.87 | ||||||||||
Granted | 625,197 | 86.67 | 421,271 | 76.32 | ||||||||||||
Vested** | (762,349 | ) | 60.53 | (456,176 | ) | 63.38 | ||||||||||
Forfeited | (82,551 | ) | 81.16 | (4,041 | ) | 77.87 | ||||||||||
|
|
|
| |||||||||||||
Nonvested, December 31, 2014 | 1,907,944 | 79.02 | 822,195 | 87.21 | ||||||||||||
|
|
|
| |||||||||||||
| * | The number of shares earned may range from 0% to 200% of the performance units shown in the table above. |
| ** | The performance units earned in 2014 were 35.2% of the vested shares shown in the table, or 160,574 shares. |
The total fair value of restricted stock units that vested during 2014, 2013 and 2012 was $66 million, $72 million and $74 million, respectively. The total fair value of performance units that vested during 2014, 2013 and 2012 was $17 million, $64 million and $70 million, respectively.
F-27
(9) Stock-Based Employee Compensation Plans (continued)
Stock Options
Stock options are granted at exercise prices not less than the fair value of Chubb's common stock on the date of grant. The terms and conditions upon which options become exercisable may vary among grants. Options expire no later than ten years from the date of grant.
An amount equal to the fair value of stock options at the date of grant is expensed over the vesting period. The weighted average fair value per stock option granted during 2014, 2013 and 2012 was $15.48, $14.95 and $11.95, respectively. The fair value of each stock option was estimated on the date of grant using the Black-Scholes option pricing model.
Additional information with respect to stock options is as follows:
| Number of Shares | Weighted Average Exercise Price | Weighted Average Remaining Contractual Term | Aggregate Intrinsic Value | |||||||||||||
| (in years) | (in millions) | |||||||||||||||
Outstanding, January 1, 2014 | 251,687 | $ | 62.52 | |||||||||||||
Granted | 65,605 | 86.59 | ||||||||||||||
Exercised | (54,932 | ) | 59.08 | |||||||||||||
Forfeited | (6,949 | ) | 82.83 | |||||||||||||
|
| |||||||||||||||
Outstanding, December 31, 2014 | 255,411 | 68.89 | 6.6 | $ | 9 | |||||||||||
|
| |||||||||||||||
Exercisable, December 31, 2014 | 128,880 | 55.24 | 4.8 | 6 | ||||||||||||
The total intrinsic value of the stock options exercised during 2014, 2013 and 2012 was $2 million, $16 million and $40 million, respectively. The Corporation received cash of $3 million, $10 million and $47 million during 2014, 2013 and 2012, respectively, from the exercise of stock options. The tax benefit realized with respect to the exercise of stock options was $1 million, $5 million and $13 million during 2014, 2013 and 2012, respectively.
F-28
(10) Employee Benefits
(a) The Corporation has several non-contributory defined benefit pension plans covering substantially all employees. Prior to 2001, benefits were generally based on an employee's years of service and average compensation during the last five years of employment. Effective January 1, 2001, the Corporation changed the formula for providing pension benefits from the final average pay formula to a cash balance formula. Under the cash balance formula, a notional account is established for each employee, which is credited semi-annually with an amount equal to a percentage of eligible compensation based on age and years of service plus interest based on the account balance. Employees hired prior to 2001 will generally be eligible to receive vested benefits based on the higher of the final average pay or cash balance formulas.
The Corporation's funding policy is to contribute amounts that meet regulatory requirements plus additional amounts determined by management based on actuarial valuations, market conditions and other factors. This may result in no contribution being made in a particular year.
The Corporation also provides certain other postretirement benefits, principally health care and life insurance, to retired employees and their beneficiaries and covered dependents. Substantially all employees hired before January 1, 1999 may become eligible for these benefits upon retirement if they meet minimum age and years of service requirements. Health care coverage is contributory. Retiree contributions vary based upon a retiree's age, type of coverage and years of service with the Corporation. Life insurance coverage is non-contributory.
The Corporation funds a portion of the health care benefits obligation where such funding can be accomplished on a tax effective basis. Benefits are paid as covered expenses are incurred.
The funded status of the pension and other postretirement benefit plans at December 31, 2014 and 2013 was as follows:
| Pension Benefits | Other Postretirement Benefits | |||||||||||||||
| 2014 | 2013 | 2014 | 2013 | |||||||||||||
| (in millions) | ||||||||||||||||
Benefit obligation, beginning of year | $ | 2,777 | $ | 2,894 | $ | 394 | $ | 470 | ||||||||
Service cost | 86 | 95 | 10 | 13 | ||||||||||||
Interest cost | 140 | 125 | 19 | 19 | ||||||||||||
Actuarial loss (gain) | 536 | (261 | ) | 74 | (97 | ) | ||||||||||
Benefits paid | (85 | ) | (75 | ) | (10 | ) | (11 | ) | ||||||||
Foreign currency translation effect | (19 | ) | (1 | ) | (2 | ) | - | |||||||||
|
|
|
|
|
|
|
| |||||||||
Benefit obligation, end of year | 3,435 | 2,777 | 485 | 394 | ||||||||||||
|
|
|
|
|
|
|
| |||||||||
Plan assets at fair value, beginning of year | 2,717 | 2,305 | 130 | 96 | ||||||||||||
Actual return on plan assets | 240 | 409 | 12 | 27 | ||||||||||||
Employer contributions | 92 | 82 | 11 | 18 | ||||||||||||
Benefits paid | (85 | ) | (75 | ) | (10 | ) | (11 | ) | ||||||||
Foreign currency translation effect | (18 | ) | (4 | ) | - | - | ||||||||||
|
|
|
|
|
|
|
| |||||||||
Plan assets at fair value, end of year | 2,946 | 2,717 | 143 | 130 | ||||||||||||
|
|
|
|
|
|
|
| |||||||||
Funded status at end of year, included in other liabilities | $ | 489 |
| $ | 60 | $ | 342 | $ | 264 | |||||||
|
|
|
|
|
|
|
| |||||||||
Net actuarial loss (gain) and prior service cost included in accumulated other comprehensive income that were not yet recognized as components of net benefit costs at December 31, 2014 and 2013 were as follows:
| Pension Benefits | Other Postretirement Benefits | |||||||||||||||
| 2014 | 2013 | 2014 | 2013 | |||||||||||||
| (in millions) | ||||||||||||||||
Net actuarial loss (gain) | $ | 842 | $ | 396 | $ | 58 | $ | (13 | ) | |||||||
Prior service cost | 14 | 16 | 1 | 1 | ||||||||||||
|
|
|
|
|
|
|
| |||||||||
| $ | 856 | $ | 412 | $ | 59 | $ | (12 | ) | ||||||||
|
|
|
|
|
|
|
| |||||||||
F-29
(10) Employee Benefits (continued)
The accumulated benefit obligation for the pension plans was $2,923 million and $2,381 million at December 31, 2014 and 2013, respectively. The accumulated benefit obligation is the present value of pension benefits earned as of the measurement date based on employee service and compensation prior to that date. It differs from the pension benefit obligation in the table on the previous page in that the accumulated benefit obligation includes no assumptions regarding future compensation levels.
The weighted average assumptions used to determine the benefit obligations were as follows:
| Pension Benefits | Other Postretirement Benefits | |||||||||||||||
| 2014 | 2013 | 2014 | 2013 | |||||||||||||
Discount rate | 4.3 | % | 5.2 | % | 4.3 | % | 5.2 | % | ||||||||
Rate of compensation increase | 4.5 | 4.5 | - | - | ||||||||||||
The components of net pension and other postretirement benefit costs reflected in net income and other changes in plan assets and benefit obligations recognized in other comprehensive income for the years ended December 31, 2014, 2013 and 2012 were as follows:
| Pension Benefits | Other Postretirement Benefits | |||||||||||||||||||||||
| 2014 | 2013 | 2012 | 2014 | 2013 | 2012 | |||||||||||||||||||
| (in millions) | ||||||||||||||||||||||||
Costs reflected in net income | ||||||||||||||||||||||||
Service cost | $ | 86 | $ | 95 | $ | 88 | $ | 10 | $ | 13 | $ | 12 | ||||||||||||
Interest cost | 140 | 125 | 124 | 19 | 19 | 20 | ||||||||||||||||||
Expected return on plan assets | (186 | ) | (165 | ) | (155 | ) | (9 | ) | (7 | ) | (6 | ) | ||||||||||||
Amortization of net actuarial loss and prior service cost and other | 35 | 90 | 80 | - | 3 | 3 | ||||||||||||||||||
|
|
|
|
|
|
|
|
|
|
|
| |||||||||||||
| $ | 75 | $ | 145 | $ | 137 | $ | 20 | $ | 28 | $ | 29 | |||||||||||||
|
|
|
|
|
|
|
|
|
|
|
| |||||||||||||
Changes in plan assets and benefit obligations recognized in other comprehensive income | ||||||||||||||||||||||||
Net actuarial loss (gain) | $ | 479 | $ | (505 | ) | $ | 139 | $ | 71 | $ | (117 | ) | $ | (11 | ) | |||||||||
Amortization of net actuarial loss and prior service cost and other | (35 | ) | (90 | ) | (80 | ) | - | (3 | ) | (3 | ) | |||||||||||||
|
|
|
|
|
|
|
|
|
|
|
| |||||||||||||
| $ | 444 | $ | (595 | ) | $ | 59 | $ | 71 | $ | (120 | ) | $ | (14 | ) | ||||||||||
|
|
|
|
|
|
|
|
|
|
|
| |||||||||||||
The estimated aggregate net actuarial loss and prior service cost that will be amortized from accumulated other comprehensive income into net benefit costs during 2015 for the pension and other postretirement benefit plans is $65 million.
The weighted average assumptions used to determine net pension and other postretirement benefit costs were as follows:
| Pension Benefits | Other Postretirement Benefits | |||||||||||||||||||||||
| 2014 | 2013 | 2012 | 2014 | 2013 | 2012 | |||||||||||||||||||
Discount rate | 5.2% | 4.4% | 5.0% | 5.2% | 4.4% | 5.0% | ||||||||||||||||||
Rate of compensation increase | 4.5 | 4.5 | 4.5 | - | - | - | ||||||||||||||||||
Expected long term rate of return on plan assets | 7.5 | 7.5 | 7.75 | 7.5 | 7.5 | 7.75 | ||||||||||||||||||
F-30
(10) Employee Benefits (continued)
The weighted average health care cost trend rate assumptions used to measure the expected cost of medical benefits were as follows:
| December 31 | ||||||||
| 2014 | 2013 | |||||||
Health care cost trend rate for next year | 7.3 | % | 7.6 | % | ||||
Rate to which the cost trend rate is assumed to decline (the ultimate trend rate) | 4.5 | 4.5 | ||||||
Year that the rate reaches the ultimate trend rate | 2028 | 2028 | ||||||
The health care cost trend rate assumption has a significant effect on the amount of the accumulated other postretirement benefit obligation and the net other postretirement benefit cost reported. To illustrate, a one percent increase in the trend rate for each year would increase the accumulated other postretirement benefit obligation at December 31, 2014 by approximately $92 million and the aggregate of the service and interest cost components of net other postretirement benefit cost for the year ended December 31, 2014 by approximately $5 million. A one percent decrease in the trend rate for each year would decrease the accumulated other postretirement benefit obligation at December 31, 2014 by approximately $73 million and the aggregate of the service and interest cost components of net other postretirement benefit cost for the year ended December 31, 2014 by approximately $4 million.
The long term objective of the pension plan is to provide sufficient funding to cover expected benefit obligations, while assuming a prudent level of portfolio risk. The assets of the pension plan are invested, either directly or through pooled funds, in a diversified portfolio of predominately U.S. equity securities and fixed maturities. The Corporation seeks to obtain a rate of return that over time equals or exceeds the returns of the broad markets in which the plan assets are invested. The target allocation of plan assets is 55% to 65% invested in equity securities, with the remainder primarily invested in fixed maturities. The Corporation rebalances its pension assets to the target allocation as market conditions permit. The Corporation determined the expected long term rate of return assumption for each asset class based on an analysis of the historical returns and the expectations for future returns. The expected long term rate of return for the portfolio is a weighted aggregation of the expected returns for each asset class.
The fair values of the pension plan assets were as follows:
| December 31 | ||||||||
| 2014 | 2013 | |||||||
| (in millions) | ||||||||
Short term investments | $ | 48 | $ | 37 | ||||
|
|
|
| |||||
Fixed maturities | ||||||||
U.S. government and government agency and authority obligations | 209 | 224 | ||||||
Corporate bonds | 419 | 371 | ||||||
Foreign government and government agency obligations | 137 | 104 | ||||||
Mortgage-backed securities | 228 | 217 | ||||||
|
|
|
| |||||
Total fixed maturities | 993 | 916 | ||||||
|
|
|
| |||||
Equity securities | 1,850 | 1,718 | ||||||
|
|
|
| |||||
Other assets | 55 | 46 | ||||||
|
|
|
| |||||
| $ | 2,946 | $ | 2,717 | |||||
|
|
|
| |||||
At December 31, 2014 and 2013, pension plan assets invested in pooled funds had a fair value of $1,556 million and $1,425 million, respectively.
At December 31, 2014 and 2013, other postretirement benefit plan assets were invested in pooled funds and had a fair value of $143 million and $130 million, respectively.
F-31
(10) Employee Benefits (continued)
The estimated benefits expected to be paid in each of the next five years and in the aggregate for the following five years are as follows:
Years Ending December 31 | Pension Benefits | Other Postretirement Benefits | ||||||
| (in millions) | ||||||||
2015 | $ | 105 | $ | 12 | ||||
2016 | 115 | 14 | ||||||
2017 | 151 | 15 | ||||||
2018 | 132 | 17 | ||||||
2019 | 143 | 18 | ||||||
2020-2024 | 868 | 117 | ||||||
(b) The Corporation has a defined contribution benefit plan, the Capital Accumulation Plan, in which substantially all employees are eligible to participate. Under this plan, the employer makes matching contributions equal to 100% of each eligible employee's pre-tax elective contributions, up to 4% of the employee's eligible compensation. Contributions are invested at the election of the employee in Chubb's common stock or in various other investment funds. The expense recognized with respect to the plan was $30 million, $29 million and $26 million in 2014, 2013 and 2012, respectively.
(11) Comprehensive Income
Comprehensive income is defined as all changes in shareholders' equity, except those arising from transactions with shareholders. Comprehensive income includes net income and other comprehensive income or loss, which for the Corporation consists of changes in unrealized appreciation or depreciation of investments carried at fair value, changes in unrealized other-than-temporary impairment losses of fixed maturities, changes in postretirement benefit costs not yet recognized in net income and changes in foreign currency translation gains or losses.
The components of other comprehensive income or loss were as follows:
| Years Ended December 31 | ||||||||||||||||||||||||||||||||||||
| 2014 | 2013 | 2012 | ||||||||||||||||||||||||||||||||||
| Before Tax | Income Tax | Net of Tax | Before Tax | Income Tax | Net of Tax | Before Tax | Income Tax | Net of Tax | ||||||||||||||||||||||||||||
| (in millions) | ||||||||||||||||||||||||||||||||||||
Net unrealized holding gains (losses) arising | $ | 1,032 | $ | 361 | $ | 671 | $ | (1,000 | ) | $ | (350 | ) | $ | (650 | ) | $ | 556 | $ | 195 | $ | 361 | |||||||||||||||
Unrealized other-than-temporary | - | - | - | - | - | - | (2 | ) | (1 | ) | (1 | ) | ||||||||||||||||||||||||
Reclassification adjustment for net realized | 220 | 77 | 143 | 212 | 74 | 138 | 127 | 44 | 83 | |||||||||||||||||||||||||||
|
|
|
|
|
|
|
|
|
|
|
|
|
|
|
|
|
| |||||||||||||||||||
Net unrealized gains (losses) recognized in other comprehensive income or loss | 812 | 284 | 528 | (1,212 | ) | (424 | ) | (788 | ) | 427 | 150 | 277 | ||||||||||||||||||||||||
|
|
|
|
|
|
|
|
|
|
|
|
|
|
|
|
|
| |||||||||||||||||||
Postretirement benefit gain (loss) not
yet | (550 | ) | (192 | ) | (358 | ) | 622 | 218 | 404 | (128 | ) | (45 | ) | (83 | ) | |||||||||||||||||||||
Reclassification adjustment for the | (35 | ) | (13 | ) | (22 | ) | (93 | ) | (33 | ) | (60 | ) | (83 | ) | (30 | ) | (53 | ) | ||||||||||||||||||
|
|
|
|
|
|
|
|
|
|
|
|
|
|
|
|
|
| |||||||||||||||||||
Net change in postretirement benefit | (515 | ) | (179 | ) | (336 | ) | 715 | 251 | 464 | (45 | ) | (15 | ) | (30 | ) | |||||||||||||||||||||
|
|
|
|
|
|
|
|
|
|
|
|
|
|
|
|
|
| |||||||||||||||||||
Foreign currency translation losses | (180 | ) | (63 | ) | (117 | ) | (111 | ) | (39 | ) | (72 | ) | (16 | ) | (5 | ) | (11 | ) | ||||||||||||||||||
|
|
|
|
|
|
|
|
|
|
|
|
|
|
|
|
|
| |||||||||||||||||||
Total other comprehensive income (loss) | $ | 117 | $ | 42 | $ | 75 | $ | (608 | ) | $ | (212 | ) | $ | (396 | ) | $ | 366 | $ | 130 | $ | 236 | |||||||||||||||
|
|
|
|
|
|
|
|
|
|
|
|
|
|
|
|
|
| |||||||||||||||||||
| (a) | Postretirement benefit costs recognized in net income during the period are included among several of the loss and expense components presented in the consolidated statements of income. |
F-32
(12) Commitments and Contingent Liabilities
(a) Chubb Financial Solutions (CFS), a wholly owned subsidiary of Chubb, participated in derivative financial instruments and has been in runoff since 2003. At December 31, 2014, CFS's remaining derivative contracts were insignificant.
CFS's aggregate exposure, or retained risk, from its derivative contracts is referred to as notional amount. Notional amounts are used to calculate the exchange of contractual cash flows and are not necessarily representative of the potential for gain or loss. Notional amounts are not recorded on the balance sheet. The notional amount of future obligations under CFS's derivative contracts at December 31, 2014 and 2013 was approximately $55 million and $80 million, respectively.
Future obligations with respect to the derivative contracts are carried at fair value at the balance sheet date and are included in other liabilities. The fair value of future obligations under CFS's derivative contracts at both December 31, 2014 and 2013 was approximately $2 million.
(b) The Corporation occupies office facilities under lease agreements that expire at various dates through 2029; such leases are generally renewed or replaced by other leases. Most facility leases contain renewal options for increments ranging from two to ten years. The Corporation also leases data processing, office and transportation equipment. All leases are operating leases.
Rent expense was as follows:
| Years Ended December 31 | ||||||||||||
| 2014 | 2013 | 2012 | ||||||||||
| (in millions) | ||||||||||||
Office facilities | $ | 67 | $ | 71 | $ | 71 | ||||||
Equipment | 13 | 13 | 11 | |||||||||
|
|
|
|
|
| |||||||
| $ | 80 | $ | 84 | $ | 82 | |||||||
|
|
|
|
|
| |||||||
At December 31, 2014, future minimum rental payments required under non-cancellable operating leases were as follows:
Years Ending December 31 | (in millions) | |||
2015 | $ | 63 | ||
2016 | 52 | |||
2017 | 47 | |||
2018 | 40 | |||
2019 | 30 | |||
After 2019 | 81 | |||
|
| |||
| $ | 313 | |||
|
| |||
(c) The Corporation had commitments totaling $860 million at December 31, 2014 to fund limited partnership investments. These commitments can be called by the partnerships (generally over a period of 5 years or less) to fund certain partnership expenses or the purchase of investments.
F-33
(13) Segments Information
The principal business of the Corporation is the sale of property and casualty insurance. The profitability of the property and casualty insurance business depends on the results of both underwriting operations and investments, which are viewed as two distinct operations. The underwriting operations are managed and evaluated separately from the investment function.
The P&C Group underwrites most lines of property and casualty insurance. Underwriting operations consist of four separate business units: personal insurance, commercial insurance, specialty insurance and reinsurance assumed. The personal segment targets the personal insurance market. The personal classes include automobile, homeowners and other personal coverages. The commercial segment includes those classes of business that are generally available in broad markets and are of a more commodity nature. Commercial classes include multiple peril, casualty, workers' compensation and property and marine. The specialty segment includes those classes of business that are available in more limited markets since they require specialized underwriting and claim settlement. Specialty classes include professional liability coverages and surety. The reinsurance assumed business has been in runoff since the transfer of the ongoing reinsurance assumed business to a reinsurance company in 2005.
Corporate and other includes investment income earned on corporate invested assets, corporate expenses and the results of the Corporation's non-insurance subsidiaries.
Performance of the property and casualty underwriting segments is measured based on statutory underwriting results. Statutory underwriting profit is arrived at by reducing premiums earned by losses and loss expenses incurred and statutory underwriting expenses incurred. Under statutory accounting principles applicable to property and casualty insurance companies, policy acquisition and other underwriting expenses are recognized immediately, not at the time premiums are earned.
Management uses underwriting results determined in accordance with GAAP to assess the overall performance of the underwriting operations. Underwriting income determined in accordance with GAAP is defined as premiums earned less losses and loss expenses incurred and GAAP underwriting expenses incurred. To convert statutory underwriting results to a GAAP basis, certain policy acquisition expenses are deferred and amortized over the period in which the related premiums are earned.
Investment income performance is measured based on investment income net of investment expenses, excluding realized investment gains and losses.
Distinct investment portfolios are not maintained for each underwriting segment. Property and casualty invested assets are available for payment of losses and expenses for all classes of business. Therefore, such assets and the related investment income are not allocated to underwriting segments.
F-34
(13) Segments Information (continued)
Revenues, income before income tax and assets of each operating segment were as follows:
| Years Ended December 31 | ||||||||||||
| 2014 | 2013 | 2012 | ||||||||||
| (in millions) | ||||||||||||
Revenues | ||||||||||||
Property and casualty insurance | ||||||||||||
Premiums earned | ||||||||||||
Personal insurance | $ | 4,418 | $ | 4,214 | $ | 4,024 | ||||||
Commercial insurance | 5,281 | 5,237 | 5,144 | |||||||||
Specialty insurance | 2,628 | 2,618 | 2,666 | |||||||||
|
|
|
|
|
| |||||||
Total insurance | 12,327 | 12,069 | 11,834 | |||||||||
Reinsurance assumed | 1 | (3 | ) | 4 | ||||||||
|
|
|
|
|
| |||||||
| 12,328 | 12,066 | 11,838 | ||||||||||
Investment income | 1,368 | 1,436 | 1,518 | |||||||||
|
|
|
|
|
| |||||||
Total property and casualty insurance | 13,696 | 13,502 | 13,356 | |||||||||
Corporate and other | 33 | 43 | 46 | |||||||||
Realized investment gains, net | 369 | 402 | 193 | |||||||||
|
|
|
|
|
| |||||||
Total revenues | $ | 14,098 | $ | 13,947 | $ | 13,595 | ||||||
|
|
|
|
|
| |||||||
Income (loss) before income tax | ||||||||||||
Property and casualty insurance | ||||||||||||
Underwriting | ||||||||||||
Personal insurance | $ | 370 | $ | 509 | $ | 192 | ||||||
Commercial insurance | 492 | 692 | 44 | |||||||||
Specialty insurance | 495 | 406 | 262 | |||||||||
|
|
|
|
|
| |||||||
Total insurance | 1,357 | 1,607 | 498 | |||||||||
Reinsurance assumed | - | 9 | 47 | |||||||||
|
|
|
|
|
| |||||||
| 1,357 | 1,616 | 545 | ||||||||||
Increase in deferred policy acquisition costs | 45 | 59 | 3 | |||||||||
|
|
|
|
|
| |||||||
Underwriting income | 1,402 | 1,675 | 548 | |||||||||
Investment income | 1,329 | 1,391 | 1,482 | |||||||||
Other income (charges) | (4 | ) | 6 | 10 | ||||||||
|
|
|
|
|
| |||||||
Total property and casualty insurance | 2,727 | 3,072 | 2,040 | |||||||||
Corporate and other | (235 | ) | (237 | ) | (237 | ) | ||||||
Realized investment gains, net | 369 | 402 | 193 | |||||||||
|
|
|
|
|
| |||||||
Total income before income tax | $ | 2,861 | $ | 3,237 | $ | 1,996 | ||||||
|
|
|
|
|
| |||||||
| December 31 | ||||||||||||
| 2014 | 2013 | 2012 | ||||||||||
| (in millions) | ||||||||||||
Assets | ||||||||||||
Property and casualty insurance | $ | 49,297 | $ | 48,278 | $ | 49,441 | ||||||
Corporate and other | 2,078 | 2,248 | 2,830 | |||||||||
Adjustments and eliminations | (89 | ) | (93 | ) | (87 | ) | ||||||
|
|
|
|
|
| |||||||
Total assets | $ | 51,286 | $ | 50,433 | $ | 52,184 | ||||||
|
|
|
|
|
| |||||||
F-35
(13) Segments Information (continued)
The international business of the property and casualty insurance segments is conducted primarily through subsidiaries that operate solely outside of the United States. Their assets and liabilities are located principally in the countries where the insurance risks are written. International business is also written by branch offices of a U.S. subsidiary.
Revenues of the P&C Group by geographic area were as follows:
| Years Ended December 31 | ||||||||||||
| 2014 | 2013 | 2012 | ||||||||||
| (in millions) | ||||||||||||
Revenues | ||||||||||||
United States | $ | 10,448 | $ | 10,205 | $ | 9,996 | ||||||
International | 3,248 |
|
3,297 |
|
|
3,360 |
| |||||
|
|
|
|
|
| |||||||
Total | $ | 13,696 | $ | 13,502 | $ | 13,356 | ||||||
|
|
|
|
|
| |||||||
(14) Fair Values of Financial Instruments
(a) Fair values of financial instruments are determined by management using valuation techniques that maximize the use of observable inputs and minimize the use of unobservable inputs. Fair values are generally measured using quoted prices in active markets for identical assets or liabilities or other inputs, such as quoted prices for similar assets or liabilities, that are observable, either directly or indirectly. In those instances where observable inputs are not available, fair values are measured using unobservable inputs for the asset or liability. Unobservable inputs reflect the Corporation's own assumptions about the assumptions that market participants would use in pricing the asset or liability and are developed based on the best information available in the circumstances. Fair value estimates derived from unobservable inputs are affected by the assumptions used, including the discount rates and the estimated amounts and timing of future cash flows. The derived fair value estimates cannot be substantiated by comparison to independent markets and are not necessarily indicative of the amounts that would be realized in a current market exchange. Certain financial instruments, particularly insurance contracts, are excluded from fair value disclosure requirements.
The methods and assumptions used to estimate the fair values of financial instruments are as follows:
(i) The carrying value of short term investments approximates fair value due to the short maturities of these investments.
(ii) Fair values of fixed maturities are determined by management, utilizing prices obtained from a third party, nationally recognized pricing service or, in the case of securities for which prices are not provided by a pricing service, from third party brokers. For fixed maturities that have quoted prices in active markets, market quotations are provided. For fixed maturities that do not trade on a daily basis, the pricing service and brokers provide fair value estimates using a variety of inputs including, but not limited to, benchmark yields, reported trades, broker/dealer quotes, issuer spreads, bids, offers, reference data, prepayment rates and measures of volatility. Management reviews on an ongoing basis the reasonableness of the methodologies used by the relevant pricing service and brokers. In addition, management, using the prices received for the securities from the pricing service and brokers, determines the aggregate portfolio price performance and reviews it against applicable indices. If management believes that significant discrepancies exist, it will discuss these with the relevant pricing service or broker to resolve the discrepancies.
(iii) Fair values of equity securities are determined by management, utilizing quoted market prices.
(iv) Fair values of long term debt issued by Chubb are determined by management, utilizing prices obtained from a third party, nationally recognized pricing service.
F-36
(14) Fair Values of Financial Instruments (continued)
The carrying values and fair values of financial instruments were as follows:
| December 31 | ||||||||||||||||
| 2014 | 2013 | |||||||||||||||
| Carrying Value | Fair Value | Carrying Value | Fair Value | |||||||||||||
| (in millions) | ||||||||||||||||
Assets | ||||||||||||||||
Invested assets | ||||||||||||||||
Short term investments | $ | 1,318 | $ | 1,318 | $ | 2,114 | $ | 2,114 | ||||||||
Fixed maturities (Note 2) | 38,780 | 38,780 | 37,091 | 37,091 | ||||||||||||
Equity securities | 1,964 | 1,964 | 1,810 | 1,810 | ||||||||||||
Liabilities | ||||||||||||||||
Long term debt (Note 6) | 3,300 | 4,013 | 3,300 | 3,806 | ||||||||||||
At December 31, 2014 and 2013, a pricing service provided fair value amounts for approximately 99% of the Corporation's fixed maturities. The prices obtained from a pricing service and brokers generally are non-binding, but are reflective of current market transactions in the applicable financial instruments.
At December 31, 2014 and 2013, the Corporation held an insignificant amount of financial instruments in its investment portfolio for which a lack of market liquidity impacted the determination of fair value.
The fair value hierarchy prioritizes the inputs to valuation techniques used to measure fair value into three broad levels as follows:
| Level 1 - | Unadjusted quoted prices in active markets for identical financial instruments. | |
| Level 2 - | Other inputs that are observable for the financial instrument, either directly or indirectly. | |
| Level 3 - | Significant unobservable inputs. | |
The fair value of financial instruments categorized based upon the lowest level of input that was significant to the fair value measurement was as follows:
| December 31, 2014 | ||||||||||||||||
| Level 1 | Level 2 | Level 3 | Total | |||||||||||||
| (in millions) | ||||||||||||||||
Assets | ||||||||||||||||
Short term investments | $ | 206 | $ | 1,112 | $ | - | $ | 1,318 | ||||||||
|
|
|
|
|
|
|
| |||||||||
Fixed maturities | ||||||||||||||||
Tax exempt | - | 19,769 | 3 | 19,772 | ||||||||||||
|
|
|
|
|
|
|
| |||||||||
Taxable | ||||||||||||||||
U.S. government and government agency and authority obligations | - | 2,007 | - | 2,007 | ||||||||||||
Corporate bonds | - | 8,912 | 116 | 9,028 | ||||||||||||
Foreign government and government agency obligations | - | 6,663 | 9 | 6,672 | ||||||||||||
Residential mortgage-backed securities | - | 210 | 1 | 211 | ||||||||||||
Commercial mortgage-backed securities | - | 1,090 | - | 1,090 | ||||||||||||
|
|
|
|
|
|
|
| |||||||||
| - | 18,882 | 126 | 19,008 | |||||||||||||
|
|
|
|
|
|
|
| |||||||||
Total fixed maturities | - | 38,651 | 129 | 38,780 | ||||||||||||
|
|
|
|
|
|
|
| |||||||||
Equity securities | 1,958 | - | 6 | 1,964 | ||||||||||||
|
|
|
|
|
|
|
| |||||||||
| $ | 2,164 | $ | 39,763 | $ | 135 | $ | 42,062 | |||||||||
|
|
|
|
|
|
|
| |||||||||
Liabilities | ||||||||||||||||
Long term debt | $ | - | $ | 4,013 | $ | - | $ | 4,013 | ||||||||
|
|
|
|
|
|
|
| |||||||||
F-37
(14) Fair Values of Financial Instruments (continued)
| December 31, 2013 | ||||||||||||||||
| Level 1 | Level 2 | Level 3 | Total | |||||||||||||
| (in millions) | ||||||||||||||||
Assets | ||||||||||||||||
Short term investments | $ | 399 | $ | 1,715 | $ | - | $ | 2,114 | ||||||||
|
|
|
|
|
|
|
| |||||||||
Fixed maturities | ||||||||||||||||
Tax exempt | - | 18,416 | 5 | 18,421 | ||||||||||||
|
|
|
|
|
|
|
| |||||||||
Taxable | ||||||||||||||||
U.S. government and government agency and authority obligations | - | 802 | - | 802 | ||||||||||||
Corporate bonds | - | 9,179 | 135 | 9,314 | ||||||||||||
Foreign government and government agency obligations | - | 6,881 | 9 | 6,890 | ||||||||||||
Residential mortgage-backed securities | - | 293 | 6 | 299 | ||||||||||||
Commercial mortgage-backed securities | - | 1,345 | 20 | 1,365 | ||||||||||||
|
|
|
|
|
|
|
| |||||||||
| - | 18,500 | 170 | 18,670 | |||||||||||||
|
|
|
|
|
|
|
| |||||||||
Total fixed maturities | - | 36,916 | 175 | 37,091 | ||||||||||||
|
|
|
|
|
|
|
| |||||||||
Equity securities | 1,803 | - | 7 | 1,810 | ||||||||||||
|
|
|
|
|
|
|
| |||||||||
|
$2,202 |
|
|
$38,631 |
|
|
$182 |
|
|
$41,015 |
| |||||
|
|
|
|
|
|
|
| |||||||||
Liabilities | ||||||||||||||||
Long term debt |
$ |
- |
|
$ |
3,806 |
|
$ |
- |
|
$ |
3,806 |
| ||||
|
|
|
|
|
|
|
| |||||||||
(b) The methods and assumptions used to estimate the fair value of the Corporation's pension plan and other postretirement benefit plan assets, other than assets invested in pooled funds, are similar to the methods and assumptions used for the Corporation's other financial instruments. The fair value of pooled funds is based on the net asset value of the funds.
Based on the fair value hierarchy, the fair value of the Corporation's pension plan assets categorized based upon the lowest level of input that was significant to the fair value measurement was as follows:
| December 31, 2014 | ||||||||||||||||
| Level 1 | Level 2 | Level 3 | Total | |||||||||||||
| (in millions) | ||||||||||||||||
Short term investments | $ | - | $ | 48 | $ | - | $ | 48 | ||||||||
|
|
|
|
|
|
|
| |||||||||
Fixed maturities | ||||||||||||||||
U.S. government and government agency and authority obligations | - | 209 | - | 209 | ||||||||||||
Corporate bonds | - | 419 | - | 419 | ||||||||||||
Foreign government and government agency obligations | - | 137 | - | 137 | ||||||||||||
Mortgage-backed securities | - | 228 | - | 228 | ||||||||||||
|
|
|
|
|
|
|
| |||||||||
Total fixed maturities | - | 993 | - | 993 | ||||||||||||
|
|
|
|
|
|
|
| |||||||||
Equity securities | 629 | 1,221 | - | 1,850 | ||||||||||||
|
|
|
|
|
|
|
| |||||||||
Other assets | 28 | 20 | 7 | 55 | ||||||||||||
|
|
|
|
|
|
|
| |||||||||
| $ | 657 | $ | 2,282 | $ | 7 | $ | 2,946 | |||||||||
|
|
|
|
|
|
|
| |||||||||
F-38
(14) Fair Values of Financial Instruments (continued)
| December 31, 2013 | ||||||||||||||||
| Level 1 | Level 2 | Level 3 | Total | |||||||||||||
| (in millions) | ||||||||||||||||
Short term investments | $ | - | $ | 37 | $ | - | $ | 37 | ||||||||
|
|
|
|
|
|
|
| |||||||||
Fixed maturities | ||||||||||||||||
U.S. government and government agency | - | 224 | - | 224 | ||||||||||||
Corporate bonds | - | 370 | 1 | 371 | ||||||||||||
Foreign government and government | - | 104 | - | 104 | ||||||||||||
Mortgage-backed securities | - | 211 | 6 | 217 | ||||||||||||
|
|
|
|
|
|
|
| |||||||||
Total fixed maturities | - | 909 | 7 | 916 | ||||||||||||
|
|
|
|
|
|
|
| |||||||||
Equity securities | 573 | 1,145 | - | 1,718 | ||||||||||||
|
|
|
|
|
|
|
| |||||||||
Other assets | 21 | 14 | 11 | 46 | ||||||||||||
|
|
|
|
|
|
|
| |||||||||
| $ | 594 | $ | 2,105 | $ | 18 | $ | 2,717 | |||||||||
|
|
|
|
|
|
|
| |||||||||
The fair value of the Corporation's other postretirement benefit plan assets was $143 million and $130 million at December 31, 2014 and 2013, respectively. Based on the fair value hierarchy, the fair value of these assets was categorized as Level 1 based upon the lowest level of input that was significant to the fair value measurement.
(15) Earnings Per Share
Basic earnings per share is computed by dividing net income by the weighted average shares outstanding during the year. The computation of diluted earnings per share reflects the potential dilutive effect, using the treasury stock method, of outstanding awards under stock-based employee compensation plans.
The following table sets forth the computation of basic and diluted earnings per share:
| Years Ended December 31 | ||||||||||||
| 2014 | 2013 | 2012 | ||||||||||
| (in millions except for per share amounts) | ||||||||||||
Basic earnings per share: | ||||||||||||
Net income | $ | 2,100 | $ | 2,345 | $ | 1,545 | ||||||
|
|
|
|
|
| |||||||
Weighted average shares outstanding | 242.9 | 258.2 | 269.5 | |||||||||
|
|
|
|
|
| |||||||
Basic earnings per share | $ | 8.65 | $ | 9.08 | $ | 5.73 | ||||||
|
|
|
|
|
| |||||||
Diluted earnings per share: | ||||||||||||
Net income | $ | 2,100 | $ | 2,345 | $ | 1,545 | ||||||
|
|
|
|
|
| |||||||
Weighted average shares outstanding | 242.9 | 258.2 | 269.5 | |||||||||
Additional shares from assumed issuance of shares under stock-based compensation awards | .6 | 1.2 | 1.9 | |||||||||
|
|
|
|
|
| |||||||
Weighted average shares and potential shares assumed outstanding for computing diluted earnings per share | 243.5 | 259.4 | 271.4 | |||||||||
|
|
|
|
|
| |||||||
Diluted earnings per share | $ | 8.62 | $ | 9.04 | $ | 5.69 | ||||||
|
|
|
|
|
| |||||||
F-39
(16) Shareholders' Equity
(a) The authorized but unissued preferred shares may be issued in one or more series and the shares of each series shall have such rights as fixed by the Board of Directors.
(b) The activity of Chubb's common stock was as follows:
| Years Ended December 31 | ||||||||||||
| 2014 | 2013 | 2012 | ||||||||||
| (number of shares) | ||||||||||||
Common stock issued | ||||||||||||
Balance, beginning and end of year | 371,980,460 | 371,980,460 | 371,980,460 | |||||||||
|
|
|
|
|
| |||||||
Treasury stock | ||||||||||||
Balance, beginning of year | 123,673,969 | 110,217,445 | 99,519,509 | |||||||||
Repurchase of shares | 16,893,455 | 14,887,701 | 13,094,640 | |||||||||
Share activity under stock-based employee compensation plans | (1,016,353 | ) | (1,431,177 | ) | (2,396,704 | ) | ||||||
|
|
|
|
|
| |||||||
Balance, end of year | 139,551,071 | 123,673,969 | 110,217,445 | |||||||||
|
|
|
|
|
| |||||||
Common stock outstanding, end of year | 232,429,389 | 248,306,491 | 261,763,015 | |||||||||
|
|
|
|
|
| |||||||
(c) As of December 31, 2014, $52 million remained under the share repurchase authorization that was approved by the Board of Directors on January 30, 2014. On January 29, 2015, the Board of Directors authorized the repurchase of up to $1.3 billion of Chubb's common stock. These authorizations have no expiration date.
(d) The property and casualty insurance subsidiaries are required to file annual statements with insurance regulatory authorities prepared on an accounting basis prescribed or permitted by such authorities (statutory basis). For such subsidiaries, statutory accounting principles differ in certain respects from GAAP.
A comparison of shareholders' equity on a GAAP basis and policyholders' surplus on a statutory basis is as follows:
| December 31 | ||||||||||||||||
| 2014 | 2013 | |||||||||||||||
| GAAP | Statutory | GAAP | Statutory | |||||||||||||
| (in millions) | ||||||||||||||||
P&C Group | $ | 17,786 | $ | 15,127 | $ | 17,398 | $ | 15,024 | ||||||||
|
|
|
| |||||||||||||
Corporate and other | (1,490 | ) | (1,301 | ) | ||||||||||||
|
|
|
| |||||||||||||
| $ | 16,296 | $ | 16,097 | |||||||||||||
|
|
|
| |||||||||||||
A comparison of GAAP and statutory net income (loss) is as follows:
| Years Ended December 31 | ||||||||||||||||||||||||
| 2014 | 2013 | 2012 | ||||||||||||||||||||||
| GAAP | Statutory | GAAP | Statutory | GAAP | Statutory | |||||||||||||||||||
| (in millions) | ||||||||||||||||||||||||
P&C Group | $ | 2,330 | $ | 2,399 | $ | 2,480 | $ | 2,485 | $ | 1,791 | $ | 1,936 | ||||||||||||
|
|
|
|
|
| |||||||||||||||||||
Corporate and other | (230 | ) | (135 | ) | (246 | ) | ||||||||||||||||||
|
|
|
|
|
| |||||||||||||||||||
| $ | 2,100 | $ | 2,345 | $ | 1,545 | |||||||||||||||||||
|
|
|
|
|
| |||||||||||||||||||
F-40
(16) Shareholders' Equity (continued)
At December 31, 2014, the aggregate statutory capital and surplus of the property and casualty insurance subsidiaries was $15.1 billion, of which $14.8 billion related to Federal Insurance Company (Federal). Federal is a direct subsidiary of Chubb and is the direct or indirect parent of most of Chubb's other insurance subsidiaries. A risk-based capital formula is used by U.S. state regulatory authorities to identify insurance companies that may be undercapitalized and that may merit regulatory attention. The risk-based capital requirement level is calculated as two times the authorized control level risk-based capital and is the level at or below which company or state regulatory action would be required. At December 31, 2014, the risk-based capital requirement level for Federal was $5.0 billion.
(e) As a holding company, Chubb's ability to continue to pay dividends to shareholders and to satisfy its obligations, including the payment of interest and principal on debt obligations, relies on the availability of liquid assets, which is dependent in large part on the dividend paying ability of its property and casualty insurance subsidiaries. The Corporation's property and casualty insurance subsidiaries are subject to laws and regulations in the jurisdictions in which they operate that restrict the amount of dividends they may pay without the prior approval of regulatory authorities. The restrictions are generally based on net income and on certain levels of policyholders' surplus as determined in accordance with statutory accounting principles. Dividends in excess of such thresholds are considered "extraordinary" and require prior regulatory approval. During 2014, these subsidiaries paid dividends of $2.0 billion to Chubb.
The maximum dividend distribution that may be made by the property and casualty insurance subsidiaries to Chubb during 2015 without prior regulatory approval is approximately $1.9 billion.
F-41
QUARTERLY FINANCIAL DATA
Summarized unaudited quarterly financial data for 2014 and 2013 are shown below. In management's opinion, the interim financial data contain all adjustments, consisting of normal recurring items, necessary to present fairly the results of operations for the interim periods.
| Three Months Ended | ||||||||||||||||||||||||||||||||
| March 31 | June 30 | September 30 | December 31 | |||||||||||||||||||||||||||||
| 2014 | 2013 | 2014 | 2013 | 2014 | 2013 | 2014 | 2013 | |||||||||||||||||||||||||
| (in millions except for per share amounts) | ||||||||||||||||||||||||||||||||
Revenues | $ | 3,506 | $ | 3,517 | $ | 3,542 | $ | 3,551 | $ | 3,574 | $ | 3,403 | $ | 3,476 | $ | 3,476 | ||||||||||||||||
Losses and expenses | 2,903 | 2,601 | 2,864 | 2,755 | 2,756 | 2,664 | 2,714 | 2,690 | ||||||||||||||||||||||||
Federal and foreign income tax | 154 | 260 | 179 | 217 | 224 | 198 | 204 | 217 | ||||||||||||||||||||||||
|
|
|
|
|
|
|
|
|
|
|
|
|
|
|
| |||||||||||||||||
Net income | $ | 449 | $ | 656 | $ | 499 | $ | 579 | $ | 594 | $ | 541 | $ | 558 | $ | 569 | ||||||||||||||||
|
|
|
|
|
|
|
|
|
|
|
|
|
|
|
| |||||||||||||||||
Basic earnings per share | $ | 1.81 | $ | 2.49 | $ | 2.03 | $ | 2.22 | $ | 2.47 | $ | 2.11 | $ | 2.35 | $ | 2.25 | ||||||||||||||||
|
|
|
|
|
|
|
|
|
|
|
|
|
|
|
| |||||||||||||||||
Diluted earnings per share | $ | 1.80 | $ | 2.48 | $ | 2.03 | $ | 2.21 | $ | 2.47 | $ | 2.10 | $ | 2.35 | $ | 2.24 | ||||||||||||||||
|
|
|
|
|
|
|
|
|
|
|
|
|
|
|
| |||||||||||||||||
Underwriting ratios | ||||||||||||||||||||||||||||||||
Losses to premiums earned | 61.1 | % | 52.3 | % | 58.7 | % | 56.7 | % | 54.0 | % | 53.0 | % | 53.8 | % | 54.7 | % | ||||||||||||||||
Expenses to premiums written | 32.1 | 32.3 | 31.3 | 32.1 | 31.8 | 32.7 | 30.5 | 30.8 | ||||||||||||||||||||||||
|
|
|
|
|
|
|
|
|
|
|
|
|
|
|
| |||||||||||||||||
Combined | 93.2 | % | 84.6 | % | 90.0 | % | 88.8 | % | 85.8 | % | 85.7 | % | 84.3 | % | 85.5 | % | ||||||||||||||||
|
|
|
|
|
|
|
|
|
|
|
|
|
|
|
| |||||||||||||||||
F-42
THE CHUBB CORPORATION
Schedule I
CONSOLIDATED SUMMARY OF INVESTMENTS - OTHER THAN INVESTMENTS IN RELATED PARTIES
(in millions)
December 31, 2014
Type of Investment | Cost or Amortized Cost | Fair Value | Amount at Which Shown in the Balance Sheet | |||||||||
Short term investments | $ | 1,318 | $ | 1,318 | $ | 1,318 | ||||||
|
|
|
|
|
| |||||||
Fixed maturities | ||||||||||||
United States Government and government agencies and authorities | 1,593 | 1,612 | 1,612 | |||||||||
States, municipalities and political subdivisions | 18,983 | 20,167 | 20,167 | |||||||||
Foreign government and government agencies | 6,380 | 6,672 | 6,672 | |||||||||
Public utilities | 1,065 | 1,148 | 1,148 | |||||||||
All other corporate bonds | 7,676 | 7,880 | 7,880 | |||||||||
Residential mortgage-backed securities | 192 | 211 | 211 | |||||||||
Commercial mortgage-backed securities | 1,069 | 1,090 | 1,090 | |||||||||
|
|
|
|
|
| |||||||
Total fixed maturities | 36,958 | 38,780 | 38,780 | |||||||||
|
|
|
|
|
| |||||||
Equity securities | ||||||||||||
Common stocks | ||||||||||||
Public utilities | 114 | 216 | 216 | |||||||||
Banks, trusts and insurance companies | 101 | 185 | 185 | |||||||||
Industrial, miscellaneous and other | 835 | 1,515 | 1,515 | |||||||||
|
|
|
|
|
| |||||||
Total common stocks | 1,050 | 1,916 | 1,916 | |||||||||
Non-redeemable preferred stocks | 39 | 48 | 48 | |||||||||
|
|
|
|
|
| |||||||
Total equity securities | 1,089 | 1,964 | 1,964 | |||||||||
|
|
|
|
|
| |||||||
Other invested assets | 1,423 | 1,423 | 1,423 | |||||||||
|
|
|
|
|
| |||||||
Total invested assets | $ | 40,788 | $ | 43,485 | $ | 43,485 | ||||||
|
|
|
|
|
| |||||||
S-1
THE CHUBB CORPORATION
Schedule II
CONDENSED FINANCIAL INFORMATION OF REGISTRANT
BALANCE SHEETS - PARENT COMPANY ONLY
(in millions)
December 31
| 2014 | 2013 | |||||||
Assets | ||||||||
Invested Assets | ||||||||
Short Term Investments | $ | 574 | $ | 856 | ||||
Taxable Fixed Maturities (cost $1,213 and $1,095) | 1,226 | 1,110 | ||||||
Equity Securities (cost $- and $-) | - | 2 | ||||||
|
|
|
| |||||
TOTAL INVESTED ASSETS | 1,800 | 1,968 | ||||||
Investment in Consolidated Subsidiaries | 17,838 | 17,455 | ||||||
Other Assets | 168 | 165 | ||||||
|
|
|
| |||||
TOTAL ASSETS | $ | 19,806 | $ | 19,588 | ||||
|
|
|
| |||||
Liabilities | ||||||||
Long Term Debt | $ | 3,300 | $ | 3,300 | ||||
Dividend Payable to Shareholders | 117 | 110 | ||||||
Accrued Expenses and Other Liabilities | 93 | 81 | ||||||
|
|
|
| |||||
TOTAL LIABILITIES | 3,510 | 3,491 | ||||||
|
|
|
| |||||
Shareholders' Equity | ||||||||
Preferred Stock - Authorized 8,000,000 Shares; | - | - | ||||||
Common Stock - Authorized 1,200,000,000 Shares; | 372 | 372 | ||||||
Paid-In Surplus | 171 | 171 | ||||||
Retained Earnings | 23,520 | 21,902 | ||||||
Accumulated Other Comprehensive Income | 1,110 | 1,035 | ||||||
Treasury Stock, at Cost - 139,551,071 and 123,673,969 Shares | (8,877 | ) | (7,383 | ) | ||||
|
|
|
| |||||
TOTAL SHAREHOLDERS' EQUITY | 16,296 | 16,097 | ||||||
|
|
|
| |||||
TOTAL LIABILITIES AND SHAREHOLDERS' EQUITY | $ | 19,806 | $ | 19,588 | ||||
|
|
|
| |||||
The condensed financial statements should be read in conjunction with the consolidated financial statements and notes thereto.
S-2
THE CHUBB CORPORATION
Schedule II
(continued)
CONDENSED FINANCIAL INFORMATION OF REGISTRANT
STATEMENTS OF INCOME - PARENT COMPANY ONLY
(in millions)
Years Ended December 31
| 2014 | 2013 | 2012 | ||||||||||
Revenues | ||||||||||||
Investment Income | $ | 26 | $ | 29 | $ | 38 | ||||||
Other Revenues | - | 6 | - | |||||||||
Realized Investment Gains (Losses), Net | 4 | 99 | (6 | ) | ||||||||
|
|
|
|
|
| |||||||
TOTAL REVENUES | 30 | 134 | 32 | |||||||||
|
|
|
|
|
| |||||||
Expenses | ||||||||||||
Corporate Expenses | 249 | 262 | 268 | |||||||||
Investment Expenses | 3 | 4 | 2 | |||||||||
Other Expenses | 3 | 8 | - | |||||||||
|
|
|
|
|
| |||||||
TOTAL EXPENSES | 255 | 274 | 270 | |||||||||
|
|
|
|
|
| |||||||
Loss before Federal and Foreign Income Tax and Equity in Net Income of Consolidated Subsidiaries | (225 | ) | (140 | ) | (238 | ) | ||||||
Federal and Foreign Income Tax | 1 | - | 4 | |||||||||
|
|
|
|
|
| |||||||
Loss before Equity in Net Income of Consolidated Subsidiaries | (226 | ) | (140 | ) | (242 | ) | ||||||
Equity in Net Income of Consolidated Subsidiaries | 2,326 | 2,485 | 1,787 | |||||||||
|
|
|
|
|
| |||||||
NET INCOME | 2,100 | 2,345 | 1,545 | |||||||||
Other Comprehensive Income (Loss), Net of Tax | 75 | (396 | ) | 236 | ||||||||
|
|
|
|
|
| |||||||
COMPREHENSIVE INCOME | $ | 2,175 | $ | 1,949 | $ | 1,781 | ||||||
|
|
|
|
|
| |||||||
Chubb and its U.S. subsidiaries file a consolidated federal income tax return. The federal income tax provision represents an allocation under the Corporation's tax allocation agreements.
The condensed financial statements should be read in conjunction with the consolidated financial statements and notes thereto.
S-3
THE CHUBB CORPORATION
Schedule II
(continued)
CONDENSED FINANCIAL INFORMATION OF REGISTRANT
STATEMENTS OF CASH FLOWS - PARENT COMPANY ONLY
(in millions)
Years Ended December 31
| 2014 | 2013 | 2012 | ||||||||||
Cash Flows from Operating Activities | ||||||||||||
Net Income | $ | 2,100 | $ | 2,345 | $ | 1,545 | ||||||
Adjustments to Reconcile Net Income to Net Cash Used in Operating Activities | ||||||||||||
Equity in Net Income of Consolidated Subsidiaries | (2,326 | ) | (2,485 | ) | (1,787 | ) | ||||||
Realized Investment Losses (Gains), Net | (4 | ) | (99 | ) | 6 | |||||||
Other, Net | 9 | 21 | 57 | |||||||||
|
|
|
|
|
| |||||||
NET CASH USED IN OPERATING ACTIVITIES | (221 | ) | (218 | ) | (179 | ) | ||||||
|
|
|
|
|
| |||||||
Cash Flows from Investing Activities | ||||||||||||
Proceeds from Fixed Maturities | ||||||||||||
Sales | 382 | 227 | 24 | |||||||||
Maturities, Calls and Redemptions | 46 | 150 | 673 | |||||||||
Proceeds from Sales of Equity Securities | 2 | 296 | - | |||||||||
Purchases of Fixed Maturities | (551 | ) | (198 | ) | (1,046 | ) | ||||||
Investments in Other Invested Assets, Net | - | 22 | - | |||||||||
Decrease in Short Term Investments, Net | 282 | 85 | 89 | |||||||||
Dividends Received from Consolidated Insurance Subsidiaries | 2,021 | 1,564 | 1,760 | |||||||||
Distributions Received from Consolidated Non-Insurance Subsidiaries | 1 | 1 | 1 | |||||||||
Other, Net | 38 | 46 | 1 | |||||||||
|
|
|
|
|
| |||||||
NET CASH PROVIDED BY INVESTING ACTIVITIES | 2,221 | 2,193 | 1,502 | |||||||||
|
|
|
|
|
| |||||||
Cash Flows from Financing Activities | ||||||||||||
Repayment of Long Term Debt | - | (275 | ) | - | ||||||||
Proceeds from Issuance of Common Stock Under Stock-Based Employee Compensation Plans | 22 | 38 | 74 | |||||||||
Repurchase of Shares | (1,547 | ) | (1,288 | ) | (959 | ) | ||||||
Dividends Paid to Shareholders | (475 | ) | (450 | ) | (438 | ) | ||||||
|
|
|
|
|
| |||||||
NET CASH USED IN FINANCING ACTIVITIES | (2,000 | ) | (1,975 | ) | (1,323 | ) | ||||||
|
|
|
|
|
| |||||||
Net Increase in Cash | - | - | - | |||||||||
Cash at Beginning of Year | - | - | - | |||||||||
|
|
|
|
|
| |||||||
CASH AT END OF YEAR | $ | - | $ | - | $ | - | ||||||
|
|
|
|
|
| |||||||
The condensed financial statements should be read in conjunction with the consolidated financial statements and notes thereto.
In 2013, Chubb exchanged its holdings of common stock and warrants of Alterra Capital Holdings Limited, with a cost basis of $177 million and a carrying value of $63 million, respectively, for common stock of Markel Corporation, valued at $226 million, and cash of $98 million, as a result of a business combination. The noncash portions of the transaction have been excluded from the statement of cash flows.
S-4
THE CHUBB CORPORATION
Schedule III
CONSOLIDATED SUPPLEMENTARY INSURANCE INFORMATION
(in millions)
| December 31 | Year Ended December 31 | |||||||||||||||||||||||||||||||||||
Segment | Deferred Policy Acquisition Costs | Unpaid Losses | Unearned Premiums | Premiums Earned | Net Investment Income (a) | Insurance Losses | Amortization of Deferred Policy Acquisition Costs | Other Insurance Operating Costs and Expenses (b) | Premiums Written | |||||||||||||||||||||||||||
2014 | ||||||||||||||||||||||||||||||||||||
Property and Casualty Insurance | ||||||||||||||||||||||||||||||||||||
Personal | $ | 517 | $ | 2,272 | $ | 2,278 | $ | 4,418 | $ | 2,540 | $ | 1,053 | $ | 438 | $ | 4,508 | ||||||||||||||||||||
Commercial | 504 | 13,161 | 2,876 | 5,281 | 3,111 | 995 | 663 | 5,402 | ||||||||||||||||||||||||||||
Specialty | 263 | 6,847 | 1,426 | 2,628 | 1,333 | 497 | 295 | 2,681 | ||||||||||||||||||||||||||||
Reinsurance Assumed | - | 398 | 1 | 1 | 1 | 3 | (3 | ) | 1 | |||||||||||||||||||||||||||
Investments | $ | 1,329 | ||||||||||||||||||||||||||||||||||
|
|
|
|
|
|
|
|
|
|
|
|
|
|
|
|
|
| |||||||||||||||||||
| $ | 1,284 | $ | 22,678 | $ | 6,581 | $ | 12,328 | $ | 1,329 | $ | 6,985 | $ | 2,548 | $ | 1,393 | $ | 12,592 | |||||||||||||||||||
|
|
|
|
|
|
|
|
|
|
|
|
|
|
|
|
|
| |||||||||||||||||||
2013 | ||||||||||||||||||||||||||||||||||||
Property and Casualty Insurance | ||||||||||||||||||||||||||||||||||||
Personal | $ | 505 | $ | 2,235 | $ | 2,216 | $ | 4,214 | $ | 2,224 | $ | 982 | $ | 465 | $ | 4,322 | ||||||||||||||||||||
Commercial | 493 | 13,147 | 2,792 | 5,237 | 2,891 | 970 | 665 | 5,273 | ||||||||||||||||||||||||||||
Specialty | 257 | 7,307 | 1,412 | 2,618 | 1,417 | 502 | 287 | 2,633 | ||||||||||||||||||||||||||||
Reinsurance Assumed | - | 457 | 3 | (3 | ) | (12 | ) | - | - | (4 | ) | |||||||||||||||||||||||||
Investments | $ | 1,391 | ||||||||||||||||||||||||||||||||||
|
|
|
|
|
|
|
|
|
|
|
|
|
|
|
|
|
| |||||||||||||||||||
| $ | 1,255 | $ | 23,146 | $ | 6,423 | $ | 12,066 | $ | 1,391 | $ | 6,520 | $ | 2,454 | $ | 1,417 | $ | 12,224 | |||||||||||||||||||
|
|
|
|
|
|
|
|
|
|
|
|
|
|
|
|
|
| |||||||||||||||||||
2012 | ||||||||||||||||||||||||||||||||||||
Property and Casualty Insurance | ||||||||||||||||||||||||||||||||||||
Personal | $ | 477 | $ | 2,493 | $ | 2,133 | $ | 4,024 | $ | 2,417 | $ | 942 | $ | 458 | $ | 4,125 | ||||||||||||||||||||
Commercial | 477 | 13,288 | 2,794 | 5,144 | 3,512 | 970 | 620 | 5,174 | ||||||||||||||||||||||||||||
Specialty | 252 | 7,622 | 1,429 | 2,666 | 1,622 | 499 | 293 | 2,568 | ||||||||||||||||||||||||||||
Reinsurance Assumed | - | 560 | 5 | 4 | (44 | ) | - | 1 | 3 | |||||||||||||||||||||||||||
Investments | $ | 1,482 | ||||||||||||||||||||||||||||||||||
|
|
|
|
|
|
|
|
|
|
|
|
|
|
|
|
|
| |||||||||||||||||||
| $ | 1,206 | $ | 23,963 | $ | 6,361 | $ | 11,838 | $ | 1,482 | $ | 7,507 | $ | 2,411 | $ | 1,372 | $ | 11,870 | |||||||||||||||||||
|
|
|
|
|
|
|
|
|
|
|
|
|
|
|
|
|
| |||||||||||||||||||
| (a) | Property and casualty assets are available for payment of losses and expenses for all classes of business; therefore, such assets and the related investment income have not been allocated to the underwriting segments. |
| (b) | Other insurance operating costs and expenses does not include other income and charges. |
S-5
THE CHUBB CORPORATION
EXHIBITS INDEX
(Item 15(a))
| Exhibit Number | Description | |
- Articles of incorporation and by-laws | ||
| 3.1 | Restated Certificate of Incorporation incorporated by reference to Exhibit (3) of the registrant's Quarterly Report on Form 10-Q for the quarter ended June 30, 1996. | |
| 3.2 | Certificate of Amendment to the Restated Certificate of Incorporation incorporated by reference to Exhibit (3) of the registrant's Annual Report on Form 10-K for the year ended December 31, 1998. | |
| 3.3 | Certificate of Correction of Certificate of Amendment to the Restated Certificate of Incorporation incorporated by reference to Exhibit (3) of the registrant's Annual Report on Form 10-K for the year ended December 31, 1998. | |
| 3.4 | Certificate of Amendment to the Restated Certificate of Incorporation incorporated by reference to Exhibit (3.1) of the registrant's Current Report on Form 8-K filed on April 18, 2006. | |
| 3.5 | Certificate of Amendment to the Restated Certificate of Incorporation incorporated by reference to Exhibit (3.1) of the registrant's Current Report on Form 8-K filed on April 30, 2007. | |
| 3.6 | By-Laws incorporated by reference to Exhibit (3.1) of the registrant's Current Report on Form 8-K filed on December 10, 2010. | |
- Instruments defining the rights of security holders, including indentures | ||
The registrant is not filing any instruments evidencing any indebtedness since the total amount of securities authorized under any single instrument does not exceed 10% of the total assets of the registrant and its subsidiaries on a consolidated basis. Copies of such instruments will be furnished to the Securities and Exchange Commission upon request. | ||
- Material contracts | ||
| 10.1* | Schedule of Salary Actions for Named Executive Officers incorporated by reference to Exhibit (10.1) of the registrant's Current Report on Form 8-K filed on March 4, 2014. | |
| 10.2* | The Chubb Corporation Annual Incentive Compensation Plan (2011) incorporated by reference to Annex A of the registrant's definitive proxy statement for the Annual Meeting of Shareholders held on April 26, 2011. | |
| 10.3* | The Chubb Corporation Long-Term Incentive Plan (2014) incorporated by reference to Exhibit (99.1) of the registrant's registration statement on Form S-8 filed on April 29, 2014 (File No. 333-195560). | |
| 10.4* | The Chubb Corporation Long-Term Incentive Plan (2009) incorporated by reference to Exhibit (99.1) of the registrant's registration statement on Form S-8 filed on April 28, 2009 (File No. 333-158841). | |
| 10.5* | Form of Performance Unit Award Agreement under The Chubb Corporation Long-Term Incentive Plan (2009) incorporated by reference to Exhibit (10.2) of the registrant's Current Report on Form 8-K filed on March 4, 2014. | |
| 10.6* | Form of Performance Unit Award Agreement under The Chubb Corporation Long-Term Incentive Plan (2009) incorporated by reference to Exhibit (10.2) of the registrant's Current Report on Form 8-K filed on February 28, 2012. | |
| 10.7* | Form of Performance Unit Award Agreement under The Chubb Corporation Long-Term Incentive Plan (2009) incorporated by reference to Exhibit (10.6) of the registrant's Annual Report on Form 10-K for the year ended December 31, 2009. | |
| 10.8* | Form of Restricted Stock Unit Agreement under The Chubb Corporation Long-Term Incentive Plan (2014) incorporated by reference to Exhibit (10.3) of the registrant's Quarterly Report on Form 10-Q for the quarter ended June 30, 2014. |
E-1
| Exhibit Number | Description | |
| 10.9* | Form of Restricted Stock Unit Agreement under The Chubb Corporation Long-Term Incentive Plan (2009) incorporated by reference to Exhibit (10.3) of the registrant's Current Report on Form 8-K filed on March 4, 2014. | |
| 10.10* | Form of Restricted Stock Unit Agreement under The Chubb Corporation Long-Term Incentive Plan (2009) incorporated by reference to Exhibit (10.2) of the registrant's Current Report on Form 8-K filed on March 1, 2013. | |
| 10.11* | Form of Restricted Stock Unit Agreement under The Chubb Corporation Long-Term Incentive Plan (2009) incorporated by reference to Exhibit (10.7) of the registrant's Annual Report on Form 10-K for the year ended December 31, 2009. | |
| 10.12* | Form of Non-Statutory Stock Option Award Agreement under The Chubb Corporation Long-Term Incentive Plan (2009) incorporated by reference to Exhibit (10.8) of the registrant's Annual Report on Form 10-K for the year ended December 31, 2009. | |
| 10.13* | Form of Deferred Stock Unit Agreement (for Non-Employee Directors) under The Chubb Corporation Long-Term Incentive Plan (2014) incorporated by reference to Exhibit (10.2) of the registrant's Quarterly Report on Form 10-Q for the quarter ended June 30, 2014. | |
| 10.14* | Form of Deferred Stock Unit Agreement (for Non-Employee Directors) under The Chubb Corporation Long-Term Incentive Plan (2009) incorporated by reference to Exhibit (10.2) of the registrant's Quarterly Report on Form 10-Q for the quarter ended June 30, 2009. | |
| 10.15* | The Chubb Corporation Long-Term Stock Incentive Plan (2004) incorporated by reference to Annex B of the registrant's definitive proxy statement for the Annual Meeting of Shareholders held on April 27, 2004. | |
| 10.16* | Amendment to The Chubb Corporation Long-Term Stock Incentive Plan (2004) incorporated by reference to Exhibit (10.8) of the registrant's Annual Report on Form 10-K for the year ended December 31, 2008. | |
| 10.17* | Form of Restricted Stock Unit Agreement under The Chubb Corporation Long-Term Stock Incentive Plan (2004) (for recipients of restricted stock unit awards other than Chief Executive Officer, Vice Chairmen, Executive Vice Presidents and certain Senior Vice Presidents) incorporated by reference to Exhibit (10.10) of the registrant's Current Report on Form 8-K filed on March 7, 2007. | |
| 10.18* | Amendment to The Chubb Corporation Long-Term Stock Incentive Plan (2004) 2005, 2006, 2007, and 2008 Outstanding Restricted Stock Unit Agreements incorporated by reference to Exhibit (10.7) of the registrant's Annual Report on Form 10-K for the year ended December 31, 2008. | |
| 10.19* | Form of Non-Statutory Stock Option Award Agreement under The Chubb Corporation Long-Term Stock Incentive Plan (2004) (three year vesting schedule) incorporated by reference to Exhibit (10.7) of the registrant's Current Report on Form 8-K filed on March 9, 2005. | |
| 10.20* | Form of Non-Statutory Stock Option Award Agreement under The Chubb Corporation Long-Term Stock Incentive Plan (2004) (four year vesting schedule) incorporated by reference to Exhibit (10.8) of the registrant's Current Report on Form 8-K filed on March 9, 2005. | |
| 10.21* | The Chubb Corporation Long-Term Stock Incentive Plan for Non-Employee Directors (2004) incorporated by reference to Annex C of the registrant's definitive proxy statement for the Annual Meeting of Shareholders held on April 27, 2004. | |
| 10.22* | Amendment No. 1 to The Chubb Corporation Long-Term Stock Incentive Plan for Non-Employee Directors (2004) incorporated by reference to Exhibit (10.12) of the registrant's Annual Report on Form 10-K for the year ended December 31, 2008. | |
| 10.23* | The Chubb Corporation Stock Option Plan for Non-Employee Directors (2001) incorporated by reference to Exhibit C of the registrant's definitive proxy statement for the Annual Meeting of Shareholders held on April 24, 2001. |
E-2
| Exhibit Number | Description | |
| 10.24* | The Chubb Corporation Long-Term Stock Incentive Plan (2000) incorporated by reference to Exhibit A of the registrant's definitive proxy statement for the Annual Meeting of Shareholders held on April 25, 2000. | |
| 10.25* | The Chubb Corporation Asset Managers Incentive Compensation Plan (2005) incorporated by reference to Exhibit (10.1) of the registrant's Annual Report on Form 10-K for the year ended December 31, 2004. | |
| 10.26* | Amendment No. 1 to The Chubb Corporation Asset Managers Incentive Compensation Plan (2005) incorporated by reference to Exhibit (10.2) of the registrant's Annual Report on Form 10-K for the year ended December 31, 2008. | |
| 10.27* | Amendment No. 2 to The Chubb Corporation Asset Managers Incentive Compensation Plan (2005) incorporated by reference to Exhibit (10.33) of the registrant's Annual Report on Form 10-K for the year ended December 31, 2009. | |
| 10.28* | The Chubb Corporation Key Employee Deferred Compensation Plan (2005) incorporated by reference to Exhibit (10.9) of the registrant's Current Report on Form 8-K filed on March 9, 2005. | |
| 10.29* | Amendment One to The Chubb Corporation Key Employee Deferred Compensation Plan (2005) incorporated by reference to Exhibit (10.1) of the registrant's Current Report on Form 8-K filed on September 12, 2005. | |
| 10.30* | Amendment No. 2 to The Chubb Corporation Key Employee Deferred Compensation Plan (2005) incorporated by reference to Exhibit (10.20) of the registrant's Annual Report on Form 10-K for the year ended December 31, 2008. | |
| 10.31* | Amendment No. 3 to The Chubb Corporation Key Employee Deferred Compensation Plan (2005) incorporated by reference to Exhibit (10.32) of the registrant's Annual Report on Form 10-K for the year ended December 31, 2012. | |
| 10.32* | The Chubb Corporation Executive Deferred Compensation Plan incorporated by reference to Exhibit (10) of the registrant's Annual Report on Form 10-K for the year ended December 31, 1998. | |
| 10.33 * | Description of Non-Employee Director Compensation filed herewith. | |
| 10.34* | The Chubb Corporation Deferred Compensation Plan for Directors, as amended, incorporated by reference to Exhibit (10.1) of the registrant's Current Report on Form 8-K filed on December 11, 2006. | |
| 10.35* | Amendment No. 1 to The Chubb Corporation Deferred Compensation Plan for Directors, incorporated by reference to Exhibit (10.23) of the registrant's Annual Report on Form 10-K for the year ended December 31, 2008. | |
| 10.36 * | Post-Employment Health Policy of The Chubb Corporation (and its subsidiaries) incorporated by reference to Exhibit (10.37) of the registrant's Annual Report on Form 10-K for the year ended December 31, 2012. | |
| 10.37 * | The Chubb Corporation Estate Enhancement Program incorporated by reference to Exhibit (10.1) of the registrant's Quarterly Report on Form 10-Q for the quarter ended March 31, 1999. | |
| 10.38 * | The Chubb Corporation Estate Enhancement Program for Non-Employee Directors incorporated by reference to Exhibit (10.2) of the registrant's Quarterly Report on Form 10-Q for the quarter ended March 31, 1999. | |
| 10.39* | Employment Agreement, dated as of January 21, 2003, between The Chubb Corporation and John D. Finnegan, incorporated by reference to Exhibit (10.1) of the registrant's Current Report on Form 8-K filed on January 21, 2003. | |
| 10.40* | Amendment, dated as of December 1, 2003, to Employment Agreement, dated as of January 21, 2003, between The Chubb Corporation and John D. Finnegan, incorporated by reference to Exhibit (10.1) of the registrant's Current Report on Form 8-K filed on December 2, 2003. |
E-3
| Exhibit Number | Description | |
| 10.41* | Amendment No. 2, dated as of September 4, 2008, to Employment Agreement, dated as of January 21, 2003, between The Chubb Corporation and John D. Finnegan, incorporated by reference to Exhibit (10.34) of the registrant's Annual Report on Form 10-K for the year ended December 31, 2008. | |
| 10.42* | Amendment No. 3, dated as of February 27, 2012, to Employment Agreement, dated as of January 21, 2003, between The Chubb Corporation and John D. Finnegan, incorporated by reference to Exhibit (10.3) of the registrant's Current Report on Form 8-K filed on February 28, 2012. | |
| 10.43* | Notice, dated as of December 4, 2014, by and between The Chubb Corporation and John D. Finnegan, incorporated by reference to Exhibit (99.1) of the registrant's Current Report on Form 8-K filed on December 5, 2014. | |
| 10.44* | Change in Control Employment Agreement, dated as of January 21, 2003, between The Chubb Corporation and John D. Finnegan, incorporated by reference to Exhibit (10.2) of the registrant's Current Report on Form 8-K filed on January 21, 2003. | |
| 10.45* | Amendment, dated as of December 1, 2003, to Change in Control Employment Agreement, dated as of January 21, 2003, between The Chubb Corporation and John D. Finnegan, incorporated by reference to Exhibit (10.2) of the registrant's Current Report on Form 8-K filed on December 2, 2003. | |
| 10.46* | Amendment No. 2, dated as of September 4, 2008, to Change in Control Employment Agreement, dated as of January 21, 2003, between The Chubb Corporation and John D. Finnegan, incorporated by reference to Exhibit (10.28) of the registrant's Annual Report on Form 10-K for the year ended December 31, 2008. | |
| 10.47* | Offer Letter to Richard G. Spiro dated September 5, 2008, incorporated by reference to Exhibit (10.1) of the registrant's Quarterly Report on Form 10-Q for the quarter ended September 30, 2008. | |
| 10.48* | Change in Control Agreement, dated as of October 1, 2008, between The Chubb Corporation and Richard G. Spiro, incorporated by reference to Exhibit (10.29) of the registrant's Annual Report on Form 10-K for the year ended December 31, 2008. | |
| 10.49 | Five Year Revolving Credit Agreement dated as of September 24, 2012 incorporated by reference to Exhibit (10.1) of the registrant's Quarterly Report on Form 10-Q for the quarter ended September 30, 2012. |
E-4
| Exhibit Number | Description | |
| 11.1 | Computation of earnings per share included in Note (15) of the Notes to Consolidated Financial Statements. | |
| 12.1 | Computation of ratio of consolidated earnings to fixed charges filed herewith. | |
| 21.1 | Subsidiaries of the registrant filed herewith. | |
| 23.1 | Consent of Independent Registered Public Accounting Firm filed herewith. | |
- Rule 13a-14(a)/15d-14(a) Certifications. | ||
| 31.1 | Certification by John D. Finnegan filed herewith. | |
| 31.2 | Certification by Richard G. Spiro filed herewith. | |
- Section 1350 Certifications. | ||
| 32.1 | Certification by John D. Finnegan filed herewith. | |
| 32.2 | Certification by Richard G. Spiro filed herewith. | |
- Interactive Data File | ||
| 101.INS | XBRL Instance Document | |
| 101.SCH | XBRL Taxonomy Extension Schema Document | |
| 101.CAL | XBRL Taxonomy Extension Calculation Linkbase Document | |
| 101.LAB | XBRL Taxonomy Extension Label Linkbase Document | |
| 101.PRE | XBRL Taxonomy Extension Presentation Linkbase Document | |
| 101.DEF | XBRL Taxonomy Extension Definition Linkbase Document |
| * | This exhibit is a management contract or a compensatory plan or arrangement. |
E-5