|
UNITED STATES
SECURITIES AND EXCHANGE COMMISSION
WASHINGTON, D.C. 20549
FORM
10-Q
QUARTERLY REPORT PURSUANT TO SECTION 13 OR 15(d) OF
THE SECURITIES EXCHANGE ACT OF 1934
For the quarterly period ended June 30, 2017
Commission file number 1-9924
Citigroup Inc.
(Exact name of registrant as specified in its charter)
Delaware (State or other jurisdiction of incorporation or organization) |
| 52-1568099 (I.R.S. Employer Identification No.) |
388 Greenwich Street, New York, NY (Address of principal executive offices) |
| 10013 (Zip code) |
(212) 559-1000 (Registrant's telephone number, including area code) | ||
Indicate by check mark whether the registrant (1) has filed all reports required to be filed by Section 13 or 15(d) of the Securities Exchange Act of 1934 during the preceding 12 months (or for such shorter period that the registrant was required to file such reports), and (2) has been subject to such filing requirements for the past 90 days. Yes x No o
Indicate by check mark whether the registrant has submitted electronically and posted on its corporate Web site, if any, every Interactive Data File required to be submitted and posted pursuant to Rule 405 of Regulation S-T (§232.405 of this chapter) during the preceding 12 months (or for such shorter period that the registrant was required to submit and post such files). Yes x No o
Large accelerated filer x |
| Accelerated filer o |
| Non-accelerated filer o (Do not check if a smaller reporting company) |
| Smaller reporting company o Emerging growth company o |
If an emerging growth company, indicate by check mark if the registrant has elected not to use the extended transition period for complying with any new or revised financial accounting standards provided pursuant to Section 13(a) of the Exchange Act. Yes o
Indicate by check mark whether the registrant is a shell company (as defined in Rule 12b-2 of the Exchange Act). Yes o No x
Number of shares of Citigroup Inc. common stock outstanding on June 30, 2017 : 2,724,556,095
Available on the web at www.citigroup.com
|
CITIGROUP'S SECOND QUARTER
2017
-FORM
10-Q
OVERVIEW | 2 |
MANAGEMENT'S DISCUSSION AND ANALYSIS OF FINANCIAL CONDITION AND RESULTS OF OPERATIONS | 4 |
Executive Summary | 4 |
Summary of Selected Financial Data | 7 |
SEGMENT AND BUSINESS-INCOME (LOSS) AND REVENUES | 9 |
SEGMENT BALANCE SHEET | 11 |
Global Consumer Banking (GCB) | 13 |
North America GCB | 15 |
Latin America GCB | 17 |
Asia GCB | 19 |
Institutional Clients Group | 21 |
Corporate/Other | 26 |
OFF-BALANCE SHEET ARRANGEMENTS | 27 |
CAPITAL RESOURCES | 28 |
MANAGING GLOBAL RISK TABLE OF CONTENTS | 47 |
MANAGING GLOBAL RISK | 48 |
INCOME TAXES | 89 |
DISCLOSURE CONTROLS AND PROCEDURES | 90 |
DISCLOSURE PURSUANT TO SECTION 219 OF THE IRAN THREAT REDUCTION AND SYRIA HUMAN RIGHTS ACT | 90 |
FORWARD-LOOKING STATEMENTS | 91 |
FINANCIAL STATEMENTS AND NOTES TABLE OF CONTENTS | 94 |
CONSOLIDATED FINANCIAL STATEMENTS | 95 |
NOTES TO CONSOLIDATED FINANCIAL STATEMENTS (UNAUDITED) | 103 |
UNREGISTERED SALES OF EQUITY SECURITIES, PURCHASES OF EQUITY SECURITIES AND DIVIDENDS | 213 |
1
OVERVIEW
This Quarterly Report on Form 10-Q should be read in conjunction with Citigroup's Annual Report on Form 10-K for the year ended December 31, 2016 , including the historical audited consolidated financial statements of Citigroup reflecting certain reclassifications set forth in Citigroup's Current Report on Form 8-K filed with the SEC on June 16, 2017 (2016 Annual Report on Form 10-K), and Citigroup's Quarterly Report on Form 10-Q for the quarter ended March 31, 2017 (First Quarter of 2017 Form 10-Q).
Additional information about Citigroup is available on Citi's website at www.citigroup.com . Citigroup's recent annual reports on Form 10-K, quarterly reports on Form 10-Q and proxy statements, as well as other filings with the U.S. Securities and Exchange Commission (SEC), are available free of charge through Citi's website by clicking on the "Investors" page and selecting "All SEC Filings." The SEC's website also contains current reports on Form 8-K, and other information regarding Citi at www.sec.gov .
Certain reclassifications, including a realignment of certain businesses, have been made to the prior periods' financial statements and disclosures to conform to the current period's presentation. For additional information on certain recent reclassifications, see Note 3 to the Consolidated Financial Statements in Citi's 2016 Annual Report on Form 10-K.
Throughout this report, "Citigroup," "Citi" and "the Company" refer to Citigroup Inc. and its consolidated subsidiaries.
2
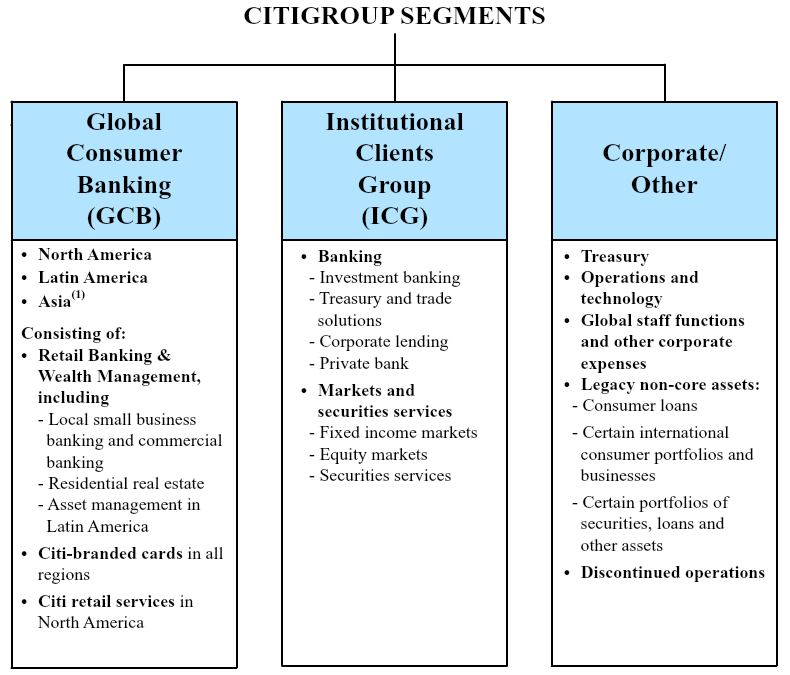
Citigroup is managed pursuant to the following segments:
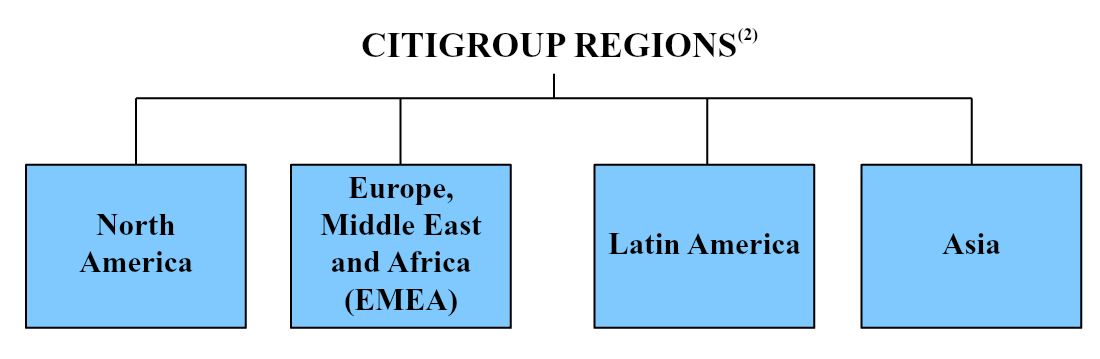
The following are the four regions in which Citigroup operates. The regional results are fully reflected in the segment results above.
(1) | Asia GCB includes the results of operations of GCB activities in certain EMEA countries for all periods presented. |
(2) | North Americ a includes the U.S., Canada and Puerto Rico, Latin America includes Mexico and Asia includes Japan. |
3
MANAGEMENT'S DISCUSSION AND ANALYSIS OF FINANCIAL CONDITION
AND RESULTS OF OPERATIONS
EXECUTIVE SUMMARY
Second Quarter of 2017 -Solid Performance Across Citi's Businesses
As described further throughout this Executive Summary, Citi reported solid operating results in the second quarter of 2017, reflecting continued momentum across its businesses, notably those where Citi has been making investments. During the quarter, Citi had loan and revenue growth in both Global Consumer Banking (GCB) and the Institutional Clients Group (ICG) compared to the prior-year quarter, while continuing to wind-down the legacy assets in Corporate/Other.
In North America GCB , retail banking showed significant growth outside of mortgage operations, while Citi-branded cards continued to benefit from the acquisition of the Costco portfolio. International GCB generated positive operating leverage driven by year-over-year revenue growth in both, Latin America and Asia , excluding the impact of foreign currency translation into U.S. dollars for reporting purposes (FX translation). ICG had a strong quarter with revenue growth across all Banking businesses, particularly in investment banking, partially offset by declines in fixed income and equity markets revenues. These increases in revenues were partially offset by lower revenues in Corporate/Other , reflecting the continued wind-down of legacy non-core assets.
Citi also continued to generate significant regulatory capital during the quarter driven mostly by earnings. Citi generated approximately $4.7 billion in regulatory capital during the quarter, before returning approximately $2.2 billion to its common shareholders in the form of common stock repurchases and dividends. Citi repurchased approximately 29 million common shares, as outstanding common shares declined 1% from the prior quarter and 6% from the prior-year period. Despite this capital return, each of Citigroup's key regulatory capital metrics remained strong as of the end of the second quarter of 2017 (see "Capital" below). Citi utilized approximately $100 million of deferred tax assets (DTAs) during the quarter and $900 million of its DTAs during the first half of 2017.
The Federal Reserve Board did not object to the capital plan Citi submitted as part of the 2017 Comprehensive Capital Analysis and Review (CCAR). Accordingly, as previously disclosed, Citi intends to return $18.9 billion of capital to its common shareholders over the next four quarters beginning with the third quarter of 2017 (for additional information, see "Equity Security Repurchases" and "Dividends" below).
While economic sentiment has improved, there continues to be various economic and political uncertainties and changes that could impact Citi's businesses. For a more detailed discussion of these risks and uncertainties, see each respective business's results of operations and "Forward-Looking Statements" below, as well as each respective business's results of operations and the "Managing Global Risk" and "Risk Factors" sections in Citi's 2016 Annual Report on Form 10-K.
Second Quarter of 2017 Summary Results
Citigroup
Citigroup reported net income of $3.9 billion, or $1.28 per share, compared to $4.0 billion, or $1.24 per share, in the prior-year period. The 3% decrease in net income from the prior-year period was primarily driven by higher credit costs and operating expenses, as well as a higher effective tax rate, partially offset by higher revenues. Earnings per share increased 3% largely due to a 6% reduction in average shares outstanding.
Citigroup revenues of $17.9 billion in the second quarter of 2017 increased 2%, driven by a 6% increase in ICG , as well as a 5% increase in GCB , partially offset by a 45% decrease in Corporate / Other due primarily to the continued wind-down of legacy non-core assets.
Citigroup's end-of-period loans increased 2% to $645 billion versus the prior-year period. Excluding the impact of FX translation, Citigroup's end-of-period loans also grew 2%, as 4% growth in both GCB and ICG was partially offset by the continued wind-down of legacy assets in Corporate/Other . (Citi's results of operations excluding the impact of FX translation are non-GAAP financial measures.) Citigroup's end-of-period deposits increased 2% to $959 billion versus the prior-year period. Excluding the impact of FX translation, Citigroup's deposits were also up 2%, driven by a 3% increase in both GCB and ICG deposits, slightly offset by a decline in Corporate/Other deposits.
Expenses
Citigroup's operating expenses were up slightly at $10.5 billion versus the prior-year period, as the impact of higher volume-related expenses, performance-based compensation and ongoing investments were partially offset by efficiency savings and the wind-down of legacy assets. Year-over-year, GCB and ICG operating expenses were up each 5% while Corporate/Other operating expenses declined 24%.
Cost of Credit
Citi's total provisions for credit losses and for benefits and claims of $1.7 billion increased 22% from the prior-year period. The increase was driven by an increase in net credit losses of $94 million and a net loan loss reserve release of $16 million, compared to a net release of $256 million mostly related to legacy assets in the prior-year period.
Net credit losses of $1.7 billion increased 6% versus the prior-year period. Consumer net credit losses of $1.6 billion increased 11%, primarily driven by the Costco portfolio acquisition, organic volume growth and seasoning, and the impact of changes in collections processes in the North America cards businesses, partially offset by the continued wind-down of legacy assets in Corporate/Other . Corporate net credit losses decreased 45% from the prior-year period to $77 million, driven by improvement in the energy sector. Citi
4
expects consumer cost of credit to increase in the near term due to continued volume growth.
For additional information on Citi's consumer and corporate credit costs and allowance for loan losses, see "Credit Risk" below.
Capital
Citigroup's Common Equity Tier 1 Capital and Tier 1 Capital ratios , on a fully implemented basis, were 13.1% and 14.7% as of June 30, 2017 (based on Basel III Standardized Approach for determining risk-weighted assets), respectively, compared to 12.5% and 14.1% as of June 30, 2016 (based on the Basel III Advanced Approaches for determining risk-weighted assets). Citigroup's Supplementary Leverage ratio as of June 30, 2017, on a fully implemented basis, was 7.2%, compared to 7.5% as of June 30, 2016. For additional information on Citi's capital ratios and related components, including the impact of Citi's DTAs on its capital ratios, see "Capital Resources" below.
Global Consumer Banking
GCB net income decreased 12% to $1.1 billion, as higher revenues were more than offset by higher cost of credit and higher operating expenses. Operating expenses were $4.5 billion, an increase of 5% on both a reported basis and excluding the impact of FX, driven by the addition of the Costco portfolio, volume growth and continued investments, partially offset by ongoing efficiency savings.
GCB revenues of $8.0 billion increased 5% versus the prior-year period. Excluding the impact of FX translation, GCB revenues also increased 5%, driven by a 5% increase in both North America GCB and international GCB . North America GCB revenues increased 5% to $4.9 billion, as higher revenues in Citi-branded cards and Citi retail services were partially offset by lower revenues in retail banking, driven by lower mortgage revenues. Citi-branded cards revenues of $2.1 billion were up 10% versus the prior-year period, reflecting the impact of the Costco portfolio acquisition as well as modest organic growth in core portfolios, partially offset by the run-off of non-core portfolios. Citi retail services revenues of $1.6 billion increased 4% versus the prior-year period, reflecting continued loan growth and a favorable prior period comparison. Retail banking revenues decreased 2% from the prior-year period, mainly driven by the lower mortgage revenues. Excluding mortgage revenues, retail banking revenues were up 7% from the prior-year period, driven by continued growth in average loans, deposits and assets under management, as well as a benefit from higher interest rates.
North America GCB average deposits of $185 billion were up 2% versus the prior-year period, average retail loans of $56 billion grew 2%, and assets under management of $57 billion grew 10%. Average branded card loans of $83 billion increased 25%, while branded card purchase sales of $81 billion increased 52% versus the prior-year period, both driven by the Costco portfolio acquisition as well as organic growth. Average retail services loans of $45 billion were up 4%, while retail services purchase sales of $21 billion were up 2%. For additional information on the results of operations of North
America GCB for the second quarter of 2017, see " Global Consumer Banking-North America GCB " below.
International GCB revenues (consisting of Latin America GCB and Asia GCB (which includes the results of operations in certain EMEA countries)) increased 4% to $3.1 billion versus the prior-year period. Excluding the impact of FX translation, international GCB revenues increased 5% versus the prior-year period. Latin America GCB revenues increased 8% versus the prior-year period, driven by growth in retail loans and deposits, as well as improved deposit spreads, partially offset by a modest decline in cards revenues. Asia GCB revenues increased 3% versus the prior-year period, driven by improvement in cards and wealth management revenues, partially offset by lower retail lending revenues. For additional information on the results of operations of Latin America GCB and Asia GCB for the second quarter of 2017, including the impact of FX translation, see " Global Consumer Banking-Latin America GCB" and " -Asia GCB " below.
Year-over-year, international GCB average deposits of $122 billion increased 7%, average retail loans of $87 billion were roughly flat, assets under management of $96 billion increased 7%, average card loans of $24 billion increased 6% and card purchase sales of $24 billion increased 7%, all excluding the impact of FX translation.
Institutional Clients Group
ICG net income of $2.8 billion increased 6%, driven by higher revenues, partially offset by higher operating expenses. ICG operating expenses increased 5% to $5.0 billion, as higher incentive compensation, investments and volume-related expenses were partially offset by efficiency savings.
ICG revenues were $9.2 billion in the second quarter of 2017, up 6% from the prior-year period, driven by a 19% increase in Banking revenues partially offset by a 5% decrease in Markets and securities services revenues. The increase in Banking revenues included the impact of $9 million of mark-to-market gains on loan hedges related to accrual loans within corporate lending compared to losses of $203 million in the prior-year period.
Banking revenues of $4.8 billion (excluding the impact of mark-to-market losses on hedges related to accrual loans within corporate lending) increased 13% compared to the prior-year period, driven by significant growth in investment banking as well as solid performance in treasury and trade solutions and the private bank. Investment banking revenues of $1.5 billion increased 22% versus the prior-year period. Advisory revenues increased 32% to $314 million, equity underwriting revenues increased 70% to $295 million and debt underwriting revenues increased 9% to $877 million, all versus the prior-year period.
Private bank revenues increased 17% versus the prior-year period to $788 million, driven by loan and deposit growth, improved spreads and increased investment activity. Corporate lending revenues increased $306 million to $486 million. Excluding the mark-to-market impact of loan hedges, corporate lending revenues increased 25% to $477 million versus the prior-year period reflecting lower hedging costs as well as the absence of a prior period adjustment to the residual value of a lease financing. Treasury and trade solutions
5
revenues increased 3% to $2.1 billion versus the prior-year period, reflecting continued volume growth and improved deposit spreads.
Markets and securities services revenues decreased 5% to $4.4 billion versus the prior-year period. Fixed income markets revenues decreased 6% to $3.2 billion versus the prior-year period, primarily reflecting lower G10 currencies revenue, given low volatility in the current quarter and the comparison to higher Brexit-related activity a year ago. Equity markets revenues decreased 11% to $691 million versus the prior-year period, reflecting episodic activity in the prior-year period, as well as low volatility in the current quarter. Securities services revenues increased 10% to $584 million versus the prior-year period, driven by growth in client volumes across the global custody business. For additional information on the results of operations of ICG for the second quarter of 2017, see " Institutional Clients Group " below.
Corporate/Other
Corporate/Other net loss was $15 million in the second quarter of 2017, compared to net income of $116 million in the prior-year period, reflecting lower revenues, partially offset by lower operating expenses and lower cost of credit. Expenses of $990 million declined 24% from the prior-year period, reflecting the wind-down of legacy assets.
Corporate/Other revenues were $653 million, down 45% from the prior-year period, reflecting the wind-down of legacy assets, divestiture activity and the absence of gains related to debt buybacks in the prior-year period.
Corporate/Other end-of-period assets decreased 21% to $92 billion from the prior-year period as Citi continued to wind-down legacy assets. For additional information on the results of operations of Corporate/Other for the second quarter of 2017, see " Corporate/Other " below.
6
RESULTS OF OPERATIONS
SUMMARY OF SELECTED FINANCIAL DATA-PAGE 1
Citigroup Inc. and Consolidated Subsidiaries
| Second Quarter |
| Six Months |
| ||||||||||||
In millions of dollars, except per-share amounts and ratios | 2017 | 2016 | % Change | 2017 | 2016 | % Change | ||||||||||
Net interest revenue | $ | 11,165 | | $ | 11,236 | | (1 | )% | $ | 22,022 | | $ | 22,463 | | (2 | )% |
Non-interest revenue | 6,736 | | 6,312 | | 7 | | 13,999 | | 12,640 | | 11 | | ||||
Revenues, net of interest expense | $ | 17,901 | | $ | 17,548 | | 2 | % | $ | 36,021 | | $ | 35,103 | | 3 | % |
Operating expenses | 10,506 | | 10,369 | | 1 | | 20,983 | | 20,892 | | - | | ||||
Provisions for credit losses and for benefits and claims | 1,717 | | 1,409 | | 22 | | 3,379 | | 3,454 | | (2 | ) | ||||
Income from continuing operations before income taxes | $ | 5,678 | | $ | 5,770 | | (2 | )% | $ | 11,659 | | $ | 10,757 | | 8 | % |
Income taxes | 1,795 | | 1,723 | | 4 | | 3,658 | | 3,202 | | 14 | | ||||
Income from continuing operations | $ | 3,883 | | $ | 4,047 | | (4 | )% | $ | 8,001 | | $ | 7,555 | | 6 | % |
Income (loss) from discontinued operations, net of taxes (1) | 21 | | (23 | ) | NM | | 3 | | (25 | ) | NM | | ||||
Net income before attribution of noncontrolling interests | $ | 3,904 | | $ | 4,024 | | (3 | )% | $ | 8,004 | | $ | 7,530 | | 6 | % |
Net income attributable to noncontrolling interests | 32 | | 26 | | 23 | | 42 | | 31 | | 35 | | ||||
Citigroup's net income | $ | 3,872 | | $ | 3,998 | | (3 | )% | $ | 7,962 | | $ | 7,499 | | 6 | % |
Less: |
|
| | |
|
|
| |||||||||
Preferred dividends-Basic | $ | 320 | | $ | 322 | | (1 | )% | $ | 621 | | $ | 532 | | 17 | % |
Dividends and undistributed earnings allocated to employee restricted and deferred shares that contain nonforfeitable rights to dividends, applicable to basic EPS | 48 | | 53 | | (9 | ) | 103 | | 93 | | 11 | | ||||
Income allocated to unrestricted common shareholders for basic and diluted EPS | $ | 3,504 | | $ | 3,623 | | (3 | )% | $ | 7,238 | | $ | 6,874 | | 5 | % |
Earnings per share |
|
| | |
|
| |
| ||||||||
Basic |
|
| | |
|
| |
| ||||||||
Income from continuing operations | $ | 1.27 | | 1.25 | | 2 | | $ | 2.63 | | 2.36 | | 11 | | ||
Net income | 1.28 | | 1.24 | | 3 | | 2.63 | | 2.35 | | 12 | | ||||
Diluted |
|
| | |
|
|
| |||||||||
Income from continuing operations | $ | 1.27 | | $ | 1.25 | | 2 | % | $ | 2.63 | | $ | 2.36 | | 11 | % |
Net income | 1.28 | | 1.24 | | 3 | | 2.63 | | 2.35 | | 12 | | ||||
Dividends declared per common share | 0.16 | | 0.05 | | NM | | 0.32 | | 0.10 | | NM | | ||||
Statement continues on the next page, including notes to the table.
7
SUMMARY OF SELECTED FINANCIAL DATA-PAGE 2
Citigroup Inc. and Consolidated Subsidiaries | |||||||||||||
| Second Quarter |
| Six Months |
| |||||||||
In millions of dollars, except per-share amounts, ratios and direct staff | 2017 | 2016 | % Change | 2017 | 2016 | % Change | |||||||
At June 30: |
|
|
|
|
|
| |||||||
Total assets | $ | 1,864,063 | | $ | 1,818,771 | | 2 | % |
|
|
| ||
Total deposits | 958,743 | | 937,852 | | 2 | |
|
|
| ||||
Long-term debt | 225,179 | | 207,448 | | 9 | |
|
|
| ||||
Citigroup common stockholders' equity | 210,766 | | 212,635 | | (1 | ) |
|
|
| ||||
Total Citigroup stockholders' equity | 230,019 | | 231,888 | | (1 | ) |
|
|
| ||||
Direct staff (in thousands) | 214 | | 220 | | (3 | ) |
|
|
| ||||
Performance metrics |
|
| | |
|
|
| ||||||
Return on average assets | 0.83 | % | 0.89 | % | | | 0.87 | % | 0.84 | % |
| ||
Return on average common stockholders' equity (2) | 6.8 | | 7.0 | | | | 7.1 | | 6.7 | |
| ||
Return on average total stockholders' equity (2) | 6.8 | | 7.0 | | | | 7.1 | | 6.7 | |
| ||
Efficiency ratio (Total operating expenses/Total revenues) | 59 | | 59 | | | | 58 | | 60 | |
| ||
Basel III ratios-full implementation |
|
|
|
|
|
| |||||||
Common Equity Tier 1 Capital (3) | 13.06 | % | 12.53 | % |
|
|
|
| |||||
Tier 1 Capital (3) | 14.74 | | 14.12 | |
|
|
|
| |||||
Total Capital (3) | 16.93 | | 16.13 | |
|
|
|
| |||||
Supplementary Leverage ratio (4) | 7.24 | | 7.48 | |
|
|
|
| |||||
Citigroup common stockholders' equity to assets | 11.31 | % | 11.69 | % |
| | |
|
| ||||
Total Citigroup stockholders' equity to assets | 12.34 | | 12.75 | |
| | |
|
| ||||
Dividend payout ratio (5) | 12.5 | | 4.0 | |
| 12.2 | % | 4.3 | % |
| |||
Total payout ratio (6) | 63 | | 40 | |
| 61 | | 42 | |
| |||
Book value per common share | $ | 77.36 | | $ | 73.19 | | 6 | % | | |
|
| |
Tangible book value (TBV) per share (7) | 67.32 | | 63.53 | | 6 | |
|
|
| ||||
Ratio of earnings to fixed charges and preferred stock dividends | 2.28x | | 2.63x | |
| 2.39x | | 2.59x | |
| |||
(1) | See Note 2 to the Consolidated Financial Statements for additional information on Citi's discontinued operations. |
(2) | The return on average common stockholders' equity is calculated using net income less preferred stock dividends divided by average common stockholders' equity. The return on average total Citigroup stockholders' equity is calculated using net income divided by average Citigroup stockholders' equity. |
(3) | Citi's reportable Common Equity Tier 1 (CET1) Capital and Tier 1 Capital ratios were the lower derived under the U.S. Basel III Standardized Approach at June 30, 2017, and U.S. Basel III Advanced Approaches at June 30, 2016. Citi's reportable Total Capital ratios were derived under the U.S. Basel III Advanced Approaches for both periods presented. This reflects the U.S. Basel III requirement to report the lower of risk-based capital ratios under both the Standardized Approach and Advanced Approaches in accordance with the Collins Amendment of the Dodd-Frank Act. |
(4) | Citi's Supplementary Leverage ratio reflects full implementation of the U.S. Basel III rules. |
(5) | Dividends declared per common share as a percentage of net income per diluted share. |
(6) | Total common dividends declared plus common stock repurchases as a percentage of net income available to common shareholders. See "Consolidated Statement of Changes in Stockholders' Equity," Note 9 to the Consolidated Financial Statements and "Equity Security Repurchases" below for the component details. |
(7) | For information on TBV, see "Capital Resources-Tangible Common Equity, Book Value Per Share, Tangible Book Value Per Share and Returns on Equity" below. |
NM Not Meaningful
8
SEGMENT AND BUSINESS-INCOME (LOSS) AND REVENUES
CITIGROUP INCOME
| Second Quarter |
| Six Months |
| ||||||||||||
In millions of dollars | 2017 | 2016 | % Change | 2017 | 2016 | % Change | ||||||||||
Income from continuing operations |
|
|
|
|
|
| ||||||||||
Global Consumer Banking |
|
|
|
|
|
| ||||||||||
North America | $ | 670 | | $ | 815 | | (18 | )% | $ | 1,297 | | $ | 1,648 | | (21 | )% |
Latin America | 136 | | 173 | | (21 | ) | 266 | | 319 | | (17 | ) | ||||
Asia (1) | 323 | | 297 | | 9 | | 569 | | 512 | | 11 | | ||||
Total | $ | 1,129 | | $ | 1,285 | | (12 | )% | $ | 2,132 | | $ | 2,479 | | (14 | )% |
Institutional Clients Group | | |
| | | | |
| | | ||||||
North America | $ | 1,112 | | $ | 1,005 | | 11 | % | $ | 2,212 | | $ | 1,551 | | 43 | % |
EMEA | 779 | | 695 | | 12 | | 1,634 | | 1,069 | | 53 | | ||||
Latin America | 333 | | 392 | | (15 | ) | 808 | | 722 | | 12 | | ||||
Asia | 556 | | 523 | | 6 | | 1,137 | | 1,142 | | - | | ||||
Total | $ | 2,780 | | $ | 2,615 | | 6 | % | $ | 5,791 | | $ | 4,484 | | 29 | % |
Corporate/Other | (26 | ) | 147 | | NM | | 78 | | 592 | | (87 | ) | ||||
Income from continuing operations | $ | 3,883 | | $ | 4,047 | | (4 | )% | $ | 8,001 | | $ | 7,555 | | 6 | % |
Discontinued operations | $ | 21 | | $ | (23 | ) | NM | | $ | 3 | | $ | (25 | ) | NM | |
Net income attributable to noncontrolling interests | 32 | | 26 | | 23 | | 42 | | 31 | | 35 | | ||||
Citigroup's net income | $ | 3,872 | | $ | 3,998 | | (3 | )% | $ | 7,962 | | $ | 7,499 | | 6 | % |
(1) | Asia GCB includes the results of operations of GCB activities in certain EMEA countries for all periods presented. |
9
| Second Quarter |
| Six Months |
| ||||||||||||
In millions of dollars | 2017 | 2016 | % Change | 2017 | 2016 | % Change | ||||||||||
Global Consumer Banking |
|
|
|
|
|
| ||||||||||
North America | $ | 4,944 | | $ | 4,709 | | 5 | % | $ | 9,888 | | $ | 9,539 | | 4 | % |
Latin America | 1,290 | | 1,236 | | 4 | | 2,441 | | 2,465 | | (1 | ) | ||||
Asia (1) | 1,801 | | 1,729 | | 4 | | 3,523 | | 3,384 | | 4 | | ||||
Total | $ | 8,035 | | $ | 7,674 | | 5 | % | $ | 15,852 | | $ | 15,388 | | 3 | % |
Institutional Clients Group | | |
| | |
|
| | | |||||||
North America | $ | 3,568 | | $ | 3,393 | | 5 | % | $ | 7,023 | | $ | 6,373 | | 10 | % |
EMEA | 2,837 | | 2,577 | | 10 | | 5,644 | | 4,744 | | 19 | | ||||
Latin America | 1,042 | | 1,022 | | 2 | | 2,169 | | 1,984 | | 9 | | ||||
Asia | 1,766 | | 1,697 | | 4 | | 3,503 | | 3,483 | | 1 | | ||||
Total | $ | 9,213 | | $ | 8,689 | | 6 | % | $ | 18,339 | | $ | 16,584 | | 11 | % |
Corporate/Other | 653 | | 1,185 | | (45 | ) | 1,830 | | 3,131 | | (42 | ) | ||||
Total Citigroup net revenues | $ | 17,901 | | $ | 17,548 | | 2 | % | $ | 36,021 | | $ | 35,103 | | 3 | % |
(1) | Asia GCB includes the results of operations of GCB activities in certain EMEA countries for all periods presented. |
10
SEGMENT BALANCE SHEET
(1)In millions of dollars | Global Consumer Banking | Institutional Clients Group | Corporate/Other and consolidating eliminations (2) | Citigroup Parent company- issued long-term debt and stockholders' equity (3) | Total Citigroup consolidated | ||||||||||
Assets |
|
|
|
|
| ||||||||||
Cash and deposits with banks | $ | 9,260 | | $ | 65,850 | | $ | 110,972 | | $ | - | | $ | 186,082 | |
Federal funds sold and securities borrowed or purchased under agreements to resell | 358 | | 233,076 | | 631 | | - | | 234,065 | | |||||
Trading account assets | 6,414 | | 251,170 | | 2,022 | | - | | 259,606 | | |||||
Investments | 10,255 | | 113,078 | | 228,377 | | - | | 351,710 | | |||||
Loans, net of unearned income and allowance for loan losses | 290,001 | | 316,842 | | 25,827 | | - | | 632,670 | | |||||
Other assets | 38,143 | | 103,046 | | 58,741 | | - | | 199,930 | | |||||
Liquidity assets (4) | 64,378 | | 269,709 | | (334,087 | ) | - | | - | | |||||
Total assets | $ | 418,809 | | $ | 1,352,771 | | $ | 92,483 | | $ | - | | $ | 1,864,063 | |
Liabilities and equity |
|
|
|
|
| ||||||||||
Total deposits | $ | 309,320 | | $ | 623,533 | | $ | 25,890 | | $ | - | | $ | 958,743 | |
Federal funds purchased and securities loaned or sold under agreements to repurchase | 4,061 | | 150,711 | | 8 | | - | | 154,780 | | |||||
Trading account liabilities | 13 | | 136,273 | | 459 | | - | | 136,745 | | |||||
Short-term borrowings | 602 | | 20,455 | | 15,462 | | - | | 36,519 | | |||||
Long-term debt (3) | 1,178 | | 34,179 | | 42,565 | | 147,257 | | 225,179 | | |||||
Other liabilities | 17,999 | | 83,118 | | 19,873 | | - | | 120,990 | | |||||
Net inter-segment funding (lending) (3) | 85,636 | | 304,502 | | (12,862 | ) | (377,276 | ) | - | | |||||
Total liabilities | $ | 418,809 | | $ | 1,352,771 | | $ | 91,395 | | $ | (230,019 | ) | $ | 1,632,956 | |
Total equity (5) | - | | - | | 1,088 | | 230,019 | | 231,107 | | |||||
Total liabilities and equity | $ | 418,809 | | $ | 1,352,771 | | $ | 92,483 | | $ | - | | $ | 1,864,063 | |
(1) | The supplemental information presented in the table above reflects Citigroup's consolidated GAAP balance sheet by reporting segment as of June 30, 2017 . The respective segment information depicts the assets and liabilities managed by each segment as of such date. |
(2) | Consolidating eliminations for total Citigroup and Citigroup parent company assets and liabilities are recorded within Corporate/Other . |
(3) | The total stockholders' equity and the majority of long-term debt of Citigroup reside in the Citigroup parent company Consolidated Balance Sheet. Citigroup allocates stockholders' equity and long-term debt to its businesses through inter-segment allocations as shown above. |
(4) | Represents the attribution of Citigroup's liquidity assets (primarily consisting of cash and available-for-sale securities) to the various businesses based on Liquidity Coverage Ratio (LCR) assumptions. |
(5) | Corporate/Othe r equity represents noncontrolling interests. |
11
This page intentionally left blank.
12
GLOBAL CONSUMER BANKING
Global Consumer Banking (GCB) consists of consumer banking businesses in North America , Latin America (consisting of Citi's consumer banking business in Mexico) and Asia . GCB provides traditional banking services to retail customers through retail banking, including commercial banking, and Citi-branded cards and Citi retail services (for additional information on these businesses, see "Citigroup Segments" above). GCB is focused on its priority markets in the U.S., Mexico and Asia with 2,570 branches in 19 countries and jurisdictions as of June 30, 2017 . At June 30, 2017 , GCB had approximately $419 billion in assets and $309 billion in deposits.
GCB 's overall strategy is to leverage Citi's global footprint and be the preeminent bank for the emerging affluent and affluent consumers in large urban centers. In credit cards and in certain retail markets, Citi serves customers in a somewhat broader set of segments and geographies.
| Second Quarter |
| Six Months |
| ||||||||||||
In millions of dollars except as otherwise noted | 2017 | 2016 | % Change | 2017 | 2016 | % Change | ||||||||||
Net interest revenue | $ | 6,699 | | $ | 6,308 | | 6 | % | $ | 13,221 | | $ | 12,660 | | 4 | % |
Non-interest revenue | 1,336 | | 1,366 | | (2 | )% | 2,631 | | 2,728 | | (4 | )% | ||||
Total revenues, net of interest expense | $ | 8,035 | | $ | 7,674 | | 5 | % | $ | 15,852 | | $ | 15,388 | | 3 | % |
Total operating expenses | $ | 4,497 | | $ | 4,297 | | 5 | % | $ | 8,912 | | $ | 8,698 | | 2 | % |
Net credit losses | $ | 1,615 | | $ | 1,374 | | 18 | % | $ | 3,218 | | $ | 2,745 | | 17 | % |
Credit reserve build (release) | 125 | | 23 | | NM | | 302 | | 108 | | NM | | ||||
Provision (release) for unfunded lending commitments | (1 | ) | 8 | | NM | | 5 | | 9 | | (44 | )% | ||||
Provision for benefits and claims | 23 | | 20 | | 15 | % | 52 | | 48 | | 8 | % | ||||
Provisions for credit losses and for benefits and claims | $ | 1,762 | | $ | 1,425 | | 24 | % | $ | 3,577 | | $ | 2,910 | | 23 | % |
Income from continuing operations before taxes | $ | 1,776 | | $ | 1,952 | | (9 | )% | $ | 3,363 | | $ | 3,780 | | (11 | )% |
Income taxes | 647 | | 667 | | (3 | ) | 1,231 | | 1,301 | | (5 | ) | ||||
Income from continuing operations | $ | 1,129 | | $ | 1,285 | | (12 | )% | $ | 2,132 | | $ | 2,479 | | (14 | )% |
Noncontrolling interests | 4 | | 1 | | NM | | 5 | | 3 | | 67 | | ||||
Net income | $ | 1,125 | | $ | 1,284 | | (12 | )% | $ | 2,127 | | $ | 2,476 | | (14 | )% |
Balance Sheet data (in billions of dollars) | | |
| | |
|
| | | |||||||
Total EOP assets | $ | 419 | | $ | 399 | | 5 | % |
|
| | | ||||
Average assets | 414 | | 387 | | 7 | | $ | 413 | | $ | 382 | | 8 | % | ||
Return on average assets | 1.09 | % | 1.33 | % | | | 1.04 | % | 1.30 | % | | | ||||
Efficiency ratio | 56 | % | 56 | % | | | 56 | % | 57 | % | | | ||||
Average deposits | $ | 307 | | $ | 297 | | 3 | % | $ | 305 | | $ | 296 | | 3 | % |
Net credit losses as a percentage of average loans | 2.20 | % | 2.02 | % | | | 2.22 | % | 2.03 | % | | | ||||
Revenue by business | | |
| | |
|
| | | |||||||
Retail banking | $ | 3,299 | | $ | 3,242 | | 2 | % | $ | 6,454 | | $ | 6,429 | | - | % |
Cards (1) | 4,736 | | 4,432 | | 7 | | 9,398 | | 8,959 | | 5 | | ||||
Total | $ | 8,035 | | $ | 7,674 | | 5 | % | $ | 15,852 | | $ | 15,388 | | 3 | % |
Income from continuing operations by business | | |
| | |
|
| | | |||||||
Retail banking | $ | 420 | | $ | 472 | | (11 | )% | $ | 759 | | $ | 770 | | (1 | )% |
Cards (1) | 709 | | 813 | | (13 | ) | 1,373 | | 1,709 | | (20 | ) | ||||
Total | $ | 1,129 | | $ | 1,285 | | (12 | )% | $ | 2,132 | | $ | 2,479 | | (14 | )% |
Table continues on the next page.
13
Foreign currency (FX) translation impact |
|
| | |
|
|
| |||||||||
Total revenue-as reported | $ | 8,035 | | $ | 7,674 | | 5 | % | $ | 15,852 | | $ | 15,388 | | 3 | % |
Impact of FX translation (2) | - | | (23 | ) | | | - | | (126 | ) | | | ||||
Total revenues-ex-FX (3) | $ | 8,035 | | $ | 7,651 | | 5 | % | $ | 15,852 | | $ | 15,262 | | 4 | % |
Total operating expenses-as reported | $ | 4,497 | | $ | 4,297 | | 5 | % | $ | 8,912 | | $ | 8,698 | | 2 | % |
Impact of FX translation (2) | - | | (9 | ) | | | - | | (50 | ) | | | ||||
Total operating expenses-ex-FX (3) | $ | 4,497 | | $ | 4,288 | | 5 | % | $ | 8,912 | | $ | 8,648 | | 3 | % |
Total provisions for LLR & PBC-as reported | $ | 1,762 | | $ | 1,425 | | 24 | % | $ | 3,577 | | $ | 2,910 | | 23 | % |
Impact of FX translation (2) | - | | (7 | ) | | | - | | (37 | ) | | | ||||
Total provisions for LLR & PBC-ex-FX (3) | $ | 1,762 | | $ | 1,418 | | 24 | % | $ | 3,577 | | $ | 2,873 | | 25 | % |
Net income-as reported | $ | 1,125 | | $ | 1,284 | | (12 | )% | $ | 2,127 | | $ | 2,476 | | (14 | )% |
Impact of FX translation (2) | - | | (6 | ) | | | - | | (30 | ) | | | ||||
Net income-ex-FX (3) | $ | 1,125 | | $ | 1,278 | | (12 | )% | $ | 2,127 | | $ | 2,446 | | (13 | )% |
(1) | Includes both Citi-branded cards and Citi retail services. |
(2) | Reflects the impact of FX translation into U.S. dollars at the second quarter of 2017 and year-to-date 2017 average exchange rates for all periods presented. |
(3) | Presentation of this metric excluding FX translation is a non-GAAP financial measure. |
14
NORTH AMERICA GCB
North America GCB provides traditional retail banking, including commercial banking, and its Citi-branded cards and Citi retail services card products to retail customers and small to mid-size businesses, as applicable, in the U.S. North America GCB 's U.S. cards product portfolio includes its proprietary portfolio (including the Citi Double Cash, Thank You and Value cards) and co-branded cards (including, among others, American Airlines and Costco) within Citi-branded cards as well as its co-brand and private label relationships (including, among others, Sears, The Home Depot, Macy's and Best Buy) within Citi retail services. As previously announced, the Hilton Honors co-brand credit card partnership with Citi will terminate as of year-end 2017. The termination is not expected to have a material impact to North America GCB's results of operations or financial condition.
As of June 30, 2017 , North America GCB 's 695 retail bank branches are concentrated in the six key metropolitan areas of New York, Chicago, Miami, Washington, D.C., Los Angeles and San Francisco. Also as of June 30, 2017 , North America GCB had approximately 9.5 million retail banking customer accounts, $55.6 billion in retail banking loans and $185.2 billion in deposits. In addition, North America GCB had approximately 120 million Citi-branded and Citi retail services credit card accounts with $130.8 billion in outstanding card loan balances.
| Second Quarter |
| Six Months |
| ||||||||||||
In millions of dollars, except as otherwise noted | 2017 | 2016 | % Change | 2017 | 2016 | % Change | ||||||||||
Net interest revenue | $ | 4,633 | | $ | 4,331 | | 7 | % | $ | 9,250 | | $ | 8,729 | | 6 | % |
Non-interest revenue | 311 | | 378 | | (18 | ) | 638 | | 810 | | (21 | ) | ||||
Total revenues, net of interest expense | $ | 4,944 | | $ | 4,709 | | 5 | % | $ | 9,888 | | $ | 9,539 | | 4 | % |
Total operating expenses | $ | 2,577 | | $ | 2,426 | | 6 | % | $ | 5,153 | | $ | 4,926 | | 5 | % |
Net credit losses | $ | 1,181 | | $ | 954 | | 24 | % | $ | 2,371 | | $ | 1,887 | | 26 | % |
Credit reserve build (release) | 101 | | 49 | | NM | | 253 | | 128 | | 98 | | ||||
Provision for unfunded lending commitments | 2 | | 7 | | (71 | ) | 9 | | 7 | | 29 | | ||||
Provisions for benefits and claims | 8 | | 8 | | - | % | 14 | | 17 | | (18 | ) | ||||
Provisions for credit losses and for benefits and claims | $ | 1,292 | | $ | 1,018 | | 27 | % | $ | 2,647 | | $ | 2,039 | | 30 | % |
Income from continuing operations before taxes | $ | 1,075 | | $ | 1,265 | | (15 | )% | $ | 2,088 | | $ | 2,574 | | (19 | )% |
Income taxes | 405 | | 450 | | (10 | ) | 791 | | 926 | | (15 | ) | ||||
Income from continuing operations | $ | 670 | | $ | 815 | | (18 | )% | $ | 1,297 | | $ | 1,648 | | (21 | )% |
Noncontrolling interests | - | | (1 | ) | NM | | - | | (1 | ) | NM | | ||||
Net income | $ | 670 | | $ | 816 | | (18 | )% | $ | 1,297 | | $ | 1,649 | | (21 | )% |
Balance Sheet data (in billions of dollars) | | |
| | |
|
| | | | ||||||
Average assets | $ | 243 | | $ | 218 | | 11 | % | $ | 244 | | $ | 215 | | 13 | % |
Return on average assets | 1.11 | % | 1.51 | % | | | 1.07 | % | 1.54 | % | | | ||||
Efficiency ratio | 52 | % | 52 | % | | | 52 | % | 52 | % | | | ||||
Average deposits | $ | 185.1 | | $ | 182.1 | | 2 | % | $ | 185.3 | | $ | 181.4 | | 2 | % |
Net credit losses as a percentage of average loans | 2.58 | % | 2.34 | % | | | 2.61 | % | 2.33 | % | | | ||||
Revenue by business | | |
| | |
|
| | | | ||||||
Retail banking | $ | 1,291 | | $ | 1,313 | | (2 | )% | $ | 2,547 | | $ | 2,603 | | (2 | )% |
Citi-branded cards | 2,079 | | 1,886 | | 10 | | 4,175 | | 3,746 | | 11 | | ||||
Citi retail services | 1,574 | | 1,510 | | 4 | | 3,166 | | 3,190 | | (1 | ) | ||||
Total | $ | 4,944 | | $ | 4,709 | | 5 | % | $ | 9,888 | | $ | 9,539 | | 4 | % |
Income from continuing operations by business | | |
| | |
|
| | | | ||||||
Retail banking | $ | 140 | | $ | 172 | | (19 | )% | $ | 223 | | $ | 261 | | (15 | )% |
Citi-branded cards | 305 | | 320 | | (5 | ) | 553 | | 673 | | (18 | ) | ||||
Citi retail services | 225 | | 323 | | (30 | ) | 521 | | 714 | | (27 | ) | ||||
Total | $ | 670 | | $ | 815 | | (18 | )% | $ | 1,297 | | $ | 1,648 | | (21 | )% |
NM Not meaningful
15
2Q17 vs. 2Q16
Net income decreased 18% due to significantly higher cost of credit, driven by the impact of the Costco portfolio acquisition (completed June 17, 2016), and higher expenses, partially offset by higher revenues.
Revenues increased 5%, reflecting higher revenues in Citi-branded cards and Citi retail services, partially offset by lower revenues in retail banking.
Retail banking revenues declined 2%, reflecting lower mortgage revenues. The decline in mortgage revenues was driven by lower origination activity and higher cost of funds, as well as the impact of the previously announced sale of a portion of Citi's mortgage servicing rights (MSR). Excluding mortgage revenues, retail banking revenues were up 7%, driven by continued growth in average loans (6%), deposits (2%), and asset under management (10%), as well as a benefit from higher interest rates. Citi expects higher interest rates and the impact of the MSR sale to continue to negatively impact mortgage revenues during the remainder of 2017.
Cards revenues increased 8%. In Citi-branded cards, revenues increased 10%, largely reflecting the impact of the Costco portfolio acquisition and modest organic growth in Citi's core portfolios. This increase in revenues was partially offset by the runoff of non-core portfolios, which is expected to be an ongoing headwind during the remainder of 2017. Average loans grew 25% (3% excluding Costco) and purchase sales grew 52% (3% excluding Costco).
Citi retail services revenues increased 4%, primarily driven by continued loan growth and a favorable prior-period comparison, partially offset by the continued impact of the previously disclosed renewal and extension of certain partnerships within the portfolio. Average loans were up 4% and purchase sales were up 2%.
Expenses increased 6%, primarily driven by the addition of the Costco portfolio, volume growth and continued investments, partially offset by efficiency savings.
Provisions increased 27% from the prior-year period, driven by higher net credit losses and a higher net loan loss reserve build.
Net credit losses increased 24%, primarily driven by higher losses in Citi-branded cards and Citi retail services. In Citi-branded cards, net credit losses increased 31% to $611 million, primarily due to the Costco portfolio acquisition, organic volume growth and seasoning. In Citi retail services, net credit losses increased 20% to $531 million, primarily due to volume growth and seasoning and the impact of changes in collection processes. The net loan loss reserve build in the second quarter of 2017 was $103 million, compared to a build of $56 million in the prior-year period, largely supporting volume growth and the impact of changes in collections processes in Citi retail services.
For additional information on North America GCB 's retail banking, including commercial banking, and its Citi-branded cards and Citi retail services portfolios, see "Credit Risk-Consumer Credit" below.
2017 YTD vs. 2016 YTD
Year-to-date, North America GCB has experienced similar trends to those described above. Net income decreased 21% due to higher cost of credit and higher expenses, partially offset by higher revenues.
Revenues increased 4%, reflecting higher revenues in cards, partially offset by lower revenues in retail banking. Retail banking revenues decreased 2%, driven by the same factors described above. Cards revenues increased 6%. In Citi-branded cards, revenues increased 11%, driven by the same factors described above. Citi retail services revenues were down 1%, driven by the continued impact of the renewal and extension of certain partnerships, as well as the absence of gains on sales of two cards portfolios in the first quarter of 2016, partially offset by loan growth.
Expenses increased 5%, driven by the same factors described above.
Provisions increased 30%, driven by the same factors described above. Net credit losses increased 26% and the net loan loss reserve build of $262 million increased $127 million.
16
LATIN AMERICA GCB
Latin America GCB provides traditional retail banking, including commercial banking, and its Citi-branded card products to retail customers and small to mid-size businesses in Mexico through Citibanamex, one of Mexico's largest banks.
At June 30, 2017 , Latin America GCB had 1,496 retail branches in Mexico, with approximately 28.0 million retail banking customer accounts, $21.0 billion in retail banking loans and $28.7 billion in deposits. In addition, the business had approximately 5.7 million Citi-branded card accounts with $5.5 billion in outstanding loan balances.
| Second Quarter |
| Six Months | % Change | ||||||||||||
In millions of dollars, except as otherwise noted | 2017 | 2016 | % Change | 2017 | 2016 | |||||||||||
Net interest revenue | $ | 917 | | $ | 861 | | 7 | % | $ | 1,717 | | $ | 1,714 | | - | % |
Non-interest revenue | 373 | | 375 | | (1 | )% | 724 | | 751 | | (4 | )% | ||||
Total revenues, net of interest expense | $ | 1,290 | | $ | 1,236 | | 4 | % | $ | 2,441 | | $ | 2,465 | | (1 | )% |
Total operating expenses | $ | 735 | | $ | 725 | | 1 | % | $ | 1,394 | | $ | 1,443 | | (3 | )% |
Net credit losses | $ | 277 | | $ | 260 | | 7 | % | $ | 530 | | $ | 538 | | (1 | )% |
Credit reserve build (release) | 50 | | (2 | ) | NM | | 62 | | 15 | | NM | | ||||
Provision (release) for unfunded lending commitments | (1 | ) | 1 | | NM | | (1 | ) | 2 | | NM | | ||||
Provision for benefits and claims | 15 | | 12 | | 25 | % | 38 | | 31 | | 23 | % | ||||
Provisions for credit losses and for benefits and claims (LLR & PBC) | $ | 341 | | $ | 271 | | 26 | % | $ | 629 | | $ | 586 | | 7 | % |
Income from continuing operations before taxes | $ | 214 | | $ | 240 | | (11 | )% | $ | 418 | | $ | 436 | | (4 | )% |
Income taxes | 78 | | 67 | | 16 | | 152 | | 117 | | 30 | | ||||
Income from continuing operations | $ | 136 | | $ | 173 | | (21 | )% | $ | 266 | | $ | 319 | | (17 | )% |
Noncontrolling interests | 2 | | 1 | | 100 | | 3 | | 2 | | 50 | | ||||
Net income | $ | 134 | | $ | 172 | | (22 | )% | $ | 263 | | $ | 317 | | (17 | )% |
Balance Sheet data (in billions of dollars) | | |
| | |
|
| | | | ||||||
Average assets | $ | 46 | | $ | 50 | | (8 | )% | $ | 45 | | $ | 50 | | (10 | )% |
Return on average assets | 1.17 | % | 1.38 | % | | | 1.18 | % | 1.27 | % | | | ||||
Efficiency ratio | 57 | % | 59 | % | | | 57 | % | 59 | % | | | ||||
Average deposits | $ | 27.8 | | $ | 25.9 | | 7 | % | $ | 26.6 | | $ | 26.0 | | 2 | % |
Net credit losses as a percentage of average loans | 4.36 | % | 4.30 | % | | | 4.38 | % | 4.43 | % | | | ||||
Revenue by business | | |
| | |
|
| | | |||||||
Retail banking | $ | 923 | | $ | 853 | | 8 | % | $ | 1,759 | | $ | 1,709 | | 3 | % |
Citi-branded cards | 367 | | 383 | | (4 | ) | 682 | | 756 | | (10 | ) | ||||
Total | $ | 1,290 | | $ | 1,236 | | 4 | % | $ | 2,441 | | $ | 2,465 | | (1 | )% |
Income from continuing operations by business | | |
| | |
|
| | | | ||||||
Retail banking | $ | 87 | | $ | 96 | | (9 | )% | $ | 173 | | $ | 186 | | (7 | )% |
Citi-branded cards | 49 | | 77 | | (36 | ) | 93 | | 133 | | (30 | ) | ||||
Total | $ | 136 | | $ | 173 | | (21 | )% | $ | 266 | | $ | 319 | | (17 | )% |
17
FX translation impact | | |
| | |
|
| | | | ||||||
Total revenues-as reported | $ | 1,290 | | $ | 1,236 | | 4 | % | $ | 2,441 | | $ | 2,465 | | (1 | )% |
Impact of FX translation (1) | - | | (37 | ) | | | - | | (160 | ) | | | ||||
Total revenues-ex-FX (2) | $ | 1,290 | | $ | 1,199 | | 8 | % | $ | 2,441 | | $ | 2,305 | | 6 | % |
Total operating expenses-as reported | $ | 735 | | $ | 725 | | 1 | % | $ | 1,394 | | $ | 1,443 | | (3 | )% |
Impact of FX translation (1) | - | | (18 | ) | | | - | | (73 | ) | | | ||||
Total operating expenses-ex-FX (2) | $ | 735 | | $ | 707 | | 4 | % | $ | 1,394 | | $ | 1,370 | | 2 | % |
Provisions for LLR & PBC-as reported | $ | 341 | | $ | 271 | | 26 | % | $ | 629 | | $ | 586 | | 7 | % |
Impact of FX translation (1) | - | | (8 | ) | | | - | | (39 | ) | | | ||||
Provisions for LLR & PBC-ex-FX (2) | $ | 341 | | $ | 263 | | 30 | % | $ | 629 | | $ | 547 | | 15 | % |
Net income-as reported | $ | 134 | | $ | 172 | | (22 | )% | $ | 263 | | $ | 317 | | (17 | )% |
Impact of FX translation (1) | - | | (9 | ) | | | - | | (37 | ) | | | ||||
Net income-ex-FX (2) | $ | 134 | | $ | 163 | | (18 | )% | $ | 263 | | $ | 280 | | (6 | )% |
(1) | Reflects the impact of FX translation into U.S. dollars at the second quarter of 2017 and year-to-date 2017 average exchange rates for all periods presented. |
(2) | Presentation of this metric excluding FX translation is a non-GAAP financial measure. |
The discussion of the results of operations for Latin America GCB below excludes the impact of FX translation for all periods presented. Presentations of the results of operations, excluding the impact of FX translation, are non-GAAP financial measures. For a reconciliation of certain of these metrics to the reported results, see the table above.
2Q17 vs. 2Q16
Net income decreased 18%, primarily driven by higher credit costs and expenses, partially offset by higher revenues.
Revenues increased 8%, driven by higher revenues in
retail banking, partially offset by modestly lower revenues in
cards.
Retail banking revenues grew by 12%, reflecting continued growth in volumes, including an increase in average loans (8%), largely driven by the commercial and small business portfolios, and an increase in average deposits (10%), as well as improved deposit spreads. Cards revenues decreased 1%, reflecting continued higher cost to fund non-revolving loans, largely offset by increased purchase sales (10%). Average card loans grew 6%. While revolving card loan balance trends continued to improve during the quarter, Latin America GCB expects cards revenues to remain under pressure in the near term.
Expenses increased 4%, as ongoing investment spending and business growth were partially offset by efficiency savings.
Provisions increased 30%, primarily driven by a higher net loan loss reserve build (increase of $51 million) and higher net credit losses (10%), largely reflecting volume growth and seasonality.
For additional information on Latin America GCB 's retail banking, including commercial banking, and its Citi-branded
cards portfolios, see "Credit Risk-Consumer Credit" below.
2017 YTD vs. 2016 YTD
Year-to-date, Latin America GCB has experienced similar trends to those described above. Net income decreased 6%, driven by the same factors described above.
Revenues increased 6%, primarily due to higher revenues in retail banking, partially offset by lower revenues in cards. Retail banking revenues increased 10%, driven by the same factors described above as well as the impact of business divestitures. Cards revenues decreased 3%, driven by the same factors described above.
Expenses increased 2%, as ongoing investment spending was partially offset by efficiency savings.
Provisions increased 15% largely driven by the same factors described above.
18
ASIA GCB
Asia GCB provides traditional retail banking, including commercial banking, and its Citi-branded card products to retail customers and small to mid-size businesses, as applicable. During the second quarter of 2017, Citi's most significant revenues in the region were from Hong Kong, Singapore, Korea, Australia, India, Taiwan, Indonesia, Philippines, Thailand and Malaysia. Included within Asia GCB, traditional retail banking and Citi-branded card products are also provided to retail customers in certain EMEA countries, primarily in Poland, Russia and the United Arab Emirates.
At June 30, 2017 , on a combined basis, the businesses had 379 retail branches, approximately 16.3 million retail banking customer accounts, $66.8 billion in retail banking loans and $95.4 billion in deposits. In addition, the businesses had approximately 16.7 million Citi-branded card accounts with $18.8 billion in outstanding loan balances.
| Second Quarter |
| Six Months | % Change | ||||||||||||
In millions of dollars, except as otherwise noted (1) | 2017 | 2016 | % Change | 2017 | 2016 | |||||||||||
Net interest revenue | $ | 1,149 | | $ | 1,116 | | 3 | % | $ | 2,254 | | $ | 2,217 | | 2 | % |
Non-interest revenue | 652 | | 613 | | 6 | | 1,269 | | 1,167 | | 9 | | ||||
Total revenues, net of interest expense | $ | 1,801 | | $ | 1,729 | | 4 | % | $ | 3,523 | | $ | 3,384 | | 4 | % |
Total operating expenses | $ | 1,185 | | $ | 1,146 | | 3 | % | $ | 2,365 | | $ | 2,329 | | 2 | % |
Net credit losses | $ | 157 | | $ | 160 | | (2 | )% | $ | 317 | | $ | 320 | | (1 | )% |
Credit reserve build (release) | (26 | ) | (24 | ) | (8 | ) | (13 | ) | (35 | ) | 63 | | ||||
Provision (release) for unfunded lending commitments | (2 | ) | - | | NM | | (3 | ) | - | | NM | | ||||
Provisions for credit losses | $ | 129 | | $ | 136 | | (5 | )% | $ | 301 | | $ | 285 | | 6 | % |
Income from continuing operations before taxes | $ | 487 | | $ | 447 | | 9 | % | $ | 857 | | $ | 770 | | 11 | % |
Income taxes | 164 | | 150 | | 9 | | 288 | | 258 | | 12 | | ||||
Income from continuing operations | $ | 323 | | $ | 297 | | 9 | % | $ | 569 | | $ | 512 | | 11 | % |
Noncontrolling interests | 2 | | 1 | | 100 | | 2 | | 2 | | - | | ||||
Net income | $ | 321 | | $ | 296 | | 8 | % | $ | 567 | | $ | 510 | | 11 | % |
Balance Sheet data (in billions of dollars) | | | | | | |
|
| | | | |||||
Average assets | $ | 125 | | $ | 119 | | 5 | % | $ | 124 | | $ | 118 | | 5 | % |
Return on average assets | 1.03 | % | 1.00 | % | | | 0.92 | % | 0.87 | % | | | ||||
Efficiency ratio | 66 | % | 66 | % |
| 67 | % | 69 | % | | | |||||
Average deposits | $ | 94.3 | | $ | 89.4 | | 5 | % | $ | 93.5 | | $ | 88.3 | | 6 | % |
Net credit losses as a percentage of average loans | 0.74 | % | 0.76 | % | | | 0.76 | % | 0.76 | % | | | ||||
Revenue by business |
|
|
|
|
| | | |||||||||
Retail banking | $ | 1,085 | | $ | 1,076 | | 1 | % | $ | 2,148 | | $ | 2,117 | | 1 | % |
Citi-branded cards | 716 | | 653 | | 10 | | 1,375 | | 1,267 | | 9 | | ||||
Total | $ | 1,801 | | $ | 1,729 | | 4 | % | $ | 3,523 | | $ | 3,384 | | 4 | % |
Income from continuing operations by business | | | | | | |
|
| | | ||||||
Retail banking | $ | 193 | | $ | 204 | | (5 | )% | $ | 363 | | $ | 323 | | 12 | % |
Citi-branded cards | 130 | | 93 | | 40 | | 206 | | 189 | | 9 | | ||||
Total | $ | 323 | | $ | 297 | | 9 | % | $ | 569 | | $ | 512 | | 11 | % |
19
FX translation impact | | | |
|
| | | |||||||||
Total revenues-as reported | $ | 1,801 | | $ | 1,729 | | 4 | % | $ | 3,523 | | $ | 3,384 | | 4 | % |
Impact of FX translation (2) | - | | 14 | | | | - | | 34 | | | | ||||
Total revenues-ex-FX (3) | $ | 1,801 | | $ | 1,743 | | 3 | % | $ | 3,523 | | $ | 3,418 | | 3 | % |
Total operating expenses-as reported | $ | 1,185 | | $ | 1,146 | | 3 | % | $ | 2,365 | | $ | 2,329 | | 2 | % |
Impact of FX translation (2) | - | | 9 | | | | - | | 23 | | | | ||||
Total operating expenses-ex-FX (3) | $ | 1,185 | | $ | 1,155 | | 3 | % | $ | 2,365 | | $ | 2,352 | | 1 | % |
Provisions for loan losses-as reported | $ | 129 | | $ | 136 | | (5 | )% | $ | 301 | | $ | 285 | | 6 | % |
Impact of FX translation (2) | - | | 1 | | | | - | | 2 | | | | ||||
Provisions for loan losses-ex-FX (3) | $ | 129 | | $ | 137 | | (6 | )% | $ | 301 | | $ | 287 | | 5 | % |
Net income-as reported | $ | 321 | | $ | 296 | | 8 | % | $ | 567 | | $ | 510 | | 11 | % |
Impact of FX translation (2) | - | | 3 | | | | - | | 7 | | | | ||||
Net income-ex-FX (3) | $ | 321 | | $ | 299 | | 7 | % | $ | 567 | | $ | 517 | | 10 | % |
(1) | Asia GCB includes the results of operations of GCB activities in certain EMEA countries for all periods presented. |
(2) | Reflects the impact of FX translation into U.S. dollars at the second quarter of 2017 and year-to-date 2017 average exchange rates for all periods presented. |
(3) | Presentation of this metric excluding FX translation is a non-GAAP financial measure. |
The discussion of the results of operations for Asia GCB below excludes the impact of FX translation for all periods presented. Presentations of the results of operations, excluding the impact of FX translation, are non-GAAP financial measures. For a reconciliation of certain of these metrics to the reported results, see the table above.
2Q17 vs. 2Q16
Net income increased 7%, reflecting higher revenues and lower cost of credit, partially offset by higher expenses.
Revenues increased 3%, driven by improvement in cards and wealth management revenues, partially offset by lower retail lending revenues.
Retail banking revenues were largely unchanged, primarily due to an increase in wealth management revenues, offset by the repositioning of the retail loan portfolio. Wealth management revenues increased due to improvement in investor sentiment, stronger equity markets and an increase in assets under management (9%) and investment sales (27%). These increases were offset by continued lower lending revenues (down 3%), reflecting continued lower average loans (decrease of 2%) due to the optimization of this portfolio away from lower-yielding mortgage loans to focus on growing higher-return personal loans.
Cards revenues increased 9%, reflecting 6% growth in average loans and 7% growth in purchase sales, both of which benefited from the previously disclosed portfolio acquisition in Australia in the first quarter of 2017. Cards revenues also benefitted from a modest gain from the sale of merchant acquiring businesses in certain countries.
Expenses increased 3%, resulting from volume growth and ongoing investment spending, partially offset by efficiency savings.
Provisions decreased 6%, driven by an increase in net loan loss reserve releases and lower net credit losses. Overall credit quality continued to remain stable in the region.
For additional information on Asia GCB 's retail banking, including commercial banking, and its Citi-branded cards portfolios, see "Credit Risk-Consumer Credit" below.
2017 YTD vs. 2016 YTD
Year-to-date, Asia GCB has experienced similar trends to
those described above. Net income increased 10% due to higher revenues, partially offset by higher expenses and cost of credit.
Revenues increased 3%, primarily due to an increase in cards revenues. Retail banking revenues were largely unchanged, driven by the same factors described above. Cards revenues increased 8%, driven by the same factors described above.
Expenses increased 1%, driven by business volumes.
Provisions increased 5%, primarily due to a higher net loan loss reserve build in the first quarter of 2017 related to the card portfolio acquisition in Australia, partially offset by lower net credit losses.
20
INSTITUTIONAL CLIENTS GROUP
Institutional Clients Group (ICG) includes Banking and Markets and securities services (for additional information on these businesses, see "Citigroup Segments" above). ICG provides corporate, institutional, public sector and high-net-worth clients around the world with a full range of wholesale banking products and services, including fixed income and equity sales and trading, foreign exchange, prime brokerage, derivative services, equity and fixed income research, corporate lending, investment banking and advisory services, private banking, cash management, trade finance and securities services. ICG transacts with clients in both cash instruments and derivatives, including fixed income, foreign currency, equity and commodity products.
ICG revenue is generated primarily from fees and spreads associated with these activities. ICG earns fee income for assisting clients in clearing transactions, providing brokerage and investment banking services and other such activities. Revenue generated from these activities is recorded in Commissions and fees and Investment banking . Revenue is also generated from transaction processing and assets under custody and administration. Revenue generated from these activities is primarily recorded in Administration and other fiduciary fees . In addition, as a market maker, ICG facilitates transactions, including holding product inventory to meet client demand, and earns the differential between the price at which it buys and sells the products. These price differentials and the unrealized gains and losses on the inventory are recorded in Principal transactions (for additional information on Principal transactions revenue, see Note 6 to the Consolidated Financial Statements). Other primarily includes mark-to-market gains and losses on certain credit derivatives, gains and losses on available-for-sale (AFS) securities and other non-recurring gains and losses. Interest income earned on assets held less interest paid to customers on deposits and long- and short-term debt is recorded as Net interest revenue .
The amount and types of Markets revenues are impacted by a variety of interrelated factors, including market liquidity; changes in market variables such as interest rates, foreign exchange rates, equity prices, commodity prices and credit spreads, as well as their implied volatilities; investor confidence; and other macroeconomic conditions. Assuming all other market conditions do not change, increases in client activity levels or bid/offer spreads generally result in increases in revenues. However, changes in market conditions can significantly impact client activity levels, bid/offer spreads and the fair value of product inventory. For example, a decrease in market liquidity may increase bid/offer spreads, decrease client activity levels and widen credit spreads on product inventory positions.
ICG 's management of the Markets businesses involves daily monitoring and evaluating of the above factors at the trading desk as well as the country level. ICG does not separately track the impact on total Markets revenues of the volume of transactions, bid/offer spreads, fair value changes of product inventory positions and economic hedges because, as noted above, these components are interrelated and are not deemed useful or necessary individually to manage the Markets businesses at an aggregate level.
In the Markets businesses, client revenues are those revenues directly attributable to client transactions at the time of inception, including commissions, interest or fees earned. Client revenues do not include the results of client facilitation activities (for example, holding product inventory in anticipation of client demand) or the results of certain economic hedging activities.
ICG 's international presence is supported by trading floors in approximately 80 countries and a proprietary network in 98 countries and jurisdictions. At June 30, 2017 , ICG had approximately $1.4 trillion of assets and $624 billion of deposits, while two of its businesses-securities services and issuer services-managed approximately $16.5 trillion of assets under custody compared to $15.3 trillion at the end of the prior-year period.
21
| Second Quarter |
| Six Months | % Change | ||||||||||||
In millions of dollars, except as otherwise noted | 2017 | 2016 | % Change | 2017 | 2016 | |||||||||||
Commissions and fees | $ | 1,020 | | $ | 956 | | 7 | % | $ | 2,005 | | $ | 1,960 | | 2 | % |
Administration and other fiduciary fees | 719 | | 638 | | 13 | | 1,363 | | 1,235 | | 10 | | ||||
Investment banking | 1,180 | | 1,029 | | 15 | | 2,224 | | 1,769 | | 26 | | ||||
Principal transactions | 2,079 | | 1,912 | | 9 | | 4,747 | | 3,488 | | 36 | | ||||
Other (1) | 240 | | 46 | | NM | | 235 | | 39 | | NM | | ||||
Total non-interest revenue | $ | 5,238 | | $ | 4,581 | | 14 | % | $ | 10,574 | | $ | 8,491 | | 25 | % |
Net interest revenue (including dividends) | 3,975 | | 4,108 | | (3 | ) | 7,765 | | 8,093 | | (4 | ) | ||||
Total revenues, net of interest expense | $ | 9,213 | | $ | 8,689 | | 6 | % | $ | 18,339 | | $ | 16,584 | | 11 | % |
Total operating expenses | $ | 5,019 | | $ | 4,763 | | 5 | % | $ | 9,964 | | $ | 9,635 | | 3 | % |
Net credit losses | $ | 71 | | $ | 141 | | (50 | )% | $ | 96 | | $ | 352 | | (73 | )% |
Credit reserve build (release) | (15 | ) | (26 | ) | 42 | | (191 | ) | 82 | | NM | | ||||
Provision (release) for unfunded lending commitments | 31 | | (33 | ) | NM | | (23 | ) | 38 | | NM | | ||||
Provisions for credit losses | $ | 87 | | $ | 82 | | 6 | % | $ | (118 | ) | $ | 472 | | NM | |
Income from continuing operations before taxes | $ | 4,107 | | $ | 3,844 | | 7 | % | $ | 8,493 | | $ | 6,477 | | 31 | % |
Income taxes | 1,327 | | 1,229 | | 8 | | 2,702 | | 1,993 | | 36 | | ||||
Income from continuing operations | $ | 2,780 | | $ | 2,615 | | 6 | % | $ | 5,791 | | $ | 4,484 | | 29 | % |
Noncontrolling interests | 18 | | 17 | | 6 | | 33 | | 27 | | 22 | | ||||
Net income | $ | 2,762 | | $ | 2,598 | | 6 | % | $ | 5,758 | | $ | 4,457 | | 29 | % |
EOP assets (in billions of dollars) | $ | 1,353 | | $ | 1,303 | | 4 | % |
|
|
| |||||
Average assets (in billions of dollars) | 1,360 | | 1,300 | | 5 | | $ | 1,339 | | $ | 1,286 | | 4 | % | ||
Return on average assets | 0.81 | % | 0.80 | % | | | 0.87 | % | 0.70 | % | | | ||||
Efficiency ratio | 54 | | 55 | | | | 54 | | 58 | | | | ||||
Revenues by region |
|
| | |
|
| | | ||||||||
North America | $ | 3,568 | | $ | 3,393 | | 5 | % | $ | 7,023 | | $ | 6,373 | | 10 | % |
EMEA | 2,837 | | 2,577 | | 10 | | 5,644 | | 4,744 | | 19 | | ||||
Latin America | 1,042 | | 1,022 | | 2 | | 2,169 | | 1,984 | | 9 | | ||||
Asia | 1,766 | | 1,697 | | 4 | | 3,503 | | 3,483 | | 1 | | ||||
Total | $ | 9,213 | | $ | 8,689 | | 6 | % | $ | 18,339 | | $ | 16,584 | | 11 | % |
Income from continuing operations by region |
|
| | |
|
| | | | |||||||
North America | $ | 1,112 | | $ | 1,005 | | 11 | % | $ | 2,212 | | $ | 1,551 | | 43 | % |
EMEA | 779 | | 695 | | 12 | | 1,634 | | 1,069 | | 53 | | ||||
Latin America | 333 | | 392 | | (15 | ) | 808 | | 722 | | 12 | | ||||
Asia | 556 | | 523 | | 6 | | 1,137 | | 1,142 | | - | | ||||
Total | $ | 2,780 | | $ | 2,615 | | 6 | % | $ | 5,791 | | $ | 4,484 | | 29 | % |
Average loans by region (in billions of dollars) |
|
| | |
|
| | | | |||||||
North America | $ | 146 | | $ | 138 | | 6 | % | $ | 143 | | $ | 135 | | 6 | % |
EMEA | 67 | | 67 | | - | | 66 | | 65 | | 2 | | ||||
Latin America | 37 | | 38 | | (3 | ) | 37 | | 39 | | (5 | ) | ||||
Asia | 62 | | 61 | | 2 | | 61 | | 61 | | - | | ||||
Total | $ | 312 | | $ | 304 | | 3 | % | $ | 307 | | $ | 300 | | 2 | % |
EOP deposits by business (in billions of dollars) |
|
|
|
|
| | | |||||||||
Treasury and trade solutions | $ | 421 | | $ | 407 | | 3 | % |
|
| | | ||||
All other ICG businesses | 203 | | 202 | | - | | | | | | | | ||||
Total | $ | 624 | | $ | 609 | | 2 | % | | | | | | | ||
(1) | First quarter of 2016 includes a previously disclosed charge of approximately $180 million, primarily reflecting the write-down of Citi's net investment in Venezuela as a result of changes in the exchange rate during the quarter. |
NM Not meaningful
22
ICG Revenue Details-Excluding Gain (Loss) on Loan Hedges
| Second Quarter |
| Six Months | % Change | ||||||||||||
In millions of dollars | 2017 | 2016 | % Change | 2017 | 2016 | |||||||||||
Investment banking revenue details |
|
|
|
|
|
| ||||||||||
Advisory | $ | 314 | | $ | 238 | | 32 | % | $ | 560 | | $ | 465 | | 20 | % |
Equity underwriting | 295 | | 174 | | 70 | | 530 | | 292 | | 82 | | ||||
Debt underwriting | 877 | | 803 | | 9 | | 1,610 | | 1,331 | | 21 | | ||||
Total investment banking | $ | 1,486 | | $ | 1,215 | | 22 | % | $ | 2,700 | | $ | 2,088 | | 29 | % |
Treasury and trade solutions | 2,065 | | 1,999 | | 3 | | 4,140 | | 3,902 | | 6 | | ||||
Corporate lending-excluding (loss) on loan hedges (1) | 477 | | 383 | | 25 | | 911 | | 831 | | 10 | | ||||
Private bank | 788 | | 674 | | 17 | | 1,532 | | 1,358 | | 13 | | ||||
Total banking revenues (ex-gain/(loss) on loan hedges) | $ | 4,816 | | $ | 4,271 | | 13 | % | $ | 9,283 | | $ | 8,179 | | 13 | % |
Corporate lending-gain/(loss) on loan hedges (1) | $ | 9 | | $ | (203 | ) | NM | | $ | (106 | ) | $ | (269 | ) | 61 | % |
Total banking revenues (including gain/(loss) on loan hedges) | $ | 4,825 | | $ | 4,068 | | 19 | % | $ | 9,177 | | $ | 7,910 | | 16 | % |
Fixed income markets | $ | 3,215 | | $ | 3,432 | | (6 | )% | $ | 6,837 | | $ | 6,483 | | 5 | % |
Equity markets | 691 | | 776 | | (11 | ) | 1,460 | | 1,473 | | (1 | ) | ||||
Securities services | 584 | | 529 | | 10 | | 1,127 | | 1,090 | | 3 | | ||||
Other (2) | (102 | ) | (116 | ) | 12 | | (262 | ) | (372 | ) | 30 | | ||||
Total markets and securities services revenues | $ | 4,388 | | $ | 4,621 | | (5 | )% | $ | 9,162 | | $ | 8,674 | | 6 | % |
Total revenues, net of interest expense | $ | 9,213 | | $ | 8,689 | | 6 | % | $ | 18,339 | | $ | 16,584 | | 11 | % |
Commissions and fees | $ | 154 | | $ | 113 | | 36 | % | $ | 294 | | $ | 237 | | 24 | % |
Principal transactions (3) | 1,890 | | 1,765 | | 7 | | 4,208 | | 3,109 | | 35 | | ||||
Other | 181 | | 213 | | (15 | ) | 330 | | 429 | | (23 | ) | ||||
Total non-interest revenue | $ | 2,225 | | $ | 2,091 | | 6 | % | $ | 4,832 | | $ | 3,775 | | 28 | % |
Net interest revenue | 990 | | 1,341 | | (26 | ) | 2,005 | | 2,708 | | (26 | ) | ||||
Total fixed income markets | $ | 3,215 | | $ | 3,432 | | (6 | )% | $ | 6,837 | | $ | 6,483 | | 5 | % |
Rates and currencies | $ | 2,227 | | $ | 2,461 | | (10 | )% | $ | 4,730 | | $ | 4,697 | | 1 | % |
Spread products / other fixed income | 988 | | 971 | | 2 | | 2,107 | | 1,786 | | 18 | | ||||
Total fixed income markets | $ | 3,215 | | $ | 3,432 | | (6 | )% | $ | 6,837 | | $ | 6,483 | | 5 | % |
Commissions and fees | $ | 313 | | $ | 319 | | (2 | )% | $ | 629 | | $ | 676 | | (7 | )% |
Principal transactions (3) | (25 | ) | (48 | ) | 48 | | 141 | | 3 | | NM | | ||||
Other | (7 | ) | 127 | | NM | | 1 | | 129 | | (99 | ) | ||||
Total non-interest revenue | $ | 281 | | $ | 398 | | (29 | )% | $ | 771 | | $ | 808 | | (5 | )% |
Net interest revenue | 410 | | 378 | | 8 | | 689 | | 665 | | 4 | | ||||
Total equity markets | $ | 691 | | $ | 776 | | (11 | )% | $ | 1,460 | | $ | 1,473 | | (1 | )% |
(1) | Hedges on accrual loans reflect the mark-to-market on credit derivatives used to economically hedge the corporate loan accrual portfolio. The fixed premium costs of these hedges are netted against the corporate lending revenues to reflect the cost of credit protection. Citigroup's results of operations excluding the impact of gain/(loss) on loan hedges are non-GAAP financial measures. |
(2) | First quarter of 2016 includes the previously disclosed charge of approximately $180 million, primarily reflecting the write-down of Citi's net investment in Venezuela as a result of changes in the exchange rate during the quarter. |
(3) Excludes principal transactions revenues of ICG businesses other than Markets , primarily treasury and trade solutions and the private bank.
NM Not meaningful
23
2Q17 vs. 2Q16
Net income increased 6%, primarily driven by higher revenues, partially offset by higher operating expenses.
• | Revenues increased 6%, reflecting higher revenues in Banking (increase of 19%; increase of 13% excluding gains and losses on hedges on accrual loans), offset by lower revenues in Markets and securities services (decrease of 5%), primarily due to fixed income and equity markets. Banking revenues were driven by strong performance in equity capital markets and M&A advisory as well as improved performance in corporate lending and the private bank. Citi expects revenues in ICG , particularly in its Markets and securities services businesses, will likely continue to reflect the overall market environment, including normal seasonal trends during the remainder of 2017, although ICG revenues may also be impacted by uncertainty around interest rates and tax reform legislation along with continued low market volatility. |
Within Banking :
• | Investment banking revenues increased 22%, reflecting strength across all products and regions, particularly in North America and EMEA , despite a slight decline in overall market wallet from the prior-year period. Debt underwriting revenues increased 9%, reflecting continued momentum driven by wallet share gains. Equity underwriting revenues increased 70%, reflecting an increase in wallet share and higher overall market activity. Advisory revenues increased 32%, largely reflecting an increase in wallet share. |
• | Treasury and trade solutions revenues increased 3%. Excluding the impact of FX translation, revenues increased 4%, reflecting strength in North America , Asia and EMEA . The increase in revenues was driven by fee growth reflecting continued volume growth as well as improved deposit spreads, partially offset by lower trade revenues. End-of-period deposit balances increased 3% (4% excluding the impact of FX translation), driven by North America , while average trade loans increased 4% (3% excluding the impact of FX translation). |
• | Corporate lending revenues increased $306 million to $486 million. Excluding the mark-to-market impact of loan hedges, revenues increased 25%, driven by North America . The increase in revenues was driven by lower hedging costs and the absence of a prior-period adjustment to the residual value of a lease financing transaction, while average loans declined modestly (1%). |
• | Private bank revenues increased 17%, reflecting strength across all products and regions. The increase in revenues was driven by higher loan and deposit growth, improved deposit spreads, higher managed investments revenues and increased capital markets activity. |
Within Markets and securities services :
• | Fixed income markets revenues decreased 6%, primarily due to lower revenues in North America , Asia and Latin America , as client activity was impacted by low volatility in the current quarter. Net interest revenues were lower (down 26%), largely due to a change in the mix of trading positions in support of client activity, which was partially offset by higher principal transactions revenues (up 7%). Rates and currencies revenues decreased 10%, reflecting weaker performance across all regions. The decrease was driven mainly by lower G10 currencies revenues due to the low volatility in the current quarter and higher revenues in the prior-year period following the vote in the U.K. in favor of its withdrawal from the European Union. G10 rates and local markets revenues were broadly stable. Spread products and other fixed income revenues increased 2%, primarily driven by higher client activity in securitized products in North America and EMEA , as higher commodities and other fixed income revenues were offset by lower credit products and municipals revenues. |
• | Equity markets revenues decreased by 11%, driven by the absence of episodic activity in the prior-year period, partially offset by strength in investor client activity, particularly in EMEA and Asia . Equity derivatives revenues declined from the prior-year period due to the absence of episodic activity and the impact of low volatility in the current quarter. This was partially offset by higher prime finance and delta one revenues due to continued growth in client balances, as well as higher cash equities revenues. Commissions revenues declined slightly, reflecting the ongoing shift to electronic trading by clients across the industry. |
• | Securities services revenues increased by 10%. Excluding the impact of FX translation, revenues increased 12%, reflecting strength in North America , Asia and Latin America . The increase was driven by growth in deposit balances and higher net interest revenues that benefited from the rising interest rate environment. Fee revenues continued to increase, driven by growth in assets under custody and the increased client volumes. |
Expenses increased 5% as higher incentive compensation, investments and volume-related expenses were partially offset by a benefit from FX translation and efficiency savings.
Provisions increased 6% to $87 million, reflecting a net loan loss reserve build of $16 million (compared to a $59 million release in the prior-year period, largely related to energy and energy-related exposures) and lower net credit losses of $71 million ($141 million in the prior-year period). The decline in net credit losses reflected improvement in the energy sector.
24
2017 YTD vs. 2016 YTD
Net income increased 29%, primarily driven by higher revenues and lower credit costs, partially offset by higher expenses.
• | Revenues increased 11%, reflecting higher revenues in Markets and securities services (increase of 6%) and higher revenues in Banking (increase of 16%; increase of 13% excluding the losses on hedges on accrual loans). |
Within Banking :
• | Investment banking revenues increased 29%, largely reflecting year-over-year gains in wallet share and an improvement from the industry-wide slowdown in activity levels during the first half of 2016. Advisory revenues increased 20%, reflecting a strong performance in the first half of 2017. Equity underwriting revenues increased 82%, while debt underwriting revenues increased 21%, both primarily due to increased wallet share, as well as higher market activity. |
• | Treasury and trade solutions revenues increased 6% primarily driven by continued growth in deposit and loan volumes, improved spreads and strong fee growth across most cash products. |
• | Corporate lending revenues increased 43%. Excluding the impact of losses on hedges on accrual loans, revenues increased 10%, driven by lower hedging costs in the current period and the absence of a prior-period adjustment to the residual value of a lease financing transaction. |
• | Private bank revenues increased 13%, reflecting increasing deposit spreads and volume growth, growth in loans and higher managed investments revenues. |
Within Markets and securities services :
• | Fixed income markets revenues increased by 5%, due to higher revenues in North America and EMEA . Rates and currencies revenues increased 1% due to higher rates revenues in EMEA , partially offset by a decrease in G10 currencies revenues reflecting the low volatility and lower client activity in all regions. Spread products and other fixed income revenues increased 18%, primarily due to a recovery from the challenging trading environment in the prior-year period, particularly in securitized products. |
• | Equity markets revenues declined 1%, as continued growth in client balances and higher client activity, particularly in EMEA and Asia , were more than offset by the absence of episodic activity in the prior-year period in North America . Equity derivatives revenues declined, driven by the same factors described above. Cash equities revenues decreased primarily due to lower commissions in the first quarter of 2017. These declines were partially offset by higher revenues due to the continued growth in client balances in prime finance and delta one. |
• | Securities services revenues increased 3%. Excluding the impact of prior-period divestitures, revenues grew 10%, primarily driven by higher deposit balances and higher net interest revenue, primarily in North America , Asia and |
Latin America , and higher fee revenue from growth in assets under custody and client volumes.
Expenses increased 3% from the prior-year period, driven by the same factors described above, partially offset by lower repositioning costs.
Provisions decreased $590 million, primarily reflecting a decline in net credit losses from $352 million in the prior-year period to $96 million and a net loan loss reserve release of $214 million ($120 million build in the period-year period). This lower cost of credit was driven largely by improvement in the energy sector.
25
CORPORATE/OTHER
Corporate/Other includes certain unallocated costs of global staff functions (including finance, risk, human resources, legal and compliance), other corporate expenses and unallocated global operations and technology expenses, Corporate Treasury, certain North America and international legacy consumer loan portfolios, other legacy assets and discontinued operations (for additional information on Corporate/Other , see "Citigroup Segments" above). At June 30, 2017 , Corporate/Other had $92 billion in assets, a decrease of 21% year-over-year and 11% from December 31, 2016.
| Second Quarter |
| Six Months | % Change | ||||||||||||
In millions of dollars | 2017 | 2016 | % Change | 2017 | 2016 | |||||||||||
Net interest revenue | $ | 491 | | $ | 820 | | (40 | )% | $ | 1,036 | | $ | 1,710 | | (39 | )% |
Non-interest revenue | 162 | | 365 | | (56 | ) | 794 | | 1,421 | | (44 | ) | ||||
Total revenues, net of interest expense | $ | 653 | | $ | 1,185 | | (45 | )% | $ | 1,830 | | $ | 3,131 | | (42 | )% |
Total operating expenses | $ | 990 | | $ | 1,309 | | (24 | )% | $ | 2,107 | | $ | 2,559 | | (18 | )% |
Net credit losses | $ | 24 | | $ | 101 | | (76 | )% | $ | 105 | | $ | 243 | | (57 | )% |
Credit reserve build (release) | (154 | ) | (223 | ) | 31 | | (189 | ) | (254 | ) | 26 | | ||||
Provision (release) for unfunded lending commitments | (2 | ) | (5 | ) | 60 | | 3 | | (6 | ) | NM | | ||||
Provision for benefits and claims | - | | 29 | | (100 | ) | 1 | | 89 | | (99 | ) | ||||
Provisions for credit losses and for benefits and claims | $ | (132 | ) | (98 | ) | (35 | )% | $ | (80 | ) | 72 | | NM | | ||
Income (loss) from continuing operations before taxes | $ | (205 | ) | $ | (26 | ) | NM | | $ | (197 | ) | $ | 500 | | NM | |
Income taxes (benefits) | (179 | ) | (173 | ) | (3 | )% | (275 | ) | (92 | ) | NM | | ||||
Income (loss) from continuing operations | $ | (26 | ) | $ | 147 | | NM | | $ | 78 | | $ | 592 | | (87 | )% |
Income (loss) from discontinued operations, net of taxes | 21 | | (23 | ) | NM | | 3 | | (25 | ) | NM | | ||||
Net income (loss) before attribution of noncontrolling interests | $ | (5 | ) | $ | 124 | | NM | | $ | 81 | | $ | 567 | | (86 | )% |
Noncontrolling interests | 10 | | 8 | | 25 | % | 4 | | 1 | | NM | | ||||
Net income (loss) | $ | (15 | ) | $ | 116 | | NM | | $ | 77 | | $ | 566 | | (86 | )% |
2Q17 vs. 2Q16
The net loss was $15 million, compared to net income of $116 million in the prior-year period, due to lower revenues, partially offset by lower expenses and lower cost of credit.
Revenues decreased 45%, driven by legacy asset run-off and divestiture activity, as well as the absence of gains related to debt buybacks in the prior-year period.
Expenses decreased 24%, primarily driven by the wind-down of legacy assets.
Provisions decreased 35% to a net benefit of $132 million, primarily due to lower net credit losses, partially offset by a lower net loan loss reserve release. Net credit losses declined 76% to $24 million, reflecting the impact of ongoing divestiture activity. The provision for benefits and claims declined by $29 million to $0, reflecting continued legacy divestitures. The net reserve release declined 32%, reflecting the continued wind-down of legacy activities, primarily in the North America mortgage portfolio. Citi expects that cost of credit in Corporate/Other should be moderately higher in the near term due to normalization of credit costs.
2017 YTD vs. 2016 YTD
Year-to-date , Corporate/Other has experienced similar trends to those described above. Net income declined 86% to $77 million, reflecting lower revenues, partially offset by lower expenses and lower cost of credit.
Revenues decreased 42%, primarily driven by the same factors described above and lower revenue from treasury hedging activity. Revenues in the current period included approximately $750 million in gains on asset sales, which more than offset a roughly $300 million charge related to the exit of Citi's U.S. mortgage servicing operations.
Expenses decreased 18%, driven by the same factors described above, partially offset by approximately $100 million in episodic expenses primarily related to the exit of the U.S. mortgage servicing operations.
Provisions decreased by $152 million, driven by the same factors described above. Net credit losses declined 57% to $105 million, reflecting the impact of ongoing divestiture activity as well as continued wind-down in the legacy North America mortgage portfolio. The provision for benefits and claims declined by $88 million, reflecting continued legacy divestitures. The net reserve release declined 28%, driven by the same factors described above.
26
OFF-BALANCE SHEET ARRANGEMENTS
The table below shows the location of a discussion of Citi's various off-balance sheet arrangements in this Form 10-Q. For additional information on Citi's off-balance sheet arrangements, see "Off-Balance Sheet Arrangements" and Notes 1, 21 and 26 to the Consolidated Financial Statements in Citigroup's 2016 Annual Report on Form 10-K.
Types of Off-Balance Sheet Arrangements Disclosures in this Form 10-Q
Variable interests and other obligations, including contingent obligations, arising from variable interests in nonconsolidated VIEs | See Note 18 to the Consolidated Financial Statements. |
Letters of credit, and lending and other commitments | See Note 22 to the Consolidated Financial Statements. |
Guarantees | See Note 22 to the Consolidated Financial Statements. |
27
CAPITAL RESOURCES
Overview
Capital is used principally to support assets in Citi's businesses and to absorb credit, market and operational losses. Citi primarily generates capital through earnings from its operating businesses. Citi may augment its capital through issuances of common stock, noncumulative perpetual preferred stock and equity issued through awards under employee benefit plans, among other issuances.
Further, Citi's capital levels may also be affected by changes in accounting and regulatory standards, as well as U.S. corporate tax laws and the impact of future events on Citi's business results, such as changes in interest and foreign exchange rates, as well as business and asset dispositions.
During the second quarter of 2017 , Citi returned a total of approximately $2.2 billion of capital to common shareholders in the form of share repurchases (approximately 29 million common shares) and dividends.
Capital Management
Citi's capital management framework is designed to ensure that Citigroup and its principal subsidiaries maintain sufficient capital consistent with each entity's respective risk profile, management targets and all applicable regulatory standards and guidelines. For additional information regarding Citi's capital management, see "Capital Resources-Capital Management" in Citigroup's 2016 Annual Report on Form 10-K.
Capital Planning and Stress Testing
Citi is subject to an annual assessment by the Federal Reserve Board as to whether Citigroup has effective capital planning processes as well as sufficient regulatory capital to absorb losses during stressful economic and financial conditions, while also meeting obligations to creditors and counterparties and continuing to serve as a credit intermediary. This annual assessment includes two related programs: the Comprehensive Capital Analysis and Review (CCAR) and Dodd-Frank Act Stress Testing (DFAST). For additional information regarding Citi's capital planning and stress testing, including potential changes in Citi's regulatory capital requirements and future CCAR processes, see "Forward-Looking Statements" below and "Capital Resources-Current Regulatory Capital Standards-Capital Planning and Stress Testing" and "Risk Factors-Strategic Risks" in Citigroup's 2016 Annual Report on Form 10-K.
In June 2017, the Federal Reserve Board expressed no objection to Citi's capital plan, including requested capital actions, in conjunction with the 2017 CCAR. For additional information, see "Equity Security Repurchases" and "Dividends" below.
Current Regulatory Capital Standards
Citi is subject to regulatory capital standards issued by the Federal Reserve Board which constitute the U.S. Basel III rules. These rules establish an integrated capital adequacy framework, encompassing both risk-based capital ratios and leverage ratios. For additional information regarding the risk-based capital ratios, Tier 1 Leverage ratio and Supplementary Leverage ratio, see "Capital Resources-Current Regulatory Capital Standards" in Citigroup's 2016 Annual Report on Form 10-K.
GSIB Surcharge
The Federal Reserve Board also adopted a rule that imposes a risk-based capital surcharge upon U.S. bank holding companies that are identified as global systemically important bank holding companies (GSIBs), including Citi. GSIB surcharges under the rule initially range from 1% to 4.5% of total risk-weighted assets. Citi's initial GSIB surcharge effective January 1, 2016 was 3.5%. However, ongoing efforts in addressing quantitative measures of systemic importance have resulted in a reduction of Citi's GSIB surcharge to 3%, effective January 1, 2017. For additional information regarding the identification of a GSIB and the methodology for annually determining the GSIB surcharge, see "Capital Resources-Current Regulatory Capital Standards-GSIB Surcharge" in Citigroup's 2016 Annual Report on Form 10-K.
Transition Provisions
The U.S. Basel III rules contain several differing, largely multi-year transition provisions (i.e., "phase-ins" and "phase-outs"). Citi considers all of these transition provisions as being fully implemented on January 1, 2019 (full implementation). For additional information regarding the transition provisions under the U.S. Basel III rules, including with respect to the GSIB surcharge, see "Capital Resources-Current Regulatory Capital Standards-Transition Provisions" in Citigroup's 2016 Annual Report on Form 10-K.
28
Citigroup's Capital Resources Under Current Regulatory Standards
Citi is required to maintain stated minimum Common Equity Tier 1 Capital, Tier 1 Capital and Total Capital ratios of 4.5%, 6% and 8%, respectively.
Citi's effective minimum Common Equity Tier 1 Capital, Tier 1 Capital and Total Capital ratios during 2017, inclusive of the 50% phase-in of both the 2.5% Capital Conservation Buffer and the 3% GSIB surcharge (all of which is to be composed of Common Equity Tier 1 Capital), are 7.25%, 8.75% and 10.75%, respectively. Citi's effective minimum Common Equity Tier 1 Capital, Tier 1 Capital and Total Capital ratios during 2016, inclusive of the 25% phase-in of both the 2.5% Capital Conservation Buffer and the 3.5% GSIB surcharge (all of which is to be
composed of Common Equity Tier 1 Capital), were 6%, 7.5% and 9.5%, respectively.
Furthermore, to be "well capitalized" under current federal bank regulatory agency definitions, a bank holding
company must have a Tier 1 Capital ratio of at least 6%, a Total Capital ratio of at least 10%, and not be subject to a Federal Reserve Board directive to maintain higher capital levels.
The following tables set forth the capital tiers, total risk-weighted assets, risk-based capital ratios, quarterly adjusted average total assets, Total Leverage Exposure and leverage ratios under current regulatory standards (reflecting Basel III Transition Arrangements) for Citi as of June 30, 2017 and December 31, 2016 .
Citigroup Capital Components and Ratios Under Current Regulatory Standards (Basel III Transition Arrangements)
| June 30, 2017 | December 31, 2016 | ||||||||||
In millions of dollars, except ratios | Advanced Approaches | Standardized Approach | Advanced Approaches | Standardized Approach | ||||||||
Common Equity Tier 1 Capital | $ | 163,786 | | $ | 163,786 | | $ | 167,378 | | $ | 167,378 | |
Tier 1 Capital | 179,544 | | 179,544 | | 178,387 | | 178,387 | | ||||
Total Capital (Tier 1 Capital + Tier 2 Capital) | 204,790 | | 216,927 | | 202,146 | | 214,938 | | ||||
Total Risk-Weighted Assets | 1,157,670 | | 1,163,894 | | 1,166,764 | | 1,126,314 | | ||||
Credit Risk (1) | $ | 755,530 | | $ | 1,086,259 | | $ | 773,483 | | $ | 1,061,786 | |
Market Risk | 77,140 | | 77,635 | | 64,006 | | 64,528 | | ||||
Operational Risk | 325,000 | | - | | 329,275 | | - | | ||||
Common Equity Tier 1 Capital ratio (2) | 14.15 | % | 14.07 | % | 14.35 | % | 14.86 | % | ||||
Tier 1 Capital ratio (2) | 15.51 | | 15.43 | | 15.29 | | 15.84 | | ||||
Total Capital ratio (2) | 17.69 | | 18.64 | | 17.33 | | 19.08 | | ||||
In millions of dollars, except ratios | June 30, 2017 | December 31, 2016 | ||||||
Quarterly Adjusted Average Total Assets (3) |
| $ | 1,815,196 | |
| $ | 1,768,415 | |
Total Leverage Exposure (4) |
| 2,421,852 | |
| 2,351,883 | | ||
Tier 1 Leverage ratio |
| 9.89 | % |
| 10.09 | % | ||
Supplementary Leverage ratio |
| 7.41 | |
| 7.58 | | ||
(1) | Under the U.S. Basel III rules, credit risk-weighted assets during the transition period reflect the effects of transitional arrangements related to regulatory capital adjustments and deductions and, as a result, will differ from credit risk-weighted assets derived under full implementation of the rules. |
(2) | As of June 30, 2017 , Citi's reportable Common Equity Tier 1 Capital and Tier 1 Capital ratios were the lower derived under the Basel III Standardized Approach, whereas the reportable Total Capital ratio was the lower derived under the Basel III Advanced Approaches framework. As of December 31, 2016, Citi's reportable Common Equity Tier 1 Capital, Tier 1 Capital and Total Capital ratios were the lower derived under the Basel III Advanced Approaches framework. |
(3) | Tier 1 Leverage ratio denominator. |
(4) | Supplementary Leverage ratio denominator. |
As indicated in the table above, Citigroup's risk-based capital ratios at June 30, 2017 were in excess of the stated and effective minimum requirements under the U.S. Basel III rules. In addition, Citi was also "well capitalized" under current federal bank regulatory agency definitions as of June 30, 2017 .
29
In millions of dollars | June 30, | December 31, 2016 | ||||
Common Equity Tier 1 Capital |
|
| ||||
Citigroup common stockholders' equity (1) | $ | 210,950 | | $ | 206,051 | |
Add: Qualifying noncontrolling interests | 212 | | 259 | | ||
Regulatory Capital Adjustments and Deductions: |
|
| ||||
Less: Net unrealized losses on securities available-for-sale (AFS), net of tax (2)(3) | (20 | ) | (320 | ) | ||
Less: Defined benefit plans liability adjustment, net of tax (3) | (1,062 | ) | (2,066 | ) | ||
Less: Accumulated net unrealized losses on cash flow hedges, net of tax (4) | (445 | ) | (560 | ) | ||
Less: Cumulative unrealized net loss related to changes in fair value of financial liabilities attributable to own creditworthiness, net of tax (3)(5) | (233 | ) | (37 | ) | ||
Less: Intangible assets: |
|
| ||||
Goodwill, net of related deferred tax liabilities (DTLs) (6) | 21,589 | | 20,858 | | ||
Identifiable intangible assets other than mortgage servicing rights (MSRs), net of related DTLs (3) | 3,670 | | 2,926 | | ||
Less: Defined benefit pension plan net assets (3) | 637 | | 514 | | ||
Less: Deferred tax assets (DTAs) arising from net operating loss, foreign tax credit and general business credit carry-forwards (3)(7) | 16,666 | | 12,802 | | ||
Less: Excess over 10%/15% limitations for other DTAs, certain common stock investments, and MSRs (3)(7)(8) | 6,574 | | 4,815 | | ||
Total Common Equity Tier 1 Capital (Standardized Approach and Advanced Approaches) | $ | 163,786 | | $ | 167,378 | |
Additional Tier 1 Capital |
|
| ||||
Qualifying noncumulative perpetual preferred stock (1) | $ | 19,069 | | $ | 19,069 | |
Qualifying trust preferred securities (9) | 1,374 | | 1,371 | | ||
Qualifying noncontrolling interests | 134 | | 17 | | ||
Regulatory Capital Adjustment and Deductions: |
|
| ||||
Less: Cumulative unrealized net loss related to changes in fair value of financial liabilities attributable to own creditworthiness, net of tax (3)(5) | (58 | ) | (24 | ) | ||
Less: Defined benefit pension plan net assets (3) | 159 | | 343 | | ||
Less: DTAs arising from net operating loss, foreign tax credit and general business credit carry-forwards (3)(7) | 4,166 | | 8,535 | | ||
Less: Permitted ownership interests in covered funds (10) | 495 | | 533 | | ||
Less: Minimum regulatory capital requirements of insurance underwriting subsidiaries (11) | 57 | | 61 | | ||
Total Additional Tier 1 Capital (Standardized Approach and Advanced Approaches) | $ | 15,758 | | $ | 11,009 | |
Total Tier 1 Capital (Common Equity Tier 1 Capital + Additional Tier 1 Capital) (Standardized Approach and Advanced Approaches) | $ | 179,544 | | $ | 178,387 | |
Tier 2 Capital |
|
| ||||
Qualifying subordinated debt | $ | 23,642 | | $ | 22,818 | |
Qualifying trust preferred securities (12) | 324 | | 317 | | ||
Qualifying noncontrolling interests | 39 | | 22 | | ||
Eligible allowance for credit losses (13) | 13,433 | | 13,452 | | ||
Regulatory Capital Adjustment and Deduction: |
|
| ||||
Add: Unrealized gains on AFS equity exposures includable in Tier 2 Capital | 2 | | 3 | | ||
Less: Minimum regulatory capital requirements of insurance underwriting subsidiaries (11) | 57 | | 61 | | ||
Total Tier 2 Capital (Standardized Approach) | $ | 37,383 | | $ | 36,551 | |
Total Capital (Tier 1 Capital + Tier 2 Capital) (Standardized Approach) | $ | 216,927 | | $ | 214,938 | |
Adjustment for excess of eligible credit reserves over expected credit losses (13) | $ | (12,137 | ) | $ | (12,792 | ) |
Total Tier 2 Capital (Advanced Approaches) | $ | 25,246 | | $ | 23,759 | |
Total Capital (Tier 1 Capital + Tier 2 Capital) (Advanced Approaches) | $ | 204,790 | | $ | 202,146 | |
Footnotes are presented on the following page.
30
(1) | Issuance costs of $184 million related to noncumulative perpetual preferred stock outstanding at June 30, 2017 and December 31, 2016 are excluded from common stockholders' equity and netted against such preferred stock in accordance with Federal Reserve Board regulatory reporting requirements, which differ from those under U.S. generally accepted accounting principles (GAAP). |
(2) | In addition, includes the net amount of unamortized loss on held-to-maturity (HTM) securities. This amount relates to securities that were previously transferred from AFS to HTM, and non-credit-related factors such as changes in interest rates and liquidity spreads for HTM securities with other-than-temporary impairment. |
(3) | The transition arrangements for significant regulatory capital adjustments and deductions impacting Common Equity Tier 1 Capital and Additional Tier 1 Capital are set forth in the chart entitled "Basel III Transition Arrangements: Significant Regulatory Capital Adjustments and Deductions," as presented in Citigroup's 2016 Annual Report on Form 10-K. |
(4) | Common Equity Tier 1 Capital is adjusted for accumulated net unrealized gains (losses) on cash flow hedges included in Accumulated other comprehensive income (loss) (AOCI) that relate to the hedging of items not recognized at fair value on the balance sheet. |
(5) | The cumulative impact of changes in Citigroup's own creditworthiness in valuing liabilities for which the fair value option has been elected, and own-credit valuation adjustments on derivatives, are excluded from Common Equity Tier 1 Capital and Additional Tier 1 Capital, in accordance with the U.S. Basel III rules. |
(6) | Includes goodwill "embedded" in the valuation of significant common stock investments in unconsolidated financial institutions. |
(7) | Of Citi's approximately $45.8 billion of net DTAs at June 30, 2017 , approximately $19.8 billion were includable in regulatory capital pursuant to the U.S. Basel III rules, while approximately $26.0 billion were excluded. Excluded from Citi's regulatory capital at June 30, 2017 was approximately $27.4 billion of net DTAs arising from net operating loss, foreign tax credit and general business credit carry-forwards as well as temporary differences, of which approximately $23.2 billion were deducted from Common Equity Tier 1 Capital and approximately $4.2 billion were deducted from Additional Tier 1 Capital, reduced by approximately $1.4 billion of net DTLs primarily associated with goodwill and certain other intangible assets. Separately, under the U.S. Basel III rules, goodwill and these other intangible assets are deducted net of associated DTLs in arriving at Common Equity Tier 1 Capital. DTAs arising from net operating loss, foreign tax credit and general business credit carry-forwards are required to be deducted from both Common Equity Tier 1 Capital and Additional Tier 1 Capital under the transition arrangements of the U.S. Basel III rules; whereas DTAs arising from temporary differences are deducted in full from Common Equity Tier 1 Capital under these rules, if in excess of 10%/15% limitations. |
(8) | Assets subject to 10%/15% limitations include MSRs, DTAs arising from temporary differences and significant common stock investments in unconsolidated financial institutions. At June 30, 2017 and December 31, 2016, this deduction related only to DTAs arising from temporary differences that exceeded the 10% limitation. Accordingly, approximately $6.6 billion of DTAs arising from temporary differences were excluded from Citi's Common Equity Tier 1 Capital at June 30, 2017. Changes to the U.S. corporate tax regime that impact the value of Citi's DTAs arising from temporary differences, which exceed the then current amount deducted from Citi's Common Equity Tier 1 Capital, would further reduce Citi's regulatory capital to the extent of such excess after tax. For additional information regarding potential U.S. corporate tax reform, see "Risk Factors-Strategic Risks" in Citigroup's 2016 Annual Report on Form 10-K. |
(9) | Represents Citigroup Capital XIII trust preferred securities, which are permanently grandfathered as Tier 1 Capital under the U.S. Basel III rules. |
(10) | Banking entities are required to be in compliance with the Volcker Rule of the Dodd-Frank Act that prohibits conducting certain proprietary investment activities and limits their ownership of, and relationships with, covered funds. Accordingly, Citi is required by the Volcker Rule to deduct from Tier 1 Capital all permitted ownership interests in covered funds that were acquired after December 31, 2013. |
(11) | 50% of the minimum regulatory capital requirements of insurance underwriting subsidiaries must be deducted from each of Tier 1 Capital and Tier 2 Capital. |
(12) | Effective January 1, 2016, non-grandfathered trust preferred securities are not eligible for inclusion in Tier 1 Capital, but are eligible for inclusion in Tier 2 Capital subject to full phase-out by January 1, 2022. Non-grandfathered trust preferred securities are eligible for inclusion in Tier 2 Capital in an amount up to 50% and 60% during 2017 and 2016, respectively, of the aggregate outstanding principal amounts of such issuances as of January 1, 2014, in accordance with the transition arrangements for non-qualifying capital instruments under the U.S. Basel III rules. |
(13) | Under the Standardized Approach, the allowance for credit losses is eligible for inclusion in Tier 2 Capital up to 1.25% of credit risk-weighted assets, with any excess allowance for credit losses being deducted in arriving at credit risk-weighted assets, which differs from the Advanced Approaches framework, in which eligible credit reserves that exceed expected credit losses are eligible for inclusion in Tier 2 Capital to the extent the excess reserves do not exceed 0.6% of credit risk-weighted assets. The total amount of eligible credit reserves in excess of expected credit losses that were eligible for inclusion in Tier 2 Capital, subject to limitation, under the Advanced Approaches framework was $1.3 billion and $0.7 billion at June 30, 2017 and December 31, 2016 , respectively. |
31
In millions of dollars | Three Months Ended June 30, 2017 | Six Months Ended June 30, 2017 | ||||
Common Equity Tier 1 Capital, beginning of period (1) | $ | 161,388 | | $ | 167,378 | |
Net income | 3,872 | | 7,962 | | ||
Common and preferred stock dividends declared | (765 | ) | (1,511 | ) | ||
Net increase in treasury stock | (1,762 | ) | (3,699 | ) | ||
Net change in common stock and additional paid-in capital | 184 | | (245 | ) | ||
Net decrease in foreign currency translation adjustment net of hedges, net of tax | 643 | | 1,961 | | ||
Net change in unrealized losses on securities AFS, net of tax | (22 | ) | 397 | | ||
Net increase in defined benefit plans liability adjustment, net of tax | (108 | ) | (1,151 | ) | ||
Net change in adjustment related to changes in fair value of financial liabilities attributable to own creditworthiness, net of tax | 11 | | 52 | | ||
Net increase in goodwill, net of related DTLs | (141 | ) | (731 | ) | ||
Net change in identifiable intangible assets other than MSRs, net of related DTLs | 120 | | (744 | ) | ||
Net change in defined benefit pension plan net assets | 32 | | (123 | ) | ||
Net change in DTAs arising from net operating loss, foreign tax credit and general business credit carry-forwards | 196 | | (3,864 | ) | ||
Net change in excess over 10%/15% limitations for other DTAs, certain common stock investments and MSRs | 123 | | (1,759 | ) | ||
Other | 15 | | (137 | ) | ||
Net change in Common Equity Tier 1 Capital | $ | 2,398 | | $ | (3,592 | ) |
Common Equity Tier 1 Capital, end of period (Standardized Approach and Advanced Approaches) | $ | 163,786 | | $ | 163,786 | |
Additional Tier 1 Capital, beginning of period | $ | 15,439 | | $ | 11,009 | |
Net increase in qualifying trust preferred securities | 2 | | 3 | | ||
Net change in adjustment related to changes in fair value of financial liabilities attributable to own creditworthiness, net of tax | 23 | | 34 | | ||
Net decrease in defined benefit pension plan net assets | 8 | | 184 | | ||
Net decrease in DTAs arising from net operating loss, foreign tax credit and general business credit carry-forwards | 49 | | 4,369 | | ||
Net decrease in permitted ownership interests in covered funds | 123 | | 38 | | ||
Other | 114 | | 121 | | ||
Net increase in Additional Tier 1 Capital | $ | 319 | | $ | 4,749 | |
Tier 1 Capital, end of period (Standardized Approach and Advanced Approaches) | $ | 179,544 | | $ | 179,544 | |
Tier 2 Capital, beginning of period (Standardized Approach) | $ | 36,976 | | $ | 36,551 | |
Net increase in qualifying subordinated debt | 364 | | 824 | | ||
Net increase in qualifying trust preferred securities | 5 | | 7 | | ||
Net change in eligible allowance for credit losses | 26 | | (19 | ) | ||
Other | 12 | | 20 | | ||
Net increase in Tier 2 Capital (Standardized Approach) | $ | 407 | | $ | 832 | |
Tier 2 Capital, end of period (Standardized Approach) | $ | 37,383 | | $ | 37,383 | |
Total Capital, end of period (Standardized Approach) | $ | 216,927 | | $ | 216,927 | |
|
|
| ||||
Tier 2 Capital, beginning of period (Advanced Approaches) | $ | 24,396 | | $ | 23,759 | |
Net increase in qualifying subordinated debt | 364 | | 824 | | ||
Net increase in qualifying trust preferred securities | 5 | | 7 | | ||
Net increase in excess of eligible credit reserves over expected credit losses | 469 | | 636 | | ||
Other | 12 | | 20 | | ||
Net increase in Tier 2 Capital (Advanced Approaches) | $ | 850 | | $ | 1,487 | |
Tier 2 Capital, end of period (Advanced Approaches) | $ | 25,246 | | $ | 25,246 | |
Total Capital, end of period (Advanced Approaches) | $ | 204,790 | | $ | 204,790 | |
Footnote is presented on the following page.
32
(1) | The beginning balance of Common Equity Tier 1 Capital for the three months ended June 30, 2017 has been restated to reflect the modified retrospective adoption of Accounting Standards Update (ASU) No. 2017-08, Receivables-Nonrefundable Fees and Other Costs (Subtopic 310-20): Premium Amortization on Purchased Callable Debt Securities , which amends the amortization period for certain purchased callable debt securities held at a premium. For additional information regarding ASU 2017-08, see Note 1 to the Consolidated Financial Statements. |
Citigroup Risk-Weighted Assets Rollforward Under Current Regulatory Standards
(Basel III Standardized Approach with Transition Arrangements)
In millions of dollars | Three Months Ended | Six Months Ended | ||||
Total Risk-Weighted Assets, beginning of period | $ | 1,142,559 | | $ | 1,126,314 | |
Changes in Credit Risk-Weighted Assets |
|
| ||||
Net increase in general credit risk exposures (1) | 20,345 | | 13,643 | | ||
Net increase in repo-style transactions | 418 | | 6,988 | | ||
Net decrease in securitization exposures | (2,096 | ) | (2,054 | ) | ||
Net increase in equity exposures | 212 | | 747 | | ||
Net change in over-the-counter (OTC) derivatives | 2,277 | | (1,080 | ) | ||
Net increase in other exposures (2) | 7 | | 2,907 | | ||
Net change in off-balance sheet exposures (3) | (4,937 | ) | 3,322 | | ||
Net increase in Credit Risk-Weighted Assets | $ | 16,226 | | $ | 24,473 | |
Changes in Market Risk-Weighted Assets |
|
| ||||
Net increase in risk levels (4) | $ | 5,138 | | $ | 15,890 | |
Net decrease due to model and methodology updates (5) | (29 | ) | (2,783 | ) | ||
Net increase in Market Risk-Weighted Assets | $ | 5,109 | | $ | 13,107 | |
Total Risk-Weighted Assets, end of period | $ | 1,163,894 | | $ | 1,163,894 | |
(1) | General credit risk exposures include cash and balances due from depository institutions, securities, and loans and leases. General credit risk exposures increased during the three and six months ended June 30, 2017 primarily due to corporate loan growth. |
(2) | Other exposures include cleared transactions, unsettled transactions, and other assets. |
(3) | Off-balance sheet exposures decreased during the three months ended June 30, 2017 primarily due to the change in risk-weighting treatment applicable to certain corporate card commitments. Off-balance sheet exposures increased during the six months ended June 30, 2017, as the growth in corporate exposures and reduced hedging benefits during the first quarter of 2017 more than offset the decline in off-balance sheet exposures during the second quarter of 2017. |
(4) | Risk levels increased during the three and six months ended June 30, 2017 primarily due to an increase in exposure levels subject to Stressed Value at Risk and comprehensive risk, as well as an increase in positions subject to securitization charges. |
(5) | Risk-weighted assets declined during the six months ended June 30, 2017 due to changes in model inputs regarding volatility, as well as methodology changes for standard specific risk charges. |
33
Citigroup Risk-Weighted Assets Rollforward Under Current Regulatory Standards
(Basel III Advanced Approaches with Transition Arrangements)
In millions of dollars | Three Months Ended June 30, 2017 | Six Months Ended June 30, 2017 | ||||
Total Risk-Weighted Assets, beginning of period | $ | 1,166,181 | | $ | 1,166,764 | |
Changes in Credit Risk-Weighted Assets |
|
| ||||
Net decrease in retail exposures (1) | (4,343 | ) | (8,655 | ) | ||
Net change in wholesale exposures (2) | (4,029 | ) | 416 | | ||
Net increase in repo-style transactions | 199 | | 2 | | ||
Net decrease in securitization exposures | (1,880 | ) | (2,115 | ) | ||
Net increase in equity exposures | 134 | | 599 | | ||
Net decrease in over-the-counter (OTC) derivatives | (1,898 | ) | (6,097 | ) | ||
Net decrease in derivatives CVA | (39 | ) | (1,100 | ) | ||
Net change in other exposures (3) | 1,636 | | (49 | ) | ||
Net decrease in supervisory 6% multiplier (4) | (611 | ) | (954 | ) | ||
Net decrease in Credit Risk-Weighted Assets | $ | (10,831 | ) | $ | (17,953 | ) |
Changes in Market Risk-Weighted Assets |
|
| ||||
Net increase in risk levels (5) | $ | 4,922 | | $ | 15,917 | |
Net decrease due to model and methodology updates (6) | (29 | ) | (2,783 | ) | ||
Net increase in Market Risk-Weighted Assets | $ | 4,893 | | $ | 13,134 | |
Net decrease in Operational Risk-Weighted Assets (7) | $ | (2,573 | ) | $ | (4,275 | ) |
Total Risk-Weighted Assets, end of period | $ | 1,157,670 | | $ | 1,157,670 | |
(1) | Retail exposures decreased during the three and six months ended June 30, 2017 primarily due to residential mortgage loan sales and repayments, divestitures of certain legacy assets and reductions in qualifying revolving (cards) exposures, partially offset by the impact of FX translation. |
(2) | Wholesale exposures decreased during the three months ended June 30, 2017 primarily due to annual updates to model parameters. Wholesale exposures increased during the six months ended June 30, 2017 primarily due to increases in commercial loans and loan commitments, as well as the impact of FX translation. |
(3) | Other exposures include cleared transactions, unsettled transactions, assets other than those reportable in specific exposure categories, and non-material portfolios. |
(4) | Supervisory 6% multiplier does not apply to derivatives CVA. |
(5) | Risk levels increased during the three and six months ended June 30, 2017 primarily due to an increase in exposure levels subject to Stressed Value at Risk and comprehensive risk, as well as an increase in positions subject to securitization charges. |
(6) | Risk-weighted assets declined during the six months ended June 30, 2017 due to changes in model inputs regarding volatility, as well as methodology changes for standard specific risk charges. |
(7) | Operational risk-weighted assets decreased during the three and six months ended June 30, 2017 due to quarterly updates to model parameters. |
34
Capital Resources of Citigroup's Subsidiary U.S. Depository Institutions Under Current Regulatory Standards
Citigroup's subsidiary U.S. depository institutions are also subject to regulatory capital standards issued by their respective primary federal bank regulatory agencies, which are similar to the standards of the Federal Reserve Board.
During 2017, Citi's primary subsidiary U.S. depository institution, Citibank, N.A. (Citibank), is subject to effective minimum Common Equity Tier 1 Capital, Tier 1 Capital and Total Capital ratios, inclusive of the 50% phase-in of the 2.5% Capital Conservation Buffer, of 5.75%, 7.25% and 9.25%, respectively. Citibank's effective minimum Common Equity Tier 1 Capital, Tier 1 Capital and Total
Capital ratios during 2016, inclusive of the 25% phase-in of the 2.5% Capital Conservation Buffer, were 5.125%, 6.625% and 8.625%, respectively. Citibank is required to maintain stated minimum Common Equity Tier 1 Capital, Tier 1 Capital and Total Capital ratios of 4.5%, 6% and 8%, respectively.
The following tables set forth the capital tiers, total risk-weighted assets, risk-based capital ratios, quarterly adjusted average total assets, Total Leverage Exposure and leverage ratios under current regulatory standards (reflecting Basel III Transition Arrangements) for Citibank, Citi's primary subsidiary U.S. depository institution, as of June 30, 2017 and December 31, 2016 .
Citibank Capital Components and Ratios Under Current Regulatory Standards (Basel III Transition Arrangements)
| June 30, 2017 | December 31, 2016 | ||||||||||
In millions of dollars, except ratios | Advanced Approaches | Standardized Approach | Advanced Approaches | Standardized Approach | ||||||||
Common Equity Tier 1 Capital | $ | 127,728 | | $ | 127,728 | | $ | 126,220 | | $ | 126,220 | |
Tier 1 Capital | 129,099 | | 129,099 | | 126,465 | | 126,465 | | ||||
Total Capital (Tier 1 Capital + Tier 2 Capital) (1) | 142,010 | | 152,802 | | 138,821 | | 150,291 | | ||||
Total Risk-Weighted Assets | 963,668 | | 1,029,517 | | 973,933 | | 1,001,016 | | ||||
Common Equity Tier 1 Capital ratio (2)(3) | 13.25 | % | 12.41 | % | 12.96 | % | 12.61 | % | ||||
Tier 1 Capital ratio (2)(3) | 13.40 | | 12.54 | | 12.99 | | 12.63 | | ||||
Total Capital ratio (2)(3) | 14.74 | | 14.84 | | 14.25 | | 15.01 | | ||||
In millions of dollars, except ratios | June 30, 2017 | December 31, 2016 | ||||||
Quarterly Adjusted Average Total Assets (4) |
| $ | 1,376,154 | |
| $ | 1,333,161 | |
Total Leverage Exposure (5) |
| 1,917,020 | |
| 1,859,394 | | ||
Tier 1 Leverage ratio (3) |
| 9.38 | % |
| 9.49 | % | ||
Supplementary Leverage ratio |
| 6.73 | |
| 6.80 | | ||
(1) | Under the Advanced Approaches framework, eligible credit reserves that exceed expected credit losses are eligible for inclusion in Tier 2 Capital to the extent the excess reserves do not exceed 0.6% of credit risk-weighted assets, which differs from the Standardized Approach in which the allowance for credit losses is eligible for inclusion in Tier 2 Capital up to 1.25% of credit risk-weighted assets, with any excess allowance for credit losses being deducted in arriving at credit risk-weighted assets. |
(2) | As of June 30, 2017 and December 31, 2016 , Citibank's reportable Common Equity Tier 1 Capital and Tier 1 Capital ratios were the lower derived under the Basel III Standardized Approach. As of June 30, 2017 and December 31, 2016 , Citibank's reportable Total Capital ratio was the lower derived under the Basel III Advanced Approaches framework. |
(3) | Citibank must maintain minimum Common Equity Tier 1 Capital, Tier 1 Capital, Total Capital and Tier 1 Leverage ratios of 6.5%, 8%, 10% and 5%, respectively, to be considered "well capitalized" under the revised Prompt Corrective Action (PCA) regulations applicable to insured depository institutions as established by the U.S. Basel III rules. For additional information, see "Capital Resources-Current Regulatory Capital Standards-Prompt Corrective Action Framework" in Citigroup's 2016 Annual Report on Form 10-K. |
(4) | Tier 1 Leverage ratio denominator. |
(5) | Supplementary Leverage ratio denominator. |
As indicated in the table above, Citibank's risk-based capital ratios at June 30, 2017 were in excess of the stated and effective minimum requirements under the U.S. Basel III rules. In addition, Citibank was also "well capitalized" as of June 30, 2017 under the revised PCA regulations, which became effective January 1, 2015.
35
Impact of Changes on Citigroup and Citibank Capital Ratios Under Current Regulatory Capital Standards
The following tables present the estimated sensitivity of Citigroup's and Citibank's capital ratios to changes of $100 million in Common Equity Tier 1 Capital, Tier 1 Capital and Total Capital (numerator), and changes of $1 billion in
Advanced Approaches and Standardized Approach risk-weighted assets and quarterly adjusted average total assets, as well as Total Leverage Exposure (denominator), under current regulatory capital standards (reflecting Basel III Transition Arrangements), as of June 30, 2017 .
This information is provided for the purpose of analyzing the impact that a change in Citigroup's or Citibank's financial position or results of operations could have on these ratios. These sensitivities only consider a single change to either a component of capital, risk-weighted assets, quarterly adjusted average total assets or Total Leverage Exposure. Accordingly, an event that affects more than one factor may have a larger basis point impact than is reflected in these tables.
Impact of Changes on Citigroup and Citibank Risk-Based Capital Ratios (Basel III Transition Arrangements)
| Common Equity Tier 1 Capital ratio | Tier 1 Capital ratio | Total Capital ratio | |||
In basis points | Impact of $100 million change in Common Equity Tier 1 Capital | Impact of $1 billion change in risk- weighted assets | Impact of $100 million change in Tier 1 Capital | Impact of $1 billion change in risk- weighted assets | Impact of $100 million change in Total Capital | Impact of $1 billion change in risk- weighted assets |
Citigroup |
|
|
|
|
|
|
Advanced Approaches | 0.9 | 1.2 | 0.9 | 1.3 | 0.9 | 1.5 |
Standardized Approach | 0.9 | 1.2 | 0.9 | 1.3 | 0.9 | 1.6 |
Citibank |
|
|
|
|
|
|
Advanced Approaches | 1.0 | 1.4 | 1.0 | 1.4 | 1.0 | 1.5 |
Standardized Approach | 1.0 | 1.2 | 1.0 | 1.2 | 1.0 | 1.4 |
Impact of Changes on Citigroup and Citibank Leverage Ratios (Basel III Transition Arrangements)
| Tier 1 Leverage ratio | Supplementary Leverage ratio | ||
In basis points | Impact of $100 million change in Tier 1 Capital | Impact of $1 billion change in quarterly adjusted average total assets | Impact of $100 million change in Tier 1 Capital | Impact of $1 billion change in Total Leverage Exposure |
Citigroup | 0.6 | 0.5 | 0.4 | 0.3 |
Citibank | 0.7 | 0.7 | 0.5 | 0.4 |
Citigroup Broker-Dealer Subsidiaries
At June 30, 2017 , Citigroup Global Markets Inc., a U.S. broker-dealer registered with the SEC that is an indirect wholly owned subsidiary of Citigroup, had net capital, computed in accordance with the SEC's net capital rule, of approximately $10.7 billion, which exceeded the minimum requirement by approximately $8.8 billion.
Moreover, Citigroup Global Markets Limited, a broker-dealer registered with the United Kingdom's Prudential Regulation Authority (PRA) that is also an indirect wholly owned subsidiary of Citigroup, had total capital of approximately $17.5 billion at June 30, 2017 , which exceeded the PRA's minimum regulatory capital requirements.
In addition, certain of Citi's other broker-dealer
subsidiaries are subject to regulation in the countries in which they do business, including requirements to maintain specified levels of net capital or its equivalent. Citigroup's other broker-dealer subsidiaries were in compliance with
their regulatory capital requirements at June 30, 2017 .
36
Basel III (Full Implementation)
Citigroup's Capital Resources Under Basel III
(Full Implementation)
Citi currently estimates that its effective minimum Common Equity Tier 1 Capital, Tier 1 Capital and Total Capital ratio requirements under the U.S. Basel III rules, on a fully implemented basis, inclusive of the 2.5% Capital Conservation Buffer and the Countercyclical Capital Buffer at its current level of 0%, as well as an expected 3% GSIB surcharge, may be 10%, 11.5% and 13.5%, respectively.
Further, under the U.S. Basel III rules, Citi must also comply with a 4% minimum Tier 1 Leverage ratio requirement and an effective 5% minimum Supplementary Leverage ratio requirement.
The following tables set forth the capital tiers, total risk-weighted assets, risk-based capital ratios, quarterly adjusted average total assets, Total Leverage Exposure and leverage ratios, assuming full implementation under the U.S. Basel III rules, for Citi as of June 30, 2017 and December 31, 2016 .
At June 30, 2017, Citi's constraining Common Equity Tier 1 Capital and Tier 1 Capital ratios were those derived under the Basel III Standardized Approach, whereas Citi's binding Total Capital ratio was that resulting from application of the Basel III Advanced Approaches. Further, each of Citi's risk-based capital ratios was constrained by the Basel III Advanced Approaches for all prior periods.
| June 30, 2017 | December 31, 2016 | ||||||||||
In millions of dollars, except ratios | Advanced Approaches | Standardized Approach | Advanced Approaches | Standardized Approach | ||||||||
Common Equity Tier 1 Capital | $ | 155,174 | | $ | 155,174 | | $ | 149,516 | | $ | 149,516 | |
Tier 1 Capital | 175,129 | | 175,129 | | 169,390 | | 169,390 | | ||||
Total Capital (Tier 1 Capital + Tier 2 Capital) | 200,382 | | 212,519 | | 193,160 | | 205,975 | | ||||
Total Risk-Weighted Assets | 1,183,399 | | 1,188,167 | | 1,189,680 | | 1,147,956 | | ||||
Credit Risk | $ | 781,259 | | $ | 1,110,532 | | $ | 796,399 | | $ | 1,083,428 | |
Market Risk | 77,140 | | 77,635 | | 64,006 | | 64,528 | | ||||
Operational Risk | 325,000 | | - | | 329,275 | | - | | ||||
Common Equity Tier 1 Capital ratio (1)(2) | 13.11 | % | 13.06 | % | 12.57 | % | 13.02 | % | ||||
Tier 1 Capital ratio (1)(2) | 14.80 | | 14.74 | | 14.24 | | 14.76 | | ||||
Total Capital ratio (1)(2) | 16.93 | | 17.89 | | 16.24 | | 17.94 | | ||||
In millions of dollars, except ratios | June 30, 2017 | December 31, 2016 | ||||||
Quarterly Adjusted Average Total Assets (3) |
| $ | 1,812,001 | |
| $ | 1,761,923 | |
Total Leverage Exposure (4) |
| 2,418,658 | |
| 2,345,391 | | ||
Tier 1 Leverage ratio (2) |
| 9.66 | % |
| 9.61 | % | ||
Supplementary Leverage ratio (2) |
| 7.24 | |
| 7.22 | | ||
(1) | As of June 30, 2017 , Citi's reportable Common Equity Tier 1 Capital and Tier 1 Capital ratios were the lower derived under the Basel III Standardized Approach, whereas the reportable Total Capital ratio was the lower derived under the Basel III Advanced Approaches framework. As of December 31, 2016, Citi's reportable Common Equity Tier 1 Capital, Tier 1 Capital and Total Capital ratios were the lower derived under the Basel III Advanced Approaches framework. |
(2) | Citi's Basel III capital ratios and related components, on a fully implemented basis, are non-GAAP financial measures. |
(3) | Tier 1 Leverage ratio denominator. |
(4) | Supplementary Leverage ratio denominator. |
37
Common Equity Tier 1 Capital Ratio
Citi's Common Equity Tier 1 Capital ratio was 13.1% at June 30, 2017 , compared to 12.8% at March 31, 2017 and 12.6% at December 31, 2016 . The quarter-over-quarter increase in the ratio was primarily due to quarterly net income of $3.9 billion and beneficial net movements in AOCI, offset in part by the return of approximately $2.2 billion of capital to common shareholders. The growth in Citi's Common Equity Tier 1 Capital ratio from year-end 2016 reflected continued growth in Common Equity Tier 1 Capital resulting from year-to-date net income of $8 billion and beneficial net movements in AOCI, offset in part by the return of approximately $4.5 billion of capital to common shareholders.
38
Components of Citigroup Capital Under Basel III (Full Implementation)
In millions of dollars | June 30, | December 31, 2016 | ||||
Common Equity Tier 1 Capital |
|
| ||||
Citigroup common stockholders' equity (1) | $ | 210,950 | | $ | 206,051 | |
Add: Qualifying noncontrolling interests | 143 | | 129 | | ||
Regulatory Capital Adjustments and Deductions: |
|
| ||||
Less: Accumulated net unrealized losses on cash flow hedges, net of tax (2) | (445 | ) | (560 | ) | ||
Less: Cumulative unrealized net loss related to changes in fair value of financial liabilities attributable to own creditworthiness, net of tax (3) | (291 | ) | (61 | ) | ||
Less: Intangible assets: |
|
| ||||
Goodwill, net of related DTLs (4) | 21,589 | | 20,858 | | ||
Identifiable intangible assets other than MSRs, net of related DTLs | 4,587 | | 4,876 | | ||
Less: Defined benefit pension plan net assets | 796 | | 857 | | ||
Less: DTAs arising from net operating loss, foreign tax credit and general business credit carry-forwards (5) | 20,832 | | 21,337 | | ||
Less: Excess over 10%/15% limitations for other DTAs, certain common stock investments, and MSRs (5)(6) | 8,851 | | 9,357 | | ||
Total Common Equity Tier 1 Capital (Standardized Approach and Advanced Approaches) | $ | 155,174 | | $ | 149,516 | |
Additional Tier 1 Capital |
|
| ||||
Qualifying noncumulative perpetual preferred stock (1) | $ | 19,069 | | $ | 19,069 | |
Qualifying trust preferred securities (7) | 1,374 | | 1,371 | | ||
Qualifying noncontrolling interests | 64 | | 28 | | ||
Regulatory Capital Deductions: |
|
| ||||
Less: Permitted ownership interests in covered funds (8) | 495 | | 533 | | ||
Less: Minimum regulatory capital requirements of insurance underwriting subsidiaries (9) | 57 | | 61 | | ||
Total Additional Tier 1 Capital (Standardized Approach and Advanced Approaches) | $ | 19,955 | | $ | 19,874 | |
Total Tier 1 Capital (Common Equity Tier 1 Capital + Additional Tier 1 Capital) (Standardized Approach and Advanced Approaches) | $ | 175,129 | | $ | 169,390 | |
Tier 2 Capital |
|
| ||||
Qualifying subordinated debt | $ | 23,642 | | $ | 22,818 | |
Qualifying trust preferred securities (10) | 324 | | 317 | | ||
Qualifying noncontrolling interests | 48 | | 36 | | ||
Eligible allowance for credit losses (11) | 13,433 | | 13,475 | | ||
Regulatory Capital Deduction: |
|
| ||||
Less: Minimum regulatory capital requirements of insurance underwriting subsidiaries (9) | 57 | | 61 | | ||
Total Tier 2 Capital (Standardized Approach) | $ | 37,390 | | $ | 36,585 | |
Total Capital (Tier 1 Capital + Tier 2 Capital) (Standardized Approach) | $ | 212,519 | | $ | 205,975 | |
Adjustment for excess of eligible credit reserves over expected credit losses (11) | $ | (12,137 | ) | $ | (12,815 | ) |
Total Tier 2 Capital (Advanced Approaches) | $ | 25,253 | | $ | 23,770 | |
Total Capital (Tier 1 Capital + Tier 2 Capital) (Advanced Approaches) | $ | 200,382 | | $ | 193,160 | |
(1) | Issuance costs of $184 million related to noncumulative perpetual preferred stock outstanding at June 30, 2017 and December 31, 2016 are excluded from common stockholders' equity and netted against such preferred stock in accordance with Federal Reserve Board regulatory reporting requirements, which differ from those under U.S. GAAP. |
(2) | Common Equity Tier 1 Capital is adjusted for accumulated net unrealized gains (losses) on cash flow hedges included in AOCI that relate to the hedging of items not recognized at fair value on the balance sheet. |
(3) | The cumulative impact of changes in Citigroup's own creditworthiness in valuing liabilities for which the fair value option has been elected and own-credit valuation adjustments on derivatives are excluded from Common Equity Tier 1 Capital, in accordance with the U.S. Basel III rules. |
(4) | Includes goodwill "embedded" in the valuation of significant common stock investments in unconsolidated financial institutions. |
Footnotes continue on the following page.
39
(5) | Of Citi's approximately $45.8 billion of net DTAs at June 30, 2017 , approximately $17.6 billion were includable in Common Equity Tier 1 Capital pursuant to the U.S. Basel III rules, while approximately $28.2 billion were excluded. Excluded from Citi's Common Equity Tier 1 Capital at June 30, 2017 was a total of approximately $29.7 billion of net DTAs arising from net operating loss, foreign tax credit and general business credit carry-forwards as well as temporary differences, reduced by approximately $1.5 billion of net DTLs primarily associated with goodwill and certain other intangible assets. Separately, under the U.S. Basel III rules, goodwill and these other intangible assets are deducted net of associated DTLs in arriving at Common Equity Tier 1 Capital. DTAs arising from net operating loss, foreign tax credit and general business credit carry-forwards are required to be fully deducted from Common Equity Tier 1 Capital under full implementation of the U.S. Basel III rules; whereas DTAs arising from temporary differences are deducted from Common Equity Tier 1 Capital, if in excess of 10%/15% limitations. |
(6) | Assets subject to 10%/15% limitations include MSRs, DTAs arising from temporary differences and significant common stock investments in unconsolidated financial institutions. At June 30, 2017 and December 31, 2016, this deduction related only to DTAs arising from temporary differences that exceeded the 10% limitation. Accordingly, approximately $8.9 billion of DTAs arising from temporary differences were excluded from Citi's Common Equity Tier 1 Capital at June 30, 2017. Changes to the U.S. corporate tax regime that impact the value of Citi's DTAs arising from temporary differences, which exceed the then current amount deducted from Citi's Common Equity Tier 1 Capital, would further reduce Citi's regulatory capital to the extent of such excess after tax. For additional information regarding potential U.S. corporate tax reform, see "Risk Factors-Strategic Risks" in Citigroup's 2016 Annual Report on Form 10-K. |
(7) | Represents Citigroup Capital XIII trust preferred securities, which are permanently grandfathered as Tier 1 Capital under the U.S. Basel III rules. |
(8) | Banking entities are required to be in compliance with the Volcker Rule of the Dodd-Frank Act that prohibits conducting certain proprietary investment activities and limits their ownership of, and relationships with, covered funds. Accordingly, Citi is required by the Volcker Rule to deduct from Tier 1 Capital all permitted ownership interests in covered funds that were acquired after December 31, 2013. |
(9) | 50% of the minimum regulatory capital requirements of insurance underwriting subsidiaries must be deducted from each of Tier 1 Capital and Tier 2 Capital. |
(10) | Represents the amount of non-grandfathered trust preferred securities eligible for inclusion in Tier 2 Capital under the U.S. Basel III rules, which will be fully phased-out of Tier 2 Capital by January 1, 2022. |
(11) | Under the Standardized Approach, the allowance for credit losses is eligible for inclusion in Tier 2 Capital up to 1.25% of credit risk-weighted assets, with any excess allowance for credit losses being deducted in arriving at credit risk-weighted assets, which differs from the Advanced Approaches framework, in which eligible credit reserves that exceed expected credit losses are eligible for inclusion in Tier 2 Capital to the extent the excess reserves do not exceed 0.6% of credit risk-weighted assets. The total amount of eligible credit reserves in excess of expected credit losses that were eligible for inclusion in Tier 2 Capital, subject to limitation, under the Advanced Approaches framework was $1.3 billion and $0.7 billion at June 30, 2017 and December 31, 2016, respectively. |
40
In millions of dollars | Three Months Ended June 30, 2017 | Six Months Ended June 30, 2017 | ||||
Common Equity Tier 1 Capital, beginning of period (1) | $ | 152,664 | | $ | 149,516 | |
Net income | 3,872 | | 7,962 | | ||
Common and preferred stock dividends declared | (765 | ) | (1,511 | ) | ||
Net increase in treasury stock | (1,762 | ) | (3,699 | ) | ||
Net change in common stock and additional paid-in capital | 184 | | (245 | ) | ||
Net decrease in foreign currency translation adjustment net of hedges, net of tax | 643 | | 1,961 | | ||
Net change in unrealized losses on securities AFS, net of tax | (27 | ) | 697 | | ||
Net increase in defined benefit plans liability adjustment, net of tax | (135 | ) | (147 | ) | ||
Net change in adjustment related to changes in fair value of financial liabilities attributable to own creditworthiness, net of tax | 34 | | 86 | | ||
Net increase in goodwill, net of related DTLs | (141 | ) | (731 | ) | ||
Net decrease in identifiable intangible assets other than MSRs, net of related DTLs | 151 | | 289 | | ||
Net decrease in defined benefit pension plan net assets | 40 | | 61 | | ||
Net decrease in DTAs arising from net operating loss, foreign tax credit and general business credit carry-forwards | 245 | | 505 | | ||
Net decrease in excess over 10%/15% limitations for other DTAs, certain common stock investments and MSRs | 161 | | 506 | | ||
Other | 10 | | (76 | ) | ||
Net increase in Common Equity Tier 1 Capital | $ | 2,510 | | $ | 5,658 | |
Common Equity Tier 1 Capital, end of period (Standardized Approach and Advanced Approaches) | $ | 155,174 | | $ | 155,174 | |
Additional Tier 1 Capital, beginning of period | $ | 19,791 | | $ | 19,874 | |
Net increase in qualifying trust preferred securities | 2 | | 3 | | ||
Net decrease in permitted ownership interests in covered funds | 123 | | 38 | | ||
Other | 39 | | $ | 40 | | |
Net increase in Additional Tier 1 Capital | $ | 164 | | $ | 81 | |
Tier 1 Capital, end of period (Standardized Approach and Advanced Approaches) | $ | 175,129 | | $ | 175,129 | |
Tier 2 Capital, beginning of period (Standardized Approach) | $ | 36,981 | | $ | 36,585 | |
Net increase in qualifying subordinated debt | 364 | | 824 | | ||
Net change in eligible allowance for credit losses | 26 | | (42 | ) | ||
Other | 19 | | 23 | | ||
Net increase in Tier 2 Capital (Standardized Approach) | $ | 409 | | $ | 805 | |
Tier 2 Capital, end of period (Standardized Approach) | $ | 37,390 | | $ | 37,390 | |
Total Capital, end of period (Standardized Approach) | $ | 212,519 | | $ | 212,519 | |
|
|
| ||||
Tier 2 Capital, beginning of period (Advanced Approaches) | $ | 24,401 | | $ | 23,770 | |
Net increase in qualifying subordinated debt | 364 | | 824 | | ||
Net increase in excess of eligible credit reserves over expected credit losses | 469 | | 636 | | ||
Other | 19 | | 23 | | ||
Net increase in Tier 2 Capital (Advanced Approaches) | $ | 852 | | $ | 1,483 | |
Tier 2 Capital, end of period (Advanced Approaches) | $ | 25,253 | | $ | 25,253 | |
Total Capital, end of period (Advanced Approaches) | $ | 200,382 | | $ | 200,382 | |
(1) | The beginning balance of Common Equity Tier 1 Capital for the three months ended June 30, 2017 has been restated to reflect the modified retrospective adoption of Accounting Standards Update (ASU) No. 2017-08, Receivables-Nonrefundable Fees and Other Costs (Subtopic 310-20): Premium Amortization on Purchased Callable Debt Securities , which amends the amortization period for certain purchased callable debt securities held at a premium. For additional information regarding ASU 2017-08, see Note 1 to the Consolidated Financial Statements. |
41
Citigroup Risk-Weighted Assets Rollforward (Basel III Standardized Approach with Full Implementation)
In millions of dollars | Three Months Ended | Six Months Ended | ||||
Total Risk-Weighted Assets, beginning of period | $ | 1,166,409 | | $ | 1,147,956 | |
Changes in Credit Risk-Weighted Assets |
|
| ||||
Net increase in general credit risk exposures (1) | 20,345 | | 13,643 | | ||
Net increase in repo-style transactions | 418 | | 6,988 | | ||
Net decrease in securitization exposures | (2,096 | ) | (2,054 | ) | ||
Net increase in equity exposures | 225 | | 836 | | ||
Net change in over-the-counter (OTC) derivatives | 2,277 | | (1,080 | ) | ||
Net increase in other exposures (2) | 417 | | 5,449 | | ||
Net change in off-balance sheet exposures | (4,937 | ) | 3,322 | | ||
Net increase in Credit Risk-Weighted Assets | $ | 16,649 | | $ | 27,104 | |
Changes in Market Risk-Weighted Assets |
|
| ||||
Net increase in risk levels | $ | 5,138 | | $ | 15,890 | |
Net decrease due to model and methodology updates | (29 | ) | (2,783 | ) | ||
Net increase in Market Risk-Weighted Assets | $ | 5,109 | | $ | 13,107 | |
Total Risk-Weighted Assets, end of period | $ | 1,188,167 | | $ | 1,188,167 | |
(1) | General credit risk exposures include cash and balances due from depository institutions, securities, and loans and leases. |
(2) | Other exposures include cleared transactions, unsettled transactions, and other assets. |
Citigroup Risk-Weighted Assets Rollforward (Basel III Advanced Approaches with Full Implementation)
In millions of dollars | Three Months Ended June 30, 2017 | Six Months Ended June 30, 2017 | ||||
Total Risk-Weighted Assets, beginning of period | $ | 1,191,463 | | $ | 1,189,680 | |
Changes in Credit Risk-Weighted Assets |
|
| ||||
Net decrease in retail exposures | (4,343 | ) | (8,655 | ) | ||
Net change in wholesale exposures | (4,029 | ) | 416 | | ||
Net increase in repo-style transactions | 199 | | 2 | | ||
Net decrease in securitization exposures | (1,880 | ) | (2,115 | ) | ||
Net increase in equity exposures | 146 | | 688 | | ||
Net decrease in over-the-counter (OTC) derivatives | (1,898 | ) | (6,097 | ) | ||
Net decrease in derivatives CVA | (39 | ) | (1,100 | ) | ||
Net increase in other exposures (1) | 2,047 | | 2,516 | | ||
Net decrease in supervisory 6% multiplier (2) | (587 | ) | (795 | ) | ||
Net decrease in Credit Risk-Weighted Assets | $ | (10,384 | ) | $ | (15,140 | ) |
Changes in Market Risk-Weighted Assets |
|
| ||||
Net increase in risk levels | $ | 4,922 | | $ | 15,917 | |
Net decrease due to model and methodology updates | (29 | ) | (2,783 | ) | ||
Net increase in Market Risk-Weighted Assets | $ | 4,893 | | $ | 13,134 | |
Net decrease in Operational Risk-Weighted Assets | $ | (2,573 | ) | $ | (4,275 | ) |
Total Risk-Weighted Assets, end of period | $ | 1,183,399 | | $ | 1,183,399 | |
(1) | Other exposures include cleared transactions, unsettled transactions, assets other than those reportable in specific exposure categories, and non-material portfolios. |
(2) | Supervisory 6% multiplier does not apply to derivatives CVA. |
42
Total risk-weighted assets under the Basel III Standardized Approach increased from year-end 2016 due to substantially higher credit and market risk-weighted assets. The increase in credit risk-weighted assets under the Basel III Standardized Approach was primarily due to corporate loan growth and increased repo-style transaction activity.
Total risk-weighted assets under the Basel III Advanced Approaches decreased from year-end 2016, as lower credit and operational risk-weighted assets were partially offset by an increase in market risk-weighted assets. The decrease in credit risk-weighted assets under the Basel III Advanced Approaches was primarily due to residential mortgage loan sales and repayments, divestitures of certain legacy assets, and reductions in qualifying revolving (cards) exposures attributable to seasonal holiday spending repayments, as well as a decrease in OTC derivatives due to model enhancements. Operational risk-weighted assets decreased from year-end 2016 due to quarterly updates to model parameters.
The increase in market risk-weighted assets under both approaches over this period was primarily due to increases in exposure levels subject to Stressed Value at Risk and comprehensive risk, as well as an increase in positions subject to securitization charges.
43
Supplementary Leverage Ratio
Citigroup's Supplementary Leverage ratio was 7.2% for the second quarter of 2017 , compared to 7.3% for the first quarter of 2017 and 7.2% for the fourth quarter of 2016 . The decline in the ratio quarter-over-quarter was principally driven by the return of capital to common shareholders and an increase in Total Leverage Exposure primarily due to growth in average on-balance sheet assets, partially offset by quarterly net income of $3.9 billion and beneficial net movements in AOCI. The ratio remained unchanged from the fourth quarter of 2016, as net income of $8 billion and beneficial net movements in AOCI were offset by the return
of capital to common shareholders and an increase in Total Leverage Exposure primarily due to growth in average on-balance sheet assets, as well as, although to a lesser extent, an increase in certain off-balance sheet exposures.
The following table sets forth Citi's Supplementary Leverage ratio and related components, assuming full implementation under the U.S. Basel III rules, for the three months ended June 30, 2017 and December 31, 2016 .
Citigroup Basel III Supplementary Leverage Ratio and Related Components (Full Implementation)
In millions of dollars, except ratios | June 30, 2017 | December 31, 2016 | ||||
Tier 1 Capital | $ | 175,129 | | $ | 169,390 | |
Total Leverage Exposure (TLE) |
|
| ||||
On-balance sheet assets (1) | $ | 1,869,208 | | $ | 1,819,802 | |
Certain off-balance sheet exposures: (2) |
|
| ||||
Potential future exposure on derivative contracts | 225,090 | | 211,009 | | ||
Effective notional of sold credit derivatives, net (3) | 69,727 | | 64,366 | | ||
Counterparty credit risk for repo-style transactions (4) | 23,174 | | 22,002 | | ||
Unconditionally cancellable commitments | 67,571 | | 66,663 | | ||
Other off-balance sheet exposures | 221,095 | | 219,428 | | ||
Total of certain off-balance sheet exposures | $ | 606,657 | | $ | 583,468 | |
Less: Tier 1 Capital deductions | 57,207 | | 57,879 | | ||
Total Leverage Exposure | $ | 2,418,658 | | $ | 2,345,391 | |
Supplementary Leverage ratio | 7.24 | % | 7.22 | % | ||
(1) | Represents the daily average of on-balance sheet assets for the quarter. |
(2) | Represents the average of certain off-balance sheet exposures calculated as of the last day of each month in the quarter. |
(3) | Under the U.S. Basel III rules, banking organizations are required to include in TLE the effective notional amount of sold credit derivatives, with netting of exposures permitted if certain conditions are met. |
(4) | Repo-style transactions include repurchase or reverse repurchase transactions and securities borrowing or securities lending transactions. |
Citibank's Supplementary Leverage ratio, assuming full implementation under the U.S. Basel III rules, was 6.6% for the second quarter of 2017, compared to 6.7% for the first quarter of 2017 and 6.6% for the fourth quarter of 2016. The decline in the ratio quarter-over-quarter was principally driven by cash dividends paid by Citibank to its parent, Citicorp, and which were subsequently remitted to Citigroup, as well as an increase in Total Leverage Exposure primarily due to growth in average on-balance sheet assets, partially offset by quarterly net income and the favorable effects associated with DTA utilization. The ratio remained unchanged from the fourth quarter of 2016, as the Tier 1 Capital benefits associated with net income and beneficial net movements in AOCI were offset by an increase in Total Leverage Exposure and cash dividends paid by Citibank to its parent, Citicorp, and which were subsequently remitted to Citigroup.
44
Regulatory Capital Standards Developments
Revisions to the Securitization Framework
In July 2017, the Basel Committee on Banking Supervision (Basel Committee) issued two consultative documents: one which establishes criteria for identifying "simple, transparent, and comparable" (STC) short-term securitizations, and another which provides for an alternative, and potentially preferential, regulatory capital treatment for short-term securitizations identified as STC. The Basel Committee had previously issued criteria solely for identifying STC securitizations in July 2015, and also previously issued an alternative regulatory capital treatment for STC securitizations in July 2016. The July 2017 consultative documents, however, introduce identification criteria and regulatory capital treatments that are uniquely tailored to short-term securitizations, with a focus on exposures related to asset-backed commercial paper conduits.
The U.S. banking agencies may revise the regulatory capital treatment of STC short-term securitizations in the future, based upon any revisions adopted by the Basel Committee.
45
Tangible Common Equity, Book Value Per Share, Tangible Book Value Per Share and Returns on Equity
Tangible common equity (TCE), as defined by Citi, represents common stockholders' equity less goodwill and identifiable intangible assets (other than MSRs). Other companies may calculate TCE in a different manner. TCE, tangible book value per share and returns on average TCE are non-GAAP financial measures.
In millions of dollars or shares, except per share amounts | June 30, | December 31, |
|
| ||||||||
Total Citigroup stockholders' equity | $ | 230,019 | | $ | 225,120 | |
|
| ||||
Less: Preferred stock | 19,253 | | 19,253 | |
|
| ||||||
Common stockholders' equity | $ | 210,766 | | $ | 205,867 | |
|
| ||||
Less: |
|
|
|
| ||||||||
Goodwill | 22,349 | | 21,659 | |
|
| ||||||
Identifiable intangible assets (other than MSRs) | 4,887 | | 5,114 | |
|
| ||||||
Goodwill and identifiable intangible assets (other than MSRs) related to assets held-for-sale | 120 | | 72 | |
|
| ||||||
Tangible common equity (TCE) | $ | 183,410 | | $ | 179,022 | |
|
| ||||
Common shares outstanding (CSO) | 2,724.6 | | 2,772.4 | |
|
| ||||||
Book value per share (common equity/CSO) | $ | 77.36 | | $ | 74.26 | |
|
| ||||
Tangible book value per share (TCE/CSO) | 67.32 | | 64.57 | |
|
| ||||||
In millions of dollars | Three Months Ended June 30, 2017 | Three Months Ended June 30, 2016 | Six Months Ended June 30, 2017 | Six Months Ended June 30, 2016 | ||||||||
Net income available to common shareholders | $ | 3,552 | | $ | 3,676 | | $ | 7,341 | | $ | 6,967 | |
Average common stockholders' equity | $ | 209,693 | | $ | 210,146 | | $ | 208,298 | | $ | 208,615 | |
Average TCE | $ | 182,404 | | $ | 184,130 | | $ | 181,276 | | $ | 182,420 | |
Less: Average net DTAs excluded from Common Equity Tier 1 Capital (1) | 28,448 | | 28,503 | | 28,714 | | 29,333 | | ||||
Average TCE, excluding average net DTAs excluded from Common Equity Tier 1 Capital | $ | 153,956 | | $ | 155,627 | | $ | 152,562 | | $ | 153,087 | |
Return on average common stockholders' equity | 6.8 | % | 7.0 | % | 7.1 | % | 6.7 | % | ||||
Return on average TCE (ROTCE) (2) | 7.8 | | 8.0 | | 8.2 | | 7.7 | | ||||
Return on average TCE, excluding average net DTAs excluded from Common Equity Tier 1 Capital | 9.3 | | 9.5 | | 9.7 | | 9.2 | | ||||
(1) | Represents average net DTAs excluded in arriving at Common Equity Tier 1 Capital under full implementation of the U.S. Basel III rules. |
(2) | ROTCE represents annualized net income available to common shareholders as a percentage of average TCE. |
46
Managing Global Risk Table of Contents
MANAGING GLOBAL RISK |
| 48 | |
CREDIT RISK (1) |
| 49 | |
Consumer Credit |
| 49 | |
Corporate Credit |
| 56 | |
Additional Consumer and Corporate Credit Details |
| 58 | |
Loans Outstanding |
| 58 | |
Details of Credit Loss Experience |
| 60 | |
Allowance for Loan Losses |
| 61 | |
Non-Accrual Loans and Assets and Renegotiated Loans |
| 62 | |
LIQUIDITY RISK |
| 66 | |
High-Quality Liquid Assets (HQLA) |
| 66 | |
Loans |
| 67 | |
Deposits |
| 67 | |
Long-Term Debt |
| 68 | |
Secured Funding Transactions and Short-Term Borrowings |
| 70 | |
Liquidity Coverage Ratio (LCR) |
| 71 | |
Credit Ratings |
| 72 | |
MARKET RISK (1) |
| 74 | |
Market Risk of Non-Trading Portfolios |
| 74 | |
Market Risk of Trading Portfolios |
| 85 | |
COUNTRY RISK |
| 87 | |
(1) | For additional information regarding certain credit risk, market risk and other quantitative and qualitative information, refer to Citi's Pillar 3 Basel III Advanced Approaches Disclosures, as required by the rules of the Federal Reserve Board, on Citi's Investor Relations website. |
47
MANAGING GLOBAL RISK
For Citi, effective risk management is of primary importance to its overall operations. Accordingly, Citi's risk management process has been designed to monitor, evaluate and manage the principal risks it assumes in conducting its activities. Specifically, the activities that Citi engages in, and the risks those activities generate, must be consistent with Citi's mission and value proposition, the key principles that guide it, and Citi's risk appetite.
For more information on Citi's management of global risk, including its three lines of defense, see "Managing Global Risk" in Citi's 2016 Annual Report on Form 10-K.
48
CREDIT RISK
For additional information on credit risk, including Citi's credit risk management, measurement and stress testing, see "Credit Risk" and "Risk Factors" in Citi's 2016 Annual Report on Form 10-K.
CONSUMER CREDIT
Citi provides traditional retail banking, including commercial banking, and credit card products in 19 countries and jurisdictions through North America GCB , Latin America GCB and Asia GCB . The retail banking products include consumer mortgages, home equity, personal, commercial loans and lines of credit, and similar related products with a focus on lending to prime customers. Citi uses its risk appetite
framework to define its lending parameters. In addition, Citi uses proprietary scoring models for new customer approvals. As stated in " Global Consumer Banking " above, GCB 's overall strategy is to leverage Citi's global footprint and be the preeminent bank for the affluent and emerging affluent consumers in large urban centers. In credit cards and in certain retail markets, Citi serves customers in a somewhat broader set of segments and geographies. GCB 's commercial banking business focuses on small to mid-sized businesses.
Consumer Credit Portfolio
The following tables show Citi's quarterly end-of-period consumer loans: (1)
In billions of dollars | 2Q'16 | 3Q'16 | 4Q'16 | 1Q'17 | 2Q'17 | ||||||||||
Retail banking: |
|
|
|
|
| ||||||||||
Mortgages | $ | 81.6 | | $ | 81.4 | | $ | 79.4 | | $ | 81.2 | | $ | 81.4 | |
Commercial banking | 32.6 | | 33.2 | | 32.0 | | 33.9 | | 34.8 | | |||||
Personal and other | 27.2 | | 27.0 | | 24.9 | | 26.3 | | 27.2 | | |||||
Total retail banking | $ | 141.4 | | $ | 141.6 | | $ | 136.3 | | $ | 141.4 | | $ | 143.4 | |
Cards: |
|
|
|
|
| ||||||||||
Citi-branded cards | $ | 100.1 | | $ | 103.9 | | $ | 108.3 | | $ | 105.7 | | $ | 109.9 | |
Citi retail services | 43.3 | | 43.9 | | 47.3 | | 44.2 | | 45.2 | | |||||
Total cards | $ | 143.4 | | $ | 147.8 | | $ | 155.6 | | $ | 149.9 | | $ | 155.1 | |
Total GCB | $ | 284.8 | | $ | 289.4 | | $ | 291.9 | | $ | 291.3 | | $ | 298.5 | |
GCB regional distribution: |
|
|
|
|
| ||||||||||
North America | 62 | % | 62 | % | 64 | % | 62 | % | 62 | % | |||||
Latin America | 8 | | 8 | | 8 | | 9 | | 9 | | |||||
Asia (2) | 30 | | 30 | | 28 | | 29 | | 29 | | |||||
Total GCB | 100 | % | 100 | % | 100 | % | 100 | % | 100 | % | |||||
Corporate/Other (3) | $ | 41.3 | | $ | 39.0 | | $ | 33.2 | | $ | 29.3 | | $ | 26.8 | |
Total consumer loans | $ | 326.1 | | $ | 328.4 | | $ | 325.1 | | $ | 320.6 | | $ | 325.3 | |
(1) | End-of-period loans include interest and fees on credit cards. |
(2) | Asia includes loans and leases in certain EMEA countries for all periods presented. |
(3) | Primarily consists of legacy assets, principally North America consumer mortgages. |
For information on changes to Citi's end-of-period consumer loans, see "Liquidity Risk-Loans" below.
49
Overall Consumer Credit Trends
The following charts show the quarterly trends in delinquencies and net credit losses across both retail banking, including commercial banking, and cards for total GCB and by region.
Global Consumer Banking |

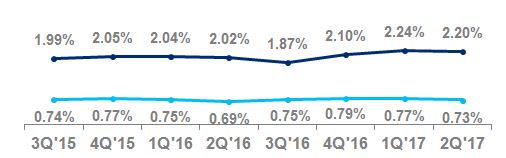
North America |
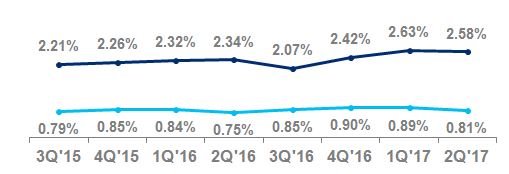
Latin America |
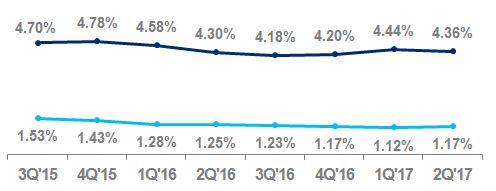
Asia (1) |
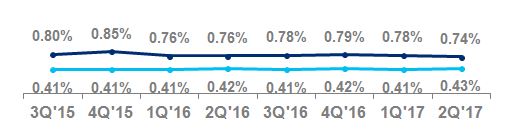
(1) | Asia includes GCB activities in certain EMEA countries for all periods presented. |
North America GCB provides mortgages, home equity loans, personal loans and commercial banking products through Citi's retail banking network, and card products through Citi-branded cards and Citi retail services businesses. The retail bank is concentrated in six major metropolitan cities in the United States (for additional information on the U.S. retail bank, see " North America GCB " above).
As of June 30, 2017 , approximately 70% of North America GCB consumer loans consisted of Citi-branded and Citi retail services cards, which drove the overall credit performance of North America GCB (for additional information on North America GCB 's cards portfolios, including delinquencies and net credit losses, see "Credit Card Trends" below).
Latin America GCB operates in Mexico through Citibanamex, one of Mexico's largest banks, and provides credit cards, consumer mortgages, personal loans and commercial banking products. Latin America GCB serves a more mass market segment in Mexico and focuses on developing multi-product relationships with customers.
As set forth in the chart above, 90+ days past due
delinquencies modestly improved and net credit loss rates slightly increased in Latin America GCB year-over-year as of the second quarter of 2017, while the delinquency rate increased and the net credit loss rate decreased quarter-over-quarter. The sequential improvement in the net credit loss rate and increase in the delinquency rate were mostly driven by seasonality.
Asia GCB operates in 17 countries in Asia and EMEA and provides credit cards, consumer mortgages, personal loans and commercial banking products.
As shown in the chart above, 90+ days past due delinquency and net credit loss rates were largely stable in Asia GCB year-over-year and quarter-over-quarter as of the second quarter of 2017. This stability reflects the strong credit profiles in Asia GCB 's target customer segments. In addition, regulatory changes in many markets in Asia over the past few years have resulted in stable or improved portfolio credit quality, despite weaker macroeconomic conditions in several countries.
For additional information on cost of credit, loan delinquency and other information for Citi's consumer loan portfolios, see each respective business's results of operations above and Note 13 to the Consolidated Financial Statements.
50
Credit Card Trends
The following charts show the quarterly trends in delinquencies and net credit losses for total GCB cards, Citi's North America Citi-branded cards and Citi retail services portfolios as well as for Citi's Latin America and Asia Citi-branded cards portfolios.
Total Cards |
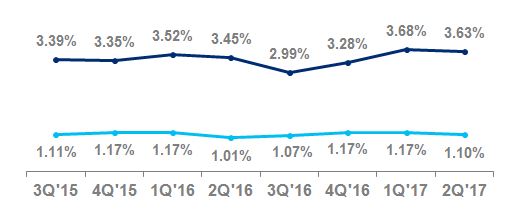
North America Citi-Branded Cards |

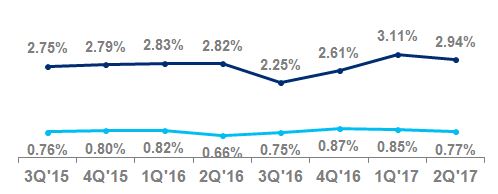
North America Citi Retail Services |

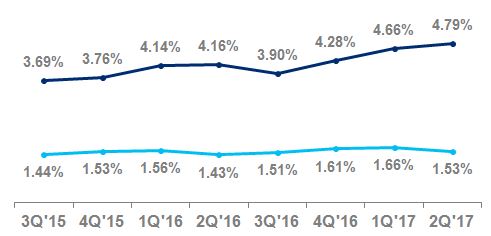
Latin America Citi-Branded Cards |

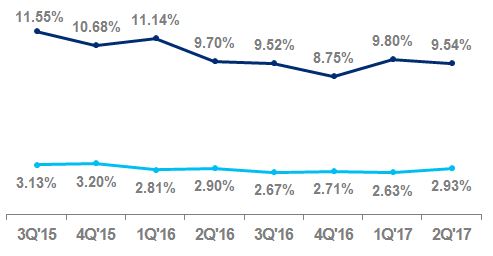
Asia Citi-Branded Cards (1) |

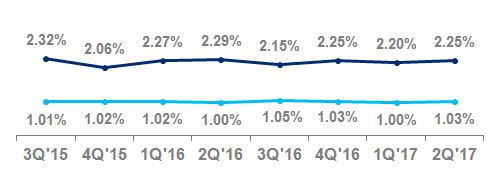
(1) | Asia includes loans and leases in certain EMEA countries for all periods presented. |
51
North America GCB 's Citi-branded cards portfolio issues proprietary and co-branded cards. As shown in the chart above, 90+ days past due delinquency rates in Citi-branded cards increased year-over-year as of the second quarter of 2017 primarily due to the impact of the Costco portfolio,
organic volume growth and seasoning, and decreased quarter-over-quarter, due to the flow-through of delinquencies to credit losses related to the Costco conversion and seasonality. Net credit loss rates increased year-over-year primarily due to
the Costco portfolio acquisition, organic volume growth and
seasoning, and decreased quarter-over-quarter due to the flow-through of delinquencies to credit losses related to the Costco conversion in the first quarter of 2017 and seasonality.
Citi retail services partners directly with more than 20 retailers and dealers to offer private-label and co-branded consumer and commercial cards. Citi retail services' target market is focused on select industry segments such as home improvement, specialty retail, consumer electronics and fuel. Citi retail services continually evaluates opportunities to add partners within target industries that have strong loyalty, lending or payment programs and growth potential.
Citi retail services' delinquency and net credit loss rates increased year-over-year, primarily due to seasoning and the impact of changes in collection processes. The net credit loss rate also increased quarter-over-quarter due to the softness in the collections rates experienced once an account reaches mid-stage delinquency. The delinquency rate decreased quarter-over-quarter due to seasonality.
Latin America GCB issues proprietary and co-branded cards. As set forth in the chart above, 90+ days past due delinquency rates and net credit loss rates have continued to improve or remained stable year-over-year as of the second quarter of 2017. The net credit loss rate decreased and delinquency rate increased quarter-over-quarter, both primarily driven by seasonality.
Asia GCB issues proprietary and co-branded cards. As set forth in the chart above, 90+ days past due delinquency and net credit loss rates have remained broadly stable, driven by mature and well-diversified cards portfolios.
For additional information on cost of credit, delinquency and other information for Citi's cards portfolios, see each respective business's results of operations above and Note 13 to the Consolidated Financial Statements.
North America Cards FICO Distribution
The following tables show the current FICO score distributions for Citi's North America Citi-branded cards and Citi retail services portfolios based on end-of-period receivables. FICO scores are updated monthly for substantially all of the portfolio and on a quarterly basis for the remaining portfolio.
|
| |||
FICO distribution | June 30, 2017 | December 31, 2016 | ||
> 720 | 63 | % | 64 | % |
660 - 720 | 26 | | 26 | |
620 - 660 | 7 | | 6 | |
< 620 | 4 | | 4 | |
Total | 100 | % | 100 | % |
|
| |||
FICO distribution | June 30, 2017 | December 31, 2016 | ||
> 720 | 41 | % | 42 | % |
660 - 720 | 35 | | 35 | |
620 - 660 | 13 | | 13 | |
< 620 | 11 | | 10 | |
Total | 100 | % | 100 | % |
As indicated by the tables above, the FICO distributions for Citi-branded cards and Citi retail services cards portfolios were largely unchanged versus year-end 2016. For additional information on FICO scores, see Note 13 to the Consolidated Financial Statements.
52
North America Consumer Mortgage Lending
Citi's North America consumer mortgage portfolio consists of both residential first mortgages and home equity loans. The following table shows the outstanding quarterly end-of-period loans for Citi's North America residential first mortgage and home equity loan portfolios:
In billions of dollars | 2Q'16 | 3Q'16 | 4Q'16 | 1Q'17 | 2Q'17 | ||||||||||
GCB : |
|
|
|
|
| ||||||||||
Residential firsts | $ | 40.1 | | $ | 40.1 | | $ | 40.2 | | $ | 40.3 | | $ | 40.2 | |
Home equity | 3.8 | | 3.9 | | 4.0 | | 4.0 | | 4.1 | | |||||
Total GCB | $ | 43.9 | | $ | 44.0 | | $ | 44.2 | | $ | 44.3 | | $ | 44.3 | |
Corporate/Other : |
|
|
|
|
| ||||||||||
Residential firsts | $ | 15.8 | | $ | 14.8 | | $ | 13.4 | | $ | 12.3 | | $ | 11.0 | |
Home equity | 17.3 | | 16.1 | | 15.0 | | 13.4 | | 12.4 | | |||||
Total Corporate/ Other | $ | 33.1 | | $ | 30.9 | | $ | 28.4 | | $ | 25.7 | | $ | 23.4 | |
Total Citigroup- North America | $ | 77.0 | | $ | 74.9 | | $ | 72.6 | | $ | 70.0 | | $ | 67.7 | |
For additional information on delinquency and net credit loss trends in Citi's consumer mortgage portfolio, see "Additional Consumer Credit Details" below.
Home Equity Loans-Revolving HELOCs
As set forth in the table above, Citi had $16.5 billion of home equity loans as of June 30, 2017 , of which $3.9 billion are fixed-rate home equity loans and $12.6 billion are extended under home equity lines of credit (Revolving HELOCs). Fixed-rate home equity loans are fully amortizing. Revolving HELOCs allow for amounts to be drawn for a period of time with the payment of interest only until the end of the draw period, when the outstanding amount is converted to an amortizing loan, or "reset" (the interest-only payment feature during the revolving period is standard for this product across the industry). Upon reset, these borrowers will be required to pay both interest, usually at a variable rate, and principal that amortizes typically over 20 years, rather than the standard 30-year amortization.
Of the Revolving HELOCs at June 30, 2017 , $6.6 billion had reset (compared to $6.4 billion at March 31, 2017) and $6.0 billion were still within their revolving period that had not reset (compared to $6.8 billion at March 31, 2017). The following chart indicates the FICO and combined loan-to-value (CLTV) characteristics of Citi's Revolving HELOCs portfolio and the year in which they reset:
North America Home Equity Lines of Credit Amortization – Citigroup Total ENR by Reset Year In billions of dollars as of June 30, 2017 |
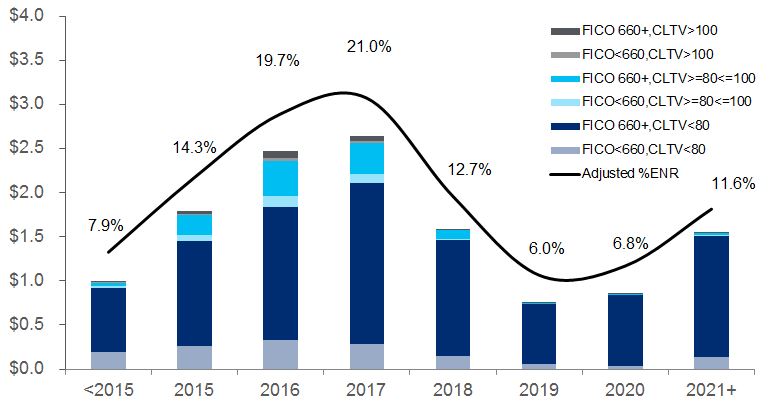 Note: Totals may not sum due to rounding.
Approximately 53% of Citi's total Revolving HELOCs portfolio had reset as of June 30, 2017 (compared to 49% as of March 31, 2017). Of the remaining Revolving HELOCs portfolio, approximately 22% will commence amortization during the remainder of 2017 . Citi's customers with Revolving HELOCs that reset could experience "payment shock" due to the higher required payments on the loans. Citi currently estimates that the monthly loan payment for its Revolving HELOCs that reset during the remainder of 2017 could increase on average by approximately $356, or 115%. Increases in interest rates could further increase these payments given the variable nature of the interest rates on these loans post-reset. Borrowers' high loan-to-value positions, as well as the cost and availability of refinancing options, could limit borrowers' ability to refinance their Revolving HELOCs as these loans begin to reset.
Approximately 5.9% of the Revolving HELOCs that have reset as of June 30, 2017 were 30+ days past due, compared to 3.7% of the total outstanding home equity loan portfolio (amortizing and non-amortizing). This compared to 6.4% and 3.9%, respectively, as of March 31, 2017. As newly amortizing loans continue to season, the delinquency rate of Citi's total home equity loan portfolio could increase. In addition, resets to date have generally occurred during a period of historically low interest rates, which Citi believes has likely reduced the overall "payment shock" to the borrower.
Citi monitors this reset risk closely and will continue to consider any potential impact in determining its allowance for loan loss reserves. In addition, management continues to review and take additional actions to offset potential reset risk, such as a borrower outreach program to provide reset risk education and proactively working with high-risk borrowers through a specialized single point of contact unit.
53
Additional Consumer Credit Details
Consumer Loan Delinquency Amounts and Ratios
| EOP loans (1) | 90+ days past due (2) | 30–89 days past due (2) | ||||||||||||||||||
In millions of dollars, | June 30, | June 30, | March 31, | June 30, | June 30, | March 31, | June 30, | ||||||||||||||
Global Consumer Banking (3)(4) |
|
|
|
|
|
|
| ||||||||||||||
Total | $ | 298.5 | | $ | 2,183 | | $ | 2,241 | | $ | 1,965 | | $ | 2,498 | | $ | 2,516 | | $ | 2,318 | |
Ratio |
| 0.73 | % | 0.77 | % | 0.69 | % | 0.84 | % | 0.87 | % | 0.82 | % | ||||||||
Retail banking |
|
|
|
|
|
|
| ||||||||||||||
Total | $ | 143.4 | | $ | 477 | | $ | 488 | | $ | 515 | | $ | 747 | | $ | 777 | | $ | 735 | |
Ratio |
| 0.33 | % | 0.35 | % | 0.37 | % | 0.52 | % | 0.55 | % | 0.52 | % | ||||||||
North America | 55.6 | | 155 | | 182 | | 180 | | 191 | | 189 | | 192 | | |||||||
Ratio |
| 0.28 | % | 0.33 | % | 0.33 | % | 0.35 | % | 0.35 | % | 0.36 | % | ||||||||
Latin America | 21.0 | | 150 | | 141 | | 157 | | 216 | | 246 | | 197 | | |||||||
Ratio |
| 0.71 | % | 0.72 | % | 0.82 | % | 1.03 | % | 1.25 | % | 1.03 | % | ||||||||
Asia (5) | 66.8 | | 172 | | 165 | | 178 | | 340 | | 342 | | 346 | | |||||||
Ratio |
| 0.26 | % | 0.25 | % | 0.26 | % | 0.51 | % | 0.52 | % | 0.51 | % | ||||||||
Cards |
|
|
|
|
|
|
| ||||||||||||||
Total | $ | 155.1 | | $ | 1,706 | | $ | 1,753 | | $ | 1,450 | | $ | 1,751 | | $ | 1,739 | | $ | 1,583 | |
Ratio |
| 1.10 | % | 1.17 | % | 1.01 | % | 1.13 | % | 1.16 | % | 1.10 | % | ||||||||
North America-Citi-branded | 85.6 | | 659 | | 698 | | 510 | | 619 | | 632 | | 550 | | |||||||
Ratio |
| 0.77 | % | 0.85 | % | 0.66 | % | 0.72 | % | 0.77 | % | 0.71 | % | ||||||||
North America-Citi retail services | 45.2 | | 693 | | 735 | | 619 | | 730 | | 730 | | 669 | | |||||||
Ratio |
| 1.53 | % | 1.66 | % | 1.43 | % | 1.62 | % | 1.65 | % | 1.55 | % | ||||||||
Latin America | 5.5 | | 161 | | 137 | | 145 | | 151 | | 145 | | 137 | | |||||||
Ratio |
| 2.93 | % | 2.63 | % | 2.90 | % | 2.75 | % | 2.79 | % | 2.74 | % | ||||||||
Asia (5) | 18.8 | | 193 | | 183 | | 176 | | 251 | | 232 | | 227 | | |||||||
Ratio |
| 1.03 | % | 1.00 | % | 1.00 | % | 1.34 | % | 1.27 | % | 1.29 | % | ||||||||
Corporate/Other -Consumer (6)(7) |
|
|
|
|
|
|
| ||||||||||||||
Total | $ | 26.8 | | $ | 601 | | $ | 684 | | $ | 878 | | $ | 554 | | $ | 615 | | $ | 858 | |
Ratio |
| 2.37 | % | 2.45 | % | 2.23 | % | 2.18 | % | 2.20 | % | 2.18 | % | ||||||||
International | 1.8 | | 63 | | 77 | | 170 | | 44 | | 60 | | 138 | | |||||||
Ratio |
| 3.50 | % | 3.67 | % | 3.09 | % | 2.44 | % | 2.86 | % | 2.51 | % | ||||||||
North America | 25.0 | | 538 | | 607 | | 708 | | 510 | | 555 | | 720 | | |||||||
Ratio |
| 2.28 | % | 2.35 | % | 2.09 | % | 2.16 | % | 2.15 | % | 2.12 | % | ||||||||
Total Citigroup | 325.3 | | $ | 2,784 | | $ | 2,925 | | $ | 2,843 | | $ | 3,052 | | $ | 3,131 | | $ | 3,176 | | |
Ratio |
| 0.86 | % | 0.92 | % | 0.88 | % | 0.94 | % | 0.98 | % | 0.98 | % | ||||||||
(1) | End-of-period (EOP) loans include interest and fees on credit cards. |
(2) | The ratios of 90+ days past due and 30–89 days past due are calculated based on EOP loans, net of unearned income. |
(3) | The 90+ days past due balances for North America-Citi-branded and North America-Citi retail services are generally still accruing interest. Citigroup's policy is generally to accrue interest on credit card loans until 180 days past due, unless notification of bankruptcy filing has been received earlier. |
(4) | The 90+ days past due and 30–89 days past due and related ratios for GCB North America exclude U.S. mortgage loans that are guaranteed by U.S. government-sponsored entities since the potential loss predominantly resides within the U.S. government-sponsored entities. The amounts excluded for loans 90+ days past due and (EOP loans) were $295 million ($0.8 billion), $313 million ($0.8 billion) and $408 million ($0.9 billion) at June 30, 2017, March 31, 2017, and June 30, 2016, respectively. The amounts excluded for loans 30–89 days past due (EOP loans have the same adjustment as above) were $84 million, $84 million and $91 million at June 30, 2017, March 31, 2017, and June 30, 2016, respectively. |
(5) | Asia includes delinquencies and loans in certain EMEA countries for all periods presented. |
(6) | The 90+ days past due and 30–89 days past due and related ratios for Corporate/Other-North America consumer exclude U.S. mortgage loans that are guaranteed by U.S. government-sponsored entities since the potential loss predominantly resides within the U.S. government-sponsored entities. The amounts excluded for loans 90+ days past due (and EOP loans) were $0.7 billion ($1.3 billion), $0.8 billion ($1.4 billion) and $1.2 billion ($1.8 billion) at June 30, 2017, March 31, 2017, and June 30, 2016, respectively. The amounts excluded for loans 30–89 days past due (EOP loans have the same adjustment as above) for each period were $0.2 billion, $0.1 billion and $0.2 billion at June 30, 2017, March 31, 2017, and June 30, 2016, respectively. |
54
(7) | The June 30, 2017, March 31, 2016, and June 30, 2016 loans 90+ days past due and 30–89 days past due and related ratios for North America exclude $6 million, $7 million and $9 million, respectively, of loans that are carried at fair value. |
Consumer Loan Net Credit Losses and Ratios
| Average loans (1) | Net credit losses (2)(3) | ||||||||||
In millions of dollars, except average loan amounts in billions | 2Q17 | 2Q17 | 1Q17 | 2Q16 | ||||||||
Global Consumer Banking |
|
|
|
| ||||||||
Total | $ | 293.8 | | $ | 1,615 | | $ | 1,603 | | $ | 1,374 | |
Ratio |
| 2.20 | % | 2.24 | % | 2.02 | % | |||||
Retail banking |
|
|
|
| ||||||||
Total | $ | 142.3 | | $ | 244 | | $ | 236 | | $ | 243 | |
Ratio |
| 0.69 | % | 0.69 | % | 0.69 | % | |||||
North America | 55.6 | | 39 | | 37 | | 45 | | ||||
Ratio |
| 0.28 | % | 0.27 | % | 0.33 | % | |||||
Latin America | 20.2 | | 151 | | 137 | | 137 | | ||||
Ratio |
| 3.00 | % | 3.04 | % | 2.87 | % | |||||
Asia (4) | 66.5 | | 54 | | 62 | | 61 | | ||||
Ratio |
| 0.33 | % | 0.39 | % | 0.36 | % | |||||
Cards |
|
|
|
| ||||||||
Total | $ | 151.5 | | $ | 1,371 | | $ | 1,367 | | $ | 1,131 | |
Ratio |
| 3.63 | % | 3.68 | % | 3.45 | % | |||||
North America-Citi-branded | 83.3 | | 611 | | 633 | | 467 | | ||||
Ratio |
| 2.94 | % | 3.11 | % | 2.82 | % | |||||
North America-Retail services | 44.5 | | 531 | | 520 | | 442 | | ||||
Ratio |
| 4.79 | % | 4.66 | % | 4.16 | % | |||||
Latin America | 5.3 | | 126 | | 116 | | 123 | | ||||
Ratio |
| 9.54 | % | 9.80 | % | 9.70 | % | |||||
Asia (4) | 18.4 | | 103 | | 98 | | 99 | | ||||
Ratio |
| 2.25 | % | 2.20 | % | 2.29 | % | |||||
Corporate/Other -Consumer (3) |
|
|
|
| ||||||||
Total | $ | 27.8 | | $ | 18 | | $ | 69 | | $ | 101 | |
Ratio |
| 0.26 | % | 0.88 | % | 0.94 | % | |||||
International | 1.9 | | 24 | | 26 | | 77 | | ||||
Ratio |
| 5.07 | % | 5.02 | % | 5.08 | % | |||||
North America | 25.9 | | (6 | ) | 43 | | 24 | | ||||
Ratio |
| (0.09 | )% | 0.59 | % | 0.26 | % | |||||
Other | 0.1 | | - | | - | | - | | ||||
Total Citigroup | $ | 321.7 | | $ | 1,633 | | $ | 1,672 | | $ | 1,475 | |
Ratio |
| 2.04 | % | 2.11 | % | 1.87 | % | |||||
(1) | Average loans include interest and fees on credit cards. |
(2) | The ratios of net credit losses are calculated based on average loans, net of unearned income. |
(3) | In October 2016, Citi entered into agreements to sell Citi's Brazil and Argentina consumer banking businesses and classified these businesses as held-for-sale (HFS). The sale of the Argentina consumer banking business was completed at the end of the first quarter 2017. As a result of HFS accounting treatment, approximately $42 million, $41 million and $38 million of net credit losses (NCLs) were recorded as a reduction in revenue ( Other revenue ) during the fourth quarter of 2016, the first quarter of 2017 and the second quarter of 2017, respectively. Accordingly, these NCLs are not included in this table. Loans classified as HFS are excluded from this table as they are recorded in Other assets . |
(4) | Asia includes NCLs and average loans in certain EMEA countries for all periods presented. |
55
CORPORATE CREDIT
Consistent with its overall strategy, Citi's corporate clients are typically large, multi-national corporations that value Citi's global network. Citi aims to establish relationships with these clients that encompass multiple products, consistent with client needs, including cash management and trade services, foreign exchange, lending, capital markets and M&A advisory.
Corporate Credit Portfolio
The following table sets forth Citi's corporate credit portfolio within ICG (excluding private bank), before consideration of collateral or hedges, by remaining tenor for the periods indicated:
| At June 30, 2017 | At March 31, 2017 | At December 31, 2016 | |||||||||||||||||||||||||||||||||
In billions of dollars | Due within 1 year | Greater than 1 year but within 5 years | Greater than 5 years | Total exposure | Due | Greater | Greater | Total | Due within 1 year | Greater than 1 year but within 5 years | Greater than 5 years | Total exposure | ||||||||||||||||||||||||
Direct outstandings (on-balance sheet) (1) | $ | 122 | | $ | 94 | | $ | 23 | | $ | 239 | | $ | 129 | | $ | 82 | | $ | 20 | | $ | 231 | | $ | 109 | | $ | 94 | | $ | 22 | | $ | 225 | |
Unfunded lending commitments (off-balance sheet) (2) | 103 | | 222 | | 22 | | 347 | | 113 | | 221 | | 23 | | 357 | | 103 | | 218 | | 23 | | 344 | | ||||||||||||
Total exposure | $ | 225 | | $ | 316 | | $ | 45 | | $ | 586 | | $ | 242 | | $ | 303 | | $ | 43 | | $ | 588 | | $ | 212 | | $ | 312 | | $ | 45 | | $ | 569 | |
(1) | Includes drawn loans, overdrafts, bankers' acceptances and leases. |
(2) | Includes unused commitments to lend, letters of credit and financial guarantees. |
Portfolio Mix-Geography, Counterparty and Industry
Citi's corporate credit portfolio is diverse across geography and counterparty. The following table shows the percentage by region based on Citi's internal management geography:
| June 30, | March 31, | December 31, | |||
North America | 55 | % | 53 | % | 55 | % |
EMEA | 26 | | 26 | | 26 | |
Asia | 12 | | 13 | | 12 | |
Latin America | 7 | | 8 | | 7 | |
Total | 100 | % | 100 | % | 100 | % |
The maintenance of accurate and consistent risk ratings across the corporate credit portfolio facilitates the comparison of credit exposure across all lines of business, geographic regions and products. Counterparty risk ratings reflect an estimated probability of default for a counterparty and are derived primarily through the use of validated statistical models, scorecard models and external agency ratings (under defined circumstances), in combination with consideration of factors specific to the obligor or market, such as management experience, competitive position, regulatory environment and commodity prices. Facility risk ratings are assigned that reflect the probability of default of
the obligor and factors that affect the loss-given-default of the facility, such as support or collateral. Internal obligor ratings that generally correspond to BBB and above are
considered investment grade, while those below are considered non-investment grade.
Citigroup also has incorporated climate risk assessment and reporting criteria for certain obligors, as necessary. Factors evaluated include consideration of climate risk to an
obligor's business and physical assets and, when relevant, consideration of cost-effective options to reduce greenhouse gas emissions.
The following table presents the corporate credit portfolio by facility risk rating as a percentage of the total corporate credit portfolio:
| Total exposure | |||||
| June 30, | March 31, | December 31, | |||
AAA/AA/A | 49 | % | 48 | % | 48 | % |
BBB | 34 | | 34 | | 34 | |
BB/B | 16 | | 16 | | 16 | |
CCC or below | 1 | | 2 | | 2 | |
Total | 100 | % | 100 | % | 100 | % |
Note: Total exposure includes direct outstandings and unfunded lending commitments.
56
Citi's corporate credit portfolio is also diversified by industry. The following table shows the allocation of Citi's total corporate credit portfolio by industry:
| Total exposure | |||||
| June 30, | March 31, | December 31, | |||
Transportation and industrial | 21 | % | 21 | % | 22 | % |
Consumer retail and health | 17 | | 16 | | 16 | |
Technology, media and telecom | 11 | | 12 | | 12 | |
Power, chemicals, metals and mining | 10 | | 11 | | 11 | |
Energy and commodities (1) | 9 | | 8 | | 9 | |
Real estate | 8 | | 7 | | 7 | |
Banks/broker-dealers/finance companies | 7 | | 6 | | 6 | |
Hedge funds | 5 | | 5 | | 5 | |
Insurance and special purpose entities | 5 | | 5 | | 5 | |
Public sector | 5 | | 5 | | 5 | |
Other industries | 2 | | 4 | | 2 | |
Total | 100 | % | 100 | % | 100 | % |
Note: Total exposure includes direct outstandings and unfunded lending commitments.
(1) In addition to this exposure, Citi has energy-related exposure within the "Public sector" (e.g., energy-related state-owned entities) and "Transportation and industrial" sector (e.g., off-shore drilling entities) included in the table above. As of June 30, 2017 , Citi's total exposure to these energy-related entities remained largely consistent with the prior quarter, at approximately $6 billion, of which approximately $4 billion consisted of direct outstanding funded loans.
Credit Risk Mitigation
As part of its overall risk management activities, Citigroup uses credit derivatives and other risk mitigants to hedge portions of the credit risk in its corporate credit portfolio, in addition to outright asset sales. The results of the mark-to-market and any realized gains or losses on credit derivatives are reflected primarily in Other revenue on the Consolidated Statement of Income.
At June 30, 2017 , March 31, 2017, December 31, 2016 ,$23.7 billion, $27.6 billion and $29.5 billion, respectively, of the corporate credit portfolio was economically hedged. Citigroup's expected loss model used in the calculation of its loan loss reserve does not include the favorable impact of credit derivatives and other mitigants that are marked-to-market. In addition, the reported amounts of direct outstandings and unfunded lending commitments in the tables above do not reflect the impact of these hedging transactions. The credit protection was economically hedging underlying corporate credit portfolio exposures with the following risk rating distribution:
Rating of Hedged Exposure
| June 30, | March 31, | December 31, | |||
AAA/AA/A | 16 | % | 16 | % | 16 | % |
BBB | 47 | | 49 | | 49 | |
BB/B | 34 | | 31 | | 31 | |
CCC or below | 3 | | 4 | | 4 | |
Total | 100 | % | 100 | % | 100 | % |
The credit protection was economically hedging underlying corporate credit portfolio exposures with the following industry distribution:
Industry of Hedged Exposure
| June 30, | March 31, | December 31, | |||
Transportation and industrial | 27 | % | 28 | % | 29 | % |
Energy and commodities | 20 | | 19 | | 20 | |
Consumer retail and health | 11 | | 13 | | 10 | |
Technology, media and telecom | 13 | | 13 | | 13 | |
Power, chemicals, metals and mining | 13 | | 12 | | 12 | |
Public sector | 6 | | 6 | | 5 | |
Banks/broker-dealers | 5 | | 4 | | 4 | |
Insurance and special purpose entities | 2 | | 3 | | 3 | |
Other industries | 3 | | 2 | | 4 | |
Total | 100 | % | 100 | % | 100 | % |
57
ADDITIONAL CONSUMER AND CORPORATE CREDIT DETAILS
Loans Outstanding
| 2nd Qtr. | 1st Qtr. | 4th Qtr. | 3rd Qtr. | 2nd Qtr. | ||||||||||
In millions of dollars | 2017 | 2017 | 2016 | 2016 | 2016 | ||||||||||
Consumer loans | | | | | | ||||||||||
In U.S. offices | | | | | | ||||||||||
Mortgage and real estate (1) | $ | 69,022 | | $ | 71,170 | | $ | 72,957 | | $ | 75,057 | | $ | 77,242 | |
Installment, revolving credit, and other | 3,190 | | 3,252 | | 3,395 | | 3,465 | | 3,486 | | |||||
Cards | 130,181 | | 125,799 | | 132,654 | | 124,637 | | 120,113 | | |||||
Commercial and industrial | 7,404 | | 7,434 | | 7,159 | | 6,989 | | 7,041 | | |||||
Total | $ | 209,797 | | $ | 207,655 | | $ | 216,165 | | $ | 210,148 | | $ | 207,882 | |
In offices outside the U.S. |
|
|
|
|
| ||||||||||
Mortgage and real estate (1) | $ | 43,821 | | $ | 43,822 | | $ | 42,803 | | $ | 45,751 | | $ | 46,049 | |
Installment, revolving credit, and other | 26,480 | | 26,014 | | 24,887 | | 28,217 | | 27,830 | | |||||
Cards | 25,376 | | 24,497 | | 23,783 | | 25,833 | | 25,844 | | |||||
Commercial and industrial | 18,956 | | 17,728 | | 16,568 | | 17,498 | | 17,520 | | |||||
Lease financing | 81 | | 83 | | 81 | | 113 | | 140 | | |||||
Total | $ | 114,714 | | $ | 112,144 | | $ | 108,122 | | $ | 117,412 | | $ | 117,383 | |
Total consumer loans | $ | 324,511 | | $ | 319,799 | | $ | 324,287 | | $ | 327,560 | | $ | 325,265 | |
Unearned income (2) | 750 | | 757 | | 776 | | 812 | | 817 | | |||||
Consumer loans, net of unearned income | $ | 325,261 | | $ | 320,556 | | $ | 325,063 | | $ | 328,372 | | $ | 326,082 | |
Corporate loans | | | | | | ||||||||||
In U.S. offices | | | | | | ||||||||||
Commercial and industrial | $ | 50,341 | | $ | 49,845 | | $ | 49,586 | | $ | 50,156 | | $ | 50,286 | |
Loans to financial institutions | 36,953 | | 35,734 | | 35,517 | | 35,801 | | 32,001 | | |||||
Mortgage and real estate (1) | 42,041 | | 40,052 | | 38,691 | | 41,078 | | 40,175 | | |||||
Installment, revolving credit, and other | 31,611 | | 32,212 | | 34,501 | | 32,571 | | 32,491 | | |||||
Lease financing | 1,467 | | 1,511 | | 1,518 | | 1,532 | | 1,546 | | |||||
Total | $ | 162,413 | | $ | 159,354 | | $ | 159,813 | | $ | 161,138 | | $ | 156,499 | |
In offices outside the U.S. | | | | | | ||||||||||
Commercial and industrial | $ | 91,131 | | $ | 87,258 | | $ | 81,882 | | $ | 84,492 | | $ | 87,432 | |
Loans to financial institutions | 34,844 | | 33,763 | | 26,886 | | 27,305 | | 27,856 | | |||||
Mortgage and real estate (1) | 6,783 | | 5,527 | | 5,363 | | 5,595 | | 5,455 | | |||||
Installment, revolving credit, and other | 19,200 | | 16,576 | | 19,965 | | 25,462 | | 24,855 | | |||||
Lease financing | 234 | | 253 | | 251 | | 243 | | 255 | | |||||
Governments and official institutions | 5,518 | | 5,970 | | 5,850 | | 6,506 | | 5,757 | | |||||
Total | $ | 157,710 | | $ | 149,347 | | $ | 140,197 | | $ | 149,603 | | $ | 151,610 | |
Total corporate loans | $ | 320,123 | | $ | 308,701 | | $ | 300,010 | | $ | 310,741 | | $ | 308,109 | |
Unearned income (3) | (689 | ) | (662 | ) | (704 | ) | (678 | ) | (676 | ) | |||||
Corporate loans, net of unearned income | $ | 319,434 | | $ | 308,039 | | $ | 299,306 | | $ | 310,063 | | $ | 307,433 | |
Total loans-net of unearned income | $ | 644,695 | | $ | 628,595 | | $ | 624,369 | | $ | 638,435 | | $ | 633,515 | |
Allowance for loan losses-on drawn exposures | (12,025 | ) | (12,030 | ) | (12,060 | ) | (12,439 | ) | (12,304 | ) | |||||
Total loans-net of unearned income | $ | 632,670 | | $ | 616,565 | | $ | 612,309 | | $ | 625,996 | | $ | 621,211 | |
Allowance for loan losses as a percentage of total loans- | 1.88 | % | 1.93 | % | 1.94 | % | 1.97 | % | 1.96 | % | |||||
Allowance for consumer loan losses as a percentage of | 2.93 | % | 2.96 | % | 2.88 | % | 2.95 | % | 2.89 | % | |||||
Allowance for corporate loan losses as a percentage of | 0.80 | % | 0.83 | % | 0.91 | % | 0.90 | % | 0.95 | % | |||||
58
(1) | Loans secured primarily by real estate. |
(2) | Unearned income on consumer loans primarily represents unamortized origination fees, costs, premiums and discounts. |
(3) | Unearned income on corporate loans primarily represents interest received in advance but not yet earned on loans originated on a discounted basis. |
(4) | All periods exclude loans that are carried at fair value. |
59
Details of Credit Loss Experience
| 2nd Qtr. | 1st Qtr. | 4th Qtr. | 3rd Qtr. | 2nd Qtr. | ||||||||||
In millions of dollars | 2017 | 2017 | 2016 | 2016 | 2016 | ||||||||||
Allowance for loan losses at beginning of period | $ | 12,030 | | $ | 12,060 | | $ | 12,439 | | $ | 12,304 | | $ | 12,712 | |
Provision for loan losses |
|
|
|
|
| ||||||||||
Consumer | $ | 1,620 | | $ | 1,816 | | $ | 1,659 | | $ | 1,815 | | $ | 1,276 | |
Corporate | 46 | | (141 | ) | 68 | | (69 | ) | 114 | | |||||
Total | $ | 1,666 | | $ | 1,675 | | $ | 1,727 | | $ | 1,746 | | $ | 1,390 | |
Gross credit losses |
|
|
|
|
| ||||||||||
Consumer |
|
|
|
|
| ||||||||||
In U.S. offices | $ | 1,437 | | $ | 1,444 | | $ | 1,343 | | $ | 1,181 | | $ | 1,213 | |
In offices outside the U.S. | 597 | | 597 | | 605 | | 702 | | 678 | | |||||
Corporate |
|
|
|
|
| ||||||||||
In U.S. offices | 72 | | 48 | | 32 | | 29 | | 62 | | |||||
In offices outside the U.S. | 24 | | 55 | | 103 | | 36 | | 95 | | |||||
Total | $ | 2,130 | | $ | 2,144 | | $ | 2,083 | | $ | 1,948 | | $ | 2,048 | |
Credit recoveries (1) |
|
|
|
|
| ||||||||||
Consumer |
|
|
|
|
| ||||||||||
In U.S. offices | $ | 266 | | $ | 242 | | $ | 235 | | $ | 227 | | $ | 262 | |
In offices outside the U.S. | 135 | | 127 | | 137 | | 173 | | 154 | | |||||
Corporate |
|
|
|
|
| ||||||||||
In U.S. offices | 15 | | 2 | | 2 | | 16 | | 3 | | |||||
In offices outside the U.S. | 4 | | 64 | | 13 | | 7 | | 13 | | |||||
Total | $ | 420 | | $ | 435 | | $ | 387 | | $ | 423 | | $ | 432 | |
Net credit losses |
|
|
|
|
| ||||||||||
In U.S. offices | $ | 1,228 | | $ | 1,248 | | $ | 1,138 | | $ | 967 | | $ | 1,010 | |
In offices outside the U.S. | 482 | | 461 | | 558 | | 558 | | 606 | | |||||
Total | $ | 1,710 | | $ | 1,709 | | $ | 1,696 | | $ | 1,525 | | $ | 1,616 | |
Other-net (2)(3)(4)(5)(6)(7) | $ | 39 | | $ | 4 | | $ | (410 | ) | $ | (86 | ) | $ | (182 | ) |
Allowance for loan losses at end of period | $ | 12,025 | | $ | 12,030 | | $ | 12,060 | | $ | 12,439 | | $ | 12,304 | |
Allowance for loan losses as a percentage of total loans (8) | 1.88 | % | 1.93 | % | 1.94 | % | 1.97 | % | 1.96 | % | |||||
Allowance for unfunded lending commitments (9) | $ | 1,406 | | $ | 1,377 | | $ | 1,418 | | $ | 1,388 | | $ | 1,432 | |
Total allowance for loan losses and unfunded lending commitments | $ | 13,431 | | $ | 13,407 | | $ | 13,478 | | $ | 13,827 | | $ | 13,736 | |
Net consumer credit losses | $ | 1,633 | | $ | 1,672 | | $ | 1,576 | | $ | 1,483 | | $ | 1,475 | |
As a percentage of average consumer loans | 2.04 | % | 2.11 | % | 1.95 | % | 1.80 | % | 1.87 | % | |||||
Net corporate credit losses | $ | 77 | | $ | 37 | | $ | 120 | | $ | 42 | | $ | 141 | |
As a percentage of average corporate loans | 0.10 | % | 0.05 | % | 0.16 | % | 0.05 | % | 0.19 | % | |||||
Allowance by type at end of period (10) |
|
|
|
|
| ||||||||||
Consumer | $ | 9,515 | | $ | 9,495 | | $ | 9,358 | | $ | 9,673 | | $ | 9,432 | |
Corporate | 2,510 | | 2,535 | | 2,702 | | 2,766 | | 2,872 | | |||||
Total | $ | 12,025 | | $ | 12,030 | | $ | 12,060 | | $ | 12,439 | | $ | 12,304 | |
(1) | Recoveries have been reduced by certain collection costs that are incurred only if collection efforts are successful. |
(2) | Includes all adjustments to the allowance for credit losses, such as changes in the allowance from acquisitions, dispositions, securitizations, FX translation, purchase accounting adjustments, etc. |
(3) | The second quarter of 2017 includes a reduction of approximately $19 million related to the sale or transfer to held-for-sale (HFS) of various loan portfolios, including a reduction of $19 million related to the transfer of a real estate loan portfolio to HFS. Additionally, the second quarter includes an increase of approximately $50 million related to FX translation. |
(4) | The first quarter of 2017 includes a reduction of approximately $161 million related to the sale or transfer to HFS of various loan portfolios, including a reduction of $37 million related to the transfer of a real estate loan portfolio to HFS. Additionally, the first quarter includes an increase of approximately $164 million related to FX translation. |
(5) | The fourth quarter of 2016 includes a reduction of approximately $267 million related to the sale or transfer to HFS of various loan portfolios, including a reduction of $3 million related to the transfer of a real estate loan portfolio to HFS. Additionally, the fourth quarter includes a reduction of approximately $141 million related to FX translation. |
60
(6) | The third quarter of 2016 includes a reduction of approximately $58 million related to the sale or transfer to HFS of various loan portfolios, including a reduction of $50 million related to the transfer of a real estate loan portfolio to HFS. Additionally, the third quarter includes a reduction of approximately $46 million related to FX translation. |
(7) | The second quarter of 2016 includes a reduction of approximately $101 million related to the sale or transfer to HFS of various loan portfolios, including a reduction of $24 million related to the transfer of a real estate loan portfolio to HFS. Additionally, the second quarter includes a reduction of approximately $75 million related to FX translation. |
(8) | June 30, 2017, March 31, 2017, December 31, 2016, September 30, 2016 and June 30, 2016 exclude $4.2 billion, $4.0 billion, $3.5 billion, $4.0 billion and $4.1 billion, respectively, of loans which are carried at fair value. |
(9) | Represents additional credit reserves recorded as Other liabilities on the Consolidated Balance Sheet. |
(10) | Allowance for loan losses represents management's best estimate of probable losses inherent in the portfolio, as well as probable losses related to large individually evaluated impaired loans and troubled debt restructurings. See "Significant Accounting Policies and Significant Estimates" and Note 1 to the Consolidated Financial Statements in Citi's 2016 Annual Report on Form 10-K. Attribution of the allowance is made for analytical purposes only and the entire allowance is available to absorb probable credit losses inherent in the overall portfolio. |
Allowance for Loan Losses
The following tables detail information on Citi's allowance for loan losses, loans and coverage ratios:
| June 30, 2017 | |||||||
In billions of dollars | Allowance for loan losses | Loans, net of unearned income | Allowance as a percentage of loans (1) | |||||
North America cards (2) | $ | 5.4 | | $ | 130.9 | | 4.1 | % |
North America mortgages (3) | 0.9 | | 67.7 | | 1.3 | | ||
North America other | 0.4 | | 12.7 | | 3.1 | | ||
International cards | 1.3 | | 24.8 | | 5.2 | | ||
International other (4) | 1.5 | | 89.2 | | 1.7 | | ||
Total consumer | $ | 9.5 | | $ | 325.3 | | 2.9 | % |
Total corporate | 2.5 | | 319.4 | | 0.8 | | ||
Total Citigroup | $ | 12.0 | | $ | 644.7 | | 1.9 | % |
(1) | Allowance as a percentage of loans excludes loans that are carried at fair value. |
(2) | Includes both Citi-branded cards and Citi retail services. The $5.4 billion of loan loss reserves represented approximately 14 months of coincident net credit loss coverage. |
(3) | Of the $0.9 billion , approximately $0.8 billion was allocated to North America mortgages in Corporate/Other . Of the $0.9 billion , approximately $0.3 billion and $0.6 billion are determined in accordance with ASC 450-20 and ASC 310-10-35 (troubled debt restructurings), respectively. Of the $67.7 billion in loans, approximately $63.6 billion and $4.1 billion of the loans are evaluated in accordance with ASC 450-20 and ASC 310-10-35 (troubled debt restructurings), respectively. For additional information, see Note 14 to the Consolidated Financial Statements. |
(4) | Includes mortgages and other retail loans. |
| December 31, 2016 | |||||||
In billions of dollars | Allowance for loan losses | Loans, net of unearned income | Allowance as a percentage of loans (1) | |||||
North America cards (2) | $ | 5.2 | | $ | 133.3 | | 3.9 | % |
North America mortgages (3) | 1.1 | | 72.6 | | 1.5 | | ||
North America other | 0.5 | | 13.6 | | 3.7 | | ||
International cards | 1.2 | | 23.1 | | 5.2 | | ||
International other (4) | 1.4 | | 82.8 | | 1.7 | | ||
Total consumer | $ | 9.4 | | $ | 325.4 | | 2.9 | % |
Total corporate | 2.7 | | 299.0 | | 0.9 | | ||
Total Citigroup | $ | 12.1 | | $ | 624.4 | | 1.9 | % |
(1) | Allowance as a percentage of loans excludes loans that are carried at fair value. |
(2) | Includes both Citi-branded cards and Citi retail services. The $5.2 billion of loan loss reserves represented approximately 15 months of coincident net credit loss coverage. |
(3) | Of the $1.1 billion, approximately $1.0 billion was allocated to North America mortgages in Corporate/Other . Of the $1.1 billion, approximately $0.4 billion and $0.7 billion are determined in accordance with ASC 450-20 and ASC 310-10-35 (troubled debt restructurings), respectively. Of the $72.6 billion in loans, approximately $67.7 billion and $4.8 billion of the loans are evaluated in accordance with ASC 450-20 and ASC 310-10-35 (troubled debt restructurings), respectively. For additional information, see Note 14 to the Consolidated Financial Statements. |
(4) | Includes mortgages and other retail loans. |
61
Non-Accrual Loans and Assets and Renegotiated Loans
There is a certain amount of overlap among non-accrual loans and assets and renegotiated loans. The following summary provides a general description of each category:
Non-Accrual Loans and Assets:
• | Corporate and consumer (commercial banking) non-accrual status is based on the determination that payment of interest or principal is doubtful. |
• | A corporate loan may be classified as non-accrual and still be performing under the terms of the loan structure. Payments received on corporate non-accrual loans are generally applied to loan principal and not reflected as interest income. Approximately 67% and 65% of Citi's corporate non-accrual loans were performing at June 30, 2017 and March 31, 2017, respectively. |
• | Consumer non-accrual status is generally based on aging, i.e., the borrower has fallen behind on payments. |
• | Mortgage loans in regulated bank entities discharged through Chapter 7 bankruptcy, other than FHA insured loans, are classified as non-accrual. Non-bank mortgage loans discharged through Chapter 7 bankruptcy are classified as non-accrual at 90 days or more past due. In addition, home equity loans in regulated bank entities are classified as non-accrual if the related residential first mortgage loan is 90 days or more past due. |
• | North America Citi-branded cards and Citi retail services are not included because, under industry standards, credit card loans accrue interest until such loans are charged off, which typically occurs at 180 days contractual delinquency. |
Renegotiated Loans:
• | Includes both corporate and consumer loans whose terms have been modified in a troubled debt restructuring (TDR). |
• | Includes both accrual and non-accrual TDRs. |
62
Non-Accrual Loans and Assets
The table below summarizes Citigroup's non-accrual loans as of the periods indicated. Non-accrual loans may still be current on interest payments. In situations where Citi reasonably expects that only a portion of the principal owed will ultimately be collected, all payments received are reflected as a reduction of principal and not as interest income. For all other non-accrual loans, cash interest receipts are generally recorded as revenue.
| Jun. 30, | Mar. 31, | Dec. 31, | Sept. 30, | Jun. 30, | ||||||||||
In millions of dollars | 2017 | 2017 | 2016 | 2016 | 2016 | ||||||||||
Corporate non-accrual loans (1) |
|
|
|
|
| ||||||||||
North America | $ | 944 | | $ | 993 | | $ | 984 | | $ | 1,057 | | $ | 1,280 | |
EMEA | 727 | | 828 | | 904 | | 857 | | 762 | | |||||
Latin America | 281 | | 342 | | 379 | | 380 | | 267 | | |||||
Asia | 146 | | 176 | | 154 | | 121 | | 151 | | |||||
Total corporate non-accrual loans | $ | 2,098 | | $ | 2,339 | | $ | 2,421 | | $ | 2,415 | | $ | 2,460 | |
Consumer non-accrual loans (1) |
|
|
|
|
| ||||||||||
North America | $ | 1,754 | | $ | 1,926 | | $ | 2,160 | | $ | 2,429 | | $ | 2,520 | |
Latin America | 793 | | 737 | | 711 | | 841 | | 884 | | |||||
Asia (2) | 301 | | 292 | | 287 | | 282 | | 301 | | |||||
Total consumer non-accrual loans | $ | 2,848 | | $ | 2,955 | | $ | 3,158 | | $ | 3,552 | | $ | 3,705 | |
Total non-accrual loans | $ | 4,946 | | $ | 5,294 | | $ | 5,579 | | $ | 5,967 | | $ | 6,165 | |
(1) | Excludes purchased distressed loans, as they are generally accreting interest. The carrying value of these loans was $183 million at June 30, 2017 , $194 million at March 31, 2017, $187 million at December 31, 2016, $194 million at September 30, 2016 and $212 million at June 30, 2016 . |
(2) Asia GCB includes balances in certain EMEA countries for all periods presented.
The changes in Citigroup's non-accrual loans were as follows:
| Three months ended | Three months ended | ||||||||||||||||
| June 30, 2017 | June 30, 2016 | ||||||||||||||||
In millions of dollars | Corporate | Consumer | Total | Corporate | Consumer | Total | ||||||||||||
Non-accrual loans at beginning of period | $ | 2,339 | | $ | 2,955 | | $ | 5,294 | | $ | 2,327 | | $ | 3,601 | | $ | 5,928 | |
Additions | 311 | | 697 | | 1,008 | | 830 | | 1,326 | | 2,156 | | ||||||
Sales and transfers to held-for-sale | (46 | ) | (82 | ) | (128 | ) | (1 | ) | (209 | ) | (210 | ) | ||||||
Returned to performing | (3 | ) | (166 | ) | (169 | ) | (68 | ) | (143 | ) | (211 | ) | ||||||
Paydowns/settlements | (464 | ) | (285 | ) | (749 | ) | (491 | ) | (396 | ) | (887 | ) | ||||||
Charge-offs | (15 | ) | (318 | ) | (333 | ) | (113 | ) | (462 | ) | (575 | ) | ||||||
Other | (24 | ) | 47 | | 23 | | (24 | ) | (12 | ) | (36 | ) | ||||||
Ending balance | $ | 2,098 | | $ | 2,848 | | $ | 4,946 | | $ | 2,460 | | $ | 3,705 | | $ | 6,165 | |
63
| Six Months Ended | Six Months Ended | ||||||||||||||||
| June 30, 2017 | June 30, 2016 | ||||||||||||||||
In millions of dollars | Corporate | Consumer | Total | Corporate | Consumer | Total | ||||||||||||
Non-accrual loans at beginning of period | $ | 2,421 | | $ | 3,158 | | $ | 5,579 | | $ | 1,596 | | $ | 3,658 | | $ | 5,254 | |
Additions | 564 | | 1,521 | | 2,085 | | 1,877 | | 2,240 | | 4,117 | | ||||||
Sales and transfers to held-for-sale | (82 | ) | (216 | ) | (298 | ) | (9 | ) | (371 | ) | (380 | ) | ||||||
Returned to performing | (40 | ) | (329 | ) | (369 | ) | (83 | ) | (284 | ) | (367 | ) | ||||||
Paydowns/settlements | (647 | ) | (565 | ) | (1,212 | ) | (589 | ) | (641 | ) | (1,230 | ) | ||||||
Charge-offs | (69 | ) | (842 | ) | (911 | ) | (253 | ) | (898 | ) | (1,151 | ) | ||||||
Other | (49 | ) | 121 | | 72 | | (79 | ) | 1 | | (78 | ) | ||||||
Ending balance | $ | 2,098 | | $ | 2,848 | | $ | 4,946 | | $ | 2,460 | | $ | 3,705 | | $ | 6,165 | |
The tables below summarize Citigroup's other real estate owned (OREO) assets as of the periods indicated. This represents the carrying value of all real estate property acquired by foreclosure or other legal proceedings when Citi has taken possession of the collateral:
| Jun. 30, | Mar. 31, | Dec. 31, | Sept. 30, | Jun. 30, | ||||||||||
In millions of dollars | 2017 | 2017 | 2016 | 2016 | 2016 | ||||||||||
OREO |
|
|
|
|
| ||||||||||
North America | $ | 128 | | $ | 136 | | $ | 161 | | $ | 132 | | $ | 151 | |
EMEA | 1 | | 1 | | - | | 1 | | - | | |||||
Latin America | 31 | | 31 | | 18 | | 18 | | 19 | | |||||
Asia | 8 | | 5 | | 7 | | 10 | | 5 | | |||||
Total OREO | $ | 168 | | $ | 173 | | $ | 186 | | $ | 161 | | $ | 175 | |
Non-accrual assets | | | | | | ||||||||||
Corporate non-accrual loans | $ | 2,098 | | $ | 2,339 | | $ | 2,421 | | $ | 2,415 | | $ | 2,460 | |
Consumer non-accrual loans | 2,848 | | 2,955 | | 3,158 | | 3,552 | | 3,705 | | |||||
Non-accrual loans (NAL) | $ | 4,946 | | $ | 5,294 | | $ | 5,579 | | $ | 5,967 | | $ | 6,165 | |
OREO | $ | 168 | | $ | 173 | | $ | 186 | | $ | 161 | | $ | 175 | |
Non-accrual assets (NAA) | $ | 5,114 | | $ | 5,467 | | $ | 5,765 | | $ | 6,128 | | $ | 6,340 | |
NAL as a percentage of total loans | 0.77 | % | 0.84 | % | 0.89 | % | 0.93 | % | 0.97 | % | |||||
NAA as a percentage of total assets | 0.27 | | 0.30 | | 0.32 | | 0.34 | | 0.35 | | |||||
Allowance for loan losses as a percentage of NAL (1) | 243 | | 227 | | 216 | | 208 | | 200 | | |||||
(1) | The allowance for loan losses includes the allowance for Citi's credit card portfolios and purchased distressed loans, while the non-accrual loans exclude credit card balances (with the exception of certain international portfolios) and purchased distressed loans as these continue to accrue interest until charge-off. |
64
Renegotiated Loans
The following table presents Citi's loans modified in TDRs:
In millions of dollars | Jun. 30, 2017 | Dec. 31, 2016 | ||||
Corporate renegotiated loans (1) |
|
| ||||
In U.S. offices |
|
| ||||
Commercial and industrial (2) | $ | 211 | | $ | 89 | |
Mortgage and real estate | 70 | | 84 | | ||
Loans to financial institutions | 9 | | 9 | | ||
Other | 166 | | 228 | | ||
| $ | 456 | | $ | 410 | |
In offices outside the U.S. |
|
| ||||
Commercial and industrial (2) | $ | 380 | | $ | 319 | |
Mortgage and real estate | 4 | | 3 | | ||
Loans to financial institutions | 15 | | - | | ||
| $ | 399 | | $ | 322 | |
Total corporate renegotiated loans | $ | 855 | | $ | 732 | |
Consumer renegotiated loans (3)(4)(5) |
|
| ||||
In U.S. offices |
|
| ||||
Mortgage and real estate (6) | $ | 4,030 | | $ | 4,695 | |
Cards | 1,270 | | 1,313 | | ||
Installment and other | 192 | | 117 | | ||
| $ | 5,492 | | $ | 6,125 | |
In offices outside the U.S. |
|
| ||||
Mortgage and real estate | $ | 375 | | $ | 447 | |
Cards | 512 | | 435 | | ||
Installment and other | 396 | | 443 | | ||
| $ | 1,283 | | $ | 1,325 | |
Total consumer renegotiated loans | $ | 6,775 | | $ | 7,450 | |
(1) | Includes $678 million and $445 million of non-accrual loans included in the non-accrual loans table above at June 30, 2017 and December 31, 2016, respectively. The remaining loans are accruing interest. |
(2) | In addition to modifications reflected as TDRs at June 30, 2017, Citi also modified $85 million of commercial loans risk rated "Substandard Non-Performing" or worse (asset category defined by banking regulators) all within offices in the U.S. These modifications were not considered TDRs because the modifications did not involve a concession. |
(3) | Includes $1,416 million and $1,502 million of non-accrual loans included in the non-accrual loans table above at June 30, 2017 and December 31, 2016, respectively. The remaining loans are accruing interest. |
(4) | Includes $47 million and $58 million of commercial real estate loans at June 30, 2017 and December 31, 2016, respectively. |
(5) | Includes $179 million and $105 million of other commercial loans at June 30, 2017 and December 31, 2016, respectively. |
(6) | Reduction in the six months ended June 30, 2017 includes $517 million related to TDRs sold or transferred to held-for-sale. |
65
LIQUIDITY RISK
For additional information on funding and liquidity at Citigroup, including its objectives, management and measurement, see "Liquidity Risk" and "Risk Factors" in Citi's 2016 Annual Report on Form 10-K.
High-Quality Liquid Assets (HQLA)
| Citibank | Non-Bank and Other (1) | Total | ||||||||||||||||||||||||
In billions of dollars | Jun. 30, 2017 | Mar. 31, 2017 | Jun. 30, 2016 | Jun. 30, 2017 | Mar. 31, 2017 | Jun. 30, 2016 | Jun. 30, 2017 | Mar. 31, 2017 | Jun. 30, 2016 | ||||||||||||||||||
Available cash | $ | 78.5 | | $ | 83.8 | | $ | 61.3 | | $ | 35.0 | | $ | 24.5 | | $ | 23.2 | | $ | 113.5 | | $ | 108.3 | | $ | 84.5 | |
U.S. sovereign | 110.6 | | 113.8 | | 115.0 | | 23.2 | | 22.7 | | 19.6 | | 133.8 | | 136.5 | | 134.6 | | |||||||||
U.S. agency/agency MBS | 63.2 | | 59.2 | | 69.2 | | 1.1 | | 0.8 | | 0.3 | | 64.3 | | 60.0 | | 69.5 | | |||||||||
Foreign government debt (2) | 102.4 | | 84.5 | | 86.7 | | 17.7 | | 17.2 | | 16.8 | | 120.1 | | 101.7 | | 103.6 | | |||||||||
Other investment grade | 0.4 | | 0.3 | | 1.2 | | 1.2 | | 1.5 | | 1.5 | | 1.6 | | 1.8 | | 2.7 | | |||||||||
Total HQLA (EOP) | $ | 355.1 | | $ | 341.6 | | $ | 333.3 | | $ | 78.1 | | $ | 66.7 | | $ | 61.5 | | $ | 433.2 | | $ | 408.3 | | $ | 394.8 | |
Total HQLA (AVG) | $ | 354.0 | | $ | 353.5 | | $ | 342.5 | | $ | 70.4 | | $ | 59.3 | | $ | 68.5 | | $ | 424.4 | | $ | 412.8 | | $ | 411.0 | |
Note: Except as indicated, amounts set forth in the table above are as of period end and may increase or decrease intra-period in the ordinary course of business. For securities, the amounts represent the liquidity value that potentially could be realized, and therefore exclude any securities that are encumbered, and incorporate any haircuts that would be required for secured funding transactions. The Federal Reserve Board adopted final rules requiring disclosure of HQLA, the Liquidity Coverage Ratio and related components on an average basis each quarter, as compared to end-of-period, starting on April 1, 2017 (for additional information, see "Liquidity Coverage Ratio (LCR)" below). Citi has presented in this form 10-Q the average information on these metrics currently available, which includes average total HQLA, average LCR and average net outflows under the LCR; other component information is not currently available.
(1) | Citibanamex and Citibank (Switzerland) AG account for approximately $6 billion of the "Non-Bank and Other" HQLA balance as of June 30, 2017. |
(2) | Foreign government debt includes securities issued or guaranteed by foreign sovereigns, agencies and multilateral development banks. Foreign government debt securities are held largely to support local liquidity requirements and Citi's local franchises, and principally include government bonds from Hong Kong, Korea, Taiwan, Singapore, India, Brazil and Mexico. |
As set forth in the table above, sequentially, Citi's total HQLA increased both on an end-of-period and an average basis, due primarily to an increase in cash related to resolution planning, as well as an increase in foreign government debt.
Citi's HQLA as set forth above does not include Citi's available borrowing capacity from the Federal Home Loan Banks (FHLBs) of which Citi is a member, which was approximately $23 billion as of June 30, 2017 (compared to $28 billion as of March 31, 2017 and $37 billion as of June 30, 2016) and maintained by eligible collateral pledged to such banks. The HQLA also does not include Citi's borrowing capacity at the U.S. Federal Reserve Bank discount window or other central banks, which would be in addition to the resources noted above.
In general, Citi's liquidity is fungible across legal entities within its bank group. Citi's bank subsidiaries, including Citibank, can lend to the Citi parent and broker-dealer entities in accordance with Section 23A of the Federal Reserve Act. As of June 30, 2017 , the capacity available for lending to these entities under Section 23A was approximately $15 billion, unchanged from both March 31, 2017 and June 30, 2016, subject to certain eligible non-cash collateral requirements.
66
Loans
The table below sets forth the average loans, by business and/or segment, and the total end-of-period loans for each of the periods indicated:
In billions of dollars | Jun. 30, 2017 | Mar. 31, 2017 | Jun. 30, 2016 | ||||||
Global Consumer Banking |
|
|
| ||||||
North America | $ | 183.4 | | $ | 183.3 | | $ | 163.8 | |
Latin America | 25.5 | | 23.1 | | 24.3 | | |||
Asia (1) | 84.9 | | 83.2 | | 84.9 | | |||
Total | $ | 293.8 | | $ | 289.6 | | $ | 273.0 | |
Institutional Clients Group |
|
|
| ||||||
Corporate lending | 121.5 | | 118.1 | | 124.2 | | |||
Treasury and trade solutions (TTS) | 73.7 | | 71.4 | | 70.9 | | |||
Private bank, Markets and securities services and other | 117.2 | | 112.2 | | 108.9 | | |||
Total | $ | 312.4 | | $ | 301.8 | | $ | 304.0 | |
Total Corporate/Other | 28.2 | | 31.8 | | 43.6 | | |||
Total Citigroup loans (AVG) | $ | 634.3 | | $ | 623.2 | | $ | 620.6 | |
Total Citigroup loans (EOP) | $ | 644.7 | | $ | 628.6 | | $ | 633.5 | |
(1) | Includes loans in certain EMEA countries for all periods presented. |
As set forth in the table above, end-of-period loans increased 2% year-over-year and 3% quarter-over-quarter. On an average basis, loans increased 2% both year-over-year and quarter-over-quarter.
Excluding the impact of FX translation, average loans increased 3% year-over-year and 1% quarter-over-quarter. On this basis, average GCB loans grew 8% year-over-year, driven by 12% growth in North America. Within North America , Citi-branded cards increased 25% year-over-year, primarily due to the acquisition of the Costco portfolio, as well as modest organic growth. International GCB loans increased 1%, as 7% growth in Mexico was partially offset by a 1% decline in Asia , reflecting Citi's optimization of its portfolio in this region.
Average ICG loans increased 3% year-over-year, primarily driven by the private bank. Corporate lending decreased 1%, primarily driven by a lower level of episodic funding compared to the prior-year period. Sequentially, corporate lending increased 2%, as Citi supported core business activity among its global subsidiary clients. TTS loans increased 4%, driven by growth in EMEA and Asia .
Average Corporate/Other loans decreased 36% year-over-
year, driven by the continued wind down of legacy assets.
Deposits
The table below sets forth the average deposits, by business and/or segment, and the total end-of-period deposits for each of the periods indicated:
In billions of dollars | Jun. 30, 2017 | Mar. 31, 2017 | Jun. 30, 2016 | ||||||
Global Consumer Banking |
|
|
| ||||||
North America | $ | 185.1 | | $ | 185.5 | | $ | 182.1 | |
Latin America | 27.8 | | 25.3 | | 25.9 | | |||
Asia (1) | 94.3 | | 92.7 | | 89.4 | | |||
Total | $ | 307.2 | | $ | 303.5 | | $ | 297.4 | |
Institutional Clients Group |
|
|
| ||||||
Treasury and trade solutions (TTS) | 423.9 | | 416.2 | | 415.0 | | |||
Banking ex-TTS | 122.1 | | 120.8 | | 116.3 | | |||
Markets and securities services | 84.3 | | 80.1 | | 82.7 | | |||
Total | $ | 630.3 | | $ | 617.1 | | $ | 614.0 | |
Corporate/Other | 22.5 | | 20.3 | | 24.2 | | |||
Total Citigroup deposits (AVG) | $ | 960.0 | | $ | 940.9 | | $ | 935.6 | |
Total Citigroup deposits (EOP) | $ | 958.7 | | $ | 950.0 | | $ | 937.9 | |
(1) | Includes deposits in certain EMEA countries for all periods presented. |
End-of-period deposits increased 2% year-over-year and 1% quarter-over-quarter. On an average basis, deposits increased 3% year-over-year and 2% sequentially.
Excluding the impact of FX translation, average deposits grew 3% from the prior-year period, as Citi experienced strong customer engagement across all major businesses and regions.
67
Long-Term Debt
The weighted-average maturities of unsecured long-term debt issued by Citigroup and its affiliates (including Citibank) with a remaining life greater than one year (excluding remaining trust preferred securities outstanding) was approximately 6.9 years as of June 30, 2017 , a slight decline from the prior-year period and unchanged sequentially.
Citi's long-term debt outstanding at the parent includes senior and subordinated debt and a portion of what Citi refers to as customer-related debt, consisting of structured notes, such as equity- and credit-linked notes, as well as non-structured notes. Citi's issuance of customer-related debt is generally driven by customer demand and supplements benchmark debt issuance as a source of funding for Citi's parent and non-bank entities. Citi's long-term debt at the bank
also includes FHLB advances and securitizations.
Long-Term Debt Outstanding
The following table sets forth Citi's end-of-period total long-term debt outstanding for each of the periods indicated:
In billions of dollars | Jun. 30, 2017 | Mar. 31, 2017 | Jun. 30, 2016 | ||||||
Parent and other (1) | | | | | | | |||
Benchmark debt: |
|
|
| ||||||
Senior debt | $ | 105.9 | | $ | 100.2 | | $ | 96.1 | |
Subordinated debt | 26.8 | | 26.3 | | 28.8 | | |||
Trust preferred | 1.7 | | 1.7 | | 1.7 | | |||
Customer-related debt: | | | | ||||||
Structured debt | 25.3 | | 24.3 | | 22.5 | | |||
Non-structured debt | 3.1 | | 2.9 | | 3.3 | | |||
Local country and other (2) | 2.1 | | 2.0 | | 2.3 | | |||
Total parent and other | $ | 164.9 | | $ | 157.4 | | $ | 154.8 | |
Bank | | | | | | | |||
FHLB borrowings | $ | 20.3 | | $ | 20.3 | | $ | 19.6 | |
Securitizations (3) | 28.2 | | 24.0 | | 27.3 | | |||
CBNA benchmark debt | 7.2 | | 2.5 | | - | | |||
Local country and other (2) | 4.5 | | 4.3 | | 5.8 | | |||
Total bank | $ | 60.2 | | $ | 51.1 | | $ | 52.6 | |
Total long-term debt | $ | 225.2 | | $ | 208.5 | | $ | 207.4 | |
Note: Amounts represent the current value of long-term debt on Citi's Consolidated Balance Sheet which, for certain debt instruments, includes consideration of fair value, hedging impacts and unamortized discounts and premiums.
(1) | "Parent and other" includes long-term debt issued to third parties by the parent holding company (Citigroup) and Citi's non-bank subsidiaries (including broker-dealer subsidiaries) that are consolidated into Citigroup. As of June 30, 2017, "parent and other" included $17.7 billion of long-term debt issued by Citi's broker-dealer subsidiaries. |
(2) | Local country debt includes debt issued by Citi's affiliates in support of their local operations. |
(3) | Predominantly credit card securitizations, primarily backed by Citi-branded credit card receivables. |
Year-over-year, Citi's total long-term debt outstanding increased, primarily driven by the issuance of senior debt at the parent, as well as the issuance of benchmark debt at the bank. Sequentially, Citi's total long-term debt outstanding increased, primarily driven by an increase in credit card securitizations, as well as the issuance of benchmark debt at both the bank and parent.
As part of its liability management, Citi has considered, and may continue to consider, opportunities to repurchase its long-term debt pursuant to open market purchases, tender offers or other means. Such repurchases help reduce Citi's overall funding costs (and assist it in meeting regulatory changes and requirements). During the second quarter of 2017, Citi repurchased an aggregate of approximately $0.2 billion of its outstanding long-term debt.
68
Long-Term Debt Issuances and Maturities
The table below details Citi's long-term debt issuances and maturities (including repurchases and redemptions) during the periods presented:
| 2Q17 | 1Q17 | 2Q16 | |||||||||||||||
In billions of dollars | Maturities | Issuances | Maturities | Issuances | Maturities | Issuances | ||||||||||||
Parent and other | | | | | | | | | | | | | ||||||
Benchmark debt: |
|
|
|
|
|
| ||||||||||||
Senior debt | $ | 2.0 | | $ | 6.3 | | $ | 5.3 | | $ | 5.2 | | $ | 5.1 | | $ | 6.6 | |
Subordinated debt | - | | 0.2 | | 1.2 | | 0.7 | | 1.7 | | 1.0 | | ||||||
Trust preferred | - | | - | | - | | - | | - | | - | | ||||||
Customer-related debt: | | |
|
|
|
| ||||||||||||
Structured debt | 2.0 | | 3.6 | | 1.8 | | 3.5 | | 3.4 | | 2.0 | | ||||||
Non-structured debt | 0.3 | | - | | 0.1 | | - | | 0.1 | | 0.1 | | ||||||
Local country and other | 0.1 | | - | | 0.5 | | 0.1 | | 1.9 | | - | | ||||||
Total parent and other | $ | 4.3 | | $ | 10.2 | | $ | 9.0 | | $ | 9.6 | | $ | 12.2 | | $ | 9.7 | |
Bank | | | | | | | | | | | | | ||||||
FHLB borrowings | $ | 1.5 | | $ | 1.5 | | $ | 1.8 | | $ | 0.5 | | $ | 1.0 | | $ | 2.5 | |
Securitizations | 0.9 | | 5.1 | | 2.0 | | 2.5 | | 1.3 | | - | | ||||||
CBNA benchmark debt | - | | 4.7 | | - | | 2.5 | | - | | - | | ||||||
Local country and other | 0.7 | | 0.3 | | 1.2 | | 0.9 | | 1.1 | | 1.0 | | ||||||
Total bank | $ | 3.0 | | $ | 11.6 | | $ | 5.0 | | $ | 6.3 | | $ | 3.4 | | $ | 3.5 | |
Total | $ | 7.4 | | $ | 21.8 | | $ | 13.9 | | $ | 15.9 | | $ | 15.6 | | $ | 13.2 | |
| Maturities 2017 YTD | Maturities | |||||||||||||||||||||||||
In billions of dollars | 2017 | 2018 | 2019 | 2020 | 2021 | 2022 | Thereafter | Total | |||||||||||||||||||
Parent and other | | | | | | | | | | | | | | | | | | | |||||||||
Benchmark debt: |
|
|
|
|
|
|
|
| | ||||||||||||||||||
Senior debt | $ | 7.2 | | $ | 6.9 | | $ | 18.3 | | $ | 14.5 | | $ | 8.9 | | $ | 14.2 | | $ | 6.0 | | $ | 37.1 | | $ | 105.9 | |
Subordinated debt | 1.2 | | - | | 0.9 | | 1.4 | | - | | - | | 1.1 | | 23.3 | | 26.8 | | |||||||||
Trust preferred | - | | - | | - | | - | | - | | - | | - | | 1.7 | | 1.7 | | |||||||||
Customer-related debt: |
|
|
|
|
|
|
|
| | ||||||||||||||||||
Structured debt | 3.8 | | 0.6 | | 3.9 | | 2.3 | | 2.9 | | 2.2 | | 1.2 | | 12.2 | | 25.3 | | |||||||||
Non-structured debt | 0.4 | | 0.1 | | 0.6 | | 0.2 | | 0.3 | | 0.1 | | 0.2 | | 1.6 | | 3.1 | | |||||||||
Local country and other | 0.6 | | 0.3 | | 0.5 | | 0.1 | | 0.1 | | 0.1 | | 0.1 | | 0.8 | | 2.1 | | |||||||||
Total parent and other | $ | 13.3 | | $ | 7.9 | | $ | 24.2 | | $ | 18.4 | | $ | 12.3 | | $ | 16.7 | | $ | 8.6 | | $ | 76.8 | | $ | 164.9 | |
Bank | | | | | | | | | | | | | | | | | | | |||||||||
FHLB borrowings | $ | 3.3 | | $ | 4.5 | | $ | 14.3 | | $ | 1.6 | | $ | - | | $ | - | | $ | - | | $ | - | | $ | 20.3 | |
Securitizations | 2.9 | | 2.4 | | 9.4 | | 6.5 | | 3.3 | | 3.8 | | 0.1 | | 2.8 | | 28.2 | | |||||||||
CBNA benchmark debt | - | | - | | 2.2 | | 2.5 | | 2.5 | | - | | - | | - | | 7.2 | | |||||||||
Local country and other | 1.9 | | 1.1 | | 1.7 | | 0.6 | | 0.5 | | 0.1 | | 0.1 | | 0.4 | | 4.5 | | |||||||||
Total bank | $ | 8.0 | | $ | 7.9 | | $ | 27.7 | | $ | 11.1 | | $ | 6.3 | | $ | 3.9 | | $ | 0.2 | | $ | 3.2 | | $ | 60.2 | |
Total long-term debt | $ | 21.3 | | $ | 15.9 | | $ | 51.9 | | $ | 29.5 | | $ | 18.5 | | $ | 20.6 | | $ | 8.8 | | $ | 80.0 | | $ | 225.2 | |
69
Resolution Plan
Under Title I of the Dodd-Frank Wall Street Reform and Consumer Protection Act of 2010 (Dodd-Frank Act), Citigroup has developed a "single point of entry" resolution strategy and plan under the U.S. Bankruptcy Code (Resolution Plan). In July 2017, Citi submitted its 2017 Resolution Plan to the Federal Reserve and FDIC (the Agencies). Under Citi's Resolution Plan, only Citigroup, the parent holding company, would enter into bankruptcy, while Citigroup's material legal entities (as defined in the public section of its 2017 Resolution Plan, which can be found on the Agencies' websites) would remain operational and outside of any resolution or insolvency proceedings. Citigroup believes its Resolution Plan has been designed to minimize the risk of systemic impact to the U.S. and global financial systems, while maximizing the value of the bankruptcy estate for the benefit of Citigroup's creditors, including its unsecured long-term debt holders. In addition, in line with the Federal Reserve's final TLAC rule, Citigroup believes it has developed the Resolution Plan so that Citigroup's shareholders and unsecured creditors-including its unsecured long-term debt holders-bear any losses resulting from Citigroup's bankruptcy.
In response to feedback received from the Agencies on Citigroup's 2015 Resolution Plan, Citigroup took the following actions in connection with its 2017 Resolution Plan submission:
(i) Citicorp LLC (Citicorp), an existing wholly-owned subsidiary of Citigroup, was established as an intermediate holding company (an IHC) for certain of Citigroup's operating material legal entities;
(ii) Citigroup executed an inter-affiliate agreement with Citicorp, Citigroup's operating material legal entities and certain other affiliated entities pursuant to which Citicorp is required to provide liquidity and capital support to Citigroup's operating material legal entities in the event Citigroup were to enter bankruptcy proceedings (Citi Support Agreement);
(iii) pursuant to the Citi Support Agreement:
• | Citigroup made an initial contribution of assets, including certain high-quality liquid assets and inter-affiliate loans (Contributable Assets), to Citicorp, and Citicorp became the business as usual funding vehicle for Citigroup's operating material legal entities; |
• | Citigroup will be obligated to continue to transfer Contributable Assets to Citicorp over time, subject to certain amounts retained by Citigroup to, among other things, meet Citigroup's near-term cash needs; |
• | in the event of a Citigroup bankruptcy, Citigroup will be required to contribute most of its remaining assets to Citicorp; and |
(iv) the obligations of both Citigroup and Citicorp under the Citi Support Agreement, as well as the Contributable Assets, are secured pursuant to a security agreement.
The Citi Support Agreement provides two mechanisms, besides Citicorp's issuing of dividends to Citigroup, pursuant to which Citicorp will be required to transfer cash to Citigroup
during business as usual so that Citigroup can fund its debt service as well as other operating needs: (i) one or more funding notes issued by Citicorp to Citigroup; and (ii) a committed line of credit under which Citicorp may make loans to Citigroup.
Secured Funding Transactions and Short-Term Borrowings
Citi supplements its primary sources of funding with short-term borrowings. Short-term borrowings generally include (i) secured funding transactions (securities loaned or sold under agreements to repurchase, or repos) and (ii) to a lesser extent, short-term borrowings consisting of commercial paper and borrowings from the FHLB and other market participants (see Note 16 to the Consolidated Financial Statements for further information on Citigroup's and its affiliates' outstanding short-term borrowings).
Outside of secured funding transactions, Citi's short-term borrowings increased 98% year-over-year and 40% sequentially. The increase both year-over-year and sequentially was driven by an increase in FHLB borrowings, as Citi continued to optimize liquidity across its legal vehicles.
Secured Funding
Secured funding is primarily accessed through Citi's broker-dealer subsidiaries to fund efficiently both secured lending activity and a portion of securities inventory held in the context of market making and customer activities. Citi also executes a smaller portion of its secured funding transactions through its bank entities, which is typically collateralized by foreign government debt securities. Generally, daily changes in the level of Citi's secured funding are primarily due to fluctuations in secured lending activity in the matched book (as described below) and securities inventory.
Secured funding of $155 billion as of June 30, 2017 declined 2% from the prior-year period and increased 4% sequentially. Excluding the impact of FX translation, secured funding decreased 2% from the prior-year period and increased 2% sequentially, both driven by normal business activity. Average balances for secured funding were approximately $161 billion for the quarter ended June 30, 2017.
The portion of secured funding in the broker-dealer subsidiaries that funds secured lending is commonly referred to as "matched book" activity. The majority of this activity is secured by high-quality liquid securities such as U.S. Treasury securities, U.S. agency securities and foreign government debt securities. Other secured funding is secured by less liquid securities, including equity securities, corporate bonds and asset-backed securities. The tenor of Citi's matched book liabilities is generally equal to or longer than the tenor of the corresponding matched book assets.
The remainder of the secured funding activity in the broker-dealer subsidiaries serves to fund securities inventory held in the context of market making and customer activities. To maintain reliable funding under a wide range of market conditions, including under periods of stress, Citi manages these activities by taking into consideration the quality of the underlying collateral and stipulating financing tenor. The weighted average maturity of Citi's secured funding of less
70
liquid securities inventory was greater than 110 days as of June 30, 2017.
Citi manages the risks in its secured funding by conducting daily stress tests to account for changes in capacity, tenors, haircut, collateral profile and client actions. Additionally, Citi maintains counterparty diversification by establishing concentration triggers and assessing counterparty reliability and stability under stress. Citi generally sources secured funding from more than 150 counterparties.
Liquidity Coverage Ratio (LCR)
In addition to internal measures that Citi has developed for a 30-day stress scenario, Citi also monitors its liquidity by reference to the LCR, as calculated pursuant to the U.S. LCR rules (for additional information, see "Liquidity Risk" in Citi's 2016 Annual Report on Form 10-K). The table below sets forth the components of Citi's LCR calculation and HQLA in excess of net outflows as of the periods indicated:
In billions of dollars | Jun. 30, 2017 | Mar. 31, 2017 | Jun. 30, 2016 | ||||||
HQLA | $ | 424.4 | | $ | 412.8 | | $ | 411.0 | |
Net outflows | 338.2 | | 334.4 | | 339.8 | | |||
LCR | 125 | % | 123 | % | 121 | % | |||
HQLA in excess of net outflows | $ | 86.2 | | $ | 78.4 | | $ | 71.2 | |
Note: The amounts set forth in the table above are presented on an average basis.
As set forth in the table above, Citi's average LCR increased both year-over-year and sequentially driven by an increase in HQLA, reflecting the increase in cash related to resolution planning, partially offset by an increase in net outflows.
71
Credit Ratings
The table below sets forth the ratings for Citigroup and Citibank as of June 30, 2017 . While not included in the table below, the long-term and short-term ratings of Citigroup Global Markets Inc. (CGMI) were "A2/P-1" at Moody's, "A+/A-1" at Standard & Poor's and "A+/F1" at Fitch as of June 30, 2017 . The long-term and short-term ratings of Citigroup Global Markets Holdings Inc. (CGMHI) were BBB+/A-2 at
Standard & Poor's and A/F1 at Fitch as of June 30, 2017 .
| Citigroup Inc. | Citibank, N.A. | ||||
| Senior debt | Commercial paper | Outlook | Long- term | Short- term | Outlook |
Fitch Ratings (Fitch) | A | F1 | Stable | A+ | F1 | Stable |
Moody's Investors Service (Moody's) | Baa1 | P-2 | Stable | A1 | P-1 | Stable |
Standard & Poor's (S&P) | BBB+ | A-2 | Stable | A+ | A-1 | Stable |
Potential Impacts of Ratings Downgrades
Ratings downgrades by Moody's, Fitch or S&P could negatively impact Citigroup's and/or Citibank's funding and liquidity due to reduced funding capacity, including derivative triggers, which could take the form of cash obligations and collateral requirements.
The following information is provided for the purpose of analyzing the potential funding and liquidity impact to Citigroup and Citibank of a hypothetical, simultaneous
ratings downgrade across all three major rating agencies. This analysis is subject to certain estimates, estimation methodologies, judgments and uncertainties. Uncertainties include potential ratings limitations that certain entities may have with respect to permissible counterparties, as well as general subjective counterparty behavior. For example, certain corporate customers and markets counterparties could re-evaluate their business relationships with Citi and limit transactions in certain contracts or market instruments with Citi. Changes in counterparty behavior could impact Citi's funding and liquidity, as well as the results of operations of certain of its businesses. The actual impact to Citigroup or Citibank is unpredictable and may differ materially from the potential funding and liquidity impacts described below. For additional information on the impact of credit rating changes on Citi and its applicable subsidiaries, see "Risk Factors-
Liquidity Risks" in Citi's 2016 Annual Report on Form 10-K.
Citigroup Inc. and Citibank-Potential Derivative Triggers
As of June 30, 2017 , Citi estimates that a hypothetical one-notch downgrade of the senior debt/long-term rating of Citigroup Inc. across all three major rating agencies could impact Citigroup's funding and liquidity due to derivative triggers by approximately $0.7 billion, compared to $0.6 billion as of March 31, 2017. Other funding sources, such as secured funding and other margin requirements, for which there are no explicit triggers, could also be adversely affected.
As of June 30, 2017 , Citi estimates that a hypothetical one-notch downgrade of the senior debt/long-term rating of Citibank across all three major rating agencies could impact Citibank's funding and liquidity by approximately $0.3 billion, compared to $0.8 billion as of March 31, 2017, due to derivative triggers.
In total, Citi estimates that a one-notch downgrade of Citigroup and Citibank, across all three major rating agencies, could result in increased aggregate cash obligations and collateral requirements of approximately $1.0 billion, compared to $1.4 billion as of March 31, 2017 (see also Note 19 to the Consolidated Financial Statements). As set forth under "High-Quality Liquid Assets" above, the liquidity resources of Citibank were approximately $354 billion and the liquidity resources of Citi's non-bank and other entities were approximately $70 billion, for a total of approximately $424 billion as of June 30, 2017 . These liquidity resources are available in part as a contingency for the potential events described above.
In addition, a broad range of mitigating actions are currently included in Citigroup's and Citibank's contingency funding plans. For Citigroup, these mitigating factors include, but are not limited to, accessing surplus funding capacity from existing clients, tailoring levels of secured lending, and adjusting the size of select trading books and collateralized borrowings from certain Citibank subsidiaries. Mitigating actions available to Citibank include, but are not limited to, selling or financing highly liquid government securities, tailoring levels of secured lending, adjusting the size of select trading assets, reducing loan originations and renewals, raising additional deposits, or borrowing from the FHLB or central
72
banks. Citi believes these mitigating actions could substantially reduce the funding and liquidity risk, if any, of the potential downgrades described above.
Citibank-Additional Potential Impacts
In addition to the above derivative triggers, Citi believes that a potential one-notch downgrade of Citibank's senior debt/long-term rating by S&P could also have an adverse impact on the commercial paper/short-term rating of Citibank. As of June 30, 2017 , Citibank had liquidity commitments of approximately $10.0 billion to consolidated asset-backed commercial paper conduits, compared to $10.1 billion at March 31, 2017 (as referenced in Note 18 to the Consolidated Financial Statements).
In addition to the above-referenced liquidity resources of certain Citibank and Citibanamex entities, Citibank could reduce the funding and liquidity risk, if any, of the potential downgrades described above through mitigating actions, including repricing or reducing certain commitments to commercial paper conduits. In the event of the potential downgrades described above, Citi believes that certain corporate customers could re-evaluate their deposit relationships with Citibank. This re-evaluation could result in clients adjusting their discretionary deposit levels or changing their depository institution, which could potentially reduce certain deposit levels at Citibank. However, Citi could choose to adjust pricing, offer alternative deposit products to its existing customers or seek to attract deposits from new customers, in addition to the mitigating actions referenced above.
73
MARKET RISK
Market risk emanates from both Citi's trading and non-trading portfolios. Trading portfolios comprise all assets and liabilities marked-to-market, with results reflected in earnings. Non-trading portfolios include all other assets and liabilities.
For additional information on market risk and market risk management at Citi, see "Market Risk" and "Risk Factors" in Citi's 2016 Annual Report on Form 10-K.
Market Risk of Non-Trading Portfolios
For additional information on Citi's net interest revenue (for interest rate exposure purposes), interest rate risk and interest rate risk measurement, see "Market Risk of Non-Trading Portfolios" in Citi's 2016 Annual Report on Form 10-K.
The following table sets forth the estimated impact to Citi's net interest revenue, AOCI and the Common Equity Tier 1 Capital ratio (on a fully implemented basis), each assuming an unanticipated parallel instantaneous 100 basis point increase in interest rates:
In millions of dollars (unless otherwise noted) | Jun. 30, 2017 | Mar. 31, 2017 | Jun. 30, 2016 | ||||||
Estimated annualized impact to net interest revenue |
|
|
| ||||||
U.S. dollar (1) | $ | 1,435 | | $ | 1,644 | | $ | 1,394 | |
All other currencies | 589 | | 581 | | 590 | | |||
Total | $ | 2,024 | | $ | 2,225 | | $ | 1,984 | |
As a percentage of average interest-earning assets | 0.12 | % | 0.14 | % | 0.12 | % | |||
Estimated initial impact to AOCI (after-tax) (2) | $ | (4,258 | ) | $ | (3,830 | ) | $ | (4,628 | ) |
Estimated initial impact on Common Equity Tier 1 Capital ratio (bps) (3) | (49 | ) | (43 | ) | (52 | ) | |||
(1) | Certain trading-oriented businesses within Citi have accrual-accounted positions that are excluded from the estimated impact to net interest revenue in the table, since these exposures are managed economically in combination with mark-to-market positions. The U.S. dollar interest rate exposure associated with these businesses was $(164) million for a 100 basis point instantaneous increase in interest rates as of June 30, 2017 . |
(2) | Includes the effect of changes in interest rates on AOCI related to investment securities, cash flow hedges and pension liability adjustments. |
(3) | The estimated initial impact to the Common Equity Tier 1 Capital ratio considers the effect of Citi's DTA position and is based on only the estimated initial AOCI impact above. |
The sequential decrease in the estimated impact to net interest revenue primarily reflected an increase in the assumed deposit re-pricing sensitivity to further increases in interest rates and changes in balance sheet composition. The sequential increase in the estimated impact to AOCI primarily reflected changes to the positioning of Citi Treasury's investment securities and related interest rate derivatives portfolio.
In the event of an unanticipated parallel instantaneous 100 basis point increase in interest rates, Citi expects the negative impact to AOCI would be offset in stockholders' equity through the combination of expected incremental net interest revenue and the expected recovery of the impact on AOCI through accretion of Citi's investment portfolio over a period of time. As of June 30, 2017 , Citi expects that the negative
$4.2 billion impact to AOCI in such a scenario could potentially be offset over approximately 21 months.
The following table sets forth the estimated impact to Citi's net interest revenue, AOCI and the Common Equity Tier 1 Capital ratio (on a fully implemented basis) under four different changes in interest rate scenarios for the U.S. dollar and Citi's other currencies. While Citi also monitors the impact of a parallel decrease in interest rates, a 100 basis point decrease in short-term rates is not meaningful, as it would imply negative interest rates in many of Citi's markets.
In millions of dollars (unless otherwise noted) | Scenario 1 | Scenario 2 | Scenario 3 | Scenario 4 | ||||||||
Overnight rate change (bps) | 100 | | 100 | | - | | - | | ||||
10-year rate change (bps) | 100 | | - | | 100 | | (100 | ) | ||||
Estimated annualized impact to net interest revenue |
|
|
|
| ||||||||
U.S. dollar | $ | 1,435 | | $ | 1,363 | | $ | 87 | | $ | (116 | ) |
All other currencies | 589 | | 549 | | 34 | | (34 | ) | ||||
Total | $ | 2,024 | | $ | 1,912 | | $ | 121 | | $ | (150 | ) |
Estimated initial impact to AOCI (after-tax) (1) | $ | (4,258 | ) | $ | (2,609 | ) | $ | (1,833 | ) | $ | (1,329 | ) |
Estimated initial impact to Common Equity Tier 1 Capital ratio (bps) (2) | (49 | ) | (30 | ) | (21 | ) | (15 | ) | ||||
Note: Each scenario in the table above assumes that the rate change will occur instantaneously. Changes in interest rates for maturities between the overnight rate and the 10-year rate are interpolated.
(1) | Includes the effect of changes in interest rates on AOCI related to investment securities, cash flow hedges and pension liability adjustments. |
74
(2) | The estimated initial impact to the Common Equity Tier 1 Capital ratio considers the effect of Citi's deferred tax asset position and is based on only the estimated AOCI impact above. |
As shown in the table above, the magnitude of the impact to Citi's net interest revenue and AOCI is greater under scenario 2 as compared to scenario 3. This is because the combination of changes to Citi's investment portfolio, partially offset by changes related to Citi's pension liabilities, results in a net position that is more sensitive to rates at shorter- and intermediate-term maturities.
In recent years, a number of central banks, including the European Central Bank, the Bank of Japan and the Swiss National Bank, have implemented negative interest rates, and additional governmental entities could do so in the future. While negative interest rates can adversely impact net interest revenue (as well as net interest margin), Citi has, to date, been able to partially offset the impact of negative rates in these jurisdictions through a combination of business and Citi Treasury interest rate risk mitigation activities, including applying negative rates to client accounts (for additional information on Citi Treasury's ongoing interest rate mitigation activities, see "Market Risk-Market Risk of Non-Trading Portfolios" in Citi's 2016 Annual Reporting on Form 10-K).
Changes in Foreign Exchange Rates-Impacts on AOCI and Capital
As of June 30, 2017 , Citi estimates that an unanticipated parallel instantaneous 5% appreciation of the U.S. dollar against all of the other currencies in which Citi has invested capital could reduce Citi's tangible common equity (TCE) by approximately $1.4 billion, or 0.8%, as a result of changes to Citi's foreign currency translation adjustment in AOCI, net of hedges. This impact would be primarily due to changes in the value of the Mexican peso, the Euro and the Australian dollar.
This impact is also before any mitigating actions Citi may take, including ongoing management of its foreign currency translation exposure. Specifically, as currency movements change the value of Citi's net investments in foreign-currency-denominated capital, these movements also change the value of Citi's risk-weighted assets denominated in those currencies. This, coupled with Citi's foreign currency hedging strategies, such as foreign currency borrowings, foreign currency forwards and other currency hedging instruments, lessens the impact of foreign currency movements on Citi's Common Equity Tier 1 Capital ratio. Changes in these hedging strategies, as well as hedging costs, divestitures and tax impacts, can further impact the actual impact of changes in foreign exchange rates on Citi's capital as compared to an unanticipated parallel shock, as described above.
The effect of Citi's ongoing management strategies with respect to changes in foreign exchange rates and the impact of these changes on Citi's TCE and Common Equity Tier 1 Capital ratio are shown in the table below. For additional information on the changes in AOCI, see Note 17 to the Consolidated Financial Statements.
| For the quarter ended | ||||||||
In millions of dollars (unless otherwise noted) | Jun. 30, 2017 | Mar. 31, 2017 | Jun. 30, 2016 | ||||||
Change in FX spot rate (1) | 1.9 | % | 4.5 | % | (0.9 | )% | |||
Change in TCE due to FX translation, net of hedges | $ | 478 | | $ | 654 | | $ | (441 | ) |
As a percentage of TCE | 0.3 | % | 0.4 | % | (0.2 | )% | |||
Estimated impact to Common Equity Tier 1 Capital ratio (on a fully implemented basis) due to changes in FX translation, net of hedges (bps) | (3 | ) | (2 | ) | 2 | | |||
(1) | FX spot rate change is a weighted average based upon Citi's quarterly average GAAP capital exposure to foreign countries. |
75
Interest Revenue/Expense and Net Interest Margin
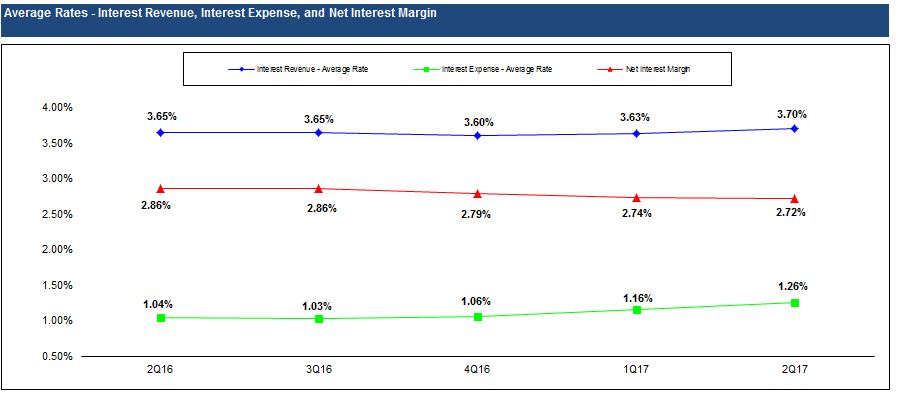
| 2nd Qtr. |
| 1st Qtr. |
| 2nd Qtr. |
| Change | ||||||||
In millions of dollars, except as otherwise noted | 2017 |
| 2017 |
| 2016 |
| 2Q17 vs. 2Q16 | ||||||||
Interest revenue (1) | $ | 15,323 | |
| $ | 14,546 | |
| $ | 14,473 | |
| 6 | % |
|
Interest expense (2) | 4,036 | |
| 3,566 | |
| 3,120 | |
| 29 | |
| |||
Net interest revenue | $ | 11,287 | |
| $ | 10,980 | |
| $ | 11,353 | |
| (1 | )% |
|
Interest revenue-average rate | 3.70 | % |
| 3.63 | % |
| 3.65 | % |
| 5 | | bps | |||
Interest expense-average rate | 1.26 | |
| 1.16 | |
| 1.04 | |
| 22 | | bps | |||
Net interest margin | 2.72 | |
| 2.74 | |
| 2.86 | |
| (14 | ) | bps | |||
Interest-rate benchmarks |
|
|
|
|
|
|
|
| |||||||
Two-year U.S. Treasury note-average rate | 1.30 | % |
| 1.24 | % |
| 0.77 | % |
| 53 | | bps | |||
10-year U.S. Treasury note-average rate | 2.26 | |
| 2.45 | |
| 1.75 | |
| 51 | | bps | |||
10-year vs. two-year spread | 96 | | bps | 121 | | bps | 98 | | bps |
| |
| |||
Note: All interest expense amounts include FDIC deposit insurance assessments.
(1) | Net interest revenue includes the taxable equivalent adjustments related to the tax-exempt bond portfolio (based on the U.S. federal statutory tax rate of 35%) of $122 million, $123 million, and $117 million for the three months ended June 30, 2017 , March 31, 2017 and June 30, 2016 , respectively. |
(2) | Interest expense associated with certain hybrid financial instruments, which are classified as Long-term debt and accounted for at fair value, is reported together with any changes in fair value as part of Principal transactions in the Consolidated Statements of Income and is therefore not reflected in Interest expense in the table above. |
Citi's net interest revenue declined 1% to $11.2 billion ($11.3 billion on a taxable equivalent basis) versus the prior-year period. Excluding the impact of FX translation, Citi's net interest revenue was largely unchanged at $11.2 billion ($11.3 billion on a taxable equivalent basis) versus the prior-year period, due to lower trading-related net interest revenue ($0.9 billion, down approximately 29% or $0.4 billion), and lower net interest revenue associated with legacy assets in Corporate/Other ($0.3 billion, down approximately 49% or $0.3 billion), offset by higher net interest revenue in the remaining accrual businesses (core accrual net interest revenue). Core accrual net interest revenue increased 7% to $10.0 billion versus the prior-year period, driven by the addition of the Costco portfolio, other volume growth and the
impact of the December 2016 and March 2017 interest rate increases, partially offset by an increase in the FDIC assessment and higher long-term debt.
Citi's net interest margin (NIM) is calculated by dividing gross interest revenue less gross interest expense by average interest-earning assets. Citi's NIM was 2.72% on a taxable equivalent basis in the second quarter of 2017, a decrease of 14 bps from the prior-year period. Citi's core accrual NIM was 3.44%, a decline of 1 bps, as the higher core accrual net interest revenue was more than offset by balance sheet growth, particularly in cash balances. (Citi's core accrual net interest revenue and core accrual NIM are non-GAAP financial measures. Citi believes these measures provide a more meaningful depiction for investors of the underlying fundamentals of its business results.)
76
Additional Interest Rate Details
Average Balances and Interest Rates-Assets (1)(2)(3)
| Average volume | Interest revenue | % Average rate | |||||||||||||||||||||
| 2nd Qtr. | 1st Qtr. | 2nd Qtr. | 2nd Qtr. | 1st Qtr. | 2nd Qtr. | 2nd Qtr. | 1st Qtr. | 2nd Qtr. | |||||||||||||||
In millions of dollars, except rates | 2017 | 2017 | 2016 | 2017 | 2017 | 2016 | 2017 | 2017 | 2016 | |||||||||||||||
Assets |
|
|
|
|
|
|
|
|
| |||||||||||||||
Deposits with banks (4) | $ | 166,023 | | $ | 154,765 | | $ | 135,245 | | $ | 375 | | $ | 295 | | $ | 237 | | 0.91 | % | 0.77 | % | 0.70 | % |
Federal funds sold and securities borrowed or purchased under agreements to resell (5) |
|
|
|
|
|
| | | | | | |||||||||||||
In U.S. offices | $ | 144,483 | | $ | 144,003 | | $ | 148,511 | | $ | 472 | | $ | 368 | | $ | 362 | | 1.31 | % | 1.04 | % | 0.98 | % |
In offices outside the U.S. (4) | 104,780 | | 103,032 | | 84,018 | | 356 | | 293 | | 302 | | 1.36 | | 1.15 | | 1.45 | | ||||||
Total | $ | 249,263 | | $ | 247,035 | | $ | 232,529 | | $ | 828 | | $ | 661 | | $ | 664 | | 1.33 | % | 1.09 | % | 1.15 | % |
Trading account assets (6)(7) |
|
|
|
|
|
| | | | | | |||||||||||||
In U.S. offices | $ | 100,080 | | $ | 101,836 | | $ | 108,602 | | $ | 877 | | $ | 884 | | $ | 970 | | 3.51 | % | 3.52 | % | 3.59 | % |
In offices outside the U.S. (4) | 103,581 | | 94,015 | | 92,656 | | 646 | | 423 | | 603 | | 2.50 | | 1.82 | | 2.62 | | ||||||
Total | $ | 203,661 | | $ | 195,851 | | $ | 201,258 | | $ | 1,523 | | $ | 1,307 | | $ | 1,573 | | 3.00 | % | 2.71 | % | 3.14 | % |
Investments |
|
|
|
|
|
| | | | | | |||||||||||||
In U.S. offices |
|
|
|
|
|
| | | | | | |||||||||||||
Taxable | $ | 224,021 | | $ | 221,450 | | $ | 225,279 | | $ | 1,086 | | $ | 1,034 | | $ | 991 | | 1.94 | % | 1.89 | % | 1.77 | % |
Exempt from U.S. income tax | 18,466 | | 18,680 | | 19,010 | | 197 | | 196 | | 170 | | 4.28 | | 4.26 | | 3.60 | | ||||||
In offices outside the U.S. (4) | 106,758 | | 107,225 | | 107,235 | | 830 | | 789 | | 837 | | 3.12 | | 2.98 | | 3.14 | | ||||||
Total | $ | 349,245 | | $ | 347,355 | | $ | 351,524 | | $ | 2,113 | | $ | 2,019 | | $ | 1,998 | | 2.43 | % | 2.36 | % | 2.29 | % |
Loans (net of unearned income) (8) |
|
|
|
|
|
| | | | | | |||||||||||||
In U.S. offices | $ | 369,342 | | $ | 367,397 | | $ | 353,422 | | $ | 6,392 | | $ | 6,273 | | $ | 5,793 | | 6.94 | % | 6.92 | % | 6.59 | % |
In offices outside the U.S. (4) | 264,986 | | 255,941 | | 267,226 | | 3,832 | | 3,697 | | 3,972 | | 5.80 | | 5.86 | | 5.98 | | ||||||
Total | $ | 634,328 | | $ | 623,338 | | $ | 620,648 | | $ | 10,224 | | $ | 9,970 | | $ | 9,765 | | 6.46 | % | 6.49 | % | 6.33 | % |
Other interest-earning assets (9) | $ | 60,107 | | $ | 56,733 | | $ | 54,058 | | $ | 260 | | $ | 294 | | $ | 236 | | 1.74 | % | 2.10 | % | 1.76 | % |
Total interest-earning assets | $ | 1,662,627 | | $ | 1,625,077 | | $ | 1,595,262 | | $ | 15,323 | | $ | 14,546 | | $ | 14,473 | | 3.70 | % | 3.63 | % | 3.65 | % |
Non-interest-earning assets (6) | $ | 206,581 | | $ | 205,477 | | $ | 212,050 | |
|
|
|
|
|
| |||||||||
Total assets | $ | 1,869,208 | | $ | 1,830,554 | | $ | 1,807,312 | |
|
|
|
|
|
| |||||||||
(1) | Net interest revenue includes the taxable equivalent adjustments related to the tax-exempt bond portfolio (based on the U.S. federal statutory tax rate of 35%) of $122 million, $123 million, and $117 million for the three months ended June 30, 2017 , March 31, 2017 and June 30, 2016 , respectively. |
(2) | Interest rates and amounts include the effects of risk management activities associated with the respective asset categories. |
(3) | Monthly or quarterly averages have been used by certain subsidiaries where daily averages are unavailable. |
(4) | Average rates reflect prevailing local interest rates, including inflationary effects and monetary corrections in certain countries. |
(5) | Average volumes of securities borrowed or purchased under agreements to resell are reported net pursuant to ASC 210-20-45. However, Interest revenue excludes the impact of ASC 210-20-45. |
(6) | The fair value carrying amounts of derivative contracts are reported net, pursuant to ASC 815-10-45, in Non-interest-earning assets and Other non-interest-bearing liabilities . |
(7) | Interest expense on Trading account liabilities of ICG is reported as a reduction of Interest revenue . Interest revenue and Interest expense on cash collateral positions are reported in interest on Trading account assets and Trading account liabilities , respectively. |
(8) | Includes cash-basis loans. |
(9) | Includes brokerage receivables. |
77
Average Balances and Interest Rates-Liabilities and Equity, and Net Interest Revenue (1)(2)(3)
Taxable Equivalent Basis
| Average volume | Interest expense | % Average rate | |||||||||||||||||||||
| 2nd Qtr. | 1st Qtr. | 2nd Qtr. | 2nd Qtr. | 1st Qtr. | 2nd Qtr. | 2nd Qtr. | 1st Qtr. | 2nd Qtr. | |||||||||||||||
In millions of dollars, except rates | 2017 | 2017 | 2016 | 2017 | 2017 | 2016 | 2017 | 2017 | 2016 | |||||||||||||||
Liabilities |
|
|
|
|
|
|
|
|
| |||||||||||||||
Deposits |
|
|
|
|
|
|
|
|
| |||||||||||||||
In U.S. offices (4) | $ | 311,758 | | $ | 302,294 | | $ | 286,653 | | $ | 593 | | $ | 507 | | $ | 371 | | 0.76 | % | 0.68 | % | 0.52 | % |
In offices outside the U.S. (5) | 439,807 | | 428,743 | | 435,242 | | 1,010 | | 908 | | 935 | | 0.92 | | 0.86 | | 0.86 | | ||||||
Total | $ | 751,565 | | $ | 731,037 | | $ | 721,895 | | $ | 1,603 | | $ | 1,415 | | $ | 1,306 | | 0.86 | % | 0.78 | % | 0.73 | % |
Federal funds purchased and securities loaned or sold under agreements to repurchase (6) |
|
|
|
|
|
| | | | | | | ||||||||||||
In U.S. offices | $ | 101,623 | | $ | 94,461 | | $ | 103,517 | | $ | 396 | | $ | 282 | | $ | 260 | | 1.56 | % | 1.21 | % | 1.01 | % |
In offices outside the U.S. (5) | 59,354 | | 54,425 | | 57,685 | | 280 | | 211 | | 267 | | 1.89 | | 1.57 | | 1.86 | | ||||||
Total | $ | 160,977 | | $ | 148,886 | | $ | 161,202 | | $ | 676 | | $ | 493 | | $ | 527 | | 1.68 | % | 1.34 | % | 1.31 | |
Trading account liabilities (7)(8) |
|
|
|
|
|
| | | | | | | ||||||||||||
In U.S. offices | $ | 34,287 | | $ | 32,215 | | $ | 27,420 | | $ | 81 | | $ | 84 | | $ | 64 | | 0.95 | % | 1.06 | % | 0.94 | % |
In offices outside the U.S. (5) | 56,731 | | 59,667 | | 45,960 | | 65 | | 63 | | 32 | | 0.46 | | 0.43 | | 0.28 | | ||||||
Total | $ | 91,018 | | $ | 91,882 | | $ | 73,380 | | $ | 146 | | $ | 147 | | $ | 96 | | 0.64 | % | 0.65 | % | 0.53 | % |
Short-term borrowings (9) |
|
|
|
|
|
| | | | | | | ||||||||||||
In U.S. offices | $ | 68,486 | | $ | 71,607 | | $ | 54,825 | | $ | 103 | | $ | 85 | | $ | 43 | | 0.60 | % | 0.48 | % | 0.32 | % |
In offices outside the U.S. (5) | 23,070 | | 24,006 | | 10,253 | | 99 | | 114 | | 66 | | 1.72 | | 1.93 | | 2.59 | | ||||||
Total | $ | 91,556 | | $ | 95,613 | | $ | 65,078 | | $ | 202 | | $ | 199 | | $ | 109 | | 0.88 | % | 0.84 | % | 0.67 | % |
Long-term debt (10) |
|
|
|
|
|
| | | | | | | ||||||||||||
In U.S. offices | $ | 187,610 | | $ | 178,656 | | $ | 175,506 | | $ | 1,361 | | $ | 1,255 | | $ | 1,009 | | 2.91 | % | 2.85 | % | 2.31 | % |
In offices outside the U.S. (5) | 4,534 | | 5,313 | | 6,714 | | 48 | | 57 | | 73 | | 4.25 | | 4.35 | | 4.37 | | ||||||
Total | $ | 192,144 | | $ | 183,969 | | $ | 182,220 | | $ | 1,409 | | $ | 1,312 | | $ | 1,082 | | 2.94 | % | 2.89 | % | 2.39 | % |
Total interest-bearing liabilities | $ | 1,287,260 | | $ | 1,251,387 | | $ | 1,203,775 | | $ | 4,036 | | $ | 3,566 | | $ | 3,120 | | 1.26 | % | 1.16 | % | 1.04 | % |
Demand deposits in U.S. offices | $ | 38,772 | | $ | 37,748 | | $ | 38,979 | |
|
|
|
|
|
| |||||||||
Other non-interest-bearing liabilities (7) | 313,229 | | 314,106 | | 335,243 | |
|
|
|
|
|
| ||||||||||||
Total liabilities | $ | 1,639,261 | | $ | 1,603,241 | | $ | 1,577,997 | |
|
|
|
|
|
| |||||||||
Citigroup stockholders' equity (11) | $ | 228,946 | | $ | 226,312 | | $ | 228,149 | |
|
|
|
|
|
| |||||||||
Noncontrolling interest | 1,001 | | 1,001 | | 1,166 | |
|
|
|
|
|
| ||||||||||||
Total equity (11) | $ | 229,947 | | $ | 227,313 | | $ | 229,315 | |
|
|
|
|
|
| |||||||||
Total liabilities and stockholders' equity | $ | 1,869,208 | | $ | 1,830,554 | | $ | 1,807,312 | |
|
|
|
|
|
| |||||||||
Net interest revenue as a percentage of average interest-earning assets (12) |
|
|
|
|
|
|
|
|
| |||||||||||||||
In U.S. offices | $ | 956,968 | | $ | 948,366 | | $ | 942,538 | | $ | 6,777 | | $ | 6,763 | | $ | 6,816 | | 2.84 | % | 2.89 | % | 2.91 | % |
In offices outside the U.S. (6) | 705,659 | | 676,711 | | 652,724 | | 4,510 | | 4,217 | | 4,537 | | 2.56 | | 2.53 | | 2.80 | | ||||||
Total | $ | 1,662,627 | | $ | 1,625,077 | | $ | 1,595,262 | | $ | 11,287 | | $ | 10,980 | | $ | 11,353 | | 2.72 | % | 2.74 | % | 2.86 | % |
(1) | Net interest revenue includes the taxable equivalent adjustments related to the tax-exempt bond portfolio (based on the U.S. federal statutory tax rate of 35%) of $122 million, $123 million, and $117 million for the three months ended June 30, 2017 , March 31, 2017 and June 30, 2016 , respectively. |
(2) | Interest rates and amounts include the effects of risk management activities associated with the respective liability categories. |
(3) | Monthly or quarterly averages have been used by certain subsidiaries where daily averages are unavailable. |
(4) | Consists of other time deposits and savings deposits. Savings deposits are made up of insured money market accounts, NOW accounts and other savings deposits. The interest expense on savings deposits includes FDIC deposit insurance assessments. |
(5) | Average rates reflect prevailing local interest rates, including inflationary effects and monetary corrections in certain countries. |
(6) | Average volumes of securities sold under agreements to repurchase are reported net pursuant to ASC 210-20-45. However, Interest expense excludes the impact of ASC 210-20-45. |
(7) | The fair value carrying amounts of derivative contracts are reported net, pursuant to ASC 815-10-45, in Non-interest-earning assets and Other non-interest-bearing liabilities . |
78
(8) | Interest expense on Trading account liabilities of ICG is reported as a reduction of Interest revenue . Interest revenue and Interest expense on cash collateral positions are reported in interest on Trading account assets and Trading account liabilities , respectively. |
(9) | Includes brokerage payables. |
(10) | Excludes hybrid financial instruments and beneficial interests in consolidated VIEs that are classified as Long-term debt , as these obligations are accounted for in changes in fair value recorded in Principal transactions . |
(11) | Includes stockholders' equity from discontinued operations. |
(12) | Includes allocations for capital and funding costs based on the location of the asset. |
Average Balances and Interest Rates-Assets (1)(2)(3)(4)
Taxable Equivalent Basis
| Average volume | Interest revenue | % Average rate | |||||||||||||
| Six Months | Six Months | Six Months | Six Months | Six Months | Six Months | ||||||||||
In millions of dollars, except rates | 2017 | 2016 | 2017 | 2016 | 2017 | 2016 | ||||||||||
Assets |
|
|
|
|
|
| ||||||||||
Deposits with banks (5) | $ | 160,394 | | $ | 126,505 | | $ | 670 | | $ | 456 | | 0.84 | % | 0.72 | % |
Federal funds sold and securities borrowed or purchased under agreements to resell (6) |
|
|
|
|
|
| ||||||||||
In U.S. offices | $ | 144,243 | | $ | 149,278 | | $ | 840 | | $ | 736 | | 1.17 | | 0.99 | |
In offices outside the U.S. (5) | 103,906 | | 81,295 | | 649 | | 575 | | 1.26 | | 1.42 | | ||||
Total | $ | 248,149 | | $ | 230,573 | | $ | 1,489 | | $ | 1,311 | | 1.21 | % | 1.14 | % |
Trading account assets (7)(8) |
|
|
|
|
|
| ||||||||||
In U.S. offices | $ | 100,958 | | $ | 106,792 | | $ | 1,761 | | $ | 1,923 | | 3.52 | % | 3.62 | % |
In offices outside the U.S. (5) | 98,798 | | 91,640 | | 1,069 | | 1,121 | | 2.18 | | 2.46 | | ||||
Total | $ | 199,756 | | $ | 198,432 | | $ | 2,830 | | $ | 3,044 | | 2.86 | % | 3.08 | % |
Investments |
|
|
|
|
|
| ||||||||||
In U.S. offices |
|
|
|
|
|
| ||||||||||
Taxable | $ | 222,736 | | $ | 227,130 | | $ | 2,120 | | $ | 1,991 | | 1.92 | % | 1.76 | % |
Exempt from U.S. income tax | 18,573 | | 19,205 | | 393 | | 339 | | 4.27 | | 3.55 | | ||||
In offices outside the U.S. (5) | 106,992 | | 105,499 | | 1,619 | | 1,591 | | 3.05 | | 3.03 | | ||||
Total | $ | 348,301 | | $ | 351,834 | | $ | 4,132 | | $ | 3,921 | | 2.39 | % | 2.24 | % |
Loans (net of unearned income) (9) |
|
|
|
|
|
| ||||||||||
In U.S. offices | $ | 368,370 | | $ | 351,765 | | $ | 12,665 | | $ | 11,666 | | 6.93 | % | 6.67 | % |
In offices outside the U.S. (5) | 260,464 | | 264,680 | | 7,529 | | 7,873 | | 5.83 | | 5.98 | | ||||
Total | $ | 628,834 | | $ | 616,445 | | $ | 20,194 | | $ | 19,539 | | 6.48 | % | 6.37 | % |
Other interest-earning assets (10) | $ | 58,418 | | $ | 55,159 | | $ | 554 | | $ | 488 | | 1.91 | % | 1.78 | % |
Total interest-earning assets | $ | 1,643,852 | | $ | 1,578,948 | | $ | 29,869 | | $ | 28,759 | | 3.66 | % | 3.66 | % |
Non-interest-earning assets (7) | $ | 206,029 | | $ | 213,496 | |
| |
| |
| |
| | ||
Total assets | $ | 1,849,881 | | $ | 1,792,444 | |
| |
| |
| |
| | ||
(1) | Net interest revenue includes the taxable equivalent adjustments (based on the U.S. federal statutory tax rate of 35%) of $245 million and $236 million for the six months ended June 30, 2017 and 2016, respectively. |
(2) | Interest rates and amounts include the effects of risk management activities associated with the respective asset and liability categories. |
(3) | Monthly or quarterly averages have been used by certain subsidiaries where daily averages are unavailable. |
(4) | Detailed average volume, Interest revenue and Interest expense exclude Discontinued operations . See Note 2 to the Consolidated Financial Statements. |
(5) | Average rates reflect prevailing local interest rates, including inflationary effects and monetary corrections in certain countries. |
(6) | Average volumes of securities borrowed or purchased under agreements to resell are reported net pursuant to FIN 41 (ASC 210-20-45). However, Interest revenue excludes the impact of FIN 41 (ASC 210-20-45). |
(7) | The fair value carrying amounts of derivative contracts are reported in Non-interest-earning assets and Other non-interest-bearing liabilities . |
(8) | Interest expense on Trading account liabilities of ICG is reported as a reduction of Interest revenue . Interest revenue and Interest expense on cash collateral positions are reported in interest on Trading account assets and Trading account liabilities , respectively. |
(9) | Includes cash-basis loans. |
(10) | Includes brokerage receivables. |
79
Average Balances and Interest Rates-Liabilities and Equity, and Net Interest Revenue (1)(2)(3)(4)
Taxable Equivalent Basis
| Average volume | Interest expense | % Average rate | |||||||||||||
| Six Months | Six Months | Six Months | Six Months | Six Months | Six Months | ||||||||||
In millions of dollars, except rates | 2017 | 2016 | 2017 | 2016 | 2017 | 2016 | ||||||||||
Liabilities |
|
|
|
|
|
| ||||||||||
Deposits |
|
|
|
|
|
| ||||||||||
In U.S. offices (5) | $ | 307,026 | | $ | 282,151 | | $ | 1,100 | | $ | 687 | | 0.72 | % | 0.49 | % |
In offices outside the U.S. (6) | 434,275 | | 429,649 | | 1,918 | | 1,823 | | 0.89 | | 0.85 | | ||||
Total | $ | 741,301 | | $ | 711,800 | | $ | 3,018 | | $ | 2,510 | | 0.82 | % | 0.71 | % |
Federal funds purchased and securities loaned or sold under agreements to repurchase (7) |
|
|
|
|
|
| ||||||||||
In U.S. offices | $ | 98,042 | | $ | 103,520 | | $ | 678 | | $ | 520 | | 1.39 | % | 1.01 | % |
In offices outside the U.S. (6) | 56,890 | | 58,539 | | 491 | | 509 | | 1.74 | | 1.75 | | ||||
Total | $ | 154,932 | | $ | 162,059 | | $ | 1,169 | | $ | 1,029 | | 1.52 | % | 1.28 | % |
Trading account liabilities (8)(9) |
|
|
|
|
|
| ||||||||||
In U.S. offices | $ | 33,251 | | $ | 25,528 | | $ | 165 | | $ | 116 | | 1.00 | % | 0.91 | % |
In offices outside the U.S. (6) | 58,199 | | 43,818 | | 128 | | 68 | | 0.44 | | 0.31 | | ||||
Total | $ | 91,450 | | $ | 69,346 | | $ | 293 | | $ | 184 | | 0.65 | % | 0.53 | % |
Short-term borrowings (10) |
|
|
|
|
|
| ||||||||||
In U.S. offices | $ | 70,047 | | $ | 55,830 | | $ | 188 | | $ | 72 | | 0.54 | % | 0.26 | % |
In offices outside the U.S. (6) | 23,538 | | 16,448 | | 213 | | 138 | | 1.82 | | 1.69 | | ||||
Total | $ | 93,585 | | $ | 72,278 | | $ | 401 | | $ | 210 | | 0.86 | % | 0.58 | % |
Long-term debt (11) |
|
|
|
|
|
| ||||||||||
In U.S. offices | $ | 183,133 | | $ | 173,968 | | $ | 2,616 | | $ | 2,003 | | 2.88 | % | 2.32 | % |
In offices outside the U.S. (6) | 4,924 | | 6,784 | | 105 | | 124 | | 4.30 | | 3.68 | | ||||
Total | $ | 188,057 | | $ | 180,752 | | $ | 2,721 | | $ | 2,127 | | 2.92 | % | 2.37 | % |
Total interest-bearing liabilities | $ | 1,269,325 | | $ | 1,196,235 | | $ | 7,602 | | $ | 6,060 | | 1.21 | % | 1.02 | % |
Demand deposits in U.S. offices | $ | 38,260 | | $ | 35,158 | |
| |
| |
| |
| |||
Other non-interest-bearing liabilities (8) | 311,877 | | 333,652 | |
| |
| |
| |
| |||||
Total liabilities | $ | 1,619,462 | | $ | 1,565,045 | |
| |
| |
| |
| |||
Citigroup stockholders' equity (12) | $ | 229,418 | | $ | 226,235 | |
| |
| |
| |
| |||
Noncontrolling interest | 1,001 | | 1,164 | |
| |
| |
| |
| |||||
Total equity (12) | $ | 230,419 | | $ | 227,399 | |
| |
| |
| |
| |||
Total liabilities and stockholders' equity | $ | 1,849,881 | | $ | 1,792,444 | |
| |
| |
| |
| |||
Net interest revenue as a percentage of average interest-earning assets |
|
|
|
|
|
| ||||||||||
In U.S. offices | $ | 952,667 | | $ | 936,046 | | $ | 13,540 | | $ | 13,802 | | 2.87 | % | 2.97 | % |
In offices outside the U.S. (6) | 691,185 | | 642,902 | | 8,727 | | 8,897 | | 2.55 | | 2.78 | | ||||
Total | $ | 1,643,852 | | $ | 1,578,948 | | $ | 22,267 | | $ | 22,699 | | 2.73 | % | 2.89 | % |
(1) | Net interest revenue includes the taxable equivalent adjustments (based on the U.S. federal statutory tax rate of 35%) of $245 million and $236 million for the six months ended June 30, 2017 and 2016, respectively. |
(2) | Interest rates and amounts include the effects of risk management activities associated with the respective asset and liability categories. |
(3) | Monthly or quarterly averages have been used by certain subsidiaries where daily averages are unavailable. |
(4) | Detailed average volume, Interest revenue and Interest expense exclude Discontinued operations . See Note 2 to the Consolidated Financial Statements. |
(5) | Consists of other time deposits and savings deposits. Savings deposits are made up of insured money market accounts, NOW accounts, and other savings deposits. The interest expense on savings deposits includes FDIC deposit insurance fees and charges. |
(6) | Average rates reflect prevailing local interest rates, including inflationary effects and monetary corrections in certain countries. |
(7) | Average volumes of securities loaned or sold under agreements to repurchase are reported net pursuant to FIN 41 (ASC 210-20-45). However, Interest expense excludes the impact of FIN 41 (ASC 210-20-45). |
(8) | The fair value carrying amounts of derivative contracts are reported in Non-interest-earning assets and Other non-interest-bearing liabilities . |
(9) | Interest expense on Trading account liabilities of ICG is reported as a reduction of Interest revenue . Interest revenue and Interest expense on cash collateral positions are reported in interest on Trading account assets and Trading account liabilities , respectively. |
(10) | Excludes hybrid financial instruments and beneficial interests in consolidated VIEs that are classified as Long-term debt , as these obligations are accounted for in changes in fair value recorded in Principal transactions . |
(11) | Includes stockholders' equity from discontinued operations. |
(12) | Includes allocations for capital and funding costs based on the location of the asset. |
80
Analysis of Changes in Interest Revenue (1)(2)(3)
| 2nd Qtr. 2017 vs. 1st Qtr. 2017 | 2nd Qtr. 2017 vs. 2nd Qtr. 2016 | ||||||||||||||||
| Increase (decrease) due to change in: | Increase (decrease) due to change in: | ||||||||||||||||
In millions of dollars | Average volume | Average rate | Net change | Average volume | Average rate | Net change | ||||||||||||
Deposits with banks (4) | $ | 23 | | $ | 57 | | $ | 80 | | $ | 61 | | $ | 77 | | $ | 138 | |
Federal funds sold and securities borrowed or purchased under agreements to resell |
|
|
|
|
|
| ||||||||||||
In U.S. offices | $ | 1 | | $ | 103 | | $ | 104 | | $ | (10 | ) | $ | 120 | | $ | 110 | |
In offices outside the U.S. (4) | 5 | | 58 | | 63 | | 71 | | (17 | ) | 54 | | ||||||
Total | $ | 6 | | $ | 161 | | $ | 167 | | $ | 61 | | $ | 103 | | $ | 164 | |
Trading account assets (5) |
|
|
|
|
|
| ||||||||||||
In U.S. offices | $ | (15 | ) | $ | 8 | | $ | (7 | ) | $ | (75 | ) | $ | (18 | ) | $ | (93 | ) |
In offices outside the U.S. (4) | 47 | | 176 | | 223 | | 69 | | (26 | ) | 43 | | ||||||
Total | $ | 32 | | $ | 184 | | $ | 216 | | $ | (6 | ) | $ | (44 | ) | $ | (50 | ) |
Investments (1) |
|
|
|
|
|
| ||||||||||||
In U.S. offices | $ | 12 | | $ | 41 | | $ | 53 | | $ | (9 | ) | $ | 131 | | $ | 122 | |
In offices outside the U.S. (4) | (3 | ) | 44 | | 41 | | (4 | ) | (3 | ) | (7 | ) | ||||||
Total | $ | 9 | | $ | 85 | | $ | 94 | | $ | (13 | ) | $ | 128 | | $ | 115 | |
Loans (net of unearned income) (6) |
|
|
|
|
|
| ||||||||||||
In U.S. offices | $ | 33 | | $ | 86 | | $ | 119 | | $ | 267 | | $ | 332 | | $ | 599 | |
In offices outside the U.S. (4) | 131 | | 4 | | 135 | | (33 | ) | (107 | ) | (140 | ) | ||||||
Total | $ | 164 | | $ | 90 | | $ | 254 | | $ | 234 | | $ | 225 | | $ | 459 | |
Other interest-earning assets (7) | $ | 17 | | $ | (51 | ) | $ | (34 | ) | $ | 26 | | $ | (2 | ) | $ | 24 | |
Total interest revenue | $ | 251 | | $ | 526 | | $ | 777 | | $ | 363 | | $ | 487 | | $ | 850 | |
(1) | The taxable equivalent adjustment is related to the tax-exempt bond portfolio based on the U.S. federal statutory tax rate of 35% and is included in this presentation. |
(2) | Rate/volume variance is allocated based on the percentage relationship of changes in volume and changes in rate to the total net change. |
(3) | Detailed average volume, Interest revenue and Interest expense exclude Discontinued operations . See Note 2 to the Consolidated Financial Statements. |
(4) | Changes in average rates reflect changes in prevailing local interest rates, including inflationary effects and monetary corrections in certain countries. |
(5) | Interest expense on Trading account liabilities of ICG is reported as a reduction of Interest revenue . Interest revenue and Interest expense on cash collateral positions are reported in interest on Trading account assets and Trading account liabilities , respectively. |
(6) | Includes cash-basis loans. |
(7) | Includes brokerage receivables. |
81
| 2nd Qtr. 2017 vs. 1st Qtr. 2017 | 2nd Qtr. 2017 vs. 2nd Qtr. 2016 | ||||||||||||||||
| Increase (decrease) due to change in: | Increase (decrease) due to change in: | ||||||||||||||||
In millions of dollars | Average volume | Average rate | Net change | Average volume | Average rate | Net change | ||||||||||||
Deposits |
|
|
|
|
|
| ||||||||||||
In U.S. offices | $ | 16 | | $ | 70 | | $ | 86 | | $ | 35 | | $ | 187 | | $ | 222 | |
In offices outside the U.S. (4) | 24 | | 78 | | 102 | | 10 | | 65 | | 75 | | ||||||
Total | $ | 40 | | $ | 148 | | $ | 188 | | $ | 45 | | $ | 252 | | $ | 297 | |
Federal funds purchased and securities loaned |
|
|
|
|
|
| ||||||||||||
In U.S. offices | $ | 23 | | $ | 91 | | $ | 114 | | $ | (5 | ) | $ | 141 | | $ | 136 | |
In offices outside the U.S. (4) | 20 | | 49 | | 69 | | 8 | | 5 | | 13 | | ||||||
Total | $ | 43 | | $ | 140 | | $ | 183 | | $ | 3 | | $ | 146 | | $ | 149 | |
Trading account liabilities (5) |
|
|
|
|
|
| ||||||||||||
In U.S. offices | $ | 5 | | $ | (8 | ) | $ | (3 | ) | $ | 16 | | $ | 1 | | $ | 17 | |
In offices outside the U.S. (4) | (3 | ) | 5 | | 2 | | 9 | | 24 | | 33 | | ||||||
Total | $ | 2 | | $ | (3 | ) | $ | (1 | ) | $ | 25 | | $ | 25 | | $ | 50 | |
Short-term borrowings (6) |
|
|
|
|
|
| ||||||||||||
In U.S. offices | $ | (4 | ) | $ | 22 | | $ | 18 | | $ | 13 | | $ | 47 | | $ | 60 | |
In offices outside the U.S. (4) | (4 | ) | (11 | ) | (15 | ) | 61 | | (28 | ) | 33 | | ||||||
Total | $ | (8 | ) | $ | 11 | | $ | 3 | | $ | 74 | | $ | 19 | | $ | 93 | |
Long-term debt |
|
|
|
|
|
| ||||||||||||
In U.S. offices | $ | 64 | | $ | 42 | | $ | 106 | | $ | 73 | | $ | 279 | | $ | 352 | |
In offices outside the U.S. (4) | (8 | ) | (1 | ) | (9 | ) | (23 | ) | (2 | ) | (25 | ) | ||||||
Total | $ | 56 | | $ | 41 | | $ | 97 | | $ | 50 | | $ | 277 | | $ | 327 | |
Total interest expense | $ | 133 | | $ | 337 | | $ | 470 | | $ | 197 | | $ | 719 | | $ | 916 | |
Net interest revenue | $ | 118 | | $ | 189 | | $ | 307 | | $ | 166 | | $ | (232 | ) | $ | (66 | ) |
(1) | The taxable equivalent adjustment is related to the tax-exempt bond portfolio based on the U.S. federal statutory tax rate of 35% and is included in this presentation. |
(2) | Rate/volume variance is allocated based on the percentage relationship of changes in volume and changes in rate to the total net change. |
(3) | Detailed average volume, Interest revenue and Interest expense exclude Discontinued operations . See Note 2 to the Consolidated Financial Statements. |
(4) | Changes in average rates reflect changes in prevailing local interest rates, including inflationary effects and monetary corrections in certain countries. |
(5) | Interest expense on Trading account liabilities of ICG is reported as a reduction of Interest revenue . Interest revenue and Interest expense on cash collateral positions are reported in interest on Trading account assets and Trading account liabilities , respectively. |
(6) | Includes brokerage payables. |
82
Analysis of Changes in Interest Revenue, Interest Expense, and Net Interest Revenue (1)(2)(3)
| Six Months 2017 vs. Six Months 2016 | ||||||||
| Increase (decrease) due to change in: | ||||||||
In millions of dollars | Average volume | Average rate | Net change (2) | ||||||
Deposits with banks (4) | $ | 134 | | $ | 80 | | $ | 214 | |
Federal funds sold and securities borrowed or purchased under agreements to resell |
|
|
| ||||||
In U.S. offices | $ | (26 | ) | $ | 130 | | $ | 104 | |
In offices outside the U.S. (4) | 147 | | (73 | ) | 74 | | |||
Total | $ | 121 | | $ | 57 | | $ | 178 | |
Trading account assets (5) |
|
|
| ||||||
In U.S. offices | $ | (103 | ) | $ | (59 | ) | $ | (162 | ) |
In offices outside the U.S. (4) | 83 | | (135 | ) | (52 | ) | |||
Total | $ | (20 | ) | $ | (194 | ) | $ | (214 | ) |
Investments (1) |
|
|
| ||||||
In U.S. offices | $ | (48 | ) | $ | 231 | | $ | 183 | |
In offices outside the U.S. (4) | 23 | | 5 | | 28 | | |||
Total | $ | (25 | ) | $ | 236 | | $ | 211 | |
Loans (net of unearned income) (6) |
|
|
| ||||||
In U.S. offices | $ | 562 | | $ | 437 | | $ | 999 | |
In offices outside the U.S. (4) | (124 | ) | (220 | ) | (344 | ) | |||
Total | $ | 438 | | $ | 217 | | $ | 655 | |
Other interest-earning assets | $ | 30 | | $ | 36 | | $ | 66 | |
Total interest revenue | $ | 678 | | $ | 432 | | $ | 1,110 | |
Deposits (7) |
|
|
| ||||||
In U.S. offices | $ | 65 | | $ | 348 | | $ | 413 | |
In offices outside the U.S. (4) | 20 | | 75 | | 95 | | |||
Total | $ | 85 | | $ | 423 | | $ | 508 | |
Federal funds purchased and securities loaned or sold under agreements to repurchase |
|
|
| ||||||
In U.S. offices | $ | (29 | ) | $ | 187 | | $ | 158 | |
In offices outside the U.S. (4) | (14 | ) | (4 | ) | (18 | ) | |||
Total | $ | (43 | ) | $ | 183 | | $ | 140 | |
Trading account liabilities (5) |
|
|
| ||||||
In U.S. offices | $ | 38 | | $ | 11 | | $ | 49 | |
In offices outside the U.S. (4) | 26 | | 34 | | 60 | | |||
Total | $ | 64 | | $ | 45 | | $ | 109 | |
Short-term borrowings |
|
|
| ||||||
In U.S. offices | $ | 22 | | $ | 94 | | $ | 116 | |
In offices outside the U.S. (4) | 63 | | 13 | | 76 | | |||
Total | $ | 85 | | $ | 107 | | $ | 192 | |
Long-term debt |
|
|
| ||||||
In U.S. offices | $ | 110 | | $ | 502 | | $ | 612 | |
In offices outside the U.S. (4) | (38 | ) | 19 | | (19 | ) | |||
Total | $ | 72 | | $ | 521 | | $ | 593 | |
Total interest expense | $ | 263 | | $ | 1,279 | | $ | 1,542 | |
Net interest revenue | $ | 415 | | $ | (847 | ) | $ | (432 | ) |
(1) | The taxable equivalent adjustment is based on the U.S. Federal statutory tax rate of 35% and is included in this presentation. |
(2) | Rate/volume variance is allocated based on the percentage relationship of changes in volume and changes in rate to the total net change. |
(3) | Detailed average volume, Interest revenue and Interest expense exclude Discontinued operations . |
(4) | Changes in average rates reflect changes in prevailing local interest rates, including inflationary effects and monetary corrections in certain countries. |
83
(5) | Interest expense on Trading account liabilities of ICG is reported as a reduction of Interest revenue . Interest revenue and Interest expense on cash collateral positions are reported in Trading account assets and Trading account liabilities , respectively. |
(6) | Includes cash-basis loans. |
(7) | The interest expense on deposits includes the FDIC assessment and deposit insurance fees and charges of $502 million and $585 million for the six months ended June 30, 2017 and 2016, respectively. |
84
Market Risk of Trading Portfolios
For additional information on Citi's market risk of trading portfolios, see "Market Risk-Market Risk of Trading Portfolios" in Citi's 2016 Annual Report on Form 10-K.
Value at Risk
As of June 30, 2017 , Citi estimates that the conservative features of its VAR calibration contribute an approximate 22% add-on (unchanged from March 31, 2017) to what would be a VAR estimated under the assumption of stable and perfectly normal distributed markets.
As set forth in the table below, Citi's average trading VAR as of June 30, 2017 was substantially unchanged compared to March 31, 2017, with changes in interest rate exposures offset by changes in credit spread exposures. Average trading and credit portfolio VAR as of June 30, 2017 slightly decreased mainly due to a reduction of the hedges to the lending portfolio.
Quarter-end and Average Trading VAR and Trading and Credit Portfolio VAR
|
| Second Quarter |
| First Quarter |
| Second Quarter | ||||||||||||
In millions of dollars | June 30, 2017 | 2017 Average | March 31, 2017 | 2017 Average | June 30, 2016 | 2016 Average | ||||||||||||
Interest rate | $ | 48 | | $ | 52 | | $ | 52 | | $ | 48 | | $ | 32 | | $ | 32 | |
Credit spread | 52 | | 49 | | 54 | | 56 | | 61 | | $ | 60 | | |||||
Covariance adjustment (1) | (15 | ) | (15 | ) | (17 | ) | (17 | ) | (30 | ) | (26 | ) | ||||||
Fully diversified interest rate and credit spread (2) | $ | 85 | | $ | 86 | | $ | 89 | | $ | 87 | | $ | 63 | | $ | 66 | |
Foreign exchange | 23 | | 23 | | 16 | | 24 | | 26 | | 20 | | ||||||
Equity | 15 | | 15 | | 17 | | 15 | | 11 | | 15 | | ||||||
Commodity | 20 | | 21 | | 23 | | 23 | | 23 | | 20 | | ||||||
Covariance adjustment (1) | (53 | ) | (59 | ) | (53 | ) | (63 | ) | (59 | ) | (56 | ) | ||||||
Total trading VAR-all market risk factors, including general and specific risk (excluding credit portfolios) (3) | $ | 90 | | $ | 86 | | $ | 92 | | $ | 86 | | $ | 64 | | $ | 65 | |
Specific risk-only component (4) | $ | 1 | | $ | 1 | | $ | - | | $ | 2 | | $ | 9 | | $ | 9 | |
Total trading VAR-general market risk factors only (excluding credit portfolios) (3) | $ | 89 | | $ | 85 | | $ | 92 | | $ | 84 | | $ | 55 | | $ | 56 | |
Incremental impact of the credit portfolio (5)(6) | $ | 5 | | $ | 10 | | $ | 15 | | $ | 14 | | $ | 22 | | $ | 23 | |
Total trading and credit portfolio VAR | $ | 95 | | $ | 96 | | $ | 107 | | $ | 100 | | $ | 86 | | $ | 88 | |
(1) | Covariance adjustment (also known as diversification benefit) equals the difference between the total VAR and the sum of the VARs tied to each individual risk type. The benefit reflects the fact that the risks within each and across risk types are not perfectly correlated and, consequently, the total VAR on a given day will be lower than the sum of the VARs relating to each individual risk type. The determination of the primary drivers of changes to the covariance adjustment is made by an examination of the impact of both model parameter and position changes. |
(2) | The increase in the second quarter of 2017 end of period and average VaR attributable to fully diversified interest rate and credit spread year-over-year was primarily due to lower trading volumes in the prior-year period. |
(3) | The total trading VAR includes mark-to-market and certain fair value option trading positions in ICG , with the exception of hedges to the loan portfolio, fair value option loans and all CVA exposures. Available-for-sale and accrual exposures are not included. |
(4) | The specific risk-only component represents the level of equity and fixed income issuer-specific risk embedded in VAR. |
(5) | The credit portfolio is composed of mark-to-market positions associated with non-trading business units including Citi Treasury, the CVA relating to derivative counterparties and all associated CVA hedges. FVA and DVA are not included. The credit portfolio also includes hedges to the loan portfolio, fair value option loans and hedges to the leveraged finance pipeline within capital markets origination in ICG . |
(6) | The decrease in the second quarter of 2017 end of period and average VaR attributable to the incremental impact of the credit portfolio year-over-year and sequentially was primarily related to a reduction in the use of credit default swaps used to hedge the corporate loan portfolio. |
85
The table below provides the range of market factor VARs associated with Citi's total trading VAR, inclusive of specific risk:
| Second Quarter | First Quarter | Second Quarter | |||||||||||||||
| 2017 | 2017 | 2016 | |||||||||||||||
In millions of dollars | Low | High | Low | High | Low | High | ||||||||||||
Interest rate | $ | 33 | | $ | 72 | | $ | 29 | | $ | 70 | | $ | 26 | | $ | 40 | |
Credit spread | 47 | | 53 | | 51 | | 63 | | 56 | | 64 | | ||||||
Fully diversified interest rate and credit spread | $ | 67 | | $ | 107 | | $ | 59 | | $ | 109 | | $ | 60 | | $ | 74 | |
Foreign exchange | 17 | | 28 | | 16 | | 35 | | 14 | | 29 | | ||||||
Equity | 10 | | 24 | | 6 | | 25 | | 10 | | 26 | | ||||||
Commodity | 14 | | 30 | | 18 | | 30 | | 16 | | 25 | | ||||||
Total trading | $ | 67 | | $ | 116 | | $ | 61 | | $ | 107 | | $ | 55 | | $ | 76 | |
Total trading and credit portfolio | 78 | | 123 | | 75 | | 123 | | 79 | | 98 | | ||||||
Note: No covariance adjustment can be inferred from the above table as the high and low for each market factor will be from different close-of-business dates.
The following table provides the VAR for ICG , excluding the CVA relating to derivative counterparties, hedges of CVA, fair value option loans and hedges to the loan portfolio:
In millions of dollars | Jun. 30, 2017 | ||
Total-all market risk factors, including general and specific risk | $ | 89 | |
Average-during quarter | $ | 86 | |
High-during quarter | 115 | | |
Low-during quarter | 65 | | |
Regulatory VAR Back-testing
In accordance with Basel III, Citi is required to perform back-testing to evaluate the effectiveness of its Regulatory VAR model. Regulatory VAR back-testing is the process in which the daily one-day VAR, at a 99% confidence interval, is compared to the buy-and-hold profit and loss (i.e., the profit and loss impact if the portfolio is held constant at the end of the day and re-priced the following day). Buy-and-hold profit and loss represents the daily mark-to-market profit and loss attributable to price movements in covered positions from the close of the previous business day. Buy-and-hold profit and loss excludes realized trading revenue, net interest, fees and commissions, intra-day trading profit and loss and changes in reserves.
Based on a 99% confidence level, Citi would expect two to three days in any one year where buy-and-hold losses exceeded the Regulatory VAR. Given the conservative calibration of Citi's VAR model (as a result of taking the greater of short- and long-term volatilities and fat-tail scaling of volatilities), Citi would expect fewer exceptions under normal and stable market conditions. Periods of unstable market conditions could increase the number of back-testing exceptions.
As of June 30, 2017, there was one back-testing exception observed for Citi's Regulatory VAR for the prior 12 months. As previously disclosed, trading losses on November 14, 2016 exceeded the VAR estimate at the Citigroup level, driven by the widening of municipal bond
yields following the election results in the United States.
86
COUNTRY RISK
For additional information on country risk at Citi, see "Country Risk" in Citi's 2016 Annual Report on Form 10-K.
Top 25 Country Exposures
The following table presents Citi's top 25 exposures by
country (excluding the U.S.) as of June 30, 2017 . For
purposes of the table, loan amounts are reflected in the country
where the loan is booked, which is generally based on the
domicile of the borrower. For example, a loan to a Chinese
subsidiary of a Switzerland-based corporation will generally
be categorized as a loan in China. In addition, Citi has
developed regional booking centers in certain countries, most
significantly in the United Kingdom (U.K.) and Ireland, in
order to more efficiently serve its corporate customers. As an
example, with respect to the U.K., only 25% of corporate
loans presented in the table below are to U.K. domiciled
entities (27% for unfunded commitments), with the balance of
the loans predominately to European domiciled counterparties.
Approximately 81% of the total U.K. funded loans and 91% of
the total U.K. unfunded commitments were investment grade
as of June 30, 2017 . Trading account assets and investment securities are generally categorized based on the domicile of the issuer of the security of the underlying reference entity. For additional information on the assets included in the table, see the footnotes to the table below.
For a discussion of uncertainties arising as a result of the vote in the U.K. to withdraw from the EU, see "Risk Factors-Strategic Risks" in Citigroup's 2016 Annual Report on Form 10-K.
In billions of dollars | ICG loans (1) | GCB loans (2) | Other funded (3) | Unfunded (4) | Net MTM on derivatives/repos (5) | Total hedges (on loans and CVA) | Investment securities (6) | Trading account assets (7) | Total as of 2Q17 | Total as of 1Q17 | Total as of 4Q16 | ||||||||||||||||||||||
United Kingdom | $ | 34.3 | | $ | - | | $ | 3.3 | | $ | 56.5 | | $ | 11.0 | | $ | (2.1 | ) | $ | 8.0 | | $ | 0.8 | | $ | 111.8 | | $ | 108.6 | | $ | 107.5 | |
Mexico | 8.4 | | 26.6 | | 0.4 | | 6.1 | | 0.7 | | (0.6 | ) | 13.5 | | 6.2 | | 61.3 | | 59.1 | | 52.4 | | |||||||||||
Singapore | 12.8 | | 12.2 | | 0.1 | | 6.6 | | 0.9 | | (0.3 | ) | 8.4 | | 0.5 | | 41.2 | | 39.8 | | 36.4 | | |||||||||||
Hong Kong | 14.5 | | 10.5 | | 0.9 | | 6.0 | | 0.5 | | (0.5 | ) | 6.0 | | 1.8 | | 39.7 | | 40.3 | | 35.9 | | |||||||||||
Korea | 2.5 | | 19.0 | | 0.4 | | 3.6 | | 1.3 | | (0.8 | ) | 7.5 | | 1.6 | | 35.1 | | 36.0 | | 34.0 | | |||||||||||
India | 7.9 | | 6.5 | | 0.7 | | 5.2 | | 2.3 | | (1.1 | ) | 9.8 | | 2.1 | | 33.4 | | 36.2 | | 30.9 | | |||||||||||
Ireland | 11.3 | | - | | 0.9 | | 15.8 | | 0.3 | | - | | - | | 0.6 | | 28.9 | | 25.3 | | 24.8 | | |||||||||||
Brazil (2) | 13.3 | | 1.8 | | 0.2 | | 3.5 | | 4.8 | | (2.8 | ) | 3.2 | | 3.3 | | 27.3 | | 28.9 | | 28.5 | | |||||||||||
Australia | 4.0 | | 10.9 | | - | | 5.8 | | 0.9 | | (0.9 | ) | 4.1 | | (1.1 | ) | 23.7 | | 23.9 | | 22.4 | | |||||||||||
Germany | 0.1 | | - | | - | | 4.2 | | 4.2 | | (2.3 | ) | 9.6 | | 3.7 | | 19.5 | | 18.0 | | 16.0 | | |||||||||||
China | 6.9 | | 4.4 | | 0.2 | | 1.6 | | 1.9 | | (1.0 | ) | 3.4 | | 2.0 | | 19.4 | | 17.4 | | 17.2 | | |||||||||||
Japan | 2.7 | | - | | 0.2 | | 7.3 | | 3.7 | | (1.0 | ) | 4.2 | | 1.5 | | 18.6 | | 18.3 | | 18.3 | | |||||||||||
Taiwan | 4.6 | | 8.6 | | 0.1 | | 1.1 | | 0.8 | | (0.2 | ) | 1.7 | | 1.7 | | 18.4 | | 18.5 | | 16.6 | | |||||||||||
Canada | 1.8 | | 0.6 | | 0.5 | | 6.6 | | 1.8 | | (0.5 | ) | 4.5 | | 1.0 | | 16.3 | | 15.0 | | 17.0 | | |||||||||||
Poland | 3.3 | | 1.8 | | - | | 3.0 | | 0.2 | | (0.3 | ) | 4.9 | | 0.2 | | 13.1 | | 12.2 | | 11.8 | | |||||||||||
Malaysia | 1.3 | | 4.5 | | 0.3 | | 1.5 | | 0.1 | | (0.2 | ) | 0.7 | | 0.8 | | 9.0 | | 9.1 | | 9.3 | | |||||||||||
Thailand | 0.9 | | 2.0 | | 0.1 | | 1.9 | | 0.3 | | - | | 1.6 | | 0.2 | | 7.0 | | 6.2 | | 5.8 | | |||||||||||
United Arab Emirates | 2.9 | | 1.4 | | 0.1 | | 2.1 | | 0.3 | | (0.4 | ) | - | | (0.2 | ) | 6.2 | | 5.9 | | 6.0 | | |||||||||||
Luxembourg | - | | - | | - | | - | | 0.4 | | (0.3 | ) | 5.3 | | 0.4 | | 5.8 | | 5.7 | | 5.4 | | |||||||||||
Indonesia | 1.9 | | 1.1 | | 0.1 | | 1.2 | | - | | (0.2 | ) | 1.3 | | 0.3 | | 5.7 | | 5.5 | | 5.2 | | |||||||||||
Colombia (2) | 2.1 | | 1.6 | | - | | 1.0 | | 0.2 | | (0.1 | ) | 0.4 | | 0.1 | | 5.3 | | 5.8 | | 5.6 | | |||||||||||
Netherlands | - | | - | | - | | - | | 1.4 | | (0.7 | ) | 3.7 | | 0.5 | | 4.9 | | 6.8 | | 5.1 | | |||||||||||
Russia | 1.9 | | 1.0 | | - | | 1.0 | | 0.2 | | (0.2 | ) | 0.8 | | - | | 4.7 | | 6.0 | | 5.3 | | |||||||||||
Jersey | 2.8 | | - | | - | | 1.3 | | - | | - | | - | | - | | 4.1 | | 3.8 | | 3.7 | | |||||||||||
South Africa | 1.5 | | - | | - | | 1.1 | | 0.1 | | (0.3 | ) | 1.3 | | 0.2 | | 3.9 | | 3.5 | | 3.9 | | |||||||||||
(1) | ICG loans reflect funded corporate loans and private bank loans, net of unearned income. As of June 30, 2017 , private bank loans in the table above totaled $21.7 billion, concentrated in Singapore ($6.9 billion), Hong Kong ($5.8 billion) and the U.K. ($4.9 billion). |
(2) | GCB loans include loans in Brazil and Colombia related to businesses that were transferred to Corporate/Other as of January 1, 2016 (Brazil GCB loans are recorded as HFS in Other assets on the Consolidated Balance Sheet). |
(3) | Other funded includes other direct exposure such as accounts receivable, loans held-for-sale, other loans in Corporate/Other and investments accounted for under the equity method. |
87
(4) | Unfunded exposure includes unfunded corporate lending commitments, letters of credit and other contingencies. |
(5) | Net mark-to-market (MTM) on derivatives and securities lending / borrowing transactions (repos). Exposures are shown net of collateral and inclusive of CVA. Includes margin loans. |
(6) | Investment securities include securities available-for-sale, recorded at fair market value, and securities held-to-maturity, recorded at historical cost. |
(7) | Trading account assets are shown on a net basis and include derivative exposure where the underlying reference entity is located in that country. |
88
INCOME TAXES
Deferred Tax Assets
For additional information on Citi's deferred tax assets (DTAs), see "Risk Factors-Strategic Risks," "Significant Accounting Policies and Significant Estimates-Income Taxes" and Note 9 to the Consolidated Financial Statements in Citi's 2016 Annual Report on Form 10-K.
At June 30, 2017 , Citigroup had recorded net DTAs of approximately $45.8 billion, a decrease of $0.1 billion from March 31, 2017 and $0.9 billion from December 31, 2016. The DTA reductions for the three and six months ended June 30, 2017 were primarily driven by the generation of earnings.
The following table summarizes Citi's net DTAs balance as of the periods presented. Of Citi's net DTAs as of June 30, 2017 , those arising from net operating losses, foreign tax credit and general business credit carry-forwards are 100% deducted in calculating Citi's regulatory capital, while DTAs arising from temporary differences are deducted from regulatory capital if in excess of the 10%/15% limitations (see "Capital Resources" above). Approximately $17.6 billion of the net DTA was not deducted in calculating regulatory capital pursuant to full Basel III implementation standards as of June 30, 2017 .
Jurisdiction/Component | DTAs balance | |||||
In billions of dollars | Jun. 30, 2017 | December 31, | ||||
Total U.S. | $ | 43.5 | | $ | 44.6 | |
Total foreign | 2.3 | | 2.1 | | ||
Total | $ | 45.8 | | $ | 46.7 | |
Effective Tax Rate
Citi's effective tax rate for the second quarter of 2017 was 31.6%, as compared with 29.9% in the second quarter of 2016 . The prior-year rate was lower because of certain nonrecurring items.
89
DISCLOSURE CONTROLS AND PROCEDURES
Citi's disclosure controls and procedures are designed to ensure that information required to be disclosed under the Securities Exchange Act of 1934, as amended, is recorded, processed, summarized and reported within the time periods specified in the SEC's rules and forms, including without limitation that information required to be disclosed by Citi in its SEC filings is accumulated and communicated to management, including the Chief Executive Officer (CEO) and Chief Financial Officer (CFO), as appropriate, to allow for timely decisions regarding required disclosure.
Citi's Disclosure Committee assists the CEO and CFO in their responsibilities to design, establish, maintain and evaluate the effectiveness of Citi's disclosure controls and procedures. The Disclosure Committee is responsible for, among other things, the oversight, maintenance and implementation of the disclosure controls and procedures, subject to the supervision and oversight of the CEO and CFO.
Citi's management, with the participation of its CEO and CFO, has evaluated the effectiveness of Citigroup's disclosure controls and procedures (as defined in Rule 13a-15(e) under the Securities Exchange Act of 1934) as of June 30, 2017 and, based on that evaluation, the CEO and CFO have concluded that at that date, Citigroup's disclosure controls and procedures were effective.
DISCLOSURE PURSUANT TO SECTION 219 OF THE IRAN THREAT REDUCTION AND SYRIA HUMAN RIGHTS ACT
Pursuant to Section 219 of the Iran Threat Reduction and Syria Human Rights Act of 2012, which added Section 13(r) to the Securities Exchange Act of 1934, as amended, Citi is required to disclose in its annual or quarterly reports, as applicable, whether it or any of its affiliates knowingly engaged in certain activities, transactions or dealings relating to Iran or with individuals or entities that are subject to sanctions under U.S. law. Disclosure is generally required even where the activities, transactions or dealings were conducted in compliance with applicable law. Citi disclosed reportable activities pursuant to Section 219 in the first quarter of 2017 in the First Quarter of 2017 Form 10-Q.
In addition to Citi's prior disclosure, during the second quarter of 2017 a branch of Citibank, N.A. located in London processed a funds transfer involving the Iranian Embassy in South Africa. The value of the funds transfer was EUR 100 (approximately $112.00). In addition, a branch of Citibank, N.A. located in the United Arab Emirates processed a funds transfer involving Bank Melli, Iran. The value of the funds transfer was AED 2,975 (approximately $810.00). These payments were for passport-related fees and Iran-related travel respectively, both of which are permissible under the travel exemption in the Iranian Transactions and Sanctions Regulations.
90
FORWARD-LOOKING STATEMENTS
Certain statements in this Form 10-Q, including but not limited to statements included within the Management's Discussion and Analysis of Financial Condition and Results of Operations, are "forward-looking statements" within the meaning of the rules and regulations of the SEC. In addition, Citigroup also may make forward-looking statements in its other documents filed or furnished with the SEC, and its management may make forward-looking statements orally to analysts, investors, representatives of the media and others.
Generally, forward-looking statements are not based on historical facts but instead represent Citigroup's and its management's beliefs regarding future events. Such statements may be identified by words such as believe, expect, anticipate, intend, estimate, may increase, may fluctuate, target, illustrative, and similar expressions or future or conditional verbs such as will, should, would and could.
Such statements are based on management's current expectations and are subject to risks, uncertainties and changes in circumstances. Actual results and capital and other financial conditions may differ materially from those included in these statements due to a variety of factors, including without limitation (i) the precautionary statements included within each individual business's discussion and analysis of its results of operations above and in Citi's 2016 Annual Report on Form 10-K; (ii) the factors listed and described under "Risk Factors" in Citi's 2016 Annual Report on Form 10-K; and (iii) the risks and uncertainties summarized below:
• | Citi's ability to address (i) the shortcomings identified by the Federal Reserve Board and FDIC as a result of their review of Citi's 2015 annual resolution plan submission as well as (ii) the 2017 resolution plan guidance in Citi's recent 2017 resolution plan submission; |
• | the potential impact on Citi's ability to return capital to shareholders due to any changes to the stress testing and CCAR requirements or process, such as the introduction of a firm-specific "stress capital buffer" or incorporation of Citi's then-effective GSIB surcharge into its post-stress test minimum capital requirements or the introduction of additional macroprudential considerations such as funding and liquidity shocks in the stress testing process; |
• | the ongoing regulatory uncertainties and changes faced by financial institutions, including Citi, in the U.S. and globally, including, among others, uncertainties and potential changes arising from the U.S. presidential administration and Congress, potential changes to various aspects of the regulatory capital framework and the terms of and other uncertainties resulting from the U.K.'s initiation of the process to withdraw from the European Union, and the potential impact these uncertainties and changes could have on Citi's businesses, results of operations, financial condition, strategy or organizational structure and compliance risks and costs; |
• | the numerous uncertainties arising as a result of the initiation of the process in the U.K. to withdraw from the European Union, including the terms of the withdrawal, and the potential impact to macroeconomic conditions as well as Citi's legal entity structure and overall results of operations or financial condition; |
• | the potential impact to financial institutions, including Citi, as a result of the uncertainties associated with any potential balance sheet normalization program by the Federal Reserve Board or other central banks; |
• | the impact on the value of Citi's DTAs and on Citi's net income or regulatory capital if corporate tax rates in the U.S. or certain state, local or foreign jurisdictions are reduced, or if other changes are made to the U.S. corporate tax system, including a potential change to a territorial system or a one-time mandatory deemed repatriation of all untaxed non-U.S. earnings at a significantly lower rate; |
• | Citi's ability to continue to utilize its DTAs (including the foreign tax credit component of its DTAs) and thus reduce the negative impact of the DTAs on Citi's regulatory capital, including as a result of movements in Citi's AOCI, which can be impacted by changes in interest rates and foreign exchange rates; |
• | the potential impact to Citi if its interpretation or application of the extensive tax laws to which it is subject, such as withholding tax obligations and stamp and other transactional taxes, differs from those of the relevant governmental authorities; |
• | Citi's ability to achieve the expected returns on its ongoing investments in its businesses or meet its operational or financial objectives or targets, including as a result of factors that Citi cannot control; |
• | the potential negative impact to Citi's co-branding and private label credit card relationships as well as Citi's results of operations or financial condition, including as a result of loss of revenues, impairment of purchased credit card relationships and contract related intangibles or other losses, due to, among other things, operational difficulties of a particular retailer or merchant or early termination of a particular relationship, or external factors, including bankruptcies, liquidations, consolidations and other similar events; |
• | the potential impact to Citi's businesses, credit costs, deposits and overall results of operations and financial condition as a result of macroeconomic and geopolitical challenges and uncertainties, including those relating to potential outcomes of elections in the EU, potential fiscal or monetary actions or the pursuit of protectionist trade and other policies by the U.S.; |
• | the various risks faced by Citi as a result of its presence in the emerging markets, including, among others, foreign exchange controls, sociopolitical instability (including from hyper-inflation), fraud, nationalization or loss of licenses, business restrictions, sanctions or asset freezes, potential criminal charges, closure of branches or subsidiaries and confiscation of assets as well as the increased compliance and regulatory risks and costs; |
91
• | the uncertainties regarding the consequences of noncompliance and the potential impact on Citi's estimates of its eligible debt arising from the Federal Reserve Board's final total loss-absorbing capacity (TLAC) rules; |
• | the potential impact of concentrations of risk, such as market risk arising from Citi's volume of transactions with counterparties in the financial services industry, on Citi's hedging strategies and results of operations; |
• | the potential impacts on Citi's liquidity and/or costs of funding as a result of external factors, including, among others, market disruptions and governmental fiscal and monetary policies as well as regulatory changes or negative investor perceptions of Citi's creditworthiness; |
• | the impact of ratings downgrades of Citi or one or more of its more significant subsidiaries or issuing entities on Citi's funding and liquidity as well as the results of operations of certain of its businesses; |
• | the potential impact to Citi from a disruption of its operational systems, including as a result of, among other things, human error, fraud or malice, accidental technological failure, electrical or telecommunication outages or failure of computer servers; |
• | the potential impact to Citi from an increasing risk of continually evolving cybersecurity risks (including theft of funds or theft, loss, misuse or disclosure of confidential client, customer, corporate or network information or assets), damage to Citi's reputation, additional costs (including credit costs) to Citi, regulatory penalties, legal exposure and financial losses; |
• | the potential impact of incorrect assumptions or estimates in Citi's financial statements or the impact of ongoing changes to financial accounting and reporting standards or interpretations, such as the FASB's new accounting standard on credit losses, on how Citi records and reports its financial condition and results of operations; |
• | the potential impact to Citi of ongoing implementation and interpretation of regulatory changes and requirements in the U.S. and globally, such as on Citi's compliance risks and costs, including reputational and legal risks as well as remediation and other financial costs, such as penalties and fines; |
• | the potential outcomes of the extensive legal and regulatory proceedings, investigations and other inquiries to which Citi is or may be subject at any given time, particularly given the increased focus on conduct risk and the severity of the remedies sought and potential collateral consequences to Citi arising from such outcomes; |
• | the potential impact to Citi's results of operations and/or regulatory capital and capital ratios if Citi's risk models, including its Basel III risk-weighted asset models, are ineffective, require refinement, modification or enhancement or approval is withdrawn by Citi's U.S. banking regulators; and |
• | the potential impact on Citi's performance, including its competitive position and ability to effectively manage its businesses and continue to execute its strategy, if Citi is unable to hire and retain highly qualified employees for any reason. |
Any forward-looking statements made by or on behalf of Citigroup speak only as to the date they are made, and Citi does not undertake to update forward-looking statements to reflect the impact of circumstances or events that arise after the date the forward-looking statements were made.
92
This page intentionally left blank.
93
FINANCIAL STATEMENTS AND NOTES TABLE OF CONTENTS
CONSOLIDATED FINANCIAL STATEMENTS |
|
Consolidated Statement of Income (Unaudited)- For the Three and Six Months Ended June 30, 2017 and 2016 | 95 |
Consolidated Statement of Comprehensive Income(Unaudited)-For the Three and Six Months Ended June 30, 2017 and 2016 | 96 |
Consolidated Balance Sheet-June 30, 2017 (Unaudited) and December 31, 2016 | 97 |
Consolidated Statement of Changes in Stockholders' Equity(Unaudited)-For the Six Months Ended June 30, 2017 and 2016 | 99 |
Consolidated Statement of Cash Flows (Unaudited)- For the Six Months Ended June 30, 2017 and 2016 | 101 |
NOTES TO CONSOLIDATED FINANCIAL STATEMENTS (UNAUDITED) |
|
Note 1-Basis of Presentation and Accounting Changes | 103 |
Note 2-Discontinued Operations and Significant Disposals | 106 |
Note 3-Business Segments | 108 |
Note 4-Interest Revenue and Expense | 109 |
Note 5-Commissions and Fees | 110 |
Note 6-Principal Transactions | 110 |
Note 7-Incentive Plans | 111 |
Note 8-Retirement Benefits | 111 |
Note 9-Earnings per Share | 116 |
Note 10-Federal Funds, Securities Borrowed, Loaned and | 117 |
Note 11-Brokerage Receivables and Brokerage Payables | 120 |
Note 12-Investments | 121 |
|
|
Note 13-Loans | 133 |
Note 14-Allowance for Credit Losses | 146 |
Note 15-Goodwill and Intangible Assets | 148 |
Note 16-Debt | 150 |
Note 17-Changes in Accumulated Other Comprehensive | 151 |
Note 18-Securitizations and Variable Interest Entities | 157 |
Note 19-Derivatives Activities | 165 |
Note 20-Fair Value Measurement | 175 |
Note 21-Fair Value Elections | 194 |
Note 22-Guarantees and Commitments | 198 |
Note 23-Contingencies | 202 |
Note 24-Condensed Consolidating Financial Statements | 204 |
94
CONSOLIDATED FINANCIAL STATEMENTS
CONSOLIDATED STATEMENT OF INCOME (UNAUDITED) |
| Citigroup Inc. and Subsidiaries |
| Three Months Ended June 30, | Six Months Ended June 30, | ||||||||||
In millions of dollars, except per share amounts | 2017 | 2016 | 2017 | 2016 | ||||||||
Revenues |
|
|
| |
| | ||||||
Interest revenue | $ | 15,201 | | $ | 14,356 | | $ | 29,624 | | $ | 28,523 | |
Interest expense | 4,036 | | 3,120 | | 7,602 | | 6,060 | | ||||
Net interest revenue | $ | 11,165 | | $ | 11,236 | | $ | 22,022 | | $ | 22,463 | |
Commissions and fees | $ | 2,937 | | $ | 2,725 | | $ | 5,696 | | $ | 5,188 | |
Principal transactions | 2,562 | | 1,816 | | 5,584 | | 3,656 | | ||||
Administration and other fiduciary fees | 1,003 | | 878 | | 1,896 | | 1,689 | | ||||
Realized gains on sales of investments, net | 221 | | 200 | | 413 | | 386 | | ||||
Other-than-temporary impairment losses on investments |
|
|
| |
| | ||||||
Gross impairment losses | (20 | ) | (118 | ) | (32 | ) | (583 | ) | ||||
Less: Impairments recognized in AOCI | - | | - | | - | | - | | ||||
Net impairment losses recognized in earnings | $ | (20 | ) | $ | (118 | ) | $ | (32 | ) | $ | (583 | ) |
Insurance premiums | $ | 156 | | $ | 217 | | $ | 325 | | $ | 481 | |
Other revenue | (123 | ) | 594 | | 117 | | 1,823 | | ||||
Total non-interest revenues | $ | 6,736 | | $ | 6,312 | | $ | 13,999 | | $ | 12,640 | |
Total revenues, net of interest expense | $ | 17,901 | | $ | 17,548 | | $ | 36,021 | | $ | 35,103 | |
Provisions for credit losses and for benefits and claims |
|
|
| |
| | ||||||
Provision for loan losses | $ | 1,666 | | $ | 1,390 | | $ | 3,341 | | $ | 3,276 | |
Policyholder benefits and claims | 23 | | 49 | | 53 | | 137 | | ||||
Provision (release) for unfunded lending commitments | 28 | | (30 | ) | (15 | ) | 41 | | ||||
Total provisions for credit losses and for benefits and claims | $ | 1,717 | | $ | 1,409 | | $ | 3,379 | | $ | 3,454 | |
Operating expenses |
|
|
| |
| | ||||||
Compensation and benefits | $ | 5,463 | | $ | 5,229 | | $ | 10,997 | | $ | 10,785 | |
Premises and equipment | 604 | | 642 | | 1,224 | | 1,293 | | ||||
Technology/communication | 1,690 | | 1,657 | | 3,349 | | 3,306 | | ||||
Advertising and marketing | 432 | | 433 | | 805 | | 823 | | ||||
Other operating | 2,317 | | 2,408 | | 4,608 | | 4,685 | | ||||
Total operating expenses | $ | 10,506 | | $ | 10,369 | | $ | 20,983 | | $ | 20,892 | |
Income from continuing operations before income taxes | $ | 5,678 | | $ | 5,770 | | $ | 11,659 | | $ | 10,757 | |
Provision for income taxes | 1,795 | | 1,723 | | 3,658 | | 3,202 | | ||||
Income from continuing operations | $ | 3,883 | | $ | 4,047 | | $ | 8,001 | | $ | 7,555 | |
Discontinued operations |
|
|
| |
| | ||||||
Income (loss) from discontinued operations | $ | 33 | | $ | (36 | ) | $ | 5 | | $ | (39 | ) |
Provision (benefit) for income taxes | 12 | | (13 | ) | 2 | | (14 | ) | ||||
Income (loss) from discontinued operations, net of taxes | $ | 21 | | $ | (23 | ) | $ | 3 | | $ | (25 | ) |
Net income before attribution of noncontrolling interests | $ | 3,904 | | $ | 4,024 | | $ | 8,004 | | $ | 7,530 | |
Noncontrolling interests | 32 | | 26 | | 42 | | 31 | | ||||
Citigroup's net income | $ | 3,872 | | $ | 3,998 | | $ | 7,962 | | $ | 7,499 | |
Basic earnings per share (1) |
|
|
| |
| | ||||||
Income from continuing operations | $ | 1.27 | | $ | 1.25 | | $ | 2.63 | | $ | 2.36 | |
Income (loss) from discontinued operations, net of taxes | 0.01 | | (0.01 | ) | - | | (0.01 | ) | ||||
Net income | $ | 1.28 | | $ | 1.24 | | $ | 2.63 | | $ | 2.35 | |
Weighted average common shares outstanding | 2,739.1 | | 2,915.8 | | 2,752.2 | | 2,929.4 | | ||||
95
Diluted earnings per share (1) |
|
|
| |
| | ||||||
Income from continuing operations | $ | 1.27 | | $ | 1.25 | | $ | 2.63 | | $ | 2.36 | |
Income (loss) from discontinued operations, net of taxes | 0.01 | | (0.01 | ) | - | | (0.01 | ) | ||||
Net income | $ | 1.28 | | $ | 1.24 | | $ | 2.63 | | $ | 2.35 | |
Adjusted weighted average common shares outstanding | 2,739.2 | | 2,915.9 | | 2,752.3 | | 2,929.5 | | ||||
(1) | Due to rounding, earnings per share on continuing operations and discontinued operations may not sum to earnings per share on net income. |
The Notes to the Consolidated Financial Statements are an integral part of these Consolidated Financial Statements.
CONSOLIDATED STATEMENT OF COMPREHENSIVE INCOME |
| Citigroup Inc. and Subsidiaries |
(UNAUDITED) |
|
|
| Three Months Ended June 30, | Six Months Ended June 30, | ||||||||||
In millions of dollars | 2017 | 2016 | 2017 | 2016 | ||||||||
Citigroup's net income | $ | 3,872 | | $ | 3,998 | | $ | 7,962 | | $ | 7,499 | |
Add: Citigroup's other comprehensive income |
|
| | | | | | |||||
Net change in unrealized gains and losses on investment securities, net of taxes (1) | $ | (27 | ) | $ | 927 | | $ | 193 | | $ | 2,961 | |
Net change in debt valuation adjustment (DVA), net of taxes (1) | (84 | ) | 12 | | (144 | ) | 205 | | ||||
Net change in cash flow hedges, net of taxes | 117 | | 151 | | 115 | | 468 | | ||||
Benefit plans liability adjustment, net of taxes | (135 | ) | (27 | ) | (147 | ) | (492 | ) | ||||
Net change in foreign currency translation adjustment, net of taxes and hedges | 643 | | (552 | ) | 1,961 | | 102 | | ||||
Citigroup's total other comprehensive income | $ | 514 | | $ | 511 | | $ | 1,978 | | $ | 3,244 | |
Citigroup's total comprehensive income | $ | 4,386 | | $ | 4,509 | | $ | 9,940 | | $ | 10,743 | |
Add: Other comprehensive income attributable to noncontrolling interests | $ | 39 | | $ | (50 | ) | 70 | | (23 | ) | ||
Add: Net income attributable to noncontrolling interests | 32 | | 26 | | $ | 42 | | $ | 31 | | ||
Total comprehensive income | $ | 4,457 | | $ | 4,485 | | $ | 10,052 | | $ | 10,751 | |
(1) | See Note 1 to the Consolidated Financial Statements. |
The Notes to the Consolidated Financial Statements are an integral part of these Consolidated Financial Statements.
96
CONSOLIDATED BALANCE SHEET |
| Citigroup Inc. and Subsidiaries |
| June 30, |
| ||||
| 2017 | December 31, | ||||
In millions of dollars | (Unaudited) | 2016 | ||||
Assets |
| |
| | ||
Cash and due from banks (including segregated cash and other deposits) | $ | 20,940 | | $ | 23,043 | |
Deposits with banks | 165,142 | | 137,451 | | ||
Federal funds sold and securities borrowed or purchased under agreements to resell (including $142,831 and $133,204 as of June 30, 2017 and December 31, 2016, respectively, at fair value) | 234,065 | | 236,813 | | ||
Brokerage receivables | 40,487 | | 28,887 | | ||
Trading account assets (including $98,974 and $80,986 pledged to creditors at June 30, 2017 and December 31, 2016, respectively) | 259,606 | | 243,925 | | ||
Investments: |
|
| ||||
Available for sale (including $8,512 and $8,239 pledged to creditors as of June 30, 2017 and December 31, 2016, respectively) | 293,629 | | 299,424 | | ||
Held to maturity (including $311 and $843 pledged to creditors as of June 30, 2017 and December 31, 2016, respectively) | 50,175 | | 45,667 | | ||
Non-marketable equity securities (including $1,384 and $1,774 at fair value as of June 30, 2017 and December 31, 2016, respectively) | 7,906 | | 8,213 | | ||
Total investments | $ | 351,710 | | $ | 353,304 | |
Loans: |
| |
| | ||
Consumer (including $27 and $29 as of June 30, 2017 and December 31, 2016, respectively, at fair value) | 325,261 | | 325,063 | | ||
Corporate (including $4,189 and $3,457 as of June 30, 2017 and December 31, 2016, respectively, at fair value) | 319,434 | | 299,306 | | ||
Loans, net of unearned income | $ | 644,695 | | $ | 624,369 | |
Allowance for loan losses | (12,025 | ) | (12,060 | ) | ||
Total loans, net | $ | 632,670 | | $ | 612,309 | |
Goodwill | 22,349 | | 21,659 | | ||
Intangible assets (other than MSRs) | 4,887 | | 5,114 | | ||
Mortgage servicing rights (MSRs) | 560 | | 1,564 | | ||
Other assets (including $18,993 and $15,729 as of June 30, 2017 and December 31, 2016, respectively, at fair value) | 131,647 | | 128,008 | | ||
Total assets | $ | 1,864,063 | | $ | 1,792,077 | |
| June 30, |
| ||||
| 2017 | December 31, | ||||
In millions of dollars | (Unaudited) | 2016 | ||||
Assets of consolidated VIEs to be used to settle obligations of consolidated VIEs |
| |
| | ||
Cash and due from banks | $ | 86 | | $ | 142 | |
Trading account assets | 1,236 | | 602 | | ||
Investments | 2,932 | | 3,636 | | ||
Loans, net of unearned income |
| |
| | ||
Consumer | 53,816 | | 53,401 | | ||
Corporate | 19,241 | | 20,121 | | ||
Loans, net of unearned income | $ | 73,057 | | $ | 73,522 | |
Allowance for loan losses | (1,863 | ) | (1,769 | ) | ||
Total loans, net | $ | 71,194 | | $ | 71,753 | |
Other assets | 154 | | 158 | | ||
Total assets of consolidated VIEs to be used to settle obligations of consolidated VIEs | $ | 75,602 | | $ | 76,291 | |
Statement continues on the next page.
97
CONSOLIDATED BALANCE SHEET Citigroup Inc. and Subsidiaries
(Continued)
| June 30, |
| ||||
| 2017 | December 31, | ||||
In millions of dollars, except shares and per share amounts | (Unaudited) | 2016 | ||||
Liabilities |
| |
| | ||
Non-interest-bearing deposits in U.S. offices | $ | 126,253 | | $ | 136,698 | |
Interest-bearing deposits in U.S. offices (including $334 and $434 as of June 30, 2017 and December 31, 2016, respectively, at fair value) | 311,361 | | 300,972 | | ||
Non-interest-bearing deposits in offices outside the U.S. | 83,046 | | 77,616 | | ||
Interest-bearing deposits in offices outside the U.S. (including $1,006 and $778 as of June 30, 2017 and December 31, 2016, respectively, at fair value) | 438,083 | | 414,120 | | ||
Total deposits | $ | 958,743 | | $ | 929,406 | |
Federal funds purchased and securities loaned or sold under agreements to repurchase (including $44,881 and $33,663 as of June 30, 2017 and December 31, 2016, respectively, at fair value) | 154,780 | | 141,821 | | ||
Brokerage payables | 62,947 | | 57,152 | | ||
Trading account liabilities | 136,745 | | 139,045 | | ||
Short-term borrowings (including $4,833 and $2,700 as of June 30, 2017 and December 31, 2016, respectively, at fair value) | 36,519 | | 30,701 | | ||
Long-term debt (including $29,001 and $26,254 as of June 30, 2017 and December 31, 2016, respectively, at fair value) | 225,179 | | 206,178 | | ||
Other liabilities (including $14,335 and $10,796 as of June 30, 2017 and December 31, 2016, respectively, at fair value) | 58,043 | | 61,631 | | ||
Total liabilities | $ | 1,632,956 | | $ | 1,565,934 | |
Stockholders' equity |
| |
| | ||
Preferred stock ($1.00 par value; authorized shares: 30 million), issued shares: 770,120 as of June 30, 2017 and as of December 31, 2016, at aggregate liquidation value | $ | 19,253 | | $ | 19,253 | |
Common stock ($0.01 par value; authorized shares: 6 billion), issued shares: 3,099,523,273 and 3,099,482,042 as of June 30, 2017 and December 31, 2016 | 31 | | 31 | | ||
Additional paid-in capital | 107,798 | | 108,042 | | ||
Retained earnings | 152,178 | | 146,477 | | ||
Treasury stock, at cost: June 30, 2017-374,967,178 shares and December 31, 2016-327,090,192 shares | (19,342 | ) | (16,302 | ) | ||
Accumulated other comprehensive income (loss) (AOCI) | (29,899 | ) | (32,381 | ) | ||
Total Citigroup stockholders' equity | $ | 230,019 | | $ | 225,120 | |
Noncontrolling interest | 1,088 | | 1,023 | | ||
Total equity | $ | 231,107 | | $ | 226,143 | |
Total liabilities and equity | $ | 1,864,063 | | $ | 1,792,077 | |
The following table presents certain liabilities of consolidated VIEs, which are included in the Consolidated Balance Sheet above. The liabilities in the table below include third-party liabilities of consolidated VIEs only and exclude intercompany balances that eliminate in consolidation. The liabilities also exclude amounts where creditors or beneficial interest holders have recourse to the general credit of Citigroup.
| June 30, |
| ||||
| 2017 | December 31, | ||||
In millions of dollars | (Unaudited) | 2016 | ||||
Liabilities of consolidated VIEs for which creditors or beneficial interest holders do not have recourse to the general credit of Citigroup |
| |
| | ||
Short-term borrowings | $ | 10,317 | | $ | 10,697 | |
Long-term debt | 28,265 | | 23,919 | | ||
Other liabilities | 456 | | 1,275 | | ||
Total liabilities of consolidated VIEs for which creditors or beneficial interest holders do not have recourse to the general credit of Citigroup | $ | 39,038 | | $ | 35,891 | |
The Notes to the Consolidated Financial Statements are an integral part of these Consolidated Financial Statements.
98
CONSOLIDATED STATEMENT OF CHANGES IN STOCKHOLDERS' EQUITY |
| Citigroup Inc. and Subsidiaries |
(UNAUDITED) |
|
|
| Six Months Ended June 30, | |||||
In millions of dollars, except shares in thousands | 2017 | 2016 | ||||
Preferred stock at aggregate liquidation value |
| |
| | ||
Balance, beginning of period | $ | 19,253 | | $ | 16,718 | |
Issuance of new preferred stock | - | | 2,535 | | ||
Balance, end of period | $ | 19,253 | | $ | 19,253 | |
Common stock and additional paid-in capital |
| |
| | ||
Balance, beginning of period | $ | 108,073 | | $ | 108,319 | |
Employee benefit plans | (239 | ) | (516 | ) | ||
Preferred stock issuance expense | - | | (37 | ) | ||
Other | (5 | ) | (5 | ) | ||
Balance, end of period | $ | 107,829 | | $ | 107,761 | |
Retained earnings |
| |
| | ||
Balance, beginning of period | $ | 146,477 | | $ | 133,841 | |
Adjustment to opening balance, net of taxes (1) | (660 | ) | 15 | | ||
Adjusted balance, beginning of period | $ | 145,817 | | $ | 133,856 | |
Citigroup's net income | 7,962 | | 7,499 | | ||
Common dividends (2) | (890 | ) | (296 | ) | ||
Preferred dividends | (621 | ) | (532 | ) | ||
Other (3) | (90 | ) | - | | ||
Balance, end of period | $ | 152,178 | | $ | 140,527 | |
Treasury stock, at cost |
| |
| | ||
Balance, beginning of period | $ | (16,302 | ) | $ | (7,677 | ) |
Employee benefit plans (4) | 523 | | 773 | | ||
Treasury stock acquired (5) | (3,563 | ) | (2,634 | ) | ||
Balance, end of period | $ | (19,342 | ) | $ | (9,538 | ) |
Citigroup's accumulated other comprehensive income (loss) |
| |
| | ||
Balance, beginning of period | $ | (32,381 | ) | $ | (29,344 | ) |
Adjustment to opening balance, net of taxes (1) | 504 | | (15 | ) | ||
Adjusted balance, beginning of period | $ | (31,877 | ) | $ | (29,359 | ) |
Citigroup's total other comprehensive income (loss) | 1,978 | | 3,244 | | ||
Balance, end of period | $ | (29,899 | ) | $ | (26,115 | ) |
Total Citigroup common stockholders' equity | $ | 210,766 | | $ | 212,635 | |
Total Citigroup stockholders' equity | $ | 230,019 | | $ | 231,888 | |
Noncontrolling interests |
| |
| | ||
Balance, beginning of period | $ | 1,023 | | $ | 1,235 | |
Transactions between noncontrolling-interest shareholders and the related consolidated subsidiary | - | | (11 | ) | ||
Transactions between Citigroup and the noncontrolling-interest shareholders | 6 | | (73 | ) | ||
Net income attributable to noncontrolling-interest shareholders | 42 | | 31 | | ||
Dividends paid to noncontrolling-interest shareholders | - | | (1 | ) | ||
Other comprehensive income (loss) attributable to noncontrolling-interest shareholders | 70 | | (23 | ) | ||
Other | (53 | ) | (25 | ) | ||
Net change in noncontrolling interests | $ | 65 | | $ | (102 | ) |
Balance, end of period | $ | 1,088 | | $ | 1,133 | |
Total equity | $ | 231,107 | | $ | 233,021 | |
(1) | See Note 1 to the Consolidated Financial Statements for additional details. |
(2) | Common dividends declared were $0.16 per share in the first and second quarter of 2017 and $0.05 per share in the first and second quarter of 2016 . |
(3) | Includes the impact of ASU 2016-09, Compensation-Stock Compensation (Topic 718): Improvements to Employee Share-Based Payment Accounting . See Note 1 to the Consolidated Financial Statements. |
(4) | Includes treasury stock related to (i) certain activity on employee stock option program exercises where the employee delivers existing shares to cover the option exercise, or (ii) under Citi's employee restricted or deferred stock programs where shares are withheld to satisfy tax requirements. |
99
(5) For the six months ended June 30, 2017 and 2016 , primarily consists of open market purchases under Citi's Board of Directors-approved common stock repurchase program.
The Notes to the Consolidated Financial Statements are an integral part of these Consolidated Financial Statements.
100
CONSOLIDATED STATEMENT OF CASH FLOWS |
| Citigroup Inc. and Subsidiaries |
(UNAUDITED) |
|
|
| Six Months Ended June 30, | |||||
In millions of dollars | 2017 | 2016 | ||||
Cash flows from operating activities of continuing operations |
| |
| | ||
Net income before attribution of noncontrolling interests | $ | 8,004 | | $ | 7,530 | |
Net income attributable to noncontrolling interests | 42 | | 31 | | ||
Citigroup's net income | $ | 7,962 | | $ | 7,499 | |
Income (loss) from discontinued operations, net of taxes | 3 | | (25 | ) | ||
Income from continuing operations-excluding noncontrolling interests | $ | 7,959 | | $ | 7,524 | |
Adjustments to reconcile net income to net cash provided by operating activities of continuing operations |
| |
| | ||
Net gains on significant disposals (1) | (19 | ) | (422 | ) | ||
Depreciation and amortization | 1,797 | | 1,776 | | ||
Provision for loan losses | 3,341 | | 3,276 | | ||
Realized gains from sales of investments | (413 | ) | (386 | ) | ||
Net impairment losses on investments, goodwill and intangible assets | 60 | | 583 | | ||
Change in trading account assets | (15,776 | ) | (21,808 | ) | ||
Change in trading account liabilities | (2,300 | ) | 18,795 | | ||
Change in brokerage receivables net of brokerage payables | (5,805 | ) | (836 | ) | ||
Change in loans held-for-sale (HFS) | (515 | ) | 1,786 | | ||
Change in other assets | (3,343 | ) | (4,345 | ) | ||
Change in other liabilities | (3,522 | ) | 7,175 | | ||
Other, net | (2,975 | ) | 7,949 | | ||
Total adjustments | $ | (29,470 | ) | $ | 13,543 | |
Net cash provided by (used in) operating activities of continuing operations | $ | (21,511 | ) | $ | 21,067 | |
Cash flows from investing activities of continuing operations |
| |
| | ||
Change in deposits with banks | $ | (27,691 | ) | $ | (15,796 | ) |
Change in federal funds sold and securities borrowed or purchased under agreements to resell | 2,748 | | (9,008 | ) | ||
Change in loans | (29,952 | ) | (30,170 | ) | ||
Proceeds from sales and securitizations of loans | 6,256 | | 7,021 | | ||
Purchases of investments | (96,925 | ) | (108,359 | ) | ||
Proceeds from sales of investments | 56,728 | | 66,138 | | ||
Proceeds from maturities of investments | 47,785 | | 33,383 | | ||
Proceeds from significant disposals (1) | 2,732 | | 265 | | ||
Capital expenditures on premises and equipment and capitalized software | (1,647 | ) | (1,377 | ) | ||
Proceeds from sales of premises and equipment, subsidiaries and affiliates, and repossessed assets | 215 | | 390 | | ||
Net cash used in investing activities of continuing operations | $ | (39,751 | ) | $ | (57,513 | ) |
Cash flows from financing activities of continuing operations |
| |
| | ||
Dividends paid | $ | (1,504 | ) | $ | (828 | ) |
Issuance of preferred stock | - | | 2,498 | | ||
Treasury stock acquired | (3,635 | ) | (2,634 | ) | ||
Stock tendered for payment of withholding taxes | (401 | ) | (312 | ) | ||
Change in federal funds purchased and securities loaned or sold under agreements to repurchase | 12,959 | | 11,505 | | ||
Issuance of long-term debt | 37,679 | | 27,142 | | ||
Payments and redemptions of long-term debt | (21,317 | ) | (26,855 | ) | ||
Change in deposits | 29,337 | | 29,965 | | ||
Change in short-term borrowings | 5,818 | | (2,671 | ) | ||
101
CONSOLIDATED STATEMENT OF CASH FLOWS | Citigroup Inc. and Subsidiaries |
| ||||
(UNAUDITED) (Continued) | Six Months Ended June 30, | |||||
In millions of dollars | 2017 | 2016 | ||||
Net cash provided by financing activities of continuing operations | $ | 58,936 | | $ | 37,810 | |
Effect of exchange rate changes on cash and cash equivalents | $ | 223 | | $ | (124 | ) |
Change in cash and due from banks | $ | (2,103 | ) | $ | 1,240 | |
Cash and due from banks at beginning of period | 23,043 | | 20,900 | | ||
Cash and due from banks at end of period | $ | 20,940 | | $ | 22,140 | |
Supplemental disclosure of cash flow information for continuing operations |
| |
| | ||
Cash paid during the period for income taxes | $ | 1,975 | | $ | 2,045 | |
Cash paid during the period for interest | 7,329 | | 5,726 | | ||
Non-cash investing activities |
| |
| | ||
Transfers to loans HFS from loans | 3,300 | | 6,000 | | ||
Transfers to OREO and other repossessed assets | 58 | | 97 | | ||
(1) See Note 2 to the Consolidated Financial Statements for further information on significant disposals.
The Notes to the Consolidated Financial Statements are an integral part of these Consolidated Financial Statements.
102
NOTES TO CONSOLIDATED FINANCIAL STATEMENTS (UNAUDITED)
1. BASIS OF PRESENTATION AND ACCOUNTING CHANGES
Basis of Presentation
The accompanying unaudited Consolidated Financial Statements as of June 30, 2017 and for the three- and six- month periods ended June 30, 2017 and 2016 include the accounts of Citigroup Inc. and its consolidated subsidiaries.
In the opinion of management, all adjustments, consisting of normal recurring adjustments, necessary for a fair presentation have been reflected. The accompanying unaudited Consolidated Financial Statements should be read in conjunction with the Consolidated Financial Statements and related notes included in Citigroup's Annual Report on Form 10-K for the fiscal year ended December 31, 2016 , including the historical audited consolidated financial statements of Citigroup reflecting the certain realignments and reclassifications set forth in Citigroup's Current Report on Form 8-K filed with the SEC on June 16, 2017 (2016 Annual Report on Form 10-K), and Citigroup's Quarterly Report on Form 10-Q for the quarter ended March 31, 2017 (First Quarter of 2017 Form 10-Q).
Certain financial information that is normally included in annual financial statements prepared in accordance with U.S. generally accepted accounting principles (GAAP), but is not required for interim reporting purposes, has been condensed or omitted.
Management must make estimates and assumptions that affect the Consolidated Financial Statements and the related footnote disclosures. While management uses its best judgment, actual results could differ from those estimates.
As noted above, the Notes to Consolidated Financial Statements are unaudited.
Throughout these Notes, "Citigroup," "Citi" and the "Company" refer to Citigroup Inc. and its consolidated subsidiaries.
Certain reclassifications have been made to the prior periods' financial statements and notes to conform to the current period's presentation.
ACCOUNTING CHANGES
Premium Amortization on Purchased Callable Debt Securities
In March 2017, the Financial Accounting Standards Board (FASB) issued Accounting Standards Update (ASU) No. 2017-08, Receivables-Nonrefundable Fees and Other Costs (Subtopic 310-20): Premium Amortization on Purchased Callable Debt Securities , which amends the amortization period for certain purchased callable debt securities held at a premium.
The ASU requires entities to amortize premiums on debt securities by the first call date when the securities have fixed and determinable call dates and prices. The scope of the ASU includes all accounting premiums, such as purchase premiums and cumulative fair value hedge adjustments. The ASU does not change the accounting for discounts, which
continue to be recognized over the contractual life of a security.
For calendar-year-end entities, the ASU is effective as of January 1, 2019, but it may be early adopted in any interim or year-end period after issuance. Adoption of the ASU is on a modified retrospective basis through a cumulative effect adjustment to retained earnings as of the beginning of the year of adoption. Citi has early-adopted the ASU in the second quarter of 2017, with an effective date of January 1, 2017. Adoption of the ASU primarily affects Citi's available-for-sale and held-to-maturity portfolios of callable state and municipal securities. The ASU adoption resulted in a net reduction to total stockholders' equity of $156 million (after tax), effective as of January 1, 2017. This amount is composed of a reduction of approximately $660 million to retained earnings for the incremental amortization of purchase premiums and cumulative hedge adjustments generated under fair value hedges of these callable debt securities. This amount was offset by an increase to AOCI of $504 million related to the cumulative fair value hedge adjustments reclassified to retained earnings.
Financial statements for periods prior to 2017 were not subject to restatement under the provisions of this ASU. The amount of amortization for the first quarter and the first half of 2017 under the provisions of the ASU is not materially different than the amount that was recorded during the first quarter or would have been recorded for the first half of 2017 if the ASU had not been adopted. For additional information, see Note 12 and Note 17 to the Consolidated Financial Statements.
Recognition and Measurement of Financial Assets and Financial Liabilities
In January 2016, the Financial Accounting Standards Board (FASB) issued Accounting Standards Update (ASU) No. 2016-01, Financial Instruments-Overall (Subtopic 825-10): Recognition and Measurement of Financial Assets and Financial Liabilities , which addresses certain aspects of recognition, measurement, presentation and disclosure of financial instruments.
This ASU requires entities to present separately in Accumulated other comprehensive income (loss) (AOCI) the portion of the total change in the fair value of a liability resulting from a change in the instrument-specific credit risk when the entity has elected to measure the liability at fair value in accordance with the fair value option for financial instruments. It also requires equity investments (except those accounted for under the equity method of accounting or those that result in consolidation of the investee) to be measured at fair value with changes in fair value recognized in net income, thus eliminating eligibility for the current available-for-sale category. However, Federal Reserve Bank and Federal Home Loan Bank stock as well as certain exchange seats will continue to be presented at cost.
Citi early adopted only the provisions of this ASU related to presentation of the change in fair value of liabilities for which the fair value option was elected, related
103
to changes in Citigroup's own credit spreads in AOCI effective January 1, 2016. Accordingly, as of the first quarter of 2016, these amounts are reflected as a component of AOCI, whereas these amounts were previously recognized in Citigroup's revenues and net income. The impact of adopting this amendment resulted in a cumulative catch-up reclassification from retained earnings to AOCI of an accumulated after-tax loss of approximately $15 million at January 1, 2016. Financial statements for periods prior to 2016 were not subject to restatement under the provisions of this ASU. For additional information, see Note 17, Note 20 and Note 21 to the Consolidated Financial Statements. The Company is evaluating the effects that the other provisions of ASU 2016-01, which are effective January 1, 2018, will have on its Consolidated Financial Statements and related disclosures.
FUTURE APPLICATION OF ACCOUNTING STANDARDS
Accounting for Financial Instruments-Credit Losses
In June 2016, the FASB issued ASU No. 2016-13, Financial Instruments-Credit Losses (Topic 326). The ASU introduces a new credit loss model, the Current Expected Credit Losses model (CECL), which requires earlier recognition of credit losses, while also providing additional transparency about credit risk.
The CECL model utilizes a lifetime "expected credit loss" measurement objective for the recognition of credit losses for loans, held-to-maturity securities and other receivables at the time the financial asset is originated or acquired. The expected credit losses are adjusted each period for changes in expected lifetime credit losses. For available-for-sale securities where fair value is less than cost, credit-related impairment, if any, will be recognized in an allowance for credit losses and adjusted each period for changes in expected credit risk. This model replaces the multiple existing impairment models in current GAAP, which generally require that a loss be incurred before it is recognized.
The CECL model represents a significant change from existing GAAP and may result in material changes to the Company's accounting for financial instruments. The Company is evaluating the effect that ASU 2016-13 will have on its Consolidated Financial Statements and related disclosures. The impact of the ASU will depend upon the state of the economy and the nature of Citi's portfolios at the date of adoption. In the current environment, the overall impact is estimated to be an approximately 10-20% increase in credit reserves. Moreover, there are still some implementation questions that will need to be resolved that could affect the estimated impact. The ASU will be effective for Citi as of January 1, 2020. Early application is permitted for annual periods beginning January 1, 2019.
Revenue Recognition
In May 2014, the FASB issued ASU No. 2014-09, Revenue from Contracts with Customers , which requires an entity to recognize the amount of revenue to which it expects to be
entitled for the transfer of promised goods or services to customers. The Company will adopt the guidance as of January 1, 2018 using a modified retrospective method with a cumulative-effect adjustment to opening retained earnings. While the guidance will replace most existing revenue recognition guidance in GAAP, the ASU is not applicable to financial instruments and, therefore, will not impact a majority of the Company's revenues, including net interest income.
While in scope of the new guidance, the Company does not expect a material change in the timing or measurement of revenues related to deposit fees. Citi's credit cardholder fees and mortgage servicing fees have been concluded to be out of scope of the standard and therefore will not be impacted by the issuance of this guidance. The Company expects the presentation of expenses associated with underwriting activity to change from the current reporting where underwriting revenue is recorded net of the related expenses to a gross presentation where the expenses are recorded in Other operating expenses . This change to a gross presentation will result in an equivalent increase in underwriting revenue recorded in Commissions and fees and associated underwriting expenses recorded in Other operating expenses ; however, this change in presentation will not have an impact on Income from continuing operations . The Company continues to evaluate the effect that the guidance will have on other revenue streams within its scope, including the presentation of certain contract costs, as well as changes in disclosures required by the new guidance. Based on the Company's current interpretations of the new guidance, the overall impact to net income is expected to be immaterial.
Lease Accounting
In February 2016, the FASB issued ASU No. 2016-02, Leases (Topic 842) , which is intended to increase transparency and comparability of accounting for lease transactions. The ASU will require lessees to recognize leases on the balance sheet as lease assets and lease liabilities and will require both quantitative and qualitative disclosures regarding key information about leasing arrangements. Lessor accounting is largely unchanged. The guidance is effective beginning January 1, 2019 with an option to early adopt. The Company does not plan to early adopt the ASU. The Company estimates that upon adoption, its Consolidated Balance Sheet will have an approximately $5 billion increase in assets and liabilities. Additionally, the Company estimates an approximately $200 million increase in retained earnings due to the cumulative effect of recognizing previously deferred gains on sale/leaseback transactions.
Income Tax Impact of Intra-Entity Transfers of Assets
In October 2016, the FASB issued ASU No. 2016-16, Income Taxes-Intra-Entity Transfers of Assets Other Than Inventory , which will require an entity to recognize the income tax consequences of an intra-entity transfer of an asset other than inventory when the transfer occurs. The ASU is effective January 1, 2018. The Company continues
104
to evaluate the impact of this standard, which is expected to increase DTAs, with an associated decrease in prepaid taxes of approximately $500 million .
Subsequent Measurement of Goodwill
In January 2017, the FASB issued ASU No. 2017-04, Intangibles-Goodwill and Other (Topic 350): Simplifying the Test for Goodwill Impairment. The ASU simplifies the subsequent measurement of goodwill impairment by eliminating the requirement to calculate the implied fair value of goodwill (i.e., the current Step 2 of the goodwill impairment test) to measure a goodwill impairment charge. Under the ASU, the impairment test is simply the comparison of the fair value of a reporting unit with its carrying amount (the current Step 1), with the impairment charge being the deficit in fair value but not exceeding the total amount of goodwill allocated to that reporting unit. The simplified one-step impairment test applies to all reporting units (including those with zero or negative carrying amounts).
The ASU is effective for Citi as of January 1, 2020. Early adoption is permitted for interim and annual goodwill impairment testing dates after January 1, 2017. The impact of the ASU will depend upon the performance of the reporting units and the market conditions impacting the fair value of each reporting unit going forward.
Clarifying the Definition of a Business
In January 2017, the FASB issued ASU No. 2017-01, Business Combinations (Topic 805): Clarifying the Definition of a Business. The definition of a business directly and indirectly affects many areas of accounting (e.g., acquisitions, disposals, goodwill and consolidation). The ASU narrows the definition of a business by introducing a quantitative screen as the first step, such that if substantially all of the fair value of the gross assets acquired is concentrated in a single identifiable asset or a group of similar identifiable assets, the set of transferred assets and activities is not a business. If the set is not scoped out from the quantitative screen, the entity then evaluates whether the set meets the requirement that a business include, at a minimum, an input and a substantive process that together significantly contribute to the ability to create outputs.
The ASU is effective for Citi as of January 1, 2018. The ASU will be applied prospectively, with early adoption permitted. The impact of the ASU will depend upon the acquisition and disposal activities of Citi. If fewer transactions qualify as a business, there could be less initial recognition of goodwill, but also less goodwill allocated to disposals.
Changes in Accounting for Pension and Postretirement (Benefit) Expense
In March 2017, the FASB issued ASU 2017-07, Compensation-Retirement Benefits (Topic 715): Improving the Presentation of Net Periodic Pension Cost and Net Periodic Postretirement Benefit Cost, which changes the income statement presentation of net benefit expense and requires restating the Company's financial statements for
each of the earlier periods presented in Citi's annual and interim financial statements. The change in presentation is effective for annual and interim periods starting January 1, 2018. The ASU requires that only the service cost component of net benefit expense be included in the Compensation and benefits line on the income statement. The other components of net benefit expense will be required to be presented outside of the Compensation and benefits line and will be presented in Other operating expense . Since both these income statement line items are part of Operating expenses, total Operating expenses will not change, nor will there be any change in Net income. This change in presentation is not expected to have a material effect on the Compensation and benefits and on Other operating lines in the income statement. The components of the net benefit expense are currently disclosed in Note 7 to the Consolidated Financial Statements.
The new standard also changes the components of net benefit expense that are eligible for capitalization when employee costs are capitalized in connection with various activities, such as internally developed software, construction-in-progress, and loan origination costs. Prospectively from January 1, 2018, only the service cost component of net benefit expense may be capitalized. Existing capitalized balances are not affected. The Company is currently evaluating the portion of net benefits cost that continues to be eligible for capitalization and the portion that is not eligible.
Other Potential Amendments to Current Accounting Standards
The FASB has issued a proposed ASU that will provide targeted improvements to the accounting guidance for hedging activities. The exposure draft contains many proposals for improving how the economic results of risk management are reflected in financial reporting. Specifically, among other improvements, the ASU is expected to expand the list of benchmark interest rates and also increase the ability for entities to construct hedges of interest rate risk that hedge only certain cash flows of a hedged item. If issued in its current form, the ASU is also expected to modify existing guidance related to the timing and income statement line recognition of ineffectiveness and components excluded from hedge relationships and add incremental disclosures regarding hedging activities.
105
2. DISCONTINUED OPERATIONS AND SIGNIFICANT DISPOSALS
Discontinued Operations
The following sales are reported as Discontinued operations within Corporate/Other .
Sale of Egg Banking plc Credit Card Business
Citi sold the Egg Banking plc credit card business in 2011. Residual items from the disposal resulted in Income (loss) from discontinued operations , net of taxes, of $21 million and $(20) million for the three months ended June 30, 2017 and 2016, respectively, and Income (loss) from discontinued operations , net of taxes, of $3 million and $(22) million for the six months ended June 30, 2017 and 2016 , respectively. The income recognized during the current period was related to the release of certain reserves associated with expirations of certain warranties and indemnifications.
Combined Results for Discontinued Operations
The following summarizes financial information for all Discontinued operations for which Citi continues to have minimal residual impact associated with the sold operations:
| Three Months Ended June 30, | Six Months Ended June 30, | ||||||||||
In millions of dollars | 2017 | 2016 | 2017 | 2016 | ||||||||
Total revenues, net of interest expense | $ | - | | $ | - | | $ | - | | $ | - | |
Income (loss) from discontinued operations | $ | 33 | | $ | (36 | ) | $ | 5 | | $ | (39 | ) |
Provision (benefit) for income taxes | 12 | | (13 | ) | 2 | | (14 | ) | ||||
Income (loss) from discontinued operations, net of taxes | $ | 21 | | $ | (23 | ) | $ | 3 | | $ | (25 | ) |
Cash flows for Discontinued operations were not material for the periods presented.
Significant Disposals
The following transactions during 2017 and 2016 were identified as significant disposals. The major classes of assets and liabilities that are derecognized from the Consolidated Balance Sheet at closing and the income related to each business until the disposal date are presented below.
Novation of the 80% Primerica Coinsurance Agreement
Effective January 1, 2016, Citi completed a novation (an arrangement that extinguishes Citi's rights and obligations under a contract) of the Primerica 80% coinsurance agreement, which was part of Corporate/Other , to a third-party re-insurer. The novation resulted in revenues of $404 million recorded in Other revenue ( $263 million after-tax) during the first quarter of 2016. Furthermore, the novation resulted in derecognition of $1.5 billion of available-for-sale securities and cash, $0.95 billion of deferred acquisition costs and $2.7 billion of insurance liabilities.
Exit of U.S. Mortgage Service Operations
As previously disclosed, Citigroup signed agreements during the first quarter of 2017 to effectively exit its direct U.S. mortgage servicing operations by the end of 2018 to intensify focus on originations. The exit of the mortgage servicing operations included the sale of mortgage servicing rights and execution of a subservicing agreement for the remaining Citi-owned loans and certain other mortgage servicing rights. As part of this transaction, Citi will also transfer certain employees.
This transaction, which was part of Corporate/Other , resulted in a pretax loss of $331 million ( $207 million after-tax) recorded in Other revenue during the first quarter of 2017. The loss on sale does not include certain other costs and charges related to the disposed operation recorded primarily in Operating expenses in the first quarter of 2017, resulting in a total pretax loss of $382 million . As part of the completed sale, during the first quarter of 2017, Citi derecognized a total of $1,162 million of servicing-related assets, including $1,046 million of mortgage servicing rights, related to approximately 750,000 Fannie Mae and Freddie Mac held loans with outstanding balances of approximately $93 billion . Excluding the loss on sale and the additional charges, income before taxes for the disposed operation was immaterial for the three and six months ended June 30, 2017 and 2016.
Sale of CitiFinancial Canada Consumer Finance Business
On March 31, 2017, Citi completed the sale of CitiFinancial Canada (CitiFinancial), which was part of Corporate/Other , and included 220 retail branches and approximately 1,400 employees. As part of the sale, Citi derecognized total assets of approximately $1.9 billion , including $1.7 billion consumer loans (net of allowance), and total liabilities of approximately $1.5 billion related to intercompany borrowings, which were settled at closing of the transaction. Separately, during the first quarter of 2017, CitiFinancial settled $0.4 billion of debt issued through loan securitizations. The sale of CitiFinancial generated a pretax gain on sale of $350 million recorded in Other revenue ( $178 million after-tax) during the first quarter of 2017.
Income before taxes, excluding the pretax gain on sale, was as follows:
| Three Months Ended June 30, | Six Months Ended June 30, | ||||||||||
In millions of dollars | 2017 | 2016 | 2017 | 2016 | ||||||||
Income before taxes | $ | - | | $ | 41 | | $ | 41 | | $ | 78 | |
106
Sale of Fixed Income Analytics and Index Businesses
On May 30, 2017, Citi entered into an agreement to sell its fixed income analytics (Yield Book) and index businesses that are part of Markets and Securities Services within Institutional Clients Group (ICG) . The closing, which is subject to regulatory clearance and other customary closing conditions, is expected to occur in the second half of 2017 and result in a gain, recognized at the closing of the transaction. As of June 30, 2017, the total assets of the businesses were approximately $100 million , including $72 million of goodwill, while the liabilities were not material. These assets and liabilities were classified as HFS within Other assets and Other liabilities on the Consolidated Balance Sheet, respectively, at June 30, 2017. Income before taxes for these businesses is as follows:
| Three Months Ended June 30, | Six Months Ended June 30, | ||||||||||
In millions of dollars | 2017 | 2016 | 2017 | 2016 | ||||||||
Income before taxes | $ | 9 | | $ | 17 | | $ | 19 | | $ | 31 | |
107
3. BUSINESS SEGMENTS
Citigroup's activities are conducted through the Global Consumer Banking (GCB) and ICG business segments. In addition, Corporate/Other includes activities not assigned to a specific business segment, as well as certain North America and international loan portfolios, discontinued operations and other legacy assets.
The prior-period balances reflect reclassifications to conform the presentation for all periods to the current period's presentation. Effective January 1, 2017, financial data was reclassified to reflect:
• | the reporting of the remaining businesses and portfolios of assets of Citi Holdings as part of Corporate/Other which, prior to the first quarter of 2017, was a separately reported business segment; |
• | the re-attribution of certain treasury-related costs between Corporate/Other , GCB and ICG ; |
• | the re-attribution of regional revenues within ICG ; and |
• | certain other immaterial reclassifications. |
Citi's consolidated results remain unchanged for all periods presented as a result of the changes and reclassifications discussed above.
For additional information regarding Citigroup's business segments, see Note 3 to the Consolidated Financial Statements in Citi's 2016 Annual Report on Form 10-K.
The following table presents certain information regarding the Company's continuing operations by segment:
| Three Months Ended June 30, |
|
| |||||||||||||||||||||
| Revenues, | Provision (benefits) | Income (loss) from | Identifiable assets | ||||||||||||||||||||
In millions of dollars, except identifiable assets in billions | 2017 | 2016 | 2017 | 2016 | 2017 | 2016 | June 30, | December 31, 2016 | ||||||||||||||||
Global Consumer Banking | $ | 8,035 | | $ | 7,674 | | $ | 647 | | $ | 667 | | $ | 1,129 | | $ | 1,285 | | $ | 419 | | $ | 412 | |
Institutional Clients Group | 9,213 | | 8,689 | | 1,327 | | 1,229 | | 2,780 | | 2,615 | | 1,353 | | 1,277 | | ||||||||
Corporate/Other | 653 | | 1,185 | | (179 | ) | (173 | ) | (26 | ) | 147 | | 92 | | 103 | | ||||||||
Total | $ | 17,901 | | $ | 17,548 | | $ | 1,795 | | $ | 1,723 | | $ | 3,883 | | $ | 4,047 | | $ | 1,864 | | $ | 1,792 | |
(1) | Includes total revenues, net of interest expense (excluding Corporate/Other ), in North America of $8.5 billion and $8.1 billion ; in EMEA of $2.8 billion and $2.6 billion ; in Latin America of $2.3 billion and $2.3 billion ; and in Asia of $3.6 billion and $3.4 billion for the three months ended June 30, 2017 and 2016 , respectively. These regional numbers exclude Corporate/Other , which largely operates within the U.S. |
(2) | Includes pretax provisions for credit losses and for benefits and claims in the GCB results of $1.8 billion and $1.4 billion ; in the ICG results of $87 million and $82 million ; and in the Corporate/Other results of $(132) million and $(98) million for the three months ended June 30, 2017 and 2016 , respectively. |
| Six Months Ended June 30, | |||||||||||||||||
| Revenues, | Provision (benefits) | Income (loss) from | |||||||||||||||
In millions of dollars | 2017 | 2016 | 2017 | 2016 | 2017 | 2016 | ||||||||||||
Global Consumer Banking | $ | 15,852 | | $ | 15,388 | | $ | 1,231 | | $ | 1,301 | | $ | 2,132 | | $ | 2,479 | |
Institutional Clients Group | 18,339 | | 16,584 | | 2,702 | | 1,993 | | 5,791 | | 4,484 | | ||||||
Corporate/Other | 1,830 | | 3,131 | | (275 | ) | (92 | ) | 78 | | 592 | | ||||||
Total | $ | 36,021 | | $ | 35,103 | | $ | 3,658 | | $ | 3,202 | | $ | 8,001 | | $ | 7,555 | |
(1) | Includes total revenues, net of interest expense, in North America of $17.0 billion and $16.0 billion ; in EMEA of $5.6 billion and $4.7 billion ; in Latin America of $4.6 billion and $4.4 billion ; and in Asia of $7.0 billion and $6.9 billion for the six months ended June 30, 2017 and 2016 , respectively. Regional numbers exclude Corporate/Other , which largely operates within the U.S. |
(2) | Includes pretax provisions for credit losses and for benefits and claims in the GCB results of $3.6 billion and $2.9 billion ; in the ICG results of $(118) million and $472 million ; and in Corporate/Other results of $(80) million and $72 million for the six months ended June 30, 2017 and 2016 , respectively. |
108
4. INTEREST REVENUE AND EXPENSE
Interest revenue and Interest expense consisted of the following:
| Three Months Ended June 30, | Six Months Ended June 30, | ||||||||||
In millions of dollars | 2017 | 2016 | 2017 | 2016 | ||||||||
Interest revenue |
|
|
|
| ||||||||
Loan interest, including fees | $ | 10,199 | | $ | 9,750 | | $ | 20,146 | | $ | 19,510 | |
Deposits with banks | 375 | | 237 | | 670 | | 456 | | ||||
Federal funds sold and securities borrowed or purchased under agreements to resell | 828 | | 664 | | 1,489 | | 1,311 | | ||||
Investments, including dividends | 2,058 | | 1,937 | | 4,018 | | 3,792 | | ||||
Trading account assets (1) | 1,481 | | 1,532 | | 2,747 | | 2,966 | | ||||
Other interest (2) | 260 | | 236 | | 554 | | 488 | | ||||
Total interest revenue | $ | 15,201 | | $ | 14,356 | | $ | 29,624 | | $ | 28,523 | |
Interest expense |
|
|
|
| ||||||||
Deposits (1) | $ | 1,603 | | $ | 1,306 | | $ | 3,018 | | $ | 2,510 | |
Federal funds purchased and securities loaned or sold under agreements to repurchase | 676 | | 527 | | 1,169 | | 1,029 | | ||||
Trading account liabilities (2) | 146 | | 96 | | 293 | | 184 | | ||||
Short-term borrowings | 202 | | 109 | | 401 | | 210 | | ||||
Long-term debt | 1,409 | | 1,082 | | 2,721 | | 2,127 | | ||||
Total interest expense | $ | 4,036 | | $ | 3,120 | | $ | 7,602 | | $ | 6,060 | |
Net interest revenue | $ | 11,165 | | $ | 11,236 | | $ | 22,022 | | $ | 22,463 | |
Provision for loan losses | 1,666 | | 1,390 | | 3,341 | | 3,276 | | ||||
Net interest revenue after provision for loan losses | $ | 9,499 | | $ | 9,846 | | $ | 18,681 | | $ | 19,187 | |
(1) | Includes deposit insurance fees and charges of $329 million and $267 million for the three months ended June 30, 2017 and 2016, respectively, and $634 million and $502 million for the six months ended June 30, 2017 and 2016 , respectively. |
(2) | Interest expense on Trading account liabilities of ICG is reported as a reduction of interest revenue from Trading account assets . |
109
5. COMMISSIONS AND FEES
The primary components of Citi's Commissions and fees revenue are investment banking fees, trading-related fees, fees related to trade and securities services in ICG and credit card and bank card fees. For additional information regarding
certain components of Commissions and fees revenue, see Note 5 to the Consolidated Financial Statements in Citi's 2016 Annual Report on Form 10-K.
The following table presents Commissions and fees revenue:
| Three Months Ended June 30, | Six Months Ended June 30, | ||||||||||
In millions of dollars | 2017 | 2016 | 2017 | 2016 | ||||||||
Investment banking | $ | 916 | | $ | 753 | | $ | 1,778 | | $ | 1,327 | |
Trading-related | 542 | | 544 | | 1,114 | | 1,145 | | ||||
Trade and securities services | 422 | | 386 | | 812 | | 792 | | ||||
Credit cards and bank cards | 364 | | 344 | | 675 | | 615 | | ||||
Corporate finance (1) | 238 | | 241 | | 407 | | 364 | | ||||
Other consumer (2) | 169 | | 166 | | 333 | | 324 | | ||||
Checking-related | 122 | | 104 | | 242 | | 220 | | ||||
Loan servicing | 88 | | 68 | | 174 | | 164 | | ||||
Other | 76 | | 119 | | 161 | | 237 | | ||||
Total commissions and fees | $ | 2,937 | | $ | 2,725 | | $ | 5,696 | | $ | 5,188 | |
(1) | Consists primarily of fees earned from structuring and underwriting loan syndications. |
(2) | Primarily consists of fees for investment fund administration and management, third-party collections, commercial demand deposit accounts and certain credit card services. |
6. PRINCIPAL TRANSACTIONS
Citi's Principal transactions revenue consists of realized and unrealized gains and losses from trading activities. For additional information regarding Principal transactions revenue, see Note 6 to the Consolidated Financial Statements in Citi's 2016 Annual Report on Form 10-K.
The following table presents Principal transactions revenue:
| Three Months Ended June 30, | Six Months Ended June 30, | ||||||||||
In millions of dollars | 2017 | 2016 | 2017 | 2016 | ||||||||
Global Consumer Banking (1) | $ | 142 | | $ | 165 | | $ | 291 | | $ | 308 | |
Institutional Clients Group | 2,079 | | 1,911 | | 4,747 | | 3,487 | | ||||
Corporate/Other (1) | 341 | | (260 | ) | 546 | | (139 | ) | ||||
Total Citigroup | $ | 2,562 | | $ | 1,816 | | $ | 5,584 | | $ | 3,656 | |
Interest rate risks (2) | $ | 1,411 | | $ | 1,140 | | $ | 3,177 | | $ | 1,947 | |
Foreign exchange risks (3) | 802 | | 402 | | 1,390 | | 1,015 | | ||||
Equity risks (4) | 58 | | (55 | ) | 246 | | (5 | ) | ||||
Commodity and other risks (5) | 148 | | 121 | | 238 | | 265 | | ||||
Credit products and risks (6) | 143 | | 208 | | 533 | | 434 | | ||||
Total | $ | 2,562 | | $ | 1,816 | | $ | 5,584 | | $ | 3,656 | |
(1) | Primarily relates to foreign exchange risks. |
(2) | Includes revenues from government securities and corporate debt, municipal securities, mortgage securities and other debt instruments. Also includes spot and forward trading of currencies and exchange-traded and over-the-counter (OTC) currency options, options on fixed income securities, interest rate swaps, currency swaps, swap options, caps and floors, financial futures, OTC options and forward contracts on fixed income securities. |
(3) | Includes revenues from foreign exchange spot, forward, option and swap contracts, as well as foreign currency translation (FX translation) gains and losses. |
(4) | Includes revenues from common, preferred and convertible preferred stock, convertible corporate debt, equity-linked notes and exchange-traded and OTC equity options and warrants. |
(5) | Primarily includes revenues from crude oil, refined oil products, natural gas and other commodities trades. |
(6) | Includes revenues from structured credit products. |
110
7. INCENTIVE PLANS
For additional information on Citi's incentive plans, see Note 7 to the Consolidated Financial Statements in Citi's 2016 Annual Report on Form 10-K.
8. RETIREMENT BENEFITS
For additional information on Citi's retirement benefits, see Note 8 to the Consolidated Financial Statements in Citi's 2016 Annual Report on Form 10-K.
Net (Benefit) Expense
| Three Months Ended June 30, | |||||||||||||||||||||||
| Pension plans | Postretirement benefit plans | ||||||||||||||||||||||
| U.S. plans | Non-U.S. plans | U.S. plans | Non-U.S. plans | ||||||||||||||||||||
In millions of dollars | 2017 | 2016 | 2017 | 2016 | 2017 | 2016 | 2017 | 2016 | ||||||||||||||||
Qualified plans |
| |
| |
| |
| |
| |
| |
| |
| | ||||||||
Benefits earned during the period | $ | - | | $ | - | | $ | 38 | | $ | 39 | | $ | - | | $ | - | | $ | 2 | | $ | 3 | |
Interest cost on benefit obligation | 128 | | 132 | | 74 | | 73 | | 8 | | 5 | | 25 | | 24 | | ||||||||
Expected return on plan assets | (217 | ) | (218 | ) | (76 | ) | (74 | ) | (2 | ) | (3 | ) | (22 | ) | (22 | ) | ||||||||
Amortization of unrecognized |
| |
|
| |
| |
| |
| |
| |
| | |||||||||
Prior service benefit | - | | - | | (1 | ) | (1 | ) | - | | - | | (3 | ) | (3 | ) | ||||||||
Net actuarial loss (gain) | 38 | | 39 | | 15 | | 20 | | 1 | | (1 | ) | 9 | | 8 | | ||||||||
Curtailment loss (1) | 3 | | - | | - | | - | | - | | - | | - | | - | | ||||||||
Settlement loss (1) | - | | - | | 4 | | 3 | | - | | - | | - | | - | | ||||||||
Net qualified plans (benefit) expense | $ | (48 | ) | $ | (47 | ) | $ | 54 | | $ | 60 | | $ | 7 | | $ | 1 | | $ | 11 | | $ | 10 | |
Nonqualified plans expense | $ | 11 | | $ | 9 | | $ | - | | $ | - | | $ | - | | $ | - | | $ | - | | $ | - | |
Total net (benefit) expense | $ | (37 | ) | $ | (38 | ) | $ | 54 | | $ | 60 | | $ | 7 | | $ | 1 | | $ | 11 | | $ | 10 | |
(1) | Losses due to curtailment and settlement relate to repositioning and divestiture activities. |
| Six Months Ended June 30, | |||||||||||||||||||||||
| Pension plans | Postretirement benefit plans | ||||||||||||||||||||||
| U.S. plans | Non-U.S. plans | U.S. plans | Non-U.S. plans | ||||||||||||||||||||
In millions of dollars | 2017 | 2016 | 2017 | 2016 | 2017 | 2016 | 2017 | 2016 | ||||||||||||||||
Qualified plans |
| |
| |
| |
| |
| |
| |
| |
| | ||||||||
Benefits earned during the period | $ | 1 | | $ | 1 | | $ | 74 | | $ | 77 | | $ | - | | $ | - | | $ | 4 | | $ | 6 | |
Interest cost on benefit obligation | 260 | | 273 | | 145 | | 146 | | 14 | | 13 | | 49 | | 48 | | ||||||||
Expected return on plan assets | (433 | ) | (436 | ) | (146 | ) | (146 | ) | (3 | ) | (5 | ) | (43 | ) | (43 | ) | ||||||||
Amortization of unrecognized | | | | |
| |
| |
|
| |
| |
| | |||||||||
Prior service benefit | - | | - | | (2 | ) | (1 | ) | - | | - | | (5 | ) | (6 | ) | ||||||||
Net actuarial loss (gain) | 79 | | 75 | | 31 | | 39 | | - | | (1 | ) | 17 | | 16 | | ||||||||
Curtailment loss (gain) (1) | 3 | | - | | - | | (3 | ) | - | | - | | - | | - | | ||||||||
Settlement loss (1) | - | | - | | 4 | | 4 | | - | | - | | - | | - | | ||||||||
Net qualified plans (benefit) expense | $ | (90 | ) | $ | (87 | ) | $ | 106 | | $ | 116 | | $ | 11 | | $ | 7 | | $ | 22 | | $ | 21 | |
Nonqualified plans expense | $ | 21 | | $ | 19 | | $ | - | | $ | - | | $ | - | | $ | - | | $ | - | | $ | - | |
Total net (benefit) expense | $ | (69 | ) | $ | (68 | ) | $ | 106 | | $ | 116 | | $ | 11 | | $ | 7 | | $ | 22 | | $ | 21 | |
(1) | (Gains) losses due to curtailment and settlement relate to repositioning and divestiture activities. |
111
Funded Status and Accumulated Other Comprehensive Income (AOCI)
The following tables summarize the funded status and amounts recognized in the Consolidated Balance Sheet for the Company's
Significant Plans.
| Six Months Ended June 30, 2017 | |||||||||||
| Pension plans | Postretirement benefit plans | ||||||||||
In millions of dollars | U.S. plans | Non-U.S. plans | U.S. plans | Non-U.S. plans | ||||||||
Change in projected benefit obligation |
| |
| |
| |
| | ||||
Projected benefit obligation at beginning of year | $ | 14,000 | | $ | 6,522 | | $ | 686 | | $ | 1,141 | |
Plans measured annually | (28 | ) | (1,784 | ) | - | | (303 | ) | ||||
Projected benefit obligation at beginning of year-Significant Plans | $ | 13,972 | | $ | 4,738 | | $ | 686 | | $ | 838 | |
First quarter activity | 25 | | 802 | | (7 | ) | 134 | | ||||
Projected benefit obligation at March 31, 2017-Significant Plans | $ | 13,997 | | $ | 5,540 | | $ | 679 | | $ | 972 | |
Benefits earned during the period | - | | 22 | | - | | 2 | | ||||
Interest cost on benefit obligation | 135 | | 62 | | 7 | | 22 | | ||||
Actuarial gain (loss) | 214 | | (58 | ) | 71 | | 22 | | ||||
Benefits paid, net of participants' contributions | (191 | ) | (79 | ) | (15 | ) | (14 | ) | ||||
Curtailment loss (1) | 3 | | - | | - | | - | | ||||
Foreign exchange impact and other | - | | 62 | | - | | 40 | | ||||
Projected benefit obligation at June 30, 2017-Significant Plans | $ | 14,158 | | $ | 5,549 | | $ | 742 | | $ | 1,044 | |
(1) | Loss due to curtailment relates to repositioning activities. |
112
| Six Months Ended June 30, 2017 | |||||||||||
| Pension plans | Postretirement benefit plans | ||||||||||
In millions of dollars | U.S. plans | Non-U.S. plans | U.S. plans | Non-U.S. plans | ||||||||
Change in plan assets |
| |
| |
| |
| | ||||
Plan assets at fair value at beginning of year | $ | 12,363 | | $ | 6,149 | | $ | 129 | | $ | 1,015 | |
Plans measured annually | - | | (1,167 | ) | - | | (11 | ) | ||||
Plan assets at fair value at beginning of year-Significant Plans | $ | 12,363 | | $ | 4,982 | | $ | 129 | | $ | 1,004 | |
First quarter activity | 159 | | 903 | | $ | - | | 124 | | |||
Plan assets at fair value at March 31, 2017 - Significant Plans | $ | 12,522 | | $ | 5,885 | | $ | 129 | | $ | 1,128 | |
Actual return on plan assets | 364 | | (45 | ) | 4 | | 23 | | ||||
Company contributions, net of reimbursements | 13 | | 13 | | 8 | | - | | ||||
Plan participants' contributions | - | | 1 | | - | | - | | ||||
Benefits paid, net of government subsidy | (191 | ) | (80 | ) | (15 | ) | (14 | ) | ||||
Foreign exchange impact and other | - | | 72 | | - | | 46 | | ||||
Plan assets at fair value at June 30, 2017-Significant Plans | $ | 12,708 | | $ | 5,846 | | $ | 126 | | $ | 1,183 | |
Funded status of the Significant Plans |
|
|
|
| ||||||||
Qualified plans (1) | $ | (720 | ) | $ | 297 | | $ | (616 | ) | $ | 139 | |
Nonqualified plans | (730 | ) | - | | - | | - | | ||||
Funded status of the plans at June 30, 2017-Significant Plans | $ | (1,450 | ) | $ | 297 | | $ | (616 | ) | $ | 139 | |
Net amount recognized |
| |
| |
| |
| | ||||
Benefit asset | $ | - | | $ | 758 | | $ | - | | $ | 139 | |
Benefit liability | (1,450 | ) | (461 | ) | (616 | ) | - | | ||||
Net amount recognized on the balance sheet-Significant Plans | $ | (1,450 | ) | $ | 297 | | $ | (616 | ) | $ | 139 | |
Amounts recognized in AOCI |
| |
| |
| | ||||||
Prior service benefit | $ | - | | $ | 32 | | $ | - | | $ | 94 | |
Net actuarial gain (loss) | (6,821 | ) | (984 | ) | 39 | | (403 | ) | ||||
Net amount recognized in equity (pretax)-Significant Plans | $ | (6,821 | ) | $ | (952 | ) | $ | 39 | | $ | (309 | ) |
Accumulated benefit obligation at June 30, 2017-Significant Plans | $ | 14,151 | | $ | 5,280 | | $ | 742 | | $ | 1,044 | |
(1) | The U.S. qualified pension plan is fully funded under specified Employee Retirement Income Security Act of 1974, as amended (ERISA), funding rules as of January 1, 2017 and no minimum required funding is expected for 2017 . |
In millions of dollars | Three Months Ended June 30, 2017 | Six Months Ended June 30, 2017 | ||||
Beginning of period balance, net of tax (1)(2) | $ | (5,176 | ) | $ | (5,164 | ) |
Actuarial assumptions changes and plan experience | (260 | ) | (508 | ) | ||
Net asset gain due to difference between actual and expected returns | 43 | | 296 | | ||
Net amortization | 56 | | 112 | | ||
Prior service cost | - | | (5 | ) | ||
Curtailment/settlement gain (3) | 7 | | 7 | | ||
Foreign exchange impact and other | (64 | ) | (122 | ) | ||
Change in deferred taxes, net | 83 | | 73 | | ||
Change, net of tax | $ | (135 | ) | $ | (147 | ) |
End of period balance, net of tax (1)(2) | $ | (5,311 | ) | $ | (5,311 | ) |
(1) | See Note 17 to the Consolidated Financial Statements for further discussion of net AOCI balance. |
(2) | Includes net-of-tax amounts for certain profit sharing plans outside the U.S. |
(3) | Gains due to curtailment and settlement relate to repositioning and divestiture activities. |
113
Plan Assumptions
The discount rates utilized during the period in determining the pension and postretirement net (benefit) expense for the Significant Plans are as follows:
Net benefit (expense) assumed discount rates during the period | Three months ended | |
Jun. 30, 2017 | Mar. 31, 2017 | |
U.S. plans |
|
|
Qualified pension | 4.05% | 4.10% |
Nonqualified pension | 3.95 | 4.00 |
Postretirement | 3.85 | 3.90 |
Non-U.S. plans |
|
|
Pension | 0.55-10.45 | 0.60-11.00 |
Weighted average | 4.83 | 5.08 |
Postretirement | 9.25 | 9.65 |
The discount rates utilized at period-end in determining the pension and postretirement benefit obligations for the Significant Plans are as follows:
Plan obligations assumed discount rates at period ended | Jun. 30, 2017 | Mar. 31, 2017 | Dec. 31, 2016 |
U.S. plans |
|
|
|
Qualified pension | 3.80% | 4.05% | 4.10% |
Nonqualified pension | 3.75 | 3.95 | 4.00 |
Postretirement | 3.60 | 3.85 | 3.90 |
Non-U.S. plans |
|
|
|
Pension | 0.65-10.90 | 0.55-10.45 | 0.60-11.00 |
Weighted average | 4.87 | 4.83 | 5.08 |
Postretirement | 9.05 | 9.25 | 9.65 |
Sensitivities of Certain Key Assumptions
The following table summarizes the estimated effect on the Company's Significant Plans quarterly expense of a one-percentage-point change in the discount rate:
| Three Months Ended June 30, 2017 | |||||
In millions of dollars | One-percentage-point increase | One-percentage-point decrease | ||||
Pension |
|
| ||||
U.S. plans | $ | 7 | | $ | (10 | ) |
Non-U.S. plans | (4 | ) | 7 | | ||
Postretirement |
|
| ||||
U.S. plans | - | | (1 | ) | ||
Non-U.S. plans | (2 | ) | 2 | | ||
Contributions
For the U.S. pension plans, there were no required minimum cash contributions during the first six months of 2017 .
The following table summarizes the Company's actual contributions for the six months ended June 30, 2017 and 2016 , as well as estimated expected Company contributions for the remainder of 2017 and the actual contributions made in the third and fourth quarters of 2016 .
| Pension plans | Postretirement plans | ||||||||||||||||||||||
| U.S. plans (1) | Non-U.S. plans | U.S. plans | Non-U.S. plans | ||||||||||||||||||||
In millions of dollars | 2017 | 2016 | 2017 | 2016 | 2017 | 2016 | 2017 | 2016 | ||||||||||||||||
Company contributions (2) for the six months ended June 30 | $ | 26 | | $ | 28 | | $ | 70 | | $ | 58 | | $ | 19 | | $ | 6 | | $ | 4 | | $ | 3 | |
Company contributions made or expected to be made during the remainder of the year | 29 | | 528 | | 70 | | 68 | | - | | - | | 4 | | 6 | | ||||||||
(1) | The U.S. pension plans include benefits paid directly by the Company for the nonqualified pension plans. |
(2) | Company contributions are composed of cash contributions made to the plans and benefits paid directly by the Company. |
114
Defined Contribution Plans
| Three Months Ended June 30, | Six Months Ended June 30, | ||||||||||
In millions of dollars | 2017 | 2016 | 2017 | 2016 | ||||||||
U.S. plans | $ | 100 | | $ | 97 | | $ | 198 | | $ | 193 | |
Non-U.S. plans | 66 | | 72 | | 135 | | 140 | | ||||
Post Employment Plans
The following table summarizes the components of net expense recognized in the Consolidated Statement of Income for the Company's U.S. post employment plans:
| Three Months Ended | Six Months Ended | ||||||||||
In millions of dollars | 2017 | 2016 | 2017 | 2016 | ||||||||
Service-related expense | $ | - | | $ | - | | $ | - | | $ | - | |
Interest cost on benefit obligation | 1 | | 1 | | 1 | | 2 | | ||||
Amortization of unrecognized | | | | | | | | | ||||
Prior service benefit | (7 | ) | (8 | ) | (15 | ) | (16 | ) | ||||
Net actuarial loss | - | | 1 | | 1 | | 2 | | ||||
Total service-related benefit | $ | (6 | ) | $ | (6 | ) | $ | (13 | ) | $ | (12 | ) |
Non-service-related expense | $ | 4 | | $ | 5 | | $ | 12 | | $ | 13 | |
Total net (benefit) expense | $ | (2 | ) | $ | (1 | ) | $ | (1 | ) | $ | 1 | |
115
9. EARNINGS PER SHARE
The following table reconciles the income and share data used in the basic and diluted earnings per share (EPS) computations:
| Three Months Ended June 30, | Six Months Ended June 30, | ||||||||||
In millions, except per-share amounts | 2017 | 2016 | 2017 | 2016 | ||||||||
Income from continuing operations before attribution of noncontrolling interests | $ | 3,883 | | $ | 4,047 | | $ | 8,001 | | $ | 7,555 | |
Less: Noncontrolling interests from continuing operations | 32 | | 26 | | 42 | | 31 | | ||||
Net income from continuing operations (for EPS purposes) | $ | 3,851 | | $ | 4,021 | | $ | 7,959 | | $ | 7,524 | |
Income (loss) from discontinued operations, net of taxes | 21 | | (23 | ) | 3 | | (25 | ) | ||||
Citigroup's net income | $ | 3,872 | | $ | 3,998 | | $ | 7,962 | | $ | 7,499 | |
Less: Preferred dividends (1) | 320 | | 322 | | 621 | | 532 | | ||||
Net income available to common shareholders | $ | 3,552 | | $ | 3,676 | | $ | 7,341 | | $ | 6,967 | |
Less: Dividends and undistributed earnings allocated to employee restricted and deferred shares with nonforfeitable rights to dividends, applicable to basic EPS | 48 | | 53 | | 103 | | 93 | | ||||
Net income allocated to common shareholders for basic EPS | $ | 3,504 | | $ | 3,623 | | $ | 7,238 | | $ | 6,874 | |
Net income allocated to common shareholders for diluted EPS | 3,504 | | 3,623 | | $ | 7,238 | | $ | 6,874 | | ||
Weighted-average common shares outstanding applicable to basic EPS | 2,739.1 | | 2,915.8 | | 2,752.2 | | 2,929.4 | | ||||
Effect of dilutive securities (2) |
|
|
| |
| |||||||
Options (3) | 0.1 | | 0.1 | | 0.1 | | 0.1 | | ||||
Adjusted weighted-average common shares outstanding applicable to diluted EPS (4) | 2,739.2 | | 2,915.9 | | 2,752.3 | | 2,929.5 | | ||||
Basic earnings per share (5) |
|
|
| |
| |||||||
Income from continuing operations | $ | 1.27 | | $ | 1.25 | | $ | 2.63 | | $ | 2.36 | |
Discontinued operations | 0.01 | | (0.01 | ) | - | | (0.01 | ) | ||||
Net income | $ | 1.28 | | $ | 1.24 | | $ | 2.63 | | $ | 2.35 | |
Diluted earnings per share (5) |
|
|
|
| ||||||||
Income from continuing operations | $ | 1.27 | | $ | 1.25 | | $ | 2.63 | | $ | 2.36 | |
Discontinued operations | 0.01 | | (0.01 | ) | - | | (0.01 | ) | ||||
Net income | $ | 1.28 | | $ | 1.24 | | $ | 2.63 | | $ | 2.35 | |
(1) | As of June 30, 2017 , Citi estimates it will distribute preferred dividends of approximately $592 million during the remainder of 2017, in each case assuming such dividends are declared by the Citi Board of Directors. |
(2) | Warrants issued to the U.S. Treasury as part of the Troubled Asset Relief Program (TARP) and the loss-sharing agreement (all of which were subsequently sold to the public in January 2011), with exercise prices of $178.50 and $105.61 per share for approximately 21.0 million and 25.5 million shares of Citigroup common stock, respectively. Both warrants were not included in the computation of earnings per share in the three and six months ended June 30, 2017 and 2016 because they were anti-dilutive. |
(3) | During the second quarters of 2017 and 2016 , weighted-average options to purchase 0.8 million and 5.3 million shares of common stock, respectively, were outstanding, but not included in the computation of earnings per share because the weighted-average exercise prices of $204.80 and $75.43 per share, respectively, were anti-dilutive. |
(4) | Due to rounding, common shares outstanding applicable to basic EPS and the effect of dilutive securities may not sum to common shares outstanding applicable to diluted EPS. |
(5) | Due to rounding, earnings per share on continuing operations and discontinued operations may not sum to earnings per share on net income. |
116
10. FEDERAL FUNDS, SECURITIES BORROWED, LOANED AND SUBJECT TO REPURCHASE AGREEMENTS
For additional information on the Company's resale and repurchase agreements and securities borrowing and lending agreements, see Note 11 to the Consolidated Financial Statements in Citi's 2016 Annual Report on Form 10-K.
Federal funds sold and securities borrowed or purchased under agreements to resell , at their respective carrying values, consisted of the following:
In millions of dollars | June 30, | December 31, 2016 | ||||
Federal funds sold | $ | - | | $ | - | |
Securities purchased under agreements to resell | 128,546 | | 131,473 | | ||
Deposits paid for securities borrowed | 105,519 | | 105,340 | | ||
Total (1) | $ | 234,065 | | $ | 236,813 | |
Federal funds purchased and securities loaned or sold under agreements to repurchase , at their respective carrying values, consisted of the following:
In millions of dollars | June 30, | December 31, 2016 | ||||
Federal funds purchased | $ | 303 | | $ | 178 | |
Securities sold under agreements to repurchase | 141,304 | | 125,685 | | ||
Deposits received for securities loaned | 13,173 | | 15,958 | | ||
Total (1) | $ | 154,780 | | $ | 141,821 | |
(1) | The above tables do not include securities-for-securities lending transactions of $13.4 billion and $9.3 billion at June 30, 2017 and December 31, 2016, respectively, where the Company acts as lender and receives securities that can be sold or pledged as collateral. In these transactions, the Company recognizes the securities received at fair value within Other assets and the obligation to return those securities as a liability within Brokerage payables . |
It is the Company's policy to take possession of the underlying collateral, monitor its market value relative to the amounts due under the agreements and, when necessary, require prompt transfer of additional collateral in order to maintain contractual margin protection. For resale and repurchase agreements, when necessary, the Company posts additional collateral in order to maintain contractual margin protection.
A substantial portion of the resale and repurchase agreements is recorded at fair value, as described in Notes 20 and 21 to the Consolidated Financial Statements. The remaining portion is carried at the amount of cash initially advanced or received, plus accrued interest, as specified in the respective agreements.
A substantial portion of securities borrowing and lending agreements is recorded at the amount of cash advanced or received. The remaining portion is recorded at fair value as the Company elected the fair value option for certain securities borrowed and loaned portfolios, as described in Note 21 to the Consolidated Financial Statements. With respect to securities loaned, the Company receives cash collateral in an amount generally in excess of the market value of the securities loaned. The Company monitors the market value of securities borrowed and securities loaned on a daily basis and obtains or posts additional collateral in order to maintain contractual margin protection.
The following tables present the gross and net resale and repurchase agreements and securities borrowing and lending
agreements and the related offsetting amount permitted under ASC-210-20-45. The tables also include amounts related to financial instruments that are not permitted to be offset under ASC-210-20-45, but would be eligible for offsetting to the extent that an event of default occurred and a legal opinion supporting enforceability of the offsetting rights has been obtained. Remaining exposures continue to be secured by financial collateral, but the Company may not have sought or been able to obtain a legal opinion evidencing enforceability of the offsetting right.
| As of June 30, 2017 | ||||||||||||||
In millions of dollars | Gross amounts | Gross amounts | Net amounts of | Amounts | Net | ||||||||||
Securities purchased under agreements to resell | $ | 186,108 | | $ | 57,562 | | $ | 128,546 | | $ | 106,230 | | $ | 22,316 | |
Deposits paid for securities borrowed | 105,519 | | - | | 105,519 | | 22,633 | | 82,886 | | |||||
Total | $ | 291,627 | | $ | 57,562 | | $ | 234,065 | | $ | 128,863 | | $ | 105,202 | |
117
In millions of dollars | Gross amounts | Gross amounts | Net amounts of | Amounts | Net | ||||||||||
Securities sold under agreements to repurchase | $ | 198,866 | | $ | 57,562 | | $ | 141,304 | | $ | 64,748 | | $ | 76,556 | |
Deposits received for securities loaned | 13,173 | | - | | 13,173 | | 2,936 | | 10,237 | | |||||
Total | $ | 212,039 | | $ | 57,562 | | $ | 154,477 | | $ | 67,684 | | $ | 86,793 | |
| As of December 31, 2016 | ||||||||||||||
In millions of dollars | Gross amounts | Gross amounts | Net amounts of | Amounts | Net | ||||||||||
Securities purchased under agreements to resell | $ | 176,284 | | $ | 44,811 | | $ | 131,473 | | $ | 102,874 | | $ | 28,599 | |
Deposits paid for securities borrowed | 105,340 | | - | | 105,340 | | 16,200 | | 89,140 | | |||||
Total | $ | 281,624 | | $ | 44,811 | | $ | 236,813 | | $ | 119,074 | | $ | 117,739 | |
In millions of dollars | Gross amounts | Gross amounts | Net amounts of | Amounts | Net | ||||||||||
Securities sold under agreements to repurchase | $ | 170,496 | | $ | 44,811 | | $ | 125,685 | | $ | 63,517 | | $ | 62,168 | |
Deposits received for securities loaned | 15,958 | | - | | 15,958 | | 3,529 | | 12,429 | | |||||
Total | $ | 186,454 | | $ | 44,811 | | $ | 141,643 | | $ | 67,046 | | $ | 74,597 | |
(1) | Includes financial instruments subject to enforceable master netting agreements that are permitted to be offset under ASC 210-20-45. |
(2) | The total of this column for each period excludes Federal funds sold/purchased. See tables above. |
(3) | Includes financial instruments subject to enforceable master netting agreements that are not permitted to be offset under ASC 210-20-45, but would be eligible for offsetting to the extent that an event of default has occurred and a legal opinion supporting enforceability of the offsetting right has been obtained. |
(4) | Remaining exposures continue to be secured by financial collateral, but the Company may not have sought or been able to obtain a legal opinion evidencing enforceability of the offsetting right. |
The following tables present the gross amount of liabilities associated with repurchase agreements and securities lending agreements, by remaining contractual maturity:
| As of June 30, 2017 | ||||||||||||||
In millions of dollars | Open and overnight | Up to 30 days | 31–90 days | Greater than 90 days | Total | ||||||||||
Securities sold under agreements to repurchase | $ | 91,133 | | $ | 56,163 | | $ | 24,255 | | $ | 27,315 | | $ | 198,866 | |
Deposits received for securities loaned | 9,948 | | 644 | | 1,709 | | 872 | | 13,173 | | |||||
Total | $ | 101,081 | | $ | 56,807 | | $ | 25,964 | | $ | 28,187 | | $ | 212,039 | |
| As of December 31, 2016 | ||||||||||||||
In millions of dollars | Open and overnight | Up to 30 days | 31–90 days | Greater than 90 days | Total | ||||||||||
Securities sold under agreements to repurchase | $ | 79,740 | | $ | 50,399 | | $ | 19,396 | | $ | 20,961 | | $ | 170,496 | |
Deposits received for securities loaned | 10,813 | | 2,169 | | 2,044 | | 932 | | 15,958 | | |||||
Total | $ | 90,553 | | $ | 52,568 | | $ | 21,440 | | $ | 21,893 | | $ | 186,454 | |
118
The following tables present the gross amount of liabilities associated with repurchase agreements and securities lending agreements, by class of underlying collateral:
| As of June 30, 2017 | ||||||||
In millions of dollars | Repurchase agreements | Securities lending agreements | Total | ||||||
U.S. Treasury and federal agency securities | $ | 66,171 | | $ | - | | $ | 66,171 | |
State and municipal securities | 1,054 | | - | | 1,054 | | |||
Foreign government securities | 77,916 | | 611 | | 78,527 | | |||
Corporate bonds | 18,799 | | 586 | | 19,385 | | |||
Equity securities | 11,419 | | 11,330 | | 22,749 | | |||
Mortgage-backed securities | 14,980 | | - | | 14,980 | | |||
Asset-backed securities | 5,321 | | - | | 5,321 | | |||
Other | 3,206 | | 646 | | 3,852 | | |||
Total | $ | 198,866 | | $ | 13,173 | | $ | 212,039 | |
| As of December 31, 2016 | ||||||||
In millions of dollars | Repurchase agreements | Securities lending agreements | Total | ||||||
U.S. Treasury and federal agency securities | $ | 66,263 | | $ | - | | $ | 66,263 | |
State and municipal securities | 334 | | - | | 334 | | |||
Foreign government securities | 52,988 | | 1,390 | | 54,378 | | |||
Corporate bonds | 17,164 | | 630 | | 17,794 | | |||
Equity securities | 12,206 | | 13,913 | | 26,119 | | |||
Mortgage-backed securities | 11,421 | | - | | 11,421 | | |||
Asset-backed securities | 5,428 | | - | | 5,428 | | |||
Other | 4,692 | | 25 | | 4,717 | | |||
Total | $ | 170,496 | | $ | 15,958 | | $ | 186,454 | |
119
11. BROKERAGE RECEIVABLES AND BROKERAGE
PAYABLES
The Company has receivables and payables for financial instruments sold to and purchased from brokers, dealers and customers, which arise in the ordinary course of business.
For additional information on these receivables and payables, see Note 12 to the Consolidated Financial Statements in Citi's 2016 Annual Report on Form 10-K.
Brokerage receivables and Brokerage payables consisted of the following:
In millions of dollars | June 30, | December 31, 2016 | ||||
Receivables from customers | $ | 12,851 | | $ | 10,374 | |
Receivables from brokers, dealers, and clearing organizations | 27,636 | | 18,513 | | ||
Total brokerage receivables (1) | $ | 40,487 | | $ | 28,887 | |
Payables to customers | $ | 38,588 | | $ | 37,237 | |
Payables to brokers, dealers, and clearing organizations | 24,359 | | 19,915 | | ||
Total brokerage payables (1) | $ | 62,947 | | $ | 57,152 | |
(1) | Includes brokerage receivables and payables recorded by Citi broker-dealer entities that are accounted for in accordance with the AICPA Accounting Guide for Brokers and Dealers in Securities as codified in ASC 940-320. |
120
12. INVESTMENTS
For additional information regarding Citi's investment portfolios, including evaluating investments for other-than-temporary impairment (OTTI), see Note 13 to the Consolidated Financial Statements in Citi's 2016 Annual Report on Form 10-K.
Overview
The following table presents Citi's investments by category:
In millions of dollars | June 30, | December 31, | |||||
Securities available-for-sale (AFS) | $ | 293,629 | | $ | 299,424 | | |
Debt securities held-to-maturity (HTM) (1) | 50,175 | | 45,667 | | |||
Non-marketable equity securities carried at fair value (2) | 1,384 | | 1,774 | | |||
Non-marketable equity securities carried at cost (3) | 6,522 | | 6,439 | | |||
Total investments | $ | 351,710 | | $ | 353,304 | | |
(1) | Carried at adjusted amortized cost basis, net of any credit-related impairment. |
(2) | Unrealized gains and losses for non-marketable equity securities carried at fair value are recognized in earnings. |
(3) | Primarily consists of shares issued by the Federal Reserve Bank, Federal Home Loan Banks and various clearing houses of which Citigroup is a member. |
The following table presents interest and dividend income on investments:
| Three Months Ended June 30, | Six Months Ended June 30, | ||||||||||
In millions of dollars | 2017 | 2016 | 2017 | 2016 | ||||||||
Taxable interest | $ | 1,859 | | $ | 1,759 | | $ | 3,623 | | $ | 3,436 | |
Interest exempt from U.S. federal income tax | 141 | | 133 | | 283 | | 276 | | ||||
Dividend income | 58 | | 45 | | 112 | | 80 | | ||||
Total interest and dividend income | $ | 2,058 | | $ | 1,937 | | $ | 4,018 | | $ | 3,792 | |
The following table presents realized gains and losses on the sales of investments, which excludes OTTI losses:
| Three Months Ended June 30, | Six Months Ended June 30, | ||||||||||
In millions of dollars | 2017 | 2016 | 2017 | 2016 | ||||||||
Gross realized investment gains | $ | 258 | | $ | 244 | | $ | 546 | | $ | 623 | |
Gross realized investment losses | (37 | ) | (44 | ) | (133 | ) | (237 | ) | ||||
Net realized gains on sale of investments | $ | 221 | | $ | 200 | | $ | 413 | | $ | 386 | |
121
Securities Available-for-Sale
The amortized cost and fair value of AFS securities were as follows:
| June 30, 2017 | December 31, 2016 | ||||||||||||||||||||||
In millions of dollars | Amortized cost | Gross unrealized gains | Gross unrealized losses | Fair value | Amortized cost | Gross unrealized gains | Gross unrealized losses | Fair value | ||||||||||||||||
Securities AFS |
|
|
|
|
|
|
|
| ||||||||||||||||
Mortgage-backed securities (1) |
|
|
|
|
|
|
|
| ||||||||||||||||
U.S. government-sponsored agency guaranteed | $ | 43,351 | | $ | 246 | | $ | 399 | | $ | 43,198 | | $ | 38,663 | | $ | 248 | | $ | 506 | | $ | 38,405 | |
Prime | 1 | | - | | - | | 1 | | 2 | | - | | - | | 2 | | ||||||||
Alt-A | - | | - | | - | | - | | 43 | | 7 | | - | | 50 | | ||||||||
Non-U.S. residential | 3,154 | | 14 | | 5 | | 3,163 | | 3,852 | | 13 | | 7 | | 3,858 | | ||||||||
Commercial | 357 | | 1 | | 1 | | 357 | | 357 | | 2 | | 1 | | 358 | | ||||||||
Total mortgage-backed securities | $ | 46,863 | | $ | 261 | | $ | 405 | | $ | 46,719 | | $ | 42,917 | | $ | 270 | | $ | 514 | | $ | 42,673 | |
U.S. Treasury and federal agency securities |
|
|
|
|
|
|
|
| ||||||||||||||||
U.S. Treasury | $ | 102,340 | | $ | 414 | | $ | 359 | | $ | 102,395 | | $ | 113,606 | | $ | 629 | | $ | 452 | | $ | 113,783 | |
Agency obligations | 10,240 | | 24 | | 61 | | 10,203 | | 9,952 | | 21 | | 85 | | 9,888 | | ||||||||
Total U.S. Treasury and federal agency securities | $ | 112,580 | | $ | 438 | | $ | 420 | | $ | 112,598 | | $ | 123,558 | | $ | 650 | | $ | 537 | | $ | 123,671 | |
State and municipal (2) | $ | 9,700 | | $ | 142 | | $ | 303 | | $ | 9,539 | | $ | 10,797 | | $ | 80 | | $ | 757 | | $ | 10,120 | |
Foreign government | 101,669 | | 514 | | 401 | | 101,782 | | 98,112 | | 590 | | 554 | | 98,148 | | ||||||||
Corporate | 16,111 | | 93 | | 101 | | 16,103 | | 17,195 | | 105 | | 176 | | 17,124 | | ||||||||
Asset-backed securities (1) | 6,020 | | 10 | | 6 | | 6,024 | | 6,810 | | 6 | | 22 | | 6,794 | | ||||||||
Other debt securities | 431 | | - | | - | | 431 | | 503 | | - | | - | | 503 | | ||||||||
Total debt securities AFS | $ | 293,374 | | $ | 1,458 | | $ | 1,636 | | $ | 293,196 | | $ | 299,892 | | $ | 1,701 | | $ | 2,560 | | $ | 299,033 | |
Marketable equity securities AFS | $ | 414 | | $ | 25 | | $ | 6 | | $ | 433 | | $ | 377 | | $ | 20 | | $ | 6 | | $ | 391 | |
Total securities AFS | $ | 293,788 | | $ | 1,483 | | $ | 1,642 | | $ | 293,629 | | $ | 300,269 | | $ | 1,721 | | $ | 2,566 | | $ | 299,424 | |
(1) | The Company invests in mortgage-backed and asset-backed securities. These securitizations are generally considered VIEs. The Company's maximum exposure to loss from these VIEs is equal to the carrying amount of the securities, which is reflected in the table above. For mortgage-backed and asset-backed securitizations in which the Company has other involvement, see Note 18 to the Consolidated Financial Statements. |
(2) | In the second quarter of 2017, Citi early adopted ASU 2017-08, Receivables-Nonrefundable Fees and Other Costs (Subtopic 310-20): Premium Amortization on Purchased Callable Debt Securities. Upon adoption, a cumulative effect adjustment was recorded to reduce retained earnings, effective January 1, 2017, for the incremental amortization of purchase premiums and cumulative fair value hedge adjustments on callable state and municipal debt securities. For additional information, see Note 1 to the Consolidated Financial Statements. |
122
The following shows the fair value of AFS securities that have been in an unrealized loss position:
| Less than 12 months | 12 months or longer | Total | |||||||||||||||
In millions of dollars | Fair value | Gross unrealized losses | Fair value | Gross unrealized losses | Fair value | Gross unrealized losses | ||||||||||||
June 30, 2017 |
|
|
|
|
|
| ||||||||||||
Securities AFS |
|
|
|
|
|
| ||||||||||||
Mortgage-backed securities |
|
|
|
|
|
| ||||||||||||
U.S. government-sponsored agency guaranteed | $ | 26,236 | | $ | 332 | | $ | 2,253 | | $ | 67 | | $ | 28,489 | | $ | 399 | |
Non-U.S. residential | 1,243 | | 4 | | 36 | | 1 | | 1,279 | | 5 | | ||||||
Commercial | 84 | | 1 | | 37 | | - | | 121 | | 1 | | ||||||
Total mortgage-backed securities | $ | 27,563 | | $ | 337 | | $ | 2,326 | | $ | 68 | | $ | 29,889 | | $ | 405 | |
U.S. Treasury and federal agency securities |
|
|
|
|
|
| ||||||||||||
U.S. Treasury | $ | 37,721 | | $ | 250 | | $ | 4,592 | | $ | 109 | | $ | 42,313 | | $ | 359 | |
Agency obligations | 6,345 | | 60 | | 106 | | 1 | | 6,451 | | 61 | | ||||||
Total U.S. Treasury and federal agency securities | $ | 44,066 | | $ | 310 | | $ | 4,698 | | $ | 110 | | $ | 48,764 | | $ | 420 | |
State and municipal | $ | 506 | | $ | 17 | | $ | 1,735 | | $ | 286 | | $ | 2,241 | | $ | 303 | |
Foreign government | 37,764 | | 172 | | 11,189 | | 229 | | 48,953 | | 401 | | ||||||
Corporate | 5,965 | | 87 | | 553 | | 14 | | 6,518 | | 101 | | ||||||
Asset-backed securities | 1,045 | | 1 | | 938 | | 5 | | 1,983 | | 6 | | ||||||
Other debt securities | 29 | | - | | - | | - | | 29 | | - | | ||||||
Marketable equity securities AFS | 16 | | 2 | | 54 | | 4 | | 70 | | 6 | | ||||||
Total securities AFS | $ | 116,954 | | $ | 926 | | $ | 21,493 | | $ | 716 | | $ | 138,447 | | $ | 1,642 | |
December 31, 2016 |
| |
| |
| |
| |
| |
| | ||||||
Securities AFS |
| |
| |
| |
| |
| |
| | ||||||
Mortgage-backed securities |
| |
| |
| |
| |
| |
| | ||||||
U.S. government-sponsored agency guaranteed | $ | 23,534 | | $ | 436 | | $ | 2,236 | | $ | 70 | | $ | 25,770 | | $ | 506 | |
Prime | 1 | | - | | - | | - | | 1 | | - | | ||||||
Non-U.S. residential | 486 | | - | | 1,276 | | 7 | | 1,762 | | 7 | | ||||||
Commercial | 75 | | 1 | | 58 | | - | | 133 | | 1 | | ||||||
Total mortgage-backed securities | $ | 24,096 | | $ | 437 | | $ | 3,570 | | $ | 77 | | $ | 27,666 | | $ | 514 | |
U.S. Treasury and federal agency securities |
| |
| |
| |
| |
| |
| | ||||||
U.S. Treasury | $ | 44,342 | | $ | 445 | | $ | 1,335 | | $ | 7 | | $ | 45,677 | | $ | 452 | |
Agency obligations | 6,552 | | 83 | | 250 | | 2 | | 6,802 | | 85 | | ||||||
Total U.S. Treasury and federal agency securities | $ | 50,894 | | $ | 528 | | $ | 1,585 | | $ | 9 | | $ | 52,479 | | $ | 537 | |
State and municipal | $ | 1,616 | | $ | 55 | | $ | 3,116 | | $ | 702 | | $ | 4,732 | | $ | 757 | |
Foreign government | 38,226 | | 243 | | 8,973 | | 311 | | 47,199 | | 554 | | ||||||
Corporate | 7,011 | | 129 | | 1,877 | | 47 | | 8,888 | | 176 | | ||||||
Asset-backed securities | 411 | | - | | 3,213 | | 22 | | 3,624 | | 22 | | ||||||
Other debt securities | 5 | | - | | - | | - | | 5 | | - | | ||||||
Marketable equity securities AFS | 19 | | 2 | | 24 | | 4 | | 43 | | 6 | | ||||||
Total securities AFS | $ | 122,278 | | $ | 1,394 | | $ | 22,358 | | $ | 1,172 | | $ | 144,636 | | $ | 2,566 | |
123
The following table presents the amortized cost and fair value of AFS debt securities by contractual maturity dates:
| June 30, 2017 | December 31, 2016 | ||||||||||
In millions of dollars | Amortized cost | Fair value | Amortized cost | Fair value | ||||||||
Mortgage-backed securities (1) |
|
|
|
| ||||||||
Due within 1 year | $ | 96 | | $ | 96 | | $ | 132 | | $ | 132 | |
After 1 but within 5 years | 812 | | 814 | | 736 | | 738 | | ||||
After 5 but within 10 years | 1,733 | | 1,730 | | 2,279 | | 2,265 | | ||||
After 10 years (2) | 44,222 | | 44,079 | | 39,770 | | 39,538 | | ||||
Total | $ | 46,863 | | $ | 46,719 | | $ | 42,917 | | $ | 42,673 | |
U.S. Treasury and federal agency securities |
|
|
|
| ||||||||
Due within 1 year | $ | 3,183 | | $ | 3,165 | | $ | 4,945 | | $ | 4,945 | |
After 1 but within 5 years | 103,151 | | 103,156 | | 101,369 | | 101,323 | | ||||
After 5 but within 10 years | 6,211 | | 6,240 | | 17,153 | | 17,314 | | ||||
After 10 years (2) | 35 | | 37 | | 91 | | 89 | | ||||
Total | $ | 112,580 | | $ | 112,598 | | $ | 123,558 | | $ | 123,671 | |
State and municipal |
|
|
|
| ||||||||
Due within 1 year | $ | 2,217 | | $ | 2,217 | | $ | 2,093 | | $ | 2,092 | |
After 1 but within 5 years | 2,393 | | 2,396 | | 2,668 | | 2,662 | | ||||
After 5 but within 10 years | 464 | | 478 | | 335 | | 334 | | ||||
After 10 years (2) | 4,626 | | 4,448 | | 5,701 | | 5,032 | | ||||
Total | $ | 9,700 | | $ | 9,539 | | $ | 10,797 | | $ | 10,120 | |
Foreign government |
|
|
|
| ||||||||
Due within 1 year | $ | 31,792 | | $ | 31,800 | | $ | 32,540 | | $ | 32,547 | |
After 1 but within 5 years | 54,028 | | 53,507 | | 51,008 | | 50,881 | | ||||
After 5 but within 10 years | 13,457 | | 13,944 | | 12,388 | | 12,440 | | ||||
After 10 years (2) | 2,392 | | 2,531 | | 2,176 | | 2,280 | | ||||
Total | $ | 101,669 | | $ | 101,782 | | $ | 98,112 | | $ | 98,148 | |
All other (3) |
|
|
|
| ||||||||
Due within 1 year | $ | 3,794 | | $ | 3,688 | | $ | 2,629 | | $ | 2,628 | |
After 1 but within 5 years | 10,380 | | 10,396 | | 12,339 | | 12,334 | | ||||
After 5 but within 10 years | 5,760 | | 5,865 | | 6,566 | | 6,528 | | ||||
After 10 years (2) | 2,628 | | 2,609 | | 2,974 | | 2,931 | | ||||
Total | $ | 22,562 | | $ | 22,558 | | $ | 24,508 | | $ | 24,421 | |
Total debt securities AFS | $ | 293,374 | | $ | 293,196 | | $ | 299,892 | | $ | 299,033 | |
(1) | Includes mortgage-backed securities of U.S. government-sponsored agencies. |
(2) | Investments with no stated maturities are included as contractual maturities of greater than 10 years. Actual maturities may differ due to call or prepayment rights. |
(3) | Includes corporate, asset-backed and other debt securities. |
124
Debt Securities Held-to-Maturity
The carrying value and fair value of debt securities HTM were as follows:
In millions of dollars | Amortized cost basis (1) | Net unrealized gains (losses) recognized in AOCI | Carrying value (2) | Gross unrealized gains | Gross unrealized (losses) | Fair value | ||||||||||||
June 30, 2017 |
|
|
|
|
| |||||||||||||
Debt securities held-to-maturity |
|
|
|
|
|
| ||||||||||||
Mortgage-backed securities (3) |
|
|
|
|
|
| ||||||||||||
U.S. government agency guaranteed | $ | 24,044 | | $ | 25 | | $ | 24,069 | | $ | 77 | | $ | (113 | ) | $ | 24,033 | |
Prime | 15 | | - | | 15 | | 3 | | - | | 18 | | ||||||
Alt-A | 279 | | (18 | ) | 261 | | 94 | | (1 | ) | 354 | | ||||||
Non-U.S. residential | 1,940 | | (47 | ) | 1,893 | | 64 | | - | | 1,957 | | ||||||
Commercial | 104 | | - | | 104 | | - | | - | | 104 | | ||||||
Total mortgage-backed securities | $ | 26,382 | | $ | (40 | ) | $ | 26,342 | | $ | 238 | | $ | (114 | ) | $ | 26,466 | |
State and municipal (4) | $ | 8,830 | | $ | (31 | ) | $ | 8,799 | | $ | 310 | | $ | (132 | ) | $ | 8,977 | |
Foreign government | 588 | | - | | 588 | | - | | (16 | ) | 572 | | ||||||
Asset-backed securities (3) | 14,451 | | (5 | ) | 14,446 | | 67 | | (5 | ) | 14,508 | | ||||||
Total debt securities held-to-maturity | $ | 50,251 | | $ | (76 | ) | $ | 50,175 | | $ | 615 | | $ | (267 | ) | $ | 50,523 | |
December 31, 2016 |
|
| |
| |
| |
| |
| | |||||||
Debt securities held-to-maturity |
| |
| |
| |
| |
| |
| | ||||||
Mortgage-backed securities (3) |
| |
| |
| |
| |
| |
| | ||||||
U.S. government agency guaranteed | $ | 22,462 | | $ | 33 | | $ | 22,495 | | $ | 47 | | $ | (186 | ) | $ | 22,356 | |
Prime | 31 | | (7 | ) | 24 | | 10 | | (1 | ) | 33 | | ||||||
Alt-A | 314 | | (27 | ) | 287 | | 69 | | (1 | ) | 355 | | ||||||
Non-U.S. residential | 1,871 | | (47 | ) | 1,824 | | 49 | | - | | 1,873 | | ||||||
Commercial | 14 | | - | | 14 | | - | | - | | 14 | | ||||||
Total mortgage-backed securities | $ | 24,692 | | $ | (48 | ) | $ | 24,644 | | $ | 175 | | $ | (188 | ) | $ | 24,631 | |
State and municipal | $ | 9,025 | | $ | (442 | ) | $ | 8,583 | | $ | 129 | | $ | (238 | ) | $ | 8,474 | |
Foreign government | 1,339 | | - | | 1,339 | | - | | (26 | ) | 1,313 | | ||||||
Asset-backed securities (3) | 11,107 | | (6 | ) | 11,101 | | 41 | | (5 | ) | 11,137 | | ||||||
Total debt securities held-to-maturity (5) | $ | 46,163 | | $ | (496 | ) | $ | 45,667 | | $ | 345 | | $ | (457 | ) | $ | 45,555 | |
(1) | For securities transferred to HTM from Trading account assets , amortized cost basis is defined as the fair value of the securities at the date of transfer plus any accretion income and less any impairments recognized in earnings subsequent to transfer. For securities transferred to HTM from AFS, amortized cost is defined as the original purchase cost, adjusted for the cumulative accretion or amortization of any purchase discount or premium, plus or minus any cumulative fair value hedge adjustments, net of accretion or amortization, and less any other-than-temporary impairment recognized in earnings. |
(2) | HTM securities are carried on the Consolidated Balance Sheet at amortized cost basis, plus or minus any unamortized unrealized gains and losses and fair value hedge adjustments recognized in AOCI prior to reclassifying the securities from AFS to HTM. Changes in the values of these securities are not reported in the financial statements, except for the amortization of any difference between the carrying value at the transfer date and par value of the securities, and the recognition of any non-credit fair value adjustments in AOCI in connection with the recognition of any credit impairment in earnings related to securities the Company continues to intend to hold until maturity. |
(3) | The Company invests in mortgage-backed and asset-backed securities. These securitizations are generally considered VIEs. The Company's maximum exposure to loss from these VIEs is equal to the carrying amount of the securities, which is reflected in the table above. For mortgage-backed and asset-backed securitizations in which the Company has other involvement, see Note 18 to the Consolidated Financial Statements. |
(4) | In the second quarter of 2017, Citi early adopted ASU 2017-08, Receivables-Nonrefundable Fees and Other Costs (Subtopic 310-20): Premium Amortization on Purchased Callable Debt Securities. Upon adoption, a cumulative effect adjustment was recorded to reduce retained earnings, effective January 1, 2017, for the incremental amortization of purchase premiums and cumulative fair value hedge adjustments on callable state and municipal debt securities. For additional information, see Note 1 to the Consolidated Financial Statements. |
(5) | During the fourth quarter of 2016, securities with a total fair value of approximately $5.8 billion were transferred from AFS to HTM, composed of $5 billion of U.S. government agency mortgage-backed securities and $830 million of municipal securities. The transfer reflects the Company's intent to hold these securities to maturity or to issuer call, in part, in order to reduce the impact of price volatility on AOCI and certain capital measures under Basel III. While these securities were transferred to HTM at fair value as of the transfer date, no subsequent changes in value may be recorded, other than in connection with the recognition of any subsequent other-than-temporary impairment and the amortization of differences between the carrying values at the transfer date and the par values of each security as an adjustment of yield over the remaining contractual life of each security. Any net unrealized holding losses within AOCI related to the respective securities at the date of transfer, inclusive of any cumulative fair value hedge adjustments, will be amortized over the remaining contractual life of each security as an adjustment of yield in a manner consistent with the amortization of any premium or discount. |
125
The table below shows the fair value of debt securities HTM that have been in an unrecognized loss position:
| Less than 12 months | 12 months or longer | Total | |||||||||||||||
In millions of dollars | Fair | Gross | Fair | Gross | Fair | Gross | ||||||||||||
June 30, 2017 |
|
|
|
|
|
| ||||||||||||
Debt securities held-to-maturity |
|
|
|
|
|
| ||||||||||||
Mortgage-backed securities | $ | 35 | | $ | 1 | | $ | 11,533 | | $ | 113 | | $ | 11,568 | | $ | 114 | |
State and municipal | 629 | | 43 | | 735 | | 89 | | 1,364 | | 132 | | ||||||
Foreign government | 572 | | 16 | | - | | - | | 572 | | 16 | | ||||||
Asset-backed securities | 54 | | 1 | | 2,810 | | 4 | | 2,864 | | 5 | | ||||||
Total debt securities held-to-maturity | $ | 1,290 | | $ | 61 | | $ | 15,078 | | $ | 206 | | $ | 16,368 | | $ | 267 | |
December 31, 2016 |
|
|
|
|
|
| ||||||||||||
Debt securities held-to-maturity |
|
|
|
|
|
| ||||||||||||
Mortgage-backed securities | $ | 17 | | $ | - | | $ | 17,176 | | $ | 188 | | $ | 17,193 | | $ | 188 | |
State and municipal | 2,200 | | 58 | | 1,210 | | 180 | | 3,410 | | 238 | | ||||||
Foreign government | 1,313 | | 26 | | - | | - | | 1,313 | | 26 | | ||||||
Asset-backed securities | 2 | | - | | 2,503 | | 5 | | 2,505 | | 5 | | ||||||
Total debt securities held-to-maturity | $ | 3,532 | | $ | 84 | | $ | 20,889 | | $ | 373 | | $ | 24,421 | | $ | 457 | |
Note: Excluded from the gross unrecognized losses presented in the table above are $(76) million and $(496) million of net unrealized losses recorded in AOCI as of June 30, 2017 and December 31, 2016 , respectively, primarily related to the difference between the amortized cost and carrying value of HTM securities that were reclassified from AFS. Substantially all of these net unrecognized losses relate to securities that have been in a loss position for 12 months or longer at June 30, 2017 and December 31, 2016 .
126
| June 30, 2017 | December 31, 2016 | ||||||||||
In millions of dollars | Carrying value | Fair value | Carrying value | Fair value | ||||||||
Mortgage-backed securities |
|
|
|
| ||||||||
Due within 1 year | $ | - | | $ | - | | $ | - | | $ | - | |
After 1 but within 5 years | 735 | | 743 | | 760 | | 766 | | ||||
After 5 but within 10 years | 51 | | 52 | | 54 | | 55 | | ||||
After 10 years (1) | 25,556 | | 25,671 | | 23,830 | | 23,810 | | ||||
Total | $ | 26,342 | | $ | 26,466 | | $ | 24,644 | | $ | 24,631 | |
State and municipal |
|
|
|
| ||||||||
Due within 1 year | $ | 463 | | $ | 472 | | $ | 406 | | $ | 406 | |
After 1 but within 5 years | 145 | | 152 | | 112 | | 110 | | ||||
After 5 but within 10 years | 372 | | 385 | | 363 | | 367 | | ||||
After 10 years (1) | 7,819 | | 7,968 | | 7,702 | | 7,591 | | ||||
Total | $ | 8,799 | | $ | 8,977 | | $ | 8,583 | | $ | 8,474 | |
Foreign government |
|
|
|
| ||||||||
Due within 1 year | $ | 138 | | $ | 138 | | $ | 824 | | $ | 818 | |
After 1 but within 5 years | 450 | | 434 | | 515 | | 495 | | ||||
After 5 but within 10 years | - | | - | | - | | - | | ||||
After 10 years (1) | - | | - | | - | | - | | ||||
Total | $ | 588 | | $ | 572 | | $ | 1,339 | | $ | 1,313 | |
All other (2) |
|
|
|
| ||||||||
Due within 1 year | $ | - | | $ | - | | $ | - | | $ | - | |
After 1 but within 5 years | - | | - | | - | | - | | ||||
After 5 but within 10 years | 468 | | 469 | | 513 | | 514 | | ||||
After 10 years (1) | 13,978 | | 14,039 | | 10,588 | | 10,623 | | ||||
Total | $ | 14,446 | | $ | 14,508 | | $ | 11,101 | | $ | 11,137 | |
Total debt securities held-to-maturity | $ | 50,175 | | $ | 50,523 | | $ | 45,667 | | $ | 45,555 | |
(1) | Investments with no stated maturities are included as contractual maturities of greater than 10 years. Actual maturities may differ due to call or prepayment rights. |
(2) | Includes corporate and asset-backed securities. |
127
Evaluating Investments for Other-Than-Temporary Impairment
Overview
The Company conducts periodic reviews of all securities with unrealized losses to evaluate whether the impairment is other-than-temporary.
An unrealized loss exists when the current fair value of an individual security is less than its amortized cost basis. Unrealized losses that are determined to be temporary in nature are recorded, net of tax, in AOCI for AFS securities. Losses related to HTM securities generally are not recorded, as these investments are carried at adjusted amortized cost basis. However, for HTM securities with credit-related impairment, the credit loss is recognized in earnings as OTTI and any difference between the cost basis adjusted for the OTTI and fair value is recognized in AOCI and amortized as an adjustment of yield over the remaining contractual life of the security. For securities transferred to HTM from Trading account assets , amortized cost is defined as the fair value of the securities at the date of transfer, plus any accretion income and less any impairment recognized in earnings subsequent to transfer. For securities transferred to HTM from AFS, amortized cost is defined as the original purchase cost, adjusted for the cumulative accretion or amortization of any purchase discount or premium, plus or minus any cumulative fair value hedge adjustments, net of accretion or amortization, and less any impairment recognized in earnings.
Regardless of the classification of the securities as AFS or HTM, the Company assesses each position with an unrealized loss for OTTI. Factors considered in determining whether a loss is temporary include:
• | the length of time and the extent to which fair value has been below cost; |
• | the severity of the impairment; |
• | the cause of the impairment and the financial condition and near-term prospects of the issuer; |
• | activity in the market of the issuer that may indicate adverse credit conditions; and |
• | the Company's ability and intent to hold the investment for a period of time sufficient to allow for any anticipated recovery. |
The Company's review for impairment generally entails:
• | identification and evaluation of impaired investments; |
• | analysis of individual investments that have fair values less than amortized cost, including consideration of the length of time the investment has been in an unrealized loss position and the expected recovery period; |
• | consideration of evidential matter, including an evaluation of factors or triggers that could cause individual investments to qualify as having other-than-temporary impairment and those that would not support other-than-temporary impairment; and |
• | documentation of the results of these analyses, as required under business policies. |
Debt Securities
The entire difference between amortized cost basis and fair value is recognized in earnings as OTTI for impaired debt securities that the Company has an intent to sell or for which the Company believes it will more-likely-than-not be required to sell prior to recovery of the amortized cost basis. However, for those securities that the Company does not intend to sell and is not likely to be required to sell, only the credit-related impairment is recognized in earnings and any non-credit-related impairment is recorded in AOCI.
For debt securities, credit impairment exists where management does not expect to receive contractual principal and interest cash flows sufficient to recover the entire amortized cost basis of a security.
Equity Securities
For equity securities, management considers the various factors described above, including its intent and ability to hold the equity security for a period of time sufficient for recovery to cost or whether it is more-likely-than-not that the Company will be required to sell the security prior to recovery of its cost basis. Where management lacks that intent or ability, the security's decline in fair value is deemed to be other-than-temporary and is recorded in earnings. AFS equity securities deemed to be other-than-temporarily impaired are written down to fair value, with the full difference between fair value and cost recognized in earnings.
Management assesses equity method investments that have fair values that are less than their respective carrying values for OTTI. Fair value is measured as price multiplied by quantity if the investee has publicly listed securities. If the investee is not publicly listed, other methods are used (see Note 22 to the Consolidated Financial Statements).
For impaired equity method investments that Citi plans to sell prior to recovery of value or would likely be required to sell, with no expectation that the fair value will recover prior to the expected sale date, the full impairment is recognized in earnings as OTTI regardless of severity and duration. The measurement of the OTTI does not include partial projected recoveries subsequent to the balance sheet date.
For impaired equity method investments that management does not plan to sell and is not likely to be required to sell prior to recovery of value, the evaluation of whether an impairment is other-than-temporary is based on (i) whether and when an equity method investment will recover in value and (ii) whether the investor has the intent and ability to hold that investment for a period of time sufficient to recover the value. The determination of whether the impairment is considered other-than-temporary considers the following indicators, regardless of the time and extent of impairment:
• | the cause of the impairment and the financial condition and near-term prospects of the issuer, including any specific events that may influence the operations of the issuer; |
• | the intent and ability to hold the investment for a period of time sufficient to allow for any anticipated recovery in market value; and |
• | the length of time and extent to which fair value has been less than the carrying value. |
128
The sections below describe the Company's process for identifying credit-related impairments for security types that have the most significant unrealized losses as of June 30, 2017.
Mortgage-Backed Securities
For U.S. mortgage-backed securities (and in particular for Alt-A and other mortgage-backed securities that have significant unrealized losses as a percentage of amortized cost), credit impairment is assessed using a cash flow model that estimates the principal and interest cash flows on the underlying mortgages using the security-specific collateral and transaction structure. The model distributes the estimated cash flows to the various tranches of securities, considering the transaction structure and any subordination and credit enhancements that exist in that structure. The cash flow model incorporates actual cash flows on the mortgage-backed securities through the current period and then estimates the remaining cash flows using a number of assumptions, including default rates, prepayment rates, recovery rates (on foreclosed properties) and loss severity rates (on non-agency mortgage-backed securities).
Management develops specific assumptions using market data, internal estimates and estimates published by rating agencies and other third-party sources. Default rates are projected by considering current underlying mortgage loan performance, generally assuming the default of (i) 10% of current loans, (ii) 25% of 30–59 day delinquent loans, (iii) 70% of 60–90 day delinquent loans and (iv) 100% of 91+ day delinquent loans. These estimates are extrapolated along a default timing curve to estimate the total lifetime pool default rate. Other assumptions contemplate the actual collateral
attributes, including geographic concentrations, rating actions and current market prices.
Cash flow projections are developed using different stress test scenarios. Management evaluates the results of those stress tests (including the severity of any cash shortfall indicated and the likelihood of the stress scenarios actually occurring based on the underlying pool's characteristics and performance) to assess whether management expects to recover the amortized cost basis of the security. If cash flow projections indicate that the Company does not expect to recover its amortized cost basis, the Company recognizes the estimated credit loss in earnings.
State and Municipal Securities
The process for identifying credit impairments in Citigroup's AFS and HTM state and municipal bonds is primarily based on a credit analysis that incorporates third-party credit ratings. Citigroup monitors the bond issuers and any insurers providing default protection in the form of financial guarantee insurance. The average external credit rating, ignoring any insurance, is Aa3/AA-. In the event of an external rating downgrade or other indicator of credit impairment (i.e., based on instrument-specific estimates of cash flows or probability of issuer default), the subject bond is specifically reviewed for adverse changes in the amount or timing of expected contractual principal and interest payments.
For state and municipal bonds with unrealized losses that Citigroup plans to sell, or would be more-likely-than-not required to sell, the full impairment is recognized in earnings.
Recognition and Measurement of OTTI
The following tables present total OTTI recognized in earnings:
OTTI on Investments and Other assets | Three Months Ended June 30, 2017 | Six Months Ended June 30, 2017 | ||||||||||||||||||||||
In millions of dollars | AFS (1) | HTM | Other | Total | AFS (1)(2) | HTM | Other Assets | Total | ||||||||||||||||
Impairment losses related to securities that the Company does not intend to sell nor will likely be required to sell: |
|
|
|
|
|
|
|
| ||||||||||||||||
Total OTTI losses recognized during the period | $ | - | | $ | - | | $ | - | | $ | - | | $ | - | | $ | - | | $ | - | | $ | - | |
Less: portion of impairment loss recognized in AOCI (before taxes) | - | | - | | - | | - | | - | | - | | - | | - | | ||||||||
Net impairment losses recognized in earnings for securities that the Company does not intend to sell nor will likely be required to sell | $ | - | | $ | - | | $ | - | | $ | - | | $ | - | | $ | - | | $ | - | | $ | - | |
Impairment losses recognized in earnings for securities that the Company intends to sell, would be more likely than not required to sell or will be subject to an issuer call deemed probable of exercise | 20 | | - | | - | | 20 | | 31 | | 1 | | - | | 32 | | ||||||||
Total impairment losses recognized in earnings | $ | 20 | | $ | - | | $ | - | | $ | 20 | | $ | 31 | | $ | 1 | | $ | - | | $ | 32 | |
(1) | Includes OTTI on non-marketable equity securities. |
129
OTTI on Investments and Other assets | Three months ended June 30, 2016 | Six Months Ended June 30, 2016 | ||||||||||||||||||||||
In millions of dollars | AFS (1) | HTM | Other | Total | AFS (1)(2) | HTM | Other | Total | ||||||||||||||||
Impairment losses related to securities that the Company does not intend to sell nor will likely be required to sell: |
|
|
|
|
|
|
|
| ||||||||||||||||
Total OTTI losses recognized during the period | $ | 2 | | $ | 1 | | $ | - | | $ | 3 | | $ | 3 | | $ | 1 | | $ | - | | $ | 4 | |
Less: portion of impairment loss recognized in AOCI (before taxes) | - | | - | | - | | - | | - | | - | | - | | - | | ||||||||
Net impairment losses recognized in earnings for securities that the Company does not intend to sell nor will likely be required to sell | $ | 2 | | $ | 1 | | $ | - | | $ | 3 | | $ | 3 | | $ | 1 | | $ | - | | $ | 4 | |
Impairment losses recognized in earnings for securities that the Company intends to sell, would be more likely than not required to sell or will be subject to an issuer call deemed probable of exercise and FX losses | 28 | | 17 | | 70 | | 115 | | 223 | | 24 | | 332 | | 579 | | ||||||||
Total impairment losses recognized in earnings | $ | 30 | | $ | 18 | | $ | 70 | | $ | 118 | | $ | 226 | | $ | 25 | | $ | 332 | | $ | 583 | |
(1) | Includes OTTI on non-marketable equity securities. |
(2) | Includes a $160 million impairment related to AFS securities affected by changes in the Venezuela exchange rate during the six months ended June 30, 2016 . |
(3) | The impairment charge is related to the carrying value of an equity investment. |
The following are three-month rollforwards of the credit-related impairments recognized in earnings for AFS and HTM debt securities held that the Company does not intend to sell nor likely will be required to sell:
| Cumulative OTTI credit losses recognized in earnings on securities still held | ||||||||||||||
In millions of dollars | Mar. 31, 2017 balance | Credit | Credit | Reductions due to | June 30, 2017 balance | ||||||||||
AFS debt securities |
|
|
|
|
| ||||||||||
Mortgage-backed securities | $ | - | | $ | - | | $ | - | | $ | - | | $ | - | |
State and municipal | 4 | | - | | - | | - | | 4 | | |||||
Foreign government securities | - | | - | | - | | - | | - | | |||||
Corporate | 4 | | - | | - | | - | | 4 | | |||||
All other debt securities | 22 | | - | | - | | (22 | ) | - | | |||||
Total OTTI credit losses recognized for AFS debt securities | $ | 30 | | $ | - | | $ | - | | $ | (22 | ) | $ | 8 | |
HTM debt securities |
|
|
|
|
| ||||||||||
Mortgage-backed securities (1) | $ | 97 | | $ | - | | $ | - | | $ | - | | $ | 97 | |
State and municipal | 3 | | - | | - | | - | | 3 | | |||||
Total OTTI credit losses recognized for HTM debt securities | $ | 100 | | $ | - | | $ | - | | $ | - | | $ | 100 | |
(1) | Primarily consists of Alt-A securities. |
130
| Cumulative OTTI credit losses recognized in earnings on securities still held | ||||||||||||||
In millions of dollars | Mar. 31, 2016 balance | Credit | Credit | Reductions due to | June 30, 2016 balance | ||||||||||
AFS debt securities |
|
|
|
|
| ||||||||||
Mortgage-backed securities | $ | - | | $ | 1 | | $ | - | | $ | (1 | ) | $ | - | |
State and municipal | 4 | | - | | - | | - | | 4 | | |||||
Foreign government securities | 5 | | - | | - | | - | | 5 | | |||||
Corporate | 7 | | - | | 2 | | (2 | ) | 7 | | |||||
All other debt securities | 43 | | - | | - | | - | | 43 | | |||||
Total OTTI credit losses recognized for AFS debt securities | $ | 59 | | $ | 1 | | $ | 2 | | $ | (3 | ) | $ | 59 | |
HTM debt securities |
|
|
|
|
| ||||||||||
Mortgage-backed securities (1) | $ | 132 | | $ | - | | $ | - | | $ | (24 | ) | $ | 108 | |
State and municipal | 4 | | 1 | | - | | (1 | ) | 4 | | |||||
Total OTTI credit losses recognized for HTM debt securities | $ | 136 | | $ | 1 | | $ | - | | $ | (25 | ) | $ | 112 | |
(1) | Primarily consists of Alt-A securities. |
The following are six-month rollforwards of the credit-related impairments recognized in earnings for AFS and HTM debt securities held that the Company does not intend to sell nor likely will be required to sell:
| Cumulative OTTI credit losses recognized in earnings on securities still held | ||||||||||||||
In millions of dollars | Dec. 31, 2016 balance | Credit | Credit | Reductions due to | June 30, 2017 balance | ||||||||||
AFS debt securities |
|
|
|
|
| ||||||||||
Mortgage-backed securities | $ | - | | $ | - | | $ | - | | $ | - | | $ | - | |
State and municipal | 4 | | - | | - | | - | | 4 | | |||||
Foreign government securities | - | | - | | - | | - | | - | | |||||
Corporate | 5 | | - | | - | | (1 | ) | 4 | | |||||
All other debt securities | 22 | | - | | - | | (22 | ) | - | | |||||
Total OTTI credit losses recognized for AFS debt securities | $ | 31 | | $ | - | | $ | - | | $ | (23 | ) | $ | 8 | |
HTM debt securities |
|
|
|
|
| ||||||||||
Mortgage-backed securities (1) | $ | 101 | | $ | - | | $ | - | | $ | (4 | ) | $ | 97 | |
State and municipal | 3 | | - | | - | | - | | 3 | | |||||
Total OTTI credit losses recognized for HTM debt securities | $ | 104 | | $ | - | | $ | - | | $ | (4 | ) | $ | 100 | |
(1) | Primarily consists of Alt-A securities. |
131
| Cumulative OTTI credit losses recognized in earnings on securities still held | ||||||||||||||
In millions of dollars | Dec. 31, 2015 balance | Credit | Credit | Reductions due to | Jun. 30, 2016 balance | ||||||||||
AFS debt securities |
|
|
|
|
| ||||||||||
Mortgage-backed securities | $ | - | | $ | 1 | | $ | - | | $ | (1 | ) | $ | - | |
State and municipal | 12 | | - | | - | | (8 | ) | 4 | | |||||
Foreign government securities | 5 | | - | | - | | - | | 5 | | |||||
Corporate | 9 | | 1 | | - | | (3 | ) | 7 | | |||||
All other debt securities | 47 | | - | | - | | (4 | ) | 43 | | |||||
Total OTTI credit losses recognized for AFS debt securities | $ | 73 | | $ | 2 | | $ | - | | $ | (16 | ) | $ | 59 | |
HTM debt securities |
|
|
|
|
| ||||||||||
Mortgage-backed securities (1) | $ | 132 | | $ | - | | $ | - | | $ | (24 | ) | $ | 108 | |
State and municipal | 4 | | 1 | | - | | (1 | ) | 4 | | |||||
Total OTTI credit losses recognized for HTM debt securities | $ | 136 | | $ | 1 | | $ | - | | $ | (25 | ) | $ | 112 | |
(1) | Primarily consists of Alt-A securities. |
Investments in Alternative Investment Funds That Calculate Net Asset Value
The Company holds investments in certain alternative investment funds that calculate net asset value (NAV), or its equivalent, including hedge funds, private equity funds, funds of funds and real estate funds, as provided by third-party asset managers. Investments in such funds are generally classified as non-marketable equity securities carried at fair value. The fair values of these investments are estimated using the NAV of the Company's ownership interest in the funds. Some of these investments are in "covered funds" for purposes of the Volcker
Rule, which prohibits certain proprietary investment activities and limits the ownership of, and relationships with, covered funds. On April 21, 2017, Citi's request for extension of the permitted holding period under the Volcker Rule for certain of its investments in illiquid funds was approved, allowing the Company to hold such investments until the earlier of 5 years from the July 21, 2017 expiration date of the general conformance period, or the date such investments mature or are otherwise conformed with the Volcker Rule.
| Fair value | Unfunded | Redemption frequency (if currently eligible) monthly, quarterly, annually | Redemption notice period | ||||||||||
In millions of dollars | June 30, | December 31, 2016 | June 30, | December 31, 2016 |
|
| ||||||||
Hedge funds | $ | 1 | | $ | 4 | | $ | - | | $ | - | | Generally quarterly | 10–95 days |
Private equity funds (1)(2) | 374 | | 348 | | 82 | | 82 | | - | - | ||||
Real estate funds (2)(3) | 41 | | 56 | | 21 | | 20 | | - | - | ||||
Total | $ | 416 | | $ | 408 | | $ | 103 | | $ | 102 | | - | - |
(1) | Private equity funds include funds that invest in infrastructure, emerging markets and venture capital. |
(2) | With respect to the Company's investments in private equity funds and real estate funds, distributions from each fund will be received as the underlying assets held by these funds are liquidated. It is estimated that the underlying assets of these funds will be liquidated over a period of several years as market conditions allow. Private equity and real estate funds do not allow redemption of investments by their investors. Investors are permitted to sell or transfer their investments, subject to the approval of the general partner or investment manager of these funds, which generally may not be unreasonably withheld. |
(3) | Includes several real estate funds that invest primarily in commercial real estate in the U.S., Europe and Asia. |
132
13. LOANS
Citigroup loans are reported in two categories-consumer and corporate. These categories are classified primarily according to the segment and subsegment that manage the loans. For additional information regarding Citi's consumer and corporate loans, including related accounting policies, see Note 14 to the Consolidated Financial Statements in Citi's 2016 Annual Report on Form 10-K.
Consumer Loans
Consumer loans represent loans and leases managed primarily by GCB and Corporate/Other . The following table provides Citi's consumer loans by loan type:
In millions of dollars | June 30, 2017 | December 31, 2016 | ||||
In U.S. offices |
|
| ||||
Mortgage and real estate (1) | $ | 69,022 | | $ | 72,957 | |
Installment, revolving credit and other | 3,190 | | 3,395 | | ||
Cards | 130,181 | | 132,654 | | ||
Commercial and industrial | 7,404 | | 7,159 | | ||
| $ | 209,797 | | $ | 216,165 | |
In offices outside the U.S. |
|
| ||||
Mortgage and real estate (1) | $ | 43,821 | | $ | 42,803 | |
Installment, revolving credit and other | 26,480 | | 24,887 | | ||
Cards | 25,376 | | 23,783 | | ||
Commercial and industrial | 18,956 | | 16,568 | | ||
Lease financing | 81 | | 81 | | ||
| $ | 114,714 | | $ | 108,122 | |
Total consumer loans | $ | 324,511 | | $ | 324,287 | |
Net unearned income | $ | 750 | | $ | 776 | |
Consumer loans, net of unearned income | $ | 325,261 | | $ | 325,063 | |
(1) | Loans secured primarily by real estate. |
The Company sold and/or reclassified to held-for-sale $0.6 billion and $2.8 billion , $2.1 billion and $4.7 billion of consumer loans during the three and six months ended June 30, 2017 and 2016 , respectively.
133
In millions of dollars | Total current (1)(2) | 30–89 days past due (3) | ≥ 90 days past due (3) | Past due government guaranteed (4) | Total loans (2) | Total non-accrual | 90 days past due and accruing | ||||||||||||||
In North America offices |
|
|
|
|
|
|
| ||||||||||||||
Residential first mortgages (5) | $ | 49,255 | | $ | 438 | | $ | 260 | | $ | 1,301 | | $ | 51,254 | | $ | 654 | | $ | 1,035 | |
Home equity loans (6)(7) | 15,862 | | 213 | | 373 | | - | | 16,448 | | 796 | | - | | |||||||
Credit cards | 128,173 | | 1,349 | | 1,352 | | - | | 130,874 | | - | | 1,352 | | |||||||
Installment and other | 3,475 | | 42 | | 14 | | - | | 3,531 | | 19 | | - | | |||||||
Commercial banking | 9,149 | | 8 | | 46 | | - | | 9,203 | | 285 | | 11 | | |||||||
Total | $ | 205,914 | | $ | 2,050 | | $ | 2,045 | | $ | 1,301 | | $ | 211,310 | | $ | 1,754 | | $ | 2,398 | |
In offices outside North America |
|
|
|
|
|
|
| ||||||||||||||
Residential first mortgages (5) | $ | 36,813 | | $ | 227 | | $ | 157 | | $ | - | | $ | 37,197 | | $ | 412 | | $ | - | |
Credit cards | 23,985 | | 418 | | 370 | | - | | 24,773 | | 313 | | 254 | | |||||||
Installment and other | 24,760 | | 281 | | 128 | | - | | 25,169 | | 165 | | - | | |||||||
Commercial banking | 26,650 | | 76 | | 84 | | - | | 26,810 | | 204 | | - | | |||||||
Total | $ | 112,208 | | $ | 1,002 | | $ | 739 | | $ | - | | $ | 113,949 | | $ | 1,094 | | $ | 254 | |
Total GCB and Corporate/Other consumer | $ | 318,122 | | $ | 3,052 | | $ | 2,784 | | $ | 1,301 | | $ | 325,259 | | $ | 2,848 | | $ | 2,652 | |
Other (8) | 2 | | - | | - | | - | | 2 | | - | | - | | |||||||
Total Citigroup | $ | 318,124 | | $ | 3,052 | | $ | 2,784 | | $ | 1,301 | | $ | 325,261 | | $ | 2,848 | | $ | 2,652 | |
(1) | Loans less than 30 days past due are presented as current. |
(2) | Includes $27 million of residential first mortgages recorded at fair value. |
(3) | Excludes loans guaranteed by U.S. government-sponsored entities. |
(4) | Consists of residential first mortgages that are guaranteed by U.S. government-sponsored entities that are 30–89 days past due of $0.3 billion and 90 days or more past due of $1.0 billion . |
(5) | Includes approximately $0.1 billion of residential first mortgage loans in process of foreclosure. |
(6) | Includes approximately $0.1 billion of home equity loans in process of foreclosure. |
(7) | Fixed-rate home equity loans and loans extended under home equity lines of credit, which are typically in junior lien positions. |
(8) | Represents loans classified as consumer loans on the Consolidated Balance Sheet that are not included in the Corporate/Other consumer credit metrics. |
134
In millions of dollars | Total current (1)(2) | 30–89 days past due (3) | ≥ 90 days past due (3) | Past due government guaranteed (4) | Total loans (2) | Total non-accrual | 90 days past due and accruing | ||||||||||||||
In North America offices |
|
|
|
|
|
|
| ||||||||||||||
Residential first mortgages (5) | $ | 50,766 | | $ | 522 | | $ | 371 | | $ | 1,474 | | $ | 53,133 | | $ | 848 | | $ | 1,227 | |
Home equity loans (6)(7) | 18,767 | | 249 | | 438 | | - | | 19,454 | | 914 | | - | | |||||||
Credit cards | 130,327 | | 1,465 | | 1,509 | | - | | 133,301 | | - | | 1,509 | | |||||||
Installment and other | 4,486 | | 106 | | 38 | | - | | 4,630 | | 70 | | 2 | | |||||||
Commercial banking | 8,876 | | 23 | | 74 | | - | | 8,973 | | 328 | | 14 | | |||||||
Total | $ | 213,222 | | $ | 2,365 | | $ | 2,430 | | $ | 1,474 | | $ | 219,491 | | $ | 2,160 | | $ | 2,752 | |
In offices outside North America |
|
|
|
|
|
|
| ||||||||||||||
Residential first mortgages (5) | $ | 35,862 | | $ | 206 | | $ | 135 | | $ | - | | $ | 36,203 | | $ | 360 | | $ | - | |
Credit cards | 22,363 | | 368 | | 324 | | - | | 23,055 | | 258 | | 239 | | |||||||
Installment and other | 22,683 | | 264 | | 126 | | - | | 23,073 | | 163 | | - | | |||||||
Commercial banking | 23,054 | | 72 | | 112 | | - | | 23,238 | | 217 | | - | | |||||||
Total | $ | 103,962 | | $ | 910 | | $ | 697 | | $ | - | | $ | 105,569 | | $ | 998 | | $ | 239 | |
Total GCB and Corporate/Other consumer | $ | 317,184 | | $ | 3,275 | | $ | 3,127 | | $ | 1,474 | | $ | 325,060 | | $ | 3,158 | | $ | 2,991 | |
Other (8) | 3 | | - | | - | | - | | 3 | | - | | - | | |||||||
Total Citigroup | $ | 317,187 | | $ | 3,275 | | $ | 3,127 | | $ | 1,474 | | $ | 325,063 | | $ | 3,158 | | $ | 2,991 | |
(1) | Loans less than 30 days past due are presented as current. |
(2) | Includes $29 million of residential first mortgages recorded at fair value. |
(3) | Excludes loans guaranteed by U.S. government-sponsored entities. |
(4) | Consists of residential first mortgages that are guaranteed by U.S. government-sponsored entities that are 30–89 days past due of $0.2 billion and 90 days or more past due of $1.3 billion . |
(5) | Includes approximately $0.1 billion of residential first mortgage loans in process of foreclosure. |
(6) | Includes approximately $0.1 billion of home equity loans in process of foreclosure. |
(7) | Fixed-rate home equity loans and loans extended under home equity lines of credit, which are typically in junior lien positions. |
(8) | Represents loans classified as consumer loans on the Consolidated Balance Sheet that are not included in the Corporate/Other consumer credit metrics. |
Consumer Credit Scores (FICO)
FICO score distribution in U.S. portfolio (1)(2) | June 30, 2017 | ||||||||
In millions of dollars | Less than 620 | ≥ 620 but less than 660 | Equal to or greater than 660 | ||||||
Residential first mortgages | $ | 2,392 | | $ | 2,195 | | $ | 43,056 | |
Home equity loans | 1,542 | | 1,248 | | 13,263 | | |||
Credit cards | 8,227 | | 11,120 | | 108,311 | | |||
Installment and other | 261 | | 253 | | 2,448 | | |||
Total | $ | 12,422 | | $ | 14,816 | | $ | 167,078 | |
FICO score distribution in U.S. portfolio (1)(2) | December 31, 2016 | ||||||||
In millions of dollars | Less than 620 | ≥ 620 but less than 660 | Equal to or greater than 660 | ||||||
Residential first mortgages | $ | 2,744 | | $ | 2,422 | | $ | 44,279 | |
Home equity loans | 1,750 | | 1,418 | | 14,743 | | |||
Credit cards | 8,310 | | 11,320 | | 110,522 | | |||
Installment and other | 284 | | 271 | | 2,601 | | |||
Total | $ | 13,088 | | $ | 15,431 | | $ | 172,145 | |
(1) | Excludes loans guaranteed by U.S. government entities, loans subject to long-term standby commitments (LTSC) with U.S. government-sponsored entities and loans recorded at fair value. |
(2) | Excludes balances where FICO was not available. Such amounts are not material. |
135
Loan to Value (LTV) Ratios
The following tables provide details on the LTV ratios for Citi's U.S. consumer mortgage portfolios. LTV ratios are updated monthly using the most recent Core Logic Home Price Index data available for substantially all of the portfolio applied at the Metropolitan Statistical Area level, if available, or the state level if not. The remainder of the portfolio is updated in a similar manner using the Federal Housing Finance Agency indices.
LTV distribution in U.S. portfolio (1)(2) | June 30, 2017 | ||||||||
In millions of dollars | Less than or equal to 80% | > 80% but less than or equal to 100% | Greater than 100% | ||||||
Residential first mortgages | $ | 44,740 | | $ | 2,820 | | $ | 262 | |
Home equity loans | 12,177 | | 2,856 | | 937 | | |||
Total | $ | 56,917 | | $ | 5,676 | | $ | 1,199 | |
LTV distribution in U.S. portfolio (1)(2) | December 31, 2016 | ||||||||
In millions of dollars | Less than or equal to 80% | > 80% but less than or equal to 100% | Greater than 100% | ||||||
Residential first mortgages | $ | 45,849 | | $ | 3,467 | | $ | 324 | |
Home equity loans | 12,869 | | 3,653 | | 1,305 | | |||
Total | $ | 58,718 | | $ | 7,120 | | $ | 1,629 | |
(1) | Excludes loans guaranteed by U.S. government entities, loans subject to LTSCs with U.S. government-sponsored entities and loans recorded at fair value. |
(2) | Excludes balances where LTV was not available. Such amounts are not material. |
136
Impaired Consumer Loans
The following tables present information about impaired consumer loans and interest income recognized on impaired consumer loans:
|
|
|
|
| Three Months Ended June 30, | Six Months Ended June 30, | ||||||||||||||||||
| Balance at June 30, 2017 | 2017 | 2016 | 2017 | 2016 | |||||||||||||||||||
In millions of dollars | Recorded investment (1)(2) | Unpaid principal balance | Related specific allowance (3) | Average carrying value (4) | Interest income | Interest income | Interest income recognized (5) | Interest income recognized (5) | ||||||||||||||||
Mortgage and real estate |
|
|
|
|
|
|
|
| ||||||||||||||||
Residential first mortgages | $ | 3,174 | | $ | 3,468 | | $ | 341 | | $ | 3,727 | | $ | 32 | | $ | 43 | | $ | 68 | | $ | 104 | |
Home equity loans | 1,183 | | 1,666 | | 235 | | 1,253 | | 7 | | 9 | | 15 | | 18 | | ||||||||
Credit cards | 1,782 | | 1,816 | | 570 | | 1,796 | | 36 | | 39 | | 73 | | 80 | | ||||||||
Installment and other |
|
|
|
|
|
|
|
| ||||||||||||||||
Individual installment and other | 410 | | 431 | | 180 | | 434 | | 5 | | 7 | | 13 | | 14 | | ||||||||
Commercial banking | 473 | | 700 | | 115 | | 521 | | 8 | | 2 | | 14 | | 4 | | ||||||||
Total | $ | 7,022 | | $ | 8,081 | | $ | 1,441 | | $ | 7,731 | | $ | 88 | | $ | 100 | | $ | 183 | | $ | 220 | |
(1) | Recorded investment in a loan includes net deferred loan fees and costs, unamortized premium or discount and direct write-downs and includes accrued interest only on credit card loans. |
(2) | $648 million of residential first mortgages, $382 million of home equity loans and $83 million of commercial market loans do not have a specific allowance. |
(3) Included in the Allowance for loan losses .
(4) Average carrying value represents the average recorded investment ending balance for the last four quarters and does not include the related specific allowance.
(5) Includes amounts recognized on both an accrual and cash basis.
| Balance, December 31, 2016 | |||||||||||
In millions of dollars | Recorded investment (1)(2) | Unpaid principal balance | Related specific allowance (3) | Average carrying value (4) | ||||||||
Mortgage and real estate |
|
|
|
| ||||||||
Residential first mortgages | $ | 3,786 | | $ | 4,157 | | $ | 540 | | $ | 4,632 | |
Home equity loans | 1,298 | | 1,824 | | 189 | | 1,326 | | ||||
Credit cards | 1,747 | | 1,781 | | 566 | | 1,831 | | ||||
Installment and other |
|
|
|
| ||||||||
Individual installment and other | 455 | | 481 | | 215 | | 475 | | ||||
Commercial banking | 513 | | 744 | | 98 | | 538 | | ||||
Total | $ | 7,799 | | $ | 8,987 | | $ | 1,608 | | $ | 8,802 | |
(1) | Recorded investment in a loan includes net deferred loan fees and costs, unamortized premium or discount and direct write-downs and includes accrued interest only on credit card loans. |
(2) | $740 million of residential first mortgages, $406 million of home equity loans and $97 million of commercial market loans do not have a specific allowance. |
(3) | Included in the Allowance for loan losses . |
(4) | Average carrying value represents the average recorded investment ending balance for the last four quarters and does not include the related specific allowance. |
137
Consumer Troubled Debt Restructurings
| At and for the three months ended June 30, 2017 | |||||||||||||||
In millions of dollars except number of loans modified | Number of | Post- | Deferred | Contingent | Principal | Average | ||||||||||
North America |
|
|
|
|
|
| ||||||||||
Residential first mortgages | 806 | | $ | 116 | | $ | 1 | | $ | - | | $ | 1 | | 1 | % |
Home equity loans | 677 | | 58 | | 5 | | - | | - | | 2 | | ||||
Credit cards | 53,080 | | 203 | | - | | - | | - | | 17 | | ||||
Installment and other revolving | 250 | | 2 | | - | | - | | - | | 5 | | ||||
Commercial banking (6) | 30 | | 43 | | - | | - | | - | | - | | ||||
Total (8) | 54,843 | | $ | 422 | | $ | 6 | | $ | - | | $ | 1 | | | |
International |
|
|
|
|
|
| ||||||||||
Residential first mortgages | 755 | | $ | 28 | | $ | - | | $ | - | | $ | - | | - | % |
Credit cards | 28,551 | | 98 | | - | | - | | 2 | | 12 | | ||||
Installment and other revolving | 11,622 | | 64 | | - | | - | | 2 | | 9 | | ||||
Commercial banking (6) | 53 | | 6 | | - | | - | | - | | - | | ||||
Total (8) | 40,981 | | $ | 196 | | $ | - | | $ | - | | $ | 4 | | | |
| At and for the three months ended June 30, 2016 | |||||||||||||||
In millions of dollars except number of loans modified | Number of loans modified | Post- modification recorded investment (1)(7) | Deferred principal (3) | Contingent principal forgiveness (4) | Principal forgiveness (5) | Average interest rate reduction | ||||||||||
North America |
|
|
|
|
|
| ||||||||||
Residential first mortgages | 1,346 | | $ | 205 | | $ | 1 | | $ | - | | $ | 1 | | 1 | % |
Home equity loans | 814 | | 30 | | - | | - | | - | | 3 | | ||||
Credit cards | 42,792 | | 164 | | - | | - | | - | | 17 | | ||||
Installment and other revolving | 1,381 | | 12 | | - | | - | | - | | 14 | | ||||
Commercial banking (6) | 41 | | 6 | | - | | - | | - | | - | | ||||
Total (8) | 46,374 | | $ | 417 | | $ | 1 | | $ | - | | $ | 1 | |
| |
International |
|
|
|
|
|
| ||||||||||
Residential first mortgages | 613 | | $ | 23 | | $ | - | | $ | - | | $ | - | | 1 | % |
Credit cards | 28,628 | | 90 | | - | | - | | 2 | | 12 | | ||||
Installment and other revolving | 11,198 | | 58 | | - | | - | | 2 | | 7 | | ||||
Commercial banking (6) | 42 | | 20 | | - | | - | | - | | - | | ||||
Total (8) | 40,481 | | $ | 191 | | $ | - | | $ | - | | $ | 4 | |
| |
(1) | Post-modification balances include past due amounts that are capitalized at the modification date. |
(2) | Post-modification balances in North America include $ 15 million of residential first mortgages and $ 5 million of home equity loans to borrowers who have gone through Chapter 7 bankruptcy in the three months ended June 30, 2017 . These amounts include $ 11 million of residential first mortgages and $ 4 million of home equity loans that were newly classified as TDRs in the three months ended June 30, 2017 , based on previously received OCC guidance. |
(3) | Represents portion of contractual loan principal that is non-interest bearing, but still due from the borrower. Such deferred principal is charged off at the time of permanent modification to the extent that the related loan balance exceeds the underlying collateral value. |
(4) | Represents portion of contractual loan principal that is non-interest bearing and, depending upon borrower performance, eligible for forgiveness. |
(5) | Represents portion of contractual loan principal that was forgiven at the time of permanent modification. |
(6) Commercial banking loans are generally borrower-specific modifications and incorporate changes in the amount and/or timing of principal and/or interest.
(7) Post-modification balances in North America include $ 21 million of residential first mortgages and $ 4 million of home equity loans to borrowers who have gone through Chapter 7 bankruptcy in the three months ended June 30, 2016 . These amounts include $ 13 million of residential first mortgages and $ 4 million of home equity loans that were newly classified as TDRs in the three months ended June 30, 2016 , based on previously received OCC guidance.
(8) The above tables reflect activity for loans outstanding as of the end of the reporting period that were considered TDRs.
138
| At and for the six months ended June 30, 2017 | |||||||||||||||
In millions of dollars except number of loans modified | Number of loans modified | Post- modification recorded investment (1)(2) | Deferred principal (3) | Contingent principal forgiveness (4) | Principal forgiveness (5) | Average interest rate reduction | ||||||||||
North America |
|
|
|
|
|
| ||||||||||
Residential first mortgages | 1,772 | | $ | 246 | | $ | 4 | | $ | - | | $ | 1 | | 1 | % |
Home equity loans | 1,356 | | 114 | | 8 | | - | | - | | 1 | | ||||
Credit cards | 112,417 | | 433 | | - | | - | | - | | 17 | | ||||
Installment and other revolving | 471 | | 4 | | - | | - | | - | | 5 | | ||||
Commercial banking (6) | 56 | | 48 | | - | | - | | - | | - | | ||||
Total (8) | 116,072 | | $ | 845 | | $ | 12 | | $ | - | | $ | 1 | | | |
International |
|
|
|
|
|
| ||||||||||
Residential first mortgages | 1,368 | | $ | 54 | | $ | - | | $ | - | | $ | - | | - | % |
Credit cards | 53,788 | | 183 | | - | | - | | 4 | | 13 | | ||||
Installment and other revolving | 22,929 | | 124 | | - | | - | | 6 | | 7 | | ||||
Commercial banking (6) | 85 | | 19 | | - | | - | | - | | (1 | ) | ||||
Total (8) | 78,170 | | $ | 380 | | $ | - | | $ | - | | $ | 10 | | | |
| At and for the six months ended June 30, 2016 | |||||||||||||||
In millions of dollars except number of loans modified | Number of loans modified | Post- modification recorded investment (1)(7) | Deferred principal (3) | Contingent principal forgiveness (4) | Principal forgiveness (5) | Average interest rate reduction | ||||||||||
North America |
|
|
|
|
|
| ||||||||||
Residential first mortgages | 2,814 | | $ | 417 | | $ | 3 | | $ | - | | $ | 2 | | 1 | % |
Home equity loans | 1,672 | | 60 | | - | | - | | - | | 3 | | ||||
Credit cards | 91,901 | | 353 | | - | | - | | - | | 17 | | ||||
Installment and other revolving | 2,766 | | 24 | | - | | - | | - | | 14 | | ||||
Commercial banking (6) | 64 | | 11 | | - | | - | | - | | - | | ||||
Total (8) | 99,217 | | $ | 865 | | $ | 3 | | $ | - | | $ | 2 | |
| |
International |
|
|
|
|
|
| ||||||||||
Residential first mortgages | 1,032 | | $ | 38 | | $ | - | | $ | - | | $ | - | | 1 | % |
Credit cards | 80,835 | | 213 | | - | | - | | 4 | | 12 | | ||||
Installment and other revolving | 32,842 | | 140 | | - | | - | | 4 | | 7 | | ||||
Commercial banking (6) | 73 | | 52 | | - | | - | | - | | - | | ||||
Total (8) | 114,782 | | $ | 443 | | $ | - | | $ | - | | $ | 8 | |
| |
(1) | Post-modification balances include past due amounts that are capitalized at the modification date. |
(2) | Post-modification balances in North America include $ 30 million of residential first mortgages and $ 11 million of home equity loans to borrowers who have gone through Chapter 7 bankruptcy in the six months ended June 30, 2017. These amounts include $ 21 million of residential first mortgages and $ 10 million of home equity loans that were newly classified as TDRs in the six months ended June 30, 2017, based on previously received OCC guidance. |
(3) | Represents portion of contractual loan principal that is non-interest bearing but still due from the borrower. Such deferred principal is charged off at the time of permanent modification to the extent that the related loan balance exceeds the underlying collateral value. |
(4) | Represents portion of contractual loan principal that is non-interest bearing and, depending upon borrower performance, eligible for forgiveness. |
(5) | Represents portion of contractual loan principal that was forgiven at the time of permanent modification. |
(6) Commercial banking loans are generally borrower-specific modifications and incorporate changes in the amount and/or timing of principal and/or interest.
(7) Post-modification balances in North America include $ 41 million of residential first mortgages and $ 10 million of home equity loans to borrowers who have gone through Chapter 7 bankruptcy in the six months ended June 30, 2016 . These amounts include $ 26 million of residential first mortgages and $ 9 million of home equity loans that were newly classified as TDRs in the six months ended June 30, 2016 , based on previously received OCC guidance.
(8) The above tables reflect activity for loans outstanding as of the end of the reporting period that were considered TDRs.
139
The following table presents consumer TDRs that defaulted for which the payment default occurred within one year of a permanent modification. Default is defined as 60 days past due, except for classifiably managed commercial banking loans, where default is defined as 90 days past due.
| Three Months Ended June 30, | Six Months Ended June 30, | ||||||||||
In millions of dollars | 2017 | 2016 | 2017 | 2016 | ||||||||
North America |
|
|
|
| ||||||||
Residential first mortgages | $ | 48 | | $ | 52 | | $ | 99 | | $ | 139 | |
Home equity loans | 8 | | 6 | | 17 | | 14 | | ||||
Credit cards | 57 | | 46 | | 109 | | 95 | | ||||
Installment and other revolving | 1 | | 2 | | 1 | | 4 | | ||||
Commercial banking | 1 | | 1 | | 2 | | 2 | | ||||
Total | $ | 115 | | $ | 107 | | $ | 228 | | $ | 254 | |
International |
|
|
|
| ||||||||
Residential first mortgages | $ | 3 | | $ | 3 | | $ | 5 | | $ | 6 | |
Credit cards | 46 | | 37 | | 88 | | 73 | | ||||
Installment and other revolving | 23 | | 24 | | 46 | | 47 | | ||||
Commercial banking | - | | 6 | | - | | 15 | | ||||
Total | $ | 72 | | $ | 70 | | $ | 139 | | $ | 141 | |
Corporate Loans
Corporate loans represent loans and leases managed by ICG . The following table presents information by corporate loan type:
In millions of dollars | June 30, | December 31, | ||||
In U.S. offices |
|
| ||||
Commercial and industrial | $ | 50,341 | | $ | 49,586 | |
Financial institutions | 36,953 | | 35,517 | | ||
Mortgage and real estate (1) | 42,041 | | 38,691 | | ||
Installment, revolving credit and other | 31,611 | | 34,501 | | ||
Lease financing | 1,467 | | 1,518 | | ||
| $ | 162,413 | | $ | 159,813 | |
In offices outside the U.S. |
|
| ||||
Commercial and industrial | $ | 91,131 | | $ | 81,882 | |
Financial institutions | 34,844 | | 26,886 | | ||
Mortgage and real estate (1) | 6,783 | | 5,363 | | ||
Installment, revolving credit and other | 19,200 | | 19,965 | | ||
Lease financing | 234 | | 251 | | ||
Governments and official institutions | 5,518 | | 5,850 | | ||
| $ | 157,710 | | $ | 140,197 | |
Total corporate loans | $ | 320,123 | | $ | 300,010 | |
Net unearned income | $ | (689 | ) | $ | (704 | ) |
Corporate loans, net of unearned income | $ | 319,434 | | $ | 299,306 | |
(1) | Loans secured primarily by real estate. |
The Company sold and/or reclassified to held-for-sale $0 billion and $0.5 billion of corporate loans during the three and six months ended June 30, 2017 , respectively, and $0.8 billion and $1.3 billion during the three and six months ended June 30, 2016, respectively. The Company did not have significant purchases of corporate loans classified as held-for-investment for the three and six months ended June 30, 2017 or 2016 .
140
In millions of dollars | 30–89 days past due and accruing (1) | ≥ 90 days past due and accruing (1) | Total past due and accruing | Total non-accrual (2) | Total current (3) | Total loans (4) | ||||||||||||
Commercial and industrial | $ | 233 | | $ | 78 | | $ | 311 | | $ | 1,521 | | $ | 136,229 | | $ | 138,061 | |
Financial institutions | 438 | | 39 | | 477 | | 232 | | 70,355 | | 71,064 | | ||||||
Mortgage and real estate | 146 | | 12 | | 158 | | 186 | | 48,462 | | 48,806 | | ||||||
Leases | 59 | | 8 | | 67 | | 63 | | 1,571 | | 1,701 | | ||||||
Other | 87 | | 15 | | 102 | | 96 | | 55,415 | | 55,613 | | ||||||
Loans at fair value | | | | | | | | | | | 4,189 | | ||||||
Purchased distressed loans | | | | | | | | | | | - | | ||||||
Total | $ | 963 | | $ | 152 | | $ | 1,115 | | $ | 2,098 | | $ | 312,032 | | $ | 319,434 | |
In millions of dollars | 30–89 days past due and accruing (1) | ≥ 90 days past due and accruing (1) | Total past due and accruing | Total non-accrual (2) | Total current (3) | Total loans (4) | ||||||||||||
Commercial and industrial | $ | 143 | | $ | 52 | | $ | 195 | | $ | 1,909 | | $ | 127,012 | | $ | 129,116 | |
Financial institutions | 119 | | 2 | | 121 | | 185 | | 61,254 | | 61,560 | | ||||||
Mortgage and real estate | 148 | | 137 | | 285 | | 139 | | 43,607 | | 44,031 | | ||||||
Leases | 27 | | 8 | | 35 | | 56 | | 1,678 | | 1,769 | | ||||||
Other | 349 | | 12 | | 361 | | 132 | | 58,880 | | 59,373 | | ||||||
Loans at fair value | | | | | | | | | | | 3,457 | | ||||||
Purchased distressed loans | | | | | | | | | | | - | | ||||||
Total | $ | 786 | | $ | 211 | | $ | 997 | | $ | 2,421 | | $ | 292,431 | | $ | 299,306 | |
(1) | Corporate loans that are 90 days past due are generally classified as non-accrual. Corporate loans are considered past due when principal or interest is contractually due but unpaid. |
(2) | Non-accrual loans generally include those loans that are ≥ 90 days past due or those loans for which Citi believes, based on actual experience and a forward-looking assessment of the collectability of the loan in full, that the payment of interest or principal is doubtful. |
(3) | Corporate loans are past due when principal or interest is contractually due but unpaid. Loans less than 30 days past due are presented as current. |
(4) | Total loans include loans at fair value, which are not included in the various delinquency columns. |
141
Corporate Loans Credit Quality Indicators
| Recorded investment in loans (1) | |||||
In millions of dollars | June 30, | December 31, | ||||
Investment grade (2) |
|
| ||||
Commercial and industrial | $ | 94,073 | | $ | 85,369 | |
Financial institutions | 56,572 | | 49,915 | | ||
Mortgage and real estate | 22,413 | | 18,718 | | ||
Leases | 1,104 | | 1,303 | | ||
Other | 48,691 | | 51,930 | | ||
Total investment grade | $ | 222,853 | | $ | 207,235 | |
Non-investment grade (2) |
|
| ||||
Accrual |
|
| ||||
Commercial and industrial | $ | 42,463 | | $ | 41,838 | |
Financial institutions | 14,260 | | 11,459 | | ||
Mortgage and real estate | 1,952 | | 1,821 | | ||
Leases | 534 | | 410 | | ||
Other | 6,827 | | 7,312 | | ||
Non-accrual |
|
| ||||
Commercial and industrial | 1,521 | | 1,909 | | ||
Financial institutions | 232 | | 185 | | ||
Mortgage and real estate | 186 | | 139 | | ||
Leases | 63 | | 56 | | ||
Other | 96 | | 132 | | ||
Total non-investment grade | $ | 68,134 | | $ | 65,261 | |
Non-rated private bank loans managed on a delinquency basis (2) | $ | 24,258 | | $ | 23,353 | |
Loans at fair value | 4,189 | | 3,457 | | ||
Corporate loans, net of unearned income | $ | 319,434 | | $ | 299,306 | |
(1) | Recorded investment in a loan includes net deferred loan fees and costs, unamortized premium or discount, less any direct write-downs. |
(2) | Held-for-investment loans are accounted for on an amortized cost basis. |
142
Non-Accrual Corporate Loans
The following tables present non-accrual loan information by corporate loan type and interest income recognized on non-accrual corporate loans:
| June 30, 2017 | Three Months Ended June 30, 2017 | Six Months Ended June 30, 2017 | |||||||||||||||
In millions of dollars | Recorded investment (1) | Unpaid principal balance | Related specific allowance | Average carrying value (2) | Interest income recognized (3) | Interest income recognized (3) | ||||||||||||
Non-accrual corporate loans |
|
|
|
|
|
| ||||||||||||
Commercial and industrial | $ | 1,521 | | $ | 1,739 | | $ | 300 | | $ | 1,766 | | $ | 8 | | $ | 10 | |
Financial institutions | 232 | | 238 | | 36 | | 227 | | - | | - | | ||||||
Mortgage and real estate | 186 | | 304 | | 9 | | 169 | | 9 | | 9 | | ||||||
Lease financing | 63 | | 63 | | 4 | | 61 | | - | | - | | ||||||
Other | 96 | | 248 | | 5 | | 96 | | - | | - | | ||||||
Total non-accrual corporate loans | $ | 2,098 | | $ | 2,592 | | $ | 354 | | $ | 2,319 | | $ | 17 | | $ | 19 | |
| December 31, 2016 | |||||||||||
In millions of dollars | Recorded investment (1) | Unpaid principal balance | Related specific allowance | Average carrying value (2) | ||||||||
Non-accrual corporate loans |
|
|
|
| ||||||||
Commercial and industrial | $ | 1,909 | | $ | 2,259 | | $ | 362 | | $ | 1,919 | |
Financial institutions | 185 | | 192 | | 16 | | 183 | | ||||
Mortgage and real estate | 139 | | 250 | | 10 | | 174 | | ||||
Lease financing | 56 | | 56 | | 4 | | 44 | | ||||
Other | 132 | | 197 | | - | | 87 | | ||||
Total non-accrual corporate loans | $ | 2,421 | | $ | 2,954 | | $ | 392 | | $ | 2,407 | |
| June 30, 2017 | December 31, 2016 | ||||||||||
In millions of dollars | Recorded investment (1) | Related specific allowance | Recorded investment (1) | Related specific allowance | ||||||||
Non-accrual corporate loans with valuation allowances |
|
|
|
| ||||||||
Commercial and industrial | $ | 979 | | $ | 300 | | $ | 1,343 | | $ | 362 | |
Financial institutions | 83 | | 36 | | 45 | | 16 | | ||||
Mortgage and real estate | 39 | | 9 | | 41 | | 10 | | ||||
Lease financing | 50 | | 4 | | 55 | | 4 | | ||||
Other | 4 | | 5 | | 1 | | - | | ||||
Total non-accrual corporate loans with specific allowance | $ | 1,155 | | $ | 354 | | $ | 1,485 | | $ | 392 | |
Non-accrual corporate loans without specific allowance |
|
|
|
| ||||||||
Commercial and industrial | $ | 542 | |
| | $ | 566 | |
| | ||
Financial institutions | 149 | |
| | 140 | |
| | ||||
Mortgage and real estate | 147 | |
| | 98 | |
| | ||||
Lease financing | 13 | |
| | 1 | |
| | ||||
Other | 92 | |
| | 131 | |
| | ||||
Total non-accrual corporate loans without specific allowance | $ | 943 | | N/A | | $ | 936 | | N/A | | ||
(1) | Recorded investment in a loan includes net deferred loan fees and costs, unamortized premium or discount, less any direct write-downs. |
(2) | Average carrying value represents the average recorded investment balance and does not include related specific allowance. |
(3) | Interest income recognized for the three- and six-month periods ended June 30, 2016 was $12 million and $25 million . |
143
Corporate Troubled Debt Restructurings
In millions of dollars | Carrying Value | TDRs involving changes in the amount and/or timing of principal payments (1) | TDRs involving changes in the amount and/or timing of interest payments (2) | TDRs involving changes in the amount and/or timing of both principal and interest payments | ||||||||
Commercial and industrial | $ | 233 | | $ | 32 | | $ | - | | $ | 201 | |
Mortgage and real estate | 3 | | - | | - | | 3 | | ||||
Total | $ | 236 | | $ | 32 | | $ | - | | $ | 204 | |
In millions of dollars | Carrying Value | TDRs involving changes in the amount and/or timing of principal payments (1) | TDRs involving changes in the amount and/or timing of interest payments (2) | TDRs involving changes in the amount and/or timing of both principal and interest payments | ||||||||
Commercial and industrial | $ | 105 | | $ | 73 | | $ | 32 | | $ | - | |
Mortgage and real estate | 1 | | - | | - | | 1 | | ||||
Other | 142 | | - | | 142 | | - | | ||||
Total | $ | 248 | | $ | 73 | | $ | 174 | | $ | 1 | |
In millions of dollars | Carrying Value | TDRs involving changes in the amount and/or timing of principal payments (1) | TDRs involving changes in the amount and/or timing of interest payments (2) | TDRs involving changes in the amount and/or timing of both principal and interest payments | ||||||||
Commercial and industrial | $ | 288 | | $ | 32 | | $ | - | | $ | 256 | |
Financial institutions | 15 | | - | | - | | 15 | | ||||
Mortgage and real estate | 4 | | - | | - | | 4 | | ||||
Total | $ | 307 | | $ | 32 | | $ | - | | $ | 275 | |
In millions of dollars | Carrying Value | TDRs involving changes in the amount and/or timing of principal payments (1) | TDRs involving changes in the amount and/or timing of interest payments (2) | TDRs involving changes in the amount and/or timing of both principal and interest payments | ||||||||
Commercial and industrial | $ | 203 | | $ | 73 | | $ | 32 | | $ | 98 | |
Mortgage and real estate | 5 | | - | | - | | 5 | | ||||
Other | 142 | | - | | 142 | | - | | ||||
Total | $ | 350 | | $ | 73 | | $ | 174 | | $ | 103 | |
(1) | TDRs involving changes in the amount or timing of principal payments may involve principal forgiveness or deferral of periodic and/or final principal payments. Because forgiveness of principal is rare for corporate loans, modifications typically have little to no impact on the loans' projected cash flows and thus little to no impact on the allowance established for the loans. Charge-offs for amounts deemed uncollectable may be recorded at the time of the restructuring or may have already been recorded in prior periods such that no charge-off is required at the time of the modification. |
(2) | TDRs involving changes in the amount or timing of interest payments may involve a below-market interest rate. |
144
In millions of dollars | TDR balances at June 30, 2017 | TDR loans in payment default during the three months ended June 30, 2017 | TDR loans in payment default six months ended June 30, 2017 | TDR balances at June 30, 2016 | TDR loans in payment default during the three months ended June 30, 2016 | TDR loans in payment default during the six months ended | ||||||||||||
Commercial and industrial | $ | 591 | | $ | 3 | | $ | 12 | | $ | 323 | | $ | 7 | | $ | 7 | |
Loans to financial institutions | 24 | | - | | 3 | | - | | - | | - | | ||||||
Mortgage and real estate | 74 | | - | | - | | 130 | | - | | - | | ||||||
Other | 166 | | - | | - | | 288 | | - | | - | | ||||||
Total (1) | $ | 855 | | $ | 3 | | $ | 15 | | $ | 741 | | $ | 7 | | $ | 7 | |
(1) | The above tables reflect activity for loans outstanding as of the end of the reporting period that were considered TDRs. |
145
14. ALLOWANCE FOR CREDIT LOSSES
| Three Months Ended June 30, | Six Months Ended June 30, | ||||||||||
In millions of dollars | 2017 | 2016 | 2017 | 2016 | ||||||||
Allowance for loan losses at beginning of period | $ | 12,030 | | $ | 12,712 | | $ | 12,060 | | $ | 12,626 | |
Gross credit losses | (2,130 | ) | (2,048 | ) | (4,274 | ) | (4,191 | ) | ||||
Gross recoveries (1) | 420 | | 432 | | 855 | | 851 | | ||||
Net credit losses (NCLs) | $ | (1,710 | ) | $ | (1,616 | ) | $ | (3,419 | ) | $ | (3,340 | ) |
NCLs | $ | 1,710 | | $ | 1,616 | | $ | 3,419 | | $ | 3,340 | |
Net reserve builds (releases) | 67 | | (90 | ) | 47 | | (48 | ) | ||||
Net specific reserve releases | (111 | ) | (136 | ) | (125 | ) | (16 | ) | ||||
Total provision for loan losses | $ | 1,666 | | $ | 1,390 | | $ | 3,341 | | $ | 3,276 | |
Other, net (see table below) | 39 | | (182 | ) | 43 | | (258 | ) | ||||
Allowance for loan losses at end of period | $ | 12,025 | | $ | 12,304 | | $ | 12,025 | | $ | 12,304 | |
Allowance for credit losses on unfunded lending commitments at beginning of period | $ | 1,377 | | $ | 1,473 | | $ | 1,418 | | $ | 1,402 | |
Provision (release) for unfunded lending commitments | 28 | | (30 | ) | (15 | ) | 41 | | ||||
Other, net | 1 | | (11 | ) | 3 | | (11 | ) | ||||
Allowance for credit losses on unfunded lending commitments at end of period (2) | $ | 1,406 | | $ | 1,432 | | $ | 1,406 | | $ | 1,432 | |
Total allowance for loans, leases and unfunded lending commitments | $ | 13,431 | | $ | 13,736 | | $ | 13,431 | | $ | 13,736 | |
(1) | Recoveries have been reduced by certain collection costs that are incurred only if collection efforts are successful. |
(2) | Represents additional credit loss reserves for unfunded lending commitments and letters of credit recorded in Other liabilities on the Consolidated Balance Sheet. |
Other, net details | Three Months Ended June 30, | Six Months Ended June 30, | ||||||||||
In millions of dollars | 2017 | 2016 | 2017 | 2016 | ||||||||
Sales or transfers of various consumer loan portfolios to held-for-sale |
|
|
|
| ||||||||
Transfer of real estate loan portfolios | $ | (19 | ) | $ | (24 | ) | $ | (56 | ) | $ | (53 | ) |
Transfer of other loan portfolios | - | | (77 | ) | (124 | ) | (196 | ) | ||||
Sales or transfers of various consumer loan portfolios to held-for-sale | $ | (19 | ) | $ | (101 | ) | $ | (180 | ) | $ | (249 | ) |
FX translation, consumer | 50 | | (75 | ) | 214 | | (12 | ) | ||||
Other | 8 | | (6 | ) | 9 | | 3 | | ||||
Other, net | $ | 39 | | $ | (182 | ) | $ | 43 | | $ | (258 | ) |
Allowance for Credit Losses and Investment in Loans
| Three Months Ended | |||||||||||||||||
| June 30, 2017 | June 30, 2016 | ||||||||||||||||
In millions of dollars | Corporate | Consumer | Total | Corporate | Consumer | Total | ||||||||||||
Allowance for loan losses at beginning of period | $ | 2,535 | | $ | 9,495 | | $ | 12,030 | | $ | 2,905 | | $ | 9,807 | | $ | 12,712 | |
Charge-offs | (96 | ) | (2,034 | ) | (2,130 | ) | (157 | ) | (1,891 | ) | (2,048 | ) | ||||||
Recoveries | 19 | | 401 | | 420 | | 16 | | 416 | | 432 | | ||||||
Replenishment of net charge-offs | 77 | | 1,633 | | 1,710 | | 141 | | 1,475 | | 1,616 | | ||||||
Net reserve builds (releases) | (4 | ) | 71 | | 67 | | (16 | ) | (74 | ) | (90 | ) | ||||||
Net specific reserve releases | (27 | ) | (84 | ) | (111 | ) | (11 | ) | (125 | ) | (136 | ) | ||||||
Other | 6 | | 33 | | 39 | | (6 | ) | (176 | ) | (182 | ) | ||||||
Ending balance | $ | 2,510 | | $ | 9,515 | | $ | 12,025 | | $ | 2,872 | | $ | 9,432 | | $ | 12,304 | |
146
| Six Months Ended | |||||||||||||||||
| June 30, 2017 | June 30, 2016 | ||||||||||||||||
In millions of dollars | Corporate | Consumer | Total | Corporate | Consumer | Total | ||||||||||||
Allowance for loan losses at beginning of period | $ | 2,702 | | $ | 9,358 | | $ | 12,060 | | $ | 2,791 | | $ | 9,835 | | $ | 12,626 | |
Charge-offs | (199 | ) | (4,075 | ) | (4,274 | ) | (381 | ) | (3,810 | ) | (4,191 | ) | ||||||
Recoveries | 85 | | 770 | | 855 | | 30 | | 821 | | 851 | | ||||||
Replenishment of net charge-offs | 114 | | 3,305 | | 3,419 | | 351 | | 2,989 | | 3,340 | | ||||||
Net reserve builds (releases) | (170 | ) | 217 | | 47 | | (12 | ) | (36 | ) | (48 | ) | ||||||
Net specific reserve builds (releases) | (39 | ) | (86 | ) | (125 | ) | 90 | | (106 | ) | (16 | ) | ||||||
Other | 17 | | 26 | | 43 | | 3 | | (261 | ) | (258 | ) | ||||||
Ending balance | $ | 2,510 | | $ | 9,515 | | $ | 12,025 | | $ | 2,872 | | $ | 9,432 | | $ | 12,304 | |
| June 30, 2017 | December 31, 2016 | ||||||||||||||||
In millions of dollars | Corporate | Consumer | Total | Corporate | Consumer | Total | ||||||||||||
Allowance for loan losses |
| |
| |
| |
|
|
| |||||||||
Collectively evaluated in accordance with ASC 450 | $ | 2,156 | | $ | 8,069 | | $ | 10,225 | | $ | 2,310 | | $ | 7,744 | | $ | 10,054 | |
Individually evaluated in accordance with ASC 310-10-35 | 354 | | 1,441 | | 1,795 | | 392 | | 1,608 | | 2,000 | | ||||||
Purchased credit-impaired in accordance with ASC 310-30 | - | | 5 | | 5 | | - | | 6 | | 6 | | ||||||
Total allowance for loan losses | $ | 2,510 | | $ | 9,515 | | $ | 12,025 | | $ | 2,702 | | $ | 9,358 | | $ | 12,060 | |
Loans, net of unearned income |
|
|
|
|
| | | |||||||||||
Collectively evaluated in accordance with ASC 450 | $ | 313,092 | | $ | 318,029 | | $ | 631,121 | | $ | 293,294 | | $ | 317,048 | | $ | 610,342 | |
Individually evaluated in accordance with ASC 310-10-35 | 2,153 | | 7,022 | | 9,175 | | 2,555 | | 7,799 | | 10,354 | | ||||||
Purchased credit-impaired in accordance with ASC 310-30 | - | | 183 | | 183 | | - | | 187 | | 187 | | ||||||
Held at fair value | 4,189 | | 27 | | 4,216 | | 3,457 | | 29 | | 3,486 | | ||||||
Total loans, net of unearned income | $ | 319,434 | | $ | 325,261 | | $ | 644,695 | | $ | 299,306 | | $ | 325,063 | | $ | 624,369 | |
147
15. GOODWILL AND INTANGIBLE ASSETS
For additional information regarding Citi's goodwill impairment testing process, see Notes 1 and 16 to the Consolidated Financial Statements in Citi's 2016 Annual Report on Form 10-K.
Goodwill
In millions of dollars |
| ||
Balance, December 31, 2016 | $ | 21,659 | |
Foreign exchange translation and other | $ | 634 | |
Impairment of goodwill | (28 | ) | |
Balance at March 31, 2017 | $ | 22,265 | |
Foreign exchange translation and other | $ | 156 | |
Impairment of goodwill | - | | |
Divestitures (1) | (72 | ) | |
Balance at June 30, 2017 | $ | 22,349 | |
(1) | Goodwill allocated to the sale of the Fixed Income Analytics and Index businesses. See Note 2 to the Consolidated Financial Statements. |
Citi performs its annual impairment test every third quarter and between annual tests (referred to as interim tests) if there are certain triggering events. Results of interim testing performed during the first half of 2017 are summarized below.
Effective January 1, 2017, the mortgage servicing business in North America GCB was reorganized and is now reported as part of Corporate/Other . Goodwill was allocated to the transferred business based on its relative fair value to the legacy North America GCB reporting unit. An interim test was performed under both the legacy and new reporting structures, which resulted in full impairment of the $28 million of allocated goodwill upon transfer to Citi Holdings-REL . The impairment was recorded as an operating expense in the first quarter of 2017.
Further, due to prior period indications that the fair value of the Citi Holdings-Consumer Latin America reporting unit only marginally exceeded its carrying value, updated interim tests were performed during the first and second quarters of 2017, with a minimal change in results. While there was no indication of impairment, the $16 million of goodwill present in Citi Holdings-Consumer Latin America may be particularly sensitive to further deterioration in economic conditions. The fair value as a percentage of allocated book value as of June 30, 2017 was 103% .
There were no other triggering events identified during the second quarter of 2017. The fair values of all other reporting units with goodwill balances exceeded their carrying values and did not indicate a risk of impairment based on the most recent valuations.
The following table shows reporting units with goodwill balances as of June 30, 2017 and the fair value as a percentage of allocated book value as of the latest impairment test (1) :
In millions of dollars |
|
| |||
Reporting unit | Goodwill | Fair value as a % of allocated book value | |||
North America Global Consumer Banking | $ | 6,732 | | 148 | % |
Asia Global Consumer Banking | 4,900 | | 157 | | |
Latin America Global Consumer Banking | 1,178 | | 180 | | |
ICG- Banking | 2,998 | | 194 | | |
ICG- Markets and Securities Services | 6,525 | | 115 | | |
Citi Holdings - Consumer Latin America (2) | 16 | | 103 | | |
Total as of June 30, 2017 | $ | 22,349 | | | |
(1) | As of July 1, 2016 for all reporting units, except for Citi Holdings-Consumer Latin America which is as of June 30, 2017. |
(2) | All Citi Holdings reporting units are presented in the Corporate/Other segment beginning in the first quarter of 2017. |
148
Intangible Assets
The components of intangible assets were as follows:
| June 30, 2017 | December 31, 2016 | ||||||||||||||||
In millions of dollars | Gross carrying amount | Accumulated amortization | Net carrying amount | Gross carrying amount | Accumulated amortization | Net carrying amount | ||||||||||||
Purchased credit card relationships | $ | 5,376 | | $ | 3,757 | | $ | 1,619 | | $ | 8,215 | | $ | 6,549 | | $ | 1,666 | |
Credit card contract related intangibles (1) | 5,043 | | 2,258 | | 2,785 | | 5,149 | | 2,177 | | 2,972 | | ||||||
Core deposit intangibles | 671 | | 651 | | 20 | | 801 | | 771 | | 30 | | ||||||
Other customer relationships | 464 | | 265 | | 199 | | 474 | | 272 | | 202 | | ||||||
Present value of future profits | 35 | | 31 | | 4 | | 31 | | 27 | | 4 | | ||||||
Indefinite-lived intangible assets | 235 | | - | | 235 | | 210 | | - | | 210 | | ||||||
Other | 150 | | 125 | | 25 | | 504 | | 474 | | 30 | | ||||||
Intangible assets (excluding MSRs) | $ | 11,974 | | $ | 7,087 | | $ | 4,887 | | $ | 15,384 | | $ | 10,270 | | $ | 5,114 | |
Mortgage servicing rights (MSRs) (2) | 560 | | - | | 560 | | 1,564 | | - | | 1,564 | | ||||||
Total intangible assets | $ | 12,534 | | $ | 7,087 | | $ | 5,447 | | $ | 16,948 | | $ | 10,270 | | $ | 6,678 | |
The changes in intangible assets were as follows:
| Net carrying |
|
|
| Net carrying amount at | ||||||||||
In millions of dollars | December 31, | Acquisitions/ divestitures | Amortization | FX translation and other | June 30, | ||||||||||
Purchased credit card relationships | $ | 1,666 | | $ | 20 | | $ | (68 | ) | $ | 1 | | $ | 1,619 | |
Credit card contract related intangibles (1) | 2,972 | | 9 | | (196 | ) | - | | 2,785 | | |||||
Core deposit intangibles | 30 | | - | | (12 | ) | 2 | | 20 | | |||||
Other customer relationships | 202 | | - | | (12 | ) | 9 | | 199 | | |||||
Present value of future profits | 4 | | - | | - | | - | | 4 | | |||||
Indefinite-lived intangible assets | 210 | | - | | - | | 25 | | 235 | | |||||
Other | 30 | | (14 | ) | (5 | ) | 14 | | 25 | | |||||
Intangible assets (excluding MSRs) | $ | 5,114 | | $ | 15 | | $ | (293 | ) | $ | 51 | | $ | 4,887 | |
Mortgage servicing rights (MSRs) (2) | 1,564 | |
|
|
| 560 | | ||||||||
Total intangible assets | $ | 6,678 | |
|
|
| $ | 5,447 | | ||||||
(1) | Primarily reflects contract-related intangibles associated with the American Airlines, Sears, The Home Depot, Costco and AT&T credit card program agreements, which represented 97% of the aggregate net carrying amount at June 30, 2017 and December 31, 2016. |
(2) | For additional information on Citi's MSRs, including the rollforward for the six months ended June 30, 2017 , see Note 18 to the Consolidated Financial Statements. |
149
16. DEBT
For additional information regarding Citi's short-term borrowings and long-term debt, see Note 17 to the Consolidated Financial Statements in Citi's 2016 Annual Report on Form 10-K.
Short-Term Borrowings
In millions of dollars | June 30, | December 31, | ||||
Commercial paper | $ | 9,977 | | $ | 9,989 | |
Other borrowings (1) | 26,542 | | 20,712 | | ||
Total | $ | 36,519 | | $ | 30,701 | |
(1) | Includes borrowings from Federal Home Loan Banks and other market participants. At June 30, 2017 and December 31, 2016 , collateralized short-term advances from the Federal Home Loan Banks were $15.3 billion and $12.0 billion , respectively. |
Long-Term Debt
In millions of dollars | June 30, | December 31, 2016 | ||||
Citigroup Inc. (1) | $ | 147,257 | | $ | 147,333 | |
Bank (2) | 60,234 | | 49,454 | | ||
Broker-dealer (3) | 17,688 | | 9,391 | | ||
Total | $ | 225,179 | | $ | 206,178 | |
(1) | Represents the parent holding company. |
(2) | Represents Citibank entities as well as other bank entities. At June 30, 2017 and December 31, 2016 , collateralized long-term advances from the Federal Home Loan Banks were $20.3 billion and $21.6 billion , respectively. |
(3) | Represents broker-dealer subsidiaries that are consolidated into Citigroup Inc., the parent holding company. |
Long-term debt outstanding includes trust preferred securities with a balance sheet carrying value of $1.7 billion at both June 30, 2017 and December 31, 2016 .
The following table summarizes Citi's outstanding trust preferred securities at June 30, 2017 :
|
|
|
|
|
| Junior subordinated debentures owned by trust | |||||||||
Trust | Issuance date | Securities issued | Liquidation value (1) | Coupon rate (2) | Common shares issued to parent | Amount | Maturity | Redeemable by issuer beginning | |||||||
In millions of dollars, except share amounts | | | | | | | | | | ||||||
Citigroup Capital III | Dec. 1996 | 194,053 | | $ | 194 | | 7.625 | % | 6,003 | | $ | 200 | | Dec. 1, 2036 | Not redeemable |
Citigroup Capital XIII | Sept. 2010 | 89,840,000 | | 2,246 | | 3 mo LIBOR + 637 bps | | 1,000 | | 2,246 | | Oct. 30, 2040 | Oct. 30, 2015 | ||
Citigroup Capital XVIII | June 2007 | 99,901 | | 130 | | 3 mo LIBOR + 88.75 bps | | 50 | | 130 | | June 28, 2067 | June 28, 2017 | ||
Total obligated |
|
| | $ | 2,570 | |
|
| $ | 2,576 | |
|
| ||
Note: Distributions on the trust preferred securities and interest on the subordinated debentures are payable semiannually for Citigroup Capital III and Citigroup Capital XVIII and quarterly for Citigroup Capital XIII.
(1) | Represents the notional value received by investors from the trusts at the time of issuance. |
(2) | In each case, the coupon rate on the subordinated debentures is the same as that on the trust preferred securities. |
150
17. CHANGES IN ACCUMULATED OTHER COMPREHENSIVE INCOME (LOSS) (AOCI)
Changes in each component of Citigroup's Accumulated other comprehensive income (loss) were as follows:
In millions of dollars | Net | Debt valuation adjustment (DVA) | Cash flow hedges (1) | Benefit plans (2) | Foreign | Accumulated | ||||||||||||
Balance, March 31, 2017 | $ | (75 | ) | $ | (412 | ) | $ | (562 | ) | $ | (5,176 | ) | $ | (24,188 | ) | $ | (30,413 | ) |
Other comprehensive income before reclassifications | 101 | | (79 | ) | 62 | | (173 | ) | 643 | | 554 | | ||||||
Increase (decrease) due to amounts reclassified from AOCI | (128 | ) | (5 | ) | 55 | | 38 | | - | | (40 | ) | ||||||
Change, net of taxes | $ | (27 | ) | $ | (84 | ) | $ | 117 | | $ | (135 | ) | $ | 643 | | $ | 514 | |
Balance at June 30, 2017 | $ | (102 | ) | $ | (496 | ) | $ | (445 | ) | $ | (5,311 | ) | $ | (23,545 | ) | $ | (29,899 | ) |
In millions of dollars | Net | Debt valuation adjustment (DVA) | Cash flow hedges (1) | Benefit plans (2) | Foreign | Accumulated | ||||||||||||
Balance, December 31, 2016 | $ | (799 | ) | $ | (352 | ) | $ | (560 | ) | $ | (5,164 | ) | $ | (25,506 | ) | $ | (32,381 | ) |
Adjustment to opening balance, net of taxes (4) | 504 | | - | | - | | - | | - | | 504 | | ||||||
Adjusted balance, beginning of period | $ | (295 | ) | $ | (352 | ) | $ | (560 | ) | $ | (5,164 | ) | $ | (25,506 | ) | $ | (31,877 | ) |
Other comprehensive income before reclassifications | 435 | | (134 | ) | 86 | | (222 | ) | 2,108 | | 2,273 | | ||||||
Increase (decrease) due to amounts reclassified from AOCI | (242 | ) | (10 | ) | 29 | | 75 | | (147 | ) | (295 | ) | ||||||
Change, net of taxes | $ | 193 | | $ | (144 | ) | $ | 115 | | $ | (147 | ) | $ | 1,961 | | $ | 1,978 | |
Balance at June 30, 2017 | $ | (102 | ) | $ | (496 | ) | $ | (445 | ) | $ | (5,311 | ) | $ | (23,545 | ) | $ | (29,899 | ) |
151
In millions of dollars | Net | Debt valuation adjustment (DVA) | Cash flow hedges (1) | Benefit plans (2) | Foreign | Accumulated | ||||||||||||
Balance, March 31, 2016 | $ | 1,127 | | $ | 178 | | $ | (300 | ) | $ | (5,581 | ) | $ | (22,050 | ) | $ | (26,626 | ) |
Other comprehensive income before reclassifications | 1,025 | | 16 | | 115 | | (66 | ) | (552 | ) | 538 | | ||||||
Increase (decrease) due to amounts reclassified from AOCI | (98 | ) | (4 | ) | 36 | | 39 | | - | | (27 | ) | ||||||
Change, net of taxes | $ | 927 | | $ | 12 | | $ | 151 | | $ | (27 | ) | $ | (552 | ) | $ | 511 | |
Balance, June 30, 2016 | $ | 2,054 | | $ | 190 | | $ | (149 | ) | $ | (5,608 | ) | $ | (22,602 | ) | $ | (26,115 | ) |
In millions of dollars | Net | Debt valuation adjustment (DVA) | Cash flow hedges (1) | Benefit plans (2) | Foreign | Accumulated | ||||||||||||
Balance, December 31, 2015 | $ | (907 | ) | $ | - | | $ | (617 | ) | $ | (5,116 | ) | $ | (22,704 | ) | $ | (29,344 | ) |
Adjustment to opening balance, net of taxes (5) | - | | (15 | ) | - | | - | | - | | (15 | ) | ||||||
Adjusted balance, beginning of period | $ | (907 | ) | $ | (15 | ) | $ | (617 | ) | $ | (5,116 | ) | $ | (22,704 | ) | $ | (29,359 | ) |
Other comprehensive income before reclassifications | 3,051 | | 208 | | 406 | | (566 | ) | 102 | | 3,201 | | ||||||
Increase (decrease) due to amounts reclassified from AOCI | (90 | ) | (3 | ) | 62 | | 74 | | - | | 43 | | ||||||
Change, net of taxes | $ | 2,961 | | $ | 205 | | $ | 468 | | $ | (492 | ) | $ | 102 | | $ | 3,244 | |
Balance, June 30, 2016 | $ | 2,054 | | $ | 190 | | $ | (149 | ) | $ | (5,608 | ) | $ | (22,602 | ) | $ | (26,115 | ) |
(1) | Primarily driven by Citigroup's pay fixed/receive floating interest rate swap programs that hedge the floating rates on liabilities. |
(2) | Primarily reflects adjustments based on the quarterly actuarial valuations of the Company's Significant pension and postretirement plans, annual actuarial valuations of all other plans, and amortization of amounts previously recognized in other comprehensive income. |
(3) | Primarily reflects the movements in (by order of impact) the Mexican peso, Euro, and Polish zloty against the U.S. dollar, and changes in related tax effects and hedges for the quarter ended June 30, 2017 . Primarily reflects the movements in (by order of impact) the Japanese yen, euro, and Brazilian real against the U.S. dollar, and changes in related tax effects and hedges for the quarter ended June 30, 2016 . |
(4) | In the second quarter of 2017, Citi early adopted ASU 2017-08, Receivables-Nonrefundable Fees and Other Costs (Subtopic 310-20): Premium Amortization on Purchased Callable Debt Securities. Upon adoption, a cumulative effect adjustment was recorded to reduce retained earnings, effective January 1, 2017, for the incremental amortization of cumulative fair value hedge adjustments on callable state and municipal debt securities. For additional information, see Note 1 to the Consolidated Financial Statements. |
(5) | Beginning in the first quarter of 2016, changes in DVA are reflected as a component of AOCI, pursuant to the early adoption of only the provisions of ASU 2016-01 relating to the presentation of DVA on fair value option liabilities. See Note 1 to the Consolidated Financial Statements for further information regarding this change. |
152
The pretax and after-tax changes in each component of Accumulated other comprehensive income (loss) were as follows:
In millions of dollars | Pretax | Tax effect | After-tax | ||||||
Balance, March 31, 2017 | $ | (39,514 | ) | $ | 9,101 | | $ | (30,413 | ) |
Change in net unrealized gains (losses) on investment securities | (45 | ) | 18 | | (27 | ) | |||
Debt valuation adjustment (DVA) | (132 | ) | 48 | | (84 | ) | |||
Cash flow hedges | 185 | | (68 | ) | 117 | | |||
Benefit plans | (219 | ) | 84 | | (135 | ) | |||
Foreign currency translation adjustment | 619 | | 24 | | 643 | | |||
Change | $ | 408 | | $ | 106 | | $ | 514 | |
Balance, June 30, 2017 | $ | (39,106 | ) | $ | 9,207 | | $ | (29,899 | ) |
In millions of dollars | Pretax | Tax effect | After-tax | ||||||
Balance, December 31, 2016 | $ | (42,035 | ) | $ | 9,654 | | $ | (32,381 | ) |
Adjustment to opening balance (1) | 803 | | (299 | ) | 504 | | |||
Adjusted balance, beginning of period | $ | (41,232 | ) | $ | 9,355 | | $ | (31,877 | ) |
Change in net unrealized gains (losses) on investment securities | 301 | | (108 | ) | 193 | | |||
Debt valuation adjustment (DVA) | (227 | ) | 83 | | (144 | ) | |||
Cash flow hedges | 186 | | (71 | ) | 115 | | |||
Benefit plans | (221 | ) | 74 | | (147 | ) | |||
Foreign currency translation adjustment | 2,087 | | (126 | ) | 1,961 | | |||
Change | $ | 2,126 | | $ | (148 | ) | $ | 1,978 | |
Balance, June 30, 2017 | $ | (39,106 | ) | $ | 9,207 | | $ | (29,899 | ) |
(1) | In the second quarter of 2017, Citi early adopted ASU 2017-08, Receivables-Nonrefundable Fees and Other Costs (Subtopic 310-20): Premium Amortization on Purchased Callable Debt Securities. Upon adoption, a cumulative effect adjustment was recorded to reduce retained earnings, effective January 1, 2017, for the incremental amortization of cumulative fair value hedge adjustments on callable state and municipal debt securities. For additional information, see Note 1 to the Consolidated Financial Statements. |
153
In millions of dollars | Pretax | Tax effect | After-tax | ||||||
Balance, March 31, 2016 | $ | (34,668 | ) | $ | 8,042 | | $ | (26,626 | ) |
Change in net unrealized gains (losses) on investment securities | 1,482 | | (555 | ) | 927 | | |||
Debt valuation adjustment (DVA) | 20 | | (8 | ) | 12 | | |||
Cash flow hedges | 257 | | (106 | ) | 151 | | |||
Benefit plans | (31 | ) | 4 | | (27 | ) | |||
Foreign currency translation adjustment | (774 | ) | 222 | | (552 | ) | |||
Change | $ | 954 | | $ | (443 | ) | $ | 511 | |
Balance, June 30, 2016 | $ | (33,714 | ) | $ | 7,599 | | $ | (26,115 | ) |
In millions of dollars | Pretax | Tax effect | After-tax | ||||||
Balance, December 31, 2015 | $ | (38,440 | ) | $ | 9,096 | | $ | (29,344 | ) |
Adjustment to opening balance (1) | (26 | ) | 11 | | (15 | ) | |||
Adjusted balance, beginning of period | $ | (38,466 | ) | $ | 9,107 | | $ | (29,359 | ) |
Change in net unrealized gains (losses) on investment securities | 4,706 | | (1,745 | ) | 2,961 | | |||
Debt valuation adjustment (DVA) | 327 | | (122 | ) | 205 | | |||
Cash flow hedges | 739 | | (271 | ) | 468 | | |||
Benefit plans | (758 | ) | 266 | | (492 | ) | |||
Foreign currency translation adjustment | (262 | ) | 364 | | 102 | | |||
Change | $ | 4,752 | | $ | (1,508 | ) | $ | 3,244 | |
Balance, June 30, 2016 | $ | (33,714 | ) | $ | 7,599 | | $ | (26,115 | ) |
(1) | Represents the $15 million adjustment related to the initial adoption of ASU 2016-01. See Note 1 to the Consolidated Financial Statements. |
154
The Company recognized pretax gain (loss) related to amounts in AOCI reclassified to the Consolidated Statement of Income as follows:
| Increase (decrease) in AOCI due to amounts reclassified to Consolidated Statement of Income | |||||
| Three Months Ended June 30, | Six Months Ended June 30, | ||||
In millions of dollars | 2017 | 2017 | ||||
Realized (gains) losses on sales of investments | $ | (221 | ) | $ | (413 | ) |
OTTI gross impairment losses | 20 | | 32 | | ||
Subtotal, pretax | $ | (201 | ) | $ | (381 | ) |
Tax effect | 73 | | 139 | | ||
Net realized (gains) losses on investment securities, after-tax (1) | $ | (128 | ) | $ | (242 | ) |
Realized DVA (gains) losses on fair value option liabilities | $ | (8 | ) | $ | (16 | ) |
Subtotal, pretax | $ | (8 | ) | $ | (16 | ) |
Tax effect | 3 | | 6 | | ||
Net realized debt valuation adjustment, after-tax | $ | (5 | ) | $ | (10 | ) |
Interest rate contracts | $ | 90 | | $ | 46 | |
Foreign exchange contracts | (2 | ) | 1 | | ||
Subtotal, pretax | $ | 88 | | $ | 47 | |
Tax effect | (33 | ) | (18 | ) | ||
Amortization of cash flow hedges, after-tax (2) | $ | 55 | | $ | 29 | |
Amortization of unrecognized |
|
| ||||
Prior service cost (benefit) | $ | (12 | ) | $ | (22 | ) |
Net actuarial loss | 66 | | 133 | | ||
Curtailment/settlement impact (3) | 7 | | 7 | | ||
Subtotal, pretax | $ | 61 | | $ | 118 | |
Tax effect | (23 | ) | (43 | ) | ||
Amortization of benefit plans, after-tax (3) | $ | 38 | | $ | 75 | |
Foreign currency translation adjustment | $ | - | | $ | (232 | ) |
Tax effect | - | | 85 | | ||
Foreign currency translation adjustment | $ | - | | $ | (147 | ) |
Total amounts reclassified out of AOCI, pretax | $ | (60 | ) | $ | (464 | ) |
Total tax effect | 20 | | 169 | | ||
Total amounts reclassified out of AOCI, after-tax | $ | (40 | ) | $ | (295 | ) |
(1) | The pretax amount is reclassified to Realized gains (losses) on sales of investments, net and Gross impairment losses on the Consolidated Statement of Income. See Note 12 to the Consolidated Financial Statements for additional details. |
(2) | See Note 19 to the Consolidated Financial Statements for additional details. |
(3) | See Note 8 to the Consolidated Financial Statements for additional details. |
155
The Company recognized pretax gain (loss) related to amounts in AOCI reclassified to the Consolidated Statement of Income as follows:
| Increase (decrease) in AOCI due to amounts reclassified to Consolidated Statement of Income | |||||
| Three Months Ended June 30, | Six Months Ended June 30, | ||||
In millions of dollars | 2016 | 2016 | ||||
Realized (gains) losses on sales of investments | $ | (200 | ) | $ | (386 | ) |
OTTI gross impairment losses | 48 | | 251 | | ||
Subtotal, pretax | $ | (152 | ) | $ | (135 | ) |
Tax effect | 54 | | 45 | | ||
Net realized (gains) losses on investment securities, after-tax (1) | $ | (98 | ) | $ | (90 | ) |
Realized DVA (gains) losses on fair value option liabilities | $ | (6 | ) | $ | (5 | ) |
Subtotal, pretax | $ | (6 | ) | $ | (5 | ) |
Tax effect | $ | 2 | | $ | 2 | |
Net realized debt valuation adjustment, after-tax | $ | (4 | ) | $ | (3 | ) |
Interest rate contracts | $ | 41 | | $ | 57 | |
Foreign exchange contracts | 17 | | 43 | | ||
Subtotal, pretax | $ | 58 | | $ | 100 | |
Tax effect | (22 | ) | (38 | ) | ||
Amortization of cash flow hedges, after-tax (2) | $ | 36 | | $ | 62 | |
Amortization of unrecognized |
|
| ||||
Prior service cost (benefit) | $ | (11 | ) | $ | (21 | ) |
Net actuarial loss | 69 | | 135 | | ||
Curtailment/settlement impact (3) | 3 | | 1 | | ||
Subtotal, pretax | $ | 61 | | $ | 115 | |
Tax effect | (22 | ) | (41 | ) | ||
Amortization of benefit plans, after-tax (3) | $ | 39 | | $ | 74 | |
Foreign currency translation adjustment | $ | - | | $ | - | |
Total amounts reclassified out of AOCI, pretax | $ | (39 | ) | $ | 75 | |
Total tax effect | 12 | | (32 | ) | ||
Total amounts reclassified out of AOCI, after-tax | $ | (27 | ) | $ | 43 | |
(1) | The pretax amount is reclassified to Realized gains (losses) on sales of investments, net and Gross impairment losses on the Consolidated Statement of Income. See Note 12 to the Consolidated Financial Statements for additional details. |
(2) | See Note 19 to the Consolidated Financial Statements for additional details. |
(3) | See Note 8 to the Consolidated Financial Statements for additional details. |
156
18. SECURITIZATIONS AND VARIABLE INTEREST ENTITIES
For additional information regarding Citi's use of special purpose entities (SPEs) and variable interest entities (VIEs), see Note 21 to the Consolidated Financial Statements in Citi's 2016 Annual Report on Form 10-K.
| As of June 30, 2017 |
| ||||||||||||||||||||||
|
|
|
| Maximum exposure to loss in significant unconsolidated VIEs (1) | ||||||||||||||||||||
|
|
|
| Funded exposures (2) | Unfunded exposures |
| ||||||||||||||||||
In millions of dollars | Total involvement with SPE assets | Consolidated VIE / SPE assets | Significant unconsolidated VIE assets (3) | Debt investments | Equity investments | Funding commitments | Guarantees and derivatives | Total | ||||||||||||||||
Credit card securitizations | $ | 51,092 | | $ | 51,092 | | $ | - | | $ | - | | $ | - | | $ | - | | $ | - | | $ | - | |
Mortgage securitizations (4) |
|
|
|
|
|
|
|
| ||||||||||||||||
U.S. agency-sponsored (5) | 117,756 | | - | | 117,756 | | 2,983 | | - | | - | | 25 | | 3,008 | | ||||||||
Non-agency-sponsored | 23,432 | | 976 | | 22,456 | | 228 | | 38 | | - | | 1 | | 267 | | ||||||||
Citi-administered asset-backed commercial paper conduits (ABCP) | 18,762 | | 18,762 | | - | | - | | - | | - | | - | | - | | ||||||||
Collateralized loan obligations (CLOs) | 18,464 | | - | | 18,464 | | 5,206 | | - | | - | | 38 | | 5,244 | | ||||||||
Asset-based financing | 50,601 | | 689 | | 49,912 | | 15,993 | | 618 | | 4,881 | | - | | 21,492 | | ||||||||
Municipal securities tender option bond trusts (TOBs) | 6,695 | | 2,290 | | 4,405 | | - | | - | | 2,939 | | - | | 2,939 | | ||||||||
Municipal investments | 18,644 | | 13 | | 18,631 | | 2,572 | | 3,835 | | 2,554 | | - | | 8,961 | | ||||||||
Client intermediation | 2,697 | | 929 | | 1,768 | | 1,020 | | - | | 484 | | 2 | | 1,506 | | ||||||||
Investment funds | 2,158 | | 815 | | 1,343 | | 32 | | 8 | | 15 | | 4 | | 59 | | ||||||||
Other | 908 | | 36 | | 872 | | 120 | | 9 | | 67 | | 44 | | 240 | | ||||||||
Total | $ | 311,209 | | $ | 75,602 | | $ | 235,607 | | $ | 28,154 | | $ | 4,508 | | $ | 10,940 | | $ | 114 | | $ | 43,716 | |
| As of December 31, 2016 |
| ||||||||||||||||||||||
|
|
|
| Maximum exposure to loss in significant unconsolidated VIEs (1) | ||||||||||||||||||||
|
|
|
| Funded exposures (2) | Unfunded exposures |
| ||||||||||||||||||
In millions of dollars | Total involvement with SPE assets | Consolidated VIE / SPE assets | Significant unconsolidated VIE assets (3) | Debt investments | Equity investments | Funding commitments | Guarantees and derivatives | Total | ||||||||||||||||
Credit card securitizations | $ | 50,171 | | $ | 50,171 | | $ | - | | $ | - | | $ | - | | $ | - | | $ | - | | $ | - | |
Mortgage securitizations (4) |
|
|
|
|
|
|
|
| ||||||||||||||||
U.S. agency-sponsored | 214,458 | | - | | 214,458 | | 3,852 | | - | | - | | 78 | | 3,930 | | ||||||||
Non-agency-sponsored | 15,965 | | 1,092 | | 14,873 | | 312 | | 35 | | - | | 1 | | 348 | | ||||||||
Citi-administered asset-backed commercial paper conduits (ABCP) | 19,693 | | 19,693 | | - | | - | | - | | - | | - | | - | | ||||||||
Collateralized loan obligations (CLOs) | 18,886 | | - | | 18,886 | | 5,128 | | - | | - | | 62 | | 5,190 | | ||||||||
Asset-based financing | 53,168 | | 733 | | 52,435 | | 16,553 | | 475 | | 4,915 | | - | | 21,943 | | ||||||||
Municipal securities tender option bond trusts (TOBs) | 7,070 | | 2,843 | | 4,227 | | 40 | | - | | 2,842 | | - | | 2,882 | | ||||||||
Municipal investments | 17,679 | | 14 | | 17,665 | | 2,441 | | 3,578 | | 2,580 | | - | | 8,599 | | ||||||||
Client intermediation | 515 | | 371 | | 144 | | 49 | | - | | - | | 3 | | 52 | | ||||||||
Investment funds | 2,788 | | 767 | | 2,021 | | 32 | | 120 | | 27 | | 3 | | 182 | | ||||||||
Other | 1,429 | | 607 | | 822 | | 116 | | 11 | | 58 | | 43 | | 228 | | ||||||||
Total | $ | 401,822 | | $ | 76,291 | | $ | 325,531 | | $ | 28,523 | | $ | 4,219 | | $ | 10,422 | | $ | 190 | | $ | 43,354 | |
(1) The definition of maximum exposure to loss is included in the text that follows this table.
(2) | Included on Citigroup's June 30, 2017 and December 31, 2016 Consolidated Balance Sheet. |
(3) | A significant unconsolidated VIE is an entity where the Company has any variable interest or continuing involvement considered to be significant, regardless of the likelihood of loss. |
(4) | Citigroup mortgage securitizations also include agency and non-agency (private-label) re-securitization activities. These SPEs are not consolidated. See "Re-securitizations" below for further discussion. |
(5) | See Note 2 to the Consolidated Financial Statements for more information on the exit of the U.S. mortgage servicing operations and sale of MSRs. |
157
The previous tables do not include:
• | certain venture capital investments made by some of the Company's private equity subsidiaries, as the Company accounts for these investments in accordance with the Investment Company Audit Guide (codified in ASC 946); |
• | certain investment funds for which the Company provides investment management services and personal estate trusts for which the Company provides administrative, trustee and/or investment management services; |
• | certain VIEs structured by third parties where the Company holds securities in inventory, as these investments are made on arm's-length terms; |
• | certain positions in mortgage-backed and asset-backed securities held by the Company, which are classified as Trading account assets or Investments , where the Company has no other involvement with the related securitization entity deemed to be significant (for more information on these positions, see Notes 12 and 20 to the Consolidated Financial Statements); |
• | certain representations and warranties exposures in legacy ICG -sponsored mortgage-backed and asset-backed securitizations, where the Company has no variable interest or continuing involvement as servicer. The outstanding balance of mortgage loans securitized during 2005 to 2008 where the Company has no variable interest or continuing involvement as servicer was approximately $9 billion and $10 billion at June 30, 2017 and December 31, 2016 , respectively; |
• | certain representations and warranties exposures in Citigroup residential mortgage securitizations, where the original mortgage loan balances are no longer outstanding; and |
• | VIEs such as trust preferred securities trusts used in connection with the Company's funding activities. The Company does not have a variable interest in these trusts. |
The asset balances for consolidated VIEs represent the carrying amounts of the assets consolidated by the Company. The carrying amount may represent the amortized cost or the current fair value of the assets depending on the legal form of the asset (e.g., loan or security) and the Company's standard accounting policies for the asset type and line of business.
The asset balances for unconsolidated VIEs where the Company has significant involvement represent the most current information available to the Company. In most cases, the asset balances represent an amortized cost basis without regard to impairments, unless fair value information is readily available to the Company.
The maximum funded exposure represents the balance sheet carrying amount of the Company's investment in the VIE. It reflects the initial amount of cash invested in the VIE adjusted for any accrued interest and cash principal payments received. The carrying amount may also be adjusted for increases or declines in fair value or any impairment in value recognized in earnings. The maximum exposure of unfunded positions represents the remaining undrawn committed amount, including liquidity and credit facilities provided by the Company, or the notional amount of a derivative instrument considered to be a variable interest. In certain transactions, the Company has entered into derivative instruments or other arrangements that are not considered variable interests in the VIE (e.g., interest rate swaps, cross-currency swaps or where the Company is the purchaser of credit protection under a credit default swap or total return swap where the Company pays the total return on certain assets to the SPE). Receivables under such arrangements are not included in the maximum exposure amounts.
158
Funding Commitments for Significant Unconsolidated VIEs-Liquidity Facilities and Loan Commitments
The following table presents the notional amount of liquidity facilities and loan commitments that are classified as funding commitments in the VIE tables above:
| June 30, 2017 | December 31, 2016 | ||||||||||
In millions of dollars | Liquidity facilities | Loan/equity commitments | Liquidity facilities | Loan/equity commitments | ||||||||
Asset-based financing | $ | - | | $ | 4,881 | | $ | 5 | | $ | 4,910 | |
Municipal securities tender option bond trusts (TOBs) | 2,939 | | - | | 2,842 | | - | | ||||
Municipal investments | - | | 2,554 | | - | | 2,580 | | ||||
Client intermediation | - | | 484 | | - | | - | | ||||
Investment funds | - | | 15 | | - | | 27 | | ||||
Other | - | | 67 | | - | | 58 | | ||||
Total funding commitments | $ | 2,939 | | $ | 8,001 | | $ | 2,847 | | $ | 7,575 | |
Significant Interests in Unconsolidated VIEs-Balance Sheet Classification
The following table presents the carrying amounts and classification of significant variable interests in unconsolidated VIEs:
In billions of dollars | June 30, 2017 | December 31, 2016 | ||||
Cash | $ | 0.1 | | $ | 0.1 | |
Trading account assets | 8.9 | | 8.0 | | ||
Investments | 4.6 | | 4.4 | | ||
Total loans, net of allowance | 18.7 | | 18.8 | | ||
Other | 0.5 | | 1.5 | | ||
Total assets | $ | 32.8 | | $ | 32.8 | |
Credit Card Securitizations
Substantially all of the Company's credit card securitization activity is through two trusts-Citibank Credit Card Master Trust (Master Trust) and Citibank Omni Master Trust (Omni
Trust), with the substantial majority through the Master Trust. These trusts are consolidated entities.
The following table reflects amounts related to the Company's securitized credit card receivables:
In billions of dollars | June 30, 2017 | December 31, 2016 | ||||
Ownership interests in principal amount of trust credit card receivables | ||||||
Sold to investors via trust-issued securities | $ | 27.5 | | $ | 22.7 | |
Retained by Citigroup as trust-issued securities | 9.0 | | 7.4 | | ||
Retained by Citigroup via non-certificated interests | 14.5 | | 20.6 | | ||
Total | $ | 51.0 | | $ | 50.7 | |
The following tables summarize selected cash flow information related to Citigroup's credit card securitizations:
| Three Months Ended June 30, | |||||
In billions of dollars | 2017 | 2016 | ||||
Proceeds from new securitizations | $ | 5.1 | | $ | - | |
Pay down of maturing notes | (0.8 | ) | (1.3 | ) | ||
| Six Months Ended June 30, | |||||
In billions of dollars | 2017 | 2016 | ||||
Proceeds from new securitizations | $ | 7.6 | | $ | - | |
Pay down of maturing notes | (2.8 | ) | (3.5 | ) | ||
Master Trust Liabilities (at Par Value)
The weighted average maturity of the third-party term notes issued by the Master Trust was 2.8 years as of June 30, 2017 and 2.6 years as of December 31, 2016 .
In billions of dollars | June 30, 2017 | Dec. 31, 2016 | ||||
Term notes issued to third parties | $ | 26.5 | | $ | 21.7 | |
Term notes retained by Citigroup affiliates | 7.1 | | 5.5 | | ||
Total Master Trust liabilities | $ | 33.6 | | $ | 27.2 | |
Omni Trust Liabilities (at Par Value)
The weighted average maturity of the third-party term notes issued by the Omni Trust was 1.4 years as of June 30, 2017 and 1.9 years as of December 31, 2016 .
In billions of dollars | June 30, 2017 | Dec. 31, 2016 | ||||
Term notes issued to third parties | $ | 1.0 | | $ | 1.0 | |
Term notes retained by Citigroup affiliates | 1.9 | | 1.9 | | ||
Total Omni Trust liabilities | $ | 2.9 | | $ | 2.9 | |
159
Mortgage Securitizations
The following table summarizes selected cash flow information related to Citigroup mortgage securitizations:
| Three Months Ended June 30, | |||||||||||
| 2017 | 2016 | ||||||||||
In billions of dollars | U.S. agency- | Non-agency- | U.S. agency- | Non-agency- | ||||||||
Proceeds from new securitizations | $ | 7.0 | | $ | 1.4 | | $ | 10.3 | | $ | 2.3 | |
Contractual servicing fees received | 0.1 | | - | | 0.1 | | - | | ||||
| Six Months Ended June 30, | |||||||||||
| 2017 | 2016 | ||||||||||
In billions of dollars | U.S. agency- | Non-agency- | U.S. agency- | Non-agency- | ||||||||
Proceeds from new securitizations | $ | 14.2 | | $ | 2.8 | | $ | 20.9 | | $ | 6.5 | |
Contractual servicing fees received | 0.1 | | - | | 0.2 | | - | | ||||
(1) The proceeds from new securitizations in 2016 include $0.5 billion related to personal loan securitizations.
Gains recognized on the securitization of U.S. agency-sponsored mortgages were $18 million and $47 million for the three and six months ended June 30, 2017 , respectively. For the three and six months ended June 30, 2017 , gains recognized on the securitization of non-agency sponsored mortgages were $26 million and $46 million , respectively.
Gains recognized on the securitization of U.S. agency-sponsored mortgages were $20 million and $45 million for the three and six months ended June 30, 2016 , respectively. For the three and six months ended June 30, 2016 , gains recognized on the securitization of non-agency sponsored mortgages were $19 million and $28 million , respectively.
Key assumptions used in measuring the fair value of retained interests at the date of sale or securitization of mortgage receivables were as follows:
| Three Months Ended June 30, 2017 | |||||
|
| Non-agency-sponsored mortgages (1) | ||||
| U.S. agency- | Senior | Subordinated | |||
Discount rate | 2.5% to 14.0% | | - | | - | |
Weighted average discount rate | 7.6 | % | - | | - | |
Constant prepayment rate | 6.5% to 16.1% | | - | | - | |
Weighted average constant prepayment rate | 10.6 | % | - | | - | |
Anticipated net credit losses (2) | NM | | - | | - | |
Weighted average anticipated net credit losses | NM | | - | | - | |
Weighted average life | 4.9 to 14.5 years | | - | | - | |
| Three Months Ended June 30, 2016 | ||||
|
| Non-agency-sponsored mortgages (1) | |||
| U.S. agency- | Senior | Subordinated | ||
Discount rate | 0.8% to 11.5% | | - | | - |
Weighted average discount rate | 9.1 | % | - | | - |
Constant prepayment rate | 8.6% to 26.8% | | - | | - |
Weighted average constant prepayment rate | 13.3 | % | - | | - |
Anticipated net credit losses (2) | NM | | - | | - |
Weighted average anticipated net credit losses | NM | | - | | - |
Weighted average life | 0.5 to 11.4 years | | - | | - |
160
| Six Months Ended June 30, 2017 | |||||
|
| Non-agency-sponsored mortgages (1) | ||||
| U.S. agency- | Senior | Subordinated | |||
Discount rate | 2.4% to 19.9% | | - | | - | |
Weighted average discount rate | 9.5 | % | - | | - | |
Constant prepayment rate | 3.8% to 16.1% | | - | | - | |
Weighted average constant prepayment rate | 9.1 | % | - | | - | |
Anticipated net credit losses (2) | NM | | - | | - | |
Weighted average anticipated net credit losses | NM | | - | | - | |
Weighted average life | 4.9 to 14.5 years | | - | | - | |
| Six Months Ended June 30, 2016 | ||||
|
| Non-agency-sponsored mortgages (1) | |||
| U.S. agency- | Senior | Subordinated | ||
Discount rate | 0.8% to 11.5% | | - | | - |
Weighted average discount rate | 8.7 | % | - | | - |
Constant prepayment rate | 8.6% to 26.8% | | - | | - |
Weighted average constant prepayment rate | 12.5 | % | - | | - |
Anticipated net credit losses (2) | NM | | - | | - |
Weighted average anticipated net credit losses | NM | | - | | - |
Weighted average life | 0.5 to 17.5 years | | - | | - |
Note: Citi held no retained interests in non-agency-sponsored mortgages securitized during the three and six months ended June 30, 2017 and 2016 .
(1) | Disclosure of non-agency-sponsored mortgages as senior and subordinated interests is indicative of the interests' position in the capital structure of the securitization. |
(2) | Anticipated net credit losses represent estimated loss severity associated with defaulted mortgage loans underlying the mortgage securitizations disclosed above. Anticipated net credit losses, in this instance, do not represent total credit losses incurred to date, nor do they represent credit losses expected on retained interests in mortgage securitizations. |
NM | Anticipated net credit losses are not meaningful due to U.S. agency guarantees. |
The interests retained by the Company range from highly rated and/or senior in the capital structure to unrated and/or residual interests.
The key assumptions used to value retained interests, and the sensitivity of the fair value to adverse changes of 10% and 20% in each of the key assumptions, are set forth in the tables
below. The negative effect of each change is calculated independently, holding all other assumptions constant. Because the key assumptions may not be independent, the net effect of simultaneous adverse changes in the key assumptions may be less than the sum of the individual effects shown below.
| June 30, 2017 | |||||
|
| Non-agency-sponsored mortgages (1) | ||||
| U.S. agency- | Senior | Subordinated | |||
Discount rate | 0.1% to 60.3% | | 0.0% to 11.6% | | 5.6% to 20.9% | |
Weighted average discount rate | 6.9 | % | 1.6 | % | 11.8 | % |
Constant prepayment rate | 7.0% to 21.0% | | 8.9% to 13.8% | | 0.5% to 20.1% | |
Weighted average constant prepayment rate | 11.6 | % | 12.3 | % | 9.6 | % |
Anticipated net credit losses (2) | NM | | 0.4% to 50.2% | | 35.7% to 60.3% | |
Weighted average anticipated net credit losses | NM | | 17.0 | % | 46.6 | % |
Weighted average life | 0.1 to 28.3 years | | 5.2 to 17.4 years | | 0.7 to 10.8 years | |
161
| December 31, 2016 | |||||
|
| Non-agency-sponsored mortgages (1) | ||||
| U.S. agency- | Senior | Subordinated | |||
Discount rate | 0.7% to 28.2% | | 0.0% to 8.1% | | 5.1% to 26.4% | |
Weighted average discount rate | 9.0 | % | 2.1 | % | 13.1 | % |
Constant prepayment rate | 6.8% to 22.8% | | 4.2% to 14.7% | | 0.5% to 37.5% | |
Weighted average constant prepayment rate | 10.2 | % | 11.0 | % | 10.8 | % |
Anticipated net credit losses (2) | NM | | 0.5% to 85.6% | | 8.0% to 63.7% | |
Weighted average anticipated net credit losses | NM | | 31.4 | % | 48.3 | % |
Weighted average life | 0.2 to 28.8 years | | 5.0 to 8.5 years | | 1.2 to 12.1 years | |
(1) | Disclosure of non-agency-sponsored mortgages as senior and subordinated interests is indicative of the interests' position in the capital structure of the securitization. |
(2) | Anticipated net credit losses represent estimated loss severity associated with defaulted mortgage loans underlying the mortgage securitizations disclosed above. Anticipated net credit losses, in this instance, do not represent total credit losses incurred to date, nor do they represent credit losses expected on retained interests in mortgage securitizations. |
NM | Anticipated net credit losses are not meaningful due to U.S. agency guarantees. |
| June 30, 2017 | ||||||||
|
| Non-agency-sponsored mortgages (1) | |||||||
In millions of dollars | U.S. agency- | Senior | Subordinated | ||||||
Carrying value of retained interests | $ | 1,895 | | $ | 13 | | $ | 153 | |
Discount rates |
|
|
| ||||||
Adverse change of 10% | $ | (52 | ) | $ | (3 | ) | $ | (6 | ) |
Adverse change of 20% | (102 | ) | (7 | ) | (12 | ) | |||
Constant prepayment rate |
|
|
| ||||||
Adverse change of 10% | (39 | ) | (1 | ) | (3 | ) | |||
Adverse change of 20% | (80 | ) | (2 | ) | (6 | ) | |||
Anticipated net credit losses |
|
|
| ||||||
Adverse change of 10% | NM | | (4 | ) | (1 | ) | |||
Adverse change of 20% | NM | | (9 | ) | (1 | ) | |||
| December 31, 2016 | ||||||||
|
| Non-agency-sponsored mortgages (1) | |||||||
In millions of dollars | U.S. agency- | Senior | Subordinated | ||||||
Carrying value of retained interests | $ | 2,258 | | $ | 26 | | $ | 161 | |
Discount rates |
|
|
| ||||||
Adverse change of 10% | $ | (71 | ) | $ | (7 | ) | $ | (8 | ) |
Adverse change of 20% | (138 | ) | (14 | ) | (16 | ) | |||
Constant prepayment rate |
|
|
| ||||||
Adverse change of 10% | (80 | ) | (2 | ) | (4 | ) | |||
Adverse change of 20% | (160 | ) | (3 | ) | (8 | ) | |||
Anticipated net credit losses |
|
|
| ||||||
Adverse change of 10% | NM | | (7 | ) | (1 | ) | |||
Adverse change of 20% | NM | | (14 | ) | (2 | ) | |||
(1) | Disclosure of non-agency-sponsored mortgages as senior and subordinated interests is indicative of the interests' position in the capital structure of the securitization. |
NM | Anticipated net credit losses are not meaningful due to U.S. agency guarantees. |
162
Mortgage Servicing Rights (MSRs)
The fair value of Citi's capitalized MSRs was $560 million and $1.3 billion at June 30, 2017 and 2016 , respectively. The MSRs correspond to principal loan balances of $135 billion and $186 billion as of June 30, 2017 and 2016 , respectively. The following table summarizes the changes in capitalized MSRs:
| Three Months Ended June 30, | |||||
In millions of dollars | 2017 | 2016 | ||||
Balance, as of March 31 | $ | 567 | | $ | 1,524 | |
Originations | 21 | | 35 | | ||
Changes in fair value of MSRs due to changes in inputs and assumptions | (11 | ) | (137 | ) | ||
Other changes (1) | (17 | ) | (98 | ) | ||
Sale of MSRs (2) | - | | - | | ||
Balance, as of June 30 | $ | 560 | | $ | 1,324 | |
| Six Months Ended June 30, | |||||
In millions of dollars | 2017 | 2016 | ||||
Balance, beginning of year | $ | 1,564 | | $ | 1,781 | |
Originations | 56 | | 68 | | ||
Changes in fair value of MSRs due to changes in inputs and assumptions | 56 | | (362 | ) | ||
Other changes (1) | (70 | ) | (177 | ) | ||
Sale of MSRs (2) | (1,046 | ) | 14 | | ||
Balance, as of June 30 | $ | 560 | | $ | 1,324 | |
(1) | Represents changes due to customer payments and passage of time. |
(2) | See Note 2 to the Consolidated Financial Statements for more information on the exit of the U.S. mortgage servicing operations and sale of MSRs. 2016 amount includes sales of credit challenged MSRs for which Citi paid the new servicer. |
The Company receives fees during the course of servicing previously securitized mortgages. The amounts of these fees were as follows:
| Three Months Ended June 30, | Six Months Ended June 30, | ||||||||||
In millions of dollars | 2017 | 2016 | 2017 | 2016 | ||||||||
Servicing fees | $ | 65 | | $ | 126 | | $ | 171 | | $ | 254 | |
Late fees | 3 | | 4 | | 6 | | 8 | | ||||
Ancillary fees | 4 | | 4 | | 8 | | 9 | | ||||
Total MSR fees | $ | 72 | | $ | 134 | | $ | 185 | | $ | 271 | |
In the Consolidated Statement of Income these fees are primarily classified as Commissions and fees and changes in MSR fair values are classified as Other revenue .
Re-securitizations
The Company engages in re-securitization transactions in which debt securities are transferred to a VIE in exchange for new beneficial interests. Citi did not transfer non-agency (private-label) securities to re-securitization entities during the three and six months ended June 30, 2017 and 2016 . These securities are backed by either residential or commercial mortgages and are often structured on behalf of clients.
As of June 30, 2017 , the fair value of Citi-retained interests in private-label re-securitization transactions structured by Citi totaled approximately $112 million (all related to re-securitization transactions executed prior to 2017 ), which has been recorded in Trading account assets . Of this amount, substantially all was related to subordinated beneficial interests. As of December 31, 2016 , the fair value of Citi-retained interests in private-label re-securitization transactions structured by Citi totaled approximately $126 million (all related to re-securitization transactions executed prior to 2016 ). Of this amount, substantially all was related to subordinated beneficial interests. The original par value of private-label re-securitization transactions in which Citi holds a retained interest as of June 30, 2017 and December 31, 2016 was approximately $1.1 billion and $1.3 billion , respectively.
The Company also re-securitizes U.S. government-agency guaranteed mortgage-backed (agency) securities. During the three and six months ended June 30, 2017 , Citi transferred agency securities with a fair value of approximately $5.6 billion and $10.1 billion , respectively, to re-securitization entities compared to approximately $6.9 billion and $14.2 billion for the three and six months ended June 30, 2016 .
As of June 30, 2017 , the fair value of Citi-retained interests in agency re-securitization transactions structured by Citi totaled approximately $2.5 billion (including $1.0 billion related to re-securitization transactions executed in 2017 ) compared to $2.3 billion as of December 31, 2016 (including $741 million related to re-securitization transactions executed in 2016 ), which is recorded in Trading account assets . The original fair value of agency re-securitization transactions in which Citi holds a retained interest as of June 30, 2017 and December 31, 2016 was approximately $68.9 billion and $71.8 billion , respectively.
As of June 30, 2017 and December 31, 2016 , the Company did not consolidate any private-label or agency re-securitization entities.
163
Citi-Administered Asset-Backed Commercial Paper Conduits
At June 30, 2017 and December 31, 2016 , the commercial paper conduits administered by Citi had approximately $18.8 billion and $19.7 billion of purchased assets outstanding, respectively, and had incremental funding commitments with clients of approximately $14.2 billion and $12.8 billion , respectively.
Substantially all of the funding of the conduits is in the form of short-term commercial paper. At June 30, 2017 and December 31, 2016 , the weighted average remaining lives of the commercial paper issued by the conduits were approximately 55 days .
The primary credit enhancement provided to the conduit investors is in the form of transaction-specific credit enhancements described above. In addition to the transaction-specific credit enhancements, the conduits, other than the government guaranteed loan conduit, have obtained a letter of credit from the Company, which is equal to at least 8% to 10% of the conduit's assets with a minimum of $200 million . The letters of credit provided by the Company to the conduits total approximately $1.7 billion and $1.8 billion as of June 30, 2017 and December 31, 2016 , respectively. The net result across multi-seller conduits administered by the Company is that, in the event defaulted assets exceed the transaction-specific credit enhancements described above, any losses in each conduit are allocated first to the Company and then the commercial paper investors.
At June 30, 2017 and December 31, 2016 , the Company owned $9.0 billion and $9.7 billion , respectively, of the commercial paper issued by its administered conduits. The Company's investments were not driven by market illiquidity and the Company is not obligated under any agreement to purchase the commercial paper issued by the conduits.
Collateralized Loan Obligations
The following table summarizes selected cash flow information related to Citigroup CLOs:
| Three Months Ended June 30, | |||||
In billions of dollars | 2017 | 2016 | ||||
Proceeds from new securitizations | $ | 1.1 | | $ | 2.0 | |
| Six Months Ended June 30, | |||||
In billions of dollars | 2017 | 2016 | ||||
Proceeds from new securitizations | $ | 1.4 | | $ | 2.0 | |
The key assumptions used to value retained interests in CLOs, and the sensitivity of the fair value to adverse changes of 10% and 20% are set forth in the tables below:
| June 30, 2017 | Dec. 31, 2016 |
Discount rate | 1.1% to 1.7% | 1.3% to 1.7% |
In millions of dollars | June 30, 2017 | Dec. 31, 2016 | ||||
Carrying value of retained interests | $ | 3,969 | | $ | 4,261 | |
Discount rates |
|
| ||||
Adverse change of 10% | $ | (27 | ) | $ | (30 | ) |
Adverse change of 20% | (53 | ) | (62 | ) | ||
Asset-Based Financing
The primary types of Citi's asset-based financings, total assets of the unconsolidated VIEs with significant involvement, and Citi's maximum exposure to loss are shown below. For Citi to realize the maximum loss, the VIE (borrower) would have to default with no recovery from the assets held by the VIE.
| June 30, 2017 | |||||
In millions of dollars | Total | Maximum | ||||
Type |
|
| ||||
Commercial and other real estate | $ | 9,084 | | $ | 2,953 | |
Corporate loans | 3,242 | | 1,872 | | ||
Hedge funds and equities | 419 | | 58 | | ||
Airplanes, ships and other assets | 37,167 | | 16,609 | | ||
Total | $ | 49,912 | | $ | 21,492 | |
| December 31, 2016 | |||||
In millions of dollars | Total | Maximum | ||||
Type |
|
| ||||
Commercial and other real estate | $ | 8,784 | | $ | 2,368 | |
Corporate loans | 4,051 | | 2,684 | | ||
Hedge funds and equities | 370 | | 54 | | ||
Airplanes, ships and other assets | 39,230 | | 16,837 | | ||
Total | $ | 52,435 | | $ | 21,943 | |
Municipal Securities Tender Option Bond (TOB) Trusts
At June 30, 2017 , none of the municipal bonds owned by non-customer TOB trusts were subject to a credit guarantee provided by the Company. At December 31, 2016 , approximately $82 million of the municipal bonds owned by non-customer TOB trusts were subject to a credit guarantee provided by the Company.
At June 30, 2017 and December 31, 2016 , liquidity agreements provided with respect to customer TOB trusts totaled $2.9 billion and $2.9 billion , respectively, of which $2.0 billion and $2.1 billion , respectively, were offset by reimbursement agreements. For the remaining exposure related to TOB transactions, where the residual owned by the customer was at least 25% of the bond value at the inception of the transaction, no reimbursement agreement was executed.
The Company also provides other liquidity agreements or letters of credit to customer-sponsored municipal investment funds, which are not variable interest entities, and municipality-related issuers that totaled $6.0 billion and $7.4 billion as of June 30, 2017 and December 31, 2016 , respectively. These liquidity agreements and letters of credit are offset by reimbursement agreements with various term-out provisions.
Client Intermediation
The proceeds from new securitizations related to the Company's client intermediation transactions for the three and six months ended June 30, 2017 totaled approximately $0.2 billion and $0.7 billion , respectively, compared to $0.8 billion and $1.4 billion for the three and six months ended June 30, 2016 .
164
19. DERIVATIVES ACTIVITIES
In the ordinary course of business, Citigroup enters into various types of derivative transactions. For additional information regarding Citi's use of and accounting for derivatives, see Note 22 to the Consolidated Financial Statements in Citi's 2016 Annual Report on Form 10-K.
Information pertaining to Citigroup's derivative activities, based on notional amounts is presented in the table below. Derivative notional amounts, are reference amounts from which contractual payments are derived and do not represent a complete and accurate measure of Citi's exposure to derivative transactions. Rather, Citi's derivative exposure arises primarily from market fluctuations (i.e., market risk), counterparty failure (i.e., credit risk) and/or periods of high volatility or financial stress (i.e., liquidity risk), as well as any market valuation adjustments that may be required on the transactions. Moreover, notional amounts do not reflect the netting of offsetting trades. For example, if Citi enters into a receive-fixed interest rate swap with $100 million notional, and offsets this risk with an identical but opposite pay-fixed position with a different counterparty, $200 million in derivative notionals is reported, although these offsetting positions may result in de minimis overall market risk. Aggregate derivative notional amounts can fluctuate from period to period in the normal course of business based on Citi's market share, levels of client activity and other factors.
165
Derivative Notionals
| Hedging instruments under ASC 815 (1)(2) | Other derivative instruments | ||||||||||||||||
| | | Trading derivatives | Management hedges (3) | ||||||||||||||
In millions of dollars | June 30, | December 31, | June 30, | December 31, | June 30, | December 31, | ||||||||||||
Interest rate contracts |
|
|
|
|
|
| ||||||||||||
Swaps | $ | 185,341 | | $ | 151,331 | | $ | 22,079,797 | | $ | 19,145,250 | | $ | 53,242 | | $ | 47,324 | |
Futures and forwards | 15 | | 97 | | 8,025,915 | | 6,864,276 | | 14,447 | | 30,834 | | ||||||
Written options | - | | | | 3,433,889 | | 2,921,070 | | 1,822 | | 4,759 | | ||||||
Purchased options | - | | - | | 3,329,915 | | 2,768,528 | | 2,330 | | 7,320 | | ||||||
Total interest rate contract notionals | $ | 185,356 | | $ | 151,428 | | $ | 36,869,516 | | $ | 31,699,124 | | $ | 71,841 | | $ | 90,237 | |
Foreign exchange contracts |
|
|
|
|
|
| ||||||||||||
Swaps | $ | 37,395 | | $ | 19,042 | | $ | 6,407,798 | | $ | 5,492,145 | | $ | 26,221 | | $ | 22,676 | |
Futures, forwards and spot | 35,815 | | 56,964 | | 4,302,684 | | 3,251,132 | | 5,730 | | 3,419 | | ||||||
Written options | 1,447 | | - | | 1,375,250 | | 1,194,325 | | - | | - | | ||||||
Purchased options | 6,672 | | - | | 1,383,864 | | 1,215,961 | | - | | - | | ||||||
Total foreign exchange contract notionals | $ | 81,329 | | $ | 76,006 | | $ | 13,469,596 | | $ | 11,153,563 | | $ | 31,951 | | $ | 26,095 | |
Equity contracts |
|
|
|
|
|
| ||||||||||||
Swaps | $ | - | | $ | - | | $ | 197,046 | | $ | 192,366 | | $ | - | | $ | - | |
Futures and forwards | - | | - | | 46,582 | | 37,557 | | - | | - | | ||||||
Written options | - | | - | | 370,016 | | 304,579 | | - | | - | | ||||||
Purchased options | - | | - | | 324,314 | | 266,070 | | - | | - | | ||||||
Total equity contract notionals | $ | - | | $ | - | | $ | 937,958 | | $ | 800,572 | | $ | - | | $ | - | |
Commodity and other contracts |
|
|
|
|
|
| ||||||||||||
Swaps | $ | - | | $ | - | | $ | 68,690 | | $ | 70,774 | | $ | - | | $ | - | |
Futures and forwards | 156 | | 182 | | 153,554 | | 142,530 | | - | | - | | ||||||
Written options | - | | - | | 69,294 | | 74,627 | | - | | - | | ||||||
Purchased options | - | | - | | 68,098 | | 69,629 | | - | | - | | ||||||
Total commodity and other contract notionals | $ | 156 | | $ | 182 | | $ | 359,636 | | $ | 357,560 | | $ | - | | $ | - | |
Credit derivatives (4) |
|
|
|
|
|
| ||||||||||||
Protection sold | $ | - | | $ | - | | $ | 845,028 | | $ | 859,420 | | $ | 64 | | $ | - | |
Protection purchased | - | | - | | 856,947 | | 883,003 | | 14,103 | | 19,470 | | ||||||
Total credit derivatives | $ | - | | $ | - | | $ | 1,701,975 | | $ | 1,742,423 | | $ | 14,167 | | $ | 19,470 | |
Total derivative notionals | $ | 266,841 | | $ | 227,616 | | $ | 53,338,681 | | $ | 45,753,242 | | $ | 117,959 | | $ | 135,802 | |
(1) | The notional amounts presented in this table do not include hedge accounting relationships under ASC 815 where Citigroup is hedging the foreign currency risk of a net investment in a foreign operation by issuing a foreign-currency-denominated debt instrument. The notional amount of such debt was $1,297 million and $1,825 million at June 30, 2017 and December 31, 2016 , respectively. |
(2) | Derivatives in hedge accounting relationships accounted for under ASC 815 are recorded in either Other assets/Other liabilities or Trading account assets/Trading account liabilities on the Consolidated Balance Sheet. |
(3) | Management hedges represent derivative instruments used to mitigate certain economic risks, but for which hedge accounting is not applied. These derivatives are recorded in either Other assets/Other liabilities or Trading account assets/Trading account liabilities on the Consolidated Balance Sheet. |
(4) | Credit derivatives are arrangements designed to allow one party (protection buyer) to transfer the credit risk of a "reference asset" to another party (protection seller). These arrangements allow a protection seller to assume the credit risk associated with the reference asset without directly purchasing that asset. The Company enters into credit derivative positions for purposes such as risk management, yield enhancement, reduction of credit concentrations and diversification of overall risk. |
166
The following tables present the gross and net fair values of the Company's derivative transactions and the related offsetting amounts as of June 30, 2017 and December 31, 2016 . Gross positive fair values are offset against gross negative fair values by counterparty pursuant to enforceable master netting agreements. Under ASC 815-10-45, payables and receivables in respect of cash collateral received from or paid to a given counterparty pursuant to a credit support annex are included in the offsetting amount if a legal opinion supporting the enforceability of netting and collateral rights has been obtained. GAAP does not permit similar offsetting for security collateral.
The tables also present amounts that are not permitted to be offset, such as security collateral or cash collateral posted at third-party custodians, but which would be eligible for offsetting to the extent an event of default occurred and a legal opinion supporting enforceability of the netting and collateral rights has been obtained.
167
Derivative Mark-to-Market (MTM) Receivables/Payables
In millions of dollars at June 30, 2017 | Derivatives classified in Trading account assets / liabilities (1)(2)(3) | Derivatives classified in Other assets / liabilities (2)(3) | ||||||||||
Derivatives instruments designated as ASC 815 hedges | Assets | Liabilities | Assets | Liabilities | ||||||||
Over-the-counter | $ | 4,089 | | $ | 271 | | $ | 1,270 | | $ | 20 | |
Cleared | 330 | | 1,757 | | 34 | | 73 | | ||||
Interest rate contracts | $ | 4,419 | | $ | 2,028 | | $ | 1,304 | | $ | 93 | |
Over-the-counter | $ | 1,058 | | $ | 795 | | $ | 411 | | $ | 384 | |
Foreign exchange contracts | $ | 1,058 | | $ | 795 | | $ | 411 | | $ | 384 | |
Total derivatives instruments designated as ASC 815 hedges | $ | 5,477 | | $ | 2,823 | | $ | 1,715 | | $ | 477 | |
Derivatives instruments not designated as ASC 815 hedges | | | | | ||||||||
Over-the-counter | $ | 212,052 | | $ | 193,609 | | $ | 38 | | $ | 1 | |
Cleared | 88,092 | | 94,441 | | 101 | | 138 | | ||||
Exchange traded | 137 | | 116 | | - | | - | | ||||
Interest rate contracts | $ | 300,281 | | $ | 288,166 | | $ | 139 | | $ | 139 | |
Over-the-counter | $ | 142,009 | | $ | 143,455 | | $ | - | | $ | - | |
Cleared | 2,667 | | 2,611 | | - | | - | | ||||
Exchange traded | 81 | | 76 | | - | | - | | ||||
Foreign exchange contracts | $ | 144,757 | | $ | 146,142 | | $ | - | | $ | - | |
Over-the-counter | $ | 16,262 | | $ | 20,994 | | $ | - | | $ | - | |
Cleared | 21 | | 12 | | - | | - | | ||||
Exchange traded | 7,885 | | 7,998 | | - | | - | | ||||
Equity contracts | $ | 24,168 | | $ | 29,004 | | $ | - | | $ | - | |
Over-the-counter | $ | 9,506 | | $ | 11,894 | | $ | - | | $ | - | |
Exchange traded | 642 | | 647 | | - | | - | | ||||
Commodity and other contracts | $ | 10,148 | | $ | 12,541 | | $ | - | | $ | - | |
Over-the-counter | $ | 16,325 | | $ | 17,190 | | $ | 49 | | $ | 58 | |
Cleared | 7,575 | | 7,906 | | 32 | | 292 | | ||||
Credit derivatives (4) | $ | 23,900 | | $ | 25,096 | | $ | 81 | | $ | 350 | |
Total derivatives instruments not designated as ASC 815 hedges | $ | 503,254 | | $ | 500,949 | | $ | 220 | | $ | 489 | |
Total derivatives | $ | 508,731 | | $ | 503,772 | | $ | 1,935 | | $ | 966 | |
Cash collateral paid/received (5)(6) | $ | 12,540 | | $ | 14,227 | | $ | - | | $ | 43 | |
Less: Netting agreements (7) | (424,492 | ) | (424,492 | ) | - | | - | | ||||
Less: Netting cash collateral received/paid (8) | (38,743 | ) | (42,570 | ) | (993 | ) | (56 | ) | ||||
Net receivables/payables included on the Consolidated Balance Sheet (9) | $ | 58,036 | | $ | 50,937 | | $ | 942 | | $ | 953 | |
Additional amounts subject to an enforceable master netting agreement, but not offset on the Consolidated Balance Sheet |
|
|
|
| ||||||||
Less: Cash collateral received/paid | $ | (657 | ) | $ | (55 | ) | $ | - | | $ | - | |
Less: Non-cash collateral received/paid | (11,359 | ) | (8,039 | ) | (295 | ) | - | | ||||
Total net receivables/payables (9) | $ | 46,020 | | $ | 42,843 | | $ | 647 | | $ | 953 | |
(1) | The trading derivatives fair values are presented in Note 20 to the Consolidated Financial Statements. |
(2) | Derivative mark-to-market receivables/payables related to management hedges are recorded in either Other assets/Other liabilities or Trading account assets/Trading account liabilities . |
(3) | Over-the-counter (OTC) derivatives are derivatives executed and settled bilaterally with counterparties without the use of an organized exchange or central clearing house. Cleared derivatives include derivatives executed bilaterally with a counterparty in the OTC market, but then novated to a central clearing house, whereby the central clearing house becomes the counterparty to both of the original counterparties. Exchange traded derivatives include derivatives executed directly on an organized exchange that provides pre-trade price transparency. |
(4) | The credit derivatives trading assets comprise $5,801 million related to protection purchased and $18,099 million related to protection sold as of June 30, 2017 . The credit derivatives trading liabilities comprise $19,400 million related to protection purchased and $5,696 million related to protection sold as of June 30, 2017 . |
(5) | For the trading account assets/liabilities, reflects the net amount of the $55,110 million and $52,970 million of gross cash collateral paid and received, respectively. Of the gross cash collateral paid, $42,570 million was used to offset trading derivative liabilities and, of the gross cash collateral received, $38,743 million was used to offset trading derivative assets. |
168
(6) | For cash collateral paid with respect to non-trading derivative assets, reflects the net amount of $56 million of gross cash collateral paid, of which $56 million is netted against non-trading derivative positions within Other liabilities . For cash collateral received with respect to non-trading derivative liabilities, reflects the net amount of $1,036 million of gross cash collateral received, of which $993 million is netted against non-trading derivative positions within Other assets . |
(7) | Represents the netting of derivative receivable and payable balances with the same counterparty under enforceable netting agreements. Approximately $321 billion , $95 billion and $8 billion of the netting against trading account asset/liability balances is attributable to each of the OTC, cleared and exchange-traded derivatives, respectively. |
(8) | Represents the netting of cash collateral paid and received by counterparty under enforceable credit support agreements. Substantially all cash collateral received and paid is netted against OTC derivative assets and liabilities, respectively. |
(9) | The net receivables/payables include approximately $4 billion of derivative asset and $7 billion of derivative liability fair values not subject to enforceable master netting agreements, respectively. |
In millions of dollars at December 31, 2016 | Derivatives classified in Trading account assets / liabilities (1)(2)(3) | Derivatives classified in Other assets / liabilities (2)(3) | ||||||||||
Derivatives instruments designated as ASC 815 hedges | Assets | Liabilities | Assets | Liabilities | ||||||||
Over-the-counter | $ | 716 | | $ | 171 | | $ | 1,927 | | $ | 22 | |
Cleared | 3,530 | | 2,154 | | 47 | | 82 | | ||||
Interest rate contracts | $ | 4,246 | | $ | 2,325 | | $ | 1,974 | | $ | 104 | |
Over-the-counter | $ | 2,494 | | $ | 393 | | $ | 747 | | $ | 645 | |
Foreign exchange contracts | $ | 2,494 | | $ | 393 | | $ | 747 | | $ | 645 | |
Total derivatives instruments designated as ASC 815 hedges | $ | 6,740 | | $ | 2,718 | | $ | 2,721 | | $ | 749 | |
Derivatives instruments not designated as ASC 815 hedges | | | | | ||||||||
Over-the-counter | $ | 244,072 | | $ | 221,534 | | $ | 225 | | $ | 5 | |
Cleared | 120,920 | | 130,855 | | 240 | | 349 | | ||||
Exchange traded | 87 | | 47 | | - | | - | | ||||
Interest rate contracts | $ | 365,079 | | $ | 352,436 | | $ | 465 | | $ | 354 | |
Over-the-counter | $ | 182,659 | | $ | 186,867 | | $ | - | | $ | 60 | |
Cleared | 482 | | 470 | | - | | - | | ||||
Exchange traded | 27 | | 31 | | - | | - | | ||||
Foreign exchange contracts | $ | 183,168 | | $ | 187,368 | | $ | - | | $ | 60 | |
Over-the-counter | $ | 15,625 | | $ | 19,119 | | $ | - | | $ | - | |
Cleared | 1 | | 21 | | - | | - | | ||||
Exchange traded | 8,484 | | 7,376 | | - | | - | | ||||
Equity contracts | $ | 24,110 | | $ | 26,516 | | $ | - | | $ | - | |
Over-the-counter | $ | 13,046 | | $ | 14,234 | | $ | - | | $ | - | |
Exchange traded | 719 | | 798 | | - | | - | | ||||
Commodity and other contracts | $ | 13,765 | | $ | 15,032 | | $ | - | | $ | - | |
Over-the-counter | $ | 19,033 | | $ | 19,563 | | $ | 159 | | $ | 78 | |
Cleared | 5,582 | | 5,874 | | 47 | | 310 | | ||||
Credit derivatives (4) | $ | 24,615 | | $ | 25,437 | | $ | 206 | | $ | 388 | |
Total derivatives instruments not designated as ASC 815 hedges | $ | 610,737 | | $ | 606,789 | | $ | 671 | | $ | 802 | |
Total derivatives | $ | 617,477 | | $ | 609,507 | | $ | 3,392 | | $ | 1,551 | |
Cash collateral paid/received (5)(6) | $ | 11,188 | | $ | 15,731 | | $ | 8 | | $ | 1 | |
Less: Netting agreements (7) | (519,000 | ) | (519,000 | ) | - | | - | | ||||
Less: Netting cash collateral received/paid (8) | (45,912 | ) | (49,811 | ) | (1,345 | ) | (53 | ) | ||||
Net receivables/payables included on the Consolidated Balance Sheet (9) | $ | 63,753 | | $ | 56,427 | | $ | 2,055 | | $ | 1,499 | |
Additional amounts subject to an enforceable master netting agreement, but not offset on the Consolidated Balance Sheet |
|
|
|
| ||||||||
Less: Cash collateral received/paid | $ | (819 | ) | $ | (19 | ) | $ | - | | $ | - | |
Less: Non-cash collateral received/paid | (11,767 | ) | (5,883 | ) | (530 | ) | - | | ||||
Total net receivables/payables (9) | $ | 51,167 | | $ | 50,525 | | $ | 1,525 | | $ | 1,499 | |
(1) | The trading derivatives fair values are presented in Note 20 to the Consolidated Financial Statements. |
(2) | Derivative mark-to-market receivables/payables related to management hedges are recorded in either Other assets/Other liabilities or Trading account assets/Trading account liabilities . |
(3) | Over-the-counter (OTC) derivatives are derivatives executed and settled bilaterally with counterparties without the use of an organized exchange or central clearing house. Cleared derivatives include derivatives executed bilaterally with a counterparty in the OTC market, but then novated to a central clearing house, |
169
whereby the central clearing house becomes the counterparty to both of the original counterparties. Exchange traded derivatives include derivatives executed directly on an organized exchange that provides pre-trade price transparency.
(4) | The credit derivatives trading assets comprise $8,871 million related to protection purchased and $15,744 million related to protection sold as of December 31, 2016 . The credit derivatives trading liabilities comprise $16,722 million related to protection purchased and $8,715 million related to protection sold as of December 31, 2016 . |
(5) | For the trading account assets/liabilities, reflects the net amount of the $60,999 million and $61,643 million of gross cash collateral paid and received, respectively. Of the gross cash collateral paid, $49,811 million was used to offset trading derivative liabilities and, of the gross cash collateral received, $45,912 million was used to offset trading derivative assets. |
(6) | For cash collateral paid with respect to non-trading derivative assets, reflects the net amount of $61 million of gross cash collateral paid, of which $53 million is netted against non-trading derivative positions within Other liabilities . For cash collateral received with respect to non-trading derivative liabilities, reflects the net amount of $1,346 million of gross cash collateral received, of which $1,345 million is netted against OTC non-trading derivative positions within Other assets . |
(7) | Represents the netting of derivative receivable and payable balances with the same counterparty under enforceable netting agreements. Approximately $383 billion , $128 billion and $8 billion of the netting against trading account asset/liability balances is attributable to each of the OTC, cleared and exchange-traded derivatives, respectively. |
(8) | Represents the netting of cash collateral paid and received by counterparty under enforceable credit support agreements. Substantially all cash collateral received and paid is netted against OTC derivative assets and liabilities, respectively. |
(9) | The net receivables/payables include approximately $7 billion of derivative asset and $9 billion of derivative liability fair values not subject to enforceable master netting agreements, respectively. |
For the three and six months ended June 30, 2017 and 2016 , the amounts recognized in Principal transactions in the Consolidated Statement of Income related to derivatives not designated in a qualifying hedging relationship, as well as the underlying non-derivative instruments, are presented in Note 6 to the Consolidated Financial Statements. Citigroup presents this disclosure by business classification, showing derivative gains and losses related to its trading activities together with gains and losses related to non-derivative instruments within the same trading portfolios, as this represents how these portfolios are risk managed.
The amounts recognized in Other revenue in the Consolidated Statement of Income related to derivatives not designated in a qualifying hedging relationship are shown below. The table below does not include any offsetting gains/losses on the economically hedged items to the extent such amounts are also recorded in Other revenue .
| Gains (losses) included in | |||||||||||
| Three Months Ended June 30, | Six Months Ended June 30, | ||||||||||
In millions of dollars | 2017 | 2016 | 2017 | 2016 | ||||||||
Interest rate contracts | $ | 11 | | $ | 11 | | $ | (34 | ) | $ | 26 | |
Foreign exchange | 23 | | 11 | | 26 | | 15 | | ||||
Credit derivatives | (80 | ) | (348 | ) | (343 | ) | (562 | ) | ||||
Total Citigroup | $ | (46 | ) | $ | (326 | ) | $ | (351 | ) | $ | (521 | ) |
170
The following table summarizes the gains (losses) on the Company's fair value hedges:
| Gains (losses) on fair value hedges (1) | |||||||||||
| Three Months Ended June 30, | Six Months Ended June 30, | ||||||||||
In millions of dollars | 2017 | 2016 | 2017 | 2016 | ||||||||
Gain (loss) on the derivatives in designated and qualifying fair value hedges |
|
|
|
| ||||||||
Interest rate contracts | $ | (71 | ) | $ | 1,082 | | $ | (376 | ) | $ | 3,197 | |
Foreign exchange contracts | (555 | ) | (397 | ) | (637 | ) | (1,758 | ) | ||||
Commodity contracts | (11 | ) | 89 | | (9 | ) | 438 | | ||||
Total gain (loss) on the derivatives in designated and qualifying fair value hedges | $ | (637 | ) | $ | 774 | | $ | (1,022 | ) | $ | 1,877 | |
Gain (loss) on the hedged item in designated and qualifying fair value hedges |
|
|
|
| ||||||||
Interest rate hedges | $ | 47 | | $ | (1,053 | ) | $ | 343 | | $ | (3,143 | ) |
Foreign exchange hedges | 570 | | 454 | | 766 | | 1,761 | | ||||
Commodity hedges | 11 | | (89 | ) | 10 | | (433 | ) | ||||
Total gain (loss) on the hedged item in designated and qualifying fair value hedges | $ | 628 | | $ | (688 | ) | $ | 1,119 | | $ | (1,815 | ) |
Hedge ineffectiveness recognized in earnings on designated and qualifying fair value hedges |
|
|
|
| ||||||||
Interest rate hedges | $ | (16 | ) | $ | 32 | | $ | (26 | ) | $ | 59 | |
Foreign exchange hedges | (13 | ) | 25 | | 49 | | (50 | ) | ||||
Total hedge ineffectiveness recognized in earnings on designated and qualifying fair value hedges | $ | (29 | ) | $ | 57 | | $ | 23 | | $ | 9 | |
Net gain (loss) excluded from assessment of the effectiveness of fair value hedges |
|
|
|
| ||||||||
Interest rate contracts | $ | (8 | ) | $ | (3 | ) | $ | (7 | ) | $ | (5 | ) |
Foreign exchange contracts (2) | 28 | | 32 | | 80 | | 53 | | ||||
Commodity hedges | - | | - | | 1 | | 5 | | ||||
Total net gain (loss) excluded from assessment of the effectiveness of fair value hedges | $ | 20 | | $ | 29 | | $ | 74 | | $ | 53 | |
(1) | Amounts are included in Other revenue on the Consolidated Statement of Income. The accrued interest income on fair value hedges is recorded in Net interest revenue and is excluded from this table. |
(2) | Amounts relate to the premium associated with forward contracts (differential between spot and contractual forward rates). These amounts are excluded from the assessment of hedge effectiveness and are reflected directly in earnings. |
171
Cash Flow Hedges
The amount of hedge ineffectiveness on the cash flow hedges recognized in earnings for the three and six months ended June 30, 2017 and 2016 is not significant. The pretax change in AOCI from cash flow hedges is presented below:
| Three Months Ended June 30, | Six Months Ended June 30, | ||||||||||
In millions of dollars | 2017 | 2016 | 2017 | 2016 | ||||||||
Effective portion of cash flow hedges included in AOCI |
|
|
|
| ||||||||
Interest rate contracts | $ | 97 | | $ | 220 | | $ | 139 | | $ | 635 | |
Foreign exchange contracts | - | | (21 | ) | - | | 3 | | ||||
Total effective portion of cash flow hedges included in AOCI | $ | 97 | | $ | 199 | | $ | 139 | | $ | 638 | |
Effective portion of cash flow hedges reclassified from AOCI to earnings | | |
|
| ||||||||
Interest rate contracts | $ | (90 | ) | $ | (41 | ) | $ | (46 | ) | $ | (57 | ) |
Foreign exchange contracts | 2 | | (17 | ) | (1 | ) | (43 | ) | ||||
Total effective portion of cash flow hedges reclassified from AOCI to earnings (1) | $ | (88 | ) | $ | (58 | ) | $ | (47 | ) | $ | (100 | ) |
(1) | Included primarily in Other revenue and Net interest revenue on the Consolidated Income Statement. |
For cash flow hedges, the changes in the fair value of the hedging derivative remain in AOCI on the Consolidated Balance Sheet and will be included in the earnings of future periods to offset the variability of the hedged cash flows when such cash flows affect earnings. The net gain (loss) associated with cash flow hedges expected to be reclassified from AOCI within 12 months of June 30, 2017 is approximately $ (199) million . The maximum length of time over which forecasted cash flows are hedged is 10 years .
The after-tax impact of cash flow hedges on AOCI is shown in Note 17 to the Consolidated Financial Statements.
Net Investment Hedges
The pretax gain (loss) recorded in the Foreign currency translation adjustment account within AOCI, related to the effective portion of the net investment hedges, is $ (32) million and $ (1,748) million for the three and six months ended June 30, 2017 and $ (47) million and $ (1,420) million for the three and six months ended June 30, 2016, respectively.
172
The following tables summarize the key characteristics of Citi's credit derivatives portfolio by counterparty and derivative form:
| Fair values | Notionals | ||||||||||
In millions of dollars at June 30, 2017 | Receivable (1) | Payable (2) | Protection | Protection | ||||||||
By industry/counterparty | | | | | ||||||||
Banks | $ | 10,015 | | $ | 9,077 | | $ | 336,802 | | $ | 352,533 | |
Broker-dealers | 3,030 | | 3,252 | | 91,096 | | 100,526 | | ||||
Non-financial | 68 | | 78 | | 3,798 | | 1,561 | | ||||
Insurance and other financial institutions | 10,868 | | 13,039 | | 439,354 | | 390,472 | | ||||
Total by industry/counterparty | $ | 23,981 | | $ | 25,446 | | $ | 871,050 | | $ | 845,092 | |
By instrument | | | | | ||||||||
Credit default swaps and options | $ | 23,582 | | $ | 23,970 | | $ | 844,661 | | $ | 835,627 | |
Total return swaps and other | 399 | | 1,476 | | 26,389 | | 9,465 | | ||||
Total by instrument | $ | 23,981 | | $ | 25,446 | | $ | 871,050 | | $ | 845,092 | |
By rating | | | | | ||||||||
Investment grade | $ | 10,740 | | $ | 10,839 | | $ | 654,355 | | $ | 642,096 | |
Non-investment grade | 13,241 | | 14,607 | | 216,695 | | 202,996 | | ||||
Total by rating | $ | 23,981 | | $ | 25,446 | | $ | 871,050 | | $ | 845,092 | |
By maturity | | | | | ||||||||
Within 1 year | $ | 3,234 | | $ | 4,172 | | $ | 282,692 | | $ | 281,166 | |
From 1 to 5 years | 18,284 | | 18,452 | | 539,944 | | 522,198 | | ||||
After 5 years | 2,463 | | 2,822 | | 48,414 | | 41,728 | | ||||
Total by maturity | $ | 23,981 | | $ | 25,446 | | $ | 871,050 | | $ | 845,092 | |
(1) | The fair value amount receivable is composed of $ 5,882 million under protection purchased and $ 18,099 million under protection sold. |
(2) | The fair value amount payable is composed of $ 19,750 million under protection purchased and $ 5,696 million under protection sold. |
| Fair values | Notionals | ||||||||||
In millions of dollars at December 31, 2016 | Receivable (1) | Payable (2) | Protection | Protection | ||||||||
By industry/counterparty | | | | | ||||||||
Banks | $ | 11,895 | | $ | 10,930 | | $ | 407,992 | | $ | 414,720 | |
Broker-dealers | 3,536 | | 3,952 | | 115,013 | | 119,810 | | ||||
Non-financial | 82 | | 99 | | 4,014 | | 2,061 | | ||||
Insurance and other financial institutions | 9,308 | | 10,844 | | 375,454 | | 322,829 | | ||||
Total by industry/counterparty | $ | 24,821 | | $ | 25,825 | | $ | 902,473 | | $ | 859,420 | |
By instrument | | | | | ||||||||
Credit default swaps and options | $ | 24,502 | | $ | 24,631 | | $ | 883,719 | | $ | 852,900 | |
Total return swaps and other | 319 | | 1,194 | | 18,754 | | 6,520 | | ||||
Total by instrument | $ | 24,821 | | $ | 25,825 | | $ | 902,473 | | $ | 859,420 | |
By rating | | | | | ||||||||
Investment grade | $ | 9,605 | | $ | 9,995 | | $ | 675,138 | | $ | 648,247 | |
Non-investment grade | 15,216 | | 15,830 | | 227,335 | | 211,173 | | ||||
Total by rating | $ | 24,821 | | $ | 25,825 | | $ | 902,473 | | $ | 859,420 | |
By maturity | | | | | ||||||||
Within 1 year | $ | 4,113 | | $ | 4,841 | | $ | 293,059 | | $ | 287,262 | |
From 1 to 5 years | 17,735 | | 17,986 | | 551,155 | | 523,371 | | ||||
After 5 years | 2,973 | | 2,998 | | 58,259 | | 48,787 | | ||||
Total by maturity | $ | 24,821 | | $ | 25,825 | | $ | 902,473 | | $ | 859,420 | |
173
(1) | The fair value amount receivable is composed of $ 9,077 million under protection purchased and $ 15,744 million under protection sold. |
(2) | The fair value amount payable is composed of $ 17,110 million under protection purchased and $ 8,715 million under protection sold. |
Credit-Risk-Related Contingent Features in Derivatives
Certain derivative instruments contain provisions that require the Company to either post additional collateral or immediately settle any outstanding liability balances upon the occurrence of a specified event related to the credit risk of the Company. These events, which are defined by the existing derivative contracts, are primarily downgrades in the credit ratings of the Company and its affiliates. The fair value (excluding CVA) of all derivative instruments with credit-risk-related contingent features that were in a net liability position at both June 30, 2017 and December 31, 2016 was $ 32 billion and $ 26 billion , respectively. The Company posted $ 28 billion and $ 26 billion as collateral for this exposure in the normal course of business as of June 30, 2017 and December 31, 2016 , respectively.
A downgrade could trigger additional collateral or cash settlement requirements for the Company and certain affiliates. In the event that Citigroup and Citibank were downgraded a single notch by all three major rating agencies as of June 30, 2017 , the Company could be required to post an additional $ 0.7 billion as either collateral or settlement of the derivative transactions. Additionally, the Company could be required to segregate with third-party custodians collateral previously received from existing derivative counterparties in the amount of $ 0.3 billion upon the single notch downgrade, resulting in aggregate cash obligations and collateral requirements of approximately $ 1.0 billion .
Derivatives Accompanied by Financial Asset Transfers
For transfers of financial assets accounted for as a sale by the Company, where the Company has retained substantially all of the economic exposure to the transferred asset through a total return swap executed in contemplation of the initial sale with the same counterparty and still outstanding as of June 30, 2017 , both the asset carrying amounts derecognized and gross cash proceeds received as of the date of derecognition were $2.1 billion . At June 30, 2017 , the fair value of these previously derecognized assets was $2.3 billion . The fair value of the total return swaps was $14 million , recorded as gross derivative assets, and $28 million , recorded as gross derivative liabilities. The balances for the total return swaps are on a gross basis, before the application of counterparty and cash collateral netting, and are included primarily as equity derivatives in the tabular disclosures in this Note.
174
20. FAIR VALUE MEASUREMENT
For additional information regarding fair value measurement at Citi, see Note 24 to the Consolidated Financial Statements in Citi's 2016 Annual Report on Form 10-K.
Market Valuation Adjustments
The table below summarizes the credit valuation adjustments (CVA) and funding valuation adjustments (FVA) applied to the fair value of derivative instruments at June 30, 2017 and December 31, 2016 :
| Credit and funding valuation adjustments contra-liability (contra-asset) | |||||
In millions of dollars | June 30, | December 31, | ||||
Counterparty CVA | $ | (1,128 | ) | $ | (1,488 | ) |
Asset FVA | (457 | ) | (536 | ) | ||
Citigroup (own-credit) CVA | 322 | | 459 | | ||
Liability FVA | 68 | | 62 | | ||
Total CVA-derivative instruments (1) | $ | (1,195 | ) | $ | (1,503 | ) |
(1) | FVA is included with CVA for presentation purposes. |
The table below summarizes pretax gains (losses) related to changes in CVA on derivative instruments, net of hedges, FVA on derivatives and debt valuation adjustments (DVA) on Citi's own fair value option (FVO) liabilities for the periods indicated:
| Credit/funding/debt valuation adjustments gain (loss) | |||||||||||
| Three Months Ended June 30, | Six Months Ended June 30, | ||||||||||
In millions of dollars | 2017 | 2016 | 2017 | 2016 | ||||||||
Counterparty CVA | $ | 80 | | $ | 15 | | $ | 170 | | $ | (93 | ) |
Asset FVA | (13 | ) | (15 | ) | 79 | | (95 | ) | ||||
Own-credit CVA | (53 | ) | (10 | ) | (125 | ) | 124 | | ||||
Liability FVA | 16 | | 18 | | 6 | | 48 | | ||||
Total CVA-derivative instruments | $ | 30 | | $ | 8 | | $ | 130 | | $ | (16 | ) |
DVA related to own FVO liabilities (1) | $ | (132 | ) | $ | 20 | | $ | (227 | ) | $ | 327 | |
Total CVA and DVA (2) | $ | (102 | ) | $ | 28 | | $ | (97 | ) | $ | 311 | |
(1) | See Note 1 and Note 17 to the Consolidated Financial Statements. |
(2) | FVA is included with CVA for presentation purposes. |
175
Items Measured at Fair Value on a Recurring Basis
The following tables present for each of the fair value hierarchy levels the Company's assets and liabilities that are measured at fair value on a recurring basis at June 30, 2017 and December 31, 2016 . The Company may hedge positions that have been classified in the Level 3 category with other financial instruments (hedging instruments) that may be
classified as Level 3, but also with financial instruments classified as Level 1 or Level 2 of the fair value hierarchy. The effects of these hedges are presented gross in the following tables:
In millions of dollars at June 30, 2017 | Level 1 (1) | Level 2 (1) | Level 3 | Gross | Netting (2) | Net | ||||||||||||
Assets |
|
|
|
|
|
| ||||||||||||
Federal funds sold and securities borrowed or purchased under agreements to resell | $ | - | | $ | 177,380 | | $ | 1,002 | | $ | 178,382 | | $ | (35,551 | ) | $ | 142,831 | |
Trading non-derivative assets |
|
|
|
|
|
| ||||||||||||
Trading mortgage-backed securities |
|
|
|
|
|
| ||||||||||||
U.S. government-sponsored agency guaranteed | - | | 24,863 | | 204 | | 25,067 | | - | | 25,067 | | ||||||
Residential | - | | 408 | | 327 | | 735 | | - | | 735 | | ||||||
Commercial | - | | 1,053 | | 318 | | 1,371 | | - | | 1,371 | | ||||||
Total trading mortgage-backed securities | $ | - | | $ | 26,324 | | $ | 849 | | $ | 27,173 | | $ | - | | $ | 27,173 | |
U.S. Treasury and federal agency securities | $ | 20,339 | | $ | 2,843 | | $ | - | | $ | 23,182 | | $ | - | | $ | 23,182 | |
State and municipal | - | | 3,297 | | 284 | | 3,581 | | - | | 3,581 | | ||||||
Foreign government | 45,450 | | 21,855 | | 108 | | 67,413 | | - | | 67,413 | | ||||||
Corporate | 481 | | 14,848 | | 401 | | 15,730 | | - | | 15,730 | | ||||||
Equity securities | 42,333 | | 6,133 | | 240 | | 48,706 | | - | | 48,706 | | ||||||
Asset-backed securities | - | | 2,098 | | 1,570 | | 3,668 | | - | | 3,668 | | ||||||
Other trading assets (3) | 9 | | 10,305 | | 1,803 | | 12,117 | | - | | 12,117 | | ||||||
Total trading non-derivative assets | $ | 108,612 | | $ | 87,703 | | $ | 5,255 | | $ | 201,570 | | $ | - | | $ | 201,570 | |
Trading derivatives | | | | |
|
| ||||||||||||
Interest rate contracts | $ | 149 | | $ | 302,851 | | $ | 1,700 | | $ | 304,700 | |
|
| ||||
Foreign exchange contracts | 38 | | 145,190 | | 587 | | 145,815 | |
|
| ||||||||
Equity contracts | 1,735 | | 21,748 | | 685 | | 24,168 | |
|
| ||||||||
Commodity contracts | 192 | | 9,456 | | 500 | | 10,148 | |
|
| ||||||||
Credit derivatives | - | | 22,457 | | 1,443 | | 23,900 | |
|
| ||||||||
Total trading derivatives | $ | 2,114 | | $ | 501,702 | | $ | 4,915 | | $ | 508,731 | |
|
| ||||
Cash collateral paid (4) |
|
|
| $ | 12,540 | |
|
| ||||||||||
Netting agreements |
|
|
|
| $ | (424,492 | ) |
| ||||||||||
Netting of cash collateral received |
|
|
|
| (38,743 | ) |
| |||||||||||
Total trading derivatives | $ | 2,114 | | $ | 501,702 | | $ | 4,915 | | $ | 521,271 | | $ | (463,235 | ) | $ | 58,036 | |
Investments |
|
|
|
|
|
| ||||||||||||
Mortgage-backed securities |
|
|
|
|
|
| ||||||||||||
U.S. government-sponsored agency guaranteed | $ | - | | $ | 43,148 | | $ | 50 | | $ | 43,198 | | $ | - | | $ | 43,198 | |
Residential | - | | 3,164 | | - | | 3,164 | | - | | 3,164 | | ||||||
Commercial | - | | 357 | | - | | 357 | | - | | 357 | | ||||||
Total investment mortgage-backed securities | $ | - | | $ | 46,669 | | $ | 50 | | $ | 46,719 | | $ | - | | $ | 46,719 | |
U.S. Treasury and federal agency securities | $ | 101,118 | | $ | 11,479 | | $ | 1 | | $ | 112,598 | | $ | - | | $ | 112,598 | |
State and municipal | - | | 8,254 | | 1,285 | | 9,539 | | - | | 9,539 | | ||||||
Foreign government | 56,320 | | 45,104 | | 358 | | 101,782 | | - | | 101,782 | | ||||||
Corporate | 2,045 | | 13,902 | | 156 | | 16,103 | | - | | 16,103 | | ||||||
Equity securities | 357 | | 67 | | 9 | | 433 | | - | | 433 | | ||||||
Asset-backed securities | - | | 4,996 | | 1,028 | | 6,024 | | - | | 6,024 | | ||||||
Other debt securities | - | | 421 | | 10 | | 431 | | - | | 431 | | ||||||
Non-marketable equity securities (5) | - | | 29 | | 939 | | 968 | | - | | 968 | | ||||||
Total investments | $ | 159,840 | | $ | 130,921 | | $ | 3,836 | | $ | 294,597 | | $ | - | | $ | 294,597 | |
Table continues on the next page.
176
In millions of dollars at June 30, 2017 | Level 1 (1) | Level 2 (1) | Level 3 | Gross | Netting (2) | Net | ||||||||||||
Loans | $ | - | | $ | 3,639 | | $ | 577 | | $ | 4,216 | | $ | - | | $ | 4,216 | |
Mortgage servicing rights | - | | - | | 560 | | 560 | | - | | 560 | | ||||||
Non-trading derivatives and other financial assets measured on a recurring basis, gross | $ | 13,382 | | $ | 6,587 | | $ | 17 | | $ | 19,986 | |
|
| ||||
Cash collateral paid (6) |
|
|
| - | |
|
| |||||||||||
Netting of cash collateral received |
|
|
|
| $ | (993 | ) |
| ||||||||||
Non-trading derivatives and other financial assets measured on a recurring basis | $ | 13,382 | | $ | 6,587 | | $ | 17 | | $ | 19,986 | | $ | (993 | ) | $ | 18,993 | |
Total assets | $ | 283,948 | | $ | 907,932 | | $ | 16,162 | | $ | 1,220,582 | | $ | (499,779 | ) | $ | 720,803 | |
Total as a percentage of gross assets (7) | 23.5 | % | 75.2 | % | 1.3 | % | | | | | | | ||||||
Liabilities |
|
|
|
|
|
| ||||||||||||
Interest-bearing deposits | $ | - | | $ | 1,040 | | $ | 300 | | $ | 1,340 | | $ | - | | $ | 1,340 | |
Federal funds purchased and securities loaned or sold under agreements to repurchase | - | | 79,625 | | 807 | | 80,432 | | (35,551 | ) | 44,881 | | ||||||
Trading account liabilities |
|
|
|
|
|
| ||||||||||||
Securities sold, not yet purchased | 72,044 | | 10,339 | | 1,143 | | 83,526 | | - | | 83,526 | | ||||||
Other trading liabilities | - | | 2,282 | | - | | 2,282 | | - | | 2,282 | | ||||||
Total trading liabilities | $ | 72,044 | | $ | 12,621 | | $ | 1,143 | | $ | 85,808 | | $ | - | | $ | 85,808 | |
Trading derivatives |
|
|
|
|
|
| ||||||||||||
Interest rate contracts | $ | 161 | | $ | 288,045 | | $ | 1,988 | | $ | 290,194 | |
|
| ||||
Foreign exchange contracts | 15 | | 146,519 | | 403 | | 146,937 | |
|
| ||||||||
Equity contracts | 1,725 | | 24,947 | | 2,332 | | 29,004 | |
|
| ||||||||
Commodity contracts | 120 | | 9,897 | | 2,524 | | 12,541 | |
|
| ||||||||
Credit derivatives | - | | 22,314 | | 2,782 | | 25,096 | |
|
| ||||||||
Total trading derivatives | $ | 2,021 | | $ | 491,722 | | $ | 10,029 | | $ | 503,772 | |
|
| ||||
Cash collateral received (8) |
|
|
| $ | 14,227 | |
|
| ||||||||||
Netting agreements |
|
|
|
| $ | (424,492 | ) |
| ||||||||||
Netting of cash collateral paid |
|
|
|
| (42,570 | ) |
| |||||||||||
Total trading derivatives | $ | 2,021 | | $ | 491,722 | | $ | 10,029 | | $ | 517,999 | | $ | (467,062 | ) | $ | 50,937 | |
Short-term borrowings | $ | - | | $ | 4,804 | | $ | 29 | | $ | 4,833 | | $ | - | | $ | 4,833 | |
Long-term debt | - | | 17,170 | | 11,831 | | 29,001 | | - | | 29,001 | | ||||||
Non-trading derivatives and other financial liabilities measured on a recurring basis, gross | $ | 13,382 | | $ | 964 | | $ | 2 | | $ | 14,348 | |
|
| ||||
Cash collateral received (9) |
|
|
| 43 | |
|
| |||||||||||
Netting of cash collateral paid |
|
|
|
| $ | (56 | ) |
| ||||||||||
Total non-trading derivatives and other financial liabilities measured on a recurring basis | $ | 13,382 | | $ | 964 | | $ | 2 | | $ | 14,391 | | $ | (56 | ) | $ | 14,335 | |
Total liabilities | $ | 87,447 | | $ | 607,946 | | $ | 24,141 | | $ | 733,804 | | $ | (502,669 | ) | $ | 231,135 | |
Total as a percentage of gross liabilities (7) | 12.2 | % | 84.5 | % | 3.4 | % |
|
|
| |||||||||
(1) | For the three and six months ended June 30, 2017 , the Company transferred assets of approximately $1.9 billion and $2.9 billion from Level 1 to Level 2, primarily related to foreign government securities and equity securities not traded in active markets. During the three and six months ended June 30, 2017 , the Company transferred assets of approximately $0.9 billion and $2.3 billion from Level 2 to Level 1, primarily related to foreign government bonds traded with sufficient frequency to constitute an active market. There were no material transfers of liabilities from Level 1 to 2 during the three months ended June 30, 2017. During the six months ended June 30, 2017 , the Company transferred liabilities of approximately $0.1 billion from Level 1 to Level 2. There were no material transfers of liabilities from Level 2 to Level 1 during the three months ended June 30, 2017. During the six months ended June 30, 2017 , the Company transferred liabilities of approximately $0.1 billion from Level 2 to Level 1. |
(2) | Represents netting of (i) the amounts due under securities purchased under agreements to resell and the amounts owed under securities sold under agreements to repurchase; and (ii) derivative exposures covered by a qualifying master netting agreement and cash collateral offsetting. |
(3) | Includes positions related to investments in unallocated precious metals, as discussed in Note 21 to the Consolidated Financial Statements. Also includes physical commodities accounted for at the lower of cost or fair value and unfunded credit products. |
(4) | Reflects the net amount of $55,110 million gross cash collateral paid, of which $42,570 million was used to offset trading derivative liabilities. |
(5) | Amounts exclude $0.4 billion investments measured at Net Asset Value (NAV) in accordance with ASU No. 2015-07, Fair Value Measurement (Topic 820): Disclosures for Investments in Certain Entities That Calculate Net Asset Value per Share (or Its Equivalent). |
(6) | Reflects the net amount of $56 million of gross cash collateral paid, of which $ 56 million was used to offset non-trading derivative liabilities. |
177
(7) | Because the amount of the cash collateral paid/received has not been allocated to the Level 1, 2 and 3 subtotals, these percentages are calculated based on total assets and liabilities measured at fair value on a recurring basis, excluding the cash collateral paid/received on derivatives. |
(8) | Reflects the net amount $52,970 million of gross cash collateral received, of which $38,743 million was used to offset trading derivative assets. |
(9) | Reflects the net amount of $1,036 million of gross cash collateral received, of which $993 million was used to offset non-trading derivative assets. |
Fair Value Levels
In millions of dollars at December 31, 2016 | Level 1 (1) | Level 2 (1) | Level 3 | Gross | Netting (2) | Net | ||||||||||||
Assets |
|
|
|
|
|
| ||||||||||||
Federal funds sold and securities borrowed or purchased under agreements to resell | $ | - | | $ | 172,394 | | $ | 1,496 | | $ | 173,890 | | $ | (40,686 | ) | $ | 133,204 | |
Trading non-derivative assets |
|
|
|
|
|
| ||||||||||||
Trading mortgage-backed securities |
|
|
|
|
|
| ||||||||||||
U.S. government-sponsored agency guaranteed | - | | 22,718 | | 176 | | 22,894 | | - | | 22,894 | | ||||||
Residential | - | | 291 | | 399 | | 690 | | - | | 690 | | ||||||
Commercial | - | | 1,000 | | 206 | | 1,206 | | - | | 1,206 | | ||||||
Total trading mortgage-backed securities | $ | - | | $ | 24,009 | | $ | 781 | | $ | 24,790 | | $ | - | | $ | 24,790 | |
U.S. Treasury and federal agency securities | $ | 16,368 | | $ | 4,811 | | $ | 1 | | $ | 21,180 | | $ | - | | $ | 21,180 | |
State and municipal | - | | 3,780 | | 296 | | 4,076 | | - | | 4,076 | | ||||||
Foreign government | 32,164 | | 17,492 | | 40 | | 49,696 | | - | | 49,696 | | ||||||
Corporate | 424 | | 14,199 | | 324 | | 14,947 | | - | | 14,947 | | ||||||
Equity securities | 45,056 | | 5,260 | | 127 | | 50,443 | | - | | 50,443 | | ||||||
Asset-backed securities | - | | 892 | | 1,868 | | 2,760 | | - | | 2,760 | | ||||||
Other trading assets (3) | - | | 9,466 | | 2,814 | | 12,280 | | - | | 12,280 | | ||||||
Total trading non-derivative assets | $ | 94,012 | | $ | 79,909 | | $ | 6,251 | | $ | 180,172 | | $ | - | | $ | 180,172 | |
Trading derivatives |
|
|
|
|
|
| ||||||||||||
Interest rate contracts | $ | 105 | | $ | 366,995 | | $ | 2,225 | | $ | 369,325 | |
|
| ||||
Foreign exchange contracts | 53 | | 184,776 | | 833 | | 185,662 | |
|
| ||||||||
Equity contracts | 2,306 | | 21,209 | | 595 | | 24,110 | |
|
| ||||||||
Commodity contracts | 261 | | 12,999 | | 505 | | 13,765 | |
|
| ||||||||
Credit derivatives | - | | 23,021 | | 1,594 | | 24,615 | |
|
| ||||||||
Total trading derivatives | $ | 2,725 | | $ | 609,000 | | $ | 5,752 | | $ | 617,477 | |
|
| ||||
Cash collateral paid (4) |
|
|
| $ | 11,188 | |
|
| ||||||||||
Netting agreements |
|
|
|
| $ | (519,000 | ) |
| ||||||||||
Netting of cash collateral received |
|
|
|
| (45,912 | ) |
| |||||||||||
Total trading derivatives | $ | 2,725 | | $ | 609,000 | | $ | 5,752 | | $ | 628,665 | | $ | (564,912 | ) | $ | 63,753 | |
Investments |
|
|
|
|
|
| ||||||||||||
Mortgage-backed securities |
|
|
|
|
|
| ||||||||||||
U.S. government-sponsored agency guaranteed | $ | - | | $ | 38,304 | | $ | 101 | | $ | 38,405 | | $ | - | | $ | 38,405 | |
Residential | - | | 3,860 | | 50 | | 3,910 | | - | | 3,910 | | ||||||
Commercial | - | | 358 | | - | | 358 | | - | | 358 | | ||||||
Total investment mortgage-backed securities | $ | - | | $ | 42,522 | | $ | 151 | | $ | 42,673 | | $ | - | | $ | 42,673 | |
U.S. Treasury and federal agency securities | $ | 112,916 | | $ | 10,753 | | $ | 2 | | $ | 123,671 | | $ | - | | $ | 123,671 | |
State and municipal | - | | 8,909 | | 1,211 | | 10,120 | | - | | 10,120 | | ||||||
Foreign government | 54,028 | | 43,934 | | 186 | | 98,148 | | - | | 98,148 | | ||||||
Corporate | 3,215 | | 13,598 | | 311 | | 17,124 | | - | | 17,124 | | ||||||
Equity securities | 336 | | 46 | | 9 | | 391 | | - | | 391 | | ||||||
Asset-backed securities | - | | 6,134 | | 660 | | 6,794 | | - | | 6,794 | | ||||||
Other debt securities | - | | 503 | | - | | 503 | | - | | 503 | | ||||||
Non-marketable equity securities (5) | - | | 35 | | 1,331 | | 1,366 | | - | | 1,366 | | ||||||
Total investments | $ | 170,495 | | $ | 126,434 | | $ | 3,861 | | $ | 300,790 | | $ | - | | $ | 300,790 | |
Table continues on the next page.
178
In millions of dollars at December 31, 2016 | Level 1 (1) | Level 2 (1) | Level 3 | Gross | Netting (2) | Net | ||||||||||||
Loans | $ | - | | $ | 2,918 | | $ | 568 | | $ | 3,486 | | $ | - | | $ | 3,486 | |
Mortgage servicing rights | - | | - | | 1,564 | | 1,564 | | - | | 1,564 | | ||||||
Non-trading derivatives and other financial assets measured on a recurring basis, gross | $ | 9,300 | | $ | 7,732 | | $ | 34 | | $ | 17,066 | |
|
| ||||
Cash collateral paid (6) |
|
|
| 8 | |
|
| |||||||||||
Netting of cash collateral received |
|
|
|
| $ | (1,345 | ) |
| ||||||||||
Non-trading derivatives and other financial assets measured on a recurring basis | $ | 9,300 | | $ | 7,732 | | $ | 34 | | $ | 17,074 | | $ | (1,345 | ) | $ | 15,729 | |
Total assets | $ | 276,532 | | $ | 998,387 | | $ | 19,526 | | $ | 1,305,641 | | $ | (606,943 | ) | $ | 698,698 | |
Total as a percentage of gross assets (7) | 21.4 | % | 77.1 | % | 1.5 | % |
|
|
| |||||||||
Liabilities |
|
|
|
|
|
| ||||||||||||
Interest-bearing deposits | $ | - | | $ | 919 | | $ | 293 | | $ | 1,212 | | $ | - | | $ | 1,212 | |
Federal funds purchased and securities loaned or sold under agreements to repurchase | - | | 73,500 | | 849 | | 74,349 | | (40,686 | ) | 33,663 | | ||||||
Trading account liabilities |
|
|
|
|
|
| ||||||||||||
Securities sold, not yet purchased | 67,429 | | 12,184 | | 1,177 | | 80,790 | | - | | 80,790 | | ||||||
Other trading liabilities | - | | 1,827 | | 1 | | 1,828 | | - | | 1,828 | | ||||||
Total trading liabilities | $ | 67,429 | | $ | 14,011 | | $ | 1,178 | | $ | 82,618 | | $ | - | | $ | 82,618 | |
Trading account derivatives |
|
|
|
|
|
| ||||||||||||
Interest rate contracts | $ | 107 | | $ | 351,766 | | $ | 2,888 | | $ | 354,761 | |
|
| ||||
Foreign exchange contracts | 13 | | 187,328 | | 420 | | 187,761 | |
|
| ||||||||
Equity contracts | 2,245 | | 22,119 | | 2,152 | | 26,516 | |
|
| ||||||||
Commodity contracts | 196 | | 12,386 | | 2,450 | | 15,032 | |
|
| ||||||||
Credit derivatives | - | | 22,842 | | 2,595 | | 25,437 | |
|
| ||||||||
Total trading derivatives | $ | 2,561 | | $ | 596,441 | | $ | 10,505 | | $ | 609,507 | |
|
| ||||
Cash collateral received (8) |
|
|
| $ | 15,731 | |
|
| ||||||||||
Netting agreements |
|
|
|
| $ | (519,000 | ) |
| ||||||||||
Netting of cash collateral paid |
|
|
|
| (49,811 | ) |
| |||||||||||
Total trading derivatives | $ | 2,561 | | $ | 596,441 | | $ | 10,505 | | $ | 625,238 | | $ | (568,811 | ) | $ | 56,427 | |
Short-term borrowings | $ | - | | $ | 2,658 | | $ | 42 | | $ | 2,700 | | $ | - | | $ | 2,700 | |
Long-term debt | - | | 16,510 | | 9,744 | | 26,254 | | - | | 26,254 | | ||||||
Non-trading derivatives and other financial liabilities measured on a recurring basis, gross | $ | 9,300 | | $ | 1,540 | | $ | 8 | | $ | 10,848 | |
|
| ||||
Cash collateral received (9) |
|
|
| 1 | |
|
| |||||||||||
Netting of cash collateral paid |
|
|
|
| $ | (53 | ) |
| ||||||||||
Non-trading derivatives and other financial liabilities measured on a recurring basis | $ | 9,300 | | $ | 1,540 | | $ | 8 | | $ | 10,849 | | $ | (53 | ) | $ | 10,796 | |
Total liabilities | $ | 79,290 | | $ | 705,579 | | $ | 22,619 | | $ | 823,220 | | $ | (609,550 | ) | $ | 213,670 | |
Total as a percentage of gross liabilities (7) | 9.8 | % | 87.4 | % | 2.8 | % |
|
|
| |||||||||
(1) | In 2016, the Company transferred assets of approximately $2.6 billion from Level 1 to Level 2, primarily related to foreign government securities and equity securities not traded in active markets. In 2016, the Company transferred assets of approximately $4.0 billion from Level 2 to Level 1, primarily related to foreign government bonds and equity securities traded with sufficient frequency to constitute a liquid market. In 2016, the Company transferred liabilities of approximately $0.4 billion from Level 2 to Level 1. In 2016, the Company transferred liabilities of approximately $0.3 billion from Level 1 to Level 2. |
(2) | Represents netting of (i) the amounts due under securities purchased under agreements to resell and the amounts owed under securities sold under agreements to repurchase; and (ii) derivative exposures covered by a qualifying master netting agreement and cash collateral offsetting. |
(3) | Includes positions related to investments in unallocated precious metals, as discussed in Note 21 to the Consolidated Financial Statements. Also includes physical commodities accounted for at the lower of cost or fair value and unfunded credit products. |
(4) | Reflects the net amount of $60,999 million of gross cash collateral paid, of which $49,811 million was used to offset trading derivative liabilities. |
(5) | Amounts exclude $0.4 billion investments measured at Net Asset Value (NAV) in accordance with ASU No. 2015-07, Fair Value Measurement (Topic 820): Disclosures for Investments in Certain Entities That Calculate Net Asset Value per Share (or Its Equivalent). |
(6) | Reflects the net amount of $61 million of gross cash collateral paid, of which $53 million was used to offset non-trading derivative liabilities. |
(7) | Because the amount of the cash collateral paid/received has not been allocated to the Level 1, 2 and 3 subtotals, these percentages are calculated based on total assets and liabilities measured at fair value on a recurring basis, excluding the cash collateral paid/received on derivatives. |
(8) | Reflects the net amount of $61,643 million of gross cash collateral received, of which $45,912 million was used to offset trading derivative assets. |
(9) | Reflects the net amount of $1,346 million of gross cash collateral received, of which $1,345 million was used to offset non-trading derivative assets. |
179
Changes in Level 3 Fair Value Category
The following tables present the changes in the Level 3 fair value category for the three and six months ended June 30, 2017 and 2016 . The gains and losses presented below include changes in the fair value related to both observable and unobservable inputs.
The Company often hedges positions with offsetting positions that are classified in a different level. For example, the gains and losses for assets and liabilities in the Level 3
category presented in the tables below do not reflect the effect of offsetting losses and gains on hedging instruments that may be classified in the Level 1 or Level 2 categories. In addition, the Company hedges items classified in the Level 3 category with instruments also classified in Level 3 of the fair value hierarchy. The hedged items and related hedges are presented gross in the following tables:
Level 3 Fair Value Rollforward
|
| Net realized/unrealized | Transfers |
|
|
|
|
| Unrealized | ||||||||||||||||||||||||
In millions of dollars | Mar. 31, 2017 | Principal | Other (1)(2) | into | out of | Purchases | Issuances | Sales | Settlements | Jun. 30, 2017 | |||||||||||||||||||||||
Assets |
|
|
|
|
|
|
|
|
|
|
| ||||||||||||||||||||||
Federal funds sold and securities borrowed or purchased under agreements to resell | $ | 1,187 | | $ | 54 | | $ | - | | $ | - | | $ | (239 | ) | $ | - | | $ | - | | $ | - | | $ | - | | $ | 1,002 | | $ | - | |
Trading non-derivative assets |
|
|
|
|
|
|
|
|
|
|
| ||||||||||||||||||||||
Trading mortgage- backed securities |
|
|
|
|
|
|
|
|
|
|
| ||||||||||||||||||||||
U.S. government-sponsored agency guaranteed | 271 | | (1 | ) | - | | 29 | | (48 | ) | 103 | | - | | (150 | ) | - | | 204 | | - | | |||||||||||
Residential | 368 | | 22 | | - | | 30 | | (20 | ) | 16 | | - | | (89 | ) | - | | 327 | | 19 | | |||||||||||
Commercial | 266 | | 5 | | - | | 27 | | (16 | ) | 244 | | - | | (208 | ) | - | | 318 | | (3 | ) | |||||||||||
Total trading mortgage- backed securities | $ | 905 | | $ | 26 | | $ | - | | $ | 86 | | $ | (84 | ) | $ | 363 | | $ | - | | $ | (447 | ) | $ | - | | $ | 849 | | $ | 16 | |
U.S. Treasury and federal agency securities | $ | 1 | | $ | - | | $ | - | | $ | - | | $ | - | | $ | - | | $ | - | | $ | (1 | ) | $ | - | | $ | - | | $ | - | |
State and municipal | 270 | | 3 | | - | | 22 | | (1 | ) | 7 | | - | | (17 | ) | - | | 284 | | (1 | ) | |||||||||||
Foreign government | 126 | | 3 | | - | | 6 | | (77 | ) | 83 | | - | | (33 | ) | - | | 108 | | 1 | | |||||||||||
Corporate | 296 | | 124 | | - | | 89 | | (21 | ) | 158 | | - | | (245 | ) | - | | 401 | | 132 | | |||||||||||
Equity securities | 110 | | 14 | | - | | 130 | | (1 | ) | 2 | | - | | (15 | ) | - | | 240 | | 13 | | |||||||||||
Asset-backed securities | 1,941 | | (23 | ) | - | | 3 | | (65 | ) | 313 | | - | | (599 | ) | - | | 1,570 | | (19 | ) | |||||||||||
Other trading assets | 1,888 | | (43 | ) | - | | 222 | | (243 | ) | 366 | | - | | (383 | ) | (4 | ) | 1,803 | | (17 | ) | |||||||||||
Total trading non- derivative assets | $ | 5,537 | | $ | 104 | | $ | - | | $ | 558 | | $ | (492 | ) | $ | 1,292 | | $ | - | | $ | (1,740 | ) | $ | (4 | ) | $ | 5,255 | | $ | 125 | |
Trading derivatives, net (4) |
|
|
|
|
|
|
|
|
|
|
| ||||||||||||||||||||||
Interest rate contracts | $ | (773 | ) | $ | (155 | ) | $ | - | | $ | 10 | | $ | 632 | | $ | 59 | | $ | - | | $ | (92 | ) | $ | 31 | | $ | (288 | ) | $ | (60 | ) |
Foreign exchange contracts | 48 | | 93 | | - | | (2 | ) | (39 | ) | 4 | | - | | (2 | ) | 82 | | 184 | | 88 | | |||||||||||
Equity contracts | (1,524 | ) | (101 | ) | - | | 18 | | 42 | | 64 | | - | | (113 | ) | (33 | ) | (1,647 | ) | (158 | ) | |||||||||||
Commodity contracts | (2,074 | ) | (153 | ) | - | | 12 | | 51 | | - | | - | | - | | 140 | | (2,024 | ) | (152 | ) | |||||||||||
Credit derivatives | (1,123 | ) | (293 | ) | - | | (44 | ) | (16 | ) | (2 | ) | - | | 2 | | 137 | | (1,339 | ) | (325 | ) | |||||||||||
Total trading derivatives, net (4) | $ | (5,446 | ) | $ | (609 | ) | $ | - | | $ | (6 | ) | $ | 670 | | $ | 125 | | $ | - | | $ | (205 | ) | $ | 357 | | $ | (5,114 | ) | $ | (607 | ) |
Table continues on the next page.
180
|
| Net realized/unrealized | Transfers |
|
|
|
|
| Unrealized | ||||||||||||||||||||||||
In millions of dollars | Mar.31, 2017 | Principal | Other (1)(2) | into | out of | Purchases | Issuances | Sales | Settlements | Jun. 30, 2017 | |||||||||||||||||||||||
Investments |
|
|
|
|
|
|
|
|
|
|
| ||||||||||||||||||||||
Mortgage-backed securities |
|
|
|
|
|
|
|
|
|
|
| ||||||||||||||||||||||
U.S. government-sponsored agency guaranteed | $ | 55 | | $ | - | | $ | 1 | | $ | - | | $ | (6 | ) | $ | - | | $ | - | | $ | - | | $ | - | | $ | 50 | | $ | - | |
Residential | - | | - | | - | | - | | - | | - | | - | | - | | - | | - | | - | | |||||||||||
Commercial | - | | - | | - | | - | | - | | - | | - | | - | | - | | - | | - | | |||||||||||
Total investment mortgage-backed securities | $ | 55 | | $ | - | | $ | 1 | | $ | - | | $ | (6 | ) | $ | - | | $ | - | | $ | - | | $ | - | | $ | 50 | | $ | - | |
U.S. Treasury and federal agency securities | $ | 1 | | $ | - | | $ | - | | $ | - | | $ | - | | $ | - | | $ | - | | $ | - | | $ | - | | $ | 1 | | $ | - | |
State and municipal | 1,233 | | - | | 27 | | 12 | | (3 | ) | 22 | | - | | (6 | ) | - | | 1,285 | | 28 | | |||||||||||
Foreign government | 235 | | - | | 10 | | - | | (1 | ) | 191 | | - | | (77 | ) | - | | 358 | | 7 | | |||||||||||
Corporate | 339 | | - | | (137 | ) | 5 | | - | | 92 | | - | | (143 | ) | - | | 156 | | 9 | | |||||||||||
Equity securities | 9 | | - | | - | | - | | - | | - | | - | | - | | - | | 9 | | - | | |||||||||||
Asset-backed securities | 712 | | - | | 173 | | 4 | | (13 | ) | 334 | | - | | (182 | ) | - | | 1,028 | | 171 | | |||||||||||
Other debt securities | - | | - | | - | | - | | - | | 10 | | - | | - | | - | | 10 | | - | | |||||||||||
Non-marketable equity securities | 1,082 | | - | | 31 | | 2 | | - | | 1 | | - | | (154 | ) | (23 | ) | 939 | | 66 | | |||||||||||
Total investments | $ | 3,666 | | $ | - | | $ | 105 | | $ | 23 | | $ | (23 | ) | $ | 650 | | $ | - | | $ | (562 | ) | $ | (23 | ) | $ | 3,836 | | $ | 281 | |
Loans | $ | 580 | | $ | - | | $ | (12 | ) | $ | 15 | | $ | - | | $ | 30 | | $ | - | | $ | (33 | ) | $ | (3 | ) | $ | 577 | | $ | 42 | |
Mortgage servicing rights | $ | 567 | | $ | - | | $ | (11 | ) | $ | - | | $ | - | | $ | - | | $ | 21 | | $ | - | | $ | (17 | ) | $ | 560 | | $ | 3 | |
Other financial assets measured on a recurring basis | $ | 27 | | $ | - | | $ | 29 | | $ | - | | $ | (7 | ) | $ | - | | $ | 27 | | $ | (4 | ) | $ | (55 | ) | $ | 17 | | $ | 26 | |
Liabilities | | | | | | | | | | | | ||||||||||||||||||||||
Interest-bearing deposits | $ | 302 | | $ | - | | $ | - | | $ | 20 | | $ | - | | $ | - | | $ | - | | $ | - | | $ | (22 | ) | $ | 300 | | $ | 5 | |
Federal funds purchased and securities loaned or sold under agreements to repurchase | 809 | | 2 | | - | | - | | - | | - | | - | | - | | - | | 807 | | 2 | | |||||||||||
Trading account liabilities | | | | | | | | | | | | ||||||||||||||||||||||
Securities sold, not yet purchased | 1,151 | | (60 | ) | - | | 2 | | (29 | ) | - | | - | | 76 | | (117 | ) | 1,143 | | 5 | | |||||||||||
Short-term borrowings | 60 | | 40 | | - | | 1 | | - | | - | | 8 | | - | | - | | 29 | | 11 | | |||||||||||
Long-term debt | 10,176 | | (618 | ) | - | | 321 | | (558 | ) | - | | 1,353 | | - | | (79 | ) | 11,831 | | (73 | ) | |||||||||||
Other financial liabilities measured on a recurring basis | 4 | | - | | 2 | | - | | - | | - | | 1 | | - | | (1 | ) | 2 | | 2 | | |||||||||||
(1) | Changes in fair value for available-for-sale investments are recorded in AOCI, unless related to other-than-temporary impairment, while gains and losses from sales are recorded in Realized gains (losses) from sales of investments on the Consolidated Statement of Income. |
(2) | Unrealized gains (losses) on MSRs are recorded in Other revenue on the Consolidated Statement of Income. |
(3) | Represents the amount of total gains or losses for the period, included in earnings (and AOCI for changes in fair value of available-for-sale investments), attributable to the change in fair value relating to assets and liabilities classified as Level 3 that are still held at June 30, 2017 . |
(4) | Total Level 3 trading derivative assets and liabilities have been netted in these tables for presentation purposes only. |
181
|
| Net realized/unrealized | Transfers |
|
|
|
|
| Unrealized | ||||||||||||||||||||||||
In millions of dollars | Dec. 31, 2016 | Principal | Other (1)(2) | into | out of | Purchases | Issuances | Sales | Settlements | Jun. 30, 2017 | |||||||||||||||||||||||
Assets |
|
|
|
|
|
|
|
|
|
|
| ||||||||||||||||||||||
Federal funds sold and securities borrowed or purchased under agreements to resell | $ | 1,496 | | $ | (2 | ) | $ | - | | $ | - | | $ | (491 | ) | $ | - | | $ | - | | $ | - | | $ | (1 | ) | $ | 1,002 | | $ | - | |
Trading non-derivative assets |
|
|
|
|
|
|
|
|
|
|
| ||||||||||||||||||||||
Trading mortgage-backed securities |
|
|
|
|
|
|
|
|
|
|
| ||||||||||||||||||||||
U.S. government-sponsored agency guaranteed | 176 | | 4 | | - | | 79 | | (65 | ) | 264 | | - | | (254 | ) | - | | 204 | | 1 | | |||||||||||
Residential | 399 | | 37 | | - | | 47 | | (49 | ) | 66 | | - | | (173 | ) | - | | 327 | | 29 | | |||||||||||
Commercial | 206 | | (3 | ) | - | | 44 | | (29 | ) | 434 | | - | | (334 | ) | - | | 318 | | (10 | ) | |||||||||||
Total trading mortgage-backed securities | $ | 781 | | $ | 38 | | $ | - | | $ | 170 | | $ | (143 | ) | $ | 764 | | $ | - | | $ | (761 | ) | $ | - | | $ | 849 | | $ | 20 | |
U.S. Treasury and federal agency securities | $ | 1 | | $ | - | | $ | - | | $ | - | | $ | - | | $ | - | | $ | - | | $ | (1 | ) | $ | - | | $ | - | | $ | - | |
State and municipal | 296 | | 5 | | - | | 24 | | (48 | ) | 88 | | - | | (81 | ) | - | | 284 | | 2 | | |||||||||||
Foreign government | 40 | | 7 | | - | | 84 | | (90 | ) | 127 | | - | | (60 | ) | - | | 108 | | 8 | | |||||||||||
Corporate | 324 | | 215 | | - | | 116 | | (73 | ) | 276 | | - | | (457 | ) | - | | 401 | | 177 | | |||||||||||
Equity securities | 127 | | 29 | | - | | 132 | | (13 | ) | 9 | | - | | (44 | ) | - | | 240 | | 21 | | |||||||||||
Asset-backed securities | 1,868 | | 137 | | - | | 23 | | (81 | ) | 704 | | - | | (1,081 | ) | - | | 1,570 | | 52 | | |||||||||||
Other trading assets | 2,814 | | (50 | ) | - | | 432 | | (774 | ) | 653 | | 1 | | (1,258 | ) | (15 | ) | 1,803 | | (38 | ) | |||||||||||
Total trading non-derivative assets | $ | 6,251 | | $ | 381 | | $ | - | | $ | 981 | | $ | (1,222 | ) | $ | 2,621 | | $ | 1 | | $ | (3,743 | ) | $ | (15 | ) | $ | 5,255 | | $ | 242 | |
Trading derivatives, net (4) |
|
|
|
|
|
|
|
|
|
|
| ||||||||||||||||||||||
Interest rate contracts | $ | (663 | ) | $ | (192 | ) | $ | - | | $ | (28 | ) | $ | 651 | | $ | 65 | | $ | - | | $ | (205 | ) | $ | 84 | | $ | (288 | ) | $ | (12 | ) |
Foreign exchange contracts | 413 | | (297 | ) | - | | 53 | | (59 | ) | 38 | | - | | (34 | ) | 70 | | 184 | | 43 | | |||||||||||
Equity contracts | (1,557 | ) | (103 | ) | - | | 18 | | 26 | | 149 | | - | | (137 | ) | (43 | ) | (1,647 | ) | (139 | ) | |||||||||||
Commodity contracts | (1,945 | ) | (328 | ) | - | | 58 | | 49 | | - | | - | | - | | 142 | | (2,024 | ) | (358 | ) | |||||||||||
Credit derivatives | (1,001 | ) | (385 | ) | - | | (68 | ) | (24 | ) | (2 | ) | - | | 2 | | 139 | | (1,339 | ) | (745 | ) | |||||||||||
Total trading derivatives, net (4) | $ | (4,753 | ) | $ | (1,305 | ) | $ | - | | $ | 33 | | $ | 643 | | $ | 250 | | $ | - | | $ | (374 | ) | $ | 392 | | $ | (5,114 | ) | $ | (1,211 | ) |
Investments |
|
|
|
|
|
|
|
|
|
|
| ||||||||||||||||||||||
Mortgage-backed securities |
|
|
|
|
|
|
|
|
|
|
| ||||||||||||||||||||||
U.S. government-sponsored agency guaranteed | $ | 101 | | $ | - | | $ | 3 | | $ | 1 | | $ | (55 | ) | $ | - | | $ | - | | $ | - | | $ | - | | $ | 50 | | $ | 2 | |
Residential | 50 | | - | | 2 | | - | | (47 | ) | - | | - | | (5 | ) | - | | - | | - | | |||||||||||
Commercial | - | | - | | - | | - | | - | | 8 | | - | | (8 | ) | - | | - | | - | | |||||||||||
Total investment mortgage-backed securities | $ | 151 | | $ | - | | $ | 5 | | $ | 1 | | $ | (102 | ) | $ | 8 | | $ | - | | $ | (13 | ) | $ | - | | $ | 50 | | $ | 2 | |
U.S. Treasury and federal agency securities | $ | 2 | | $ | - | | $ | - | | $ | - | | $ | - | | $ | - | | $ | - | | $ | (1 | ) | $ | - | | $ | 1 | | $ | - | |
State and municipal | 1,211 | | - | | 39 | | 49 | | (33 | ) | 76 | | - | | (57 | ) | - | | 1,285 | | 35 | | |||||||||||
Foreign government | 186 | | - | | 11 | | 2 | | (19 | ) | 333 | | - | | (155 | ) | - | | 358 | | 7 | | |||||||||||
Corporate | 311 | | - | | (135 | ) | 64 | | (4 | ) | 183 | | - | | (263 | ) | - | | 156 | | 9 | | |||||||||||
Equity securities | 9 | | - | | - | | - | | - | | - | | - | | - | | - | | 9 | | - | | |||||||||||
Asset-backed securities | 660 | | - | | 182 | | 21 | | (13 | ) | 360 | | - | | (182 | ) | - | | 1,028 | | 171 | | |||||||||||
Other debt securities | - | | - | | - | | - | | - | | 21 | | - | | (11 | ) | - | | 10 | | - | | |||||||||||
Non-marketable equity securities | 1,331 | | - | | (63 | ) | 2 | | - | | 9 | | - | | (227 | ) | (113 | ) | 939 | | 79 | | |||||||||||
Total investments | $ | 3,861 | | $ | - | | $ | 39 | | $ | 139 | | $ | (171 | ) | $ | 990 | | $ | - | | $ | (909 | ) | $ | (113 | ) | $ | 3,836 | | $ | 303 | |
Table continues on the next page.
182
|
| Net realized/unrealized | Transfers |
|
|
|
|
| Unrealized | ||||||||||||||||||||||||
In millions of dollars | Dec. 31, 2016 | Principal | Other (1)(2) | into | out of | Purchases | Issuances | Sales | Settlements | Jun. 30, 2017 | |||||||||||||||||||||||
Loans | $ | 568 | | $ | - | | $ | (16 | ) | $ | 80 | | $ | (16 | ) | $ | 42 | | $ | - | | $ | (76 | ) | $ | (5 | ) | $ | 577 | | $ | 58 | |
Mortgage servicing rights | 1,564 | | - | | 56 | | - | | - | | - | | 56 | | (1,046 | ) | (70 | ) | 560 | | (40 | ) | |||||||||||
Other financial assets measured on a recurring basis | 34 | | - | | (160 | ) | 3 | | (8 | ) | - | | 260 | | (4 | ) | (108 | ) | 17 | | (184 | ) | |||||||||||
Liabilities |
|
|
|
|
|
|
|
|
|
|
| ||||||||||||||||||||||
Interest-bearing deposits | $ | 293 | | $ | - | | $ | 11 | | $ | 40 | | $ | - | | $ | - | | $ | - | | $ | - | | $ | (22 | ) | $ | 300 | | $ | 31 | |
Federal funds purchased and securities loaned or sold under agreements to repurchase | 849 | | 8 | | - | | - | | - | | - | | - | | - | | (34 | ) | 807 | | 8 | | |||||||||||
Trading account liabilities |
|
|
|
|
|
|
|
|
|
|
| ||||||||||||||||||||||
Securities sold, not yet purchased | 1,177 | | (6 | ) | - | | 13 | | (43 | ) | - | | - | | 177 | | (187 | ) | 1,143 | | (3 | ) | |||||||||||
Short-term borrowings | 42 | | 31 | | - | | 1 | | - | | - | | 19 | | - | | (2 | ) | 29 | | 5 | | |||||||||||
Long-term debt | 9,744 | | (601 | ) | - | | 521 | | (967 | ) | - | | 2,282 | | - | | (350 | ) | 11,831 | | (747 | ) | |||||||||||
Other financial liabilities measured on a recurring basis | 8 | | - | | - | | - | | - | | (1 | ) | 2 | | - | | (7 | ) | 2 | | - | | |||||||||||
(1) | Changes in fair value of available-for-sale investments are recorded in AOCI, unless related to other-than-temporary impairment, while gains and losses from sales are recorded in Realized gains (losses) from sales of investments on the Consolidated Statement of Income. |
(2) | Unrealized gains (losses) on MSRs are recorded in Other revenue on the Consolidated Statement of Income. |
(3) | Represents the amount of total gains or losses for the period, included in earnings (and AOCI for changes in fair value of available-for-sale investments), attributable to the change in fair value relating to assets and liabilities classified as Level 3 that are still held at June 30, 2016 . |
(4) | Total Level 3 derivative assets and liabilities have been netted in these tables for presentation purposes only. |
183
|
| Net realized/unrealized | Transfers |
|
|
|
|
| Unrealized | ||||||||||||||||||||||||
In millions of dollars | Mar. 31, 2016 | Principal | Other (1)(2) | into | out of | Purchases | Issuances | Sales | Settlements | Jun. 30, 2016 | |||||||||||||||||||||||
Assets |
|
|
|
|
|
|
|
|
|
|
| ||||||||||||||||||||||
Federal funds sold and securities borrowed or purchased under agreements to resell | $ | 1,909 | | $ | (62 | ) | $ | - | | $ | - | | $ | (28 | ) | $ | - | | $ | - | | $ | - | | $ | - | | $ | 1,819 | | $ | (54 | ) |
Trading non-derivative assets |
|
|
|
|
|
|
|
|
|
|
| ||||||||||||||||||||||
Trading mortgage-backed securities |
|
|
|
|
|
|
|
|
|
|
| ||||||||||||||||||||||
U.S. government-sponsored agency guaranteed | 1,039 | | - | | - | | 83 | | (362 | ) | 405 | | - | | (443 | ) | 8 | | 730 | | - | | |||||||||||
Residential | 1,192 | | (61 | ) | - | | 25 | | (44 | ) | 46 | | - | | (351 | ) | (6 | ) | 801 | | (72 | ) | |||||||||||
Commercial | 581 | | 4 | | - | | 123 | | (75 | ) | 107 | | - | | (350 | ) | - | | 390 | | (5 | ) | |||||||||||
Total trading mortgage-backed securities | $ | 2,812 | | $ | (57 | ) | $ | - | | $ | 231 | | $ | (481 | ) | $ | 558 | | $ | - | | $ | (1,144 | ) | $ | 2 | | $ | 1,921 | | $ | (77 | ) |
U.S. Treasury and federal agency securities | $ | 3 | | $ | - | | $ | - | | $ | - | | $ | - | | $ | - | | $ | - | | $ | - | | $ | - | | $ | 3 | | $ | - | |
State and municipal | 209 | | 1 | | - | | 5 | | (57 | ) | 65 | | - | | (106 | ) | - | | 117 | | (2 | ) | |||||||||||
Foreign government | 219 | | (7 | ) | - | | - | | (13 | ) | 34 | | - | | (152 | ) | - | | 81 | | (2 | ) | |||||||||||
Corporate | 477 | | 272 | | - | | 35 | | (60 | ) | 165 | | - | | (479 | ) | (5 | ) | 405 | | 77 | | |||||||||||
Equity securities | 3,755 | | (491 | ) | - | | 174 | | (26 | ) | 670 | | - | | (112 | ) | - | | 3,970 | | (438 | ) | |||||||||||
Asset-backed securities | 2,814 | | 6 | | - | | 40 | | (181 | ) | 694 | | - | | (703 | ) | - | | 2,670 | | 5 | | |||||||||||
Other trading assets | 2,574 | | (89 | ) | - | | 680 | | (869 | ) | 1,074 | | (13 | ) | (509 | ) | (9 | ) | 2,839 | | (125 | ) | |||||||||||
Total trading non-derivative assets | $ | 12,863 | | $ | (365 | ) | $ | - | | $ | 1,165 | | $ | (1,687 | ) | $ | 3,260 | | $ | (13 | ) | $ | (3,205 | ) | $ | (12 | ) | $ | 12,006 | | $ | (562 | ) |
Trading derivatives, net (4) |
|
|
|
|
|
|
|
|
|
|
| ||||||||||||||||||||||
Interest rate contracts | $ | (755 | ) | $ | 182 | | $ | - | | $ | 144 | | $ | (51 | ) | $ | 137 | | $ | (18 | ) | $ | (100 | ) | $ | 87 | | $ | (374 | ) | $ | 136 | |
Foreign exchange contracts | 295 | | (324 | ) | - | | 1 | | (90 | ) | 89 | | - | | (52 | ) | 52 | | (29 | ) | (428 | ) | |||||||||||
Equity contracts | (876 | ) | 76 | | - | | (11 | ) | (284 | ) | 22 | | 38 | | (12 | ) | (24 | ) | (1,071 | ) | 108 | | |||||||||||
Commodity contracts | (1,949 | ) | (139 | ) | - | | 3 | | (36 | ) | 356 | | - | | (352 | ) | 100 | | (2,017 | ) | (122 | ) | |||||||||||
Credit derivatives | (321 | ) | (637 | ) | - | | (33 | ) | (52 | ) | 41 | | - | | - | | 248 | | (754 | ) | (603 | ) | |||||||||||
Total trading derivatives, net (4) | $ | (3,606 | ) | $ | (842 | ) | $ | - | | $ | 104 | | $ | (513 | ) | $ | 645 | | $ | 20 | | $ | (516 | ) | $ | 463 | | $ | (4,245 | ) | $ | (909 | ) |
Investments |
|
|
|
|
|
|
|
|
|
|
| ||||||||||||||||||||||
Mortgage-backed securities |
|
|
|
|
|
|
|
|
|
|
| ||||||||||||||||||||||
U.S. government-sponsored agency guaranteed | $ | 111 | | $ | - | | $ | 6 | | $ | 5 | | $ | (23 | ) | $ | 1 | | $ | - | | $ | (6 | ) | $ | - | | $ | 94 | | $ | 1 | |
Residential | - | | - | | - | | - | | - | | 25 | | - | | - | | - | | 25 | | - | | |||||||||||
Commercial | 3 | | - | | - | | 3 | | (1 | ) | - | | - | | - | | - | | 5 | | - | | |||||||||||
Total investment mortgage-backed securities | $ | 114 | | $ | - | | $ | 6 | | $ | 8 | | $ | (24 | ) | $ | 26 | | $ | - | | $ | (6 | ) | $ | - | | $ | 124 | | $ | 1 | |
U.S. Treasury and federal agency securities | $ | 3 | | $ | - | | $ | - | | $ | - | | $ | - | | $ | - | | $ | - | | $ | - | | $ | - | | $ | 3 | | $ | - | |
State and municipal | 2,098 | | - | | 127 | | 130 | | (374 | ) | 89 | | - | | (54 | ) | - | | 2,016 | | 99 | | |||||||||||
Foreign government | 175 | | - | | 17 | | - | | - | | 41 | | - | | (89 | ) | (3 | ) | 141 | | - | | |||||||||||
Corporate | 498 | | - | | 31 | | - | | (8 | ) | 93 | | - | | (154 | ) | - | | 460 | | (5 | ) | |||||||||||
Equity securities | 126 | | - | | - | | 2 | | - | | - | | - | | - | | - | | 128 | | - | | |||||||||||
Asset-backed securities | 701 | | - | | 61 | | - | | (22 | ) | 72 | | - | | (215 | ) | - | | 597 | | 51 | | |||||||||||
Other debt securities | - | | - | | - | | - | | - | | 5 | | - | | - | | - | | 5 | | - | | |||||||||||
Non-marketable equity securities | 1,165 | | - | | 26 | | 13 | | - | | 6 | | - | | - | | (71 | ) | 1,139 | | 26 | | |||||||||||
Total investments | $ | 4,880 | | $ | - | | $ | 268 | | $ | 153 | | $ | (428 | ) | $ | 332 | | $ | - | | $ | (518 | ) | $ | (74 | ) | $ | 4,613 | | $ | 172 | |
184
|
| Net realized/unrealized | Transfers |
|
|
|
|
| Unrealized | ||||||||||||||||||||||||
In millions of dollars | Mar. 31, 2016 | Principal | Other (1)(2) | into | out of | Purchases | Issuances | Sales | Settlements | Jun. 30, 2016 | |||||||||||||||||||||||
Loans | $ | 1,723 | | $ | - | | $ | 19 | | $ | - | | $ | - | | $ | 211 | | $ | 58 | | $ | (297 | ) | $ | (480 | ) | $ | 1,234 | | $ | (34 | ) |
Mortgage servicing rights | 1,524 | | - | | (137 | ) | - | | - | | - | | 35 | | - | | (98 | ) | 1,324 | | (154 | ) | |||||||||||
Other financial assets measured on a recurring basis | 57 | | - | | 16 | | 37 | | (2 | ) | - | | 67 | | (4 | ) | (60 | ) | 111 | | (61 | ) | |||||||||||
Liabilities |
|
|
|
|
|
|
|
|
|
|
| ||||||||||||||||||||||
Interest-bearing deposits | $ | 191 | | $ | - | | $ | 39 | | $ | 318 | | $ | - | | $ | - | | $ | 1 | | $ | - | | $ | (38 | ) | $ | 433 | | $ | 39 | |
Federal funds purchased and securities loaned or sold under agreements to repurchase | 1,238 | | 4 | | - | | - | | - | | - | | - | | - | | (127 | ) | 1,107 | | 4 | | |||||||||||
Trading account liabilities |
|
|
|
|
|
|
|
|
|
|
| ||||||||||||||||||||||
Securities sold, not yet purchased | 118 | | (11 | ) | - | | 38 | | (18 | ) | (61 | ) | (41 | ) | 34 | | (69 | ) | 12 | | (30 | ) | |||||||||||
Short-term borrowings | 46 | | (24 | ) | - | | 12 | | - | | - | | 7 | | - | | (36 | ) | 53 | | (15 | ) | |||||||||||
Long-term debt | 8,736 | | (48 | ) | - | | 712 | | (756 | ) | - | | 990 | | 61 | | (653 | ) | 9,138 | | (48 | ) | |||||||||||
Other financial liabilities measured on a recurring basis | 14 | | - | | 1 | | - | | (6 | ) | (2 | ) | 1 | | - | | (1 | ) | 5 | | (1 | ) | |||||||||||
185
|
| Net realized/unrealized | Transfers |
|
|
|
|
| Unrealized | ||||||||||||||||||||||||
In millions of dollars | Dec. 31, 2015 | Principal | Other (1)(2) | into | out of | Purchases | Issuances | Sales | Settlements | Jun. 30, 2016 | |||||||||||||||||||||||
Assets |
|
|
|
|
|
|
|
|
|
|
| ||||||||||||||||||||||
Federal funds sold and securities borrowed or purchased under agreements to resell | $ | 1,337 | | $ | 8 | | $ | - | | $ | - | | $ | (28 | ) | $ | 503 | | $ | - | | $ | - | | $ | (1 | ) | $ | 1,819 | | $ | (55 | ) |
Trading non-derivative assets |
|
|
|
|
|
|
|
|
|
|
| ||||||||||||||||||||||
Trading mortgage-backed securities |
|
|
|
|
|
|
|
|
|
|
| ||||||||||||||||||||||
U.S. government-sponsored agency guaranteed | 744 | | 12 | | - | | 418 | | (582 | ) | 761 | | - | | (634 | ) | 11 | | 730 | | (3 | ) | |||||||||||
Residential | 1,326 | | (12 | ) | - | | 129 | | (87 | ) | 257 | | - | | (806 | ) | (6 | ) | 801 | | (40 | ) | |||||||||||
Commercial | 517 | | 13 | | - | | 179 | | (102 | ) | 352 | | - | | (569 | ) | - | | 390 | | (13 | ) | |||||||||||
Total trading mortgage-backed securities | $ | 2,587 | | $ | 13 | | $ | - | | $ | 726 | | $ | (771 | ) | $ | 1,370 | | $ | - | | $ | (2,009 | ) | $ | 5 | | $ | 1,921 | | $ | (56 | ) |
U.S. Treasury and federal agency securities | $ | 1 | | $ | - | | $ | - | | $ | 2 | | $ | - | | $ | - | | $ | - | | $ | - | | $ | - | | $ | 3 | | $ | (1 | ) |
State and municipal | 351 | | 8 | | - | | 18 | | (216 | ) | 168 | | - | | (212 | ) | - | | 117 | | (1 | ) | |||||||||||
Foreign government | 197 | | (8 | ) | - | | 2 | | (17 | ) | 75 | | - | | (168 | ) | - | | 81 | | 1 | | |||||||||||
Corporate | 376 | | 284 | | - | | 80 | | (76 | ) | 334 | | - | | (588 | ) | (5 | ) | 405 | | 89 | | |||||||||||
Equity securities | 3,684 | | (535 | ) | - | | 267 | | (60 | ) | 749 | | - | | (135 | ) | - | | 3,970 | | (474 | ) | |||||||||||
Asset-backed securities | 2,739 | | 134 | | - | | 157 | | (195 | ) | 1,186 | | - | | (1,351 | ) | - | | 2,670 | | 29 | | |||||||||||
Other trading assets | 2,483 | | (116 | ) | - | | 1,458 | | (1,482 | ) | 1,357 | | (2 | ) | (840 | ) | (19 | ) | 2,839 | | (223 | ) | |||||||||||
Total trading non-derivative assets | $ | 12,418 | | $ | (220 | ) | $ | - | | $ | 2,710 | | $ | (2,817 | ) | $ | 5,239 | | $ | (2 | ) | $ | (5,303 | ) | $ | (19 | ) | $ | 12,006 | | $ | (636 | ) |
Trading derivatives, net (4) |
|
|
|
|
|
|
|
|
|
|
| ||||||||||||||||||||||
Interest rate contracts | $ | (495 | ) | $ | (326 | ) | $ | - | | $ | 309 | | $ | 39 | | $ | 142 | | $ | (18 | ) | $ | (103 | ) | $ | 78 | | $ | (374 | ) | $ | (154 | ) |
Foreign exchange contracts | 620 | | (677 | ) | - | | 4 | | (60 | ) | 106 | | - | | (91 | ) | 69 | | (29 | ) | (572 | ) | |||||||||||
Equity contracts | (800 | ) | 108 | | - | | 64 | | (428 | ) | 46 | | 38 | | (71 | ) | (28 | ) | (1,071 | ) | 107 | | |||||||||||
Commodity contracts | (1,861 | ) | (281 | ) | - | | (49 | ) | (26 | ) | 356 | | - | | (352 | ) | 196 | | (2,017 | ) | (288 | ) | |||||||||||
Credit derivatives | 307 | | (1,152 | ) | - | | (114 | ) | (23 | ) | 42 | | - | | - | | 186 | | (754 | ) | (1,086 | ) | |||||||||||
Total trading derivatives, net (4) | $ | (2,229 | ) | $ | (2,328 | ) | $ | - | | $ | 214 | | $ | (498 | ) | $ | 692 | | $ | 20 | | $ | (617 | ) | $ | 501 | | $ | (4,245 | ) | $ | (1,993 | ) |
Investments |
|
|
|
|
|
|
|
|
|
|
| ||||||||||||||||||||||
Mortgage-backed securities |
|
|
|
|
|
|
|
|
|
|
| ||||||||||||||||||||||
U.S. government-sponsored agency guaranteed | $ | 139 | | $ | - | | $ | (25 | ) | $ | 12 | | $ | (62 | ) | $ | 40 | | $ | - | | $ | (9 | ) | $ | (1 | ) | $ | 94 | | $ | 41 | |
Residential | 4 | | - | | 1 | | - | | - | | 25 | | - | | (5 | ) | - | | 25 | | - | | |||||||||||
Commercial | 2 | | - | | - | | 6 | | (3 | ) | - | | - | | - | | - | | 5 | | - | | |||||||||||
Total investment mortgage-backed securities | $ | 145 | | $ | - | | $ | (24 | ) | $ | 18 | | $ | (65 | ) | $ | 65 | | $ | - | | $ | (14 | ) | $ | (1 | ) | $ | 124 | | $ | 41 | |
U.S. Treasury and federal agency securities | $ | 4 | | $ | - | | $ | - | | $ | - | | $ | - | | $ | - | | $ | - | | $ | (1 | ) | $ | - | | $ | 3 | | $ | - | |
State and municipal | 2,192 | | - | | 162 | | 391 | | (783 | ) | 240 | | - | | (186 | ) | - | | 2,016 | | 118 | | |||||||||||
Foreign government | 260 | | - | | 19 | | 33 | | - | | 103 | | - | | (271 | ) | (3 | ) | 141 | | (106 | ) | |||||||||||
Corporate | 603 | | - | | 45 | | 5 | | (45 | ) | 94 | | - | | (242 | ) | - | | 460 | | (1 | ) | |||||||||||
Equity securities | 124 | | - | | - | | 4 | | - | | - | | - | | - | | - | | 128 | | - | | |||||||||||
Asset-backed securities | 596 | | - | | 35 | | - | | (23 | ) | 204 | | - | | (215 | ) | - | | 597 | | 24 | | |||||||||||
Other debt securities | - | | - | | - | | - | | - | | 5 | | - | | - | | - | | 5 | | - | | |||||||||||
Non-marketable equity securities | 1,135 | | - | | 24 | | 51 | | - | | 18 | | - | | - | | (89 | ) | 1,139 | | 20 | | |||||||||||
Total investments | $ | 5,059 | | $ | - | | $ | 261 | | $ | 502 | | $ | (916 | ) | $ | 729 | | $ | - | | $ | (929 | ) | $ | (93 | ) | $ | 4,613 | | $ | 96 | |
186
|
| Net realized/unrealized | Transfers |
|
|
|
|
| Unrealized | ||||||||||||||||||||||||
In millions of dollars | Dec. 31, 2015 | Principal | Other (1)(2) | into | out of | Purchases | Issuances | Sales | Settlements | Jun. 30, 2016 | |||||||||||||||||||||||
Loans | $ | 2,166 | | $ | - | | $ | (58 | ) | $ | 89 | | $ | (538 | ) | $ | 570 | | $ | 219 | | $ | (675 | ) | $ | (539 | ) | $ | 1,234 | | $ | (63 | ) |
Mortgage servicing rights | 1,781 | | - | | (362 | ) | - | | - | | - | | 68 | | 14 | | (177 | ) | 1,324 | | (154 | ) | |||||||||||
Other financial assets measured on a recurring basis | 180 | | - | | 33 | | 40 | | (5 | ) | - | | 130 | | (124 | ) | (143 | ) | 111 | | (277 | ) | |||||||||||
Liabilities |
|
|
|
|
|
|
|
|
|
|
| ||||||||||||||||||||||
Interest-bearing deposits | $ | 434 | | $ | - | | $ | 35 | | $ | 322 | | $ | (209 | ) | $ | - | | $ | 5 | | $ | - | | $ | (84 | ) | $ | 433 | | $ | 39 | |
Federal funds purchased and securities loaned or sold under agreements to repurchase | 1,247 | | (21 | ) | - | | - | | - | | - | | - | | 16 | | (177 | ) | 1,107 | | (25 | ) | |||||||||||
Trading account liabilities |
|
|
|
|
|
|
|
|
|
|
| ||||||||||||||||||||||
Securities sold, not yet purchased | 199 | | 14 | | - | | 97 | | (43 | ) | (61 | ) | (41 | ) | 70 | | (195 | ) | 12 | | (29 | ) | |||||||||||
Short-term borrowings | 9 | | (27 | ) | - | | 17 | | (4 | ) | - | | 41 | | - | | (37 | ) | 53 | | (19 | ) | |||||||||||
Long-term debt | 7,543 | | (26 | ) | - | | 1,221 | | (1,843 | ) | - | | 2,872 | | 61 | | (742 | ) | 9,138 | | (86 | ) | |||||||||||
Other financial liabilities measured on a recurring basis | 14 | | - | | (7 | ) | - | | (10 | ) | (6 | ) | 2 | | - | | (2 | ) | 5 | | (3 | ) | |||||||||||
(1) | Changes in fair value of available-for-sale investments are recorded in AOCI, unless related to other-than-temporary impairment, while gains and losses from sales are recorded in Realized gains (losses) from sales of investments on the Consolidated Statement of Income. |
(2) | Unrealized gains (losses) on MSRs are recorded in Other revenue on the Consolidated Statement of Income. |
(3) | Represents the amount of total gains or losses for the period, included in earnings (and AOCI for changes in fair value of available-for-sale investments), attributable to the change in fair value relating to assets and liabilities classified as Level 3 that are still held at June 30, 2016. |
(4) | Total Level 3 derivative assets and liabilities have been netted in these tables for presentation purposes only. |
Level 3 Fair Value Rollforward
The were no significant Level 3 transfers for the period March 31, 2017 to June 30, 2017:
The following were the significant Level 3 transfers for the period December 31, 2016 to June 30, 2017:
• | Transfers of Long-term debt of $0.5 billion from Level 2 to Level 3, and of $1.0 billion from Level 3 to Level 2, mainly related to structured debt, reflecting changes in the significance of unobservable inputs as well as certain underlying market inputs becoming less or more observable. |
There were no significant Level 3 transfers for the period from March 31, 2016 to June 30, 2016.
The following were the significant Level 3 transfers for the period from December 31, 2015 to June 30, 2016:
• | Transfers of Other trading assets of $1.5 billion from Level 2 to Level 3, and of $1.5 billion from Level 3 to Level 2, related to trading loans, reflecting changes in the volume of market quotations. |
• | Transfers of Long-term debt of $1.2 billion from Level 2 to Level 3, and of $1.8 billion from Level 3 to Level 2, mainly related to structured debt, reflecting changes in the significance of unobservable inputs as well as certain underlying market inputs becoming less or more observable. |
187
Valuation Techniques and Inputs for Level 3 Fair Value Measurements
The following tables present the valuation techniques covering the majority of Level 3 inventory and the most significant unobservable inputs used in Level 3 fair value measurements. Differences between this table and amounts presented in the Level 3 Fair Value Rollforward table represent individually immaterial items that have been measured using a variety of valuation techniques other than those listed.
As of June 30, 2017 | Fair value (1) (in millions) | Methodology | Input | Low (2)(3) | High (2)(3) | Weighted average (4) | ||||||||
Assets |
|
|
|
|
|
| ||||||||
Federal funds sold and securities borrowed or purchased under agreements to resell | $ | 1,002 | | Model-based | IR Normal Volatility | 24.54 | % | 80.07 | % | 66.85 | % | |||
Mortgage-backed securities | $ | 496 | | Yield analysis | Yield | 0.88 | % | 11.81 | % | 4.13 | % | |||
| 402 | | Price based | Price | $ | 6.02 | | $ | 105.10 | | $ | 70.52 | | |
Non-mortgage debt securities | $ | 2,417 | | Price-based | Price | $ | 15.00 | | $ | 118.96 | | $ | 94.36 | |
| 1,725 | | Model-based | Credit Spread | 35 bps | | 600 bps | | 242 bps | | ||||
Equity securities (5) | $ | 119 | | Model-based | Price | $ | 2.50 | | $ | 1,355.65 | | $ | 656.24 | |
| 115 | | Price-based | Forward Price | 69.86 | | 134.52 | | 92.90 | | ||||
|
|
| Equity Volatility | 3.00 | % | 47.73 | % | 26.01 | % | |||||
Asset-backed securities | $ | 2,406 | | Price-based | Price | $ | 8.19 | | $ | 100.00 | | $ | 77.97 | |
Non-marketable equity | $ | 495 | | Comparables analysis | EBITDA Multiples | 6.30 | x | 12.10 | x | 8.73 | x | |||
| 400 | | Price-based | Discount to price | - | % | 100.00 | % | 7.52 | % | ||||
|
|
| Price to book ratio | 0.23 | x | 1.03 | x | 0.78 | x | |||||
Derivatives-gross (6) |
|
|
|
|
|
| ||||||||
Interest rate contracts (gross) | $ | 3,579 | | Model-based | IR Normal Volatility | 0.11 | % | 67.64 | % | 55.31 | % | |||
|
|
| Mean Reversion | 1.00 | % | 20.00 | % | 10.50 | % | |||||
Foreign exchange contracts (gross) | $ | 894 | | Model-based | Yield | 5.62 | % | 14.50 | % | 9.30 | % | |||
| 96 | | Cash flow | FX Volatility | 2.99 | % | 24.51 | % | 12.77 | % | ||||
|
|
| IR-FX Correlation | (4.01 | )% | 60.00 | % | 49.09 | % | |||||
|
|
| IR-IR Correlation | (7.79 | )% | 69.65 | % | 39.74 | % | |||||
|
|
| Credit Spread | 22 bps | | 481 bps | | 204 bps | | |||||
Equity contracts (gross) | $ | 2,946 | | Model-based | Equity Volatility | 3.00 | % | 54.46 | % | 24.65 | % | |||
|
|
| Forward Price | 51.91 | % | 134.52 | % | 95.49 | % | |||||
|
|
| Equity-Equity Correlation | (88.92 | )% | 92.42 | % | 69.78 | % | |||||
|
|
| Yield Volatility | 3.25 | % | 12.68 | % | 6.41 | % | |||||
|
|
| Equity-IR Correlation | (35.00 | )% | 41.00 | % | 33.25 | % | |||||
Commodity and other contracts (gross) | $ | 3,024 | | Model-based | Forward Price | 28.61 | % | 303.76 | % | 112.86 | % | |||
Credit derivatives (gross) | $ | 2,840 | | Model-based | Recovery Rate | 6.50 | % | 65.00 | % | 34.50 | % | |||
| 1,384 | | Price-based | Credit Correlation | 5.00 | % | 95.00 | % | 35.11 | % | ||||
|
|
| Upfront Points | 5.00 | % | 98.97 | % | 57.17 | % | |||||
|
|
| Price | $ | 0.01 | | $ | 239.25 | | $ | 81.58 | | ||
|
|
| Credit Spread | 5 bps | | 10,381 bps | | 401 bps | | |||||
188
As of June 30, 2017 | Fair value (1) (in millions) | Methodology | Input | Low (2)(3) | High (2)(3) | Weighted average (4) | ||||||||
Nontrading derivatives and other financial assets and liabilities measured on a recurring basis (Gross) | $ | 18 | | Model-based | Redemption Rate | 13.22 | % | 99.50 | % | 73.22 | % | |||
|
|
| Recovery Rate | 40.00 | % | 40.00 | % | 40.00 | % | |||||
|
|
|
| | | | | | | |||||
Loans and leases | $ | 260 | | Model-based | Credit Spread | 45 bps | | 500 bps | | 71 bps | | |||
| 214 | | Yield analysis | Yield | 3.04 | % | 4.54 | % | 3.66 | % | ||||
| 92 | | Price-based |
| | | | | | | ||||
Mortgage servicing rights | $ | 470 | | Cash flow | Yield | 8.00 | % | 19.93 | % | 12.59 | % | |||
| 90 | | Model-based | WAL | 3.97 years | | 7.52 years | | 6.11 years | | ||||
Liabilities |
|
|
|
|
|
| ||||||||
Interest-bearing deposits | $ | 300 | | Model-based | Mean Reversion | 1.00 | % | 20.00 | % | 10.50 | % | |||
|
|
| Yield Volatility | 3.64 | % | 9.31 | % | 7.46 | % | |||||
|
|
| Equity-IR Correlation | 27.00 | % | 41.00 | % | 31.44 | % | |||||
Federal funds purchased and securities loaned or sold under agreements to repurchase | $ | 807 | | Model-based | Interest Rate | 0.93 | % | 2.22 | % | 2.00 | % | |||
Trading account liabilities |
|
|
|
|
|
| ||||||||
Securities sold, not yet purchased | $ | 1,105 | | Model-based | IR Normal Volatility | 24.54 | % | 80.07 | % | 66.85 | % | |||
Short-term borrowings and long-term debt | $ | 11,856 | | Model-based | Mean Reversion | 1.00 | % | 20.00 | % | 10.50 | % | |||
|
|
| Forward Price | 28.61 | % | 196.94 | % | 99.83 | % | |||||
|
|
| IR Normal Volatility | 15.32 | % | 80.07 | % | 62.20 | % | |||||
|
|
| Equity Volatility | 3.00 | % | 47.73 | % | 23.47 | % | |||||
As of December 31, 2016 | Fair value (1) (in millions) | Methodology | Input | Low (2)(3) | High (2)(3) | Weighted average (4) | ||||||||
Assets |
|
|
|
|
|
| ||||||||
Federal funds sold and securities borrowed or purchased under agreements to resell | $ | 1,496 | | Model-based | IR Log-Normal Volatility | 12.86 | % | 75.50 | % | 61.73 | % | |||
|
|
| Interest Rate | (0.51 | )% | 5.76 | % | 2.80 | % | |||||
Mortgage-backed securities | $ | 509 | | Price-based | Price | $ | 5.50 | | $ | 113.48 | | $ | 61.74 | |
| 368 | | Yield analysis | Yield | 1.90 | % | 14.54 | % | 4.34 | % | ||||
State and municipal, foreign government, corporate and other debt securities | $ | 3,308 | | Price-based | Price | $ | 15.00 | | $ | 103.60 | | $ | 89.93 | |
| 1,513 | | Cash flow | Credit Spread | 35 bps | | 600 bps | | 230 bps | | ||||
Equity securities (5) | $ | 69 | | Model-based | Price | $ | 0.48 | | $ | 104.00 | | $ | 22.19 | |
| 58 | | Price-based |
| | | | | | | ||||
Asset-backed securities | $ | 2,454 | | Price-based | Price | $ | 4.00 | | $ | 100.00 | | $ | 71.51 | |
Non-marketable equity | $ | 726 | | Price-based | Discount to Price | - | % | 90.00 | % | 13.36 | % | |||
| 565 | | Comparables analysis | EBITDA Multiples | 6.80 | x | 10.10 | x | 8.62 | x | ||||
|
|
| Price-to-Book Ratio | 0.32 | x | 1.03 | x | 0.87 | x | |||||
|
|
| Price | $ | - | | $ | 113.23 | | $ | 54.40 | | ||
Derivatives-gross (6) |
|
|
|
|
|
| ||||||||
Interest rate contracts (gross) | $ | 4,897 | | Model-based | IR Log-Normal Volatility | 1.00 | % | 93.97 | % | 62.72 | % | |||
|
|
| Mean Reversion | 1.00 | % | 20.00 | % | 10.50 | % | |||||
Foreign exchange contracts (gross) | $ | 1,110 | | Model-based | Foreign Exchange (FX) Volatility | 1.39 | % | 26.85 | % | 15.18 | % | |||
| 134 | | Cash flow | IR Basis | (0.85 | )% | (0.49 | )% | (0.84 | )% | ||||
|
|
| Credit Spread | 4 bps | | 657 bps | | 266 bps | | |||||
189
As of December 31, 2016 | Fair value (1) (in millions) | Methodology | Input | Low (2)(3) | High (2)(3) | Weighted average (4) | ||||||||
|
|
| IR-IR Correlation | 40.00 | % | 50.00 | % | 41.27 | % | |||||
|
|
| IR-FX Correlation | 16.41 | % | 60.00 | % | 49.52 | % | |||||
Equity contracts (gross) (7) | $ | 2,701 | | Model-based | Equity Volatility | 3.00 | % | 97.78 | % | 29.52 | % | |||
|
|
| Forward Price | 69.05 | % | 144.61 | % | 94.28 | % | |||||
|
|
| Equity-FX Correlation | (60.70 | )% | 28.20 | % | (26.28 | )% | |||||
|
|
| Equity-IR Correlation | (35.00 | )% | 41.00 | % | (15.65 | )% | |||||
|
|
| Yield Volatility | 3.55 | % | 14.77 | % | 9.29 | % | |||||
|
|
| Equity-Equity Correlation | (87.70 | )% | 96.50 | % | 67.45 | % | |||||
Commodity contracts (gross) | $ | 2,955 | | Model-based | Forward Price | 35.74 | % | 235.35 | % | 119.99 | % | |||
|
|
| Commodity Volatility | 2.00 | % | 32.19 | % | 17.07 | % | |||||
|
|
| Commodity Correlation | (41.61 | )% | 90.42 | % | 52.85 | % | |||||
Credit derivatives (gross) | $ | 2,786 | | Model-based | Recovery Rate | 20.00 | % | 75.00 | % | 39.75 | % | |||
| 1,403 | | Price-based | Credit Correlation | 5.00 | % | 90.00 | % | 34.27 | % | ||||
|
|
| Upfront Points | 6.00 | % | 99.90 | % | 72.89 | % | |||||
|
|
| Price | $ | 1.00 | | $ | 167.00 | | $ | 77.35 | | ||
|
|
| Credit Spread | 3 bps | | 1,515 bps | | 256 bps | | |||||
Nontrading derivatives and other financial assets and liabilities measured on a recurring basis (gross) (6) | $ | 42 | | Model-based | Recovery Rate | 40.00 | % | 40.00 | % | 40.00 | % | |||
|
|
| Redemption Rate | 3.92 | % | 99.58 | % | 74.69 | % | |||||
|
|
| Upfront Points | 16.00 | % | 20.50 | % | 18.78 | % | |||||
Loans | $ | 258 | | Price-based | Price | $ | 31.55 | | $ | 105.74 | | $ | 56.46 | |
| 221 | | Yield analysis | Yield | 2.75 | % | 20.00 | % | 11.09 | % | ||||
| 79 | | Model-based |
|
|
|
| |||||||
Mortgage servicing rights | $ | 1,473 | | Cash flow | Yield | 4.20 | % | 20.56 | % | 9.32 | % | |||
|
|
| WAL | 3.53 years | | 7.24 years | | 5.83 years | | |||||
Liabilities |
|
|
|
|
|
| ||||||||
Interest-bearing deposits | $ | 293 | | Model-based | Mean Reversion | 1.00 | % | 20.00 | % | 10.50 | % | |||
|
|
| Forward Price | 98.79 | % | 104.07 | % | 100.19 | % | |||||
Federal funds purchased and securities loaned or sold under agreements to repurchase | $ | 849 | | Model-based | Interest Rate | 0.62 | % | 2.19 | % | 1.99 | % | |||
Trading account liabilities |
|
|
|
|
|
| ||||||||
Securities sold, not yet purchased | $ | 1,056 | | Model-based | IR Normal Volatility | 12.86 | % | 75.50 | % | 61.73 | % | |||
Short-term borrowings and long-term debt | $ | 9,774 | | Model-based | Mean Reversion | 1.00 | % | 20.00 | % | 10.50 | % | |||
|
|
| Commodity Correlation | (41.61 | )% | 90.42 | % | 52.85 | % | |||||
|
|
| Commodity Volatility | 2.00 | % | 32.19 | % | 17.07 | % | |||||
|
|
| Forward Price | 69.05 | % | 235.35 | % | 103.28 | % | |||||
(1) | The fair value amounts presented in these tables represent the primary valuation technique or techniques for each class of assets or liabilities. |
(2) | Some inputs are shown as zero due to rounding. |
(3) | When the low and high inputs are the same, there is either a constant input applied to all positions, or the methodology involving the input applies to only one large position. |
(4) | Weighted averages are calculated based on the fair values of the instruments. |
(5) | For equity securities, the price inputs are expressed on an absolute basis, not as a percentage of the notional amount. |
(6) | Both trading and nontrading account derivatives-assets and liabilities-are presented on a gross absolute value basis. |
(7) | Includes hybrid products. |
190
Items Measured at Fair Value on a Nonrecurring Basis
Certain assets and liabilities are measured at fair value on a nonrecurring basis and therefore are not included in the tables above. These include assets measured at cost that have been written down to fair value during the periods as a result of an impairment. In addition, these assets include loans held-for-sale and other real estate owned that are measured at the lower of cost or market.
The following table presents the carrying amounts of all assets that were still held for which a nonrecurring fair value measurement was recorded:
In millions of dollars | Fair value | Level 2 | Level 3 | ||||||
June 30, 2017 |
|
|
| ||||||
Loans held-for-sale (1) | $ | 3,398 | | $ | 1,814 | | $ | 1,584 | |
Other real estate owned | 63 | | 12 | | 51 | | |||
Loans (2) | 863 | | 308 | | 555 | | |||
Total assets at fair value on a nonrecurring basis | $ | 4,324 | | $ | 2,134 | | $ | 2,190 | |
In millions of dollars | Fair value | Level 2 | Level 3 | ||||||
December 31, 2016 |
|
|
| ||||||
Loans held-for-sale (1) | $ | 5,802 | | $ | 3,389 | | $ | 2,413 | |
Other real estate owned | 75 | | 15 | | 60 | | |||
Loans (2) | 1,376 | | 586 | | 790 | | |||
Total assets at fair value on a nonrecurring basis | $ | 7,253 | | $ | 3,990 | | $ | 3,263 | |
(1) | Net of fair value amounts on the unfunded portion of loans held-for-sale, recognized as other liabilities on the Consolidated Balance Sheet. |
(2) | Represents impaired loans held for investment whose carrying amount is based on the fair value of the underlying collateral, primarily real estate. |
191
Valuation Techniques and Inputs for Level 3 Nonrecurring Fair Value Measurements
The following tables present the valuation techniques covering the majority of Level 3 nonrecurring fair value measurements and the most significant unobservable inputs used in those measurements:
As of June 30, 2017 | Fair value (1) (in millions) | Methodology | Input | Low (2) | High | Weighted average (3) | ||||||||
Loans held-for-sale | $ | 1,510 | | Price-based | Price | $ | 0.88 | | $ | 100.00 | | $ | 93.68 | |
Other real estate owned | $ | 50 | | Price-based | Discount to price (4) | 0.34 | % | 0.34 | % | 0.34 | % | |||
|
|
| Appraised value | $ | 20,372 | | $ | 4,491,044 | | $ | 2,018,801 | | ||
|
|
| Price | $ | 54.61 | | $ | 85.81 | | $ | 58.74 | | ||
Loans (5) | $ | 237 | | Price-based | Price | $ | 2.85 | | $ | 58.00 | | $ | 48.70 | |
| 181 | | Recovery Analysis | Appraised Value | $ | 39.47 | | $ | 89.20 | | $ | 76.84 | | |
As of December 31, 2016 | Fair value (1) (in millions) | Methodology | Input | Low (2) | High | Weighted average (3) | ||||||||
Loans held-for-sale | $ | 2,413 | | Price-based | Price | $ | - | | $ | 100.00 | | $ | 93.08 | |
Other real estate owned | $ | 59 | | Price-based | Discount to price (4) | 0.34 | % | 13.00 | % | 3.10 | % | |||
| | |
| Price | $ | 64.65 | | $ | 74.39 | | $ | 66.21 | | |
Loans (5) | $ | 431 | | Cash flow | Price | $ | 3.25 | | $ | 105.00 | | $ | 59.61 | |
| 197 | | Recovery analysis | Forward price | $ | 2.90 | | $ | 210.00 | | $ | 156.78 | | |
| 135 | | Price-based | Discount to price (4) | 0.25 | % | 13.00 | % | 8.34 | % | ||||
| | |
| Appraised value | $ | 25.80 | | $ | 26,400,000 | | $ | 6,462,735 | | |
(1) | The fair value amounts presented in this table represent the primary valuation technique or techniques for each class of assets or liabilities. |
(2) | Some inputs are shown as zero due to rounding. |
(3) | Weighted averages are calculated based on the fair values of the instruments. |
(4) | Includes estimated costs to sell. |
(5) | Represents impaired loans held for investment whose carrying amounts are based on the fair value of the underlying collateral, primarily real estate. |
Nonrecurring Fair Value Changes
The following table presents total nonrecurring fair value measurements for the period, included in earnings, attributable to the change in fair value relating to assets that were still held:
| Three Months Ended June 30, | |||||
In millions of dollars | 2017 | 2016 | ||||
Loans held-for-sale | $ | (5 | ) | $ | (35 | ) |
Other real estate owned | (3 | ) | (4 | ) | ||
Loans (1) | (30 | ) | (48 | ) | ||
Other assets (2) | - | | (23 | ) | ||
Total nonrecurring fair value gains (losses) | $ | (38 | ) | $ | (110 | ) |
(1) | Represents loans held for investment whose carrying amount is based on the fair value of the underlying collateral, primarily real estate. |
(2) | Represents net impairment losses related to an equity investment. |
| Six Months Ended June 30, | |||||
In millions of dollars | 2017 | 2016 | ||||
Loans held-for-sale | $ | (5 | ) | $ | (32 | ) |
Other real estate owned | (3 | ) | (5 | ) | ||
Loans (1) | (48 | ) | (105 | ) | ||
Other assets (2) | - | | (211 | ) | ||
Total nonrecurring fair value gains (losses) | $ | (56 | ) | $ | (353 | ) |
(1) | Represents loans held for investment whose carrying amount is based on the fair value of the underlying collateral, primarily real estate. |
(2) | Represents net impairment losses related to an equity investment. |
192
Estimated Fair Value of Financial Instruments Not Carried at Fair Value
The following table presents the carrying value and fair value of Citigroup's financial instruments that are not carried at fair value. The table therefore excludes items measured at fair value on a recurring basis presented in the tables above.
| June 30, 2017 | Estimated fair value | |||||||||||||
| Carrying value | Estimated fair value |
|
|
| ||||||||||
In billions of dollars | Level 1 | Level 2 | Level 3 | ||||||||||||
Assets |
|
|
|
|
| ||||||||||
Investments | $ | 56.7 | | $ | 57.0 | | $ | 0.3 | | $ | 55.1 | | $ | 1.6 | |
Federal funds sold and securities borrowed or purchased under agreements to resell | 91.2 | | 91.2 | | - | | 86.1 | | 5.1 | | |||||
Loans (1)(2) | 626.7 | | 622.0 | | - | | 5.8 | | 616.2 | | |||||
Other financial assets (2)(3) | 256.0 | | 256.5 | | 6.7 | | 179.6 | | 70.2 | | |||||
Liabilities |
|
|
|
|
| ||||||||||
Deposits | $ | 957.4 | | $ | 955.1 | | $ | - | | $ | 811.6 | | $ | 143.5 | |
Federal funds purchased and securities loaned or sold under agreements to repurchase | 109.9 | | 109.9 | | - | | 109.9 | | - | | |||||
Long-term debt (4) | 196.2 | | 203.7 | | - | | 175.1 | | 28.6 | | |||||
Other financial liabilities (5) | 124.5 | | 124.5 | | - | | 15.4 | | 109.1 | | |||||
| December 31, 2016 | Estimated fair value | |||||||||||||
| Carrying value | Estimated fair value |
|
|
| ||||||||||
In billions of dollars | Level 1 | Level 2 | Level 3 | ||||||||||||
Assets |
|
|
|
|
| ||||||||||
Investments | $ | 52.1 | | $ | 52.0 | | $ | 0.8 | | $ | 48.6 | | $ | 2.6 | |
Federal funds sold and securities borrowed or purchased under agreements to resell | 103.6 | | 103.6 | | - | | 98.5 | | 5.1 | | |||||
Loans (1)(2) | 607.0 | | 607.3 | | - | | 7.0 | | 600.3 | | |||||
Other financial assets (2)(3) | 215.2 | | 215.9 | | 8.2 | | 153.6 | | 54.1 | | |||||
Liabilities |
|
|
|
|
| ||||||||||
Deposits | $ | 928.2 | | $ | 927.6 | | $ | - | | $ | 789.7 | | $ | 137.9 | |
Federal funds purchased and securities loaned or sold under agreements to repurchase | 108.2 | | 108.2 | | - | | 107.8 | | 0.4 | | |||||
Long-term debt (4) | 179.9 | | 185.5 | | - | | 156.5 | | 29.0 | | |||||
Other financial liabilities (5) | 115.3 | | 115.3 | | - | | 16.2 | | 99.1 | | |||||
(1) | The carrying value of loans is net of the Allowance for loan losses of $12.0 billion for June 30, 2017 and $12.1 billion for December 31, 2016 . In addition, the carrying values exclude $1.8 billion and $1.9 billion of lease finance receivables at June 30, 2017 and December 31, 2016 , respectively. |
(2) | Includes items measured at fair value on a nonrecurring basis. |
(3) | Includes cash and due from banks, deposits with banks, brokerage receivables, reinsurance recoverables and other financial instruments included in Other assets on the Consolidated Balance Sheet, for all of which the carrying value is a reasonable estimate of fair value. |
(4) | The carrying value includes long-term debt balances under qualifying fair value hedges. |
(5) | Includes brokerage payables, separate and variable accounts, short-term borrowings (carried at cost) and other financial instruments included in Other liabilities on the Consolidated Balance Sheet, for all of which the carrying value is a reasonable estimate of fair value. |
The estimated fair values of the Company's corporate unfunded lending commitments at June 30, 2017 and December 31, 2016 were liabilities of $2.4 billion and $5.2 billion , respectively, substantially all of which are classified as Level 3. The Company does not estimate the fair values of consumer unfunded lending commitments, which are generally cancellable by providing notice to the borrower.
193
21. FAIR VALUE ELECTIONS
The Company may elect to report most financial instruments and certain other items at fair value on an instrument-by-instrument basis with changes in fair value reported in earnings, other than DVA (see below). The election is made upon the initial recognition of an eligible financial asset, financial liability or firm commitment or when certain specified reconsideration events occur. The fair value election
may not be revoked once an election is made. The changes in fair value are recorded in current earnings, other than DVA, which from January 1, 2016 is reported in AOCI.
The Company has elected fair value accounting for its mortgage servicing rights. See Note 18 to the Consolidated Financial Statements for further discussions regarding the accounting and reporting of MSRs.
| Changes in fair value-gains (losses) | |||||||||||
| Three Months Ended June 30, | Six Months Ended June 30, | ||||||||||
In millions of dollars | 2017 | 2016 | 2017 | 2016 | ||||||||
Assets |
|
|
|
| ||||||||
Federal funds sold and securities borrowed or purchased under agreements to resell-selected portfolios | $ | (58 | ) | $ | 19 | | $ | (91 | ) | $ | 47 | |
Trading account assets | 232 | | (320 | ) | 662 | | (62 | ) | ||||
Investments | (3 | ) | (22 | ) | (3 | ) | (21 | ) | ||||
Loans |
|
| | | ||||||||
Certain corporate loans (1) | (5 | ) | 36 | | 19 | | 60 | | ||||
Certain consumer loans (1) | 2 | | - | | 2 | | (1 | ) | ||||
Total loans | $ | (3 | ) | $ | 36 | | $ | 21 | | $ | 59 | |
Other assets |
|
| | | ||||||||
MSRs | $ | (11 | ) | $ | (137 | ) | $ | 56 | | $ | (362 | ) |
Certain mortgage loans held-for-sale (2) | 44 | | 91 | | 81 | | 171 | | ||||
Other assets | - | | - | | - | | 370 | | ||||
Total other assets | $ | 33 | | $ | (46 | ) | $ | 137 | | $ | 179 | |
Total assets | $ | 201 | | $ | (333 | ) | $ | 726 | | $ | 202 | |
Liabilities |
|
|
|
| ||||||||
Interest-bearing deposits | $ | (30 | ) | $ | (18 | ) | $ | (44 | ) | $ | (68 | ) |
Federal funds purchased and securities loaned or sold under agreements to repurchase-selected portfolios | (527 | ) | (2 | ) | 86 | | (8 | ) | ||||
Trading account liabilities | 25 | | 3 | | 51 | | 97 | | ||||
Short-term borrowings | (99 | ) | (114 | ) | (80 | ) | (34 | ) | ||||
Long-term debt | (139 | ) | (117 | ) | (471 | ) | (540 | ) | ||||
Total liabilities | $ | (770 | ) | $ | (248 | ) | $ | (458 | ) | $ | (553 | ) |
(1) | Includes mortgage loans held by consolidated mortgage loan securitization VIEs. |
(2) | Includes gains (losses) associated with interest rate lock commitments for those loans that have been originated and elected under the fair value option. |
194
Own Debt Valuation Adjustments (DVA)
Own debt valuation adjustments are recognized on Citi's liabilities for which the fair value option has been elected using Citi's credit spreads observed in the bond market. Among other variables, the fair value of liabilities for which the fair value option has been elected (other than non-recourse and similar liabilities) is impacted by the narrowing or widening of the Company's credit spreads.
The estimated change in the fair value of these liabilities due to such changes in the Company's own credit spread (or instrument-specific credit risk) was a loss of $132 million and a gain of $ 20 million for the three months ended June 30, 2017 and 2016 , and a loss of $227 million and a gain of $327 million for the six months ended June 30, 2017 and 2016, respectively. Changes in fair value resulting from changes in instrument-specific credit risk were estimated by incorporating the Company's current credit spreads observable in the bond market into the relevant valuation technique used to value each liability as described above. Effective January 1, 2016, changes in fair value of fair value option liabilities related to changes in Citigroup's own credit spreads (DVA) are reflected as a component of AOCI; previously these amounts were recognized in Citigroup's Revenues and Net income along with all other changes in fair value. See Note 1 to the Consolidated Financial Statements for additional information.
The Fair Value Option for Financial Assets and Financial Liabilities
Selected Portfolios of Securities Purchased Under Agreements to Resell, Securities Borrowed, Securities Sold Under Agreements to Repurchase, Securities Loaned and Certain Non-Collateralized Short-Term Borrowings
The Company elected the fair value option for certain portfolios of fixed-income securities purchased under agreements to resell and fixed-income securities sold under agreements to repurchase, securities borrowed, securities loaned and certain non-collateralized short-term borrowings held primarily by broker-dealer entities in the United States, United Kingdom and Japan. In each case, the election was made because the related interest rate risk is managed on a portfolio basis, primarily with offsetting derivative instruments that are accounted for at fair value through earnings.
Changes in fair value for transactions in these portfolios are recorded in Principal transactions . The related interest revenue and interest expense are measured based on the contractual rates specified in the transactions and are reported as interest revenue and expense in the Consolidated Statement of Income.
Certain Loans and Other Credit Products
Citigroup has also elected the fair value option for certain other originated and purchased loans, including certain unfunded loan products, such as guarantees and letters of credit, executed by Citigroup's lending and trading businesses. None of these credit products are highly leveraged financing commitments. Significant groups of transactions include loans and unfunded loan products that are expected to be either sold or securitized in the near term, or transactions where the economic risks are hedged with derivative instruments, such as purchased credit default swaps or total return swaps where the Company pays the total return on the underlying loans to a third party. Citigroup has elected the fair value option to mitigate accounting mismatches in cases where hedge accounting is complex and to achieve operational simplifications. Fair value was not elected for most lending transactions across the Company.
The following table provides information about certain credit products carried at fair value:
| June 30, 2017 | December 31, 2016 | ||||||||||
In millions of dollars | Trading assets | Loans | Trading assets | Loans | ||||||||
Carrying amount reported on the Consolidated Balance Sheet | $ | 9,009 | | $ | 4,216 | | $ | 9,824 | | $ | 3,486 | |
Aggregate unpaid principal balance in excess of fair value | 402 | | 3 | | 758 | | 18 | | ||||
Balance of non-accrual loans or loans more than 90 days past due | - | | 1 | | - | | 1 | | ||||
Aggregate unpaid principal balance in excess of fair value for non-accrual loans or loans more than 90 days past due | - | | - | | - | | 1 | | ||||
In addition to the amounts reported above, $ 1,203 million and $ 1,828 million of unfunded commitments related to certain credit products selected for fair value accounting were
outstanding as of June 30, 2017 and December 31, 2016 , respectively.
195
Changes in the fair value of funded and unfunded credit products are classified in Principal transactions in the Company's Consolidated Statement of Income. Related interest revenue is measured based on the contractual interest rates and reported as Interest revenue on Trading account assets or loan interest depending on the balance sheet classifications of the credit products. The changes in fair value for the six months ended June 30, 2017 and 2016 due to instrument-specific credit risk totaled to a gain of $ 25 million and $ 56 million , respectively.
Certain Investments in Unallocated Precious Metals
Citigroup invests in unallocated precious metals accounts (gold, silver, platinum and palladium) as part of its commodity and foreign currency trading activities or to economically hedge certain exposures from issuing structured liabilities. Under ASC 815, the investment is bifurcated into a debt host contract and a commodity forward derivative instrument. Citigroup elects the fair value option for the debt host contract, and reports the debt host contract within Trading account assets on the Company's Consolidated Balance Sheet. The total carrying amount of debt host contracts across unallocated precious metals accounts was approximately $ 0.8 billion and $ 0.6 billion at June 30, 2017 and December 31, 2016 , respectively. The amounts are expected to fluctuate based on trading activity in future periods.
As part of its commodity and foreign currency trading activities, Citi trades unallocated precious metals investments and executes forward purchase and forward sale derivative contracts with trading counterparties. When Citi sells an unallocated precious metals investment, Citi's receivable from its depository bank is repaid and Citi derecognizes its investment in the unallocated precious metal. The forward purchase or sale contract with the trading counterparty indexed to unallocated precious metals is accounted for as a derivative, at fair value through earnings. As of June 30, 2017 , there were approximately $ 16.8 billion and $ 13.9 billion notional amounts of such forward purchase and forward sale derivative contracts outstanding, respectively.
Certain Investments in Private Equity and Real Estate Ventures and Certain Equity Method and Other Investments
Citigroup invests in private equity and real estate ventures for the purpose of earning investment returns and for capital appreciation. The Company has elected the fair value option for certain of these ventures, because such investments are considered similar to many private equity or hedge fund activities in Citi's investment companies, which are reported at fair value. The fair value option brings consistency in the accounting and evaluation of these investments. All investments (debt and equity) in such private equity and real estate entities are accounted for at fair value. These investments are classified as Investments on Citigroup's Consolidated Balance Sheet.
Changes in the fair values of these investments are classified in Other revenue in the Company's Consolidated Statement of Income.
Citigroup also elects the fair value option for certain non-marketable equity securities whose risk is managed with derivative instruments that are accounted for at fair value through earnings. These securities are classified as Trading account assets on Citigroup's Consolidated Balance Sheet. Changes in the fair value of these securities and the related derivative instruments are recorded in Principal transactions .
Certain Mortgage Loans Held-for-Sale (HFS)
Citigroup has elected the fair value option for certain purchased and originated prime fixed-rate and conforming adjustable-rate first mortgage loans HFS. These loans are intended for sale or securitization and are hedged with derivative instruments. The Company has elected the fair value option to mitigate accounting mismatches in cases where hedge accounting is complex and to achieve operational simplifications.
The following table provides information about certain mortgage loans HFS carried at fair value:
In millions of dollars | June 30, | December 31, 2016 | ||||
Carrying amount reported on the Consolidated Balance Sheet | $ | 468 | | $ | 915 | |
Aggregate fair value in excess of unpaid principal balance | 17 | | 8 | | ||
Balance of non-accrual loans or loans more than 90 days past due | - | | - | | ||
Aggregate unpaid principal balance in excess of fair value for non-accrual loans or loans more than 90 days past due | - | | - | | ||
The changes in the fair values of these mortgage loans are reported in Other revenue in the Company's Consolidated Statement of Income. There was no net change in fair value during the six months ended June 30, 2017 and 2016 due to instrument-specific credit risk. Related interest income continues to be measured based on the contractual interest rates and reported as Interest revenue in the Consolidated Statement of Income.
196
Certain Structured Liabilities
The Company has elected the fair value option for certain structured liabilities whose performance is linked to structured interest rates, inflation, currency, equity, referenced credit or commodity risks. The Company elected the fair value option because these exposures are considered to be trading-related positions and, therefore, are managed on a fair value basis. These positions will continue to be classified as debt, deposits or derivatives ( Trading account liabilities ) on the Company's Consolidated Balance Sheet according to their legal form.
The following table provides information about the carrying value of structured notes, disaggregated by type of embedded derivative instrument:
In billions of dollars | June 30, 2017 | December 31, 2016 | ||||
Interest rate linked | $ | 12.1 | | $ | 10.6 | |
Foreign exchange linked | 0.2 | | 0.2 | | ||
Equity linked | 12.0 | | 12.3 | | ||
Commodity linked | 0.9 | | 0.3 | | ||
Credit linked | 2.0 | | 0.9 | | ||
Total | $ | 27.2 | | $ | 24.3 | |
Prior to 2016, the total change in the fair value of these structured liabilities was reported in Principal transactions in the Company's Consolidated Statement of Income. Beginning in the first quarter of 2016, the portion of the changes in fair value attributable to changes in Citigroup's own credit spreads (DVA) is reflected as a component of AOCI while all other changes in fair value will continue to be reported in Principal transactions . Changes in the fair value of these structured liabilities include accrued interest, which is also included in the change in fair value reported in Principal transactions .
Certain Non-Structured Liabilities
The Company has elected the fair value option for certain non-structured liabilities with fixed and floating interest rates. The Company has elected the fair value option where the interest rate risk of such liabilities may be economically hedged with derivative contracts or the proceeds are used to purchase financial assets that will also be accounted for at fair value through earnings. The elections have been made to mitigate accounting mismatches and to achieve operational simplifications. These positions are reported in Short-term borrowings and Long-term debt on the Company's Consolidated Balance Sheet. Prior to 2016, the total change in the fair value of these non-structured liabilities was reported in Principal transactions in the Company's Consolidated Statement of Income. Beginning in the first quarter of 2016, the portion of the changes in fair value attributable to changes in Citigroup's own credit spreads (DVA) is reflected as a component of AOCI while all other changes in fair value will continue to be reported in Principal transactions .
Interest expense on non-structured liabilities is measured based on the contractual interest rates and reported as Interest expense in the Consolidated Statement of Income.
The following table provides information about long-term debt carried at fair value:
In millions of dollars | June 30, 2017 | December 31, 2016 | ||||
Carrying amount reported on the Consolidated Balance Sheet | $ | 29,001 | | $ | 26,254 | |
Aggregate unpaid principal balance in excess of (less than) fair value | 866 | | (128 | ) | ||
The following table provides information about short-term borrowings carried at fair value:
In millions of dollars | June 30, 2017 | December 31, 2016 | ||||
Carrying amount reported on the Consolidated Balance Sheet | $ | 4,833 | | $ | 2,700 | |
Aggregate unpaid principal balance in excess of (less than) fair value | (71 | ) | (61 | ) | ||
197
22. GUARANTEES AND COMMITMENTS
Citi provides a variety of guarantees and indemnifications to its customers to enhance their credit standing and enable them to complete a wide variety of business transactions. For
certain contracts meeting the definition of a guarantee, the guarantor must recognize, at inception, a liability for the fair value of the obligation undertaken in issuing the guarantee.
In addition, the guarantor must disclose the maximum potential amount of future payments that the guarantor could be required to make under the guarantee, if there were a total
default by the guaranteed parties. The determination of the maximum potential future payments is based on the notional amount of the guarantees without consideration of possible
recoveries under recourse provisions or from collateral held or pledged. As such, Citi believes such amounts bear no relationship to the anticipated losses, if any, on these guarantees.
For additional information regarding Citi's guarantees and indemnifications included in the tables below, as well as its other guarantees and indemnifications excluded from the tables below, see Note 26 to the Consolidated Financial Statements in Citi's 2016 Annual Report on Form 10-K.
The following tables present information about Citi's guarantees at June 30, 2017 and December 31, 2016 :
| Maximum potential amount of future payments |
| ||||||||||
In billions of dollars at June 30, 2017 except carrying value in millions | Expire within 1 year | Expire after 1 year | Total amount outstanding | Carrying value (in millions of dollars) | ||||||||
Financial standby letters of credit | $ | 36.8 | | $ | 56.4 | | $ | 93.2 | | $ | 162 | |
Performance guarantees | 7.5 | | 3.0 | | 10.5 | | 20 | | ||||
Derivative instruments considered to be guarantees | 14.1 | | 83.6 | | 97.7 | | 806 | | ||||
Loans sold with recourse | - | | 0.2 | | 0.2 | | 10 | | ||||
Securities lending indemnifications (1) | 97.0 | | - | | 97.0 | | - | | ||||
Credit card merchant processing (1)(2) | 83.8 | | - | | 83.8 | | - | | ||||
Credit card arrangements with partners | 0.1 | | 1.3 | | 1.4 | | 206 | | ||||
Custody indemnifications and other | - | | 52.0 | | 52.0 | | 59 | | ||||
Total | $ | 239.3 | | $ | 196.5 | | $ | 435.8 | | $ | 1,263 | |
| Maximum potential amount of future payments |
| ||||||||||
In billions of dollars at December 31, 2016 except carrying value in millions | Expire within 1 year | Expire after 1 year | Total amount outstanding | Carrying value ( in millions of dollars) | ||||||||
Financial standby letters of credit | $ | 26.0 | | $ | 67.1 | | $ | 93.1 | | $ | 141 | |
Performance guarantees | 7.5 | | 3.6 | | 11.1 | | 19 | | ||||
Derivative instruments considered to be guarantees | 7.2 | | 80.0 | | 87.2 | | 747 | | ||||
Loans sold with recourse | - | | 0.2 | | 0.2 | | 12 | | ||||
Securities lending indemnifications (1) | 80.3 | | - | | 80.3 | | - | | ||||
Credit card merchant processing (1)(2) | 86.4 | | - | | 86.4 | | - | | ||||
Credit card arrangements with partners | - | | 1.5 | | 1.5 | | 206 | | ||||
Custody indemnifications and other | - | | 45.4 | | 45.4 | | 58 | | ||||
Total | $ | 207.4 | | $ | 197.8 | | $ | 405.2 | | $ | 1,183 | |
(1) | The carrying values of securities lending indemnifications and credit card merchant processing were not material for either period presented, as the probability of potential liabilities arising from these guarantees is minimal. |
(2) | At June 30, 2017 and December 31, 2016 , this maximum potential exposure was estimated to be $84 billion and $86 billion , respectively. However, Citi believes that the maximum exposure is not representative of the actual potential loss exposure based on its historical experience. This contingent liability is unlikely to arise, as most products and services are delivered when purchased and amounts are refunded when items are returned to merchants. |
198
Loans sold with recourse
Loans sold with recourse represent Citi's obligations to
reimburse the buyers for loan losses under certain
circumstances. Recourse refers to the clause in a sales
agreement under which a seller/lender will fully reimburse
the buyer/investor for any losses resulting from the
purchased loans. This may be accomplished by the seller
taking back any loans that become delinquent.
In addition to the amounts shown in the tables above,
Citi has recorded a repurchase reserve for its potential
repurchases or make-whole liability regarding residential
mortgage representation and warranty claims related to its
whole loan sales to the U.S. government-sponsored
enterprises (GSEs) and, to a lesser extent, private investors.
The repurchase reserve was approximately $75 million and
$107 million at June 30, 2017 and December 31, 2016 ,
respectively, and these amounts are included in Other
liabilities on the Consolidated Balance Sheet.
Credit card arrangements with partners
Citi, in certain of its credit card partner arrangements,
provides guarantees to the partner regarding the volume of
certain customer originations during the term of the
agreement. To the extent such origination targets are not met,
the guarantees serve to compensate the partner for certain
payments that otherwise would have been generated in
connection with such originations.
Other guarantees and indemnifications
Credit Card Protection Programs
Citi, through its credit card businesses, provides various
cardholder protection programs on several of its card
products, including programs that provide insurance
coverage for rental cars, coverage for certain losses
associated with purchased products, price protection for
certain purchases and protection for lost luggage. These
guarantees are not included in the table, since the total
outstanding amount of the guarantees and Citi's maximum
exposure to loss cannot be quantified. The protection is
limited to certain types of purchases and losses, and it is not
possible to quantify the purchases that would qualify for
these benefits at any given time. Citi assesses the probability
and amount of its potential liability related to these programs
based on the extent and nature of its historical loss
experience. At June 30, 2017 and December 31, 2016, the actual and estimated losses incurred and the carrying value of Citi's obligations related to these programs were
immaterial.
Value-Transfer Networks
Citi is a member of, or shareholder in, hundreds of value transfer networks (VTNs) (payment, clearing and settlement
systems as well as exchanges) around the world. As a
condition of membership, many of these VTNs require that
members stand ready to pay a pro rata share of the losses
incurred by the organization due to another member's default
on its obligations. Citi's potential obligations may be limited
to its membership interests in the VTNs, contributions to the
VTN's funds, or, in limited cases, the obligation may be unlimited. The maximum exposure cannot be estimated as
this would require an assessment of future claims that have
not yet occurred. Citi believes the risk of loss is remote
given historical experience with the VTNs. Accordingly,
Citi's participation in VTNs is not reported in the guarantees
tables above, and there are no amounts reflected on the
Consolidated Balance Sheet as of June 30, 2017 or
December 31, 2016 for potential obligations that could arise
from Citi's involvement with VTN associations.
Long-Term Care Insurance Indemnification
In connection with the 2005 sale of certain insurance and annuity subsidiaries to MetLife Inc. (MetLife), the Company provided an indemnification for policyholder claims and other liabilities relating to a book of long-term care (LTC) business (for the entire term of the LTC policies) that is fully reinsured by subsidiaries of Genworth Financial Inc. (Genworth). In turn, Genworth has offsetting reinsurance agreements with MetLife and the Union Fidelity Life Insurance Company (UFLIC), a subsidiary of the General Electric Company. Genworth has funded two trusts with securities whose fair value (approximately $7.3 billion at June 30, 2017 , compared to $7.0 billion at December 31, 2016 ) is designed to cover Genworth's statutory liabilities for the LTC policies. The trusts serve as collateral for Genworth's reinsurance obligations related to the MetLife LTC policies and MetLife Insurance Company USA is the sole beneficiary of the trusts. The assets in these trusts are evaluated and adjusted periodically to ensure that the fair value of the assets continues to cover the estimated statutory liabilities related to the LTC policies, as those statutory liabilities change over time.
If Genworth fails to perform under the reinsurance agreement for any reason, including insolvency, and the assets in the two trusts are insufficient or unavailable to MetLife, then Citi must reimburse MetLife for any losses actually incurred in connection with the LTC policies. Since both events would have to occur before Citi would become responsible for any payment to MetLife pursuant to its indemnification obligation, and the likelihood of such events occurring is currently not probable, there is no liability reflected in the Consolidated Balance Sheet as of June 30, 2017 and December 31, 2016 related to this indemnification. Citi continues to closely monitor its potential exposure under this indemnification obligation.
In the fourth quarter of 2016, MetLife announced it was pursuing spinning off the entity involved in the long-term care reinsurance obligations as part of a broader separation of its retail and group/corporate insurance operations. Separately, Genworth announced that it had agreed to be purchased by China Oceanwide Holdings Co., Ltd, subject to a series of conditions and regulatory approvals. Citi is monitoring these developments.
199
Futures and over-the-counter derivatives clearing
Citi provides clearing services on central clearing parties (CCP) for clients that need to clear exchange-traded and over-the-counter (OTC) derivatives contracts with CCPs. Based on all relevant facts and circumstances, Citi has concluded that it acts as an agent for accounting purposes in its role as clearing member for these client transactions. As such, Citi does not reflect the underlying exchange-traded or OTC derivatives contracts in its Consolidated Financial Statements. See Note 19 for a discussion of Citi's derivatives activities that are reflected in its Consolidated Financial Statements.
As a clearing member, Citi collects and remits cash and securities collateral (margin) between its clients and the
respective CCP. In certain circumstances, Citi collects a higher amount of cash (or securities) from its clients than it needs to remit to the CCPs. This excess cash is then held at depository institutions such as banks or carry brokers.
There are two types of margin: initial margin and variation margin. Where Citi obtains benefits from or controls cash initial margin (e.g., retains an interest
spread), cash initial margin collected from clients and
remitted to the CCP, or depository institutions, is reflected within Brokerage payables (payables to customers) and Brokerage receivables (receivables from brokers, dealers and clearing organizations) or Cash and due from banks , respectively.
However, for exchange-traded and OTC-cleared derivatives contracts where Citi does not obtain benefits from or control the client cash balances, the client cash initial margin collected from clients and remitted to the CCP or depository institutions is not reflected on Citi's Consolidated Balance Sheet. These conditions are met when Citi has contractually agreed with the client that (i) Citi will pass through to the client all interest paid by the CCP or depository institutions on the cash initial margin; (ii) Citi will not utilize its right as a clearing member to transform cash margin into other assets; (iii) Citi does not guarantee and is not liable to the client for the performance of the CCP or the depository institution and (iv) the client cash balances are legally isolated from Citi's bankruptcy estate. The total amount of cash initial margin collected and remitted in this manner was approximately $10.2 billion and $9.4 billion as of June 30, 2017 and December 31, 2016 , respectively.
Variation margin due from clients to the respective CCP, or from the CCP to clients, reflects changes in the value of the client's derivative contracts for each trading day. As a clearing member, Citi is exposed to the risk of nonperformance by clients (e.g., failure of a client to post
variation margin to the CCP for negative changes in the
value of the client's derivative contracts). In the event of
non-performance by a client, Citi would move to close out
the client's positions. The CCP would typically utilize initial
margin posted by the client and held by the CCP, with any
remaining shortfalls required to be paid by Citi as clearing
member. Citi generally holds incremental cash or securities
margin posted by the client, which would typically be
expected to be sufficient to mitigate Citi's credit risk in the
event the client fails to perform.
As required by ASC 860-30-25-5, securities collateral posted by clients is not recognized on Citi's Consolidated Balance Sheet.
Carrying Value-Guarantees and Indemnifications
At June 30, 2017 and December 31, 2016 , the total carrying amounts of the liabilities related to the guarantees and indemnifications included in the tables above amounted
to approximately $1.3 billion and $1.2 billion . The carrying value of financial and performance guarantees is included in Other liabilities . For loans sold with recourse, the carrying value of the liability is included in Other liabilities .
Collateral
Cash collateral available to Citi to reimburse losses realized under these guarantees and indemnifications amounted to $57 billion and $45 billion at June 30, 2017 and December 31, 2016 , respectively. Securities and other marketable assets held as collateral amounted to $43 billion and $38 billion at June 30, 2017 and December 31, 2016 , respectively. The majority of collateral is held to reimburse losses realized under securities lending indemnifications. Additionally, letters of credit in favor of Citi held as collateral amounted to $5.4 billion at both June 30, 2017 and December 31, 2016 . Other property may also be available to Citi to cover losses under certain guarantees and indemnifications; however, the value of such property has not been determined.
Performance risk
Presented in the tables below are the maximum potential amounts of future payments that are classified based upon internal and external credit ratings. The determination of the maximum potential future payments is based on the notional amount of the guarantees without consideration of possible recoveries under recourse provisions or from collateral held or pledged. As such, Citi believes such amounts bear no relationship to the anticipated losses, if any, on these guarantees.
200
| Maximum potential amount of future payments | |||||||||||
In billions of dollars at June 30, 2017 | Investment grade | Non-investment grade | Not rated | Total | ||||||||
Financial standby letters of credit | $ | 67.0 | | $ | 12.3 | | $ | 13.9 | | $ | 93.2 | |
Performance guarantees | 6.8 | | 2.9 | | 0.8 | | 10.5 | | ||||
Derivative instruments deemed to be guarantees | - | | - | | 97.7 | | 97.7 | | ||||
Loans sold with recourse | - | | - | | 0.2 | | 0.2 | | ||||
Securities lending indemnifications | - | | - | | 97.0 | | 97.0 | | ||||
Credit card merchant processing | - | | - | | 83.8 | | 83.8 | | ||||
Credit card arrangements with partners | - | | - | | 1.4 | | 1.4 | | ||||
Custody indemnifications and other | 51.5 | | 0.3 | | 0.2 | | 52.0 | | ||||
Total | $ | 125.3 | | $ | 15.5 | | $ | 295.0 | | $ | 435.8 | |
| Maximum potential amount of future payments | |||||||||||
In billions of dollars at December 31, 2016 | Investment grade | Non-investment grade | Not rated | Total | ||||||||
Financial standby letters of credit | $ | 66.8 | | $ | 13.4 | | $ | 12.9 | | $ | 93.1 | |
Performance guarantees | 6.3 | | 4.0 | | 0.8 | | 11.1 | | ||||
Derivative instruments deemed to be guarantees | - | | - | | 87.2 | | 87.2 | | ||||
Loans sold with recourse | - | | - | | 0.2 | | 0.2 | | ||||
Securities lending indemnifications | - | | - | | 80.3 | | 80.3 | | ||||
Credit card merchant processing | - | | - | | 86.4 | | 86.4 | | ||||
Credit card arrangements with partners | - | | - | | 1.5 | | 1.5 | | ||||
Custody indemnifications and other | 45.3 | | 0.1 | | - | | 45.4 | | ||||
Total | $ | 118.4 | | $ | 17.5 | | $ | 269.3 | | $ | 405.2 | |
Credit Commitments and Lines of Credit
The table below summarizes Citigroup's credit commitments:
In millions of dollars | U.S. | Outside of U.S. | June 30, | December 31, 2016 | ||||||||
Commercial and similar letters of credit | $ | 913 | | $ | 4,275 | | $ | 5,188 | | $ | 5,736 | |
One- to four-family residential mortgages | 1,589 | | 1,681 | | 3,270 | | 2,838 | | ||||
Revolving open-end loans secured by one- to four-family residential properties | 11,487 | | 1,551 | | 13,038 | | 13,405 | | ||||
Commercial real estate, construction and land development | 10,816 | | 1,394 | | 12,210 | | 10,781 | | ||||
Credit card lines | 577,326 | | 98,938 | | 676,264 | | 664,335 | | ||||
Commercial and other consumer loan commitments | 168,318 | | 95,569 | | 263,887 | | 259,934 | | ||||
Other commitments and contingencies | 2,163 | | 9,371 | | 11,534 | | 11,267 | | ||||
Total | $ | 772,612 | | $ | 212,779 | | $ | 985,391 | | $ | 968,296 | |
The majority of unused commitments are contingent upon customers maintaining specific credit standards.
Commercial commitments generally have floating interest rates and fixed expiration dates and may require payment of fees. Such fees (net of certain direct costs) are deferred and, upon exercise of the commitment, amortized over the life of the loan or, if exercise is deemed remote, amortized over the commitment period.
201
23. CONTINGENCIES
The following information supplements and amends, as applicable, the disclosures in Note 23 to the Consolidated Financial Statements of Citigroup's First Quarter of 2017 Form 10-Q and Note 27 to the Consolidated Financial Statements of Citigroup's 2016 Annual Report on Form 10-K. For purposes of this Note, Citigroup, its affiliates and subsidiaries and current and former officers, directors and employees, are sometimes collectively referred to as Citigroup and Related Parties.
In accordance with ASC 450, Citigroup establishes accruals for contingencies, including the litigation and regulatory matters disclosed herein, when Citigroup believes it is probable that a loss has been incurred and the amount of the loss can be reasonably estimated. Once established, accruals are adjusted from time to time, as appropriate, in light of additional information. The amount of loss ultimately incurred in relation to those matters may be substantially higher or lower than the amounts accrued for those matters.
If Citigroup has not accrued for a matter because the matter does not meet the criteria for accrual (as set forth above), or Citigroup believes an exposure to loss exists in excess of the amount accrued for a particular matter, in each case assuming a material loss is reasonably possible, Citigroup discloses the matter. In addition, for such matters, Citigroup discloses an estimate of the aggregate reasonably possible loss or range of loss in excess of the amounts accrued for those matters as to which an estimate can be made. At June 30, 2017, Citigroup's estimate of the reasonably possible unaccrued loss for these matters ranges up to approximately $1.5 billion in the aggregate.
As available information changes, the matters for which Citigroup is able to estimate will change, and the estimates themselves will change. In addition, while many estimates presented in financial statements and other financial disclosures involve significant judgment and may be subject to significant uncertainty, estimates of the range of reasonably possible loss arising from litigation and regulatory proceedings are subject to particular uncertainties. For example, at the time of making an estimate, Citigroup may have only preliminary, incomplete or inaccurate information about the facts underlying the claim; its assumptions about the future rulings of the court or other tribunal on significant issues, or the behavior and incentives of adverse parties or regulators, may prove to be wrong; and the outcomes it is attempting to predict are often not amenable to the use of statistical or other quantitative analytical tools. In addition, from time to time an outcome may occur that Citigroup had not accounted for in its estimates because it had deemed such an outcome to be remote. For all these reasons, the amount of loss in excess of accruals ultimately incurred for the matters as to which an estimate has been made could be substantially higher or lower than the range of loss included in the estimate.
Subject to the foregoing, it is the opinion of Citigroup's management, based on current knowledge and after taking into account its current legal accruals, that the eventual outcome of all matters described in this Note would not be likely to have a material adverse effect on the consolidated financial condition
of Citigroup. Nonetheless, given the substantial or indeterminate amounts sought in certain of these matters and the inherent unpredictability of such matters, an adverse outcome in certain of these matters could, from time to time, have a material adverse effect on Citigroup's consolidated results of operations or cash flows in particular quarterly or annual periods.
For further information on ASC 450 and Citigroup's accounting and disclosure framework for contingencies, including for litigation and regulatory matters disclosed herein, see Note 27 to the Consolidated Financial Statements of Citigroup's 2016 Annual Report on Form 10-K.
Credit Crisis-Related Litigation and Other Matters
Mortgage-Related Litigation and Other Matters
Mortgage Backed Securities Trustee Actions:
On May 23, 2017, the plaintiffs cross-moved for partial summary judgment in FIXED INCOME SHARES: SERIES M ET AL. v. CITIBANK N.A. Additional information concerning this action is publicly available in court filings under the docket number 14-cv-9373 (S.D.N.Y.) (Furman, J.).
On June 27, 2017, the court granted in part and denied in part Citibank's motion to dismiss the amended complaint in FIXED INCOME SHARES: SERIES M ET AL. v. CITIBANK N.A., pending in New York State Supreme Court. Additional information concerning this action is publicly available in court filings under the docket number 653891/2015 (N.Y. Sup. Ct.) (Ramos, J.).
On July 11, 2017, in FEDERAL DEPOSIT INSURANCE CORPORATION AS RECEIVER FOR GUARANTY BANK v. CITIBANK N.A., the court denied plaintiff's motion for reconsideration but granted the plaintiff leave to amend the complaint within 90 days to establish its standing to sue. Additional information concerning this action is publicly available in court filings under the docket number 15-cv-6574 (S.D.N.Y.) (Carter, J.).
Credit Default Swaps Matters
Antitrust and Other Litigation: On June 8, 2017, a complaint was filed in the United States District Court for the Southern District of New York against numerous credit default swap (CDS) market participants, including Citigroup, Citibank, CGMI and CGML, under the caption TERA GROUP, INC., ET AL. v. CITIGROUP INC., ET AL. The complaint alleges that defendants colluded to prevent plaintiffs' electronic CDS trading platform, TeraExchange, from entering the market, resulting in lost profits to plaintiffs. The complaint asserts federal and state antitrust claims, and claims for unjust enrichment and tortious interference with business relations. Plaintiffs are seeking a finding of joint and several liability, treble damages, attorneys' fees, pre and post judgment interest and a permanent injunction. Additional information concerning this action is publicly available in court filings under the docket number 17-cv-04302 (S.D.N.Y.) (Sullivan, J.).
202
Foreign Exchange Matters
Antitrust and Other Litigation : On May 5, 2017, in NYPL v. JPMORGAN CHASE & CO., ET AL., plaintiffs moved for leave to amend their previously dismissed complaint, which defendants opposed on June 14, 2017. Additional information concerning this action is publicly available in court filings under the docket numbers 15 Civ. 2290 (N.D. Cal.) (Chhabria, J.) and 15 Civ. 9300 (S.D.N.Y.) (Schofield, J.).
On April 28, 2017, plaintiffs voluntarily dismissed their amended complaint in BAKER ET AL. v. BANK OF AMERICA CORPORATION ET AL. On April 28 and June 10, 2017, plaintiffs (including certain of the Baker plaintiffs) filed two new putative class action suits, captioned CONTANT ET AL. v. BANK OF AMERICA CORPORATION ET AL. and LAVENDER ET AL. v. BANK OF AMERICA CORPORATION ET AL; respectively, against various financial institutions, including Citigroup, Citibank, Citicorp, and CGMI. The suits were filed on behalf of purported classes of indirect purchasers of FX instruments sold by the defendants. Plaintiffs in each case allege that defendants engaged in a conspiracy to fix currency prices in violation of the Sherman Act and various state antitrust laws, and seek unspecified money damages (including treble damages), as well as equitable and injunctive relief. On June 30, 2017, the CONTANT and LAVENDER plaintiffs filed a consolidated class action complaint in CONTANT. Additional information concerning these actions is publicly available in court filings under the docket numbers 16 Civ. 7512 (S.D.N.Y.) (Schofield, J.), 17 Civ. 4392 (S.D.N.Y.) (Schofield, J.), and 17 Civ. 3139 (S.D.N.Y.) (Schofield, J.).
On July 11, 2017, in NEGRETE v. CITIBANK, N.A., the court denied plaintiffs' motion for entry of final judgment as to the claims dismissed in the court's February 27, 2017 order. Additional information concerning this action is publicly available in court filings under the docket number 15 Civ. 7250 (S.D.N.Y.) (Sweet, J.).
On July 12, 2017, a putative class action captioned ALPARI (US), LLC v. CITIGROUP, INC. AND CITIBANK, N.A. was filed in the United States District Court for the Southern District of New York. Plaintiff asserts claims for breach of contract and unjust enrichment arising out of alleged cancellation of electronic FX transactions and seeks damages, restitution, injunctive relief, and attorneys' fees. Additional information concerning this action is publicly available in court filings under the docket number 17 Civ. 5269 (S.D.N.Y.).
Interbank Offered Rates-Related Litigation and Other
Matters
Antitrust and Other Litigation : In May 2017, plaintiffs in IN RE LIBOR-BASED FINANCIAL INSTRUMENTS ANTITRUST LITIGATION (the LIBOR MDL) filed motions to certify proposed classes in the over-the-counter (OTC), exchange-based, and lender class actions. On June 8, 2017, Judge Buchwald entered partial final judgment for the OTC plaintiffs, allowing them to appeal parts of the court's December 20, 2016 decision to the United States Court of Appeals for the Second Circuit. Additional information concerning these actions is publicly available in court filings
under the docket number 11 MD 2262 (S.D.N.Y.) (Buchwald, J.).
The Schwab plaintiffs, whose claims were dismissed in their entirety in December 2016, filed a notice of appeal to the Second Circuit on May 12, 2017. Additional information concerning this action is publicly available in court filings under the docket number 17-1569 (2d Cir.).
On April 27, 2017, in FRONTPOINT ASIAN EVENT DRIVEN FUND, LTD ET AL. v. CITIBANK, N.A. ET AL., the court held oral argument on defendants' motions to dismiss. The court indicated at argument that it intends to dismiss most of the plaintiffs' claims with leave to replead some claims. Additional information is available in court filings under the docket number 16 Civ. 5263 (S.D.N.Y.) (Hellerstein, J.).
Interest Rate Swaps Matters
Antitrust and Other Litigation: On July 28, 2017, in IN RE INTEREST RATE SWAPS ANTITRUST LITIGATION, the court ruled on defendants' motions to dismiss, granting them in part and denying them in part. Additional information is publicly available in court filings under the docket number 16 MD 2704 (S.D.N.Y.) (Engelmayer, J.).
Money Laundering Inquiries
Regulatory Actions: As previously announced, on May 22, 2017, the United States Department of Justice, Citigroup, and Citigroup's subsidiary, Banamex, USA (BUSA), announced a settlement of all remaining open inquiries conducted jointly by the Department and the U.S. Attorney's Office for the District of Massachusetts concerning the Bank Secrecy Act and anti-money laundering compliance of Citigroup and related entities, including BUSA. The settlement includes a non-prosecution agreement and forfeiture amount of approximately $97 million .
Sovereign Securities Matters
Antitrust and Other Litigation : On July 14, 2017, defendants, including Citigroup and Related Parties, moved to dismiss the consolidated amended complaint in IN RE SSA BONDS ANTITRUST LITIGATION. Additional information relating to this action is publicly available in court filings under the docket number 16 Civ. 03711 (S.D.N.Y.) (Ramos, J.).
Settlement Payments
Payments required in settlement agreements described above have been made or are covered by existing litigation accruals.
203
24. CONDENSED CONSOLIDATING FINANCIAL STATEMENTS
Citigroup amended its Registration Statement on Form S-3 on file with the SEC (File No. 33-192302) to add its wholly owned subsidiary, Citigroup Global Markets Holdings Inc. (CGMHI), as a co-registrant. Any securities issued by CGMHI under the Form S-3 will be fully and unconditionally guaranteed by Citigroup.
The following are the Condensed Consolidating Statements of Income and Comprehensive Income for the three and six months ended June 30, 2017 and 2016 , Condensed Consolidating Balance Sheet as of June 30, 2017 and December 31, 2016 and Condensed Consolidating Statement of Cash Flows for the six months ended June 30, 2017 and 2016 for Citigroup Inc., the parent holding company (Citigroup parent company), CGMHI, other Citigroup subsidiaries and eliminations and total consolidating adjustments. "Other Citigroup subsidiaries and eliminations" includes all other subsidiaries of Citigroup, intercompany eliminations and income (loss) from discontinued operations. "Consolidating adjustments" includes Citigroup parent company elimination of distributed and undistributed income of subsidiaries and investment in subsidiaries.
These Condensed Consolidating Financial Statements have been prepared and presented in accordance with SEC Regulation S-X Rule 3-10, "Financial Statements of Guarantors and Issuers of Guaranteed Securities Registered or Being Registered."
These Condensed Consolidating Financial Statements schedules are presented for purposes of additional analysis, but should be considered in relation to the Consolidated Financial Statements of Citigroup taken as a whole.
204
| Three Months Ended June 30, 2017 | ||||||||||||||||||
In millions of dollars | Citigroup parent company |
| CGMHI |
| Other Citigroup subsidiaries and eliminations |
| Consolidating adjustments |
| Citigroup consolidated | ||||||||||
Revenues |
|
|
|
|
|
|
|
|
| ||||||||||
Dividends from subsidiaries | $ | 2,515 | |
| $ | - | |
| $ | - | |
| $ | (2,515 | ) |
| $ | - | |
Interest revenue | (1 | ) |
| 1,404 | |
| 13,798 | |
| - | |
| 15,201 | | |||||
Interest revenue-intercompany | 1,076 | |
| 377 | |
| (1,453 | ) |
| - | |
| - | | |||||
Interest expense | 1,136 | |
| 546 | |
| 2,354 | |
| - | |
| 4,036 | | |||||
Interest expense-intercompany | 263 | |
| 653 | |
| (916 | ) |
| - | |
| - | | |||||
Net interest revenue | $ | (324 | ) |
| $ | 582 | |
| $ | 10,907 | |
| $ | - | |
| $ | 11,165 | |
Commissions and fees | $ | - | |
| $ | 1,279 | |
| $ | 1,658 | |
| $ | - | |
| $ | 2,937 | |
Commissions and fees-intercompany | (1 | ) |
| 108 | |
| (107 | ) |
| - | |
| - | | |||||
Principal transactions | 1,122 | |
| 398 | |
| 1,042 | |
| - | |
| 2,562 | | |||||
Principal transactions-intercompany | 396 | |
| 290 | |
| (686 | ) |
| - | |
| - | | |||||
Other income | (1,601 | ) |
| 87 | |
| 2,751 | |
| - | |
| 1,237 | | |||||
Other income-intercompany | 161 | |
| (7 | ) |
| (154 | ) |
| - | |
| - | | |||||
Total non-interest revenues | $ | 77 | |
| $ | 2,155 | |
| $ | 4,504 | |
| $ | - | |
| $ | 6,736 | |
Total revenues, net of interest expense | $ | 2,268 | |
| $ | 2,737 | |
| $ | 15,411 | |
| $ | (2,515 | ) |
| $ | 17,901 | |
Provisions for credit losses and for benefits and claims | $ | - | |
| $ | 1 | |
| $ | 1,716 | |
| $ | - | |
| $ | 1,717 | |
Operating expenses | |
| |
| |
| |
| | ||||||||||
Compensation and benefits | $ | (1 | ) |
| $ | 1,212 | |
| $ | 4,252 | |
| $ | - | |
| $ | 5,463 | |
Compensation and benefits-intercompany | 20 | |
| - | |
| (20 | ) |
| - | |
| - | | |||||
Other operating | (344 | ) |
| 443 | |
| 4,944 | |
| - | |
| 5,043 | | |||||
Other operating-intercompany | 10 | |
| 502 | |
| (512 | ) |
| - | |
| - | | |||||
Total operating expenses | $ | (315 | ) |
| $ | 2,157 | |
| $ | 8,664 | |
| $ | - | |
| $ | 10,506 | |
Equity in undistributed income of subsidiaries | $ | 1,183 | |
| $ | - | |
| $ | - | |
| $ | (1,183 | ) |
| $ | - | |
Income (loss) from continuing operations before income taxes | $ | 3,766 | |
| $ | 579 | |
| $ | 5,031 | |
| $ | (3,698 | ) |
| $ | 5,678 | |
Provision (benefit) for income taxes | (106 | ) |
| 261 | |
| 1,640 | |
| - | |
| 1,795 | | |||||
Income from continuing operations | $ | 3,872 | |
| $ | 318 | |
| $ | 3,391 | |
| $ | (3,698 | ) |
| $ | 3,883 | |
Income from discontinued operations, net of taxes | - | |
| - | |
| 21 | |
| - | |
| 21 | | |||||
Net income before attribution of noncontrolling interests | $ | 3,872 | |
| $ | 318 | |
| $ | 3,412 | |
| $ | (3,698 | ) |
| $ | 3,904 | |
Noncontrolling interests | - | |
| - | |
| 32 | |
| - | |
| 32 | | |||||
Net income | $ | 3,872 | |
| $ | 318 | |
| $ | 3,380 | |
| $ | (3,698 | ) |
| $ | 3,872 | |
Comprehensive income | | |
| | |
| | |
| | |
| | | |||||
Add: Other comprehensive income (loss) | $ | 514 | |
| $ | (38 | ) |
| $ | (155 | ) |
| $ | 193 | |
| $ | 514 | |
Total Citigroup comprehensive income | $ | 4,386 | |
| $ | 280 | |
| $ | 3,225 | |
| $ | (3,505 | ) |
| $ | 4,386 | |
Add: Other comprehensive income attributable to noncontrolling interests | $ | - | | | $ | - | | | $ | 39 | |
| $ | - | |
| $ | 39 | |
Add: Net income attributable to noncontrolling interests | - | | | - | | | 32 | |
| - | |
| 32 | | |||||
Total comprehensive income | $ | 4,386 | |
| $ | 280 | |
| $ | 3,296 | |
| $ | (3,505 | ) |
| $ | 4,457 | |
205
Condensed Consolidating Statements of Income and Comprehensive Income
| Three Months Ended June 30, 2016 | |||||||||||||||||||
In millions of dollars | Citigroup parent company |
| CGMHI |
| Other Citigroup subsidiaries and eliminations |
| Consolidating adjustments |
| Citigroup consolidated | |||||||||||
Revenues |
|
|
|
|
|
|
|
|
| |||||||||||
Dividends from subsidiaries | $ | 2,900 | |
| $ | - | |
| $ | - | |
| $ | (2,900 | ) |
| $ | - | | |
Interest revenue | 1 | |
| 1,251 | |
| 13,104 | |
| - | |
| 14,356 | | ||||||
Interest revenue-intercompany | 668 | |
| 139 | |
| (807 | ) |
| - | |
| - | | ||||||
Interest expense | 1,094 | |
| 401 | |
| 1,625 | |
| - | |
| 3,120 | | ||||||
Interest expense-intercompany | 38 | |
| 416 | |
| (454 | ) |
| - | |
| - | | ||||||
Net interest revenue | $ | (463 | ) |
| $ | 573 | |
| $ | 11,126 | |
| $ | - | |
| $ | 11,236 | | |
Commissions and fees | $ | - | |
| $ | 1,119 | |
| $ | 1,606 | |
| $ | - | |
| $ | 2,725 | | |
Commissions and fees-intercompany | (17 | ) |
| (24 | ) |
| 41 | |
| - | |
| - | | ||||||
Principal transactions | (186 | ) |
| 2,394 | |
| (392 | ) |
| - | |
| 1,816 | | ||||||
Principal transactions-intercompany | (217 | ) |
| (1,791 | ) |
| 2,008 | |
| - | |
| - | | ||||||
Other income | (585 | ) |
| 51 | |
| 2,305 | |
| - | |
| 1,771 | | ||||||
Other income-intercompany | 736 | |
| 339 | |
| (1,075 | ) |
| - | |
| - | | ||||||
Total non-interest revenues | $ | (269 | ) |
| $ | 2,088 | |
| $ | 4,493 | |
| $ | - | |
| $ | 6,312 | | |
Total revenues, net of interest expense | $ | 2,168 | |
| $ | 2,661 | |
| $ | 15,619 | |
| $ | (2,900 | ) |
| $ | 17,548 | | |
Provisions for credit losses and for benefits and claims | $ | - | |
| $ | - | |
| $ | 1,409 | |
| $ | - | |
| $ | 1,409 | | |
Operating expenses | |
| |
| |
| |
| | |||||||||||
Compensation and benefits | $ | (16 | ) |
| $ | 1,202 | |
| $ | 4,043 | |
| $ | - | |
| $ | 5,229 | | |
Compensation and benefits-intercompany | 23 | |
| - | |
| (23 | ) |
| - | |
| - | | ||||||
Other operating | 213 | |
| 412 | |
| 4,515 | |
| - | |
| 5,140 | | ||||||
Other operating-intercompany | 79 | |
| 322 | |
| (401 | ) |
| - | |
| - | | ||||||
Total operating expenses | $ | 299 | |
| $ | 1,936 | |
| $ | 8,134 | |
| $ | - | |
| $ | 10,369 | | |
Equity in undistributed income of subsidiaries | $ | 1,709 | |
| $ | - | |
| $ | - | |
| $ | (1,709 | ) |
| $ | - | | |
Income (loss) from continuing operations before income taxes | $ | 3,578 | |
| $ | 725 | |
| $ | 6,076 | |
| $ | (4,609 | ) |
| $ | 5,770 | | |
Provision (benefit) for income taxes | (420 | ) |
| 157 | |
| 1,986 | |
| - | |
| 1,723 | | ||||||
Income (loss) from continuing operations | $ | 3,998 | |
| $ | 568 | |
| $ | 4,090 | |
| $ | (4,609 | ) |
| $ | 4,047 | | |
Loss from discontinued operations, net of taxes | - | |
| - | |
| (23 | ) |
| - | |
| (23 | ) | ||||||
Net income (loss) before attribution of noncontrolling interests | $ | 3,998 | |
| $ | 568 | |
| $ | 4,067 | |
| $ | (4,609 | ) |
| $ | 4,024 | | |
Noncontrolling interests | - | |
| (3 | ) |
| 29 | |
| - | |
| 26 | | ||||||
Net income (loss) | $ | 3,998 | |
| $ | 571 | |
| $ | 4,038 | |
| $ | (4,609 | ) |
| $ | 3,998 | | |
Comprehensive income | | |
| | |
| | |
| | |
| | | ||||||
Add: Other comprehensive income (loss) | $ | 511 | |
| $ | 58 | |
| $ | 1,708 | |
| $ | (1,766 | ) |
| $ | 511 | | |
Total Citigroup comprehensive income (loss) | $ | 4,509 | | | $ | 629 | | | | $ | 5,746 | |
| $ | (6,375 | ) |
| $ | 4,509 | |
Add: Other comprehensive income attributable to noncontrolling interests | $ | - | |
| $ | - | | - | | $ | (50 | ) |
| $ | - | |
| $ | (50 | ) |
Add: Net income attributable to noncontrolling interests | - | |
| (3 | ) | | | 29 | |
| - | |
| 26 | | |||||
Total comprehensive income (loss) | $ | 4,509 | | | $ | 626 | | | | $ | 5,725 | |
| $ | (6,375 | ) |
| $ | 4,485 | |
206
| Six Months Ended June 30, 2017 | ||||||||||||||||||
In millions of dollars | Citigroup parent company |
| CGMHI |
| Other Citigroup subsidiaries and eliminations |
| Consolidating adjustments |
| Citigroup consolidated | ||||||||||
Revenues |
|
|
|
|
|
|
|
|
| ||||||||||
Dividends from subsidiaries | $ | 6,265 | |
| $ | - | |
| $ | - | |
| $ | (6,265 | ) |
| $ | - | |
Interest revenue | - | |
| 2,431 | |
| 27,193 | |
| - | |
| 29,624 | | |||||
Interest revenue-intercompany | 1,869 | |
| 534 | |
| (2,403 | ) |
| - | |
| - | | |||||
Interest expense | 2,354 | |
| 942 | |
| 4,306 | |
| - | |
| 7,602 | | |||||
Interest expense-intercompany | 353 | |
| 1,079 | |
| (1,432 | ) |
| - | |
| - | | |||||
Net interest revenue | $ | (838 | ) |
| $ | 944 | |
| $ | 21,916 | |
| $ | - | |
| $ | 22,022 | |
Commissions and fees | $ | - | |
| $ | 2,534 | |
| $ | 3,162 | |
| $ | - | |
| $ | 5,696 | |
Commissions and fees-intercompany | (1 | ) |
| 110 | |
| (109 | ) |
| - | |
| - | | |||||
Principal transactions | 959 | |
| 2,004 | |
| 2,621 | |
| - | |
| 5,584 | | |||||
Principal transactions-intercompany | 600 | |
| (392 | ) |
| (208 | ) |
| - | |
| - | | |||||
Other income | (1,640 | ) |
| 161 | |
| 4,198 | |
| - | |
| 2,719 | | |||||
Other income-intercompany | 38 | |
| 27 | |
| (65 | ) |
| - | |
| - | | |||||
Total non-interest revenues | $ | (44 | ) |
| $ | 4,444 | |
| $ | 9,599 | |
| $ | - | |
| $ | 13,999 | |
Total revenues, net of interest expense | $ | 5,383 | |
| $ | 5,388 | |
| $ | 31,515 | |
| $ | (6,265 | ) |
| $ | 36,021 | |
Provisions for credit losses and for benefits and claims | $ | - | |
| $ | 1 | |
| $ | 3,378 | |
| $ | - | |
| $ | 3,379 | |
Operating expenses |
|
|
|
|
|
|
|
|
| ||||||||||
Compensation and benefits | $ | (15 | ) |
| $ | 2,474 | |
| $ | 8,538 | |
| $ | - | |
| $ | 10,997 | |
Compensation and benefits-intercompany | 51 | |
| - | |
| (51 | ) |
| - | |
| - | | |||||
Other operating | (316 | ) |
| 849 | |
| 9,453 | |
| - | |
| 9,986 | | |||||
Other operating-intercompany | (49 | ) |
| 970 | |
| (921 | ) |
| - | |
| - | | |||||
Total operating expenses | $ | (329 | ) |
| $ | 4,293 | |
| $ | 17,019 | |
| $ | - | |
| $ | 20,983 | |
Equity in undistributed income of subsidiaries | $ | 1,770 | |
| $ | - | |
| $ | - | |
| $ | (1,770 | ) |
| $ | - | |
Income (loss) from continuing operations before income taxes | $ | 7,482 | |
| $ | 1,094 | |
| $ | 11,118 | |
| $ | (8,035 | ) |
| $ | 11,659 | |
Provision (benefit) for income taxes | (480 | ) |
| 476 | |
| 3,662 | |
| - | |
| 3,658 | | |||||
Income (loss) from continuing operations | $ | 7,962 | |
| $ | 618 | |
| $ | 7,456 | |
| $ | (8,035 | ) |
| $ | 8,001 | |
Income from discontinued operations, net of taxes | - | |
| - | |
| 3 | |
| - | |
| 3 | | |||||
Net income (loss) before attribution of noncontrolling interests | $ | 7,962 | |
| $ | 618 | |
| $ | 7,459 | |
| $ | (8,035 | ) |
| $ | 8,004 | |
Noncontrolling interests | - | |
| - | |
| 42 | |
| - | |
| 42 | | |||||
Net income (loss) | $ | 7,962 | |
| $ | 618 | |
| $ | 7,417 | |
| $ | (8,035 | ) |
| $ | 7,962 | |
Comprehensive income |
|
|
|
|
|
|
|
|
| ||||||||||
Add: Other comprehensive income (loss) | $ | 1,978 | |
| $ | (58 | ) |
| $ | (3,876 | ) |
| $ | 3,934 | |
| $ | 1,978 | |
Total Citigroup comprehensive income (loss) | $ | 9,940 | |
| $ | 560 | |
| $ | 3,541 | |
| $ | (4,101 | ) |
| $ | 9,940 | |
Add: other comprehensive income attributable to noncontrolling interests | $ | - | |
| $ | - | |
| $ | 70 | |
| $ | - | |
| $ | 70 | |
Add: Net income attributable to noncontrolling interests | - | |
| - | |
| 42 | |
| - | |
| 42 | | |||||
Total comprehensive income (loss) | $ | 9,940 | |
| $ | 560 | |
| $ | 3,653 | |
| $ | (4,101 | ) |
| $ | 10,052 | |
207
Condensed Consolidating Statements of Income and Comprehensive Income
| Six Months Ended June 30, 2016 | ||||||||||||||||||
In millions of dollars | Citigroup parent company |
| CGMHI |
| Other Citigroup subsidiaries and eliminations |
| Consolidating adjustments |
| Citigroup consolidated | ||||||||||
Revenues |
|
|
|
|
|
|
|
|
| ||||||||||
Dividends from subsidiaries | $ | 5,700 | |
| $ | - | |
| $ | - | |
| $ | (5,700 | ) |
| $ | - | |
Interest revenue | 3 | |
| 2,397 | |
| 26,123 | |
| - | |
| 28,523 | | |||||
Interest revenue-intercompany | 1,540 | |
| 275 | |
| (1,815 | ) |
| - | |
| - | | |||||
Interest expense | 2,164 | |
| 765 | |
| 3,131 | |
| - | |
| 6,060 | | |||||
Interest expense-intercompany | 79 | |
| 845 | |
| (924 | ) |
| - | |
| - | | |||||
Net interest revenue | $ | (700 | ) |
| $ | 1,062 | |
| $ | 22,101 | |
| $ | - | |
| $ | 22,463 | |
Commissions and fees | $ | - | |
| $ | 2,079 | |
| $ | 3,109 | |
| $ | - | |
| $ | 5,188 | |
Commissions and fees-intercompany | (19 | ) |
| (30 | ) |
| 49 | |
| - | |
| - | | |||||
Principal transactions | (395 | ) |
| 2,257 | |
| 1,794 | |
| - | |
| 3,656 | | |||||
Principal transactions-intercompany | 41 | |
| (1,043 | ) |
| 1,002 | |
| - | |
| - | | |||||
Other income | (3,679 | ) |
| 127 | |
| 7,348 | |
| - | |
| 3,796 | | |||||
Other income-intercompany | 3,996 | |
| 199 | |
| (4,195 | ) |
| - | |
| - | | |||||
Total non-interest revenues | $ | (56 | ) |
| $ | 3,589 | |
| $ | 9,107 | |
| $ | - | |
| $ | 12,640 | |
Total revenues, net of interest expense | $ | 4,944 | |
| $ | 4,651 | |
| $ | 31,208 | |
| $ | (5,700 | ) |
| $ | 35,103 | |
Provisions for credit losses and for benefits and claims | $ | - | |
| $ | - | |
| $ | 3,454 | |
| $ | - | |
| $ | 3,454 | |
Operating expenses | |
| |
| |
| |
| | ||||||||||
Compensation and benefits | $ | (8 | ) |
| $ | 2,491 | |
| $ | 8,302 | |
| $ | - | |
| $ | 10,785 | |
Compensation and benefits-intercompany | 26 | |
| - | |
| (26 | ) |
| - | |
| - | | |||||
Other operating | 480 | |
| 798 | |
| 8,829 | |
| - | |
| 10,107 | | |||||
Other operating-intercompany | 80 | |
| 629 | |
| (709 | ) |
| - | |
| - | | |||||
Total operating expenses | $ | 578 | |
| $ | 3,918 | |
| $ | 16,396 | |
| $ | - | |
| $ | 20,892 | |
Equity in undistributed income of subsidiaries | $ | 2,653 | |
| $ | - | |
| $ | - | |
| $ | (2,653 | ) |
| $ | - | |
Income (loss) from continuing operations before income taxes | $ | 7,019 | |
| $ | 733 | |
| $ | 11,358 | |
| $ | (8,353 | ) |
| $ | 10,757 | |
Provision (benefit) for income taxes | (480 | ) |
| 194 | |
| 3,488 | |
| - | |
| 3,202 | | |||||
Income (loss) from continuing operations | $ | 7,499 | |
| $ | 539 | |
| $ | 7,870 | |
| $ | (8,353 | ) |
| $ | 7,555 | |
Loss from discontinued operations, net of taxes | - | |
| - | |
| (25 | ) |
| - | |
| (25 | ) | |||||
Net income (loss) before attribution of noncontrolling interests | $ | 7,499 | |
| $ | 539 | |
| $ | 7,845 | |
| $ | (8,353 | ) |
| $ | 7,530 | |
Noncontrolling interests | - | |
| (1 | ) |
| 32 | |
| - | |
| 31 | | |||||
Net income (loss) | $ | 7,499 | |
| $ | 540 | |
| $ | 7,813 | |
| $ | (8,353 | ) |
| $ | 7,499 | |
Comprehensive income | | |
| | |
| | |
| | |
| | | |||||
Add: Other comprehensive income (loss) | $ | 3,244 | |
| $ | 105 | |
| $ | 1,173 | |
| $ | (1,278 | ) |
| $ | 3,244 | |
Total Citigroup comprehensive income (loss) | $ | 10,743 | |
| $ | 645 | |
| $ | 8,986 | |
| $ | (9,631 | ) |
| $ | 10,743 | |
Add: Other comprehensive income attributable to noncontrolling interests | $ | - | |
| $ | - | |
| $ | (23 | ) |
| $ | - | |
| $ | (23 | ) |
Add: Net income attributable to noncontrolling interests | - | |
| (1 | ) |
| 32 | |
| - | |
| 31 | | |||||
Total comprehensive income (loss) | $ | 10,743 | |
| $ | 644 | |
| $ | 8,995 | |
| $ | (9,631 | ) |
| $ | 10,751 | |
208
Condensed Consolidating Balance Sheet
| June 30, 2017 | ||||||||||||||||||
In millions of dollars | Citigroup parent company |
| CGMHI |
| Other Citigroup subsidiaries and eliminations |
| Consolidating adjustments |
| Citigroup consolidated | ||||||||||
Assets |
|
|
|
|
|
|
|
|
| ||||||||||
Cash and due from banks | $ | - | |
| $ | 793 | |
| $ | 20,147 | |
| $ | - | |
| $ | 20,940 | |
Cash and due from banks-intercompany | 160 | |
| 2,843 | |
| (3,003 | ) |
| - | |
| - | | |||||
Federal funds sold and resale agreements | - | |
| 188,379 | |
| 45,686 | |
| - | |
| 234,065 | | |||||
Federal funds sold and resale agreements-intercompany | - | |
| 15,478 | |
| (15,478 | ) |
| - | |
| - | | |||||
Trading account assets | 11 | |
| 136,853 | |
| 122,742 | |
| - | |
| 259,606 | | |||||
Trading account assets-intercompany | 1 | |
| 1,544 | |
| (1,545 | ) |
| - | |
| - | | |||||
Investments | 26 | |
| 167 | |
| 351,517 | |
| - | |
| 351,710 | | |||||
Loans, net of unearned income | - | |
| 891 | |
| 643,804 | |
| - | |
| 644,695 | | |||||
Loans, net of unearned income-intercompany | - | |
| - | |
| - | |
| - | |
| - | | |||||
Allowance for loan losses | - | |
| - | |
| (12,025 | ) |
| - | |
| (12,025 | ) | |||||
Total loans, net | $ | - | |
| $ | 891 | |
| $ | 631,779 | |
| $ | - | |
| $ | 632,670 | |
Advances to subsidiaries | $ | 132,366 | |
| $ | - | |
| $ | (132,366 | ) |
| $ | - | |
| $ | - | |
Investments in subsidiaries | 230,077 | |
| - | |
| - | |
| (230,077 | ) |
| - | | |||||
Other assets (1) | 23,712 | |
| 55,983 | |
| 285,377 | |
| - | |
| 365,072 | | |||||
Other assets-intercompany | 15,650 | |
| 48,567 | |
| (64,217 | ) |
| - | |
| - | | |||||
Total assets | $ | 402,003 | |
| $ | 451,498 | |
| $ | 1,240,639 | |
| $ | (230,077 | ) |
| $ | 1,864,063 | |
Liabilities and equity | | |
| |
| |
| |
| | |||||||||
Deposits | $ | - | |
| $ | - | |
| $ | 958,743 | |
| $ | - | |
| $ | 958,743 | |
Deposits-intercompany | - | |
| - | |
| - | |
| - | |
| - | | |||||
Federal funds purchased and securities loaned or sold | - | |
| 133,308 | |
| 21,472 | |
| - | |
| 154,780 | | |||||
Federal funds purchased and securities loaned or sold-intercompany | - | |
| 18,993 | |
| (18,993 | ) |
| - | |
| - | | |||||
Trading account liabilities | - | |
| 87,137 | |
| 49,608 | |
| - | |
| 136,745 | | |||||
Trading account liabilities-intercompany | 67 | |
| 1,629 | |
| (1,696 | ) |
| - | |
| - | | |||||
Short-term borrowings | 201 | |
| 3,217 | |
| 33,101 | |
| - | |
| 36,519 | | |||||
Short-term borrowings-intercompany | - | |
| 57,532 | |
| (57,532 | ) |
| - | |
| - | | |||||
Long-term debt | 147,257 | |
| 16,710 | |
| 61,212 | |
| - | |
| 225,179 | | |||||
Long-term debt-intercompany | - | |
| 28,795 | |
| (28,795 | ) |
| - | |
| - | | |||||
Advances from subsidiaries | 20,761 | |
| - | |
| (20,761 | ) |
| - | |
| - | | |||||
Other liabilities | 2,998 | |
| 60,092 | |
| 57,900 | |
| - | |
| 120,990 | | |||||
Other liabilities-intercompany | 700 | |
| 10,733 | |
| (11,433 | ) |
| - | |
| - | | |||||
Stockholders' equity | 230,019 | |
| 33,352 | |
| 197,813 | |
| (230,077 | ) |
| 231,107 | | |||||
Total liabilities and equity | $ | 402,003 | |
| $ | 451,498 | |
| $ | 1,240,639 | |
| $ | (230,077 | ) |
| $ | 1,864,063 | |
(1) | Other assets for Citigroup parent company at June 30, 2017 included $ 26.3 billion of placements to Citibank and its branches, of which $ 23.4 billion had a remaining term of less than 30 days. |
209
Condensed Consolidating Balance Sheet
| December 31, 2016 | ||||||||||||||||||
In millions of dollars | Citigroup parent company |
| CGMHI |
| Other Citigroup subsidiaries and eliminations |
| Consolidating adjustments |
| Citigroup consolidated | ||||||||||
Assets |
|
|
|
|
|
|
|
|
| ||||||||||
Cash and due from banks | $ | - | |
| $ | 870 | |
| $ | 22,173 | |
| $ | - | |
| $ | 23,043 | |
Cash and due from banks-intercompany | 142 | |
| 3,820 | |
| (3,962 | ) |
| - | |
| - | | |||||
Federal funds sold and resale agreements | - | |
| 196,236 | |
| 40,577 | |
| - | |
| 236,813 | | |||||
Federal funds sold and resale agreements-intercompany | - | |
| 12,270 | |
| (12,270 | ) |
| - | |
| - | | |||||
Trading account assets | 6 | |
| 121,484 | |
| 122,435 | |
| - | |
| 243,925 | | |||||
Trading account assets-intercompany | 1,173 | |
| 907 | |
| (2,080 | ) |
| - | |
| - | | |||||
Investments | 173 | |
| 335 | |
| 352,796 | |
| - | |
| 353,304 | | |||||
Loans, net of unearned income | - | |
| 575 | |
| 623,794 | |
| - | |
| 624,369 | | |||||
Loans, net of unearned income-intercompany | - | |
| - | |
| - | |
| - | |
| - | | |||||
Allowance for loan losses | - | |
| - | |
| (12,060 | ) |
| - | |
| (12,060 | ) | |||||
Total loans, net | $ | - | |
| $ | 575 | |
| $ | 611,734 | |
| $ | - | |
| $ | 612,309 | |
Advances to subsidiaries | $ | 143,154 | |
| $ | - | |
| $ | (143,154 | ) |
| $ | - | |
| $ | - | |
Investments in subsidiaries | 226,279 | |
| - | |
| - | |
| (226,279 | ) |
| - | | |||||
Other assets (1) | 23,734 | |
| 46,095 | |
| 252,854 | |
| - | |
| 322,683 | | |||||
Other assets-intercompany | 27,845 | |
| 38,207 | |
| (66,052 | ) |
| - | |
| - | | |||||
Total assets | $ | 422,506 | |
| $ | 420,799 | |
| $ | 1,175,051 | |
| $ | (226,279 | ) |
| $ | 1,792,077 | |
Liabilities and equity | |
| |
| |
| |
| | | |||||||||
Deposits | $ | - | |
| $ | - | |
| $ | 929,406 | |
| $ | - | |
| $ | 929,406 | |
Deposits-intercompany | - | |
| - | |
| - | |
| - | |
| - | | |||||
Federal funds purchased and securities loaned or sold | - | |
| 122,320 | |
| 19,501 | |
| - | |
| 141,821 | | |||||
Federal funds purchased and securities loaned or sold-intercompany | - | |
| 25,417 | |
| (25,417 | ) |
| - | |
| - | | |||||
Trading account liabilities | - | |
| 87,714 | |
| 51,331 | |
| - | |
| 139,045 | | |||||
Trading account liabilities-intercompany | 1,006 | |
| 868 | |
| (1,874 | ) |
| - | |
| - | | |||||
Short-term borrowings | - | |
| 1,356 | |
| 29,345 | |
| - | |
| 30,701 | | |||||
Short-term borrowings-intercompany | - | |
| 35,596 | |
| (35,596 | ) |
| - | |
| - | | |||||
Long-term debt | 147,333 | |
| 8,128 | |
| 50,717 | |
| - | |
| 206,178 | | |||||
Long-term debt-intercompany | - | |
| 41,287 | |
| (41,287 | ) |
| - | |
| - | | |||||
Advances from subsidiaries | 41,258 | |
| - | |
| (41,258 | ) |
| - | |
| - | | |||||
Other liabilities | 3,466 | |
| 57,430 | |
| 57,887 | |
| - | |
| 118,783 | | |||||
Other liabilities-intercompany | 4,323 | |
| 7,894 | |
| (12,217 | ) |
| - | |
| - | | |||||
Stockholders' equity | 225,120 | |
| 32,789 | |
| 194,513 | |
| (226,279 | ) |
| 226,143 | | |||||
Total liabilities and equity | $ | 422,506 | |
| $ | 420,799 | |
| $ | 1,175,051 | |
| $ | (226,279 | ) |
| $ | 1,792,077 | |
(1) | Other assets for Citigroup parent company at December 31, 2016 included $20.7 billion of placements to Citibank and its branches, of which $6.8 billion had a remaining term of less than 30 days. |
210
Condensed Consolidating Statement of Cash Flows
| Six Months Ended June 30, 2017 | ||||||||||||||||||
In millions of dollars | Citigroup parent company |
| CGMHI |
| Other Citigroup subsidiaries and eliminations |
| Consolidating adjustments |
| Citigroup consolidated | ||||||||||
Net cash provided by (used in) operating activities of continuing operations | $ | 10,626 | |
| $ | (18,060 | ) |
| $ | (14,077 | ) |
| $ | - | |
| $ | (21,511 | ) |
Cash flows from investing activities of continuing operations |
|
|
|
|
|
|
|
|
| ||||||||||
Purchases of investments | $ | - | |
| $ | - | |
| $ | (96,925 | ) |
| $ | - | |
| $ | (96,925 | ) |
Proceeds from sales of investments | 132 | |
| - | |
| 56,596 | |
| - | |
| 56,728 | | |||||
Proceeds from maturities of investments | - | |
| - | |
| 47,785 | |
| - | |
| 47,785 | | |||||
Change in deposits with banks | - | |
| 10,108 | |
| (37,799 | ) |
| - | |
| (27,691 | ) | |||||
Change in loans | - | |
| - | |
| (29,952 | ) |
| - | |
| (29,952 | ) | |||||
Proceeds from sales and securitizations of loans | - | |
| - | |
| 6,256 | |
| - | |
| 6,256 | | |||||
Proceeds from significant disposals | - | |
| - | |
| 2,732 | |
| - | |
| 2,732 | | |||||
Change in federal funds sold and resales | - | |
| 4,649 | |
| (1,901 | ) |
| - | |
| 2,748 | | |||||
Changes in investments and advances-intercompany | 12,132 | |
| (5,870 | ) |
| (6,262 | ) |
| - | |
| - | | |||||
Other investing activities | - | |
| - | |
| (1,432 | ) |
| - | |
| (1,432 | ) | |||||
Net cash provided by (used in) investing activities of continuing operations | $ | 12,264 | |
| $ | 8,887 | |
| $ | (60,902 | ) |
| $ | - | |
| $ | (39,751 | ) |
Cash flows from financing activities of continuing operations |
|
|
|
|
|
|
|
|
| ||||||||||
Dividends paid | $ | (1,504 | ) |
| $ | - | |
| $ | - | |
| $ | - | |
| $ | (1,504 | ) |
Treasury stock acquired | (3,635 | ) |
| - | |
| - | |
| - | |
| (3,635 | ) | |||||
Proceeds (repayments) from issuance of long-term debt, net | 2,964 | |
| 3,887 | |
| 9,511 | |
| - | |
| 16,362 | | |||||
Proceeds (repayments) from issuance of long-term debt-intercompany, net | - | |
| (3,100 | ) |
| 3,100 | |
| - | |
| - | | |||||
Change in deposits | - | |
| - | |
| 29,337 | |
| - | |
| 29,337 | | |||||
Change in federal funds purchased and repos | - | |
| 4,564 | |
| 8,395 | |
| - | |
| 12,959 | | |||||
Change in short-term borrowings | 201 | |
| 1,861 | |
| 3,756 | |
| - | |
| 5,818 | | |||||
Net change in short-term borrowings and other advances-intercompany | (20,497 | ) |
| 907 | |
| 19,590 | |
| - | |
| - | | |||||
Other financing activities | (401 | ) |
| - | |
| - | |
| - | |
| (401 | ) | |||||
Net cash provided by (used in) financing activities of continuing operations | $ | (22,872 | ) |
| $ | 8,119 | |
| $ | 73,689 | |
| $ | - | |
| $ | 58,936 | |
Effect of exchange rate changes on cash and due from banks | $ | - | |
| $ | - | |
| $ | 223 | |
| $ | - | |
| $ | 223 | |
Change in cash and due from banks | $ | 18 | |
| $ | (1,054 | ) |
| $ | (1,067 | ) |
| $ | - | |
| $ | (2,103 | ) |
Cash and due from banks at beginning of period | 142 | |
| 4,690 | |
| 18,211 | |
| - | |
| 23,043 | | |||||
Cash and due from banks at end of period | $ | 160 | |
| $ | 3,636 | |
| $ | 17,144 | |
| $ | - | |
| $ | 20,940 | |
Supplemental disclosure of cash flow information for continuing operations | | |
| | |
| | |
| | |
| | | |||||
Cash paid (refund) during the year for income taxes | $ | 679 | |
| $ | 152 | |
| $ | 1,144 | |
| $ | - | |
| $ | 1,975 | |
Cash paid during the year for interest | 119 | |
| 1,924 | |
| 5,286 | |
| - | |
| 7,329 | | |||||
Non-cash investing activities | | |
| | |
| | |
| | |
| | | |||||
Transfers to loans HFS from loans | $ | - | |
| $ | - | |
| $ | 3,300 | |
| $ | - | |
| $ | 3,300 | |
Transfers to OREO and other repossessed assets | - | |
| - | |
| 58 | |
| - | |
| 58 | | |||||
211
| Six Months Ended June 30, 2016 | ||||||||||||||||||
In millions of dollars | Citigroup parent company |
| CGMHI |
| Other Citigroup subsidiaries and eliminations |
| Consolidating adjustments |
| Citigroup consolidated | ||||||||||
Net cash provided by (used in) operating activities of continuing operations | $ | 13,794 | |
| $ | 2,380 | |
| $ | 4,893 | |
| $ | - | |
| $ | 21,067 | |
Cash flows from investing activities of continuing operations |
|
|
|
|
|
|
|
|
| ||||||||||
Purchases of investments | $ | - | |
| $ | - | |
| $ | (108,359 | ) |
| $ | - | |
| $ | (108,359 | ) |
Proceeds from sales of investments | - | |
| - | |
| 66,138 | |
| - | |
| 66,138 | | |||||
Proceeds from maturities of investments | 46 | |
| - | |
| 33,337 | |
| - | |
| 33,383 | | |||||
Change in deposits with banks | - | |
| (5,390 | ) |
| (10,406 | ) |
| - | |
| (15,796 | ) | |||||
Change in loans | - | |
| - | |
| (30,170 | ) |
| - | |
| (30,170 | ) | |||||
Proceeds from sales and securitizations of loans | - | |
| - | |
| 7,021 | |
| - | |
| 7,021 | | |||||
Proceeds from significant disposals | - | |
| - | |
| 265 | |
| - | |
| 265 | | |||||
Change in federal funds sold and resales | - | |
| (4,256 | ) |
| (4,752 | ) |
| - | |
| (9,008 | ) | |||||
Changes in investments and advances-intercompany | (16,412 | ) |
| (5,125 | ) |
| 21,537 | |
| - | |
| - | | |||||
Other investing activities | - | |
| - | |
| (987 | ) |
| - | |
| (987 | ) | |||||
Net cash used in investing activities of continuing operations | $ | (16,366 | ) |
| $ | (14,771 | ) |
| $ | (26,376 | ) |
| $ | - | |
| $ | (57,513 | ) |
Cash flows from financing activities of continuing operations |
|
|
|
|
|
|
|
|
| ||||||||||
Dividends paid | $ | (828 | ) |
| $ | - | |
| $ | - | |
| $ | - | |
| $ | (828 | ) |
Issuance of preferred stock | 2,498 | |
| - | |
| - | |
| - | |
| 2,498 | | |||||
Treasury stock acquired | (2,634 | ) |
| - | |
| - | |
| - | |
| (2,634 | ) | |||||
Proceeds (repayments) from issuance of long-term debt, net | 890 | |
| 2,512 | |
| (3,115 | ) |
| - | |
| 287 | | |||||
Proceeds (repayments) from issuance of long-term debt-intercompany, net | - | |
| (10,112 | ) |
| 10,112 | |
| - | |
| - | | |||||
Change in deposits | - | |
| - | |
| 29,965 | |
| - | |
| 29,965 | | |||||
Change in federal funds purchased and repos | - | |
| 13,550 | |
| (2,045 | ) |
| - | |
| 11,505 | | |||||
Change in short-term borrowings | (160 | ) |
| 583 | |
| (3,094 | ) |
| - | |
| (2,671 | ) | |||||
Net change in short-term borrowings and other advances-intercompany | 3,127 | |
| 1,855 | |
| (4,982 | ) |
| - | |
| - | | |||||
Capital contributions from parent | - | |
| 5,000 | |
| (5,000 | ) |
| - | |
| - | | |||||
Other financing activities | (312 | ) |
| - | |
| - | |
| - | |
| (312 | ) | |||||
Net cash provided by financing activities of continuing operations | $ | 2,581 | |
| $ | 13,388 | |
| $ | 21,841 | |
| $ | - | |
| $ | 37,810 | |
Effect of exchange rate changes on cash and due from banks | $ | - | |
| $ | - | |
| $ | (124 | ) |
| $ | - | |
| $ | (124 | ) |
Change in cash and due from banks | $ | 9 | |
| $ | 997 | |
| $ | 234 | |
| $ | - | |
| $ | 1,240 | |
Cash and due from banks at beginning of period | 124 | |
| 1,995 | |
| 18,781 | |
| - | |
| 20,900 | | |||||
Cash and due from banks at end of period | $ | 133 | |
| $ | 2,992 | |
| $ | 19,015 | |
| $ | - | |
| $ | 22,140 | |
Supplemental disclosure of cash flow information for continuing operations | | |
| | |
| | |
| | |
| | | |||||
Cash paid (refund) during the year for income taxes | $ | (323 | ) |
| $ | 40 | |
| $ | 2,328 | |
| $ | - | |
| $ | 2,045 | |
Cash paid during the year for interest | 2,040 | |
| 1,666 | |
| 2,020 | |
| - | |
| 5,726 | | |||||
Non-cash investing activities | | |
| | |
| | |
| | |
| | | |||||
Transfers to loans HFS from loans | $ | - | |
| $ | - | |
| $ | 6,000 | |
| $ | - | |
| $ | 6,000 | |
Transfers to OREO and other repossessed assets | - | |
| - | |
| 97 | |
| - | |
| 97 | | |||||
212
UNREGISTERED SALES OF EQUITY SECURITIES, PURCHASES OF EQUITY SECURITIES AND DIVIDENDS
Unregistered Sales of Equity Securities
None.
Equity Security Repurchases
The following table summarizes Citi's equity security repurchases, which consisted entirely of common stock repurchases:
In millions, except per share amounts | Total shares purchased | Average price paid per share | Approximate dollar value of shares that may yet be purchased under the plan or programs | |||||
April 2017 |
|
|
| |||||
Open market repurchases (1) | 8.9 | | $ | 59.01 | | $ | 1,260 | |
Employee transactions (2) | - | | - | | N/A | | ||
May 2017 |
|
|
| |||||
Open market repurchases (1) | 9.8 | | 60.80 | | 661 | | ||
Employee transactions (2) | - | | - | | N/A | | ||
June 2017 |
|
|
| |||||
Open market repurchases (1) | 10.3 | | 63.72 | | - | | ||
Employee transactions (2) | - | | - | | N/A | | ||
Total for 2Q17 and remaining program balance as of June 30, 2017 | 29.0 | | $ | 61.29 | | $ | - | |
(1) | Represents repurchases under the $10.4 billion 2016 common stock repurchase program (2016 Repurchase Program) that was approved by Citigroup's Board of Directors and announced on June 29, 2016. The 2016 Repurchase Program included the additional $1.75 billion increase in the program that was approved by Citigroup's Board of Directors and announced on November 21, 2016. The 2016 Repurchase Program was part of the planned capital actions included by Citi in its 2016 Comprehensive Capital Analysis and Review (CCAR). Shares repurchased under the 2016 Repurchase Program were added to treasury stock. The 2016 Repurchase Program expired on June 30, 2017. On June 28, 2017, Citigroup announced a $15.6 billion common stock repurchase program during the four quarters beginning in the third quarter of 2017 (2017 Repurchase Program), which was part of the planned capital actions included by Citi as part of its 2017 CCAR. The 2017 Repurchase Program expires on June 30, 2018. Shares repurchased under the 2017 Repurchase Program will be added to treasury stock. |
(2) | Consisted of shares added to treasury stock related to (i) certain activity on employee stock option program exercises where the employee delivers existing shares to cover the option exercise, or (ii) under Citi's employee restricted or deferred stock programs where shares are withheld to satisfy tax requirements. |
N/A Not applicable
Dividends
In addition to Board of Directors' approval, Citi's ability to pay common stock dividends substantially depends on regulatory approval, including an annual regulatory review of the results of the CCAR process required by the Federal Reserve Board and the supervisory stress tests required under the Dodd-Frank Act. For additional information regarding Citi's capital planning and stress testing, see "Capital Resources-Current Regulatory Capital Standards-Capital Planning and Stress Testing" and "Risk Factors-Strategic Risks" in Citi's 2016 Annual Report on Form 10-K. Any dividend on Citi's outstanding common stock would also need to be made in compliance with Citi's obligations to its outstanding preferred stock.
On June 28, 2017, Citi announced the Federal Reserve Board did not object to its planned capital actions as part of the 2017 CCAR, which included an increase of Citi's quarterly common stock dividend to $0.32 per share over the four quarters beginning with the third quarter of 2017 (subject to quarterly approval by the Board of Directors). Any dividend on Citi's outstanding common stock would also need to be made in compliance with Citi's obligations to its outstanding preferred stock.
For information on the ability of Citigroup's subsidiary depository institutions to pay dividends, see Note 18 to the
Consolidated Financial Statements in Citi's 2016 Annual Report on Form 10-K.
213
SIGNATURES
Pursuant to the requirements of the Securities Exchange Act of 1934, the Registrant has duly caused this report to be signed on its behalf by the undersigned, thereunto duly authorized, on the 1st day of August, 2017 .
CITIGROUP INC.
(Registrant)
By /s/ John C. Gerspach
John C. Gerspach
Chief Financial Officer
(Principal Financial Officer)
By /s/ Jeffrey R. Walsh
Jeffrey R. Walsh
Controller and Chief Accounting Officer
(Principal Accounting Officer)
214
EXHIBIT INDEX
Exhibit |
|
|
Number |
| Description of Exhibit |
3.01 |
| Restated Certificate of Incorporation of the Company, as in effect on the date hereof, incorporated by reference to Exhibit 3.01 to the Company's Quarterly Report on Form 10-Q for the quarter ended March 31, 2016 (File No. 1-9924). |
|
|
|
4.01+ |
| Third Supplemental Indenture dated as of June 26, 2017 among Citigroup Global Markets Holdings Inc., the Company and The Bank of New York Mellon, as trustee, to Indenture dated as of November 13, 2013. |
|
|
|
12.01+ |
| Calculation of Ratio of Income to Fixed Charges. |
|
|
|
12.02+ |
| Calculation of Ratio of Income to Fixed Charges Including Preferred Stock Dividends. |
|
|
|
31.01+ |
| Certification of principal executive officer pursuant to Section 302 of the Sarbanes-Oxley Act of 2002. |
|
|
|
31.02+ |
| Certification of principal financial officer pursuant to Section 302 of the Sarbanes-Oxley Act of 2002. |
|
|
|
32.01+ |
| Certification pursuant to 18 U.S.C. Section 1350, as adopted pursuant to Section 906 of the Sarbanes-Oxley Act of 2002. |
|
|
|
101.01+ |
| Financial statements from the Quarterly Report on Form 10-Q of the Company for the quarter ended June 30, 2017, filed on August 1, 2017, formatted in XBRL: (i) the Consolidated Statement of Income, (ii) the Consolidated Balance Sheet, (iii) the Consolidated Statement of Changes in Equity, (iv) the Consolidated Statement of Cash Flows and (v) the Notes to Consolidated Financial Statements. |
The total amount of securities authorized pursuant to any instrument defining rights of holders of long-term debt of the Company does not exceed 10% of the total assets of the Company and its consolidated subsidiaries. The Company will furnish copies of any such instrument to the SEC upon request.
+ Filed herewith.
215