Table of Contents
UNITED STATES
SECURITIES AND EXCHANGE COMMISSION
Washington, D.C. 20549
___________________________
FORM 10-K
[X] | ANNUAL REPORT PURSUANT TO SECTION 13 OR 15(d) OF THE SECURITIES EXCHANGE ACT OF 1934 |
For the fiscal year ended June 30, 2013 or
[ ] | TRANSITION REPORT PURSUANT TO SECTION 13 OR 15(d) OF THE SECURITIES EXCHANGE ACT OF 1934 |
For the transition period from _____ to _____
ANCHOR BANCORP | ||
(Exact name of registrant as specified in its charter) | ||
|
|
|
Washington |
| 26-3356075 |
(State or other jurisdiction of incorporation or organization) |
| (I.R.S. Employer Identification No.) |
|
|
|
601 Woodland Square Loop SE, Lacey, Washington |
| 98503 |
(Address of principal executive offices) |
| (Zip Code) |
|
|
|
Registrant's telephone number, including area code: |
| (360) 491-2250 |
|
|
|
Securities registered pursuant to Section 12(b) of the Act: |
|
|
|
|
|
Common Stock, par value $0.01 per share |
| The Nasdaq Stock Market LLC |
(Title of Class) |
| (Name of each exchange on which registered) |
|
|
|
Securities registered pursuant to Section 12(g) of the Act: |
| None |
|
|
|
Indicate by check mark if the registrant is a well-known seasoned issuer, as defined in Rule 405 of the Securities Act. YES NO X
Indicate by check mark if the registrant is not required to file reports pursuant to Section 13 or Section 15(d) of the Act. YES NO X
Indicate by check mark whether the registrant: (1) has filed all reports required to be filed by Section 13 or 15(d) of the Securities Exchange Act of 1934 during the preceding 12 months (or for such shorter period that the registrant was required to file such reports), and (2) has been subject to such filing requirements for the past 90 days. Yes X No
Indicate by check mark whether the registrant has submitted electronically and posted on its corporate Web site, if any, every Interactive Data File required to be submitted and posted pursuant to Rule 405 of Regulation S-T (§232.405 of this chapter) during the preceding 12 months (or for such shorter period that the registrant was required to submit and post such files).
Yes X No
Indicate by check mark if disclosure of delinquent filers pursuant to Item 405 of Regulation S-K (§232.405 of this chapter) is not contained herein, and will not be contained, to the best of registrant's knowledge, in definitive proxy or information statements incorporated by reference in Part III of this Form 10-K or any amendment to this Form 10-K.
Indicate by check mark whether the registrant is a large accelerated filer, an accelerated filer, a non-accelerated filer or a smaller reporting company. See definitions of "large accelerated filer," "accelerated filer" and "smaller reporting company" in Rule 12b-2 of the Exchange Act (Check one):
Large accelerated filer _____ | Accelerated filer _____ | Non-accelerated filer _____ | Smaller reporting company X |
Indicate by check mark whether the registrant is a shell company (as defined in Rule 12b-2 of the Exchange Act). YES NO X
As of September 3, 2013, there were issued and outstanding 2,550,000 shares of the registrant's common stock, which are traded on the over-the-counter market through the NASDAQ Global Market under the symbol "ANCB." The aggregate market value of the voting stock held by non-affiliates of the registrant, computed by reference to the closing price of such stock as of December 31, 2012, was $36.2 million. (The exclusion from such amount of the market value of the shares owned by any person shall not be deemed an admission by the registrant that such person is an affiliate of the registrant.)
DOCUMENTS INCORPORATED BY REFERENCE
Portions of the registrant's Proxy Statement for the 2013 Annual Meeting of Stockholders are incorporated by reference into Part III.
Table of Contents
ANCHOR BANCORP
2013 ANNUAL REPORT ON FORM 10-K
TABLE OF CONTENTS
|
|
Forward-Looking Statements | iii |
Available Information | v |
|
|
PART I |
|
Item 1. Business | 1 |
General | 1 |
Corporate Developments | 1 |
Market Area | 2 |
Lending Activities | 3 |
Asset Quality | 15 |
Investment Activities | 24 |
Deposit Activities and Other Sources of Funds | 28 |
Subsidiaries and Other Activities | 31 |
Competition | 31 |
Natural Disasters | 32 |
Employees | 32 |
How We Are Regulated | 33 |
Taxation | 42 |
Item 1A. Risk Factors | 43 |
Item 1B. Unresolved Staff Comments | 52 |
Item 2. Properties | 52 |
Item 3. Legal Proceedings | 54 |
Item 4. Mine Safety Disclosures | 54 |
PART II |
|
Item 5. Market for Registrant's Common Equity, Related Stockholder Matters and Issuer Purchases of Equity Securities | 55 |
Item 6. Selected Financial Data | 57 |
Item 7. Management's Discussion and Analysis of Financial Condition and Results of Operations | 59 |
Overview | 59 |
Compliance With Regulatory Restrictions | 59 |
Operating Strategy | 60 |
Critical Accounting Policies | 61 |
Comparison of Financial Condition at June 30, 2013 and June 30, 2012 | 62 |
Comparison of Operating Results for the Years Ended June 30, 2013 and June 30, 2012 | 63 |
Comparison of Financial Condition at June 30, 2012 and June 30, 2011 | 68 |
Comparison of Operating Results for the Years Ended June 30, 2012 and June 30, 2011 | 69 |
Average Balances, Interest and Average Yields/Costs | 73 |
Yields Earned and Rates Paid | 75 |
Rate/Volume Analysis | 76 |
| |
(Table of Contents continued on following page) | |
( i )
Table of Contents
Asset and Liability Management and Market Risk | 76 |
Liquidity | 79 |
Contractual Obligations | 80 |
Commitments and Off-Balance Sheet Arrangements | 80 |
Capital | 81 |
Impact of Inflation | 81 |
Recent Accounting Pronouncements | 82 |
Item 7A. Quantitative and Qualitative Disclosures About Market Risk | 83 |
Item 8. Financial Statements and Supplementary Data | 83 |
Item 9. Changes in and Disagreements with Accountants on Accounting and Financial Disclosure | 127 |
Item 9A. Controls and Procedures | 127 |
Item 9B. Other Information | 128 |
PART III. |
|
Item 10. Directors, Executive Officers and Corporate Governance | 128 |
Item 11. Executive Compensation | 128 |
Item 12. Security Ownership of Certain Beneficial Owners and Management and Related Stockholder Matters | 128 |
Item 13. Certain Relationships and Related Transactions and Director Independence | 129 |
Item 14. Principal Accountant Fees and Services | 129 |
PART IV. |
|
Item 15. Exhibits and Financial Statement Schedules | 129 |
Signatures | 130 |
As used in this report, the terms, "we," "our," and "us," and "Company" refer to Anchor Bancorp and its consolidated subsidiary, unless the context indicates otherwise. When we refer to "Anchor Bank" or the "Bank" in this report, we are referring to Anchor Bank, the wholly owned subsidiary of Anchor Bancorp.
( ii )
Table of Contents
Forward-Looking Statements
This Form 10-K, including information included or incorporated by reference, future filings by the Company on Form 10-Q, and Form 8-K, and future oral and written statements by Anchor Bancorp and its management may contain forward-looking statements within the meaning of the Private Securities Litigation Reform Act of 1995. Forward-looking statements often include the words "believes," "expects," "anticipates," "estimates," "forecasts," "intends," "plans," "targets," "potentially," "probably," "projects," "outlook" or similar expressions or future or conditional verbs such as "may," "will," "should," "would" and "could." These forward-looking statements are subject to known and unknown risks, uncertainties and other factors that could cause actual results to differ materially from the results anticipated, including, but not limited to:
• | the credit risks of lending activities, including changes in the level and trend of loan delinquencies and write offs and changes in our allowance for loan losses and provision for loan losses that may be impacted by deterioration in the housing and commercial real estate markets; |
• | changes in general economic conditions, either nationally or in our market areas; |
• | changes in the levels of general interest rates, and the relative differences between short and long term interest rates, deposit interest rates, our net interest margin and funding sources; |
• | fluctuations in the demand for loans, the number of unsold homes, land and other properties and fluctuations in real estate values in our market area; |
• | secondary market conditions for loans and our ability to sell loans in the secondary market; |
• | results of examinations of us by the Federal Deposit Insurance Corporation ("FDIC"), the Washington State Department of Financial Institution, Division of Banks ("DFI") or other regulatory authorities, including the possibility that any such regulatory authority may, among other things, require us to increase our reserve for loan losses, write-down assets, change our regulatory capital position or affect our ability to borrow funds or maintain or increase deposits, which could adversely affect our liquidity and earnings; |
• | our compliance with regulatory enforcement actions, including the requirements and restrictions with the Supervisory Directive the Bank entered into with the DFI and the possibility that the Bank will be unable to fully comply with this enforcement action which could result in the imposition of additional requirements or restrictions; |
• | our ability to attract and retain deposits; |
• | increases in premiums for deposit insurance; |
• | management's assumptions in determining the adequacy of the allowance for loan losses; |
• | our ability to control operating costs and expenses; |
• | the use of estimates in determining fair value of certain of our assets, which estimates may prove to be incorrect and result in significant declines in valuation; |
• | difficulties in reducing risks associated with the loans on our balance sheet; |
• | staffing fluctuations in response to product demand or the implementation of corporate strategies that affect our workforce and potential associated charges; |
• | computer systems on which we depend could fail or experience a security breach; |
• | our ability to retain key members of our senior management team; |
• | costs and effects of litigation, including settlements and judgments; |
• | our ability to manage loan delinquency rates; |
• | increased competitive pressures among financial services companies; |
• | changes in consumer spending, borrowing and savings habits; |
( iii )
Table of Contents
• | legislative or regulatory changes that adversely affect our business including the effect of the Dodd-Frank Wall Street Reform and Consumer Protection Act, changes in regulatory policies and principles, or the interpretation of regulatory capital or other rules, including as a result of Basel III; |
• | changes in regulatory policies and principles, including the interpretation of regulatory capital or other rules; |
• | the availability of resources to address changes in laws, rules, or regulations or to respond to regulatory actions; |
• | our ability to pay dividends on our common stock; |
• | adverse changes in the securities markets; |
• | inability of key third-party providers to perform their obligations to us; |
• | changes in accounting policies and practices, as may be adopted by the financial institution regulatory agencies, or the Financial Accounting Standards Board, including additional guidance and interpretation on existing accounting issues and details of the implementation of new accounting methods, including relating to fair value accounting and loan loss reserve requirements; and |
• | other economic, competitive, governmental, regulatory, and technological factors affecting our operations, pricing, products and services and the other risks described elsewhere in our filings with the Securities and Exchange Commission ("SEC"), including this Form 10-K. |
These developments could have an adverse impact on our financial position and our results of operations.
Any forward-looking statements are based upon management's beliefs and assumptions at the time they are made. We undertake no obligation to publicly update or revise any forward-looking statements included or incorporated by reference in this document or to update the reasons why actual results could differ from those contained in such statements, whether as a result of new information, future events or otherwise. In light of these risks, uncertainties and assumptions, the forward-looking statements discussed in this document might not occur, and you should not put undue reliance on any forward-looking statements.
( iv )
Table of Contents
Available Information
The Company provides a link on its investor information page at www.anchornetbank.com to the Securities and Exchange Commission's ("SEC") website ( www.sec.gov ) for purposes of providing copies of its annual report to shareholders, Annual Report on Form 10-K, Quarterly Reports on Form 10-Q, Current Reports on Form 8-K and press releases. Other than an investor's own internet access charges, these filings are available free of charge and also can be obtained by calling the SEC at 1-800-SEC-0330. The information contained on the Company's website is not included as part of, or incorporated by reference into, this Annual Report on Form 10-K.
( v )
Table of Contents
PART I
Item 1. Business
General
Anchor Bancorp, a Washington corporation, was formed for the purpose of becoming the bank holding company for Anchor Bank in connection with the Bank's conversion from mutual to stock form, which was completed on January 25, 2011. In connection with the mutual to stock conversion, the Bank changed its name from "Anchor Mutual Savings Bank" to "Anchor Bank." At June 30, 2013, we had total assets of $452.2 million , total deposits of $328.6 million and total stockholders' equity of $52.4 million . Anchor Bancorp's business activities generally are limited to passive investment activities and oversight of its investment in Anchor Bank. Accordingly, the information set forth in this report, including consolidated financial statements and related data, relates primarily to Anchor Bank.
Anchor Bancorp is a bank holding company and is subject to regulation by the Board of Governors of the Federal Reserve System ("Federal Reserve"). Anchor Bank is examined and regulated by the Washington State Department of Financial Institutions, Division of Banks ("DFI") and by the Federal Deposit Insurance Corporation ("FDIC"). Anchor Bank is required to have certain reserves set by the Federal Reserve and is a member of the Federal Home Loan Bank of Seattle ("FHLB" or "FHLB of Seattle"), which is one of the 12 regional banks in the Federal Home Loan Bank System ("FHLB System").
Anchor Bank is a community-based savings bank primarily serving Western Washington through our 11 full-service banking offices (including two Wal-Mart store locations) located within Grays Harbor, Thurston, Lewis, Pierce and Mason counties, Washington. In addition we have two loan production offices located in Grays Harbor. We are in the business of attracting deposits from the public and utilizing those deposits to originate loans. We offer a wide range of loan products to meet the demands of our customers, however, at June 30, 2013, 90.3% of our loans were collateralized by real estate. Historically, lending activities have been primarily directed toward the origination of one-to-four family construction, commercial real estate and consumer loans. Since 1990, we have also offered commercial real estate loans and multi-family loans primarily in Western Washington. Lending activities also include the origination of residential construction loans, including prior to fiscal 2010, through brokers, in particular within the Portland, Oregon metropolitan area.
The executive office of the Company is located at 601 Woodland Square Loop SE, Lacey, Washington 98503, and its telephone number is (360) 491-2250.
Corporate Developments
Anchor Bank entered into an Order to Cease and Desist ("Order") with the FDIC and the Washington DFI on August 12, 2009. On September 5, 2012, Anchor Bank's regulators, the FDIC and the DFI terminated the Order as a result of the steps Anchor Bank took in complying with the Order and reducing its level of classified assets, augmenting management and improving the overall condition of the Bank. In place of the Order, Anchor Bank entered into a Supervisory Directive with the DFI.
The Supervisory Directive contains provisions concerning (i) the management and directors of Anchor Bank; (ii) restrictions on paying dividends; (iii) reductions of classified assets; (iv) maintaining Tier 1 capital in an amount equal to or exceeding 10% of Anchor Bank's total assets; (v) policies concerning the allowance for loan and lease losses ("ALLL"); and (vi) requirements to furnish a revised three-year business plan to improve Anchor Bank's profitability and progress reports to the FDIC and DFI.
Management and the Board of Directors have and will be taking action and implementing programs to comply with the requirements of the Supervisory Directive. In particular, the Board of Directors has increased its participation in the affairs of Anchor Bank and assumed full responsibility for the formulation and monitoring of its policies and objectives, including the development and implementation of actions, plans, policies and procedures to improve Anchor Bank's operations and financial condition. In addition, we also have added experienced personnel to the department that monitors our loans to enable us to better identify problem loans in a timely manner and reduce our exposure to further deterioration in asset quality.
Anchor Bank has also been notified that it must notify the FDIC and DFI in writing at least 30 days prior to certain management changes. These changes include the addition or replacement of a board member, or the employment or change in responsibilities of anyone who is, who will become, or who performs the duties of a senior executive officer. In addition prior to entering into any agreement to pay and prior to making any golden parachute payment or excess nondiscriminatory severance plan payment to any institution-affiliated party, Anchor Bank must file an application to obtain the consent of the FDIC. For additional details, see Item 1A., "Risk Factors - Risks Related to Our Business - We are subject to increased regulatory scrutiny and are subject to certain business limitations. Further, we may be subject to more severe future regulatory enforcement actions if our financial condition or performance weakens further."
1
Table of Contents
Anchor Bank believes that it is in compliance with the requirements set forth in the Supervisory Directive.
Market Area
Anchor Bank is a community-based financial institution primarily serving Western Washington including Grays Harbor, Thurston, Lewis, Pierce, and Mason counties. Prior to 2007 we also had conducted lending operations in the Portland, Oregon metropolitan area. Our lending activities have been materially limited in recent periods as we focused on reducing our nonperforming assets. Since the latter half of 2007, depressed economic conditions have prevailed in portions of the United States, including Western Washington and the Portland, Oregon metropolitan area, which have experienced substantial home price declines, lower levels of existing home sale activity, increased foreclosures and above average unemployment rates. Based on information from the Washington Center for Real Estate Research, for the quarter ended June 30, 2013, the median home price in our five-county market area was $168,560, which was a 28.4% decline compared to the quarter ended September 30, 2007. Existing home sales in our five-county primary market area for the quarter ended June 30, 2013 totaled $19.1 million, which reflected a 12.1% decrease compared to the quarter ended September 30, 2007. Using data from the FDIC, foreclosures as a percentage of all mortgage loans in the State of Washington increased from approximately 0.32% as of September 2007 to approximately 0.70% for June 2013. According to the Department of Labor, the unemployment rate in our five-county primary market area averaged 10.4% during June 2013 compared to 11.2% during June 2012, and an average of 6.2% during September 2007. These unemployment rates are higher than the national unemployment rates of 7.6%, 8.9% and 4.5%, as of June 2013, June 2012 and September 2007, respectively. A continuation of the overall economic weakness in the counties in our market area could negatively impact our lending opportunities and profitability.
Grays Harbor County has a population of 72,793 and a median household income of $40,074 according to the latest 2012 information available from the U.S. Census Bureau. The economic base in Grays Harbor has been historically dependent on the timber and fishing industries. Other industries that support the economic base are tourism, manufacturing, agriculture, shipping, transportation and technology. The 2013 estimated median family income as provided by data from the FDIC was $54,300. Based on information from the Washington Center for Real Estate Research, for the quarter ended June 30, 2013, the median home price in Grays Harbor County was $112,300 compared to $115,600 for the quarter ended June 30, 2012, and represents a decline of 37.6% from the median home price of $180,000 for the quarter ended September 30, 2007. In addition, existing home sales in Grays Harbor County for the quarter ended June 30, 2013 declined by 20.6% from the total for the quarter ended September 30, 2007. According to the U.S. Department of Labor, the unemployment rate in Grays Harbor County decreased to 12.5% at June 30, 2013 from 13.2% at June 30, 2012. We have six branches (including our home office) located throughout this county.
Thurston County has a population of 255,913 and a median household income of $57,837 according to the latest 2012 information available from the U.S. Census Bureau. Thurston County is home of Washington State's capital (Olympia) and its economic base is largely driven by state government related employment. The 2012 estimated median family income for Thurston County as provided by data from the FDIC was $77,300. Based on information from the Washington Center for Real Estate Research, for the quarter ended June 30, 2013, the median home price in Thurston County was $217,100 compared to $225,000 for the quarter ended June 30, 2012, and represents a 19.6% decline from the median home price of $270,000 for the quarter ended September 30, 2007. In addition, existing home sales in Thurston County for the quarter ended June 30, 2013 declined by 26.9% from the quarter ended September 30, 2007. According to the U.S. Department of Labor, the unemployment rate for the Thurston County area decreased to 7.8% at June 30, 2013 from 8.3% at June 30, 2012. We currently have two branches in Thurston County. Thurston County has a stable economic base primarily attributable to the state government presence.
Lewis County has a population of 79,017 and a median household income of $42,513 according to the latest 2012 information available from the U.S. Census Bureau. The economic base in Lewis County is supported by manufacturing, retail trade, local government and industrial services. The 2013 estimated median family income for Lewis County as provided by data from the FDIC was $54,600. Based on information from the Washington Center for Real Estate Research, for the quarter ended June 30, 2013, the median home price in Lewis County was $154,000 compared to $158,000 for the quarter ended June 30, 2012, and represents a 28.1% decline from the median home price of $214,100 for the quarter ended September 30, 2007. In addition, existing home sales in Lewis County for the quarter ended June 30, 2013 declined by 31.1% from the quarter ended September 30, 2007. According to the U.S. Department of Labor, the unemployment rate in Lewis County decreased to 12.4% at June 30, 2013 from 13.4% at June 30, 2012. We have one branch located in Lewis County.
Pierce County is the second most populous county in the state and has a population of 801,981 and a median household income of $55,899 according to the latest 2012 information available from the U.S. Census Bureau. The economy in Pierce County is diversified with the presence of military related government employment (Lewis/McChord JBLM Base), transportation and shipping employment (Port of Tacoma), and aerospace related employment (Boeing). The 2013 estimated median family income for Pierce County as provided by data from the FDIC was $70,200. Based on information from the Washington Center for Real Estate Research, for the quarter ended June 30, 2013, the median home price in Pierce County was $201,600 compared to $195,200
2
Table of Contents
for the quarter ended June 30, 2012, and represents a 30.2% decline from the median home price of $288,700 for the quarter ended September 30, 2007. In addition, existing home sales in Pierce County for the quarter ended June 30, 2013 declined by 2.7% from the quarter ended September 30, 2007. According to the U.S. Department of Labor, the unemployment rate for the Pierce County area decreased to 8.9% at June 30, 2013 from 9.8% at June 30, 2012. We have one branch located in Pierce County.
Mason County has a population of 61,339 and a median household income of $43,912 according to the latest information available from the U.S. Department of Labor. The economic base in Mason County is supported by wood products. The 2013 estimated median family income for Mason County as provided by data from the FDIC was $60,400. Based on information from the Washington Center for Real Estate Research, for the quarter ended June 30, 2013, the median home price in Mason County was $157,800 compared to $156,200 for the quarter ended June 30, 2012, and represents a 29.8% decline from the median home price of $224,700 for the quarter ended September 30, 2007. In addition, existing home sales in Mason County for the quarter ended June 30, 2013 declined by 8.5% from the quarter ended September 30, 2007. According to the U.S. Department of Labor, the unemployment rate in Mason County decreased to 10.4% at June 30, 2013 from 11.2% at June 30, 2012. We have one branch located in Mason County.
For a discussion regarding the competition in our primary market area, see "– Competition."
Lending Activities
General. Historically, our principal lending activity has consisted of the origination of loans secured by first mortgages on owner-occupied, one-to-four family residences and loans for the construction of one-to-four family residences. We also originate consumer loans, with an emphasis on home equity loans and lines of credit. Since 1990, we have been aggressively offering commercial real estate loans and multi-family loans primarily in Western Washington. A substantial portion of our loan portfolio is secured by real estate, either as primary or secondary collateral, located in our primary market area. As of June 30, 2013, the net loan portfolio totaled $277.5 million and represented 61.4% of our total assets. As of June 30, 2013, 26.1% of our total loan portfolio was comprised of one-to-four family loans, 9.1% of home equity loans and lines of credit, 37.7% of commercial real estate loans, 13.6% of multi-family real estate loans, 6.4% of commercial business loans, 3.9% of construction and land loans, 2.7% of unsecured consumer loans and 0.7% of automobile loans.
As a state chartered savings bank chartered under Washington law, we are subject to 20% of total risk based capital as our statutory lending limit. At June 30, 2013, there were no borrowing relationships that were over the legal amount. Our ten largest credit relationships at June 30, 2013 were as follows:
• | Our largest single borrower relationship totaled $8.2 million and consisted of three loans secured by office and light industrial buildings; |
• | The second largest borrower relationship totaled $6.0 million and consisted of 12 loans which range in size from $1.5 million to a line of credit of $5,000 that had a zero balance at that date. Collateral consists primarily of owner- and non-owner-occupied light industrial commercial real estate; |
• | The third largest borrower relationship totaled $5.7 million, secured by a purchased minority interest in a national shared loan secured by an entertainment, hospitality and dining complex; |
• | The fourth largest borrower relationship totaled $5.6 million and consisted of three loans secured by hospitality and commercial retail property; |
• | The fifth largest borrower relationship totaled $5.3 million and consisted of 38 loans, each of which was secured by a single family rental house, with an average balance of $143,000; |
• | The sixth largest borrower relationship totaled $5.2 million and consisted of three loans secured by commercial income-producing properties; |
• | The seventh largest borrower relationship is one loan for $4.8 million, secured by a church complex; |
• | The eighth largest borrower relationship is one loan for $4.5 million, secured by a commercial retail building; |
• | The ninth largest borrower relationship totaled $4.3 million and consisted of four loans secured by multi-family and single family residential properties; and |
• | The tenth largest borrower relationship totaled $4.3 million and consisted of five loans secured by industrial property and commercial equipment. |
3
Table of Contents
All of these relationships include personal guarantees except for the third largest borrower relationship which is a minority interest in a shared national credit. All of the properties securing these loans are located in our primary or secondary market area. These loans were all performing according to their repayment terms as of June 30, 2013.
Loan Portfolio Analysis. The following table sets forth the composition of Anchor Bank's loan portfolio by type of loan at the dates indicated:
| At June 30, | |||||||||||||||||||||||||||||||||
| 2013 |
| 2012 |
| 2011 |
| 2010 |
| 2009 | |||||||||||||||||||||||||
| Amount |
| Percent |
| Amount |
| Percent |
| Amount |
| Percent |
| Amount |
| Percent |
| Amount |
| Percent | |||||||||||||||
| (Dollars in thousands) | |||||||||||||||||||||||||||||||||
Real Estate: |
|
|
|
|
|
|
|
|
|
|
|
|
|
|
|
|
|
|
| |||||||||||||||
One-to-four family | $ | 73,901 | |
| 26.1 | % |
| $ | 82,709 | |
| 28.0 | % |
| $ | 97,133 | |
| 29.1 | % |
| $ | 112,835 | |
| 27.7 | % |
| $ | 114,823 | |
| 22.9 | % |
Multi-family | 38,425 | |
| 13.6 | |
| 42,032 | |
| 14.2 | |
| 42,608 | |
| 12.8 | |
| 45,983 | |
| 11.3 | |
| 52,661 | |
| 10.5 | | |||||
Commercial | 106,859 | |
| 37.7 | |
| 97,306 | |
| 32.9 | |
| 105,997 | |
| 31.8 | |
| 118,492 | |
| 29.1 | |
| 123,902 | |
| 24.7 | | |||||
Construction | 5,641 | |
| 2.0 | |
| 6,696 | |
| 2.3 | |
| 11,650 | |
| 3.5 | |
| 36,812 | |
| 9.0 | |
| 106,163 | |
| 21.2 | | |||||
Land loans | 5,330 | |
| 1.9 | |
| 7,062 | |
| 2.4 | |
| 6,723 | |
| 2.0 | |
| 7,843 | |
| 1.9 | |
| 9,211 | |
| 1.8 | | |||||
Total real estate | $ | 230,156 | |
| 81.2 | % |
| $ | 235,805 | |
| 79.8 | % |
| $ | 264,111 | |
| 79.2 | % |
| $ | 321,965 | |
| 79.1 | % |
| $ | 406,760 | |
| 81.2 | % |
Consumer: |
|
|
|
|
| |
|
| |
|
| |
|
| |
|
| |
|
| |
|
| |
|
| | |||||||
Home equity | 25,835 | |
| 9.1 | |
| 31,504 | |
| 10.7 | |
| 35,729 | |
| 10.7 | |
| 42,446 | |
| 10.4 | |
| 49,028 | |
| 9.8 | | |||||
Credit cards | 4,741 | |
| 1.7 | |
| 5,180 | |
| 1.8 | |
| 7,101 | |
| 2.1 | |
| 7,943 | |
| 2.0 | |
| 8,617 | |
| 1.7 | | |||||
Automobile | 1,850 | |
| 0.7 | |
| 3,342 | |
| 1.1 | |
| 5,547 | |
| 1.7 | |
| 8,884 | |
| 2.2 | |
| 14,016 | |
| 2.8 | | |||||
Other | 2,723 | |
| 1.0 | |
| 2,968 | |
| 1.0 | |
| 3,595 | |
| 1.1 | |
| 4,160 | |
| 1.0 | |
| 5,142 | |
| 1.0 | | |||||
Total consumer | 35,149 | |
| 12.4 | |
| 42,994 | |
| 14.6 | |
| 51,972 | |
|
| |
| 63,433 | |
| 15.6 | |
| 76,803 | |
| 15.3 | | |||||
Commercial business | 18,211 | |
| 6.4 | |
| 16,618 | |
| 5.6 | |
| 17,268 | |
| 5.2 | |
| 21,718 | |
| 5.3 | |
| 17,172 | |
| 3.4 | | |||||
Total loans | 283,516 | |
| 100.0 | % |
| 295,417 | |
| 100.0 | % |
| 333,351 | |
| 100.0 | % |
| 407,116 | |
| 100.0 | % |
| 500,735 | |
| 100.0 | % | |||||
Less: |
|
|
|
|
| |
|
| |
|
| |
|
| |
|
| |
|
| |
|
| |
|
| | |||||||
Deferred loan fees | 915 | |
|
|
| 605 | |
|
| |
| 648 | |
|
| |
| 917 | |
|
| |
| 1,315 | |
|
| | ||||||
Allowance for loan losses | 5,147 | |
|
|
| 7,057 | |
|
| |
| 7,239 | |
|
| |
| 16,788 | |
|
| |
| 24,463 | |
|
| | ||||||
Loans receivable, net | $ | 277,454 | |
|
|
| $ | 287,755 | |
|
| |
| $ | 325,464 | |
|
| |
| $ | 389,411 | |
|
| |
| $ | 474,957 | |
|
| | |
4
Table of Contents
The following table shows the composition of Anchor Bank's loan portfolio by fixed- and adjustable-rate loans at the dates indicated:
| At June 30, | |||||||||||||||||||||||||||||||||
| 2013 |
| 2012 |
| 2011 |
| 2010 |
| 2009 | |||||||||||||||||||||||||
| Amount |
| Percent |
| Amount |
| Percent |
| Amount |
| Percent |
| Amount |
| Percent |
| Amount |
| Percent | |||||||||||||||
FIXED-RATE LOANS | (Dollars in thousands) | |||||||||||||||||||||||||||||||||
Real estate: |
|
|
|
|
|
|
|
|
|
|
|
|
|
|
|
|
|
|
| |||||||||||||||
One-to-four family | $ | 58,639 | |
| 20.7 | % |
| $ | 69,635 | |
| 23.6 | % |
| $ | 80,938 | |
| 24.3 | % |
| $ | 94,872 | |
| 23.3 | % |
| $ | 95,931 | |
| 19.2 | % |
Multi-family | 29,603 | |
| 10.4 | |
| 33,174 | |
| 11.2 | |
| 32,967 | |
| 9.9 | |
| 33,606 | |
| 8.3 | |
| 42,032 | |
| 8.4 | | |||||
Commercial | 42,128 | |
| 14.9 | |
| 57,449 | |
| 19.4 | |
| 71,493 | |
| 21.4 | |
| 86,667 | |
| 21.3 | |
| 94,567 | |
| 18.9 | | |||||
Land loans | 4,316 | |
| 1.5 | |
| 6,045 | |
| 2.0 | |
| 5,869 | |
| 1.8 | |
| 7,244 | |
| 1.8 | |
| 8,759 | |
| 1.7 | | |||||
Total real estate | 134,686 | |
| 47.5 | |
| 166,303 | |
| 56.3 | |
| 191,267 | |
| 57.4 | |
| 222,389 | |
| 54.6 | |
| 241,289 | |
| 48.2 | | |||||
Real estate construction: |
|
|
|
|
|
|
|
|
|
|
|
|
|
|
|
|
|
|
| |||||||||||||||
One-to-four family | - | |
| - | |
| 449 | |
| 0.2 | |
| 1,481 | |
| 0.4 | |
| 9,481 | |
| 2.3 | |
| 27,671 | |
| 5.5 | | |||||
Multi-family | 2,254 | |
| 0.8 | |
| 1,370 | |
| 0.5 | |
| - | |
| - | |
| - | |
| - | |
| - | |
| - | | |||||
Commercial | 88 | |
| - | |
| 4,044 | |
| 1.4 | |
| 3,642 | |
| 1.1 | |
| 7,690 | |
| 1.9 | |
| 5,809 | |
| 1.2 | | |||||
Total real estate construction | 2,342 | |
| 0.8 | |
| 5,863 | |
| 2.0 | |
| 5,123 | |
| 1.5 | |
| 17,171 | |
| 4.2 | |
| 33,480 | |
| 6.7 | | |||||
Consumer: |
|
|
|
|
|
|
|
|
|
|
|
|
|
|
|
|
|
|
| |||||||||||||||
Home equity | 15,848 | |
| 5.6 | |
| 20,805 | |
| 7.0 | |
| 25,806 | |
| 7.7 | |
| 31,074 | |
| 7.6 | |
| 36,260 | |
| 7.2 | | |||||
Automobile | 1,850 | |
| 0.7 | |
| 3,342 | |
| 1.1 | |
| 5,547 | |
| 1.7 | |
| 8,884 | |
| 2.2 | |
| 14,016 | |
| 2.8 | | |||||
Other | 2,723 | |
| 1.0 | |
| 2,968 | |
| 1.0 | |
| 3,510 | |
| 1.1 | |
| 4,084 | |
| 1.0 | |
| 5,078 | |
| 1.0 | | |||||
Total consumer | 20,421 | |
| 7.2 | |
| 27,115 | |
| 9.2 | |
| 34,863 | |
| 10.5 | |
| 44,042 | |
| 10.8 | |
| 55,354 | |
| 11.1 | | |||||
Commercial business | 11,050 | |
| 3.9 | |
| 9,690 | |
| 3.3 | |
| 8,460 | |
| 2.5 | |
| 9,226 | |
| 2.3 | |
| 8,721 | |
| 1.7 | | |||||
Total fixed-rate loans | $ | 168,499 | |
| 59.4 | |
| $ | 208,971 | |
| 70.7 | |
| $ | 239,713 | |
| 71.9 | |
| $ | 292,828 | |
| 71.9 | |
| $ | 338,844 | |
| 67.7 | |
ADJUSTABLE-RATE LOANS |
|
|
|
|
|
|
|
|
|
|
|
|
|
|
|
|
|
|
| |||||||||||||||
Real estate: |
|
|
|
|
|
|
|
|
|
|
|
|
|
|
|
|
|
|
| |||||||||||||||
One-to-four family | $ | 15,262 | |
| 5.4 | |
| $ | 13,074 | |
| 4.4 | |
| $ | 16,195 | |
| 4.9 | |
| $ | 17,963 | |
| 4.4 | |
| $ | 18,892 | |
| 3.8 | |
Multi-family | 8,822 | |
| 3.1 | |
| 8,858 | |
| 3.0 | |
| 9,641 | |
| 2.9 | |
| 12,377 | |
| 3.0 | |
| 10,629 | |
| 2.1 | | |||||
Commercial | 64,731 | |
| 22.8 | |
| 39,857 | |
| 13.5 | |
| 34,504 | |
| 10.4 | |
| 31,825 | |
| 7.8 | |
| 29,335 | |
| 5.9 | | |||||
Land loans | 1,014 | |
| 0.4 | |
| 1,017 | |
| 0.3 | |
| 854 | |
| 0.3 | |
| 599 | |
| 0.1 | |
| 452 | |
| 0.1 | | |||||
Total real estate | 89,829 | |
| 31.7 | |
| 62,806 | |
| 21.3 | |
| 61,194 | |
| 18.4 | |
| 62,764 | |
| 15.4 | |
| 59,308 | |
| 11.8 | | |||||
Real estate construction: |
|
|
|
|
|
|
|
|
|
|
|
|
|
|
|
|
|
|
| |||||||||||||||
One-to-four family | 858 | |
| 0.3 | |
| - | |
| - | |
| 3,829 | |
| 1.1 | |
| 7,299 | |
| 1.8 | |
| 37,187 | |
| 7.4 | | |||||
Multi-family | 1,270 | |
| 0.4 | |
| - | |
| - | |
| - | |
| - | |
| - | |
| - | |
| 2,493 | |
| 0.5 | | |||||
Commercial | 1,171 | |
| 0.4 | |
| 833 | |
| 0.3 | |
| 2,698 | |
| 0.8 | |
| 12,342 | |
| 3.0 | |
| 33,003 | |
| 6.6 | | |||||
Total real estate construction | 3,299 | |
| 1.2 | |
| 833 | |
| 0.3 | |
| 6,527 | |
| 2.0 | |
| 19,641 | |
| 4.8 | |
| 72,683 | |
| 14.5 | | |||||
5
Table of Contents
| At June 30, | |||||||||||||||||||||||||||||||||
| 2013 |
| 2012 |
| 2011 |
| 2010 |
| 2009 | |||||||||||||||||||||||||
| Amount |
| Percent |
| Amount |
| Percent |
| Amount |
| Percent |
| Amount |
| Percent |
| Amount |
| Percent | |||||||||||||||
| (Dollars in thousands) | |||||||||||||||||||||||||||||||||
Consumer: |
|
|
|
|
|
|
|
|
|
|
|
|
|
|
|
|
|
|
| |||||||||||||||
Home equity | 9,987 | |
| 3.5 | |
| 10,699 | |
| 3.6 | |
| 9,923 | |
| 3.0 | |
| 11,372 | |
| 2.8 | |
| 12,768 | |
| 2.6 | | |||||
Automobile | - | |
| - | |
| - | |
| - | |
| - | |
| - | |
| - | |
| - | |
| - | |
| - | | |||||
Credit cards | 4,741 | |
| 1.7 | |
| 5,180 | |
| 1.8 | |
| 7,101 | |
| 2.1 | |
| 7,943 | |
| 2.0 | |
| 8,617 | |
| 1.7 | | |||||
Other | - | |
| - | |
| - | |
| - | |
| 85 | |
| - | |
| 76 | |
| - | |
| 64 | |
| - | | |||||
Total consumer | 14,728 | |
| 5.2 | |
| 15,879 | |
| 5.4 | |
| 17,109 | |
| 5.1 | |
| 19,391 | |
| 4.8 | |
| 21,449 | |
| 4.3 | | |||||
Commercial business | 7,161 | |
| 2.5 | |
| 6,928 | |
| 2.3 | |
| 8,808 | |
| 2.6 | |
| 12,492 | |
| 3.1 | |
| 8,451 | |
| 1.7 | | |||||
Total adjustable rate loans | 115,017 | |
| 40.6 | |
| 86,446 | |
| 29.3 | |
| 93,638 | |
| 28.1 | |
| 114,288 | |
| 28.1 | |
| 161,891 | |
| 32.3 | | |||||
Total loans | 283,516 | |
| 100.0 | % |
| 295,417 | |
| 100.0 | % |
| 333,351 | |
| 100.0 | % |
| 407,116 | |
| 100.0 | % |
| 500,735 | |
| 100.0 | % | |||||
Less: |
|
|
| |
|
| |
|
| |
|
| |
|
| |
|
| |
|
| |
|
| |
|
| | ||||||
Deferred loan fees | 915 | |
|
| |
| 605 | |
|
| |
| 648 | |
|
| |
| 917 | |
|
| |
| 1,315 | |
|
| | |||||
Allowance for loan losses | 5,147 | |
|
| |
| 7,057 | |
|
| |
| 7,239 | |
|
| |
| 16,788 | |
|
| |
| 24,463 | |
|
| | |||||
Loans receivable, net | $ | 277,454 | |
|
| |
| $ | 287,755 | |
|
| |
| $ | 325,464 | |
|
| |
| $ | 389,411 | |
|
| |
| $ | 474,957 | |
|
| |
6
Table of Contents
One-to-Four Family Real Estate Lending. As of June 30, 2013, $73.9 million, or 26.1%, of our total loan portfolio consisted of permanent loans secured by one-to-four family residences of which $4.8 million secured by non-owner occupied residential properties were nonperforming. We originate both fixed rate and adjustable rate loans in our residential lending program and use Freddie Mac underwriting guidelines. None of our residential loan products allow for negative amortization of principal. We typically base our decision on whether to sell or retain secondary market quality loans on the rate and fees for each loan, market conditions and liquidity needs. Although we have sold the majority of our residential loans over the last two years, we do not sell all qualified loans on the secondary market as we hold in our portfolio many residential loans that may not meet all Freddie Mac guidelines yet meet our investment and liquidity objectives.
At June 30, 2013, $58.6 million of this loan portfolio consisted of fixed rate loans which was 79.3% of our total one-to-four family portfolio and 20.7% of our total loans at that date. Specifically, we offer fixed rate, residential mortgages from 10 to 30 year terms and we use Freddie Mac daily pricing to set our pricing. Borrowers have a variety of buy-down options with each loan and most mortgages have a duration of less than ten years. The average loan duration is a function of several factors, including real estate supply and demand, current interest rates, expected future rates and interest rates payable on outstanding loans.
Additionally, we offer a full range of adjustable rate mortgage products. These loans offer three, five or seven year fixed-rate terms with annual adjustments thereafter. The annual adjustments are limited to increases or decreases of no more than two percent and carry a typical lifetime cap of five percent above the original rate. At this time, we hold these adjustable rate mortgages in our portfolio. Similar to fixed rate loans, borrower demand for adjustable rate mortgage loans is a function of the current rate environment, the expectations of future interest rates and the difference between the initial interest rates and fees charged for each type of loan. The relative amount of fixed rate mortgage loans and adjustable rate mortgage loans that can be originated at any time is largely determined by the demand for each in a competitive environment.
While adjustable rate mortgages in our loan portfolio help us reduce our exposure to changes in interest rates, it is possible that, during periods of rising interest rates, the risk of default on adjustable rate mortgage loans may increase as a result of annual repricing and the subsequent higher payment to the borrower. In some rate environments, adjustable rate mortgages may be offered at initial rates of interest below a comparable fixed rate and could result in a higher risk of default or delinquency. Another consideration is that although adjustable rate mortgage loans allow us to decrease the sensitivity of our asset base as a result of changes in the interest rates, the extent of this interest sensitivity is limited by the periodic and lifetime interest rate adjustment limits. Our historical experience with adjustable rate mortgages has been very favorable. We do not, however, offer adjustable rate mortgages with initial teaser rates. At June 30, 2013, $15.3 million of our permanent one-to-four family mortgage loans were adjustable rate loans which was 20.7% of our total one-to-four family loan portfolio and 5.4% of our total loans at that date.
Regardless of the type of loan, we underwrite our residential loans based on Freddie Mac's Loan Prospector guidelines. This underwriting considers a variety of factors such as credit history, debt to income, property type, loan-to-value, and occupancy, to name a few. Generally, we use the same Freddie Mac criteria for establishing maximum loan-to-values and also consider whether a transaction is a purchase, rate and term refinance, or cash-out refinance. For loans above 80% loan-to-value, we typically require private mortgage insurance in order to reduce our risk exposure should the loan default. Regardless of the loan-to-value, our one-to-four family loans are appraised by independent fee appraisers that have been approved by us and generally carry no prepayment restrictions. We also require title insurance, hazard insurance, and if necessary, flood insurance in an amount not less than the current regulatory requirements.
We also have additional products designed to make home ownership available to qualified low to moderate income borrowers. The underwriting guidelines for these programs are usually more flexible in the areas of credit or work history. For example, some segments of the low to moderate income population have non-traditional credit histories and pay cash for many of their consumer purchases. They may also work in seasonal industries that do not offer a standard work schedule or salary. Loans such as Freddie Mac's "Homestart Program" are designed to meet this market's needs and often require a borrower to show a history of saving and budgeting. These types of programs also provide education on the costs and benefits of homeownership. We plan on continuing to offer these and other programs which reach out to qualifying borrowers in all the markets we serve.
7
Table of Contents
The following table describes certain credit risk characteristics of Anchor Bank's one-to-four family loan portfolio held for investment as of June 30, 2013:
| Outstanding Principal Balance (1) |
| Weighted- Average FICO (2) |
| Weighted-Average LTV (3) |
| Weighted-Average Seasoning (4) | |||||
| (Dollars in thousands) | |||||||||||
Interest only | $ | 2,698 | |
| 709 | |
| 97.1 | % |
| 41 | |
Stated income (5) | 538 | |
| 725 | |
| 75.2 | |
| 59 | | |
FICO less than or equal to 660 (6) | 5,265 | |
| 621 | |
| 77.1 | |
| 61 | | |
__________
(1) | The outstanding balance presented in this table may overlap more than one category. |
(2) | The FICO score represents the creditworthiness, as reported by an independent third party, of a borrower based on the borrower's credit history. A higher FICO score indicates a greater degree of creditworthiness. |
(3) | LTV (loan-to-value) is the ratio calculated by dividing the original loan balance by the original appraised value of the real estate collateral. As a result of the decline in single-family real estate values, the weighted-average LTV presented above may be substantially understated compared to the current market value. |
(4) | Seasoning describes the number of months since the funding date of the loans. |
(5) | Stated income is defined as a borrower provided level of income which was not subject to verification during the loan origination process. |
(6) | These loans are considered "subprime" as defined by the FDIC. |
Anchor Bank does not actively engage in subprime lending, either through advertising, marketing, underwriting and/or risk selection, and has no established program to originate or purchase subprime loans to be held in its portfolio. Residential mortgage loans identified as subprime, with FICO scores of less than 660, were originated and managed in the ordinary course of business, and totaled $5.3 million at June 30, 2013, representing 1.9% of total loans, 7.1% of one-to-four family mortgage loans, and 10.0% of Tier 1 Capital. Our one-to-four family mortgage loans identified as subprime based on the borrower's FICO score at time the loan was originated do not represent a material part of our lending activity. Accordingly, these loans are identified as "exclusions" as defined pursuant to regulatory guidance issued by the FDIC in Financial Institutions Letter FIL-9-2001.
Construction and Land Loans. We had been an active originator of real estate construction loans in our market area since 1990 although we have been significantly reducing the balance of these loans since 2009 in accordance with the Order and limited new loan originations. At June 30, 2013, our construction loans amounted to $5.6 million, or 2.0% of the total loan portfolio, most of which is for the construction of commercial and multi-family real estate. Prior to fiscal 2010, a substantial number of our speculative residential construction loans for both attached and detached housing units, as well as residential land acquisition and development loans were referred through a broker relationship in Portland, Oregon, and were secured by first lien construction deeds of trust on properties in the greater Portland, Oregon metropolitan area. Much of the increase in our nonperforming assets since 2007 was related to these construction loans. We originated $2.7 million, $32.9 million and $48.9 million of construction loans through this broker during the years ended June 30, 2009, 2008, 2007, respectively, of which none remained outstanding at June 30, 2013.
We generally provide an interest reserve for funds on builder construction loans that have been advanced. Interest reserves are a means by which a lender builds in, as a part of the loan approval and as a component of the cost of the project, the amount of the monthly interest required to service the debt during the construction period of the loan.
At June 30, 2013, our construction loan portfolio did not contain any loans which had been previously extended or renewed and which included unfunded interest reserves. Our entire construction loan portfolio at June 30, 2013 consisted of loans requiring interest only payments, six of which totaled $5.4 million and were relying on the interest reserve to make this payment. At June 30, 2013, no construction loans were delinquent. During the years ended June 30, 2013, 2012, and 2011, one, seven and 22 construction loans were charged-off totaling $105,000, $561,000 and $8.9 million, respectively.
8
Table of Contents
At the dates indicated, the composition of our construction portfolio was as follows:
| At June 30, | ||||||||||
| 2013 |
| 2012 |
| 2011 | ||||||
| (In thousands) | ||||||||||
One-to-four family: |
|
|
|
|
| ||||||
Speculative | $ | 589 | |
| $ | 308 | |
| $ | 3,984 | |
Permanent | - | |
| - | |
| 1,326 | | |||
Custom | 269 | |
| 141 | |
| 2,053 | | |||
Land acquisition and development loans | - | |
| 833 | |
| - | | |||
Multi-family | 3,524 | |
| 1,370 | |
| - | | |||
Commercial real estate: |
|
|
| |
|
| | ||||
Construction | 1,259 | |
| 4,044 | |
| 4,287 | | |||
Total construction (1) | $ | 5,641 | |
| $ | 6,696 | |
| $ | 11,650 | |
(1) | Loans in process for these loans at June 30, 2013, 2012 and 2011 were $5.4 million, $1.9 million and $1.4 million, respectively. |
For the year ended June 30, 2013, we originated one builder construction loan to fund the construction of one-to-four family properties totaling $1.8 million, as compared to none during the years ended June 30, 2012 and 2011 and the origination of 17 loans during the year ended June 30, 2009, aggregating $6.0 million. We originate construction and site development loans to experienced contractors and builders in our market area primarily to finance the construction of single-family homes and subdivisions, which homes typically have an average price ranging from $200,000 to $500,000. All builders were qualified using the same standards as other commercial loan credits, requiring minimum debt service coverage ratios and established cash reserves to carry projects through construction completion and sale of the project. The maximum loan-to-value limit on both pre-sold and speculative projects is generally up to 75% of the appraised market value or sales price upon completion of the project. We generally do not require any cash equity from the borrower if there is sufficient equity in the land being used as collateral. Development plans are required from builders prior to making the loan. We also require that builders maintain adequate insurance coverage. Maturity dates for residential construction loans are largely a function of the estimated construction period of the project, and generally did not exceed 18 months for residential subdivision development loans at the time of origination. Our residential construction loans typically have adjustable rates of interest based on The Wall Street Journal prime rate and during the term of construction, the accumulated interest is added to the principal of the loan through an interest reserve. Construction loan proceeds are disbursed periodically in increments as construction progresses and as inspection by our approved inspectors warrant. At June 30, 2013, our largest builder and sole remaining relationship consisted of one loan for $1.8 million, including $1.2 million which is undisbursed.
We have made, from time to time, construction loans for commercial development projects. These projects include multi-family, apartment, retail, office/warehouse and office buildings. These loans generally have an interest-only phase during construction, rely on an interest reserve to fund interest payments and generally convert to permanent financing when construction is completed. Disbursement of funds is at our sole discretion and is based on the progress of the construction. The maximum loan-to-value limit applicable to these loans is generally 75% of the appraised post-construction value. Additional analysis and underwriting of these loans typically results in lower loan-to-value ratios based on the debt service coverage analysis, including our interest rate and vacancy stress testing. Our target minimum debt coverage ratio is 1.20 for loans on these projects. At June 30, 2013, our portfolio of construction loans for commercial projects included six loans totaling $4.8 million, in addition $3.9 million which is undisbursed. These loans consisted of three multi-family complexes, a commercial industrial property, a school, and a restaurant all located in Washington.
Properties which are the subject of a construction loan are monitored for progress through our construction loan administration department, and include monthly site inspections, inspection reports and photographs provided by a qualified staff inspector or a licensed and bonded third party inspection service contracted by and for us. If we make a determination that there is deterioration, or if the loan becomes nonperforming, we halt any disbursement of those funds identified for use in paying interest and bill the borrower directly for interest payments. Construction loans with interest reserves are underwritten similarly to construction loans without interest reserves.
We have in the past originated land acquisition and development loans to local contractors and developers for the purpose of holding the land for future development. These loans are secured by a first lien on the property, are generally limited up to 75% of the lower of the acquisition price or the appraised value of the land or sales price, and generally have a term of one to two years
9
Table of Contents
with a fixed interest rate based on the prime rate. Our land acquisition and development loans are generally secured by property in our primary market area. We require title insurance and, if applicable, a hazardous waste survey reporting that the land is free of hazardous or toxic waste. At June 30, 2013, we had no land acquisition and development loans.
We also originate land loans which are typically made to individual consumers to buy a lot or parcel of land for the future construction of the buyer's primary residence and are included in "land loans". At June 30, 2013, our land loans to individuals totaled $5.3 million or 1.9% of the total loan portfolio of which $734,000 were delinquent more than 90 days and nonaccrual status.
Construction lending contains the inherent difficulty in estimating both a property's value at completion of the project and the estimated cost (including interest) of the project. If the estimate of construction cost proves to be inaccurate, we may be required to advance funds beyond the amount originally committed to permit completion of the project. If the estimate of value upon completion proves to be inaccurate, we may be confronted at, or prior to, the maturity of the loan with a project the value of which is insufficient to assure full repayment. In addition, speculative construction loans to a builder are often associated with homes that are not pre-sold, and thus pose a greater potential risk to us than construction loans to individuals on their personal residences. This type of lending also typically involves higher loan principal amounts and is often concentrated with a small number of builders. In addition, generally during the term of a construction loan, no payment from the borrower is generally required since the accumulated interest is added to the principal of the loan through an interest reserve. Land loans also pose additional risk because of the lack of income being produced by the property and the potential illiquid nature of the collateral. These risks can be significantly impacted by the supply and demand conditions. As a result, construction lending often involves the disbursement of substantial funds with repayment dependent on the success of the ultimate project and the ability of the borrower to sell or lease the property rather than the ability of the borrower or guarantor themselves to repay principal and interest.
Commercial and Multi-Family Real Estate Lending. As of June 30, 2013, $145.3 million, or 51.3% of our total loan portfolio was secured by commercial and multi-family real estate property. Of this amount, $32.0 million was identified as owner occupied commercial real estate, and the remaining $124.3 million, or 43.8% of our total loan portfolio was secured by income producing, or non-owner occupied commercial real estate. Our commercial real estate loans include loans secured by hotels and motels, office space, office/warehouse, retail strip centers, self-storage facilities, mobile home parks, medical and professional office buildings, and assisted living facilities in our market area. As of June 30, 2013, commercial real estate loans totaled $106.9 million, or 37.7% of our portfolio and multi-family real estate totaled $38.4 million, or 13.6% of our portfolio. These loans generally are priced at a higher rate of interest than one-to-four family loans. Typically, these loans have higher loan balances, are more difficult to evaluate and monitor, and involve a greater degree of risk than one-to-four family loans. Often payments on loans secured by commercial or multi-family properties are dependent on the successful operation and management of the property; therefore, repayment of these loans may be affected by adverse conditions in the real estate market or the economy. We generally require and obtain loan guarantees from financially capable parties based upon the review of personal financial statements. If the borrower is a corporation, we generally require and obtain personal guarantees from the corporate principals based upon a review of their personal financial statements and individual credit reports.
The average loan size in our commercial and multi-family real estate portfolio was $765,000 as of June 30, 2013. We target individual commercial and multi-family real estate loans to small and mid-size owner occupants and investors in our market area, between $1.0 million and $6.0 million. At June 30, 2013, the largest commercial loan in our portfolio was a $5.7 million purchased minority interest in a national shared loan secured by a dining, entertainment, and hotel facility, located near Olympia, Washington. Our largest multi-family loan as of June 30, 2013, was a 75 unit apartment complex with an outstanding principal balance of $2.9 million, located in Pacific, Washington. These loans were performing according to their repayment terms as of June 30, 2013.
We offer both fixed and adjustable rates on commercial and multi-family real estate loans. Loans originated on a fixed rate basis generally are originated at terms up to ten years, with amortization terms up to 30 years. As of June 30, 2013, we had $29.6 million and $8.8 million in fixed and adjustable rate multi-family loans, respectively, and $42.1 million and $64.7 million in fixed and adjustable rate commercial real estate loans, respectively.
Commercial and multi-family real estate loans are originated with rates that generally adjust after an initial period ranging from three to ten years. Adjustable rate multi-family and commercial real estate loans are generally priced utilizing the applicable FHLB or U.S. Treasury Term Borrowing Rate plus an acceptable margin. These loans are typically amortized for up to 30 years with a prepayment penalty. The maximum loan-to-value ratio for commercial and multi-family real estate loans is generally 75%. We require appraisals of all properties securing commercial and multi-family real estate loans, performed by independent appraisers designated by us. We require our commercial and multi-family real estate loan borrowers with outstanding balances in excess of $750,000, or a loan-to-value ratio in excess of 60% to submit annual financial statements and rent rolls on the subject property. The properties that fit within this profile are also inspected annually, and an inspection report and photograph are included. We generally require a minimum pro forma debt coverage ratio of 1.20 times for loans secured by commercial and multi-family properties.
10
Table of Contents
The following is an analysis of the types of collateral securing our commercial real estate and multi-family loans at June 30, 2013:
Collateral |
| Amount |
| Percent of Total | |||
|
| (Dollars in thousands) | |||||
Multi-family |
| $ | 38,425 | |
| 26.4 | % |
Office |
| 25,592 | |
| 17.6 | | |
Hospitality |
| 9,132 | |
| 6.3 | | |
Mini storage |
| 29,494 | |
| 20.3 | | |
Mobile home park |
| 4,145 | |
| 2.9 | | |
Congregate care |
| 6,642 | |
| 4.6 | | |
Retail |
| 4,912 | |
| 3.4 | | |
Education/Worship |
| 6,222 | |
| 4.3 | | |
Other non-residential |
| 20,720 | |
| 14.3 | | |
Total |
| $ | 145,284 | |
| 100.0 | % |
If we foreclose on a multi-family or commercial real estate loan, our holding period for the collateral typically is longer than for one-to-four family mortgage loans because there are fewer potential purchasers of the collateral. Additionally, as a result of our increasing emphasis on this type of lending, a portion of our multi-family and commercial real estate loan portfolio is relatively unseasoned and has not been subjected to unfavorable economic conditions. As a result, we may not have enough payment history with which to judge future collectability or to predict the future performance of this part of our loan portfolio. These loans may have delinquency or charge-off levels above our historical experience, which could adversely affect our future performance. Further, our multi-family and commercial real estate loans generally have relatively large balances to single borrowers or related groups of borrowers. Accordingly, if we make any errors in judgment in the collectability of our commercial real estate loans, any resulting charge-offs may be larger on a per loan basis than those incurred with our residential or consumer loan portfolios. At June 30, 2013 , there were no commercial real estate loans or multi-family loans that were delinquent in excess of 90 days and on nonaccrual status. There were no commercial real estate loan charge offs for the year ended June 30, 2013. Commercial real estate loan charge offs for the years ended June 30, 2012 and 2011 were $571,000 and $584,000, respectively. There were no multi-family loan charge-offs during these periods.
Consumer Lending. We offer a variety of consumer loans, including home equity loans and lines of credit, automobile loans, credit cards and personal lines of credit. At June 30, 2013, the largest component of the consumer loan portfolio consisted of home equity loans and lines of credit, which totaled $25.8 million, or 9.1%, of the total loan portfolio. Our home equity loans are risk priced using credit score, loan-to-value and overall credit quality of the applicant. Home equity loans are made for, among other purposes, the improvement of residential properties, debt consolidation and education expenses. The majority of these loans are secured by a second deed of trust on residential property. Fixed rate terms are available up to 240 months, and our equity line of credit is a prime rate based loan with the ability to lock in portions of the line for five to 20 years. Maximum loan-to-values are dependent on creditworthiness and may be originated at up to 95% of collateral value.
Our credit card portfolio includes both VISA and MasterCard brands, and totaled $4.7 million, or 1.7% of the total loan portfolio at June 30, 2013. We have been offering credit cards for more than 20 years but no new credit cards were issued during the last three fiscal years. All of our credit cards have interest rates and credit limits determined by the creditworthiness of the borrower. We use credit bureau scores in addition to other criteria such as income in our underwriting decision process on these loans.
Our automobile loan portfolio totaled $1.9 million, or 0.7% of the total loan portfolio at June 30, 2013. We offer several options for vehicle purchase or refinance with a maximum term of 84 months for newer vehicles and 72 months for older vehicles. As with home equity loans, our vehicle and recreational vehicle loans are risk priced based on creditworthiness, loan term and loan-to-value. We currently access a Carfax Vehicle Report to ensure that the collateral being loaned against is acceptable and to protect borrowers from a "lemon" or other undesirable histories. Other consumer loans, consisting primarily of unsecured personal lines of credit totaled $2.7 million or 1.0% of our total loan portfolio at June 30, 2013.
Consumer loans entail greater risk than do residential mortgage loans, particularly in the case of consumer loans that are unsecured or secured by rapidly depreciating assets such as automobiles. In these cases, any repossessed collateral for a defaulted consumer loan may not provide an adequate source of repayment of the outstanding loan balance as a result of the greater likelihood of damage, loss or depreciation. The remaining deficiency often does not warrant further substantial collection efforts against the
11
Table of Contents
borrower beyond obtaining a deficiency judgment. In addition, consumer loan collections are dependent on the borrower's continuing financial stability, and are more likely to be adversely affected by job loss, divorce, illness or personal bankruptcy. Furthermore, the application of various federal and state laws, including federal and state bankruptcy and insolvency laws, may limit the amount that can be recovered on these loans. These risks are not as prevalent with respect to our consumer loan portfolio because a large percentage of the portfolio consists of home equity lines of credit that are underwritten in a manner such that they result in credit risk that is substantially similar to one-to-four family mortgage loans. Nevertheless, home equity lines of credit have greater credit risk than one-to-four family mortgage loans because they are secured by mortgages subordinated to the existing first mortgage on the property, which we may or may not hold and do not have private mortgage insurance coverage. At June 30, 2013, consumer loans of $448,000 were delinquent in excess of 90 days or in nonaccrual status. Consumer loans of $1.2 million were charged off during the year ended June 30, 2013 compared to $1.4 million and $1.9 million of consumer loans that were charged-off during the years ended June 30, 2012 and 2011, respectively.
Commercial Business Lending. These loans are primarily originated as conventional loans to business borrowers, which include lines of credit, term loans and letters of credit. These loans are typically secured by collateral and are used for general business purposes, including working capital financing, equipment financing, capital investment and general investments. Loan terms vary from one to seven years. The interest rates on such loans are generally floating rates indexed to The Wall Street Journal prime rate. Inherent with our extension of business credit is the business deposit relationship which frequently includes multiple accounts and related services from which we realize low cost deposits plus service and ancillary fee income.
Commercial business loans typically have shorter maturity terms and higher interest spreads than real estate loans, but generally involve more credit risk because of the type and nature of the collateral. We are focusing our efforts on small- to medium-sized, privately-held companies with local or regional businesses that operate in our market area. Our commercial business lending policy includes credit file documentation and analysis of the borrower's background, capacity to repay the loan, the adequacy of the borrower's capital and collateral, as well as an evaluation of other conditions affecting the borrower. Analysis of the borrower's past, present and future cash flows is also an important aspect of our credit analysis. We generally obtain personal guarantees on our commercial business loans. At June 30, 2013, commercial business loans totaled $18.2 million, or 6.4% of our loan portfolio comprised of 161 loans in 89 different business classifications as identified by the North American Industrial Classification System. The largest commercial business relationship at June 30, 2013 included three loans which totaled $1.7 million to a borrower located in Washington secured by the assets of a machine shop.
Repayment of our commercial business loans is often dependent on the cash flows of the borrower, which may be unpredictable, and the collateral securing these loans may fluctuate in value. Our commercial business loans are originated primarily based on the identified cash flow of the borrower and secondarily on the underlying collateral provided by the borrower. Most often, this collateral consists of accounts receivable, inventory or equipment. Credit support provided by the borrower for most of these loans and the probability of repayment is based on the liquidation of the pledged collateral and enforcement of a personal guarantee, if any. As a result, in the case of loans secured by accounts receivable, the availability of funds for the repayment of these loans may be substantially dependent on the ability of the borrower to collect amounts due from its customers. The collateral securing other loans may depreciate over time, may be difficult to appraise and may fluctuate in value based on the success of the business. For the years ended June 30, 2013 and 2012, Anchor Bank charged off $1.5 million and $63,000 from its commercial business loan portfolio.
Loan Maturity and Repricing . The following table sets forth certain information at June 30, 2013 regarding the dollar amount of loans maturing in our portfolio based on their contractual terms to maturity, but does not include scheduled payments or potential prepayments. Demand loans, loans having no stated schedule of repayments and no stated maturity, are reported as due in one year or less. Loan balances do not include undisbursed loan proceeds, unearned discounts, unearned income and allowance for loan losses.
12
Table of Contents
| Within One Year |
| After One Year Through 3 Years |
| After 3 Years Through 5 Years |
| After 5 Years Through 10 Years |
| Beyond 10 Years |
| Total | ||||||||||||
| (In thousands) | ||||||||||||||||||||||
Real Estate: |
|
|
|
|
|
|
|
|
|
|
| ||||||||||||
One-to-four family | $ | 4,231 | |
| $ | 4,606 | |
| $ | 4,589 | |
| $ | 4,775 | |
| $ | 55,700 | |
| $ | 73,901 | |
Multi-family | 992 | |
| 8,041 | |
| 3,108 | |
| 14,351 | |
| 11,933 | |
| 38,425 | | ||||||
Commercial | 9,515 | |
| 26,340 | |
| 12,126 | |
| 47,467 | |
| 11,411 | |
| 106,859 | | ||||||
Construction | 5,611 | |
| 30 | |
| - | |
| - | |
| - | |
| 5,641 | | ||||||
Land loans | 1,599 | |
| 1,786 | |
| 971 | |
| 485 | |
| 489 | |
| 5,330 | | ||||||
Total real estate | 21,948 | |
| 40,803 | |
| 20,794 | |
| 67,078 | |
| 79,533 | |
| 230,156 | | ||||||
Consumer: |
|
|
|
|
|
|
|
|
|
|
| ||||||||||||
Home equity | 26 | |
| 1,432 | |
| 5,182 | |
| 9,854 | |
| 9,341 | |
| 25,835 | | ||||||
Credit cards | 4,741 | |
| - | |
| - | |
| - | |
| - | |
| 4,741 | | ||||||
Automobile | 113 | |
| 465 | |
| 494 | |
| 385 | |
| 393 | |
| 1,850 | | ||||||
Other | 394 | |
| 459 | |
| 289 | |
| 371 | |
| 1,210 | |
| 2,723 | | ||||||
Total consumer | 5,274 | |
| 2,356 | |
| 5,965 | |
| 10,610 | |
| 10,944 | |
| 35,149 | | ||||||
Commercial business | 4,557 | |
| 4,519 | |
| 3,665 | |
| 5,218 | |
| 252 | |
| 18,211 | | ||||||
Total | $ | 31,779 | |
| $ | 47,678 | |
| $ | 30,424 | |
| $ | 82,906 | |
| $ | 90,729 | |
| $ | 283,516 | |
The following table sets forth the dollar amount of all loans due after June 30, 2014, which have fixed interest rates and have floating or adjustable interest rates:
| Fixed Rates |
| Floating or Adjustable Rates |
| Total | ||||||
| (In thousands) | ||||||||||
Real Estate: |
|
|
|
|
| ||||||
One-to-four family | $ | 54,490 | |
| $ | 15,180 | |
| $ | 69,670 | |
Multi-family | 28,611 | |
| 8,822 | |
| 37,433 | | |||
Commercial | 33,507 | |
| 63,837 | |
| 97,344 | | |||
Construction | 10 | |
| 2,441 | |
| 2,451 | | |||
Land loans | 2,717 | |
| 1,014 | |
| 3,731 | | |||
Total real estate | 119,335 | |
| 91,294 | |
| 210,629 | | |||
|
|
|
|
|
| ||||||
Consumer: |
|
|
|
|
| ||||||
Home equity | 15,822 | |
| 9,987 | |
| 25,809 | | |||
Automobile | 1,737 | |
| - | |
| 1,737 | | |||
Other | 2,329 | |
| - | |
| 2,329 | | |||
Total consumer | 19,888 | |
| 9,987 | |
| 29,875 | | |||
|
|
|
|
|
| ||||||
Commercial business | 9,044 | |
| 4,610 | |
| 13,654 | | |||
Total | $ | 148,267 | |
| $ | 105,891 | |
| $ | 254,158 | |
Loan Solicitation and Processing Loan originations are obtained from a variety of sources, including direct mail and telephone solicitation, trade and business organization participation. Our management and staff are also involved in a wide variety of professional, charitable, service and social organizations within the communities in which we operate, and our branch managers, loan representatives and business bankers solicit referrals from existing clients and new prospects. We also originate and cross sell loans and services to our existing customer base as well as our walk-in/call-in/internet traffic as a result of our long standing community presence and broad based advertising efforts. Loan processing and underwriting, closing and funding are determined
13
Table of Contents
by the type of loan. Consumer loans, including conforming one-to-four family mortgage loans are processed, underwritten, documented and funded through our centralized processing and underwriting center located in Aberdeen, Washington. Commercial business loans, including commercial and multi-family real estate loans and any non-conforming one-to-four family mortgage loans are processed and underwritten in one of our two Business Banking Center offices located in Lacey and Aberdeen, Washington. Our consumer and residential loan underwriters have specific approval authority, and requests that exceed such authority are referred to the appropriate supervisory level.
Depending upon the size of the loan request and the total borrower credit relationship with us, loan decisions may include the Executive Loan Committee, Senior Loan Committee, and/or Board of Directors. Credit relationships up to $4 million may be approved by the Executive Loan Committee. Loans or aggregated credit relationships which exceed $4 million must be approved by the Board of Directors, either in the form of its Senior Loan Committee with an authority limit of $6 million, or by the full membership of the Board.
Commercial and multi-family real estate loans can be approved up to $250,000 by the Chief Financial Officer, and up to $500,000 by any of the Credit Administrator, Business Banking Manager or Loan Operations Officer. These loans can be approved up to $1.0 million by either the President/Chief Executive Officer or Chief Lending Officer, and up to $2.0 million with the combination of both President/Chief Executive Officer and Chief Lending Officer. Our Executive Loan Committee, which presently consists of the President/Chief Executive Officer, Chief Financial Officer, Chief Lending Officer, Credit Administrator, Business Banking Manager, Note Department Manager, and Loan Operations Manager is authorized to approve loans to one borrower or a group of related borrowers up to $4.0 million. Loans over $4.0 million must be approved by the Senior Loan Committee of the Board with a limit of $6.0 million, or the full Board of Directors.
Loan Originations, Servicing, Purchases and Sales. During the years ended June 30, 2013 and 2012, our total loan originations were $93.5 million and $55.8 million, respectively.
One-to-four family loans are generally originated in accordance with the guidelines established by Freddie Mac, with the exception of our special community development loans under the Community Reinvestment Act. We utilize the Freddie Mac Loan Prospector, an automated loan system to underwrite the majority of our residential first mortgage loans (excluding community development loans). The remaining loans are underwritten by designated real estate loan underwriters internally in accordance with standards as provided by our Board-approved loan policy.
We actively sell the majority of our residential fixed rate first mortgage loans to the secondary market at the time of origination. During the years ended June 30, 2013 and 2012, we sold $22.6 million and $20.6 million, respectively, in whole loans to the secondary market and $1.7 million and $4.7 million, respectively, were securitized. The increase in whole loan sales and securitizations was attributable to an increase in the origination of one-to-four family loans to $28.1 million from $26.8 million during the years ended June 30, 2013 and 2012, respectively. Our secondary market relationship is with Freddie Mac. We generally retain the servicing on the loans we sell into the secondary market. Loans are generally sold on a non-recourse basis. As of June 30, 2013, our residential loan servicing portfolio was $109.8 million.
14
Table of Contents
The following table shows total loans originated, purchased, sold and repaid during the periods indicated:
| Year Ended June 30, | ||||||||||
| 2013 |
| 2012 |
| 2011 | ||||||
Loans originated: | (In thousands) | ||||||||||
Real estate: |
|
|
|
|
| ||||||
One-to-four family | $ | 28,120 | |
| $ | 26,840 | |
| $ | 15,819 | |
Multi-family | 1,069 | |
| 6,682 | |
| 1,976 | | |||
Commercial | 41,157 | |
| 12,415 | |
| 3,101 | | |||
Construction | 13,632 | |
| 4,385 | |
| 1,319 | | |||
Land loans | 252 | |
| 117 | |
| 355 | | |||
Total real estate | 84,230 | |
| 50,439 | |
| 22,570 | | |||
Consumer: |
|
|
| |
|
| | ||||
Home equity | 283 | |
| 204 | |
| 397 | | |||
Credit cards | - | |
| - | |
| - | | |||
Automobile | 221 | |
| 295 | |
| 467 | | |||
Other | 562 | |
| 615 | |
| 840 | | |||
Total consumer | 1,066 | |
| 1,114 | |
| 1,704 | | |||
Commercial business | 8,238 | |
| 4,284 | |
| 6,549 | | |||
Total loans originated | 93,534 | |
| 55,837 | |
| 30,823 | | |||
Loans sold: |
|
|
| |
|
| | ||||
One-to-four family | 22,566 | |
| 20,641 | |
| 15,503 | | |||
Commercial real estate | - | |
| - | |
| - | | |||
Participation loans | - | |
| - | |
| - | | |||
Total loans sold | 22,566 | |
| 20,641 | |
| 15,503 | | |||
Principal repayments | 79,419 | |
| 55,030 | |
| 46,678 | | |||
Loans securitized | 1,069 | |
| 4,682 | |
| - | | |||
Transfer to real estate owned | 5,365 | |
| 11,810 | |
| 11,615 | | |||
Increase (decrease) in other items, net | (4,806 | ) |
| (1,071 | ) |
| (20,749 | ) | |||
Loans held for sale | 222 | |
| 312 | |
| 225 | | |||
Net increase (decrease) in loans receivable, net | $ | (19,913 | ) |
| $ | (37,709 | ) |
| $ | (63,947 | ) |
Loan Origination and Other Fees. In some instances, we receive loan origination fees on real estate related products. Loan fees generally represent a percentage of the principal amount of the loan that is paid by the borrower. Accounting standards require that certain fees received, net of certain origination costs, be deferred and amortized over the contractual life of the loan. Net deferred fees or costs associated with loans that are prepaid or sold are recognized as income at the time of prepayment. We had $915,000 of net deferred loan fees and costs as of June 30, 2013 compared to $605,000 and $648,000 at June 30, 2012 and 2011, respectively.
Asset Quality
The objective of our loan review process is to determine risk levels and exposure to loss. The depth of review varies by asset types, depending on the nature of those assets. While certain assets may represent a substantial investment and warrant individual reviews, other assets may have less risk because the asset size is small, the risk is spread over a large number of obligors or the obligations are well collateralized and further analysis of individual assets would expand the review process without measurable advantage to risk assessment. Asset types with these characteristics may be reviewed as a total portfolio on the basis of risk indicators such as delinquency (consumer and residential real estate loans) or credit rating. A formal review process is conducted on individual assets that represent greater potential risk. A formal review process is a total re-evaluation of the risks associated with the asset and is documented by completing an asset review report. Certain real estate-related assets must be evaluated in terms of their fair
15
Table of Contents
market value or net realizable value in order to determine the likelihood of loss exposure and, consequently, the adequacy of valuation allowances.
We define a loan as being impaired when, based on current information and events, it is probable that we will be unable to collect all amounts due under the contractual terms of the loan agreement. Large groups of smaller balance homogeneous loans such as consumer secured loans, residential mortgage loans and consumer unsecured loans are collectively evaluated for potential loss. All other loans are evaluated for impairment on an individual basis.
We generally assess late fees or penalty charges on delinquent loans of five percent of the monthly payment amount due. Substantially all fixed rate and adjustable rate mortgage loan payments are due on the first day of the month; however, the borrower is given a 15-day grace period to make the loan payment. When a mortgage loan borrower fails to make a required payment when it is due, we institute collection procedures. The first notice is mailed to the borrower on the 16th day requesting payment and assessing a late charge. Attempts to contact the borrower by telephone generally begin upon the 30th day of delinquency. If a satisfactory response is not obtained, continual follow-up contacts are attempted until the loan has been brought current. Before the 90th day of delinquency, attempts to interview the borrower are made to establish the cause of the delinquency, whether the cause is temporary, the attitude of the borrower toward the debt and a mutually satisfactory arrangement for curing the default.
When a consumer loan borrower fails to make a required payment on a consumer loan by the payment due date, we institute the same collection procedures as for our mortgage loan borrowers.
The Board of Directors is informed monthly as to the number and dollar amount of mortgage and consumer loans that are delinquent by more than 30 days, and is given information regarding classified assets.
If the borrower is chronically delinquent and all reasonable means of obtaining payments have been exercised, we will seek to recover the collateral securing the loan according to the terms of the security instrument and applicable law. In the event of an unsecured loan, we will either seek legal action against the borrower or refer the loan to an outside collection agency.
Nonperforming Assets. The following table sets forth information with respect to our nonperforming assets and restructured loans for the periods indicated.
16
Table of Contents
| At June 30, | ||||||||||||||||||
| 2013 |
| 2012 |
| 2011 |
| 2010 |
| 2009 | ||||||||||
Loans accounted for on a nonaccrual basis: | (Dollars in thousands) | ||||||||||||||||||
Real estate: |
|
|
|
|
|
|
|
|
| ||||||||||
One-to-four family | $ | 4,758 | |
| $ | 1,878 | |
| $ | 3,113 | |
| $ | 3,855 | |
| $ | 3,803 | |
Multi-family | - | |
| - | |
| - | |
| - | |
| - | | |||||
Commercial | - | |
| - | |
| 2,280 | |
| 433 | |
| - | | |||||
Construction | - | |
| 3,369 | |
| 4,055 | |
| 13,964 | |
| 36,954 | | |||||
Land loans | 734 | |
| 109 | |
| 90 | |
| - | |
| - | | |||||
Total real estate | 5,492 | |
| 5,356 | |
| 9,538 | |
| 18,252 | |
| 40,757 | | |||||
Consumer: |
|
|
| |
|
| |
|
| |
|
| | ||||||
Home equity | 428 | |
| 159 | |
| 121 | |
| 70 | |
| 347 | | |||||
Credit cards | - | |
| 16 | |
| - | |
| - | |
| - | | |||||
Automobile | 2 | |
| 66 | |
| 63 | |
| 63 | |
| 190 | | |||||
Other | - | |
| 1 | |
| 9 | |
| 47 | |
| 54 | | |||||
Total consumer | 430 | |
| 242 | |
| 193 | |
| 180 | |
| 591 | | |||||
Commercial business | 219 | |
| 3,124 | |
| 1,245 | |
| 1,324 | |
| 997 | | |||||
Total | 6,141 | |
| 8,722 | |
| 10,976 | |
| 19,756 | |
| 42,345 | | |||||
Accruing loans which are contractually past due 90 days or more: |
|
|
| |
|
| |
|
| |
|
| | ||||||
One-to-four family | - | |
| 55 | |
| 44 | |
| - | |
| - | | |||||
Multi-family | - | |
| - | |
| - | |
| - | |
| - | | |||||
Commercial | - | |
| - | |
| - | |
| - | |
| - | | |||||
Construction | - | |
| - | |
| 2,845 | |
| 822 | |
| 17,575 | | |||||
Land loans | - | |
| - | |
| - | |
| - | |
| - | | |||||
Total real estate | - | |
| 55 | |
| 2,889 | |
| 822 | |
| 17,575 | | |||||
Consumer: |
|
|
| |
|
| |
|
| |
|
| | ||||||
Home equity | - | |
| - | |
| 1 | |
| - | |
| - | | |||||
Credit cards | 18 | |
| - | |
| 137 | |
| - | |
| - | | |||||
Automobile | - | |
| - | |
| - | |
| - | |
| - | | |||||
Other | - | |
| - | |
| 42 | |
| 64 | |
| 143 | | |||||
Total consumer | 18 | |
| - | |
| 180 | |
| 64 | |
| 143 | | |||||
Commercial business | - | |
| - | |
| 124 | |
| - | |
| 586 | | |||||
Total of nonaccrual and 90 days past due loans | 6,159 | |
| 8,722 | |
| 14,169 | |
| 20,642 | |
| 60,649 | | |||||
Real estate owned | 6,212 | |
| 6,708 | |
| 12,597 | |
| 14,570 | |
| 2,990 | | |||||
Repossessed automobiles | 21 | |
| - | |
| 130 | |
| 21 | |
| 69 | | |||||
Total nonperforming assets | $ | 12,392 | |
| $ | 15,430 | |
| $ | 26,896 | |
| $ | 35,233 | |
| $ | 63,708 | |
Restructured loans | $ | 17,469 | |
| $ | 15,112 | |
| $ | 15,034 | |
| $ | 13,491 | |
| $ | 2,670 | |
Allowance for loan loss as a percent of | 83.6 | % |
| 80.9 | % |
| 51.1 | % |
| 81.3 | % |
| 40.3 | % | |||||
Classified assets included in nonperforming assets | $ | 6,159 | |
| $ | 8,722 | |
| $ | 14,169 | |
| $ | 20,642 | |
| $ | 60,649 | |
Nonaccrual and 90 days or more past due loans as percentage of total loans | 2.2 | % |
| 3.0 | % |
| 4.3 | % |
| 5.1 | % |
| 12.1 | % | |||||
Nonaccrual and 90 days or more past due loans as a percentage of total assets | 1.4 | % |
| 1.9 | % |
| 2.9 | % |
| 3.8 | % |
| 9.2 | % | |||||
Nonperforming assets as a percentage of | 2.7 | % |
| 3.3 | % |
| 5.5 | % |
| 6.5 | % |
| 9.8 | % | |||||
Nonaccrued interest (1) | $ | 475 | |
| $ | 665 | |
| $ | 783 | |
| $ | 731 | |
| $ | 2,664 | |
(1) Represents foregone interest on nonaccural loans.
With the exception of $734,000 in construction and land loans that were past due 90 days or more at June 30, 2013, all of our construction loans from which repayment is delayed are a result of the slowdown in the real estate market and, in many cases, a corresponding decline in the value of the collateral. As a result of a decline in home sales and value, Anchor Bank has undertaken
17
Table of Contents
to re-evaluate the collectability of interest payments, the efficacy of collateral for these loans, including updated and/or new appraisals, to identify additional collateral and or curtailment opportunities with borrowers, and to update current and future exit strategies as part of its portfolio risk management.
Real Estate Owned and Other Repossessed Assets. As of June 30, 2013, the Company had 21 properties in real estate owned ("REO") with an aggregate book value of $6.2 million compared to 71 properties with an aggregate book value of $6.7 million at June 30, 2012, and 31 properties in REO with an aggregate book value of $7.0 million at March 31, 2013. The decrease in number of properties during the twelve months ended June 30, 2013 was primarily attributable to ongoing sales of residential properties. Our largest REO property at June 30, 2013 had an aggregate book value of $3.4 million and consisted of a commercial real estate property located in Pierce County, Washington. At June 30, 2013, the Company owned 12 one-to-four family residential properties with an aggregate book value of $2.1 million, four residential building lots with an aggregate book value of $179,000, one vacant land parcel with a book value of $10,000, and four parcels of commercial real estate with an aggregate book value of $3.9 million. Our REO properties are located in Pierce County, southwest Washington and the greater Portland area of northwest Oregon, with 16 of the parcels in Washington and the remaining five in Oregon.
Restructured Loans. According to generally accepted accounting principles, we are required to account for certain loan modifications or restructurings as "troubled debt restructurings." Our policy is to track and report all loans modified to terms not generally available in the market, except for those outside of the materiality threshold established for such tracking and reporting. Loans with principal balances of less than $50,000, and loans with temporary modifications of six months or less are deemed to be immaterial and not included within the tracking and reporting of troubled debt restructurings. In general, the modification or restructuring of a debt is considered a troubled debt restructuring if we, for economic or legal reasons related to a borrower's financial difficulties, grant a concession to the borrower that we would not otherwise consider. We will modify the loan when upon completion of the residence the home is rented instead of sold, or when the borrower can continue to make interest payments and is unable to repay the loan until the property is sold as a result of current market conditions. In connection with a loan modification, we may lower the interest rate, extend the maturity date and require monthly payments when monthly payments are not otherwise required. We may also require additional collateral. All loans which are extended with rates and/or terms below market are identified as impaired loans and an appropriate allowance is established pursuant to generally accepted accounting principles. A loan guarantee, in and by itself, is not considered in either the classification of an impaired loan, the determination of the amount of the allowance or the carrying value of the loan, unless the guarantor provides additional collateral which, when independently evaluated, reduces or eliminates the conditions which caused the loan to be determined as impaired. Accordingly, the existence of a loan guarantee does not result in the carrying value of an impaired loan at a value in excess of the appraised value of the collateral. Loans which are placed in nonaccrual status and subsequently modified are not returned to accruing status until there has been at least six months of consecutive satisfactory performance. As of June 30, 2013, there were 48 loans with aggregate net principal balances of $17.5 million that we have identified as "troubled debt restructures." In connection with these loans, a valuation allowance in the form of charged-off principal equal to $692,000 has been taken. Of these 48 loans, four loans totaling $3.6 million were not performing according to the modified repayment terms at June 30, 2013.
The existence of a guarantor is an important factor that we consider in every deteriorating credit relationship and in our determination as to whether or not to restructure the loan. Additional factors we consider include the cooperation we receive from the borrower and/or guarantor as determined by the timeliness and quality of their direct and indirect communication, including providing us with current financial information; their willingness to develop new, and report on, previously identified risk mitigation strategies; and whether we receive additional collateral. The financial wherewithal of the borrower and/or guarantor is determined through a review and analysis of personal and business financial statements, tax return filings, liquidity verifications, personal and business credit reports, rent rolls, and direct reference checks. The type of financial statements required of a borrower and/or guarantor varies based upon the credit risk and our aggregate credit exposure as it relates to the borrower and any guarantor. Audited financial statements are required for commercial business loans greater than $1.5 million and for commercial real estate loans greater than $10 million, with the level of outside independent accounting review decreasing as our risk exposure decreases. We conduct reviews of the financial condition of borrowers and guarantors at least annually for credits of $750,000 or more, and for aggregate relationships of $1.5 million or more.
At both the time of loan origination and when considering a restructuring of a loan, we also assess the guarantor's character and reputation. This assessment is made by reviewing both the duration or length of time such guarantor has been providing credit guarantees, the aggregate of the contingent liabilities of such guarantor as it relates to guarantees of additional debt provided to other lenders, and the results of direct reference checks. Cooperative and communicative borrowers and/or guarantors may create opportunities for restructuring a loan, however, this cooperation does not affect the amount of the allowance for loan losses recorded or the timing of charging off the loan.
We pursue guarantees where the cost/benefit analysis results in the likelihood of some recovery. Recoveries and settlements range from zero to 100% of the potential unmitigated loan loss, with the lower end generally being the result of a guarantor filing
18
Table of Contents
bankruptcy. At June 30, 2013, we were pursuing guarantors related to three defaulted loans, and had established settlements and repayment arrangements during the past few years from an additional 25 guarantors for repayment of approximately $3.1 million of previously taken losses. These arrangements had individual remaining balances ranging from $300 to $1.2 million at June 30, 2013, and included a variety of repayment terms including principal only and principal plus negotiated interest.
Classified Assets. Federal regulations provide for the classification of lower quality loans and other assets, such as debt and equity securities, as substandard, doubtful or loss. An asset is considered substandard if it is inadequately protected by the current net worth and repayment capacity of the borrower or of any collateral pledged. Substandard assets include those characterized by the distinct possibility that we will sustain some loss if the deficiencies are not corrected. Assets classified as doubtful have all the weaknesses inherent in those classified substandard with the added characteristic that the weaknesses present make collection or liquidation in full highly questionable and improbable, on the basis of currently existing facts, conditions and values. Assets classified as loss are those considered uncollectible and of such little value that their continuance as assets without the establishment of a specific loss reserve is not warranted.
When we classify problem assets as either substandard or doubtful, we may establish a specific allowance in an amount we deem prudent and approved by senior management or the Classified Asset Committee to address the risk specifically or we may allow the loss to be charged-off against the general loan allowance. General loan allowances represent loss allowances which have been established to recognize the inherent risk associated with lending activities, but which, unlike specific allowances, have not been specifically allocated to particular problem assets. When an insured institution classifies problem assets as a loss, it is required to charge off such assets in the period in which they are deemed uncollectible. Assets that do not currently expose us to sufficient risk to warrant classification as substandard or doubtful but possess identified weaknesses are considered either watch or special mention assets. Our determination as to the classification of our assets and the amount of our valuation allowances is subject to review by our regulators, which can order the establishment of additional loss allowances.
In connection with the filing of periodic reports with the FDIC classification of assets policy, we regularly review the problem loans in our portfolio to determine whether any loans require classification in accordance with applicable regulations. On the basis of our review of our loans, as of June 30, 2013, we had classified loans of $17.3 million. The total amount classified represented 33.0% of equity capital and 3.8% of assets at June 30, 2013.
The aggregate amounts of our classified loans at the date indicated (as determined by management), were as follows:
| At June 30, | ||||||
| 2013 |
| 2012 | ||||
| (In thousands) | ||||||
Classified Loans: |
|
|
| ||||
Substandard | $ | 17,290 | |
| $ | 30,471 | |
Doubtful | - | |
| 2,316 | | ||
Loss | - | |
| - | | ||
Total | $ | 17,290 | |
| $ | 32,787 | |
Our $17.3 million of substandard loans at June 30, 2013, consisted primarily of $15.7 million of real estate secured loans and $1.5 million of consumer and commercial business loans. Of the $15.7 million of substandard loans which were real estate secured, $1.1 million were construction and land loans. The $1.1 million in substandard construction and land loans were land loans made to individuals of which $734,000 was on nonaccrual status. Also included in the total of substandard real estate secured loans at June 30, 2013 was $3.4 million of commercial real estate loans and $2.3 million of multi-family loans, secured by property located in Washington and Oregon. The balance of our substandard real estate secured loans at June 30, 2013 was $8.9 million, which consisted of loans secured by one-to-four family properties, and an additional $1.0 million in home equity loans.
Potential Problem Loans. Potential problem loans are loans that do not yet meet the criteria for identification as classified assets graded as substandard or doubtful, but where known information about the borrower causes management to have serious concerns about the ability of the borrower to comply with present loan repayment terms and may result in the loan being included as a classified asset for future periods. At June 30, 2013, we had $39.3 million, or 14.2% of our net loans that were identified as potential problem loans compared to $41.2 million or 13.9% of our net loans at June 30, 2012.
Within these problem loans were the following lending relationships:
• | a loan of $4.8 million secured by a church in Washington; |
19
Table of Contents
• | a relationship of $4.3 million in four loans secured by multi-family property in Washington; |
• | a relationship of $3.7 million in two loans secured by residential condominiums and commercial office property in Oregon; |
• | a relationship of $2.2 million in two term loans secured by multi-family property in Oregon; |
• | a loan of $2.0 million secured by commercial real estate in Washington; |
• | a loan of $1.9 million secured by commercial real estate in Washington; and |
• | a loan of $1.4 million secured by accounts receivable and inventory of a wood preservation company in Washington. |
The seven relationships described above comprise $20.3 million, or 51.7% of the potential problem loans that were identified as of June 30, 2013. All of the loans identified above are located in Western Washington and/or Portland, Oregon and were in compliance with their repayment terms at June 30, 2013.
Allowance for Loan Losses. Management recognizes that loan losses may occur over the life of a loan and that the allowance for loan losses must be maintained at a level necessary to absorb specific losses on impaired loans and probable losses inherent in the loan portfolio. Our Chief Lending Officer assesses the allowance for loan and lease losses on a monthly basis and reports to the Board of Directors no less than quarterly. The assessment includes analysis of several different factors, including delinquency, charge-off rates and the changing risk profile of our loan portfolio, as well as local economic conditions such as unemployment rates, bankruptcies and vacancy rates of business and residential properties.
We believe that the accounting estimate related to the allowance for loan losses is a critical accounting estimate because it is highly susceptible to change from period to period and requires management to make assumptions about probable losses inherent in the loan portfolio. The impact of a sudden large loss could deplete the allowance and potentially require increased provisions to replenish the allowance, which would negatively affect earnings.
Our methodology for analyzing the allowance for loan losses consists of two components: formula and specific allowances. The formula allowance is determined by applying an estimated loss percentage to various groups of loans. The loss percentages are generally based on various historical measures such as the amount and type of classified loans, past due ratios and loss experience, which could affect the collectibility of the respective loan types.
The specific allowance component is created when management believes that the collectibility of a specific large loan, such as a real estate, multi-family or commercial real estate loan, has been impaired and a loss is probable.
The allowance is increased by the provision for loan losses, which is charged against current period earnings and decreased by the amount of actual loan charge-offs, net of recoveries.
The provision for loan losses was $750,000 and $2.7 million for the years ended June 30, 2013 and 2012, respectively. We decreased the provision primarily as a result of the decrease in loan delinquencies, in particular our higher risk nonperforming construction loans. The specific risks that are considered in our analysis for determining the provision for loan losses include an automatic elevation in risk grade and corresponding reserve requirement based on loan payment and payment delinquencies, including debt to the borrower and related entities under loans to one borrower guidelines; and a qualitative analysis of the economic and portfolio trends. The provision for loan losses for the year ended June 30, 2013 included an incremental component, a qualitative component, and specific reserve as a result of impairment analysis. The total allowance for loan losses was $5.1 million and $7.1 million at June 30, 2013 and 2012, respectively. Of the total allowance at June 30, 2013, specific reserves decreased to $1.3 million and general reserves decreased to $3.8 million from specific reserves of $1.9 million and general reserves of $5.2 million, respectively, at June 30, 2012. Included in the general reserve amount of $3.8 million at June 30, 2013 was $1.1 million based on incremental changes in asset quality and $500,000 based on qualitative analysis.
The decrease in the provision for loan losses was a result of the decrease in delinquent and classified loans, and loan charge-offs together with our recognition of qualitative factors. We continually monitor the market conditions reported at national, regional, and local levels including those from the FDIC, Case-Schiller, and Realtor Boards. Delinquent residential lot loans decreased to $734,000, or 0.25% of total loans at June 30, 2013, compared to $3.4 million, or 1.14% of total loans at June 30, 2012. Qualitative factors developed from this analysis along with the incremental changes discussed above resulted in an increase to the provision for the period.
Levels and trends in delinquencies and nonperforming loans have decreased during the year ended June 30, 2013. During the current economic cycle, we have experienced changes in our portfolio with respect to delinquent, nonperforming and impaired
20
Table of Contents
loans. At June 30, 2013 and June 30, 2012, our total delinquent loans, including loans 30 or more days past due, were $10.2 million and $14.2 million, respectively, which included nonperforming loans of $6.2 million and $8.7 million, respectively. Net charge-offs during the years ended June 30, 2013 and June 30, 2012 were $2.7 million and $2.9 million, respectively.
Management identifies a loan as impaired when the source of repayment of the loan is recognized as being in jeopardy, such that economic or other changes have affected the borrower to the extent that it may not be able to meet repayment terms, and that resources available to the borrower, including the liquidation of collateral, may be insufficient. Impairment is measured on a loan-by-loan basis for each loan based upon its source or sources of repayment. For collateral dependent loans management utilizes the valuation from an appraisal obtained within the last six months in establishing the allowance for loan losses, unless additional information known to management results in management applying a downward adjustment to the valuation. Appraisals are updated subsequent to the time of origination when management identifies a loan as impaired or potentially being impaired, as indicated by the borrower's payment and loan covenant performance, an analysis of the borrower's financial condition, property tax and/or assessment delinquency, increases in deferred maintenance or other information known to management. When the results of the impairment analysis indicate a potential loss, the loan is classified as substandard and a specific reserve is established for such loan in the amount determined. Further, the specific reserve amount is adjusted to reflect any further deterioration in the value of the collateral that may occur prior to liquidation or reinstatement. The impairment analysis takes into consideration the primary, secondary, and tertiary sources of repayment, whether impairment is likely to be temporary in nature or liquidation is anticipated.
Our nonperforming loans include collateral secured and unsecured loans, which totaled $6.2 million and $8.7 million at June 30, 2013 and 2012, respectively. At June 30, 2013, our nonperforming loans secured by first mortgage liens consisted of $734,000 in residential land loans and $4.8 million of one-to-four family mortgage loans.
The remainder of our nonperforming loans at June 30, 2013 and 2012 included secured and unsecured credits from our consumer and commercial business loan portfolios, totaling $667,000 and $3.4 million, respectively.
During the year ended June 30, 2013, we recorded a provision for loan losses which was significantly less than the provision for loan losses we recorded for the year ended June 30, 2012. The decreased provision for 2013 was primarily a result of decreased loan delinquencies and loan charge-off amounts.
The allowance for loan losses was $5.1 million or 1.8% of total loans at June 30, 2013 as compared to $7.1 million or 2.4% of total loans outstanding at June 30, 2012. The level of the allowance is based on estimates, and the ultimate losses may vary from the estimates. Management will continue to review the adequacy of the allowance for loan losses and make adjustments to the provision for loan losses based on loan growth, economic conditions, charge-offs and portfolio composition. For the years ended June 30, 2013 and 2012 the provision for loan losses was $750,000 and $2.7 million, respectively.
A loan is considered impaired when we have determined that we may be unable to collect payments of principal and/or interest when due under the terms of the loan. In the process of identifying loans as impaired, management takes into consideration factors which include payment history and status, collateral value, financial condition of the borrower, and the probability of collecting scheduled payments in the future. Minor payment delays and insignificant payment shortfalls typically do not result in a loan being classified as impaired. The significance of payment delays and shortfalls is considered by management on a case by case basis, after taking into consideration the totality of circumstances surrounding the loans and the borrowers, including payment history and amounts of any payment shortfall, length and reason for delay, and likelihood of return to stable performance.
Impairment is measured on a loan by loan basis for all loans in the portfolio except for the smaller groups of homogeneous consumer loans in the portfolio.
As of June 30, 2013 and 2012, we had impaired loans of $23.6 million and $23.8 million, respectively. Included within the impaired loan totals are loans identified as troubled debt restructures. At June 30, 2013 and 2012, the aggregate amount of troubled debt restructure loans with valuation allowances were $17.5 million and $15.1 million, respectively.
21
Table of Contents
The following table summarizes the distribution of the allowance for loan losses by loan category:
| At June 30, | |||||||||||||||||||||||||||||||||||||||||||||||||||||
| 2013 |
| 2012 |
| 2011 |
| 2010 |
| 2009 | |||||||||||||||||||||||||||||||||||||||||||||
| Loan Balance |
| Amount by Loan Category |
| Percent of Loans in Loan Category to total Loans |
| Loan Balance |
| Amount by Loan Category |
| Percent of Loans in Loan Category to total Loans |
| Loan Balance |
| Amount by Loan Category |
| Percent of Loans in Loan Category to total Loans |
| Loan Balance |
| Amount by Loan Category |
| Percent of Loans in Loan Category to total Loans |
| Loan Balance |
| Amount by Loan Category |
| Percent of Loans in Loan Category to total Loans | |||||||||||||||||||||||||
| (Dollars in thousands) | |||||||||||||||||||||||||||||||||||||||||||||||||||||
Real estate: |
| |||||||||||||||||||||||||||||||||||||||||||||||||||||
One-to-four family | $ | 73,901 | |
| $ | 1,393 | |
| 26.1 | % |
| $ | 82,709 | |
| $ | 1,659 | |
| 28.0 | % |
| $ | 97,133 | |
| $ | 1,980 | |
| 29.1 | % |
| $ | 112,835 | |
| $ | 2,975 | |
| 27.7 | % |
| $ | 114,823 | |
| $ | 861 | |
| 22.9 | % |
Multi-family | 38,425 | |
| 156 | |
| 13.6 | |
| 42,032 | |
| 238 | |
| 14.2 | |
| 42,608 | |
| 88 | |
| 12.8 | |
| 45,983 | |
| 552 | |
| 11.3 | |
| 52,661 | |
| 632 | |
| 10.5 | | ||||||||||
Commercial | 106,859 | |
| 671 | |
| 37.7 | |
| 97,306 | |
| 578 | |
| 32.9 | |
| 105,997 | |
| 173 | |
| 31.8 | |
| 118,492 | |
| 1,422 | |
| 29.1 | |
| 123,902 | |
| 1,487 | |
| 24.7 | | ||||||||||
Construction | 5,641 | |
| 356 | |
| 2.0 | |
| 6,696 | |
| 148 | |
| 2.3 | |
| 11,650 | |
| 1,163 | |
| 3.5 | |
| 36,812 | |
| 7,952 | |
| 9.0 | |
| 106,163 | |
| 16,558 | |
| 21.2 | | ||||||||||
Land loans | 5,330 | |
| 531 | |
| 1.9 | |
| 7,062 | |
| 368 | |
| 2.4 | |
| 6,723 | |
| 191 | |
| 2.0 | |
| 7,843 | |
| 157 | |
| 1.9 | |
| 9,211 | |
| 184 | |
| 1.8 | | ||||||||||
Total real estate | 230,156 | |
| 3,107 | |
| 81.2 | |
| 235,805 | |
| 2,991 | |
| 79.8 | |
| 264,111 | |
| 3,595 | |
| 79.2 | |
| 321,965 | |
| 13,058 | |
| 79.1 | |
| 406,760 | |
| 19,722 | |
| 81.2 | | ||||||||||
Consumer: |
|
|
|
|
|
|
| |
|
| |
|
| |
|
| |
|
| |
|
| |
|
| |
|
| |
|
| |
|
| |
|
| |
|
| | |||||||||||||
Home equity | 25,835 | |
| 376 | |
| 9.1 | |
| 31,504 | |
| 681 | |
| 10.7 | |
| 35,729 | |
| 739 | |
| 10.7 | |
| 42,446 | |
| 1,818 | |
| 10.4 | |
| 49,028 | |
| 368 | |
| 9.8 | | ||||||||||
Credit cards | 4,741 | |
| 283 | |
| 1.7 | |
| 5,180 | |
| 328 | |
| 1.8 | |
| 7,101 | |
| 568 | |
| 2.1 | |
| 7,943 | |
| 477 | |
| 2.0 | |
| 8,617 | |
| 517 | |
| 1.7 | | ||||||||||
Automobile | 1,850 | |
| 103 | |
| 0.7 | |
| 3,342 | |
| 373 | |
| 1.1 | |
| 5,547 | |
| 675 | |
| 1.7 | |
| 8,884 | |
| 533 | |
| 2.2 | |
| 14,016 | |
| 841 | |
| 2.8 | | ||||||||||
Other | 2,723 | |
| 55 | |
| 1.0 | |
| 2,968 | |
| 126 | |
| 1.0 | |
| 3,595 | |
| 153 | |
| 1.1 | |
| 4,160 | |
| 250 | |
| 1.0 | |
| 5,142 | |
| 309 | |
| 1.0 | | ||||||||||
Total consumer | 35,149 | |
| 817 | |
| 12.4 | |
| 42,994 | |
| 1,508 | |
| 14.6 | |
| 51,972 | |
| 2,135 | |
| 15.6 | |
| 63,433 | |
| 3,078 | |
| 15.6 | |
| 76,803 | |
| 2,035 | |
| 15.3 | | ||||||||||
Commercial business | 18,211 | |
| 1,172 | |
| 6.4 | |
| 16,618 | |
| 2,558 | |
| 5.6 | |
| 17,268 | |
| 1,509 | |
| 5.2 | |
| 21,718 | |
| 652 | |
| 5.3 | |
| 17,172 | |
| 206 | |
| 3.4 | | ||||||||||
Unallocated | - | |
| 51 | |
| - | |
| - | |
| - | |
| - | |
| - | |
| - | |
| - | |
| - | |
| - | |
| - | |
| - | |
| 2,500 | |
| - | | ||||||||||
Total | $ | 283,516 | |
| $ | 5,147 | |
| 100.0 | % |
| $ | 295,417 | |
| $ | 7,057 | |
| 100.0 | % |
| $ | 333,351 | |
| $ | 7,239 | |
| 100.0 | % |
| $ | 407,116 | |
| $ | 16,788 | |
| 100.0 | % |
| $ | 500,735 | |
| $ | 24,463 | |
| 100.0 | % |
Management believes that it uses the best information available to determine the allowance for loan losses. However, unforeseen market conditions could result in adjustments to the allowance for loan losses and net income could be significantly affected, if circumstances differ substantially from the assumptions used in determining the allowance.
22
Table of Contents
The following table sets forth an analysis of our allowance for loan losses at the dates and for the periods indicated:
| Year Ended June 30, | ||||||||||||||||||
| 2013 |
| 2012 |
| 2011 |
| 2010 |
| 2009 | ||||||||||
| (Dollars in thousands) | ||||||||||||||||||
Allowance at beginning of period | $ | 7,057 | |
| $ | 7,239 | |
| $ | 16,788 | |
| $ | 24,463 | |
| $ | 7,485 | |
Provision for loan losses | 750 | |
| 2,735 | |
| 8,078 | |
| 2,615 | |
| 20,263 | | |||||
Recoveries: |
|
|
| |
|
| |
|
| |
|
| | ||||||
Real estate loans: |
|
|
| |
|
| |
|
| |
|
| | ||||||
One-to-four family | 143 | |
| 498 | |
| 238 | |
| 146 | |
| 3 | | |||||
Multi-family | - | |
| - | |
| - | |
| - | |
| 20 | | |||||
Commercial | 201 | |
| 18 | |
| 5 | |
| - | |
| - | | |||||
Construction | 43 | |
| 271 | |
| 502 | |
| - | |
| - | | |||||
Land loans | - | |
| - | |
| - | |
| - | |
| - | | |||||
Total real estate | 387 | |
| 787 | |
| 745 | |
| 146 | |
| 23 | | |||||
Consumer: |
|
|
| |
|
| |
|
| |
|
| | ||||||
Home equity | 57 | |
| 20 | |
| 9 | |
| 1 | |
| 3 | | |||||
Credit cards | 51 | |
| 121 | |
| 98 | |
| 55 | |
| 45 | | |||||
Automobile | 23 | |
| 20 | |
| 62 | |
| 95 | |
| 33 | | |||||
Other | 68 | |
| 22 | |
| 27 | |
| 39 | |
| - | | |||||
Total consumer | 199 | |
| 183 | |
| 196 | |
| 190 | |
| 81 | | |||||
Commercial business | 37 | |
| 131 | |
| 3 | |
| - | |
| - | | |||||
Total recoveries | 623 | |
| 1,101 | |
| 944 | |
| 336 | |
| 104 | | |||||
Charge-offs: |
|
|
| |
|
| |
|
| |
|
| | ||||||
Real estate loans: |
|
|
| |
|
| |
|
| |
|
| | ||||||
One-to-four family | 416 | |
| 1,465 | |
| 3,003 | |
| 747 | |
| 283 | | |||||
Multi-family | - | |
| - | |
| - | |
| - | |
| - | | |||||
Commercial | - | |
| 571 | |
| 584 | |
| 31 | |
| - | | |||||
Construction | 105 | |
| 561 | |
| 8,915 | |
| 4,970 | |
| 2,086 | | |||||
Land loans | - | |
| - | |
| - | |
| 2,836 | |
| - | | |||||
Total real estate | 521 | |
| 2,597 | |
| 12,502 | |
| 8,584 | |
| 2,369 | | |||||
Consumer: |
|
|
| |
|
| |
|
| |
|
| | ||||||
Home equity | 356 | |
| 337 | |
| 465 | |
| 847 | |
| 222 | | |||||
Credit cards | 212 | |
| 492 | |
| 591 | |
| 605 | |
| 374 | | |||||
Automobile | 30 | |
| 59 | |
| 55 | |
| 254 | |
| 17 | | |||||
Other | 633 | |
| 470 | |
| 777 | |
| 336 | |
| 407 | | |||||
Total consumer | 1,231 | |
| 1,358 | |
| 1,888 | |
| 2,042 | |
| 1,020 | | |||||
Commercial business | 1,531 | |
| 63 | |
| 4,181 | |
| - | |
| - | | |||||
Total charge-offs | 3,283 | |
| 4,018 | |
| 18,571 | |
| 10,626 | |
| 3,389 | | |||||
Net charge-offs | 2,660 | |
| 2,917 | |
| 17,627 | |
| 10,290 | |
| 3,285 | | |||||
Balance at end of period | $ | 5,147 | |
| $ | 7,057 | |
| $ | 7,239 | |
| $ | 16,788 | |
| $ | 24,463 | |
Allowance for loan losses as a percentage of total loans outstanding at the end of the period | 1.8 | % |
| 2.4 | % |
| 2.2 | % |
| 4.1 | % |
| 4.9 | % | |||||
Net charge-offs as a percentage of average total loans outstanding during the period | 0.9 | % |
| 0.9 | % |
| 4.7 | % |
| 2.3 | % |
| 0.6 | % | |||||
Allowance for loan losses as a percentage of nonperforming loans at the end of period | 83.6 | % |
| 80.9 | % |
| 51.1 | % |
| 81.3 | % |
| 40.3 | % | |||||
23
Table of Contents
Our Executive Loan Committee reviews the appropriate level of the allowance for loan losses on a quarterly basis and establishes the provision for loan losses based on the risk composition of our loan portfolio, delinquency levels, loss experience, economic conditions, bank regulatory examination results, seasoning of the loan portfolios and other factors related to the collectability of the loan portfolio as detailed further in this Form 10-K under Item 7. "Management's Discussion and Analysis of Financial Condition and Results of Operations – Critical Accounting Policies – Allowance for Loan Losses." The allowance is increased by the provision for loan losses, which is charged against current period operating results and decreased by the amount of actual loan charge-offs, net of recoveries.
Management believes that our allowance for loan losses as of June 30, 2013 was adequate to absorb the known and inherent risks of loss in the loan portfolio at that date. While management believes the estimates and assumptions used in its determination of the adequacy of the allowance are reasonable, there can be no assurance that such estimates and assumptions will not be proven incorrect in the future, or that the actual amount of future provisions will not exceed the amount of past provisions or that any increased provision that may be required will not adversely impact our financial condition and results of operations. In addition, the determination of the amount of our allowance for loan losses is subject to review by bank regulators, as part of the routine examination process, which may result in the establishment of additional reserves based upon their judgment of information available to them at the time of their examination.
The following table provides certain information with respect to our allowance for loan losses, including charge-offs, recoveries and selected ratios for the periods indicated.
| Year Ended June 30, | ||||||||||||||||||
| 2013 |
| 2012 |
| 2011 |
| 2010 |
| 2009 | ||||||||||
| (Dollars in thousands) | ||||||||||||||||||
Provision for loan losses | $ | 750 | |
| $ | 2,735 | |
| $ | 8,078 | |
| $ | 2,615 | |
| $ | 20,263 | |
Allowance for loan losses | 5,147 | |
| 7,057 | |
| 7,239 | |
| 16,788 | |
| 24,463 | | |||||
Allowance for loan losses as a percentage of total loans outstanding at the end of the period | 1.8 | % |
| 2.4 | % |
| 2.2 | % |
| 4.1 | % |
| 4.9 | % | |||||
Net charge-offs | 2,660 | |
| 2,917 | |
| 17,627 | |
| 10,290 | |
| 3,285 | | |||||
Total of nonaccrual and 90 days past due loans | 6,159 | |
| 8,722 | |
| 14,169 | |
| 20,642 | |
| 60,649 | | |||||
Allowance for loan losses as a percentage of nonperforming loans at end of period | 83.6 | % |
| 80.9 | % |
| 51.1 | % |
| 81.3 | % |
| 40.3 | % | |||||
Nonaccrual and 90 days or more past due loans as a percentage of loans receivable | 2.2 | % |
| 3.0 | % |
| 4.3 | % |
| 5.1 | % |
| 12.1 | % | |||||
Total loans | $ | 283,516 | |
| $ | 295,417 | |
| $ | 333,351 | |
| $ | 407,116 | |
| $ | 500,735 | |
Investment Activities
General. Under Washington law, savings banks are permitted to invest in various types of liquid assets, including U.S. Treasury obligations, securities of various federal agencies, certain certificates of deposit of insured banks and savings institutions, banker's acceptances, repurchase agreements, federal funds, commercial paper, investment grade corporate debt securities, and obligations of states and their political sub-divisions.
The Investment Committee has the authority and responsibility to administer our investment policy, monitor portfolio strategies, and recommend appropriate changes to policy and strategies to the Board. On a monthly basis, our management reports to the Board a summary of investment holdings with respective market values, and all purchases and sales of investments. The Chief Financial Officer has the primary responsibility for the management of the investment portfolio. The Chief Financial Officer considers various factors when making decisions regarding proposed investments, including the marketability, maturity and tax consequences. The maturity structure of investments will be affected by various market conditions, including the current and anticipated slope of the yield curve, the level of interest rates, the trend of new deposit inflows and the anticipated demand for funds via deposit withdrawals and loan originations and purchases.
The general objectives of the investment portfolio are to provide liquidity when loan demand is high, to assist in maintaining earnings when loan demand is low and to maximize earnings while satisfactorily managing risk, including credit risk, reinvestment risk, liquidity risk and interest rate risk.
24
Table of Contents
At June 30, 2013, our investment portfolio consisted principally of mortgage-backed securities, U.S. Government Agency obligations, municipal bonds and mutual funds consisting of mortgage-backed securities. From time to time, investment levels may increase or decrease depending upon yields available on investment opportunities and management's projected demand for funds for loan originations, deposits and other activities.
Mortgage-Backed Securities . The mortgage-backed securities in our investment portfolio were comprised of Freddie Mac, Fannie Mae and Ginnie Mae mortgage-backed securities. At June 30, 2013, the amortized cost of mortgage-backed securities held in the available-for-sale category was $47.8 million with a weighted average yield of 1.41%, while the mortgage-backed securities in the held-to-maturity category was $10.2 million with a weighted average yield of 2.57%.
Municipal Bonds . The tax-exempt and taxable municipal bond portfolios were comprised of general obligation bonds ( i.e. , backed by the general credit of the issuer) and revenue bonds ( i.e. , backed by revenues from the specific project being financed) issued by various municipal corporations. All bonds are rated "A" or better and are from issuers located within the State of Washington. The weighted average yield on the tax exempt bonds (on a tax equivalent basis) was 4.94% at June 30, 2013, and the total amount of our municipal bonds was $1.6 million at that date, of which $1.4 million was available-for-sale and the remaining balance categorized as held-to-maturity.
Federal Home Loan Bank Stock. As a member of the FHLB of Seattle, we are required to own capital stock in the FHLB of Seattle. The amount of stock we hold is based on guidelines specified by the FHLB of Seattle. The redemption of any excess stock we hold is at the discretion of the FHLB of Seattle. The carrying value of FHLB stock was $6.3 million at June 30, 2013.
Our investment in FHLB stock is carried at cost, which approximates fair value. As a member of the FHLB System, we are required to maintain a minimum level of investment in FHLB stock based on specific percentages of our outstanding mortgages, total assets, or FHLB advances. At both June 30, 2013 and 2012, our minimum investment requirement was approximately $2.9 million. We were in compliance with the FHLB minimum investment requirement at June 30, 2013 and 2012. For the year ended June 30, 2013, we did not receive any dividends from the FHLB.
Bank-Owned Life Insurance. We purchase bank-owned life insurance policies ("BOLI") to offset future employee benefit costs. At June 30, 2013, we had a $18.9 million investment in life insurance contracts. The purchase of BOLI policies, and its increase in cash surrender value, is classified as "Life insurance investment, net of surrender charges" in our Consolidated Statement of Financial Condition. The income related to the BOLI, which is generated by the increase in the cash surrender value of the policy is recorded within "Other Income" in our Consolidated Statement of Operations. See Item 8. "Financial Statements and Supplementary Data" of this Form 10-K for our Consolidated Financial Statements and specifically the Consolidated Statement of Cash Flow and Consolidated Statement of Operations regarding BOLI.
25
Table of Contents
The following table sets forth the composition of our investment portfolio at the dates indicated.
| At June 30, | ||||||||||||||||||||||
| 2013 |
| 2012 |
| 2011 | ||||||||||||||||||
| Amortized Cost |
| Fair Value |
| Amortized Cost |
| Fair Value |
| Amortized Cost |
| Fair Value | ||||||||||||
| (In thousands) | ||||||||||||||||||||||
Available-for-sale: |
|
|
|
|
|
|
|
|
|
|
| ||||||||||||
Securities: |
|
|
|
|
|
|
|
|
|
|
| ||||||||||||
U.S. Government Agency obligations | $ | - | |
| $ | - | |
| $ | - | |
| $ | - | |
| $ | 3,000 | |
| $ | 3,045 | |
Municipal bonds | 1,446 | |
| 1,456 | |
| 1,623 | |
| 1,656 | |
| 2,355 | |
| 2,400 | | ||||||
Mortgage-backed securities: |
|
|
|
|
| |
|
| |
|
| |
|
| | ||||||||
FHLMC | 20,675 | |
| 20,415 | |
| - | |
| - | |
| - | |
| - | | ||||||
FNMA | 25,639 | |
| 24,971 | |
| - | |
| - | |
| - | |
| - | | ||||||
GNMA | 1,499 | |
| 1,466 | |
| - | |
| - | |
| - | |
| - | | ||||||
Total available-for-sale | 49,259 | |
| 48,308 | |
| 48,170 | |
| 48,717 | |
| 35,814 | |
| 38,163 | | ||||||
Held-to-maturity: |
|
|
|
|
| |
|
| |
|
| |
|
| | ||||||||
Securities: |
|
|
|
|
| |
|
| |
|
| |
|
| | ||||||||
Municipal bonds | 135 | |
| 135 | |
| 142 | |
| 142 | |
| 149 | |
| 149 | | ||||||
Mortgage-backed securities: |
|
|
|
|
| |
|
| |
|
| |
|
| | ||||||||
FHLMC | 4,744 | |
| 4,754 | |
| 7,037 | |
| 7,548 | |
| 7,438 | |
| 8,008 | | ||||||
FNMA | 2,931 | |
| 3,048 | |
| - | |
| - | |
| - | |
| - | | ||||||
GNMA | 2,485 | |
| 2,379 | |
| - | |
| - | |
| - | |
| - | | ||||||
Total held-to-maturity | 10,295 | |
| 10,316 | |
| 7,179 | |
| 7,690 | |
| 7,587 | |
| 8,157 | | ||||||
Total securities | $ | 59,554 | |
| $ | 58,624 | |
| $ | 55,349 | |
| $ | 56,407 | |
| $ | 43,401 | |
| $ | 46,320 | |
26
Table of Contents
The table below sets forth information regarding the amortized cost, weighted average yields and maturities or call dates of Anchor Bank's investment portfolio at June 30, 2013:
|
|
| At June 30, 2013 | |||||||||||||||||||||||||||||||||||||||||||||
| At June 30, 2013 |
| One Year or Less |
| Over One to Five Years |
| Over Five to Ten Years |
| Over Ten Years |
| Mortgage-Backed Securities |
| Totals | |||||||||||||||||||||||||||||||||||
| Amortized Cost |
| Weighted Average Yield |
| Amortized Cost |
| Weighted Average Yield |
| Amortized Cost |
| Weighted Average Yield |
| Amortized Cost |
| Weighted Average Yield |
| Amortized Cost |
| Weighted Average Yield |
| MBS Securities Amortized Cost |
| Weighted Average Yield |
| Amortized Cost |
| Weighted Average Yield | |||||||||||||||||||||
| (Dollars in thousands) | |||||||||||||||||||||||||||||||||||||||||||||||
Available-for-sale: |
|
|
|
|
|
|
|
|
|
|
|
|
|
|
|
|
|
|
|
|
|
|
|
|
|
|
| |||||||||||||||||||||
Securities: |
|
|
|
|
|
|
|
|
|
|
|
|
|
|
|
|
|
|
|
|
|
|
|
|
|
|
| |||||||||||||||||||||
Municipal bonds (1) | $ | 1,446 | |
| 4.24 | % |
| $ | - | |
| - | % |
| $ | 600 | |
| 4.17 | % |
| $ | 645 | |
| 5.25 | % |
| $ | 201 | |
| 6.23 | % |
| $ | - | |
| - | % |
| $ | 1,446 | |
| 4.24 | % |
Mortgage-backed securities: |
|
|
|
|
|
|
|
|
|
|
|
|
|
|
|
|
|
|
|
|
|
|
|
|
|
|
| |||||||||||||||||||||
FHLMC | 20,675 | |
| 1.82 | |
| - | |
| - | |
| - | |
| - | |
| - | |
| - | |
| - | |
| - | |
| 20,675 | |
| 1.82 | |
| 20,675 | |
| 1.82 | | |||||||
FNMA | 25,639 | |
| 1.11 | |
| - | |
| - | |
| - | |
| - | |
| - | |
| - | |
| - | |
| - | |
| 25,639 | |
| 1.11 | |
| 25,639 | |
| 1.11 | | |||||||
GNMA | 1,499 | |
| 0.88 | |
| - | |
| - | |
| - | |
| - | |
| - | |
| - | |
| - | |
| - | |
| 1,499 | |
| 0.88 | |
| 1,499 | |
| 0.88 | | |||||||
Total available-for-sale | 49,259 | |
|
|
| - | |
|
|
| 600 | |
|
|
| 645 | |
|
|
| 201 | |
|
|
| 47,813 | |
|
|
| 49,259 | |
|
| ||||||||||||||
Held-to-maturity: |
|
|
|
|
|
|
|
|
|
|
|
|
|
|
|
|
|
|
|
|
|
|
|
|
|
|
| |||||||||||||||||||||
Securities: |
|
|
|
|
|
|
|
|
|
|
|
|
|
|
|
|
|
|
|
|
|
|
|
|
|
|
| |||||||||||||||||||||
Municipal bonds (1) | 135 | |
| 6.38 | |
| - | |
| - | |
| - | |
| - | |
| - | |
| - | |
| 135 | |
| 6.38 | |
| - | |
| - | |
| 135 | |
| 6.38 | | |||||||
Mortgage-backed securities: |
|
|
|
|
|
|
|
|
|
|
|
|
|
|
|
|
|
|
|
|
|
|
|
|
|
|
| |||||||||||||||||||||
FHLMC | 4,744 | |
| 2.35 | |
| - | |
| - | |
| - | |
| - | |
| - | |
| - | |
| - | |
| - | |
| 4,744 | |
| 2.35 | |
| 4,744 | |
| 2.35 | | |||||||
FNMA | 2,931 | |
| 3.82 | |
| - | |
| - | |
| - | |
| - | |
| - | |
| - | |
| - | |
| - | |
| 2,931 | |
| 3.82 | |
| 2,931 | |
| 3.82 | | |||||||
GNMA | 2,485 | |
| 1.54 | |
| - | |
| - | |
| - | |
| - | |
| - | |
| - | |
| - | |
| - | |
| 2,485 | |
| 1.54 | |
| 2,485 | |
| 1.54 | | |||||||
Total held-to-maturity | 10,295 | |
|
|
| - | |
|
|
| - | |
|
|
| - | |
|
|
| 135 | |
|
|
| 10,160 | |
|
|
| 10,295 | |
|
| ||||||||||||||
Total | $ | 59,554 | |
|
|
| $ | - | |
|
|
| $ | 600 | |
|
|
| $ | 645 | |
|
|
| $ | 336 | |
|
|
| $ | 57,973 | |
|
|
| $ | 59,554 | |
|
| |||||||
(1) Yields on tax exempt obligations are computed on a tax equivalent basis.
27
Table of Contents
Deposit Activities and Other Sources of Funds
General . Deposits and loan repayments are the major sources of our funds for lending and other investment purposes. Scheduled loan repayments are a relatively stable source of funds, while deposit inflows and outflows and loan prepayments are influenced significantly by general interest rates and market conditions. Borrowings from the FHLB of Seattle are used to supplement the availability of funds from other sources and also as a source of term funds to assist in the management of interest rate risk.
Our deposit composition reflects a mixture with certificates of deposit accounting for approximately one-half of the total deposits and interest and noninterest-bearing checking, savings and money market accounts comprising the balance of total deposits. We rely on marketing activities, convenience, customer service and the availability of a broad range of deposit products and services to attract and retain customer deposits.
Deposits. Substantially all of our depositors are residents of Washington State. Deposits are attracted from within our market area through the offering of a broad selection of deposit instruments, including checking accounts, money market deposit accounts, savings accounts and certificates of deposit with a variety of rates. Deposit account terms vary according to the minimum balance required, the time periods the funds must remain on deposit and the interest rate, among other factors. In determining the terms of our deposit accounts, we consider the development of long term profitable customer relationships, current market interest rates, current maturity structure and deposit mix, our customer preferences and the profitability of acquiring customer deposits compared to alternative sources.
At June 30, 2013, we had $70.3 million of jumbo ($100,000 or more) retail certificates of deposit. We also had $8.0 million in public funds, which represented 2.4% of total deposits at June 30, 2013. Anchor Bank had no brokered deposits at June 30, 2013.
In the unlikely event we are liquidated, depositors will be entitled to full payment of their deposit accounts prior to any payment being made to Anchor Bancorp, as the sole shareholder of Anchor Bank.
Deposit Activities. The following table sets forth our total deposit activities for the periods indicated:
| Year Ended June 30, | ||||||||||
| 2013 |
| 2012 |
| 2011 | ||||||
| (In thousands) | ||||||||||
Beginning balance | $ | 345,798 | |
| $ | 339,474 | |
| $ | 355,788 | |
Net deposits (withdrawals) before interest credited | (20,736 | ) |
| 1,606 | |
| (22,144 | ) | |||
Interest credited | 3,522 | |
| 4,718 | |
| 5,830 | | |||
Net increase (decrease) in deposits | (17,214 | ) |
| 6,324 | |
| (16,314 | ) | |||
Ending balance | $ | 328,584 | |
| $ | 345,798 | |
| $ | 339,474 | |
28
Table of Contents
The following table sets forth information concerning our time deposits and other deposits at June 30, 2013:
Weighted Average Interest Rate |
|
|
|
|
|
|
|
|
| Percentage of Total Deposits | ||||
|
|
|
|
|
|
| Minimum Balance |
| ||||||
| Term |
| Category |
| Amount |
|
| |||||||
|
|
|
|
|
| (In thousands) |
|
|
|
| ||||
- |
| N/A |
| Savings accounts |
| $ | 36,518 | |
| 100 | |
| (11.1 | )% |
- |
| N/A |
| Demand deposit accounts |
| 59,780 | |
| 10 | |
| (18.2 | ) | |
- |
| N/A |
| Money market accounts |
| 82,603 | |
| 1,000 | |
| (25.1 | ) | |
|
|
|
|
|
|
|
|
|
|
| ||||
|
|
|
| Certificates of Deposit |
|
|
|
|
|
| ||||
0.10 |
| 6 month |
| Fixed-term, fixed rate |
| 2,284 | |
| 500 | |
| (0.7 | ) | |
0.32 |
| 9-12 month |
| Fixed-term, fixed rate |
| 13,822 | |
| 500 | |
| (4.2 | ) | |
0.33 |
| 13-16 month |
| Fixed-term, fixed rate |
| 629 | |
| 500 | |
| (0.2 | ) | |
0.48 |
| 18-20 month |
| Fixed term-fixed or variable rate |
| 11,462 | |
| 500 | |
| (3.5 | ) | |
0.62 |
| 24 month |
| Fixed term-fixed or variable rate |
| 20,741 | |
| 2,000 | |
| (6.3 | ) | |
1.19 |
| 30-36 month |
| Fixed term-fixed or variable rate |
| 7,451 | |
| 500 | |
| (2.3 | ) | |
1.73 |
| 48 month |
| Fixed term-fixed or variable rate |
| 4,419 | |
| 500 | |
| (1.3 | ) | |
2.09 |
| 60 month |
| Fixed term-fixed or variable rate |
| 8,683 | |
| 500 | |
| (2.6 | ) | |
3.26 |
| 96 month |
| Fixed term-fixed or variable rate |
| 70,659 | |
| 500 | |
| (21.5 | ) | |
0.57 |
| Other |
| Fixed term-fixed or variable rate |
| 9,533 | |
| 500 | |
| (2.9 | ) | |
|
|
|
| Total |
| $ | 149,683 | |
|
| |
| (100.0 | )% |
Time Deposits by Rate. The following table sets forth our time deposits classified by rates as of the dates indicated:
| At June 30, | ||||||||||
| 2013 |
| 2012 |
| 2011 | ||||||
| (In thousands) | ||||||||||
0.00 - 0.99% | $ | 57,443 | |
| $ | 40,996 | |
| $ | 22,996 | |
1.00 - 1.99 | 19,946 | |
| 51,994 | |
| 71,215 | | |||
2.00 - 2.99 | 21,169 | |
| 23,898 | |
| 26,068 | | |||
3.00 - 3.99 | 44,565 | |
| 46,364 | |
| 50,615 | | |||
4.00 - 4.99 | 6,167 | |
| 7,555 | |
| 9,932 | | |||
5.00 - 5.99 | 393 | |
| 391 | |
| 693 | | |||
Total | $ | 149,683 | |
| $ | 171,198 | |
| $ | 181,519 | |
29
Table of Contents
Time Deposit Certificates. The following table sets forth the amount and maturities of time deposit certificates at June 30, 2013:
| Amount Due | ||||||||||||||||||||||
| Within 1 Year |
| After 1 Year Through 2 Years |
| After 2 Years Through 3 Years |
| After 3 Years Through 4 Years |
| Beyond 4 Years |
| Total | ||||||||||||
| (In thousands) | ||||||||||||||||||||||
0.00 - 0.99% | $ | 40,134 | |
| $ | 14,787 | |
| $ | 1,122 | |
| $ | 709 | |
| $ | 691 | |
| $ | 57,443 | |
1.00 - 1.99 | 8,233 | |
| 1,727 | |
| 1,087 | |
| 2,985 | |
| 5,914 | |
| 19,946 | | ||||||
2.00 - 2.99 | 1,123 | |
| 1,664 | |
| 2,101 | |
| 299 | |
| 15,982 | |
| 21,169 | | ||||||
3.00 - 3.99 | 881 | |
| - | |
| 772 | |
| 5,577 | |
| 37,335 | |
| 44,565 | | ||||||
4.00 - 4.99 | 1,110 | |
| 318 | |
| 4,211 | |
| 528 | |
| - | |
| 6,167 | | ||||||
5.00 - 5.99 | 252 | |
| - | |
| 141 | |
| - | |
| - | |
| 393 | | ||||||
Total | $ | 51,733 | |
| $ | 18,496 | |
| $ | 9,434 | |
| $ | 10,098 | |
| $ | 59,922 | |
| $ | 149,683 | |
The following table indicates the amount of our jumbo certificates of deposit by time remaining until maturity as of June 30, 2013. Jumbo certificates of deposit are certificates in amounts of $100,000 or more.
|
| Time Deposit Certificates | ||
Maturity Period |
| |||
|
| (In thousands) | ||
|
|
| ||
Three months or less |
| $ | 8,301 | |
Over three through six months |
| 5,481 | | |
Over six through twelve months |
| 9,476 | | |
Over twelve months |
| 47,001 | | |
Total |
| $ | 70,259 | |
Deposits. The following table sets forth the balances of deposits in the various types of accounts we offered at the dates indicated:
| At June 30, | |||||||||||||||||||||||||||
| 2013 |
| 2012 |
| 2011 | |||||||||||||||||||||||
| Amount |
| Percent of Total |
| Increase/ (Decrease) |
| Amount |
| Percent of Total |
| Increase/ (Decrease) |
| Amount |
| Percent of Total | |||||||||||||
| (Dollars in thousands) | |||||||||||||||||||||||||||
Savings deposits | $ | 36,518 | |
| 11.1 | % |
| $ | 43 | |
| $ | 36,475 | |
| 10.5 | % |
| $ | 4,212 | |
| $ | 32,263 | |
| 9.5 | % |
Demand deposit accounts | 59,780 | |
| 18.2 | |
| 5,405 | |
| 54,375 | |
| 15.7 | |
| 6,700 | |
| 47,675 | |
| 14.0 | | |||||
Money market accounts | 82,603 | |
| 25.1 | |
| (1,147 | ) |
| 83,750 | |
| 24.2 | |
| 5,733 | |
| 78,017 | |
| 23.0 | | |||||
Fixed-rate certificates which mature in the year ending: |
|
|
|
|
|
|
| |
|
| |
|
| |
|
| |
|
| | ||||||||
Within 1 year | 44,522 | |
| 13.5 | |
| (2,298 | ) |
| 46,820 | |
| 13.5 | |
| (5,007 | ) |
| 51,827 | |
| 15.3 | | |||||
After 1 year, but within 2 years | 9,153 | |
| 2.8 | |
| (6,288 | ) |
| 15,441 | |
| 4.5 | |
| 2,029 | |
| 13,412 | |
| 4.0 | | |||||
After 2 years, but within 5 years | 39,413 | |
| 12.0 | |
| 18,119 | |
| 21,294 | |
| 6.2 | |
| 5,083 | |
| 16,211 | |
| 4.8 | | |||||
Certificates maturing thereafter | 40,031 | |
| 12.2 | |
| (16,141 | ) |
| 56,172 | |
| 16.2 | |
| 1,186 | |
| 54,986 | |
| 16.2 | | |||||
Variable rate certificates | 16,564 | |
| 5.0 | |
| (14,907 | ) |
| 31,471 | |
| 9.1 | |
| (13,612 | ) |
| 45,083 | |
| 13.3 | | |||||
Total | $ | 328,584 | |
|
|
| $ | (17,214 | ) |
| $ | 345,798 | |
|
| |
| $ | 6,324 | |
| $ | 339,474 | |
|
| | |
30
Table of Contents
Borrowings. Customer deposits are the primary source of funds for our lending and investment activities. We do, however, use advances from the FHLB of Seattle to supplement our supply of lendable funds, to meet short-term deposit withdrawal requirements and also to provide longer term funding to better match the duration of selected loan and investment maturities.
As one of our capital management strategies, we have used advances from the FHLB of Seattle to fund loan originations in order to increase our net interest income. Depending upon the retail banking activity and the availability of excess capital, we will consider and undertake additional leverage strategies within applicable regulatory requirements or restrictions. Such borrowings would be expected to primarily consist of FHLB of Seattle advances.
As a member of the FHLB of Seattle, we are required to own capital stock in the FHLB of Seattle and are authorized to apply for advances on the security of that stock and certain of our mortgage loans and other assets (principally securities which are obligations of, or guaranteed by, the U.S. Government) provided certain creditworthiness standards have been met. Advances are individually made under various terms pursuant to several different credit programs, each with its own interest rate and range of maturities. Depending on the program, limitations on the amount of advances are based on the financial condition of the member institution and the adequacy of collateral pledged to secure the credit. We also maintain a committed credit facility with the FHLB of Seattle that provides for immediately available advances up to an aggregate of 25% of the prior quarter's total assets of Anchor Bank. At June 30, 2013, outstanding advances to Anchor Bank from the FHLB of Seattle totaled $64.9 million.
The following tables set forth information regarding FHLB of Seattle advances by us at the end of and during the periods indicated. The table includes both long- and short-term borrowings.
| Year Ended June 30, | ||||||||||
| 2013 |
| 2012 |
| 2011 | ||||||
| (Dollars in thousands) | ||||||||||
Maximum amount of borrowing outstanding at any month end: |
|
|
|
|
| ||||||
FHLB advances | $ | 64,900 | |
| $ | 74,900 | |
| $ | 121,900 | |
Approximate average borrowing outstanding: |
|
|
| |
|
| | ||||
FHLB advances | 64,900 | |
| 73,242 | |
| 104,408 | | |||
Approximate weighted average rate paid on: |
|
|
| |
|
| | ||||
FHLB advances | 1.91 | % |
| 1.87 | % |
| 2.08 | % | |||
| At June 30, | ||||||||||
| 2013 |
| 2012 |
| 2011 | ||||||
| (Dollars in thousands) | ||||||||||
Balance outstanding at end of period: |
|
|
|
|
| ||||||
FHLB advances | $ | 64,900 | |
| $ | 64,900 | |
| $ | 85,900 | |
Weighted average rate paid on: |
|
|
| |
|
| | ||||
FHLB advances | 1.91 | % |
| 1.91 | % |
| 1.75 | % | |||
Subsidiaries and Other Activities
Anchor Bank. Anchor Bank has one wholly-owned subsidiary, Anchor Financial Services, Inc., that is currently inactive. At June 30, 2013, Anchor Bank's equity investment in Anchor Financial Services, Inc. was $303,000.
Competition
Anchor Bank operates in an intensely competitive market for the attraction of deposits (generally its primary source of lendable funds) and in the origination of loans. Historically, its most direct competition for deposits has come from large commercial banks, thrift institutions and credit unions in its primary market area. In times of high interest rates, Anchor Bank experiences additional significant competition for investors' funds from short-term money market securities and other corporate and government securities. Anchor Bank's competition for loans comes principally from mortgage bankers, commercial banks and other thrift institutions. Such competition for deposits and the origination of loans may limit Anchor Bank's future growth and earnings prospects.
31
Table of Contents
Natural Disasters
Grays Harbor, Thurston, Lewis, Pierce, Mason and King counties, where substantially all of the real and personal properties securing our loans are located, is an earthquake-prone region. We have not suffered any losses in the last fifteen years from earthquake damage to collateral secured loans, which include the July 1999 and February 2001 major earthquakes in the region. Although we have experienced no losses related to earthquakes, a major earthquake could result in material loss to us in two primary ways. If an earthquake damages real or personal properties collateralizing outstanding loans to the point of insurable loss, material loss would be suffered to the extent that the properties are uninsured or inadequately insured. A substantial number of our borrowers do not have insurance which provides for coverage as a result of losses from earthquakes. Earthquake insurance is generally not required by other lenders in the market area, and as a result in order to remain competitive in the marketplace, we do not require earthquake insurance as a condition of making a loan. Earthquake insurance is also not always available at a reasonable coverage level and cost because of changing insurance underwriting practices in our market area resulting from past earthquake activity and the likelihood of future earthquake activity in the region. In addition, if the collateralized properties are only damaged and not destroyed to the point of total insurable loss, borrowers may suffer sustained job interruptions or job loss, which may materially impair their ability to meet the terms of their loan obligations. While risk of credit loss can be insured against by, for example, job interruption insurance or "umbrella" insurance policies, such forms of insurance often are beyond the financial means of many individuals. Accordingly, for most individuals, sustained job interruption or job loss would likely result in financial hardship that could lead to delinquency in their financial obligations or even bankruptcy. Accordingly, no assurances can be given that a major earthquake in our primary market area will not result in material losses to us.
Employees
At June 30, 2013, we had 134 full-time equivalent employees. Our employees are not represented by any collective bargaining group. We consider our employee relations to be good.
Executive Officers. The following table sets forth information regarding the executive officers of the Company and the Bank:
|
| Age at June 30, 2013 |
| Position | ||
Name |
|
| Company |
| Bank | |
Jerald L. Shaw |
| 67 |
| President and Chief Executive Officer |
| President and Chief Executive Officer |
Terri L. Degner |
| 50 |
| Chief Financial Officer |
| Chief Financial Officer |
Gregory H. Schultz |
| 59 |
| Executive Vice President |
| Executive Vice President and Chief Lending Officer |
Biographical Information . The following is a description of the principal occupation and employment of the executive officers of the Company and the Bank during at least the past five years:
Jerald L. Shaw is the President and Chief Executive Officer of Anchor Bank, positions he has held since July 2006. He has also served in those capacities for Anchor Bancorp since its formation is September 2008. Prior to serving as President and Chief Executive Officer, he served as Chief Operating Officer from 2004 to 2006 and Chief Financial Officer from 1988 to 2002. Prior to that, he served Anchor Bank and its predecessor, Aberdeen Federal Savings and Loan Association, in a variety of capacities since 1976. Prior to that time, Mr. Shaw piloted C-130 aircraft for the U.S. Air Force including numerous combat missions during the Vietnam War. Having performed virtually every position at Anchor Bank, he has extensive knowledge of our operations. He is a distinguished graduate of the School for Executive Development of the U.S. League of Savings Institutions at the University of Washington. Mr. Shaw is also a graduate of the Asset Liability Management School of America's Community Bankers, and many other educational programs. He is a member of the Board of Trustees for the Thurston County Chamber of Commerce, as well as South Sound YMCA. Mr. Shaw also holds a position on the Board of Washington Banker's Association.
Terri L. Degner is the Executive Vice President, Chief Financial Officer and Treasurer of Anchor Bank, positions she has held since 2004. She has also served in those capacities for Anchor Bancorp since its formation in September 2008. Prior to serving as Executive Vice President, Chief Financial Officer and Treasurer, Ms. Degner has served Anchor Bank in a variety of capacities since 1990, including as Senior Vice President and Controller from 1994 to 2004. Ms. Degner has been in banking since high school. She has worked in multiple lending positions in various size institutions. Since 1990, she has held a variety of positions in the finance area of Anchor Bank. Ms. Degner demonstrated her determination to succeed when she worked full time in Anchor's Accounting Department and commuted 60 miles to evening classes at St. Martin's College where she received her Bachelor's Degree in Accounting. At the same time she worked full days and met all expectations for performance. In 2000, she graduated
32
Table of Contents
from the Pacific Coast Banking School at the University of Washington in the top 10% of her class and her thesis was published in the University's library. She has become the management expert on issues ranging from information technology to asset-liability management. Ms. Degner also serves on the board of directors and finance committee of NeighborWorks of Grays Harbor, sits on the St. Martins University Accounting Advisory Committee and is on the Executive Committee of the Providence St. Peter Foundation Christmas Forest.
Gregory H. Schultz , is an Executive Vice President of Anchor Bancorp, a position he has held since January 2011. Mr. Schultz also is an Executive Vice President and Chief Lending Officer of Anchor Bank, positions he has held since October 2010 and May 2008, respectively. Prior to his appointment as Executive Vice President of Anchor Bank, Mr. Schultz had served as Senior Vice President since joining Anchor Bank in February 2008. In his current capacity, Mr. Schultz serves on many Bank committees, including Chair of the Executive Loan and Problem Asset committees, and as a member of the Executive Management, Senior Management, Risk Management, ALCO, IT, and Loan Policy committees. Mr. Schultz has more than 37 years of experience in banking and finance, beginning as a collector in 1974 with a subsidiary of Bank of America. His career includes three years in consumer lending, four years in the thrift industry, and 30 years in community and regional commercial banking, working in Utah, Idaho, Nevada and Washington. Prior to joining Anchor Bank in February 2008, Mr. Schultz was the Senior Commercial Lending Officer for Silverstate Bank from May 2007 through January 2008, and was previously employed by Community Bank of Nevada for ten years in a variety of positions, including most recently as Chief Lending Officer. Mr. Schultz earned an Associate of Arts Degree in Speech and Drama from Treasure Valley Community College and has extensive training in most aspects of banking including accounting, credit, law, sales, marketing, valuation, management and administration. Mr. Schultz also participates as a volunteer for charitable organizations, including Relay for Life and Rebuilding Together, and participates in community fund raising activities for Habitat for Humanity, the Kiwanis Club and the Chamber of Commerce.
How We Are Regulated
The following is a brief description of certain laws and regulations applicable to Anchor Bancorp and Anchor Bank. Descriptions of laws and regulations here and elsewhere in this report do not purport to be complete and are qualified in their entirety by reference to the actual laws and regulations. Legislation is introduced from time to time in the United States Congress or the Washington State Legislature that may affect the operations of Anchor Bancorp and Anchor Bank. In addition, the regulations governing us may be amended from time to time by our regulators, the FDIC, DFI, Federal Reserve and the Consumer Financial Protection Bureau ("CFPB"). Any such legislation or regulatory changes in the future could adversely affect us. We cannot predict whether any such changes may occur.
Regulatory Impact of the Dodd-Frank Act. The following summarizes significant aspects of the Dodd-Frank Act that may materially affect the operations and condition of Anchor Bank and Anchor Bancorp.
• | Centralize responsibility for consumer financial protection in the CFPB, which has broad rulemaking, supervision and enforcement authority for a wide range of consumer protection laws that would apply to all banks and thrifts. Smaller financial institutions, including the Bank, are subject to the supervision and enforcement of their primary federal banking regulator with respect to their compliance with the federal consumer financial protection laws. |
• | Require new capital rules and apply the same leverage and risk-based capital requirements that apply to insured depository institutions. |
• | Require the federal banking regulators to make their capital requirements counter cyclical, so that capital requirements increase in times of economic expansion and decrease in times of economic contraction. |
• | Provide for new disclosure and other requirements relating to executive compensation and corporate governance. |
• | Make permanent the $250,000 limit for federal deposit insurance. |
• | Repeal the prohibition on the payment of interest on demand deposits and eliminate the unlimited federal deposit insurance for non interest-bearing demand transaction accounts effective January 1, 2013. |
• | Require all depository institution holding companies to serve as a source of financial strength to their depository institution subsidiaries in the event such subsidiaries suffer from financial distress. |
• | Change the deposit insurance assessment base for FDIC insurance to the depository institution's total average assets minus the sum of its average tangible equity during the assessment period, rather the level of deposits. |
• | Increase the minimum reserve ratio of the FDIC deposit insurance fund to 1.35% of estimated annual insured deposits or assessment base. However, the FDIC is directed to "offset the effect" of the increased reserve ratio for insured depository institutions with total consolidated assets of less than $10.0 billion. |
Many aspects of the Dodd-Frank Act are subject to rulemaking by the federal banking agencies, which has not been completed and will not take effect for some time, making it difficult to anticipate the overall financial impact of the Dodd-Frank Act on the Corporation, the Bank and the financial services industry more generally.
33
Table of Contents
Regulation and Supervision of Anchor Bank
General. Anchor Bank, as a state-chartered savings bank, is subject to applicable provisions of Washington law and to regulations and examinations of the DFI. As an insured institution, it also is subject to examination and regulation by the FDIC, which insures the deposits of Anchor Bank to the maximum permitted by law. During these state or federal regulatory examinations, the examiners may require Anchor Bank to provide for higher general or specific loan loss reserves, which can impact our capital and earnings. This regulation of Anchor Bank is intended for the protection of depositors and the Deposit Insurance Fund ("DIF") of the FDIC and not for the purpose of protecting shareholders of Anchor Bank or Anchor Bancorp. Anchor Bank is required to maintain minimum levels of regulatory capital and is subject to some limitations on the payment of dividends to Anchor Bancorp. See "- Regulatory Capital Requirements" and "- Limitations on Dividends and Stock Repurchases."
Federal and State Enforcement Authority and Actions. As part of its supervisory authority over Washington-chartered savings banks, the DFI may initiate enforcement proceedings to obtain a cease-and-desist order against an institution believed to have engaged in unsafe and unsound practices or to have violated a law, regulation, or other regulatory limit, including a written agreement. The FDIC also has the authority to initiate enforcement actions against insured institutions for similar reasons and may terminate the deposit insurance if it determines that an institution has engaged in unsafe or unsound practices or is in an unsafe or unsound condition. Both these agencies may utilize less formal supervisory tools to address their concerns about the condition, operations or compliance status of a savings bank.
Regulation by the Washington Department of Financial Institutions. State law and regulations govern Anchor Bank's ability to take deposits and pay interest, to make loans on or invest in residential and other real estate, to make consumer loans, to invest in securities, to offer various banking services to its customers, and to establish branch offices. As a state savings bank, Anchor Bank must pay semi-annual assessments, examination costs and certain other charges to the DFI.
Washington law generally provides the same powers for Washington savings banks as federally and other-state chartered savings institutions and banks with branches in Washington, subject to the approval of the DFI. Washington law allows Washington savings banks to charge the maximum interest rates on loans and other extensions of credit to Washington residents which are allowable for a national bank in another state if higher than Washington limits. In addition, the DFI may approve applications by Washington savings banks to engage in an otherwise unauthorized activity, if the DFI determines that the activity is closely related to banking, and Anchor Bank is otherwise qualified under the statute. This additional authority, however, is subject to review and approval by the FDIC if the activity is not permissible for national banks.
Insurance of Accounts and Regulation by the FDIC. The DIF of the FDIC insures deposit accounts in Anchor Bank up to $250,000 per separately insured depositor. As insurer, the FDIC imposes deposit insurance premiums and is authorized to conduct examinations of and to require reporting by FDIC-insured institutions. Our deposit insurance premiums for the year ended June 30, 2013, were $651,000. Those premiums have increased in recent years due to recent strains on the FDIC deposit insurance fund as a result of the cost of large bank failures and increases in the number of troubled banks. Management is not aware of any existing circumstances which would result in termination of Anchor Bank's deposit insurance.
As required by the Dodd-Frank Act, the FDIC adopted rules effective April 1, 2011, under which insurance premium assessments are based on an institution's total assets minus its tangible equity (defined as Tier 1 capital) instead of its deposits. Under these rules, an institution with total assets of less than $10 billion is assigned one of four risk categories based on its capital, supervisory ratings and other factors. Well capitalized institutions that are financially sound with only a few minor weaknesses are assigned to Risk Category I. Risk Categories II, III and IV present progressively greater risks to the DIF. A range of initial base assessment rates apply to each category, subject to adjustment downward based on unsecured debt issued by the institution and, except for an institution in Risk Category I, adjustment upward if the institution's brokered deposits exceed 10% of its domestic deposits, to produce total base assessment rates. Total base assessment rates range from 2.5 to nine basis points for Risk Category I, nine to 24 basis points for Risk Category II, 18 to 33 basis points for Risk Category III and 30 to 45 basis points for Risk Category IV, all subject to further adjustment upward if the institution holds more than a de minimis amount of unsecured debt issued by another FDIC-insured institution. The FDIC may increase or decrease its rates by 2.0 basis points without further rulemaking. In an emergency, the FDIC may also impose a special assessment.
The Dodd-Frank Act establishes 1.35% as the minimum reserve ratio. The FDIC has adopted a plan under which it will meet this ratio by September 30, 2020, the deadline imposed by the Dodd-Frank Act. The Dodd-Frank Act requires the FDIC to offset the effect on institutions with assets less than $10 billion for the increase in the statutory minimum reserve ratio to 1.35% from the former statutory minimum of 1.15%. The FDIC has not yet announced how it will implement this offset. In addition to the statutory minimum ratio the FDIC must designate a reserve ratio, known as the designated reserve ratio ("DRR"), which may exceed the statutory minimum. The FDIC has established 2.0% as the DRR.
34
Table of Contents
In addition to the assessment for deposit insurance, institutions are required to make payments on bonds issued in the late 1980s by the Financing Corporation to recapitalize a predecessor deposit insurance fund. These assessments, which may be revised based upon the level of DIF deposits, will continue until the bonds mature in the years 2017 through 2019. This payment is established quarterly and during the year ending March 31, 2013 averaged 8.20 basis points (annualized) of assessable assets. The Financing Corporation was chartered in 1987 by the Federal Home Loan Bank Board solely for the purpose of functioning as a vehicle for the recapitalization of the deposit insurance system.
As insurer, the FDIC is authorized to conduct examinations of and to require reporting by FDIC-insured institutions. It also may prohibit any FDIC-insured institution from engaging in any activity the FDIC determines by regulation or order to pose a serious threat to the DIF. The FDIC also has the authority to take enforcement actions against banks and savings associations.
A significant increase in insurance premiums would likely have an adverse effect on the operating expenses and results of operations of the Bank. There can be no prediction as to what changes in insurance assessment rates may be made in the future.
Prompt Corrective Action. Federal statutes establish a supervisory framework based on five capital categories: well capitalized, adequately capitalized, undercapitalized, significantly undercapitalized and critically undercapitalized. An institution's category depends upon where its capital levels are in relation to relevant capital measures, which include a risk-based capital measure, a leverage ratio capital measure and certain other factors. The federal banking agencies have adopted regulations that implement this statutory framework. Under these regulations, an institution is treated as well capitalized if its ratio of total capital to risk-weighted assets is 10% or more, its ratio of core capital to risk-weighted assets is 6% or more, its ratio of core capital to adjusted total assets (leverage ratio) is 5% or more, and it is not subject to any federal supervisory order or directive to meet a specific capital level. In order to be adequately capitalized, an institution must have a total risk-based capital ratio of not less than 8%, a Tier 1 risk-based capital ratio of not less than 4%, and a leverage ratio of not less than 4%. An institution that is not well capitalized is subject to certain restrictions on brokered deposits, including restrictions on the rates it can offer on its deposits generally. Any institution which is neither well capitalized nor adequately capitalized is considered undercapitalized.
Undercapitalized institutions are subject to certain prompt corrective action requirements, regulatory controls and restrictions which become more extensive as an institution becomes more severely undercapitalized. Failure by an institution to comply with applicable capital requirements would, if unremedied, result in progressively more severe restrictions on its activities and lead to enforcement actions, including, but not limited to, the issuance of a capital directive to ensure the maintenance of required capital levels and, ultimately, the appointment of the FDIC as receiver or conservator. Banking regulators will take prompt corrective action with respect to depository institutions that do not meet minimum capital requirements. Additionally, approval of any regulatory application filed for their review may be dependent on compliance with capital requirements.
At June 30, 2013, Anchor Bank was categorized as well capitalized.
Capital Requirements. On July 2, 2013, the Federal Reserve approved a final rule ("Final Rules") to establish a new comprehensive regulatory capital framework for all U.S. financial institutions and their holding companies. On July 9, the Final Rule was approved as an interim final rule by the FDIC. The Final rule implements the "Basel III" regulatory capital reforms and changes required by the Dodd-Frank Act, which is discussed below in the section entitled "-New Capital Rules." The following is a discussion of the capital requirements Anchor Bank was subject to as of June 30, 2013.
Anchor Bank is required by FDIC regulations to maintain specified levels of regulatory capital under regulation of the FDIC consisting of core (Tier 1) capital and supplementary (Tier 2) capital. Tier 1 capital generally includes common shareholders' equity and noncumulative perpetual preferred stock, less most intangible assets. Tier 2 capital, which is limited to 100 percent of Tier 1 capital, includes such items as qualifying general loan loss reserves, cumulative perpetual preferred stock, mandatory convertible debt, term subordinated debt and limited life preferred stock; however, the amount of term subordinated debt and intermediate term preferred stock (original maturity of at least five years but less than 20 years) that may be included in Tier 2 capital is limited to 50 percent of Tier 1 capital.
At June 30, 2013, the FDIC measured an institution's capital using a leverage limit together with certain risk-based ratios. The FDIC's minimum leverage capital requirement specifies a minimum ratio of Tier 1 capital to average total assets. Most banks are required to maintain a minimum leverage ratio of at least 4% to 5% of total assets. At June 30, 2013, Anchor Bank had a Tier 1 leverage capital ratio of 11.4% . The FDIC retains the right to require a particular institution to maintain a higher capital level based on its particular risk profile.
FDIC regulations also establish a measure of capital adequacy based on ratios of qualifying capital to risk-weighted assets. Assets are placed in one of four categories and given a percentage weight based on the relative risk of that category. In addition, certain off-balance-sheet items are converted to balance-sheet credit equivalent amounts, and each amount is then assigned to one of the four categories. Under the guidelines, for a bank to be considered adequately capitalized the ratio of total capital (Tier 1 capital
35
Table of Contents
plus Tier 2 capital) to risk-weighted assets must be at least 8%, and the ratio of Tier 1 capital to risk-weighted assets (the Tier 1 risk based capital ratio) must be at least 4%. In evaluating the adequacy of a bank's capital, the FDIC may also consider other factors that may affect a bank's financial condition. Such factors may include interest rate risk exposure, liquidity, funding and market risks, the quality and level of earnings, concentration of credit risk, risks arising from nontraditional activities, loan and investment quality, the effectiveness of loan and investment policies, and management's ability to monitor and control financial operating risks.
The DFI requires that net worth equal at least five percent of total assets. At June 30, 2013, Anchor Bank had Tier 1 risk-based capital of 16.7% .
The table below sets forth Anchor Bank's capital position under the prompt corrective action regulations of the FDIC at June 30, 2013 and 2012 and the requirements pursuant to the Order, which the Bank was subject to until September 5, 2012, at which time it became subject to the Supervisory Directive. The Bank's Tier 1 leverage capital ratio was 11.4% at June 30, 2013, which exceeded the requirements of the Supervisory Directive of 10%.
| At June 30, | ||||||||||||
| 2013 |
| 2012 | ||||||||||
| Amount |
| Ratio |
| Amount |
| Ratio | ||||||
| (Dollars in thousands) | ||||||||||||
Bank equity capital under GAAP | $ | 52,368 | |
|
|
| $ | 54,024 | |
|
| ||
|
|
|
|
|
|
|
| ||||||
Total risk-based capital | $ | 56,289 | |
| 18.0 | % |
| $ | 56,143 | |
| 18.2 | % |
Total risk-based capital requirement | 25,060 | |
| 8.0 | |
| 24,634 | |
| 8.0 | | ||
Excess | $ | 31,229 | |
| 10.0 | % |
| $ | 31,509 | |
| 10.2 | % |
|
|
|
|
|
|
|
| ||||||
Tier 1 risk-based capital | $ | 52,450 | |
| 16.7 | % |
| $ | 52,254 | |
| 17.0 | % |
Tier 1 risk-based capital requirement | 12,530 | |
| 4.0 | |
| 12,317 | |
| 4.0 | | ||
Excess | $ | 39,920 | |
| 12.7 | % |
| $ | 39,937 | |
| 13.0 | % |
|
|
|
|
|
|
|
| ||||||
Tier 1 leverage capital | $ | 52,450 | |
| 11.4 | % |
| $ | 52,254 | |
| 10.9 | % |
Tier 1 leverage capital requirement | 18,358 | |
| 4.0 | |
| 19,094 | |
| 4.0 | | ||
Excess | $ | 34,092 | |
| 7.4 | % |
| $ | 33,160 | |
| 6.9 | % |
Pursuant to minimum capital requirements of the FDIC, Anchor Bank is required to maintain a leverage ratio (capital to assets ratio) of 4% and risk-based capital ratios of Tier 1 capital and total capital (to total risk-weighted assets) of 4% and 8%, respectively. The Order required Anchor Bank to maintain Tier 1 capital and total risk-based capital ratios at a minimum of 10% and 12%, respectively. The Supervisory Directive requires Anchor Bank to maintain a Tier 1 capital ratio of at least 10%) As of June 30, 2013 and 2012, the Bank was classified as a "well capitalized" institution under the criteria established by the FDIC.
Anchor Bank's management believes that, under the current regulations, Anchor Bank will continue to meet its minimum capital requirements in the foreseeable future. However, events beyond the control of Anchor Bank, such as a downturn in the economy in areas where it has most of its loans, could adversely affect future earnings and, consequently, the ability of Anchor Bank to meet its capital requirements.
New Capital Rules. The Final Rules approved by the Federal Reserve and subsequently approved as an interim final rule by the FDIC substantially amends the regulatory risk-based capital rules applicable to Anchor Bancorp and Anchor Bank.
Effective in 2015 (with some changes generally transitioned into full effectiveness over two to four years), the Bank will be subject to new capital requirements adopted by the FDIC. These new requirements create a new required ratio for common equity Tier 1 ("CET1") capital, increases the leverage and Tier 1 capital ratios, changes the risk-weights of certain assets for purposes of the risk-based capital ratios, creates an additional capital conservation buffer over the required capital ratios and changes what qualifies as capital for purposes of meeting these various capital requirements. Beginning in 2016, failure to maintain the required capital conservation buffer will limit the ability of the Bank to pay dividends, repurchase shares or pay discretionary bonuses.
When these new requirements become effective in 2015, the Bank's leverage ratio of 4% of adjusted total assets and total capital ratio of 8% of risk-weighted assets will remain the same; however, the Tier 1 capital ratio requirement will increase from 4.0% to
36
Table of Contents
6.5% of risk-weighted assets. In addition, the Bank will have to meet the new CET1 capital ratio of 4.5% of risk-weighted assets, with CET1 consisting of qualifying Tier 1 capital less all capital components that are not considered common equity.
For all of these capital requirements, there are a number of changes in what constitutes regulatory capital, some of which are subject to a two-year transition period. These changes include the phasing-out of certain instruments as qualifying capital. The Bank does not have any of these instruments. Under the new requirements for total capital, Tier 2 capital is no longer limited to the amount of Tier 1 capital included in total capital.
Mortgage servicing rights, certain deferred tax assets and investments in unconsolidated subsidiaries over designated percentages of common stock will be deducted from capital, subject to a two-year transition period. In addition, Tier 1 capital will include accumulated other comprehensive income, which includes all unrealized gains and losses on available for sale debt and equity securities, subject to a two-year transition period. Because of its asset size, the Bank has the one-time option of deciding in the first quarter of 2015 whether to permanently opt-out of the inclusion of accumulated other comprehensive income in its capital calculations. The Bank is considering whether to take advantage of this opt-out to reduce the impact of market volatility on its regulatory capital levels.
The new requirements also include changes in the risk-weights of assets to better reflect credit risk and other risk exposures. These include a 150% risk weight (up from 100%) for certain high volatility commercial real estate acquisition, development and construction loans and for non-residential mortgage loans that are 90 days past due or otherwise in nonaccrual status; a 20% (up from 0%) credit conversion factor for the unused portion of a commitment with an original maturity of one year or less that is not unconditionally cancellable (currently set at 0%); a 250% risk weight (up from 100%) for mortgage servicing and deferred tax assets that are not deducted from capital; and increased risk-weights (0% to 600%) for equity exposures.
In addition to the minimum CET1, Tier 1 and total capital ratios, the Bank will have to maintain a capital conservation buffer consisting of additional CET1 capital equal to 2.5% of risk-weighted assets above the required minimum levels in order to avoid limitations on paying dividends, engaging in share repurchases, and paying discretionary bonuses based on percentages of eligible retained income that could be utilized for such actions. This new capital conservation buffer requirement is be phased in beginning in January 2016 at 0.625% of risk-weighted assets and increasing each year until fully implemented at 2.5% in January 2019.
The FDIC's prompt corrective action standards will change when these new capital ratios become effective. Under the new standards, in order to be considered well-capitalized, the Bank would have to have a CET1 ratio of 6.5% (new), a Tier 1 ratio of 8% (increased from 6%), a total capital ratio of 10% (unchanged) and a leverage ratio of 5% (unchanged). Anchor Bank has conducted a pro forma analysis of the application of these new capital requirements as of June 30, 2013. We have determined that Anchor Bank meets all these new requirements, including the full 2.5% capital conservation buffer, and remains well-capitalized, if these new requirements had been effect on that date. Anchor Bancorp has also conducted a pro forma analysis of the application of these new capital requirements as of June 30, 2013. We have determined that Anchor Bancorp meets all these new requirements, including the full 2.5% capital conservation buffer, and remains well-capitalized, if these new requirements had been in effect on that date.
The application of these more stringent capital requirements could, among other things, result in lower returns on invested capital, over time require the raising of additional capital, and result in regulatory actions if we were to be unable to comply with such requirements. Implementation of changes to asset risk weightings for risk based capital calculations, items included or deducted in calculating regulatory capital and/or additional capital conservation buffers could result in management modifying its business strategy and could limit our ability to make distributions, including paying out dividends or buying back shares. Furthermore, the imposition of liquidity requirements in connection with the implementation of Basel III could result in our having to lengthen the term of our funding, restructure our business models, and/or increase our holdings of liquid assets. Any additional changes in our regulation and oversight, in the form of new laws, rules and regulations could make compliance more difficult or expensive or otherwise materially adversely affect our business, financial condition or prospects.
Federal Home Loan Bank System. Anchor Bank is a member of the FHLB of Seattle, which is one of 12 regional FHLBs that administer the home financing credit function of savings institutions. Each FHLB serves as a reserve or central bank for its members within its assigned region. It is funded primarily from proceeds derived from the sale of consolidated obligations of the FHLB System. It makes loans or advances to members in accordance with policies and procedures, established by the Board of Directors of the FHLB, which are subject to the oversight of the Federal Housing Finance Board. All advances from the FHLB are required to be fully secured by sufficient collateral as determined by the FHLB. In addition, all long-term advances are required to provide funds for residential home financing.
As a member, Anchor Bank is required to purchase and maintain stock in the FHLB of Seattle. At June 30, 2013, Anchor Bank had $6.3 million in FHLB stock, which was in compliance with this requirement. Anchor Bank did not receive any dividends from the FHLB of Seattle for the year ended June 30, 2013. Subsequent to December 31, 2008, the FHLB of Seattle announced
37
Table of Contents
that it was below its regulatory risk-based capital requirement and that it would suspend future dividends and the repurchase and redemption of outstanding common stock. As a result, the FHLB has not paid a dividend since the fourth quarter of 2008. In September 2012, the FHLB announced that the FHFA considered the FHLB to be adequately capitalized. The FHLB also announced that it had been granted authority to repurchase up to $25 million of excess capital stock per quarter, provided they receive a non-objection from the FHFA. As of June 30, 2013, the FHLB had repurchased $231,700 of its stock, at par, from Anchor Bank. The FHLB announced July 22, 2013 that, based on second quarter 2013 financial results, their Board of Directors had declared a $0.025 per share cash dividend. It is the first dividend in a number of years and represents a significant milestone in FHLB's return to normal operations.
The FHLBs continue to contribute to low- and moderately-priced housing programs through direct loans or interest subsidies on advances targeted for community investment and low- and moderate-income housing projects. These contributions have affected adversely the level of FHLB dividends paid and could continue to do so in the future. These contributions could also have an adverse effect on the value of FHLB stock in the future. A reduction in value of Anchor Bank's FHLB stock may result in a corresponding reduction in its capital.
Standards for Safety and Soundness. The federal banking regulatory agencies have prescribed, by regulation, guidelines for all insured depository institutions relating to: internal controls, information systems and internal audit systems; loan documentation; credit underwriting; interest rate risk exposure; asset growth; asset quality; earnings and compensation, fees and benefits. The guidelines set forth the safety and soundness standards that the federal banking agencies use to identify and address problems at insured depository institutions before capital becomes impaired. Each insured depository institution must implement a comprehensive written information security program that includes administrative, technical, and physical safeguards appropriate to the institution's size and complexity and the nature and scope of its activities. The information security program also must be designed to ensure the security and confidentiality of customer information, protect against any unanticipated threats or hazards to the security or integrity of such information, protect against unauthorized access to or use of such information that could result in substantial harm or inconvenience to any customer, and ensure the proper disposal of customer and consumer information. Each insured depository institution must also develop and implement a risk-based response program to address incidents of unauthorized access to customer information in customer information systems. If the FDIC determines that Anchor Bank fails to meet any standard prescribed by the guidelines, it may require Anchor Bank to submit an acceptable plan to achieve compliance with the standard. FDIC regulations establish deadlines for the submission and review of such safety and soundness compliance plans. Management of Anchor Bank is not aware of any conditions relating to these safety and soundness standards which would require submission of a plan of compliance.
Real Estate Lending Standards. FDIC regulations require Anchor Bank to adopt and maintain written policies that establish appropriate limits and standards for real estate loans. These standards, which must be consistent with safe and sound banking practices, must establish loan portfolio diversification standards, prudent underwriting standards (including loan-to-value ratio limits) that are clear and measurable, loan administration procedures, and documentation, approval and reporting requirements. Anchor Bank is obligated to monitor conditions in its real estate markets to ensure that its standards continue to be appropriate for current market conditions. Anchor Bank's Board of Directors is required to review and approve Anchor Bank's standards at least annually. The FDIC has published guidelines for compliance with these regulations, including supervisory limitations on loan-to-value ratios for different categories of real estate loans. Under the guidelines, the aggregate amount of all loans in excess of the supervisory loan-to-value ratios should not exceed 100% of total capital, and the total of all loans for commercial, agricultural, multifamily or other non-one-to-four-family properties should not exceed 30% of total capital. Loans in excess of the supervisory loan-to-value ratio limitations must be identified in Anchor Bank's records and reported at least quarterly to Anchor Bank's Board of Directors. Anchor Bank is in compliance with the record and reporting requirements. As of June 30, 2013, Anchor Bank's aggregate loans in excess of the supervisory loan-to-value ratios were 11.97% and Anchor Bank's loans on commercial, agricultural, multifamily or other non-one-to-four-family properties in excess of the supervisory loan-to-value ratios were 5.25%. Based on strong risk management practices, Anchor Bank has consistently operated above the aggregate 100% of capital guideline limit since these standards were imposed.
Activities and Investments of Insured State-Chartered Financial Institutions. Federal law generally limits the activities and equity investments of FDIC-insured, state-chartered banks to those that are permissible for national banks. An insured state bank is not prohibited from, among other things, (1) acquiring or retaining a majority interest in a subsidiary, (2) investing as a limited partner in a partnership the sole purpose of which is direct or indirect investment in the acquisition, rehabilitation or new construction of a qualified housing project, provided that such limited partnership investments may not exceed 2% of the bank's total assets, (3) acquiring up to 10% of the voting stock of a company that solely provides or reinsures directors', directors' and officers' liability insurance coverage or bankers' blanket bond group insurance coverage for insured depository institutions, and (4) acquiring or retaining the voting shares of a depository institution owned by another FDIC-insured institution if certain requirements are met.
38
Table of Contents
Washington State has enacted a law regarding financial institution parity. Primarily, the law affords Washington-chartered commercial banks the same powers as Washington-chartered savings banks. In order for a bank to exercise these powers, it must provide 30 days notice to the Director of Financial Institutions and the Director must authorize the requested activity. In addition, the law provides that Washington-chartered savings banks may exercise any of the powers of Washington-chartered commercial banks, national banks and federally-chartered savings banks, subject to the approval of the Director in certain situations. Finally, the law provides additional flexibility for Washington-chartered commercial and savings banks with respect to interest rates on loans and other extensions of credit. Specifically, they may charge the maximum interest rate allowable for loans and other extensions of credit by federally-chartered financial institutions to Washington residents.
Environmental Issues Associated With Real Estate Lending. The Comprehensive Environmental Response, Compensation and Liability Act ("CERCLA") is a federal statute that generally imposes strict liability on all prior and present "owners and operators" of sites containing hazardous waste. However, Congress asked to protect secured creditors by providing that the term "owner and operator" excludes a person whose ownership is limited to protecting its security interest in the site. Since the enactment of the CERCLA, this "secured creditor exemption" has been the subject of judicial interpretations which have left open the possibility that lenders could be liable for cleanup costs on contaminated property that they hold as collateral for a loan. To the extent that legal uncertainty exists in this area, all creditors, including Anchor Bank, that have made loans secured by properties with potential hazardous waste contamination (such as petroleum contamination) could be subject to liability for cleanup costs, which costs often substantially exceed the value of the collateral property.
Federal Reserve System. The Federal Reserve requires that all depository institutions maintain reserves on transaction accounts or non-personal time deposits. These reserves may be in the form of cash or noninterest-bearing deposits with the regional Federal Reserve Bank. Negotiable order of withdrawal (NOW) accounts and other types of accounts that permit payments or transfers to third parties fall within the definition of transaction accounts and are subject to the reserve requirements, as are any non-personal time deposits at a savings bank. As of June 30, 2013, Anchor Bank's deposit with the Federal Reserve Bank and vault cash exceeded its reserve requirements.
Affiliate Transactions. Federal laws strictly limit the ability of banks to engage in certain transactions with their affiliates, including their bank holding companies. Transactions deemed to be a "covered transaction" under Section 23A of the Federal Reserve Act and between a subsidiary bank and its parent company or the nonbank subsidiaries of the bank holding company are limited to 10% of the bank subsidiary's capital and surplus and, with respect to the parent company and all such nonbank subsidiaries, to an aggregate of 20% of the bank subsidiary's capital and surplus. Further, covered transactions that are loans and extensions of credit generally are required to be secured by eligible collateral in specified amounts. Federal law also requires that covered transactions and certain other transactions listed in Section 23B of the Federal Reserve Act between a bank and its affiliates be on terms as favorable to the bank as transactions with non-affiliates.
Community Reinvestment Act and Consumer Protection Laws. Anchor Bank is subject to the provisions of the Community Reinvestment Act of 1977 ("CRA"), which requires the appropriate federal bank regulatory agency to assess a bank's performance under the CRA in meeting the credit needs of the community serviced by the bank, including low and moderate income neighborhoods. The regulatory agency's assessment of the bank's record is made available to the public. Further, a bank's CRA performance must be considered in connection with a bank's application to, among other things, establish a new branch office that will accept deposits, relocate an existing office or merge or consolidate with, or acquire the assets or assume the liabilities of, a federally regulated financial institution. Anchor Bank received a "satisfactory" rating during its most recent examination.
In connection with its deposit-taking, lending and other activities, the Bank is subject to a number of federal laws designed to protect consumers and promote lending to various sectors of the economy and population. The CFPB issues regulations and standards under these federal consumer protection laws, which include the Equal Credit Opportunity Act, the Truth-in-Lending Act, the Home Mortgage Disclosure Act and the Real Estate Settlement Procedures Act. Through its rulemaking authority, the CFPB has promulgated several proposed and final regulations under these laws that will affect our consumer businesses. Among these regulatory initiatives, are final regulations setting "ability to repay" and "qualified mortgage" standards for residential mortgage loans and establishing new mortgage loan servicing and loan originator compensation standards. The Bank is evaluating these recent CFPB regulations and proposals and devotes substantial compliance, legal and operational business resources to ensure compliance with these consumer protection standards. In addition, the FDIC has enacted customer privacy regulations that limit the ability of the Bank to disclose nonpublic consumer information to non-affiliated third parties. The regulations require disclosure of privacy policies and allow consumers to prevent certain personal information from being shared with non-affiliated parties.
Bank Secrecy Act/Anti-Money Laundering Laws . The Bank is subject to the Bank Secrecy Act and other anti-money laundering laws and regulations, including the USA PATRIOT Act of 2001. These laws and regulations require the Bank to implement policies, procedures, and controls to detect, prevent, and report money laundering and terrorist financing and to verify the identity of their customers. Violations of these requirements can result in substantial civil and criminal sanctions. In addition, provisions of the
39
Table of Contents
USA PATRIOT Act require the federal financial institution regulatory agencies to consider the effectiveness of a financial institution's anti-money laundering activities when reviewing mergers and acquisitions.
Dividends. The amount of dividends payable by Anchor Bank to Anchor Bancorp depends upon Anchor Bank's earnings and capital position, and is limited by federal and state laws, regulations and policies. According to Washington law, Anchor Bank may not declare or pay a cash dividend on its capital stock if it would cause its net worth to be reduced below (1) the amount required for liquidation accounts or (2) the net worth requirements, if any, imposed by the Director of the DFI. Dividends on Anchor Bank's capital stock may not be paid in an aggregate amount greater than the aggregate retained earnings of Anchor Bank, without the approval of the Director of the DFI.
The amount of dividends actually paid during any one period is strongly affected by Anchor Bank's policy of maintaining a strong capital position. Federal law further provides that no insured depository institution may pay a cash dividend if it would cause the institution to be "undercapitalized," as defined in the prompt corrective action regulations. Moreover, the federal bank regulatory agencies also have the general authority to limit the dividends paid by insured banks if such payments are deemed to constitute an unsafe and unsound practice. In addition, as noted above, beginning in 2016, if the Bank does not have the required capital conservation buffer, its ability to pay dividends to the Company would be limited, which may limit the ability of the Company to pay dividends to its shareholders.
Under the Supervisory Directive, Anchor Bank is not able to pay dividends to Anchor Bancorp without the prior approval of the DFI and the FDIC and we do not expect to be permitted to pay dividends as long as the Supervisory Directive remains in effect. In addition, we are restricted by the FDIC from making any distributions to shareholders that represent a return of capital without the written non-objection of the FDIC Regional Director and the DFI.
Regulation and Supervision of Anchor Bancorp
General . Anchor Bancorp is a bank holding company registered with the Federal Reserve and the sole shareholder of Anchor Bank. Bank holding companies are subject to comprehensive regulation by the Federal Reserve under the Bank Holding Company Act of 1956, as amended, ("BHCA"), and the regulations promulgated thereunder. This regulation and oversight is generally intended to ensure that Anchor Bancorp limits its activities to those allowed by law and that it operates in a safe and sound manner without endangering the financial health of Anchor Bank.
As a bank holding company, Anchor Bancorp is required to file quarterly reports with the Federal Reserve and any additional information required by the Federal Reserve and will be subject to regular examinations by the Federal Reserve. The Federal Reserve also has extensive enforcement authority over bank holding companies, including the ability to assess civil money penalties, to issue cease and desist or removal orders and to require that a holding company divest subsidiaries (including its bank subsidiaries). In general, enforcement actions may be initiated for violations of law and regulations and unsafe or unsound practices.
The Bank Holding Company Act. Under the BHCA, Anchor Bancorp is supervised by the Federal Reserve. The Federal Reserve has a policy that a bank holding company is required to serve as a source of financial and managerial strength to its subsidiary banks and may not conduct its operations in an unsafe or unsound manner. In addition, the Federal Reserve provides that bank holding companies should serve as a source of strength to its subsidiary banks by being prepared to use available resources to provide adequate capital funds to its subsidiary banks during periods of financial stress or adversity, and should maintain the financial flexibility and capital raising capacity to obtain additional resources for assisting its subsidiary banks. A bank holding company's failure to meet its obligation to serve as a source of strength to its subsidiary banks will generally be considered by the Federal Reserve to be an unsafe and unsound banking practice or a violation of the Federal Reserve's regulations or both.
Under the BHCA, the Federal Reserve may approve the ownership of shares by a bank holding company in any company the activities of which the Federal Reserve has determined to be so closely related to the business of banking or managing or controlling banks as to be a proper incident thereto. These activities generally include, among others, operating a savings institution, mortgage company, finance company, credit card company or factoring company; performing certain data processing operations; providing certain investment and financial advice; underwriting and acting as an insurance agent for certain types of credit related insurance; leasing property on a full payout, non-operating basis; selling money orders, travelers' checks and U.S. Savings Bonds; real estate and personal property appraising; providing tax planning and preparation services; and, subject to certain limitations, providing securities brokerage services for customers.
The Dodd-Frank Wall Street Reform and Consumer Protection Act of 2010. On July 21, 2010, the Dodd-Frank Act was signed into law. The Dodd-Frank-Act imposes new restrictions and an expanded framework of regulatory oversight for financial institutions, including depository institutions and implements new capital regulations that Anchor Bancorp will become subject to and that are discussed above under "- Regulation and Supervision of Anchor Bank - New Capital Rules." In addition, among other changes, the Dodd-Frank Act requires public companies, such as Anchor Bancorp, to (i) provide their shareholders with a
40
Table of Contents
non-binding vote (a) at least once every three years on the compensation paid to executive officers and (b) at least once every six years on whether they should have a "say on pay" vote every one, two or three years; (ii) have a separate, non-binding shareholder vote regarding golden parachutes for named executive officers when a shareholder vote takes place on mergers, acquisitions, dispositions or other transactions that would trigger the parachute payments; (iii) provide disclosure in annual proxy materials concerning the relationship between the executive compensation paid and the financial performance of the issuer; and (iv) amend Item 402 of Regulation S-K to require companies to disclose the ratio of the Chief Executive Officer's annual total compensation to the median annual total compensation of all other employees. For certain of these changes, the implementing regulations have not been promulgated, so the full impact of the Dodd-Frank Act on public companies cannot be determined at this time.
Sarbanes-Oxley Act of 2002 . As a public company, Anchor Bancorp is subject to the Sarbanes-Oxley Act of 2002 ("Sarbanes-Oxley Act"), which implements a broad range of corporate governance and accounting measures for public companies designed to promote honesty and transparency in corporate America and better protect investors from corporate wrongdoing. The Sarbanes-Oxley Act was enacted in 2002 in response to public concerns regarding corporate accountability in connection with various accounting scandals. The stated goals of the Sarbanes-Oxley Act are to increase corporate responsibility, to provide for enhanced penalties for accounting and auditing improprieties at publicly traded companies and to protect investors by improving the accuracy and reliability of corporate disclosures pursuant to the securities laws.
The Sarbanes-Oxley Act includes very specific additional disclosure requirements and corporate governance rules and required the SEC and securities exchanges to adopt extensive additional disclosure, corporate governance and other related rules. The Sarbanes-Oxley Act represents significant federal involvement in matters traditionally left to state regulatory systems, such as the regulation of the accounting profession, and to state corporate law, such as the relationship between a Board of Directors and management and between a Board of Directors and its committees.
Acquisitions . The BHCA prohibits a bank holding company, with certain exceptions, from acquiring ownership or control of more than 5% of the voting shares of any company that is not a bank or bank holding company and from engaging in activities other than those of banking, managing or controlling banks, or providing services for its subsidiaries. A bank holding company that meets certain supervisory and financial standards and elects to be designed as a financial holding company may also engage in certain securities, insurance and merchant banking activities and other activities determined to be financial in nature or incidental to financial activities. The BHCA prohibits a bank holding company, with certain exceptions, from acquiring ownership or control of more than 5% of the voting shares of any company that is not a bank or bank holding company and from engaging in activities other than those of banking, managing or controlling banks, or providing services for its subsidiaries.
Interstate Banking . The Federal Reserve must approve an application of a bank holding company to acquire control of, or acquire all or substantially all of the assets of, a bank located in a state other than the holding company's home state, without regard to whether the transaction is prohibited by the laws of any state. The Federal Reserve may not approve the acquisition of a bank that has not been in existence for the minimum time period, not exceeding five years, specified by the law of the host state. Nor may the Federal Reserve approve an application if the applicant controls or would control more than 10% of the insured deposits in the United States or 30% or more of the deposits in the target bank's home state or in any state in which the target bank maintains a branch. Federal law does not affect the authority of states to limit the percentage of total insured deposits in the state that may be held or controlled by a bank holding company to the extent such limitation does not discriminate against out-of-state banks or bank holding companies. Individual states may also waive the 30% state-wide concentration limit contained in the federal law.
The federal banking agencies are authorized to approve interstate merger transactions without regard to whether the transaction is prohibited by the law of any state, unless the home state of one of the banks adopted a law prior to June 1, 1997 which applies equally to all out-of-state banks and expressly prohibits merger transactions involving out-of-state banks. Interstate acquisitions of branches will be permitted only if the law of the state in which the branch is located permits such acquisitions. Interstate mergers and branch acquisitions will also be subject to the nationwide and statewide insured deposit concentration amounts described above.
Regulatory Capital Requirements. Anchor Bancorp is subject to the new capital regulations reflected in the Final Rule and discussed above under "- Regulation and Supervision of Anchor Bank - New Capital Rules." In addition, under the Dodd-Frank Act, the federal banking regulators require any company that controls an FDIC-insured depository institution, such as Anchor Bank, to serve as a source of strength for the institution, with the ability to provide financial assistance if the institution suffers financial distress.
Restrictions on Dividends . Anchor Bancorp's ability to declare and pay dividends may depend in part on dividends received from Anchor Bank. The Revised Code of Washington regulates the distribution of dividends by savings banks and states, in part, that dividends may be declared and paid out of accumulated net earnings, provided that the bank continues to meet its surplus
41
Table of Contents
requirements. In addition, dividends may not be declared or paid if Anchor Bank is in default in payment of any assessment due the FDIC.
A policy of the Federal Reserve limits the payment of a cash dividend by a bank holding company if the holding company's net income for the past year is not sufficient to cover both the cash dividend and a rate of earnings retention that is consistent with capital needs, asset quality and overall financial condition. A bank holding company that does not meet any applicable capital standard would not be able to pay any cash dividends under this policy. A bank holding company not subject to consolidated capital requirements is expected not to pay dividends unless its debt-to-equity ratio is less than 1:1, and it meets certain additional criteria. The Federal Reserve also has indicated that it would be inappropriate for a company experiencing serious financial problems to borrow funds to pay dividends.
Except for a company that meets the well-capitalized standard for bank holding companies, is well managed, and is not subject to any unresolved supervisory issues, a bank holding company is required to give the Federal Reserve prior written notice of any purchase or redemption of its outstanding equity securities if the gross consideration for the purchase or redemption, when combined with the net consideration paid for all such purchases or redemptions during the preceding 12 months, is equal to 10% or more of the company's consolidated net worth. The Federal Reserve may disapprove such a purchase or redemption if it determines that the proposal would constitute an unsafe or unsound practice or would violate any law, regulation or regulatory order, condition, or written agreement. A bank holding company is considered well-capitalized if on a consolidated basis it has a total risk-based capital ratio of at least 10.0% and a Tier 1 risk-based capital ratio of 6.0% or more, and is not subject to an agreement, order, or directive to maintain a specific level for any capital measure.
Stock Repurchases . Bank holding companies, except for certain "well-capitalized" and highly rated bank holding companies, are required to give the Federal Reserve prior written notice of any purchase or redemption of its outstanding equity securities if the consideration for the purchase or redemption, when combined with the net consideration paid for all such purchases or redemptions during the preceding 12 months, is equal to 10% or more of their consolidated net worth. The Federal Reserve may disapprove a purchase or redemption if it determines that the proposal would constitute an unsafe or unsound practice or would violate any law, regulation, Federal Reserve order, or any condition imposed by, or written agreement with, the Federal Reserve.
TAXATION
Federal Taxation
General. Anchor Bancorp and Anchor Bank are subject to federal income taxation in the same general manner as other corporations, with some exceptions discussed below. The following discussion of federal taxation is intended only to summarize certain pertinent federal income tax matters and is not a comprehensive description of the tax rules applicable to Anchor Bancorp or Anchor Bank. The Company files income tax returns in the U.S. federal jurisdiction. With few exceptions, the Company is no longer subject to
U.S. federal or state/local income tax examinations by tax authorities for years before 2010.
Anchor Bancorp files a consolidated federal income tax return with Anchor Bank. Any cash distributions made by Anchor Bancorp to its shareholders would be considered to be taxable dividends and not as a non-taxable return of capital to shareholders for federal and state tax purposes.
Method of Accounting. For federal income tax purposes, Anchor Bank currently reports its income and expenses on the accrual method of accounting and uses a fiscal year ending on June 30 for filing its federal income tax return.
Minimum Tax. The Internal Revenue Code imposes an alternative minimum tax at a rate of 20% on a base of regular taxable income plus certain tax preferences, called alternative minimum taxable income. The alternative minimum tax is payable to the extent such alternative minimum taxable income is in excess of an exemption amount. Net operating losses can offset no more than 90% of alternative minimum taxable income. Certain payments of alternative minimum tax may be used as credits against regular tax liabilities in future years.
Net Operating Loss Carryovers . A financial institution may carryback net operating losses to the preceding five taxable years and forward to the succeeding 20 taxable years. This provision applies to losses incurred in taxable years beginning after August 6, 1997.
Corporate Dividends-Received Deduction. Anchor Bancorp may eliminate from its income dividends received from Anchor Bank as a wholly-owned subsidiary of Anchor Bancorp if it elects to file a consolidated return with Anchor Bank. The corporate dividends-received deduction is 100% or 80%, in the case of dividends received from corporations with which a corporate recipient does not file a consolidated tax return, depending on the level of stock ownership of the payor of the dividend. Corporations which
42
Table of Contents
own less than 20% of the stock of a corporation distributing a dividend may deduct 70% of dividends received or accrued on their behalf.
Washington Taxation
Anchor Bank is subject to a business and occupation tax imposed under Washington law at the rate of 1.8% of gross receipts. Interest received on loans secured by mortgages or deeds of trust on residential properties and certain securities are exempt from this tax.
Oregon Taxation
The Company files income tax returns in Oregon state and within local jurisdictions. With few exceptions, the Company is no longer subject to U.S. federal or state/local income tax examinations by tax authorities for years before 2009.
Item 1A. Risk Factors.
An investment in our common stock involves various risks which are particular to Anchor Bancorp, our industry, and our market area. Before making an investment decision, you should carefully consider the risks and uncertainties described below, together with all of the other information included in this report. In addition to the risks and uncertainties described below, other risks and uncertainties not currently known to us or that we currently deem to be immaterial also may materially and adversely affect our business, financial condition and results of operations. The value or market price of our common stock could decline due to any of these identified or other risks, and you could lose all or part of your investment.
Risks Related to Our Business
We are subject to increased regulatory scrutiny and are subject to certain business limitations. Further, we may be subject to more severe future regulatory enforcement actions if our financial condition or performance weakens.
Primarily because of its increased level of nonperforming assets, on August 12, 2009, Anchor Bank became subject to the Order, issued with its consent, by the FDIC and DFI because they had reason to believe that Anchor Bank had engaged in unsafe and unsound banking practices and violations of law and/or regulations. The Order was terminated on September 5, 2012 as a result of the steps Anchor Bank took in complying with the Order and reducing its level of classified assets, augmenting management and improving the overall condition of Anchor Bank. In place of the Order, Anchor Bank entered into a Supervisory Directive with the DFI. The Supervisory Directive contains provisions concerning (i) the management and directors of Anchor Bank; (ii) restrictions on paying dividends; (iii) reductions of classified assets; (iv) maintaining Tier 1 capital in an amount equal to or exceeding 10% of Anchor Bank's total assets; (v) policies concerning the allowance for loan and lease losses ("ALLL"); and (vi) requirements to furnish a revised three-year business plan to improve Anchor Bank's profitability and progress reports to the FDIC and DFI. The Supervisory Directive will remain in effect until modified or terminated by the FDIC and DFI.
Management has been taking action and implementing programs to comply with the requirements of the Supervisory Directive. Compliance with the Supervisory Directive, however, is subject to a determination by the DFI. The DFI may determine, in its sole discretion, that we have not addressed the issues raised by the Supervisory Directive satisfactorily, or that any current or past actions, violations or deficiencies could be the subject of further regulatory enforcement actions taken by it. Such enforcement actions could involve penalties or limitations on our business and negatively affect our ability to implement our business plan, the value of our common stock as well as our financial condition and results of operations.
The current weak economic conditions in the market areas we serve may continue to adversely impact our earnings and could increase the credit risk associated with our loan portfolio.
Substantially all of our loans are to businesses and individuals in the states of Washington and Oregon. A continuing decline in the economies of the five counties in which we operate, which we consider to be our primary market areas, as well as the Portland, Oregon metropolitan area where we have had lending activities prior to 2007, could have a material adverse effect on our business, financial condition, results of operations and prospects. In particular, in the current economic downturn, Washington and Oregon have experienced substantial home price declines and increased foreclosures and have experienced above average unemployment rates.
Continued weakness or a further deterioration in economic conditions in the market areas we serve could result in the following consequences, any of which could have a materially adverse impact on our business, financial condition and results of operations:
• | loan delinquencies, problem assets and foreclosures may increase; |
43
Table of Contents
• | the slowing of sales of foreclosed assets; |
• | demand for our products and services may decline, possibly resulting in a decrease in our total loans or assets; |
• | collateral for loans made may decline further in value, exposing us to increased risk of loss on existing loans, reducing customers' borrowing power, and reducing the value of assets and collateral associated with existing loans; and |
• | the amount of our low-cost or noninterest bearing deposits may decrease and the composition of our deposits may be adversely affected. |
A return of recessionary conditions could result in increases in our level of nonperforming loans and/or reduce demand for our products and services, which could have adverse effect on our results of operations.
The ongoing debate in Congress regarding the national debt ceiling and federal budget deficit and concerns over the United States' credit rating (which was downgraded by Standard & Poor's), the European sovereign debt crisis, the overall weakness in the economy and continued high unemployment in the United States, among other economic indicators, have contributed to increased volatility in the capital markets and uncertainty for the economy.
A return of recessionary conditions and/or continued negative developments in the domestic and international credit markets may significantly affect the markets in which we do business, the value of our loans and investments, and our ongoing operations, costs and profitability. Further declines in real estate values and sales volumes and continued high unemployment levels may result in higher than expected loan delinquencies and a decline in demand for our products and services. These negative events may cause us to incur losses and may adversely affect our capital, liquidity, and financial condition.
Furthermore, the Board of Governors of the Federal Reserve System, in an attempt to help the overall economy, has, among other things, kept interest rates low through its targeted federal funds rate and the purchase of mortgage-backed securities. If the Federal Reserve increases the federal funds rate, overall interest rates will likely rise, which may negatively impact the housing markets and the U.S. economic recovery. In addition, deflationary pressures, while possibly lowering our operating costs, could have a significant negative effect on our borrowers, especially our business borrowers, and the values of underlying collateral securing loans, which could negatively affect our financial performance.
Our business may be adversely affected by credit risk associated with residential property.
At June 30, 2013, $73.9 million, or 26.1% of our total loan portfolio, was secured by one-to-four single-family real property. This type of lending is generally sensitive to regional and local economic conditions that significantly impact the ability of borrowers to meet their loan payment obligations, making loss levels difficult to predict. The decline in residential real estate values as a result of the downturn in the Washington housing market has reduced the value of the real estate collateral securing these types of loans and increased the risk that we would incur losses if borrowers default on their loans reflected in our recent charge-off experience on these loans. These declines may have a greater effect on our earnings and capital than on the earnings and capital of financial institutions whose loan portfolios are more diversified.
Many of our residential mortgage loans are secured by liens on mortgage properties in which the borrowers have little or no equity because either we originated the loan with a relatively high combined loan-to-value ratio or because of the decline in home values in our market areas. Residential loans with combined higher loan-to-value ratios will be more sensitive to declining property values than those with lower combined loan-to-value ratios and therefore may experience a higher incidence of default and severity of losses. In addition, if the borrowers sell their homes, such borrowers may be unable to repay their loans in full from the sale proceeds. Further, a significant amount of our home equity lines of credit consist of second mortgage loans. For those home equity lines secured by a second mortgage, it is unlikely that we will be successful in recovering all or a portion of our loan proceeds in the event of default unless we are prepared to repay the first mortgage loan and such repayment and the costs associated with a foreclosure are justified by the value of the property. For these reasons, we may experience higher rates of delinquencies, default and losses on our residential loans.
Our loan portfolio is concentrated in loans with a higher risk of loss.
In addition to residential mortgage loans, we originate construction and land loans, commercial and multi-family mortgage loans, commercial business loans, and consumer loans primarily within our market areas. At June 30, 2013, we had $209.6 million outstanding in non-residential loans. For the year ended June 30, 2013, loans delinquent 30 days or more, including nonperforming
44
Table of Contents
loans, were $10.2 million, and delinquent loans represented 3.6% of total loans. Many of these loans are perceived to have greater credit risk than residential real estate loans for a number of reasons, including those described below:
Construction and Land Loans. Since 2008, and as was required by the Order, we significantly decreased our origination of construction and land acquisition and development loans. At June 30, 2013, we had $10.9 million or 3.9% of total loans in construction and land loans. Included in this amount are $5.3 million of land loans to individuals at June 30, 2013. There were no land acquisition and development loans outstanding at June 30, 2013.
Construction and land lending includes the inherent difficulty in estimating both a property's value at completion of the project and the estimated cost (including interest) of the project. If the estimate of construction cost proves to be inaccurate, we may advance funds beyond the amount originally committed to permit completion of the project. If the estimate of value upon completion proves to be inaccurate, we may be confronted at, or prior to, the maturity of the loan with a project the value of which is insufficient to assure full repayment. In addition, speculative construction loans to a builder are for homes that are not pre-sold, and thus pose a greater potential risk to us than construction loans to individuals on their personal residences. Loans on land under development or held for future construction as well as lot loans made to individuals for the future construction of a residence also pose additional risk because of the lack of income being produced by the property and the potential illiquid nature of the collateral. These risks can be significantly affected by supply and demand conditions. As a result, this type of lending often involves the disbursement of substantial funds with repayment dependent on the success of the ultimate project and the ability of the borrower to sell the property, rather than the ability of the borrower or guarantor to independently repay principal and interest. At June 30, 2013, $589,000 of our construction loans were to a builder for speculative residential construction. Speculative construction loans are loans made to builders who have not identified a buyer for the completed property at the time of origination. At June 30, 2013, $734,000 or 11.9% of our total construction and land loans were nonperforming.
Commercial and Multi-family Mortgage Loans. These loans typically involve higher principal amounts than other types of loans. Repayment is dependent upon income being generated from the property securing the loan in amounts sufficient to cover operating expenses and debt service, which may be adversely affected by changes in the economy or local market conditions. Commercial and multi-family mortgage loans also expose a lender to greater credit risk than loans secured by residential real estate because the collateral securing these loans may not be sold as easily as residential real estate. In addition, many of our commercial and multi-family real estate loans are not fully amortizing and contain large balloon payments upon maturity. Such balloon payments may require the borrower to either sell or refinance the underlying property in order to make the payment, which may increase the risk of default or non-payment. This risk is exacerbated in this current environment. At June 30, 2013, we had $145.3 million or 51.2% of total loans in commercial and multi-family mortgage loans, none of which were nonperforming.
Commercial Business Loans. At June 30, 2013, we had $18.2 million or 6.4% of total loans in commercial business loans, however, we are currently planning on expanding our commercial business lending, subject to market conditions. Commercial business lending involves risks that are different from those associated with residential and commercial real estate lending. Real estate lending is generally considered to be collateral based lending with loan amounts based on predetermined loan to collateral values and liquidation of the underlying real estate collateral being viewed as the primary source of repayment in the event of borrower default. Our commercial business loans are primarily made based on the cash flow of the borrower and secondarily on the underlying collateral provided by the borrower. The borrower's cash flow may be unpredictable, and collateral securing these loans may fluctuate in value. Although commercial business loans are often collateralized by equipment, inventory, accounts receivable, or other business assets, the liquidation of collateral in the event of default is often an insufficient source of repayment because accounts receivable may be uncollectible, inventories may be obsolete or of limited use, and other collateral securing other loans may depreciate over time, may be difficult to appraise and may fluctuate in value based on the success of the business. Accordingly, the repayment of commercial business loans depends primarily on the cash flow and creditworthiness of the borrower and secondarily on the underlying collateral provided by the borrower. At June 30, 2013, nonperforming commercial business loans totaled $219,000.
Consumer Loans. We make secured and unsecured consumer loans. Our secured consumer loans are collateralized with assets that may not provide an adequate source of payment of the loan due to depreciation, damage, or loss. In addition, consumer loan collections are dependent on the borrower's continuing financial stability, and thus are more likely to be adversely affected by job loss, divorce, illness or personal bankruptcy. Furthermore, the application of various federal and state laws, including federal and state bankruptcy and insolvency laws, may limit the amount that can be recovered on these loans. At June 30, 2013, we had $35.1 million or 12.4% of total loans in consumer loans of which $448,000 were nonperforming. Of this amount, $25.8 million were in home equity loans, some of which are loans in amounts for up to 100% of collateral value. For more information about the credit risk, we face with respect to these types of loans, see "Our business may be adversely affected by credit risk associated with residential property."
45
Table of Contents
Our loan portfolio possesses increased risk as the result of subprime loans.
As of June 30, 2013, we held in our loan portfolio $6.5 million in one-to-four family mortgage loans ($3.4 million of which were fixed rate), $228,000 of automobile loans (all of which were fixed rate), $2.9 million of home equity loans (of which $2.1 million were fixed rate) and $165,000 of other types of consumer loans (all of which were fixed rate), which are considered "subprime" by federal banking regulators. The aggregate amount of loans considered subprime at June 30, 2013 was $9.8 million or 3.5% of our total loan portfolio. In exchange for the additional lender risk associated with these loans, these borrowers generally are required to pay a higher interest rate, and depending on the severity of the credit history, a lower loan-to-value ratio may be required than for a conforming loan borrower. At the time of loan origination, our subprime borrowers had an average Fair Isaac and Company, Incorporated, or FICO, credit score of 624 and a weighted average loan-to-value ratio of 69%, which may be significantly understated if current market values are used. A FICO score is a principal measure of credit quality and is one of the significant criteria we rely upon in our underwriting. Generally, a FICO score higher than 660 indicates the borrower has an acceptable credit reputation. At June 30, 2013, $1.4 million of our subprime loans were categorized as nonperforming assets and $348,000 of these loans were categorized as nonaccrual. Subprime loans are generally considered to have an increased risk of delinquency and foreclosure than do conforming loans, especially when adjustable rate loans adjust to a higher interest rate. We had not experienced such increased delinquencies or foreclosures at June 30, 2013, however, our subprime loan portfolio will be adversely affected in the event of a further downturn in regional or national economic conditions. In addition, we may not recover funds in an amount equal to any remaining loan balance. Consequently, we could sustain loan losses and potentially incur a higher provision for loan loss expense.
Our concentration in non-owner occupied residential real estate loans may expose us to increased credit risk.
At June 30, 2013, $21.3 million, or 29.7% of our residential mortgage loan portfolio and 7.6% of our total loan portfolio, consisted of loans secured by non-owner occupied residential properties. Loans secured by non-owner occupied properties generally expose a lender to greater risk of non-payment and loss than loans secured by owner occupied properties because repayment of such loans depends primarily on the tenant's continuing ability to pay rent to the property owner, who is our borrower, or, if the property owner is unable to find a tenant, the property owner's ability to repay the loan without the benefit of a rental income stream. In addition, the physical condition of non-owner occupied properties is often below that of owner occupied properties due to lax property maintenance standards, which has a negative impact on the value of the collateral properties. Furthermore, some of our non-owner occupied residential loan borrowers have more than one loan outstanding with us. At June 30, 2013, we had 16 non-owner occupied residential loan relationships, with aggregate outstanding balances of $13.3 million, of which four loan relationships had an aggregate outstanding balance over $500,000. Consequently, an adverse development with respect to one credit relationship may expose us to a greater risk of loss compared to an adverse development with respect to an owner occupied residential mortgage loan. At June 30, 2013, all of our non-owner occupied residential mortgage loans complied with their loan repayment terms, except for 13 loans which totaled $4.8 million at that date.
The level of our commercial real estate loan portfolio may subject us to additional regulatory scrutiny.
The FDIC, the Federal Reserve and the Office of the Comptroller of the Currency, have promulgated joint guidance on sound risk management practices for financial institutions with concentrations in commercial real estate lending. Under the guidance, a financial institution that, like us, is actively involved in commercial real estate lending should perform a risk assessment to identify concentrations. A financial institution may have a concentration in commercial real estate lending if, among other factors, (i) total reported loans for construction, land acquisition and development, and other land represent 100% or more of total capital, or (ii) total reported loans secured by multi-family and non-farm residential properties, loans for construction, land acquisition and development and other land, and loans otherwise sensitive to the general commercial real estate market, including loans to commercial real estate related entities, represent 300% or more of total capital. The particular focus of the guidance is on exposure to commercial real estate loans that are dependent on the cash flow from the real estate held as collateral and that are likely to be at greater risk to conditions in the commercial real estate market (as opposed to real estate collateral held as a secondary source of repayment or as an abundance of caution). The purpose of the guidance is to guide banks in developing risk management practices and capital levels commensurate with the level and nature of real estate concentrations. The guidance states that management should employ heightened risk management practices including board and management oversight and strategic planning, development of underwriting standards, risk assessment and monitoring through market analysis and stress testing. Our total of incoming producing or non-owner occupied commercial real estate loans were $124.3 million or 220.8% of total capital at June 30, 2013 compared to $126.9 million or 225.9% of total capital at June 30, 2012. While we believe we have implemented policies and procedures with respect to our commercial real estate loan portfolio consistent with this guidance, bank regulators could require us to implement additional policies and procedures consistent with their interpretation of the guidance that may result in additional costs to us.
46
Table of Contents
Our allowance for loan losses may prove to be insufficient to absorb losses in our loan portfolio.
Lending money is a substantial part of our business and each loan carries a certain risk that it will not be repaid in accordance with its terms, or that any underlying collateral will not be sufficient to assure repayment. This risk is affected by, among other things:
• | cash flow of the borrower and/or the project being financed; |
• | the changes and uncertainties as to the future value of the collateral, in the case of a collateralized loan; |
• | the duration of the loan; |
• | the character and creditworthiness of a particular borrower; and |
• | changes in economic and industry conditions. |
We maintain an allowance for loan losses, which we believe is an appropriate reserve to provide for probable losses in our loan portfolio. The allowance is funded by provisions for loan losses charged to expense. The amount of this allowance is determined by our management through periodic reviews and consideration of several factors, including, but not limited to:
• | our general reserve, based on our historical default and loss experience, certain macroeconomic factors, and management's expectations of future events; |
• | our specific reserve, based on our evaluation of nonperforming loans and their underlying collateral; and |
• | an unallocated reserve to provide for other credit losses inherent in our portfolio that may not have been contemplated in the other loss factors. |
The determination of the appropriate level of the allowance for loan losses inherently involves a high degree of subjectivity and requires us to make significant estimates of current credit risks and future trends, all of which may undergo material changes. Continuing deterioration in economic conditions affecting borrowers, new information regarding existing loans, identification of additional problem loans and other factors, both within and outside of our control, may require an increase in the allowance for loan losses. In addition, bank regulatory agencies periodically review our allowance for loan losses and may require an increase in the provision for possible loan losses or the recognition of further loan charge-offs, based on judgments different than those of management. In addition, if charge-offs in future periods exceed the allowance for loan losses we will need additional provisions to replenish the allowance for loan losses. Any additional provisions will result in a decrease in net income and possibly capital, and may have a material adverse effect on our financial condition and results of operations.
Our provision for loan losses and net loan charge-offs have increased significantly in recent years and we may be required to make further increases in our provision for loan losses and to charge-off additional loans in the future, which could adversely affect our results of operations.
For the fiscal year ended June 30, 2013, we recorded a provision for loan losses of $750,000 compared to $2.7 million for the year ended June 30, 2012. We also recorded net loan charge-offs of $2.7 million for the year ended June 30, 2013 compared to $2.9 million for the comparable period in 2012. Despite the decrease from the prior year, we are still experiencing elevated levels of loan delinquencies and credit losses by historical standards.
If current weak conditions in the housing and real estate markets continue, we expect that we will continue to experience further delinquencies and credit losses until general economic conditions improve further. As a result, we could be required to make further increases in our provision for loan losses to increase our allowance for loan losses. Our allowance for loan losses was 1.8% of total loans held for investment and 83.6% of nonperforming loans at June 30, 2013. Any increases in the provision for loan losses will result in a decrease in net income and may have a material adverse effect on our financial condition, results of operations and our capital.
In addition, Western Washington and the Portland, Oregon metropolitan area, where substantially all of the real and personal property securing our loans is located, is an earthquake-prone region. A major earthquake could result in our significantly increasing our allowance for loan losses resulting in material losses to us, although we have not experienced any losses in the past ten years as a result of earthquake damage to collateral securing loans. See Item 1., "Business – Natural Disasters.
If our nonperforming assets increase, our earnings will be adversely affected.
At June 30, 2013, our nonperforming assets which consist of nonaccruing loans and real estate owned, were $12.4 million, or 2.7% of total assets. Our nonperforming assets adversely affect our net income in various ways:
47
Table of Contents
• | we record interest income only on a cash basis for nonaccrual loans and any nonperforming securities and we do not record interest income for real estate owned; |
• | we must provide for probable loan losses through a current period charge to the provision for loan losses; |
• | noninterest expense increases when we write down the value of properties in our real estate owned portfolio to reflect changing market values or recognize other-than-temporary impairment on nonperforming securities; |
• | there are legal fees associated with the resolution of problem assets, as well as carrying costs, such as taxes, insurance, and maintenance fees related to our real estate owned; and |
• | the resolution of nonperforming assets requires the active involvement of management, which can distract them from more profitable activity. |
If additional borrowers become delinquent and do not pay their loans and we are unable to successfully manage our nonperforming assets, our losses and troubled assets could increase significantly, which could have a material adverse effect on our financial condition and results of operations.
If our investments in real estate are not properly valued or sufficiently reserved to cover actual losses, or if we are required to increase our valuation reserves, our earnings could be reduced.
We obtain updated valuations in the form of appraisals and broker price opinions when a loan has been foreclosed upon and the property taken in as real estate owned and at certain other times during the asset's holding period. Our net book value ("NBV") in the loan at the time of foreclosure and thereafter is compared to the updated market value of the foreclosed property less estimated selling costs ("fair value"). A charge-off is recorded for any excess in the asset's NBV over its fair value. If our valuation process is incorrect, the fair value of the investments in real estate may not be sufficient to recover our NBV in such assets, resulting in the need for additional charge-offs. Additional material charge-offs to our investments in real estate could have a material adverse effect on our financial condition and results of operations.
In addition, bank regulators periodically review our real estate owned and may require us to recognize further charge-offs. Any increase in our charge-offs, as required by the bank regulators, may have a material adverse effect on our financial condition and results of operations.
Fluctuating interest rates can adversely affect our profitability.
Our profitability is dependent to a large extent upon net interest income, which is the difference, or spread, between the interest earned on loans, securities and other interest-earning assets and the interest paid on deposits, borrowings, and other interest-bearing liabilities. Because of the differences in maturities and repricing characteristics of our interest-earning assets and interest-bearing liabilities, changes in interest rates do not produce equivalent changes in interest income earned on interest-earning assets and interest paid on interest-bearing liabilities. We principally manage interest rate risk by managing our volume and mix of our earning assets and funding liabilities. In a changing interest rate environment, we may not be able to manage this risk effectively. Changes in interest rates also can affect: (1) our ability to originate and/or sell loans; (2) the fair value of our financial assets and liabilities, which could negatively impact shareholders' equity, and our ability to realize gains from the sale of such assets; (3) our ability to obtain and retain deposits in competition with other available investment alternatives; (4) the ability of our borrowers to repay adjustable or variable rate loans; and (5) the average duration of our mortgage backed securities portfolio and other interest-earning assets.
If the interest rates paid on deposits and other borrowings increase at a faster rate than the interest rates received on loans and other investments, our net interest income, and therefore earnings, could be adversely affected. As a result of the relatively low interest rate environment, an increasing percentage of our deposits have been comprised of short-term certificates of deposit and other deposits yielding no or a relatively low rate of interest. At June 30, 2013, we had $51.7 million in certificates of deposit that mature within one year and $39.7 million in non-interest bearing demand deposits. We would incur a higher cost of funds to retain these deposits in a rising interest rate environment. Earnings could also be adversely affected if the interest rates received on loans and other investments fall more quickly than the interest rates paid on deposits and other borrowings. In addition, a substantial amount of our mortgage loans and home equity loans have adjustable interest rates. As a result, these loans may experience a higher rate of default in a rising interest rate environment. Further, a prolonged period of exceptionally low market interest rates, such as we are currently experiencing, could have an adverse effect on our results of operations as a result of substantially reduced asset yields.
Although management believes it has implemented effective asset and liability management strategies to reduce the potential effects of changes in interest rates on our results of operations, any substantial, unexpected or prolonged change in market interest
48
Table of Contents
rates could have a material adverse effect on our financial condition and results of operations. Also, our interest rate risk modeling techniques and assumptions likely may not fully predict or capture the impact of actual interest rate changes on our balance sheet.
Historically low interest rates may adversely affect our net interest income and profitability .
During the last four years it has been the policy of the Federal Reserve to maintain interest rates at historically low levels through its targeted federal funds rate and the purchase of mortgage-backed securities. As a result, yields on securities we have purchased, and market rates on the loans we have originated, have been at levels lower than were available prior to 2008. Consequently, the average yield on our interest-earning assets has decreased during the recent low interest rate environment. As a general matter, our interest-bearing liabilities re-price or mature more quickly than our interest-earning assets, which has contributed to increases in net interest income in the short term. However, our ability to lower our interest expense is limited at these interest rate levels, while the average yield on our interest-earning assets may continue to decrease. How long the Federal Reserve will maintain low interest rates in the future is unknown. So long as a low interest rate environment is maintained, our net interest income may decrease, which may have an adverse effect on our profitability. For information with respect to changes in interest rates, see "Fluctuating interest rates can adversely affect our profitability."
Decreases in noninterest income could adversely affect our ability to return to profitability and, if we cannot generate and increase our income, our stock price may be adversely affected.
Our net interest income has decreased steadily in recent years. We also face significant challenges that will hinder our ability to generate competitive returns. Our most significant challenge has been our low interest rate spread and margin during recent periods. As a result, we have become even more reliant on our noninterest income, including from time to time significant gains on sales of investments in order to increase noninterest income. These gains on sales of investments are subject to market and other risks and cannot be relied upon. During the years ended June 30, 2013 and 2012, net interest income before provision for loan losses was less than noninterest expense by $4.4 million and $5.7 million, respectively. While we have identified various strategic initiatives that we will pursue in our efforts to overcome these challenges and improve earnings, our strategic initiatives may not succeed in generating and increasing income. If we are unable to generate or increase income, our stock price may be adversely affected.
In addition, we originate and sell residential mortgage loans. Changes in interest rates affect demand for our residential loan products and the revenue realized on the sale of loans. A decrease in the volume of loans sold can decrease our revenues and net income. Further, recent regulatory changes to the rules for overdraft fees for debit transactions and interchange fees have reduced our fee income, resulting in a reduction of our noninterest income.
Liquidity risk could impair our ability to fund operations and jeopardize our financial condition, and growth prospects.
Liquidity is essential to our business. An inability to raise funds through deposits, borrowings, the sale of loans and other sources could have a substantial negative effect on our liquidity. We rely on customer deposits and advances from the Federal Home Loan Bank of Seattle ("FHLB") and other borrowings to fund our operations. At June 30, 2013, we had $64.9 million of FHLB advances outstanding with an additional $14.3 million of available borrowing capacity. Additionally we have $1.1 million available with the Federal Reserve. Although we have historically been able to replace maturing deposits and advances if desired, we may not be able to replace such funds in the future if, among other things, our financial condition, the financial condition of the FHLB, or market conditions change. Our access to funding sources in amounts adequate to finance our activities or the terms of which are acceptable could be impaired by factors that affect us specifically or the financial services industry or economy in general. Factors that could detrimentally impact our access to liquidity sources include a decrease in the level of our business activity as a result of a downturn in the Washington or Oregon markets where our loans are concentrated, or adverse regulatory action against us. Our ability to borrow could also be impaired by factors that are not specific to us, such as a disruption in the financial markets or negative views and expectations about the prospects for the financial services industry.
Our financial flexibility will be severely constrained if we are unable to maintain our access to funding or if adequate financing is not available to accommodate future growth at acceptable interest rates. Although we consider our sources of funds adequate for our liquidity needs, we may seek additional debt in the future to achieve our long-term business objectives. Additional borrowings, if sought, may not be available to us or, if available, may not be available on reasonable terms. If additional financing sources are unavailable, or are not available on reasonable terms, our financial condition, results of operations, growth and future prospects could be materially adversely affected. Finally, if we are required to rely more heavily on more expensive funding sources to support future growth, our revenues may not increase proportionately to cover our costs. In this case, our operating margins and profitability would be adversely affected.
49
Table of Contents
We operate in a highly regulated environment and may be adversely affected by changes in federal and state laws and regulations that are expected to increase our costs of operations.
Anchor Bank is subject to extensive examination, supervision and comprehensive regulation by the FDIC and the DFI, and Anchor Bancorp is subject to examination and supervision by the Federal Reserve. The FDIC, DFI and the Federal Reserve govern the activities in which we may engage, primarily for the protection of depositors and the Deposit Insurance Fund. These regulatory authorities have extensive discretion in connection with their supervisory and enforcement activities, including the ability to impose restrictions on an institution's operations, reclassify assets, determine the adequacy of an institution's allowance for loan losses and determine the level of deposit insurance premiums assessed.
Additionally, the Dodd-Frank Wall Street Reform and Consumer Protection Act (the "Dodd-Frank Act") has significantly changed the bank regulatory structure and will affect the lending, deposit, investment, trading and operating activities of financial institutions and their holding companies. The Dodd-Frank Act requires various federal agencies to adopt a broad range of new implementing rules and regulations, and to prepare numerous studies and reports for Congress. The federal agencies are given significant discretion in drafting and implementing rules and regulations, and consequently, many of the details and much of the impact of the Dodd-Frank Act may not be known for many months or years.
Certain provisions of the Dodd-Frank Act are expected to have a near term impact on Anchor Bank. For example, a provision of the Dodd-Frank Act eliminates the federal prohibitions on paying interest on demand deposits, thus allowing businesses to have interest bearing checking accounts. Depending on competitive responses, this significant change to existing law could have an adverse impact on our interest expense.
The Dodd-Frank Act also broadens the base for FDIC insurance assessments. Assessments are now based on the average consolidated total assets less tangible equity capital of a financial institution. The Dodd-Frank Act also permanently increased the maximum amount of deposit insurance for banks, savings institutions and credit unions to $250,000 per depositor.
The Dodd-Frank Act requires publicly traded companies to give stockholders a non-binding vote on executive compensation and so-called "golden parachute" payments and authorizes the SEC to promulgate rules that would allow stockholders to nominate their own candidate using a company's proxy materials. The legislation also directs the Federal Reserve to promulgate rules prohibiting excessive compensation paid to bank holding company executives, regardless of whether the company is publicly traded or not.
The Dodd-Frank Act created a new Consumer Financial Protection Bureau with broad powers to supervise and enforce consumer protection laws. The Consumer Financial Protection Bureau has broad rule-making authority for a wide range of consumer protection laws that apply to all banks and savings institutions, including the authority to prohibit "unfair, deceptive or abusive" acts and practices. The Consumer Financial Protection Bureau has examination and enforcement authority over all banks and savings institutions with more than $10 billion in assets. Financial institutions such as Anchor Bank with $10 billion or less in assets will continue to be examined for compliance with the consumer laws by their primary bank regulators, but are subject to the rules of the Consumer Financial Protection Bureau.
In June 2012, the Federal Reserve approved final rules and the FDIC subsequently interim final rules that substantially amend the regulatory risk-based capital rules applicable to us. The final rules implement the "Basel III" regulatory capital reforms and changes required by the Dodd-Frank Act.
The short-term and long-term impact of the changing regulatory capital requirements and new capital rules is uncertain.
On July 2, 2013, the Federal Reserve approved a final rule ("Final Rule") to establish a new comprehensive regulatory capital framework for all US banking organizations. On July 9, 2013, the Final Rule was approved as an interim final rule by the FDIC. These new requirements establish the following minimum capital ratios: (1) a common equity Tier 1 ("CET1") capital ratio of 4.5% of risk-weighted assets; (2) a Tier 1 capital ratio of 6.0% of risk-weighted assets; (3) a total capital ratio of 8.0% of risk-weighted assets; and 94) a leverage ratio of 4.0%. In addition, there is a new requirement to maintain a capital conservation buffer, comprised of CET1 capital, in an amount greater than 2.5% of risk-weighted assets over the minimum capital required by each of the minimum risk-based capital ratios in order to avoid limitations on the organization's ability to pay dividends, repurchase shares or pay discretionary bonuses. The capital conservation buffer requirement will be phased in, beginning January 1, 2016, requiring during 2016 a buffer amount greater than 0.625% in order to avoid these limitations, and increasing the amount each year until beginning January 1, 2019, the buffer amount must be greater than 2.5% in order to avoid the limitation.
The new regulations also change what qualifies as capital for purposes of meeting these various capital requirements, as well as the risk-weighted of certain assets for purposes of the risk-based capital ratios.
50
Table of Contents
Under the new regulations, in order to be considered well-capitalized for prompt corrective action purposes, the Bank will be required to maintain the following ratios: (1) a CET1 ratio of at least 6.5% of risk-weighted assets; (2) a Tier 1 capital ratio of at least 8.0% of risk-weighted assets; (3) a total capital ratio of a least 10.0% of risk-weighted assets; and (4) a leverage ratio of at least 5.0%. Anchor Bank has conducted a pro forma analysis of the application of these new capital requirements as of June 30, 2013. We have determined that Anchor Bank meets all these new requirements, including the full 2.5% capital conservation buffer, and remains well-capitalized, if these new requirements had been effect on that date. Anchor Bancorp has also conducted a pro forma analysis of the application of these new capital requirements as of June 30, 2013. We have determined that Anchor Bancorp meets all these new requirements, including the full 2.5% capital conservation buffer, and remains well-capitalized, if these new requirements had been effect on that date.
The application of these more stringent capital requirements could, among other things, result in lower returns on invested capital, over time require the raising of additional capital, and result in regulatory actions if we were to be unable to comply with such requirements. Implementation of changes to asset risk weightings for risk based capital calculations, items included or deducted in calculating regulatory capital and/or additional capital conservation buffers could result in management modifying its business strategy and could limit our ability to make distributions, including paying out dividends or buying back shares. Furthermore, the imposition of liquidity requirements in connection with the implementation of Basel III could result in our having to lengthen the term of our funding, restructure our business models, and/or increase our holdings of liquid assets. Any additional changes in our regulation and oversight, in the form of new laws, rules and regulations could make compliance more difficult or expensive or otherwise materially adversely affect our business, financial condition or prospects.
Our growth or future losses may require us to raise additional capital in the future, but that capital may not be available when it is needed or the cost of that capital may be very high.
We are required by federal and state regulatory authorities to maintain adequate levels of capital to support our operations. At some point, we may need to raise additional capital to support continued growth.
Our ability to raise additional capital, if needed, will depend on conditions in the capital markets at that time, which are outside our control, and on our financial condition and performance. Accordingly, we may not be able to raise additional capital if needed on terms that are acceptable to us, or at all. If we cannot raise additional capital when needed, our operations could be materially impaired and our financial condition and liquidity could be materially and adversely affected. In addition, if we are unable to raise additional capital when required by the FDIC and DFI, we may be subject to additional adverse regulatory action. See "– We are subject to increased regulatory scrutiny and are subject to certain business limitations. Further, we may be subject to more severe future regulatory enforcement actions if our financial condition or performance weakens further." above.
If our investment in the Federal Home Loan Bank of Seattle becomes impaired, our earnings and shareholders' equity could decrease.
At June 30, 2013, we owned $6.3 million in FHLB stock. Our stock purchase requirement is based, in part, upon the outstanding principal balance of advances from the FHLB and is calculated in accordance with the FHLB's Capital Plan. Our FHLB stock has a par value of $100, is carried at cost, and it is subject to recoverability testing per applicable accounting standards. The FHLB has announced that it had a risk-based capital deficiency under the regulations of the Federal Housing Finance Agency, its primary regulator, as of December 31, 2008, and that it would suspend future dividends and the repurchase and redemption of outstanding common stock. As a result, the FHLB has not paid a dividend since the fourth quarter of 2008. In September 2012, the FHLB announced that the FHFA now considers the FHLB to be adequately capitalized. The FHLB also announced that it had been granted authority to repurchase up to $25 million of excess capital stock per quarter, provided they receive a non-objection from the FHFA. As of June 30, 2013, the FHLB had repurchased $ 231,700 of its stock, at par, from Anchor Bank. The FHLB announced July 22, 2013 that, based on second quarter 2013 financial results, their Board of Directors had declared a $0.025 per share cash dividend. It is the first dividend in a number of years and represents a significant milestone in FHLB's return to normal operations. As a result, we have not recorded an impairment on our investment in FHLB stock. Deterioration in the FHLB's financial position may, however, result in future impairment in the value of those securities. We will continue to monitor the financial condition of the FHLB as it relates to, among other things, the recoverability of our investment.
New or changes in existing tax, accounting, and regulatory rules and interpretations could significantly impact strategic initiatives, results of operations, cash flows, and financial condition.
The financial services industry is extensively regulated. Federal and state banking regulations are designed primarily to protect the deposit insurance funds and consumers, not to benefit our shareholders. Regulatory authorities have extensive discretion in connection with their supervisory and enforcement activities, including the imposition of restrictions on the operation of an institution, the classification of assets by the institution and the adequacy of an institution's allowance for loan losses. Additionally,
51
Table of Contents
actions by regulatory agencies or significant litigation against us could require us to devote significant time and resources to defending our business and may lead to penalties that materially affect us. These regulations, along with the currently existing tax, accounting, securities, insurance, and monetary laws, regulations, rules, standards, policies, and interpretations control the methods by which financial institutions conduct business, implement strategic initiatives and tax compliance, and govern financial reporting and disclosures. These laws, regulations, rules, standards, policies, and interpretations are constantly evolving and may change significantly over time.
You may not receive dividends on our common stock.
It is not expected that we will pay cash dividends on our common stock in the near future. Holders of our common stock are only entitled to receive such dividends as our Board of Directors may declare out of funds legally available for such payments. Under the Supervisory Directive, Anchor Bank is not able to pay dividends to Anchor Bancorp without the prior approval of the DFI and the FDIC and we do not expect to pay dividends as long as the Supervisory Directive remains in effect. In addition, we are restricted by the FDIC from making any distributions to stockholders that represent a return of capital without the written non-objection of the FDIC Regional Director. The declaration and payment of future cash dividends will be subject to, among other things, our then current and projected consolidated operating results, financial condition, tax considerations, statutory and regulatory restrictions, future growth plans, general economic conditions, and other factors the board deems relevant.
Item 1B. Unresolved Staff Comments
None.
Item 2. Properties
At June 30, 2013, we had one administrative office, 11 full service banking offices and two loan centers of which 11 locations are owned and three locations are leased. At June 30, 2013, the net book value of our investment in premises, equipment and leaseholds was $11.4 million. The net book value of our data processing and computer equipment at June 30, 2013 was $327,000.
The following table provides a list of our main and branch offices and indicates whether the properties are owned or leased:
52
Table of Contents
Location |
| Leased or Owned |
| Lease Expiration Date |
| Square Footage |
| Net Book Value at June 30, 2013 | ||||
|
|
|
|
|
|
|
| (In thousands) | ||||
ADMINISTRATIVE OFFICE |
|
|
|
|
|
|
|
| ||||
100 West First Aberdeen, Washington 98520 |
| Owned |
| - | |
| 7,410 | |
| $ | 2,100 | |
|
|
|
|
|
|
|
|
| ||||
BRANCH OFFICES: |
|
|
|
| |
|
| |
|
| ||
|
|
|
|
|
|
|
|
| ||||
Aberdeen (1) (2) 120 N. Broadway Aberdeen, Washington 98520 |
| Owned |
| - | |
| 17,550 | |
| 1,244 | | |
|
|
|
|
|
|
|
|
| ||||
Centralia (2) 604 S. Tower Centralia, Washington 98531 |
| Owned |
| - | |
| 3,000 | |
| 633 | | |
|
|
|
|
|
|
|
|
| ||||
Elma (2) 216 S. Third Street Elma, Washington 98541 |
| Owned |
| - | |
| 2,252 | |
| 264 | | |
|
|
|
|
|
|
|
|
| ||||
Hoquiam 701 Simpson Avenue Hoquiam, Washington 98550 |
| Leased |
| 6/30/2014 |
| 550 | |
| 3 | | ||
|
|
|
|
|
|
|
|
| ||||
Lacey (4) 601 Woodland Square Loop SE Lacey, Washington 98503 |
| Owned |
| - | |
| 13,505 | |
| 1,900 | | |
|
|
|
|
|
|
|
|
| ||||
Montesano 301 Pioneer Avenue East Montesano, Washington 98563 |
| Owned |
| - | |
| 2,125 | |
| 2,869 | | |
|
|
|
|
|
|
|
|
| ||||
Ocean Shores (2) 795 Pt. Brown Avenue NW Ocean Shores, Washington 98569 |
|
Owned |
| - | |
| 2,550 | |
| 604 | | |
|
|
|
|
|
|
|
|
| ||||
Olympia (2) 2610 Harrison Avenue West Olympia, Washington 98502 |
| Owned |
| - | |
| 1,882 | |
| 446 | | |
( table continued on following page ) | ||||||||||||
53
Table of Contents
Location |
| Leased or Owned |
| Lease Expiration Date |
| Square Footage |
|
Net Book Value at June 30, 2013 | | ||
Puyallup (3) 16502 Meridian Avenue E, Suite B Puyallup, Washington 98375 |
| Leased |
| 1/31/2015 |
| 982 | |
| 83 | | |
|
|
|
|
|
|
|
|
| |||
Shelton (3) 100 E. Wallace Kneeland Boulevard Shelton, Washington 98584 |
| Leased |
| 5/31/2018 |
| 673 | |
| 4 | | |
|
|
|
|
|
|
|
|
| |||
Westport (2) 915 N. Montesano Westport, Washington 98595 |
| Owned |
| - | |
| 3,850 | |
| 1,009 | |
|
|
|
|
|
|
|
|
| |||
LOAN OFFICES: |
|
|
|
| |
|
| |
|
| |
|
|
|
|
|
|
|
|
| |||
Aberdeen 211 E. Market Street Aberdeen, Washington 98520 |
| Owned |
| - | |
| 12,825 | |
| 13 | |
|
|
|
|
|
|
|
|
| |||
Aberdeen 215 E. Market Street Aberdeen, Washington 98520 |
| Owned |
| - | |
| 12,000 | |
| 186 | |
________
(1) | Includes our home branch. |
(2) | Drive-up ATM available. |
(3) | Wal-Mart locations. |
(4) | Includes space leased. |
Item 3. Legal Proceedings
The Company or Anchor Bank from time to time is involved in various claims and legal actions arising in the ordinary course of business. There are currently no matters that in the opinion of management, would have material adverse effect on our consolidated financial position, results of operation, or liquidity.
Item 4. Mine Safety Disclosures
Not applicable
54
Table of Contents
PART II
Item 5. Market for Registrant's Common Equity, Related Stockholder Matters and Issuer Purchases of Equity Securities
Our common stock is traded on The Nasdaq Stock Market LLC's Global Market, under the symbol "ANCB." As of June 30, 2013, there were 2,550,000 shares of common stock issued and outstanding and we had approximately 293 shareholders of record, excluding persons or entities who hold stock in nominee or "street name" accounts with brokers. The Company has not paid any dividends to shareholders since its formation.
Under Washington law, the Company is prohibited from paying a dividend if, as a result of its payment, the Company would be unable to pay its debts as they become due in the normal course of business, or if the Company's total liabilities would exceed its total assets. The principal source of funds for the Company is dividend payments from the Bank. According to Washington law, Anchor Bank may not declare or pay a cash dividend on its capital stock if it would cause its net worth to be reduced below (1) the amount required for liquidation accounts or (2) the net worth requirements, if any, imposed by the Director of the DFI. Dividends on Anchor Bank's capital stock may not be paid in an aggregate amount greater than the aggregate retained earnings of Anchor Bank, without the approval of the Director of the DFI. Under the Supervisory Directive, Anchor Bank is not able to pay dividends to Anchor Bancorp without the prior approval of the DFI and the FDIC and we do not expect to be permitted to pay dividends as long as the Supervisory Directive remains in effect. In addition, we are restricted by the FDIC from making any distributions to stockholders that represent a return of capital without the written non-objection of the FDIC Regional Director. See Item 1A, "Risk Factors - We are subject to increased regulatory scrutiny and are subject to certain business limitations. Further, we may be subject to more severe future regulatory enforcement actions if our financial condition or performance weakens."
Stock Repurchases. The Company had no stock repurchases of its outstanding common stock during the fourth quarter of the year ended June 30, 2013.
Equity Compensation Plan Information. The equity compensation plan information presented under subparagraph (d) in Part III, Item 12 of this report is incorporated herein by reference.
55
Table of Contents
Performance Graph. The following graph compares the cumulative total shareholder return on the Company's Common Stock with the cumulative total return on the NASDAQ Composite Index and a peer group of the SNL All Thrift Index. Total return assumes the reinvestment of all dividends and that the value of Common Stock and each index was $100 on January 26, 2011.
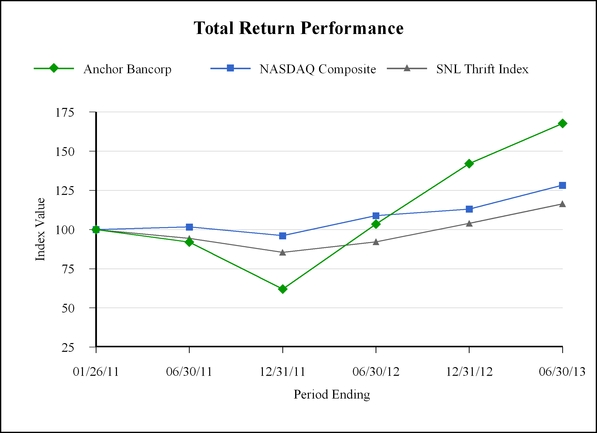
| Period Ending | ||||||||||||||||||||||
Index | 01/26/11 | |
| 06/30/11 | |
| 12/31/11 | |
| 06/30/12 | |
| 12/31/12 | |
| 06/30/13 | | ||||||
Anchor Bancorp | $ | 100.00 | |
| $ | 92.00 | |
| $ | 62.00 | |
| $ | 103.40 | |
| $ | 142.00 | |
| $ | 167.70 | |
NASDAQ Composite | 100.00 | |
| 101.67 | |
| 96.05 | |
| 108.85 | |
| 113.09 | |
| 128.27 | | ||||||
SNL Thrift Index | 100.00 | |
| 94.32 | |
| 85.43 | |
| 92.20 | |
| 103.91 | |
| 116.40 | | ||||||
Source: SNL Financial LC, Charlottesville, VA
56
Table of Contents
Item 6. Selected Financial Data
The following table sets forth certain information concerning our consolidated financial position and results of operations at and for the dates indicated and have been derived from our audited consolidated financial statements. The information below is qualified in its entirety by the detailed information included elsewhere herein and should be read along with Item 7. "Management's Discussion and Analysis of Financial Condition and Results of Operations" and Item 8. "Financial Statements and Supplementary Data."
| At June 30, | ||||||||||||||||||
| 2013 |
| 2012 |
| 2011 |
| 2010 |
| 2009 | ||||||||||
FINANCIAL CONDITION DATA: | (In thousands) | ||||||||||||||||||
Total assets | $ | 452,179 | |
| $ | 470,815 | |
| $ | 488,935 | |
| $ | 544,829 | |
| $ | 652,435 | |
Securities | 1,591 | |
| 1,798 | |
| 5,594 | |
| 6,737 | |
| 9,337 | | |||||
Mortgage-backed securities | 57,012 | |
| 54,098 | |
| 40,156 | |
| 52,077 | |
| 70,530 | | |||||
Loans receivable, net (1) | 277,454 | |
| 287,755 | |
| 325,464 | |
| 389,411 | |
| 474,957 | | |||||
Deposits | 328,584 | |
| 345,798 | |
| 339,474 | |
| 355,788 | |
| 471,713 | | |||||
FHLB advances | 64,900 | |
| 64,900 | |
| 85,900 | |
| 136,900 | |
| 129,500 | | |||||
Total equity | 52,368 | |
| 54,024 | |
| 57,452 | |
| 44,670 | |
| 42,914 | | |||||
| Year Ended June 30, | ||||||||||||||||||
OPERATING DATA: | 2013 |
| 2012 |
| 2011 |
| 2010 |
| 2009 | ||||||||||
| (In thousands) | ||||||||||||||||||
Total interest income | $ | 19,727 | |
| $ | 22,464 | |
| $ | 25,969 | |
| $ | 32,503 | |
| $ | 37,050 | |
Total interest expense | 4,764 | |
| 6,090 | |
| 8,002 | |
| 14,650 | |
| 20,748 | | |||||
Net interest income before provision for loan losses | 14,963 | |
| 16,374 | |
| 17,967 | |
| 17,853 | |
| 16,302 | | |||||
Provision for loan losses | 750 | |
| 2,735 | |
| 8,078 | |
| 2,615 | |
| 20,263 | | |||||
Net interest income (loss) after provision for loan losses | 14,213 | |
| 13,639 | |
| 9,889 | |
| 15,238 | |
| (3,961 | ) | |||||
Noninterest income | 4,924 | |
| 6,674 | |
| 5,752 | |
| 6,807 | |
| 5,777 | | |||||
Noninterest expense | 19,392 | |
| 22,025 | |
| 24,461 | |
| 24,583 | |
| 24,992 | | |||||
Income (loss) before provision (benefit) for income tax | (255 | ) |
| (1,712 | ) |
| (8,820 | ) |
| (2,538 | ) |
| (23,176 | ) | |||||
Total benefit for income tax | - | |
| - | |
| - | |
| (2,958 | ) |
| (2,923 | ) | |||||
Net income (loss) | $ | (255 | ) |
| $ | (1,712 | ) |
| $ | (8,820 | ) |
| $ | 420 | |
| $ | (20,253 | ) |
__________________
(1) Net of allowances for loan losses, loans in process and deferred loan fees.
| At June 30, | |||||||||||||
OTHER DATA: | 2013 |
| 2012 |
| 2011 |
| 2010 |
| 2009 | |||||
Number of: |
|
|
|
|
|
|
|
|
| |||||
Real estate loans outstanding | 1,733 | |
| 1,950 | |
| 2,222 | |
| 2,463 | |
| 2,499 | |
Deposit accounts | 23,366 | |
| 25,411 | |
| 26,837 | |
| 29,035 | |
| 31,951 | |
Full-service offices | 11 | |
| 13 | |
| 14 | |
| 16 | |
| 16 | |
57
Table of Contents
| At or For the Year Ended June 30, | |||||||||||||
KEY FINANCIAL RATIOS: | 2013 |
| 2012 |
| 2011 |
| 2010 |
| 2009 | |||||
Performance Ratios: |
|
|
|
|
|
|
|
|
| |||||
Return on assets (1) | (0.05 | )% |
| (0.36 | )% |
| (1.72 | )% |
| 0.07 | % |
| (3.02 | )% |
Return on equity (2) | (0.49 | ) |
| (3.13 | ) |
| (16.66 | ) |
| 0.86 | |
| (34.70 | ) |
Equity to total assets ratio (3) | 11.23 | |
| 11.36 | |
| 10.32 | |
| 8.07 | |
| 8.72 | |
Interest rate spread (4) | 3.35 | |
| 3.43 | |
| 3.57 | |
| 3.00 | |
| 2.17 | |
Net interest margin (5) | 3.53 | |
| 3.65 | |
| 3.78 | |
| 3.22 | |
| 2.58 | |
Average interest-earning assets to average interest-bearing liablities | 115.9 | |
| 116.4 | |
| 112.3 | |
| 108.5 | |
| 112.5 | |
Efficiency ratio (6) | 97.5 | |
| 95.6 | |
| 103.1 | |
| 99.7 | |
| 113.2 | |
Other operating expenses as a percent of average total assets | 4.2 | |
| 4.6 | |
| 4.8 | |
| 4.1 | |
| 3.7 | |
|
|
|
|
|
|
|
|
|
| |||||
Anchor Bank Capital Ratios: |
|
|
| |
|
| |
|
| |
|
| | |
Tier I leverage | 11.4 | |
| 10.9 | |
| 10.7 | |
| 7.6 | |
| 6.2 | |
Tier I risk-based | 16.7 | |
| 17.0 | |
| 15.8 | |
| 10.5 | |
| 8.9 | |
Total risk-based | 18.0 | |
| 18.2 | |
| 17.1 | |
| 11.8 | |
| 10.1 | |
|
|
|
|
|
|
|
|
|
| |||||
Asset Quality Ratios: |
|
|
| |
|
| |
|
| |
|
| | |
Nonaccrual and 90 days or more past due loans as a percent of total loans | 2.2 | |
| 3.0 | |
| 4.3 | |
| 5.1 | |
| 12.1 | |
Nonperforming assets as a percent of total assets | 2.7 | |
| 3.3 | |
| 5.5 | |
| 6.5 | |
| 9.8 | |
Allowance for loan losses as a percent of total loans | 1.8 | |
| 2.4 | |
| 2.2 | |
| 4.1 | |
| 4.9 | |
Allowance for loan losses as a percent of nonperforming loans | 83.6 | |
| 80.9 | |
| 51.1 | |
| 81.3 | |
| 40.3 | |
Net charge-offs to average outstanding loans | 0.9 | |
| 0.9 | |
| 4.7 | |
| 2.3 | |
| 0.6 | |
_______________________
(1) | Net income (loss) divided by average total assets. |
(2) | Net income (loss) divided by monthly average equity. |
(3) | Average equity divided by average total assets. |
(4) | Difference between weighted average yield on interest-earning assets and weighted average rate on interest-bearing liabilities. |
(5) | Net interest income as a percentage of average interest-earning assets. |
(6) | The efficiency ratio represents the ratio of noninterest expense divided by the sum of net interest income and noninterest income. |
58
Table of Contents
Item 7. Management's Discussion and Analysis of Financial Condition and Results of Operations
This discussion and analysis reviews our consolidated financial statements and other relevant statistical data and is intended to enhance your understanding of our financial conditions and results of operations. The information in this section has been derived from the Consolidated Financial Statements and footnotes thereto, which are included in Item 8 of this Form 10-K. You should read the information in this section in conjunction with the business and financial information regarding us as provided in this Form 10-K. Unless otherwise indicated, the financial information presented in this section reflects the consolidated financial condition and results of operations of Anchor Bancorp and its subsidiary.
Overview
Anchor Bancorp is a bank holding company which primarily engages in the business activity of its subsidiary, Anchor Bank. Anchor Bank is a community-based savings bank primarily serving Western Washington through our 11 full-service banking offices (including two Wal-Mart store locations) located within Grays Harbor, Thurston, Lewis, Pierce, and Mason counties, Washington. In addition we have two loan production offices located in Grays Harbor County. We are in the business of attracting deposits from the public and utilizing those deposits to originate loans. We offer a wide range of loan products to meet the demands of our customers. Historically, lending activities have been primarily directed toward the origination of one-to-four family construction, commercial real estate and consumer loans. Since 1990, we have also offered commercial real estate loans and multi-family loans primarily in Western Washington. Lending activities also include the origination of residential construction loans, and prior to fiscal 2010, a significant amount of originations through brokers, in particular within the Portland, Oregon metropolitan area.
Historically, we used wholesale sources to fund wholesale loan growth - typically FHLB advances or brokered certificates of deposit depending on the relative cost of each and our interest rate position. Our current strategy is to utilize FHLB advances consistent with our asset liability objectives. We currently do not utilize brokered certificates of deposit as we are limiting loan growth consistent with our regulatory and capital objectives. While continuing our commitment to real estate lending, management expects to continue to reduce our exposure to construction loans while commercial business lending becomes increasingly more important for us.
Our primary source of pre-tax income is net interest income. Net interest income is the difference between interest income, which is the income that we earn on our loans and investments, and interest expense, which is the interest that we pay on our deposits and borrowings. Changes in levels of interest rates also affect our net interest income. Additionally, to offset the impact of the current low interest rate environment, we are seeking other means of increasing interest income while controlling expenses. We intend to enhance the mix of our assets by increasing commercial business relationships which have higher risk-adjusted returns as well as increasing deposits. A secondary source of income is noninterest income, which includes gains on sales of assets, and revenue we receive from providing products and services. In recent years, our noninterest expense has exceeded our net interest income after provision for loan losses and we have relied primarily upon gains on sales of assets (primarily sales of investments and mortgage loans to Freddie Mac) to supplement our net interest income.
Our operating expenses consist primarily of compensation and benefits, general and administrative, information technology, occupancy and equipment, deposit services and marketing expenses. Compensation and benefits expense consist primarily of the salaries and wages paid to our employees, payroll taxes, expenses for retirement and other employee benefits. Occupancy and equipment expenses, which are the fixed and variable costs of building and equipment, consist primarily of lease payments, taxes, depreciation charges, maintenance and costs of utilities.
Compliance With Regulatory Restrictions
Anchor Bank entered into the Order with the FDIC and the Washington DFI on August 12, 2009. The Order was terminated on September 5, 2012 as a result of the steps Anchor Bank took in complying with the Order and reducing its level of classified assets, augmenting management and improving the overall condition of Anchor Bank. In place of the Order, Anchor Bank entered into a Supervisory Directive with the DFI.
Correcting the problems identified in the Order has caused us to revise our operating strategy and has had a resulting impact on our financial condition and results of operations. We have reduced our asset size from $652.4 million at June 30, 2009 to $452.2 million at June 30, 2013 as we have sought to reduce our concentration in construction lending and commercial real estate loans, to preserve our capital and maximize our regulatory capital ratios. In addition, in fiscal 2010 we sold relatively high yielding performing fixed rate single family loans which has reduced our net interest income in recent periods. Also, because of the reduced demand for commercial real estate loans, we have sold these loans at a discount which has negatively impacted our operating
59
Table of Contents
result s. The reduction in asset size has helped us preserve our capital and maximize our regulatory capital ratios as we took action to achieve and maintain compliance with the requirements of the Order and Supervisory Directive.
In addition to the reduction in assets we also reduced certain types of liabilities. We had relied on wholesale funds such as brokered deposits in some cases to fund lending transactions and as a result of the Order we significantly reduced brokered certificates and our reliance on wholesale funds and have increased our reliance on core deposits which has decreased our cost of funds. At June 30, 2013, we had eliminated all brokered deposits as compared to $84.7 million of brokered deposits at June 30, 2009.
The Supervisory Directive contains provisions concerning (i) the management and directors of Anchor Bank; (ii) restrictions on paying dividends; (iii) reductions of classified assets; (iv) maintaining Tier 1 capital in an amount equal to or exceeding 10% of Anchor Bank's total assets; (v) policies concerning the allowance for loan and lease losses ("ALLL"); and (vi) requirements to furnish a revised three-year business plan to improve Anchor Bank's profitability and progress reports to the FDIC and DFI.
Management and the Board of Directors have and will be taking action and implementing programs to comply with the requirements of the Supervisory Directive.
Operating Strategy
Our focus is on managing our problem assets, increasing our higher-yielding assets (in particular commercial business loans), increasing our core deposit balances, reducing expenses, and retaining experienced employees with a commercial lending focus. We seek to achieve these results by focusing on the following objectives:
Focusing on Asset Quality. We have de-emphasized new loan originations for investment purposes to focus on monitoring existing performing loans, resolving nonperforming loans and selling foreclosed assets. We have aggressively sought to reduce our level of nonperforming assets through write-downs, collections, modifications and sales of nonperforming loans and the sale of properties once they become real estate owned. We have taken proactive steps to resolve our nonperforming loans, including negotiating repayment plans, forbearances, loan modifications and loan extensions with our borrowers when appropriate, and accepting short payoffs on delinquent loans, particularly when such payoffs result in a smaller loss to us than foreclosure. We also have added experienced personnel to the department that monitors our loans to enable us to better identify problem loans in a timely manner and reduce our exposure to a further deterioration in asset quality, including a new Chief Lending Officer in 2008 and a new Credit Administration Officer in 2009. During the latter part of fiscal 2007, as part of management's decision to reduce the risk profile of our loan portfolio, we implemented more stringent underwriting guidelines and procedures. Prior to this time our underwriting emphasis with respect to commercial real estate, multi-family and construction loans focused heavily on the value of the collateral securing the loan, with less emphasis placed on the borrower's debt servicing capacity or other credit factors. Our revised underwriting guidelines place greater emphasis on the borrower's credit, debt service coverage and cash flows as well as on collateral appraisals. Additionally, our policies with respect to loan extensions became more conservative than our previous policies, and now require that a review of all relevant factors, including loan terms, the condition of the security property, market changes and trends that may affect the security property and financial condition of the borrower conform to our revised underwriting guidelines and that the extension be in our best interest.
Improving our Earnings by Expanding Our Product Offerings . We intend, subject to market conditions, to prudently increase the percentage of our assets consisting of higher-yielding commercial business loans, which offer higher risk-adjusted returns, shorter maturities and more sensitivity to interest rate fluctuations. At June 30, 2013, our commercial business loans totaled $18.2 million, or 6.4% of our total loan portfolio. We also intend to selectively add additional products to further diversify revenue sources and to capture more of each customer's banking relationship by cross selling our loan and deposit products and additional services to our customers such as electronic invoicing and payroll services for our business customers.
Attracting Core Deposits and Other Deposit Products. Our strategic focus is to emphasize total relationship banking with our customers to increase core deposits to internally fund our loan growth. The Company has reduced its reliance on other wholesale funding sources, including FHLB advances and brokered deposits, by focusing on customer deposits. We believe that by focusing on customer relationships, our level of core deposits and locally-based retail certificates of deposit will increase.
During the year ended June 30, 2013, our deposits decreased by $17.2 million, of which $21.5 million were locally-based retail certificates of deposit.
Continued Expense Control. Beginning in fiscal 2009 and continuing into fiscal 2013, management has undertaken several initiatives to reduce noninterest expense and will continue to emphasize the identification of cost savings opportunities throughout all phases of our operations. Beginning in fiscal 2009, we instituted expense control measures such as reducing staff, eliminating
60
Table of Contents
Anchor Bank's discretionary matching contribution to its 401(k) plan, reducing most marketing expenses and charitable contributions, cancelling certain projects and capital purchases, and reducing travel and entertainment expenditures. We have also reduced our number of full-time equivalent employees from 194 at September 30, 2008 to 134 at June 30, 2013. During fiscal 2009, four in store Wal-Mart branch offices were closed as a result of their failure to meet our required growth standards. During fiscal 2010, two additional in store Wal-Mart branch offices were closed. The reduction in personnel, cost savings and closure of offices, resulted in savings of approximately $1.8 million per year from the closure of these six offices. Notwithstanding these initiatives, our efforts to reduce noninterest expense were until fiscal 2013 adversely affected by the $1.0 million increase in our FDIC insurance premiums beginning in fiscal 2009 and continuing significant costs associated with our REO. Despite these significant REO costs, noninterest expense decreased by $2.6 million or 12.0% to $19.4 million during fiscal 2013 from $22.0 during fiscal 2012.
Retaining Experienced Personnel with a Focus on Relationship Banking. Our ability to continue to retain banking professionals with strong community relationships and significant knowledge of our markets will be a key to our success. We believe that we enhance our market position and add profitable growth opportunities by focusing on retaining experienced bankers who are established in their communities. We emphasize to our employees the importance of delivering exemplary customer service and seeking opportunities to build further relationships with our customers. Our goal is to compete with other financial service providers by relying on the strength of our customer service and relationship banking approach.
Disciplined Franchise Expansion. We intend to maintain our current asset size to facilitate compliance with the capital requirements of the Supervisory Directive. Once the Supervisory Directive is lifted and general economic conditions improve, we anticipate modest organic growth. We will seek to increase our loan originations and core deposits through targeted marketing efforts designed to take advantage of the opportunities being created as a result of the consolidation of financial institutions that is occurring in our market area.
Critical Accounting Policies
We use estimates and assumptions in our consolidated financial statements in accordance with generally accepted accounting principles. Management has identified several accounting policies that, due to the judgments, estimates and assumptions inherent in those policies, are critical to an understanding of our consolidated financial statements. These policies relate to the determination of the allowance for loan losses and the associated provision for loan losses, deferred income taxes and the associated income tax expense, as well as valuation of real estate owned. Management reviews the allowance for loan losses for adequacy on a monthly basis and establishes a provision for loan losses that it believes is sufficient for the loan portfolio growth expected and the loan quality of the existing portfolio. The carrying value of real estate owned is assessed on a quarterly basis. Income tax expense and deferred income taxes are calculated using an estimated tax rate and are based on management's understanding of our effective tax rate and the tax code.
Allowance for Loan Losses. Management recognizes that loan losses may occur over the life of a loan and that the allowance for loan losses must be maintained at a level necessary to absorb specific losses on impaired loans and probable losses inherent in the loan portfolio. Our Board of Directors and management assess the allowance for loan losses on a quarterly basis. The Executive Loan Committee analyzes several different factors including delinquency rates, charge-off rates and the changing risk profile of our loan portfolio, as well as local economic conditions such as unemployment rates, number of bankruptcies and vacancy rates of business and residential properties.
We believe that the accounting estimate related to the allowance for loan losses is a critical accounting estimate because it is highly susceptible to change from period to period, requiring management to make assumptions about future losses on loans. The impact of a sudden large loss could deplete the allowance and require increased provisions to replenish the allowance, which would negatively affect earnings.
Our methodology for analyzing the allowance for loan losses consists of specific allocations on significant individual credits that meet the definition of impaired and a general allowance amount. The specific allowance component is determined when management believes that the collectability of a specifically identified large loan has been impaired and a loss is probable. The general allowance component relates to assets with no well-defined deficiency or weakness and takes into consideration loss that is inherent within the portfolio but has not been realized. The general allowance is determined by applying an expected loss percentage to various classes of loans with similar characteristics and classified loans that are not analyzed specifically for impairment. Because of the imprecision in calculating inherent and potential losses, the national and local economic conditions are also assessed to determine if the general allowance is adequate to cover losses.
61
Table of Contents
The allowance is increased by the provision for loan losses, which is charged against current period operating results and decreased by the amount of actual loan charge-offs, net of recoveries.
Deferred Income Taxes. Deferred income taxes are reported for temporary differences between items of income or expense reported in the financial statements and those reported for income tax purposes. Deferred taxes are computed using the asset and liability method. Under this method, a deferred tax asset or liability is determined based on the enacted tax rates that will be in effect when the differences between the financial statement carrying amounts and tax basis of existing assets and liabilities are expected to be reported in an institution's income tax returns. Deferred tax assets are deferred tax consequences attributable to deductible temporary differences and carryforwards. After the deferred tax asset has been measured using the applicable enacted tax rate and provisions of the enacted tax law, it is then necessary to assess the need for a valuation allowance. A valuation allowance is needed when, based on the weight of the available evidence, it is more likely than not that some portion of the deferred tax asset will not be realized. As required by GAAP, available evidence is weighted heavily on cumulative losses with less weight placed on future projected profitability. Realization of the deferred tax asset is dependent on whether there will be sufficient future taxable income of the appropriate character in the period during which deductible temporary differences reverse or within the carryback and carryforward periods available under tax law. Based upon the available evidence, we carried a valuation allowance of $8.7 million at June 30, 2013. The tax provision for the period is equal to the net change in the net deferred tax asset from the beginning to the end of the period, less amounts applicable to the change in value related to securities available-for-sale. The effect on deferred taxes of a change in tax rates is recognized as income in the period that includes the enactment date. The primary differences between financial statement income and taxable income result from deferred loan fees and costs, mortgage servicing rights, loan loss reserves and dividends received from the FHLB of Seattle. Deferred income taxes do not include a liability for pre-1988 bad debt deductions allowed to thrift institutions that may be recaptured if the institution fails to qualify as a bank for income tax purposes in the future.
Real Estate Owned. Real estate acquired through foreclosure is transferred to the real estate owned asset classification at fair value estimated fair market value less estimated costs of disposal and subsequently carried at the lower of cost or market. Costs associated with real estate owned for maintenance, repair, property tax, etc., are expensed during the period incurred. Assets held in real estate owned are reviewed quarterly for potential impairment. When impairment is indicated the impairment is charged against current period operating results and netted against the real estate owned to reflect a net book value. At disposition any residual difference is either charged to current period earnings as a loss on sale or reflected as income in a gain on sale.
Comparison of Financial Condition at June 30, 2013 and June 30, 2012
General. Total assets decreased $18.6 million, or 4.0%, to $452.2 million at June 30, 2013 from $470.8 million at June 30, 2012. The decrease in assets during this period was primarily a result of a $13.3 million or 16.9% decline in cash and due from banks and a $10.3 million or 3.6% decrease in loans receivable since June 30, 2012. Securities available-for-sale decreased $409,000, or 0.8% and securities held-to-maturity increased $3.1 million, or 43.4% from June 30, 2012 as we reinvested excess liquidity into securities yielding a higher rate than obtained from our cash deposits in other banks. In addition, total real estate owned decreased $496,000, or 7.4%, to $6.2 million at June 30, 2013 from $6.7 million at June 30, 2012. Total liabilities decreased $17.0 million or 4.0% to $399.8 million at June 30, 2013 compared to $416.8 million at June 30, 2012. Total deposits decreased $17.2 million, or 5.0%, to $328.6 million at June 30, 2013 from $345.8 million at June 30, 2012 primarily as a result of a $21.5 million or 12.6% decrease in certificates of deposit. Our total borrowings, which consisted of FHLB advances, remained unchanged at $64.9 million at both June 30, 2013 and June 30, 2012. The average cost of advances increased to 1.91% during the year ended June 30, 2013 from 1.87% during the year ended June 30, 2012.
Assets. For the year ended June 30, 2013, total assets decreased $18.6 million. The following table details the increases and decreases in the composition of our assets from June 30, 2012 to June 30, 2013:
|
|
|
| |||||||||||
| Balance at June 30, 2013 |
| Balance at June 30, 2012 |
| Increase/(Decrease) | |||||||||
|
|
| Amount |
| Percent | |||||||||
| (Dollars in thousands) | |||||||||||||
Cash and due from banks | $ | 65,353 | |
| $ | 78,673 | |
| $ | (13,320 | ) |
| (16.9 | )% |
Mortgage-backed securities, available-for-sale | 46,852 | |
| 47,061 | |
| (209 | ) |
| (0.4 | ) | |||
Mortgage-backed securities, held-to-maturity | 10,160 | |
| 7,037 | |
| 3,123 | |
| 44.4 | | |||
Loans receivable, net of allowance for loan losses | 277,454 | |
| 287,755 | |
| (10,301 | ) |
| (3.6 | ) | |||
Real estate owned, net | 6,212 | |
| 6,708 | |
| (496 | ) |
| (7.4 | ) | |||
62
Table of Contents
From June 30, 2012 to June 30, 2013, cash and due from banks decreased $13.3 million. The decrease is primarily a result of a $17.2 million decline in deposits.
Mortgage-backed securities available-for-sale decreased slightly by $209,000 or 0.4% to $46.9 million at June 30, 2013 from $47.1 million at June 30, 2012. The decrease in this portfolio was primarily the result of the purchase of 13 mortgage-backed securities totaling $19.6 million, contractual principal repayments of $18.7 million, and the sale of four mortgage-backed securities totaling $1.0 million. Mortgage-backed securities held-to-maturity increased $3.1 million or 44.4% to $10.2 million at June 30, 2013 from $7.0 million at June 30, 2012. The increase in this portfolio was primarily the result of purchases of four mortgage-backed securities totaling $5.8 million and contractual principal repayments of $2.6 million.
Loans receivable, net, decreased $10.3 million or 3.6% to $277.5 million at June 30, 2013 from $287.8 million at June 30, 2012 as a result of normal principal reductions, transfers to REO and loan charge-offs exceeding new loan production. Commercial real estate loans increased $9.6 million or 9.8% to $106.9 million at June 30, 2013 from $97.3 million at June 30, 2012 and one-to-four family loans decreased $8.8 million or 10.6% to $73.9 million at June 30, 2013 from $82.7 million during the same period in 2012. The balance of construction and land loans declined to $11.0 million at June 30, 2013 compared to $13.8 million at June 30, 2012. Consumer loans decreased $7.8 million or 18.2% to $35.1 million from June 30, 2012 as consumers continue to reduce debt and demand for consumer loans has been modest during the current economic uncertainty.
Real estate owned, net decreased $496,000, or 7.4% to $6.2 million at June 30, 2013 from $6.7 million at June 30, 2012 as a result of ongoing sales to reduce our nonperforming assets. The $496,000 decline was a result of REO sales of $4.9 million and $1.5 million of REO valuation write-downs partially offset by the transfer of loans to REO totaling $5.0 million as well as $793,000 of capital improvements.
Deposits. Deposits decreased $17.2 million, or 5.0%, to $328.6 million at June 30, 2013 from $345.8 million at June 30, 2012.
The following table details the changes in deposit accounts at the dates indicated:
| Balance at June 30, 2013 |
| Balance at June 30, 2012 |
| Increase/(Decrease) | |||||||||
|
|
| Amount |
| Percent | |||||||||
| (Dollars in thousands) | |||||||||||||
Noninterest-bearing demand deposits | $ | 39,713 | |
| $ | 37,941 | |
| $ | 1,772 | |
| 4.7 | % |
Interest-bearing demand deposits | 20,067 | |
| 16,434 | |
| 3,633 | |
| 22.1 | | |||
Money market accounts | 82,603 | |
| 83,750 | |
| (1,147 | ) |
| (1.4 | ) | |||
Savings deposits | 36,518 | |
| 36,475 | |
| 43 | |
| 0.1 | | |||
Certificates of deposit | 149,683 | |
| 171,198 | |
| (21,515 | ) |
| (12.6 | ) | |||
Total deposit accounts | $ | 328,584 | |
| $ | 345,798 | |
| $ | (17,214 | ) |
| (5.0 | )% |
Borrowings. FHLB advances remained unchanged at $64.9 million at both June 30, 2013 and June 30, 2012.
Equity. Total stockholders' equity decreased $1.7 million, or 3.1%, to $52.4 million at June 30, 2013 from $54.0 million at June 30, 2012. The decrease was primarily due to the increase in accumulated other comprehensive loss of $1.5 million related to our unrealized losses on securities available-for-sale, which increased due to the recent rise in long term mortgage interest rates.
Comparison of Operating Results for the Years Ended June 30, 2013 and June 30, 2012
General. Net loss for the year ended June 30, 2013 was $255,000 or $0.10 per diluted share compared to a net loss of $1.7 million or $0.70 per diluted share for the year ended June 30, 2012.
Net Interest Income. Net interest income before the provision for loan losses decreased $1.4 million, or 8.6%, to $15.0 million for the year ended June 30, 2013, from $16.4 million for the year ended June 30, 2012. For the year ended June 30, 2013, average loans receivable, net, decreased $26.1 million or 8.2% to $292.3 million from $318.4 million for the year ended June 30, 2012.
Our net interest margin decreased 12 basis points to 3.53% for the year ended June 30, 2013, from 3.65% for the prior fiscal year. Over the last fiscal year, our net interest margin declined as a result of the decline in our cost of funds not exceeding the reduction in yield on interest-earning assets. Our yield on earnings assets decreased to 4.66% for the year ended June 30, 2013
63
Table of Contents
from 5.01% for the year ended June 30, 2012. Our funding costs have decreased from 1.58% during the year ended June 30, 2012 to 1.30% during the year ended June 30, 2013. All these declines reflect the low interest rate environment that has persisted throughout the year. We expect further declines in our funding costs as our certificates of deposit mature and reprice to current market rates. The cost for certificates of deposit decreased to 2.01%, respectively during the year ended June 30, 2013 from 2.19% for the same period of the prior year. At June 30, 2013, $51.7 million of our certificates of deposit with a weighted average rate of 1.38% will mature within one year. Our net interest rate spread decreased to 3.35% for the year ended June 30, 2013 as compared to 3.43% for the year ended June 30, 2012.
The following table sets forth the results of balance sheet growth and changes in interest rates to our net interest income. The rate column shows the effects attributable to changes in rate (changes in rate multiplied by prior volume). The volume column shows the effects attributable to changes in volume (changes in volume multiplied by prior rate). Changes attributable to both rate and volume, which cannot be segregated, are allocated proportionately to the changes in rate and volume.
|
| Year Ended June 30, 2013 Compared to June 30, 2012 | ||||||||||
|
| Increase (Decrease) Due to |
|
| ||||||||
|
| Rate |
| Volume |
| Total | ||||||
|
| (In thousands) | ||||||||||
Interest-earning assets: |
|
|
|
|
|
| ||||||
Loans receivable, net |
| $ | (491 | ) |
| $ | (1,656 | ) |
| $ | (2,147 | ) |
Mortgage-backed securities |
| (985 | ) |
| 464 | |
| (521 | ) | |||
Securities, FHLB and cash and due from banks |
| (57 | ) |
| (12 | ) |
| (69 | ) | |||
Total net change in income on interest-earning assets |
| (1,533 | ) |
| (1,204 | ) |
| (2,737 | ) | |||
Interest-bearing liabilities: |
|
|
|
|
|
| ||||||
Savings deposits |
| (121 | ) |
| 10 | |
| (111 | ) | |||
Interest bearing demand deposits |
| (44 | ) |
| 10 | |
| (34 | ) | |||
Money market accounts |
| (339 | ) |
| 30 | |
| (309 | ) | |||
Certificates of deposit |
| (291 | ) |
| (451 | ) |
| (742 | ) | |||
FHLB advances |
| 26 | |
| (156 | ) |
| (130 | ) | |||
Total net change in expense on interest-bearing liabilities |
| (769 | ) |
| (557 | ) |
| (1,326 | ) | |||
Net change in net interest income |
| $ | (764 | ) |
| $ | (647 | ) |
| $ | (1,411 | ) |
Interest Income. Total interest income for the year ended June 30, 2013 decreased $2.7 million, or 12.2%, to $19.7 million, from $22.5 million for the year ended June 30, 2012. The decrease during the period was primarily attributable to the $2.1 million decrease in interest income, primarily as a result of a 10.6% decline in net loans receivable over the last year. For the year ended June 30, 2013, average loans receivable, net, decreased $26.1 million or 8.2% to $292.3 million from $318.4 million for the year ended June 30, 2012. In addition, the yield on mortgage-backed securities decreased to 2.45% for the year ended June 30, 2013 from 4.13% for the prior fiscal year.
64
Table of Contents
The following table compares detailed average earning asset balances, associated yields, and resulting changes in interest income for the years ended June 30, 2013 and 2012:
|
| Year Ended June 30, | ||||||||||||||||
|
| 2013 |
| 2012 |
| Increase/(Decrease) in Interest and Dividend Income from 2012 | ||||||||||||
|
| Average Balance |
| Yield |
| Average Balance |
| Yield |
| |||||||||
|
| (Dollars in thousands) | ||||||||||||||||
Loans receivable, net |
| $ | 292,255 | |
| 6.17 | % |
| $ | 318,366 | |
| 6.34 | % |
| $ | (2,147 | ) |
Mortgage-backed securities |
| 58,870 | |
| 2.45 | |
| 47,622 | |
| 4.13 | |
| (521 | ) | |||
Securities |
| 1,682 | |
| 4.88 | |
| 3,331 | |
| 4.41 | |
| (65 | ) | |||
FHLB stock |
| 6,415 | |
| - | |
| 6,510 | |
| - | |
| - | | |||
Cash and due from banks |
| 64,472 | |
| 0.25 | |
| 72,698 | |
| 0.23 | |
| (4 | ) | |||
Total interest-earning assets |
| $ | 423,694 | |
| 4.66 | % |
| $ | 448,527 | |
| 5.01 | % |
| $ | (2,737 | ) |
Interest Expense. Interest expense decreased $1.3 million, or 21.8%, to $4.8 million for the year ended June 30, 2013 from $6.1 million for the year ended June 30, 2012 primarily due to a decline in our cost of funds. In addition, the average balance of total interest-bearing liabilities decreased $19.7 million, or 5.1%, to $365.5 million for the year ended June 30, 2013 from $385.2 million for the year ended June 30, 2012. The decrease was primarily a result of our managed decline in certificates of deposit.
As a result of general market rate decreases, the average cost of funds for total interest-bearing liabilities decreased 28 basis points to 1.30% for the year ended June 30, 2013 compared to 1.58% for the year ended June 30, 2012.
The following table details average balances, cost of funds and the change in interest expense for the years ended June 30, 2013 and 2012:
|
| Year Ended June 30, | ||||||||||||||||
|
| 2013 |
| 2012 |
| Increase/(Decrease) in Interest Expense from 2012 | ||||||||||||
|
| Average Balance |
| Yield |
| Average Balance |
| Yield |
| |||||||||
|
| (Dollars in thousands) | ||||||||||||||||
Savings deposits |
| $ | 36,867 | |
| 0.23 | % |
| $ | 35,153 | |
| 0.56 | % |
| $ | (111 | ) |
Interest-bearing demand deposits |
| 17,723 | |
| 0.08 | |
| 14,823 | |
| 0.33 | |
| (34 | ) | |||
Money market accounts |
| 87,090 | |
| 0.27 | |
| 82,476 | |
| 0.66 | |
| (309 | ) | |||
Certificates of deposit |
| 158,969 | |
| 2.01 | |
| 179,555 | |
| 2.19 | |
| (742 | ) | |||
FHLB advances |
| 64,900 | |
| 1.91 | |
| 73,242 | |
| 1.87 | |
| (130 | ) | |||
Total interest-bearing liabilities |
| $ | 365,549 | |
| 1.30 | % |
| $ | 385,249 | |
| 1.58 | % |
| $ | (1,326 | ) |
Provision for Loan Losses. In connection with our analysis of the loan portfolio for the year ended June 30, 2013, management determined that a provision for loan losses of $750,000 was required for the year ended June 30, 2013, compared to a provision for loan losses of $2.7 million established for the year ended June 30, 2012. The $2.0 million decrease in the provision primarily reflects a decrease in charge-offs to $3.3 million for year ended June 30, 2013 as compared to $4.0 million for the last fiscal year and the decline in nonperforming loans. The $3.3 million of loans charged off during the fiscal year included $416,000 of one-to-four family mortgage loans, $105,000 of construction loans, $356,000 of home equity loans, $875,000 of direct consumer loans, including credit cards, and $1.5 million of commercial business loans. Nonperforming loans were $12.4 million or 2.7% of total assets at June 30, 2013, compared to $15.4 million, or 3.3% of total assets at June 30, 2012. Total delinquent loans (past due 30 days or more), decreased $4.0 million, or 28.2% to $10.2 million at June 30, 2013 from $14.2 million at June 30, 2012. Nonperforming loans decreased to $6.2 million at June 30, 2013 from $8.7 million at June 30, 2012. In particular, our higher risk nonperforming construction loans decreased from $3.4 million at June 30, 2012 to none at June 30, 2013. The ratio of nonperforming loans, which includes nonaccrual loans and loans which are 90 days or more past due and still accruing interest, to total loans
65
Table of Contents
decreased to 2.2% at June 30, 2013 from 3.0% at June 30, 2012. The allowance for loan losses of $5.1 million at June 30, 2013 represented 1.8% of loans receivable and 83.6% of nonperforming loans.
Management considers the allowance for loan losses at June 30, 2013 to be adequate to cover probable losses inherent in the loan portfolio based on the assessment of the above-mentioned factors affecting the loan portfolio. While management believes the estimates and assumptions used in its determination of the adequacy of the allowance are reasonable, there can be no assurance that such estimates and assumptions will not be proven incorrect in the future, or that the actual amount of future provisions will not exceed the amount of past provisions or that any increased provisions that may be required will not adversely impact our financial condition and results of operations. In addition, the determination of the amount of our allowance for loan losses is subject to review by bank regulators, as part of the routine examination process, which may result in the establishment of additional reserves based upon their judgment of information available to them at the time of their examination.
The following table details activity and information related to the allowance for loan losses for the year ended June 30, 2013 and 2012:
|
| At or For the Year Ended June 30, | ||||||
|
| 2013 |
| 2012 | ||||
|
| (Dollars in thousands) | ||||||
Provision for loan losses |
| $ | 750 | |
| $ | 2,735 | |
Net charge-offs |
| 2,660 | |
| 2,917 | | ||
Allowance for loan losses |
| 5,147 | |
| 7,057 | | ||
Allowance for losses as a percentage of total loans receivable at the end of this period |
| 1.8 | % |
| 2.4 | % | ||
Nonaccrual and 90 days or more past due loans |
| $ | 6,159 | |
| $ | 8,722 | |
Allowance for loan losses as a percentage of nonperforming loans at the end of the period |
| 83.6 | % |
| 80.9 | % | ||
Nonaccrual and 90 days or more past due loans as a percentage of loans receivable at the end of the period |
| 2.2 | % |
| 3.0 | % | ||
Total loans, gross and excluding loans held for sale |
| $ | 283,516 | |
| $ | 295,417 | |
Noninterest Income. Noninterest income decreased $1.8 million, or 26.2%, to $4.9 million for the year ended June 30, 2013 from $6.7 million for the year ended June 30, 2012. The following table provides a detailed analysis of the changes in the components of noninterest income:
|
| Year Ended June 30, |
| Increase (Decrease) | |||||||||||
|
| 2013 |
| 2012 |
| Amount |
| Percent | |||||||
|
| (Dollars in thousands) | |||||||||||||
Deposit services fees |
| $ | 1,468 | |
| $ | 1,900 | |
| $ | (432 | ) |
| (22.7 | )% |
Other deposit fees |
| 863 | |
| 798 | |
| 65 | |
| 8.1 | | |||
Gain on sale of investments |
| 70 | |
| 1,536 | |
| (1,466 | ) |
| (95.4 | ) | |||
Loan fees |
| 712 | |
| 955 | |
| (243 | ) |
| (25.4 | ) | |||
Gain on sale of loans |
| 444 | |
| 259 | |
| 185 | |
| 71.4 | | |||
Other income |
| 1,367 | |
| 1,226 | |
| 141 | |
| 11.5 | | |||
Total noninterest income |
| $ | 4,924 | |
| $ | 6,674 | |
| $ | (1,750 | ) |
| (26.2 | )% |
Noninterest income decreased during the year ended June 30, 2013, primarily due to a decline in gain on sales of investments and a decline in deposit service fees partially offset by an increase in gain on sales of loans. The gain on sale of loans increased as a result of more loans originated and sold to Freddie Mac during the year ended June 30, 2013 at more favorable rates for the majority of the fiscal year as compared to the last fiscal year. We sold $22.6 million and $20.6 million of loans to Freddie Mac during the years ended June 30, 2013 and 2012, respectively. Refinancing activity was particularly significant in fiscal 2013 resulting in an
66
Table of Contents
increase in loans originated for sale; however, the recent rise in mortgage interest rates may result in lower refinancing activity and gain on sale of loans in the future.
Noninterest Expense. Noninterest expense decreased $2.6 million, or 12.0%, to $19.4 million for the year ended June 30, 2013 from $22.0 million for the year ended June 30, 2012. The following table provides an analysis of the changes in the components of noninterest expense:
|
| At or For the Year Ended June 30, |
| Increase (Decrease) | |||||||||||
|
| 2013 |
| 2012 |
| Amount |
| Percent | |||||||
|
| (Dollars in thousands) | |||||||||||||
Compensation and benefits |
| $ | 8,441 | |
| $ | 8,447 | |
| $ | (6 | ) |
| (0.1 | )% |
General and administrative expenses |
| 3,277 | |
| 3,644 | |
| (367 | ) |
| (10.1 | ) | |||
Real estate owned reserve |
| 1,487 | |
| 2,494 | |
| (1,007 | ) |
| (40.4 | ) | |||
Real estate holding cost |
| 496 | |
| 862 | |
| (366 | ) |
| (42.5 | ) | |||
FDIC insurance premium |
| 651 | |
| 1,016 | |
| (365 | ) |
| (35.9 | ) | |||
Information technology |
| 1,661 | |
| 2,271 | |
| (610 | ) |
| (26.9 | ) | |||
Occupancy and equipment |
| 2,182 | |
| 2,192 | |
| (10 | ) |
| (0.5 | ) | |||
Deposit services |
| 651 | |
| 771 | |
| (120 | ) |
| (15.6 | ) | |||
Marketing |
| 584 | |
| 653 | |
| (69 | ) |
| (10.6 | ) | |||
Loss on sale of premises and equipment |
| 56 | |
| 129 | |
| (73 | ) |
| (56.6 | ) | |||
Net (gain) loss on sale of REO |
| (94 | ) |
| (454 | ) |
| 360 | |
| (79.3 | ) | |||
Total noninterest expense |
| $ | 19,392 | |
| $ | 22,025 | |
| $ | (2,633 | ) |
| (12.0 | )% |
Major components of the decrease in noninterest expense include:
Noninterest expense decreased $2.6 million or 12.0% in the year ended June 30, 2013 to $19.4 million from $22.0 million for the year ended June 30, 2012. The decrease was primarily due to a decrease in REO impairment expense of $1.0 million as compared to the same period in 2012, reflecting the stabilization in the real estate market. Additionally, the decrease in information technology expenses of $610,000 was due to increased costs last year incurred for our core system conversion.
Our efficiency ratio, which is the percentage of noninterest expense to net interest income plus noninterest income, was 97.5% for the year ended June 30, 2013 compared to 95.6% for the year ended June 30, 2012. The increase in efficiency ratio was primarily attributable to the decrease in noninterest income. By definition, a lower efficiency ratio would be an indication that we are more efficiently utilizing resources to generate net interest income and other fee income.
Provision (benefit) for Income Tax. There was no provision for income tax for the years ended June 30, 2013 and 2012, as a result of the net operating loss in both years. There was no tax benefit as we were unable to utilize our net operating losses. As of June 30, 2013, the Company had a net operating loss carryforward totaling $12.7 million which can be used to offset future taxable income. The net operating loss carryforward expires in 2031 through 2033.
Deferred tax assets are deferred tax consequences attributable to deductible temporary differences and carryforwards. After the deferred tax asset has been measured using the applicable enacted tax rate and provisions of the enacted tax law, it is then necessary to assess the need for a valuation allowance. A valuation allowance is needed when, based on the weight of the available evidence, it is more likely than not that some portion of the deferred tax asset will not be realized. As required by generally accepted accounting principles, available evidence is weighted heavily on cumulative losses with less weight placed on future projected profitability. Realization of the deferred tax asset is dependent on whether there will be sufficient future taxable income of the appropriate character in the period during which deductible temporary differences reverse or within the carryback and carryforward periods available under tax law. Based upon the available evidence, we recorded a partial valuation allowance of $8.7 million, $7.9 million and $6.4 million at June 30, 2013, June 30, 2012 and 2011, respectively.
67
Table of Contents
Comparison of Financial Condition at June 30, 2012 and June 30, 2011
General. Total assets decreased $18.1 million, or 3.7%, to $470.8 million at June 30, 2012 from $488.9 million at June 30, 2011. The decrease in assets during this period was primarily a result of a $37.7 million or 11.6% decrease in loans receivable. Total real estate owned decreased $5.9 million, or 46.7%, to $6.7 million at June 30, 2012 from $12.6 million at June 30, 2011. Total liabilities decreased $14.7 million or 3.4% to $416.8 million at June 30, 2012 compared to $431.5 million at June 30, 2011. The decrease in our balance sheet facilitated our efforts to comply with the regulatory capital requirements under the Order. Total deposits increased $6.3 million, or 1.9%, to $345.8 million at June 30, 2012 from $339.5 million at June 30, 2011 primarily as a result of an increase of $5.7 million or 7.3% in money market deposits and $7.7 million or 25.3% in noninterest bearing deposits partially offset by a $10.3 million decline in certificates of deposit. Our total borrowings, which consisted of FHLB advances, decreased $21.0 million from June 30, 2011 to June 30, 2012. The average cost of advances decreased from 2.08% during the year ended June 30, 2011 to 1.87% during the year ended June 30, 2012.
Assets. For the year ended June 30, 2012, total assets decreased $18.1 million. The following table details the increases and decreases in the composition of our assets from June 30, 2011 to June 30, 2012:
|
Balance at June 30, 2012 |
|
Balance at June 30, 2011 |
| Increase (Decrease) | |||||||||
|
|
| Amount |
| Percent | |||||||||
| (Dollars in thousands) | |||||||||||||
Cash and due from banks | $ | 78,673 | |
| $ | 63,757 | |
| $ | 14,916 | |
| 23.4 | % |
Mortgage-backed securities, available-for-sale | 47,061 | |
| 32,718 | |
| 14,343 | |
| 43.8 | | |||
Mortgage-backed securities, held-to-maturity | 7,037 | |
| 7,438 | |
| (401 | ) |
| (5.4 | ) | |||
Loans receivable, net of allowance for loan losses | 287,755 | |
| 325,464 | |
| (37,709 | ) |
| (11.6 | ) | |||
Real estate owned | 6,708 | |
| 12,597 | |
| (5,889 | ) |
| (46.7 | ) | |||
From June 30, 2011 to June 30, 2012, cash and due from banks increased $14.9 million. This increase was primarily a result of our public offering in January 2011 as well as funds received from normal operations.
Mortgage-backed securities increased $13.9 million to $54.1 million at June 30, 2012 from $40.2 million at June 30, 2011. During the year ended June 30, 2012, we securitized $4.7 million of fixed rate mortgage-backed securities through Freddie Mac. We securitize and sell mortgage loans to manage interest rate sensitivity and capital requirements, supplement loan originations and provide liquidity. During the year ended June 30, 2012, we sold $24.4 million in securities compared to $3.4 million in securities for the year ended June 30, 2011.
Loans receivable, net, decreased $37.7 million to $287.8 million at June 30, 2012 from $325.5 million at June 30, 2011 primarily as a result of lower loan demand from creditworthy borrowers, charge-offs, and transfers of nonperforming loans to real estate owned, as well as pay downs due to normal borrower activity. During the year ended June 30, 2012, $7.7 million of nonperforming loans were transferred to real estate owned. We continued to reduce our exposure to construction and land loans during the year ended June 30, 2012. The total construction and land loan portfolios declined to $13.8 million or 4.7% of the total loan portfolio at June 30, 2012 compared to $18.4 million or 5.5% of the total loan portfolio a year ago. In addition to the significant decline in the construction and land loan portfolios, our commercial real estate loan portfolio decreased $8.7 million. One-to-four family loans decreased $14.4 million primarily due to repayments and lower loan demand. Consumer loans decreased $9.0 million primarily due to a $4.2 million decrease in home equity loans and a $2.2 million reduction in automobile loans.
Real estate owned, net decreased $5.9 million as a result of ongoing sales to reduce our nonperforming assets.
68
Table of Contents
Deposits. Deposits increased $6.3 million, or 1.9%, to $345.8 million at June 30, 2012 from $339.5 million at June 30, 2011. The increase in money market deposits was due in part to our ongoing marketing strategy to focus on core deposits.
The following table details the changes in deposit accounts:
| Balance at June 30, 2012 |
| Balance at June 30, 2011 |
| Increase (Decrease) | |||||||||
|
|
| Amount |
| Percent | |||||||||
| (Dollars in thousands) | |||||||||||||
Noninterest-bearing demand deposits | $ | 37,941 | |
| $ | 30,288 | |
| $ | 7,653 | |
| 25.3 | % |
Interest-bearing demand deposits | 16,434 | |
| 17,387 | |
| (953 | ) |
| (5.5 | ) | |||
Money market accounts | 83,750 | |
| 78,017 | |
| 5,733 | |
| 7.3 | | |||
Savings deposits | 36,475 | |
| 32,263 | |
| 4,212 | |
| 13.1 | | |||
Certificates of deposit | 171,198 | |
| 181,519 | |
| (10,321 | ) |
| (5.7 | ) | |||
Total deposit accounts | $ | 345,798 | |
| $ | 339,474 | |
| $ | 6,324 | |
| 1.9 | % |
Borrowings. FHLB advances decreased $21.0 million, or 24.7%, to $64.9 million at June 30, 2012 from $85.9 million at June 30, 2011. The decrease in borrowing was related to our continuing focus on reducing wholesale funds.
Equity. Total equity decreased $3.4 million, or 6.0%, to $54.0 million at June 30, 2012 from $57.5 million at June 30, 2011. The decrease was due to a $1.7 million loss as well as a change in other comprehensive income.
Comparison of Operating Results for the Years Ended June 30, 2012 and June 30, 2011
General. Net loss for the year ended June 30, 2012 was $1.7 million compared to a net loss of $8.8 million for the year ended June 30, 2011.
Net Interest Income. Net interest income decreased $1.6 million, or 16.4%, to $16.4 million for the year ended June 30, 2012, from $18.0 million for the year ended June 30, 2011. The decrease in net interest income was primarily attributable to the decrease in our net loans receivable.
Our net interest margin decreased 13 basis points to 3.65% for the year ended June 30, 2012, from 3.78% for the same period of the prior year. Over the last year, our net interest margin declined as a result of the decline in our cost of funds not exceeding the reduction in yield on interest-earning assets. Our yield on earnings assets decreased to 5.01% for the year ended June 30, 2012 from 5.46% for the year ended June 30, 2011. Our funding costs have decreased from 1.89% during the year ended June 30, 2011 to 1.58% during the year ended June 30, 2012. The decline was related to the repricing of our FHLB borrowings and certificates of deposit to lower current rates. We expect further declines in our funding costs as our certificates of deposit mature and reprice to current market rates. Our net interest rate spread decreased to 3.43% for the year ended June 30, 2012 as compared to 3.57% for the year ended June 30, 2011.
The cost of borrowed funds from the FHLB and certificates of deposit decreased to 1.87% and 2.19%, respectively during the year ended June 30, 2012 from 2.08% and 2.51% for the prior year. The following table sets forth the results of balance sheet growth and changes in interest rates to our net interest income. The rate column shows the effects attributable to changes in rate (changes in rate multiplied by prior volume). The volume column shows the effects attributable to changes in volume (changes in volume multiplied by prior rate). Changes attributable to both rate and volume, which cannot be segregated, are allocated proportionately to the changes in rate and volume.
69
Table of Contents
|
| Year Ended June 30, 2012 Compared to June 30, 2011 | ||||||||||
|
| Increase (Decrease) Due to |
|
| ||||||||
|
| Rate |
| Volume |
| Total | ||||||
|
| (In thousands) | ||||||||||
Interest-earning assets: |
|
|
|
|
|
| ||||||
Loans receivable, net |
| $ | 164 | |
| $ | (3,442 | ) |
| $ | (3,278 | ) |
Mortgage-backed securities |
| (290 | ) |
| 110 | |
| (180 | ) | |||
Securities, FHLB and cash and due from banks |
| (204 | ) |
| 157 | |
| (47 | ) | |||
Total net change in income on interest-earning assets |
| (330 | ) |
| (3,175 | ) |
| (3,505 | ) | |||
Interest-bearing liabilities: |
|
|
|
|
|
| ||||||
Savings deposits |
| (58 | ) |
| 31 | |
| (27 | ) | |||
Interest bearing demand deposits |
| 8 | |
| (18 | ) |
| (10 | ) | |||
Money market accounts |
| (243 | ) |
| 65 | |
| (178 | ) | |||
Certificates of deposit |
| (576 | ) |
| (321 | ) |
| (897 | ) | |||
FHLB advances |
| (152 | ) |
| (648 | ) |
| (800 | ) | |||
Total net change in expense on interest-bearing liabilities |
| (1,021 | ) |
| (891 | ) |
| (1,912 | ) | |||
Net change in net interest income |
| $ | 691 | |
| $ | (2,284 | ) |
| $ | (1,593 | ) |
Interest Income. Total interest income for the year ended June 30, 2012 decreased $3.5 million, or 13.5%, to $22.5 million, from $26.0 million for the year ended June 30, 2011. The decrease during the period was primarily attributable to the decline in net loans receivable over the last year.
The following table compares detailed average earning asset balances, associated yields, and resulting changes in interest income for the years ended June 30, 2012 and 2011:
|
| Year Ended June 30, | ||||||||||||||||
|
| 2012 |
| 2011 |
| Increase/ (Decrease) in Interest Income from 2011 | ||||||||||||
|
| Average Balance |
| Yield |
| Average Balance |
| Yield |
| |||||||||
|
| (Dollars in thousands) | ||||||||||||||||
Loans receivable, net |
| $ | 318,366 | |
| 6.34 | % |
| $ | 373,099 | |
| 6.29 | % |
| $ | (3,278 | ) |
Mortgage-backed securities |
| 47,622 | |
| 4.13 | |
| 45,271 | |
| 4.74 | |
| (180 | ) | |||
Securities |
| 3,331 | |
| 4.41 | |
| 6,259 | |
| 4.25 | |
| (119 | ) | |||
FHLB stock |
| 6,510 | |
| - | |
| 6,510 | |
| - | |
| - | | |||
Cash and due from banks |
| 72,698 | |
| 0.23 | |
| 44,602 | |
| 0.21 | |
| 72 | | |||
Total interest-earning assets |
| $ | 448,527 | |
| 5.01 | % |
| $ | 475,741 | |
| 5.46 | % |
| $ | (3,505 | ) |
Interest Expense. Interest expense decreased $1.9 million, or 23.9%, to $6.1 million for the year ended June 30, 2012 from $8.0 million for the year ended June 30, 2011 primarily due to a decline in our cost of funds. In addition, the average balance of total interest-bearing liabilities decreased $38.4 million, or 9.1%, to $385.2 million for the year ended June 30, 2012 from $423.7 million for the year ended June 30, 2011. The decrease was primarily a result of our managed decline in certificates of deposit and continued focus on reducing FHLB advances and increasing core deposits.
As a result of general market rate decreases along with the reduction in outstanding brokered certificates of deposit, the average cost of funds for total interest-bearing liabilities decreased 31 basis points to 1.58% for the year ended June 30, 2012 compared to 1.89% for the year ended June 30, 2011.
70
Table of Contents
The following table details average balances, cost of funds and the change in interest expense for the years ended June 30, 2012 and 2011:
|
| Year Ended June 30, | ||||||||||||||||
|
| 2012 |
| 2011 |
| Increase/(Decrease) in Interest Expense from 2011 | ||||||||||||
|
| Average Balance |
| Yield |
| Average Balance |
| Yield |
| |||||||||
|
| (Dollars in thousands) | ||||||||||||||||
Savings deposits |
| $ | 35,153 | |
| 0.56 | % |
| $ | 30,864 | |
| 0.72 | % |
| $ | (27 | ) |
Interest-bearing demand deposits |
| 14,823 | |
| 0.33 | |
| 20,428 | |
| 0.29 | |
| (10 | ) | |||
Money market accounts |
| 82,476 | |
| 0.66 | |
| 75,661 | |
| 0.95 | |
| (178 | ) | |||
Certificates of deposit |
| 179,555 | |
| 2.19 | |
| 192,334 | |
| 2.51 | |
| (897 | ) | |||
FHLB advances |
| 73,242 | |
| 1.87 | |
| 104,408 | |
| 2.08 | |
| (800 | ) | |||
Total interest-bearing liabilities |
| $ | 385,249 | |
| 1.58 | % |
| $ | 423,695 | |
| 1.89 | % |
| $ | (1,912 | ) |
Provision for Loan Losses. In connection with our analysis of the loan portfolio for the year ended June 30, 2012, management determined that a provision for loan losses of $2.7 million was required for the year ended June 30, 2012, compared to a provision for loan losses of $8.1 million established for the year ended June 30, 2011. The $5.3 million decrease in the provision primarily reflects a decrease in charge-offs to $4.0 million for year ended June 30, 2012 as compared to $18.6 million for the last fiscal year. The $4.0 million of loans charged off during the fiscal year included $1.5 million of one-four family mortgage loans, $571,000 of commercial real estate loans, $561,000 of construction loans, $337,000 of home equity loans, $1.0 million of direct consumer loans, including credit cards and $63,000 of commercial business loans. Nonperforming assets were $15.4 million or 3.3% of total assets at June 30, 2012, compared to $26.9 million, or 5.5% of total assets at June 30, 2011.
The following table details activity and information related to the allowance for loan losses for the year ended June 30, 2012 and 2011:
|
| At or For the Year Ended June 30, | ||||||
|
| 2012 |
| 2011 | ||||
|
| (Dollars in thousands) | ||||||
Provision for loan losses |
| $ | 2,735 | |
| $ | 8,078 | |
Net charge-offs |
| 2,917 | |
| 17,627 | | ||
Allowance for loan losses |
| 7,057 | |
| 7,239 | | ||
Allowance for losses as a percentage of total loans |
|
|
|
| | |||
receivable at the end of this period |
| 2.4 | % |
| 2.2 | % | ||
Nonaccrual and 90 days or more past due loans |
| $ | 8,722 | |
| $ | 14,169 | |
Allowance for loan losses as a percentage of |
|
|
|
| | |||
nonperforming loans at end of period |
| 80.9 | % |
| 51.1 | % | ||
Nonaccrual and 90 days or more past due loans as a |
|
|
|
| | |||
percentage of loans receivable at the end of the period |
| 3.0 | % |
| 4.3 | % | ||
Total loans |
| $ | 295,417 | |
| $ | 333,351 | |
71
Table of Contents
Noninterest Income. Noninterest income decreased $922,000, or 16.0%, to $6.7 million for the year ended June 30, 2012 from $5.8 million for the year ended June 30, 2011. The following table provides a detailed analysis of the changes in the components of noninterest income:
|
| Year Ended June 30, |
| Increase (Decrease) | |||||||||||
|
| 2012 |
| 2011 |
| Amount |
| Percent | |||||||
|
| (Dollars in thousands) | |||||||||||||
Deposit services fees |
| $ | 1,900 | |
| $ | 2,288 | |
| $ | (388 | ) |
| (17.0 | )% |
Other deposit fees |
| 798 | |
| 860 | |
| (62 | ) |
| (7.2 | ) | |||
Gain on sale of investments |
| 1,536 | |
| 135 | |
| 1,401 | |
| 1,037.8 | | |||
Loan fees |
| 955 | |
| 971 | |
| (16 | ) |
| (1.6 | ) | |||
Gain on sale of loans |
| 259 | |
| 174 | |
| 85 | |
| 48.9 | | |||
Other income |
| 1,226 | |
| 1,324 | |
| (98 | ) |
| (7.4 | ) | |||
Total noninterest income |
| $ | 6,674 | |
| $ | 5,752 | |
| $ | 922 | |
| 16.0 | % |
Noninterest income increased during the year ended June 30, 2012, primarily as a result of increased gains on sale of investments partially offset by a decline in deposit service fees due. Deposit service fees decreased as a result of prior branch closures as well as reductions in overdraft fees.
Noninterest Expense. Noninterest expense decreased $2.4 million, or 10.0%, to $22.0 million for the year ended June 30, 2012 from $24.5 million for the year ended June 30, 2011. The following table provides an analysis of the changes in the components of noninterest expense:
|
| At or For the Year Ended June 30, |
| Increase (Decrease) | |||||||||||
|
| 2012 |
| 2011 |
| Amount |
| Percent | |||||||
|
| (Dollars in thousands) | |||||||||||||
Compensation and benefits |
| $ | 8,447 | |
| $ | 8,365 | |
| $ | 82 | |
| 1.0 | % |
General and administrative expenses |
| 3,644 | |
| 3,733 | |
| (89 | ) |
| (2.4 | ) | |||
Real estate owned reserve |
| 2,494 | |
| 4,624 | |
| (2,130 | ) |
| (46.1 | ) | |||
Real estate holding costs |
| 862 | |
| 1,094 | |
| (232 | ) |
| (21.2 | ) | |||
FDIC insurance premium |
| 1,016 | |
| 1,164 | |
| (148 | ) |
| (12.7 | ) | |||
Information technology |
| 2,271 | |
| 2,049 | |
| 222 | |
| 10.8 | | |||
Occupancy and equipment |
| 2,192 | |
| 2,337 | |
| (145 | ) |
| (6.2 | ) | |||
Deposit services |
| 771 | |
| 708 | |
| 63 | |
| 8.9 | | |||
Marketing |
| 653 | |
| 543 | |
| 110 | |
| 20.3 | | |||
Loss on sale of property, premises and equipment |
| 129 | |
| 168 | |
| (39 | ) |
| (23.2 | ) | |||
Net (gain) loss on sale of REO |
| (454 | ) |
| (324 | ) |
| (130 | ) |
| 40.1 | | |||
Total noninterest expense |
| $ | 22,025 | |
| $ | 24,461 | |
| $ | (2,436 | ) |
| (10.0 | )% |
Major components of the increase in noninterest expense include:
Noninterest expense decreased $2.4 million or 10.0% in the year ended June 30, 2012 to $22.0 million from $24.5 million for the year ended June 30, 2011. The decrease was primarily due to a decreased of $2.1 million to REO impairment charges and $232,000 in REO holding costs for the year ended June 30, 2012.
Our efficiency ratio, which is the percentage of noninterest expense to net interest income plus noninterest income, was 95.6% for the year ended June 30, 2012 compared to 103.1% for the year ended June 30, 2011. The decrease in efficiency ratio was primarily attributable to the decrease in noninterest expense. By definition, a lower efficiency ratio would be an indication that we are more efficiently utilizing resources to generate net interest income and other fee income.
72
Table of Contents
Provision (benefit) for Income Tax. The benefit for income tax for the years ended June 30, 2012 and 2011, respectively, is zero as a result of the net operating loss in both years. Our combined federal and state effective income tax rate for the current period was a tax benefit of (0%), as compared to (0%) for the same period a year ago.
Deferred tax assets are deferred tax consequences attributable to deductible temporary differences and carryforwards. After the deferred tax asset has been measured using the applicable enacted tax rate and provisions of the enacted tax law, it is then necessary to assess the need for a valuation allowance. A valuation allowance is needed when, based on the weight of the available evidence, it is more likely than not that some portion of the deferred tax asset will not be realized. As required by generally accepted accounting principles, available evidence is weighted heavily on cumulative losses with less weight placed on future projected profitability. Realization of the deferred tax asset is dependent on whether there will be sufficient future taxable income of the appropriate character in the period during which deductible temporary differences reverse or within the carryback and carryforward periods available under tax law. Based upon the available evidence, we recorded a valuation allowance of $7.9 million, $6.4 million and $3.0 million at June 30, 2012, June 30, 2011 and 2010, respectively.
Average Balances, Interest and Average Yields/Cost
The following table sets forth for the periods indicated, information regarding average balances of assets and liabilities as well as the total dollar amounts of interest income from average interest-earning assets and interest expense on average interest-bearing liabilities, resultant yields, interest rate spread, net interest margin, and the ratio of average interest-earning assets to average interest-bearing liabilities. Average balances have been calculated using the average of weekly interest-earning assets and interest-bearing liabilities. Noninterest-earning assets and noninterest-bearing liabilities have been computed on a monthly basis.
73
Table of Contents
| Year Ended June 30, | ||||||||||||||||||||||||||||||||||
| 2013 |
| 2012 |
| 2011 | ||||||||||||||||||||||||||||||
| Average Balance (1) |
| Interest and Dividends |
| Yield/ Cost |
| Average Balance (1) |
| Interest and Dividends |
|
Yield/ Cost |
| Average Balance (1) |
| Interest and Dividends |
|
Yield/ Cost | ||||||||||||||||||
|
|
|
|
|
|
| (Dollars in thousands) |
|
|
|
|
|
| ||||||||||||||||||||||
Interest-earning assets: |
|
|
|
|
|
|
|
|
|
|
|
|
|
|
|
|
| ||||||||||||||||||
Loans receivable, net (1) | $ | 292,255 | |
| $ | 18,040 | |
| 6.17 | % |
| $ | 318,366 | |
| $ | 20,187 | |
| 6.34 | % |
| $ | 373,099 | |
| $ | 23,465 | |
| 6.29 | % | |||
Mortgage-backed securities | 58,870 | |
| 1,445 | |
| 2.45 | |
| 47,622 | |
| 1,966 | |
| 4.13 | |
| 45,271 | |
| 2,146 | |
| 4.74 | | |||||||||
Securities | 1,682 | |
| 82 | |
| 4.88 | |
| 3,331 | |
| 147 | |
| 4.41 | |
| 6,259 | |
| 266 | |
| 4.25 | | |||||||||
FHLB stock | 6,415 | |
| - | |
| - | |
| 6,510 | |
| - | |
| - | |
| 6,510 | |
| - | |
| - | | |||||||||
Cash and due from banks | 64,472 | |
| 160 | |
| 0.25 | |
| 72,698 | |
| 164 | |
| 0.23 | |
| 44,602 | |
| 92 | |
| 0.21 | | |||||||||
Total interest-earning assets | 423,694 | |
| 19,727 | |
| 4.66 | |
| 448,527 | |
| 22,464 | |
| 5.01 | |
| 475,741 | |
| 25,969 | |
| 5.46 | | |||||||||
Noninterest earning assets | 40,691 | |
|
|
|
|
| 32,581 | |
|
| |
|
| |
| 37,014 | |
|
| |
|
| | |||||||||||
Total average assets | $ | 464,385 | |
|
|
|
|
| $ | 481,108 | |
|
| |
|
| |
| $ | 512,755 | |
|
| |
|
| | ||||||||
Interest-bearing liabilities: |
|
|
|
|
|
|
| |
|
| |
|
| |
|
| |
|
| |
|
| | ||||||||||||
Savings deposits | 36,867 | |
| 85 | |
| 0.23 | |
| 35,153 | |
| 196 | |
| 0.56 | |
| 30,864 | |
| 223 | |
| 0.72 | | |||||||||
Interest-bearing demand deposits | 17,723 | |
| 15 | |
| 0.08 | |
| 14,823 | |
| 49 | |
| 0.33 | |
| 20,428 | |
| 59 | |
| 0.29 | | |||||||||
Money market accounts | 87,090 | |
| 233 | |
| 0.27 | |
| 82,476 | |
| 542 | |
| 0.66 | |
| 75,661 | |
| 720 | |
| 0.95 | | |||||||||
Certificates of deposit | 158,969 | |
| 3,189 | |
| 2.01 | |
| 179,555 | |
| 3,931 | |
| 2.19 | |
| 192,334 | |
| 4,828 | |
| 2.51 | | |||||||||
Total deposits | 300,649 | |
| 3,522 | |
| 1.17 | |
| 312,007 | |
| 4,718 | |
| 1.51 | |
| 319,287 | |
| 5,830 | |
| 1.83 | | |||||||||
FHLB advances | 64,900 | |
| 1,242 | |
| 1.91 | |
| 73,242 | |
| 1,372 | |
| 1.87 | |
| 104,408 | |
| 2,172 | |
| 2.08 | | |||||||||
Total interest-bearing liabilities | 365,549 | |
| 4,764 | |
| 1.30 | |
| 385,249 | |
| 6,090 | |
| 1.58 | |
| 423,695 | |
| 8,002 | |
| 1.89 | | |||||||||
Noninterest-bearing liabilities | 46,681 | |
|
|
|
|
| 41,088 | |
|
| |
|
| |
| 36,121 | |
|
| |
|
| | |||||||||||
Total average liabilities | 412,230 | |
|
|
|
|
| 426,337 | |
|
| |
|
| |
| 459,816 | |
|
| |
|
| | |||||||||||
Average equity | 52,155 | |
|
|
|
|
| 54,771 | |
|
| |
|
| |
| 52,939 | |
|
| |
|
| | |||||||||||
Total liabilities and equity | $ | 464,385 | |
|
|
|
|
| $ | 481,108 | |
|
| |
|
| |
| $ | 512,755 | |
|
| |
|
| | ||||||||
Net interest income |
|
|
|
| $ | 14,963 | |
|
| |
|
| |
| $ | 16,374 | |
|
| |
|
| |
| $ | 17,967 | | ||||||||
Interest rate spread |
|
|
|
| 3.35 | % |
|
| |
|
| |
| 3.43 | % |
|
| |
|
| |
| 3.57 | % | |||||||||||
Net interest margin |
|
|
|
| 3.53 | % |
|
| |
|
| |
| 3.65 | % |
|
| |
|
| |
| 3.78 | % | |||||||||||
Ratio of average interest-earning assets to average interest-bearing liabilities |
|
|
| |
| 115.9 | % |
|
|
|
|
| 116.4 | % |
|
| |
|
| |
| 112.3 | % | ||||||||||||
___________________
(1) Average loans receivable includes nonperforming loans and does not include net deferred loan fees. Interest income does not include nonaccrual loans.
74
Table of Contents
Yields Earned and Rates Paid
The following table sets forth (on a consolidated basis) for the periods and at the dates indicated, the weighted average yields earned on our assets, the weighted average interest rates paid on our liabilities, together with the net yield on interest-earning assets.
|
| At June 30, 2013 |
|
|
|
| ||||||
|
|
| Year Ended June 30, | |||||||||
|
|
| 2013 |
| 2012 |
| 2011 | |||||
Weighted average yield on: |
|
|
|
|
|
|
|
| ||||
Loans receivable, net |
| 5.87 | % |
| 6.17 | % |
| 6.34 | % |
| 6.29 | % |
Mortgage-backed securities |
| 1.61 | |
| 2.45 | |
| 4.13 | |
| 4.74 | |
Securities |
| 4.64 | |
| 4.88 | |
| 4.41 | |
| 4.25 | |
FHLB stock |
| - | |
| - | |
| - | |
| - | |
Cash and due from banks |
| 0.25 | |
| 0.25 | |
| 0.23 | |
| 0.21 | |
Total interest-earning assets |
| 4.29 | |
| 4.66 | |
| 5.01 | |
| 5.46 | |
Weighted average rate paid on: |
|
|
|
| |
|
| |
|
| | |
Savings accounts |
| 0.15 | |
| 0.23 | |
| 0.56 | |
| 0.72 | |
Interest-bearing demand deposits |
| 0.10 | |
| 0.08 | |
| 0.33 | |
| 0.29 | |
Money market accounts |
| 0.15 | |
| 0.27 | |
| 0.66 | |
| 0.95 | |
Certificates of deposit |
| 1.96 | |
| 2.01 | |
| 2.19 | |
| 2.51 | |
Total average deposits |
| 1.09 | |
| 1.17 | |
| 1.51 | |
| 1.83 | |
FHLB advances |
| 1.91 | |
| 1.91 | |
| 1.87 | |
| 2.08 | |
Total interest-bearing liabilities |
| 1.10 | |
| 1.30 | |
| 1.58 | |
| 1.89 | |
|
|
|
|
| |
|
| |
|
| | |
Interest rate spread (spread between weighted average rate on all interest-earning assets and all interest-bearing liabilities) |
| 3.19 | |
| 3.35 | |
| 3.43 | |
| 3.57 | |
|
|
|
|
|
|
|
|
| ||||
Net interest margin (net interest income (expense) as a percentage of average interest-earning assets) |
| N/A | |
| 3.53 | |
| 3.65 | |
| 3.78 | |
75
Table of Contents
Rate/Volume Analysis
The following table sets forth the effects of changing rates and volumes on our net interest income. Information is provided with respect to: (1) effects on interest income attributable to changes in volume (changes in volume multiplied by prior rate); and (2) effects on interest income attributable to changes in rate (changes in rate multiplied by prior volume). Changes attributable to both rate and volume, which cannot be segregated, are allocated proportionately to the changes in rate and volume.
|
| Year Ended June 30, 2013 Compared to June 30, 2012 Increase (Decrease) Due to |
| Year Ended June 30, 2012 Compared to June 30, 2011 Increase (Decrease) Due to | ||||||||||||||||||||
|
| Rate |
| Volume |
| Total |
| Rate |
| Volume |
| Total | ||||||||||||
|
| (In thousands) | ||||||||||||||||||||||
Interest-earning assets: |
|
| ||||||||||||||||||||||
Loans receivable, net |
| $ | (491 | ) |
| $ | (1,656 | ) |
| $ | (2,147 | ) |
| $ | 164 | |
| $ | (3,442 | ) |
| $ | (3,278 | ) |
Mortgage-backed securities |
| (985 | ) |
| 464 | |
| (521 | ) |
| (290 | ) |
| 110 | |
| (180 | ) | ||||||
Securities, FHLB stock and cash due from banks |
| (57 | ) |
| (12 | ) |
| (69 | ) |
| (204 | ) |
| 157 | |
| (47 | ) | ||||||
Total net change in income on interest-earning assets |
| $ | (1,533 | ) |
| $ | (1,204 | ) |
| $ | (2,737 | ) |
| $ | (330 | ) |
| $ | (3,175 | ) |
| $ | (3,505 | ) |
Interest-bearing liabilities: |
|
|
|
|
|
|
|
| |
|
| |
|
| | |||||||||
Savings accounts |
| $ | (121 | ) |
| $ | 10 | |
| $ | (111 | ) |
| $ | (58 | ) |
| $ | 31 | |
| $ | (27 | ) |
Interest-bearing demand deposits |
| (44 | ) |
| 10 | |
| (34 | ) |
| 8 | |
| (18 | ) |
| (10 | ) | ||||||
Money market accounts |
| (339 | ) |
| 30 | |
| (309 | ) |
| (243 | ) |
| 65 | |
| (178 | ) | ||||||
Certificates of deposit |
| (291 | ) |
| (451 | ) |
| (742 | ) |
| (576 | ) |
| (321 | ) |
| (897 | ) | ||||||
FHLB advances |
| 26 | |
| (156 | ) |
| (130 | ) |
| (152 | ) |
| (648 | ) |
| (800 | ) | ||||||
Total net change in expense on interest-bearing liabilities |
| $ | (769 | ) |
| $ | (557 | ) |
| $ | (1,326 | ) |
| $ | (1,021 | ) |
| $ | (891 | ) |
| $ | (1,912 | ) |
Net change in net interest income |
| $ | (764 | ) |
| $ | (647 | ) |
| $ | (1,411 | ) |
| $ | 691 | |
| $ | (2,284 | ) |
| $ | (1,593 | ) |
Asset and Liability Management and Market Risk
General. Our Board of Directors has established an asset and liability management policy to guide management in maximizing net interest rate spread by managing the differences in terms between interest-earning assets and interest-bearing liabilities while maintaining acceptable levels of liquidity, capital adequacy, interest rate sensitivity, changes in net interest income, credit risk and profitability. The policy includes the use of an Asset Liability Management Committee whose members include certain members of senior management. The Committee's purpose is to communicate, coordinate and manage our asset/liability positions consistent with our business plan and Board-approved policies. The Asset Liability Management Committee meets monthly to review various areas including:
• | economic conditions; |
• | interest rate outlook; |
• | asset/liability mix; |
• | interest rate risk sensitivity; |
• | change in net interest income; |
• | current market opportunities to promote specific products; |
• | historical financial results; |
• | projected financial results; and |
• | capital position. |
The Committee also reviews current and projected liquidity needs monthly. As part of its procedures, the Asset Liability Management Committee regularly reviews interest rate risk by forecasting the impact of alternative interest rate environments on net interest income and market value of portfolio equity, which is defined as the net present value of an institution's existing assets, liabilities and off-balance sheet instruments, and evaluating such impacts against the maximum potential change in market value of portfolio equity that is authorized by the Board of Directors.
76
Table of Contents
Our Risk When Interest Rates Change. The rates of interest we earn on assets and pay on liabilities generally are established contractually for a period of time. Market interest rates change over time. Our loans generally have longer maturities than our deposits. Accordingly, our results of operations, like those of other financial institutions, are impacted by changes in interest rates and the interest rate sensitivity of our assets and liabilities. The risk associated with changes in interest rates and our ability to adapt to these changes is known as interest rate risk and is our most significant market risk.
In recent years, we primarily have utilized the following strategies in our efforts to manage interest rate risk:
• | we have increased our originations of shorter term loans and particularly, home equity loans (limited recent originations) and commercial business loans; |
• | we have structured certain borrowings with maturities that match fund our loan portfolios; and |
• | we have securitized our single family loans to available-for-sale investments which generates cash flow as well as allows the flexibility of managing interest rate risk as well as selling the investment when appropriate. |
How We Measure the Risk of Interest Rate Changes. We measure our interest rate sensitivity on a quarterly basis utilizing an internal model. Management uses various assumptions to evaluate the sensitivity of our operations to changes in interest rates. Although management believes these assumptions are reasonable, the interest rate sensitivity of our assets and liabilities on net interest income and the market value of portfolio equity could vary substantially if different assumptions were used or actual experience differs from such assumptions. The assumptions we use are based upon proprietary and market data and reflect historical results and current market conditions. These assumptions relate to interest rates, prepayments, deposit decay rates and the market value of certain assets under the various interest rate scenarios. An independent service was used to provide market rates of interest and certain interest rate assumptions to determine prepayments and maturities of loans, investments and borrowings and decay rates on deposits. Time deposits are modeled to reprice to market rates upon their stated maturities. We assumed that non-maturity deposits can be maintained with rate adjustments not directly proportionate to the change in market interest rates.
In the past, we have demonstrated that the tiering structure of our deposit accounts during changing rate environments results in relatively low volatility and less than market rate changes in our interest expense for deposits. Our deposit accounts are tiered by balance and rate, whereby higher balances within an account earn higher rates of interest. Therefore, deposits that are not very rate sensitive (generally, lower balance tiers) are separated from deposits that are rate sensitive (generally, higher balance tiers).
We generally have found that a number of our deposit accounts are less rate sensitive than others. Thus, when interest rates increase, the interest rates paid on these deposit accounts do not require a proportionate increase in order for us to retain them. These assumptions are based upon an analysis of our customer base, competitive factors and historical experience. The following table shows the change in our net portfolio value at June 30, 2013 that would occur upon an immediate change in interest rates based on our assumptions, but without giving effect to any steps that we might take to counteract that change. The net portfolio value is calculated based upon the present value of the discounted cash flows from assets and liabilities. The difference between the present value of assets and liabilities is the net portfolio value and represents the market value of equity for the given interest rate scenario. Net portfolio value is useful for determining, on a market value basis, how much equity changes in response to various interest rate scenarios. Large changes in net portfolio value reflect increased interest rate sensitivity and generally more volatile earnings streams.
Basis Point Change in Rates |
| Net Portfolio Value (1) |
| Net Portfolio as % of Portfolio Value of Assets |
| Market Value of Assets (5) | |||||||||||||||
| Amount |
| $ Change (2) |
| % Change |
| NPV Ratio (3) |
| % Change (4) |
| |||||||||||
|
| (Dollars in thousands) | |||||||||||||||||||
300 |
| $ | 48,485 | |
| $ | (8,594 | ) |
| (15.06 | )% |
| 11.21 | % |
| (1.36 | )% |
| $ | 432,499 | |
200 |
| 52,269 | |
| (4,810 | ) |
| (8.43 | ) |
| 11.87 | |
| (0.70 | ) |
| 440,464 | | |||
100 |
| 55,237 | |
| (1,842 | ) |
| (3.23 | ) |
| 12.34 | |
| (0.23 | ) |
| 447,803 | | |||
Base |
| 57,079 | |
| - | |
| - | |
| 12.57 | |
| - | |
| 454,215 | | |||
(100) |
| 57,819 | |
| 740 | |
| 1.30 | |
| 12.57 | |
| - | |
| 460,117 | | |||
(200) |
| 62,217 | |
| 5,138 | |
| 9.00 | |
| 13.35 | |
| 0.78 | |
| 466,085 | | |||
__________
(1) | The net portfolio value is calculated based upon the present value of the discounted cash flows from assets and liabilities. The difference between the present value of assets and liabilities is the net portfolio value and represents the market value of equity for the given interest rate scenario. Net portfolio value is useful for determining, on a market value basis, how much |
77
Table of Contents
equity changes in response to various interest rate scenarios. Large changes in net portfolio value reflect increased interest rate sensitivity and generally more volatile earnings streams.
(2) | Represents the increase (decrease) in the estimated net portfolio value at the indicated change in interest rates compared to the net portfolio value assuming no change in interest rates. |
(3) | Calculated as the net portfolio value divided by the market value of assets ("net portfolio value ratio"). |
(4) | Calculated as the increase (decrease) in the net portfolio value ratio assuming the indicated change in interest rates over the estimated net portfolio value ratio assuming no change in interest rates. |
(5) | Calculated based on the present value of the discounted cash flows from assets. The market value of assets represents the value of assets under the various interest rate scenarios and reflects the sensitivity of those assets to interest rate changes. |
The following table illustrates the change in net interest income that would occur in the event of an immediate change in interest rates at June 30, 2013, but without giving effect to any steps that might be taken to counter the effect of that change in interest rates.
Basis Point Change in Rates |
| Net Interest Income | |||||||||
| Amount |
| $ Change (1) |
| % Change | ||||||
|
| (Dollars in thousands) | |||||||||
300 |
| $ | 13,780 | |
| $ | 158 | |
| 1.2 | % |
200 |
| 13,907 | |
| 285 | |
| 2.1 | | ||
100 |
| 13,867 | |
| 245 | |
| 1.8 | | ||
Base |
| 13,622 | |
| - | |
| - | | ||
(100) |
| 12,603 | |
| (1,019 | ) |
| (7.5 | ) | ||
(200) |
| 11,795 | |
| (1,826 | ) |
| (13.4 | ) | ||
(1) | Represents the increase (decrease) of the estimated net interest income at the indicated change in interest rates compared to net interest income assuming no change in interest rates. |
We use certain assumptions in assessing our interest rate risk. These assumptions relate to interest rates, loan prepayment rates, deposit decay rates and the market values of certain assets under differing interest rate scenarios, among others.
As with any method of measuring interest rate risk, shortcomings are inherent in the method of analysis presented in the foregoing tables. For example, although assets and liabilities may have similar maturities or periods to repricing, they may react in different degrees to changes in the market interest rates. Also, the interest rates on certain types of assets and liabilities may fluctuate in advance of changes in market interest rates, while interest rates on other types may lag behind changes in market rates. Additionally, certain assets, such as adjustable rate mortgage loans, have features that restrict changes in interest rates on a short-term basis and over the life of the asset. Further, if interest rates change, expected rates of prepayments on loans and early withdrawals from certificates of deposit could deviate significantly from those assumed in calculating the table.
78
Table of Contents
The following table presents our interest sensitivity gap between interest-earning assets and interest-bearing liabilities at June 30, 2013. These amounts are based on daily averages.
| Within Six Months |
|
Over Six Months to One Year |
| Over 1 - 3 Years |
| Over 3 - 5 Years |
| Over 5 - 10 Years |
| Over 10 Years |
| Total | ||||||||||||||
| (Dollars in thousands) | ||||||||||||||||||||||||||
Interest-earning assets: |
|
|
|
|
|
|
|
|
|
|
|
|
| ||||||||||||||
Loans | $ | 109,496 | |
| $ | 45,004 | |
| $ | 78,578 | |
| $ | 42,877 | |
| $ | 9,624 | |
| $ | 1,340 | |
| $ | 286,919 | |
Investments and other interest bearing deposits | 8,510 | |
| 6,747 | |
| 19,276 | |
| 9,889 | |
| 15,919 | |
| 2,462 | |
| 62,803 | | |||||||
Life insurance investment, net | - | |
| 18,879 | |
| - | |
| - | |
| - | |
| - | |
| 18,879 | | |||||||
Total rate sensitive assets | 118,006 | |
| 70,630 | |
| 97,854 | |
| 52,766 | |
| 25,543 | |
| 3,802 | |
| 368,601 | | |||||||
Interest-bearing liabilities: |
|
|
|
|
|
|
|
|
|
|
|
|
| ||||||||||||||
Deposits | 167,234 | |
| 25,418 | |
| 43,545 | |
| 46,303 | |
| 48,183 | |
| 3,802 | |
| 334,485 | | |||||||
Borrowings | 47,400 | |
| - | |
| 17,500 | |
| - | |
| - | |
| - | |
| 64,900 | | |||||||
Total rate sensitive liabilities | 214,634 | |
| 25,418 | |
| 61,045 | |
| 46,303 | |
| 48,183 | |
| 3,802 | |
| 399,385 | | |||||||
Excess (deficiency) of interest sensitivity assets over interest sensitivity liabilities | (96,628 | ) |
| 45,212 | |
| 36,809 | |
| 6,463 | |
| (22,640 | ) |
| - | |
| (30,784 | ) | |||||||
Cumulative excess (deficiency) of interest sensitivity assets | (96,628 | ) |
| (51,417 | ) |
| (14,607 | ) |
| (8,144 | ) |
| (30,784 | ) |
| (30,784 | ) |
| - | | |||||||
As a percentage of total interest-earning assets | (0.82 | )% |
| (1.03 | )% |
| (1.09 | )% |
| (1.14 | )% |
| (1.07 | )% |
| (1.08 | )% |
| - | | |||||||
Anchor Bank currently runs an internal model to simulate interest rate risk; the model in use is a Fiserv model which calculates interest-earning assets and liabilities using a monthly average.
Liquidity
We are required to have enough cash flow in order to maintain sufficient liquidity to ensure a safe and sound operation. Historically, we have maintained cash flow above the minimum level believed to be adequate to meet the requirements of normal operations, including potential deposit outflows. On a monthly basis, we review and update cash flow projections to ensure that adequate liquidity is maintained.
Our primary sources of funds are from customer deposits, loan repayments, loan sales, investment payments, maturing securities and advances from the FHLB of Seattle. These funds, together with retained earnings and equity, are used to make loans, acquire securities and other assets, and fund continuing operations. While maturities and the scheduled amortization of loans are a predictable source of funds, deposit flows and mortgage prepayments are greatly influenced by the level of interest rates, economic conditions and competition.
We believe that our current liquidity position is sufficient to fund all of our existing commitments. At June 30, 2013, the total approved loan origination commitments outstanding amounted to $275,000. At the same date, unused lines of credit were $25.6 million.
For purposes of determining our liquidity position, we use a concept of basic surplus, which is derived from the total of available-for-sale investments, as well as other liquid assets, less short-term liabilities. Our Board of Directors has established a target range for basic surplus of 5% to 7%. During the year ended June 30, 2013, our average basic surplus was 18.83%. The relatively high level of liquidity is consistent with our strategy to mitigate liquidity risk during the current economic uncertainty and difficult banking environment as well as for potential lending opportunities in the future.
79
Table of Contents
Liquidity management is both a daily and long-term function of business management. Excess liquidity is generally invested in short-term investments such as overnight deposits or mortgage-backed securities. On a longer-term basis, we maintain a strategy of investing in various lending products as described in greater detail under Item 1. "Business – Lending Activities."
We use our sources of funds primarily to meet ongoing commitments, to pay maturing certificates of deposit and savings withdrawals, to fund loan commitments and to maintain our portfolio of mortgage-backed securities and securities.
Certificates of deposit scheduled to mature in one year or less at June 30, 2013 totaled $51.7 million. Management's policy is to generally maintain deposit rates at levels that are competitive with other local financial institutions. Recently we have targeted certain deposit rates at a lower level as part of our efforts to reduce higher costing certificates of deposits as part of our overall capital and liquidity strategy. Based on historical experience, we believe that a significant portion of maturing deposits will remain with Anchor Bank. In addition, we had the ability at June 30, 2013 to borrow an additional $14.3 million from the FHLB of Seattle. We also have a line of credit with the Federal Reserve Bank for $1.1 million which is collateralized with securities.
We measure our liquidity based on our ability to fund our assets and to meet liability obligations when they come due. Liquidity (and funding) risk occurs when funds cannot be raised at reasonable prices, or in a reasonable time frame, to meet our normal or unanticipated obligations. We regularly monitor the mix between our assets and our liabilities to manage effectively our liquidity and funding requirements.
Our primary source of funds is our deposits. When deposits are not available to provide the funds for our assets, we use alternative funding sources. These sources include, but are not limited to: cash management from the FHLB of Seattle, wholesale funding, brokered deposits, federal funds purchased and dealer repurchase agreements, as well as other short-term alternatives. Alternatively, we may also liquidate assets to meet our funding needs. On a monthly basis, we estimate our liquidity sources and needs for the coming three-month, six-month, and one-year time periods. Also, we determine funding concentrations and our need for sources of funds other than deposits. This information is used by our Asset Liability Management Committee in forecasting funding needs and investing opportunities.
Contractual Obligations
Through the normal course of operations, we have entered into certain contractual obligations. Our obligations generally relate to funding of operations through deposits and borrowings as well as leases for premises. Lease terms generally cover a five-year period, with options to extend, and are non-cancelable.
At June 30, 2013, our scheduled maturities of contractual obligations were as follows:
|
| Within 1 Year |
| After 1 Year Through 3 Years |
| After 3 Years Through 5 Years |
|
Beyond 5 Years |
| Total Balance | ||||||||||
|
| (In thousands) | ||||||||||||||||||
Certificates of deposit |
| $ | 51,733 | |
| $ | 27,930 | |
| $ | 29,989 | |
| $ | 40,031 | |
| $ | 149,683 | |
FHLB advances |
| 47,400 | |
| 17,500 | |
| - | |
| - | |
| 64,900 | | |||||
Operating leases |
| 109,392 | |
| 202,876 | |
| 55,692 | |
| - | |
| 367,960 | | |||||
Total contractual obligations |
| $ | 208,525 | |
| $ | 248,306 | |
| $ | 85,681 | |
| $ | 40,031 | |
| $ | 582,543 | |
Commitments and Off-Balance Sheet Arrangements
We are party to financial instruments with off-balance sheet risk in the normal course of business in order to meet the financing needs of our customers. These financial instruments generally include commitments to originate mortgage, commercial and consumer loans, and involve to varying degrees, elements of credit and interest rate risk in excess of the amount recognized in the balance sheet. Our maximum exposure to credit loss in the event of nonperformance by the borrower is represented by the contractual amount of those instruments. Because some commitments may expire without being drawn upon, the total commitment amounts do not necessarily represent future cash requirements. We use the same credit policies in making commitments as we do for on-balance sheet instruments. Collateral is not required to support commitments.
80
Table of Contents
Undisbursed balances of loans closed include funds not disbursed but committed for construction projects. Unused lines of credit include funds not disbursed, but committed to, home equity, commercial and consumer lines of credit.
The following table summarizes our commitments and contingent liabilities with off-balance sheet risks as of June 30, 2013:
| Amount of Commitment Expiration - Per Period | ||||||
| Total Amounts Committed (2) |
| Due in One Year | ||||
| (In thousands) | ||||||
Commitments to originate loans (1) | $ | 275 | |
| $ | 275 | |
Line of Credit |
|
|
| ||||
Fixed rate (3) | 3,452 | |
| 1,908 | | ||
Adjustable rate | 22,194 | |
| 5,827 | | ||
Undisbursed balance of loans closed | 25,646 | |
| 7,735 | | ||
(1) Interest rates on fixed rate loans range from 2.75% to 2.875%.
(2) At June 30, 2013 there were $51 in reserves for unfunded commitments.
(3) Includes standby letters of credit.
Capital
Consistent with our goal to operate a sound and profitable financial organization, we actively seek to maintain a "well capitalized" institution in accordance with regulatory standards and the Supervisory Directive. Anchor Bank's total regulatory capital was $56.3 million at June 30, 2013, or 12.5%, of total assets on that date. As of June 30, 2013, we exceeded all regulatory capital requirements to be considered well capitalized as of that date. Our regulatory capital ratios at June 30, 2013 were as follows: Tier 1 capital 11.4% ; Tier 1 (core) risk-based capital 16.7% ; and total risk-based capital 18.0% . The regulatory capital requirements to be considered well capitalized are 5%, 6% and 10%, respectively. We were "well capitalized" at June 30, 2013 based on financial statements prepared in accordance with generally accepted accounting principles in the United States and the general percentages in the regulatory guidelines, for federal regulatory purposes. Anchor Bancorp exceeded all regulatory capital requirements with Tier 1 Leverage Capital, Tier 1 Risk-Based Capital and Total Risk-Based Capital ratios of 11.7%, 17.2% and 18.4%, respectively, as of June 30, 2013.
Impact of Inflation
The Consolidated Financial Statements and related financial data presented herein have been prepared in accordance with accounting principles generally accepted in the United States of America. These principles generally require the measurement of financial position and operating results in terms of historical dollars, without considering changes in the relative purchasing power of money over time due to inflation.
Unlike most industrial companies, virtually all the assets and liabilities of a financial institution are monetary in nature. The primary impact of inflation is reflected in the increased cost of our operations. As a result, interest rates generally have a more significant impact on a financial institution's performance than do general levels of inflation. Interest rates do not necessarily move in the same direction or to the same extent as the prices of goods and services. In a period of rapidly rising interest rates, the liquidity and maturity structures of our assets and liabilities are critical to the maintenance of acceptable performance levels.
The principal effect of inflation on earnings, as distinct from levels of interest rates, is in the area of noninterest expense. Expense items such as employee compensation, employee benefits and occupancy and equipment costs may be subject to increases as a result of inflation. An additional effect of inflation is the possible increase in dollar value of the collateral securing loans that we have made. Our management is unable to determine the extent, if any, to which properties securing loans have appreciated in dollar value due to inflation.
81
Table of Contents
Recent Accounting Pronouncements
In July 2012, the Financial Accounting Standards Board (FASB) issued Accounting Standards Update (ASU) No. 2012-02, Testing Indefinite-Lived Intangible Assets for Impairment. With the ASU, a company testing indefinite-lived intangibles for impairment now has the option to assess qualitative factors to determine whether the existence of events and circumstances indicates that it is more likely than not that the indefinite-lived intangible asset is impaired. If, after assessing the totality of events and circumstances, an entity concludes that it is not more likely than not that the indefinite-lived intangible asset is impaired, then the entity is not required to take further action. However, if an entity concludes otherwise, then it is required to determine the fair value of the indefinite-lived intangible asset and perform the quantitative impairment test by comparing the fair value with the carrying amount in accordance with current guidance. An entity also has the option to bypass the qualitative assessment for any indefinite-lived intangible asset in any period and proceed directly to performing the quantitative impairment test. An entity will be able to resume performing the qualitative assessment in any subsequent period. The amendments were effective for annual and interim goodwill impairment tests performed for fiscal years beginning after September 15, 2012. The adoption of this ASU did not have a material impact on the Company's consolidated financial statements.
In September 2012, the FASB issued ASU No. 2012-03, Technical Amendments and Corrections to SEC Sections : Amendments to SEC Paragraphs Pursuant to SEC Staff Accounting Bulletin No. 114, Technical Amendments Pursuant to SEC Release No. 33-9250, and Corrections Related to FASB Accounting Standards Update 2010-22. This ASU amends various SEC paragraphs: ( a ) pursuant to the issuance of Staff Accounting Bulletin No. 114; ( b ) pursuant to the issuance of the SEC's Final Rule, "Technical Amendments to Commission Rules and Forms Related to the FASB's Accounting Standards Codification," Release Nos. 33-9250, 34-65052, and IC-29748 August 8, 2011; and ( c ) related to ASU 2010-22, Accounting for Various Topics . The adoption of this ASU did not have a material impact on the Company's consolidated financial statements.
In October 2012, the FASB issued ASU No. 2012-04, Technical Corrections and Improvements . This ASU includes amendments that identify when the use of fair value should be linked to the definition of fair value in Topic 820, Fair Value Measurement , and contains conforming amendments to the codification to reflect the measurement and disclosure requirements of Topic 820. In addition, this ASU deletes the second glossary definition of fair value that originated from AICPA Statement of Position 92-6, Accounting and Reporting by Health and Welfare Benefit Plans . The first definition originating from FASB No. 123, Share-Based Payment , and the third definition originating from FASB No. 157, Fair Value Measurements, remain. The conforming amendments to U.S. GAAP included in this ASU are generally non-substantive in nature. Many of the amendments conform wording to be consistent with the terminology in Topic 820 (e.g., revising market value and current market value to fair value, or mark-to-market to subsequently measure at fair value). The FASB does not anticipate that the amendments in this ASU will result in pervasive changes to current practice. However, certain amendments may result in a change to existing practice. For those amendments which the FASB deemed to be more substantive, transition guidance and a delayed effective date accompany them. The amendments to this ASU that will not have transition guidance were effective upon issuance. The amendments that are subject to the transition guidance were effective for fiscal periods beginning after December 15, 2012. The adoption of this ASU did not have a material impact on the Company's consolidated financial statements.
In February 2013, the FASB issued ASU 2013-02, Reporting of Amounts Reclassified Out of Accumulated Other Comprehensive Income . The ASU requires an entity to provide information about the amounts of reclassified out of accumulated other comprehensive income by component and to present either on the face of the statement where net income is presented, or in the notes, significant amounts reclassified out of accumulated other comprehensive income by the respective line items of net income, but only if the amount reclassified is required to be reclassified to net income in its entirety in the same reporting period. The amendments in this ASU were effective for annual and interim reporting periods beginning on or after December 15, 2012. The adoption of this ASU did not have a material impact on the Company's consolidated financial statements.
In July 2013, the FASB issued ASU No. 2013-10, Inclusion of the Fed Funds Effective Swap Rate (or Overnight Index Swap Rate) as a Benchmark Interest Rate for Hedge Accounting Purposes . ASU No. 2013-10 permits the use of the Fed Funds Effective Swap Rate (OIS) to be used as a U.S. benchmark interest rate for hedge account purposes. The amendment is effective prospectively for qualifying new or redesiginated hedging relationships entered into on or after July 17, 2013. The adoption of ASU No. 2013-10 is not expected to have a material impact on the Company's consolidated financial statements.
In July 2013, the FASB issued ASU No. 2013-11, Presentation of Unrecognized Tax Benefit When a Net Operating Loss Carryforward, a Similar Tax Loss, or a Tax Credit Carryforward Exists . ASU No. 2013-11 requires an entity to present an unrecognized tax benefit, or a portion of an unrecognized tax benefit, as a reduction to a deferred tax asset for a net operating loss carryforward, a similar tax loss, or a tax credit carryforward, except to the extent a net operating loss carryforward, a similar tax loss, or a tax credit carryforward is not available at the reporting date under the tax law of the applicable jurisdiction to settle any
82
Table of Contents
additional income taxes that would result from the disallowance of a tax position or the tax law of the applicable jurisdiction does not require the entity to use, and the entity does not intend to use, the deferred tax asset for such purpose, the unrecognized tax benefit should be presented in the financial statements as a liability and should not be combined with deferred tax assets. No new recurring disclosures are required. The amendments are effective for annual and interim reporting periods beginning on or after December 15, 2013 and are to be applied prospectively to all unrecognized tax benefits that exist at the effective date. Retrospective application is permitted. The adoption of ASU No. 2013-11 is not expected to have a material impact on the Company's consolidated financial statements.
Item 7A. Quantitative and Qualitative Disclosures about Market Risk
Market risk is the risk of loss from adverse changes in market prices and rates. Our market risk arises principally from interest rate risk inherent in our lending, investing, deposit and borrowings activities. Management actively monitors and manages its interest rate risk exposure. In addition to other risks that we manage in the normal course of business, such as credit quality and liquidity, management considers interest rate risk to be a significant market risk that could have a potentially have a material effect on our financial condition and result of operations. The information contained in Item 7, "Management's Discussion and Analysis of Financial Condition and Results of Operations – Asset and Liability Management" in this Form 10-K is incorporated herein by reference.
Item 8. Financial Statements and Supplementary Data
Index to Consolidated Financial Statements | Page |
Report of Independent Registered Public Accounting Firm | 84 |
Consolidated Statement of Financial Condition, June 30, 2013 and 2012 | 85 |
Consolidated Statement of Operations For the Years Ended June 30, 2013, 2012 and 2011 | 86 |
Consolidated Statement of Comprehensive Loss For the Years Ended June 30, 2013, 2012 and 2011 | 87 |
Consolidated Statement of Stockholders' Equity For the Years Ended June 30, 2013, 2012 and 2011 | 88 |
Consolidated Statement of Cash Flows For the Years Ended June 30, 2013, 2012 and 2011 | 89 |
Notes to Consolidated Financial Statements | 91 |
83
 |
REPORT OF INDEPENDENT REGISTERED PUBLIC ACCOUNTING FIRM
The Board of Directors and Stockholders
Anchor Bancorp
We have audited the accompanying consolidated statement of financial condition of Anchor Bancorp (the Company) as of June 30, 2013 and 2012, and the related consolidated statements of operations, comprehensive loss, stockholders' equity, and cash flows for the three years ended June 30, 2013. These consolidated financial statements are the responsibility of the Company's management. Our responsibility is to express an opinion on these consolidated financial statements based on our audits.
We conducted our audits in accordance with the standards of the Public Company Accounting Oversight Board (United States). Those standards require that we plan and perform the audit to obtain reasonable assurance about whether the consolidated financial statements are free of material misstatement. The Company is not required to have, nor were we engaged to perform, an audit of its internal control over financial reporting. Our audit included consideration of internal control over financial reporting as a basis for designing audit procedures that are appropriate in the circumstances, but not for the purpose of expressing an opinion on the effectiveness of the Company's internal control over financial reporting. Accordingly, we express no such opinion. An audit also includes examining, on a test basis, evidence supporting the amounts and disclosures in the consolidated financial statements, assessing the accounting principles used and significant estimates made by management, and evaluating the overall consolidated financial statement presentation. We believe that our audits provide a reasonable basis for our opinion.
In our opinion, the consolidated financial statements referred to above present fairly, in all material respects, the consolidated financial position of Anchor Bancorp as of June 30, 2013 and 2012, and the consolidated results of its operations and its cash flows for the three years ended June 30, 2013, in conformity with accounting principles generally accepted in the United States of America.

Everett, Washington
September 12, 2013
| 84 |  |
ANCHOR BANCORP
CONSOLIDATED STATEMENT OF FINANCIAL CONDITION
(Dollars in thousands, except share data)
| June 30, | ||||||
| 2013 |
| 2012 | ||||
ASSETS |
|
|
| ||||
Cash and cash equivalents | $ | 65,353 | |
| $ | 78,673 | |
Securities available-for-sale, at fair value, amortized cost of $49,259 and $48,170 | 48,308 | |
| 48,717 | | ||
Securities held-to-maturity, at amortized cost, fair value of $10,316 and $7,690 | 10,295 | |
| 7,179 | | ||
Loans held for sale | 222 | |
| 312 | | ||
Loans receivable, net of allowance for loan losses of $5,147 and $7,057 | 277,454 | |
| 287,755 | | ||
Life insurance investment, net of surrender charges | 18,879 | |
| 18,257 | | ||
Accrued interest receivable | 1,583 | |
| 1,532 | | ||
Real estate owned, net | 6,212 | |
| 6,708 | | ||
Federal Home Loan Bank ("FHLB") stock, at cost | 6,278 | |
| 6,510 | | ||
Property, premises, and equipment, at cost, less accumulated depreciation of $15,324 and $15,460 | 11,394 | |
| 12,213 | | ||
Deferred tax asset, net | 555 | |
| 555 | | ||
Prepaid expenses and other assets | 5,646 | |
| 2,404 | | ||
Total assets | $ | 452,179 | |
| $ | 470,815 | |
LIABILITIES AND STOCKHOLDERS' EQUITY
|
| |
|
| | ||
LIABILITIES |
| |
|
| | ||
Deposits: |
| |
|
| | ||
Noninterest-bearing | $ | 39,713 | |
| $ | 37,941 | |
Interest-bearing | 288,871 | |
| 307,857 | | ||
Total deposits | 328,584 | |
| 345,798 | | ||
|
|
|
| ||||
FHLB advances | 64,900 | |
| 64,900 | | ||
Advance payments by borrowers for taxes and insurance | 791 | |
| 562 | | ||
Supplemental Executive Retirement Plan liability | 1,703 | |
| 1,764 | | ||
Accounts payable and other liabilities | 3,833 | |
| 3,767 | | ||
Total liabilities | 399,811 | |
| 416,791 | | ||
Commitments and Contingencies (Note 16) | | |
| | | ||
STOCKHOLDERS' EQUITY |
|
|
| ||||
Preferred stock, $.01 par value per share, authorized 5,000,000 shares; no shares issued or outstanding | - | |
| - | | ||
Common stock, $.01 par value per share, authorized 45,000,000 shares; 2,550,000 issued and 2,464,433 outstanding at June 30, 2013 and 2,550,000 shares issued and 2,457,633 outstanding at June 30, 2012 | 25 | |
| 25 | | ||
Additional paid-in capital | 23,229 | |
| 23,202 | | ||
Retained earnings, substantially restricted | 31,491 | |
| 31,746 | | ||
Unearned Employee Stock Ownership Plan ("ESOP") shares | (856 | ) |
| (924 | ) | ||
Accumulated other comprehensive loss, net of tax | (1,521 | ) |
| (25 | ) | ||
Total stockholders' equity | 52,368 | |
| 54,024 | | ||
Total liabilities and stockholders' equity | $ | 452,179 | |
| $ | 470,815 | |
See accompanying notes to these consolidated financial statements.
85
ANCHOR BANCORP
CONSOLIDATED STATEMENT OF OPERATIONS
For the Years Ended June 30, 2013, 2012, and 2011
(Dollars in thousands, except share data)
| Years Ended June 30, | ||||||||||
| 2013 |
| 2012 |
| 2011 | ||||||
Interest income: |
|
|
|
|
| ||||||
Loans receivable, including fees | $ | 18,040 | |
| $ | 20,187 | |
| $ | 23,465 | |
Securities | 242 | |
| 311 | |
| 358 | | |||
Mortgage-backed securities | 1,445 | |
| 1,966 | |
| 2,146 | | |||
Total interest income | 19,727 | |
| 22,464 | |
| 25,969 | | |||
Interest expense: |
| |
|
| |
|
| ||||
Deposits | 3,522 | |
| 4,718 | |
| 5,830 | | |||
FHLB advances | 1,242 | |
| 1,372 | |
| 2,172 | | |||
Total interest expense | 4,764 | |
| 6,090 | |
| 8,002 | | |||
Net interest income before provision for loan losses | 14,963 | |
| 16,374 | |
| 17,967 | | |||
Provision for loan losses | 750 | |
| 2,735 | |
| 8,078 | | |||
Net interest income after provision for loan losses | 14,213 | |
| 13,639 | |
| 9,889 | | |||
Noninterest income |
| |
|
| |
|
| ||||
Deposit service fees | 1,468 | |
| 1,900 | |
| 2,288 | | |||
Other deposit fees | 863 | |
| 798 | |
| 860 | | |||
Gain on sale of investments | 70 | |
| 1,536 | |
| 135 | | |||
Loan fees | 712 | |
| 955 | |
| 971 | | |||
Gain on sale of loans | 444 | |
| 259 | |
| 174 | | |||
Bank owned life insurance investment | 622 | |
| 645 | |
| 692 | | |||
Other income | 745 | |
| 581 | |
| 632 | | |||
Total noninterest income | 4,924 | |
| 6,674 | |
| 5,752 | | |||
Noninterest expense |
| |
|
| |
|
| ||||
Compensation and benefits | 8,441 | |
| 8,447 | |
| 8,365 | | |||
General and administrative expenses | 3,277 | |
| 3,644 | |
| 3,733 | | |||
Real estate owned impairment | 1,487 | |
| 2,494 | |
| 4,624 | | |||
Real estate owned holding costs | 496 | |
| 862 | |
| 1,094 | | |||
Federal Deposit Insurance Corporation ("FDIC") insurance premiums | 651 | |
| 1,016 | |
| 1,164 | | |||
Information technology | 1,661 | |
| 2,271 | |
| 2,049 | | |||
Occupancy and equipment | 2,182 | |
| 2,192 | |
| 2,337 | | |||
Deposit services | 651 | |
| 771 | |
| 708 | | |||
Marketing | 584 | |
| 653 | |
| 543 | | |||
Loss on sale of property, premises and equipment | 56 | |
| 129 | |
| 168 | | |||
Gain on sale of real estate owned | (94 | ) |
| (454 | ) |
| (324 | ) | |||
Total noninterest expense | 19,392 | |
| 22,025 | |
| 24,461 | | |||
Loss before provision for income taxes | (255 | ) |
| (1,712 | ) |
| (8,820 | ) | |||
Provision for income taxes | - | |
| - | |
| - | | |||
Net loss | $ | (255 | ) |
| $ | (1,712 | ) |
| $ | (8,820 | ) |
Basic loss per share (1) | $ | (0.10 | ) |
| $ | (0.70 | ) |
| $ | (3.28 | ) |
Diluted loss per share (1) | $ | (0.10 | ) |
| $ | (0.70 | ) |
| $ | (3.28 | ) |
(1) | Loss per share for the year ended June 30, 2011 included in the table above represents the period from January 25, 2011 through June 30, 2011 as the Company completed its initial public offering on January 25, 2011 with the issuance of 2,550,000 shares of common stock. Prior to January 25, 2011 there were no shares outstanding. |
See accompanying notes to these consolidated financial statements.
86
ANCHOR BANCORP
CONSOLIDATED STATEMENT OF COMPREHENSIVE LOSS
For the Years Ended June 30, 2013, 2012, and 2011
(Dollars in thousands, except share data)
| Years Ended June 30, | ||||||||||
| 2013 |
| 2012 |
| 2011 | ||||||
NET LOSS | $ | (255 | ) |
| $ | (1,712 | ) |
| $ | (8,820 | ) |
OTHER COMPREHENSIVE LOSS, net of income tax |
| |
|
|
|
| |||||
Unrealized holding loss on available-for-sale securities during the period, net of income tax benefit of $0, $(37),and $(365), respectively | (1,426 | ) |
| (71 | ) |
| (483 | ) | |||
Adjustment for realized gains included in net loss | (70 | ) |
| (1,728 | ) |
| (135 | ) | |||
Other comprehensive loss net of income tax | (1,496 | ) |
| (1,799 | ) |
| (618 | ) | |||
COMPREHENSIVE LOSS | $ | (1,751 | ) |
| $ | (3,511 | ) |
| $ | (9,438 | ) |
See accompanying notes to these consolidated financial statements.
87
ANCHOR BANCORP
CONSOLIDATED STATEMENT OF STOCKHOLDERS' EQUITY
For the Years Ended June 30, 2013, 2012, and 2011
(Dollars in thousands, except share data)
| Shares |
| Common Stock |
| Additional Paid-in Capital |
| Retained Earnings |
| Unearned ESOP shares |
| Accumulated Other Comprehensive Loss, net of tax |
| Total Stockholders' Equity | |||||||||||||
Balance at June 30, 2010 | - | |
| $ | - | |
| $ | - | |
| $ | 42,278 | |
| $ | - | |
| $ | 2,392 | |
| $ | 44,670 | |
|
|
|
|
|
|
|
|
|
|
|
|
|
| |||||||||||||
Net loss | - | |
| - | |
| - | |
| (8,820 | ) |
| - | |
| - | |
| (8,820 | ) | ||||||
Other comprehensive loss net of tax | - | |
| - | |
| - | |
| - | |
| - | |
| (618 | ) |
| (618 | ) | ||||||
Proceeds from public offering, net of expenses | 2,550,000 | |
| 25 | |
| 23,187 | |
| - | |
| - | |
| - | |
| 23,212 | | ||||||
ESOP shares purchased | - | |
| - | |
| - | |
| - | |
| (1,020 | ) |
| - | |
| (1,020 | ) | ||||||
ESOP shares allocated | - | |
| - | |
| - | |
| - | |
| 28 | |
| - | |
| 28 | | ||||||
|
|
|
|
|
|
|
|
|
|
|
|
|
| |||||||||||||
Balance at June 30, 2011 | 2,550,000 | |
| $ | 25 | |
| $ | 23,187 | |
| $ | 33,458 | |
| $ | (992 | ) |
| $ | 1,774 | |
| $ | 57,452 | |
|
|
|
|
|
|
|
|
|
|
|
|
|
| |||||||||||||
Net loss | - | |
| $ | - | |
| $ | - | |
| $ | (1,712 | ) |
| $ | - | |
| $ | - | |
| $ | (1,712 | ) |
Other comprehensive loss net of tax | - | |
| - | |
| - | |
| - | |
| - | |
| (1,799 | ) |
| (1,799 | ) | ||||||
ESOP shares allocated | - | |
| - | |
| 15 | |
| - | |
| 68 | |
| - | |
| 83 | | ||||||
|
|
|
|
|
|
|
|
|
|
|
|
|
| |||||||||||||
Balance at June 30, 2012 | 2,550,000 | |
| $ | 25 | |
| $ | 23,202 | |
| $ | 31,746 | |
| $ | (924 | ) |
| $ | (25 | ) |
| $ | 54,024 | |
|
|
|
|
|
|
|
|
|
|
|
|
|
| |||||||||||||
Net loss | - | |
| $ | - | |
| $ | - | |
| $ | (255 | ) |
| $ | - | |
| $ | - | |
| $ | (255 | ) |
Other comprehensive loss net of tax | - | |
| - | |
| - | |
| - | |
| - | |
| (1,496 | ) |
| (1,496 | ) | ||||||
ESOP shares allocated | - | |
| - | |
| 27 | |
| - | |
| 68 | |
| - | |
| 95 | | ||||||
|
|
|
|
|
|
|
|
|
|
|
|
|
| |||||||||||||
Balance at June 30, 2013 | 2,550,000 | |
| $ | 25 | |
| $ | 23,229 | |
| $ | 31,491 | |
| $ | (856 | ) |
| $ | (1,521 | ) |
| $ | 52,368 | |
See accompanying notes to these consolidated financial statements.
88
ANCHOR BANCORP
CONSOLIDATED STATEMENT OF CASH FLOWS
For the Years Ended June 30, 2013, 2012, and 2011
(In thousands)
| Year Ended June 30, | |||||||||||
| 2013 |
| 2012 |
| 2011 | |||||||
CASH FLOWS FROM OPERATING ACTIVITIES |
|
|
|
|
| |||||||
Net loss | $ | (255 | ) |
| $ | (1,712 | ) |
| $ | (8,820 | ) | |
Adjustments to reconcile net loss to net cash from operating activities |
| |
|
| |
|
| |||||
Depreciation and amortization | 946 | |
| 924 | |
| 1,111 | | ||||
Net amortization of premiums on securities | 616 | |
| 132 | |
| 94 | | ||||
Provision for loan losses | 750 | |
| 2,735 | |
| 8,078 | | ||||
ESOP expense | 95 | |
| 68 | |
| 28 | | ||||
Real estate owned impairment | 1,487 | |
| 2,494 | |
| 4,624 | | ||||
Income from life insurance investment | (622 | ) |
| (645 | ) |
| (692 | ) | ||||
Gain on sale of loans | (444 | ) |
| (259 | ) |
| (174 | ) | ||||
Gain on sale of investments | (70 | ) |
| (1,536 | ) |
| (135 | ) | ||||
Originations of loans held for sale | (23,100 | ) |
| (20,558 | ) |
| (11,784 | ) | ||||
Proceeds from sale of loans held for sale | 22,566 | |
| 20,641 | |
| 15,503 | | ||||
Loss on sale of property, premises, and equipment | 56 | |
| 129 | |
| 168 | | ||||
Gain on sale of real estate owned | (94 | ) |
| (454 | ) |
| (324 | ) | ||||
Changes in operating assets and liabilities: |
| |
|
| |
|
| |||||
Accrued interest receivable | (51 | ) |
| 278 | |
| 348 | | ||||
Prepaid expenses and other assets | (3,242 | ) |
| (821 | ) |
| 1,738 | | ||||
Supplemental Executive Retirement Plan | (61 | ) |
| (74 | ) |
| (101 | ) | ||||
Accounts payable and other liabilities | 66 | |
| 885 | |
| (1,227 | ) | ||||
Net cash provided by operating activities | (1,357 | ) |
| 2,227 | |
| 8,435 | | ||||
CASH FLOWS FROM INVESTING ACTIVITIES |
| |
|
| |
|
| |||||
Proceeds from sales and maturities of available-for-sale securities | 1,166 | |
| 28,147 | |
| 4,403 | | ||||
Purchases of available-for-sale investments | (19,610 | ) |
| (47,737 | ) |
| - | | ||||
Purchase of held-to-maturity investments | (5,830 | ) |
| (1,540 | ) |
| - | | ||||
Principal repayments on mortgage-backed securities available-for-sale | 16,813 | |
| 10,095 | |
| 5,825 | | ||||
Principal repayments on mortgage-backed securities held-to-maturity | 2,649 | |
| 1,933 | |
| 2,431 | | ||||
Loan originations, net of undisbursed loan proceeds and principal repayments | 5,865 | |
| 25,957 | |
| 44,599 | | ||||
Proceeds from sale of real estate owned | 4,945 | |
| 11,690 | |
| 9,608 | | ||||
Capital improvements on real estate owned | (793 | ) |
| (163 | ) |
| (319 | ) | ||||
Proceeds from sale of property, premises, and equipment | (37 | ) |
| 117 | |
| - | | ||||
Purchase of fixed assets | (146 | ) |
| (307 | ) |
| 80 | | ||||
Net cash provided by investing activities | 5,022 | |
| 28,192 | |
| 66,627 | | ||||
CASH FLOWS FROM FINANCING ACTIVITIES |
| |
|
| |
|
| |||||
Net (decrease) increase in deposits | (17,214 | ) |
| 6,324 | |
| (16,314 | ) | ||||
Net change in advance payments by borrowers for taxes and insurance | 229 | |
| (827 | ) |
| (34 | ) | ||||
Proceeds from FHLB advances | - | |
| - | |
| 47,543 | | ||||
Repayment of FHLB advances | - | |
| (21,000 | ) |
| (98,543 | ) | ||||
Proceeds from stock offering, net of costs | - | | - | | - | |
| 23,212 | | |||
Net cash provided by financing activities | (16,985 | ) |
| (15,503 | ) |
| (44,136 | ) | ||||
See accompanying notes to these consolidated financial statements.
89
ANCHOR BANCORP
CONSOLIDATED STATEMENT OF CASH FLOWS
For the Years Ended June 30, 2013, 2012, and 2011
(In thousands)
CONSOLIDATED STATEMENTS OF CASH FLOWS (continued) | Years Ended June 30, | ||||||||||
| 2013 |
| 2012 |
| 2011 | ||||||
|
|
|
|
|
| ||||||
NET CHANGE IN CASH AND CASH EQUIVALENTS | (13,320 | ) |
| 14,916 | |
| 30,926 | | |||
Beginning of period | 78,673 | |
| 63,757 | |
| 32,831 | | |||
End of period | $ | 65,353 | |
| $ | 78,673 | |
| $ | 63,757 | |
SUPPLEMENTAL DISCLOSURES OF CASH FLOW INFORMATION |
|
|
|
|
| ||||||
Noncash investing activities |
| |
|
| |
|
| ||||
Net loans transferred to real estate owned | $ | 5,050 | |
| $ | 7,678 | |
| $ | 11,615 | |
Loans securitized into mortgage-backed securities | $ | 1,069 | |
| $ | 4,682 | |
| $ | - | |
CASH PAID DURING THE PERIOD FOR INTEREST | $ | 4,765 | |
| $ | 6,114 | |
| $ | 8,240 | |
See accompanying notes to these consolidated financial statements.
90
ANCHOR BANCORP
NOTES TO CONSOLIDATED FINANCIAL STATEMENTS
(Dollars in thousands except share data)
|
|
|
Note 1 - Organization and Summary of Significant Accounting Policies
Conversion and change in corporate form - On January 25, 2011, in accordance with a Plan of Conversion (Plan) adopted by its Board of Directors and as approved by its depositors and borrowers, Anchor Mutual Savings Bank (i) converted from a mutual savings bank to a stock savings bank, (ii) changed its name to "Anchor Bank" (the Bank), and (iii) became the wholly-owned subsidiary of Anchor Bancorp (the Company), a bank holding company registered with the Board of Governors of the Federal Reserve System (Federal Reserve). In connection with the conversion, the Company issued an aggregate of 2,550,000 shares of common stock at an offering price of $10.00 per share for gross proceeds of $25.5 million . The cost of conversion and the issuance of capital stock was approximately $2.3 million , which was deducted from the proceeds of the offering.
Pursuant to the Plan, the Bank's Board of Directors adopted an employee stock ownership plan (ESOP), which subscribed for 4% of the common stock sold in the offering or 102,000 shares. As provided for in the Plan, the Bank also established a liquidation account in the amount of retained earnings as of June 30, 2010. The liquidation account will be maintained for the benefit of eligible savings account holders as of June 30, 2007 and supplemental eligible account holders as of September 30, 2010 who maintain deposit accounts in the Bank after the conversion. The conversion was accounted for as a change in corporate form with the historic basis of the Bank's assets, liabilities, and equity unchanged as a result.
General - The Company was incorporated in September 2008 as the proposed holding company for Anchor Bank in connection with the Bank's conversion from the mutual to stock form of ownership, which was completed on January 25, 2011.
Anchor Bank is a community-based savings bank primarily serving Western Washington through its 11 full-service banking offices (including two Wal-Mart in-store locations) located within Grays Harbor, Thurston, Lewis, Mason and Pierce counties, Washington. In addition the Bank has two loan production offices located in Grays Harbor County. Anchor Bank's business consists of attracting deposits from the public and utilizing those deposits to originate loans.
Lines of business - The Bank's operations include commercial banking services, such as lending activities, deposit products, and other cash management services. The performance of the Bank is reviewed by the Board of Directors and Senior Management Committee. The Senior Management Committee, which is the senior decision-making group of the Bank, is composed of five members, including the President/Chief Executive Officer. The Company's activities are considered to be a single industry segment for financial reporting purposes.
Financial statement presentation and use of estimates - The consolidated financial statements have been prepared in accordance with accounting principles generally accepted in the United States of America and reporting practices applicable to the banking industry. In preparing the consolidated financial statements, management is required to make estimates and assumptions that affect the reported amounts of assets and liabilities, as of the date of the consolidated balance sheet, and revenues and expenses for the period. Actual results could differ from estimated amounts. Material estimates that are particularly susceptible to significant change relate to the determination of the allowance for loan losses, valuation of real estate owned, and deferred tax assets.
Principles of consolidation - The consolidated financial statements include the accounts of Anchor Bancorp and its wholly-owned subsidiary, Anchor Bank. All material intercompany accounts have been eliminated in consolidation.
Subsequent events - The Company has evaluated events and transactions subsequent to June 30, 2013 for potential recognition or disclosure.
Cash and cash equivalents - For purposes of the consolidated statement of cash flows, the Bank considers all deposits and funds in interest-bearing accounts with an original term to maturity of three months or less to be cash equivalents. The Bank maintains its cash in bank deposit accounts that, at times, may exceed the federally insured limits. The Bank has not experienced any losses in such accounts and evaluates the credit quality of these banks and financial institutions to mitigate its credit risk.
Restricted assets - Federal Reserve regulations require maintenance of certain minimum reserve balances on deposit with the Federal Reserve Bank (FRB). The amount required to be on deposit was $1,433 and $1,285 at June 30, 2013 and 2012, respectively. The Bank was in compliance with this requirement at June 30, 2013 and 2012.
Investment securities - Securities are classified as held-to-maturity when the Bank has the ability and positive intent to hold them to maturity. Securities held-to-maturity are carried at cost, adjusted for amortization of premiums and accretion of discounts to maturity. Securities bought and held principally for the purpose of sale in the near term are classified as trading securities and are
91
ANCHOR BANCORP
NOTES TO CONSOLIDATED FINANCIAL STATEMENTS
(Dollars in thousands except share data)
|
|
|
carried at fair value. There were no trading securities at June 30, 2013 and 2012. Securities not classified as trading or held-to-maturity are classified as available-for-sale. Unrealized holding gains and losses on securities available-for-sale are excluded from earnings and are reported net of tax as a separate component of equity until realized. These unrealized holding gains and losses, net of tax, are also included as a component of comprehensive income. Realized gains and losses are recorded on the trade date and are determined using the specific identification method. Amortization of premiums and accretion of discounts are recognized into interest income using the effective interest method over the period to maturity.
The Bank evaluates securities for other-than-temporary impairment on a periodic basis, and more frequently when economic or market concerns warrant such evaluation. Consideration is given to the length of time and the extent to which the fair value has been less than cost, the financial condition and near-term prospects of the issuer, and whether the Bank does not have the intent to sell these securities and it is likely that it will not be required to sell the securities before their anticipated recovery. In analyzing an issuer's financial condition, the Bank may consider whether the securities are issued by the federal government or its agencies, whether downgrades by bond rating agencies have occurred, and the results of reviews of the issuer's financial condition. If the Bank does not intend to sell the security or it is not more likely than not it will be required to sell the security prior to recovery of its cost basis, the credit loss component of impairment is recognized in earnings and impairment associated with non-credit factors, such as market liquidity, is recognized in other comprehensive income net of tax. A credit loss is the difference between the cost basis of the security and the present value of cash flows expected to be collected, discounted at the security's effective interest rate at the date of acquisition. The cost basis of an other-than-temporarily impaired security is written down by the amount of impairment recognized in earnings. The new cost basis is not adjusted for subsequent recoveries in fair value. However, the difference between the new amortized cost basis and the cash flows expected to be collected is accreted as interest income. The total other-than-temporary impairment is presented in the consolidated statements of operations with a reduction for the amount of other-than-temporary impairment that is recognized in other comprehensive income, if any.
Federal Home Loan Bank stock - The Bank's investment in FHLB stock is carried at cost, which approximates fair value. As a member of the FHLB system, the Bank is required to maintain a minimum level of investment in FHLB stock based on specific percentages of its outstanding mortgages, total assets, or FHLB advances. At both June 30, 2013 and 2012, the Bank's minimum investment requirement was $2,871 . The Bank was in compliance with the FHLB minimum investment requirement at June 30, 2013 and 2012.
Management evaluates FHLB stock for impairment as needed. Management's determination of whether these investments are impaired is based on their assessment of the ultimate recoverability of cost rather than by recognizing temporary declines in value. The determination of whether a decline affects the ultimate recoverability of cost is influenced by criteria such as (1) the significance of any decline in net assets of the FHLB as compared with the capital stock amount for the FHLB and the length of time this situation has persisted; (2) commitments by the FHLB to make payments required by law or regulation and the level of such payments in relation to the operating performance of the FHLB; (3) the impact of legislative and regulatory changes on institutions and, accordingly, the customer base of the FHLB; and (4) the liquidity position of the FHLB. Based on its evaluation, management determined that there was no impairment of FHLB stock at June 30 2013 and 2012, respectively.
Securitizations - The Bank securitizes and services interests in residential home loans. The Bank securitizes these loans through the Federal Home Loan Mortgage Corporation (FHLMC). Of the total serviced loan portfolio of $110.8 million and $124.5 million at June 30, 2013 and 2012, $37.3 million and $53.5 million , respectively, represent securitized loans. The loans have been sold without recourse, servicing retained. All principal, interest, late fees, and escrow payments are collected and remitted to the investor daily.
Loans - Loans that management has the intent and ability to hold for the foreseeable future or until maturity or payoff are reported at the principal amount outstanding, net of unamortized nonrefundable loan fees and related direct loan origination costs. Deferred net fees and costs are recognized in interest income over the loan term using a method that generally produces a level yield on the unpaid loan balance. Interest is accrued primarily on a simple interest basis.
Nonaccrual loans are those for which management has discontinued accrual of interest because there exists significant uncertainty as to the full and timely collection of either principal or interest or because such loans have become contractually past due 90 days with respect to principal or interest. When a loan is placed on nonaccrual, all previously accrued but uncollected interest is reversed against current-period interest income. All subsequent payments received are first applied to unpaid principal and then to unpaid interest. Interest income is accrued at such time as the loan is brought fully current as to both principal and interest, and, in management's judgment, such loans are considered to be fully collectible.
92
ANCHOR BANCORP
NOTES TO CONSOLIDATED FINANCIAL STATEMENTS
(Dollars in thousands except share data)
|
|
|
Loans are considered impaired when the Company has determined that it may be unable to collect payments of principal or interest when due under the terms of the loan. In the process of identifying loans as impaired, management takes into consideration factors which include payment history and status, collateral value, financial condition of the borrower, and the probability of collecting scheduled payments in the future. Minor payment delays and insignificant payment shortfalls typically do not result in a loan being classified as impaired. The significance of payment delays and shortfalls is considered by management on a case by case basis, after taking into consideration the totality of circumstances surrounding the loans and the borrowers, including payment history and amounts of any payment shortfall, length and reason for delay, and likelihood of return to stable performance. Impairment is measured on a loan by loan basis for all loans in the portfolio except for the smaller groups of homogeneous consumer loans in the portfolio.
Restructured loans - A loan is classified as a troubled debt restructuring when a borrower is experiencing financial difficulties that lead to a restructuring of the loan, and the Company grants concessions to the borrower in the restructuring that it would not otherwise consider. These concessions may include interest rate reductions, principal forgiveness, extension of maturity date and other actions intended to minimize potential losses. Generally, a nonaccrual loan that is restructured remains on nonaccrual status for a period of six months to demonstrate that the borrower can meet the restructured terms. If the borrower's performance under the new terms is not reasonably assured, the loan remains classified as a nonaccrual loan.
Allowance for loan losses - Key elements of the allowance for loan loss methodology include the specific loan loss reserve, the general loan loss reserve, and the unallocated reserve, individually described below.
The specific loan loss reserve is established for individually impaired loans when the discounted cash flow or collateral value of the impaired loan is lower than the carrying value of that loan.
The general loan loss reserve is calculated by applying a specific loss percentage factor to the various groups of loans by loan type, based upon historic loss experience, and adjusted based upon the risk grade attached to any loan or group of loans. This portion of the allowance may be further adjusted for qualitative and environmental conditions such as changes in lending policies and procedures; experience and ability of lending staff; concentrations of credit; national, regional, and local economic conditions; and other factors including levels and trends of delinquency.
The unallocated reserve recognizes the estimation risk associated with the mathematical calculations applied in both specific and general portions of the allowance for loan loss, together with the assumption risk relative to management's assessment of the variables included in the qualitative and environmental factors.
The Bank maintains an allowance for loan losses to absorb losses inherent in the loan portfolio. The allowance is based on ongoing quarterly assessments of the probable estimated losses inherent in the loan portfolio. The allowance is increased by the provision for loan losses, which is charged against current-period operating results and decreased by the amount of charge-offs, net of recoveries. Various regulatory agencies, as part of their examination process, periodically review the Bank's allowance for loan losses. Such agencies may require management to make adjustments to the allowance using judgments available to them at the time of their examination.
Loans held-for-sale - Loans originated as held-for-sale are carried at the lower of cost or market value on an aggregate basis. Net unrealized losses, if any, are recognized through a valuation allowance by a charge to income. Nonrefundable fees and direct loan origination costs related to loans held-for-sale are deferred and recognized when the loans are sold.
Real estate owned - Real estate owned (REO) and other repossessed items consist of properties or assets acquired through or in lieu of foreclosure in full satisfaction of a loan receivable, and are recorded initially at fair value of the REO properties less estimated costs of disposal with any initial losses charged to the allowance for loan losses. Costs relating to development and improvement of the properties or assets are capitalized, while costs relating to holding the properties or assets are expensed. Valuations are periodically performed by management, and a charge to earnings is recorded if the recorded value of a property exceeds its estimated fair value.
Gains or losses at the time the property is sold are charged or credited to noninterest expense in the period in which they are realized. The amounts the Bank will ultimately recover from REO may differ substantially from the carrying value of the assets because of future market factors beyond the control of the Bank or because of changes in the Bank's strategy for recovering its investments.
93
ANCHOR BANCORP
NOTES TO CONSOLIDATED FINANCIAL STATEMENTS
(Dollars in thousands except share data)
|
|
|
Life insurance investment - The Bank is the sole beneficiary of life insurance policies that are recorded at their cash surrender value, net of any surrender charges, and cover certain key executives of the Bank. The $622 , $645 , and $692 of income for the years ended June 30, 2013, 2012, and 2011, respectively, is tax-exempt and included in other income.
Transfers of financial assets - Transfers of financial assets are accounted for as sales when control over the assets has been surrendered. Control over transferred assets is deemed surrendered when (1) the assets have been isolated from the Bank, (2) the transferee obtains the right (free of conditions that constrain it from taking advantage of that right) to pledge or exchange the transferred assets, and (3) the Bank does not maintain effective control over the transferred assets through an agreement to repurchase them before their maturity.
Mortgage servicing rights - Mortgage servicing rights are recorded as separate assets at fair value when mortgage loans are originated and subsequently sold or securitized (and held as available-for-sale securities) with servicing rights retained. Periodically, the Bank estimates the fair value of its mortgage servicing rights based upon observed market prices.
Mortgage servicing rights are amortized in proportion to, and over, the estimated period that net servicing income will be collected. The carrying value of mortgage servicing rights is periodically evaluated in relation to estimated future cash flows to be received, and such carrying value is adjusted for indicated impairments based on management's best estimate of the remaining cash flows. The Bank has stratified its mortgage servicing rights based on whether the loan was sold or securitized and the interest rate of the underlying loans. The Bank uses the direct write-down method for mortgage servicing rights where the serviced loan has been paid off. The mortgage servicing asset was $505 and $546 at June 30, 2013 and 2012, respectively, and is included in prepaid expenses and other assets in the consolidated statement of financial condition.
Property, premises, and equipment - Property, premises, and equipment are stated at cost less accumulated depreciation. The depreciation charged is computed on the straight-line method over estimated useful lives as follows:
|
|
Buildings | 40 years |
Furniture and equipment | 5-10 years |
Improvements | 10 years |
Computer equipment | 3 years |
Income taxes- The provision for income taxes includes current and deferred income tax expense on net income adjusted for permanent and temporary differences such as interest income on state and municipal securities and affordable housing credits. Deferred tax assets and liabilities are recognized for the expected future tax consequences of existing temporary differences between the financial reporting and tax reporting basis of assets and liabilities using enacted tax laws and rates. The effect on deferred tax assets and liabilities of a change in tax rates is recognized in income in the period that includes the enactment date. On a quarterly basis, management evaluates deferred tax assets to determine if these tax benefits are expected to be realized in future periods. This determination is based on facts and circumstances, including the Company's current and future tax outlook. To the extent a deferred tax asset is no longer considered "more likely than not" to be realized, a valuation allowance is established.
Marketing costs - The Bank expenses marketing costs as they are incurred. Total marketing expenses were $584 , $653 , and $543 for the years ended June 30, 2013, 2012, and 2011, respectively.
Financial instruments - In the ordinary course of business, the Bank has entered into off-balance-sheet financial instruments consisting of commitments to extend credit, commercial letters of credit, and standby letters of credit. Such financial instruments are recorded in the financial statements when they are funded or related fees are incurred or received.
Contingencies - The Company and the Bank are defendants in various legal proceedings arising in connection with its business. It is the opinion of management that the financial position and the results of operations of the Company or the Bank will not be materially adversely affected by the final outcome of the legal proceedings and that adequate provision has been made in the accompanying consolidated financial statements.
94
ANCHOR BANCORP
NOTES TO CONSOLIDATED FINANCIAL STATEMENTS
(Dollars in thousands except share data)
|
|
|
At periodic intervals, the Washington State Department of Financial Institutions, Division of Banks (DFI) and the FDIC routinely examine the Bank's financial statements as part of their legally prescribed oversight of the banking industry. Based on these examinations, the regulators can direct that the Bank's financial statements be adjusted in accordance with their findings.
Employee Stock Ownership Plan (ESOP) - The cost of shares issued to the ESOP, but not yet allocated to participants, is shown as a reduction of stockholders' equity. Compensation expense is based on the market price of shares as they are committed to be released to participant accounts. Dividends on allocated ESOP shares reduce retained earnings; dividends on unearned ESOP shares reduce debt and accrued interest.
Earnings (Loss) Per Share (EPS) - Basic EPS is computed by dividing net income or (loss) by the weighted-average number of common shares outstanding during the period. As ESOP shares are committed to be released they become outstanding for EPS calculation purposes. ESOP shares not committed to be released are not considered outstanding. The basic EPS calculation excludes the dilutive effect of all common stock equivalents. Diluted earnings (loss) per share reflects the weighted-average potential dilution that could occur if all potentially dilutive securities or other commitments to issue common stock were exercised or converted into common stock using the treasury stock method.
Comprehensive income - Accounting principles generally require that recognized revenue, expenses, gains, and losses be included in net income (loss). Certain changes in assets and liabilities, such as unrealized gains and losses on available-for-sale investments, are reported as a separate component of stockholders' equity.
Fair value - Fair value is defined as the price that would be received to sell an asset or paid to transfer a liability in an orderly transaction between market participants at the measurement date.
The Bank determined the fair values of its financial instruments based on the fair value hierarchy, which requires an entity to maximize the use of observable inputs and minimize the use of unobservable inputs when measuring fair values. Observable inputs reflect market data obtained from independent sources, while unobservable inputs reflect the Bank's estimates for market assumptions.
Valuation inputs refer to the assumptions market participants would use in pricing a given asset or liability using one of the three valuation techniques. Inputs can be observable or unobservable. Observable inputs are those assumptions that market participants would use in pricing the particular asset or liability. These inputs are based on market data and are obtained from an independent source. Unobservable inputs are assumptions based on the Bank's own information or estimate of assumptions used by market participants in pricing the asset or liability. Unobservable inputs are based on the best and most current information available on the measurement date.
All inputs, whether observable or unobservable, are ranked in accordance with a prescribed fair value hierarchy:
• | Level 1 - Quoted prices for identical instrument in active markets. |
• | Level 2 - Quoted prices for similar instruments in active markets; quoted prices for identical or similar instruments in markets that are not active; and model-driven valuations whose inputs are observable. |
• | Level 3 - Instruments whose significant value drivers are unobservable. |
Recently issued accounting pronouncements - In July 2012, the Financial Accounting Standards Board (FASB) issued Accounting Standards Update (ASU) No. 2012-02, Testing Indefinite-Lived Intangible Assets for Impairment. With the ASU, a company testing indefinite-lived intangibles for impairment now has the option to assess qualitative factors to determine whether the existence of events and circumstances indicates that it is more likely than not that the indefinite-lived intangible asset is impaired. If, after assessing the totality of events and circumstances, an entity concludes that it is not more likely than not that the indefinite-lived intangible asset is impaired, then the entity is not required to take further action. However, if an entity concludes otherwise, then it is required to determine the fair value of the indefinite-lived intangible asset and perform the quantitative impairment test by comparing the fair value with the carrying amount in accordance with current guidance. An entity also has the option to bypass the qualitative assessment for any indefinite-lived intangible asset in any period and proceed directly to performing the quantitative impairment test. An entity will be able to resume performing the qualitative assessment in any subsequent period. The amendments were effective for annual and interim goodwill impairment tests performed for fiscal years beginning after September 15, 2012. The adoption of this ASU did not have a material impact on the Company's consolidated financial statements.
95
ANCHOR BANCORP
NOTES TO CONSOLIDATED FINANCIAL STATEMENTS
(Dollars in thousands except share data)
|
|
|
In September 2012, the FASB issued ASU No. 2012-03, Technical Amendments and Corrections to SEC Sections: Amendments to SEC Paragraphs Pursuant to SEC Staff Accounting Bulletin No. 114, Technical Amendments Pursuant to SEC Release No. 33-9250, and Corrections Related to FASB Accounting Standards Update 2010-22. This ASU amends various SEC paragraphs: (a) pursuant to the issuance of Staff Accounting Bulletin No. 114; (b) pursuant to the issuance of the SEC's Final Rule, "Technical Amendments to Commission Rules and Forms Related to the FASB's Accounting Standards Codification," Release Nos. 33-9250, 34-65052, and IC-29748 August 8, 2011; and (c) related to ASU 2010-22, Accounting for Various Topics . The adoption of this ASU did not have a material impact on the Company's consolidated financial statements.
In October 2012, the FASB issued ASU No. 2012-04, Technical Corrections and Improvements . This ASU includes amendments that identify when the use of fair value should be linked to the definition of fair value in Topic 820, Fair Value Measurement , and contains conforming amendments to the codification to reflect the measurement and disclosure requirements of Topic 820. In addition, this ASU deletes the second glossary definition of fair value that originated from AICPA Statement of Position 92-6, Accounting and Reporting by Health and Welfare Benefit Plans . The first definition originating from FASB No. 123, Share-Based Payment , and the third definition originating from FASB No. 157, Fair Value Measurements, remain. The conforming amendments to U.S. GAAP included in this ASU are generally non-substantive in nature. Many of the amendments conform wording to be consistent with the terminology in Topic 820 (e.g., revising market value and current market value to fair value, or mark-to-market to subsequently measure at fair value). The FASB does not anticipate that the amendments in this ASU will result in pervasive changes to current practice. However, certain amendments may result in a change to existing practice. For those amendments which the FASB deemed to be more substantive, transition guidance and a delayed effective date accompany them. The amendments to this ASU that will not have transition guidance were effective upon issuance. The amendments that are subject to the transition guidance were effective for fiscal periods beginning after December 15, 2012. The adoption of this ASU did not have a material impact on the Company's consolidated financial statements.
In February 2013, the FASB issued ASU 2013-02, Reporting of Amounts Reclassified Out of Accumulated Other Comprehensive Income . The ASU requires an entity to provide information about the amounts of reclassified out of accumulated other comprehensive income by component and to present either on the face of the statement where net income is presented, or in the notes, significant amounts reclassified out of accumulated other comprehensive income by the respective line items of net income, but only if the amount reclassified is required to be reclassified to net income in its entirety in the same reporting period. The amendments in this ASU were effective for annual and interim reporting periods beginning on or after December 15, 2012. The adoption of this ASU did not have a material impact on the Company's consolidated financial statements.
In July 2013, the FASB issued ASU No. 2013-10, Inclusion of the Fed Funds Effective Swap Rate (or Overnight Index Swap Rate) as a Benchmark Interest Rate for Hedge Accounting Purposes . ASU No. 2013-10 permits the use of the Fed Funds Effective Swap Rate (OIS) to be used as a U.S. benchmark interest rate for hedge account purposes. The amendment is effective prospectively for qualifying new or redesiginated hedging relationships entered into on or after July 17, 2013. The adoption of ASU No. 2013-10 is not expected to have a material impact on the Company's consolidated financial statements.
In July 2013, the FASB issued ASU No. 2013-11, Presentation of Unrecognized Tax Benefit When a Net Operating Loss Carryforward, a Similar Tax Loss, or a Tax Credit Carryforward Exists . ASU No. 2013-11 requires an entity to present an unrecognized tax benefit, or a portion of an unrecognized tax benefit, as a reduction to a deferred tax asset for a net operating loss carryforward, a similar tax loss, or a tax credit carryforward, except to the extent a net operating loss carryforward, a similar tax loss, or a tax credit carryforward is not available at the reporting date under the tax law of the applicable jurisdiction to settle any additional income taxes that would result from the disallowance of a tax position or the tax law of the applicable jurisdiction does not require the entity to use, and the entity does not intend to use, the deferred tax asset for such purpose, the unrecognized tax benefit should be presented in the financial statements as a liability and should not be combined with deferred tax assets. No new recurring disclosures are required. The amendments are effective for annual and interim reporting periods beginning on or after December 15, 2013 and are to be applied prospectively to all unrecognized tax benefits that exist at the effective date. Retrospective application is permitted. The adoption of ASU No. 2013-11 is not expected to have a material impact on the Company's consolidated financial statements.
96
ANCHOR BANCORP
NOTES TO CONSOLIDATED FINANCIAL STATEMENTS
(Dollars in thousands except share data)
|
|
|
Note 2 - Supervisory Directive, Economic Environment, and Management's Plans
Anchor Bank entered into an Order to Cease and Desist Order with the FDIC and the DFI on August 12, 2009. On September 5, 2012, the FDIC and the DFI terminated the Order and it was replaced with a Supervisory Directive.
The Order was terminated as a result of the steps Anchor Bank took in complying with the Order by reducing its level of classified assets, augmenting management and improving the overall condition of the Bank.
The Supervisory Directive contains provisions concerning: (i) the management and directors of Anchor Bank; (ii) restrictions on paying dividends; (iii) reductions of classified assets; (iv) maintaining Tier 1 capital in an amount equal to or exceeding 10% of Anchor Bank's total assets; (v) policies concerning the allowance for loan and lease losses (ALLL) ; and (vi) requirements to furnish a revised three-year business plan to improve Anchor Bank's profitability and progress reports to the FDIC and DFI.
Anchor Bank has also been notified that it must notify the FDIC and DFI in writing at least 30 days prior to certain management changes. These changes include the addition or replacement of a board member, or the employment or change in responsibilities of anyone who is, who will become, or who performs the duties of a senior executive officer. In addition prior to entering into any agreement to pay and prior to making any golden parachute payment or excess nondiscriminatory severance plan payment to any institution-affiliated party, Anchor Bank must file an application to obtain the consent of the FDIC.
Anchor Bank believes that it is in compliance with the requirements set forth in the Supervisory Directive.
Note 3 - Securities
The amortized cost and estimated fair market values of investment securities were as follows:
| Amortized Cost |
| Gross Unrealized Gains |
| Gross Unrealized Losses |
| Fair Value | ||||||||
June 30, 2013 |
|
|
| ||||||||||||
Securities available-for-sale |
|
|
|
|
|
|
| ||||||||
Municipal bonds | $ | 1,446 | |
| $ | 10 | |
| $ | - | |
| $ | 1,456 | |
Mortgage-backed securities: |
|
|
|
|
|
|
| ||||||||
FHLMC (1) | 20,675 | |
| 210 | |
| (470 | ) |
| 20,415 | | ||||
FNMA (2) | 25,639 | |
| 76 | |
| (744 | ) |
| 24,971 | | ||||
GNMA (3) | 1,499 | |
| - | |
| (33 | ) |
| 1,466 | | ||||
| $ | 49,259 | |
| $ | 296 | |
| $ | (1,247 | ) |
| $ | 48,308 | |
Securities held-to-maturity |
| |
|
| |
|
| |
|
| | ||||
Municipal bonds | $ | 135 | |
| $ | - | |
| $ | - | |
| $ | 135 | |
Mortgage-backed securities: |
|
|
|
|
|
|
| ||||||||
FHLMC | 4,744 | |
| 119 | |
| (109 | ) |
| 4,754 | | ||||
FNMA | 2,931 | |
| 164 | |
| (47 | ) |
| 3,048 | | ||||
GNMA | 2,485 | |
| - | |
| (106 | ) |
| 2,379 | | ||||
| $ | 10,295 | |
| $ | 283 | |
| $ | (262 | ) |
| $ | 10,316 | |
(1) Federal Home Loan Mortgage Corporation (Freddie Mac)
(2) Federal National Mortgage Association (Fannie Mae)
(3) Government National Mortgage Association (Ginnie Mae)
97
ANCHOR BANCORP
NOTES TO CONSOLIDATED FINANCIAL STATEMENTS
(Dollars in thousands except share data)
|
|
|
| Amortized Cost |
| Gross Unrealized Gains |
| Gross Unrealized Losses |
| Fair Value | ||||||||
June 30, 2012 |
|
|
| ||||||||||||
Securities available-for-sale |
|
|
|
|
|
|
| ||||||||
Municipal bonds | $ | 1,623 | |
| $ | 33 | |
| $ | - | |
| $ | 1,656 | |
Mortgage-backed securities: |
|
|
|
|
|
|
| ||||||||
FHLMC | 18,202 | |
| 532 | |
| (88 | ) |
| 18,646 | | ||||
FNMA | 28,345 | |
| 169 | |
| (99 | ) |
| 28,415 | | ||||
GNMA | - | |
| - | |
| - | |
| - | | ||||
| $ | 48,170 | |
| $ | 734 | |
| $ | (187 | ) |
| $ | 48,717 | |
Securities held-to-maturity |
| |
|
| |
|
| |
|
| | ||||
Municipal bonds | $ | 142 | |
| $ | - | |
| $ | - | |
| $ | 142 | |
Mortgage-backed securities: |
|
|
|
|
|
|
| ||||||||
FHLMC | 2,437 | |
| 202 | |
| - | |
| 2,639 | | ||||
FNMA | 3,075 | |
| 277 | |
| - | |
| 3,352 | | ||||
GNMA | 1,525 | |
| 32 | |
| - | |
| 1,557 | | ||||
| $ | 7,179 | |
| $ | 511 | |
| $ | - | |
| $ | 7,690 | |
At June 30, 2013 , there were 51 securities in an unrealized loss position compare to 20 securities in an unrealized loss position at June 30, 2012. The unrealized losses on investments in debt securities relate principally to the general change in interest rates in changing market conditions and not credit quality that has occurred since the securities' purchase dates, and such unrecognized losses or gains will continue to vary with general interest rate level fluctuations in the future. We do not intend to sell the temporarily impaired securities and it is not likely that we will be required to sell the securities. We do expect to recover the entire amortized cost basis of the securities. The fair value of temporarily impaired securities, the amount of unrealized losses, and the length of time these unrealized losses existed as of June 30, 2013 and 2012 were as follows:
| Less Than 12 Months |
| 12 Months or Longer |
| Total | ||||||||||||||||||
| Fair Value |
| Unrealized Losses |
| Fair Value |
| Unrealized Losses |
| Fair Value |
| Unrealized Losses | ||||||||||||
June 30, 2013 |
|
|
|
|
|
|
|
|
|
|
| ||||||||||||
Securities available-for-sale |
|
|
|
|
|
|
|
|
|
|
| ||||||||||||
Mortgage-backed securities: |
|
|
|
|
|
|
|
|
|
|
| ||||||||||||
FHLMC | $ | 9,559 | |
| $ | (281 | ) |
| $ | 4,760 | |
| $ | (189 | ) |
| $ | 14,319 | |
| $ | (470 | ) |
FNMA | 17,904 | |
| (502 | ) |
| 6,077 | |
| (242 | ) |
| 23,981 | |
| (744 | ) | ||||||
GNMA | 1,466 | |
| (33 | ) |
| - | |
| - | |
| 1,466 | |
| (33 | ) | ||||||
| $ | 28,929 | |
| $ | (816 | ) |
| $ | 10,837 | |
| $ | (431 | ) |
| $ | 39,766 | |
| $ | (1,247 | ) |
| Less Than 12 Months |
| 12 Months or Longer |
| Total | ||||||||||||||||||
| Fair Value |
| Unrealized Losses |
| Fair Value |
| Unrealized Losses |
| Fair Value |
| Unrealized Losses | ||||||||||||
June 30, 2013 |
|
|
|
|
|
|
|
|
|
|
| ||||||||||||
Securities held-to-maturity |
|
|
|
|
|
|
|
|
|
|
| ||||||||||||
Mortgage-backed securities: |
|
|
|
|
|
|
|
|
|
|
| ||||||||||||
FHLMC | $ | 2,960 | |
| $ | (109 | ) |
| $ | - | |
| $ | - | |
| $ | 2,960 | |
| $ | (109 | ) |
FNMA | 938 | |
| (47 | ) |
| - | |
| - | |
| 938 | |
| (47 | ) | ||||||
GNMA | 2,379 | |
| (106 | ) |
| - | |
| - | |
| 2,379 | |
| (106 | ) | ||||||
| $ | 6,277 | |
| $ | (262 | ) |
| $ | - | |
| $ | - | |
| $ | 6,277 | |
| $ | (262 | ) |
98
ANCHOR BANCORP
NOTES TO CONSOLIDATED FINANCIAL STATEMENTS
(Dollars in thousands except share data)
|
|
|
| Less Than 12 Months |
| 12 Months or Longer |
| Total | ||||||||||||||||||
| Fair Value |
| Unrealized Losses |
| Fair Value |
| Unrealized Losses |
| Fair Value |
| Unrealized Losses | ||||||||||||
June 30, 2012 |
|
|
|
|
|
|
|
|
|
|
| ||||||||||||
Securities available-for-sale |
| |
|
| |
|
| |
|
| |
|
| |
|
| | ||||||
Mortgage-backed securities: |
|
|
|
|
|
|
|
|
|
|
| ||||||||||||
FHLMC | $ | 7,542 | |
| $ | (88 | ) |
| $ | - | |
| $ | - | |
| $ | 7,542 | |
| $ | (88 | ) |
FNMA | 15,626 | |
| (99 | ) |
| - | |
| - | |
| 15,626 | |
| (99 | ) | ||||||
GNMA | - | |
| |
| - | |
| - | |
| - | |
| - | | |||||||
| $ | 23,168 | |
| $ | (187 | ) |
| $ | - | |
| $ | - | |
| $ | 23,168 | |
| $ | (187 | ) |
There were no held-to-maturity securities in an unrealized loss position at June 30, 2012.
Contractual maturities of securities at June 30, 2013 are listed below. Expected maturities of mortgage-backed securities may differ from contractual maturities because borrowers may have the right to call or prepay the obligations; therefore, these securities are classified separately with no specific maturity date.
| Amortized Cost |
| Fair Value | ||||
June 30, 2013 |
| ||||||
Securities available-for-sale |
|
|
| ||||
Municipal bonds: |
|
|
| ||||
Due within one year | $ | - | |
| $ | - | |
Due after one to five years | 600 | |
| 610 | | ||
Due five years to ten years | 645 | |
| 645 | | ||
Due after ten years | 201 | |
| 201 | | ||
Mortgage-backed securities: |
|
|
| ||||
FHLMC | 20,675 | |
| 20,145 | | ||
FNMA | 25,639 | |
| 24,971 | | ||
GNMA | 1,499 | |
| 1,466 | | ||
| $ | 49,259 | |
| $ | 48,038 | |
|
|
|
| ||||
Securities held-to-maturity |
| |
|
| | ||
Municipal bonds: |
|
|
| ||||
Due after ten years | $ | 135 | |
| $ | 135 | |
Mortgage-backed securities: |
|
|
| ||||
FHLMC | 4,744 | |
| 4,754 | | ||
FNMA | 2,931 | |
| 3,048 | | ||
GNMA | 2,485 | |
| 2,379 | | ||
| $ | 10,295 | |
| $ | 10,316 | |
Sales, maturities, and calls of securities for the years presented are summarized as follows:
| Year Ended June 30, | ||||||||||
| 2013 |
| 2012 |
| 2011 | ||||||
Proceeds from sales | $ | 996 | |
| $ | 24,419 | |
| $ | 3,393 | |
Proceeds from maturities and calls | 170 | |
| 3,728 | |
| 1,010 | | |||
Gross realized gains | 70 | |
| 1,536 | |
| 135 | | |||
Gross realized loss | - | |
| - | |
| - | | |||
99
ANCHOR BANCORP
NOTES TO CONSOLIDATED FINANCIAL STATEMENTS
(Dollars in thousands except share data)
|
|
|
Pledged securities at the dates indicated are summarized as follows:
| June 30, 2013 |
| June 30, 2012 | ||||||||||||
Pledged to secure: | Book Value |
| Fair Value |
| Book Value |
| Fair Value | ||||||||
Certain public deposits | $ | 9,601 | |
| $ | 9,557 | |
| $ | 3,815 | |
| $ | 4,152 | |
Certificates of deposit in excess of FDIC-insured limits | 1,573 | |
| 1,514 | |
| 1,163 | |
| 1,249 | | ||||
FHLB borrowings | 3,012 | |
| 3,039 | |
| 4,618 | |
| 4,743 | | ||||
Federal Reserve borrowings | 1,161 | |
| 1,120 | |
| - | |
| - | | ||||
Note 4 - Loans Receivable
Loans receivable consisted of the following at the dates indicated:
| June 30, | ||||||
| 2013 |
| 2012 | ||||
Real estate |
|
|
| ||||
One-to-four family | $ | 73,901 | |
| $ | 82,709 | |
Multi-family | 38,425 | |
| 42,032 | | ||
Commercial | 106,859 | |
| 97,306 | | ||
Construction | 5,641 | |
| 6,696 | | ||
Land | 5,330 | |
| 7,062 | | ||
Total real estate | 230,156 | |
| 235,805 | | ||
Consumer |
| |
|
| | ||
Home equity | 25,835 | |
| 31,504 | | ||
Credit cards | 4,741 | |
| 5,180 | | ||
Automobile | 1,850 | |
| 3,342 | | ||
Other consumer | 2,723 | |
| 2,968 | | ||
Total consumer | 35,149 | |
| 42,994 | | ||
|
|
|
| ||||
Commercial business | 18,211 | |
| 16,618 | | ||
Total loans | 283,516 | |
| 295,417 | | ||
Less |
| |
|
| | ||
Deferred loan fees and unamortized discount on purchased loans | 915 | |
| 605 | | ||
Allowance for loan losses | 5,147 | |
| 7,057 | | ||
| $ | 277,454 | |
| $ | 287,755 | |
| June 30, | ||||||||||
| 2013 |
| 2012 |
| 2011 | ||||||
Beginning balance | $ | 7,057 | |
| $ | 7,239 | |
| $ | 16,788 | |
Provision for losses | 750 | |
| 2,735 | |
| 8,078 | | |||
Charge-offs | (3,283 | ) |
| (4,018 | ) |
| (18,571 | ) | |||
Recoveries | 623 | |
| 1,101 | |
| 944 | | |||
| $ | 5,147 | |
| $ | 7,057 | |
| $ | 7,239 | |
100
ANCHOR BANCORP
NOTES TO CONSOLIDATED FINANCIAL STATEMENTS
(Dollars in thousands except share data)
|
|
|
The following table presents the activity in the allowance for loan losses by portfolio segment for the year ended June 30, 2013 :
| One-to- four family |
| Multi- family |
| Commercial real estate |
| Construction |
| Land |
| Consumer (1) |
| Commercial business |
| Unallocated |
| Total | ||||||||||||||||||
|
| ||||||||||||||||||||||||||||||||||
Allowance for loan losses : |
|
|
|
|
|
|
|
|
|
|
|
|
|
|
|
|
| ||||||||||||||||||
Beginning balance | $ | 1,659 | |
| $ | 238 | |
| $ | 578 | |
| $ | 148 | |
| $ | 368 | |
| $ | 1,508 | |
| $ | 2,558 | |
| $ | - | |
| $ | 7,057 | |
Provision (benefit) for loan losses | 7 | |
| (82 | ) |
| (108 | ) |
| 270 | |
| 163 | |
| 341 | |
| 108 | |
| 51 | |
| 750 | | |||||||||
Charge-offs | (416 | ) |
| - | |
| - | |
| (105 | ) |
| - | |
| (1,231 | ) |
| (1,531 | ) |
| - | |
| (3,283 | ) | |||||||||
Recoveries | 143 | |
| - | |
| 201 | |
| 43 | |
| - | |
| 199 | |
| 37 | |
| - | |
| 623 | | |||||||||
Ending balance | $ | 1,393 | |
| $ | 156 | |
| $ | 671 | |
| $ | 356 | |
| $ | 531 | |
| $ | 817 | |
| $ | 1,172 | |
| $ | 51 | |
| $ | 5,147 | |
(1) | Consumer loans include home equity, credit cards, auto, and other consumer loans. The only consumer loans with impairment are home equity loans. |
The following table presents the activity in the allowance for loan losses by portfolio segment for the year ended June 30, 2012 :
| One-to- four family |
| Multi- family |
| Commercial real estate |
| Construction |
| Land |
| Consumer (1) |
| Commercial business |
| Unallocated |
| Total | ||||||||||||||||||
|
| ||||||||||||||||||||||||||||||||||
Allowance for loan losses : |
|
|
|
|
|
|
|
|
|
|
|
|
|
|
|
|
| ||||||||||||||||||
Beginning balance | $ | 1,980 | |
| $ | 88 | |
| $ | 173 | |
| $ | 1,163 | |
| $ | 191 | |
| $ | 2,135 | |
| $ | 1,509 | |
| $ | - | |
| $ | 7,239 | |
Provision (benefit) for loan losses | 646 | |
| 150 | |
| 958 | |
| (725 | ) |
| 177 | |
| 548 | |
| 981 | |
| - | |
| 2,735 | | |||||||||
Charge-offs | (1,465 | ) |
| - | |
| (571 | ) |
| (561 | ) |
| - | |
| (1,358 | ) |
| (63 | ) |
| - | |
| (4,018 | ) | |||||||||
Recoveries | 498 | |
| - | |
| 18 | |
| 271 | |
| - | |
| 183 | |
| 131 | |
| - | |
| 1,101 | | |||||||||
Ending balance | $ | 1,659 | |
| $ | 238 | |
| $ | 578 | |
| $ | 148 | |
| $ | 368 | |
| $ | 1,508 | |
| $ | 2,558 | |
| $ | - | |
| $ | 7,057 | |
(1) | Consumer loans include home equity, credit cards, auto, and other consumer loans. The only consumer loans with impairment are home equity loans. |
.
101
ANCHOR BANCORP
NOTES TO CONSOLIDATED FINANCIAL STATEMENTS
(Dollars in thousands except share data)
|
|
|
The following table presents loans individually evaluated for impairment by class of loans as of June 30, 2013 :
| Recorded Investments |
| Unpaid Principal Balance |
| Related Allowance | ||||||
With no allowance recorded |
|
|
|
|
| ||||||
One-to-four family | $ | 5,744 | |
| $ | 6,418 | |
| $ | - | |
Multi-family | 2,263 | |
| 2,408 | |
| - | | |||
Commercial real estate | 1,968 | |
| 1,968 | |
| - | | |||
Land | 464 | |
| 478 | |
| - | | |||
Home equity | 240 | |
| 241 | |
| - | | |||
Commercial business | 1,319 | |
| 2,637 | |
| - | | |||
With an allowance recorded |
| |
|
| |
|
| | |||
One-to-four family | 8,235 | |
| 8,262 | |
| 804 | | |||
Land | 1,122 | |
| 1,122 | |
| 353 | | |||
Home equity | 437 | |
| 444 | |
| 147 | | |||
Commercial business | 69 | |
| 69 | |
| 2 | | |||
Total |
| |
|
| |
|
| | |||
One-to-four family | 13,979 | |
| 14,680 | |
| 804 | | |||
Multi-family | 2,263 | |
| 2,408 | |
| - | | |||
Commercial real estate | 1,968 | |
| 1,968 | |
| - | | |||
Land | 1,586 | |
| 1,600 | |
| 353 | | |||
Home equity | 677 | |
| 685 | |
| 147 | | |||
Commercial business | 1,388 | |
| 2,706 | |
| 2 | | |||
Total | $ | 21,861 | |
| $ | 24,047 | |
| $ | 1,306 | |
102
ANCHOR BANCORP
NOTES TO CONSOLIDATED FINANCIAL STATEMENTS
(Dollars in thousands except share data)
|
|
|
The following table presents loans individually evaluated for impairment by class of loans as of June 30, 2012 :
| Recorded Investments |
| Unpaid Principal Balance |
| Related Allowance | ||||||
With no allowance recorded |
|
|
|
|
| ||||||
One-to-four family | $ | 10,510 | |
| $ | 11,769 | |
| $ | - | |
Multi-family | 2,263 | |
| 2,408 | |
| - | | |||
Commercial real estate | 2,745 | |
| 2,757 | |
| - | | |||
Construction | 4,044 | |
| 4,044 | |
| - | | |||
Land | 686 | |
| 745 | |
| - | | |||
Home equity | 276 | |
| 278 | |
| - | | |||
Commercial business | 2,069 | |
| 2,170 | |
| - | | |||
With an allowance recorded |
| |
|
| |
|
| | |||
One-to-four family | 880 | |
| 880 | |
| 105 | | |||
Commercial business | 2,670 | |
| 2,678 | |
| 1,780 | | |||
Total |
| |
|
| |
|
| | |||
One-to-four family | 11,390 | |
| 12,649 | |
| 105 | | |||
Multi-family | 2,263 | |
| 2,408 | |
| - | | |||
Commercial real state | 2,745 | |
| 2,757 | |
| - | | |||
Construction | 4,044 | |
| 4,044 | |
| - | | |||
Land | 686 | |
| 745 | |
| - | | |||
Home equity | 276 | |
| 278 | |
| - | | |||
Commercial Business | 4,739 | |
| 4,848 | |
| 1,780 | | |||
Total | $ | 26,143 | |
| $ | 27,729 | |
| $ | 1,885 | |
103
ANCHOR BANCORP
NOTES TO CONSOLIDATED FINANCIAL STATEMENTS
(Dollars in thousands except share data)
|
|
|
The following table presents the average recorded investment in loans individually evaluated for impairment and the interest income recognized for the year ended June 30, 2013 :
| Year Ended June 30, 2013 | ||||||
| |||||||
| Average Recorded Investment |
| Interest Income Recognized | ||||
With no allowance recorded |
|
|
| ||||
One-to-four family | $ | 9,094 | |
| $ | 190 | |
Multi-family | 2,408 | |
| 109 | | ||
Commercial real estate | 2,363 | |
| 131 | | ||
Construction | 2,022 | |
| - | | ||
Land | 612 | |
| 25 | | ||
Home equity | 260 | |
| 10 | | ||
Commercial business | - | |
| 70 | | ||
With an allowance recorded |
|
|
| ||||
One-to-four family | 4,571 | |
| 292 | | ||
Land | 561 | |
| 64 | | ||
Home equity | 222 | |
| 19 | | ||
Commercial business | 1,374 | |
| 6 | | ||
Total |
|
|
| ||||
One-to-four family | 13,665 | |
| 482 | | ||
Multi-family | 2,408 | |
| 109 | | ||
Commercial real estate | 2,363 | |
| 131 | | ||
Construction | 2,022 | |
| - | | ||
Land | 1,173 | |
| 89 | | ||
Home equity | 482 | |
| 29 | | ||
Commercial business | 1,374 | |
| 76 | | ||
Total | $ | 23,485 | |
| $ | 916 | |
104
ANCHOR BANCORP
NOTES TO CONSOLIDATED FINANCIAL STATEMENTS
(Dollars in thousands except share data)
|
|
|
The following table presents the average recorded investment in loans individually evaluated for impairment and the interest income recognized for the year ended June 30, 2012 :
| Year Ended June 30, 2012 | ||||||
| |||||||
| Average Recorded Investment |
| Interest Income Recognized | ||||
With no Allowance recorded |
|
|
| ||||
One-to-four family | $ | 13,391 | |
| $ | 477 | |
Multi-family | 1,425 | |
| 97 | | ||
Commercial real estate | 4,980 | |
| 173 | | ||
Construction | 5,751 | |
| 45 | | ||
Land | 442 | |
| 41 | | ||
Home equity | 310 | |
| 7 | | ||
Commercial business | 3,900 | |
| 96 | | ||
With an Allowance recorded |
|
|
| ||||
One-to-four family | 1,110 | |
| 58 | | ||
Multi-family | - | |
| - | | ||
Commercial real estate | - | |
| - | | ||
Construction | - | |
| - | | ||
Home equity | - | |
| - | | ||
Commercial business | 1,534 | |
| 181 | | ||
Total |
|
|
| ||||
One-to-four family | 14,501 | |
| 535 | | ||
Multi-family | 1,425 | |
| 97 | | ||
Commercial real estate | 4,980 | |
| 173 | | ||
Construction | 5,751 | |
| 45 | | ||
Land | 442 | |
| 41 | | ||
Home equity | 310 | |
| 7 | | ||
Commercial Business | 5,434 | |
| 277 | | ||
Total | $ | 32,843 | |
| $ | 1,175 | |
105
ANCHOR BANCORP
NOTES TO CONSOLIDATED FINANCIAL STATEMENTS
(Dollars in thousands except share data)
|
|
|
The following table presents the balance in the allowance for loan losses and the recorded investment in loans by portfolio segment and based on impairment method as of June 30, 2013 :
| One-to-four family |
| Multi- family |
| Commercial real estate |
| Construction |
| Land |
| Consumer(1) |
| Commercial business |
| Unallocated |
| Total | ||||||||||||||||||
|
| ||||||||||||||||||||||||||||||||||
Allowance for loan losses: |
|
|
|
|
|
|
|
|
|
|
|
|
|
|
|
|
| ||||||||||||||||||
Ending balance | $ | 1,393 | |
| $ | 156 | |
| $ | 671 | |
| $ | 356 | |
| $ | 531 | |
| $ | 817 | |
| $ | 1,172 | |
| $ | 51 | |
| $ | 5,147 | |
Ending balance: individually evaluated for impairment | 804 | |
| - | |
| - | |
| - | |
| 353 | |
| 147 | |
| 2 | |
| - | |
| 1,306 | | |||||||||
Ending balance: collectively evaluated for impairment | $ | 589 | |
| $ | 156 | |
| $ | 671 | |
| $ | 356 | |
| $ | 178 | |
| $ | 670 | |
| $ | 1,170 | |
| $ | 51 | |
| $ | 3,841 | |
|
|
|
|
|
|
|
|
|
|
|
|
|
|
|
|
|
| ||||||||||||||||||
Loans receivable: |
| |
|
| |
|
| |
|
| |
|
| |
|
| |
|
| |
|
|
|
| | ||||||||||
Ending balance | $ | 73,901 | |
| $ | 38,425 | |
| $ | 106,859 | |
| $ | 5,641 | |
| $ | 5,330 | |
| $ | 35,149 | |
| $ | 18,211 | |
| $ | - | |
| $ | 283,516 | |
Ending balance: individually evaluated for impairment | 13,979 | |
| 2,263 | |
| 1,968 | |
| - | |
| 1,586 | |
| 677 | |
| 1,388 | |
| - | |
| 21,861 | | |||||||||
Ending balance: collectively evaluated for impairment | $ | 59,922 | |
| $ | 36,162 | |
| $ | 104,891 | |
| $ | 5,641 | |
| $ | 3,744 | |
| $ | 34,472 | |
| $ | 16,823 | |
| $ | - | |
| $ | 261,655 | |
(1) | Consumer loans include home equity, credit cards, auto and other consumer loans. |
106
ANCHOR BANCORP
NOTES TO CONSOLIDATED FINANCIAL STATEMENTS
(Dollars in thousands except share data)
|
|
|
The following table presents the balance in the allowance for loan losses and the recorded investment in loans by portfolio segment and based on impairment method as of June 30, 2012 :
| One-to-four family |
| Multi- family |
| Commercial real estate |
| Construction |
| Land |
| Consumer (1) |
| Commercial business |
| Unallocated |
| Total | ||||||||||||||||||
|
| ||||||||||||||||||||||||||||||||||
Allowance for loan losses: |
|
|
|
|
|
|
|
|
|
|
|
|
|
|
|
|
| ||||||||||||||||||
Ending balance | $ | 1,659 | |
| $ | 238 | |
| $ | 578 | |
| $ | 148 | |
| $ | 368 | |
| $ | 1,508 | |
| $ | 2,558 | |
| $ | - | |
| $ | 7,057 | |
Ending balance: individually evaluated for impairment | 105 | |
| - | |
| - | |
| - | |
| - | |
| - | |
| 1,780 | |
| - | |
| 1,885 | | |||||||||
Ending balance: collectively evaluated for impairment | $ | 1,554 | |
| $ | 238 | |
| $ | 578 | |
| $ | 148 | |
| $ | 368 | |
| $ | 1,508 | |
| $ | 778 | |
| $ | - | |
| $ | 5,172 | |
|
|
|
|
|
|
|
|
|
|
|
|
|
|
|
|
|
| ||||||||||||||||||
Loans receivable: |
| |
|
| |
|
| |
|
| |
|
| |
|
| |
|
| |
|
|
|
| | ||||||||||
Ending balance | $ | 82,709 | |
| $ | 42,032 | |
| $ | 97,306 | |
| $ | 6,696 | |
| $ | 7,062 | |
| $ | 42,994 | |
| $ | 16,618 | |
| $ | - | |
| $ | 295,417 | |
Ending balance: individually evaluated for impairment | 11,390 | |
| 2,263 | |
| 2,745 | |
| 4,044 | |
| 686 | |
| 276 | |
| 4,739 | |
| - | |
| 26,143 | | |||||||||
Ending balance: collectively evaluated for impairment | $ | 71,319 | |
| $ | 39,769 | |
| $ | 94,561 | |
| $ | 2,652 | |
| $ | 6,376 | |
| $ | 42,718 | |
| $ | 11,879 | |
| $ | - | |
| $ | 269,274 | |
(1) | Consumer loans include home equity, credit cards, auto, and other consumer loans. |
The following table presents the recorded investment in nonaccrual and loans past due 90 days still on accrual by type of loans as of the dates indicated:
| June 30, | ||||||
| 2013 |
| 2012 | ||||
One-to-four family | $ | 4,758 | |
| $ | 1,878 | |
Construction | - | |
| 3,369 | | ||
Land loans | 734 | |
| 109 | | ||
Home equity | 428 | |
| 159 | | ||
Automobile | 2 | |
| 66 | | ||
Credit cards | 18 | |
| 16 | | ||
Other consumer | - | |
| 1 | | ||
Commercial business | 219 | |
| 3,124 | | ||
Total | $ | 6,159 | |
| $ | 8,722 | |
The table above includes $6,141 in nonaccrual and $18 in past due 90 days or more and still accruing, net of partial loan charge-offs at June 30, 2013 . There were $8,667 in nonaccrual and $55 in past due 90 days or more and still accruing, net of partial loan charge-offs at June 30, 2012 .
Past Due Loans. Loans are considered past due if the required principal and interest payments have not been received as of the date such payments were due.
107
ANCHOR BANCORP
NOTES TO CONSOLIDATED FINANCIAL STATEMENTS
(Dollars in thousands except share data)
|
|
|
The following table presents past due loans, net of partial loan charge-offs, by class, as of June 30, 2013 :
| 30-59 Days Past Due |
| 60-89 Days Past Due |
| 90 Days Or More Past Due (1) |
| Total Past Due |
| Current |
| Total Loans | ||||||||||||
|
| ||||||||||||||||||||||
One-to-four family | $ | 1,853 | |
| $ | 1,469 | |
| $ | 4,758 | |
| $ | 8,080 | |
| $ | 65,821 | |
| $ | 73,901 | |
Multi-family | 149 | |
| - | |
| - | |
| 149 | |
| 38,276 | |
| 38,425 | | ||||||
Commercial real estate | 101 | |
| - | |
| - | |
| 101 | |
| 106,758 | |
| 106,859 | | ||||||
Construction | - | |
| - | |
| - | |
| - | |
| 5,641 | |
| 5,641 | | ||||||
Land | - | |
| 38 | |
| 734 | |
| 772 | |
| 4,558 | |
| 5,330 | | ||||||
Home equity | 84 | |
| 68 | |
| 428 | |
| 580 | |
| 25,255 | |
| 25,835 | | ||||||
Credit cards | 54 | |
| 6 | |
| 18 | |
| 78 | |
| 4,663 | |
| 4,741 | | ||||||
Automobile | 66 | |
| - | |
| 2 | |
| 68 | |
| 1,782 | |
| 1,850 | | ||||||
Other consumer | 32 | |
| 1 | |
| - | |
| 33 | |
| 2,690 | |
| 2,723 | | ||||||
Commercial business | 78 | |
| 52 | |
| 219 | |
| 349 | |
| 17,862 | |
| 18,211 | | ||||||
Total | $ | 2,417 | |
| $ | 1,634 | |
| $ | 6,159 | |
| $ | 10,210 | |
| $ | 273,306 | |
| $ | 283,516 | |
(1) Includes loans on nonaccrual status and loans that may be less than 90 days past due.
The following table presents past due loans, net of partial loan charge-offs, by class as of June 30, 2012 :
| 30-59 Days Past Due |
| 60-89 Days Past Due |
| 90 Days Or More Past Due (1) |
| Total Past Due |
| Current |
| Total Loans | ||||||||||||
|
| ||||||||||||||||||||||
One-to-four family | $ | 1,787 | |
| $ | 1,668 | |
| $ | 1,878 | |
| $ | 5,333 | |
| $ | 77,376 | |
| $ | 82,709 | |
Multi-family | - | |
| 101 | |
| - | |
| 101 | |
| 41,931 | |
| 42,032 | | ||||||
Commercial real estate | 170 | |
| - | |
| - | |
| 170 | |
| 97,136 | |
| 97,306 | | ||||||
Construction | - | |
| - | |
| 3,369 | |
| 3,369 | |
| 3,327 | |
| 6,696 | | ||||||
Land | 149 | |
| - | |
| 109 | |
| 258 | |
| 6,804 | |
| 7,062 | | ||||||
Home equity | 558 | |
| 358 | |
| 159 | |
| 1,075 | |
| 30,429 | |
| 31,504 | | ||||||
Credit cards | 40 | |
| 39 | |
| 16 | |
| 95 | |
| 5,085 | |
| 5,180 | | ||||||
Automobile | 70 | |
| - | |
| 66 | |
| 136 | |
| 3,206 | |
| 3,342 | | ||||||
Other consumer | 68 | |
| - | |
| 1 | |
| 69 | |
| 2,899 | |
| 2,968 | | ||||||
Commercial business | 343 | |
| 142 | |
| 3,124 | |
| 3,609 | |
| 13,009 | |
| 16,618 | | ||||||
Total | $ | 3,185 | |
| $ | 2,308 | |
| $ | 8,722 | |
| $ | 14,215 | |
| $ | 281,202 | |
| $ | 295,417 | |
(1) Includes loans on nonaccrual status and loans that may be less than 90 days past due.
Credit Quality Indicators . The Bank utilizes a ten-point risk rating system and assign a risk rating for all credit exposures. The risk rating system is designed to define the basic characteristics and identify risk elements of each credit extension.
Credits risk rated 1 through 7 are considered to be "pass" credits. Pass credits can be assets where there is virtually no credit risk, such as cash secured loans with funds on deposit with the Bank. Pass credits also include credits that are on our Watch and Special Mention lists, where the borrower exhibits potential weaknesses, which may, if not checked or corrected, negatively affect the borrower's financial capacity and threaten their ability to fulfill debt obligations in the future.
Credits classified as Watch are risk rated 6 and possess weaknesses that deserve management's close attention. These assets do not expose the Bank to sufficient risk to warrant adverse classification in the substandard, doubtful or loss categories. The Bank uses this rating when a material documentation deficiency exists but correction is anticipated within an acceptable time frame.
108
ANCHOR BANCORP
NOTES TO CONSOLIDATED FINANCIAL STATEMENTS
(Dollars in thousands except share data)
|
|
|
A loan classified as Watch may have the following characteristics:
• | Acceptable asset quality, but requiring increased monitoring. Strained liquidity and less than anticipated performance. The loan may be fully leveraged. |
• | Apparent management weakness, perhaps demonstrated by an irregular flow of adequate and/or timely performance information required to support the credit. |
• | The borrower has a plausible plan to correct problem(s) in the near future that is devoid of material uncertainties. |
• | Lacks reserve capacity, so the risk rating will improve or decline in relatively short time (results of corrective actions should be apparent within six months or less). |
• | A seasoned loan with a debt service coverage ratio ("DSCR") of less than 1.00 is not considered a pass credit. |
Credits classified as Special Mention are risk rated 7. These credits have potential weaknesses that deserve management's close attention. If left uncorrected, these potential weaknesses may result in deterioration of the repayment prospects for the asset. Special Mention assets are not adversely classified and do not expose the Bank to sufficient risk to warrant adverse classification.
A loan classified as Special Mention may have the following characteristics:
• | Performance is poor or significantly less than expected. A debt service deficiency either exists or cannot be ruled out. |
• | Generally an undesirable business credit. Assets in this category are protected, but are potentially weak. These assets constitute an undue and unwarranted credit risk, but not to the point of justifying a classification of Substandard. Special mention assets have potential weaknesses which may, if not checked or corrected, weaken the asset or inadequately protect the Bank's credit position at some future date. |
• | Assets which might be detailed in this category include credits that the lending officer may be unable to supervise properly because of lack of expertise, an inadequate loan agreement, the condition of and control over collateral, failure to obtain proper documentation, or any other deviations from prudent lending practices. |
• | An adverse trend in the borrower's operations or an imbalanced position in the balance sheet which does not jeopardize liquidation may best be handled by this classification. |
• | A Special Mention classification should not be used as a compromise between a pass and substandard rating. Assets in which actual, not potential, weaknesses are evident and significant, and should be considered for more serious criticism. |
• | A seasoned loan with a DSCR of greater than 1.00 is the minimum acceptable level for a "Pass Credit". Particular attention should be paid to coverage trend analysis as a declining trend may warrant an elevated risk grade regardless of current coverage at or above the threshold. |
A loan classified as Substandard is risk rated 8. They are characterized by the distinct possibility that the Bank will sustain some loss if the deficiencies are not corrected. An asset is considered Substandard if it is inadequately protected by the current net worth and payment capacity of the borrower or of any collateral pledged.
A loan classified as Substandard may have the following characteristics:
• | Unacceptable business credit. The asset is inadequately protected by the current sound worth and paying capacity of the borrower or of the collateral pledged, if any. Assets so classified must have a well defined weakness or weaknesses that jeopardize the liquidation of the debt. |
• | Though no loss is envisioned, the outlook is sufficiently uncertain to preclude ruling out the possibility. Some liquidation of assets will likely be necessary as a corrective measure. |
• | Assets in this category may demonstrate performance problems such as debt servicing deficiencies with no immediate relief. Borrowers have an inability to adjust to prolonged and unfavorable industry or economic trends. Management's character and/or effectiveness have become suspect. |
A loan classified as Doubtful is risk rated 9 and has all the inherent weaknesses as those classified Substandard with the added characteristic that the weaknesses make collection or liquidation in full, on the basis of currently existing facts, conditions, and values highly questionable is improbable.
A loan classified as Doubtful is risk rated 9 and has the following characteristics:
• | The possibility of loss is extremely high, but because of certain important and reasonable specific pending factors which may work to the advantage and strengthening of the asset, its classification as an estimated loss is deferred until its more exact status may be determined. |
109
ANCHOR BANCORP
NOTES TO CONSOLIDATED FINANCIAL STATEMENTS
(Dollars in thousands except share data)
|
|
|
• | Pending factors include proposed merger, acquisition, or liquidation procedures, capital injection, perfecting liens on additional collateral and refinancing plans. |
A loan risk rated 10 is a loan for which a total loss is expected.
A loan classified as a Loss has the following characteristics:
• | An uncollectible asset or one of such little value that it does not warrant classification as an active, earning asset. Such an asset may, however, have recovery or salvageable value, but not to the point of deferring full write off, even though some recovery may occur in the future. |
• | The Bank will charge off such assets as a loss during the accounting period in which they were identified. |
• | Loan to be eliminated from the active loan reporting system via charge off. |
The following table represents the internally assigned grade as of June 30, 2013 , by class of loans:
| One-to- four family |
| Multi- family |
| Commercial real estate |
| Construction |
| Land |
| Home equity |
| Credit cards |
| Automobile |
| Other consumer |
| Commercial business |
| Total | ||||||||||||||||||||||
Grade: |
|
|
|
|
|
|
|
|
|
|
|
|
|
|
|
|
|
|
|
|
| ||||||||||||||||||||||
Pass | $ | 54,534 | |
| $ | 31,613 | |
| $ | 88,825 | |
| $ | 3,387 | |
| $ | 3,665 | |
| $ | 23,554 | |
| $ | 4,663 | |
| $ | 1,635 | |
| $ | 2,614 | |
| $ | 12,417 | |
| $ | 226,907 | |
Watch | 2,832 | |
| 3,536 | |
| 8,659 | |
| - | |
| 429 | |
| 941 | |
| 60 | |
| 214 | |
| 61 | |
| 612 | |
| 17,344 | | |||||||||||
Special Mention | 7,587 | |
| 1,013 | |
| 5,977 | |
| 2,254 | |
| 111 | |
| 308 | |
| - | |
| - | |
| 48 | |
| 4,677 | |
| 21,975 | | |||||||||||
Substandard | 8,948 | |
| 2,263 | |
| 3,398 | |
| - | |
| 1,125 | |
| 1,032 | |
| 18 | |
| 1 | |
| - | |
| 505 | |
| 17,290 | | |||||||||||
Doubtful | - | |
| - | |
| - | |
| - | |
| - | |
| - | |
| - | |
| - | |
| - | |
| - | |
| - | | |||||||||||
Total | $ | 73,901 | |
| $ | 38,425 | |
| $ | 106,859 | |
| $ | 5,641 | |
| $ | 5,330 | |
| $ | 25,835 | |
| $ | 4,741 | |
| $ | 1,850 | |
| $ | 2,723 | |
| $ | 18,211 | |
| $ | 283,516 | |
The following table represents the credit risk profile based on payment activity as of June 30, 2013 , by class of loans:
| One-to- four family |
| Multi-family |
| Commercial real estate |
| Construction |
| Land |
| Home equity |
| Credit cards |
| Automobile |
| Other consumer |
| Commercial business |
| Total | ||||||||||||||||||||||
Performing | $ | 69,143 | |
| $ | 38,425 | |
| $ | 106,859 | |
| $ | 5,641 | |
| $ | 4,596 | |
| $ | 25,407 | |
| $ | 4,723 | |
| $ | 1,848 | |
| $ | 2,723 | |
| $ | 17,992 | |
| $ | 277,375 | |
Nonperforming (1) | 4,758 | |
| - | |
| - | |
| - | |
| 734 | |
| 428 | |
| 18 | |
| 2 | |
| - | |
| 219 | |
| 6,159 | | |||||||||||
Total | $ | 73,901 | |
| $ | 38,425 | |
| $ | 106,859 | |
| $ | 5,641 | |
| $ | 5,330 | |
| $ | 25,835 | |
| $ | 4,741 | |
| $ | 1,850 | |
| $ | 2,723 | |
| $ | 18,211 | |
| $ | 283,516 | |
(1) Loans that are more than 90 days past due and nonaccrual loans are considered nonperforming.
The following table represents the internally assigned grade as of June 30, 2012 , by class of loans:
| One-to- four family |
| Multi-family |
| Commercial real estate |
| Construction |
| Land |
| Home equity |
| Credit cards |
| Automobile |
| Other consumer |
| Commercial business |
| Total | ||||||||||||||||||||||
|
| ||||||||||||||||||||||||||||||||||||||||||
Grade: |
|
|
|
|
|
|
|
|
|
|
|
|
|
|
|
|
|
|
|
|
| ||||||||||||||||||||||
Pass | $ | 65,706 | |
| $ | 28,122 | |
| $ | 71,660 | |
| $ | 1,064 | |
| $ | 6,159 | |
| $ | 29,234 | |
| $ | 5,085 | |
| $ | 3,177 | |
| $ | 2,840 | |
| $ | 8,405 | |
| $ | 221,452 | |
Watch | 2,932 | |
| 2,243 | |
| 10,326 | |
| - | |
| 149 | |
| 1,160 | |
| 79 | |
| 95 | |
| 76 | |
| 552 | |
| 17,612 | | |||||||||||
Special Mention | 2,738 | |
| 9,404 | |
| 9,088 | |
| 1,280 | |
| - | |
| 509 | |
| - | |
| 4 | |
| 51 | |
| 492 | |
| 23,566 | | |||||||||||
Substandard | 11,333 | |
| 2,263 | |
| 6,232 | |
| 4,352 | |
| 754 | |
| 601 | |
| 16 | |
| 66 | |
| 1 | |
| 4,853 | |
| 30,471 | | |||||||||||
Doubtful | - | |
| - | |
| - | |
| - | |
| - | |
| - | |
| - | |
| - | |
| - | |
| 2,316 | |
| 2,316 | | |||||||||||
Total | $ | 82,709 | |
| $ | 42,032 | |
| $ | 97,306 | |
| $ | 6,696 | |
| $ | 7,062 | |
| $ | 31,504 | |
| $ | 5,180 | |
| $ | 3,342 | |
| $ | 2,968 | |
| $ | 16,618 | |
| $ | 295,417 | |
110
ANCHOR BANCORP
NOTES TO CONSOLIDATED FINANCIAL STATEMENTS
(Dollars in thousands except share data)
|
|
|
The following table represents the credit risk profile based on payment activity as of June 30, 2012 , by class of loans:
| One-to- four family |
| Multi-family |
| Commercial real estate |
| Construction |
| Land |
| Home equity |
| Credit cards |
| Automobile |
| Other consumer |
| Commercial business |
| Total | ||||||||||||||||||||||
|
| ||||||||||||||||||||||||||||||||||||||||||
Performing | $ | 80,831 | |
| $ | 42,032 | |
| $ | 97,306 | |
| $ | 3,327 | |
| $ | 6,953 | |
| $ | 31,345 | |
| $ | 5,164 | |
| $ | 3,276 | |
| $ | 2,967 | |
| $ | 13,494 | |
| $ | 286,695 | |
Nonperforming (1) | 1,878 | |
| - | |
| - | |
| 3,369 | |
| 109 | |
| 159 | |
| 16 | |
| 66 | |
| 1 | |
| 3,124 | |
| 8,722 | | |||||||||||
Total | $ | 82,709 | |
| $ | 42,032 | |
| $ | 97,306 | |
| $ | 6,696 | |
| $ | 7,062 | |
| $ | 31,504 | |
| $ | 5,180 | |
| $ | 3,342 | |
| $ | 2,968 | |
| $ | 16,618 | |
| $ | 295,417 | |
(1) | Loans that are more than 90 days past due and nonaccrual loans are considered nonperforming. |
Troubled Debt Restructure . At June 30, 2013 and June 30, 2012, troubled debt restructured loans ("TDRs"), included in impaired loans above, totaled $17.5 million and $15.1 million , respectively and $3.6 million with $1.2 million currently in nonaccrual, respectively. Restructured loans are an option that the Bank uses to minimize risk of loss and are a concession granted to a borrower experiencing financial difficulties that it would not otherwise consider. The modifications have included items such as lowering the interest rate on the loan for a period of time and extending the maturity date of the loan. These modifications are made only when there is a reasonable and attainable workout plan that has been agreed to by the borrower and is in the Bank's best interest. At June 30, 2013 , there were no commitments to lend additional funds to borrowers whose loans have been modified in a TDR.
The Bank has utilized a combination of rate and term modifications for its TDRs.
The following table represents TDRs by accrual versus nonaccrual status and by loan class as of June 30, 2013 :
| June 30, 2013 | ||||||||||
| Accrual Status |
| Nonaccrual |
| Total Modifications | ||||||
|
| ||||||||||
One-to-four family | $ | 9,221 | |
| $ | 3,479 | |
| $ | 12,700 | |
Multi-family | 2,263 | |
| - | |
| 2,263 | | |||
Construction | 391 | |
| - | |
| 391 | | |||
Land | 502 | |
| - | |
| 502 | | |||
Home equity | 288 | |
| 157 | |
| 445 | | |||
Commercial business | 1,168 | |
| - | |
| 1,168 | | |||
Total | $ | 13,833 | |
| $ | 3,636 | |
| $ | 17,469 | |
The following table represents TDRs by accrual versus nonaccrual status and by loan class as of June 30, 2012 :
| June 30, 2012 | ||||||||||
| Accrual Status |
| Nonaccrual |
| Total Modifications | ||||||
|
| ||||||||||
One-to-four family | $ | 9,552 | |
| $ | 1,201 | |
| $ | 10,753 | |
Multi-family | 2,263 | |
| - | |
| 2,263 | | |||
Construction | 571 | |
| - | |
| 571 | | |||
Land | 74 | |
| - | |
| 74 | | |||
Home equity | 151 | |
| - | |
| 151 | | |||
Commercial business | 1,300 | |
| - | |
| 1,300 | | |||
Total | $ | 13,911 | |
| $ | 1,201 | |
| $ | 15,112 | |
111
ANCHOR BANCORP
NOTES TO CONSOLIDATED FINANCIAL STATEMENTS
(Dollars in thousands except share data)
|
|
|
The following table presents new TDRs by type of modification that occurred during the year ended June 30, 2013 :
Pre-TDR recorded investment | Number of Contracts |
| Rate Modifications |
| Term Modifications |
| Payment Modifications |
| Combination Modifications |
| Total Modifications | |||||||||||
|
| |||||||||||||||||||||
One-to-four family | 22 | |
| $ | - | |
| $ | - | |
| $ | - | |
| $ | 7,381 | |
| $ | 7,381 | |
Land | 1 | |
| - | |
| - | |
| - | |
| 429 | |
| 429 | | |||||
Home equity | 4 | |
| - | |
| - | |
| - | |
| 299 | |
| 299 | | |||||
Total | 27 | |
| $ | - | |
| $ | - | |
| $ | - | |
| $ | 8,109 | |
| $ | 8,109 | |
Post-TDR recorded investment | Number of Contracts |
| Rate Modifications |
| Term Modifications |
| Payment Modifications |
| Combination Modifications |
| Total Modifications | |||||||||||
|
| |||||||||||||||||||||
One-to-four family | 22 | |
| $ | - | |
| $ | - | |
| $ | - | |
| $ | 7,179 | |
| $ | 7,179 | |
Land | 1 | |
| - | |
| - | |
| - | |
| 429 | |
| 429 | | |||||
Home equity | 4 | |
| - | |
| - | |
| - | |
| 301 | |
| 301 | | |||||
Total | 27 | |
| $ | - | |
| $ | - | |
| $ | - | |
| $ | 7,909 | |
| $ | 7,909 | |
The following table presents new TDRs by type of modification that occurred during the year ended June 30, 2012:
Pre-TDR recorded investment | Number of Contracts |
| Rate Modifications |
| Term Modifications |
| Payment Modifications |
| Combination Modifications |
| Total Modifications | |||||||||||
|
| |||||||||||||||||||||
One-to-four family | 9 | |
| $ | - | |
| $ | - | |
| $ | - | |
| $ | 2,743 | |
| $ | 2,743 | |
Multi-family | 1 | |
| - | |
| - | |
| - | |
| 2,410 | |
| 2,410 | | |||||
Commercial business | 1 | |
| - | |
| - | |
| - | |
| 104 | |
| 104 | | |||||
Total | 11 | |
| $ | - | |
| $ | - | |
| $ | - | |
| $ | 5,257 | |
| $ | 5,257 | |
Post-TDR recorded investment | Number of Contracts |
| Rate Modifications |
| Term Modifications |
| Payment Modifications |
| Combination Modifications |
| Total Modifications | |||||||||||
|
| |||||||||||||||||||||
One-to-four family | 9 | |
| $ | - | |
| $ | - | |
| $ | - | |
| $ | 2,314 | |
| $ | 2,314 | |
Multi-family | 1 | |
| - | |
| - | |
| - | |
| 2,263 | |
| 2,263 | | |||||
Commercial business | 1 | |
| - | |
| - | |
| - | |
| 90 | |
| 90 | | |||||
Total | 11 | |
| $ | - | |
| $ | - | |
| $ | - | |
| $ | 4,667 | |
| $ | 4,667 | |
The following table below represents TDRs modified within the previous 12 months for which there was a payment default during the year ended June 30, 2013 and the total of payments default for the past 12 months:
| Number of Contracts |
| For the Year Ended June 30, 2013 | ||
Post TDR investment |
|
|
| ||
One-to-four family | 7 |
| $ | 4,635 | |
Land | 1 |
| 73 | | |
Home equity | 2 |
| 136 | | |
Commercial business | 2 |
| 399 | | |
Total | 12 |
| $ | 5,243 | |
112
ANCHOR BANCORP
NOTES TO CONSOLIDATED FINANCIAL STATEMENTS
(Dollars in thousands except share data)
|
|
|
The following table below represents TDRs modified within the previous 12 months for which there was a payment default during the year ended June 30, 2012 and the total of payments default for the past 12 months:
| Number of Contracts |
| For the Year Ended June 30, 2012 | |||
Post TDR investment |
|
|
| |||
One-to-four family | 1 | |
| $ | 187 | |
Total | 1 | |
| $ | 187 | |
Note 5 - Real Estate Owned, net
The following table is a summary of real estate owned for the years ended June 30, 2013 and 2012:
| Year Ended June 30, | ||||||
| |||||||
| 2013 |
| 2012 | ||||
|
| ||||||
Balance at the beginning of the period | $ | 6,708 | |
| $ | 12,597 | |
Net loans transferred to real estate owned | 5,050 | |
| 7,678 | | ||
Capitalized improvements | 793 | |
| 163 | | ||
Sales | (4,852 | ) |
| (11,236 | ) | ||
Impairments | (1,487 | ) |
| (2,494 | ) | ||
Balance at the end of the period | $ | 6,212 | |
| $ | 6,708 | |
Note 6 - Property, Premises, and Equipment
Property, premises, and equipment owned by the Bank are summarized as follows:
| June 30, | ||||||
| 2013 |
| 2012 | ||||
Land | $ | 2,323 | |
| $ | 2,323 | |
Building and improvements | 16,485 | |
| 17,252 | | ||
Furniture and fixtures | 6,338 | |
| 6,539 | | ||
Automobiles | 293 | |
| 293 | | ||
Software | 1,242 | |
| 1,244 | | ||
Leasehold improvements | 37 | |
| 22 | | ||
| 26,718 | |
| 27,673 | | ||
Less accumulated depreciation and amortization | (15,324 | ) |
| (15,460 | ) | ||
Property, premises, and equipment, net of depreciation and amortization | $ | 11,394 | |
| $ | 12,213 | |
Depreciation and amortization expense for the years ended June 30, 2013, 2012, and 2011, was $946 , $924 and $1,111 , respectively.
113
ANCHOR BANCORP
NOTES TO CONSOLIDATED FINANCIAL STATEMENTS
(Dollars in thousands except share data)
|
|
|
Note 7 - Deposits
Deposits consist of the following:
| June 30, | ||||||||||||
| 2013 |
| 2012 | ||||||||||
| Amount |
| Percent |
| Amount |
| Percent | ||||||
|
|
|
|
|
|
|
| ||||||
Noninterest-bearing demand deposits | $ | 39,713 | |
| 12.1 | % |
| $ | 37,941 | |
| 11.0 | % |
Interest-bearing demand deposits, weighted-average rate of .08% and .33% in 2013 and 2012, respectively | 20,067 | |
| 6.1 | |
| 16,434 | |
| 4.8 | | ||
Savings deposits, weighted-average rate of .23% in 2013 and .56% in 2012 | 36,518 | |
| 11.1 | |
| 36,475 | |
| 10.5 | | ||
Money market accounts, weighted-average rate of .27% and .66% in 2013 and 2012, respectively | 82,603 | |
| 25.1 | |
| 83,750 | |
| 24.2 | | ||
Certificates of deposit |
|
|
|
|
|
|
| ||||||
0.00 to 3.49% | 121,358 | |
| 36.9 | |
| 139,685 | |
| 40.4 | | ||
3.50 to 5.49% | 28,325 | |
| 8.6 | |
| 31,513 | |
| 9.1 | | ||
Total of certificates of deposit | 149,683 | |
| 45.6 | |
| 171,198 | |
| 49.5 | | ||
Total deposits | $ | 328,584 | |
| 100.0 | % |
| $ | 345,798 | |
| 100.0 | % |
Certificates of deposit in denominations of $100 or more were $70,259 and $74,298 at June 30, 2013 and 2012, respectively. Interest on certificates of deposit in denominations of $100 or more totaled $1,701 , $1,860 , and $2,285 for the years ended June 30, 2013 , 2012, and 2011, respectively. Included in deposits at June 30, 2013 and 2012, were $8,042 and $8,028 , respectively, of public funds. There were no brokered deposits at June 30, 2013 or 2012.
As of June 30, 2013 , certificates mature as follows:
Year Ended June 30, |
|
| ||
| Amount | |||
|
|
| ||
2014 |
| $ | 51,733 | |
2015 |
| 18,496 | | |
2016 |
| 9,434 | | |
2017 |
| 10,098 | | |
Thereafter |
| 59,922 | | |
|
| $ | 149,683 | |
114
ANCHOR BANCORP
NOTES TO CONSOLIDATED FINANCIAL STATEMENTS
(Dollars in thousands except share data)
|
|
|
Note 8 - Borrowings
The Bank is a member of the FHLB of Seattle. Based on eligible collateral, consisting of loans at June 30, 2013 and 2012, the total amount available under this line of credit was $79,203 and $108,146 , respectively. The total balance of loans pledged at June 30, 2013 and 2012 was $123,807 and $170,913 , respectively. The total balance of advances outstanding was $64,900 at both June 30, 2013 and 2012. The net remaining amounts available as of June 30, 2013 and 2012 were $14,304 and $ 43,246 , respectively. Borrowings generally provide for interest at the then-current published rates. FHLB advances (at weighted-average interest rates of 1.91% and 1.91% at June 30, 2013 and 2012, respectively) and lines of credit are scheduled to mature as follows:
| June 30, | ||||||
| 2013 |
| 2012 | ||||
One year or less | $ | 47,400 | |
| $ | - | |
After one year through three years | 17,500 | |
| 64,900 | | ||
| $ | 64,900 | |
| $ | 64,900 | |
Advances from FHLB are collateralized by all FHLB stock owned by the Bank, deposits with the FHLB, certain investments, and all loans as described in the Advances, Pledge, and Security Agreement with the FHLB. The maximum and average outstanding advances and lines of credit from the FHLB are as follows:
| June 30, | ||||||
| 2013 |
| 2012 | ||||
Highest outstanding advances at month-end for the previous 12 months | $ | 64,900 | |
| $ | 74,900 | |
Average outstanding | $ | 64,900 | |
| $ | 73,242 | |
The Bank also maintains a short-term borrowing line with the Federal Reserve with total credit based on eligible collateral. As of June 30, 2013, the Bank had a borrowing capacity of $1.1 million , of which none was outstanding.
Note 9 - Employee Benefit Plans
Employee Stock Ownership Plan
On January 25, 2011, the Company established an ESOP for the benefit of substantially all employees. The ESOP borrowed $1.0 million from the Company and used those funds to acquire 102,000 shares of the Company's common stock at the time of the initial public offering at a price of $10.00 per share.
Shares purchased by the ESOP with the loan proceeds are held in a suspense account and allocated to ESOP participants on a pro rata basis as principal and interest payments are made by the ESOP to the Company. The loan is secured by shares purchased with the loan proceeds and will be repaid by the ESOP with funds from the Company's discretionary contributions to the ESOP and earnings on the ESOP assets. Payments of principal and interest are due annually on June 30, the Company's fiscal year end.
As shares are committed to be released from collateral, the Company reports compensation expense equal to the daily average market prices of the shares and the shares become outstanding for EPS computations. The compensation expense is accrued throughout the year.
Compensation expense related to the ESOP for the years ended June 30, 2013 and 2012 was $95,000 and $56,000 , respectively.
115
ANCHOR BANCORP
NOTES TO CONSOLIDATED FINANCIAL STATEMENTS
(Dollars in thousands except share data)
|
|
|
Shares held by the ESOP as of the dates indicated are as follows:
| June 30, | ||||||
| 2013 |
| 2012 | ||||
|
| ||||||
Allocated shares | 16,433 | |
| 9,633 | | ||
Unallocated shares | 85,567 | |
| 92,367 | | ||
Total ESOP shares | 102,000 | |
| 102,000 | | ||
Fair value of unallocated shares | $ | 1,435 | |
| $ | 955 | |
Note 10 - Supplemental Executive Retirement Plan (SERP)
On July 1, 2002, the Bank implemented a nonqualified SERP for the benefit of senior officers and directors of the Bank. The SERP entitles these individuals to receive defined benefits upon their retirement or death based on the appreciation in Bank value. The Bank appreciation value will be the difference between the last trading day in March 2013 and 2012. On January 1, 2004, the SERP was amended to provide that a participant's SERP unit shall be valued at no less than 90% , and no more than 125% , of the participant's SERP unit as of the preceding valuation date. The value of the participant's SERP unit is based upon the stock value of the Bank. The accrual for the deferred compensation owed under the SERP is based upon the net present value of the vested benefits expected to be paid under the SERP. The Bank recognized $61 , $88 , and $(53) in compensation cost (benefit) related to the SERP for the years ended June 30, 2013 , 2012, and 2011, respectively. The SERP liability totaled $1,703 and $1,764 at June 30, 2013 and 2012, respectively.
Note 11 - Earnings (Loss) Per Share
Basic earnings (loss) per share is computed by dividing income or loss, as applicable, available to common stockholders by the weighted average number of common shares outstanding for the period. As ESOP shares are committed to be released they become outstanding for EPS calculation purposes. ESOP shares not committed to be released are not considered outstanding. Diluted earnings per share reflect the potential dilution that could occur if securities or other contracts to issue common stock were exercised or converted into common stock or resulted in the issuance of common stock that then shared in the earnings of the Company. There were no other securities or issues that can convert to common stock during the following periods. The following table presents a reconciliation of the components used to compute basic and diluted earnings (loss) per share:
| For the Year Ended June 30, | ||||||||||
| 2013 |
| 2012 |
| 2011 | ||||||
Net loss | $ | (255 | ) |
| $ | (1,712 | ) |
| $ | (8,024 | ) |
Weighted-average common shares outstanding | 2,461,033 | |
| 2,454,233 | |
| 2,448,675 | | |||
Basic loss per share | $ | (0.10 | ) |
| $ | (0.70 | ) |
| $ | (3.28 | ) |
Diluted loss per share | $ | (0.10 | ) |
| $ | (0.70 | ) |
| $ | (3.28 | ) |
There were no antidilutive options at or for the years ended June 30, 2013, 2012 and 2011.
Note 12 - Related Party Transactions
During the normal course of business, the Bank originates loans to directors, committee members, and senior management. Such loans are granted with interest rates, terms, and collateral requirements substantially the same as those for all other customers.
Loans to directors, executive officers, and their affiliates are subject to regulatory limitations. Such loans had aggregate balances are as follows and were within regulatory limitations:
116
ANCHOR BANCORP
NOTES TO CONSOLIDATED FINANCIAL STATEMENTS
(Dollars in thousands except share data)
|
|
|
| June 30, | ||||||
| 2013 |
| 2012 | ||||
Total loans | $ | 228 | |
| $ | 254 | |
Total deposits | $ | 1,980 | |
| $ | 2,736 | |
Note 13 - Regulatory Capital Requirements
The Bank is subject to various regulatory capital requirements administered by federal banking agencies. Failure to meet minimum capital requirements can initiate certain mandatory and possibly additional discretionary actions by regulators that, if undertaken, could have a direct material effect on the Bank's financial statements. Under capital adequacy guidelines and the regulatory framework for prompt corrective action, the Bank must meet specific capital guidelines that involve quantitative measures of the Bank's assets, liabilities, and certain off-balance-sheet items as calculated under regulatory accounting practices. The Bank's capital amounts and classification are also subject to qualitative judgments by the regulators about components, risk weightings, and other factors.
Quantitative measures established by regulation to ensure capital adequacy require the Bank to maintain minimum amounts and ratios (set forth in the table that follows) of total and Tier I capital (as defined in the regulations) to risk-weighted assets (as defined) and of Tier I capital (as defined) to average assets (as defined).
The Bank's actual capital accounts and ratios are also presented in the following table:
| Actual |
| Minimum Capital Requirement |
| Minimum to be Well Capitalized Under Prompt Corrective Action Provisions | ||||||||||||
| Amount |
|
Ratio |
|
Amount |
|
Ratio |
|
Amount |
|
Ratio | ||||||
As of June 30, 2013 |
|
|
|
|
|
|
|
|
|
|
| ||||||
Total capital (to risk-weighted assets) | $ | 56,289 | |
| 18.0% |
| $ | 25,060 | |
| 8.0% |
| $ | 31,325 | |
| 10.0% |
Tier I capital (to risk-weighted assets) | 52,450 | |
| 16.7 |
| 12,530 | |
| 4.0 |
| 18,795 | |
| 6.0 | |||
Tier I leverage capital (to average assets) | 52,450 | |
| 11.4 |
| 18,358 | |
| 4.0 |
| 22,947 | |
| 5.0 | |||
|
|
|
|
|
|
|
|
|
|
|
| ||||||
As of June 30, 2012 |
|
|
|
|
|
|
|
|
|
|
| ||||||
Total capital (to risk-weighted assets) | $ | 56,143 | |
| 18.2% |
| $ | 24,634 | |
| 8.0% |
| $ | 30,792 | |
| 10.0% |
Tier I capital (to risk-weighted assets) | 52,254 | |
| 17.0 |
| 12,317 | |
| 4.0 |
| 18,475 | |
| 6.0 | |||
Tier I leverage capital (to average assets) | 52,254 | |
| 10.9 |
| 19,094 | |
| 4.0 |
| 23,867 | |
| 5.0 | |||
Anchor Bancorp exceeded all regulatory capital requirements with Tier 1 Leverage-Based Capital, Tier 1 Risk- Based Capital and Total Risk-Based Capital ratios of 11.7% , 17.2% and 18.4% , respectively, as of June 30, 2013 . As of June 30, 2012, these ratios were 11.3% , 17.5% and 18.8% , respectively.
117
ANCHOR BANCORP
NOTES TO CONSOLIDATED FINANCIAL STATEMENTS
(Dollars in thousands except share data)
|
|
|
Note 14 - Income Taxes
Provision for income tax includes the following components:
| Year Ended June 30, | ||||||||||
| 2013 |
| 2012 |
| 2011 | ||||||
Current | $ | - | |
| $ | - | |
| $ | 178 | |
Deferred | - | |
| - | |
| (178 | ) | |||
Total | $ | - | |
| $ | - | |
| $ | - | |
Retained earnings at June 30, 2013 and 2012, included $5,500 in tax-basis bad debt reserves for which no income tax liability has been recorded. In the future, if this tax-basis bad debt reserve is used for purposes other than to absorb bad debts, or if legislation is enacted requiring recapture of all tax-basis bad debt reserves, the Bank will incur a federal tax liability at the then-prevailing corporate tax rate.
A reconciliation of the provision (benefit) for income tax based on statutory corporate tax rates on pre-tax income and the provision shown in the accompanying consolidated statement of operations at the dates indicated is summarized as follows:
| Amount |
| Percent of Pre-Tax Income | |||
June 30, 2013 |
|
|
| |||
Income taxes computed at statutory rates | $ | (86 | ) |
| (34.0 | )% |
Tax-exempt income | (239 | ) |
| (94.0 | ) | |
Deferred tax asset valuation allowance | 303 | |
| 119.0 | | |
Other, net | 22 | |
| 9.0 | | |
Benefit for income tax | $ | - | |
| - | % |
June 30, 2012 |
| |
|
| | |
Income taxes computed at statutory rates | $ | (582 | ) |
| (34.0 | )% |
Tax-exempt income | (254 | ) |
| (94.0 | ) | |
Deferred tax asset valuation allowance | 823 | |
| 118.6 | | |
Other, net | 13 | |
| 9.4 | | |
Benefit for income tax | $ | - | |
| - | % |
June 30, 2011 |
| |
|
| | |
Income taxes computed at statutory rates | $ | (2,999 | ) |
| (34.0 | )% |
Tax-exempt income | (283 | ) |
| (3.2 | ) | |
Deferred tax asset valuation allowance | 3,259 | |
| 37.0 | | |
Other, net | 23 | |
| 0.2 | | |
Benefit for income tax | $ | - | |
| - | % |
118
ANCHOR BANCORP
NOTES TO CONSOLIDATED FINANCIAL STATEMENTS
(Dollars in thousands except share data)
|
|
|
The components of net deferred tax assets and liabilities at the dates indicated are summarized as follows:
| June 30, | ||||||
| 2013 |
| 2012 | ||||
Deferred tax assets |
|
|
| ||||
Allowance for loan losses | $ | 3,624 | |
| $ | 4,273 | |
AMT credit carryforward | 198 | |
| 198 | | ||
Deferred compensation - SERP | 570 | |
| 591 | | ||
Securities impairment charge | 340 | |
| 340 | | ||
Net operating loss carryforward | 4,329 | |
| 3,385 | | ||
Real estate owned | 1,360 | |
| 1,511 | | ||
Unrealized loss on securities available-for-sale | 323 | |
| - | | ||
Accumulated depreciation | 271 | |
| 131 | | ||
Total deferred tax assets | 11,015 | |
| 10,429 | | ||
Deferred tax liabilities |
|
|
| | |||
Deferred loan fees and costs | 372 | |
| 392 | | ||
FHLB stock dividends | 1,073 | |
| 1,073 | | ||
Mortgage servicing rights | 172 | |
| 186 | | ||
Unrealized gain on securities available-for-sale | - | |
| 186 | | ||
Other common, net | 156 | |
| 162 | | ||
Total deferred tax liabilities | 1,773 | |
| 1,999 | | ||
|
|
|
| | |||
Net deferred tax asset, before valuation allowance | 9,242 | |
| 8,430 | | ||
Valuation allowance | 8,687 | |
| 7,875 | | ||
Net deferred tax asset, after valuation allowance | $ | 555 | |
| $ | 555 | |
Realization of the deferred tax asset is dependent on whether there will be sufficient future taxable income of the appropriate character in the period during which deductible temporary differences reverse or within the carryback and carryforward periods available under tax law. Based upon the available evidence, the Company recorded a valuation allowance of $8,687 and $7,875 at June 30, 2013 and 2012, respectively.
As of June 30, 2013 , the Company had a federal net operating loss carryforwards totaling $12,734 and Oregon net operating loss carryforwards of $858 , which can be used to offset future taxable income. The net operating losses begin to expire in 2031 for federal and 2023 for Oregon. The Company's net operating loss carryforwards may be subject to limitations under Internal Revenue Code Section 382. The Company has not completed a study to assess whether the change of control has occurred.
The Company had no uncertain tax positions at June 30, 2013 , 2012, and 2011. The Company recognizes interest accrued on and penalties related to uncertain tax positions in tax expense. During the years ended June 30, 2013 , 2012, and 2011, the Company recognized no interest and penalties.
The Company files income tax returns in the U.S. federal and Oregon state and local jurisdictions. With few exceptions, the Company is no longer subject to U.S. federal or state/local income tax examinations by tax authorities for years before 2009.
119
ANCHOR BANCORP
NOTES TO CONSOLIDATED FINANCIAL STATEMENTS
(Dollars in thousands except share data)
|
|
|
Note 15 – Parent Company Financials
Presented below are the condensed statement of financial condition, statement of operations, and statement of cash flows for Anchor Bancorp.
ANCHOR BANCORP STATEMENT OF FINANCIAL CONDITION
| June 30, 2013 | |
| June 30, 2012 | | ||
ASSETS |
| |
|
| | ||
Cash | $ | 510 | |
| $ | 798 | |
ESOP loan | 856 | |
| 924 | | ||
Investment in bank subsidiary | 50,979 | |
| 52,284 | | ||
Prepaid and other assets | 23 | |
| 18 | | ||
Total assets | $ | 52,368 | |
| $ | 54,024 | |
LIABILITIES |
|
|
| | |||
Total liabilities | $ | - | |
| $ | - | |
STOCKHOLDERS' EQUITY |
|
|
| | |||
Common stock | $ | 25 | |
| $ | 25 | |
Additional paid-in-capital | 23,229 | |
| 23,202 | | ||
Retained earnings, substantially restricted | 31,491 | |
| 31,746 | | ||
Unearned ESOP shares | (856 | ) |
| (924 | ) | ||
Accumulated other comprehensive income (loss), net of tax | (1,521 | ) |
| (25 | ) | ||
Total stockholders' equity | $ | 52,368 | |
| $ | 54,024 | |
Total liabilities and stockholders' equity | $ | 52,368 | |
| $ | 54,024 | |
ANCHOR BANCORP STATEMENT OF OPERATIONS
| Year Ended June 30, 2013 |
| Year Ended June 30, 2012 |
| Year Ended | ||||||
Operating income |
|
|
|
|
| ||||||
Interest income ESOP loan | $ | 30 | |
| $ | 32 | |
| $ | 14 | |
Total operating income | 30 | |
| 32 | |
| 14 | | |||
Operating expenses |
|
|
| |
|
| |||||
Legal expense | 164 | |
| 162 | |
| 48 | | |||
Accounting expense | 47 | |
| 71 | |
| 10 | | |||
Professional fee | 76 | |
| 54 | |
| 35 | | |||
Management fee | 73 | |
| 73 | |
| 25 | | |||
General and administrative | 22 | |
| 27 | |
| - | | |||
Total operating expenses | 382 | |
| 387 | |
| 118 | | |||
Loss before income tax benefit and equity in undistributed loss of subsidiary | (352 | ) |
| (355 | ) |
| (104 | ) | |||
Income tax expense (benefit) | - | |
| - | |
| - | | |||
Loss before equity in undistributed loss of subsidiary | (352 | ) |
| (355 | ) |
| (104 | ) | |||
Equity in undistributed income (loss) in subsidiary | 97 | |
| (1,357 | ) |
| (8,716 | ) | |||
Net loss | $ | (255 | ) |
| $ | (1,712 | ) |
| $ | (8,820 | ) |
120
ANCHOR BANCORP
NOTES TO CONSOLIDATED FINANCIAL STATEMENTS
(Dollars in thousands except share data)
|
|
|
ANCHOR BANCORP CONDENSED STATEMENT OF CASH FLOWS
| For the Year Ended June 30, 2013 |
| For the Year Ended June 30, 2012 |
| For the Year | |||||
Cash flows from operating activities |
|
|
|
|
| |||||
Net loss | $ | (255 | ) |
| $ | (1,712 | ) |
| (8,820 | ) |
Adjustments to reconcile net loss to net cash from operating activities |
| |
|
| |
|
| |||
Prepaid expenses | (41 | ) |
| (18 | ) |
| - | | ||
Equity in undistributed income (loss) of Anchor Bank | (97 | ) |
| 1,357 | |
| 8,716 | | ||
Net cash used by operating activities | (393 | ) |
| (373 | ) |
| (104 | ) | ||
Cash flows from financing activities |
| |
|
| |
|
| |||
Issuance of common stock net of offering costs | - | |
| - | |
| 23,212 | | ||
Dividend paid to bank subsidiary | - | |
| - | |
| (22,033 | ) | ||
Principal and interest repayments on ESOP loan | 95 | |
| 96 | |
| - | | ||
Net cash provided by investing activities | 95 | |
| 96 | |
| 1,179 | | ||
Net change in cash and cash equivalents | (298 | ) |
| (277 | ) |
| 1,075 | | ||
Cash and cash equivalents at beginning of period | 798 | |
| 1,075 | |
| - | | ||
Cash and cash equivalents at end of period | $ | 500 | |
| $ | 798 | |
| 1,075 | |
Note 16 - Commitments and Contingent Liabilities
Credit-related financial instruments - The Bank is a party to credit-related financial instruments with off-balance-sheet risk in the normal course of business to meet the financing needs of its customers. These financial instruments include commitments to extend credit. Such commitments involve, to a varying degree, elements of credit and interest rate risk in excess of the amount recognized in the consolidated balance sheet.
The Bank's exposure to credit loss is represented by the contractual amount of these commitments. The Bank follows the same credit policies in making commitments as it does for on-balance-sheet instruments.
The following financial instruments were outstanding whose contract amounts represent credit risk at June 30, 2013:
| Amount of Commitment Expiration - Per Period | ||||||
| |||||||
| Total Amounts Committed (2) |
| Due in One Year | ||||
Commitments to originate loans (1) | $ | 275 | |
| $ | 275 | |
Line of Credit |
|
|
| ||||
Fixed rate (3) | 3,452 | |
| 1,908 | | ||
Adjustable rate | 22,194 | |
| 5,827 | | ||
Undisbursed balance of loans closed | 25,646 | |
| 7,735 | | ||
Total balance | $ | 25,921 | |
| $ | 8,010 | |
(1) Interest rates on fixed rate loans range from 2.75% to 2.875% .
(2) At June 30, 2013 there were $51 in reserves for unfunded commitments.
(3) Includes standby letters of credit.
121
ANCHOR BANCORP
NOTES TO CONSOLIDATED FINANCIAL STATEMENTS
(Dollars in thousands except share data)
|
|
|
The following financial instruments were outstanding whose contract amounts represent credit risk at June 30, 2012:
| Amount of Commitment Expiration - Per Period | ||||||
| |||||||
| Total Amounts Committed (2) |
| Due in One Year | ||||
Commitments to originate loans (1) | $ | 1,205 | |
| $ | 1,205 | |
Line of Credit |
|
|
| ||||
Fixed rate (3) | 3,444 | |
| 3,444 | | ||
Adjustable rate | 20,333 | |
| 20,333 | | ||
Undisbursed balance of loans closed | $ | 23,777 | |
| $ | 23,777 | |
Total balance | $ | 24,982 | |
| $ | 24,982 | |
(1) Interest rates on fixed rate loans range from 2.875% to 3.875% .
(2) At June 30, 2012 there were no reserves for unfunded commitments.
(3) Includes standby letters of credit.
Commitments to extend credit are agreements to lend to a customer as long as there is no violation of any condition established in the contract. Commitments generally have fixed expiration dates or other termination clauses and may require payment of a fee. The commitments for equity lines of credit may expire without being drawn upon.
Therefore, the total commitment amounts do not necessarily represent future cash requirements. The amount of collateral obtained, if it is deemed necessary by the Bank, is based on management's credit evaluation of the borrower.
Unfunded commitments under commercial lines of credit, revolving credit lines, and overdraft protection agreements are commitments for possible future extensions of credit to existing customers. These lines of credit are uncollateralized and usually do not contain a specified maturity date and may not be drawn upon to the total extent that the Bank is committed.
Contingent liabilities for sold loans - In the ordinary course of business, the Bank sells loans without recourse that may have to subsequently be repurchased due to defects that occurred during the origination of the loan. The defects are categorized as documentation errors, underwriting errors, early payment defaults, breach of representation or warranty, and fraud. When a loan sold to an investor without recourse fails to perform according to its contractual terms, the investor will typically review the loan file to determine whether defects in the origination process occurred. If a defect is identified, the Bank may be required to either repurchase the loan or indemnify the investor for losses sustained. If there are no such defects, the Bank has no commitment to repurchase the loan. The Bank has recorded no reserve to cover loss exposure related to these guarantees. The principal balance of loans sold without recourse as of June 30, 2013 and 2012, was $110.8 million and $124.5 million , respectively. The Bank repurchased no loans for the year ended June 30, 2013 , no loans for the year ended June 30, 2012, and two loans during the year ended June 30, 2011.
Operating lease commitment - The Bank leases space for branches and operations located in Hoquiam, Shelton, and Puyallup, Washington. These leases run for periods ranging from three to five years. All leases require the Bank to pay all taxes, maintenance, and utility costs, as well as maintain certain types of insurance. The annual lease commitments for the next five years are as follows:
Year Ended June 30, | Amount |
2014 | $109 |
2015 | $91 |
2016 | $56 |
2017 | $56 |
2018 | $51 |
Rental expense charged to operations was $238 , $260 , and $302 for the years ended June 30, 2013 , 2012, and 2011, respectively.
122
ANCHOR BANCORP
NOTES TO CONSOLIDATED FINANCIAL STATEMENTS
(Dollars in thousands except share data)
|
|
|
Note 17 - Fair Value Measurements
Assets and liabilities measured at fair value on a recurring basis - Assets and liabilities are considered to be fair valued on a recurring basis if fair value is measured regularly. The following table shows the Bank's assets and liabilities at the dates indicated measured at fair value on a recurring basis:
| June 30, 2013 | ||||||||||||||
| Level 1 |
| Level 2 |
| Level 3 |
| Total | ||||||||
|
| ||||||||||||||
Municipal bonds | $ | - | |
| $ | 1,456 | |
| $ | - | |
| $ | 1,456 | |
Mortgage-backed securities: |
|
|
|
|
|
|
| ||||||||
FHLMC | - | |
| 20,415 | |
| - | |
| 20,415 | | ||||
FNMA | - | |
| 24,971 | |
| - | |
| 24,971 | | ||||
GNMA | - | |
| 1,466 | |
| - | |
| 1,466 | | ||||
| June 30, 2012 | ||||||||||||||
| Level 1 |
| Level 2 |
| Level 3 |
| Total | ||||||||
|
| ||||||||||||||
Municipal bonds | $ | - | |
| $ | 1,656 | |
| $ | - | |
| $ | 1,656 | |
Mortgage-backed securities: |
|
|
|
|
|
|
| ||||||||
FHLMC | - | |
| 18,646 | |
| - | |
| 18,646 | | ||||
FNMA | - | |
| 28,415 | |
| - | |
| 28,415 | | ||||
GNMA | - | |
| - | |
| - | |
| - | | ||||
Assets and liabilities measured at fair value on a nonrecurring basis - Assets and liabilities are considered to be fair valued on a nonrecurring basis if the fair value measurement of the instrument does not necessarily result in a change in the amount recorded on the balance sheet. Generally, a nonrecurring valuation is the result of the application of other accounting pronouncements that require assets or liabilities to be assessed for impairment or recorded at the lower of cost or fair value. The following table presents the Bank's assets measured at fair value on a nonrecurring basis at the dates indicated:
| June 30, 2013 | ||||||||||||||||||
| Level 1 |
| Level 2 |
| Level 3 |
| Total |
| Total Gains (Losses) | ||||||||||
|
| ||||||||||||||||||
Impaired loans (1) | $ | - | |
| $ | - | |
| $ | 21,861 | |
| $ | 21,861 | |
| $ | (1,306 | ) |
Real estate owned | - | |
| - | |
| 6,212 | |
| 6,212 | |
| (3,447 | ) | |||||
Loans held for sale | 222 | |
| - | |
| - | |
| 222 | |
| - | | |||||
(1) | The balance disclosed for impaired loans represents the impaired loans where fair value is less than unpaid principal prior to impairment at June 30, 2013 . |
| June 30, 2012 | ||||||||||||||||||
| Level 1 |
| Level 2 |
| Level 3 |
| Total |
| Total Gains (Losses) | ||||||||||
|
| ||||||||||||||||||
Impaired loans (1) | $ | - | |
| $ | - | |
| $ | 26,143 | |
| $ | 26,143 | |
| $ | (1,885 | ) |
Real estate owned | - | |
| - | |
| 6,708 | |
| 6,708 | |
| (5,381 | ) | |||||
Loans held for sale | 312 | |
| - | |
| - | |
| 312 | |
| - | | |||||
(1) | The balance disclosed for impaired loans represents the impaired loans where fair value is less than unpaid principal prior to impairment at June 30, 2012 . |
123
ANCHOR BANCORP
NOTES TO CONSOLIDATED FINANCIAL STATEMENTS
(Dollars in thousands except share data)
|
|
|
The fair value of impaired loans is calculated using the collateral value method or on a discounted cash flow basis. Inputs used in the collateral value method include appraisal values, estimates of certain completion costs and closing and selling costs. Some of these inputs may not be observable in the marketplace.
The fair value of real estate owned properties is measured at the lower of their carrying amount or fair value, less costs to sell. Fair values are generally based on third party appraisal of the property, resulting in Level 3 classification. In cases where the carrying amount exceeds the fair value, less costs to sell, an impairment loss is recognized.
The fair value of loans held for sale is based on quoted market prices obtained from FHLMC or from direct sales to other third parties. FHLMC quotes are updated daily and represent prices at which loans are exchanged in high volumes and in a liquid market.
The following table presents quantitative information about Level 3 fair value instruments measured at fair value on a recurring and non-recurring basis.
| June 30, 2013 | ||||||||
| Fair Value |
| Valuation Technique(s) |
| Unobservable Input(s) |
| Range (Weighted Average) | ||
|
| ||||||||
Impaired loans | $ | 21,861 | |
| Fair value of underlying collateral |
| Discount applied to the obtained appraisal |
| 0% - 49% (9%) |
Real estate owned | $ | 6,212 | |
| Fair value of collateral |
| Discount applied to the obtained appraisal |
| 0% - 90% (22%) |
The following presents the carrying amount, fair value, and placement in the fair value hierarchy of the Bank's financial instruments as of June 30, 2013 and June 30, 2012 . For short-term financial assets such as cash and due from banks, the carrying amount is a reasonable estimate of fair value due to the relatively short time between the origination of the instrument and its expected realization. For financial liabilities such as demand deposits, savings, and money market, the carrying amount is a reasonable estimate of fair value due to these products having no stated maturity.
124
ANCHOR BANCORP
NOTES TO CONSOLIDATED FINANCIAL STATEMENTS
(Dollars in thousands except share data)
|
|
|
| June 30, 2013 |
| June 30, 2012 | ||||||||||||||||||||||||
| Carrying Amount |
| Fair Value |
| Quoted Prices in Active Markets for Identical Assets or Liabilities (Level 1) |
| Significant Other Observable Inputs (Level 2) |
| Significant Unobservable Inputs (Level 3) |
| Carrying Amount |
| Fair Value | ||||||||||||||
|
| ||||||||||||||||||||||||||
|
|
|
|
|
|
|
|
|
|
|
|
|
| ||||||||||||||
Financial Instruments-Assets |
|
|
|
|
|
|
|
|
|
|
|
|
| ||||||||||||||
Cash and cash equivalents | $ | 65,353 | |
| $ | 65,353 | |
| $ | 65,353 | |
| $ | - | |
| $ | - | |
| $ | 78,673 | |
| $ | 78,673 | |
Securities available-for-sale | 48,308 | |
| 48,308 | |
| - | |
| 48,308 | |
| - | |
| 48,717 | |
| 48,717 | | |||||||
Securities held-to-maturity | 10,295 | |
| 10,316 | |
| - | |
| 10,316 | |
| - | |
| 7,179 | |
| 7,690 | | |||||||
FHLB stock | 6,278 | |
| 6,278 | |
| - | |
| 6,278 | |
| - | |
| 6,510 | |
| 6,510 | | |||||||
Loans held for sale | 222 | |
| 222 | |
| 222 | |
| - | |
| - | |
| 312 | |
| 312 | | |||||||
Loans | 277,454 | |
| 272,777 | |
| - | |
| - | |
| 272,777 | |
| 287,755 | |
| 273,122 | | |||||||
Life insurance investment | 18,879 | |
| 18,879 | |
| - | |
| 18,879 | |
| - | |
| 18,257 | |
| 18,257 | | |||||||
Accrued interest receivable | 1,583 | |
| 1,583 | |
| - | |
| 1,583 | |
| - | |
| 1,532 | |
| 1,532 | | |||||||
|
|
|
|
|
|
|
|
|
|
|
|
|
| ||||||||||||||
Financial Instruments-Liabilities |
|
|
|
|
|
|
|
|
|
|
|
|
| ||||||||||||||
Demand deposits, savings and money market | $ | 178,901 | |
| $ | 178,901 | |
| $ | 178,901 | |
| $ | - | |
| $ | - | |
| $ | 174,600 | |
| $ | 174,600 | |
Certificates of deposit | 149,683 | |
| 148,808 | |
| - | |
| 148,808 | |
| - | |
| 171,198 | |
| 168,467 | | |||||||
FHLB advances | 64,900 | |
| 65,426 | |
| - | |
| 65,426 | |
| - | |
| 64,900 | |
| 66,465 | | |||||||
Advance payments by borrowers taxes and insurance | 791 | |
| 791 | |
| 791 | |
| - | |
| - | |
| 562 | |
| 562 | | |||||||
Supplemental Executive Retirement Plan | 1,703 | |
| 1,703 | |
| - | |
| - | |
| 1,703 | |
| 1,764 | |
| 1,764 | | |||||||
The following methods and assumptions were used to estimate the fair value of each class of financial instrument:
Cash and cash equivalents - For cash, the carrying amount is a reasonable estimate of fair value.
Securities - The estimated fair values of securities are based on quoted market prices of similar securities.
Loans held for sale - The fair value of loans held-for-sale is based on quoted market prices from FHLMC. FHLMC quotes are updated daily and represent prices at which loans are exchanged in high volumes and in a liquid market.
Loans receivable, net - The fair value of loans is estimated by using comparable market statistics. The loan portfolio was segregated into various categories and a weighted average valuation discount that approximated similar loan sales was applied to each category.
Life insurance investment - The carrying amount is a reasonable estimate of its fair value.
FHLB stock - FHLB stock is carried at par and does not have a readily determinable fair value. Ownership of FHLB stock is restricted to the member institutions, and can only be purchased and redeemed at par.
125
ANCHOR BANCORP
NOTES TO CONSOLIDATED FINANCIAL STATEMENTS
(Dollars in thousands except share data)
|
|
|
Demand deposits, savings, money market, and certificates of deposit - The fair value of the Bank's demand deposits, savings, and money market accounts is the amount payable on demand. The fair value of fixed-maturity certificates is estimated using a discounted cash flow analysis using current rates offered for deposits of similar remaining maturities.
FHLB advances - The fair value of the Bank's FHLB advances was calculated using the discounted cash flow method. The discount rate was equal to the current rate offered by the FHLB for advances of similar remaining maturities.
Accrued interest receivable and advance payments by borrowers for taxes and insurance - The carrying value has been determined to be a reasonable estimate of their fair value.
Supplemental Executive Retirement Plan - The carrying amount is a reasonable estimate of its fair value.
Commitments - Commitments to extend credit represent the principal categories of off-balance-sheet financial instruments. The fair values of these commitments are not material since they are for a short period of time and are subject to customary credit terms.
126
Item 9. Changes in and Disagreements With Accountants on Accounting and Financial Disclosure
None.
Item 9A. Controls and Procedures
(a) Evaluation of Disclosure Controls and Procedures : An evaluation of the Company's disclosure controls and procedures (as defined in Section 13a-15(e) of the Securities Exchange Act of 1934 (the "Act")) was carried out under the supervision and with the participation of the Company's Chief Executive Officer, Chief Financial Officer and several other members of the Company's senior management as of the end of the period covered by this report. The Company's Chief Executive Officer and Chief Financial Officer concluded that the Company's disclosure controls and procedures as currently in effect are effective in ensuring that the information required to be disclosed by the Company in the reports it files or submits under the Act is (i) accumulated and communicated to the Company's management (including the Chief Executive Officer and Chief Financial Officer) in a timely manner, and (ii) recorded, processed, summarized and reported within the time periods specified in the SEC's rules and forms.
(b) Report of Management on Internal Control over Financial Reporting : The management of the Company is responsible for establishing and maintaining adequate internal control over financial reporting. The internal control process has been designed under our supervision to provide reasonable assurance regarding the reliability of financial reporting and the preparation of the Company's financial statements for external reporting purposes in accordance with accounting principles generally accepted in the United States of America.
Management conducted an assessment of the effectiveness of the Company's internal control over financial reporting as of June 30, 2013, utilizing the framework established in Internal Control – Integrated Framework issued by the Committee of Sponsoring Organizations of the Treadway Commission (COSO). Based on this assessment, management has determined that the Company's internal control over financial reporting as of June 30, 2013 was effective.
Our internal control over financial reporting includes policies and procedures that pertain to the maintenance of records that accurately and fairly reflect, in reasonable detail, transactions and dispositions of assets; and provide reasonable assurances that: (1) transactions are recorded as necessary to permit preparation of financial statements in accordance with accounting principles generally accepted in the United States; (2) receipts and expenditures are being made only in accordance with authorizations of management and the directors of the Company; and (3) unauthorized acquisition, use, or disposition of the Company's assets that could have a material effect on the Company's financial statements are prevented or timely detected.
All internal control systems, no matter how well designed, have inherent limitations. Therefore, even those systems determined to be effective can provide only reasonable assurance with respect to financial statement preparation and presentation. Also, projections of any evaluation of effectiveness to future periods are subject to the risk that controls may become inadequate because of changes in conditions, or that the degree of compliance with the policies or procedures may deteriorate.
(c) Changes in Internal Controls : There have been no changes in the Company's internal control over financial reporting during the quarter ended June 30, 2013 that have materially affected, or are reasonably likely to materially affect, the Company's internal control over financial reporting.
The Company intends to continually review and evaluate the design and effectiveness of its disclosure controls and procedures and to improve its controls and procedures over time and to correct any deficiencies that it may discover in the future. The goal is to ensure that senior management has timely access to all material financial and non-financial information concerning the Company's business. While the Company believes the present design of its disclosure controls and procedures is effective to achieve its goal, future events affecting its business may cause the Company to modify its disclosure controls and procedures. The Company does not expect that its disclosure controls and procedures and internal control over financial reporting will prevent every error or instance of fraud. A control procedure, no matter how well conceived and operated, can provide only reasonable, not absolute, assurance that the objectives of the control procedure are met. Because of the inherent limitations in all control procedures, no evaluation of controls can provide absolute assurance that all control issues and instances of fraud, if any, within the Company have been detected. These inherent limitations include the realities that judgments in decision-making can be faulty, and that breakdowns in controls or procedures can occur because of simple error or mistake. Additionally, controls can be circumvented by the individual acts of some persons, by collusion of two or more people, or by management override of the control. The design of any control procedure is based in part upon certain assumptions about the likelihood of future events, and there can be no assurance that any design will succeed in achieving its stated goals under all potential future conditions; over time, controls become inadequate because of changes in conditions, or the degree of compliance with the policies or procedures may
127
Table of Contents
deteriorate. Because of the inherent limitations in a cost-effective control procedure, misstatements due to error or fraud may occur and not be detected.
Item 9B. Other Information
Not applicable.
PART III
Item 10. Directors, Executive Officers and Corporate Governance
The information contained under the section captioned " Proposal 1 – Election of Directors" in the Company's proxy statement, a copy of which will be filed with the SEC no later than 120 days after the Company's year end (the "Proxy Statement") is incorporated herein by reference.
For information regarding the executive officers of the Company and the Bank, see the information contained herein under the section captioned "Item 1. Business – Employees – Executive Officers."
Audit Committee Financial Expert . The Audit Committee of the Company is composed of Directors Kay (Chairperson), Ruecker and Donovan. Each member of the Audit Committee is "independent" as defined in the Nasdaq Stock Market listing standards. The Board of Directors has determined that Mr. Kay meets the definition of "audit committee financial expert," as defined by the SEC.
Code of Ethics. The Board of Directors has adopted a Code of Ethics for the Company's officers (including its senior financial officers), directors and employees. The Code is applicable to the Company's principal executive officer and senior financial officers. The Company's Code of Ethics is posted on its website at www.anchornetbank.com.
Compliance with Section 16(a) of the Exchange Act . The information contained under the section captioned "Section 16(a) Beneficial Ownership Reporting Compliance" is included in the Company's Proxy Statement and is incorporated herein by reference.
Nomination Procedures. There have been no material changes to the procedures by which shareholders may recommend nominees to the Company's Board of Directors.
Item 11. Executive Compensation
The information contained in the section captioned "Executive Compensation" in the Proxy Statement is incorporated herein by reference.
Item 12. Security Ownership of Certain Beneficial Owners and Management and Related Stockholder Matters
(a) | Security Ownership of Certain Beneficial Owners. |
The information contained in the section captioned "Security Ownership of Certain Beneficial Owners and Management" in the Proxy Statement is incorporated herein by reference.
(b) | Security Ownership of Management. |
The information contained in the section captioned "Security Ownership of Certain Beneficial Owners and Management" in the Proxy Statement is incorporated herein by reference.
(c) Changes In Control
The Company is not aware of any arrangements, including any pledge by any person of securities of the Company, the operation of which may at a subsequent date result in a change in control of the Company.
(d) Equity Compensation Plan Information
The Company has not established any equity compensation plans as of June 30, 2013.
128
Table of Contents
Item 13. Certain Relationships and Related Transactions, and Director Independence
Related Transactions . The information contained in the section captioned "Meetings and Committees of the Board of Directors and Corporate Governance Matters – Corporate Governance – Transactions with Related Persons" in the Proxy Statement is incorporated herein by reference.
Director Independence . The information contained in the section captioned "Meetings and Committees of the Board of Directors and Corporate Governance Matters – Corporate Governance – Director Independence" in the Proxy Statement is incorporated herein by reference.
Item 14. Principal Accounting Fees and Services
The information contained under the section captioned "Proposal 2 – Ratification of Appointment of Independent Auditor" is included in the Company's Proxy Statement and is incorporated herein by reference.
PART IV
Item 15. Exhibits and Financial Statement Schedules
( a) 1. Financial Statements.
For a list of the financial statements filed as part of this report see Part II – Item 8.
2. Financial Statement Schedules.
All schedules have been omitted as the required information is either inapplicable or contained in the Consolidated Financial Statements or related Notes contained in Part II, Item 8 of this Form 10-K.
3. Exhibits:
Exhibits are available from the Company by written request.
3.1 Articles of Incorporation (1)
3.2 Amended and Restated Bylaws (2)
4.1 Form of Stock Certificate of the Company (1)
10.1 Form of Anchor Bank Employee Severance Compensation Plan (1)
10.2 Anchor Bank Phantom Stock Plan (1)
10.3 Form of 401(k) Retirement Plan (1)
14 Code of Ethics (3)
21 Subsidiaries of Registrant
31.1 Certification of Chief Executive Officer Pursuant to Section 302 of the Sarbanes-Oxley Act
31.2 Certification of Chief Financial Officer Pursuant to Section 302 of the Sarbanes-Oxley Act
32 Certification of Chief Executive Officer and Chief Financial Officer Pursuant to Section 906 of the
Sarbanes-Oxley Act
101 The following materials from Anchor Bancorp's Annual Report on Form 10-K for the year ended
June 30, 2013, formatted in Extensible Business Reporting Language (XBRL): (1) Consolidated Statement of Financial Condition; (2) Consolidated Statement of Operations; (3) Consolidated Statement of Comprehensive Loss; (4) Consolidated Statement of Stockholders' Equity; (5) Consolidated Statement of Cash Flows; and (6) Notes to Consolidated Financial Statements (4)
___________________
(1) Filed on October 24, 2008, as an exhibit to the Company's Registration Statement on Form S-1
(File No. 333-154734) and incorporated herein by reference.
(2) Filed as an exhibit to the Company's Current Report on Form 8-K dated December 13, 2011 and
incorporated herein by reference.
(3) The Company elects to satisfy Regulation S-K §229.406(c) by posting its Code of Ethics on its website
at www.anchornetbank.com.
(4) Pursuant to Rule 406T of Regulation S-T, these interactive data files are deemed not filed or part of
a registration statement or prospectus for purposes of Sections 11 or 12 of the Securities Act of 1933 or Section 18 of the Securities Exchange Act of 1934, as amended, and otherwise are not subject to liability under those sections.
129
Table of Contents
SIGNATURES
Pursuant to the requirements of section 13 or 15(d) of the Securities Exchange Act of 1934, the registrant has duly caused this report to be signed on its behalf by the undersigned, thereunto duly authorized.
| ANCHOR BANCORP |
|
|
September 13, 2013 | By: /s/Jerald L. Shaw |
| Jerald L. Shaw |
| President, Chief Executive Officer and Director |
| (Duly Authorized Representative) |
Pursuant to the requirements of the Securities Exchange Act of 1934, this report has been signed below by the following persons on behalf of the registrant and in the capacities and on the dates indicated.
By: /s/Jerald L. Shaw | September 13, 2013 |
Jerald L. Shaw President, Chief Executive Officer and Director (Principal Executive Officer) |
|
|
|
By: /s/Terri L. Degner | September 13, 2013 |
Terri L. Degner Chief Financial Officer and Director (Principal Financial and Accounting Officer) |
|
|
|
By: /s/Robert D. Ruecker | September 13, 2013 |
Robert D. Ruecker |
|
Chairman of the Board and Director |
|
|
|
By: /s/Douglas A. Kay | September 13, 2013 |
Douglas A. Kay |
|
Director |
|
|
|
By: /s/George W. Donovan | September 13, 2013 |
George W. Donovan |
|
Director |
|
|
|
By: /s/ William K. Foster | September 13, 2013 |
William K. Foster |
|
Director |
|
|
|
By: /s/ Reid A. Bates | September 13, 2013 |
Reid A. Bates |
|
Director |
|
130