2017
UNITED STATES
SECURITIES AND EXCHANGE COMMISSION
Washington, D.C. 20549
FORM 10-K
ANNUAL REPORT PURSUANT TO SECTION 13 OR 15(d) OF THE
SECURITIES EXCHANGE ACT OF 1934
For the Fiscal Year Ended December 31, 2017
Commission file number 1-16811

(Exact name of registrant as specified in its charter)
Delaware |
| 25-1897152 |
(State of Incorporation) |
| (I.R.S. Employer Identification No.) |
600 Grant Street, Pittsburgh, PA 15219-2800
(Address of principal executive offices)
Tel. No. (412) 433-1121
Securities registered pursuant to Section 12 (b) of the Act:
Title of Each Class |
| Name of Exchange on which Registered |
United States Steel Corporation Common Stock, par value $1.00 |
| New York Stock Exchange, Chicago Stock Exchange |
Indicate by check mark whether the registrant is a well-known seasoned issuer, as defined in Rule 405 of the Securities Act.
Yes ☑ No
Indicate by check mark if the registrant is not required to file reports pursuant to Section 13 or Section 15(d) of the Act.
Yes No ☑
Indicate by check mark whether the registrant (1) has filed all reports required to be filed by Section 13 or 15 (d) of the Securities Exchange Act of 1934 during the preceding 12 months and (2) has been subject to such filing requirements for at least the past 90 days. Yes ☑ No
Indicate by check mark whether the registrant has submitted electronically and posted on its corporate Website, if any, every Interactive Data File required to be submitted and posted pursuant to Rule 405 of Regulation S-T (§232.405 of this chapter) during the preceding 12 months (or for such shorter period that the registrant was required to submit and post such files). Yes ☑ No
Indicate by check mark if disclosure of delinquent filers pursuant to Item 405 of Regulation S-K (§229.405 of this chapter) is not contained herein, and will not be contained, to the best of registrant's knowledge, in definitive proxy or information statements incorporated by reference in Part III of this Form 10-K or any amendment to this Form 10-K. ☑
Indicate by check mark whether the registrant is a large accelerated filer, an accelerated filer, a non-accelerated filer, a smaller reporting company, or emerging growth company. See the definition of "large accelerated filer," "accelerated filer," "smaller reporting company" and "emerging growth company" in Rule 12b-2 of the Exchange Act.(Check one):
Large accelerated filer P |
| Accelerated filer |
| Non-accelerated filer |
| Smaller reporting company |
| Emerging growth company (a) __ |
|
|
|
| (Do not check if a smaller reporting company) |
|
|
|
|
(a) If an emerging growth company, indicate by check mark if the registrant has elected not to use the extended transition period for complying with any new or revised financial accounting standards provided pursuant to Section 13(a) of the Exchange Act. ___ | ||||||||
Indicate by check mark whether the registrant is a shell company (as defined in Rule 12b-2 of the Act). Yes No ☑
Aggregate market value of Common Stock held by non-affiliates as of June 30, 2017 (the last business day of the registrant's most recently completed second fiscal quarter): $3.9 billion. The amount shown is based on the closing price of the registrant's Common Stock on the New York Stock Exchange composite tape on that date. Shares of Common Stock held by executive officers and directors of the registrant are not included in the computation. However, the registrant has made no determination that such individuals are "affiliates" within the meaning of Rule 405 under the Securities Act of 1933.
There were 175,883,206 shares of United States Steel Corporation Common Stock outstanding as of February 15, 2018 .
Documents Incorporated By Reference:
Portions of the Proxy Statement for the 2018 Annual Meeting of Stockholders are incorporated into Part III.
INDEX
| FORWARD-LOOKING STATEMENTS | 3 | |
| 10-K SUMMARY | 5 | |
|
| ||
PART I |
| ||
Item 1. | BUSINESS | 18 | |
Item 1A | RISK FACTORS | 41 | |
Item 1B | UNRESOLVED STAFF COMMENTS | 47 | |
Item 2. | PROPERTIES | 48 | |
Item 3. | LEGAL PROCEEDINGS | 50 | |
Item 4. | MINE SAFETY DISCLOSURE | 55 | |
|
| ||
PART II |
| ||
Item 5. | MARKET FOR REGISTRANT'S COMMON EQUITY, RELATED STOCKHOLDER MATTERS AND ISSUER PURCHASES OF EQUITY SECURITIES | 57 | |
Item 6. | SELECTED FINANCIAL DATA | 59 | |
Item 7. | MANAGEMENT'S DISCUSSION AND ANALYSIS OF FINANCIAL CONDITION AND RESULTS OF OPERATIONS | 60 | |
Item 7A | QUANTITATIVE AND QUALITATIVE DISCLOSURES ABOUT MARKET RISK | 91 | |
Item 8. | FINANCIAL STATEMENTS AND SUPPLEMENTARY DATA | F-1 | |
Item 9. | CHANGES IN AND DISAGREEMENTS WITH ACCOUNTANTS ON ACCOUNTING AND FINANCIAL DISCLOSURE | 95 | |
Item 9A | CONTROLS AND PROCEDURES | 95 | |
Item 9B | OTHER INFORMATION | 95 | |
|
| ||
PART III |
| ||
Item 10. | DIRECTORS, EXECUTIVE OFFICERS AND CORPORATE GOVERNANCE | 96 | |
Item 11. | EXECUTIVE COMPENSATION | 96 | |
Item 12. | SECURITY OWNERSHIP OF CERTAIN BENEFICIAL OWNERS AND MANAGEMENT AND RELATED STOCKHOLDER MATTERS | 97 | |
Item 13. | CERTAIN RELATIONSHIPS AND RELATED TRANSACTIONS, AND DIRECTOR INDEPENDENCE | 97 | |
Item 14. | PRINCIPAL ACCOUNTANT FEES AND SERVICES | 97 | |
|
| ||
PART IV |
| ||
Item 15. | EXHIBITS AND FINANCIAL STATEMENT SCHEDULE | 98 | |
|
|
| |
Item 16. | 10-K SUMMARY | 106 | |
|
| ||
SIGNATURES | 107 | | |
|
| ||
GLOSSARY OF CERTAIN DEFINED TERMS | 109 | | |
|
| ||
TOTAL NUMBER OF PAGES | 110 | | |
Table of Contents
FORWARD-LOOKING STATEMENTS
This report contains information that may constitute "forward-looking statements" within the meaning of Section 27 of the Securities Act of 1933, as amended, and Section 21E of the Securities Exchange Act of 1934, as amended. We intend the forward-looking statements to be covered by the safe harbor provisions for forward-looking statements in those sections. Generally, we have identified such forward-looking statements by using the words "believe," "expect," "intend," "estimate," "anticipate," "project," "target," "forecast," "aim," "should," "will" and similar expressions or by using future dates in connection with any discussion of, among other things, operating performance, trends, events or developments that we expect or anticipate will occur in the future, statements relating to volume growth, share of sales and earnings per share growth, and statements expressing general views about future operating results. However, the absence of these words or similar expressions does not mean that a statement is not forward-looking. Forward-looking statements are not historical facts, but instead represent only the Company's beliefs regarding future events, many of which, by their nature, are inherently uncertain and outside of the Company's control. It is possible that the Company's actual results and financial condition may differ, possibly materially, from the anticipated results and financial condition indicated in these forward-looking statements. Management believes that these forward-looking statements are reasonable as of the time made. However, caution should be taken not to place undue reliance on any such forward-looking statements because such statements speak only as of the date when made. Our Company undertakes no obligation to publicly update or revise any forward-looking statements, whether as a result of new information, future events or otherwise, except as required by law. In addition, forward-looking statements are subject to certain risks and uncertainties that could cause actual results to differ materially from our Company's historical experience and our present expectations or projections. These risks and uncertainties include, but are not limited to the risks and uncertainties described in this report in "Item 1A. Risk Factors" and those described from time to time in our future reports filed with the Securities and Exchange Commission.
References in this Annual Report on Form 10-K to "U. S. Steel," "the Company," "we," "us," and "our" refer to United States Steel Corporation and its consolidated subsidiaries unless otherwise indicated by the context.
Non-Generally Accepted Accounting Principles (non-GAAP) Financial Measures
This report contains certain non-GAAP financial measures such as earnings (loss) before interest, income taxes, depreciation, depletion and amortization (EBITDA), adjusted EBITDA, adjusted net earnings (loss), adjusted net earnings (loss) per diluted share and cash conversion cycle.
We believe that EBITDA, considered along with the net earnings (loss), is a relevant indicator of trends relating to cash generating activity and provides management and investors with additional information for comparison of our operating results to the operating results of other companies.
Adjusted net earnings (loss) and adjusted net earnings (loss) per diluted share are non-GAAP measures that exclude the effects of gains (losses) associated with our retained interest in U. S. Steel Canada Inc., gains (losses) on the sale of ownership interests in equity investees, restructuring charges, impairment charges, significant temporary idling charges, debt extinguishment and other related costs and effects of tax reform that are not part of the Company's core operations. Adjusted EBITDA is also a non-GAAP measure that excludes the effects of gains (losses) associated with our retained interest in U. S. Steel Canada Inc., gains (losses) on the sale of ownership interests in equity investees, restructuring charges, impairment charges and significant temporary idling charges. We present adjusted net earnings (loss), adjusted net earnings (loss) per diluted share and adjusted EBITDA to enhance the understanding of our ongoing operating performance and established trends affecting our core operations, by excluding the effects of gains (losses) associated with our retained interest in U. S. Steel Canada Inc., gains (losses) on the sale of ownership interests in equity investees, restructuring charges, impairment charges, significant temporary idling charges, debt extinguishment and other related costs and effects of tax reform that can obscure underlying trends. U. S. Steel's management considers adjusted net earnings (loss), adjusted net earnings (loss) per diluted share and adjusted EBITDA as alternative measures of operating performance and not alternative measures of the Company's liquidity. U. S. Steel's management considers adjusted net earnings (loss), adjusted net earnings (loss) per diluted share and adjusted EBITDA useful to investors by facilitating a comparison of our operating performance to the operating performance of our competitors. Additionally, the presentation of adjusted net earnings (loss), adjusted net earnings (loss) per diluted share and adjusted EBITDA provides insight into management's view and assessment of the Company's ongoing operating performance, because management does not consider the adjusting items when evaluating the Company's financial performance or in preparing the Company's annual financial Outlook. Adjusted net earnings (loss), adjusted net earnings (loss) per diluted share and adjusted EBITDA should not be considered a substitute for net earnings
3
Table of Contents
(loss), earnings (loss) per diluted share or other financial measures as computed in accordance with U.S. GAAP and is not necessarily comparable to similarly titled measures used by other companies.
We believe the cash conversion cycle is a useful measure in providing investors with information regarding our cash management performance and is a widely accepted measure of working capital management efficiency. The cash conversion cycle should not be considered in isolation or as an alternative to other GAAP metrics as an indicator of performance.
4
Table of Contents
10-K SUMMARY
Our vision is to transform our company in meaningful ways that strategically position us for the future. This vision is about more than U. S. Steel; it is about reinforcing the economic and societal benefits associated with strong domestic manufacturing capabilities, of which steel is a foundational industry.
Underlying our efforts is our belief that we must operate as a principled company committed to a code of conduct that is rooted in our Gary Principles and our core values, the most important of which is safety - of our employees, our environment, and our facilities and equipment. These core beliefs have served us well for much of our history, and our commitment to them remains as strong as the products we make every day.
During 2017, we continued to transform U. S. Steel through a disciplined approach committed to finding ways to innovate, grow, and overcome obstacles in order to create value and benefit the long-term interests of all U. S. Steel stakeholders, including employees, customers, stockholders, and the communities where we do business.
We are focused on execution of a two-phased stockholder value creation strategy: (1) earn the right to grow, and (2) drive and sustain profitable growth. Earning the right to grow means delivering consistent, reliable EBITDA across the business cycle by achieving operational excellence through a focused effort by our talented workforce to deliver superior results in four business-critical areas: safety, quality, delivery, and cost. Driving and sustaining profitable growth, economic profit across the business cycle and above-average returns for long-term stockholders, is enabled through stable, reliable facilities that produce innovative product and service solutions for discerning steel customers. Underlying both phases is our unwavering commitment to strengthen our balance sheet, with an emphasis on cash flow, liquidity, and financial flexibility.
We are on a mission to become an industry leader by striving to create a sustainable competitive advantage with a customer-centric focus on: delivering high-quality, on time value-added products; collaborating with customers to develop innovative solutions that address their most challenging needs, including new advanced high-strength steels to meet fuel efficiency and safety requirements for automotive customers and new premium connections that provide strong, durable connections between pipes used by energy customers in oil and gas drilling; generating economic profit through active participation in relevant markets; and creating and maintaining a competitive cost structure centered around operational flexibility.
We have launched a series of initiatives that we believe will enable us to achieve true operational excellence by improving our performance across our core business processes, including commercial, supply chain, manufacturing, procurement, innovation, and operational and functional support. Our highly talented, capable and collaborative employees are the driving force behind many of these continuous improvement projects, and their efforts are creating a culture where accountability and high performance are valued and celebrated.
5
Table of Contents
KEY PERFORMANCE INDICATORS
This section provides an overview of select key performance indicators for U. S. Steel which management and investors use to assess the Company's financial performance. It does not contain all of the information you should consider. Fluctuations for year to year changes are explained in Item 7. "Management's Discussion and Analysis of Financial Condition and Results of Operations." Please read the entire Annual Report on Form 10-K.
• | While we continue to face challenges driven primarily by uncertain geopolitical factors, our successful navigation through the industry downturn positioned us to benefit from improved industry conditions in 2017. |
• | Our investments in our assets helped to provide a more stable operating performance in 2017. |
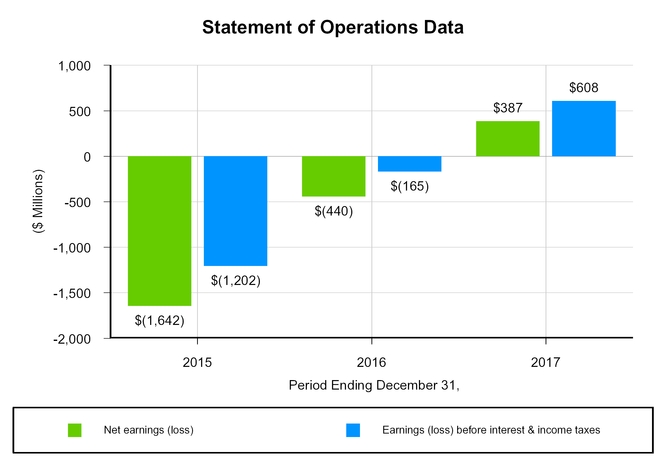
• | Our 2017 results include a favorable impact of $344 million related to our previously disclosed change in accounting method for property, plant and equipment. |
• | Our 2017 net earnings includes an $81 million income tax benefit from tax reform. |
6
Table of Contents
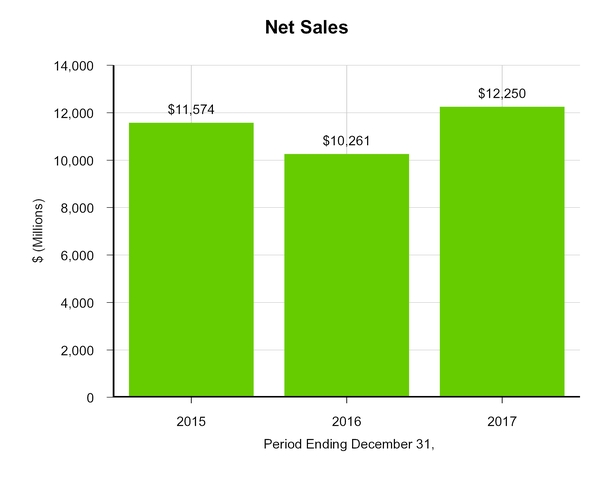
• | The increase in net sales in 2017 as compared to 2016 is primarily due to higher average realized prices in all of our reportable segments. Improved market conditions for our Flat-Rolled segment, notably for hot-rolled, resulted in spot price increases in 2017 as well as price increases for both market-based and firm priced contracts from 2016 to 2017. Lower imports resulted in higher average realized prices for our USSE segment. Improved market conditions for our Tubular segment resulted in higher average realized prices and higher shipments. |
7
Table of Contents
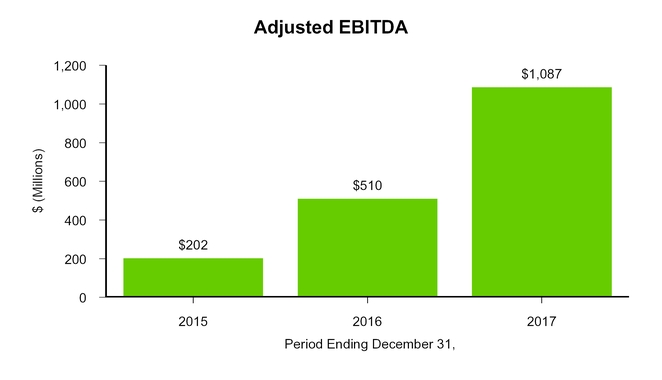
• | These amounts are derived starting from net earnings (loss) as shown on page 6. For a full reconciliation of adjusted EBITDA see page 15. |
• | EBITDA increased for all three reportable segments in 2017 as compared to 2016 with higher average realized prices in all three segments. Our long-term strategic goals of improving our balance sheet, enhancing operational efficiency and reliability and seeking robust enforcement of our trade laws led to a successful year. |
• | Our 2017 adjusted EBITDA includes a favorable impact of $381 million related to our previously disclosed change in accounting method for property, plant and equipment. |
8
Table of Contents
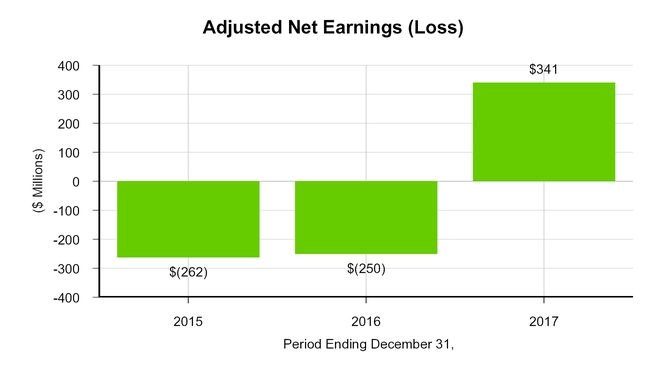
• | These amounts are derived starting from net earnings (loss) as shown on page 6. For a full reconciliation of adjusted net earnings (loss) see page 15. |
• | Our efforts towards achieving economic profit across the business cycle continue, and are reflected in our improved results in 2017 as compared to 2016. |
• | Our 2017 results include a favorable impact of $344 million related to our previously disclosed change in accounting method for property, plant and equipment. |
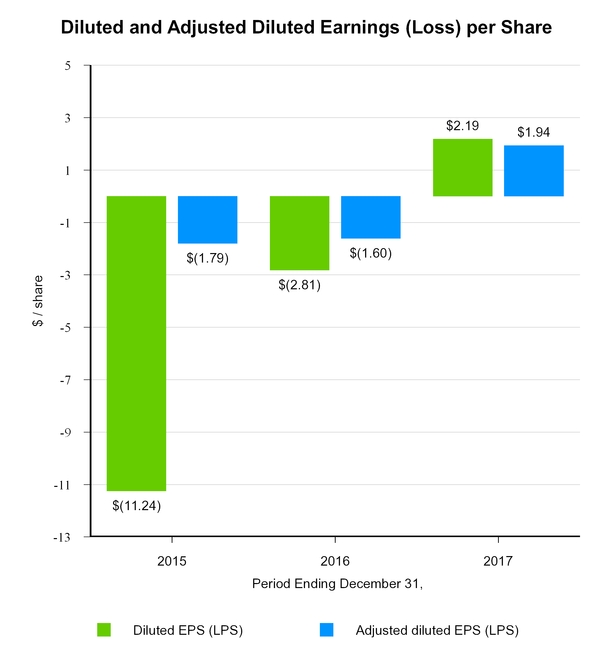
• | See reconciliation from diluted net earnings (loss) per share to adjusted diluted net earnings (loss) per share on page 16. |
• | Our 2017 results include a favorable impact of $1.95 per diluted share related to our previously disclosed change in accounting method for property, plant and equipment. |
9
Table of Contents
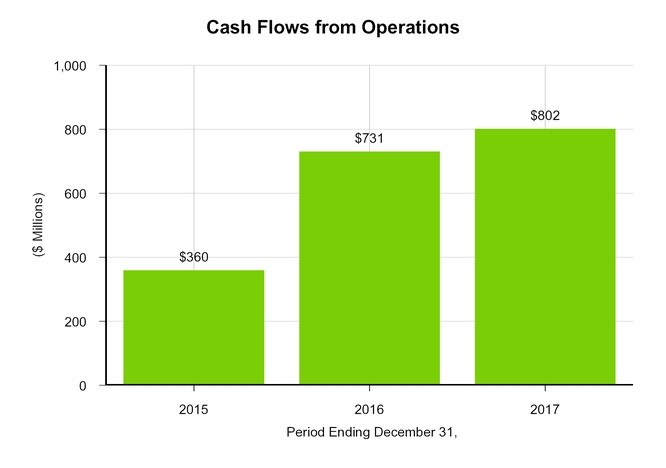
• | The increase in our cash from operations in 2016 as compared to 2015 was due to efficient working capital management. |
• | In 2017, improved financial performance more than offset the changes in working capital. |
• | Our cash conversion cycle was 63, 43 and 30 days for 2015, 2016 and 2017, respectively. See "Item 7. Management's Discussion and Analysis of Financial Condition and Results of Operations – Financial Condition, Cash Flows and Liquidity – Cash Flows" for the calculation of our cash conversion cycle. |
10
Table of Contents
Flat-Rolled Segment Asset Revitalization Program Performance Scorecard
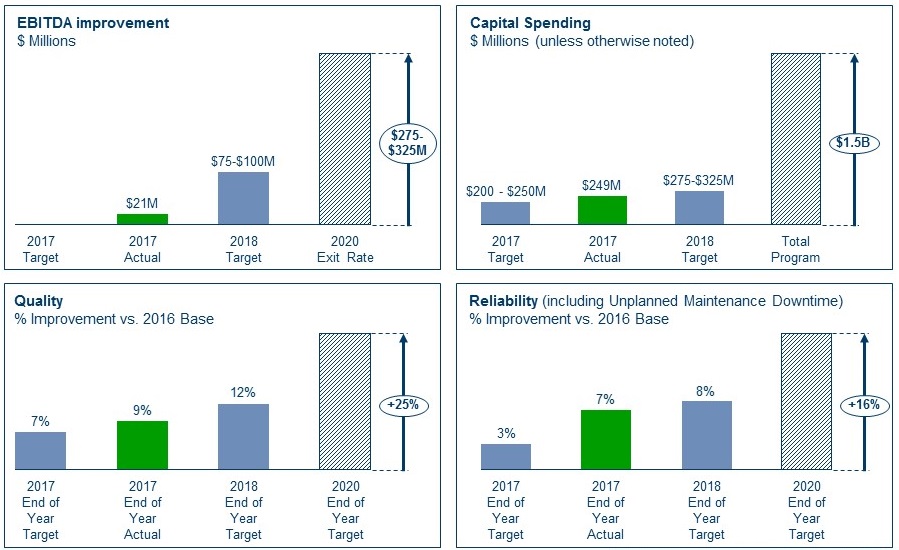
• | We have developed a performance scorecard that includes two financial and two non-financial metrics for |
tracking our progress on implementing our Flat-Rolled Segment asset revitalization program. We believe these metrics will effectively measure how successfully we are implementing the program.
• | We made good progress in 2017, exceeding the EBITDA, quality, and reliability improvements we had |
committed to for 2017 for this asset revitalization program. We established the additional improvement goals we expect to achieve in 2018.
11
Table of Contents
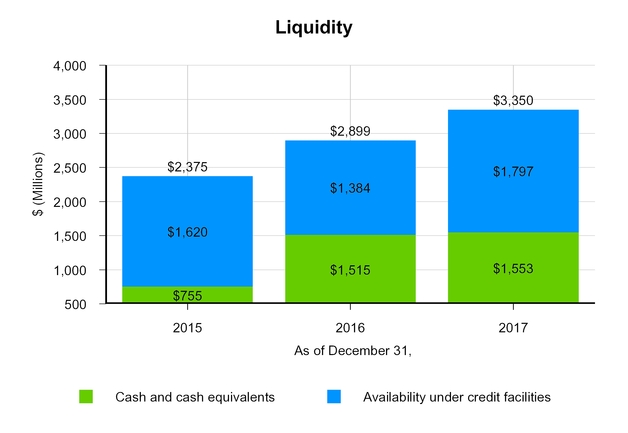
• | Maintaining strong cash and liquidity continues to be a strategic priority. |
• | Total liquidity improved significantly from 2015 to 2016 due to improved cash levels. |
• | Total liquidity further improved from 2016 to 2017 primarily due to higher Asset Based Loan (ABL) availability and improved cash levels, which was driven by higher values of inventory and trade receivable that serve as collateral for the ABL, as well as improved profitability levels. |
12
Table of Contents
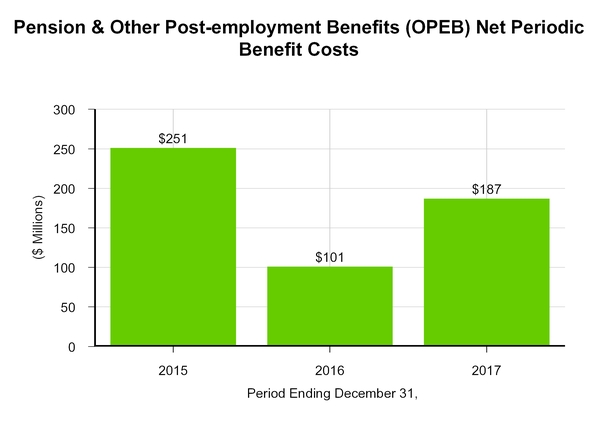
• | The decrease in pension and OPEB expense from 2015 to 2016 was primarily due to the freezing of benefit accruals for non-represented participants effective December 31, 2015. |
• | The increase in 2017 pension and OPEB expense from 2016 is primarily due to a lower return on assets assumption for OPEB benefits as a result of actions taken in 2016 to de-risk the OPEB benefit plan. |
• | 2018 pension and OPEB expense is expected to be approximately $195 million. |
• | For further details, see Note 17 to the Consolidated Financial Statements. |
13
Table of Contents
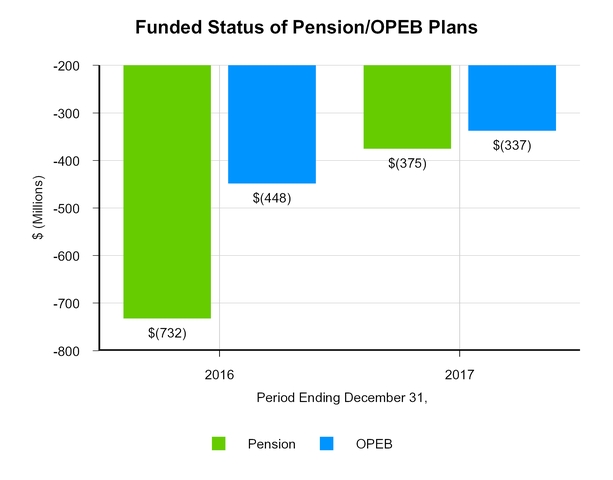
• | As we continue to focus on strengthening the balance sheet, the funded status of our benefit plans is improving. This is partially attributable to the decision to freeze benefit accruals for non-represented participants in the defined benefit pension plan effective December 31, 2015 and the closure of OPEB plans to represented employees hired or rehired under certain conditions on or after January 1, 2016. |
• | Our funded status continued to improve in 2017 due to strong asset returns. Additionally, U. S. Steel made a voluntary contribution of $75 million in 2017 to the Company's main defined benefit pension plan. |
• | On a U.S. GAAP basis the funded status of our pension and OPEB obligations improved to 93% and 86% respectively, at December 31, 2017 from 88% and 82% respectively, at December 31, 2016. |
• | For further details, see Note 17 to the Consolidated Financial Statements. |
14
Table of Contents
NON-GAAP FINANCIAL MEASURES
As disclosed on page 3 of this report, we present EBITDA, adjusted EBITDA, adjusted net earnings (loss) and adjusted net earnings (loss) per diluted share, which are non-GAAP measures, as an additional measurement to enhance the understanding of our operating performance and facilitate a comparison with that of our competitors.
RECONCILIATION TO ADJUSTED NET EARNINGS (LOSS) (a) | ||||||||||||
|
|
|
|
|
|
| ||||||
|
| Year Ended December 31, | ||||||||||
(Dollars in millions) | 2017 |
| 2016 |
| 2015 | |||||||
Reconciliation to adjusted net earnings (loss) attributable to United States Steel Corporation |
|
|
|
|
| |||||||
| Net earnings (loss) attributable to United States Steel Corporation, as reported | $ | 387 | |
| $ | (440 | ) |
| $ | (1,642 | ) |
| Loss on shutdown of certain tubular pipe mill assets (b) | 35 | |
| 126 | |
| - | | |||
| (Gain) loss associated with U. S. Steel Canada Inc. | (72 | ) |
| - | |
| 266 | | |||
| Loss on shutdown of Fairfield Flat-Rolled Operations (b) (c) | - | |
| - | |
| 53 | | |||
| Loss on shutdown of coke production facilities (b) | - | |
| - | |
| 65 | | |||
| Restructuring and other charges (b) (d) | - | |
| (2 | ) |
| 64 | | |||
| Granite City Works temporary idling charges | 17 | |
| 18 | |
| 99 | | |||
| Post-employment benefit actuarial adjustment | - | |
| - | |
| 26 | | |||
| (Gain) loss on equity investee transactions | (2 | ) |
| 12 | |
| 18 | | |||
| Deferred tax asset valuation allowance | - | |
| - | |
| 753 | | |||
| Impairment of intangible assets | - | |
| 14 | |
| - | | |||
| Loss on extinguishment of debt and other related costs | 57 | |
| 22 | |
| 36 | | |||
| Effect of tax reform | (81 | ) |
| - | |
| - | | |||
| Total Adjustments | (46 | ) |
| 190 | |
| 1,380 | | |||
| Adjusted net earnings (loss) attributable to United States Steel Corporation | $ | 341 | |
| $ | (250 | ) |
| $ | (262 | ) |
(b) Included in restructuring and other charges on the Consolidated Statement of Operations.
(c) Fairfield Flat-Rolled Operations includes the blast furnace and associated steelmaking operations, along with most of the flat-rolled finishing operations at the former Fairfield Works. The #5 coating line continues to operate.
(d) The 2015 amount consists primarily of employee related costs, including costs for severance, supplemental unemployment benefits and continuation of health care benefits.
15
Table of Contents
RECONCILIATION TO ADJUSTED NET EARNINGS (LOSS) PER SHARE (a) | ||||||||||||
|
|
|
|
|
|
| ||||||
|
| Year Ended December 31, | ||||||||||
|
| 2017 |
| 2016 |
| 2015 | ||||||
Reconciliation to adjusted diluted net earnings (loss) per share |
|
|
|
|
| |||||||
| Diluted net earnings (loss) per share, as reported | $ | 2.19 | |
| $ | (2.81 | ) |
| $ | (11.24 | ) |
| Loss on shutdown of certain tubular pipe mill assets (b) | 0.20 | |
| 0.80 | |
| - | | |||
| (Gain) loss associated with U. S. Steel Canada Inc. | (0.41 | ) |
| - | |
| 1.82 | | |||
| Loss on shutdown of Fairfield Flat-Rolled Operations (b) (c) | - | |
| - | |
| 0.37 | | |||
| Loss on shutdown of coke production facilities (b) | - | |
| - | |
| 0.44 | | |||
| Restructuring and other charges (b) (d) | - | |
| (0.01 | ) |
| 0.44 | | |||
| Granite City Works temporary idling charges | 0.10 | |
| 0.11 | |
| 0.68 | | |||
| Post-employment benefit actuarial adjustment | - | |
| - | |
| 0.18 | | |||
| (Gain) loss on equity investee transactions | (0.01 | ) |
| 0.08 | |
| 0.12 | | |||
| Deferred tax asset valuation allowance | - | |
| - | |
| 5.15 | | |||
| Impairment of intangible assets | - | | | 0.09 | | | - | | |||
| Loss on extinguishment of debt and other related costs | 0.33 | |
| 0.14 | |
| 0.25 | | |||
| Effect of tax reform | (0.46 | ) |
| - | |
| - | | |||
| Total adjustments | (0.25 | ) |
| 1.21 | |
| 9.45 | | |||
| Adjusted diluted net earnings (loss) per share | $ | 1.94 | |
| $ | (1.60 | ) |
| $ | (1.79 | ) |
(a) The adjustments included in this table have been tax affected at the quarterly effective tax rate through the third quarter of 2015. Subsequent to the third quarter of 2015, the adjustments have been tax affected at a 0% tax rate due to the recognition of a full valuation allowance which was established in the fourth quarter of 2015.
(b) Included in restructuring and other charges and cost of sales in the Consolidated Statement of Operations.
(c) Fairfield Flat-Rolled Operations includes the blast furnace and associated steelmaking operations, along with most of the flat-rolled finishing operations at the former Fairfield Works. The #5 coating line continues to operate.
(d) The 2015 amount consists primarily of employee related costs, including costs for severance, supplemental unemployment benefits and continuation of health care benefits.
16
Table of Contents
RECONCILIATION TO EBITDA AND ADJUSTED EBITDA | ||||||||||||
|
|
|
|
|
|
| ||||||
|
| Year Ended December 31, | ||||||||||
(Dollars in millions) | 2017 |
| 2016 |
| 2015 | |||||||
Reconciliation to EBITDA and Adjusted EBITDA |
|
|
|
|
| |||||||
| Net earnings (loss) attributable to U. S. Steel Corporation | $ | 387 | |
| $ | (440 | ) |
| $ | (1,642 | ) |
| Income tax (benefit) provision | (86 | ) |
| 24 | |
| 183 | | |||
| Net interest and other financial costs | 307 | |
| 251 | |
| 257 | | |||
| Depreciation, depletion and amortization expense | 501 | |
| 507 | |
| 547 | | |||
| EBITDA | 1,109 | |
| 342 | |
| (655 | ) | |||
| Loss on shutdown of certain tubular pipe mill assets (a) | 35 | |
| 126 | |
| - | | |||
| (Gain) loss associated with U. S. Steel Canada Inc. | (72 | ) |
| - | |
| 392 | | |||
| Loss on shutdown of Fairfield Flat-Rolled Operations (a) (b) | - | |
| - | |
| 91 | | |||
| Loss on shutdown of coke production facilities (a) | - | |
| - | |
| 153 | | |||
| Restructuring and other charges (a) (c) | - | |
| (2 | ) |
| 78 | | |||
| Granite City Works temporary idling charges | 17 | |
| 18 | |
| 99 | | |||
| Post-employment benefit actuarial adjustment | - | |
| - | |
| 26 | | |||
| (Gain) loss on equity investee transactions | (2 | ) |
| 12 | |
| 18 | | |||
| Impairment of intangible assets | - | |
| 14 | |
| - | | |||
| Adjusted EBITDA | $ | 1,087 | | | $ | 510 | | | $ | 202 | |
(a) Included in restructuring and other charges in the Consolidated Statement of Operations.
(b) Fairfield Flat-Rolled Operations includes the blast furnace and associated steelmaking operations, along with most of the flat-rolled finishing operations at Fairfield Works. The #5 coating line continues to operate.
(c) The 2015 amount consists primarily of employee related costs, including costs for severance, supplemental unemployment benefits and continuation of health care benefits.
17
Table of Contents
PART I
Item 1. BUSINESS
United States Steel Corporation (U. S. Steel) is an integrated steel producer of flat-rolled and tubular products with major production operations in the United States and Europe. An integrated steel producer uses iron ore and coke as primary raw materials for steel production. U. S. Steel has annual raw steel production capability of 22.0 million net tons (17.0 million tons in the United States and 5.0 million tons in Europe). U. S. Steel supplies customers throughout the world primarily in the automotive, consumer, industrial and oil country tubular goods (OCTG) markets. According to World Steel Association's latest published statistics, in 2016 U. S. Steel was the third largest steel producer in the United States and the twenty-fourth largest steel producer in the world. U. S. Steel is also engaged in other business activities consisting primarily of railroad services and real estate operations.
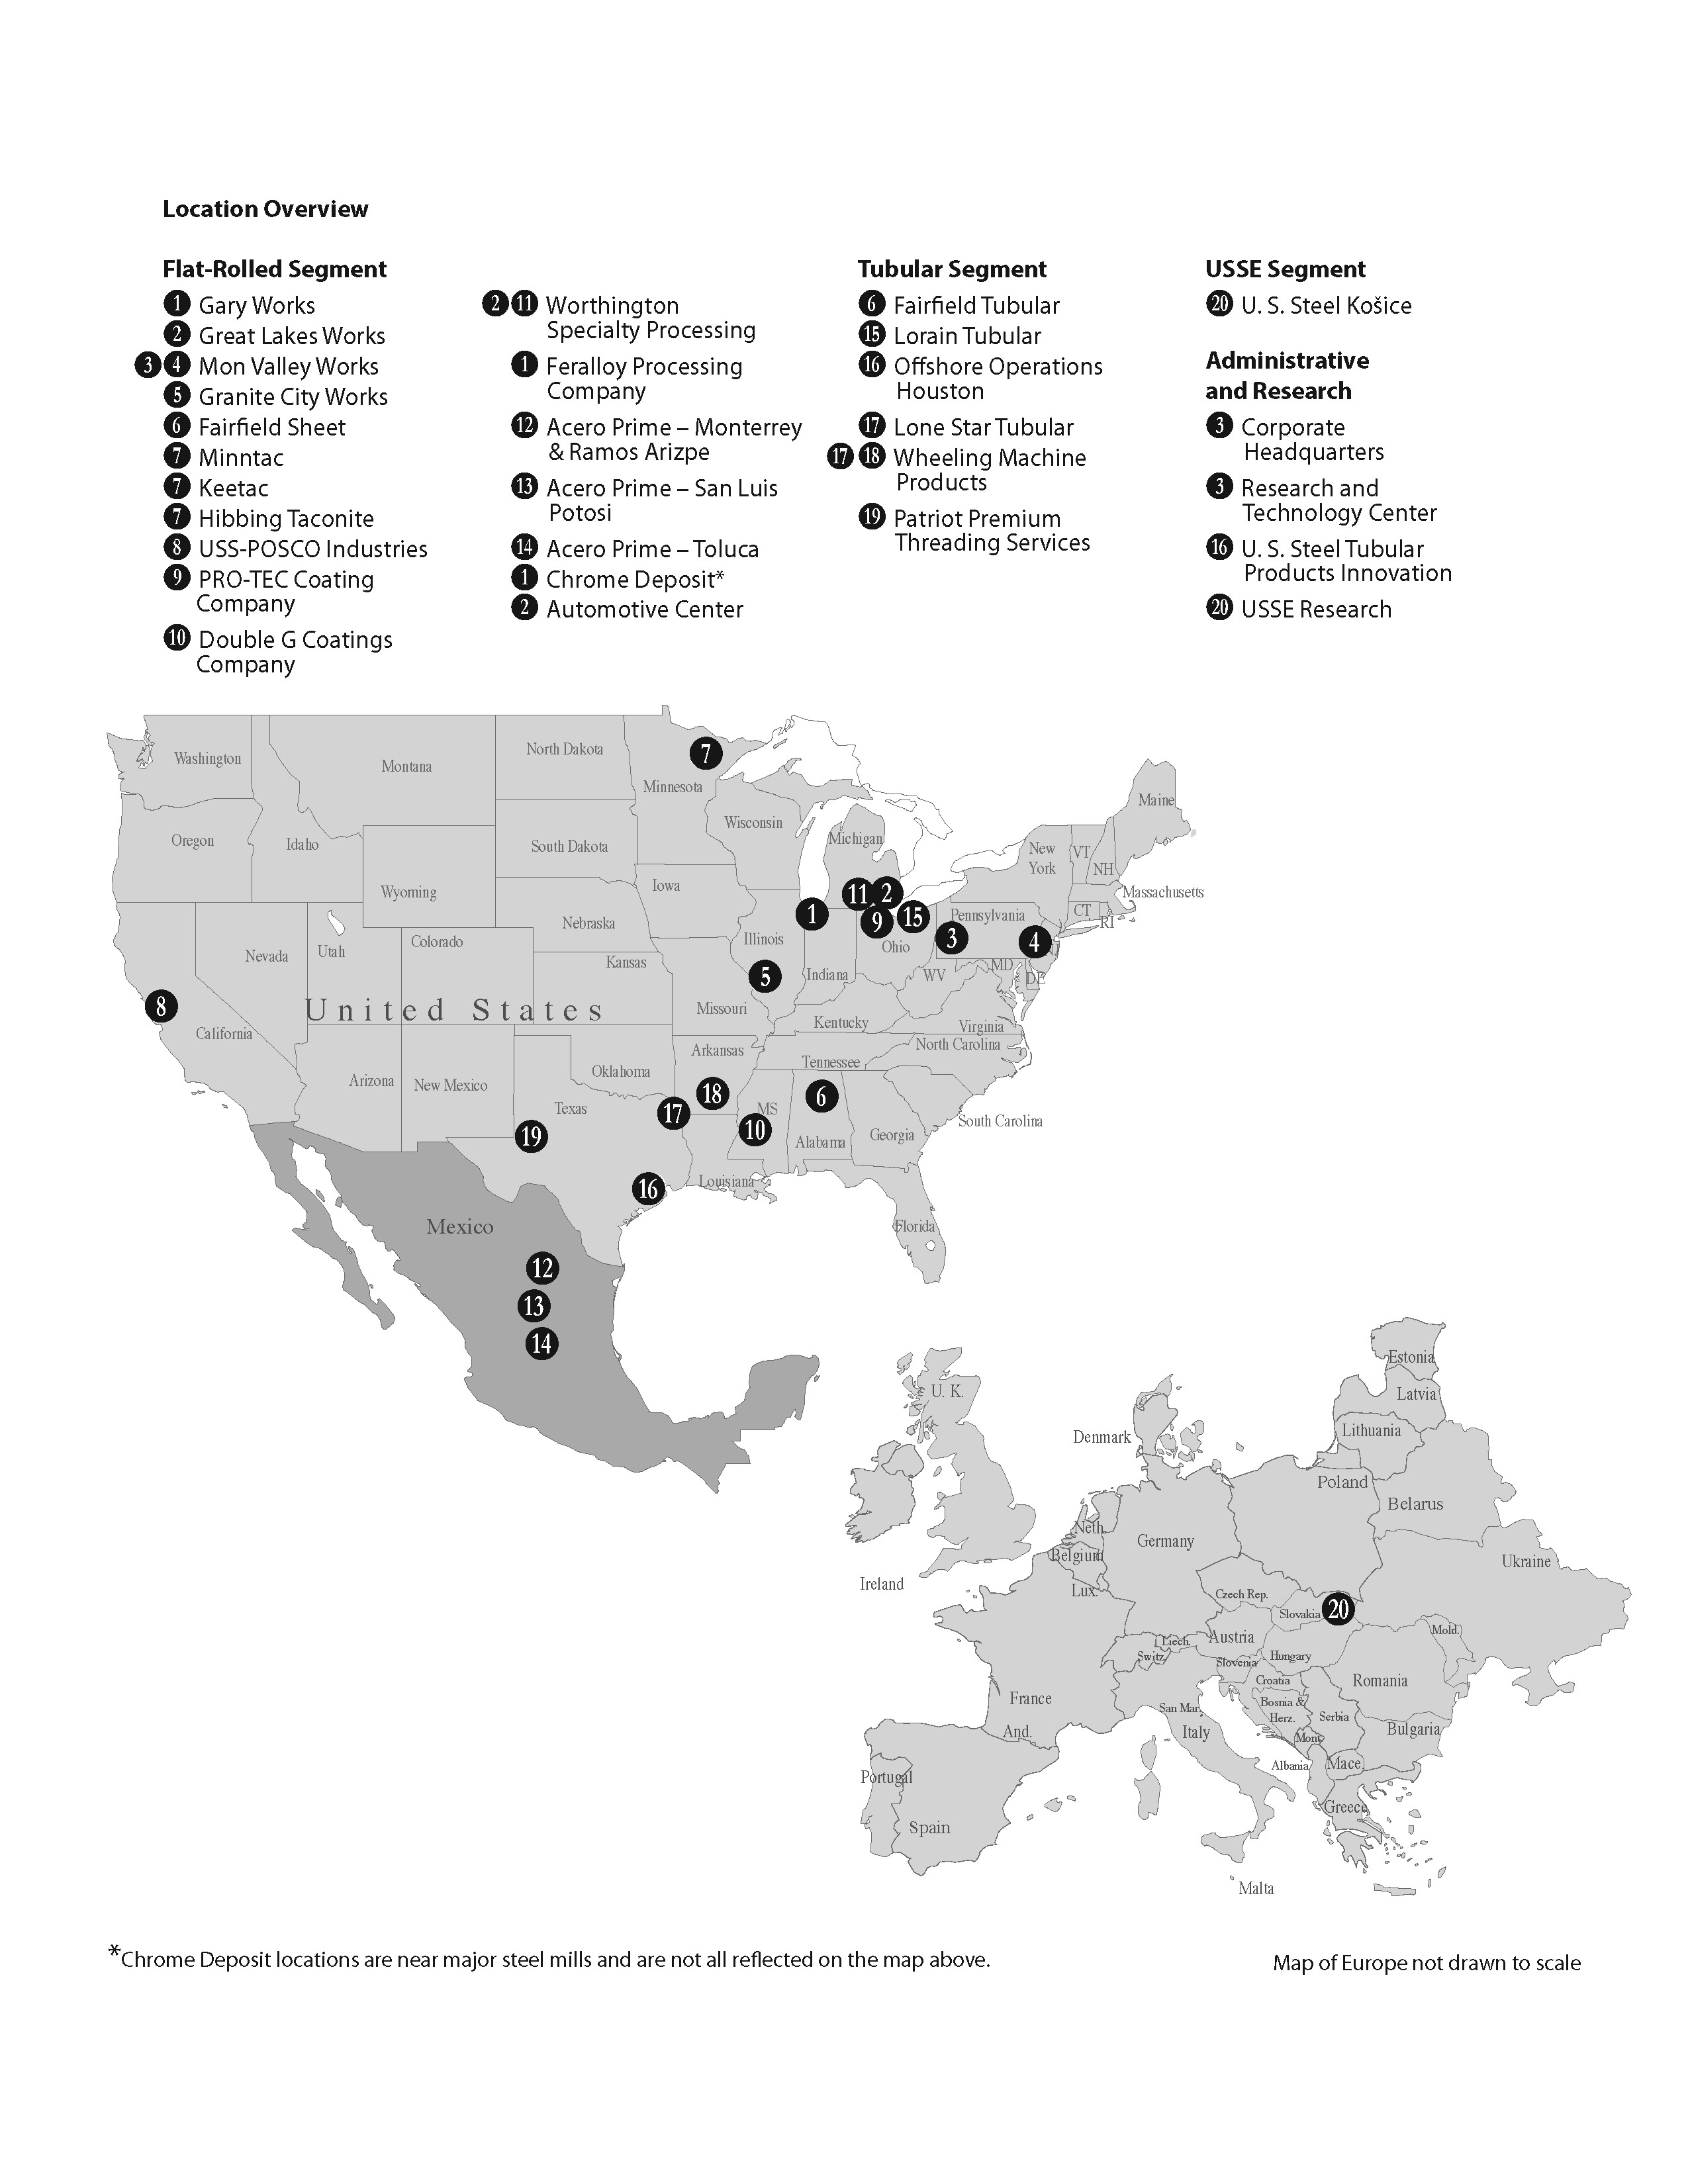
Segments
U. S. Steel has three reportable operating segments: Flat-Rolled Products (Flat-Rolled), U. S. Steel Europe (USSE) and Tubular Products (Tubular). The results of our railroad and real estate businesses that do not constitute reportable segments are combined and disclosed in the Other Businesses category.
Flat-Rolled
The Flat-Rolled segment includes the operating results of U. S. Steel's integrated steel plants and equity investees in North America involved in the production of slabs, strip mill plates, sheets and tin mill products, as well as all iron ore and coke production facilities in the United States. These operations primarily serve North American customers in the service center, conversion, transportation (including automotive), construction, container, and appliance and electrical markets.
The Flat-Rolled segment is structured to specifically address customer needs through three "commercial entities." Our Flat-Rolled segment commercial entities are focused on customers in the: (1) automotive, (2) consumer and (3) industrial, service center and mining industries.
Automotive Solutions collaborates with customers to develop solutions such as the next generation of advanced high strength steel (AHSS) to address challenges facing the automotive industry, including increased fuel economy standards and enhanced safety requirements.
Consumer Solutions partners with customers in the appliance, packaging, container and construction markets. Consumer Solutions has a robust presence with our tin customers, who represent roughly one quarter of this market category. Additional product lines within the market category include the Company's COR-TEN AZP®, ACRYLUME®, GALVALUME® and Weathered Metals Series®.
Industrial, Service Center and Mining Solutions focuses on the Company's customers in the service center business, pipe and tube manufacturing markets, and agricultural and industrial equipment markets.
Flat-Rolled has aggregate annual raw steel production capability of 17.0 million tons produced at our Gary Works, Mon Valley Works, Great Lakes Works and Granite City Works facilities. Prior to the permanent shut down of the Fairfield Flat-Rolled operations beginning in August 2015, annual raw steel production capability for Flat-Rolled was 19.4 million tons. Raw steel production was 10.8 million tons in 2017, 10.7 million tons in 2016 and 11.3 million tons in 2015. Raw steel production averaged 64 percent of capability in 2017, 63 percent of capability in 2016 and 60 percent of capability in 2015. In December 2015 Granite City Works was temporarily idled and if its production capability is excluded, Flat-Rolled production would have been 76 percent and 75 percent of capability in 2017 and 2016 respectively.
European Operations
The USSE segment includes the operating results of U. S. Steel Košice (USSK), U. S. Steel's integrated steel plant and coke production facilities in Slovakia, and its subsidiaries. USSE primarily serves customers in the Eastern European construction, service center, conversion, container, transportation (including automotive), appliance and electrical, and oil, gas and petrochemical markets. USSE produces and sells slabs, sheet, strip mill plate, tin mill products and spiral welded pipe, as well as heating radiators and refractory ceramic materials.
18
Table of Contents
USSE has annual raw steel production capability of 5.0 million tons. USSE's raw steel production was 5.1 million tons in 2017, 5.0 million tons in 2016, and 4.7 million tons in 2015. USSE's raw steel production averaged 102 percent of capability in 2017, 99 percent of capability in 2016 and 93 percent of capability in 2015.
Tubular
The Tubular segment includes the operating results of U. S. Steel's tubular production facilities, in the United States, and equity investees in the United States and Brazil. Our ownership interest in the equity investment in Brazil was sold in December of 2017. These operations produce and sell seamless and electric resistance welded (ERW) steel casing and tubing (commonly known as OCTG), and standard and line pipe and mechanical tubing and primarily serve customers in the oil, gas and petrochemical markets. Tubular's annual production capability is 1.5 million tons.
U. S. Steel Tubular Products, Inc. (USSTP), a wholly owned subsidiary of U. S. Steel, is designing and developing a range of premium and semi-premium connections to address the growing needs for technical solutions for our end users' well site production challenges. Through its wholly owned subsidiary, U. S. Steel Oilwell Services, LLC, USSTP also offers rig site services, which provides the technical expertise for proper installation of our tubular products and proprietary connections at the well site.
For further information, see "Item 7. Management's Discussion and Analysis of Financial Condition and Results of Operations" and Note 4 to the Consolidated Financial Statements.
19
Table of Contents
Financial and Operational Highlights
Steel Shipments by Product and Segment
(Thousands of Tons) |
| Flat-Rolled |
| USSE |
| Tubular |
| Total | ||||
Product-2017 |
|
|
|
|
|
|
|
| ||||
Hot-rolled Sheets |
| 3,262 | |
| 1,151 | |
| - | |
| 4,413 | |
Cold-rolled Sheets |
| 3,281 | |
| 499 | |
| - | |
| 3,780 | |
Coated Sheets |
| 2,394 | |
| 872 | |
| - | |
| 3,266 | |
Tin Mill Products |
| 800 | |
| 441 | |
| - | |
| 1,241 | |
Oil country tubular goods (OCTG) |
| - | |
| - | |
| 575 | |
| 575 | |
Standard and line pipe |
| - | |
| 61 | |
| 113 | |
| 174 | |
Semi-finished and Plates |
| 148 | |
| 1,561 | |
| - | |
| 1,709 | |
Other |
| 2 | |
| - | |
| - | |
| 2 | |
TOTAL |
| 9,887 | |
| 4,585 | |
| 688 | |
| 15,160 | |
Memo: Intersegment shipments from Flat-Rolled to Tubular, hot-rolled sheets |
| 158 | |
|
|
|
|
|
| |||
Memo: Intersegment shipments from USSK to Flat-Rolled, slabs |
|
|
| 47 | |
|
|
|
| |||
Product-2016 |
|
|
|
|
|
|
|
| ||||
Hot-rolled Sheets |
| 2,784 | |
| 1,337 | |
| - | |
| 4,121 | |
Cold-rolled Sheets |
| 3,775 | |
| 459 | |
| - | |
| 4,234 | |
Coated Sheets |
| 2,655 | |
| 849 | |
| - | |
| 3,504 | |
Tin Mill Products |
| 831 | |
| 439 | |
| - | |
| 1,270 | |
Oil country tubular goods (OCTG) |
| - | |
| - | |
| 351 | |
| 351 | |
Standard and line pipe |
| - | |
| 60 | |
| 49 | |
| 109 | |
Semi-finished and Plates |
| 23 | |
| 1,352 | |
| - | |
| 1,375 | |
Other |
| 26 | |
| - | |
| - | |
| 26 | |
TOTAL |
| 10,094 | |
| 4,496 | |
| 400 | |
| 14,990 | |
Memo: Intersegment shipments from Flat-Rolled to Tubular |
|
|
|
|
|
|
|
| ||||
Hot-rolled sheets |
| 42 | |
|
|
|
|
|
| |||
Product-2015 |
|
|
|
|
|
|
|
| ||||
Hot-rolled Sheets |
| 3,283 | |
| 1,165 | |
| - | |
| 4,448 | |
Cold-rolled Sheets |
| 3,507 | |
| 470 | |
| - | |
| 3,977 | |
Coated Sheets |
| 2,511 | |
| 865 | |
| - | |
| 3,376 | |
Tin Mill Products |
| 927 | |
| 428 | |
| - | |
| 1,355 | |
Oil country tubular goods (OCTG) |
| - | |
| - | |
| 345 | |
| 345 | |
Standard and line pipe |
| - | |
| 55 | |
| 248 | |
| 303 | |
Semi-finished and Plates |
| 47 | |
| 1,374 | |
| - | |
| 1,421 | |
Other |
| 320 | |
| - | |
| - | |
| 320 | |
TOTAL |
| 10,595 | |
| 4,357 | |
| 593 | |
| 15,545 | |
Memo: Intersegment shipments from Flat-Rolled to Tubular |
|
|
|
|
|
|
|
| ||||
Hot-rolled sheets |
| 219 | |
|
|
|
|
|
| |||
Rounds |
| 197 | |
|
|
|
|
|
| |||
20
Table of Contents
Steel Shipments by Market and Segment
(Thousands of Tons) |
| Flat-Rolled |
| USSE |
| Tubular |
| Total | ||||
Major Market – 2017 |
|
|
|
|
|
|
|
| ||||
Steel Service Centers |
| 1,587 | |
| 761 | |
| - | |
| 2,348 | |
Further Conversion – Trade Customers |
| 2,951 | |
| 284 | |
| - | |
| 3,235 | |
– Joint Ventures |
| 1,513 | |
| - | |
| - | |
| 1,513 | |
Transportation (Including Automotive) |
| 1,453 | |
| 708 | |
| - | |
| 2,161 | |
Construction and Construction Products |
| 665 | |
| 1,831 | |
| 41 | |
| 2,537 | |
Containers |
| 597 | |
| 438 | |
| - | |
| 1,035 | |
Appliances and Electrical Equipment |
| 406 | |
| 247 | |
| - | |
| 653 | |
Oil, Gas and Petrochemicals |
| - | |
| 10 | |
| 631 | |
| 641 | |
Exports from the United States |
| 452 | |
| - | |
| 16 | |
| 468 | |
All Other |
| 263 | |
| 306 | |
| - | |
| 569 | |
TOTAL |
| 9,887 | |
| 4,585 | |
| 688 | |
| 15,160 | |
Major Market – 2016 |
|
|
|
|
|
|
|
| ||||
Steel Service Centers |
| 1,765 | |
| 801 | |
| - | |
| 2,566 | |
Further Conversion – Trade Customers |
| 2,650 | |
| 274 | |
| - | |
| 2,924 | |
– Joint Ventures |
| 1,423 | |
| - | |
| - | |
| 1,423 | |
Transportation (Including Automotive) |
| 1,725 | |
| 660 | |
| - | |
| 2,385 | |
Construction and Construction Products |
| 725 | |
| 1,811 | |
| 40 | |
| 2,576 | |
Containers |
| 600 | |
| 436 | |
| - | |
| 1,036 | |
Appliances and Electrical Equipment |
| 420 | |
| 236 | |
| - | |
| 656 | |
Oil, Gas and Petrochemicals |
| - | |
| 4 | |
| 340 | |
| 344 | |
Exports from the United States |
| 436 | |
| - | |
| 20 | |
| 456 | |
All Other |
| 350 | |
| 274 | |
| - | |
| 624 | |
TOTAL |
| 10,094 | |
| 4,496 | |
| 400 | |
| 14,990 | |
Major Market – 2015 |
|
|
|
|
|
|
|
| ||||
Steel Service Centers |
| 1,702 | |
| 718 | |
| - | |
| 2,420 | |
Further Conversion – Trade Customers |
| 3,039 | |
| 304 | |
| - | |
| 3,343 | |
– Joint Ventures |
| 1,254 | |
| - | |
| - | |
| 1,254 | |
Transportation (Including Automotive) |
| 2,011 | |
| 705 | |
| - | |
| 2,716 | |
Construction and Construction Products |
| 649 | |
| 1,703 | |
| 55 | |
| 2,407 | |
Containers |
| 692 | |
| 424 | |
| - | |
| 1,116 | |
Appliances and Electrical Equipment |
| 429 | |
| 236 | |
| - | |
| 665 | |
Oil, Gas and Petrochemicals |
| - | |
| - | |
| 513 | |
| 513 | |
Exports from the United States |
| 234 | |
| - | |
| 25 | |
| 259 | |
All Other |
| 585 | |
| 267 | |
| - | |
| 852 | |
TOTAL |
| 10,595 | |
| 4,357 | |
| 593 | |
| 15,545 | |
21
Table of Contents
Business Strategy
We are committed to improving our operations, revitalizing our assets, and developing our talent. Foundational to all our efforts is our belief that we must operate as a principled company committed to a code of conduct that is rooted in our Gary Principles and our core values, the most important of which is safety - of our employees, our environment, and our facilities and equipment. This core belief has served us well for much of our history, and our commitment to it remains as strong as the products we make every day.
We are focused on execution of our two-phased stockholder value creation strategy: (1) earn the right to grow, and (2) drive and sustain profitable growth. Earning the right to grow means delivering consistent, reliable EBITDA across the business cycle by achieving operational excellence through a focused effort by our talented workforce to deliver superior results in four business-critical areas: safety, quality, delivery, and cost. Driving and sustaining profitable growth, economic profit across the business cycle and above-average returns for long-term stockholders, is enabled through stable, reliable facilities that produce innovative product and service solutions for discerning steel customers. Underlying both phases is our unwavering commitment to strengthen our balance sheet, with an emphasis on cash flow, liquidity, and financial flexibility.
We are on a mission to become an industry leader by striving to create a sustainable competitive advantage with a customer-centric focus on: delivering high-quality, value-added products on time every time; collaborating with customers to develop innovative solutions that address their most challenging needs, including new advanced high-strength steels to meet fuel efficiency and safety requirements for automotive customers and new premium connections that provide strong, durable connections between pipes used by energy customers in oil and gas drilling; generating economic profit through active participation in relevant markets; and creating and maintaining a competitive cost structure centered around operational flexibility. The strategic positioning of operations within the commercial entities enhances our ability to better hear the voice of the customer, ensuring that we deliver superior value and drive results in the markets we choose to serve.
U. S. Steel will continue to evaluate potential strategic and organizational opportunities, which may include the acquisition, divestiture or consolidation of assets. Given recent market conditions, the cyclicality of our industry, and the continued challenges faced by the Company, we are focused on strategically maintaining and spending cash (including capital investments under our asset revitalization program), in order to invest in areas consistent with our long-term strategy, and are considering various possibilities, including exiting lines of business and the sale of certain assets, that we believe would ultimately result in a stronger balance sheet and greater stockholder value. The Company will pursue opportunities based on its long-term strategy, and what the Board of Directors determines to be in the best interests of the Company's stockholders at the time.
Changes to Operational Footprint
On December 22, 2017, a subsidiary of U. S. Steel completed the sale of its 50% ownership interest in Apolo Tubulars, S.A. joint venture for $11 million. As a result of the transaction, U. S. Steel recognized a non-cash loss of approximately $18 million.
On September 29, 2017, a subsidiary of U. S. Steel completed the sale of its 15% ownership interest in Tilden Mining Company L.C. for $105 million. As a result of the transaction, U. S. Steel recognized a gain of approximately $26 million.
On June 30, 2017, U. S. Steel completed the restructuring and disposition of USSC through a sale and transfer of all of the issued and outstanding shares in USSC to an affiliate of Bedrock Industries Group LLC (Bedrock). In accordance with the Second Amended and Restated Plan of Compromise, Arrangement and Reorganization, approved by the Ontario Superior Court of Justice on June 9, 2017, U. S. Steel received approximately $127 million in satisfaction of its secured claims, including interest, which resulted in a gain of $72 million on the Company's retained interest in USSC. U. S. Steel also agreed to the discharge and cancellation of its unsecured claims for nominal consideration. The terms of the settlement also included mutual releases among key stakeholders, including a release of all claims against the Company regarding environmental, pension and other liabilities.
In March 2017, U. S. Steel made a strategic decision to permanently shutdown the Lorain No. 6 Quench & Temper Mill and relocate the equipment.
22
Table of Contents
In February 2017, the Company restarted production on the hot strip mill at Granite City Works to provide better alignment with customer needs and improve service while increasing the pace of our asset revitalization program. The hot strip mill had been temporarily idle since January 2016.
In December 2016, the Company reached agreements to supply iron ore pellets to third party customers over the next several years. The Keetac Iron Ore Operations restarted production in the first quarter of 2017 to take full advantage of these business opportunities. It had previously been idle since May 2015 due to significantly lower steel production.
In December 2016, the Company made the strategic decision to permanently close the Lorain #4 and Lone Star #1 pipe mills and the Bellville Tubular Operations after considering a number of factors, including challenging market conditions for tubular products, reduced rig counts, and high levels of unfairly traded imports.
In April 2016, U. S. Steel temporarily idled its Lone Star tubular operations. These operations were restarted in April 2017.
During 2015, the Company adjusted operating levels at several of its tubular operations as declining oil prices and rig counts have significantly reduced demand for OCTG products.
In August 2015, U. S. Steel permanently shut down most of the Fairfield Flat-Rolled operations.
In 2015, the Company permanently closed the coke making operations at Granite City Works and Gary Works. Also, in 2015, U. S. Steel temporarily idled steelmaking operations at Granite City Works.
Steel Innovation
In addition to the increased focus on our operations, we are continuing to develop the next generation of steel products for our customers. Our Generation 3 (GEN3) steels will provide superior formability and high-strength properties while using a low-alloyed approach for robust weldability. To expand our capabilities in GEN3 steels, a new continuous galvanizing line will be constructed at our PRO-TEC Coating Company joint venture (PRO-TEC), which will allow PRO-TEC to produce these GEN3 steels with a hot-dipped zinc coating. This line will be the first of its kind and will utilize proprietary technology capable of producing the high-quality, cutting-edge advanced high-strength steels that will meet our automotive customers' needs and solve some of their most pressing challenges. Our GEN3 steels reinforce why steel will remain the lowest cost, strongest, safest, and most environmentally efficient material of choice.
Asset Revitalization
Our Flat-Rolled segment asset revitalization program is a comprehensive $2 billion investment plan with a focus on continually improving safety, quality, delivery and cost. We currently expect capital spending for this program to be approximately $1.5 billion from 2017 through 2020. As we revitalize our assets, we expect to increase profitability, productivity and operational stability, and reduce volatility. This program is designed to prioritize investment in the areas with the highest returns. Importantly, while this is a large program, the majority of projects are not complex projects. This means that projects are easier to execute. Due to the smaller nature of many of the projects, we do not have to complete the entire program in order to start seeing benefits. Also, by breaking the program down into a series of smaller projects, we have greater flexibility to adjust the scope and pace of project implementation based on changes in business conditions. Our asset revitalization program covers investments in our existing assets and involves investments beyond routine capital and maintenance spending. These projects are expected to deliver both operational and commercial benefits, with most of the benefits coming from operational improvements. The commercial benefits we expect to realize will be driven primarily by things we can control, such as better product quality, improved delivery performance, and increased throughput on constrained assets. Being regarded as a top quartile performer in the eyes of our customers will support sustainable commercial benefits from these investments. After we complete our full asset revitalization program, we expect to have well maintained facilities with a strong core infrastructure, and strong reliability centered maintenance organizations. We will deliver products to our customers with improved reliability and quality. While this program only covers our existing assets, it will create a stable foundation for our future as we continue to evaluate strategic growth projects to strengthen our position as the markets we serve continue to grow and evolve. Refer to our Flat-Rolled segment Asset Revitalization Program Performance Scorecard on page 11 in the 10-K summary section of this document for how we measure success in this program.
23
Table of Contents
Safety
U. S. Steel has a long-standing commitment to the safety and health of the men and women who work in our facilities. For our Company, safety is our primary core value. Every employee has the right to return home safely at the end of every day, and we are working to eliminate all injuries and incidents at all of our facilities. Ensuring a safe workplace also improves productivity, quality, reliability and financial performance. By making safety and health a personal responsibility, our employees are making a daily commitment to follow safe work practices, look out for the safety of co-workers and ensure safe working conditions for everyone. A "Safety First" mindset is as essential to our success as the tools and technologies we rely on to do business.
Our objective is to attain a sustainable zero harm culture supported by leadership and owned by an engaged and highly skilled workforce, empowered with the capabilities and resources needed to assess, reduce, and eliminate workplace risks and hazards. In support of these objectives, we have developed an enhanced Safety Management System, initiated new safety communication methods and enhanced contractor safety processes.
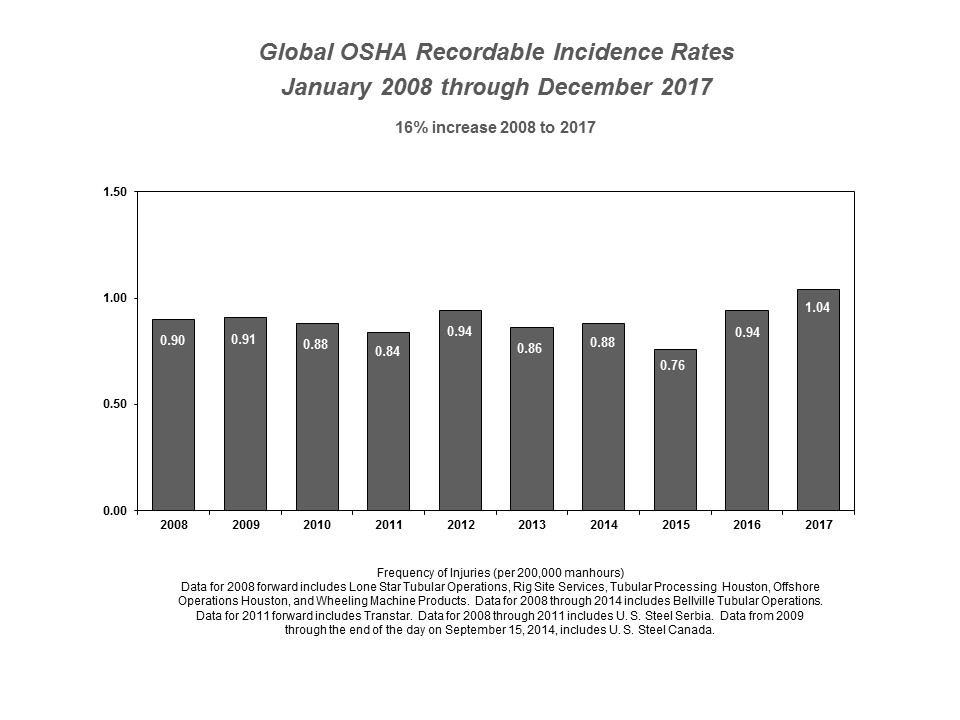
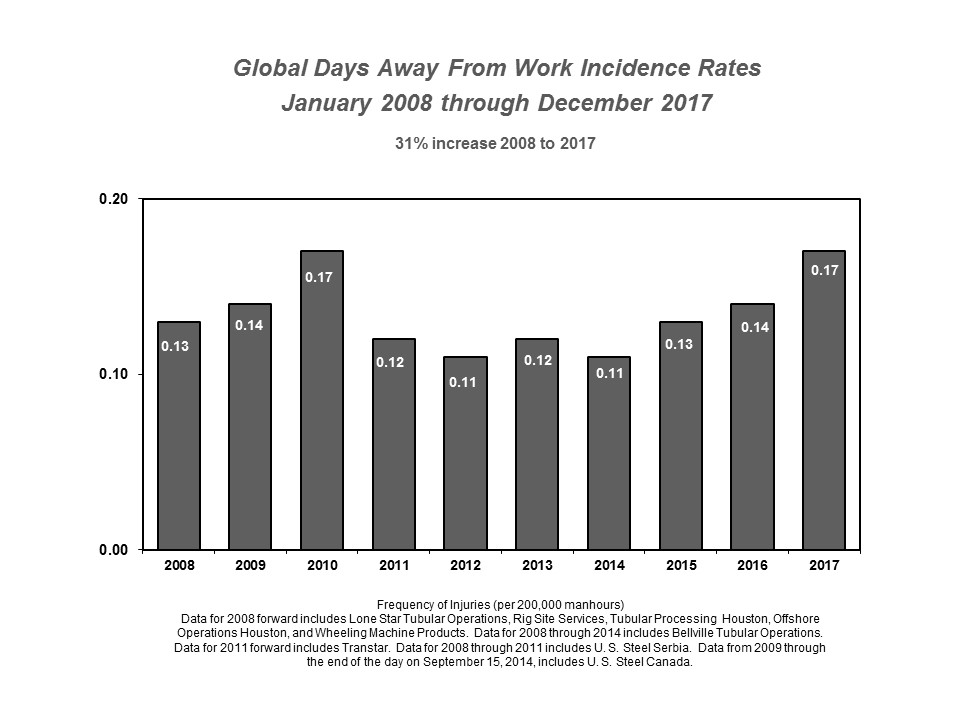
U. S. Steel finished 2017 with a Global Total OSHA Recordable Rate of 1.04, which is 60% better than the Bureau of Labor Statistics for Iron & Steel rate of 2.60 and 32% better than American Iron and Steel Institute rate of 1.54. U. S. Steel finished 2017 with a Days Away From Work Rate of 0.17, which is 76% b etter than the Bureau of Labor Statistics for Iron & Steel rate of 0.70 and 43% b etter than American Iron and Steel Institute rate of 0.30. Additionally, when comparing our most severe injuries - cases involving 31 or more days away from work - U. S. Steel performs at a level almost 7 times better than the Bureau of Labor Statistics for Iron and Steel.
In 2017 we experienced one d omestic employee fatality and three co ntract or fatalities (one in th e United States a nd two in Europe). These tragic events serve as a reminder that we must remain vigilant in our safety efforts to ensure every employee and contractor returns home safely every day.
Through 2017, the 13 year performan ce for our key safety measures: Total Recordable Incidence and Days Away From Work rates show improvement of 34% and 51% re spectively, as shown on the following graphs.
24
Table of Contents
25
Table of Contents
26
Table of Contents
Environmental Stewardship
U. S. Steel is committed to effective environmental stewardship. We have implemented and continue to develop business practices that are environmentally effective. We believe part of being a good corporate citizen requires a dedicated focus on how our industry affects the environment. U. S. Steel's environmental expenditures totaled $255 million in 2017, $232 million in 2016 and $354 million in 2015. For further information, see "Item 7. Management's Discussion and Analysis of Financial Condition and Results of Operations – Environmental Matters." We have taken the actions described below in furtherance of that goal.
U. S. Steel, largely through the American Iron and Steel Institute (AISI), World Steel Association and the European Confederation of Iron and Steel Industries (Eurofer), is involved in the promotion of cost effective environmental strategies through the development of appropriate air, water, waste and climate change laws and regulations at the local, state, national and international levels.
We are committed to reducing emissions as well as our carbon footprint. We have investigated, created and implemented innovative, best practice solutions throughout U. S. Steel to manage and reduce energy consumption. We are also committed to investing in technologies to further improve the environmental performance of our steelmaking process. In addition, we continue to focus on implementing energy reduction strategies, use of efficient energy sources, waste reduction management and the utilization of by-product fuels.
According to the AISI, relative to competing materials, steel has approximately one-fifth the carbon footprint of aluminum, one-twelfth the footprint of magnesium, and one-ninth the footprint of carbon fiber composites. Our advanced high strength steel (AHSS) used in today's vehicles afford significant light-weighting opportunities that assist the automobile industry in meeting ever-increasing fuel economy standards while enhancing a vehicle's safety and engine performance. When comparing steel to aluminum, in terms of sustainability, steel has a smaller carbon footprint and costs less.
In 2017 alone, U. S. Steel recycled 2.9 million tons of purchased and produced steel scrap. Because of steel's physical properties, our products can be recycled at the end of their useful life without loss of quality, contributing to steel's high recycling rate and affordability. Comparatively, due to limitations in aluminum processing, very little recycled aluminum is included in aluminum sheet goods used for automotive or aircraft applications. This means that any increased use of aluminum sheet for high-end applications must come from Greenhouse Gas (GHG) intensive primary aluminum, which generates significantly more GHG emissions than steel.
U. S. Steel also completed a project to utilize biomass from Clairton Works biological wastewater treatment facility to "seed" other biological wastewater treatment facilities in Pennsylvania, Indiana, and Illinois in 2017. This helps these facilities recover from treatment facility upsets, thereby reducing the amount of pollutants released during the upsets.
In December 2017, U. S. Steel enhanced our website disclosures of GHG emission and energy efficiency projects.
Many of our major production facilities have Environmental Management Systems that are certified to the ISO 14001 Standard. This standard, published by the International Organization for Standardization (ISO), provides the framework for the measurement and improvement of environmental impacts of the certified facility.
Commercial Strategy
Our commercial strategy is focused on providing customer focused solutions with value-added steel products, including maintaining AHSS leadership with GEN3 steels and coated sheets for the automotive and appliance industries, electrical steel sheets for the manufacture of motors and electrical equipment, galvanized and Galvalume ® sheets for construction, hot rolled skelp used in the production of energy transmitting line pipe, tin mill products for the packaging industry and pipe, connections, accessories and rig site services for use in drilling for oil and gas.
We are responsive to our customers' changing needs by developing new steel products and uses for steel that meet the evolving market and regulatory demands imposed on them. In connection with this commitment, we have research centers in Pittsburgh, Pennsylvania, and Košice, Slovakia, an automotive center in Troy, Michigan and a Research and Development Laboratory and Test Facility for Tubular products in Houston, Texas. The focus of these centers is to develop new products and to collaborate with our customers to better provide innovative solutions to serve their needs. Examples of our customer focused product innovation include the development of the first commercially available coated AHSS and GEN3 steels and embedding application engineers at original equipment manufacturers to demonstrate how to best utilize the material in body design to meet automobile passenger safety requirements while significantly reducing weight to meet future vehicle fuel efficiency standards; and a line of premium and semi-premium
27
Table of Contents
tubular connections designed for our customers operating in challenging drilling environments. These connections optimize performance and provide outstanding sealing capabilities for onshore and offshore oil and gas drilling. Engineered, designed, tested and commercialized in 2015, the USS-LIBERTY TC™ premium connection is used by our customers focused on horizontal drilling. Since its introduction, more than 1.5 million feet has been shipped to customers operating in every major shale play in North America. Another successful premium connection, USS-EAGLE SFH™ was introduced in 2017 for customers drilling deep, high-pressure horizontal onshore natural gas and oil wells in North America. Please refer to Item I. Business Strategy for further details of our commercial entities and related strategies.
Workforce
At U. S. Steel, we are committed to attracting, developing, and retaining a workforce of talented and diverse people - all working together to deliver superior results for our Company, stockholders, customers and communities. We regularly review our human capital needs and focus on the selection, development and retention of employees in order to sustain and enhance our competitive position in the markets we serve.
Capital Structure and Liquidity
Our primary financial goal is to enhance stockholder value by focusing on our capital structure, liquidity, and financial flexibility by deploying cash strategically as we earn the right to grow. Our cash deployment strategy is aligned to our strategic priorities, and includes; revitalizing our capital, both human and equipment; strengthening our balance sheet; maintaining a healthy pension plan; and delivering sustainable growth with a focus on safety, quality, delivery and cost.
Our liquidity supports our ability to satisfy short-term obligations, fund working capital requirements, and provides a foundation to execute key strategic initiatives such as our asset revitalization program.
We are focused on strengthening our balance sheet and credit ratings, and may proactively manage our company's debt maturity profile from time to time to protect our capital structure from unforeseen external events and re-financing risks.
In 2017, we undertook several steps to support these goals. The Company issued $750 million of 6.875% Senior Notes due August 15, 2025 and received net proceeds of approximately $737 million, which was used together with cash on hand to repay certain of the Company's outstanding debt obligations. U. S. Steel completed a redemption of all the aggregate principal amount of its $70 million Lorain County Port Authority Recovery Zone Facility Revenue Bonds, and an optional redemption of $161 million of its 7.00% Senior Notes due 2018, $200 million of its 6.875% Senior Notes due 2021, and $400 million of its 7.50% Senior Notes due 2022. Additionally, the Company completed an optional partial redemption of $200 million in aggregate principle amount of its 8.375% Senior Secured Notes due 2021.
In November 2017 we made a voluntary contribution of $75 million to U. S. Steel's main defined benefit pension plan as part of our long term pension liability management strategy.
During 2017, U. S. Steel reduced debt by $328 million and extended the maturities of long-term debt as a result of actions noted above. We ended 2017 with $1.533 billion of cash and cash equivalents on hand and total liquidity of approximately $3.350 billion.
Steel Industry Background and Competition
The global steel industry is cyclical, highly competitive and has historically been characterized by overcapacity.
U. S. Steel's competitive position may be affected by, among other things, differences among U. S. Steel's and its competitors' cost structure, labor costs, environmental remediation and compliance costs, global capacity and the existence and magnitude of government subsidies.
U. S. Steel competes with many North American and international steel producers. Competitors include integrated producers, which, like U. S. Steel, use iron ore and coke as the primary raw materials for steel production, as well as electric arc furnace (EAF) producers, which primarily use steel scrap and other iron-bearing feedstocks as raw materials. Global steel capacity has continued to increase, with some published sources estimating that steel capacity in China alone is over one billion metric tons per year. In addition, other materials, such as aluminum, plastics and composites, compete with steel in several applications.
28
Table of Contents
EAF producers typically require lower capital expenditures for construction of facilities and may have lower total employment costs; however, these competitive advantages may be minimized or eliminated by the cost of scrap when scrap prices are high. During 2017, certain public scrap prices in certain publications averaged more than 50% higher than 2016. Some mini-mills utilize thin slab casting technology to produce flat-rolled products and are increasingly able to compete directly with integrated producers in many flat-rolled product applications previously produced only by integrated steelmakers.
U. S. Steel provides defined benefit pension and/or other post-employment benefits to approximately 95,000 current employees, retirees and their beneficiaries. Many of our competitors do not have comparable retiree obligations. Participation in U. S. Steel's main defined benefit pension plan was closed to new entrants on July 1, 2003 and benefit accruals for all non-represented participants were frozen effective December 31, 2015. With amendments effective June 30, 2014, retiree medical and life insurance benefits for non-represented employees were eliminated for those who retire after December 31,2017. The United Steelworkers (USW) ratified successor three year Collective Bargaining Agreements with U. S. Steel and its U. S. Steel Tubular Products, Inc. subsidiary (the 2015 Labor Agreements) on February 1, 2016, which were effective as of September 1, 2015 and expire on September 1, 2018. These 2015 Labor Agreements provided for the closure of other post-employment benefits (OPEB) plans to represented employees hired or rehired under certain conditions on or after January 1, 2016.
We believe that our major North American and many European integrated steel competitors are confronted with substantially similar environmental regulatory conditions and therefore do not believe that our relative position with regard to such competitors will be materially affected by the impact of environmental laws and regulations. However, if future regulations do not recognize the fact that the integrated steel process involves a series of chemical reactions involving carbon that create carbon dioxide (CO 2 ) emissions without linking these emissions to steel scrap as well, our competitive position relative to mini-mills will be adversely impacted. Our competitive position compared to producers in developing nations such as China, Russia, Ukraine, Turkey, Brazil and India, will be harmed unless such nations require commensurate reductions in CO 2 emissions. Competing materials such as plastics may not be similarly impacted. The specific impact on each competitor will vary depending on a number of factors, including the age and location of its operating facilities and its production methods. U. S. Steel is also responsible for remediation costs related to former and present operating locations and disposal of environmentally sensitive materials. Many of our competitors, including North American producers, or their successors, that have been the subject of bankruptcy relief have no or substantially lower liabilities for such environmental remediation matters.
International Trade
U. S. Steel continues to face competition from foreign steel producers, many of which are heavily subsidized by their governments and dump steel into the United States (U.S.) market. Trade-distorting policies and practices, coupled with global steel overcapacity, impact pricing in the U.S. market and influence the Company's ability to compete on a level playing field. U. S. Steel continues to lead the industry in efforts to address dumped and subsidized steel imports that injure the Company, our workers, and our country's national and economic security.
U. S. Steel continues to be actively engaged in relevant administrative reviews and five-year reviews (Sunset Review) of antidumping (AD) and countervailing duty (CVD) orders before the U.S. International Trade Commission (USITC) and the U.S. Department of Commerce (DOC), including the following:
• | On January 30, 2018, the USITC voted to continue the AD order on seamless carbon and alloy steel standard, line, and pressure pipe (SSLPP) from Germany for another five years in the fourth Sunset Review of the 1995 AD order. U. S. Steel actively participated in that Sunset Review. As a result of the USITC's determination, Mannesmannrohren-Werke AG will continue to be subject to 20.08% AD duties and all other companies will continue to be subject to 57.72% AD duties on SSLPP imports from Germany. |
• | On October 2, 2017, the DOC issued preliminary results in the second administrative review of the AD order on oil country tubular goods (OCTG) from Korea for the period September 2015 through August 2016. In its preliminary results, the DOC calculated the dumping margins of 46.37% for Nexteel Co., Ltd., 6.66% for SeAH Steel Corporation and 19.58% for non-examined companies. U. S. Steel is participating in the administrative review, which is currently in the briefing stage. The final results are due on April 11, 2018. |
• | On May 1, 2017, the DOC automatically initiated a Sunset Review of the AD order on tin mill products from Japan. The DOC concluded that revocation of the order would lead to margins of up to 95.29%. The USITC concurrently published its notice of institution of the Sunset Review which covers the same order and decided |
29
Table of Contents
to conduct a full Sunset Review and vote on continuation of the order in April 2018. U. S. Steel is participating in the Sunset Review and, if successful, the order will remain in effect for another five years.
On December 5, 2017, in response to circumvention petitions filed by U.S. Steel and other domestic steel producers in September 2016, the DOC preliminarily found that imports of cold-rolled and galvanized steel made from Chinese substrate are covered by the AD/CVD orders on such imports from China. As a result of the preliminary determination, U.S. imports of cold-rolled steel from Vietnam made from Chinese hot-rolled steel are subject to 522.23% cash deposit requirements and U.S. imports of galvanized steel from Vietnam made from Chinese hot- or cold-rolled steel are subject to 238.48% cash deposit requirements, both retroactive to November 4, 2016. The DOC's final circumvention determinations are expected in the second quarter of 2018.
U. S. Steel is also actively involved in several appeals before the U.S. Court of International Trade and U.S. Court of Appeals for the Federal Circuit concerning the AD/CVD orders imposed in 2016 on flat-rolled steel cases as well as several OCTG cases.
In April 2016, U. S. Steel launched a case under Section 337 of the Tariff Act of 1930 against several Chinese producers and their distributors. All but seven of the producers did not respond and are considered to be in default. The complaint alleged three causes of action: 1) illegal conspiracy to fix prices and control output and export volumes; 2) the theft of trade secrets through industrial espionage; and 3) circumvention of duties by false labeling of the steel's origin and transshipment (FDO). On May 26, 2016, the USITC instituted an investigation on all three causes of action. On February 15, 2017, U. S. Steel voluntarily withdrew the trade secrets claim preserving its right to resurrect the claim when additional information becomes available. On October 2, 2017, the Administrative Law Judge (ALJ) assigned to the case terminated the FDO claim. The Company has elected not to pursue an appeal leaving the price fixing claim as the remaining claim. That claim is pending before the USITC. The remedy sought by U. S. Steel in that claim is the barring of all Chinese carbon and alloy steel from the U.S. market.
On December 12, 2016, China filed a complaint at the World Trade Organization (WTO) against the U.S. and the European Union (EU) alleging that the U.S. and EU are violating their treaty obligations by continuing to use the non-market economy (NME) methodology for price comparisons in antidumping duty investigations and reviews. On April 3, 2017, the DOC issued a notice requesting comments and information on whether China should continue to be treated as a NME country under U.S. antidumping laws. U. S. Steel and other domestic producers submitted comments to the DOC on May 10, 2017. On October 26, 2017, the DOC issued a memorandum concluding that it will continue to use the NME methodology for antidumping proceedings involving imports from China because the state continues to fundamentally distort China's economy. China then requested additional consultations with the U.S. regarding its WTO complaint. The outcome of these WTO disputes may impact U.S. dumping orders on Chinese goods, including many steel products.
On April 19, 2017, the DOC initiated an investigation under Section 232 of the Trade Expansion Act of 1962 to determine the effects of steel imports on U.S. national security. On May 24, 2017, U. S. Steel testified at the DOC public hearing and remains active in the investigation. On January 11, 2018, the DOC submitted its investigation report to the President, who under the statute has until April 11, 2018 to announce any action based on the DOC findings.
U. S. Steel continually assesses the impact of imports and global excess capacity on our business, and continues to execute a broad, global strategy to enhance the means and manner in which it competes in the U.S. market and internationally.
Facilities and Locations as of December 31, 2017
30
Table of Contents
Flat-Rolled
During 2017, U. S. Steel continued to review and adjust its operating levels at several of its Flat-Rolled operations. Customer order rates will determine the size and duration of any adjustments that we make at our Flat-Rolled operations during 2018.
The operating results of all facilities within U. S. Steel's integrated steel plants in the U.S. are included in Flat-Rolled. These facilities include Gary Works, Great Lakes Works, Mon Valley Works and Granite City Works. The operating results of U. S. Steel's coke and iron ore pellet operations and many equity investees in North America are also included in Flat-Rolled.
Gary Works, located in Gary, Indiana, has annual raw steel production capability of 7.5 million tons. Gary Works has four blast furnaces, six steelmaking vessels, a vacuum degassing unit and four slab casters. Finishing facilities include a hot strip mill, two pickling lines, two cold reduction mills, three temper mills, a double cold reduction line, four annealing facilities and two tin coating lines. Principal products include hot-rolled, cold-rolled and coated sheets and tin mill products. Gary Works also produces strip mill plate in coil.
The Midwest Plant, located in Portage, Indiana, processes hot-rolled and cold-rolled bands and produces tin mill products, hot dip galvanized, cold-rolled and electrical lamination sheets. Midwest facilities include a currently idle pickling line, two cold reduction mills, two temper mills, a double cold reduction mill, two annealing facilities, two hot dip galvanizing lines, a tin coating line and a tin-free steel line.
East Chicago Tin is located in East Chicago, Indiana and produces tin mill products. Facilities include a pickling line, a cold reduction mill, two annealing facilities, a temper mill, a tin coating line and a tin-free steel line.
Great Lakes Works, located in Ecorse and River Rouge, Michigan, has annual raw steel production capability of 3.8 million tons. Great Lakes facilities include three blast furnaces, two steelmaking vessels, a vacuum degassing unit, two slab casters, a hot strip mill, a pickling line, a tandem cold reduction mill, three annealing facilities, a temper mill, a recoil and inspection line, two electrolytic galvanizing lines (one being the former Double Eagle Steel Coating Company's (DESCO) line) and a hot dip galvanizing line. Principal products include hot-rolled, cold-rolled and coated sheets.
Mon Valley Works consists of the Edgar Thomson Plant, located in Braddock, Pennsylvania; the Irvin Plant, located in West Mifflin, Pennsylvania; the Fairless Plant, located in Fairless Hills, Pennsylvania; and the Clairton Plant, located in Clairton, Pennsylvania. Mon Valley Works has annual raw steel production capability of 2.9 million tons. Facilities at the Edgar Thomson Plant include two blast furnaces, two steelmaking vessels, a vacuum degassing unit and a slab caster. Irvin Plant facilities include a hot strip mill, two pickling lines, a cold reduction mill, three annealing facilities, a temper mill and two hot dip galvanizing lines. The Fairless Plant operates a hot dip galvanizing line. Principal products from Mon Valley Works include hot-rolled, cold-rolled and coated sheets, as well as coke and coke by-products produced at the Clairton Plant.
The Clairton Plant is comprised of ten coke batteries with an annual coke production capacity of 4.3 million tons. Almost all of the coke we produce is consumed by U. S. Steel facilities, or swapped with other domestic steel producers. Coke by-products are sold to the chemicals and raw materials industries.
Granite City Works, located in Granite City, Illinois, has annual raw steel production capability of 2.8 million tons. Granite City's facilities includes two blast furnaces, two steelmaking vessels, two slab casters, a hot strip mill, a pickling line, a tandem cold reduction mill, a hot dip galvanizing line and a hot dip galvanizing/Galvalume ® line. Principal products include hot-rolled and coated sheets. Gateway Energy and Coke Company LLC (Gateway) constructed a coke plant, which began operating in October 2009 to supply Granite City Works under a 15-year agreement with Suncoke.
U. S. Steel owns and operates a cogeneration facility that utilizes by-products from the Gateway coke plant to generate heat and power. During December 2015, the Granite City Works steelmaking operations and hot strip mill were temporarily idled. In the first quarter 2017, the hot strip mill restarted operations.
Subsequent to the permanent shutdown of the steelmaking operations in August 2015, Fairfield Works, located in Fairfield, Alabama, consists of the #5 coating line.
U. S. Steel owns a Research and Technology Center located in Munhall, Pennsylvania (near Pittsburgh) where we carry out a wide range of applied research, development and technical support functions.
31
Table of Contents
U. S. Steel also owns an automotive technical center in Troy, Michigan. This facility brings automotive sales, service, distribution and logistics services, product technology and applications research into one location. Much of U. S. Steel's work in developing new grades of steel to meet the demands of automakers for high-strength, light-weight and formable materials is carried out at this location.
U. S. Steel has iron ore pellet operations located at Mt. Iron (Minntac) and Keewatin (Keetac), Minnesota with annual iron ore pellet production capability of 22.4 million tons. During 2017, 2016 and 2015, these operations produced 21.1 million, 15.0 million and 15.5 million tons of iron ore pellets, respectively.
Joint Ventures Within Flat-Rolled
U. S. Steel participates in a number of joint ventures that are included in Flat-Rolled, most of which are conducted through subsidiaries. All of these joint ventures are accounted for under the equity method. The significant joint ventures and other investments are described below. For information regarding joint ventures and other investments, see Note 11 to the Consolidated Financial Statements.
U. S. Steel has a 14.7 percent ownership interest in Hibbing Taconite Company (Hibbing), which is based in Hibbing, Minnesota. Hibbing's rated annual production capability is 9.1 million tons of iron ore pellets, of which our share is about 1.3 million tons.
U. S. Steel and POSCO of South Korea participate in a 50-50 joint venture, USS-POSCO Industries (UPI), located in Pittsburg, California. The joint venture markets sheet and tin mill products, principally in the western United States. UPI produces cold-rolled sheets, galvanized sheets, tin plate and tin-free steel from hot bands principally provided by POSCO and U. S. Steel. UPI's annual production capability is approximately 1.5 million tons.
U. S. Steel and Kobe Steel, Ltd. of Japan participate in a 50-50 joint venture, PRO-TEC Coating Company
(PRO-TEC). PRO-TEC owns and operates two hot dip galvanizing lines and a continuous annealing line (CAL) in Leipsic, Ohio, which primarily serve the automotive industry. PRO-TEC's annual production capability is approximately 1.5 million tons. U. S. Steel's domestic production facilities supply PRO-TEC with cold-rolled sheets and U. S. Steel markets all of PRO-TEC's products. The CAL produces high strength, lightweight steels that are an integral component in automotive manufacturing as vehicle emission and safety requirements become increasingly stringent. On September 25, 2017, U. S. Steel and Kobe Steel, Ltd. announced their agreement to begin construction of a new continuous galvanizing line (CGL) at PRO-TEC, in response to increased demand for advanced high-strength steels (AHSS). The new CGL, an investment of approximately $400 million financed by the joint venture, will have a yearly capacity of 500,000 tons. This line, which will utilize a proprietary process, will be capable of coating steel that will help automakers manufacture economically lightweight vehicles to meet increasing fuel efficiency requirements while maintaining exceptionally high safety standards. Construction began in the fourth quarter of 2017 and the line is expected to commence startup in 2019.
U. S. Steel and ArcelorMittal participate in the Double G Coatings Company, L.P. a 50-50 joint venture (Double G), which operates a hot dip galvanizing and Galvalume ® facility located near Jackson, Mississippi and primarily serves the construction industry. Double G processes steel supplied by each partner and each partner markets the steel it has processed by Double G. Double G's annual production capability is approximately 315,000 tons.
U. S. Steel and Worthington Industries, Inc. participate in Worthington Specialty Processing (Worthington), a joint venture with locations in Jackson, Canton, and Taylor, Michigan, in which U. S. Steel has a 49 percent interest. Worthington slits, cuts to length, and presses blanks from steel coils to desired specifications. Worthington's annual production capability is approximately 890,000 tons.
Chrome Deposit Corporation (CDC), a 50-50 joint venture between U. S. Steel and Court Holdings, reconditions finishing work rolls, which require grinding, chrome plating and/or texturing. The rolls are used on rolling mills to provide superior finishes on steel sheets. CDC has seven locations across the United States, with all locations near major steel plants.
U. S. Steel holds a 49 percent interest in Feralloy Processing Company (FPC), a joint venture between U. S. Steel and Feralloy Corporation, which converts coiled hot strip mill plate into sheared and flattened plates. The plant, located in Portage, Indiana, has annual production capability of approximately 275,000 tons.
U. S. Steel and Feralloy Corporation, participate in a joint venture, Acero Prime, S. de R.L. de C.V. (Acero Prime). U. S. Steel has a 40 percent interest. Acero Prime has facilities in San Luis Potosi, Ramos Arizpe, Monterrey, and
32
Table of Contents
Toluca, Mexico. Acero Prime provides slitting, warehousing and logistical services. Acero Prime's annual slitting capability is approximately 486,000 tons.
USSE
USSE operates an integrated facility in Košice, Slovakia, which has annual raw steel production capability of 5.0 million tons. This facility has two coke batteries, four sintering strands, three blast furnaces, four steelmaking vessels, a vacuum degassing unit, two dual strand casters, a hot strip mill, two pickling lines, two cold reduction mills, four annealing facilities, a temper mill, a temper/double cold reduction mill, three hot dip galvanizing lines, two tin coating lines, three dynamo lines, a color coating line and two spiral welded pipe mills. USSE also has multiple slitting, cutting and other finishing lines for flat products. Principal products include hot-rolled, cold-rolled and coated sheets, tin mill products and spiral welded pipe. USSE also has facilities for manufacturing heating radiators, refractory ceramic materials and has a power plant for internal steam and electricity generation.
In addition, USSE has a research laboratory, which, in conjunction with our Research and Technology Center, supports efforts in coke making, electrical steels, design and instrumentation, and ecology.
Tubular
Tubular manufactures seamless and welded OCTG, standard pipe, line pipe and mechanical tubing.
Seamless products are produced at Fairfield Tubular Operations in Fairfield, Alabama and Lorain Tubular Operations located in Lorain, Ohio. The Fairfield Tubular Operations has annual production capability of 720,000 tons and has historically been supplied with steel rounds from Flat-Rolled's former Fairfield Works. Subsequent to the shutdown of the hot end at the Fairfield Works in August 2015, the facility is currently purchasing rounds from third parties. At the appropriate time, with continued tubular market improvement, construction of the EAF should be completed and when it is it will be part of the Tubular segment and the Flat-rolled segment will not be supplying Fairfield Tubular Operations with rounds. The Fairfield Tubular Operations has the capability to produce outer diameter (O.D.) sizes from 4.5 to 9.875 inches and has quench and temper, hydrotester, threading and coupling and inspection capabilities. The slab and rounds casters of the former Fairfield Works remain capable of operation and are now part of the Fairfield Tubular Operations. The Lorain plant consists of the #3 facility and has historically consumed steel rounds supplied by Fairfield Works and external sources. Subsequent to the shutdown of the hot end at the Fairfield Works, the Company is sourcing rounds from third parties. Lorain #3 facility has the capability to produce 300,000 tons annually in O.D. sizes from 10.125 to 26 inches and has quench and temper, hydrotester, cutoff and inspection capabilities. In March 2017, U. S. Steel made a strategic decision to permanently shutdown the Lorain No. 6 Quench & Temper Mill and relocate the equipment.
Welded products are produced at Lone Star Tubular Operations #2 facility in Lone Star, Texas and it has the capability to produce O.D. sizes from 1.088 to 7.15 inches. It has quench and temper, hydrotester, threading and coupling and inspection capabilities. The Lone Star #2 facility was temporarily idled from April 2016 to April 2017 and has annual production capability of 300,000 tons.
Wheeling Machine Products manufactures couplings used to connect individual sections of oilfield casing and tubing. It produces sizes ranging from 2.375 to 20 inches at two locations: Pine Bluff, Arkansas, and Hughes Springs, Texas.
Tubular Processing, located in Houston, Texas, provides quench and temper and end-finishing services for oilfield production tubing. Offshore Operations, also located in Houston, Texas, provides threading, inspection, accessories and storage services to the OCTG market. Tubular Processing has been temporarily idled since 2015.
We have a Research and Development Laboratory and Test Facility in Houston, Texas where our engineers develop and test new steel products, including premium connections.
Joint Ventures Within Tubular
U. S. Steel and Butch Gilliam Enterprises LLC participate in a 50-50 joint venture, Patriot Premium Threading Services, LLC located in Midland, Texas, which provides oil country threading, accessory threading , repair services and rig site services to exploration and production companies located principally in the Permian Basin. For information regarding joint ventures and other investments, see Note 11 to the Consolidated Financial Statements.
33
Table of Contents
Other Businesses
U. S. Steel's Other Businesses include railroad services and real estate operations.
U. S. Steel owns the Gary Railway Company in Indiana, Lake Terminal Railroad Company and Lorain Northern Company in Ohio, Union Railroad Company, LLC in Pennsylvania, Fairfield Southern Company, Inc. in Alabama, Delray Connecting Railroad Company in Michigan and Texas & Northern Railroad Company in Texas, these entities comprise U. S. Steel's transportation business.
U. S. Steel owns, develops and manages various real estate assets, which include approximately 50,000 acres of surface rights primarily in Alabama and Michigan, with additional holdings in Pennsylvania and Illinois. In addition, U. S. Steel holds ownership interests in joint ventures that are developing real estate projects in Alabama.
Raw Materials and Energy
As an integrated producer, U. S. Steel's primary raw materials are iron units in the form of iron ore pellets and sinter ore, carbon units in the form of coal and coke (which is produced from coking coal) and steel scrap. U. S. Steel's raw materials supply strategy consists of acquiring and expanding captive sources of certain primary raw materials and entering into flexible supply contracts for certain other raw materials at competitive market prices which are subject to fluctuations based on market conditions at the time.
The amounts of such raw materials needed to produce a ton of steel will fluctuate based upon the specifications of the final steel products, the quality of raw materials and, to a lesser extent, differences among steel producing equipment. In broad terms, U. S. Steel consumes approximately 1.4 tons of coal to produce one ton of coke and then it consumes approximately 0.3 tons of coke, 0.3 tons of steel scrap (40 percent of which is internally generated) and 1.3 tons of iron ore pellets to produce one ton of raw steel. At normal operating levels, we also consume approximately 6 mmbtu's of natural gas per ton produced. While we believe that these estimated consumption amounts are useful for planning purposes, and are presented to give a general sense of raw material and energy consumption related to steel production, substantial variations may occur.
Iron Ore
Iron Ore Production (a)
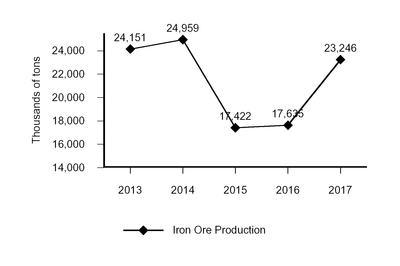
(a) Includes our share of production from Hibbing through December 31, 2017 and Tilden to September 29, 2017. U. S. Steel's ownership interest in Tilden was sold on September 29, 2017. The decrease in iron ore production from 2014 is primarily related to the idling of our Keetac facility. In 2017, the Keetac facility restarted production.
The iron ore facilities at Minntac and Keetac contain an estimated 860 million short tons of recoverable reserves and our share of recoverable reserves at the Hibbing joint ventures is 8 million short tons. Recoverable reserves are defined as the tons of product that can be used internally or delivered to a customer after considering mining and beneficiation or preparation losses. Minntac and Keetac's annual capability and our share of annual capability for the Hibbing joint
34
Table of Contents
venture total approximately 23 million tons. Through our wholly owned operations and our share of joint ventures, we have iron ore pellet production capability that exceeds our steelmaking capability in the U.S.
We sold iron ore pellets in 2017, 2016 and 2015 to third parties. The Company has agreements to supply iron ore pellets to third-party customers over the next several years.
Substantially all of USSE's iron ore requirements are purchased from outside sources, primarily Russian and Ukrainian mining companies. However, in prior years, USSE also received iron ore from U. S. Steel's iron ore facilities in North America. We believe that supplies of iron ore adequate to meet USSE's needs are available at competitive market prices.
Coking Coal
All of U. S. Steel's coal requirements for our cokemaking facilities are purchased from outside sources. Pricing for Flat-Rolled's coking coal contracts are typically negotiated on a yearly basis, and from time to time we have entered into multi-year agreements for a portion of our coking coal requirements.
Prices for European contracts are negotiated at defined intervals, usually quarterly.
We believe that supplies of coking coal adequate to meet our needs are available from outside sources at competitive market prices. The main source of coking coal for Flat-Rolled is the United States, and sources for USSE include Poland, the Czech Republic, Russia, Ukraine, Mozambique and the United States.
Coke
Coke Production (a)
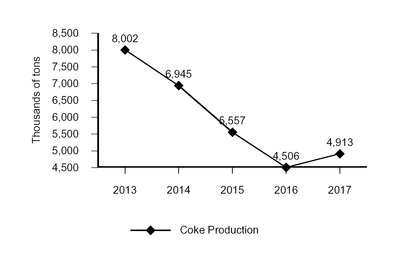
(a) The decrease in 2016 coke production from 2015 was due to decreased internal steel production and depletion of existing coke inventory. The decrease in 2015 coke production from 2014 is due to the permanent shutdown of coke operations at Gary Works and Granite City Works. The decrease in 2014 coke production from 2013 is primarily due to the deconsolidation of USSC and the permanent shut down of two coke batteries at Gary Works.
In North America, the Flat-Rolled segment operates a cokemaking facility at the Clairton Plant of Mon Valley Works. At our Granite City Works, we also have a 15-year coke supply agreement with Gateway which began in 2009. Blast furnace injection of coal, and self-generated coke oven gas is also used to reduce coke usage.
With Flat-Rolled's cokemaking facilities and the Gateway long-term supply agreement, it has the capability to be self-sufficient with respect to its annual coke requirements at normal operating levels. Coke is purchased from, sold to, or swapped with suppliers and other end-users to adjust for production needs and reduce transportation costs.
In Europe, the USSE segment operates cokemaking facilities at USSK. While USSE is self-sufficient for coke at normal operating levels, it periodically purchases coke from Polish and Czech coke producers to meet production needs. Volume and price are negotiated quarterly.
35
Table of Contents
Steel Scrap and Other Materials
We believe that supplies of steel scrap, alloys and coating materials adequate to meet our needs to support Flat-Rolled and USSE are readily available from outside sources at competitive market prices. Generally, approximately 40 percent of our steel scrap requirements are internally generated through normal operations.
Limestone
All of Flat-Rolled's and USSE's limestone requirements are purchased from outside sources. We believe that supplies of limestone adequate to meet our needs are readily available from outside sources at competitive market prices.
Zinc and Tin
We believe that supplies of zinc and tin required to fulfill the requirements for Flat-Rolled and USSE are available from outside sources at competitive market prices. The main sources of tin for Flat-Rolled include Bolivia and China. The main sources of zinc for Flat-Rolled include Canada and Mexico. During 2017, Flat-Rolled protected approximately 80% of its operation's zinc purchases with financial swap derivatives to manage our exposure to zinc price fluctuations. The main sources of tin for USSE include Indonesia, Peru and China. The main sources of zinc for USSE include Sweden, the Slovak Republic and Poland. During 2017, USSE executed approximately 40% of USSE's zinc purchases with forward physical contracts to partially manage our exposure to zinc price fluctuations.
Natural Gas
All of U. S. Steel's natural gas requirements are purchased from outside sources.
We believe that adequate supplies to meet Flat-Rolled's and Tubular's needs are available at competitive market prices. For 2017, approximately 70 percent of our natural gas purchases in Flat-Rolled were based on bids solicited on a monthly basis from various vendors; the remainder were made daily or with term agreements.
We believe that adequate natural gas supplies to meet USSE's needs are available at competitive market prices. During 2017, we routinely executed fixed-price forward physical purchase contract for natural gas to partially manage our exposure to natural gas price increases. For 2017, approximately 56 percent of our natural gas purchases in USSK were made with fixed-price forward physical purchase contracts; the remainder were based on bids solicited on a quarterly, monthly or a daily basis from various vendors.
Both Flat-Rolled and USSE use self-generated coke oven and blast furnace gas to reduce consumption of natural gas. USSE also captures and consumes converter gas from its four steelmaking vessels.
Industrial Gases
U. S. Steel purchases industrial gas in the U.S. under long-term contracts with various suppliers. USSE owns and operates its own industrial gas facilities, but also may purchase industrial gases from time to time.
Commercial Sales of Product
U. S. Steel characterizes sales as contract sales if sold pursuant to an agreement with a defined volume and pricing and a duration of longer than three months, and as spot if sold without a defined volume and pricing agreement. In 2017, approximately 79 percent, 64 percent and 53 percent of sales by Flat-Rolled, USSE and Tubular, respectively, were contract sales. Some contract pricing agreements include fixed prices while others are adjusted periodically based upon published prices of steel products or cost components.
Environmental Matters
Some of U. S. Steel's facilities were in operation before 1900. Although management believes that U. S. Steel's environmental practices have either led the industry or at least been consistent with prevailing industry practices, hazardous materials may have been released at current or former operating sites or delivered to sites operated by third parties.
Our U.S. facilities are subject to environmental laws applicable in the U.S., including the Clean Air Act (CAA), the Clean Water Act (CWA), the Resource Conservation and Recovery Act (RCRA) and the Comprehensive Environmental Response, Compensation and Liability Act (CERCLA), as well as state and local laws and regulations.
36
Table of Contents
U. S. Steel has incurred and will continue to incur substantial capital, operating, and maintenance and remediation expenditures as a result of environmental laws and regulations, related to release of hazardous materials, which in recent years have been mainly for process changes to meet CAA obligations and similar obligations in Europe.
Midwest Plant Incident
On April 11, 2017, there was a process waste water release at our Midwest Plant (Midwest) in Portage, Indiana that impacted a water outfall that discharges to Burns Waterway near Lake Michigan. U. S. Steel identified the source of the release and made the necessary repairs. We determined that all repairs were safely working as intended and, on April 14, 2017, resumed operations in a controlled, phased and highly monitored approach with extensive input from participating government agencies. The Company has since implemented substantial operational, process and notification improvements at Midwest. The Company has been presented with cost reimbursements, loss of use and penalty requests from the involved governmental agencies and intends to amicably resolve the matter with those agencies. Separately, the Company was placed on notice of potential citizens' enforcement suits regarding the April 2017 incident and other historical alleged Clean Water Act and Permit violations at Midwest. In January of 2018, The Surfrider Foundation and the City of Chicago initiated suits in the Northern District of Indiana alleging such violations. The Company intends to defend against those actions.
Slovak Operations
A Memorandum of Understanding (MOU) was signed in March 2013 between U. S. Steel and the government of Slovakia. The MOU outlines areas in which the government and U. S. Steel will work together to help create a more competitive environment and conditions for USSK. Incentives the government of Slovakia agreed to provide include potential participation in a renewable energy program that provides the opportunity to reduce electricity costs, as well as the potential for government grants and other support concerning investments in environmental control technology. Although there are many conditions and uncertainties regarding the grants, including matters controlled by the European Union (EU), the value of these incentives as stated in the MOU could be as much as €75 million (approximately $90 million). U. S. Steel also agreed to pay the government of Slovakia specified declining amounts should U. S. Steel sell USSK within five years of the date of the MOU. We expect the total amount of EU funds will be as much as €85 million (approximately $102 million). The final grant value will depend on public procurement results. The MOU is set to expire in March 2018.
Slovakia adopted a new waste code in March 2015 that became effective January 1, 2016. This legislation implements the EU Waste Framework Directive that strictly regulates waste disposal and encourages recycling, among other provisions, by increasing fees for waste disposed of in landfills, including privately owned landfills. The impact of this legislation is estimated to be €2 million (approximately $2 million) annually due to waste stabilization requirements and increased fees for packaging materials recycling fees. Slovakia is considering legislation implementing an EU Directive, which is expected to increase existing fees upon USSK for use of its landfills. Because the legislation has not yet been adopted, the impact on operations at USSK facilities cannot be estimated at this time.
The EU's Industry Emission Directive requires implementation of EU determined best available techniques (BAT) to reduce environmental impacts as well as compliance with BAT associated emission levels. This directive includes operational requirements for air emissions, wastewater discharges, solid waste disposal and energy conservation, dictates certain operating practices and imposes stricter emission limits. Producers were required to be in compliance with the iron and steel BAT by March 8, 2016, unless specific exceptions or extensions were granted by the Slovak environmental authority. USSK updated existing operating permits for different facilities involved in producing iron and steel in the plant in accordance with the new BAT requirements. Through this process for some facilities, USSK has obtained extensions from the 2016 compliance deadline in order to meet or exceed the BAT requirements. Compliance with stricter emission limits going beyond BAT requirements makes us eligible for EU funding support and prepares us for any further tightening of environmental protection standards. Our most recent broad estimate of likely capital expenditures for projects to comply with or go beyond the BAT requirements is €138 million (approximately $166 million) over the 2017 to 2020 time period.
The EU has various programs under which funds are allocated to member states to implement broad public policies which are then awarded by the member states to public and private entities on a competitive basis. The funding intensity under these programs currently ranges from 55 percent of defined eligible costs on a project under the standard state scheme to 90 percent on an approved ad hoc scheme to improve the air quality in the Košice region of Slovakia. Based on our list of projects that comprise the approximate €138 million (approximately $166 million) of spending
37
Table of Contents
noted, we currently believe we will be eligible to receive up to €85 million (approximately $102 million) of incentive grants. This could potentially reduce our net cash expenditures to approximately €53 million (approximately $64 million). The actual amount of capital spending will be dependent upon, among other things, the actual amount of incentive grants received.
We also believe there will be increased operating costs associated with these projects, such as increased energy and maintenance costs. We are currently unable to reliably estimate what the increase in operating costs will be as many projects are still in the development stage.
On March 28, 2017, the Regional Court in Košice issued an ex parte judicial lien on USSK's real property to plaintiffs in an ongoing legal case. Following a decision of the Supreme Court, which reversed and remanded the lien petition to the Regional Court, the lien has been removed. The case is still ongoing. We do not expect this matter to have an impact on the eligibility of USSK to obtain EU funding support for BAT projects.
For further discussion of laws applicable in Slovakia and the EU and their impact on USSK, see Note 25 to the Consolidated Financial Statements, "Contingencies and Commitments - Environmental Matters, EU Environmental Requirements."
New and Emerging Environmental Regulations
United States and European Greenhouse Gas Emissions Regulations
Future compliance with carbon dioxide (CO 2 ) emission requirements may include substantial costs for emission allowances, restriction of production and higher prices for coking coal, natural gas and electricity generated by carbon based systems. Because we cannot predict what requirements ultimately will be imposed in the U.S. and Europe, it is difficult to estimate the likely impact on U. S. Steel, but it could be substantial. On March 28, 2017, President Trump signed Executive Order 13783 instructing the Environmental Protection Agency (EPA) to review the Clean Power Plan. On October 16, 2017, the EPA proposed to repeal the Clean Power Plan after reviewing the plan pursuant to President Trump's executive order. Any repeal and/or replacement of the Clean Power Plan is likely to be challenged by various proponents of the plan, such as environmental groups and certain states. Any impacts to our operations as a result of any future greenhouse gas regulations are not estimable at this time since the matter is unsettled. In any case, to the extent expenditures associated with any greenhouse gas regulation, as with all costs, are not ultimately reflected in the prices of U. S. Steel's products and services, operating results will be reduced. There were no material changes in U. S. Steel's exposure to European Greenhouse Gas Emissions regulations since December 31, 2016.
United States - Air
The CAA imposes stringent limits on air emissions with a federally mandated operating permit program and civil and criminal enforcement sanctions. The CAA requires, among other things, the regulation of hazardous air pollutants through the development and promulgation of National Emission Standards for Hazardous Air Pollutants (NESHAP) and Maximum Achievable Control Technology (MACT) Standards. The EPA has developed various industry-specific MACT standards pursuant to this requirement. The CAA requires the EPA to promulgate regulations establishing emission standards for each category of Hazardous Air Pollutants. The EPA also must conduct risk assessments on each source category that is already subject to MACT standards and determine if additional standards are needed to reduce residual risks.
While our operations are subject to several different categories of NESHAP and MACT standards, the principal impact of these standards on U. S. Steel operations includes those that are specific to coke making, iron making, steel making and iron ore processing.
The EPA is currently in the process of completing a Residual Risk and Technology Review of the Integrated Iron and Steel regulations and Coke MACT regulations as required by the CAA. Because the EPA has not completed its review, any impacts related to the EPA's review of these standards cannot be estimated at this time.
The CAA also requires the EPA to develop and implement National Ambient Air Quality Standards (NAAQS) for criteria pollutants, which include, among others, particulate matter (PM) - consisting of PM 10 and PM 2.5 , lead, carbon monoxide, nitrogen dioxide, sulfur dioxide, and ozone. Sulfur dioxide is the NAAQS criteria pollutant of most concern to the Company at this time.
38
Table of Contents
In June 2010, the EPA significantly lowered the primary NAAQS for sulfur dioxide (SO 2 ) from 140 parts per billion (ppb) on a 24-hour basis to an hourly standard of 75 ppb. Subsequently, the EPA designated the areas in which Great Lakes Works and Mon Valley Works facilities are located as nonattainment with the 2010 standard for the SO 2 NAAQS. The non-attainment designation will require the facilities to implement operational and/or capital improvements to demonstrate attainment with the 2010 standard. In addition, the EPA is currently evaluating the attainment status for all other areas as required by a Consent Decree that the EPA entered with the Sierra Club and the Natural Resources Defense Council in March 2015 pursuant to a lawsuit filed by the non-governmental organizations. U. S. Steel is working with the relevant regulatory agencies in completing the evaluation process as required by the Consent Decree. While U. S. Steel has determined that it will face increased capital, operating and compliance costs, the operational and financial impact of the SO 2 NAAQS is not estimated to be material at this time.
In October 2015, the EPA lowered the NAAQS for ozone from 75 ppb to 70 ppb. The EPA has designated certain areas in which we operate as nonattainment with the 2008 ozone standard. In addition, some areas in which we operate have been recommended as nonattainment with the 2015 ozone standard by the respective states. The EPA has yet to act on the recommendations. In June 2017, the EPA had published a notice extending the deadline to promulgate initial designations by one year, extending the deadline from October 1, 2017 to October 1, 2018. However, in August 2017, the EPA withdrew the notice; and therefore, the designation deadline remained October 1, 2017. On November 16, 2017, the EPA published its initial designations for areas that the EPA is designating as attainment/unclassifiable. The rule lists most areas in which U. S. Steel operates as attainment/unclassifiable. The EPA has yet to publish a notice regarding areas that it is designating as nonattainment. Because nonattainment designations and any implementation plans to bring the ozone nonattainment areas into attainment have yet to be proposed or developed, the operational and financial impact of the ozone NAAQS cannot be reasonably estimated at this time.
On December 14, 2012, the EPA lowered the annual standard for PM 2.5 from 15 micrograms per cubic meter (ug/m3) to 12 ug/m3, and retained the PM 2.5 24-hour and PM 10 NAAQS rules. In December 2014, the EPA designated some areas in which U. S. Steel operates as nonattainment with the 2012 annual PM 2.5 standard. Because it is early in the State Implementation Plan development stages, any impacts to U. S. Steel cannot be reasonably estimated at this time.
In 2010, the EPA retained the annual nitrogen dioxide NAAQS standard, but created a new 1-hour NAAQS and established new data reduction and monitoring requirements. While the EPA has classified all areas as being in attainment or unclassifiable, it is requiring implementation of a network of monitoring stations to assess air quality. Until the network is implemented and further designations are made, the impact on operations at U. S. Steel facilities cannot be reasonably estimated at this time.
United States - CERCLA 108(b) Financial Assurance
In December 2016, the EPA published a proposed rule focused on developing financial assurance for managing hazardous substances in the hard rock, mining industry, in accordance with CERCLA Section 108(b). The EPA had a court-mandated deadline for publication of the final rule by December 1, 2017. The draft form of the proposed rule was commented upon by the public and the regulated community. Based on information provided by the comments, EPA decided that a new financial assurance rule was not necessary for the hard rock mining industry. EPA's decision may be challenged in court and a possible result of such a challenge may be a new proposed rule at some point in the future that could have a material impact on the Company's liquidity.
Environmental Remediation
In the United States, U. S. Steel has been identified as a potentially responsible party (PRP) at seven sites under CERCLA as of December 31, 2017. Of these, there are two sites where information requests have been received or there are other indications that U. S. Steel may be a PRP under CERCLA, but where sufficient information is not presently available to confirm the existence of liability or to make a reasonable estimate with respect to any potential liabilities. There are also 19 additional sites where U. S. Steel may be liable for remediation costs in excess of $100,000 under other environmental statutes, both federal and state, or where private parties are seeking to impose liability on U. S. Steel for remediation costs through discussions or litigation. At many of these sites, U. S. Steel is one of a number of parties involved and the total cost of remediation, as well as U. S. Steel's share, is frequently dependent upon the outcome of ongoing investigations and remedial studies. U. S. Steel accrues for environmental remediation activities when the responsibility to remediate is probable and the amount of associated costs is reasonably determinable. As environmental remediation matters proceed toward ultimate resolution or as remediation obligations arise, charges in excess of those previously accrued may be required.
39
Table of Contents
For further discussion of relevant environmental matters, see "Item 3. Legal Proceedings - Environmental Proceedings."
Property, Plant and Equipment Additions
For property, plant and equipment additions, including capital leases, see "Item 7. Management's Discussion and Analysis of Financial Condition and Results of Operations – Financial Condition, Cash Flows and Liquidity – Cash Flows" and Note 12 to the Consolidated Financial Statements.
Employees
As of December 31, 2017, U. S. Steel had approximately 17,200 employees in the U.S. and approximately 12,000 in Europe.
Most hourly employees of U. S. Steel's flat-rolled, tubular, cokemaking and iron ore pellet facilities in the United States are covered by the 2015 Labor Agreements. Our U.S. collective bargaining agreements contain no-strike provisions which are applicable during the term of the respective agreements.
In Europe, excluding U.S. expatriates, most employees at USSK are represented by the OZ KOVO union and all employees are covered by an agreement that expires at the end of March 2020.
A small number of workers at some of our North American facilities and at our transportation operations are covered by agreements with the USW or other unions that have varying expiration dates.
Available Information
U. S. Steel's Internet address is www.ussteel.com . We post our annual report on Form 10-K, our quarterly reports on Form 10-Q, our proxy statement and our interactive data files to our website as soon as reasonably practicable after such reports are filed with the Securities and Exchange Commission (SEC). We also post all press releases and earnings releases to our website.
All other filings with the SEC are available via a direct link on the U. S. Steel website to the SEC's website, www.sec.gov .
Also available on the U. S. Steel website are U. S. Steel's Corporate Governance Principles, Code of Ethical Business Conduct and the charters of the Audit Committee, the Compensation & Organization Committee and the Corporate Governance & Public Policy Committee of the Board of Directors. These documents and the Annual Report on Form 10-K and proxy statement are also available in print to any stockholder who requests them. Such requests should be sent to the Office of the Corporate Secretary, United States Steel Corporation, 600 Grant Street, Suite 1500, Pittsburgh, Pennsylvania 15219-2800 (telephone: 412-433-1121).
U. S. Steel does not incorporate into this document the contents of any website or the documents referred to in the immediately preceding paragraph.
Other Information
Information on net sales, depreciation, capital expenditures, earnings (loss) before interest and income taxes and assets by reportable segment and for Other Businesses and on net sales and assets by geographic area are set forth in Note 4 to the Consolidated Financial Statements.
For significant operating data for U. S. Steel for each of the last five years, see "Five-Year Operating Summary (Unaudited)" on pages F-59 and F-60.
40
Table of Contents
Item 1A. RISK FACTORS
Operational Risk Factors
Our reduced operational footprint, unplanned equipment outages and other unforeseen disruptions may adversely impact our results of operations.
Over the past three years, U. S. Steel has adjusted its operating configuration in response to challenging market conditions as a result of global overcapacity and unfair trade practices by indefinitely, permanently and temporarily idling production at certain facilities. Due to our reduced operational footprint, the Company may not be able to respond in an efficient manner when restarting certain of our temporarily idled facilities to fully realize the benefits from changing market conditions that are favorable to integrated steel producers.
Our steel production depends on the operation of critical structures and pieces of equipment, such as blast furnaces, casters, hot strip mills and various structures and operations that support them. While we are implementing asset revitalization and a reliability centered maintenance initiative focusing on proactive maintenance of key machinery and equipment at our production facilities, we may experience prolonged periods of reduced production and increased maintenance and repair costs due to equipment failures at our facilities or those of our key suppliers.
It is also possible that operations may be disrupted due to other unforeseen circumstances such as power outages, explosions, fires, floods, accidents and severe weather conditions. We are also exposed to similar risks involving major customers and suppliers such as force majeure events of raw materials suppliers that have occurred and may occur in the future. Availability of raw materials and delivery of products to customers could be affected by logistical disruptions, such as shortages of barges, ocean vessels, rail cars or trucks, or unavailability of rail lines or of locks on the Great Lakes or other bodies of water. To the extent that lost production could not be compensated for at unaffected facilities and depending on the length of the outage, our sales and our unit production costs could be adversely affected.
U. S. Steel continues to incur certain costs when production capacity is idled, increased costs to resume production at idled facilities, or costs to idle facilities.
Our decisions concerning which facilities to operate and at what levels are made based upon our customers' orders for products as well as the capabilities and cost performance of our locations. During periods of depressed market conditions, we may concentrate production operations at several plant locations and not operate others in response to customer demand, and as a result we will incur idle facility costs.
When we restart idled facilities, we incur certain costs to replenish raw material inventories, prepare the previously idled facilities for operation, perform the required repair and maintenance activities and prepare employees to return to work safely and resume production responsibilities. The amount of any such costs can be material, depending on a variety of factors, such as the period of time during which the facilities remained idle, necessary repairs and available employees, and is difficult to project.
U. S. Steel has been and continues to be adversely affected by worldwide overcapacity and high levels of imports, which may negatively affect steel prices and demand levels, reducing profitability.
An increase in global capacity and new or expanded production capacity in the United States, China and other countries in recent years has resulted in capacity significantly in excess of global demand, as well as in the Company's primary markets in North America and Europe.
Worldwide overcapacity continues to result in high levels of dumped and subsidized steel products in the markets we serve. Domestic and international trade laws provide mechanisms to address the injury caused by such imports to domestic industries. While in some cases, U. S. Steel is successful in obtaining relief under U.S. and international trade laws, in other circumstances, relief has been denied. When received, such relief is generally subject to annual automatic or discretionary review, which can result in rescission or reduction. There can be no assurance that any relief will be obtained or continued in the future or that such relief will adequately combat the surge in imports. There is also a risk that international bodies such as the World Trade Organization or other judicial bodies in the United States or the EU may change their interpretations of their respective trade laws in ways that are unfavorable to U. S. Steel.
Faced with overcapacity in various markets, we will continue to evaluate potential strategic and organizational opportunities, which may include exiting lines of business and the sale of certain assets, temporary shutdowns or closures of facilities.
41
Table of Contents
The steel industry is highly cyclical, which may have an adverse effect on our results of operations.
Steel consumption is highly cyclical and generally follows economic and industrial conditions both worldwide and in regional markets. This volatility makes it difficult to balance the procurement of raw materials and energy with global steel prices, our steel production and customer product demand. U. S. Steel has implemented strategic initiatives to produce more stable and consistent results, even during periods of economic and market downturns, but this may not be enough to mitigate the effect that the volatility inherent in the steel industry has on our results of operations.
We face increased competition from alternative materials and risks concerning innovation, new technologies, products and increasing customer requirements.
As a result of increasingly stringent regulatory requirements, designers, engineers and industrial manufacturers, especially those in the automotive industry, are increasing their use of lighter weight and alternative materials, such as aluminum, composites, plastics, and carbon fiber. Use of such materials could reduce the demand for steel products, which may reduce our profitability and cash flow.
Additionally, technologies such as direct iron reduction, EAF production, oxygen-coal injection and experimental technologies such as molten oxide electrolysis and hydrogen flash smelting may be more cost effective than our current production methods. However, we may not have sufficient capital to invest in such technologies and may incur difficulties adapting and fully integrating these technologies into our existing operations. We may also encounter production restrictions, or not realize the cost benefit from such capital intensive technology adaptations to our current production processes. Customers, such as those in the automotive industry, are demanding stronger and lighter products. Tubular customers are increasingly requesting pipe producers to supply connections and other ancillary parts as well as inspection and other services. We may not be successful in meeting these technological challenges.
Limited availability of raw materials and energy may constrain operating levels and reduce profit margins.
U. S. Steel and other steel producers have periodically been faced with problems in obtaining sufficient raw materials and energy in a timely manner due to delays, defaults, severe weather conditions, or force majeure events by suppliers, shortages or transportation problems (such as shortages of barges, ore vessels, rail cars or trucks, or disruption of rail lines, waterways, or natural gas transmission lines), resulting in production curtailments. As a result, we may be exposed to risks concerning pricing and availability of raw materials from third parties. USSE purchases substantially all of its iron ore and coking coal requirements from outside sources. USSE is also dependent upon availability of natural gas produced in Russia and transported through Ukraine. Any curtailments or escalated costs may further reduce profit margins.
Changes in the global economic environment may lead to declines in the production levels of our customers.
We sell to the automotive, service center, converter, energy and appliance and construction-related industries. Some of these industries are cyclical and exhibit a great deal of sensitivity to general economic conditions. Low demand from customers in these key industries may adversely impact our financial position, results of operations and cash flows.
Our Flat-Rolled and Tubular segments may be particularly impacted by unfavorable market conditions in the oil and gas industries. Declines in oil prices, and the correlating reduction in drilling activity, as well as high levels of inventory in the supply chain, may reduce demand for tubular products and could have adverse impacts on our results of operations and cash flows.
We may be adversely impacted by volatility in prices for raw materials, energy, and steel.
U. S. Steel may be faced with having agreed to purchase raw materials and energy at prices that are above the then current market price or in greater volumes than required. Additionally, any future decreases in iron ore, scrap, natural gas and oil prices may place downward pressure on steel prices. If steel prices decline, our profit margins on market-based indexed contracts and spot business will be reduced.
42
Table of Contents
Our operations expose us to uncertainties and risks in the countries in which we operate, which may negatively affect our results of operations, cash flows and liquidity.
Our U.S. operations are subject to economic conditions, including credit and capital market conditions, and political factors in the United States, which if changed could negatively affect our results of operations, cash flows and liquidity. Political factors include, but are not limited to, taxation, inflation, increased regulation, limitations on exports of energy and raw materials, and trade remedies. Actions taken by the U.S. government could affect our results of operations, cash flows and liquidity.
USSE is subject to economic conditions and political factors associated with the EU, Slovakia and neighboring countries, and the euro currency. Changes in any of these economic conditions or political factors could negatively affect our results of operations, cash flows and liquidity. Political factors include, but are not limited to, taxation, nationalization, inflation, government instability, civil unrest, increased regulation and quotas, tariffs and other protectionist measures.
Our collective bargaining agreements with the USW may limit certain business flexibility. These agreements expire on September 1, 2018, which creates a potential risk of labor disruption.
Our master collective bargaining agreements with the USW contain provisions that may limit us from pursuing some North American transactions involving steel or steel-related assets without the consent of the USW, grant the USW a right to bid on any sale of one or more facilities covered by the 2015 Labor Agreements, and require us to make a minimum level of capital expenditures (subject to approval of the Board of Directors) to maintain the competitive status of our domestic facilities. These agreements may also restrict our ability to operate our facilities at less than full capacity and replace the product which could have been produced in such facilities with foreign products (excluding the United States or Canada), and further require that the ratio of non-represented employees to USW represented employees at our domestic facilities not exceed one to four. These provisions may limit our ability to acquire or sell steel or steel related assets at favorable prices, increase our operating costs and reduce our margins and otherwise adversely affect our competitiveness in the marketplace. These master agreements expire on September 1, 2018 and to the extent that good faith negotiations for successor agreements would reach legal impasse after this date, there exists a potential risk of labor disruption at covered plants.
A failure of our information technology infrastructure and cybersecurity threats may adversely affect our business operations.
Increasingly sophisticated attacks against rapidly evolving computer technologies pose a risk to the security of our systems, networks and data. Despite efforts to protect confidential business information, personal data of employees and contractors, and the control systems of manufacturing plants, U. S. Steel systems and those of our third-party service providers may be subject to system breaches. System breaches can lead to disclosure, modification and destruction of proprietary business data, personally identifiable information (PII), other sensitive information, defective products, production downtime and damage to production assets with a resulting impact to our reputation, competitiveness and operations. Of special note is our risk when implementing new capabilities. As we implement new systems, many times both new and old systems run in parallel until all processes have successfully transferred to the new system and thorough testing has been performed.
Historically, U. S. Steel has experienced cybersecurity attacks, including a high profile breach of our information technology systems in which proprietary information was compromised. On May 19, 2014, the U.S. Department of Justice unsealed an indictment against certain individuals in connection with cyber crimes committed against the Company and other entities. We cooperated with the U.S. government on this matter and have implemented enhancements and improvements to safeguard our information technology enterprise against future attacks. Some of these enhancements include planning for and taking initial steps to implement a risk management framework based on security standards written by the National Institute of Standards and Technology. Other enhancements include implementing additional security monitoring of our systems by advanced technologies. However, there is no assurance the Company's remediation efforts will be successful in safeguarding information from future attacks, which likely will increase in frequency and sophistication. Based on information known to date, the Company is currently unable to determine the materiality, if any, of these events.
We depend on third parties for transportation services, and increases in costs or the availability of transportation may adversely affect our business and operations.
43
Table of Contents
Our business depends on the transportation of a large number of products, both domestically and internationally. We rely primarily on third parties for transportation of the products we manufacture as well as delivery of our raw materials. Any increase in the cost of the transportation of our raw materials or products, as a result of increases in fuel or labor costs, higher demand for logistics services, consolidation in the transportation industry or otherwise, may adversely affect our results of operations as we may not be able to pass such cost increases on to our customers.
If any of these providers were to fail to deliver raw materials to us in a timely manner, we may be unable to manufacture and deliver our products in response to customer demand. In addition, if any of these third parties were to cease operations or cease doing business with us, we may be unable to replace them at a reasonable cost.
In addition, such failure of a third-party transportation provider could harm our reputation, negatively affect our customer relationships and have a material adverse effect on our financial position and results of operations.
Benefits from our stockholder value creation strategy and asset revitalization program may be limited or may not be fully realized.
U. S. Steel initiated a stockholder value creation strategy pursuant to which we focus on strengthening our balance sheet and cash flow generation. We continue to work on a series of initiatives that we believe will enable us to add value, right size the Company, and improve our performance across our core business processes, including commercial, supply chain, manufacturing, procurement, innovation, and operational and functional support. Additionally, in 2017 we implemented an asset revitalization program, which covers investments in our existing assets, and involves investments beyond routine capital and maintenance spending. These asset revitalization projects are expected to deliver both operational and commercial benefits, with most of the benefits coming from operational improvement. Business conditions, our ability to implement such initiatives, and factors beyond our control may limit the benefits associated with certain identified projects and limit the economic benefits of our stockholder value creation strategy or asset revitalization program.
We participate in joint ventures, which may not be successful.
We participate in a number of joint ventures and we may enter into additional joint ventures or other similar arrangements in the future. Our joint venture partners, as well as any future partners, may have interests that are different from ours which may result in conflicting views as to the conduct of the business of the joint venture. In the event that we have a disagreement with a joint venture partner as to the resolution of a particular issue, or as to the management or conduct of the business of the joint venture in general, we may not be able to resolve such disagreement in our favor. In addition, our joint venture partners may, as a result of financial or other difficulties or because of other reasons, be unable or unwilling to fulfill their obligations under the joint venture, such as contributing capital to expansion or maintenance projects or approving dividends or other distributions or payments to us. Any significant downturn or deterioration in the business, financial condition or results of operations of a joint venture could adversely affect our results of operations in a particular period. There can be no assurance that our joint ventures will be beneficial to us.
Financial Risk Factors
Our business requires substantial expenditures for debt service obligations, capital investments, operating leases and maintenance that we may be unable to fund.
While we have refinanced the near-term maturities of our long-term debt, we have approximately $1.2 billion of debt maturing in 2020 and 2021 (see Note 16 to the Consolidated Financial Statements). If our cash flows and capital resources are insufficient to fund our debt service obligations, we may face substantial liquidity problems and may be forced to reduce or delay investments and capital expenditures or to dispose of material assets or operations, or issue additional debt or equity. We may not be able to take such actions, if necessary, on commercially reasonable terms or at all. Our inability to generate sufficient cash flows to satisfy our debt obligations, or to refinance our indebtedness on commercially reasonable terms or at all, would materially and adversely affect our financial position and results or operations.
Our ability to service or refinance our debt or fund investments and capital expenditures required to maintain or expand our business operations depends on our financial condition and operating performance, which are subject to prevailing economic and competitive conditions and to certain financial, business, legislative, regulatory and other factors beyond our control. We may not be able to maintain a level of cash flows from operating activities sufficient to permit us to satisfy our liquidity needs. In addition, the limitations under our Third Amended and Restated Credit Agreement, such
44
Table of Contents
as insufficient collateral or not being able to meet the fixed charge coverage ratio, may limit our availability to draw upon this facility. See the Liquidity section in "Item 7. Management's Discussion and Analysis" for further details.
We have significant retiree health care, retiree life insurance and pension plan costs, which may negatively affect our results of operations and cash flows.
We maintain retiree health care and life insurance and defined benefit pension plans covering many of our domestic employees and former employees upon their retirement. These benefit plans have significant liabilities that are not fully funded, which will require additional cash funding in future years. Minimum contributions to domestic qualified pension plans (other than contributions to the Steelworkers Pension Trust (SPT) described below) are regulated under the Employee Retirement Income Security Act of 1974 (ERISA) and the Pension Protection Act of 2006 (PPA).
The level of cash funding for our defined benefit pension plans in future years depends upon various factors, including voluntary contributions that we may make, future pension plan asset performance, actual interest rates under the law, and the impacts of business acquisitions or divestitures, union negotiated benefit changes and future government regulations, many of which are not within our control. In addition, assets held by the trusts for our pension plan and our trust for retiree health care and life insurance benefits are subject to the risks, uncertainties and variability of the financial markets. See "Item 7. Management's Discussion and Analysis" and Note 17 to the Consolidated Financial Statements for a discussion of assumptions and further information associated with these benefit plans.
U. S. Steel contributes to a domestic multiemployer defined benefit pension plan, the SPT, for USW-represented employees formerly employed by National Steel and represented employees hired after May 2003. We have legal requirements for future funding of this plan should the SPT become significantly underfunded or we decide to withdraw from the plan. Either of these scenarios may negatively impact our future cash flows. The 2015 Labor Agreements require a contribution rate of $2.65 per hour for most steelworker employees. Collectively bargained company contributions to the plan could increase as a result of future changes agreed to by the Company and the USW.
Product liability claims may have an adverse effect on our financial position, results of operations and cash flows.
Events such as well failures, line pipe leaks, blowouts, bursts, fires and product recalls could result in claims that our products or services were defective and caused death, personal injury, property damage or environmental pollution. The insurance we maintain may not be adequate, available to protect us in the event of a claim, or its coverage may be limited, canceled or otherwise terminated, or the amount of our insurance may be less than the related impact on our enterprise value after a loss.
Rating agencies may downgrade our credit ratings, which would make it more difficult for us to raise capital and would increase our financial costs.
Any downgrades in our credit ratings may make raising capital more difficult, may increase the cost and adversely affect the terms of future borrowings, may adversely affect the terms under which we purchase goods and services and may limit our ability to take advantage of potential business opportunities.
We are subject to foreign currency risks, which may negatively impact our profitability and cash flows.
The financial condition and results of operations of USSE are reported in euros and then translated into U.S. dollars at the applicable exchange rate for inclusion in our financial statements. The appreciation of the U.S. dollar against the euro negatively affects our Consolidated Results of Operations.
In addition, international cash requirements have been and in the future may be funded by intercompany loans, creating intercompany monetary assets and liabilities in currencies other than the functional currencies of the entities involved, which can have a non-cash impact on income when they are remeasured at the end of each period.
Financial regulatory frameworks introduced by U.S. and EU regulators may limit our financial flexibility or increase our costs.
The Commodity Future Trading Commission's Dodd Frank and the EU's EMIR regulatory frameworks can limit the Company's ability to hedge interest rate, foreign exchange (FX), or commodity pricing exposures, which could expose us to increased economic risk. These frameworks may introduce additional compliance costs or liquidity requirements.
45
Table of Contents
Some counterparties may cease hedging as a result of increased regulatory cost burdens, which in turn may reduce U. S. Steel's ability to hedge its interest rate, FX, or commodity exposures.
We may be subject to legal proceedings or investigations, the resolution of which could negatively affect our profitability and cash flows in a particular period.
We may be involved at any given time in various litigation matters, including administrative and regulatory proceedings, governmental investigations, environmental matters, and commercial disputes. Our profitability and cash flows in a particular period could be negatively affected by an adverse ruling in any legal proceeding or investigation that may be pending against us or filed against us in the future. While we believe that we have taken appropriate actions to mitigate and reduce these risks, due to the nature of our operations, these risks will continue to exist and additional legal proceedings or investigations may arise from time to time.
Regulatory Risk Factors
Compliance with existing and new environmental regulations, environmental permitting and approval requirements may result in delays or other adverse impacts on planned projects, our results of operations and cash flows.
Steel producers in the United States, along with their customers and suppliers, are subject to numerous federal, state and local laws and regulations relating to the protection of the environment. Steel producers in the EU are subject to similar laws. These laws continue to evolve and are becoming increasingly stringent. The ultimate impact of complying with such laws and regulations is not always clearly known or determinable because regulations under some of these laws have not yet been promulgated or are undergoing revision. Compliance with environmental laws and regulations, such as the Clean Air Act, governing GHG and sulfur dioxide emissions, could result in substantially increased capital requirements and operating costs. In addition, the integrated steel process involves a series of chemical reactions that create carbon dioxide. Accordingly, we are subject to regulations adopted by the EPA, the EU and various state agencies regulating GHG emissions. Compliance with current or future regulations could entail substantial costs for emission based systems, and could have a negative impact on our results of operations and cash flows.
Construction and operation of new production facilities and modifications to existing facilities may require environmental permits and approvals from the appropriate regulatory agencies. There can be no assurance that future approvals, licenses and permits will be granted or that we will be able to maintain and renew the approvals, licenses and permits we currently hold. Failure to do so could have a material adverse effect on our results of operations and cash flows. Furthermore, compliance with the environmental permitting and approval requirements may be costly and time consuming and could result in delays or other adverse impacts on planned projects, our results of operations and cash flows.
We have significant environmental remediation costs that may negatively affect our results of operations and cash flows.
Some of U. S. Steel's current and former facilities were in operation before 1900. Hazardous materials associated with those facilities may have been released at current or former operating sites or delivered to sites operated by third parties.
U. S. Steel is involved in numerous remediation projects at currently operating facilities, facilities that have been closed or sold to unrelated parties and other sites where material generated by U. S. Steel was deposited. In addition, there are numerous other former operating or disposal sites that could become the subject of remediation, which may negatively affect our results of operations and cash flows.
Our operations are subject to complex regulatory and compliance frameworks.
Complex foreign and U.S. laws and regulations that apply to our international operations, including but not limited to U.S. laws such as the Foreign Corrupt Practices Act, regulations related to import-export controls, the Office of Foreign Assets Control sanctions program, antiboycott provisions, and changes in transportation and logistics regulations may increase our cost of doing business in international jurisdictions and expose the Company and its employees to elevated risk. The Company's subsidiaries and joint ventures face similar risks. Although we have implemented policies and processes designed to comply with these laws and regulations, failure by our employees, contractors, or agents to
46
Table of Contents
comply with these laws and regulations can result in possible administrative, civil, or criminal liability, as well as reputational harm to the Company and its employees.
The IRS may disallow all or part of a worthless stock loss and bad debt deduction taken in 2013.
U. S. Steel made an election effective December 31, 2013 to liquidate for U.S. income tax purposes a foreign subsidiary that holds most of the Company's international operations. The tax liquidation allowed the Company to claim a worthless stock loss and bad debt deduction in its 2013 U.S. income tax return, resulting in a net income tax benefit in 2013 of $419 million. The worthless stock loss and bad debt deduction are subject to audit and possible adjustment by the IRS, which could result in the reversal of all or part of the income tax benefit. In 2015, the IRS began its audit of the worthless stock loss and bad debt deduction taken in 2013. We expect resolution in a future period. While we believe we have adequate legal and factual support for the tax position taken, the IRS could reject or reduce the amount of the income tax benefit related to the worthless stock loss and bad debt deduction. If this occurs, U. S. Steel would incur additional current tax expense, which could result in additional income tax payments.
Changes to global data privacy laws and cross-border transfer requirements could adversely affect our business and operations.
Our business depends on the transfer of data between our affiliated entities, to and from our business partners, and with third-party service providers, which may be subject to global data privacy laws and cross-border transfer restrictions. While U. S. Steel takes steps to comply with these legal requirements, the volatility and changes to the applicability of those laws, as well as evolving standards and judicial and regulatory interpretations of such laws, may impact U. S. Steel's ability to effectively transfer data across borders in support of our business operations and lead to possible administrative, civil, or criminal liability, as well as reputational harm to the Company and its employees. For example, the European Union's General Data Protection Regulation (GDPR), which comes into effect in May 2018, creates a range of new compliance obligations for subject companies and increases financial penalties for non-compliance. The costs of compliance with the GDPR and the potential for fines and penalties in the event of a breach of the GDPR may have an adverse effect on our business and operations.
Item 1B. UNRESOLVED STAFF COMMENTS
None.
47
Table of Contents
Item 2. PROPERTIES
The following tables list U. S. Steel's main properties, their locations and their products and services:
North American Operations |
|
|
|
|
|
|
| ||
Property |
| Location |
| Products and Services |
Gary Works |
| Gary, Indiana |
| Slabs; Sheets; Tin mill; Strip mill plate |
Midwest Plant |
| Portage, Indiana |
| Sheets; Tin mill |
East Chicago Tin |
| East Chicago, Indiana |
| Sheets; Tin mill |
Great Lakes Works |
| Ecorse and River Rouge, Michigan |
| Slabs; Sheets |
Great Lakes Works EGL at Dearborn |
| Dearborn, Michigan |
| Galvanized sheets |
Mon Valley Works |
|
|
|
|
Irvin Plant |
| West Mifflin, Pennsylvania |
| Sheets |
Edgar Thomson Plant |
| Braddock, Pennsylvania |
| Slabs |
Fairless Plant |
| Fairless Hills, Pennsylvania |
| Galvanized sheets |
Clairton Plant |
| Clairton, Pennsylvania |
| Coke |
Granite City Works (a) |
| Granite City, Illinois |
| Slabs; Sheets |
Southern Coatings |
|
|
|
|
Fairfield Sheet |
| Fairfield, Alabama |
| Galvanized Sheets |
Double G Coatings Company, L.P. (b) |
| Jackson, Mississippi |
| Galvanized and Galvalume ® sheets |
USS-POSCO Industries (b) |
| Pittsburg, California |
| Sheets; Tin mill |
PRO-TEC Coating Company (b) |
| Leipsic, Ohio |
| Galvanized and high strength annealed sheets |
Fairfield Tubular Operations |
| Fairfield, Alabama |
| Seamless Tubular Pipe |
Worthington Specialty Processing (b) |
| Jackson, Canton and Taylor, Michigan |
| Steel processing |
Feralloy Processing Company (b) |
| Portage, Indiana |
| Steel processing |
Chrome Deposit Corporation (b) |
| Various |
| Roll processing |
Acero Prime, S.R.L. de C.V. (b) |
| Monterrey, Ramos Arizpe, San Luis Potosi, and Toluca, Mexico |
| Steel processing; warehousing; logistical services |
Lorain Tubular Operations |
| Lorain, Ohio |
| Seamless Tubular Pipe |
Lone Star Tubular |
| Lone Star, Texas |
| Welded Tubular Pipe |
Wheeling Machine Products |
| Pine Bluff, Arkansas and Hughes Springs, Texas |
| Tubular couplings |
Tubular Processing (c) |
| Houston, Texas |
| Tubular processing |
Offshore Operations |
| Houston, Texas |
| Tubular threading, inspection, accessories and storage services |
Patriot Premium Threading Services (b) |
| Midland, Texas |
| Tubular threading, accessories and premium connections |
Minntac Iron Ore Operations |
| Mt. Iron, Minnesota |
| Iron ore pellets |
Keetac Iron Ore Operations (d) |
| Keewatin, Minnesota |
| Iron ore pellets |
(a) | Hot end temporarily idled |
(b) | Equity investee |
(c) Temporarily Idled
(d) Idled in 2015, restarted in the 1st quarter of 2017
48
Table of Contents
North American Operations (Continued) |
|
| ||
|
|
| ||
Property |
| Location |
| Products and Services |
Hibbing Taconite Company (b) |
| Hibbing, Minnesota |
| Iron ore pellets |
Transtar, LLC |
| Alabama, Indiana, Michigan, Ohio, Pennsylvania, Texas |
| Railroad operations |
(b) Equity Investee
Other Operations | ||||
|
|
| ||
Property |
| Location |
| Products and Services |
U. S. Steel Košice |
| Košice, Slovakia |
| Slabs; Sheets; Tin mill; Strip mill plate; Tubular; Coke; Radiators; Refractories |
U. S. Steel and its predecessors (including Lone Star) have owned their properties for many years with no material adverse title claims asserted. In the case of Great Lakes Works, Granite City Works, the Midwest Plant and Keetac iron ore operations, U. S. Steel or its subsidiaries are the beneficiaries of bankruptcy laws and orders providing that properties are held free and clear of past liens and liabilities. In addition, U. S. Steel or its predecessors obtained title insurance, local counsel opinions or similar protections when significant properties were initially acquired or since acquisition.
At the Midwest Plant in Indiana, U. S. Steel has a supply agreement for various utility services with a company that owns a cogeneration facility located on U. S. Steel property. The Midwest Plant agreement expires in 2028.
U. S. Steel leases its headquarters office space in Pittsburgh, Pennsylvania.
For property, plant and equipment additions, including capital leases, see "Item 7. Management's Discussion and Analysis of Financial Condition and Results of Operations – Financial Condition, Cash Flows and Liquidity – Cash Flows" and Note 12 to the Consolidated Financial Statements.
49
Table of Contents
Item 3. LEGAL PROCEEDINGS
U. S. Steel is the subject of, or a party to, a number of threatened or pending legal actions, contingencies and commitments involving a variety of matters, including laws and regulations relating to the environment, certain of which are discussed in Note 25 to the Consolidated Financial Statements. The ultimate resolution of these contingencies could, individually or in the aggregate, be material to the U. S. Steel financial statements. However, management believes that U. S. Steel will remain a viable and competitive enterprise even though it is possible that these contingencies could be resolved unfavorably to U. S. Steel.
General Litigation
On April 26, 2016, the Company filed a complaint with the U.S. International Trade Commission (USITC) to initiate an investigation under Section 337 of the Tariff Act of 1930 against Chinese steel producers and their distributors. All but seven of the producers did not respond and are considered to be in default. The complaint alleges three causes of action: 1) illegal conspiracy to fix prices and control output and export volumes; 2) the theft of trade secrets through industrial espionage; and 3) circumvention of duties by false designation of origin (FDO). In February 2017, U. S. Steel voluntarily withdrew its trade secrets claim, but preserved the right to refile the claim when additional information becomes available. On October 2, 2017, the Administrative Law judge (ALJ) assigned to the case terminated the FDO claim. The Company has elected not to pursue an appeal of that claim leaving the price fixing claim as the remaining claim. That claim is pending before the USITC. The remedy sought by U. S. Steel in that claim is the barring of all Chinese carbon alloy steel from the U.S. market.
U. S. Steel v. Minnesota Pollution Control Agency (MPCA) and Commissioner John Linc Stine: On February 21, 2017, U. S. Steel filed a Verified Complaint and Writ of Mandamus against the MPCA for failure to act on U. S. Steel's request for revisions to water quality standards which will affect the draft National Pollutant Discharge Elimination System (water) permit at Minntac. MPCA filed an Answer and Counterclaim and U. S. Steel responded to the Counterclaim. Three citizen groups, Minnesota Center for Environmental Advocacy, Save Lake Superior Association and Save Our Sky Blue Waters (collectively MCEA), then intervened in the lawsuit. All parties have filed cross-motions for summary judgment, which remained outstanding pending a court-ordered mediation. The parties have now settled all claims and counterclaims and the case has been dismissed. U. S. Steel will now proceed through the Administrative regulatory process to address the outstanding water quality standards issues.
On August 9, 2017, the MPCA issued rulemaking proposals to replace the current sulfate standard with an equation-based standard. As part of the rulemaking process, an ALJ was appointed to preside over public hearings and comments. The Company and others challenged the standards and presented evidence that the standards were unsupported by science and that the MPCA failed to consider associated costs as part of the rulemaking process. On January 9, 2018, the ALJ rejected the MPCA's proposals, concluding that the MPCA failed to comply with state law requirements for drafting and adopting a new standard, that portions of the rule were unsupported by the MPCA's evidence and that the MPCA proposal was unconstitutional due to vagueness.
On October 2, 2017, an Amended Shareholder Class Action Complaint was filed in Federal Court in the Western District of Pennsylvania consolidating previously-filed actions. Separately, four related shareholder derivative lawsuits were filed in Pennsylvania and Federal courts in Pittsburgh. The underlying consolidated class action lawsuit alleges that U. S. Steel, certain current and former officers, an upper level manager of the Company and the financial Underwriters who participated in the August 2016 secondary public offering violated federal securities laws in making false statements and/or failing to discover and disclose material information regarding the financial condition of the Company. The lawsuit claims that this conduct caused a prospective class of plaintiffs to sustain damages during the period of January 27, 2016 and April 25, 2017 as a result of the prospective class purchasing the Company's common stock at artificially inflated prices and/or suffering losses when the price of the common stock dropped. The derivative lawsuits generally make the same allegations against the same officers and also allege that certain members of the Board of Directors failed to exercise appropriate control and oversight over the Company and were unjustly compensated. They seek to recover losses that were allegedly sustained. The Company is vigorously defending these matters.
On April 11, 2017, there was a process waste water release at our Midwest Plant (Midwest) in Portage, Indiana that impacted a water outfall that discharges to Burns Waterway near Lake Michigan. U. S. Steel identified the source of the release and made the necessary repairs. We determined that all repairs were safely working as intended and, on April 14, 2017, resumed operations in a controlled, phased and highly monitored approach with extensive input from participating government agencies. The Company has since implemented substantial operational, process and
50
Table of Contents
notification improvements at Midwest. The Company has been presented with cost reimbursements, loss of use and penalty requests from the involved governmental agencies and intends to amicably resolve the matter with those agencies. Separately, the Company was placed on notice of potential citizens' enforcement suits regarding the April 2017 incident and other historical alleged Clean Water Act and Permit violations at Midwest. In January of 2018, The Surfrider Foundation and the City of Chicago initiated suits in the Northern District of Indiana alleging such violations. The Company intends to defend against those actions.
Asbestos Litigation
As of December 31, 2017, U. S. Steel was a defendant in approximately 820 active cases involving approximately 3,315 plaintiffs. The vast majority of these cases involve multiple defendants. As of December 31, 2016, U. S. Steel was a defendant in approximately 845 cases involving approximately 3,340 plaintiffs. About 2,500 , or approximately 75 percent , of these plaintiff claims are currently pending in jurisdictions which permit filings with massive numbers of plaintiffs. Based upon U. S. Steel's experience in such cases, it believes that the actual number of plaintiffs who ultimately assert claims against U. S. Steel will likely be a small fraction of the total number of plaintiffs.
The following table shows the activity with respect to asbestos litigation:
Period ended |
| Opening |
| Claims |
| New |
| Closing |
December 31, 2015 |
| 3,455 |
| 415 |
| 275 |
| 3,315 |
December 31, 2016 |
| 3,315 |
| 225 |
| 250 |
| 3,340 |
December 31, 2017 |
| 3,340 |
| 275 |
| 250 |
| 3,315 |
Historically, asbestos-related claims against U. S. Steel fall into three groups: (1) claims made by persons who allegedly were exposed to asbestos on the premises of U. S. Steel facilities; (2) claims made by persons allegedly exposed to products manufactured by U. S. Steel; and (3) claims made under certain federal and maritime laws by employees of former operations of U. S. Steel.
The amount U. S. Steel accrues for pending asbestos claims is not material to U. S. Steel's financial condition. However, U. S. Steel is unable to estimate the ultimate outcome of asbestos-related claims due to a number of uncertainties, including: (1) the rates at which new claims are filed, (2) the number of and effect of bankruptcies of other companies traditionally defending asbestos claims, (3) uncertainties associated with the variations in the litigation process from jurisdiction to jurisdiction, (4) uncertainties regarding the facts, circumstances and disease process with each claim, and (5) any new legislation enacted to address asbestos-related claims. Despite these uncertainties, management believes that the ultimate resolution of these matters will not have a material adverse effect on U. S. Steel's financial condition, although the resolution of such matters could significantly impact results of operations for a particular quarter.
Environmental Proceedings
The following is a summary of the proceedings of U. S. Steel that were pending or contemplated as of December 31, 2017, under federal and state environmental laws. Information about specific sites where U. S. Steel is or has been engaged in significant clean up or remediation activities is also summarized below. Except as described herein, it is not possible to accurately predict the ultimate outcome of these matters.
CERCLA Remediation Sites
Claims under the Comprehensive Environmental Response, Compensation and Liability Act (CERCLA) have been raised with respect to the cleanup of various waste disposal and other sites. Under CERCLA, potentially responsible parties (PRPs) for a site include current owners and operators, past owners and operators at the time of disposal, persons who arranged for disposal of a hazardous substance at a site, and persons who transported a hazardous substance to a site. CERCLA imposes strict and joint and several liabilities. Because of various factors, including the ambiguity of the regulations, the difficulty of identifying the responsible parties for any particular site, the complexity
51
Table of Contents
of determining the relative liability among them, the uncertainty as to the most desirable remediation techniques, and the amount of damages and cleanup costs and the time period during which such costs may be incurred, we are unable to reasonably estimate U. S. Steel's ultimate liabilities under CERCLA.
As of December 31, 2017, U. S. Steel has received information requests or been identified as a PRP at a total of seven CERCLA sites, two of which have liabilities that have not been resolved. Based on currently available information, which is in many cases preliminary and incomplete, management believes that U. S. Steel's liability for CERCLA cleanup and remediation costs at the other five sites will be between $100,000 and $1 million for four of the sites, and over $5 million for one site as described below.
Duluth Works
The former U. S. Steel Duluth Works site was placed on the National Priorities List under CERCLA in 1983 and on the State of Minnesota's Superfund list in 1984. Liability for environmental remediation at the site is governed by a Response Order by Consent executed with the MPCA in 1985 and a Record of Decision signed by MPCA in 1989. U. S. Steel has submitted a feasibility study that includes remedial measures to address contaminated sediments in the St. Louis River Estuary and several other Operable Units that could impact the Estuary if not addressed.
While work continues on completion of the remedial design and educating the public and key stakeholders on the details of the plan, there has been no material change in the status of the project during the twelve months ended December 31, 2017. Additional study, investigation, design, oversight costs, and implementation of U. S. Steel's preferred remedial alternatives on the upland property and Estuary are currently estimated as of December 31, 2017 at approximately $47 million .
RCRA and Other Remediation Sites
U. S. Steel may be liable for remediation costs under other environmental statutes, both federal and state, or where private parties are seeking to impose liability on U. S. Steel for remediation costs through discussions or litigation. There are 19 such sites where remediation is being sought involving amounts in excess of $100,000. Based on currently available information, which is in many cases preliminary and incomplete, management believes that liability for cleanup and remediation costs in connection with 9 sites have potential costs between $100,000 and $1 million per site, 5 sites may involve remediation costs between $1 million and $5 million per site and 5 sites are estimated to or could have, costs for remediation, investigation, restoration or compensation in excess of $5 million per site.
For more information on the status of remediation activities at U. S. Steel's significant sites, see the discussions related to each site below.
Gary Works
On October 23, 1998, the Environmental Protection Agency (EPA) issued a final Administrative Order on Consent (Order) addressing Corrective Action for Solid Waste Management Units (SWMU) throughout Gary Works. This Order requires U. S. Steel to perform a Resource Conservation and Recovery Act (RCRA) Facility Investigation (RFI), a Corrective Measures Study (CMS) and Corrective Measure Implementation. While work continues on several items, there has been no material change in the status of the project during the twelve months ended December 31, 2017. Until the remaining Phase I work and Phase II field investigations are completed, it is not possible to assess what additional expenditures will be necessary for Corrective Action projects at Gary Works. In total, the accrued liability for Corrective Action projects is approximately $25 million as of December 31, 2017, based on our current estimate of known remaining costs.
Geneva Works
At U. S. Steel's former Geneva Works, liability for environmental remediation, including the closure of three hazardous waste impoundments and facility-wide corrective action, has been allocated between U. S. Steel and the current property owner pursuant to an agreement and a permit issued by the Utah Department of Environmental Quality (UDEQ). Having completed the investigation on a majority of the remaining areas identified in the permit, U. S. Steel has determined the most effective means to address the remaining impacted material is to manage those materials in a previously approved on-site Corrective Action Management Unit (CAMU). While preliminary approval of the conceptual CAMU design has been granted by the UDEQ, there has been no material change in the status of the
52
Table of Contents
project during the twelve months ended December 31, 2017. U. S. Steel has an accrued liability of approximately $63 million as of December 31, 2017, for our estimated share of the remaining costs of remediation.
USS-POSCO Industries (UPI)
A joint venture in Pittsburg, California between subsidiaries of U. S. Steel and POSCO, UPI's facilities were previously owned and operated solely by U. S. Steel which retains primary responsibility for the existing environmental conditions. During 2016, U. S. Steel implemented its preferred remedial plan to address groundwater impacts from trichloroethylene at Solid Waste Management Unit (SWMU) 4. Evaluations continue for the three SWMUs known as the Northern Boundary Group and it is likely that corrective measures will be required, but it is not possible at this time to define a scope or estimate costs for what may be required by the California Department of Toxic Substances Control. As such, there has been no material change in the status of the project during the twelve months ended December 31, 2017. As of December 31, 2017, approximately $1 million has been accrued for ongoing environmental studies, investigations and remedy monitoring. Significant additional costs associated with this site are possible and are referenced in Note 25 to the Consolidated Financial Statements "Contingencies and Commitments - Environmental Matters - Remediation Projects - Projects with Ongoing Study and Scope Development."
Fairfield Works
A consent decree was signed by U. S. Steel, the EPA and the U.S. Department of Justice and filed with the United States District Court for the Northern District of Alabama (United States of America v. USX Corporation) in December 1997. In accordance with the consent decree, U. S. Steel initiated a RCRA corrective action program at the Fairfield Works facility. The Alabama Department of Environmental Management (ADEM), with the approval of the EPA, assumed primary responsibility for regulation and oversight of the RCRA corrective action program at Fairfield Works. While work continues on different aspects of the program, there has been no material change in the status of the project during the twelve months ended December 31, 2017. In total, the accrued liability for remaining work under the Corrective Action Program, was approximately $325,000 at December 31, 2017. Significant additional costs associated with this site are possible and are referenced in Note 25 to the Consolidated Financial Statements "Contingencies and Commitments - Environmental Matters - Remediation Projects - Projects with Ongoing Study and Scope Development."
Fairless Plant
In April 1993, U. S. Steel entered into a consent order with the EPA pursuant to RCRA, under which U. S. Steel would perform Interim Measures (IM), an RFI and CMS at our Fairless Plant. A Phase I RFI Final Report was submitted in September of 1997. With EPA's agreement, in lieu of conducting subsequent phases of the RFI and the CMS, U. S. Steel has been working through the Pennsylvania Department of Environmental Protection Act 2 Program to characterize and remediate facility parcels for redevelopment. While work continues on these items, there has been no material change in the status of the project during the twelve months ended December 31, 2017. As of December 31, 2017, the accrued liability to maintain the interim measures, and clear properties through the Act 2 process is approximately $49,000. Significant additional costs associated with this site are possible and are referenced in Note 25 to the Consolidated Financial Statements "Contingencies and Commitments - Environmental Matters - Remediation Projects - Projects with Ongoing Study and Scope Development."
Lorain Tubular Operations
In September 2006, U. S. Steel and the Ohio Environmental Protection Agency (OEPA) commenced discussions about RCRA Corrective Action at Lorain Tubular Operations. A Phase I RFI on the identified SWMUs and Areas of Contamination was submitted in March 2012. While discussions continue with OEPA on the Phase II RFI report that addresses additional investigations of soil, site wide groundwater and the pipe mill lagoon, there has been no material change in the status of the project during the twelve months ended December 31, 2017. As of December 31, 2017, costs to complete additional projects are estimated to be approximately $108,000. Significant additional costs associated with this site are possible and are referenced in Note 25 to the Consolidated Financial Statements "Contingencies and Commitments - Environmental Matters - Remediation Projects - Projects with Ongoing Study and Scope Development."
Joliet Works
The 50-acre parcel at the former Joliet Works is enrolled in the Illinois Environmental Protection Agency's (IEPA) voluntary Site Remediation Program (the Program). The Program requires investigation and establishment of cleanup
53
Table of Contents
objectives followed by submission/approval of a Remedial Action Plan to meet those objectives. The 50-acre parcel was divided into four (4) subareas with remedial activities completed in 2015 for three (3) of the subareas. While work continues to define the requirements for further investigation of the remaining subarea, there has been no material change in the status of the project during the twelve months ended December 31, 2017. U. S. Steel has an accrued liability of $294,000 as of December 31, 2017. Significant additional costs associated with this site are possible and are referenced in Note 25 to the Consolidated Financial Statements "Contingencies and Commitments - Environmental Matters - Remediation Projects - Projects with Ongoing Study and Scope Development."
Cherryvale (KS) Zinc
In April 2003, U. S. Steel and Salomon Smith Barney Holdings, Inc. (SSB) entered into a Consent Order with the Kansas Department of Health & Environment (KDHE) concerning a former zinc smelting operation in Cherryvale, Kansas. Remediation of the site proper was essentially completed in 2007. The Consent Order was amended on May 3, 2013, to require investigation (but not remediation) of potential contamination beyond the boundary of the former zinc smelting operation. On November 22, 2016, KDHE approved a State Cooperative Final Agency Decision Statement that identified the remedy selected to address potential contamination beyond the boundary of the former zinc smelting site. Work continues on finalizing the Removal Action Design Plan. As of December 31, 2017, an accrual of approximately $351,000 remains available for addressing these outstanding issues. Significant additional costs associated with this site are possible and are referenced in Note 25 to the Consolidated Financial Statements "Contingencies and Commitments - Environmental Matters - Remediation Projects - Projects with Ongoing Study and Scope Development."
South Works
On August 29, 2017, U. S. Steel was notified by the U.S. Coast Guard of a sheen on the water in the North Vessel Slip at our former South Works in Chicago, Illinois. U. S. Steel has been working with the IEPA under their voluntary Site Remediation Program since 1993 to evaluate the condition of the property including the North Vessel Slip. The result of this cooperative effort has been the issuance of a series of "No Further Remediation" (NFR) notices to U. S. Steel including one specific to the North Vessel Slip. U. S. Steel has notified the IEPA of the potential changed condition and is working closely with the IEPA and the U. S. Coast Guard to determine the source of the sheen and options to address the issue. U. S. Steel has an accrued liability of $82,000 as of December 31, 2017.
Air Related Matters
Great Lakes Works
In June 2010, the EPA significantly lowered the primary National Ambient Air Quality Standards (NAAQS) for sulfur dioxide (SO 2 ) from 140 parts per billion (ppb) on a 24-hour basis to an hourly standard of 75 ppb. Based upon the 2009-2011 ambient air monitoring data, the EPA designated the area in which Great Lakes Works is located as nonattainment with the 2010 SO 2 NAAQS.
As result, the Michigan Department of Environmental Quality (MDEQ) must submit a State Implementation Plan (SIP) to the EPA that demonstrates that the entire nonattainment area (and not just the monitor) will be in attainment by October 2018 by using conservative air dispersion modeling. U. S. Steel met with MDEQ on multiple occasions and had offered reduction plans to MDEQ but the parties could not agree to a plan. MDEQ, instead promulgated Rule 430 which was solely directed at U. S. Steel. The Company challenged Rule 430 before the Michigan Court of Claims who by Order dated October 4, 2017, granted the Company's motion for summary disposition voiding Rule 430 finding that it violated rule-making provisions of the Michigan Administrative Procedures Act and Michigan Constitution. Since Rule 430 has been invalidated, EPA has indicated that it would promulgate a Federal Implementation Plan (FIP). Because development of the FIP is in the early stages, the impacts of the nonattainment designation to the Company are not estimable at this time.
On May 27, 2015, Great Lakes Works received a Violation Notice in which MDEQ alleged that U. S. Steel did not obtain a required permit to install a BOP vessel replacement that occurred in November 2014. U. S. Steel responded to MDEQ on June 17, 2015. While the resolution of the matter is uncertain at this time, it is not anticipated that the resolution will be material to U. S. Steel.
54
Table of Contents
Granite City Works
In October 2015, Granite City Works received a Violation Notice from IEPA in which the IEPA alleges that U. S. Steel violated the emission limits for nitrogen oxides (NOx) and volatile organic compounds from the Basic Oxygen Furnace Electrostatic Precipitator Stack. In addition, the IEPA alleges that U. S. Steel exceeded its natural gas usage limit at its CoGeneration Boiler. U. S. Steel responded to the notice and is currently discussing resolution of the matter with IEPA.
On December 18, 2017, Granite City Works received a Violation Notice from IEPA in which the IEPA alleges that U. S. Steel violated certain air operating, maintenance and recordkeeping requirements related to a coke conveyance system, pickle line scrubbers and hydrochloric acid storage tanks. U. S. Steel is currently discussing resolution of the matter with IEPA.
Although discussions with IEPA regarding the foregoing alleged violations are ongoing and the resolution of these matters is uncertain at this time, it is not anticipated that the result of those discussions will be material to U. S. Steel.
Minnesota Ore Operations
On February 6, 2013, the EPA published a FIP that applies to taconite facilities in Minnesota. The FIP establishes and requires emission limits and the use of low NOx reduction technology on indurating furnaces as Best Available Retrofit Technology. While U. S. Steel installed low NOx burners on three furnaces at Minntac and is currently obligated to install low NOx burners on the two other furnaces at Minntac pursuant to existing agreements and permits, the rule would require the installation of a low NOx burner on the one furnace at Keetac for which U. S. Steel did not have an otherwise existing obligation. U. S. Steel estimates expenditures associated with the installation of low NOx burners of as much as $25 to $30 million. In 2013, U. S. Steel filed a petition for administrative reconsideration to the EPA and a petition for judicial review of the 2013 FIP and denial of the Minnesota State Implementation Plan (SIP) to the Eighth Circuit of the 2013 FIP. In April 2016, the EPA promulgated a revised FIP with the same substantive requirements for U. S. Steel. In June 2016, U. S. Steel filed a petition for administrative reconsideration of the 2016 FIP to the EPA and a petition for judicial review of the 2016 FIP before the Eighth Circuit Court of Appeals. While the proceedings regarding the petition for judicial review of the 2013 FIP remained stayed, oral arguments regarding the petition for judicial review of the 2016 FIP were heard by the Eighth Circuit Court of Appeals on November 15, 2017. Thus, both petitions for judicial review remain with the Eighth Circuit. On December 4, 2017, EPA published a notification in the Federal Register in which the EPA denied U. S. Steel's administrative petitions for reconsideration and stay of the 2013 FIP and 2016 FIP. On February 1, 2018, U. S. Steel filed a petition for judicial review of EPA's denial of the administrative petitions for reconsideration to the 8th Circuit Court of Appeals. U. S. Steel continues to defend its petitions while pursuing a resolution that would include an equitable revision to the FIP.
Mon Valley Works
On November 9, 2017, EPA Region III and Allegheny County Health Department (ACHD) jointly issued a Notice of Violation (NOV) regarding the Company's Edgar Thomson facility in Braddock, PA. In addition, on November 20, 2017, ACHD issued a separate, but related NOV to the Company regarding the Edgar Thomson facility. In the NOVs, based upon their inspections and review of documents collected throughout the last two years, the agencies allege that the Company has violated the Clean Air Act by exceeding the allowable visible emission standards from certain operations during isolated events. In addition, the agencies allege that the Company has violated certain maintenance, reporting, and recordkeeping requirements. U. S. Steel met with EPA Region III and ACHD on December 18, 2017, and continues to negotiate a potential resolution of the matter.
Item 4. MINE SAFETY DISCLOSURE
The information concerning mine safety violations and other regulatory matters required by Section 150 of the Dodd-Frank Wall Street Reform and Consumer Protection Act and Item 104 of Regulation S-K is included in Exhibit 95 to this Form 10-K.
55
Table of Contents
EXECUTIVE OFFICERS OF THE REGISTRANT
The executive officers of U. S. Steel and their ages as of February 1, 2018, are as follows:
Name |
| Age |
| Title |
| Executive Officer Since |
Kevin P. Bradley |
| 55 |
| Executive Vice President & Chief Financial Officer |
| July 27, 2017 |
Christine S. Breves |
| 61 |
| Senior Vice President, Manufacturing Support & Chief Supply Chain Officer |
| April 27, 2017 |
James E. Bruno |
| 52 |
| Senior Vice President - Automotive Solutions (a) |
| December 1, 2014 |
Scott D. Buckiso |
| 50 |
| Senior Vice President - European Solutions and President - USSK (b) |
| May 31, 2015 |
David B. Burritt |
| 62 |
| President & Chief Executive Officer |
| September 1, 2013 |
Colleen M. Darragh |
| 48 |
| Vice President & Controller |
| July 17, 2014 |
Richard L. Fruehauf |
| 50 |
| Deputy General Counsel - Corporate; Interim General Counsel |
| November 7, 2017 |
Sara A. Greenstein |
| 43 |
| Senior Vice President - Consumer Solutions (a) |
| December 1, 2014 |
Douglas R. Matthews |
| 52 |
| Senior Vice President - Industrial, Service Center and Mining Solutions (a) |
| July 2, 2012 |
David J. Rintoul |
| 60 |
| Senior Vice President - Tubular Business (c) |
| May 1, 2014 |
Pipasu Soni |
| 45 |
| Vice President - Finance |
| February 1, 2017 |
(a) Automotive Solutions, Consumer Solutions, and Industrial, Service Center and Mining Solutions commercial entities are contained within the Flat-Rolled segment.
(b) European Solutions commercial entity is contained within the USSE segment.
(c) Tubular Business commercial entity is contained within the Tubular segment. David J. Rintoul has elected to retire on February 28, 2018. Douglas R. Matthews will assume responsibilities for the Company's Tubular Segment on an interim basis.
All of the executive officers mentioned above have held responsible management or professional positions with U. S. Steel or our subsidiaries for more than the past five years, with the exception of Mr. Bradley, Ms. Breves, Mr. Bruno, Mr. Burritt, Ms. Greenstein, Mr. Soni and Mr. Fruehauf. Prior to joining U. S. Steel, Mr. Bruno was with TRW Automotive, a global leader in automotive safety and one of the world's largest automotive suppliers, for 20 years, most recently serving as vice president – North American braking operations and global slip control portfolio. Prior to joining U. S. Steel, Mr. Bradley served as senior vice president and chief financial officer at Terex Corporation, a U.S.-based global manufacturer of lifting and material processing products such as cranes, aerial work platforms, and mobile crushing and screening equipment used in industries ranging from construction and mining to utilities. Prior to joining U. S. Steel, Ms. Breves served as chief procurement officer at Alcoa Inc., where she served since 2004 with responsibility for strategic materials, indirect materials and services, non-smelter energy, transportation and capital. Ms. Greenstein joined U. S. Steel from Underwriters Laboratories, Inc. (UL) where she was employed for 12 years and most recently held the position of president, UL Supply Chain and Sustainability. Mr. Soni joined U. S. Steel in 2016. Previously he was with Pentair for six years, most recently serving as Vice President, Business Analysis and Planning from 2012 - 2015. Mr. Soni also held various roles in international and business unit finance, corporate development and controllership at Honeywell. Mr. Fruehauf joined the Company in 2014 as Assistant General Counsel, and was subsequently promoted to Associate General Counsel and Deputy General Counsel. He was named Interim General Counsel in November 2017. Prior to joining U. S. Steel, Mr. Fruehauf served as Senior Counsel and then Assistant General Counsel during his six years at Westinghouse Electric Company LLC. Throughout his career, he has also worked as an attorney at several law firms and other manufacturing companies, and as a national security analyst for several U.S. government agencies.
56
Table of Contents
PART II
Item 5. MARKET FOR REGISTRANT'S COMMON EQUITY, RELATED STOCKHOLDER MATTERS AND ISSUER PURCHASES OF EQUITY SECURITIES
Common Stock Information
The principal market on which United States Steel Corporation (U. S. Steel) common stock is traded is the New York Stock Exchange. U. S. Steel common stock is also traded on the Chicago Stock Exchange. Information concerning the high and low sales price for the common stock as reported in the consolidated transaction reporting system and the frequency and amount of dividends paid during the last two years is set forth in "Selected Quarterly Financial Data (Unaudited)" on page F-57.
As of February 15, 2018 , there were 13,632 registered holders of U. S. Steel common stock.
The Board of Directors currently intends to declare and pay dividends on shares of U. S. Steel common stock based on the financial condition and results of operations of U. S. Steel out of legally available funds and in accordance with the requirements set forth by applicable law. Quarterly dividends were declared by U. S. Steel in 2017 and 2016 in the amount of $0.05 per share.
Shareholder Return Performance
The graph below compares the yearly change in cumulative total shareholder return of our common stock with the cumulative total return of the Standard & Poor's (S&P's) 500 Stock Index and the S&P 600 Steel Index.
Comparison of Cumulative Total Return
on $100 Invested in U.S. Steel Stock on December 31, 2012
vs
S&P 500 and S&P 600 Steel Index
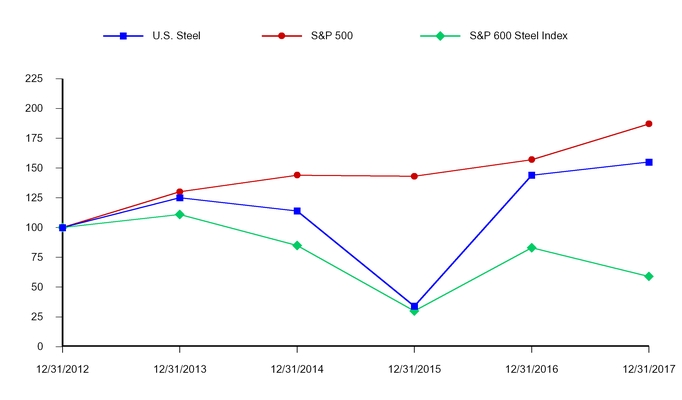
(a) U. S. Steel was removed from the S&P 500 Index effective July 1, 2014. Consequently, U. S. Steel is now part of the S&P 600 Steel Index instead of the S&P 500 Steel Index, which is a subset of the S&P 500. Therefore, current year results may not be comparable to prior years.
57
Table of Contents
For information on securities authorized for issuance under our equity compensation plans, see "Item 12. Security Ownership of Certain Beneficial Owners and Management and Related Stockholder Matters."
Recent Sales of Unregistered Securities
U. S. Steel had no sales of unregistered securities during the period covered by this report.
58
Table of Contents
Item 6. SELECTED FINANCIAL DATA
Dollars in millions (except per share data) (a) |
| 2017 |
| 2016 |
| 2015 |
| 2014 |
| 2013 | ||||||||||
Statement of Operations Data: |
|
|
|
|
|
|
|
|
|
| ||||||||||
Net sales |
| $ | 12,250 | |
| $ | 10,261 | |
| $ | 11,574 | |
| $ | 17,507 | |
| $ | 17,424 | |
Earnings (loss) before interest and income taxes |
| 608 | |
| (165 | ) |
| (1,202 | ) |
| 413 | |
| (1,900 | ) | |||||
Net earnings (loss) attributable to United States Steel Corporation |
| 387 | |
| (440 | ) |
| (1,642 | ) |
| 102 | |
| (1,645 | ) | |||||
Per Common Share Data: |
|
|
|
|
|
|
|
|
|
| ||||||||||
Net earnings (loss) attributable to United States Steel Corporation (b) |
|
|
|
|
|
|
|
|
|
| ||||||||||
– basic |
| 2.21 | |
| (2.81 | ) |
| $ | (11.24 | ) |
| $ | 0.71 | |
| $ | (11.37 | ) | ||
– diluted |
| 2.19 | |
| (2.81 | ) |
| (11.24 | ) |
| 0.69 | |
| (11.37 | ) | |||||
Dividends per share declared and paid |
| 0.20 | |
| 0.20 | |
| 0.20 | |
| 0.20 | |
| 0.20 | | |||||
Balance Sheet Data – December 31: |
|
|
|
|
|
|
|
|
|
| ||||||||||
Total assets (c) (d) |
| $ | 9,862 | |
| $ | 9,160 | |
| $ | 9,167 | |
| $ | 11,975 | |
| $ | 12,679 | |
Capitalization: |
|
|
|
|
|
|
|
|
|
| ||||||||||
Debt (d) |
| $ | 2,703 | |
| $ | 3,031 | |
| $ | 3,138 | |
| $ | 3,460 | |
| $ | 3,892 | |
United States Steel Corporation stockholders' equity |
| 3,320 | |
| 2,274 | |
| 2,436 | |
| 3,799 | |
| 3,375 | | |||||
Total capitalization |
| $ | 6,023 | |
| $ | 5,305 | |
| $ | 5,574 | |
| $ | 7,259 | |
| $ | 7,267 | |
(a) | For discussion of changes between the years, see Item 7. "Management's Discussion and Analysis of Financial Condition and Results of Operations." |
(b) | See Note 8 to the Consolidated Financial Statements for the basis of calculating earnings per share. |
(c) | 2014 and 2013 amounts have been adjusted to retroactively adopt Accounting Standards Update 2015-17, Balance Sheet Classification of Deferred Taxes , which requires that all deferred tax assets and liabilities, along with any related valuation allowance, be classified as noncurrent on the balance sheet. |
(d) | 2015, 2014 and 2013 amounts have been adjusted to retroactively adopt Accounting Standards Update 2015-03, Interest-Imputation of Interest (Subtopic 835-30) - Simplifying the Presentation of Debt Issuance Costs , which requires that debt issuance costs related to a recognized debt liability be presented in the balance sheet as a direct deduction from the carrying amount of the debt liability. |
59
Table of Contents
Item 7. MANAGEMENT'S DISCUSSION AND ANALYSIS OF FINANCIAL CONDITION AND RESULTS OF OPERATIONS
The following discussion should be read in conjunction with the Consolidated Financial Statements and related notes that appear elsewhere in this document.
Overview
According to World Steel Association's latest published statistics, U. S. Steel was the twenty-fourth largest steel producer in the world in 2016. Also in 2016 according to World Steel Association's latest published statistics, U. S. Steel was the third largest steel producer in the United States. U. S. Steel has a broad and diverse mix of products and customers. We use iron ore, coal, coke, steel scrap, zinc, tin, and other metallic additions to produce a wide range of flat-rolled and tubular steel products, concentrating on value-added steel products for customers with demanding technical applications in the automotive, appliance, container, industrial machinery, construction and oil, gas, and petrochemical industries. In addition to our facilities in the United States, U. S. Steel has significant operations in Eastern Europe through U. S. Steel Košice (USSK), located in Slovakia.
We are proud to report the following highlights and accomplishments achieved in 2017:
• | Implemented comprehensive safety program enhancements for employees and contractors, to help achieve our goal of a safe return home every day |
• | Outperformed the Bureau of Labor Statistics and AISI industry safety benchmarks in both OSHA Recordable Days and Days Away From Work |
• | Reported net earnings of $387 million in 2017 |
• | Finished 2017 with adjusted EBITDA of $1.087 billion and positive operating cash flow of $802 million |
• | Strong year-end liquidity of approximately $3.350 billion, including $1.553 billion of cash, which supports our goal of maintaining a healthy balance sheet |
• | Reduced total debt by $328 million in 2017 as compared to 2016 |
• | Successfully completed a $750 million debt offering, providing for future financial flexibility |
• | Improved our cash conversion cycle by 13 days |
• | Made a $75 million voluntary contribution to our defined benefit pension plan, further improving the funded status |
• | Launched a new proprietary tubular connection - USS-EAGLE SFH TM and sold our first order of USS-LIBERTY LD TM |
• | Began construction of a new continuous galvanizing line at our PRO-TEC joint venture to efficiently produce advanced high strength steels |
• | Initiated a multi-year asset revitalization program that includes $1.5 billion of capital investments in our Flat-Rolled assets |
• | Continue to lead the U.S. steel industry's efforts to strengthen and enforce trade laws against unfairly traded imports |
Our management team took several critical actions in recent years, including: idling facilities; right-sizing the organization; and exiting parts of the business where it is not possible to earn an economic profit. These were tough decisions and, despite the challenging economic circumstances, U. S. Steel ended 2017 as a more streamlined organization focused on generating economic profit across all business cycles.
We continue to take steps to improve our position for the long-term. The focus on improving the balance sheet and strategically accessing the capital markets enables the Company to move forward and open avenues to future growth and investment.
60
Table of Contents
We have taken these actions as part of our strategy to return to profitable growth and deliver sustainable value creation for our stockholders as market conditions improve.
Critical Accounting Estimates
Management's discussion and analysis of U. S. Steel's financial condition and results of operations is based upon U. S. Steel's financial statements, which have been prepared in accordance with accounting standards generally accepted in the United States (U.S. GAAP). The preparation of these financial statements requires management to make estimates and assumptions that affect the reported amounts of assets and liabilities, the disclosure of contingent assets and liabilities at year-end and the reported amount of revenues and expenses during the year. Management regularly evaluates these estimates, including those related to employee benefits liabilities and assets held in trust relating to such liabilities; the carrying value of property, plant and equipment; intangible assets; valuation allowances for receivables, inventories and deferred income tax assets; liabilities for deferred income taxes, potential tax deficiencies, environmental obligations and potential litigation claims and settlements. Management's estimates are based on historical experience, current business and market conditions, and various other assumptions that are believed to be reasonable under the circumstances, the results of which form the basis for making judgments about the carrying values of assets and liabilities that are not readily apparent from other sources. Actual results may differ materially from current expectations under different assumptions or conditions.
Management believes that the following are the more significant judgments and estimates used in the preparation of the financial statements.
Identifiable intangible assets - Intangible assets with indefinite lives are subject to at least annual impairment testing, which compares the fair value of the intangible assets with their carrying amounts. U. S. Steel has determined that certain of its acquired intangible assets have indefinite useful lives. These assets are reviewed for impairment annually in the third quarter and whenever events or circumstances indicate the carrying value may not be recoverable. U. S. Steel performed a quantitative impairment evaluation of its indefinite-lived intangible assets, which consist of its water rights, during the third quarter of 2017. Based on the results of the evaluation, U. S. Steel's indefinite-lived intangible assets were not impaired. Based on the results of the quantitative impairment evaluation performed during 2016, the water rights were not impaired. Prior to the fourth quarter of 2016, U. S. Steel had in process research and development patents that had indefinite useful lives. Based on the results of the impairment evaluation, the estimated fair value of the patents had decreased below their carrying value. As a result, an impairment charge of approximately $14 million was recorded in the third quarter of 2016. The research and development activities of the Company's acquired indefinite lived in-process research and development patents was completed during the fourth quarter of 2016 and the carrying amount of the patents is being amortized over the useful lives of the patents (approximately 10 years).
Identifiable intangible assets with finite lives are amortized on a straight-line basis over their estimated useful lives and are reviewed for impairment whenever events or circumstances indicate that the carrying value may not be recoverable. During 2016, the permanent shutdown of certain Lorain, Lone Star and Bellville tubular assets was considered a triggering event for our welded and seamless tubular asset groups. U. S. Steel completed a review of certain of its identifiable intangible asset with finite lives, primarily customer relationships with a carrying value of $73 million at December 31, 2016, and determined the assets were not impaired. There were no triggering events that indicated the carrying value of the customer relationships may not be recoverable in 2017.
Inventories – Inventories are carried at the lower of cost or market for last-in, first-out (LIFO) inventories and lower of cost and net realizable value for first-in, first-out (FIFO) method inventories. LIFO is the predominant method of inventory costing for inventories in the United States and FIFO is the predominant method used in Europe. The LIFO method of inventory costing was used on 75 percent of consolidated inventories at both December 31, 2017 and 2016 . Since the LIFO inventory valuation methodology is an annual calculation, interim estimates of the annual LIFO valuation are required. We recognize the effects of the LIFO inventory valuation method on an interim basis by estimating the year end inventory amounts. The projections of annual LIFO inventory amounts are updated quarterly. Changes in U.S. GAAP rules or tax law, such as the elimination of the LIFO method of accounting for inventories, could negatively affect our profitability and cash flow.
Equity method investments – Investments in entities over which U. S. Steel has significant influence are accounted for using the equity method of accounting and are carried at U. S. Steel's share of net assets plus loans, advances and our share of earnings less distributions. Differences in the basis of the investment and the underlying net asset value of the investee, if any, are amortized into earnings over the remaining useful life of the associated assets.
61
Table of Contents
Income from investees includes U. S. Steel's share of income from equity method investments, which is generally recorded a month in arrears, except for significant and unusual items which are recorded in the period of occurrence. Gains or losses from changes in ownership of unconsolidated investees are recognized in the period of change. Intercompany profits and losses on transactions with equity investees have been eliminated in consolidation subject to lower of cost or market inventory adjustments.
U. S. Steel evaluates impairment of its equity method investments whenever circumstances indicate that a decline in value below carrying value is other than temporary. Under these circumstances, we would adjust the investment down to its estimated fair value, which then becomes its new carrying value. During the fourth quarter of 2016, the Company completed a review of its equity method investments and determined there was an other than temporary impairment of its Apolo equity investment due to the intent to sell its ownership interest at an amount less than the carrying value of the investment. Accordingly, U. S. Steel recorded an impairment charge of $12 million, which reduced the carrying value of the investment to $18 million at December 31, 2016. U. S. Steel sold its ownership interest in this equity investment in 2017. During the fourth quarter of 2015, U. S. Steel completed a review of its equity method investments and determined there was an other than temporary impairment of an equity investee within a non-core operating segment of U. S. Steel. The other than temporary impairment resulted from a decision to cease the funding of the long-term development plans of the equity investment, due to our intent to sell the particular investment, thereby inhibiting sufficient recovery of the market value. Accordingly, U. S. Steel recorded an impairment charge of $18 million, which reduced the carrying amount of the equity investment to $3 million, in the fourth quarter of 2015. U. S. Steel's ownership interest in this investment was sold in 2017.
Pensions and other benefits – The recording of net periodic benefit costs for defined benefit pensions and other benefits is based on, among other things, assumptions of the expected annual return on plan assets, discount rate, mortality, escalation or other changes in retiree health care costs and plan participation levels. Changes in the assumptions or differences between actual and expected changes in the present value of liabilities or assets of U. S. Steel's plans could cause net periodic benefit costs to increase or decrease materially from year to year as discussed below.
U. S. Steel's investment strategy for its U.S. pension plan assets provides for a diversified mix of public equities, high quality bonds and selected smaller investments in private equities, investment trusts and partnerships, timber and mineral interests. For its U.S. pension plan, U. S. Steel has a target allocation for plan assets of 55 percent in equities (inclusive of private equity and investment trusts). The balance is primarily invested in corporate bonds, Treasury bonds and government-backed mortgages. U. S. Steel believes that returns on equities over the long term will be higher than returns from fixed-income securities as actual historical returns from U. S. Steel's trusts have shown. Returns on bonds tend to offset some of the short-term volatility of stocks. Both equity and fixed-income investments are made across a broad range of industries and companies to provide protection against the impact of volatility in any single industry as well as company specific developments. U. S. Steel will use a 6.85 percent assumed rate of return on assets for the development of net periodic cost for the main defined benefit pension plan in 2018 . The 2018 assumed rate of return is lower than the rate of return used for 2017 domestic expense and was determined by taking into account the intended asset mix and some moderation of the historical premiums that fixed-income and equity investments have yielded above government bonds. Actual returns since the inception of the plans have exceeded this 6.85 percent rate and while recent annual returns have been volatile, it is U. S. Steel's expectation that rates will achieve this level in future periods.
For its other benefits plan assets, U. S. Steel employs a liability driven investment strategy. The plan assets are allocated to match the plan cash flows with maturing investments. To achieve this strategy, U. S. Steel has a target allocation for plan assets of 90 percent in high quality domestic bonds with the balance primarily invested in equity securities. U. S. Steel will use a 4.25 percent assumed rate of return on assets for the development of net periodic cost for its other benefits plans. The 2018 assumed rate of return has been conservatively set, taking into account the intended asset mix.
The expected long-term rate of return on plan assets is applied to the market value of assets as of the beginning of the period less expected benefit payments and considering any planned contributions.
To determine the discount rate used to measure our pension and other benefit obligations in 2016 and prior years, the discount rate for our U.S. plans was determined by utilizing several AAA and AA corporate bond indices as an indication of interest rate movements and levels. In 2017, we refined our discount rate determination process for our U.S. plans by using a bond matching approach to select specific bonds that would satisfy our projected benefit payments. At December 31, 2017 , the discount rate used for our pension and other benefit obligations was determined to be 4.00 percent and 4.03 percent, respectively, compared to the discount rate used of 4.00 percent and 4.00 percent, respectively,
62
Table of Contents
at December 31, 2016 . The discount rate reflects the current rate at which we estimate the pension and other benefits liabilities could be effectively settled at the measurement date.
At December 31, 2017, due to recent experience study on plan retirees, the Company updated the mortality assumptions used to calculate its main U.S. defined benefit pension and other post-employment benefit liabilities. As a result of this change in mortality assumptions, our projected benefit obligations have increased by $194 million and $42 million for pension and other benefits, respectively. However, this increase was more than offset by strong asset returns and a voluntary contribution of $75 million to our main domestic pension plan in 2017. As a result, the funded status of our pension and other benefit plans improved by $357 million and $111 million, respectively.
U. S. Steel reviews its actual historical rate experience and expectations of future health care cost trends to determine the escalation of per capita health care costs under U. S. Steel's benefit plans. Approximately three quarters of our costs for the domestic United Steelworkers (USW) participants' retiree health benefits in the Company's main domestic benefit plan are limited to a per capita dollar maximum calculation based on 2006 base year actual costs incurred under the main U. S. Steel benefit plan for USW participants (cost cap). The full effect of the cost cap is expected to be realized around 2024. After 2024, the Company's costs for a majority of USW retirees and their dependents are expected to remain fixed and as a result, the cost impact of health care escalation for the Company is projected to be limited for this group (See Note 17 to the Consolidated Financial Statements). For measurement of its domestic retiree medical plans where health care cost escalation is applicable, U. S. Steel has assumed an initial escalation rate of 7.0 percent for 2018 . This rate is assumed to decrease gradually to an ultimate rate of 5.0 percent in 2022 and remain at that level thereafter.
Net periodic pension cost, including multiemployer plans, is expected to total approximately $135 million in 2018 compared to $109 million in 2017 . Excluding the settlement, termination and curtailment losses totaling $7 million in 2017 , the increase in expected expense in 2018 is primarily due to lower expected return on assets and updates to the mortality assumption, partially offset by the impact of above expected asset returns for 2017. Total other benefits costs in 2018 are expected to be approximately $60 million , compared to $78 million in 2017 . The decrease in expense in 2018 is primarily a result of the higher expected return on assets assumption.
A sensitivity analysis of the projected incremental effect of a hypothetical one percentage point change in the significant assumptions used in the pension and other benefits calculations is provided in the following table:
|
| Hypothetical Rate Increase (Decrease) | ||||||
(In millions) |
| 1% |
| (1)% | ||||
Expected return on plan assets |
|
|
|
| ||||
Incremental (decrease) increase in: |
|
|
|
| ||||
Net periodic pension costs for 2018 |
| $ | (72 | ) |
| $ | 72 | |
Discount rate |
|
|
|
| ||||
Incremental (decrease) increase in: |
|
|
|
| ||||
Net periodic pension & other benefits costs for 2018 |
| $ | (8 | ) |
| $ | 6 | |
Pension & other benefits obligations at December 31, 2017 |
| $ | (743 | ) |
| $ | 885 | |
Health care cost escalation trend rates |
|
|
|
| ||||
Incremental increase (decrease) in: |
|
|
|
| ||||
Other post-employment benefit obligations |
| $ | 99 | |
| $ | (85 | ) |
Service and interest costs components for 2018 |
| $ | 5 | |
| $ | (4 | ) |
Changes in the assumptions for expected annual return on plan assets and the discount rate used for accounting purposes do not impact the funding calculations used to derive minimum funding requirements for the pension plan. However, the discount rate required for minimum funding purposes is also based on corporate bond related indices and as such, the same general sensitivity concepts as above can be applied to increases or decreases to the funding obligations of the plans assuming the same hypothetical rate changes. (See Note 17 to the Consolidated Financial Statements for a discussion regarding legislation enacted in November of 2015 that impacts the discount rate used for funding purposes.) For further cash flow discussion see "Item 7. Management's Discussion and Analysis of Financial Condition and Results of Operations – Financial Condition, Cash Flows and Liquidity – Liquidity."
63
Table of Contents
Long-lived assets – U. S. Steel evaluates long-lived assets, primarily property, plant and equipment for impairment whenever changes in circumstances indicate that the carrying amounts of those productive assets exceed their recoverable amount as determined by the asset group's projected undiscounted cash flows. We evaluate the impairment of long-lived assets at the asset group level. Our primary asset groups are Flat-Rolled, welded tubular, seamless tubular and U. S. Steel Europe (USSE). During 2017, there were no triggering events that required long-lived assets to be evaluated for impairment. During 2016, the permanent shutdown of certain Lorain, Lone Star and Bellville tubular assets was considered a triggering event for our welded and seamless tubular asset groups. U. S. Steel completed a quantitative analysis of its long-lived assets for these asset groups within the Tubular segment, and determined that the remaining assets were not impaired. The welded tubular asset group had a carrying value of $410 million at December 31, 2016 and the recoverable amount exceeded this carrying value by approximately $93 million, or 23 percent. The seamless tubular asset group had a carrying value of $210 million at December 31, 2016 and the recoverable amount exceeded this carrying value by $220 million, or 106 percent. The key assumption used to estimate the recoverable amounts for both the welded and seamless tubular asset groups was the forecasted price of oil over the 11-year average remaining useful lives of the assets within the asset groups. Management will continue to monitor market and economic conditions for triggering events that may warrant further review of long-lived assets.
Taxes – U. S. Steel records a valuation allowance to reduce deferred tax assets to the amount that is more likely than not to be realized. A valuation allowance is recorded if, based on the weight of all available positive and negative evidence, it is more likely than not that some portion, or all, of a deferred tax asset will not be realized. Each quarter U. S. Steel analyzes the likelihood that our deferred tax assets will be realized.
At December 31, 2015, it was determined that a valuation allowance against our entire net domestic deferred tax asset was required. As a result, U. S. Steel recorded a non-cash charge to tax expense. This determination, which is evaluated each quarter, was based upon the following forms of negative evidence concerning U. S. Steel's ability to use some or all of its domestic deferred tax assets:
• | U. S. Steel's domestic operations had generated significant losses in recent years and there was uncertainty regarding the Company's ability to generate domestic income in the near term, |
• | some of our domestic deferred tax assets were carryforwards, which have expiration dates, and |
• | the global steel industry was experiencing global overcapacity, which was driving adverse economic conditions, |
including depressed selling prices for steel products and increased foreign steel imports into the U.S.
Most positive evidence can be categorized into one of the four sources of taxable income sequentially. These are (from least to most subjective):
• | taxable income in prior carryback years, if carryback is permitted |
• | future reversal of existing taxable temporary differences |
• | tax planning strategies, and |
• | future taxable income exclusive of reversing temporary differences and carryforwards |
U. S. Steel utilized all available carrybacks, and therefore, our analysis at December 31, 2015 focused on the other sources of taxable income. Our projection of the reversal of our existing temporary differences generated significant taxable income. This source of taxable income, however, was not sufficient to project full utilization of U. S. Steel's domestic deferred tax assets. To assess the realizability of the remaining domestic deferred tax assets, U. S. Steel analyzed its prudent and feasible tax planning strategies.
At December 31, 2015, after weighing all the positive and negative evidence, U. S. Steel determined that it was more likely than not that the net domestic deferred tax asset (excluding a deferred tax liability with an indefinite life) may not be realized. As a result, U. S. Steel recorded a valuation allowance of $804 million.
At December 31, 2016, the valuation allowance was increased by $305 million due to an increase in the net domestic deferred tax asset.
At December 31, 2017, after weighing all the positive and negative evidence, U. S. Steel determined that it was still more likely than not that the net domestic deferred tax asset (excluding a deferred tax asset related to refundable alternative minimum tax (AMT) credits and a deferred tax liability related to an asset with an indefinite life) may not be realized. The valuation allowance was decreased by $505 million due to the reduction in the corporate income tax rate pursuant to the Tax Cut and Jobs Act of 2017 (the 2017 Act) and current year activity. U. S. Steel will continue to monitor the realizability of its deferred tax assets on a quarterly basis. In the future, if we determine that realization is
64
Table of Contents
more likely than not for deferred tax assets with a valuation allowance, the related valuation allowance will be reduced and we will record a non-cash benefit to earnings.
At the end of both 2017 and 2016, U. S. Steel did not have any undistributed foreign earnings and profits for which U.S. deferred taxes have not been provided.
U. S. Steel records liabilities for uncertain tax positions. These liabilities are based on management's judgment of the risk of loss for items that have been or may be challenged by taxing authorities. If U. S. Steel determines that tax-related items would not be considered uncertain tax positions or that items previously not considered to be potential uncertain tax positions could be considered potential uncertain tax positions (as a result of an audit, court case, tax ruling or other authoritative tax position), an adjustment to the liability would be recorded through income in the period such determination was made.
Environmental remediation – U. S. Steel has been identified as a potentially responsible party (PRP) at seven sites under the Comprehensive Environmental Response, Compensation, and Liability Act of 1980 (CERCLA) as of December 31, 2017 . Of these, there are two sites where information requests have been received or there are other indications that U. S. Steel may be a PRP under CERCLA, but where sufficient information is not presently available to confirm the existence of liability or to make a reasonable estimate with respect to any potential liabilities. There are also 19 additional sites where U. S. Steel may be liable for remediation costs in excess of $100,000 under other environmental statutes, both federal and state, or where private parties are seeking to impose liability on U. S. Steel for remediation costs through discussions or litigation. At many of these sites, U. S. Steel is one of a number of parties involved and the total cost of remediation, as well as U. S. Steel's share, is frequently dependent upon the outcome of ongoing investigations and remedial studies. U. S. Steel accrues for environmental remediation activities when the responsibility to remediate is probable and the amount of associated costs is reasonably determinable. As environmental remediation matters proceed toward ultimate resolution or as remediation obligations arise, charges in excess of those previously accrued may be required.
Consistent with the prior year, U. S. Steel's accrual for environmental liabilities for U.S. and international facilities as of December 31, 2017 was $179 million. These amounts exclude liabilities related to asset retirement obligations, disclosed in Note 18 to the Consolidated Financial Statements.
U. S. Steel is the subject of, or a party to, a number of pending or threatened legal actions, contingencies and commitments involving a variety of matters, including laws and regulations relating to the environment. The ultimate resolution of these contingencies could, individually or in the aggregate, be material to the Consolidated Financial Statements.
For discussion of relevant environmental items, see "Part I. Item 3. Legal Proceedings-Environmental Proceedings."
Segments
U. S. Steel has three reportable segments: Flat-Rolled Products (Flat-Rolled), USSE and Tubular Products (Tubular). The results of our railroad and real estate businesses that do not constitute reportable segments are combined and disclosed in the Other Businesses category.
The Flat-Rolled segment includes the operating results of U. S. Steel's integrated steel plants and equity investees in North America involved in the production of slabs, strip mill plates, sheets and tin mill products, as well as all iron ore and coke production facilities in the United States. These operations primarily serve North American customers in the service center, conversion, transportation (including automotive), construction, container, and appliance and electrical markets. Additionally, the Flat-Rolled segment consists of the following three commercial entities to specifically address our customers and service their needs: (1) automotive solutions, (2) consumer solutions, and (3) industrial, service center and mining solutions.
Flat-Rolled has historically supplied steel rounds and hot-rolled bands to Tubular. In the third quarter of 2015, the blast furnace and associated steelmaking operations, along with most of the flat-rolled finishing operations at Fairfield Works were shutdown. Therefore, Flat-Rolled is currently not supplying rounds to Tubular, and will not in the future.
The USSE segment includes the operating results of U. S. Steel Košice (USSK), U. S. Steel's integrated steel plant and coke production facilities in Slovakia, and its subsidiaries. USSE primarily serves customers in the Eastern European construction, service center, conversion, container, transportation (including automotive), appliance and electrical, and oil, gas and petrochemical markets. USSE produces and sells slabs, sheet, strip mill plate, tin mill products and spiral welded pipe, as well as heating radiators and refractory ceramic materials.
65
Table of Contents
The Tubular segment includes the operating results of U. S. Steel's tubular production facilities, in the United States, and equity investees in the United States and Brazil. Our ownership interest in the equity investment in Brazil was sold in December of 2017. These operations produce and sell seamless and electric resistance welded (ERW) steel casing and tubing (commonly known as oil country tubular goods or OCTG), standard and line pipe and mechanical tubing and primarily serve customers in the oil, gas and petrochemical markets. In March 2017, U. S. Steel made the strategic decision to permanently shutdown the Lorain No. 6 Quench & Temper Mill and relocate the equipment. During the fourth quarter of 2016, certain of our tubular assets within the Tubular segment were permanently shut down, including Pipe Mill #1 at our Lone Star facility, Pipe Mill #4 at our Lorain facility and our Bellville facility, as a result of the challenging market conditions for tubular products. Additionally, we sold the assets at our McKeesport tubular operations in 2016.
For further information, see Note 4 to the Consolidated Financial Statements.
Net Sales
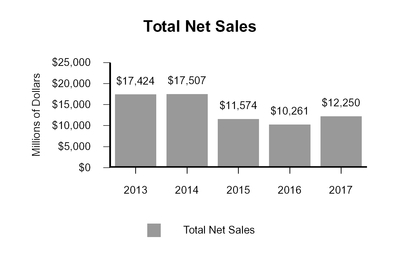
Net Sales by Segment
(Dollars in millions, excluding intersegment sales) |
| 2017 |
| 2016 |
| 2015 | ||||||
Flat-Rolled |
| $ | 8,297 | |
| $ | 7,507 | |
| $ | 8,293 | |
USSE |
| 2,949 | |
| 2,243 | |
| 2,323 | | |||
Tubular |
| 944 | |
| 449 | |
| 898 | | |||
Total sales from reportable segments |
| 12,190 | |
| 10,199 | |
| 11,514 | | |||
Other Businesses |
| 60 | |
| 62 | |
| 60 | | |||
Net sales |
| $ | 12,250 | |
| $ | 10,261 | |
| $ | 11,574 | |
66
Table of Contents
Management's analysis of the percentage change in net sales for U. S. Steel's reportable business segments is set forth in the following tables:
Year Ended December 31, 2017 versus Year December 31, 2016
|
| Steel Products (a) |
|
|
|
| ||||||||||||
Volume |
| Price |
| Mix |
| FX (b) |
| Coke, Pellets & Other (c) |
| Net | ||||||||
Flat-Rolled |
| (3 | )% |
| 26 | % |
| (16 | )% |
| - | % |
| 4 | % |
| 11 | % |
USSE |
| 2 | % |
| 26 | % |
| - | % |
| 2 | % |
| 1 | % |
| 31 | % |
Tubular |
| 74 | % |
| 13 | % |
| 17 | % |
| - | % |
| 6 | % |
| 110 | % |
(a) | Excludes intersegment sales |
(b) | Foreign currency translation effects |
(c) | Includes sales of scrap inventory |
The increase in sales for the Flat-Rolled segment primarily reflected higher average realized prices (increase of $60 per net ton) as a result of improved market conditions, notably for hot-rolled products, that resulted in spot price increases in 2017 as well as price increases for both market-based and firm priced contracts from 2016 to 2017, and sales also increased due to a favorable impact from higher third-party pellet sales. These increases were partially offset by a lower value product mix and decreased shipments (decrease of 207 thousand net tons).
The increase in sales for the USSE segment was primarily due to higher average realized euro-based prices (increase of €115 per net ton) as a result of lower imports and increased shipments (increase of 89 thousand net tons).
The increase in sales from 2016 to 2017 for the Tubular segment primarily reflected increased shipments (increase of 288 thousand net tons), a favorable impact on product mix as a result of increased shipments of seamless tubular products, and higher average realized prices (increase of $182 per net ton) as a result of improved market conditions.
Year Ended December 31, 2016 versus Year Ended December 31, 2015
|
| Steel Products (a) |
|
|
|
| ||||||||||||
Volume |
| Price |
| Mix |
| FX (b) |
| Coke, Pellets & Other (c) |
| Net | ||||||||
Flat-Rolled |
| (4 | )% |
| (3 | )% |
| - | % |
| - | % |
| (2 | )% |
| (9 | )% |
USSE |
| 3 | % |
| (5 | )% |
| (1 | )% |
| - | % |
| - | % |
| (3 | )% |
Tubular |
| (27 | )% |
| (24 | )% |
| 2 | % |
| - | % |
| (1 | )% |
| (50 | )% |
(a) | Excludes intersegment sales |
(b) | Foreign currency translation effects |
(c) | Includes sales of scrap inventory |
The decrease in sales for the Flat-Rolled segment primarily reflected lower shipments (decrease of 501 thousand net tons, which includes the reduction in shipments due to the permanent shutdown of Fairfield Flat-Rolled Operations, as well as operational issues across our Flat-Rolled facilities) and lower average realized prices (decrease of $29 per net ton) as a result of market conditions, including high import levels, which have served to reduce shipment volumes and depress both spot and contract prices. In the second half of 2016 we experienced unplanned outages at several of our steelmaking and finishing facilities and our operating configuration in 2016 extended the time it took to recover volumes from unplanned outages.
The decrease in sales for the USSE segment was primarily due to lower average realized euro-based prices (decrease of €28 per net ton), partially offset by an increase in shipments (increase of 139 thousand net tons).
The decrease in sales from 2015 to 2016 for the Tubular segment primarily reflected lower shipments (decrease of 193 thousand net tons) and lower average realized prices (decrease of $393 per net ton) as a result of reduced drilling activity caused by low crude oil prices and continued high import levels.
Operating Expenses
67
Table of Contents
Union profit-sharing costs
|
| Year Ended December 31, | ||||||||||
(Dollars in millions) |
| 2017 |
| 2016 |
| 2015 | ||||||
Allocated to segment results |
| $ | 35 | |
| $ | 3 | |
| $ | - | |
Effective January 1, 2016, profit-based amounts per the 2015 Labor Agreements are calculated and paid on a quarterly basis as a percentage of consolidated earnings (loss) before interest and income taxes based on 7.5 percent of profit between $10 and $50 per ton and 15 percent of profit above $50 per ton (10 percent of profit above $50 per ton in prior periods).
The amounts above represent profit-sharing amounts paid to active USW-represented employees and are included in cost of sales on the Consolidated Statement of Operations.
Pension and other benefits costs
Defined benefit and multiemployer pension plan costs totaled $109 million in 2017 , $106 million in 2016 and $291 million during 2015 . Plan costs in 2017 , 2016 and 2015 included $7 million, $13 million and $35 million of settlement and curtailment costs, respectively. Excluding these costs, the $9 million increase from 2016 to 2017 is primarily due to lower expected return on assets, updates to the mortality assumption and unfavorable retirement experience. U. S. Steel calculates its market-related value of assets such that investment gains or losses as compared to expected returns are recognized over a three-year period. To the extent that deferred gains and losses on plan assets are not yet reflected in this calculated value, the amounts do not impact expected asset returns or the net actuarial gains or losses subject to amortization within the net periodic pension expense calculation. (See Note 17 to the Consolidated Financial Statements.)
In November 2015, pension stabilization legislation further extended a revised interest rate formula to be used to measure defined benefit pension obligations for calculating minimum annual contributions. The new interest rate formula results in higher interest rates for minimum funding calculations as compared to prior law over the next few years, which will improve the funded status of our main defined benefit pension plan and reduce minimum required contributions. In 2017, the Company made a voluntary contribution of $75 million to the U. S. Steel Retirement Plan Trust, which is the funding vehicle for the Company's main defined benefit pension plan. Historically, U. S. Steel has made voluntary contributions to our main U.S. defined benefit plan, including a voluntary stock contribution of $100 million in 2016. U. S. Steel will monitor the status of the plan to determine when voluntary contributions may be prudent to mitigate potentially larger mandatory contributions in later years.
Costs related to defined contribution plans totaled $42 million during 2017 , 2016 and 2015 .
Other benefits (income), which are included in earnings (loss) before interest and income taxes, totaled $78 million in 2017 , $(5) million in 2016 and $(40) million in 2015 . The $83 million increase in expense from 2016 to 2017 is primarily due to lower return on assets assumptions as a result of actions taken in 2016 to de-risk the OPEB plan. For additional information on pensions and other benefits, see Note 17 to the Consolidated Financial Statements.
Selling, general and administrative expenses
Selling, general and administrative expenses were $375 million in 2017 , $255 million in 2016 and $415 million in 2015 . The increase from 2016 to 2017 is primarily related to higher pension and other benefit costs, as discussed above. The decrease from 2015 to 2016 is primarily related to lower pension costs, primarily due to the freezing of benefit accruals for non-represented participants effective December 31, 2015 and the natural maturation of our pension plans, offset by better asset performance, as well as impacts from Company-wide headcount reductions.
Operating configuration adjustments
Over the past three years, the Company has adjusted its operating configuration in response to challenging market conditions as a result of global overcapacity and unfair trade practices by indefinitely and temporarily idling production at certain of its facilities.
As of December 31, 2017 , the following facilities are temporarily idled:
Temporarily Idled:
68
Table of Contents
Tubular Processing (idled in April 2015)
Granite City Works - Steelmaking Operations (idled in December 2015)
The carrying value of the long-lived assets associated with the temporarily idled facilities listed above total approximately $160 million.
Other Strategic Decisions
In March 2017, U. S. Steel made the strategic decision to permanently shutdown the Lorain No. 6 Quench & Temper Mill and relocate the equipment.
In December 2016, U. S. Steel made the strategic decision to permanently shutdown the Lorain #4 and Lone Star #1 pipe mills and the Bellville Tubular Operations after considering a number of factors, including challenging market conditions for tubular products, reduced rig counts, and high levels of unfairly traded imports.
U. S. Steel will continue to evaluate potential strategic and organizational opportunities, which may include the acquisition, divestiture or consolidation of assets. Given recent market conditions, the cyclicality of our industry, and the continued challenges faced by the Company, we are focused on strategically maintaining and spending cash (including capital investments under our asset revitalization program), in order to invest in areas consistent with our long-term strategy, and are considering various possibilities, including exiting lines of business and the sale of certain assets, that we believe would ultimately result in a stronger balance sheet and greater stockholder value. The Company will pursue opportunities based on its long-term strategy, and what the Board of Directors determines to be in the best interests of the Company's stockholders at the time.
Better operating performance in our Flat-Rolled segment, coupled with relatively stable market conditions during 2017, have resulted in improved segment results in recent quarters. As we continue with the implementation of our asset revitalization program, described below, and increase investment in our facilities, we expect the sustainable improvements in safety, quality, delivery and costs we are targeting to position us to succeed over the long term, and support future growth initiatives.
Asset Revitalization
As part of our long-term strategy, the Board of Directors has approved a $2 billion multi-year asset revitalization program focused on our Flat-Rolled segment. The program is structured over four years, and involves capital investments totaling approximately $1.5 billion. Management evaluated performance in the key industries we serve, and developed projects across multiple Flat-Rolled segment assets with a focus on continuous improvement in safety, quality, delivery and cost. The Company views this program as essential to improving predictability and our ability to compete effectively in the industry. As we revitalize our assets, we expect to increase profitability, productivity, and operational stability, and reduce volatility.
The asset revitalization program includes projects to address short-term operational and maintenance enhancements as well as larger initiatives. The projects vary in scope and cost. The investments specifically address issues that are critical to delivering quality products to our customers in a timely manner.
The identified projects and schedule may change to address our customers' needs, current and future economic operating conditions, and risks identified in the production cycle. Through the multi-year asset revitalization program, we expect to make total capital investments of $1.5 billion, which consist of capital investments in our iron making facilities, steel making facilities, hot rolling facilities, and finishing facilities. The Company plans to fund the program through cash generated from operations and cash on hand.
Our total capital expenditures for 2017 were $505 million, which includes $249 million for the Company's asset revitalization program.
Depreciation, depletion and amortization
Depreciation, depletion and amortization expenses were $501 million in 2017 , $507 million in 2016 and $547 million in 2015 . Depreciation expense in 2017 was consistent with 2016 depreciation expense. The decrease from 2015 to 2016 is primarily related to the write-off of assets as a result of the permanent shutdown of the Fairfield Flat-Rolled Operations in 2015.
69
Table of Contents
Earnings from investees
Earnings from investees was $44 million in 2017 , $98 million in 2016 and $38 million in 2015 . The decrease from 2016 to 2017 is primarily due to decreased earnings from our joint venture finishing and mining affiliates. The increase from 2015 to 2016 is primarily due to increased earnings from our joint venture mining affiliates, partially offset by a $12 million impairment charge for an equity investee.
Restructuring and Other Charges
During 2017, U. S. Steel recorded net restructuring charges of approximately $31 million , which consists of charges of $37 million primarily related to the permanent shutdown and relocation of the No. 6 Quench & Temper Mill at Lorain Tubular Operations and a favorable adjustment of $6 million primarily associated with a change in estimate for previously recorded costs for environmental obligations and Company-wide headcount reductions. Cash payments were made related to severance and exit costs of $32 million .
During 2016, U. S. Steel recorded net restructuring charges of approximately $122 million , which consists of: (1) charges of $124 million related to the permanent shutdown of the Lorain #4, Lone Star #1 and Bellville pipe mills within our Tubular segment; (2) charges of $24 million for Company-wide headcount reductions, including within our Flat-Rolled, Tubular and USSE segments; and (3) a favorable adjustment of $26 million primarily associated with a change in estimate for previously recorded costs for Company-wide headcount reductions. Cash payments were made related to severance and exit costs of $79 million .
Charges for restructuring and ongoing cost reduction initiatives are recorded in the period U. S. Steel commits to a restructuring or cost reduction plan, or executes specific actions contemplated by the plan and all criteria for liability recognition have been met. Charges related to the restructuring and cost reductions are reported in restructuring and other charges in the Consolidated Statements of Operations.
The Company has realized actual cash savings of approximately $300 million related to restructuring efforts through December 31, 2017 .
Gain and loss associated with U. S. Steel Canada Inc.
USSC, an indirect wholly owned subsidiary of U. S. Steel, applied for relief from its creditors pursuant to CCAA in September of 2014. Subsequent to the CCAA filing, U. S. Steel's management continued to assess the recoverability of the Company's retained interest in USSC. During 2015, management's estimate of the recoverable retained interest was updated as a result of economic conditions impacting the steel industry in North America such as lower prices, elevated levels of imports, the strength of the U.S. dollar and depressed steel company valuations as well as the uncertainty of the ultimate outcome of USSC's CCAA filing. As a result, a pre-tax charge was recognized during the fourth quarter of 2015, bringing the total charge to $392 million for the fiscal year ended December 31, 2015.
On June 30, 2017, U. S. Steel completed the restructuring and disposition of USSC through a sale and transfer of all of the issued and outstanding shares in USSC to an affiliate of Bedrock. In accordance with the Second Amended and Restated Plan of Compromise, Arrangement and Reorganization, approved by the Ontario Superior Court of Justice on June 9, 2017, U. S. Steel received approximately $127 million in satisfaction of its secured claims, including interest, which resulted in a gain of $72 million on the Company's retained interest in USSC. U. S. Steel also agreed to the discharge and cancellation of its unsecured claims for nominal consideration. The terms of the settlement also included mutual releases among key stakeholders, including a release of all claims against the Company regarding environmental, pension and other liabilities.
70
Table of Contents
Earnings (loss) before interest and income taxes by Segment (a)
|
| Year Ended December 31, | ||||||||||
(Dollars in Millions) |
| 2017 |
| 2016 |
| 2015 | ||||||
Flat-Rolled |
| $ | 380 | |
| $ | (3 | ) |
| $ | (237 | ) |
USSE |
| 327 | |
| 185 | |
| 81 | | |||
Tubular |
| (99 | ) |
| (304 | ) |
| (179 | ) | |||
Total earnings (loss) from reportable segments |
| 608 | |
| (122 | ) |
| (335 | ) | |||
Other Businesses |
| 44 | |
| 63 | |
| 33 | | |||
Segment earnings (loss) before interest and income taxes |
| 652 | |
| (59 | ) |
| (302 | ) | |||
Items not allocated to segments: |
|
|
|
|
|
| ||||||
Post-employment benefit (expense) income (b) |
| (66 | ) |
| 62 | |
| (43 | ) | |||
Other items not allocated to segments: |
|
|
|
|
|
| ||||||
Loss on shutdown of certain tubular pipe mill assets (c) |
| (35 | ) |
| (126 | ) |
| - | | |||
Gain (loss) associated with U. S. Steel Canada Inc. (Note 5) |
| 72 | |
| - | |
| (392 | ) | |||
Loss on shutdown of Fairfield Flat-Rolled Operations (c) (d) |
| - | |
| - | |
| (91 | ) | |||
Loss on shutdown of coke production facilities (c) |
| - | |
| - | |
| (153 | ) | |||
Restructuring and other charges (c) |
| - | |
| 2 | |
| (78 | ) | |||
Granite City Works temporary idling charges |
| (17 | ) |
| (18 | ) |
| (99 | ) | |||
Post-employment benefit actuarial adjustment |
| - | |
| - | |
| (26 | ) | |||
Gain (loss) on equity investee transactions (Note 11) |
| 2 | |
| (12 | ) |
| (18 | ) | |||
Impairment of intangible assets (Note 13) |
| - | |
| (14 | ) |
| - | | |||
Total earnings (loss) before interest and income taxes |
| $ | 608 | |
| $ | (165 | ) |
| $ | (1,202 | ) |
(a) | See Note 4 to the Consolidated Financial Statements for reconciliations and other disclosures required by Accounting Standards Codification Topic 280. |
(b) | Consists of the net periodic benefit cost elements, other than service cost and amortization of prior service cost for active employees, associated with our defined pension, retiree health care and life insurance benefit plans. |
(c) | Included in Restructuring and other charges on the Consolidated Statements of Operations. See Note 24 to the Consolidated Financial Statements. |
(d) | Fairfield Flat-Rolled Operations includes the blast furnace and associated steelmaking operations, along with most of the flat-rolled finishing operations at Fairfield Works. The #5 coating line continues to operate. |
71
Table of Contents
Gross Margin by Segment
|
| Year Ended December 31, | |||||||
|
| 2017 |
| 2016 |
| 2015 | |||
Flat-Rolled |
| 11 | % |
| 6 | % |
| 2 | % |
USSE |
| 15 | % |
| 14 | % |
| 9 | % |
Tubular |
| (2 | )% |
| (43 | )% |
| (6 | )% |
72
Table of Contents
Segment results for Flat-Rolled
(Excludes the results of USSC beginning September 16, 2014)
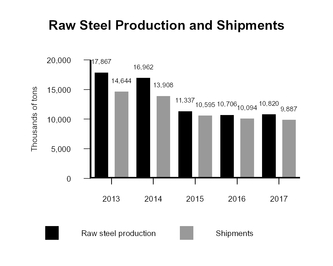
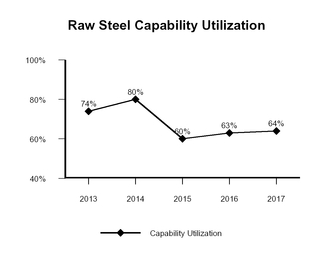
| Average Realized Price Per Ton |
| Segment Earnings (Loss) before Interest and Income Taxes |
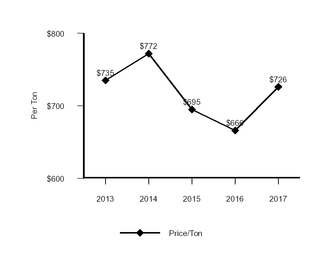
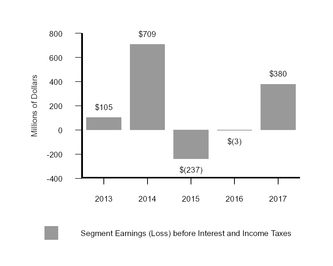
The Flat-Rolled segment had earnings of $380 million for the year ended December 31, 2017 compared to a loss of $3 million for the year ended December 31, 2016 . The increase in Flat-Rolled results for 2017 compared to 2016 resulted from higher average realized prices (approximately $695 million) as a result of improved market conditions, a favorable impact related to our change in accounting method for property, plant and equipment (approximately $150 million), higher results from our mining operations (approximately $80 million) including benefits from the restart of our Keetac facility to support third-party pellet sales, and increased shipments to our Tubular segment (approximately $50 million). These changes were partially offset by increased maintenance and asset revitalization spending and other operating costs (approximately $330 million) and higher raw materials costs, primarily scrap and coal (approximately $275 million).
The Flat-Rolled segment had a loss of $3 million for the year ended December 31, 2016 compared to a loss of $237 million for the year ended December 31, 2015 . The increase in Flat-Rolled results for 2016 compared to 2015 was primarily due to lower raw materials costs (approximately $275 million), reduced losses in 2016 after the shutdown of the blast furnace and associated steel making assets and most of the finishing operations at Fairfield Works in the third quarter of 2015 (approximately $145 million), decreased spending for repairs and maintenance and other operating costs (approximately $145 million), reduced costs associated with lower operating rates at our mining operations (approximately $70 million) and lower energy costs, primarily natural gas costs (approximately $55 million). These changes were partially offset by lower average realized prices (approximately $390 million) as a result of market conditions and higher levels of imports and higher costs for profit based payments (approximately $75 million).
73
Table of Contents
Gross margin for 2017 as compared to 2016 increased primarily as a result of higher average realized prices due to improved contract and spot market prices, in addition to the favorable impact on cost of goods sold related to our change in accounting method for property, plant and equipment. G ross margin for 2016 as compared to 2015 increased primarily due to lower raw materials costs and our lower and more flexible cost structure.
74
Table of Contents
Segment results for USSE
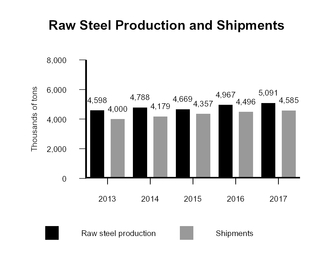
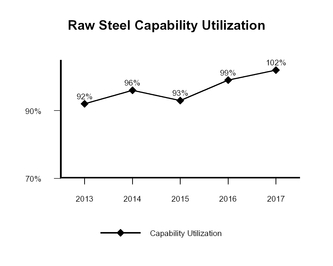
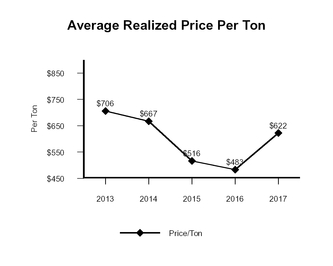
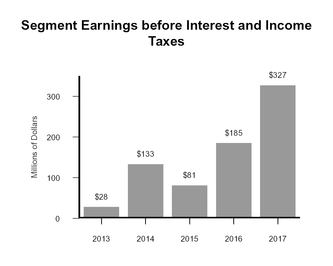
The USSE segment had earnings of $327 million for the year ended December 31, 2017 compared to earnings of $185 million for the year ended December 31, 2016 . The increase in USSE results in 2017 compared to 2016 was primarily due to higher average realized euro-based prices (approximately $600 million), the strengthening of the euro versus the U.S. dollar in 2017 as compared to the prior year (approximately $15 million) and increased shipments (approximately $10 million). These changes were partially offset by higher raw materials costs, primarily coal and iron ore (approximately $475 million).
The USSE segment had earnings of $185 million for the year ended December 31, 2016 compared to earnings of $81 million for the year ended December 31, 2015 . The increase in USSE results in 2016 compared to 2015 was primarily due to lower raw materials costs (approximately $145 million), reduced costs due to operating efficiencies (approximately $60 million) and decreased energy costs (approximately $20 million). These changes were partially offset by lower average realized euro-based prices (approximately $130 million), as selling prices reached a 5-year low in early 2016.
Gross margin for 2017 as compared to 2016 increased primarily due to higher average realized euro-based prices, partially offset by higher raw materials costs. Gross margin for 2016 as compared to 2015 increased primarily due to lower raw materials costs and operating efficiencies.
75
Table of Contents
Segment results for Tubular
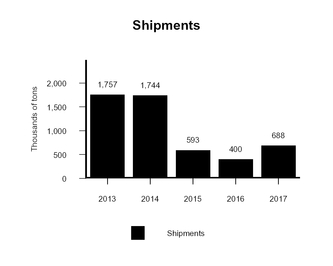
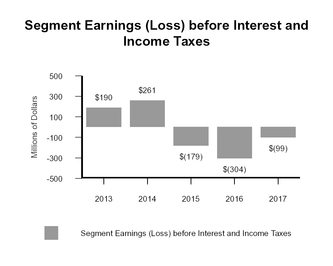
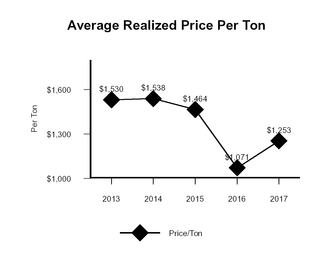
The Tubular segment had a loss of $99 million for the year ended December 31, 2017 compared to a loss of $304 million for the year ended December 31, 2016 . The increase in Tubular results in 2017 as compared to 2016 was primarily due to higher average realized prices and shipment volumes as a result of improving market conditions (approximately $105 million), decreased labor and other operating costs (approximately $95 million), favorable impacts from changes to our operating footprint (approximately $35 million) and favorable lower of cost or market (LCM) adjustments (approximately $30 million). These changes were partially offset by higher substrate costs (approximately $60 million).
The Tubular segment had a loss of $304 million for the year ended December 31, 2016 compared to a loss of $179 million for the year ended December 31, 2015 . The decrease in Tubular results in 2016 as compared to 2015 was primarily due to lower average realized prices (approximately $135 million), decreased shipment volumes (approximately $25 million) as a result of high import levels, lower energy pricing and a continued decline in drilling activity and lower of cost or market (LCM) adjustments for obsolete inventory related to the prolonged downturn in the energy markets (approximately $45 million). These changes were partially offset by decreased repairs and maintenance and other operating costs (approximately $45 million) and lower raw materials costs (approximately $30 million).
Gross margin for 2017 as compared to 2016 increased primarily due to increased average realized prices and shipment volumes and operating efficiencies. Gross margin for 2016 as compared to 2015 decreased as a result of production cost inefficiencies driven by the decrease in shipments.
76
Table of Contents
Results for Other Businesses
Other Businesses had earnings of $44 million, $63 million and $33 million for 2017 , 2016 and 2015 , respectively.
77
Table of Contents
Items not allocated to segments:
The increase in post-employment benefit expense in 2017 as compared to 2016 resulted from lower return on asset assumptions as a result of actions taken in 2016 to de-risk the OPEB plan. The decrease in expense in 2016 as compared to 2015 resulted from lower pension expenses as a result of the freezing of benefit accruals for non-represented participants effective December 31, 2015.
We recorded a $35 million loss on the shutdown of certain tubular assets in 2017 as a result of the permanent shutdown and relocation of the No. 6 Quench & Temper Mill at Lorain Tubular Operations. We recorded a loss on shutdown of certain tubular pipe mill assets of $126 million in 2016 as a result of the permanent closure of the Lorain #4 and Lone Star #1 pipe mills and the Bellville Tubular Operations.
We recognized a $72 million gain associated with U. S. Steel Canada Inc. (USSC) as a result of the restructuring and disposition of USSC on June 30, 2017. We recorded a $392 million loss associated with U. S. Steel Canada Inc. in 2015 as a result of a change in our assessment of the recoverability of the Company's retained interest in USSC and other charges.
We recorded $17 million, $18 million and $99 million of Granite City Works temporary idling charges during 2017, 2016 and 2015, respectively.
We recognized a gain on equity investee transactions of $2 million in 2017 primarily as a result of a gain on sale of our 15% ownership interest in Tilden Mining Company, L.C., partially offset by a loss on sale of our 50% ownership interest in Apolo Tubulars, S.A. In 2016, the Company determined there was an other than temporary impairment of its Apolo equity investment due to the intent to sell its ownership interest at an amount less than the carrying value of the investment. Accordingly, an impairment charge of $12 million was recorded in 2016. The Company sold its ownership interest in this equity investment in 2017. During 2015, U. S. Steel determined there was an other than temporary impairment of an equity investee within a non-core operating segment of U. S. Steel, due to our intent to sell the particular investment, thereby inhibiting sufficient recovery of the market value. As a result, an impairment charge of $18 million was recorded in 2015 and during the first quarter of 2017, this investment was sold.
We recorded a net favorable adjustment of $2 million in restructuring and other charges in 2016 primarily due to changes in estimates associated with supplemental unemployment and severance cost accruals with respect to our actions to adjust our operating configuration, streamline our operational processes, and reduce costs. We recorded restructuring and other charges of $78 million during 2015 as a result of further actions to adjust our operational footprint.
We recorded an impairment charge of $14 million on our indefinite lived intangible assets related to certain of our patents in our Tubular segment as a result of an annual quantitative evaluation that was performed during the third quarter of 2016.
We recorded a $91 million loss on shutdown of Fairfield Flat-Rolled Operations during 2015 as a result of the permanent closure of those operations.
We recorded a $153 million loss on shutdown of coke production facilities during 2015 as a result of the permanent closure of our Gary Works and Granite City Works coke facilities.
We recorded a $26 million post-employment benefit actuarial adjustment in 2015 related to workers' compensation and black lung benefit obligations.
78
Table of Contents
Net Interest and Other Financial Costs
|
| Year Ended December 31, | ||||||||||
(Dollars in millions) |
| 2017 |
| 2016 |
| 2015 | ||||||
Interest income |
| $ | (17 | ) |
| $ | (5 | ) |
| $ | (3 | ) |
Interest expense |
| 226 | |
| 230 | |
| 214 | | |||
Loss on debt extinguishment |
| 54 | |
| 22 | |
| 36 | | |||
Other financial costs |
| 44 | |
| 4 | |
| 10 | | |||
Net interest and other financial costs |
| $ | 307 | |
| $ | 251 | |
| $ | 257 | |
During 2017, U. S. Steel issued $750 million of 6.875% Senior Notes due August 2025 (2025 Senior Notes) and redeemed $161 million of 7.00% Senior Notes due 2018, $200 million of 6.875% Senior Notes due 2021, and $400 million of 7.50% Senior Notes due 2022 for an aggregate redemption cost of approximately $808 million, which included $761 million for the remaining principal balances, $21 million in accrued and unpaid interest and $26 million in redemption premiums which have been reflected within the loss on debt extinguishment line in the table above. Additionally, U. S. Steel redeemed $200 million of its 8.375% Senior Secured Notes due 2021 for an aggregate redemption cost of approximately $227 million, which included $200 million for the remaining principal balance, $8 million in accrued and unpaid interest and $19 million in redemption premiums which have been reflected within the loss on debt extinguishment line in the table above. For further information see Note 16 to the Consolidated Financial Statements.
During 2016, U. S. Steel issued $980 million of 8.375% Senior Secured Notes due July 2021 (2021 Senior Secured Notes) and repurchased several tranches of its outstanding senior notes through various tender offers, redemptions and open market purchases, including the redemption of the remaining 6.05% Senior Notes due 2017 for an aggregate principal amount of approximately $444 million plus a total make whole premium of approximately $22 million, which has been reflected within the loss on debt extinguishment line in the table above. During 2015, U. S. Steel incurred a $36 million charge related to the retirement of the 2.75% Senior Convertible Notes due 2019, which has also been reflected within the loss on debt extinguishment line in the table above.
The increase in net interest and other financial costs from 2016 to 2017 is primarily due to an increase in loss on debt extinguishment (as described above) and decreased foreign currency gains, partially offset by an increase in interest income as a result of increased cash balances and interest rates in 2017 as compared to 2016.
The increase in net interest and other financial costs from 2015 to 2016 is primarily due to a decrease in loss on debt extinguishment (as described above) and decreased other financing costs, partially offset by increased interest expense associated with the 2021 Senior Secured Notes.
For additional information on U. S. Steel's foreign currency exchange activity see Note 15 to the Consolidated Financial Statements and Item 7A . "Quantitative and Qualitative Disclosures about Market Risk – Foreign Currency Exchange Rate Risk."
Income Taxes
The Tax Cut and Jobs Act of 2017 (the 2017 Act) was signed by the President on December 22, 2017 and most of the provisions are effective for tax years beginning January 1, 2018. The corporate rate reduction to 21% provided a small benefit to the Company in the fourth quarter of 2017 and should provide a material benefit in future years, once the Company has fully utilized its domestic net operating losses (NOLs). The limitation of NOLs to 80% of taxable income and the change to an unlimited carryforward period for NOLs generated in years after December 31, 2017 will not impact the Company's current NOLs, which were generated in 2013, 2015, and 2016. As the Company's NOLs still have a carryforward period of 20 years from the year they were generated, the 2017 Act had no impact on the valuation allowance for those NOLs. The repeal of the corporate Alternative Minimum Tax (AMT), with AMT credits refundable beginning with the filing of the 2018 return through the 2021 return, caused the release of the valuation allowance associated with the Company's AMT credits in the fourth quarter of 2017.
The one-time transition tax (imposed as part of the change to a territorial system) had an immaterial impact to the Company's effective tax rate (ETR) in the fourth quarter of 2017 and will have an immaterial impact to cash taxes paid, as the Company had minimal unrepatriated foreign earnings. The allowance of a 100% deduction for dividends from
79
Table of Contents
foreign corporations, the Basis Erosion Anti-Avoidance Tax (BEAT) and the Global Intangible Low-Taxed Income (GILTI) tax should not have a material impact on the Company's ETR in future years, based on our current structure. The Company has elected to record taxes associated with any GILTI inclusions in the period any such amounts are determined. The Company does not currently assert indefinite reinvestment and does not plan to change that position. Some of the other changes to the taxation of foreign earnings may impact the Company's ability to fully utilize foreign tax credits (FTCs) generated in future years, thereby impacting the ETR.
The new limitation on the deductibility of interest should not adversely affect the Company in the near term. The deduction for full expensing for assets acquired and placed in service after September 27, 2017 should not provide any benefit in the near term because of the Company's NOL position.
The income tax benefit for the year ended December 31, 2017 was $86 million compared to an income tax provision of $24 million in 2016 and $183 million in 2015 . Included in the 2017 tax benefit is a benefit of $10 million related to the corporate rate reduction provided by the 2017 Act, as well as a benefit of $71 million related to the reversal of the valuation allowance recorded against the remaining balance of the Company's AMT credits, which became fully refundable pursuant to the 2017 Act. Also included in the 2017 tax benefit is a benefit of $48 million related to the Company's election to claim a refund of AMT credits pursuant to a provision in the Protecting Americans from Tax Hikes Act (PATH Act).
Included in the 2016 tax provision is a benefit of $18 million related to the Company's election to claim a refund of AMT credits pursuant to a provision in the PATH Act. The 2016 provision also reflects a write-off of certain deferred tax assets and liabilities related to branch operations pursuant to new regulations. However, the write-off does not impact the total provision because of the valuation allowance on the net domestic deferred tax asset. Included in the 2015 tax provision is a net tax benefit of $31 million relating to adjustments to tax reserves related to the conclusion of certain audits.
The net domestic deferred tax asset was $53 million at December 31, 2017 , net of an established valuation allowance of $604 million , compared to a net domestic deferred tax liability of $28 million at December 31, 2016 , net of an established valuation allowance of $1,109 million .
At December 31, 2017 , the net foreign deferred tax liability was $3 million, net of an established valuation allowance of $4 million. At December 31, 2016 , the net foreign deferred tax asset was $6 million , net of an established valuation allowance of $4 million .
For further information on income taxes see Note 10 to the Consolidated Financial Statements.
Net earnings/(loss) attributable to U. S. Steel
Net earnings attributable to U. S. Steel in 2017 was $387 million compared to a net loss of $(440) million in 2016 and a net loss of $(1,642) million in 2015 , respectively. The changes primarily reflected the factors discussed above.
Financial Condition, Cash Flows and Liquidity
Financial Condition
Accounts receivable increased by $131 million from year-end 2016 primarily due to higher average realized prices, as well as increased shipment volumes in our Flat-Rolled and Tubular segments in the fourth quarter of 2017 compared to the fourth quarter of 2016.
Inventories increased by $165 million from December 31, 2016 primarily as a result of increased operating levels and higher raw materials prices across all of our segments.
Other current assets increased by $65 million from December 31, 2016 primarily due to purchases of emission allowances by our USSE segment.
Accounts payable and other accrued liabilities increased by $502 million from year-end 2016 primarily as a result of increased operating levels and higher raw materials prices across all of our segments.
Payroll and benefits payable decreased by $53 million from year-end 2016 primarily due to incentive payments related to 2016 financial performance that we paid in March 2017.
80
Table of Contents
Short-term debt and current maturities of long-term debt decreased by $47 million from year-end 2016 primarily due to the repayment of environmental bonds.
Long-term debt decreased by $281 million from year-end 2016 primarily due to the redemption of $200 million of our 8.375% Senior Secured Notes due 2021 in December 2017. Also contributing to the decrease from year-end 2016 was the repayment of the Recovery Zone Bonds, for which an "Extraordinary Mandatory Redemption" was triggered under the applicable indenture as a result of the permanent shutdown of the No. 6 Quench & Temper Mill at Lorain Tubular Operations during the first quarter of 2017 and decision to relocate the equipment.
Employee benefits decreased by $457 million from year-end 2016 primarily due to a strong return on plan assets and the voluntary contribution of $75 million to the U. S. Steel Retirement Plan during 2017 partially offset by the natural maturation of our pension plans and an improved mortality assumption.
Cash Flows
Net cash provided by operating activities was $802 million in 2017 compared to $731 million in 2016 and $360 million in 2015 . The increase in 2017 compared to 2016 is primarily due to stronger financial results, partially offset by changes in working capital period over period. The increase in 2016 compared to 2015 is primarily due to stronger financial results partially offset by changes in working capital period over period. Changes in working capital can vary significantly depending on factors such as the timing of inventory production and purchases, which is affected by the length of our business cycles as well as our captive raw materials position, customer payments of accounts receivable and payments to vendors in the regular course of business.
Our key working capital components include accounts receivable and inventory. The accounts receivable and inventory turnover ratios for the years ended December 31, 2017 and 2016 are as follows:
|
| Year Ended December 31, | ||||
|
| 2017 |
| 2016 | ||
Accounts Receivable Turnover |
| 9.3 | |
| 8.8 | |
Inventory Turnover |
| 6.6 | |
| 5.3 | |
The increase in the accounts receivable turnover approximates two days for 2017 as compared to 2016 and is primarily due to increased sales as a result of increased shipments in our Tubular and USSE segments as well as higher average realized prices across all of our segments in 2017 as compared to 2016. The increase in the inventory turnover approximates 14 days for 2017 as compared to 2016 and is primarily due to an increase in cost of goods sold mainly attributable to higher raw materials costs across all of our segments.
The last-in, first-out (LIFO) inventory method is the predominant method of inventory costing in the United States. At December 31, 2017 and 2016 , the LIFO method accounted for 75 percent of total inventory values. In the U.S., management monitors the inventory realizability by comparing the LIFO cost of inventory with the replacement cost of inventory. To the extent the replacement cost (i.e., market value) of inventory is lower than the LIFO cost of inventory, management will write the inventory down. As of December 31, 2017 and 2016 , the replacement cost of the inventory was higher by approximately $802 million and $489 million , respectively.
81
Table of Contents
Our cash conversion cycle improved 13 days in the fourth quarter of 2017 from the fourth quarter of 2016 as shown below:
Cash Conversion Cycle | 2017 |
|
| 2016 | ||||||||
| $ millions |
| Days |
|
| $ millions |
| Days | ||||
Accounts receivable, net (a) | $ | 1,379 | |
| 43 |
|
| $ | 1,248 | |
| 42 |
|
|
|
|
|
|
|
|
| ||||
+ Inventories (b) | $ | 1,738 | |
| 58 |
|
| $ | 1,573 | |
| 63 |
|
|
|
|
|
|
|
|
| ||||
- Accounts Payable and Other Accrued Liabilities (c) | $ | 2,163 | |
| 71 |
|
| $ | 1,665 | |
| 62 |
|
|
|
|
|
|
|
|
| ||||
|
|
|
|
|
|
|
|
| ||||
= Cash Conversion Cycle (d) |
|
| 30 |
|
|
|
| 43 | ||||
(a) Calculated as Average Accounts Receivable, net divided by total Net Sales multiplied by the number of days in the period.
(b) Calculated as Average Inventory divided by total Cost of Sales multiplied by the number of days in the period.
(c) Calculated as Average Accounts Payable and Other Accrued Liabilities less bank checks outstanding and other current liabilities divided by total Cost of Sales multiplied by the number of days in the period.
(d) Calculated as Accounts Receivable Days plus Inventory Days less Accounts Payable Days.
Net cash provided by operating activities for 2017 , 2016 and 2015 reflects employee benefits payments as shown in the following table.
Employee Benefits Payments
|
| Year Ended December 31, | ||||||||||
(Dollars in millions) |
| 2017 |
| 2016 |
| 2015 | ||||||
Voluntary contributions to main defined benefit pension plan (b) |
| $ | 75 | |
| $ | 13 | | (a) | $ | - | |
Other employee benefits payments not funded by trusts |
| 59 | |
| 61 | |
| 75 | | |||
Contributions to trusts for retiree health care and life insurance |
| - | |
| - | |
| 10 | | |||
Payments to a multiemployer pension plan |
| 59 | |
| 63 | |
| 66 | | |||
Pension related payments not funded by trusts |
| 13 | |
| 26 | |
| 38 | | |||
Reductions in cash flows from operating activities |
| $ | 206 | |
| $ | 163 | |
| $ | 189 | |
(a) Represents a contribution related to the payment of Pension Benefit Guarantee Corporation (PBGC) fees.
(b) In 2016, we also made a voluntary contribution in Company stock valued at approximately $100 million.
82
Table of Contents
Capital expenditures in 2017 were $505 million compared to $306 million in 2016 and $500 million in 2015 .
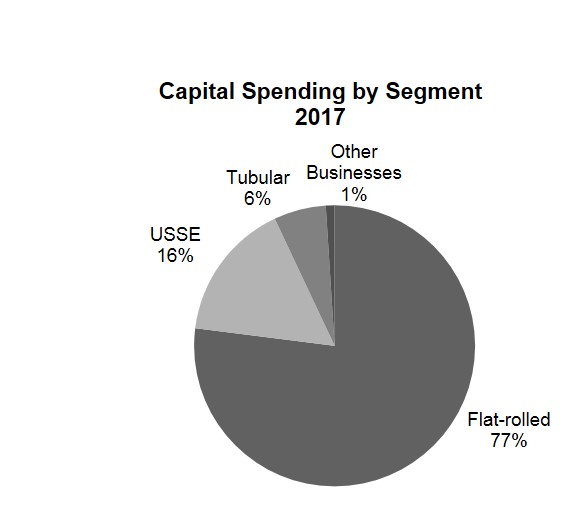
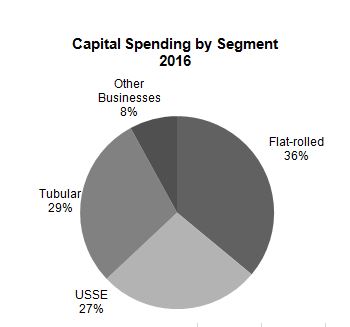
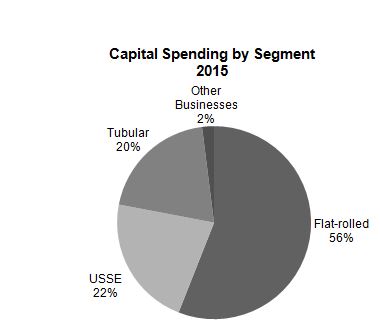
2017 Capital Spending
Flat-rolled capital expenditures were $388 million and included spending for the Mon Valley Works blast furnace stove rebuild, Gary Works blast furnace reline and skip incline replacement, Edgar Thomson Basic Oxygen Process (BOP) R vessel hood replacement, Midwest Plant galvanneal furnace upgrade, Great Lakes Works BOP truss off gas main replacement, and various other infrastructure, environmental and strategic projects. Tubular capital expenditures of $28 million related to Lone Star pipe mill finishing, Offshore Operations premium thread line and Lorain primary electric utility supply, as well as various other strategic capital projects. USSE capital expenditures of $83 million consisted of spending for a boiler house upgrade, pickle line upgrades, coke battery through-wall replacement and various other infrastructure and environmental projects.
2016 Capital Spending
Flat-rolled capital expenditures were $111 million and included spending for the Gary Works No. 1 Caster upgrade and certain other blast furnace upgrades, the Great Lakes Works Pickle Line Tank replacement, Continuous Galvanized Line (CGL) Strip Cleaning and Roller Coater, and various other infrastructure, environmental and strategic projects. Tubular capital expenditures of $88 million related to the delayed electric arc furnace (EAF) and coupling facilities projects as well as various other infrastructure and strategic capital projects. USSE capital expenditures of $83 million consisted of spending for a boiler house upgrade, pickle line upgrades and various other infrastructure and environmental projects.
2015 Capital Spending
Flat-Rolled capital expenditures were $280 million and included spending for the Granite City Works No. 1 Caster replacement, the ongoing implementation of an enterprise resource planning (ERP) system, No. 1 Caster upgrade at Gary Works, pickle line replacement at Great Lakes Works, blast furnace maintenance at Granite City Works, and various other infrastructure, environmental and strategic projects. Tubular capital expenditures of $102 million related to the EAF and coupling facilities as well as various other infrastructure and strategic capital projects. USSE capital expenditures of $110 million consisted of spending for infrastructure and environmental projects.
Capital expenditures for 2018 are expected to total approximately $850 million and remain focused largely on strategic, infrastructure and environmental projects, as well as asset revitalization of our equipment to improve our operating reliability and efficiency, and product quality and cost by focusing on investments in our North American Flat-Rolled segment.
U. S. Steel's contract commitments to acquire property, plant and equipment at December 31, 2017 , totaled $397 million .
In 2017, U. S. Steel received approximately $11 million for the sale of its 50% ownership interest in Apolo Tubulars, S.A. in December 2017.
In 2017, U. S. Steel received approximately $105 million for the sale of its 15% ownership in Tilden Mining Company L.C. in September 2017.
In 2017, U. S. Steel received approximately $127 million in satisfaction of its secured and unsecured claims, including interest, as a result of the restructuring and disposition of USSC on June 30, 2017.
83
Table of Contents
Acquisitions in 2015 reflects the purchase of the 50 percent joint venture interest in Double Eagle Steel Coating Company not already owned by U. S. Steel.
Restricted cash in 2015 reflects the use of restricted cash for qualified environmental capital projects. These proceeds are restricted for environmental capital projects at Gary Works, our Clairton Plant and Granite City Works and become unrestricted as capital expenditures for these projects are made. At December 31, 2017, December 31, 2016 and December 31, 2015, there was no restricted cash related to these projects.
Issuance of long-term debt, net of financing costs, totaled $737 million in 2017. In 2017, U. S. Steel issued $750 million of 6.875% Senior Notes due August 15, 2025. U. S. Steel received net proceeds from the offering of approximately $737 million after fees of approximately $13 million related to the underwriting and third party expenses. In 2016, U. S. Steel issued $980 million of its 8.375% Senior Secured Notes due July 1, 2021. U. S. Steel received net proceeds from the offering of approximately $958 million after fees of approximately $22 million related to underwriting and third party expenses. For further information see Note 16 to the Consolidated Financial Statements.
Repayment of long-term debt totaled $1,104 million in 2017. In 2017, U. S. Steel redeemed the entire aggregate principal amount of $70 million of the Lorain County Port Authority Recovery Zone Facility Revenue Bonds. Additionally, U. S. Steel redeemed $161 million of 7.00% Senior Notes due 2018, $200 million of 6.875% Senior Notes due 2021, and $400 million of 7.50% Senior Notes due 2022 for a total aggregate redemption cost of approximately $808 million . Also during 2017, U. S. Steel r edeemed $200 million of 8.375% Senior Secured Notes due 2021 for an aggregate redemption cost of approximately $227 million. Repayment of long-term debt in 2016 reflects the repurchase of approximately $6 million of U. S. Steel's 6.05% Senior Notes due 2017 through open market purchases and the redemption of the remaining aggregate principal amount of approximately $444 million. Also during 2016, U. S. Steel repurchased portions of its outstanding senior notes which included the 7.00% Senior Notes due 2018, 7.375% Senior Notes due 2020, and the 6.875% Senior Notes due 2021 for a total aggregate principal value of approximately $582 million through a series of tender offers and open market purchases. Repayment of long-term debt in 2015 reflects the retirem ent of the $316 million principal amount of the 2019 Senior Convertible Notes along with scheduled repayments of certain environmental revenue bonds. For further information see Note 16 to the Consolidated Financial Statements.
For all four quarters in 2017 , 2016 and 2015 , dividends paid per share of U. S. Steel common stock was $0.05.
Liquidity
The following table summarizes U. S. Steel's liquidity as of December 31, 2017 :
(Dollars in millions) |
| ||
Cash and cash equivalents | $ | 1,553 | |
Amount available under $1.5 Billion Credit Facility | 1,500 | | |
Amounts available under USSK credit facilities | 297 | | |
Total estimated liquidity | $ | 3,350 | |
84
Table of Contents
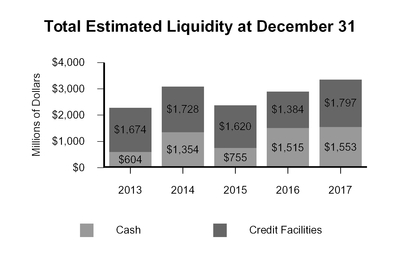
As of December 31, 2017 , $365 million of the total cash and cash equivalents was held by our foreign subsidiaries. Substantially all of the liquidity attributable to our foreign subsidiaries can be accessed without the imposition of income taxes as a result of the election effective December 31, 2013 to liquidate for U.S. income tax purposes a foreign subsidiary that holds most of our international operations.
U. S. Steel maintains a $1.5 billion asset-backed revolving credit facility. As of December 31, 2017 , there were no amounts drawn on the $1.5 billion credit facility (Third Amended and Restated Credit Agreement). U. S. Steel must maintain a fixed charge coverage ratio of at least 1.00 to 1.00 for the most recent four consecutive quarters when availability under the Third Amended and Restated Credit Agreement is less than the greater of 10% of the total aggregate commitments and $150 million . Based on the four quarters as of December 31, 2017 , we have met this covenant. If we are unable to meet this covenant in future periods, the amount available to the Company under this facility would be reduced by $150 million .
At December 31, 2017 , USSK had no borrowings under its €200 million (approximately $240 million ) unsecured revolving credit facility (the USSK Credit Agreement). The USSK Credit Agreement contains certain USSK financial covenants as well as other customary terms and conditions. At December 31, 2017 , USSK had full availability under the USSK Credit Agreement. Currently, the USSK Credit Agreement expires in July 2020. The USSK Credit Agreement permits one additional one-year extension to the final maturity date at the mutual consent of USSK and its lenders. On January 22, 2018 USSK's lenders confirmed the second maturity extension request to July 2021 under the USSK Credit Agreement.
At December 31, 2017 , USSK had no borrowings under its €40 million and €10 million unsecured credit facilities (collectively approximately $60 million ) and the aggregate availability was approximately $57 million due to approximately $3 million of customs and other guarantees outstanding. The €40 million facility expires in December 2018. On October 27, 2017, USSK entered into an amendment to its €10 million unsecured credit agreement to extend the agreement's final maturity date from December 2017 to December 2018. The agreement also permits one additional one -year extension to the final maturity date at the mutual consent of USSK and its lender.
In August of 2017, U. S. Steel issued $750 million of 6.875% Senior Notes due August 15, 2025 (2025 Senior Notes). U. S. Steel received net proceeds from the offering of approximately $737 million after fees of approximately $13 million related to the underwriting and third party expenses. The net proceeds from the issuance of the 2025 Senior Notes, together with cash on hand, were used to repurchase portions of our outstanding senior notes (see Note 16 to the Consolidated Financial Statements, "Debt" for further details). Interest on the notes is payable semi-annually in arrears on February 15th and August 15th of each year, commencing on February 15, 2018.
For the twelve months ended December 31, 2017 , the Non-Guarantor Subsidiaries (as defined in the Indenture governing the 2021 Senior Secured Notes), which consist principally of our tubular subsidiaries and our foreign subsidiaries, including USSK, represented approximately 40% of our net sales, 51% of our operating income and 45% of our adjusted EBITDA on a consolidated basis. As of December 31, 2017 , the Non-Guarantor Subsidiaries represented 42% of our total assets and had $1.3 billion of total liabilities on a consolidated basis, including trade
85
Table of Contents
payables but excluding intercompany liabilities, all of which would be structurally senior to the 2021 Senior Secured Notes.
We may from time to time seek to retire or repurchase our outstanding long-term debt through open market purchases, privately negotiated transactions, exchange transactions, redemptions or otherwise. Such purchases or exchanges, if any, will depend on prevailing market conditions, our liquidity requirements, and other factors and may be commenced or suspended at any time. The amounts involved may be material.
On March 10, 2017, U. S. Steel announced the permanent shutdown of the No. 6 Quench & Temper Mill at Lorain Tubular Operations in Lorain, Ohio. Under the terms of the Trust Indenture dated as of December 1, 2010, between the Lorain County Port Authority and The Bank of New York Mellon Trust Company, N.A., as Trustee (the Indenture), this action and our decision to relocate the Lorain No. 6 Quench & Temper equipment triggered an Extraordinary Mandatory Redemption of the Recovery Zone Bonds and accordingly required U. S. Steel to redeem the Recovery Zone Bonds and repay in full the principal amount plus accrued interest. In accordance with the terms of the Indenture, U. S. Steel paid in full all amounts due under the Indenture, comprised of $70 million principal and accrued interest of approximately $2 million, on April 27, 2017.
We use surety bonds, trusts and letters of credit to provide financial assurance for certain transactions and business activities. The use of some forms of financial assurance and cash collateral have a negative impact on liquidity. U. S. Steel has committed $158 million of liquidity sources for financial assurance purposes as of December 31, 2017 . Increases in certain of these commitments which use collateral are reflected in restricted cash on the Consolidated Statement of Cash Flows.
At December 31, 2017 , in the event of a change in control of U. S. Steel: (a) debt obligations totaling $2,312 million as of December 31, 2017 (including the Senior Notes and 2021 Senior Secured Notes) may be declared due and payable; (b) the Third Amended and Restated Credit Agreement and USSK's €200 million revolving credit agreement may be terminated and any amounts outstanding declared due and payable; and (c) U. S. Steel may be required to either repurchase the leased Fairfield slab caster for $26 million or provide a cash collateralized letter of credit to secure the remaining obligation.
The maximum guarantees of the indebtedness of unconsolidated entities of U. S. Steel totaled $4 million at December 31, 2017 . If any default related to the guaranteed indebtedness occurs, U. S. Steel has access to its interest in the assets of the investees to reduce its potential losses under the guarantees.
The following table summarizes U. S. Steel's contractual obligations at December 31, 2017 , and the effect such obligations are expected to have on our liquidity and cash flows in future periods.
(Dollars in millions) |
|
|
|
|
|
|
|
|
|
|
| ||||||||||
|
|
|
|
|
| Payments Due by Period |
| ||||||||||||||
Contractual Obligations |
| Total |
| 2018 |
| 2019 |
| 2021 through |
| Beyond |
| ||||||||||
Long-term debt (including interest) and capital leases (a) |
| $ | 4,199 | |
| $ | 211 | |
| $ | 879 | |
| $ | 1,021 | |
| $ | 2,088 | |
|
Operating leases (b) |
| 271 | |
| 67 | |
| 84 | |
| 50 | |
| 70 | |
| |||||
Contractual purchase commitments (c) |
| 5,058 | |
| 2,465 | |
| 733 | |
| 601 | |
| 1,259 | |
| |||||
Capital commitments (d) |
| 397 | |
| 225 | |
| 172 | |
| - | |
| - | |
| |||||
Environmental commitments (d) |
| 179 | |
| 29 | |
| - | |
| - | |
| 150 | | (e) | |||||
Steelworkers Pension Trust |
| 290 | | (f) | 54 | | (f) | 115 | | (f) | 121 | | (f) | - | | (f) | |||||
Pensions (g) |
| - | |
| - | |
| - | |
| - | |
| - | |
| |||||
Other benefits |
| 279 | | (h) | 57 | |
| 113 | |
| 109 | |
| - | | (h) | |||||
Unrecognized tax positions |
| 42 | |
| - | |
| - | |
| - | |
| 42 | | (e) | |||||
Total contractual obligations |
| $ | 10,715 | |
| $ | 3,108 | |
| $ | 2,096 | |
| $ | 1,902 | |
| $ | 3,609 | |
|
(a) | See Note 16 to the Consolidated Financial Statements. |
(b) | See Note 23 to the Consolidated Financial Statements. Amounts exclude subleases. |
(c) | Reflects contractual purchase commitments under purchase orders and "take or pay" arrangements. "Take or pay" arrangements are primarily for purchases of gases and certain energy and utility services. Additionally, includes coke and steam purchase commitments related to a coke supply agreement with Gateway Energy & Coke Company LLC (See Note 25 to the Consolidated Financial Statements). |
86
Table of Contents
(d) | See Note 25 to the Consolidated Financial Statements. |
(e) | Timing of potential cash flows is not reasonably determinable. |
(f) | While it is difficult to make a prediction of cash requirements beyond the term of the 2015 Labor Agreements, which expire on September 1, 2018, projected amounts shown through 2022 assume that the current $2.65 contribution rate per hour will apply. |
(g) | Projections are estimates of the minimum required contributions to the main domestic defined benefit pension plan which have been estimated assuming future asset performance consistent with our expected long-term earnings rate assumption, no voluntary contributions during the periods, and that the current low interest rate environment persists. Projections include the impacts of the November 2015 pension stabilization legislation, which further extended a revised interest rate formula to be used in calculating minimum required annual contributions. The legislation also increased the contribution rate of future PBGC premiums. Under these assumptions, there are no minimum required contributions to be paid. |
(h) | The amounts reflect corporate cash outlays for expected benefit payments to be paid by the Company. Under the 2015 Labor Agreement, previously required contributions to the USW VEBA trust have been eliminated (See Note 17 to the Consolidated Financial Statements). The accuracy of this forecast of future cash flows depends on future medical health care escalation rates and restrictions related to our trusts for retiree healthcare and life insurance that impact the timing of the use of trust assets. Projected amounts have been reduced to reflect withdrawals from the USW VEBA trust available under its agreements with the USW. Due to these factors, it is not possible to reliably estimate cash requirements beyond five years and actual amounts experienced may differ significantly from those shown. |
Contingent lease payments have been excluded from the above table. Contingent lease payments relate to operating lease agreements that include a floating rental charge, which is associated to a variable component. Future contingent lease payments are not determinable to any degree of certainty. U. S. Steel's annual incurred contingent lease expense is disclosed in Note 23 to the Consolidated Financial Statements. Additionally, recorded liabilities related to deferred income taxes and other liabilities that may have an impact on liquidity and cash flow in future periods, disclosed in Note 10 to the Consolidated Financial Statements, are excluded from the above table.
U. S. Steel made a voluntary contribution to our main U.S. defined benefit plan of $75 million in 2017. U. S. Steel will monitor the funded status of the plan to determine when voluntary contributions may be prudent in order to mitigate potentially larger mandatory contributions in later years. The funded status of U. S. Steel's pension plans is disclosed in Note 17 to the Consolidated Financial Statements.
87
Table of Contents
The following table summarizes U. S. Steel's commercial commitments at December 31, 2017 , and the effect such commitments could have on our liquidity and cash flows in future periods.
(Dollars in millions) |
|
|
|
|
|
|
|
|
|
|
| ||||||||||
|
|
|
| Scheduled Reductions by Period |
| ||||||||||||||||
Commercial Commitments |
| Total |
| 2018 |
| 2019 |
| 2021 |
| Beyond |
| ||||||||||
Standby letters of credit (a) |
| $ | 59 | |
| $ | 48 | |
| $ | 1 | |
| | |
| $ | 10 | | (b) | |
Surety bonds (a) |
| 67 | |
| - | |
| - | |
| - | |
| 67 | | (b) | |||||
Funded Trusts (a) |
| 32 | |
| - | |
| - | |
| - | |
| 32 | | (b) | |||||
Total commercial commitments |
| $ | 158 | |
| $ | 48 | |
| $ | 1 | |
| $ | - | |
| $ | 109 | |
|
(a) | Reflects a commitment or guarantee for which future cash outflow is not considered likely. |
(b) | Timing of potential cash outflows is not determinable. |
Our major cash requirements in 2018 are expected to be for capital expenditures, including asset revitalization, employee benefits and operating costs, which includes purchases of raw materials. We ended 2017 with $1.553 billion of cash and cash equivalents and $3.350 billion of total liquidity. Available cash is left on deposit with financial institutions or invested in highly liquid securities with parties we believe to be creditworthy.
U. S. Steel management believes that U. S. Steel's liquidity will be adequate to satisfy our obligations for the foreseeable future, including obligations to complete currently authorized capital spending programs. Future requirements for U. S. Steel's business needs, including the funding of acquisitions and capital expenditures, scheduled debt maturities, repurchase of debt, share buyback, contributions to employee benefit plans, and any amounts that may ultimately be paid in connection with contingencies, are expected to be funded by a combination of internally generated funds (including asset sales), proceeds from the sale of stock, borrowings, refinancings and other external financing sources.
Other Relevant Matters
Apolo Tubulars S.A.
Apolo Tubulars S.A. (Apolo) (formerly an unconsolidated Brazilian joint venture of which the Company owned 50%) was the subject of a search of its premises by Brazilian federal authorities on May 24, 2016. Apolo's CEO was among those subsequently indicted by the Brazilian federal prosecutor on June 27, 2016 for corruption, money laundering and organized crime in connection with alleged payments to government officials in exchange for contracts with Petróleo Brasileiro S.A. (commonly known as "Petrobras"), Brazil's state-run energy company. In March 2017, Apolo's CEO was acquitted of all charges due to a lack of evidence as to him personally, although the court did find that there was a misuse of certain Apolo funds by others not employed by Apolo. The prosecution has appealed that acquittal. While there can be no assurance that a successful appeal by the prosecution would not have an adverse effect on Apolo, it would not have a material impact on the Company as a whole. The prosecutor has not alleged any violations of law by, or initiated any investigation of, the Company or any of its employees. The Company sold all of its interest in Apolo in December 2017.
Off-Balance Sheet Arrangements
U. S. Steel has invested in several joint ventures that are reported as equity investments. Several of these investments involved a transfer of assets in exchange for an equity interest. U. S. Steel has supply arrangements with several of these joint ventures. In some cases, a portion of the labor force used by the investees is provided by U. S. Steel, the cost of which is reimbursed; however, failing reimbursement, U. S. Steel is ultimately responsible for the cost of these employees. The terms of these arrangements were a result of negotiations in arms-length transactions with the other joint venture participants, who are not affiliates of U. S. Steel.
U. S. Steel's other off-balance sheet arrangements include guarantees, indemnifications, unconditional purchase obligations, surety bonds, trusts and letters of credit disclosed in Note 25 to the Consolidated Financial Statements as well as operating leases disclosed in Note 23 to the Consolidated Financial Statements.
88
Table of Contents
Derivative Instruments
See "Item 7A. Quantitative and Qualitative Disclosures About Market Risk" for discussion of derivative instruments and associated market risk for U. S. Steel.
Change in Accounting Estimate
Capitalization and Depreciation Method
During 2017, U. S. Steel completed a review of its accounting policy for property, plant and equipment depreciated on a group basis. As a result of this review, U. S. Steel changed its accounting method for property, plant and equipment from the group method of depreciation to the unitary method of depreciation, effective as of January 1, 2017. The change from the group method to the unitary method of depreciation is preferable under U.S. GAAP as it will result in a more precise estimate of depreciation expense. Additionally, the change to the unitary method of depreciation is consistent with the depreciation method applied by our competitors, and improves the comparability of our results to our competitors. Our change in the method of depreciation is considered a change in accounting estimate effected by a change in accounting principle and has been applied prospectively.
When property, plant, and equipment are disposed of by sale, retirement, or abandonment, the gross value of the property, plant and equipment and corresponding accumulated depreciation are removed from the Company's financial accounting records. Due to the application of the unitary method of depreciation, any gain or loss resulting from an asset disposal by sale will now be immediately recognized as a gain or loss on the disposal of assets line in our consolidated statement of operations. Assets that are retired or abandoned will be reflected as an immediate charge to depreciation expense for any remaining book value in our consolidated statement of operations. Gains (losses) on disposals of assets for the year ended December 31, 2017 were immaterial.
For the year ended December 31, 2017 , the effect of the change was an increase in both income from continuing operations and net earnings of $344 million (which consists of a $381 million decrease in cost of sales due to the capitalization of maintenance and outage spending that would have been previously expensed, partially offset by increased depreciation expense of $37 million , as a result of the impact of unitary depreciation on the existing net book value of fixed assets, as noted below, and the capitalization of maintenance and outage spending) and an increase in diluted earnings per share of $1.95 . The tax effect of this change was immaterial to the consolidated financial statements.
Due to the application of the unitary method of depreciation and resultant change in our capitalization policy, spending associated with major maintenance and outage work, that had previously been expensed, will now be capitalized if it extends the useful life of the related asset. Based upon our average spending in years prior to 2017, we had estimated the impact on 2017 results to be a reduction of approximately $175 million in cost of sales on the Consolidated Statement of Operations. Additionally, due to the increased spending related to maintenance under our asset revitalization program, we capitalized $206 million of incremental expenditures.
89
Table of Contents
Environmental Matters
U. S. Steel's environmental expenditures were as follows:
(Dollars in millions) |
|
|
|
|
|
| ||||||
|
| 2017 |
| 2016 |
| 2015 | ||||||
North America: |
|
|
|
|
|
| ||||||
Capital |
| $ | 6 | |
| $ | 5 | |
| $ | 16 | |
Compliance |
|
|
|
|
|
| ||||||
Operating & maintenance |
| 176 | |
| 167 | |
| 226 | | |||
Remediation (a) |
| 9 | |
| 17 | |
| 12 | | |||
Total North America |
| $ | 191 | |
| $ | 189 | |
| $ | 254 | |
USSE: |
|
|
|
|
|
| ||||||
Capital |
| $ | 46 | |
| $ | 26 | |
| $ | 80 | |
Compliance |
|
|
|
|
|
| ||||||
Operating & maintenance |
| 11 | |
| 11 | |
| 12 | | |||
Remediation (a) |
| 7 | |
| 6 | |
| 8 | | |||
Total USSE |
| $ | 64 | |
| $ | 43 | |
| $ | 100 | |
Total U. S. Steel |
| $ | 255 | |
| $ | 232 | |
| $ | 354 | |
(a) | These amounts include spending charged against remediation reserves, net of recoveries where permissible, but do not include non-cash provisions recorded for environmental remediation. |
U. S. Steel's environmental capital expenditures accounted for 10 percent of total capital expenditures in 2017, 10 percent in 2016 and 19 percent in 2015.
Environmental compliance expenditures represented two percent of U. S. Steel's total costs and expenses in 2017, 2016 and 2015. Remediation spending during 2015 through 2017 was mainly related to remediation activities at former and present operating locations.
RCRA establishes standards for the management of solid and hazardous wastes. Besides affecting current waste disposal practices, RCRA also addresses the environmental impacts of certain past waste disposal operations, the recycling of wastes and the regulation of storage tanks.
For discussion of other relevant environmental items see "Part I, Item 3. Legal Proceedings – Environmental Proceedings."
The following table shows activity with respect to environmental remediation liabilities for the years ended December 31, 2017 and December 31, 2016 . These amounts exclude liabilities related to asset retirement obligations accounted for in accordance with ASC Topic 410. See Note 18 to the Consolidated Financial Statements.
(Dollars in millions) |
| 2017 |
| 2016 | ||||
Beginning Balance |
| $ | 179 | |
| $ | 197 | |
Plus: Additions |
| 8 | |
| 1 | | ||
Adjustments for changes in estimates |
| - | |
| (7 | ) | ||
Less: Obligations settled |
| (8 | ) |
| (12 | ) | ||
Ending Balance |
| $ | 179 | |
| $ | 179 | |
New or expanded environmental requirements, which could increase U. S. Steel's environmental costs, may arise in the future. U. S. Steel intends to comply with all legal requirements regarding the environment, but since many of them are not fixed or presently determinable (even under existing legislation) and may be affected by future legislation, it is not possible to predict accurately the ultimate cost of compliance, including remediation costs which may be incurred and penalties which may be imposed. However, based on presently available information and existing laws and regulations as currently implemented, U. S. Steel does not anticipate that environmental compliance and remediation expenditures (including operating and maintenance) will materially increase in 2018. U. S. Steel's environmental capital expenditures are expected to be approximately $60 million in 2018, $45 million of which is related to projects at USSE.
90
Table of Contents
U. S. Steel's environmental expenditures for 2018 for operating and maintenance and for remediation projects are expected to be approximately $175 million and $40 million, respectively, of which approximately $15 million and $5 million for operating and maintenance and remediation, respectively, is related to USSE. Predictions beyond 2018 can only be broad-based estimates, which have varied, and will continue to vary, due to the ongoing evolution of specific regulatory requirements, the possible imposition of more stringent requirements and the availability of new technologies to remediate sites, among other factors.
Outlook for 2018
If market conditions remain at their January 24, 2018 levels, we expect 2018 net earnings of approximately $685 million, or $3.88 per diluted share, and EBITDA of approximately $1.5 billion.
We believe market conditions, which include spot prices, raw material costs, customer demand, import volumes, supply chain inventories, rig counts and energy prices, will change, and as changes occur during the balance of 2018, we expect these changes to be reflected in our net earnings and EBITDA.
Please refer to the table below for the reconciliation of the Outlook net earnings to EBITDA.
UNITED STATES STEEL CORPORATION | ||||
RECONCILIATION OF ANNUAL EBITDA OUTLOOK | ||||
|
|
| ||
|
| Year Ended | ||
|
| Dec. 31 | ||
(Dollars in millions) | 2018 | |||
Reconciliation to Projected Annual EBITDA Included in Outlook |
| |||
| Projected net earnings attributable to United States Steel Corporation included in Outlook | $ | 685 | |
| Estimated income tax expense | 50 | | |
| Estimated net interest and other financial costs | 270 | | |
| Estimated depreciation, depletion and amortization | 495 | | |
| Projected annual EBITDA included in Outlook | $ | 1,500 | |
EBITDA is a non-GAAP measure that we believe, considered along with the net earnings (loss), is a relevant indicator of trends relating to cash generating activity and provides management and investors with additional information for comparison of our operating results to the operating results of other companies.
The outlook for 2018 is based on market conditions as of January 24, 2018 and may change based on prevailing economic and competitive conditions and other risks and uncertainties referred to in the Forward-Looking Statements section and in "Item 1A. Risk Factors." These factors could significantly affect our shipments and average realized prices and our outlook may change as a result of these and other factors.
Accounting Standards
See Note 2 to the Consolidated Financial Statements in Part II Item 8 of this Form 10-K.
Item 7A. QUANTITATIVE AND QUALITATIVE DISCLOSURES ABOUT MARKET RISK
U. S. Steel is exposed to certain risks related to its ongoing business operations, including financial, market, political, and economic risks. The following discussion provides information regarding U. S. Steel's exposure to the risks of changing foreign currency exchange rates, commodity prices and interest rates.
U. S. Steel may enter into derivative financial instrument transactions in order to manage or reduce these market risks. The use of derivative instruments is subject to our corporate governance policies. These instruments are used solely to mitigate market exposure and are not used for trading or speculative purposes.
91
Table of Contents
U. S. Steel may elect to use hedge accounting for certain commodity or currency transactions. For those transactions, the impact of the effective portion of the hedging instrument will be recognized in other comprehensive income until the transaction is settled. Once the transaction is settled, the effect of the hedged item will be recognized in income. For further information regarding derivative instruments see Notes 1 and 15 to the Consolidated Financial Statements.
Foreign Currency Exchange Rate Risk
U. S. Steel, through USSE, is subject to the risk of price fluctuations due to the effects of exchange rates on revenues and operating costs, firm commitments for capital expenditures and existing assets or liabilities denominated in currencies other than the U.S. dollar, particularly the euro. U. S. Steel historically has made limited use of forward currency contracts to manage exposure to certain currency price fluctuations. U. S. Steel has not elected to use hedge accounting for these contracts. Foreign currency derivative instruments have been marked-to-market and the resulting gains or losses recognized in the current period in net interest and other financial costs. At December 31, 2017 and December 31, 2016 , U. S. Steel had open euro forward sales contracts for U.S. dollars (total notional value of approximately $273 million and $176 million , respectively). A 10 percent increase in the December 31, 2017 euro forward rates would result in a $28 million charge to income.
The fair value of our derivatives is determined using Level 2 inputs, which are defined as "significant other observable" inputs. The inputs used include quotes from counterparties that are corroborated with market sources.
Volatility in the foreign currency markets could have significant implications for U. S. Steel as a result of foreign currency transaction effects. Future foreign currency impacts will depend upon changes in currencies and the extent to which we engage in derivatives transactions. For additional information on U. S. Steel's foreign currency exchange activity, see Note 15 to the Consolidated Financial Statements.
Commodity Price Risk and Related Risks
In the normal course of our business, U. S. Steel is exposed to market risk or price fluctuations related to the purchase, production or sale of steel products. U. S. Steel is also exposed to price risk related to the purchase, production or sale of coal, coke, natural gas, steel scrap, iron ore and pellets, and zinc, tin and other nonferrous metals used as raw materials. See Note 15 to the Consolidated Financial Statements for further details on U. S. Steel's derivatives.
U. S. Steel's market risk strategy has generally been to obtain competitive prices for our products and services and allow operating results to reflect market price movements dictated by supply and demand; however, U. S. Steel has made forward physical purchases to manage exposure to price risk related to the purchases of natural gas and certain non-ferrous metals used in the production process.
U. S. Steel held commodity contracts for natural gas forward buys placed for 2018 that qualified for the normal purchases and normal sales exemption with a total notional value of approximately $26 million at December 31, 2017 . Total commodity contracts for natural gas forward buys placed for 2018 at December 31, 2017 represent approximately 14 percent of our expected North American natural gas requirements.
92
Table of Contents
Interest Rate Risk
U. S. Steel is subject to the effects of interest rate fluctuations on the fair value of certain of our non-derivative financial instruments. A sensitivity analysis of the projected incremental effect of a hypothetical 10 percent increase/decrease in year-end 2017 and 2016 interest rates on the fair value of U. S. Steel's non-derivative financial instruments is provided in the following table:
(Dollars in millions) |
| 2017 |
| 2016 | ||||||||||||
Non-Derivative Financial Instruments (a) |
| Fair Value (b) |
| Change in |
| Fair Value (b) |
| Change in | ||||||||
Financial liabilities: |
|
|
|
|
|
|
|
| ||||||||
Debt (d)(e) |
| $ | 2,851 | |
| $ | 93 | |
| $ | 3,139 | |
| $ | 101 | |
(a) | Fair values of cash and cash equivalents, current accounts and notes receivable, accounts payable, bank checks outstanding and accrued interest approximate carrying value and are relatively insensitive to changes in interest rates due to the short-term maturity of the instruments. Accordingly, these instruments are excluded from the table. |
(b) | See Note 19 to the Consolidated Financial Statements for carrying value of instruments. |
(c) | Reflects, by class of financial instrument, the estimated incremental effect of a hypothetical 10 percent change in interest rates at December 31, 2017 and 2016 , on the fair value of U. S. Steel's non-derivative financial instruments. For financial liabilities, this assumes a 10 percent decrease in the weighted average yield to maturity of U. S. Steel's long-term debt at December 31, 2017 and December 31, 2016 . |
(d) | Excludes capital lease obligations. |
(e) | Fair value was determined using Level 2 inputs which were derived from quoted market prices and is based on the yield on public debt where available or current borrowing rates available for financings with similar terms and maturities. |
U. S. Steel's sensitivity to interest rate declines and corresponding increases in the fair value of our debt portfolio would unfavorably affect our results and cash flows only to the extent that we elected to repurchase or otherwise retire all or a portion of our fixed-rate debt portfolio at prices above carrying value.
93
Table of Contents
Item 8. FINANCIAL STATEMENTS AND SUPPLEMENTARY DATA
The information required by this item is set forth in our Consolidated Financial Statement contained in this Annual Report on Form 10-K. Specific financial statements can be found at the page listed below:
| PAGE |
MANAGEMENT'S REPORT TO STOCKHOLDERS | F-2 |
REPORT OF INDEPENDENT REGISTERED PUBLIC ACCOUNTING FIRM | F-4 |
CONSOLIDATED STATEMENTS OF OPERATIONS FOR THE YEARS ENDED DECEMBER 31, 2017, 2016 AND 2015 | F-6 |
CONSOLIDATED STATEMENTS OF COMPREHENSIVE INCOME (LOSS) FOR THE YEARS ENDED DECEMBER 31, 2017, 2016 AND 2015 | F-7 |
CONSOLIDATED BALANCE SHEETS AS OF DECEMBER 31, 2017 AND 2016 | F-8 |
CONSOLIDATED STATEMENTS OF CASH FLOWS FOR THE YEARS ENDED DECEMBER 31, 2017, 2016 AND 2015 | F-9 |
CONSOLIDATED STATEMENTS OF STOCKHOLDERS' EQUITY FOR THE YEARS ENDED DECEMBER 31, 2017, 2016 AND 2015 | F-10 |
NOTES TO CONSOLIDATED FINANCIAL STATEMENTS | F-12 |
F-1
Table of Contents

MANAGEMENT'S REPORT TO STOCKHOLDERS
February 21, 2018
To the Stockholders of United States Steel Corporation:
Financial Statements and Practices
The accompanying consolidated financial statements of United States Steel Corporation are the responsibility of and have been prepared by United States Steel Corporation in conformity with accounting principles generally accepted in the United States of America. They necessarily include some amounts that are based on our best judgments and estimates. United States Steel Corporation's financial information displayed in other sections of this report is consistent with these financial statements.
United States Steel Corporation seeks to assure the objectivity and integrity of its financial records by careful selection of its managers, by organizational arrangements that provide an appropriate division of responsibility and by communication programs aimed at assuring that its policies, procedures and methods are understood throughout the organization.
United States Steel Corporation has a comprehensive, formalized system of internal controls designed to provide reasonable assurance that assets are safeguarded, that financial records are reliable and that information required to be disclosed in reports filed with or submitted to the Securities and Exchange Commission is recorded, processed, summarized and reported within the required time limits. Appropriate management monitors the system for compliance and evaluates it for effectiveness, and the auditors independently measure its effectiveness and recommend possible improvements thereto.
The Board of Directors exercises its oversight role in the area of financial reporting and internal control over financial reporting through its Audit Committee. This committee, composed solely of independent directors, regularly meets (jointly and separately) with the independent registered public accounting firm, management, internal audit and other executives to monitor the proper discharge by each of their responsibilities relative to internal control over financial reporting and United States Steel Corporation's financial statements.
Internal Control Over Financial Reporting
United States Steel Corporation's management is responsible for establishing and maintaining adequate internal control over financial reporting, as defined in Exchange Act Rule 13a-15(f). Under the supervision and with the participation of United States Steel Corporation's management, including the Chief Executive Officer and Chief Financial Officer, United States Steel Corporation conducted an evaluation of the effectiveness of its internal control over financial reporting based on the framework in Internal Control – Integrated Framework (2013) issued by the Committee of Sponsoring Organizations of the Treadway Commission.
F-2
Table of Contents
Based on this evaluation, United States Steel Corporation's management concluded that United States Steel Corporation's internal control over financial reporting was effective as of December 31, 2017 .
The effectiveness of United States Steel Corporation's internal control over financial reporting as of December 31, 2017 has been audited by PricewaterhouseCoopers LLP, an independent registered public accounting firm, as stated in their report which is included herein.
/ S / DAVID B. BURRITT |
| / S / KEVIN P. BRADLEY |
David B. Burritt |
| Kevin P. Bradley |
President and Chief Executive Officer |
| Executive Vice President and Chief Financial Officer |
/ S / COLLEEN M. DARRAGH |
|
|
Colleen M. Darragh |
|
|
Vice President and Controller |
|
|
F-3
Table of Contents

Report of Independent Registered Public Accounting Firm
To the Board of Directors and Stockholders of United States Steel Corporation
Opinions on the Financial Statements and Internal Control over Financial Reporting
We have audited the accompanying consolidated balance sheets of United States Steel Corporation and its subsidiaries as of December 31, 2017 and 2016, and the related consolidated statements of operations, comprehensive income (loss), stockholders' equity, and cash flows for each of the three years in the period ended December 31, 2017, including the related notes and financial statement schedule listed in the index appearing under Item 15(a)(2) (collectively referred to as the "consolidated financial statements"). We also have audited the Company's internal control over financial reporting as of December 31, 2017, based on criteria established in Internal Control - Integrated Framework (2013) issued by the Committee of Sponsoring Organizations of the Treadway Commission (COSO).
In our opinion, the consolidated financial statements referred to above present fairly, in all material respects, the financial position of the Company as of December 31, 2017 and 2016, and the results of their operations and their cash flows for each of the three years in the period ended December 31, 2017 in conformity with accounting principles generally accepted in the United States of America. Also in our opinion, the Company maintained, in all material respects, effective internal control over financial reporting as of December 31, 2017, based on criteria established in Internal Control - Integrated Framework (2013) issued by the COSO.
Change in Accounting Principle
As discussed in Note 1 to the consolidated financial statements, the Company changed the manner in which it accounts for property, plant, and equipment in 2017.
Basis for Opinions
The Company's management is responsible for these consolidated financial statements, for maintaining effective internal control over financial reporting, and for its assessment of the effectiveness of internal control over financial reporting, included in Management's Report on Internal Control Over Financial Reporting appearing under Item 9A. Our responsibility is to express opinions on the Company's consolidated financial statements and on the Company's internal control over financial reporting based on our audits. We are a public accounting firm registered with the Public Company Accounting Oversight Board (United States) (PCAOB) and are required to be independent with respect to the Company in accordance with the U.S. federal securities laws and the applicable rules and regulations of the Securities and Exchange Commission and the PCAOB.
We conducted our audits in accordance with the standards of the PCAOB. Those standards require that we plan and perform the audits to obtain reasonable assurance about whether the consolidated financial statements are free of material misstatement, whether due to error or fraud, and whether effective internal control over financial reporting was maintained in all material respects.
Our audits of the consolidated financial statements included performing procedures to assess the risks of material misstatement of the consolidated financial statements, whether due to error or fraud, and performing procedures that respond to those risks. Such procedures included examining, on a test basis, evidence regarding the amounts and disclosures in the consolidated financial statements. Our audits also included evaluating the accounting principles used and significant estimates made by management, as well as evaluating the overall presentation of the consolidated financial statements. Our audit of internal control over financial reporting included obtaining an understanding of internal control over financial reporting, assessing the risk that a material weakness exists, and testing and evaluating the design and operating effectiveness of internal control based on the assessed risk. Our audits also included performing such other procedures as we considered necessary in the circumstances. We believe that our audits provide a reasonable basis for our opinions.
F-4
Table of Contents
Definition and Limitations of Internal Control over Financial Reporting
A company's internal control over financial reporting is a process designed to provide reasonable assurance regarding the reliability of financial reporting and the preparation of financial statements for external purposes in accordance with generally accepted accounting principles. A company's internal control over financial reporting includes those policies and procedures that (i) pertain to the maintenance of records that, in reasonable detail, accurately and fairly reflect the transactions and dispositions of the assets of the company; (ii) provide reasonable assurance that transactions are recorded as necessary to permit preparation of financial statements in accordance with generally accepted accounting principles, and that receipts and expenditures of the company are being made only in accordance with authorizations of management and directors of the company; and (iii) provide reasonable assurance regarding prevention or timely detection of unauthorized acquisition, use, or disposition of the company's assets that could have a material effect on the financial statements.
Because of its inherent limitations, internal control over financial reporting may not prevent or detect misstatements. Also, projections of any evaluation of effectiveness to future periods are subject to the risk that controls may become inadequate because of changes in conditions, or that the degree of compliance with the policies or procedures may deteriorate.
/s/ PricewaterhouseCoopers LLP
Pittsburgh, Pennsylvania
February 21, 2018
We have served as the Company's auditor since 1903.
F-5
Table of Contents
UNITED STATES STEEL CORPORATION
CONSOLIDATED STATEMENTS OF OPERATIONS
|
| Year Ended December 31, | ||||||||||
(Dollars in millions, except per share amounts) |
| 2017 |
| 2016 |
| 2015 | ||||||
Net sales: |
|
|
|
|
|
| ||||||
Net sales |
| $ | 11,046 | |
| $ | 9,045 | |
| $ | 10,111 | |
Net sales to related parties (Note 22) |
| 1,204 | |
| 1,216 | |
| 1,463 | | |||
Total |
| 12,250 | |
| 10,261 | |
| 11,574 | | |||
Operating expenses (income): |
|
|
|
|
|
| ||||||
Cost of sales (excludes items shown below) |
| 10,864 | |
| 9,623 | |
| 11,141 | | |||
Selling, general and administrative expenses |
| 375 | |
| 255 | |
| 415 | | |||
Depreciation, depletion and amortization (Notes 12 and 13) |
| 501 | |
| 507 | |
| 547 | | |||
Earnings from investees (Note 11) |
| (44 | ) |
| (98 | ) |
| (38 | ) | |||
(Gain) loss associated with U. S. Steel Canada Inc. (Note 5) |
| (72 | ) |
| - | |
| 392 | | |||
Restructuring and other charges (Note 24) |
| 31 | |
| 122 | |
| 322 | | |||
Impairment of intangible assets (Note 13) |
| - | |
| 14 | |
| - | | |||
Net (gain) loss on disposals of assets |
| (5 | ) |
| 5 | |
| (2 | ) | |||
Other income, net |
| (8 | ) |
| (2 | ) |
| (1 | ) | |||
Total |
| 11,642 | |
| 10,426 | |
| 12,776 | | |||
Earnings (loss) before interest and income taxes |
| 608 | |
| (165 | ) |
| (1,202 | ) | |||
Interest expense (Note 7) |
| 226 | |
| 230 | |
| 214 | | |||
Interest income |
| (17 | ) |
| (5 | ) |
| (3 | ) | |||
Loss on debt extinguishment (Note 7) |
| 54 | |
| 22 | |
| 36 | | |||
Other financial costs (Note 7) |
| 44 | |
| 4 | |
| 10 | | |||
Net interest and other financial costs |
| 307 | |
| 251 | |
| 257 | | |||
Earnings (loss) before income taxes |
| 301 | |
| (416 | ) |
| (1,459 | ) | |||
Income tax (benefit) provision (Note 10) |
| (86 | ) |
| 24 | |
| 183 | | |||
Net earnings (loss) |
| 387 | |
| (440 | ) |
| (1,642 | ) | |||
Less: Net earnings attributable to noncontrolling interests |
| - | |
| - | |
| - | | |||
Earnings (loss) attributable to United States Steel Corporation |
| $ | 387 | |
| $ | (440 | ) |
| $ | (1,642 | ) |
Earnings (loss) per common share (Note 8) |
|
|
|
|
|
| ||||||
Earnings (loss) per share attributable to United States Steel Corporation stockholders: |
|
|
|
|
|
| ||||||
- Basic |
| $ | 2.21 | |
| $ | (2.81 | ) |
| $ | (11.24 | ) |
- Diluted |
| $ | 2.19 | |
| $ | (2.81 | ) |
| $ | (11.24 | ) |
The accompanying notes are an integral part of these Consolidated Financial Statements.
F-6
Table of Contents
UNITED STATES STEEL CORPORATION
CONSOLIDATED STATEMENTS OF COMPREHENSIVE INCOME (LOSS)
|
| Year Ended December 31, | ||||||||||
(Dollars in millions) |
| 2017 |
| 2016 |
| 2015 | ||||||
Net earnings (loss) |
| $ | 387 | |
| $ | (440 | ) |
| $ | (1,642 | ) |
Other comprehensive income (loss), net of tax: |
|
|
|
|
|
| ||||||
Changes in foreign currency translation adjustments (a) |
| 189 | |
| (38 | ) |
| (104 | ) | |||
Changes in pension and other employee benefit accounts (a) |
| 462 | |
| (292 | ) |
| 373 | | |||
Other (a) |
| 1 | |
| 2 | |
| 3 | | |||
Total other comprehensive income (loss), net of tax |
| 652 | |
| (328 | ) |
| 272 | | |||
Comprehensive income (loss) including noncontrolling interest |
| 1,039 | |
| (768 | ) |
| (1,370 | ) | |||
Comprehensive income attributable to noncontrolling interest |
| - | |
| - | |
| - | | |||
Comprehensive income (loss) attributable to United States Steel Corporation |
| $ | 1,039 | |
| $ | (768 | ) |
| $ | (1,370 | ) |
Foreign currency translation adjustments (b) |
| $ | - | |
| $ | - | |
| $ | 82 | |
Pension and other benefits adjustments (b) |
| - | |
| - | |
| (228 | ) | |||
Other adjustments (b) |
| - | |
| - | |
| (2 | ) | |||
(b) Amounts for 2017 and 2016 do not reflect a tax benefit as a result of a full valuation allowance on our domestic deferred tax assets.
The accompanying notes are an integral part of these Consolidated Financial Statements.
F-7
Table of Contents
UNITED STATES STEEL CORPORATION
CONSOLIDATED BALANCE SHEETS
|
| December 31, | ||||||
(Dollars in millions) |
| 2017 |
| 2016 | ||||
Assets |
|
|
|
| ||||
Current assets: |
|
|
|
| ||||
Cash and cash equivalents |
| $ | 1,553 | |
| $ | 1,515 | |
Receivables, less allowance of $28 and $25 |
| 1,173 | |
| 976 | | ||
Receivables from related parties, less allowance of $0 and $265 (Note 22) |
| 206 | |
| 272 | | ||
Inventories (Note 9) |
| 1,738 | |
| 1,573 | | ||
Other current assets |
| 85 | |
| 20 | | ||
Total current assets |
| 4,755 | |
| 4,356 | | ||
Investments and long-term receivables, less allowance of $11 and $10 (Note 11) |
| 480 | |
| 528 | | ||
Long-term receivables from related parties, less allowance of $0 and $1,627 (Notes 5 and 22) |
| - | |
| - | | ||
Property, plant and equipment, net (Note 12) |
| 4,280 | |
| 3,979 | | ||
Intangibles - net (Note 13) |
| 167 | |
| 175 | | ||
Deferred income tax benefits (Note 10) |
| 56 | |
| 6 | | ||
Other noncurrent assets |
| 124 | |
| 116 | | ||
Total assets |
| $ | 9,862 | |
| $ | 9,160 | |
Liabilities |
|
|
|
| ||||
Current liabilities: |
|
|
|
| ||||
Accounts payable and other accrued liabilities |
| $ | 2,096 | |
| $ | 1,602 | |
Accounts payable to related parties (Note 22) |
| 74 | |
| 66 | | ||
Payroll and benefits payable |
| 347 | |
| 400 | | ||
Accrued taxes |
| 132 | |
| 128 | | ||
Accrued interest |
| 69 | |
| 85 | | ||
Short-term debt and current maturities of long-term debt (Note 16) |
| 3 | |
| 50 | | ||
Total current liabilities |
| 2,721 | |
| 2,331 | | ||
Long-term debt, less unamortized discount and debt issuance costs (Note 16) |
| 2,700 | |
| 2,981 | | ||
Employee benefits (Note 17) |
| 759 | |
| 1,216 | | ||
Deferred income tax liabilities (Note 10) |
| 6 | |
| 28 | | ||
Deferred credits and other noncurrent liabilities |
| 355 | |
| 329 | | ||
Total liabilities |
| 6,541 | |
| 6,885 | | ||
Contingencies and commitments (Note 25) |
| |
| | ||||
Stockholders' Equity |
|
|
|
| ||||
Common stock issued - 176,424,554 shares issued (par value $1 per share, authorized 400,000,000 shares) (Notes 8 and 26) |
| 176 | |
| 176 | | ||
Treasury stock, at cost (1,203,344 shares and 2,614,378 shares) |
| (76 | ) |
| (182 | ) | ||
Additional paid-in capital |
| 3,932 | |
| 4,027 | | ||
Retained earnings (accumulated deficit) |
| 133 | |
| (250 | ) | ||
Accumulated other comprehensive loss (Note 20) |
| (845 | ) |
| (1,497 | ) | ||
Total United States Steel Corporation stockholders' equity |
| 3,320 | |
| 2,274 | | ||
Noncontrolling interests |
| 1 | |
| 1 | | ||
Total liabilities and stockholders' equity |
| $ | 9,862 | |
| $ | 9,160 | |
The accompanying notes are an integral part of these Consolidated Financial Statements.
F-8
Table of Contents
UNITED STATES STEEL CORPORATION
CONSOLIDATED STATEMENTS OF CASH FLOWS
|
| Year Ended December 31, | |||||||||||
(Dollars in millions) |
| 2017 |
| 2016 |
| 2015 | |||||||
Increase (decrease) in cash and cash equivalents |
|
|
|
|
|
| |||||||
Operating activities: |
|
|
|
|
|
| |||||||
Net earnings (loss) |
| $ | 387 | |
| $ | (440 | ) |
| $ | (1,642 | ) | |
Adjustments to reconcile net cash provided by operating activities: |
|
|
|
|
|
| |||||||
Depreciation, depletion and amortization (Notes 12 and 13) |
| 501 | |
| 507 | |
| 547 | | ||||
Impairment of intangible assets (Note 13) |
| - | |
| 14 | |
| - | | ||||
(Gain) loss associated with U. S. Steel Canada Inc. (Note 5) |
| (72 | ) |
| - | | 392 | | 392 | | |||
Restructuring and other charges (Note 24) |
| 31 | |
| 122 | |
| 322 | | ||||
Loss on debt extinguishment (Note 16) |
| 54 | |
| 22 | |
| 36 | | ||||
Provision for doubtful accounts |
| 1 | |
| - | |
| (15 | ) | ||||
Pensions and other post-employment benefits |
| (16 | ) |
| (62 | ) |
| 50 | | ||||
Deferred income taxes (Note 10) |
| (72 | ) |
| 9 | |
| 213 | | ||||
Net (gain) loss on disposal of assets |
| (5 | ) |
| 5 | |
| (2 | ) | ||||
Equity investees earnings, net of distributions received |
| (32 | ) |
| (89 | ) |
| (28 | ) | ||||
Changes in: |
|
|
|
|
|
| |||||||
Current receivables |
| (36 | ) |
| (182 | ) |
| 792 | | ||||
Inventories |
| (117 | ) |
| 491 | |
| 391 | | ||||
Current accounts payable and accrued expenses |
| 173 | |
| 287 | |
| (632 | ) | ||||
Income taxes receivable/payable |
| (52 | ) |
| 10 | |
| 6 | | ||||
Bank checks outstanding |
| (2 | ) |
| - | |
| - | | ||||
All other, net |
| 59 | |
| 37 | |
| (70 | ) | ||||
Net cash provided by operating activities |
| 802 | |
| 731 | |
| 360 | | ||||
Investing activities: |
|
|
|
|
|
| |||||||
Capital expenditures |
| (505 | ) |
| (306 | ) |
| (500 | ) | ||||
Acquisitions |
| - | |
| - | |
| (25 | ) | ||||
Disposal of assets |
| 5 | |
| 12 | |
| 4 | | ||||
Change in restricted cash, net |
| (3 | ) |
| (3 | ) |
| 13 | | ||||
Proceeds from sale of ownership interests in equity investees |
| 116 | |
| - | |
| - | | ||||
Investments, net |
| (2 | ) |
| (21 | ) |
| (2 | ) | ||||
Net cash used in investing activities |
| (389 | ) |
| (318 | ) |
| (510 | ) | ||||
Financing activities: |
|
|
|
|
|
| |||||||
Issuance of long-term debt, net of financing costs (Note 16) |
| 737 | |
| 958 | |
| - | | ||||
Repayment of long-term debt (Note 16) |
| (1,104 | ) |
| (1,070 | ) |
| (379 | ) | ||||
Settlement of contingent consideration |
| - | |
| (15 | ) |
| - | | ||||
Net proceeds from public offering of common stock (Note 26) |
| - | |
| 482 | |
| - | | ||||
Receipts from exercise of stock options |
| 20 | |
| 35 | |
| 1 | | ||||
Taxes paid for equity compensation plans (Note 14) |
| (10 | ) |
| (4 | ) |
| (1 | ) | ||||
Dividends paid |
| (35 | ) |
| (31 | ) |
| (29 | ) | ||||
Net cash (used in) provided by financing activities |
| (392 | ) |
| 355 | |
| (408 | ) | ||||
Effect of exchange rate changes on cash |
| 17 | |
| (8 | ) |
| (41 | ) | ||||
Net increase (decrease) in cash and cash equivalents |
| 38 | |
| 760 | |
| (599 | ) | ||||
Cash and cash equivalents at beginning of year |
| 1,515 | |
| 755 | |
| 1,354 | | ||||
Cash and cash equivalents at end of year |
| $ | 1,553 | |
| $ | 1,515 | |
| $ | 755 | | |
See Note 21 for supplemental cash flow information.
The accompanying notes are an integral part of these Consolidated Financial Statements.
F-9
Table of Contents
UNITED STATES STEEL CORPORATION
CONSOLIDATED STATEMENTS OF STOCKHOLDERS' EQUITY
|
| Dollars in Millions |
| Shares in Thousands | |||||||||||||||||
|
| 2017 |
| 2016 |
| 2015 |
| 2017 |
| 2016 |
| 2015 | |||||||||
Common stock: |
|
|
|
|
|
|
|
|
|
|
|
| |||||||||
Balance at beginning of year |
| $ | 176 | |
| $ | 151 | |
| $ | 151 | |
| 176,425 | |
| 150,926 | |
| 150,926 | |
Common stock issued |
| - | |
| 25 | |
| - | |
| - | |
| 25,499 | |
| - | | |||
Balance at end of year |
| $ | 176 | |
| $ | 176 | |
| $ | 151 | |
| 176,425 | |
| 176,425 | |
| 150,926 | |
Treasury stock: |
|
|
|
|
|
|
|
|
|
|
|
| |||||||||
Balance at beginning of year |
| $ | (182 | ) |
| $ | (339 | ) |
| $ | (396 | ) |
| (2,614 | ) |
| (4,645 | ) |
| (5,271 | ) |
Common stock reissued for employee/non-employee director stock plans |
| 106 | |
| 157 | |
| 57 | |
| 1,411 | |
| 2,031 | |
| 626 | | |||
Balance at end of year |
| $ | (76 | ) |
| $ | (182 | ) |
| $ | (339 | ) |
| (1,203 | ) |
| (2,614 | ) |
| (4,645 | ) |
Additional paid-in capital: |
|
|
|
|
|
|
|
|
|
|
|
| |||||||||
Balance at beginning of year |
| $ | 4,027 | |
| $ | 3,603 | |
| $ | 3,623 | |
|
|
|
|
|
| |||
Common stock issued |
| - | |
| 557 | |
| - | |
|
|
|
|
|
| ||||||
Dividends on common stock |
| (26 | ) |
| (31 | ) |
| - | |
|
|
|
|
|
| ||||||
Employee stock plans |
| (69 | ) |
| (102 | ) |
| (20 | ) |
|
|
|
|
|
| ||||||
Balance at end of year |
| $ | 3,932 | |
| $ | 4,027 | |
| $ | 3,603 | |
|
|
|
|
|
| |||
The accompanying notes are an integral part of these Consolidated Financial Statements.
F-10
Table of Contents
UNITED STATES STEEL CORPORATION
CONSOLIDATED STATEMENTS OF STOCKHOLDERS' EQUITY
(Continued)
|
|
|
| Comprehensive Income (Loss) | ||||||||||||||||||||
(Dollars in millions) |
| 2017 |
| 2016 |
| 2015 |
| 2017 |
| 2016 |
| 2015 | ||||||||||||
Retained earnings: |
|
|
|
|
|
|
|
|
|
|
|
| ||||||||||||
Balance at beginning of year |
| $ | (250 | ) |
| $ | 190 | |
| $ | 1,862 | |
|
|
|
|
|
| ||||||
Net earnings (loss) attributable to United States Steel Corporation |
| 387 | |
| (440 | ) |
| (1,642 | ) |
| $ | 387 | |
| $ | (440 | ) |
| $ | (1,642 | ) | |||
Dividends on common stock |
| (9 | ) |
| - | |
| (29 | ) |
|
|
|
|
|
| |||||||||
Other |
| 5 | |
| - | |
| (1 | ) |
|
|
|
|
|
| |||||||||
Balance at end of year |
| $ | 133 | |
| $ | (250 | ) |
| $ | 190 | |
|
|
|
|
|
| ||||||
Accumulated other comprehensive (loss) income: |
|
|
|
|
|
|
|
|
|
|
|
| ||||||||||||
Pension and other benefit adjustments (Note 17) : |
|
|
|
|
|
|
|
|
|
|
|
| ||||||||||||
Balance at beginning of year |
| $ | (1,771 | ) |
| $ | (1,479 | ) |
| $ | (1,852 | ) |
|
|
|
|
|
| ||||||
Changes during year, net of taxes (a) |
| 454 | |
| (288 | ) |
| 364 | |
| 454 | |
| (288 | ) |
| 364 | | ||||||
Changes during year, equity investee net of taxes (a) |
| 8 | |
| (4 | ) |
| 9 | |
| 8 | |
| (4 | ) |
| 9 | | ||||||
Balance at end of year |
| $ | (1,309 | ) |
| $ | (1,771 | ) |
| $ | (1,479 | ) |
|
|
|
|
|
| ||||||
Foreign currency translation adjustments: |
|
|
|
|
|
|
|
|
|
|
|
| ||||||||||||
Balance at beginning of year |
| $ | 274 | |
| $ | 312 | |
| $ | 416 | |
|
|
|
|
|
| ||||||
Changes during year, net of taxes (a) |
| 189 | |
| (38 | ) |
| (104 | ) |
| 189 | |
| (38 | ) |
| (104 | ) | ||||||
Balance at end of year |
| $ | 463 | |
| $ | 274 | |
| $ | 312 | |
|
|
|
|
|
| ||||||
Other: |
|
|
|
|
|
|
|
|
|
|
|
| ||||||||||||
Balance at beginning of year |
| $ | - | |
| $ | (2 | ) |
| $ | (5 | ) |
|
|
|
|
|
| ||||||
Changes during year, net of taxes (a) |
| 1 | |
| 2 | |
| 3 | |
| 1 | |
| 2 | |
| 3 | | ||||||
Balance at end of year |
| $ | 1 | |
| $ | - | |
| $ | (2 | ) |
|
|
|
|
|
| ||||||
Total balances at end of year |
| $ | (845 | ) |
| $ | (1,497 | ) |
| $ | (1,169 | ) |
|
|
|
|
|
| ||||||
Total stockholders' equity |
| $ | 3,320 | |
| $ | 2,274 | |
| $ | 2,436 | |
|
|
|
|
|
| ||||||
Noncontrolling interests: |
|
|
|
|
|
|
|
|
|
|
|
| ||||||||||||
Balance at beginning of year |
| $ | 1 | |
| $ | 1 | |
| $ | 1 | |
|
|
|
|
|
| ||||||
Net loss |
| - | |
| - | |
| - | |
| - | |
| - | |
| - | | ||||||
Balance at end of year |
| $ | 1 | |
| $ | 1 | |
| $ | 1 | |
|
|
|
|
|
| ||||||
Total comprehensive (income) loss |
|
|
|
|
|
|
| $ | 1,039 | |
| $ | (768 | ) |
| $ | (1,370 | ) | ||||||
Foreign currency translation adjustments (b) |
| $ | - | |
| $ | - | |
| $ | 82 | |
Pension and other benefits adjustments (b) |
| - | |
| - | |
| (228 | ) | |||
Other adjustments (b) |
| - | |
| - | |
| (2 | ) | |||
(b) Amounts for 2016 and 2017 do not reflect a tax benefit as a result of a full valuation allowance on our domestic deferred tax assets.
The accompanying notes are an integral part of these Consolidated Financial Statements.
F-11
Table of Contents
1. Nature of Business and Significant Accounting Policies
Nature of Business
U. S. Steel produces and sells steel products, including flat-rolled and tubular products, in North America and Europe. Operations also include iron ore and coke production facilities, railroad services and real estate operations located in the United States. Operations in Europe also include coke production facilities.
Significant Accounting Policies
Principles applied in consolidation
These financial statements include the accounts of U. S. Steel and its majority-owned subsidiaries. Additionally, variable interest entities for which U. S. Steel is the primary beneficiary are included in the Consolidated Financial Statements and their impacts are either partially or completely offset by noncontrolling interests. Intercompany accounts, transactions and profits have been eliminated in consolidation. On September 16, 2014, U. S. Steel Canada Inc. (USSC), a wholly owned subsidiary of U. S. Steel, applied for relief from its creditors pursuant to Canada's Companies' Creditors Arrangement Act (CCAA). As a result of USSC filing for protection under CCAA (CCAA filing), U. S. Steel determined that USSC and its subsidiaries would be deconsolidated from U. S. Steel's financial statements on a prospective basis effective as of the date of the CCAA filing. Transactions between USSC and U. S. Steel subsequent to the CCAA filing and prior to the sale to an affiliate of Bedrock Industries Group LLC (Bedrock) on June 30, 2017 are not eliminated and are considered related party.
Investments in entities over which U. S. Steel has significant influence are accounted for using the equity method of accounting and are carried at U. S. Steel's share of net assets plus loans, advances and our share of earnings less distributions. Differences in the basis of the investment and the underlying net asset value of the investee, if any, are amortized into earnings over the remaining useful life of the associated assets.
Earnings or loss from investees includes U. S. Steel's share of earnings or loss from equity method investments, which is generally recorded a month in arrears, except for significant and unusual items which are recorded in the period of occurrence. Gains or losses from changes in ownership of unconsolidated investees are recognized in the period of change. Intercompany profits and losses on transactions with equity investees have been eliminated in consolidation.
U. S. Steel evaluates impairment of its equity method investments whenever circumstances indicate that a decline in value below carrying value is other than temporary. Under these circumstances, we adjust the investment down to its estimated fair value, which then becomes its new carrying value.
Investments in companies whose equity has no readily determinable fair value are carried at cost and are periodically reviewed for impairment.
Use of estimates
Generally accepted accounting principles require management to make estimates and assumptions that affect the reported amounts of assets and liabilities, the disclosure of contingent assets and liabilities at year-end and the reported amounts of revenues and expenses during the year. Significant items subject to such estimates and assumptions include the carrying value of property, plant and equipment; intangible assets; valuation allowances for receivables, inventories and deferred income tax assets and liabilities; environmental liabilities; liabilities for potential tax deficiencies; potential litigation claims and settlements; and assets and obligations related to employee benefits. Actual results could differ materially from the estimates and assumptions used.
Sales recognition
Sales are recognized when products are shipped, properties are sold or services are provided to customers; the sales price is fixed and determinable; collectability is reasonably assured; and title and risks of ownership have passed to the buyer. Depending on the shipping terms, shipping and other transportation costs charged to buyers are recorded gross (as both sales and cost of sales), or net of the amount paid to shipping providers.
Cash and cash equivalents
Cash and cash equivalents include cash on deposit and investments in highly liquid debt instruments with maturities of three months or less.
Inventories
Inventories are carried at the lower of cost or market. Fixed costs related to abnormal production capacity are expensed in the period incurred rather than capitalized into inventory.
F-12
Table of Contents
LIFO (last-in, first-out) is the predominant method of inventory costing for inventories in the United States and FIFO (first-in, first-out) is the predominant method in Europe. The LIFO method of inventory costing was used on 75 percent of consolidated inventories at both December 31, 2017 and 2016 .
Derivative instruments
U. S. Steel uses commodity-based and foreign currency derivative instruments to manage its exposure to price and foreign currency exchange rate risk. Forward physical purchase contracts and foreign exchange forward contracts are used to reduce the effects of fluctuations in the purchase price of natural gas and certain nonferrous metals and also certain business transactions denominated in foreign currencies. U. S. Steel does not have a material amount of derivative instruments for which hedge accounting treatment has been elected. As a result, the changes in fair value of these derivatives are recognized immediately in results of operations. See Note 15 for further details on U. S. Steel's derivatives.
Identifiable intangible assets
U. S. Steel has determined that certain acquired intangible assets have indefinite useful lives. These assets are reviewed for impairment annually and whenever events or circumstances indicate that the carrying value may not be recoverable.
Identifiable intangible assets with finite lives are amortized on a straight-line basis over their estimated useful lives and are reviewed for impairment whenever events or circumstances indicate that the carrying value may not be recoverable.
See Note 13 for further details on our evaluation of intangible asset impairment.
Property, plant and equipment
Property, plant and equipment is carried at cost and is depreciated on a straight-line basis over the estimated useful lives of the assets.
Depletion of mineral properties is based on rates which are expected to amortize cost over the estimated tonnage of minerals to be removed.
When property, plant and equipment is sold or otherwise disposed of, any gains or losses are reflected in income. If a loss on disposal is expected, such losses are recognized when the assets are reclassified as assets held for sale or when impaired as part of an asset group's impairment.
U. S. Steel evaluates impairment of its property, plant and equipment whenever circumstances indicate that the carrying value may not be recoverable. We evaluate the impairment of long-lived assets at the asset group level. Our asset groups are Flat-Rolled, welded tubular, seamless tubular and U. S. Steel Europe (USSE). Asset impairments are recognized when the carrying value of an asset grouping exceeds its recoverable amount as determined by the asset group's aggregate projected undiscounted cash flows.
During 2017, there were no triggering events that required fixed assets to be evaluated for impairment.
During 2016, the permanent shutdown of certain Lorain, Lone Star and Bellville tubular assets, was considered a triggering event for our welded and seamless tubular asset groups. U. S. Steel completed a quantitative analysis of its long-lived assets for these asset groups within the Tubular segment and determined that the remaining assets were not impaired. The welded tubular asset group had a carrying value of $410 million at December 31, 2016 and the recoverable amount exceeded this carrying value by approximately $93 million , or 23 percent . The seamless tubular asset group had a carrying value of $210 million at December 31, 2016 and the recoverable amount exceeded this carrying value by $220 million , or 106 percent . The key assumption used to estimate the recoverable amounts for both the welded and seamless tubular asset groups was the forecasted price of oil over the 11 -year average remaining useful lives of the assets within the asset groups. Management will continue to monitor market and economic conditions for triggering events that may warrant further review of long-lived assets.
During 2015, the economic environment, including the significant decline in energy prices and the high levels of tubular imports, was considered a triggering event for our welded and seamless tubular asset groups. U. S. Steel completed a quantitative analysis of its long-lived assets for these asset groups within the Tubular segment. This analysis indicated that the assets were not impaired.
F-13
Table of Contents
Change in Accounting Estimate - Capitalization and Depreciation Method
During 2017, U. S. Steel completed a review of its accounting policy for property, plant and equipment depreciated on a group basis. As a result of this review, U. S. Steel changed its accounting method for property, plant and equipment from the group method of depreciation to the unitary method of depreciation, effective as of January 1, 2017. The Company believes the change from the group method to the unitary method of depreciation is preferable under U.S. GAAP as it will result in a more precise estimate of depreciation expense. Additionally, the change to the unitary method of depreciation is consistent with the depreciation method applied by our competitors, and improves the comparability of our results to the results of our competitors. Our change in the method of depreciation is considered a change in accounting estimate effected by a change in accounting principle and has been applied prospectively. Due to the application of the unitary method of depreciation and resultant change in our capitalization policy, maintenance and outage spending that had previously been expensed as well as capital investments associated with our asset revitalization program will now be capitalized if it extends the useful life of the related asset.
When property, plant, and equipment are disposed of by sale, retirement, or abandonment, the gross value of the property, plant and equipment and corresponding accumulated depreciation are removed from the Company's financial accounting records. Due to the application of the unitary method of depreciation, any gain or loss resulting from an asset disposal by sale will now be immediately recognized as a gain or loss on the disposal of assets line in our consolidated statement of operations. Assets that are retired or abandoned will be reflected as an immediate charge to depreciation expense for any remaining book value in our consolidated statement of operations. Gains (losses) on disposals of assets for the year ended December 31, 2017 were immaterial.
U. S. Steel's property, plant and equipment totaled $3,979 million at December 31, 2016. U. S. Steel allocated the existing net book value of group assets at the transition date to approximate a unitary depreciation methodology, and the fixed assets are being depreciated over their estimated remaining useful lives as follows:
| (In millions) | ||
Remaining Useful Life of Assets | Net Book Value at December 31, 2016 | ||
Under 5 years | $ | 597 | |
6-10 years | 629 | | |
11-15 years | 765 | | |
16-20 years | 654 | | |
21-25 years | 363 | | |
Over 25 years | 479 | | |
Assets not subject to depreciation | 492 | | |
Total | $ | 3,979 | |
Major maintenance activities
U. S. Steel incurs maintenance costs on all of its major equipment. Costs that extend the life of the asset, materially add to its value, or adapt the asset to a new or different use are separately capitalized in property, plant and equipment and are depreciated over the estimated useful life. All other repair and maintenance costs are expensed as incurred.
Environmental remediation
Environmental expenditures are capitalized if the costs mitigate or prevent future contamination or if the costs improve existing assets' environmental safety or efficiency. U. S. Steel provides for remediation costs and penalties when the responsibility to remediate is probable and the amount of associated costs is reasonably estimable. The timing of remediation accruals typically coincides with completion of studies defining the scope of work to be undertaken or when it is probable that a formal plan of action will be approved by the oversight agency. Remediation liabilities are accrued based on estimates of believed environmental exposure and are discounted if the amount and timing of the cash disbursements are readily determinable.
Asset retirement obligations
F-14
Table of Contents
Asset retirement obligations (AROs) are initially recorded at fair value and are capitalized as part of the cost of the related long-lived asset and depreciated in accordance with U. S. Steel's depreciation policies for property, plant and equipment. The fair value of the obligation is determined as the discounted value of expected future cash flows. Accretion expense is recorded each month to increase this discounted obligation over time. Certain AROs related to disposal costs of the majority of assets at our integrated steel facilities are not recorded because they have an indeterminate settlement date. These AROs will be initially recognized in the period in which sufficient information exists to estimate their fair value. See Note 18 for further details on U. S. Steel's AROs.
Pensions and other post-employment benefits
U. S. Steel has defined contribution or multi-employer arrangements for pension benefits for more than three-quarters of its employees in the United States and non-contributory defined benefit pension plans covering the remaining employees. Effective December 31, 2015, defined benefit pension benefits for non-represented employees were frozen. As of January 1, 2016 all non-represented employees participate in defined contribution plans. U. S. Steel has defined benefit retiree health care and life insurance plans (Other Benefits) that cover the majority of its represented employees in North America upon their retirement. On February 1, 2016, the United Steelworkers (USW) ratified successor three year Collective Bargaining Agreements with U. S. Steel and its U. S. Steel Tubular Products, Inc. subsidiary (the 2015 Labor Agreements). As a result of the 2015 Labor Agreements, retiree medical and retiree life benefit plans were closed to represented employees hired on or after January 1, 2016. Instead, these employees will receive a company defined contribution into a savings account of $0.50 per hour worked. Defined benefit retiree health and retiree life insurance has been eliminated for non-represented employee retirements after December 31, 2017. The Steelworkers Pension Trust (SPT), a multi-employer pension plan, to which U. S. Steel contributes on the basis of a fixed dollar amount for each hour worked by participating employees, currently covers approximately two-thirds of our represented employees in the United States. Government-sponsored programs into which U. S. Steel makes required contributions cover the majority of U. S. Steel's European employees.
The pension and other benefits obligations and the related net periodic benefit costs are based on, among other things, assumptions of the discount rate, estimated return on plan assets, salary increases, the projected mortality of participants and the current level and future escalation of health care costs. Additionally, U. S. Steel recognizes an obligation to provide post-employment benefits for disability-related claims covering indemnity and medical payments for certain employees in North America. The obligation for these claims and the related periodic costs are measured using actuarial techniques and assumptions. Actuarial gains and losses occur when actual experience differs from any of the many assumptions used to value the benefit plans, or when assumptions change. For pension and other benefits, the Company recognizes into income on an annual basis any unrecognized actuarial net gains or losses that exceed 10 percent of the larger of projected benefit obligations or plan assets (the corridor). These unrecognized amounts in excess of the corridor are amortized over the plan participants' average life expectancy or average future service, depending on the demographics of the plan. Unrecognized actuarial net gains and losses for disability-related claims are immediately recognized into income.
Concentration of credit and business risks
U. S. Steel is exposed to credit risk in the event of nonpayment by customers, principally within the automotive, container, construction, steel service center, appliance and electrical, conversion, and oil, gas and petrochemical industries. Changes in these industries may significantly affect U. S. Steel's financial performance and management's estimates. U. S. Steel mitigates its exposure to credit risk by performing ongoing credit evaluations and, when deemed necessary, requiring letters of credit, credit insurance, prepayments, guarantees or other collateral.
The majority of U. S. Steel's customers are located in North America and Europe. No single customer accounted for more than 10 percent of gross annual revenues.
Foreign currency translation
U. S. Steel is subject to the risk of the effects of exchange rates on revenues and operating costs and existing assets or liabilities denominated in currencies other than our reporting currency, the U.S. dollar.
The functional currency for U. S. Steel Europe (USSE) is the euro ( € ). Assets and liabilities of USSE are translated into U.S. dollars at period-end exchange rates. Revenue and expenses are translated using the average exchange rate for the reporting period. Resulting translation adjustments are recorded in the accumulated other comprehensive income (loss) component of stockholders' equity. Gains and losses from foreign currency transactions are included in net earnings (loss) for the period.
F-15
Table of Contents
Stock-based compensation
U. S. Steel accounts for its various stock-based employee compensation plans in accordance with the guidance in Accounting Standards Codification (ASC) Topic 718 on stock compensation (see Note 14).
Deferred taxes
Deferred tax assets and liabilities are recognized for the estimated future tax consequences attributable to differences between the financial statement carrying amounts of existing assets and liabilities and their respective tax basis. The realization of deferred tax assets is assessed quarterly based on several interrelated factors. These factors include U. S. Steel's expectation to generate sufficient future taxable income and the projected time period over which these deferred tax assets will be realized. U. S. Steel records a valuation allowance when necessary to reduce deferred tax assets to the amount that will more likely than not be realized. Deferred taxes have been recognized for the undistributed earnings of most foreign subsidiaries because management does not intend to indefinitely reinvest such earnings in foreign operations. See Note 10 for further details of deferred taxes.
Insurance
U . S. Steel maintains insurance for certain property damage, equipment, business interruption and general liability exposures; however, insurance is applicable only after certain deductibles and retainages. U. S. Steel is self-insured for certain other exposures including workers' compensation (where permitted by law) and automobile liability. Liabilities are recorded for workers' compensation and personal injury obligations. Other costs resulting from losses under deductible or retainage amounts or not otherwise covered by insurance are charged against income upon occurrence.
Sales taxes
Sales are generally recorded net of sales taxes charged to customers. Sales taxes primarily relate to value-added tax on sales.
Reclassifications
Effective January 1, 2017, the Company adopted Accounting Standards Update No. 2016-09, Compensation - Stock Compensation (ASU 2016-09). As a result of adopting ASU 2016-09, cash taxes paid by the Company when directly withholding shares for tax withholding purposes have been classified as a cash flow financing activity. The adoption of this component of ASU 2016-09 was applied retrospectively, and prior year data has been reclassified to conform to current year data. Additionally, we have expanded our Property, Plant and Equipment disclosure to include additional disaggregation of the machinery and equipment category (see Note 12). Reclassification of prior year data has been made to conform to this expanded disclosure.
2. New Accounting Standards
In February 2018, the Financial Accounting Standards Board (FASB) issued Accounting Standards Update (ASU) 2018-02, Reclassification of Certain Tax Effects from Accumulated Other Comprehensive Income (ASU 2018-02) . ASU 2018-02 allows a reclassification from Accumulated other Comprehensive Income to Retained Earnings for stranded tax effects resulting from the Tax Cuts and Jobs Act (the 2017 Act). The amendments in this ASU are effective for fiscal years beginning after December 15, 2018 and for interim periods therein. Early adoption of ASU 2018-02 is permitted. U. S. Steel is currently assessing the impact of the ASU, but does not believe this ASU will have a material impact on its overall Consolidated Financial Statements.
In August 2017, the FASB issued ASU 2017-12, Derivatives and Hedging (Topic 815): Targeted Improvements to Accounting for Hedging Activities (ASU 2017-12), which amends and simplifies existing guidance in order to allow companies to more accurately present the economic effects of risk management activities in the financial statements. ASU 2017-12 is effective for fiscal years beginning after December 15, 2018 and interim periods within those fiscal years, with early adoption permitted. U. S. Steel will adopt the provisions of ASU 2017-12 effective January 1, 2018 and does not expect there to be a material impact on its Consolidated Financial Statements.
On May 10, 2017, the FASB issued ASU 2017-09, Compensation – Stock Compensation: Scope of Modification Accounting (ASU 2017-09). The amendments included in ASU 2017-09 provide guidance about which changes to the terms and conditions of a share-based payment award require an entity to apply modification accounting. The amendments in this update will be applied prospectively to an award modified on or after the adoption date. ASU 2017-09 is effective for fiscal years beginning after December 15, 2017 and interim periods within those
F-16
Table of Contents
fiscal years, with early adoption permitted. U. S. Steel does not expect the adoption of ASU 2017-09 to have a material impact on its Consolidated Financial Statements.
On March 10, 2017, the FASB issued ASU 2017-07, Compensation - Retirement Benefits (ASU 2017-07). ASU 2017-07 requires an employer who offers defined benefit and postretirement benefit plans to report the service cost component of the net periodic benefit cost in the same line item or items as other compensation cost arising from services rendered by employees during the period. The other components of net periodic benefit costs are required to be presented on a retrospective basis in the income statement separately from the service cost component and outside a subtotal of income from operations, if one is presented. If a separate line item or items are used to present the other components of net periodic benefit cost, that line item or items must be appropriately described. If a separate line item or items are not used, the line item or items used in the income statement to present the other components of net periodic benefit cost must be disclosed. The ASU also allows for the service cost component of net periodic benefit cost to be eligible for capitalization into inventory when applicable. ASU 2017-07 is effective for periods beginning after December 15, 2017, including interim periods within those annual periods; early adoption is permitted. The adoption of this ASU will not have an impact on U. S. Steel's net earnings (loss) but will be a reclassification from a line on the income statement within earnings (loss) before interest and income taxes to a line on the income statement below earnings (loss) before interest and income taxes.
On November 17, 2016, the FASB issued ASU 2016-18, Statement of Cash Flows (Topic 230): Restricted Cash (ASU 2016-18). The primary purpose of this ASU is to reduce the diversity in practice that exists in the classification and presentation of changes in restricted cash on the statement of cash flows. ASU 2016-18 will require that a statement of cash flows explain the change during the period in the total of cash, cash equivalents, and amounts generally described as restricted cash or cash equivalents. Therefore, amounts generally described as restricted cash and restricted cash equivalents should be included with cash and cash equivalents when reconciling the beginning-of-period and end-of-period total amounts shown on the statement of cash flows. ASU 2016-18 is effective for fiscal years beginning after December 15, 2017, including interim periods within those annual periods; early adoption is permitted. U. S. Steel will adopt the provisions of ASU 2016-18 effective January 1, 2018 and will make the required changes to its Consolidated Statement of Cash Flows.
On August 26, 2016, the FASB issued ASU 2016-15, Statement of Cash Flows: Classification of Certain Cash Receipts and Cash Payments (ASU 2016-15). ASU 2016-15 reduces diversity in practice in how certain transactions are classified in the statement of cash flows by addressing eight specific cash receipt and cash payment issues. ASU 2016-15 is effective for public business entities for fiscal years beginning after December 15, 2017, and interim periods within those fiscal years. Early adoption is permitted, including adoption in an interim period. U. S. Steel does not expect the adoption of ASU 2016-15 to have an overall impact to the Company's consolidated statement of cash flows, but it may result in a reclassification between cash flow line items.
On February 25, 2016, the FASB issued ASU 2016-02, Leases (ASU 2016-02). ASU 2016-02 supersedes prior lease accounting guidance. Under ASU 2016-02, for operating leases, a lessee should recognize in its statement of financial position a liability to make lease payments and a right-of-use asset representing its right to use the underlying asset for the lease term; recognize a single lease cost, which is allocated over the lease term, generally on a straight line basis, and classify all cash payments within the operating activities in the statement of cash flows. For financing leases, a lessee is required to recognize a right-of-use asset and a lease liability; recognize interest on the lease liability separately from amortization of the right-of-use asset, and classify repayments of the principal portion of the lease liability within financing activities and payments of interest on the lease liability within the operating activities in the statement of cash flows. For leases with a term of 12 months or less, a lessee is permitted to make an accounting policy election not to recognize lease assets and lease liabilities. In addition, at the inception of a contract, an entity should determine whether the contract is, or contains a lease. ASU 2016-02 is effective for public entities for fiscal years beginning after December 15, 2018, including interim periods within those fiscal years, using a modified retrospective approach. U. S. Steel is currently evaluating the financial statement implications of adopting ASU 2016-02, and has begun an inventory of its global leasing arrangements.
On May 28, 2014, the FASB and the International Accounting Standards Board issued ASU No. 2014-09, Revenue from Contracts with Customers (ASU 2014-09). ASU 2014-09 outlines a single comprehensive model for entities to use in accounting for revenue arising from contracts with customers and supersedes most current revenue recognition guidance, including industry-specific guidance. ASU 2014-09 is effective for interim and annual periods beginning after December 15, 2016; early application is not permitted. On August 12, 2015, the FASB issued ASU 2015-14, Revenue from Contracts with Customers - Deferral of the Effective Date (ASU 2015-14).
F-17
Table of Contents
ASU 2015-14 defers the effective date of ASU 2014-09 to annual reporting periods beginning after December 15, 2017, including interim reporting periods within that reporting period, and only permits entities to adopt the standard one year earlier as of annual reporting periods beginning after December 15, 2016, including interim reporting periods within that reporting period. U. S. Steel has completed its review of its significant customer contracts and has determined that the full retrospective adoption of this ASU on January 1, 2018 will not have a material financial statement impact. U. S. Steel will provide expanded disclosures in accordance with the ASU.
3. Recently Adopted Accounting Standards
On March 30, 2016, the FASB issued ASU 2016-09, Compensation - Stock Compensation (ASU 2016-09). ASU 2016-09 simplifies the accounting and reporting of certain aspects of share-based payment transactions, including income tax treatment of excess tax benefits, forfeitures, classification of share-based awards as either equity or liabilities, and classification in the statement of cash flows for certain share-based transactions related to tax benefits and tax payments. ASU 2016-09 was effective for public business entities for annual periods beginning after December 15, 2016.
On January 1, 2017, the Company adopted the provisions of ASU 2016-09. The adoption of ASU 2016-09 did not have a significant impact on the Company's Consolidated Financial Statements and included the following items: (1) adoption on a prospective basis of the recognition of excess tax benefits and tax deficiencies in the Company's income tax expense line in the Consolidated Statement of Operations for vested and exercised equity awards as discrete items in the period in which they occur; (2) adoption on a prospective basis of the classification of excess tax benefits in cash flows from operations in the Company's Consolidated Statement of Cash Flows; (3) adoption on a retrospective basis of the classification of cash paid by the Company for directly withholding shares for tax withholding purposes in cash flows from financing activities, and (4) adoption on a prospective basis for the exclusion of the amount of excess tax benefits when applying the treasury stock method for the Company's diluted earnings per share calculation.
Additionally, the Company continues to withhold the statutory minimum taxes for participants in the Company's stock-based compensation plans and estimates forfeiture rates at the grant date and the expected term of its equity awards based on historical results.
On July 22, 2015, the FASB issued ASU No. 2015-11, Simplifying the Measurement of Inventory (ASU 2015-11). ASU 2015-11 requires an entity to measure most inventory at the lower of cost and net realizable value, thereby simplifying the prior guidance under which an entity must measure inventory at the lower of cost or market. ASU 2015-11 does not apply to inventories that are measured using either the last-in, first-out (LIFO) method or the retail inventory method. ASU 2015-11 was effective for public entities for financial statements issued for fiscal years beginning after December 15, 2016. U. S. Steel adopted ASU 2015-11 on January 1, 2017. The adoption did not have a significant financial statement impact to U. S. Steel.
4. Segment Information
U. S. Steel has three reportable segments: Flat-Rolled Products (Flat-Rolled), USSE and Tubular Products (Tubular). The results of our railroad and real estate businesses that do not constitute reportable segments are combined and disclosed in the Other Businesses category.
The Flat-Rolled segment includes the operating results of U. S. Steel's integrated steel plants and equity investees in the United States involved in the production of slabs, strip mill plates, sheets and tin mill products, as well as all iron ore and coke production facilities in the United States. These operations primarily serve North American customers in the service center, conversion, transportation (including automotive), construction, container, and appliance and electrical markets. Additionally, the Flat-Rolled segment consists of the following three commercial entities to specifically address our customers and service their needs: (1) automotive solutions, (2) consumer solutions, and (3) industrial, service center and mining solutions.
Flat-Rolled has historically supplied steel rounds and hot-rolled bands to Tubular. In the third quarter of 2015, the blast furnace and associated steelmaking operations, along with most of the flat-rolled finishing operations at Fairfield Works were shutdown. Therefore, Flat-Rolled is currently not supplying rounds to Tubular, and will not in the future.
The USSE segment includes the operating results of U. S. Steel Košice (USSK), U. S. Steel's integrated steel plant and coke production facilities in Slovakia, and its subsidiaries. USSE primarily serves customers in the
F-18
Table of Contents
Eastern European construction, service center, conversion, container, transportation (including automotive), appliance and electrical, and oil, gas and petrochemical markets. USSE produces and sells slabs, sheet, strip mill plate, tin mill products and spiral welded pipe, as well as heating radiators and refractory ceramic materials.
The Tubular segment includes the operating results of U. S. Steel's tubular production facilities, in the United States, and equity investees in the United States and Brazil. Our ownership interest in the equity investment in Brazil was sold in December of 2017. These operations produce and sell seamless and electric resistance welded (welded) steel casing and tubing (commonly known as oil country tubular goods or OCTG), standard and line pipe and mechanical tubing and primarily serve customers in the oil, gas and petrochemical markets. During the fourth quarter of 2016, certain of our tubular assets within the Tubular segment were permanently shut down, including Pipe Mill #1 at our Lone Star facility, Pipe Mill #4 at our Lorain facility and our Bellville facility. Additionally, we sold the assets at our McKeesport tubular operations in 2016.
The chief operating decision maker evaluates performance and determines resource allocations based on a number of factors, the primary measure being earnings (loss) before interest and income taxes. Earnings (loss) before interest and income taxes for reportable segments and Other Businesses does not include net interest and other financial costs (income), income taxes, post-employment benefit expenses (other than service cost and amortization of prior service cost for active employees) and certain other items that management believes are not indicative of future results.
The accounting principles applied at the operating segment level in determining earnings (loss) before interest and income taxes are generally the same as those applied at the consolidated financial statement level. Intersegment sales and transfers are accounted for at market-based prices and are eliminated at the corporate consolidation level. Corporate-level selling, general and administrative expenses and costs related to certain former businesses are allocated to the reportable segments and Other Businesses based on measures of activity that management believes are reasonable.
F-19
Table of Contents
The results of segment operations are as follows:
(In millions) |
| Customer |
| Intersegment |
| Net |
| Earnings |
| Earnings (Loss) before Interest and Income Taxes |
| Depreciation, |
| Capital | ||||||||||||||
2017 |
|
|
|
|
|
|
|
|
|
|
|
|
|
| ||||||||||||||
Flat-Rolled |
| $ | 8,297 | |
| $ | 194 | |
| $ | 8,491 | |
| $ | 38 | |
| $ | 380 | |
| $ | 352 | |
| $ | 388 | |
USSE |
| 2,949 | |
| 25 | |
| 2,974 | |
| - | |
| 327 | |
| 76 | |
| 83 | | |||||||
Tubular |
| 944 | |
| 1 | |
| 945 | |
| 8 | |
| (99 | ) |
| 51 | |
| 28 | | |||||||
Total reportable segments |
| 12,190 | |
| 220 | |
| 12,410 | |
| 46 | |
| 608 | |
| 479 | |
| 499 | | |||||||
Other Businesses |
| 60 | |
| 119 | |
| 179 | |
| (2 | ) |
| 44 | |
| 22 | |
| 6 | | |||||||
Reconciling Items and Eliminations |
| - | |
| (339 | ) |
| (339 | ) |
| - | |
| (44 | ) |
| - | |
| - | | |||||||
Total |
| $ | 12,250 | |
| $ | - | |
| $ | 12,250 | |
| $ | 44 | |
| $ | 608 | |
| $ | 501 | |
| $ | 505 | |
2016 |
|
|
|
|
|
|
|
|
|
|
|
|
|
| ||||||||||||||
Flat-Rolled |
| $ | 7,507 | |
| $ | 25 | |
| $ | 7,532 | |
| $ | 106 | |
| $ | (3 | ) |
| $ | 349 | |
| $ | 111 | |
USSE |
| 2,243 | |
| 3 | |
| 2,246 | |
| - | |
| 185 | |
| 80 | |
| 83 | | |||||||
Tubular |
| 449 | |
| 2 | |
| 451 | |
| 6 | |
| (304 | ) |
| 68 | |
| 88 | | |||||||
Total reportable segments |
| 10,199 | |
| 30 | |
| 10,229 | |
| 112 | |
| (122 | ) |
| 497 | |
| 282 | | |||||||
Other Businesses |
| 62 | |
| 107 | |
| 169 | |
| (2 | ) |
| 63 | |
| 10 | |
| 24 | | |||||||
Reconciling Items and Eliminations |
| - | |
| (137 | ) |
| (137 | ) |
| (12 | ) |
| (106 | ) |
| - | |
| - | | |||||||
Total |
| $ | 10,261 | |
| $ | - | |
| $ | 10,261 | |
| $ | 98 | |
| $ | (165 | ) |
| $ | 507 | |
| $ | 306 | |
2015 |
|
|
|
|
|
|
|
|
|
|
|
|
|
| ||||||||||||||
Flat-Rolled |
| $ | 8,293 | |
| $ | 268 | |
| $ | 8,561 | |
| $ | 49 | |
| $ | (237 | ) |
| $ | 392 | |
| $ | 280 | |
USSE |
| 2,323 | |
| 3 | |
| 2,326 | |
| - | |
| 81 | |
| 81 | |
| 110 | | |||||||
Tubular |
| 898 | |
| - | |
| 898 | |
| 11 | |
| (179 | ) |
| 64 | |
| 102 | | |||||||
Total reportable segments |
| 11,514 | |
| 271 | |
| 11,785 | |
| 60 | |
| (335 | ) |
| 537 | |
| 492 | | |||||||
Other Businesses |
| 60 | |
| 105 | |
| 165 | |
| (22 | ) |
| 33 | |
| 10 | |
| 8 | | |||||||
Reconciling Items and Eliminations |
| - | |
| (376 | ) |
| (376 | ) |
| - | |
| (900 | ) |
| - | |
| - | | |||||||
Total |
| $ | 11,574 | |
| $ | - | |
| $ | 11,574 | |
| $ | 38 | |
| $ | (1,202 | ) |
| $ | 547 | |
| $ | 500 | |
A summary of assets by segment is as follows:
|
| December 31, | ||||||
(In millions) |
| 2017 |
| 2016 | ||||
Flat-Rolled (a) |
| $ | 5,823 | |
| $ | 5,431 | |
USSE (a) |
| 5,423 | |
| 5,375 | | ||
Tubular |
| 1,076 | |
| 993 | | ||
Total reportable segments |
| $ | 12,322 | |
| $ | 11,799 | |
Other Businesses |
| $ | 344 | |
| $ | 375 | |
Corporate, reconciling items, and eliminations (b) |
| (2,804 | ) |
| (3,014 | ) | ||
Total assets |
| $ | 9,862 | |
| $ | 9,160 | |
(a) | Included in segment assets for each year presented is goodwill for Flat-Rolled and USSE of $3 million and $4 million , respectively. |
(b) | The majority of Corporate, reconciling items, and eliminations total assets is comprised of Cash and the elimination of intersegment amounts. |
F-20
Table of Contents
(In millions) |
| 2017 |
| 2016 |
| 2015 | ||||||
Items not allocated to segments: |
|
|
|
|
|
| ||||||
Post-employment benefit (expense) income (a) |
| $ | (66 | ) |
| $ | 62 | |
| $ | (43 | ) |
Other items not allocated to segments: |
|
|
|
|
|
| ||||||
Gain (loss) associated with U. S. Steel Canada Inc. (Note 5) |
| 72 | |
| - | |
| (392 | ) | |||
Loss on shutdown of certain tubular pipe mill assets (b) |
| (35 | ) |
| (126 | ) |
| - | | |||
Loss on shutdown of coke production facilities (b) |
| - | |
| - | |
| (153 | ) | |||
Granite City Works temporary idling charges |
| (17 | ) |
| (18 | ) |
| (99 | ) | |||
Loss on shutdown of Fairfield Flat-Rolled Operations (b) (c) |
| - | |
| - | |
| (91 | ) | |||
Restructuring and other charges (b) |
| - | |
| 2 | |
| (78 | ) | |||
Post-employment benefit actuarial adjustment |
| - | |
| - | |
| (26 | ) | |||
Gain (loss) on equity investee transactions (Note 11) |
| 2 | |
| (12 | ) |
| (18 | ) | |||
Impairment of intangible assets (Note 13) |
| - | |
| (14 | ) |
| - | | |||
Total other items not allocated to segments |
| $ | 22 | |
| $ | (168 | ) |
| $ | (857 | ) |
Total reconciling items |
| $ | (44 | ) |
| $ | (106 | ) |
| $ | (900 | ) |
(a) | Consists of the net periodic benefit cost elements, other than service cost and amortization of prior service cost for active employees, associated with our defined pension, retiree health care and life insurance benefit plans. |
(b) | Included in Restructuring and other charges on the Consolidated Statements of Operations. See Note 24 to the Consolidated Financial Statements. |
(c) | Fairfield Flat-Rolled Operations includes the blast furnace and associated steelmaking operations, along with most of the flat-rolled finishing operations at Fairfield Works. The #5 coating line continues to operate. |
Net Sales by Product:
The following summarizes net sales by product:
(In millions) |
| 2017 |
| 2016 |
| 2015 | ||||||
Flat-Rolled |
| $ | 10,106 | |
| $ | 8,969 | |
| $ | 10,047 | |
Tubular |
| 987 | |
| 481 | |
| 929 | | |||
Other (a) |
| 1,157 | |
| 811 | |
| 598 | | |||
Total |
| $ | 12,250 | |
| $ | 10,261 | |
| $ | 11,574 | |
(a) | Primarily includes sales of steel production by-products, railroad services and real estate operations. |
Geographic Area:
The information below summarizes external sales, property, plant and equipment and equity method investments based on the location of the operating segment to which they relate.
(In millions) |
| Year |
| External |
| Assets |
| ||||
North America |
| 2017 |
| $ | 9,301 | |
| $ | 3,831 | | (a) |
|
| 2016 |
| 8,018 | |
| 3,671 | | (a) | ||
|
| 2015 |
| 9,251 | |
| 4,057 | | (a) | ||
Europe |
| 2017 |
| 2,949 | |
| 906 | |
| ||
|
| 2016 |
| 2,243 | |
| 789 | |
| ||
|
| 2015 |
| 2,323 | |
| 832 | |
| ||
Other Foreign Countries |
| 2017 |
| - | |
| - | |
| ||
|
| 2016 |
| - | |
| 18 | |
| ||
|
| 2015 |
| - | |
| 24 | |
| ||
Total |
| 2017 |
| 12,250 | |
| 4,737 | |
| ||
|
| 2016 |
| 10,261 | |
| 4,478 | |
| ||
|
| 2015 |
| $ | 11,574 | |
| $ | 4,913 | |
|
(a) | Assets with a book value of $3,817 million , $3,670 million and $4,047 million were located in the United States at December 31, 2017 , 2016 and 2015 , respectively. |
5. U. S. Steel Canada Inc. Retained Interest
F-21
Table of Contents
Subsequent to the CCAA filing, U. S. Steel's management continued to assess the recoverability of the Company's retained interest in USSC. During 2015, management's estimate of the recoverable retained interest was updated as a result of economic conditions impacting the steel industry in North America such as lower prices, elevated levels of imports, the strength of the U.S. dollar and depressed steel company valuations as well as the uncertainty of the ultimate outcome of USSC's CCAA filing. As a result, an additional pre-tax charge was recognized during the fourth quarter of 2015, bringing the total charge to $392 million for the fiscal year ended December 31, 2015. U. S. Steel's recoverability involved uncertainties from economic and other events, including developments related to the ongoing CCAA proceedings, including the appeal of the decision of the Court in the trial relating to the classification and amounts of our secured and unsecured USSC claims, which were beyond the control of U. S. Steel.
As part of the USSC CCAA restructuring process, U. S. Steel and USSC, entered into a mutually agreed upon, court approved, transition arrangement (the original transition plan) that provided for certain services to be provided by the Company to support USSC's continued operations as part of an orderly severance of the parties relationship. Additionally, the Court approved USSC's business preservation plan designed to conserve its liquidity.
The original transition plan required U. S. Steel to continue to provide certain shared services to USSC for up to 24 months from October 9, 2015 (the date of the original transition plan), and transitioned U. S. Steel away from providing any technical and engineering services associated with product development or sales with USSC immediately. In addition, U. S. Steel would no longer support any quality claims made against USSC. Further, unless mutually agreed to, U. S. Steel would no longer generate any sales orders on behalf of USSC and would fulfill its production orders with its U.S. based operating facilities.
Under the original transition plan, U. S. Steel provided USSC with funds for the purpose of making payments for pension contributions which were due under the pension plan funding agreement that Stelco, now USSC, had with the Superintendent of Financial Services of Ontario that covers USSC's four main pension plans (the Stelco Agreement) between September 1, 2015 and December 31, 2015. This funding requirement was satisfied as of December 31, 2015.
The write-down of the retained interest, Stelco funding charge and other related charges were the components of the Losses associated with U. S. Steel Canada, Inc. in the Consolidated Statement of Operations.
On June 30, 2017, U. S. Steel completed the restructuring and disposition of USSC through a sale and transfer of all of the issued and outstanding shares in USSC to an affiliate of Bedrock. In accordance with the Second Amended and Restated Plan of Compromise, Arrangement and Reorganization, approved by the Ontario Superior Court of Justice on June 9, 2017, U. S. Steel received approximately $127 million in satisfaction of its secured claims, including interest, which resulted in a gain of $72 million on the Company's retained interest in USSC. U. S. Steel also agreed to the discharge and cancellation of its unsecured claims for nominal consideration. The terms of the settlement included mutual releases among key stakeholders, including a release of all claims against the Company regarding environmental, pension and other liabilities, and transition services agreements that superseded all prior arrangements among the parties, including the 2015 transition arrangements. Pursuant to the terms of these new transition services agreements, U. S. Steel will continue to provide various transition services for up to 24 months from June 30, 2017.
6. Acquisition
On May 29, 2015, the Company purchased the 50 percent joint venture interest in Double Eagle Steel Coating Company (DESCO) that it did not previously own for $25 million . DESCO's electrolytic galvanizing line (EGL) has become part of the larger operational footprint of U. S. Steel's Great Lakes Works within the Flat-Rolled segment. The EGL is increasing our ability to provide industry leading advanced high strength steels, including GEN3 grades under development, as well as to provide high quality exposed steel for automotive body and closure applications. The Company's previously held 50 percent equity interest of $3 million was recorded at fair market value resulting in a net gain of approximately $3 million , which has been recognized in the earnings from investees line in the Consolidated Statements of Operations. Goodwill of approximately $3 million was recognized and is included as a component of other noncurrent assets in the Company's Consolidated Balance Sheet. The fair value of the DESCO acquisition was measured using both cost and market approaches, Level 2 inputs, in accordance with ASC No. 820, Fair Value Measurement. Transaction costs associated with the
F-22
Table of Contents
acquisition were immaterial. The amount of revenue recognized in the Consolidated Statements of Operations as a result of the acquisition was not significant to the year ended December 31, 2015.
7. Net Interest and Other Financial Costs
(In millions) |
| 2017 |
| 2016 |
| 2015 | ||||||
Interest income: |
|
|
|
|
|
| ||||||
Interest income |
| $ | (17 | ) |
| $ | (5 | ) |
| $ | (3 | ) |
Interest expense and other financial costs: |
|
|
|
|
|
| ||||||
Interest incurred |
| 229 | |
| 234 | |
| 228 | | |||
Less interest capitalized |
| 3 | |
| 4 | |
| 14 | | |||
Total interest expense |
| 226 | |
| 230 | |
| 214 | | |||
Loss on debt extinguishment (a) |
| 54 | |
| 22 | |
| 36 | | |||
Foreign currency net loss (gain) (b) |
| 23 | |
| (14 | ) |
| (15 | ) | |||
Financial costs on: |
|
|
|
|
|
| ||||||
Sale of receivables |
| - | |
| - | |
| 2 | | |||
Amended Credit Agreement |
| 6 | |
| 6 | |
| 4 | | |||
USSK credit facilities |
| 3 | |
| 3 | |
| 3 | | |||
Other |
| 2 | |
| - | |
| 5 | | |||
Amortization of discounts and deferred financing costs |
| 10 | |
| 9 | |
| 11 | | |||
Total other financial costs |
| 44 | |
| 4 | |
| 10 | | |||
Net interest and other financial costs |
| $ | 307 | |
| $ | 251 | |
| $ | 257 | |
(a) | Represents a net pretax charge of $54 million during 2017 related to the retirement of our 2018, 2021, and 2022 Senior Notes, partial redemption of our 2021 Senior Secured Notes, and redemption of the Lorain Recovery Zone Facility Bonds. A net pretax charge of $22 million during 2016 related to the retirement of our 2017 Senior Notes, and partial redemption of our 2018, 2020 and 2021 Senior Notes, and a $36 million pretax charge during 2015 related to the retirement of our 2019 Senior Convertible Notes. |
(b) | The functional currency for USSE is the euro. Foreign currency net loss (gain) is a result of transactions denominated in currencies other than the euro. |
8. Earnings and Dividends Per Common Share
Earnings (Loss) per Share Attributable to United States Steel Corporation Shareholders
Basic earnings (loss) per common share is based on the weighted average number of common shares outstanding during the period.
Diluted earnings (loss) per common share assumes the exercise of stock options, the vesting of restricted stock units and performance awards, provided in each case the effect is dilutive.
The computations for basic and diluted earnings (loss) per common share from continuing operations are as follows:
(Dollars in millions, except per share amounts) |
| 2017 |
| 2016 |
| 2015 | ||||||
Net earnings (loss) attributable to United States Steel Corporation shareholders |
| $ | 387 | |
| $ | (440 | ) |
| $ | (1,642 | ) |
Weighted-average shares outstanding (in thousands): |
|
|
|
|
|
| ||||||
Basic |
| 174,793 | |
| 156,673 | |
| 146,094 | | |||
Effect of stock options, restricted stock units and performance awards |
| 1,727 | |
| - | |
| - | | |||
Adjusted weighted-average shares outstanding, diluted |
| 176,520 | |
| 156,673 | |
| 146,094 | | |||
Basic earnings (loss) per common share |
| $ | 2.21 | |
| $ | (2.81 | ) |
| $ | (11.24 | ) |
Diluted earnings (loss) per common share |
| $ | 2.19 | |
| $ | (2.81 | ) |
| $ | (11.24 | ) |
The following table summarizes the securities that were antidilutive, and therefore, were not included in the computation of diluted earnings (loss) per common share:
(In thousands) |
| 2017 |
| 2016 |
| 2015 | ||||||
Securities granted under the 2005 Stock Incentive Plan |
| $ | 1,579 | |
| $ | 8,820 | |
| $ | 8,298 | |
Dividends Paid per Share
F-23
Table of Contents
Quarterly dividends on common stock were five cent s per share for each quarter in 2017 , 2016 and 2015 .
9. Inventories
(In millions) |
| December 31, 2017 |
| December 31, 2016 | ||||
Raw materials |
| $ | 527 | |
| $ | 449 | |
Semi-finished products |
| 796 | |
| 686 | | ||
Finished products |
| 356 | |
| 375 | | ||
Supplies and sundry items |
| 59 | |
| 63 | | ||
Total |
| $ | 1,738 | |
| $ | 1,573 | |
Current acquisition costs were estimated to exceed the above inventory values at December 31 by $802 million in 2017 and $489 million in 2016 . As a result of the liquidation of LIFO inventories, cost of sales increased and earnings (loss) before interest and income taxes decreased by $6 million and $77 million in 2017 and 2016 , respectively. As a result of the liquidation of LIFO inventories, cost of sales decreased and earnings (loss) before interest and income taxes increased by $9 million in 2015 .
Inventory includes $42 million and $54 million of land held for residential/commercial development as of December 31, 2017 and 2016 , respectively.
10. Income Taxes
(Benefit) Provision for income taxes
|
| 2017 |
| 2016 |
| 2015 | ||||||||||||||||||||||||||||||
(In millions) |
| Current |
| Deferred |
| Total |
| Current |
| Deferred |
| Total |
| Current |
| Deferred |
| Total | ||||||||||||||||||
Federal |
| $ | (66 | ) |
| $ | (81 | ) |
| $ | (147 | ) |
| $ | (18 | ) |
| $ | - | |
| $ | (18 | ) |
| $ | (29 | ) |
| $ | 168 | |
| $ | 139 | |
State and local |
| (1 | ) |
| - | |
| (1 | ) |
| 1 | |
| - | |
| 1 | |
| (5 | ) |
| 33 | |
| 28 | | |||||||||
Foreign |
| 53 | |
| 9 | |
| 62 | |
| 32 | |
| 9 | |
| 41 | |
| 4 | |
| 12 | |
| 16 | | |||||||||
Total |
| $ | (14 | ) |
| $ | (72 | ) |
| $ | (86 | ) |
| $ | 15 | |
| $ | 9 | |
| $ | 24 | |
| $ | (30 | ) |
| $ | 213 | |
| $ | 183 | |
A reconciliation of the federal statutory tax rate of 35 percent to total provision follows:
(In millions) |
| 2017 |
| 2016 |
| 2015 | ||||||
Statutory rate applied to earnings (loss) before income taxes |
| $ | 105 | |
| $ | (146 | ) |
| $ | (511 | ) |
Valuation allowance |
| 36 | |
| 252 | |
| 804 | | |||
Excess percentage depletion |
| (68 | ) |
| (49 | ) |
| (49 | ) | |||
State and local income taxes after federal income tax effects |
| (28 | ) |
| (20 | ) |
| (42 | ) | |||
Adjustments of prior years' federal income taxes |
| (5 | ) |
| (6 | ) |
| (23 | ) | |||
Tax credits |
| (56 | ) |
| (39 | ) |
| (7 | ) | |||
Effects of foreign operations |
| 56 | |
| 36 | |
| 5 | | |||
Effect of tax reform |
| (81 | ) |
| - | |
| - | | |||
Alternative minimum tax credit refund |
| (48 | ) |
| (18 | ) |
| - | | |||
Other |
| 3 | |
| 14 | |
| 6 | | |||
Total (benefit) provision |
| $ | (86 | ) |
| $ | 24 | |
| $ | 183 | |
The tax benefit differs from the domestic statutory rate of 35 percent as a result of the items listed above. In particular, it includes a benefit of $10 million related to the corporate rate reduction provided by the 2017 Act, as well as a benefit of $71 million related to the reversal of the valuation allowance recorded against the remaining balance of the Company's AMT credits, which became fully refundable pursuant to the 2017 Act. Also included in the 2017 tax benefit is a benefit of $48 million related to the Company's election to claim a refund of AMT credits pursuant to a provision in the Protecting Americans from Tax Hikes (PATH) Act.
F-24
Table of Contents
Included in the 2016 tax provision is a benefit of $18 million related to the Company's election to claim a refund of AMT credits pursuant to a provision in the PATH Act. The provision also reflects a write-off of certain deferred tax assets and liabilities related to branch operations pursuant to new regulations. However, the write-off does not impact the total provision because of the valuation allowance on the net domestic deferred tax asset.
Included in the 2015 tax provision is a tax benefit of $31 million relating to adjustments to tax reserves related to the conclusion of certain audits.
Unrecognized tax benefits
Unrecognized tax benefits are the differences between a tax position taken, or expected to be taken, in a tax return and the benefit recognized for accounting purposes pursuant to the guidance in ASC Topic 740 on income taxes. The total amount of unrecognized tax benefits was $42 million , $72 million and $74 million as of December 31, 2017 , 2016 and 2015 , respectively.
The total amount of unrecognized tax benefits that, if recognized, would affect the effective tax rate was $6 million as of December 31, 2017 and $9 million as of December 31, 2016 .
U. S. Steel records interest related to uncertain tax positions as a part of net interest and other financial costs in the Consolidated Statements of Operations. Any penalties are recognized as part of selling, general and administrative expenses. U. S. Steel had accrued liabilities of $6 million and $4 million for interest and penalties related to uncertain tax positions as of December 31, 2017 and 2016 , respectively.
A tabular reconciliation of unrecognized tax benefits follows:
(In millions) |
| 2017 |
| 2016 |
| 2015 | ||||||
Unrecognized tax benefits, beginning of year |
| $ | 72 | |
| $ | 74 | |
| $ | 112 | |
Increases – tax positions taken in prior years |
| 1 | |
| - | |
| - | | |||
Decreases – tax positions taken in prior years |
| (26 | ) |
| (4 | ) |
| (5 | ) | |||
Increases – current tax positions |
| - | |
| 3 | |
| - | | |||
Settlements |
| (4 | ) |
| - | |
| (26 | ) | |||
Lapse of statute of limitations |
| (1 | ) |
| (1 | ) |
| (7 | ) | |||
Unrecognized tax benefits, end of year |
| $ | 42 | |
| $ | 72 | |
| $ | 74 | |
Tax years subject to examination
Below is a summary of the tax years open to examination by major tax jurisdiction:
U.S. Federal – 2011 and forward*
U.S. States – 2009 and forward
Slovakia – 2007 and forward
*U. S. Steel's 2011 federal tax year remains open to the extent of net operating losses carried back from 2013.
Status of Internal Revenue Service (IRS) examinations
The IRS audit of U. S. Steel's 2012 and 2013 tax returns began in 2015 and is ongoing. The IRS and the Company have agreed to a number of adjustments, but two issues remain unagreed and the parties are using the Appeals process in an attempt to resolve their differences. To the extent that some issues have been agreed to, the effect of those items are now reflected in the Company's tax accounts. The IRS completed its audit of U. S. Steel's 2010 and 2011 tax returns in 2014, and the audit report was agreed to by the Company, and was approved by the Congressional Joint Committee on Taxation in the first quarter of 2015.
Taxes on foreign earnings
Pretax earnings for 2017 include domestic earnings of $75 million and earnings attributable to foreign sources of $226 million . Pretax loss and earnings for 2016 and 2015 include domestic losses of $588 million and $1,193 million , respectively, and earnings attributable to foreign sources of $172 million and a loss attributable to foreign sources of $266 million , respectively. At the end of both 2017 and 2016 , U. S. Steel does not have any undistributed foreign earnings and profits for which U.S. deferred taxes have not been provided.
F-25
Table of Contents
Deferred taxes
Deferred tax assets and liabilities resulted from the following:
|
| December 31, | ||||||
(In millions) |
| 2017 |
| 2016 | ||||
Deferred tax assets: |
|
|
|
| ||||
Federal tax loss carryforwards (expiring in 2033 through 2036) |
| $ | 394 | |
| $ | 754 | |
Federal capital loss carryforwards (expiring 2021) |
| 36 | |
| - | | ||
State tax credit carryforwards (expiring in 2018 through 2031) |
| 14 | |
| 15 | | ||
State tax loss carryforwards (expiring in 2018 through 2037) |
| 155 | |
| 110 | | ||
Minimum tax credit carryforwards |
| 76 | |
| 109 | | ||
General business credit carryforwards (expiring in 2025 through 2037) |
| 86 | |
| 85 | | ||
Foreign tax loss and credit carryforwards (expiring in 2024 through 2027) |
| 102 | |
| 51 | | ||
Employee benefits |
| 266 | |
| 633 | | ||
Receivables, payables and debt |
| - | |
| 5 | | ||
Future reduction of foreign tax credits |
| 1 | |
| 1 | | ||
Contingencies and accrued liabilities |
| 70 | |
| 97 | | ||
Investments in subsidiaries and equity investees |
| 33 | |
| 211 | | ||
Valuation allowance |
| (608 | ) |
| (1,113 | ) | ||
Total deferred tax assets |
| 625 | |
| 958 | | ||
Deferred tax liabilities: |
|
|
|
| ||||
Property, plant and equipment |
| 516 | |
| 899 | | ||
Inventory |
| 6 | |
| 23 | | ||
Receivables, payables and debt |
| 14 | |
| - | | ||
Expected federal benefit for deducting state deferred income taxes |
| 14 | |
| 9 | | ||
Indefinite-lived intangible assets |
| 18 | |
| 28 | | ||
Other temporary differences |
| 7 | |
| 21 | | ||
Total deferred tax liabilities |
| 575 | |
| 980 | | ||
Net deferred tax asset (liability) |
| $ | 50 | |
| $ | (22 | ) |
U. S. Steel recognizes deferred tax assets and liabilities for the estimated future tax consequences attributable to differences between the financial statement carrying amounts of existing assets and liabilities and their respective tax basis. The realization of deferred tax assets is assessed quarterly based on several interrelated factors. These factors include U. S. Steel's expectation to generate sufficient future taxable income and the projected time period over which these deferred tax assets will be realized.
At December 31, 2017, the net domestic deferred tax asset was $53 million , net of an established valuation allowance of $604 million . At December 31, 2016, the net domestic deferred tax liability was $28 million , net of an established valuation allowance of $1,109 million .
At December 31, 2017 , the net foreign deferred tax liability was $3 million , net of an established valuation allowance of $4 million . At December 31, 2016, the net foreign deferred tax asset was $6 million , net of an established valuation allowance of $4 million . The net foreign deferred tax asset will fluctuate as the value of the U.S. dollar changes with respect to the euro.
U. S. Steel will continue to monitor the realizability of its deferred tax assets on a quarterly basis taking into consideration, among other items, the uncertainty regarding the Company's continued ability to generate domestic income in the near term. In the future, if we determine that realization is more likely than not for deferred tax assets with a valuation allowance, the related valuation allowance will be reduced, and we will record a non-cash benefit to earnings.
F-26
Table of Contents
11. Investments and Long-Term Receivables
|
| December 31, | ||||||
(In millions) |
| 2017 |
| 2016 | ||||
Equity method investments |
| $ | 457 | |
| $ | 499 | |
Receivables due after one year, less allowance of $11 and $10 |
| 20 | |
| 25 | | ||
Other |
| 3 | |
| 4 | | ||
Total |
| $ | 480 | |
| $ | 528 | |
Summarized financial information of all investees accounted for by the equity method of accounting is as follows (amounts represent 100% of investee financial information):
(In millions) |
| 2017 |
| 2016 |
| 2015 | ||||||
Income data – year ended December 31: (a) |
|
|
|
|
|
| ||||||
Net Sales |
| $ | 2,485 | |
| $ | 2,839 | |
| $ | 3,176 | |
Operating income |
| 132 | |
| 345 | |
| 529 | | |||
Net earnings |
| 109 | |
| 323 | |
| 491 | | |||
Balance sheet date – December 31: |
|
|
|
|
|
| ||||||
Current Assets |
| $ | 633 | |
| $ | 771 | |
| $ | 732 | |
Noncurrent Assets |
| 710 | |
| 989 | |
| 988 | | |||
Current liabilities |
| 441 | |
| 478 | |
| 485 | | |||
Noncurrent Liabilities |
| 335 | |
| 506 | |
| 490 | | |||
(a) | Former equity affiliates, Swan Point Development Company, Inc., Tilden Mining Company and Apolo Tubulars S.A. were sold on February 6, 2017, September 29, 2017 and December 22, 2017, respectively. The former equity affiliates are included in the Income data through the month prior to the date of sale. |
U. S. Steel's portion of the equity in net earnings for its equity investments as reported in the income from investees line on the Consolidated Statements of Operations was $44 million , $98 million and $38 million for the years ended December 31, 2017 , 2016 and 2015 , respectively.
Investees accounted for using the equity method include:
Investee | Country | December 31, 2017 Interest | |
Acero Prime, S. R. L. de CV | Mexico | 40 | % |
Chrome Deposit Corporation | United States | 50 | % |
Daniel Ross Bridge, LLC | United States | 50 | % |
Double G Coatings Company L.P. | United States | 50 | % |
Feralloy Processing Company | United States | 49 | % |
Hibbing Development Company | United States | 24.1 | % |
Hibbing Taconite Company (a) | United States | 14.7 | % |
Leeds Retail Center, LLC | United States | 33.3 | % |
Patriot Premium Threading Services | United States | 50 | % |
PRO-TEC Coating Company | United States | 50 | % |
Strategic Investment Fund Partners II (b) | United States | 5.2 | % |
USS-POSCO Industries | United States | 50 | % |
Worthington Specialty Processing | United States | 49 | % |
(a) | Hibbing Taconite Company (HTC) is an unincorporated joint venture that is owned, in part, by Hibbing Development Company (HDC), |
which is accounted for using the equity method. Through HDC we are able to influence the activities of HTC, and as such, its activities are accounted for using the equity method.
(b) | Strategic Investment Fund Partners II is a limited partnership and in accordance with ASC Topic 323, the financial activities are accounted for using the equity method. |
Dividends and partnership distributions received from equity investees were $12 million in 2017 , $9 million in 2016 and $10 million in 2015 .
U. S. Steel evaluates impairment of its equity method investments whenever circumstances indicate that a decline in value below carrying value is other than temporary. Under these circumstances, we would adjust the investment down to its estimated fair value, which then becomes its new carrying value.
F-27
Table of Contents
During the fourth quarter of 2016, the Company completed a review of its equity method investments and determined there was an other than temporary impairment of an equity investee within our Tubular segment. Accordingly, U. S. Steel recorded an impairment charge of $12 million , which reduced the carrying value of the investment to $18 million , at December 31, 2016. The equity investment was sold in 2017.
During the fourth quarter of 2015, U. S. Steel completed a review of its equity method investments and determined there was an other than temporary impairment of an equity investee within a non-core operating segment of U. S. Steel. The other than temporary impairment resulted from a decision to cease the funding of the long-term development plans of the equity investment, due to our intent to sell the particular investment, thereby inhibiting sufficient recovery of the market value. Accordingly, U. S. Steel recorded an impairment charge of $18 million , which reduced the carrying amount of the equity investment to $3 million , in the fourth quarter of 2015. The equity investment was sold in 2017.
We supply substrate to certain of our equity method investees and from time to time will extend the payment terms for their trade receivables. For discussion of transactions and related receivable and payable balances between U. S. Steel and its investees, see Note 22.
12. Property, Plant and Equipment
|
|
|
| December 31, | |||||||
(In millions) |
| Useful Lives |
| 2017 |
| 2016 | |||||
Land and depletable property |
| - | |
| $ | 208 | |
| $ | 204 | |
Buildings |
| 35 years | |
| 1,109 | |
| 1,051 | | ||
Machinery and equipment |
|
|
|
|
|
| |||||
Steel producing |
| 3-30 years | |
| 12,590 | |
| 11,773 | | ||
Transportation |
| 3-40 years | |
| 239 | |
| 234 | | ||
Other |
| 5-30 years | |
| 122 | |
| 121 | | ||
Information technology |
| 5-6 years | |
| 782 | |
| 777 | | ||
Assets under capital lease |
| 5-15 years | |
| 36 | |
| 36 | | ||
Total |
|
|
| 15,086 | |
| 14,196 | | |||
Less accumulated depreciation and depletion |
|
|
| 10,806 | |
| 10,217 | | |||
Net |
|
|
| $ | 4,280 | |
| $ | 3,979 | | |
Amounts in accumulated depreciation and depletion for assets acquired under capital leases (including sale-leasebacks accounted for as financings) were $18 million and $16 million at December 31, 2017 and 2016 , respectively.
13. Intangible Assets
Intangible assets are being amortized on a straight-line basis over their estimated useful lives and are detailed below:
|
|
|
| As of December 31, 2017 |
| As of December 31, 2016 | ||||||||||||||||||||
(In millions) |
| Useful |
| Gross |
| Accumulated |
| Net |
| Gross |
| Accumulated |
| Net | ||||||||||||
Customer relationships |
| 22 Years |
| $ | 132 | |
| $ | 64 | |
| $ | 68 | |
| $ | 132 | |
| $ | 59 | |
| $ | 73 | |
Patents |
| 10-15 Years |
| 22 | |
| 5 | |
| 17 | |
| 22 | |
| 3 | |
| 19 | | ||||||
Other |
| 4-20 Years |
| 15 | |
| 8 | |
| 7 | |
| 14 | |
| 6 | |
| 8 | | ||||||
Total amortizable intangible assets |
|
|
| $ | 169 | |
| $ | 77 | |
| $ | 92 | |
| $ | 168 | |
| $ | 68 | |
| $ | 100 | |
The carrying amount of acquired water rights with indefinite lives as of December 31, 2017 and December 31, 2016 totaled $75 million . The acquired water rights are tested for impairment annually in the third quarter, or whenever events or circumstances indicate the carrying value may not be recoverable. U. S. Steel performed a quantitative impairment evaluation of its acquired water rights during the third quarter of 2017. Based on the results of the evaluation, the water rights were not impaired.
F-28
Table of Contents
The research and development activities of the Company's acquired indefinite lived in-process research and development patents was completed during the fourth quarter of 2016 and the carrying amount of the patents is being amortized over the useful lives of the patents (approximately 10 years). As a result of the quantitative impairment evaluation of its in-process research and development patents during 2016, an impairment charge of approximately $14 million was recorded during 2016. Key assumptions used in the discounted cash flow analysis for the evaluation of the patents consisted of a combination of Level 2 and Level 3 inputs, which included future cash flow projections, a royalty rate of 5% and a discount rate of 17% .
Identifiable intangible assets with finite lives are reviewed for impairment whenever events or circumstances indicate that the carrying value may not be recoverable. During the fourth quarter of 2016 , U. S. Steel completed a review of certain of its identifiable intangible assets with finite lives, primarily customer relationships with a carrying value of $73 million as of December 31, 2016, and determined that the assets were not impaired. There were no triggering events in 2017 that required a review for impairment.
Amortization expense was $9 million for the year ended December 31, 2017 and $8 million for the year ended December 31, 2016 . The estimated future amortization expense of identifiable intangible assets is $8 million in each year from 2018 to 2022.
14. Stock-Based Compensation Plans
U. S. Steel has outstanding stock-based compensation awards that were granted by the Compensation & Organization Committee of the Board of Directors (the Committee) under the 2005 Stock Incentive Plan (the 2005 Plan) and the 2016 Omnibus Incentive Compensation Plan (the Omnibus Plan) (collectively the Plans). On April 26, 2016, the Company's stockholders approved the Omnibus Plan and authorized the Company to issue up to 7,200,000 shares of U. S. Steel common stock under the Omnibus Plan. The Company's stockholders authorized the issuance of an additional 6,300,000 shares under the Omnibus Plan on April 25, 2017. While the awards that were previously granted under the 2005 Plan remain outstanding, all future awards will be granted under the Omnibus Plan. As of December 31, 2017 , there were 12,579,984 shares available for future grants under the Omnibus Plan. Generally, a share issued under the Omnibus Plan pursuant to an award other than a stock option will reduce the number of shares available under the Stock Plan by 1.73 shares. Also, shares related to awards under either plan (i) that are forfeited, (ii) that terminate without shares having been issued or (iii) for which payment is made in cash or property other than shares, are again available for awards under the Omnibus Plan; provided, however, that shares delivered to U. S. Steel or withheld for purposes of satisfying the exercise price or tax withholding obligations shall not be available for future awards. The purpose of the Plans is to attract, retain and motivate employees and non-employee directors of outstanding ability, and to align their interests with those of the stockholders of U. S. Steel. The Committee administers the plan pursuant to which they may make grants of stock options, restricted stock, restricted stock units (RSUs), performance awards, and other stock-based awards.
F-29
Table of Contents
The following table summarizes the total stock-based compensation awards granted during the years 2017 , 2016 and 2015 :
|
| Stock Options |
| Restricted Stock Units |
| TSR Performance Awards | |||
2017 Grants |
| 647,780 | |
| 348,040 | |
| 169,850 | |
2016 Grants |
| 1,333,210 | |
| 1,120,332 | |
| 308,130 | |
2015 Grants |
| 1,638,540 | |
| 807,432 | |
| 273,560 | |
Stock-based compensation expense
The following table summarizes the total compensation expense recognized for stock-based compensation awards:
(In millions, except per share amounts) |
| Year Ended December 31, 2017 |
| Year Ended December 31, 2016 |
| Year Ended December 31, 2015 | ||||||
Stock-based compensation expense recognized: |
|
|
|
|
|
| ||||||
Cost of sales |
| $ | 10 | |
| $ | 9 | |
| $ | 14 | |
Selling, general and administrative expenses |
| 17 | |
| 13 | |
| 23 | | |||
Total |
| 27 | |
| 22 | |
| 37 | | |||
Related deferred income tax benefit (a) |
| - | |
| - | |
| 13 | | |||
Decrease in net income |
| $ | 27 | |
| $ | 22 | |
| $ | 24 | |
Decrease in basic earnings per share |
| 0.15 | |
| 0.14 | |
| 0.16 | | |||
Decrease in diluted earnings per share |
| 0.15 | |
| 0.14 | |
| 0.16 | | |||
(a) Amounts for 2017 and 2016 do not reflect a tax benefit as a result of a full valuation allowance on our domestic deferred tax assets.
As of December 31, 2017 , total future compensation cost related to nonvested stock-based compensation arrangements was $15 million , and the average period over which this cost is expected to be recognized is approximately 10 months .
Stock options
Compensation expense for stock options is recorded over the vesting period based on the fair value on the date of grant, as calculated by U. S. Steel using the Black-Scholes model and the assumptions listed below. The 2017 , 2016 and 2015 awards generally vest ratably over a three -year service period and have a term of ten years . Stock options are generally issued at the market price of the underlying stock on the date of the grant. Upon exercise of stock options, shares of U. S. Steel stock are issued from treasury stock.
Black-Scholes Assumptions (a) |
| 2017 Grants |
| 2016 Grants |
| 2015 Grants | ||||||
Grant date price per share of option award |
| $ | 36.94 | |
| $ | 14.78 | |
| $ | 24.74 | |
Exercise price per share of option award |
| $ | 36.94 | |
| $ | 14.78 | |
| $ | 24.74 | |
Expected annual dividends per share |
| $ | 0.20 | |
| $ | 0.20 | |
| $ | 0.20 | |
Expected life in years |
| 5.0 | |
| 5.0 | |
| 5.0 | | |||
Expected volatility |
| 57 | % |
| 53 | % |
| 47 | % | |||
Risk-free interest rate |
| 2.0 | % |
| 1.5 | % |
| 1.6 | % | |||
Average grant date fair value per share of unvested option awards as calculated from above |
| $ | 17.28 | |
| $ | 6.24 | |
| $ | 10.02 | |
(a) The assumptions represent a weighted-average for all grants during the year.
The expected annual dividends per share are based on the latest annualized dividend rate at the date of grant; the expected life in years is determined primarily from historical stock option exercise data; the expected volatility is based on the historical volatility of U. S. Steel stock; and the risk-free interest rate is based on the U.S. Treasury strip rate for the expected life of the option.
F-30
Table of Contents
The following table shows a summary of the status and activity of stock options for the year ended December 31, 2017 :
|
| Shares |
| Weighted- |
| Weighted- |
| Aggregate | |||||
Outstanding at January 1, 2017 |
| 5,693,211 | |
| $ | 29.94 | |
|
|
|
| ||
Granted |
| 647,780 | |
| $ | 36.94 | |
|
|
|
| ||
Exercised |
| (879,942 | ) |
| $ | 23.07 | |
|
|
|
| ||
Forfeited or expired |
| (848,109 | ) |
| $ | 48.00 | |
|
|
|
| ||
Outstanding at December 31, 2017 |
| 4,612,940 | |
| $ | 28.92 | |
| 5.25 |
| $ | 48 | |
Exercisable at December 31, 2017 |
| 3,177,505 | |
| $ | 30.86 | |
| 3.97 |
| $ | 31 | |
Exercisable and expected to vest at December 31, 2017 |
| 4,369,238 | |
| $ | 29.12 | |
| 5.09 |
| $ | 45 | |
The aggregate intrinsic value in the table above represents the total pretax intrinsic value (difference between our closing stock price on the last trading day of 2017 and the exercise price, multiplied by the number of in-the-money options). Intrinsic value changes are a function of the fair market value of our stock.
The total intrinsic value of stock options exercised (i.e., the difference between the market price at exercise and the price paid by the employee to exercise the option) was $11 million during the year ended December 31, 2017 , $13 million during the year ended December 31, 2016 and immaterial during the year ended December 31, 2015 . The total amount of cash received by U. S. Steel from the exercise of options during the year ended December 31, 2017 and December 31, 2016 , was $20 million and $35 million , respectively, and the related net tax benefit realized from the exercise of these options was immaterial.
Stock awards
Compensation expense for nonvested stock awards is recorded over the vesting period based on the fair value at the date of grant.
RSUs awarded as part of annual grants generally vest ratably over 3 years . Their fair value is the market price of the underlying common stock on the date of grant. RSUs granted in connection with new-hire or retentions grants cliff vest three years from the date of the grant.
Total shareholder return (TSR) performance awards may vest at the end of a three -year performance period if U. S. Steel's total shareholder return compared to the total shareholder return of a peer group of companies over the three -year performance period meets the performance criteria. Performance awards can vest at between zero and 200 percent of the target award. The fair value of the performance awards is calculated using a Monte-Carlo simulation.
Beginning in 2014 the Committee added return on capital employed (ROCE) as a second performance measure for the performance awards as permitted under the terms of the Plans. ROCE awards granted will be measured on a weighted average basis of the Company's consolidated worldwide earnings (loss) before interest and income taxes, as adjusted, divided by consolidated worldwide capital employed, as adjusted, over a three year period.
Weighted average ROCE is calculated based on the ROCE achieved in the first, second and third years of the performance period, weighted at 20 percent , 30 percent and 50 percent , respectively. The ROCE awards will payout 50 percent at the threshold level, 100 percent at the target level and 200 percent at the maximum level. Amounts in between the threshold percentages will be interpolated.
Compensation expense associated with the ROCE awards will be contingent based upon the achievement of the specified ROCE performance goals and will be adjusted on a quarterly basis to reflect the probability of achieving the ROCE metric.
ROCE performance awards may vest at the end of a three -year performance period contingent upon meeting ROCE performance goals approved by the Committee. The fair value of the ROCE performance awards is the average market price of the underlying common stock on the date of grant. Beginning in 2015, ROCE awards were granted and can be paid in cash if the ROCE performance goals are achieved.
F-31
Table of Contents
The following table shows a summary of the performance awards outstanding as of December 31, 2017 , and their fair market value on the respective grant date:
Performance Period |
| Fair Value |
| Minimum |
| Target |
| Maximum | |||||
2017 - 2019 |
| $ | 4 | |
| - | |
| 106,440 | |
| 212,880 | |
2016 - 2018 |
| $ | 2 | |
| - | |
| 206,401 | |
| 412,802 | |
2015 - 2017 |
| $ | 5 | |
| - | |
| 202,690 | |
| 405,380 | |
The following table shows a summary of the status and activity of nonvested stock awards for the year ended December 31, 2017 :
|
| Restricted |
| TSR Performance |
| ROCE Performance |
| Total |
| Weighted- | ||||||
Nonvested at January 1, 2017 |
| 1,593,155 | |
| 751,579 | |
| 205,453 | |
| 2,550,187 | |
| $ | 18.58 | |
Granted |
| 348,040 | |
| 169,850 | |
| - | |
| 517,890 | |
| 37.68 | | |
Vested |
| (533,371 | ) |
| - | |
| - | |
| (533,371 | ) |
| 21.15 | | |
Performance adjustment factor (b) |
| - | |
| (220,943 | ) |
| (205,453 | ) |
| (426,396 | ) |
| 22.91 | | |
Forfeited or expired |
| (219,078 | ) |
| (184,955 | ) |
| - | |
| (404,033 | ) |
| 24.59 | | |
Nonvested at December 31, 2017 |
| 1,188,746 | |
| 515,531 | |
| - | |
| 1,704,277 | |
| $ | 21.08 | |
(a) The number of shares shown for the performance awards is based on the target number of share awards.
(b) Consists of adjustments to vested performance awards to reflect actual performance. The adjustments were required since the original grants of the awards were at 100 percent of the targeted amounts.
The following table presents information on RSUs and performance awards granted:
|
| 2017 |
| 2016 |
| 2015 | ||||||
Number of awards granted |
| 517,890 | |
| 1,428,462 | |
| 1,080,992 | | |||
Weighted-average grant-date fair value per share |
| $ | 37.68 | |
| $ | 13.39 | |
| $ | 24.63 | |
During the years ended December 31, 2017 , 2016 , and 2015 , the total fair value of shares vested was $11 million , $17 million , and $14 million , respectively.
15. Derivative Instruments
U. S. Steel is exposed to foreign currency exchange rate risks as a result of our European operations. USSE's revenues are primarily in euros, and costs are primarily in U.S. dollars and euros. In addition, cash requirements may be funded by intercompany loans, creating intercompany monetary assets and liabilities in currencies other than the functional currency of the entities involved, and affect income when remeasured at the end of each period.
U. S. Steel uses euro forward sales contracts with maturities no longer than 12 months to exchange euros for U.S. dollars to manage our currency requirements and exposure to foreign currency exchange rate fluctuations. Derivative instruments are required to be recognized at fair value in the Consolidated Balance Sheet. U. S. Steel has not elected to designate these euro forward sales contracts as hedges. Therefore, changes in their fair value are recognized immediately in the Consolidated Statements of Operations.
As of December 31, 2017 , U. S. Steel held euro forward sales contracts with a total notional value of approximately $273 million . We mitigate the risk of concentration of counterparty credit risk by purchasing our forward sales contracts from several counterparties.
Additionally, U. S. Steel uses fixed-price forward physical purchase contracts to partially manage our exposure to price risk related to the purchases of natural gas and certain nonferrous metals used in the production process. During 2017 , 2016 and 2015 , the forward physical purchase contracts for natural gas and nonferrous metals
F-32
Table of Contents
qualified for the normal purchases and normal sales exemption described in ASC Topic 815 and were not subject to mark-to-market accounting.
The following summarizes the financial statement location and amounts of the fair values related to derivatives included in U. S. Steel's consolidated financial statements as of December 31, 2017 and 2016 :
|
|
|
| Fair Value | ||||||
(In millions) |
| Balance Sheet |
| December 31, 2017 |
| December 31, 2016 | ||||
Foreign exchange forward contracts |
| Accounts receivable |
| $ | - | |
| $ | 9 | |
Foreign exchange forward contracts |
| Accounts payable |
| $ | 11 | |
| $ | - | |
The following summarizes the financial statement location and amounts of the gains and losses related to derivatives included in U. S. Steel's consolidated financial statements for the years ended December 31, 2017 , 2016 and 2015 :
|
|
|
| Amount of (Loss) Gain | ||||||||||
(In millions) |
| Statement of Operations |
| Year Ended December 31, 2017 |
| Year Ended December 31, 2016 |
| Year Ended December 31, 2015 | ||||||
Foreign exchange forward contracts |
| Other financial costs |
| $ | (23 | ) |
| $ | 7 | |
| $ | 39 | |
In accordance with the guidance in ASC Topic 820 on fair value measurements and disclosures, the fair value of our euro forward sales contracts was determined using Level 2 inputs, which are defined as "significant other observable" inputs. The inputs used are from market sources that aggregate data based upon market transactions.
16. Debt
|
|
|
|
|
| December 31, | ||||||
(In millions) |
| Interest |
| Maturity |
| 2017 |
| 2016 | ||||
2037 Senior Notes |
| 6.65 |
| 2037 |
| $ | 350 | |
| $ | 350 | |
2025 Senior Notes |
| 6.875 |
| 2025 |
| 750 | |
| - | | ||
2022 Senior Notes |
| 7.50 |
| 2022 |
| - | |
| 400 | | ||
2021 Senior Secured Notes |
| 8.375 |
| 2021 |
| 780 | |
| 980 | | ||
2021 Senior Notes |
| 6.875 |
| 2021 |
| - | |
| 200 | | ||
2020 Senior Notes |
| 7.375 |
| 2020 |
| 432 | |
| 432 | | ||
2018 Senior Notes |
| 7.00 |
| 2018 |
| - | |
| 161 | | ||
Environmental Revenue Bonds |
| 5.750 - 6.875 |
| 2019 - 2042 |
| 400 | |
| 447 | | ||
Recovery Zone Facility Bonds |
| 6.75 |
| 2040 |
| - | |
| 70 | | ||
Fairfield Caster Lease |
|
|
| 2022 |
| 24 | |
| 28 | | ||
Other capital leases and all other obligations |
|
|
| 2019 |
| 1 | |
| 1 | | ||
Third Amended and Restated Credit Agreement |
| Variable |
| 2020 |
| - | |
| - | | ||
USSK Revolver |
| Variable |
| 2021 |
| - | |
| - | | ||
USSK credit facilities |
| Variable |
| 2018 |
| - | |
| - | | ||
Total debt |
|
|
|
|
| 2,737 | |
| 3,069 | | ||
Less unamortized discount and debt issuance costs |
|
|
|
|
| 34 | |
| 38 | | ||
Less short-term debt and long-term debt due within one year |
|
|
|
|
| 3 | |
| 50 | | ||
Long-term debt |
|
|
|
|
| $ | 2,700 | |
| $ | 2,981 | |
Issuance of Senior Notes due 2025
In August 2017, U. S. Steel issued $750 million of 6.875% Senior Notes due August 15, 2025 (2025 Senior Notes). U. S. Steel received net proceeds from the offering of approximately $737 million after fees of approximately $13 million related to the underwriting and third party expenses. The net proceeds from the issuance of the 2025
F-33
Table of Contents
Senior Notes, together with cash on hand, were used to redeem portions of our outstanding senior notes as discussed below.
The 2025 Senior Notes are senior and unsecured obligations that rank equally in right of payment with all of our other existing and future senior notes. U. S. Steel will pay interest on the notes semi-annually in arrears on February 15 th and August 15 th of each year, commencing on February 15, 2018.
Similar to our other senior notes, the indenture governing the 2025 Senior Notes restricts our ability to create certain liens, to enter into sale leaseback transactions and to consolidate, merge, transfer or sell all, or substantially all of our assets. It also contains provisions requiring the purchase of the 2025 Senior Notes upon a change of control under certain specified circumstances, as well as other customary provisions.
U. S. Steel may redeem the 2025 Senior Notes, in whole or in part, at our option at any time, or from time to time, on or after August 15, 2020 at the redemption price for such notes set forth below as a percentage of the principal amount, plus accrued and unpaid interest, if any, to, but excluding the redemption date, if redeemed during the twelve-month period beginning August 15 of the years indicated below:
Year | Redemption Price | |
2020 | 103.438 | % |
2021 | 101.719 | % |
2022 and thereafter | 100.000 | % |
At any time prior to August 15, 2020, U. S. Steel may also redeem the 2025 Senior Notes, at our option, in whole or in part, or from time to time, at a price equal to the greater of 100 percent of the principal amount of the 2025 Senior Notes to be redeemed, or the sum of the present value of the redemption price of the 2025 Senior Notes if they were redeemed on August 15, 2020 plus interest payments due through August 15, 2020 discounted to the date of redemption at the applicable treasury yield, plus 50 basis points and accrued and unpaid interest, if any.
At any time prior to August 15, 2020 we may also purchase up to 35% of the original aggregate principal amount of the 2025 Senior Notes at 106.875% , plus accrued and unpaid interest, if any, up to, but excluding the applicable date of redemption, with proceeds from equity offerings.
Senior Note Redemption
In September 2017, U. S. Steel redeemed $161 million of 7.00% Senior Notes due 2018, $200 million of 6.875% Senior Notes due 2021, and $400 million of 7.50% Senior Notes due 2022 in accordance with the redemption provisions under the indentures governing these notes. The aggregate redemption cost of approximately $808 million included $761 million for the remaining principal balances, $21 million in accrued and unpaid interest and $26 million in redemption premiums, of which approximately $4 million was a make-whole premium.
In December 2017, U. S. Steel redeemed $200 million of 8.375% Senior Secured Notes due 2021.The aggregate redemption cost of approximately $227 million included $200 million for the present value of the remaining principal balances, $8 million in accrued and unpaid interest and $19 million in redemption premiums, of which all was considered a make-whole premium.
Redemption of Recovery Zone Facility Bonds
On March 10, 2017, U. S. Steel announced the permanent shutdown of the No. 6 Quench & Temper Mill at Lorain Tubular Operations in Lorain, Ohio. Under the terms of the Trust Indenture dated as of December 1, 2010, between the Lorain County Port Authority and The Bank of New York Mellon Trust Company, N.A., as Trustee (the Indenture), this action and our decision to relocate the Lorain No. 6 Quench & Temper equipment triggered an Extraordinary Mandatory Redemption of the Lorain County Port Authority Recovery Zone Facility Revenue Bonds (the Recovery Zone Bonds) and accordingly required U. S. Steel to redeem the Recovery Zone Bonds and repay in full the principal amount plus accrued interest. In accordance with the terms of the Indenture, U. S. Steel paid in full all amounts due under the Indenture, comprised of $70 million principal and accrued interest of approximately $2 million , on April 27, 2017.
Third Amended and Restated Credit Agreement
F-34
Table of Contents
On July 27, 2015, the Company entered into a five -year revolving credit facility (Third Amended and Restated Credit Agreement) replacing the Company's former $875 million facility agreement, and concurrently terminated the Receivables Purchase Agreement. The Third Amended and Restated Credit Agreement increased the amount of the facility to $1.5 billion . As of both December 31, 2017 and 2016 , there were no amounts drawn on the Third Amended and Restated Credit Agreement. U. S. Steel must maintain a fixed charge coverage ratio of at least 1.00 to 1.00 for the most recent four consecutive quarters when availability under the Third Amended and Restated Credit Agreement is less than the greater of 10% of the total aggregate commitments or $150 million . Based on the four quarters as of December 31, 2017 , we have met this covenant. If we are unable to meet this covenant in future periods, the amount available to the Company under this facility would be reduced by $150 million .
The Third Amended and Restated Credit Agreement provides for borrowings at interest rates based on defined, short-term market rates plus a spread based on availability and includes other customary terms and conditions including restrictions on our ability to create certain liens and to consolidate, merge or transfer all, or substantially all, of our assets. The Third Amended and Restated Credit Agreement expires in July 2020. Maturity may be accelerated 91 days prior to the stated maturity of any outstanding senior debt if excess cash and credit facility availability do not meet the liquidity conditions set forth in the Third Amended and Restated Credit Agreement. Borrowings are secured by liens on certain domestic inventory and trade accounts receivable.
The Third Amended and Restated Credit Agreement permits incurrence of additional secured debt up to 15% of Consolidated Net Tangible Assets.
U. S. Steel Košice ( USSK) credit facilities
At both December 31, 2017 and 2016 , USSK had no borrowings under its €200 million (approximately $240 million and $210 million , respectively) unsecured revolving credit facility (the USSK Credit Agreement). The USSK Credit Agreement contains certain USSK financial covenants, including maximum Leverage, maximum Net Debt to Tangible Net Worth, and minimum Interest Coverage ratios as defined in the USSK Credit agreement. The covenants are measured semi-annually for the period covering the last twelve calendar months. USSK may not draw on the USSK Credit Agreement if it does not comply with any of the financial covenants until the next measurement date. At both December 31, 2017 and 2016 , USSK had full availability under the USSK Credit Agreement. Currently, the USSK Credit Agreement expires in July 2020. The USSK Credit Agreement permits one additional one -year extension to the final maturity date at the mutual consent of USSK and its lenders. On January 22, 2018 USSK's lenders confirmed the second maturity extension request to July 2021 under the USSK Credit Agreement.
At December 31, 2017 , USSK had no borrowings under its €40 million and €10 million unsecured credit facilities (collectively approximately $60 million ) and the availability was approximately $57 million due to approximately $3 million of customs and other guarantees outstanding. At December 31, 2016 , USSK had no borrowings under its €40 million and €10 million unsecured credit facilities (collectively approximately $53 million ) and the availability was approximately $51 million due to approximately $2 million of customs and other guarantees outstanding. On October 27, 2017, USSK entered into an amendment to its €10 million unsecured credit agreement to extend the agreement's final maturity date from December 2017 to December 2018. The agreement also permits one additional one -year extension to the final maturity date at the mutual consent of USSK and its lender.
Each of these facilities bear interest at the applicable inter-bank offer rate plus a margin and contain customary terms and conditions.
Change in control event
If there is a change in control of U. S. Steel: (a) debt obligations totaling $2,312 million as of December 31, 2017 (including the Senior Notes and Senior Secured Notes) may be declared due and payable; (b) the Third Amended and Restated Credit Agreement and USSK's €200 million Revolving Credit Agreement may be terminated and any amounts outstanding declared due and payable; and (c) U. S. Steel may be required to either repurchase the leased Fairfield Works slab caster for $26 million or provide a letter of credit to secure the remaining obligation.
Debt Maturities – Aggregate maturities of debt are as follows (in millions):
2018 |
| 2019 |
| 2020 |
| 2021 |
| 2022 |
| Later |
| Total | ||||||||||||||
$ | 3 | |
| $ | 59 | |
| $ | 435 | |
| $ | 784 | |
| $ | 10 | |
| $ | 1,446 | |
| $ | 2,737 | |
F-35
Table of Contents
17. Pensions and Other Benefits
U. S. Steel has defined contribution or multi-employer retirement benefits for more than three-quarters of its employees in the United States and non-contributory defined benefit pension plans covering the remaining employees. Benefits under the defined benefit pension plans are based upon years of service and final average pensionable earnings, or a minimum benefit based upon years of service, whichever is greater. In addition, pension benefits for most non-represented employees under these plans are based upon a percent of total career pensionable earnings. Effective December 31, 2015, non-represented participants in the defined benefit plan no longer accrue additional benefits under the plan. For those without defined benefit coverage (defined benefit pension plan was closed to new participants in 2003) and those for which the defined benefit plan was frozen, the Company also provides a retirement account benefit based on salary and attained age. Most non-represented employees also participate in defined contribution plans (401(k) plans) whereby the Company matches a certain percentage of salary based on the amount contributed by the participant. At December 31, 2017 , more than two-thirds of U. S. Steel's represented employees in the United States are covered by the Steelworkers Pension Trust (SPT), a multi-employer pension plan, to which U. S. Steel contributes on the basis of a fixed dollar amount for each hour worked.
U.S. Steel's defined benefit retiree health care and life insurance plans (Other Benefits) cover the majority of its represented employees in the United States upon their retirement. Health care benefits are provided for Medicare and pre-Medicare retirees, with Medicare retirees largely enrolled in Medicare Advantage Plans. Both are subject to various cost sharing features, and in most cases domestically, an employer cap on total costs.
On February 1, 2016, the USW ratified successor three year Collective Bargaining Agreements with U. S. Steel and its U. S. Steel Tubular Products, Inc. subsidiary (the 2015 Labor Agreements). The 2015 Labor Agreements were effective as of September 1, 2015 and expire on September 1, 2018.
The 2015 Labor Agreements provide for certain employee and retiree benefit modifications, as well as closure of the Other Benefits plan to represented employees hired or rehired under certain conditions on or after January 1, 2016. Instead, these employees will receive a company defined contribution into a savings account of $0.50 per hour worked.
Additionally, the 2015 Labor Agreements preserved the Company's capped amounts for retiree healthcare contributions and restructured prior contractual obligations that required U. S. Steel to make $235 million in cash contributions to our trust for represented retiree health care and life insurance benefits (VEBA). These funds will now be used to help keep healthcare affordable for our retirees.
Per an amendment effective June 30, 2014, non-represented retiree medical and retiree life insurance benefits are eliminated for non-represented employees who retire after December 31, 2017.
The majority of U. S. Steel's European employees are covered by government-sponsored programs into which U. S. Steel makes required contributions. Also, U. S. Steel sponsors defined benefit plans for most European employees covering benefit payments due to employees upon their retirement, some of which are government mandated. These same employees receive service awards throughout their careers based on stipulated service and, in some cases, age and service.
F-36
Table of Contents
U. S. Steel uses a December 31 measurement date for its plans and may have an interim measurement date if significant events occur. Details relating to Pension Benefits and Other Benefits are below.
|
| Pension Benefits |
| Other Benefits | ||||||||||||
(In millions) |
| 2017 |
| 2016 |
| 2017 |
| 2016 | ||||||||
Change in benefit obligations |
|
|
|
|
|
|
|
| ||||||||
Benefit obligations at January 1 |
| $ | 6,214 | |
| $ | 6,374 | |
| $ | 2,432 | |
| $ | 2,310 | |
Service cost |
| 50 | |
| 54 | |
| 17 | |
| 20 | | ||||
Interest cost |
| 235 | |
| 258 | |
| 94 | |
| 98 | | ||||
Plan amendments |
| - | |
| (25 | ) |
| - | |
| 172 | | ||||
Actuarial losses (gains) |
| 214 | |
| 264 | |
| 8 | |
| (6 | ) | ||||
Exchange rate loss/(gain) |
| 4 | |
| (1 | ) |
| - | |
| - | | ||||
Settlements, curtailments and termination benefits |
| (12 | ) |
| (25 | ) |
| - | |
| (1 | ) | ||||
Benefits paid |
| (598 | ) |
| (685 | ) |
| (172 | ) |
| (161 | ) | ||||
Benefit obligations at December 31 |
| $ | 6,107 | |
| $ | 6,214 | |
| $ | 2,379 | |
| $ | 2,432 | |
Change in plan assets |
|
|
|
|
|
|
|
| ||||||||
Fair value of plan at January 1 |
| $ | 5,482 | |
| $ | 5,639 | |
| $ | 1,984 | |
| $ | 1,990 | |
Actual return on plan assets |
| 773 | |
| 414 | |
| 171 | |
| 94 | | ||||
Employer contributions |
| 75 | |
| 113 | |
| - | |
| - | | ||||
Benefits paid from plan assets |
| (598 | ) |
| (684 | ) |
| (113 | ) |
| (100 | ) | ||||
Fair value of plan assets at December 31 |
| $ | 5,732 | |
| $ | 5,482 | |
| $ | 2,042 | |
| $ | 1,984 | |
Funded status of plans at December 31 |
| (375 | ) |
| (732 | ) |
| (337 | ) |
| (448 | ) | ||||
Amounts recognized in accumulated other comprehensive loss:
|
|
|
| 2017 |
|
| ||||||||||
(In millions) |
| 12/31/2016 |
| Amortization |
| Activity |
| 12/31/2017 | ||||||||
Pensions |
|
|
|
| ||||||||||||
Prior Service Cost |
| $ | (8 | ) |
| $ | - | |
| $ | - | |
| $ | (8 | ) |
Actuarial Losses |
| 2,562 | |
| (148 | ) |
| (176 | ) |
| 2,238 | | ||||
Other Benefits |
|
|
|
|
|
|
|
| ||||||||
Prior Service Cost |
| (22 | ) |
| (29 | ) |
| - | |
| (51 | ) | ||||
Actuarial Losses |
| 141 | |
| (3 | ) |
| (97 | ) |
| 41 | | ||||
As of December 31, 2017 and 2016 , the following amounts were recognized in the Consolidated Balance Sheet:
|
| Pension Benefits |
| Other Benefits | ||||||||||||
(In millions) |
| 2017 |
| 2016 |
| 2017 |
| 2016 | ||||||||
Current liabilities |
| (4 | ) |
| (3 | ) |
| (59 | ) |
| (60 | ) | ||||
Noncurrent liabilities |
| (371 | ) |
| (729 | ) |
| (278 | ) |
| (388 | ) | ||||
Accumulated other comprehensive loss (a) |
| 2,230 | |
| 2,554 | |
| (10 | ) |
| 119 | | ||||
Net amount recognized |
| $ | 1,855 | |
| $ | 1,822 | |
| $ | (347 | ) |
| $ | (329 | ) |
(a) | Accumulated other comprehensive loss effects associated with accounting for pensions and other benefits in accordance with ASC Topic 715 at December 31, 2017 and December 31, 2016 , respectively, are reflected net of tax of $958 million and $939 million respectively, on the Consolidated Statements of Stockholders' Equity. |
The Accumulated Benefit Obligation (ABO) for all defined benefit pension plans was $5,937 million and $6,064 million at December 31, 2017 and 2016 , respectively.
F-37
Table of Contents
|
| December 31, | ||||||
(In millions) |
| 2017 |
| 2016 | ||||
Information for pension plans with an accumulated benefit obligation in excess of plan assets: |
|
|
|
| ||||
Aggregate accumulated benefit obligations (ABO) |
| $ | (5,937 | ) |
| $ | (6,064 | ) |
Aggregate projected benefit obligations (PBO) |
| (6,107 | ) |
| (6,214 | ) | ||
Aggregate fair value of plan assets |
| 5,732 | |
| 5,482 | | ||
The aggregate ABO in excess of plan assets reflected above is included in the payroll and benefits payable and employee benefits lines on the Consolidated Balance Sheet.
Following are the details of net periodic benefit costs related to Pension and Other Benefits:
|
| Pension Benefits |
| Other Benefits | ||||||||||||||||||||
(In millions) |
| 2017 |
| 2016 |
| 2015 |
| 2017 |
| 2016 |
| 2015 | ||||||||||||
Components of net periodic benefit cost: |
|
|
|
|
|
|
|
|
|
|
|
| ||||||||||||
Service cost |
| $ | 50 | |
| $ | 54 | |
| $ | 102 | |
| $ | 17 | |
| $ | 20 | |
| $ | 21 | |
Interest cost |
| 235 | |
| 258 | |
| 263 | |
| 94 | |
| 98 | |
| 97 | | ||||||
Expected return on plan assets |
| (390 | ) |
| (422 | ) |
| (435 | ) |
| (65 | ) |
| (151 | ) |
| (155 | ) | ||||||
Amortization - prior service costs |
| - | |
| 11 | |
| 17 | |
| 29 | |
| 26 | |
| (6 | ) | ||||||
- actuarial losses |
| 148 | |
| 129 | |
| 241 | |
| 3 | |
| 3 | |
| 7 | | ||||||
Net periodic benefit cost (benefit), excluding below |
| 43 | |
| 30 | |
| 188 | |
| 78 | |
| (4 | ) |
| (36 | ) | ||||||
Multiemployer plans (a) |
| 59 | |
| 63 | |
| 68 | |
| - | |
| - | |
| - | | ||||||
Settlement, termination and curtailment losses/(gains) |
| 7 | |
| 13 | |
| 35 | |
| - | |
| (1 | ) |
| (4 | ) | ||||||
Net periodic benefit cost (benefit) |
| $ | 109 | |
| $ | 106 | |
| $ | 291 | |
| $ | 78 | |
| $ | (5 | ) |
| $ | (40 | ) |
(a) | Primarily represents pension expense for the SPT covering USW employees hired from National Steel Corporation and new USW employees hired after May 21, 2003. |
Net periodic benefit cost for pensions and other benefits is projected to be approximately $135 million and approximately $60 million , respectively, in 2018 . The pension cost projection includes approximately $54 million of contributions to the SPT. The amounts in accumulated other comprehensive income that are expected to be recognized as components of net periodic benefit cost during 2018 are as follows:
(In millions) |
| Pension Benefits 2018 |
| Other Benefits 2018 | ||||
Amortization of actuarial loss |
| $ | 143 | |
| $ | 4 | |
Amortization of prior service cost |
| - | |
| 29 | | ||
Total recognized from accumulated other comprehensive income |
| $ | 143 | |
| $ | 33 | |
Weighted average assumptions used to determine the benefit obligation at December 31 and net periodic benefit cost for the year ended December 31 are detailed below.
|
| Pension Benefits |
| Other Benefits | ||||||||
|
| 2017 | 2016 |
| 2017 | 2016 | ||||||
|
| U.S. and Europe |
| U.S. and Europe |
| U.S. |
| U.S. | ||||
Actuarial assumptions used to determine benefit obligations at December 31: |
|
|
|
|
|
|
|
| ||||
Discount rate |
| 4.00 | % |
| 4.00 | % |
| 4.03 | % |
| 4.00 | % |
Increase in compensation rate |
| 2.60 | % |
| 2.60 | % |
| N/A | |
| 3.50 | % |
F-38
Table of Contents
|
| Pension Benefits | |||||||
|
| 2017 | 2016 |
| 2015 | ||||
|
| U.S. and Europe |
| U.S. and Europe |
| U.S. and Europe | |||
Actuarial assumptions used to determine net periodic benefit cost for the year ended December 31: |
|
|
|
|
|
| |||
Discount rate |
| 4.00 | % |
| 4.25 | % |
| 3.75 | % |
Expected annual return on plan assets |
| 7.25 | % |
| 7.50 | % |
| 7.50 | % |
Increase in compensation rate |
| 2.60 | % |
| 2.60 | % |
| 3.00 | % |
|
| Other Benefits | |||||||
|
| 2017 | 2016 | 2015 | |||||
|
| U.S. |
| U.S. |
| U.S. | |||
Discount rate |
| 4.00 | % |
| 4.25 | % |
| 3.75 | % |
Expected annual return on plan assets |
| 3.25 | % |
| 7.50 | % |
| 7.50 | % |
Increase in compensation rate |
| 3.50 | % |
| 3.50 | % |
| 3.50 | % |
The discount rate reflects the current rate at which the pension and other benefit liabilities could be effectively settled at the measurement date. In 2016 and prior years, the discount rate for our U.S. plans was determined by utilizing several AAA and AA corporate bond indices as an indication of interest rate movements and levels. In 2017, we refined our discount rate determination process for our U.S. plans by using a bond matching approach to select specific bonds that would satisfy our projected benefit payments. We believe the bond matching approach more closely reflects the process we would employ to settle our pension and other benefits obligations. This process refinement had an impact of increasing the pension benefits and other benefits discount rate by 25 and 28 basis points for 2017 as compared to the previous methodology. For 2017, each basis point increase in the discount rate decreases the projected benefit obligation by approximately $6 million and $2 million for pension and other benefits, respectively. For our European pension plan, the discount rate is determined using a yield curve methodology based on European bonds. The discount rate assumptions are updated annually.
At December 31, 2017 due to a recent experience study performed, the Company updated the mortality assumptions used to calculate its main U.S. defined benefit pension and other post-employment benefit liabilities. As a result of this change in mortality assumptions, our projected benefit obligations have increased by $194 million and $42 million for pension and other benefits, respectively.
|
| 2017 |
| 2016 |
Assumed health care cost trend rates at December 31: |
| U.S. |
| U.S. |
Health care cost trend rate assumed for next year |
| 7.00% |
| 7.00% |
Rate to which the cost trend rate is assumed to decline (the ultimate trend rate) |
| 5.00% |
| 5.00% |
Year that the rate reaches the ultimate trend rate |
| 2022 |
| 2021 |
A one-percentage-point change in the assumed return on plan assets, discount rate or health care cost trend rates would have the following effects:
F-39
Table of Contents
(In millions) |
| 1-Percentage- |
| 1-Percentage- | ||||
Expected return on plan assets |
|
|
|
| ||||
Incremental (decrease) increase in: |
|
|
|
| ||||
Net periodic pension costs for 2018 |
| $ | (72 | ) |
| $ | 72 | |
Discount rate |
|
|
|
| ||||
Incremental (decrease) increase in: |
|
|
|
| ||||
Net periodic pension & other benefits costs for 2018 |
| $ | (8 | ) |
| $ | 6 | |
Pension & other benefits liabilities at December 31, 2017 |
| $ | (743 | ) |
| $ | 885 | |
Health care cost escalation trend rates |
|
|
|
| ||||
Incremental increase (decrease) in: |
|
|
|
| ||||
Other post-employment benefit obligations |
| $ | 99 | |
| $ | (85 | ) |
Service and interest costs components for 2018 |
| $ | 5 | |
| $ | (4 | ) |
U. S. Steel reviews its actual historical rate experience and expectations of future health care cost trends to determine the escalation of per capita health care costs under U. S. Steel's benefit plans. About three quarters of our costs for the domestic USW participants' retiree health benefits in the Company's main domestic benefit plan are limited to a per capita dollar maximum calculation based on 2006 base year actual costs incurred under the main U. S. Steel benefit plan for USW participants (cost cap). The full effect of the cost cap is expected to be realized around 2024. After 2024, the Company's costs for a majority of USW retirees and their dependents are expected to remain fixed and as a result, the cost impact of health care escalation for the Company is projected to be limited for this group.
Plan Assets
On January 1, 2016, U. S. Steel adopted Accounting Standards Update 2015-07, Fair Value Measurement (Topic 820) Disclosures for Investments in Certain Entities that Calculate Net Asset Value per Share (or Its Equivalent) (ASU 2015-07). ASU 2015-07 removes the requirement to categorize within the fair value hierarchy all investments for which fair value is measured using the net asset value per share practical expedient.
ASC Topic 820 establishes a single definition of fair value, creates a three-tier hierarchy as a framework for measuring fair value based on inputs used to value the Plan's investments, and requires additional disclosure about fair value. The hierarchy gives the highest priority to unadjusted quoted prices in active markets for identical assets or liabilities (level 1) and the lowest priority to unobservable inputs (level 3). The three levels of the fair value hierarchy are summarized below:
• | Level 1 – Inputs to the valuation methodology are unadjusted quoted prices for identical assets or liabilities in active markets that the Partnership has the ability to access. |
• | Level 2 – Inputs to the valuation methodology include: |
◦ Quoted prices for similar assets or liabilities in active markets;
◦ Quoted prices for identical or similar assets or liabilities in inactive markets;
◦ Inputs other than quoted prices that are observable for the asset or liability;
◦ Inputs that are derived principally from or corroborated by observable market data by correlation or other means
If the asset or liability has a specified (contractual) term, the level 2 input must be observable for substantially the full term of the asset or liability.
• | Level 3 – Inputs to the valuation methodology are unobservable and significant to the fair value measurement. |
U. S. Steel's Pension plan and Other Benefits plan assets are classified as follows:
Level 1 |
| Level 2 |
| Level 3 |
Short-term Investments |
| Corporate Bonds - U.S. |
| Private Equities |
Equity Securities - U.S. |
| Government Bonds - U.S. |
| Real Estate |
Exchange-traded Funds |
| Mortgage-backed GNMAs & FNMAs |
| Mineral Interests |
|
|
|
| Timberlands |
F-40
Table of Contents
An instrument's level is based on the lowest level of any input that is significant to the fair value measurement. Valuation techniques maximize the use of relevant observable inputs and minimize the use of unobservable inputs. The following is a description of the valuation methodologies used for assets measured at fair value. There have been no changes in the methodologies used at December 31, 2017 and 2016 .
Short-term investments are valued at amortized cost which approximates fair value to the short-term maturity of the instruments. Equity securities - U.S., investments in investment trusts and exchange-traded funds are valued at the closing price reported on the active exchange on which the individual securities are traded. U.S. government bonds are valued using pricing models maximizing the use of observable inputs for similar securities. Corporate bonds are also valued using pricing models maximizing the use of observable inputs for similar securities, which includes basing value on yields currently available on comparable securities of issuers with similar credit ratings. When quoted prices are not available for identical or similar bonds, the bond is valued under a discounted cash flow approach that maximizes observable inputs, such as current yields of similar instruments, but includes adjustments for certain risks that may not be observable, such as credit and liquidity risks. Mortgage-backed GNMAs and FNMAs are valued using quotes from a broker dealer. Internally Managed Partnerships are valued at the net asset value (NAV) of units of the partnership. NAV is used as a practical expedient to estimate fair value. Investment opportunities in these partnerships are restricted to the benefit plans of U. S. Steel, its subsidiaries and current and former affiliates. The Internally Managed Partnerships were liquidated during 2017. Investments in non-public investment partnerships are valued using NAV as a practical expedient. Private equities and real estate are valued using information provided by external managers for each individual investment held in the fund or using NAV as a practical expedient. Timberland investments are either appraised or valued using the investment managers' assessment of the assets within the fund. Mineral Interests are valued at the present value of estimated future cash flows discounted at estimated market rates for assets of similar quality and duration.
The following is a summary of U. S. Steel's Pension plan assets carried at fair value at December 31, 2017 and 2016 :
|
| Fair Value Measurements at December 31, 2017 (in millions) | ||||||||||||||
|
| Total |
| Quoted Prices in |
| Other Significant Observable Inputs |
| Significant | ||||||||
Asset Classes |
| |
| |
|
|
| | ||||||||
Short-term investments |
| $ | 155 | |
| $ | 155 | |
| $ | - | |
| $ | - | |
Equity Securities - U.S. (a) |
| 260 | |
| 260 | |
| - | |
| - | | ||||
Corporate & Government Bonds (b) |
| 1,806 | |
| - | |
| 1,806 | |
| - | | ||||
Mineral Interests |
| 3 | |
| - | |
| - | |
| 3 | | ||||
Timberlands |
| 300 | |
| - | |
| - | |
| 300 | | ||||
Private equities (c) |
| 4 | |
| - | |
| - | |
| 4 | | ||||
Real Estate (d) |
| 33 | |
| - | |
| - | |
| 33 | | ||||
All Other (e) |
| (39 | ) |
| (39 | ) |
| - | |
| - | | ||||
Total assets in the fair value hierarchy |
| $ | 2,522 | |
| $ | 376 | |
| $ | 1,806 | |
| $ | 340 | |
Investments measured at net asset value (f) |
| 3,210 | |
|
|
|
|
|
| |||||||
Investments at fair value |
| $ | 5,732 | |
|
|
|
|
|
| ||||||
(a) Includes U. S. Steel stock.
(b) Underlying investments include:
Corporate Bonds – U.S. | $ | 1,084 | |
Government Bonds – U.S. | 720 | | |
Agency Mortgages | 2 | | |
Total | $ | 1,806 | |
(c) Includes investments in CAI Partners and Company III LP, Clayton Dubilier Rice Fund VI, Epiris Club 2007 (formerly Electra Partners Club 2007 LP) and FF&P Investor 8 ERISA LP.
(d) Includes investments in the Avanti Funds and the Mariano Ranch properties.
(e) Includes $157 million of investment sales, $19 million of accrued income, $(197) million of investment purchases and $(18) million of miscellaneous payables.
(f) In accordance with ASC Topic 820, certain investments that were measured at net asset value per share (or its equivalent) have not been classified in the fair value hierarchy.
F-41
Table of Contents
The following table represents investments based on net asset value and the significant unobservable inputs and the ranges of values for those inputs:
|
| Net Asset Value at December 31, 2017 |
| Unfunded Commitments |
| Redemption Frequency |
| Redemption Notice Period | ||||
Private Equity Funds (a) |
| $ | 252 | |
| $ | 91 | |
| Not redeemable |
| N/A |
Real Estate Funds (a) |
| 260 | |
| 117 | |
| ** |
| N/A | ||
Interest in Investment Partnerships (b) |
| 729 | |
| N/A | |
| N/A |
| N/A | ||
Commingled Funds |
| 1,969 | |
| N/A | |
| N/A |
| N/A | ||
Investments measured at net asset value |
| $ | 3,210 | |
|
|
|
|
|
| ||
** Not redeemable, except for JP Morgan Real Estate Income & Growth, which has a quarterly redemption provision.
(a) The remaining lives of such investments range from less than one year to up to eleven years.
(b) Investment partnerships whose investment objectives are to achieve long-term capital appreciation by investing in global equity markets.
|
| Fair Value Measurements at December 31, 2016 (in millions) | ||||||||||
|
| Total |
| Quoted Prices in |
| Significant | ||||||
Asset Classes |
|
|
|
|
|
| ||||||
Short-term investments |
| $ | 98 | |
| $ | 98 | |
| $ | - | |
Exchange-Traded Funds |
| 61 | |
| 61 | |
| - | | |||
Equity Securities - U.S. (a) |
| 124 | |
| 124 | |
| - | | |||
Mineral Interests |
| 3 | |
| - | |
| 3 | | |||
Timberlands |
| 312 | |
| - | |
| 312 | | |||
Private equities (b) |
| 8 | |
| - | |
| 8 | | |||
Real Estate (c) |
| 34 | |
| - | |
| 34 | | |||
All Other (d) |
| (4 | ) |
| (4 | ) |
| - | | |||
Total assets in the fair value hierarchy |
| $ | 636 | |
| $ | 279 | |
| $ | 357 | |
Investments measured at net asset value (e) |
| 4,846 | |
|
|
|
| |||||
Investments at fair value |
| $ | 5,482 | |
|
|
|
| ||||
(a) | Includes U. S. Steel stock. |
(b) | Includes investments in CAI Partners and Company III LP, Clayton Dubilier Rice Fund VI, Electra Partners Club 2007 LP and FF&P Investor 8 ERISA LP. |
(c) | Includes investments in the Avanti Funds and the Mariano Ranch properties. |
(d) | Includes $50 million of investment sales, $1 million of accrued income and $(55) million of miscellaneous payables. |
(e) | In accordance with ASC Topic 820, certain investments that were measured at net asset value per share (or its equivalent) have not been classified in the fair value hierarchy. |
The following table represents investments based on net asset value and the significant unobservable inputs and the ranges of values for those inputs:
|
| Net Asset Value at December 31, 2016 |
| Unfunded Commitments |
| Redemption Frequency |
| Redemption Notice Period | ||||
Private Equity Funds (a) |
| $ | 273 | |
| $ | 124 | |
| Not redeemable |
| N/A |
Real Estate Funds (a) |
| 252 | |
| 156 | |
| ** |
| N/A | ||
Interest in Internally Managed Partnership - Fixed Income (b) |
| 1,490 | |
| N/A | |
| N/A |
| N/A | ||
Interest in Internally Managed Partnership - Equity (c) |
| 2,232 | |
| N/A | |
| N/A |
| N/A | ||
Interest in Investment Partnerships (d) |
| 599 | |
| N/A | |
| N/A |
| N/A | ||
Investments measured at net asset value |
| $ | 4,846 | |
|
|
|
|
|
| ||
** Not redeemable, except for JP Morgan U.S. Real Estate Income & Growth, which has a quarterly redemption provision.
(a) The remaining lives of such investments range from less than one year to up to twelve years.
(b) Underlying investments include:
F-42
Table of Contents
Corporate Bonds – U.S. | $ | 885 | |
Government Bonds – U.S. | 564 | | |
Other (1) | 41 | | |
Total | $ | 1,490 | |
(1) Other includes $27 million of mortgages, $20 million of contributions, $13 million of accrued income and
$(19) million of investment purchases payable.
(c) Underlying investments include:
Exchange-Traded Funds | $ | 100 | |
Equity Securities – U.S. | 2,038 | | |
Other (2) | 94 | | |
Total | $ | 2,232 | |
(2) Other includes $57 million of equity securities - foreign, $55 million of investment sales receivable, $3 million of
accrued income, $1 million of short-term investment funds, $(20) million of withdrawals, and $(2) million of
investment purchases payable.
(d) Investment partnerships whose investment objectives are to achieve long-term capital appreciation by investing in global equity markets.
The following table sets forth a summary of changes in the fair value of U. S. Steel's Pension plan Level 3 assets for the years ended December 31, 2017 and 2016 (in millions):
|
|
| ||||||
(In millions) |
| 2017 |
| 2016 | ||||
Balance at beginning of period |
| $ | 357 | |
| $ | 336 | |
Transfers in and/or out of Level 3 |
| - | |
| - | | ||
Actual return on plan assets: |
|
|
|
| ||||
Realized gain/(loss) |
| 2 | |
| (2 | ) | ||
Net unrealized (loss)/gain |
| (16 | ) |
| 29 | | ||
Purchases, sales, issuances and settlements: |
|
|
|
| ||||
Purchases |
| - | |
| 1 | | ||
Sales |
| (3 | ) |
| (7 | ) | ||
Balance at end of period |
| $ | 340 | |
| $ | 357 | |
The following is a summary of U. S. Steel's Other Benefits plan assets carried at fair value at December 31, 2017 and 2016 . During 2016, the VEBA Trust withdrew from the Fixed Income Internally Managed Partnership and invested in Corporate Bonds - U.S., Government bonds - U.S. and Agency mortgages.
|
| Fair Value Measurements at December 31, 2017 (in millions) | ||||||||||||||
|
| Total |
| Quoted Prices in |
| Other Significant Observable Inputs (Level 2) |
| Significant | ||||||||
Asset Classes |
|
|
|
|
| |
|
| ||||||||
Short-term investments |
| $ | 54 | |
| $ | 54 | |
| - | |
| $ | - | | |
Equity Securities - U.S. |
| 29 | |
| 29 | |
| - | |
| - | | ||||
Corporate Bonds - U.S. |
| 1,455 | |
| - | |
| 1,455 | |
| - | | ||||
Government bonds - U.S. |
| 323 | |
| - | |
| 323 | |
| - | | ||||
Timberlands |
| 34 | |
| - | |
| - | |
| 34 | | ||||
Private equities (a) |
| 1 | |
| - | |
| - | |
| 1 | | ||||
All Other (b) |
| 39 | |
| 39 | |
| - | |
| - | | ||||
Total assets in the fair value hierarchy |
| $ | 1,935 | |
| $ | 122 | |
| $ | 1,778 | |
| $ | 35 | |
Investments measured at net asset value (c) |
| 107 | |
|
|
|
|
|
| |||||||
Investments at fair value |
| $ | 2,042 | |
|
|
|
|
|
| ||||||
(a) Includes investment in Epiris Club 2007 (formerly Electra Partners Club 2007 LP) and FF&P Investor 8 ERISA LP.
(b) Includes $23 million of investment sales, $17 million of accrued income and $(1) million of investment purchase payables.
F-43
Table of Contents
(c) In accordance with Subtopic 820-10, certain investments that were measured at net asset value per share (or its equivalent) have not been classified in the fair value hierarchy.
The following table represents investments based on net asset value and the significant unobservable inputs and the ranges of values for those inputs:
|
| Net Asset Value at December 31, 2017 |
| Unfunded Commitments |
| Redemption Frequency |
| Redemption Notice Period | ||||
Private Equity Funds (a) |
| $ | 62 | |
| $ | 15 | |
| Not redeemable |
| N/A |
Real Estate Funds (a) |
| 33 | |
| 15 | |
| ** |
| N/A | ||
Interest in Investment Partnerships (b) |
| 12 | |
| N/A | |
| N/A |
| N/A | ||
Investments measured at net asset value |
| $ | 107 | |
| |
| |
| | ||
** Not redeemable, except for JP Morgan U.S. Real Estate Income & Growth, which has a quarterly redemption provision.
(a) The remaining lives of such investments range from less than one year up to eleven years.
(b) Investment partnerships whose investment objectives are to achieve long-term capital appreciation by investing in global equity markets.
|
| Fair Value Measurements at December 31, 2016 (in millions) | |||||||||||||
|
| Total |
| Quoted Prices in |
| Other Significant Observable Inputs (Level 2) |
| Significant | |||||||
Asset Classes |
|
|
|
|
|
|
|
| |||||||
Short-term investments |
| $ | 24 | |
| $ | 24 | |
| - | |
| $ | - | |
Equity Securities - U.S. |
| 21 | |
| 21 | |
| - | |
| - | | |||
Corporate Bonds - U.S. |
| 1,369 | |
| - | |
| 1,369 | |
| - | | |||
Government bonds - U.S. |
| 173 | |
| - | |
| 173 | |
| - | | |||
Agency Mortgages |
| 13 | |
| - | |
| 13 | |
| - | | |||
Timberlands |
| 37 | |
| - | |
| - | |
| 37 | | |||
Private equities (a) |
| 1 | |
| - | |
| - | |
| 1 | | |||
All Other (b) |
| 18 | |
| 18 | |
| - | |
| - | | |||
Total assets in the fair value hierarchy |
| $ | 1,656 | |
| $ | 63 | |
| 1,555 | |
| $ | 38 | |
Investments measured at net asset value (c) |
| 328 | |
|
|
|
|
|
| ||||||
Investments at fair value |
| $ | 1,984 | |
|
|
|
|
|
| |||||
(a) Includes investment in Electra Partners Club 2007 LP and FF&P Investor 8 ERISA LP.
(b) Includes $15 million of investment sales, $16 million of accrued income and $(13) million of investment purchase payables.
(c) In accordance with Subtopic 820-10, certain investments that were measured at net asset value per share (or its equivalent) have not been classified in the fair value hierarchy.
The following table represents investments based on net asset value and the significant unobservable inputs and the ranges of values for those inputs:
|
| Net Asset Value at December 31, 2016 |
| Unfunded Commitments |
| Redemption Frequency |
| Redemption Notice Period | ||||
Private Equity Funds (a) |
| $ | 66 | |
| $ | 22 | |
| Not redeemable |
| N/A |
Real Estate Funds (a) |
| 41 | |
| 21 | |
| ** |
| N/A | ||
Interest in Internally Managed Partnership - Equity (b) |
| 162 | |
| N/A | |
| N/A |
| N/A | ||
Interest in Investment Partnerships (c) |
| 59 | |
| N/A | |
| N/A |
| N/A | ||
Investments measured at net asset value |
| $ | 328 | |
|
|
|
|
|
| ||
** Not redeemable, except for JP Morgan U.S. Real Estate Income & Growth, which has quarterly redemption provisions.
(a) The remaining lives of such investments range from less than one year to up to twelve years.
(b) Underlying investments include:
F-44
Table of Contents
Equity Securities – U.S. | $ | 160 | |
Withdrawal (1) | (15 | ) | |
Other (2) | 17 | | |
Total | $ | 162 | |
(1) This represents a withdrawal to rebalance the investment mix in the other benefits plan.
(2) Other includes $8 million of exchange-traded funds, $5 million in equity securities - foreign and $4 million in investment sales receivable.
(c) Investment partnerships whose investment objectives are to achieve long-term capital appreciation by investing in global equity markets.
The following table sets forth a summary of changes in the fair value of U. S. Steel's Other Benefits plan Level 3 assets for the years ended December 31, 2017 and 2016 (in millions):
|
|
| ||||||
(In millions) |
| 2017 |
| 2016 | ||||
Balance at beginning of period |
| $ | 38 | |
| $ | 41 | |
Transfers in and/or out of Level 3 |
| - | |
| - | | ||
Actual return on plan assets: |
|
|
|
| ||||
Net unrealized loss |
| (2 | ) |
| (2 | ) | ||
Purchases, sales, issuances and settlements: |
|
|
|
| ||||
Sales |
| (1 | ) |
| (1 | ) | ||
Balance at end of period |
| $ | 35 | |
| $ | 38 | |
U. S. Steel's investment strategy for its U.S. pension and other benefits plan assets provides for a diversified mix of public equities, high quality bonds and selected smaller investments in private equities, investment trusts and partnerships, timber and mineral interests. For its U.S. Pension, U. S. Steel has a target allocation for plan assets of 55 percent in equities (inclusive of private equity and investment trusts). The balance is primarily invested in corporate bonds, Treasury bonds and government-backed mortgages. U. S. Steel believes that returns on equities over the long term will be higher than returns from fixed-income securities as actual historical returns from U. S. Steel's trusts have shown. Returns on bonds tend to offset some of the short-term volatility of stocks. Both equity and fixed-income investments are made across a broad range of industries and companies to provide protection against the impact of volatility in any single industry as well as company specific developments. U. S. Steel will use a 6.85 percent assumed rate of return on assets for the development of net periodic cost for the main defined benefit pension plan in 2018 . The 2018 assumed rate of return is lower than the rate of return used for 2017 domestic expense and was determined by taking into account the intended asset mix and some moderation of the historical premiums that fixed-income and equity investments have yielded above government bonds. Actual returns since the inception of the plan have exceeded this 6.85 percent rate and while recent annual returns have been volatile, it is U. S. Steel's expectation that rates will achieve this level in future periods.
For its Other Benefits Plan, U. S. Steel is now employing a liability driven investment strategy. The plan assets are allocated to match the plan cash flows with maturing investments. To achieve this strategy, U. S. Steel has a target allocation for plan assets of 90 percent in high quality domestic bonds with the balance primarily invested in equity securities. U. S. Steel will use a 4.25 percent assumed rate of return on assets for the development of net periodic cost for its Other Benefits Plan. The 2018 assumed rate of return has been conservatively set, taking into account the intended asset mix.
Steelworkers Pension Trust
U. S. Steel participates in a multi-employer defined benefit pension plan, the Steelworkers Pension Trust (SPT). For most bargaining unit employees participating in the SPT, U. S. Steel contributes to the SPT a fixed dollar amount for each hour worked of $2.65 ; a rate agreed to as part of the 2015 Labor Agreements, that are set to expire on September 1, 2018. U. S. Steel's contributions to the SPT represented greater than 5% of the total combined contributions of all employers participating in the plan for the years ended December 31, 2017 , 2016 and 2015 .
Participation in a multi-employer pension plan agreed to under the terms of a collective bargaining agreement differ from a traditional qualified single employer defined benefit pension plan. The SPT shares risks associated with the plan in the following respects:
F-45
Table of Contents
a. Contributions to the SPT by U. S. Steel may be used to provide benefits to employees of other participating employers;
b. If a participating employer stops contributing to the SPT, the unfunded obligations of the plan may be borne by the remaining participating employers;
c. If U. S. Steel chooses to stop participating in the SPT, U. S. Steel may be required to pay an amount based on the underfunded status of the plan, referred to as a withdrawal liability.
On March 21, 2011 the Board of Trustees of the SPT elected funding relief which has the effect of decreasing the amount of required minimum contributions in near-term years, but will increase the minimum funding requirements during later plan years. As a result of the election of funding relief, the SPT's zone funding under the Pension Protection Act may be impacted.
In addition to the funding relief election, the Board of Trustees also elected a special amortization rule, which allows the SPT to separately amortize investment losses incurred during the SPT's December 31, 2008 plan year-end over a 29 year period, whereas they were previously required to be amortized over a 15 year period.
U. S. Steel's participation in the SPT for the annual periods ended December 31, 2017 , 2016 and 2015 is outlined in the table below.
|
| Employer |
| Pension Protection Act Zone |
| FIP/RP Status |
| U.S. Steel |
| Surcharge |
| Expiration Date | ||||||||||||||
Pension Fund |
| 2017 |
| 2016 |
| 2017 |
| 2016 |
| 2015 |
| 2017 |
| 2016 |
| |||||||||||
Steelworkers Pension Trust |
| 23-6648508/499 |
| Green |
| Green |
| No |
| $ | 59 | |
| $ | 63 | |
| $ | 66 | |
| No |
| No |
| September 1, 2018 |
(a) | The zone status is based on information that U. S. Steel received from the plan and is certified by the plan's actuary. Among other factors, plans in the green zone are at least 80 percent funded, while plans in the yellow zone are less than 80 percent funded and plans in the red zone are less than 65 percent funded. |
(b) | Indicates if a financial improvement plan (FIP) or a rehabilitation plan (RP) is either pending or has been implemented. |
(c) | Indicates whether there were charges to U. S. Steel from the plan. |
Cash Flows
Employer Contributions – In addition to the contributions to the SPT noted in the table above, on November 20, 2017, U. S. Steel made a voluntary contribution of $75 million to the U. S. Steel Retirement Plan Trust, which is the funding vehicle for the Company's main defined pension plan. In 2016, U. S. Steel made a voluntary contribution of 3,763,643 shares of common stock (the shares), par value of $1.00 per share, to the U. S. Steel Retirement Plan Trust. The shares were valued by an independent valuation firm for the purposes of the contribution at $26.57 per share, or approximately $100 million in the aggregate, which was the closing price of the Company's common stock on August 1, 2016.
For pension plans not funded by trusts, U. S. Steel made $13 million , $26 million and $38 million of pension payments not funded by trusts in 2017 , 2016 and 2015 , respectively.
Cash payments totaling $59 million , $61 million and $75 million were made for other post-employment benefit payments not funded by trusts in 2017 , 2016 and 2015 , respectively. In 2017 and 2016, U. S. Steel continued to use VEBA assets to pay USW post-employment benefit claims. In addition, in 2015, we made a $10 million contribution to our VEBA. The 2015 Labor Agreements restructured prior contractual obligations that required U. S. Steel to make $235 million in cash contributions to the VEBA trust fund. These funds will now be used to help keep healthcare affordable for our retirees.
Estimated Future Benefit Payments – The following benefit payments, which reflect expected future service as appropriate, are expected to be paid from U. S. Steel's defined benefit plans:
F-46
Table of Contents
(In millions) |
| Pension |
| Other | ||||
2018 |
| $ | 523 | |
| $ | 177 | |
2019 |
| 482 | |
| 183 | | ||
2020 |
| 471 | |
| 188 | | ||
2021 |
| 455 | |
| 189 | | ||
2022 |
| 442 | |
| 189 | | ||
Years 2023 - 2027 |
| 2,039 | |
| 860 | | ||
Defined contribution plans
U. S. Steel also contributes to several defined contribution plans for its salaried employees. Effective December 31, 2015, all non-represented salaried employees in North America receive pension benefits through a defined contribution pension plan with contribution percentages based upon age, for which company contributions totaled $22 million , $23 million and $17 million in 2017 , 2016 and 2015 , respectively. U. S. Steel's matching contributions to salaried employees' defined contribution savings fund plans, which for the most part are based on a percentage of the employees' contributions, totaled $17 million in 2017 and 2016 , and $22 million in 2015 . U. S. Steel also maintains non-qualified defined contribution plans to provide benefits which are otherwise limited by the Internal Revenue Service for qualified plans. U. S. Steel's contributions under these defined contribution plans totaled $1 million in 2017 , 2016 and 2015 .
Most represented employees are eligible to participate in a defined contribution savings fund plan where there is no company match on savings except for certain Tubular hourly employees. Effective with the 2015 Labor Agreement, represented hires on or after January 1, 2016 are eligible for a $0.50 per hour savings account contribution. These company contributions for represented employees totaled $1 million in 2017 , 2016 and 2015 .
Other post-employment benefits
The Company provides benefits to former or inactive employees after employment but before retirement. Certain benefits including workers' compensation and black lung benefits represent material obligations to the Company and under the guidance for nonretirement post-employment benefits, have historically been treated as accrued benefit obligations. Liabilities for these benefits recorded at December 31, 2017 , totaled $116 million as compared to $114 million at December 31, 2016 . Liability amounts were developed assuming a discount rate of 3.57% and 4.00% at December 31, 2017 and 2016 . Net periodic benefit cost for these benefits is projected to be $12 million in 2018 compared to $22 million in 2017 and $3 million in 2016 .
Non-retirement post-employment benefits
U. S. Steel recorded a favorable adjustment associated with a change in estimate that resulted in a benefit of $2 million in 2017 compared to costs of less than $1 million in 2016 , related to the accrual of employee costs for supplemental unemployment benefits and the continuation of health care benefits and life insurance coverage for employees associated with the temporary idling of certain facilities and reduced production at others. Payments for these benefits during 2017 and 2016 were $18 million and $81 million , respectively.
Pension Funding
In October 2017, U. S. Steel's Board of Directors authorized voluntary contributions to U. S. Steel's trusts for pensions and other benefits of up to $200 million through the end of 2018 . On November 20, 2017, the Company made a voluntary contribution of $75 million to the U. S. Steel Retirement Plan Trust.
In November 2015, pension stabilization legislation further extended a revised interest rate formula to be used to measure defined benefit pension obligations for calculating minimum annual contributions. The new interest rate formula results in higher interest rates for minimum funding calculations as compared to prior law over the next few years, which will improve the funded status of our main defined benefit pension plan and reduce minimum required contributions.
U. S. Steel will monitor the funded status of the plan to determine when voluntary contributions may be prudent in order to mitigate potentially larger mandatory contributions in later years.
F-47
Table of Contents
18. Asset Retirement Obligations
U. S. Steel's asset retirement obligations (AROs) primarily relate to mine, landfill closure and post-closure costs. The following table reflects changes in the carrying values of AROs for the years ended December 31, 2017 and 2016 :
|
| December 31, |
| ||||||
(In millions) |
| 2017 |
| 2016 |
| ||||
Balance at beginning of year |
| $ | 79 | |
| $ | 89 | |
|
Additional obligations incurred |
| - | |
| 2 | |
| ||
Obligations settled |
| (8 | ) |
| (15 | ) |
| ||
Change in estimate of obligations |
| (6 | ) |
| - | |
| ||
Foreign currency translation effects |
| 2 | |
| - | |
| ||
Accretion expense |
| 2 | |
| 3 | |
| ||
Balance at end of period |
| $ | 69 | |
| $ | 79 | |
|
Certain AROs related to disposal costs of the majority of fixed assets at our integrated steel facilities have not been recorded because they have an indeterminate settlement date. These AROs will be initially recognized in the period in which sufficient information exists to estimate their fair value.
19. Fair Value of Financial Instruments
The carrying value of cash and cash equivalents, current accounts and notes receivable, accounts payable, bank checks outstanding, and accrued interest included in the Consolidated Balance Sheet approximate fair value. See Note 15 for disclosure of U. S. Steel's derivative instruments, which are accounted for at fair value on a recurring basis. Additionally, see Note 5 for disclosure of short-term and long-term receivables from related parties (USSC Retained Interest) which is presented net of the allowance for doubtful accounts, which approximates fair value.
The following table summarizes U. S. Steel's financial assets and liabilities that were not carried at fair value at December 31, 2017 and 2016 .
|
| December 31, 2017 |
| December 31, 2016 | ||||||||||||
(In millions) |
| Fair Value |
| Carrying |
| Fair Value |
| Carrying | ||||||||
Financial liabilities: |
|
|
|
|
|
|
|
| ||||||||
Long-term debt (a) |
| $ | 2,851 | |
| $ | 2,678 | |
| $ | 3,139 | |
| $ | 3,002 | |
(a) Excludes capital lease obligations.
The following methods and assumptions were used to estimate the fair value of financial instruments included in the table above:
Long-term debt : Fair value was determined using Level 2 inputs which were derived from quoted market prices and is based on the yield on public debt where available or current borrowing rates available for financings with similar terms and maturities.
Fair value of the financial assets and liabilities disclosed herein is not necessarily representative of the amount that could be realized or settled, nor does the fair value amount consider the tax consequences of realization or settlement.
Financial guarantees are U. S. Steel's only unrecognized financial instrument. For details relating to financial guarantees see Note 25.
F-48
Table of Contents
20. Reclassifications from Other Comprehensive Income (AOCI)
(In millions) (a) |
| Pension and Other Benefit Items |
| Foreign Currency Items |
| Other |
| Total | ||||||||
Balance at December 31, 2015 |
| $ | (1,479 | ) |
| $ | 312 | |
| $ | (2 | ) |
| $ | (1,169 | ) |
Other comprehensive (loss) income before reclassifications |
| (111 | ) |
| (38 | ) |
| 20 | |
| (129 | ) | ||||
Amounts reclassified from AOCI |
| (181 | ) | (b) | - | |
| (18 | ) |
| (199 | ) | ||||
Net current-period other comprehensive (loss) income |
| (292 | ) |
| (38 | ) |
| 2 | |
| (328 | ) | ||||
Balance at December 31, 2016 |
| $ | (1,771 | ) |
| $ | 274 | |
| $ | - | |
| $ | (1,497 | ) |
Other comprehensive income before reclassifications |
| 640 | |
| 189 | |
| 5 | |
| 834 | | ||||
Amounts reclassified from AOCI |
| (187 | ) | (b) | - | |
| (4 | ) |
| (191 | ) | ||||
Sale of ownership interest in Tilden Mining Company L.C. |
| 9 | | | - | | | - | | | 9 | | ||||
Net current-period other comprehensive income |
| 462 | |
| 189 | |
| 1 | |
| 652 | | ||||
Balance at December 31, 2017 |
| $ | (1,309 | ) |
| $ | 463 | |
| $ | 1 | |
| $ | (845 | ) |
(a) Amounts for 2016 and 2017 do not reflect a tax benefit as a result of a full valuation allowance on our domestic deferred tax assets. Amounts for 2015 are shown net of tax. Amounts in parentheses indicate decreases in AOCI.
(b) See table below for further details.
|
|
|
| Amount reclassified | ||||||||||
(In millions) (a) |
| Details about AOCI components |
| 2017 |
| 2016 |
| 2015 | ||||||
|
| Amortization of pension and other benefit items |
|
|
|
|
|
| ||||||
|
| Prior service costs (b) |
| $ | (29 | ) |
| $ | (37 | ) |
| $ | (11 | ) |
|
| Actuarial losses (b) |
| (151 | ) |
| (132 | ) |
| (265 | ) | |||
|
| Settlements, termination and curtailment losses (b) |
| (7 | ) |
| (12 | ) |
| - | | |||
|
| Total before tax |
| (187 | ) |
| (181 | ) |
| (276 | ) | |||
|
| Tax benefit |
| - | |
| - | |
| 99 | | |||
|
| Net of tax (c) |
| $ | (187 | ) |
| $ | (181 | ) |
| $ | (177 | ) |
(a) Amounts in parentheses indicate decreases in AOCI.
(b) | These AOCI components are included in the computation of net periodic benefit cost (see Note 17 for additional details). |
(c) Amounts for 2016 and 2017 do not reflect a tax benefit as a result of a full valuation allowance on our domestic deferred tax assets.
F-49
Table of Contents
21. Supplemental Cash Flow Information
|
| Year Ended December 31, | ||||||||||
(In millions) |
| 2017 |
| 2016 |
| 2015 | ||||||
Net cash used in operating activities included: |
|
|
|
|
|
| ||||||
Interest and other financial costs paid (net of amount capitalized) |
| $ | (242 | ) |
| $ | (193 | ) |
| $ | (229 | ) |
Income taxes paid |
| $ | (40 | ) |
| $ | (6 | ) |
| $ | - | |
Non-cash investing and financing activities: |
|
|
|
|
|
| ||||||
Change in accrued capital expenditures |
| $ | 208 | |
| $ | (110 | ) |
| $ | 59 | |
U. S. Steel common stock issued for employee stock plans |
| $ | 49 | |
| $ | 32 | |
| $ | 18 | |
U. S. Steel common stock issued for defined benefit pension plans |
| $ | - | |
| $ | 100 | |
| $ | - | |
22. Transactions with Related Parties
Net sales to related parties and receivables from related parties primarily reflect sales of raw materials and steel products to equity investees and USSC after the CCAA filing on September 16, 2014, but before the sale to an affiliate of Bedrock on June 30, 2017. Generally, transactions are conducted under long-term contractual arrangements. Related party sales and service transactions were $1,204 million , $1,216 million and $1,463 million in 2017 , 2016 and 2015 , respectively. The long-term receivables from related parties was due from USSC. The $1,627 million was fully reserved as of December 31, 2016 and was removed with the sale of USSC to an affiliate of Bedrock.
Purchases from related parties for outside processing services provided by equity investees and USSC after the CCAA filing on September 16, 2014, but before the sale to an affiliate of Bedrock, amounted to $70 million , $80 million and $383 million during 2017 , 2016 and 2015 , respectively. Purchases of iron ore pellets from related parties amounted to $140 million , $177 million and $203 million for the years ended December 31, 2017 , 2016 and 2015 , respectively.
Accounts payable to related parties include balances due to PRO-TEC Coating Company (PRO-TEC) of $72 million and $63 million at December 31, 2017 and 2016 , respectively for invoicing and receivables collection services provided by U. S. Steel on PRO-TEC's behalf. U. S. Steel, as PRO-TEC's exclusive sales agent, is responsible for credit risk related to those receivables. U. S. Steel also provides PRO-TEC marketing, selling and customer service functions. Payables to other related parties, including USSC after the CCAA filing on September 16, 2014, but before the sale to an affiliate of Bedrock, totaled $2 million and $3 million at December 31, 2017 and 2016 , respectively.
23. Leases
Future minimum commitments for capital leases (including sale-leasebacks accounted for as financings) and for operating leases having initial non-cancelable lease terms in excess of one year are as follows:
(In millions) |
| Capital |
| Operating | ||||
2018 |
| $ | 5 | |
| $ | 67 | |
2019 |
| 5 | |
| 48 | | ||
2020 |
| 5 | |
| 35 | | ||
2021 |
| 5 | |
| 28 | | ||
2022 |
| 12 | |
| 22 | | ||
Later years |
| - | |
| 71 | | ||
Sublease rentals |
| - | |
| - | | ||
Total minimum lease payments |
| $ | 32 | |
| $ | 271 | |
Less imputed interest costs |
| 7 | |
|
| |||
Present value of net minimum lease payments included in long-term debt (see Note 16) |
| $ | 25 | |
|
| ||
F-50
Table of Contents
Operating lease rental expense:
|
| Year Ended December 31, | ||||||||||
(In millions) |
| 2017 |
| 2016 |
| 2015 | ||||||
Minimum rentals |
| $ | 114 | |
| $ | 115 | |
| $ | 117 | |
Contingent rentals |
| 10 | |
| 8 | |
| 11 | | |||
Sublease rentals |
| - | |
| - | |
| - | | |||
Net rental expense |
| $ | 124 | |
| $ | 123 | |
| $ | 128 | |
U. S. Steel leases a wide variety of facilities and equipment under operating leases, including land and building space, office equipment, production equipment and transportation equipment. Most long-term leases include renewal options and, in certain leases, purchase options. See the discussion of residual value guarantees under "other contingencies" in Note 25. Contingent rental payments are determined based on operating lease agreements that include floating rental charges that are directly associated to variable operating components.
24. Restructuring and Other Charges
During 2017, U. S. Steel recorded net restructuring charges of approximately $31 million , which consists of charges of $37 million primarily related to the permanent shutdown and relocation of the No. 6 Quench & Temper Mill at Lorain Tubular Operations and a favorable adjustment of $6 million primarily associated with a change in estimate for previously recorded costs for environmental obligations and Company-wide headcount reductions. Cash payments were made related to severance and exit costs of $32 million .
During 2016, U. S. Steel recorded net restructuring charges of approximately $122 million , which consists of: (1) charges of $124 million related to the permanent shutdown of the Lorain #4, Lone Star #1 and Bellville pipe mills within our Tubular segment; (2) charges of $24 million for Company-wide headcount reductions, including within our Flat-Rolled, Tubular and USSE segments; and (3) a favorable adjustment of $26 million primarily associated with a change in estimate for previously recorded costs for Company-wide headcount reductions. Cash payments were made related to severance and exit costs of $79 million .
Charges for restructuring and ongoing cost reduction initiatives are recorded in the period U. S. Steel commits to a restructuring or cost reduction plan, or executes specific actions contemplated by the plan and all criteria for liability recognition have been met. Charges related to the restructuring and cost reductions are reported in restructuring and other charges in the Consolidated Statements of Operations.
The activity in the accrued balances incurred in relation to restructuring and other cost reduction programs during the years ended December 31, 2017 and December 31, 2016 were as follows:
(in millions) |
| Employee Related Costs |
| Exit Costs |
| Non-cash Charges |
| Total | ||||||||
Balance at December 31, 2015 |
| $ | 48 | |
| $ | 107 | |
| $ | - | |
| $ | 155 | |
|
|
|
|
|
|
|
|
| ||||||||
Additional charges |
| 24 | |
| - | |
| 124 | | (a) | 148 | | ||||
Cash payments/utilization |
| (40 | ) |
| (39 | ) |
| (124 | ) |
| (203 | ) | ||||
Other adjustments and reclasses |
| (18 | ) |
| (8 | ) |
| - | |
| (26 | ) | ||||
|
|
|
|
|
|
|
|
| ||||||||
Balance at December 31, 2016 |
| $ | 14 | |
| $ | 60 | |
| $ | - | |
| $ | 74 | |
|
|
|
|
|
|
|
|
| ||||||||
Additional charges |
| 2 | |
| - | | | 35 | | (b) | 37 | | ||||
Cash payments/utilization |
| (8 | ) |
| (24 | ) |
| (35 | ) |
| (67 | ) | ||||
Other adjustments and reclasses |
| (4 | ) |
| (2 | ) |
| - | |
| (6 | ) | ||||
|
|
|
|
|
|
|
|
| ||||||||
Balance at December 31, 2017 |
| $ | 4 | |
| $ | 34 | |
| $ | - | |
| $ | 38 | |
(a) Charges are primarily related to the write down of inventory and assets associated with the permanent shutdown of the Lorain #4 and Lone Star #1 pipe mills and Bellville Operations within our Tubular segment.
(b) Charges are primarily related to the write down of assets associated with the permanent shutdown and relocation of the No. 6 Quench & Temper Mill at Lorain Tubular Operations.
F-51
Table of Contents
Accrued liabilities for restructuring and other cost reduction programs are included in the following balance sheet lines:
(in millions) |
| December 31, 2017 |
| December 31, 2016 | ||||
Accounts payable |
| $ | 26 | |
| $ | 50 | |
Payroll and benefits payable |
| 4 | |
| 11 | | ||
Employee benefits |
| - | |
| 1 | | ||
Deferred credits and other noncurrent liabilities |
| 8 | |
| 12 | | ||
Total |
| $ | 38 | |
| $ | 74 | |
25. Contingencies and Commitments
U. S. Steel is the subject of, or party to, a number of pending or threatened legal actions, contingencies and commitments involving a variety of matters, including laws and regulations relating to the environment. Certain of these matters are discussed below. The ultimate resolution of these contingencies could, individually or in the aggregate, be material to the Consolidated Financial Statements. However, management believes that U. S. Steel will remain a viable and competitive enterprise even though it is possible that these contingencies could be resolved unfavorably.
U. S. Steel accrues for estimated costs related to existing lawsuits, claims and proceedings when it is probable that it will incur these costs in the future and the costs are reasonably estimable.
Asbestos matters – As of December 31, 2017 , U. S. Steel was a defendant in approximately 820 active cases involving approximately 3,315 plaintiffs. The vast majority of these cases involve multiple defendants. At December 31, 2016 , U. S. Steel was a defendant in approximately 845 cases involving approximately 3,340 plaintiffs. About 2,500 , or approximately 75 percent , of these plaintiff claims are currently pending in jurisdictions which permit filings with massive numbers of plaintiffs. Based upon U. S. Steel's experience in such cases, it believes that the actual number of plaintiffs who ultimately assert claims against U. S. Steel will likely be a small fraction of the total number of plaintiffs.
The following table shows the number of asbestos claims in the current year and the prior two years:
Period ended |
| Opening |
| Claims |
| New |
| Closing |
December 31, 2015 |
| 3,455 |
| 415 |
| 275 |
| 3,315 |
December 31, 2016 |
| 3,315 |
| 225 |
| 250 |
| 3,340 |
December 31, 2017 |
| 3,340 |
| 275 |
| 250 |
| 3,315 |
Historically, asbestos-related claims against U. S. Steel fall into three groups: (1) claims made by persons who allegedly were exposed to asbestos on the premises of U. S. Steel facilities; (2) claims made by persons allegedly exposed to products manufactured by U. S. Steel; and (3) claims made under certain federal and maritime laws by employees of former operations of U. S. Steel.
The amount U. S. Steel accrues for pending asbestos claims is not material to U. S. Steel's financial condition. However, U. S. Steel is unable to estimate the ultimate outcome of asbestos-related claims due to a number of uncertainties, including: (1) the rates at which new claims are filed, (2) the number of and effect of bankruptcies of other companies traditionally defending asbestos claims, (3) uncertainties associated with the variations in the litigation process from jurisdiction to jurisdiction, (4) uncertainties regarding the facts, circumstances and disease process with each claim, and (5) any new legislation enacted to address asbestos-related claims. Despite these uncertainties, management believes that the ultimate resolution of these matters will not have a material adverse effect on U. S. Steel's financial condition, although the resolution of such matters could significantly impact results of operations for a particular quarter.
Environmental Matters – U. S. Steel is subject to federal, state, local and foreign laws and regulations relating to the environment. These laws generally provide for control of pollutants released into the environment and
F-52
Table of Contents
require responsible parties to undertake remediation of hazardous waste disposal sites. Penalties may be imposed for noncompliance. Changes in accrued liabilities for remediation activities where U. S. Steel is identified as a named party are summarized in the following table:
|
| Year Ended December 31, | ||||||
(In millions) |
| 2017 |
| 2016 | ||||
Beginning of period |
| $ | 179 | |
| $ | 197 | |
Accruals for environmental remediation deemed probable and reasonably estimable |
| 8 | |
| 1 | | ||
Adjustments for changes in estimates |
| - | |
| (7 | ) | ||
Obligations settled |
| (8 | ) |
| (12 | ) | ||
End of period |
| $ | 179 | |
| $ | 179 | |
Accrued liabilities for remediation activities are included in the following Consolidated Balance Sheet lines:
(In millions) |
| December 31, 2017 |
| December 31, 2016 | ||||
Accounts payable |
| $ | 29 | |
| $ | 19 | |
Deferred credits and other noncurrent liabilities |
| 150 | |
| 160 | | ||
Total |
| $ | 179 | |
| $ | 179 | |
Expenses related to remediation are recorded in cost of sales and were immaterial for the years ended December 31, 2017 , December 31, 2016 and December 31, 2015 . It is not presently possible to estimate the ultimate amount of all remediation costs that might be incurred or the penalties that may be imposed. Due to uncertainties inherent in remediation projects and the associated liabilities, it is reasonably possible that total remediation costs for active matters may exceed the accrued liabilities by as much as 15 to 30 percent .
Remediation Projects
U. S. Steel is involved in environmental remediation projects at or adjacent to several current and former U. S. Steel facilities and other locations that are in various stages of completion ranging from initial characterization through post-closure monitoring. Based on the anticipated scope and degree of uncertainty of projects, we categorize projects as follows:
(1) | Projects with Ongoing Study and Scope Development – Projects which are still in the development phase. For these projects, the extent of remediation that may be required is not yet known, the remediation methods and plans are not yet developed, and/or cost estimates cannot be determined. Therefore, significant costs, in addition to the accrued liabilities for these projects, are reasonably possible. There are six environmental remediation projects where additional costs for completion are not currently estimable, but could be material. These projects are at Fairfield Works, Lorain Tubular, USS-POSCO Industries (UPI), the Fairless Plant, Cherryvale Zinc and the former steelmaking plant at Joliet, Illinois. As of December 31, 2017 , accrued liabilities for these projects totaled $1 million for the costs of studies, investigations, interim measures, design and/or remediation. It is reasonably possible that additional liabilities associated with future requirements regarding studies, investigations, design and remediation for these projects could be as much as $30 million to $50 million . |
(2) | Significant Projects with Defined Scope – Projects with significant accrued liabilities with a defined scope. As of December 31, 2017 , there are three significant projects with defined scope greater than or equal to $5 million each, with a total accrued liability of $135 million . These projects are: Gary Resource Conservation and Recovery Act (RCRA) (accrued liability of $25 million ), the former Geneva facility (accrued liability of $63 million ), and the former Duluth facility St. Louis River Estuary (accrued liability of $47 million ). |
(3) | Other Projects with a Defined Scope – Projects with relatively small accrued liabilities for which we believe that, while additional costs are possible, they are not likely to be significant, and also include those projects for which we do not yet possess sufficient information to estimate potential costs to U. S. Steel. There are two other environmental remediation projects which each had an accrued liability of between $1 million and $5 million . The total accrued liability for these projects at December 31, 2017 was $4 million . These projects have progressed through a significant portion of the design phase and material additional costs are not expected. |
F-53
Table of Contents
The remaining environmental remediation projects have an accrued liability of less than $1 million each. The total accrued liability for these projects at December 31, 2017 was approximately $6 million . We do not foresee material additional liabilities for any of these sites.
Post-Closure Costs – Accrued liabilities for post-closure site monitoring and other costs at various closed landfills totaled $22 million at December 31, 2017 and were based on known scopes of work.
Administrative and Legal Costs – As of December 31, 2017 , U. S. Steel had an accrued liability of $8 million for administrative and legal costs related to environmental remediation projects. These accrued liabilities were based on projected administrative and legal costs for the next three years and do not change significantly from year to year.
Capital Expenditures – For a number of years, U. S. Steel has made substantial capital expenditures to bring existing facilities into compliance with various laws relating to the environment. In 2017 and 2016 , such capital expenditures totaled $52 million and $31 million , respectively. U. S. Steel anticipates making additional such expenditures in the future; however, the exact amounts and timing of such expenditures are uncertain because of the continuing evolution of specific regulatory requirements.
EU Environmental Requirements – Under the Emission Trading Scheme (ETS), USSK's final allocation of free allowances for the Phase III period, which covers the years 2013 through 2020 is 48 million allowances. Based on projected future production levels, we started to purchase allowances in the third quarter of 2017 to meet the annual compliance submission in the future. As of December 31, 2017 , we have purchased 5 million European Union Allowances (EUA) totaling €36 million (approximately $44 million ). We estimate a shortfall of approximately 16 million allowances for the Phase III period. However, due to a number of variables such as the future market value of allowances, future production levels and future emission intensity levels, we cannot reliably estimate the full cost of complying with the ETS regulations at this time.
The EU's Industry Emission Directive requires implementation of EU determined best available techniques (BAT) for Iron and Steel production to reduce environmental impacts as well as compliance with BAT associated emission levels. Our most recent broad estimate of future capital expenditures for projects to comply with or go beyond BAT requirements is €138 million (approximately $166 million ) over the 2017 to 2020 period. There are ongoing efforts to seek EU grants to fund a portion of these capital expenditures. The actual amount spent will depend largely upon the amount of EU incentive grants received.
Due to other EU legislation requirements - BAT for Large Combustion Plants (LCP), we are required to make changes to the boilers at our steam and power generation plant in order to comply with stricter air emission limits for large combustion plants. The new requirements for LCP resulted in the construction of a new boiler and certain upgrades to our existing boilers. In January 2014, the operation of USSK's boilers was approved by the European Commission (EC) as part of Slovakia's Transitional National Plan (TNP) for bringing all boilers in Slovakia into compliance by no later than 2020. The TNP establishes emission ceilings for each category of emissions (total suspended particulate, sulfur dioxide (SO 2 ) and nitrogen oxide (NOx)) for both stacks within the power plant. The allowable amount of discharged emissions will decrease each year until mid 2020. An emission ceiling will be a limiting factor for future operation of the boilers. The boiler projects have been approved by our Board of Directors and we are now in the execution phase. These projects will result in a reduction in electricity, carbon dioxide (CO 2 ) emissions and operating, maintenance and waste disposal costs once completed. The construction of the new boiler is complete with a total final installed cost of €128 million (approximately $154 million ). Reconstruction of the existing boiler with a projected cost of €54 million (approximately $65 million ) is in progress. The total remaining to be spent on the existing boiler project is projected to be €7 million (approximately $8 million ). Broad legislative changes were enacted by the Slovak Republic to extend the scope of support for renewable sources of energy, that are intended to allow USSK to participate in Slovakia's renewable energy incentive program once the boiler projects are completed.
Environmental indemnifications – Throughout its history, U. S. Steel has sold numerous properties and businesses and many of these sales included indemnifications and cost sharing agreements related to the assets that were divested. These indemnifications and cost sharing agreements have included provisions related to the condition of the property, the approved use, certain representations and warranties, matters of title, and environmental matters. While most of these provisions have not specifically dealt with environmental issues, there have been transactions in which U. S. Steel indemnified the buyer for clean-up or remediation costs relating to the business sold or its then existing conditions or past practices related to non-compliance with environmental laws. Most of the recent indemnification and cost sharing agreements are of a limited nature, only applying to
F-54
Table of Contents
non-compliance with past and/or current laws. Some indemnifications and cost sharing agreements only run for a specified period of time after the transactions close and others run indefinitely. In addition, current owners or operators of property formerly owned or operated by U. S. Steel may have common law claims and cost recovery and contribution rights against U. S. Steel related to environmental matters. The amount of potential environmental liability associated with these transactions and properties is not estimable due to the nature and extent of the unknown conditions related to the properties divested and deconsolidated. Aside from the environmental liabilities already recorded as a result of these transactions due to specific environmental remediation activities and cases (included in the $179 million of accrued liabilities for remediation discussed above), there are no other known environmental liabilities related to these transactions.
Guarantees – The maximum guarantees of the indebtedness and other obligations of unconsolidated entities of U. S. Steel totaled $4 million at December 31, 2017 .
EPA Region V Federal Lawsuit – This is a Clean Air Act (CAA) enforcement action brought in Federal Court in the Northern District of Indiana in 2012. The U.S. Government, joined by the States of Illinois, Indiana, and Michigan initiated the action alleging the Company violated the CAA and failed to have in place appropriate pollution control equipment at Gary Works, Granite City Works, and Great Lakes Works. A Consent Decree with a proposed settlement agreement was filed with the Court on November 22, 2016. As part of the settlement agreement, U. S. Steel agreed to perform seven supplemental environmental projects totaling approximately $3 million and to pay a civil penalty of approximately $2 million . The enforcement action concluded on March 30, 2017 when the Court signed and entered the Consent Decree. In April 2017, U. S. Steel satisfied payment of the approximately $2 million civil penalty and is currently in various phases of implementing the supplemental environmental projects.
CCAA - On September 16, 2014, USSC commenced court-supervised restructuring proceedings under CCAA before the Ontario Superior Court of Justice (the Court). As part of the CCAA proceedings, U. S. Steel submitted both secured and unsecured claims of approximately C $2.2 billion which were verified by the court-appointed Monitor. U. S. Steel's claims were challenged by a number of interested parties, and on February 29, 2016, the Court denied those challenges and verified U. S. Steel's secured claims in the amount of approximately $119 million and unsecured claims of approximately C $1.8 billion and $120 million . The interested parties had appealed the determinations of the Court, but the appeals have been discontinued as a result of the sale of USSC to Bedrock on June 30, 2017 for approximately $127 million .
Other contingencies – Under certain operating lease agreements covering various equipment, U. S. Steel has the option to renew the lease or to purchase the equipment at the end of the lease term. If U. S. Steel does not exercise the purchase option by the end of the lease term, U. S. Steel guarantees a residual value of the equipment as determined at the lease inception date (totaling approximately $10 million at December 31, 2017 ). No liability has been recorded for these guarantees as the potential loss is not probable.
Insurance – U . S. Steel maintains insurance for certain property damage, equipment, business interruption and general liability exposures; however, insurance is applicable only after certain deductibles and retainages. U. S. Steel is self-insured for certain other exposures including workers' compensation (where permitted by law) and auto liability. Liabilities are recorded for workers' compensation and personal injury obligations. Other costs resulting from losses under deductible or retainage amounts or not otherwise covered by insurance are charged against income upon occurrence.
U. S. Steel uses surety bonds, trusts and letters of credit to provide whole or partial financial assurance for certain obligations such as workers' compensation. The total amount of active surety bonds, trusts and letters of credit being used for financial assurance purposes was approximately $158 million as of December 31, 2017 , which reflects U. S. Steel's maximum exposure under these financial guarantees, but not its total exposure for the underlying obligations. A significant portion of our trust arrangements and letters of credit are collateralized by our Third Amended and Restated Credit Agreement. The remaining trust arrangements and letters of credit are collateralized by restricted cash. Restricted cash, which is recorded in other current and noncurrent assets, totaled $44 million and $40 million at December 31, 2017 and December 31, 2016 respectively.
Capital Commitments – At December 31, 2017 , U. S. Steel's contractual commitments to acquire property, plant and equipment totaled $397 million .
F-55
Table of Contents
Contractual Purchase Commitments – U. S. Steel is obligated to make payments under contractual purchase commitments, including unconditional purchase obligations. Payments for contracts with remaining terms in excess of one year are summarized below (in millions):
2018 |
| 2019 |
| 2020 |
| 2021 |
| 2022 |
| Later years |
| Total |
$617 |
| $419 |
| $313 |
| $307 |
| $295 |
| $1,259 |
| $3,210 |
The majority of U. S. Steel's unconditional purchase obligations relates to the supply of industrial gases, and certain energy and utility services with terms ranging from two to 15 years. Unconditional purchase obligations also include coke and steam purchase commitments related to a coke supply agreement with Gateway Energy & Coke Company LLC (Gateway) under which Gateway is obligated to supply a minimum volume of the expected targeted annual production of the heat recovery coke plant, and U. S. Steel is obligated to purchase the coke from Gateway at the contract price. As of December 31, 2017 , if U. S. Steel were to terminate the agreement, it may be obligated to pay in excess of $175 million .
Total payments relating to unconditional purchase obligations were approximately $576 million in 2017 , $457 million in 2016 and $408 million in 2015 .
26. Common Stock Issuance
On August 15, 2016, the Company issued 21,735,000 shares of common stock, par value of $1.00 per share, at a price of $23.00 per share in an underwritten public offering. Third-party expenses related to the issuance of approximately $18 million were recorded as a decrease to additional paid-in capital, resulting in net proceeds of approximately $482 million .
F-56
Table of Contents
SELECTED QUARTERLY FINANCIAL DATA (Unaudited)
|
| 2017 |
| 2016 | ||||||||||||||||||||||||||||
(In millions, except per share data) |
| 4th Qtr. |
| 3rd Qtr. |
| 2nd Qtr. |
| 1st Qtr. |
| 4th Qtr. |
| 3rd Qtr. |
| 2nd Qtr. |
| 1st Qtr. | ||||||||||||||||
Net sales |
| $ | 3,133 | |
| $ | 3,248 | |
| $ | 3,144 | |
| $ | 2,725 | |
| $ | 2,650 | |
| $ | 2,686 | |
| $ | 2,584 | |
| $ | 2,341 | |
Segment earnings (loss) before interest and income taxes: |
|
|
|
|
|
|
|
|
|
|
|
|
|
|
|
| ||||||||||||||||
Flat-rolled |
| 92 | |
| 160 | |
| 218 | |
| (90 | ) |
| 65 | |
| 114 | |
| 6 | |
| (188 | ) | ||||||||
USSE |
| 112 | |
| 73 | |
| 55 | |
| 87 | |
| 63 | |
| 81 | |
| 55 | |
| (14 | ) | ||||||||
Tubular |
| (6 | ) |
| (7 | ) |
| (29 | ) |
| (57 | ) |
| (87 | ) |
| (75 | ) |
| (78 | ) |
| (64 | ) | ||||||||
Total reportable segments |
| $ | 198 | |
| $ | 226 | |
| $ | 244 | |
| $ | (60 | ) |
| $ | 41 | |
| $ | 120 | |
| $ | (17 | ) |
| $ | (266 | ) |
Other Businesses |
| 10 | |
| 12 | |
| 9 | |
| 13 | |
| 21 | |
| 18 | |
| 10 | |
| 14 | | ||||||||
Items not allocated to segments |
| (60 | ) |
| 7 | |
| 60 | |
| (51 | ) |
| (126 | ) |
| (6 | ) |
| 35 | |
| (9 | ) | ||||||||
Total earnings (loss) before interest and income taxes |
| $ | 148 | |
| $ | 245 | |
| $ | 313 | |
| $ | (98 | ) |
| $ | (64 | ) |
| $ | 132 | |
| $ | 28 | |
| $ | (261 | ) |
Net earnings (loss) |
| 159 | |
| 147 | |
| 261 | |
| (180 | ) |
| (105 | ) |
| 51 | |
| (46 | ) |
| (340 | ) | ||||||||
Net earnings (loss) attributable to United States Steel Corporation |
| $ | 159 | |
| $ | 147 | |
| $ | 261 | |
| $ | (180 | ) |
| $ | (105 | ) |
| $ | 51 | |
| $ | (46 | ) |
| $ | (340 | ) |
|
|
|
|
|
|
|
|
|
|
|
|
|
|
|
|
| ||||||||||||||||
Gross profit (loss) |
| $ | 384 | |
| $ | 419 | |
| $ | 419 | |
| $ | 164 | |
| $ | 220 | |
| $ | 326 | |
| $ | 187 | |
| $ | (95 | ) |
|
|
|
|
|
|
|
|
|
|
|
|
|
|
|
|
| ||||||||||||||||
Common stock data |
|
|
|
|
|
|
|
|
|
|
|
|
|
|
|
| ||||||||||||||||
Net earnings (loss) per share attributable to United States Steel Corporation |
|
|
|
|
|
|
|
|
|
|
|
|
|
|
|
| ||||||||||||||||
- Basic |
| $ | 0.91 | |
| $ | 0.84 | |
| $ | 1.49 | |
| $ | (1.03 | ) |
| $ | (0.61 | ) |
| $ | 0.32 | |
| $ | (0.32 | ) |
| $ | (2.32 | ) |
- Diluted |
| $ | 0.90 | |
| $ | 0.83 | |
| $ | 1.48 | |
| $ | (1.03 | ) |
| $ | (0.61 | ) |
| $ | 0.32 | |
| $ | (0.32 | ) |
| $ | (2.32 | ) |
Dividends paid per share |
| $ | 0.05 | |
| $ | 0.05 | |
| $ | 0.05 | |
| $ | 0.05 | |
| $ | 0.05 | |
| $ | 0.05 | |
| $ | 0.05 | |
| $ | 0.05 | |
Price range of common stock |
|
|
|
|
|
|
|
|
|
|
|
|
|
|
|
| ||||||||||||||||
- Low |
| $ | 24.93 | |
| $ | 21.37 | |
| $ | 19.09 | |
| $ | 31.09 | |
| $ | 16.17 | |
| $ | 15.72 | |
| $ | 12.77 | |
| $ | 6.15 | |
- High |
| $ | 35.74 | |
| $ | 27.63 | |
| $ | 34.50 | |
| $ | 41.31 | |
| $ | 39.14 | |
| $ | 27.64 | |
| $ | 20.55 | |
| $ | 17.04 | |
F-57
Table of Contents
SUPPLEMENTARY INFORMATION ON MINERAL RESERVES OTHER THAN OIL AND GAS
(Unaudited)
Mineral Reserves
U. S. Steel operates two surface iron ore mining complexes in Minnesota consisting of the Minntac Mine and Pellet Plant and the Keetac Mine and Pellet Plant. As of December 31, 2017 U. S. Steel owns an interest in the iron ore mining assets of Hibbing Taconite Company.
The following table provides a summary of our reserves and minerals production by mining complex:
|
| Proven and Probable Reserves |
| Production | ||||||||||||||
(Millions of short tons) |
| Owned |
| Leased |
| Total |
| 2017 |
| 2016 |
| 2015 | ||||||
Iron ore pellets: |
|
|
|
|
|
|
|
|
|
|
|
| ||||||
Minntac Mine and Pellet Plant |
| 104 | |
| 376 | |
| 480 | |
| 16.0 | |
| 15.0 | |
| 13.6 | |
Keetac Mine and Pellet Plant |
| 19 | |
| 361 | |
| 380 | |
| 5.1 | |
| - | |
| 1.9 | |
Tilden Mining Company, L.C. (1)( 2) |
| - | |
| - | |
| - | |
| 0.8 | |
| 1.3 | |
| 0.6 | |
Hibbing Taconite Company (1) |
| - | |
| 8 | |
| 8 | |
| 1.3 | |
| 1.3 | |
| 1.3 | |
Total |
| 123 | |
| 745 | |
| 868 | |
| 23.2 | |
| 17.6 | |
| 17.4 | |
(1) | Represents U. S. Steel's proportionate share of proven and probable reserves and production as these investments are unconsolidated equity affiliates. |
(2) | On September 29, 2017, a subsidiary of U. S. Steel completed the sale of its 15% ownership interest in Tilden Mining Company L.C. |
Iron Ore Reserves
Reserves are defined by SEC Industry Standard Guide 7 as that part of a mineral deposit that could be economically and legally extracted and produced at the time of the reserve determination. The estimate of proven and probable reserves is of recoverable tons. Recoverable tons mean the tons of product that can be used internally or delivered to a customer after considering mining and beneficiation or preparation losses. Neither inferred reserves nor resources that exist in addition to proven and probable reserves were included in these figures. At December 31, 2017 , all 868 million tons of proven and probable reserves are assigned, which means that they have been committed by U. S. Steel to its operating mines and are of blast furnace pellet grade.
U. S. Steel estimates its iron ore reserves using exploration drill holes, physical inspections, sampling, laboratory testing, 3-D computer models, economic pit analysis and fully-developed pit designs for its operating mines. These estimates are reviewed and reassessed from time to time. The most recent such review for our Keetac operating mine was completed in 2013 and resulted in an increase in the proven and probable reserves primarily due to additional exploration drilling and development of an economic computerized mine plan. The most recent review for our Minntac operating mine was conducted in 2005 and led U. S. Steel to reduce its determination of proven and probable reserves mainly due to excluding areas where sampling and measurement did not meet its new 600-foot drill spacing standard, based on updated geostatistical studies. Estimates for our share of unconsolidated equity affiliates are based upon information supplied by the joint ventures. The most recent such reviews for Hibbing Taconite Company was conducted in 2015.
F-58
Table of Contents
FIVE-YEAR OPERATING SUMMARY (Unaudited)
(Thousands of tons, unless otherwise noted) |
| 2017 |
| 2016 |
| 2015 |
| 2014 |
| 2013 | ||||||||||
Raw Steel Production |
|
|
|
|
|
|
|
|
|
| ||||||||||
Gary, IN |
| 5,755 | |
| 5,608 | |
| 5,172 | |
| 5,936 | |
| 6,396 | | |||||
Great Lakes, MI |
| 2,592 | |
| 2,543 | |
| 2,257 | |
| 2,442 | |
| 2,883 | | |||||
Mon Valley, PA |
| 2,473 | |
| 2,555 | |
| 2,266 | |
| 2,563 | |
| 2,918 | | |||||
Granite City, IL |
| - | |
| - | |
| 1,162 | |
| 2,285 | |
| 2,538 | | |||||
Fairfield, AL (a) |
| - | |
| - | |
| 480 | |
| 1,992 | |
| 1,943 | | |||||
Lake Erie, Ontario, Canada (a) |
| - | |
| - | |
| - | |
| 1,744 | |
| 1,189 | | |||||
Total Flat-Rolled facilities |
| 10,820 | |
| 10,706 | |
| 11,337 | |
| 16,962 | |
| 17,867 | | |||||
U. S. Steel Košice |
| 5,091 | |
| 4,967 | |
| 4,669 | |
| 4,788 | |
| 4,598 | | |||||
Total |
| 15,911 | |
| 15,673 | |
| 16,006 | |
| 21,750 | |
| 22,465 | | |||||
Raw Steel Capability |
|
|
|
|
|
|
|
|
|
| ||||||||||
Flat-Rolled (a) |
| 17,000 | |
| 17,000 | |
| 17,000 | |
| 19,400 | |
| 24,300 | | |||||
USSE |
| 5,000 | |
| 5,000 | |
| 5,000 | |
| 5,000 | |
| 5,000 | | |||||
Total |
| 22,000 | |
| 22,000 | |
| 22,000 | |
| 24,400 | |
| 29,300 | | |||||
Production as % of total capability: |
|
|
|
|
|
|
|
|
|
| ||||||||||
Flat-Rolled |
| 64 | % |
| 63 | % |
| 60 | % |
| 80 | % |
| 74 | % | |||||
USSE |
| 102 | % |
| 99 | % |
| 93 | % |
| 96 | % |
| 92 | % | |||||
Coke Production |
|
|
|
|
|
|
|
|
|
| ||||||||||
Flat-Rolled (a) |
| 3,416 | |
| 2,961 | |
| 3,957 | |
| 5,406 | |
| 6,494 | | |||||
USSE |
| 1,497 | |
| 1,545 | |
| 1,600 | |
| 1,539 | |
| 1,508 | | |||||
Total |
| 4,913 | |
| 4,506 | |
| 5,557 | |
| 6,945 | |
| 8,002 | | |||||
Iron Ore Pellet Production (b) |
|
|
|
|
|
|
|
|
|
| ||||||||||
Total |
| 23,246 | |
| 17,635 | |
| 17,422 | |
| 24,959 | |
| 24,151 | | |||||
Steel Shipments by Segment (c) |
|
|
|
|
|
|
|
|
|
| ||||||||||
Flat-Rolled (a) |
| 9,887 | |
| 10,094 | |
| 10,595 | |
| 13,908 | |
| 14,644 | | |||||
USSE |
| 4,585 | |
| 4,496 | |
| 4,357 | |
| 4,179 | |
| 4,000 | | |||||
Tubular |
| 688 | |
| 400 | |
| 593 | |
| 1,744 | |
| 1,757 | | |||||
Total steel shipments |
| 15,160 | |
| 14,990 | |
| 15,545 | |
| 19,831 | |
| 20,401 | | |||||
Average Realized Price (dollars per net ton) |
|
|
|
|
|
|
|
|
|
| ||||||||||
Flat-Rolled |
| $ | 726 | |
| $ | 666 | |
| $ | 695 | |
| $ | 772 | |
| $ | 735 | |
USSE |
| $ | 622 | |
| $ | 483 | |
| $ | 516 | |
| $ | 667 | |
| $ | 706 | |
Tubular |
| $ | 1,253 | |
| $ | 1,071 | |
| $ | 1,464 | |
| $ | 1,538 | |
| $ | 1,530 | |
(a) | As a result of the CCAA filing and deconsolidation of USSC on September 16, 2014, the year ended December 31, 2014 raw steel and coke production amounts and shipments for Flat-Rolled do not include USSC after September 15, 2014 and Flat-Rolled's annual raw steel capability was reduced to 19.4 million tons. As a result of the permanent shutdown of the blast furnace and associated steelmaking operations, along with most of the flat-rolled finishing operations at Fairfield Works late in the third quarter of 2015, Flat-Rolled's annual raw steel capability was reduced to 17.0 million tons. In 2015, coke operations at Gary Works and Granite City Works were permanently shutdown. |
(b) | Includes our share of production from Hibbing and Tilden. |
(c) | Does not include shipments by joint ventures and other equity investees of U. S. Steel, but instead reflects the shipments of substrate materials, primarily hot-rolled and cold-rolled sheets, to those entities. |
F-59
Table of Contents
FIVE-YEAR OPERATING SUMMARY (Unaudited) (Continued)
(Thousands of net tons) |
| 2017 |
| 2016 |
| 2015 |
| 2014 |
| 2013 | |||||
Steel Shipments by Market - North American Facilities (a) (b) |
|
|
|
|
|
|
|
|
|
| |||||
Steel service centers |
| 1,587 | |
| 1,765 | |
| 1,702 | |
| 2,578 | |
| 2,721 | |
Further conversion: |
|
|
|
|
|
|
|
|
|
| |||||
Trade customers |
| 2,951 | |
| 2,650 | |
| 3,039 | |
| 4,013 | |
| 4,409 | |
Joint ventures |
| 1,513 | |
| 1,423 | |
| 1,254 | |
| 1,519 | |
| 1,664 | |
Transportation (including automotive) |
| 1,453 | |
| 1,725 | |
| 2,011 | |
| 2,445 | |
| 2,480 | |
Construction and construction products |
| 706 | |
| 765 | |
| 704 | |
| 897 | |
| 905 | |
Containers |
| 597 | |
| 600 | |
| 692 | |
| 1,287 | |
| 1,259 | |
Appliances & electrical equipment |
| 406 | |
| 420 | |
| 429 | |
| 616 | |
| 666 | |
Oil, gas and petrochemicals |
| 631 | |
| 340 | |
| 513 | |
| 1,545 | |
| 1,540 | |
Export from the United States |
| 468 | |
| 456 | |
| 259 | |
| 340 | |
| 450 | |
All other |
| 263 | |
| 350 | |
| 585 | |
| 412 | |
| 307 | |
Total |
| 10,575 | |
| 10,494 | |
| 11,188 | |
| 15,652 | |
| 16,401 | |
Steel Shipments by Market - USSE |
|
|
|
|
|
|
|
|
|
| |||||
Steel service centers |
| 761 | |
| 801 | |
| 718 | |
| 682 | |
| 560 | |
Further conversion: |
|
|
|
|
|
|
|
|
|
| |||||
Trade customers |
| 284 | |
| 274 | |
| 304 | |
| 299 | |
| 286 | |
Transportation (including automotive) |
| 708 | |
| 660 | |
| 705 | |
| 674 | |
| 709 | |
Construction and construction products |
| 1,831 | |
| 1,811 | |
| 1,703 | |
| 1,584 | |
| 1,501 | |
Containers |
| 438 | |
| 436 | |
| 424 | |
| 403 | |
| 393 | |
Appliances & electrical equipment |
| 247 | |
| 236 | |
| 236 | |
| 267 | |
| 275 | |
Oil, gas and petrochemicals |
| 10 | |
| 4 | |
| - | |
| 3 | |
| 15 | |
All other |
| 306 | |
| 274 | |
| 267 | |
| 267 | |
| 261 | |
Total |
| 4,585 | |
| 4,496 | |
| 4,357 | |
| 4,179 | |
| 4,000 | |
(a) | Does not include shipments by joint ventures and other equity investees of U. S. Steel, but instead reflects the shipments of substrate materials, primarily hot-rolled and cold-rolled sheets, to those entities. |
(b) | As a result of the CCAA filing, shipments do not include USSC after September 15, 2014. |
F-60
Table of Contents
FIVE-YEAR FINANCIAL SUMMARY (Unaudited)
(Dollars in millions, except per share amounts) |
| 2017 |
| 2016 |
| 2015 |
| 2014 |
| 2013 | ||||||||||
Net sales by segment: |
|
|
|
|
|
|
|
|
|
| ||||||||||
Flat-Rolled (a) |
| $ | 8,491 | |
| $ | 7,532 | |
| $ | 8,561 | |
| $ | 12,895 | |
| $ | 12,830 | |
USSE |
| 2,974 | |
| 2,246 | |
| 2,326 | |
| 2,936 | |
| 2,944 | | |||||
Tubular |
| 945 | |
| 451 | |
| 898 | |
| 2,774 | |
| 2,777 | | |||||
Total reportable segments |
| $ | 12,410 | |
| $ | 10,229 | |
| $ | 11,785 | |
| $ | 18,605 | |
| $ | 18,551 | |
Other Businesses |
| 179 | |
| 169 | |
| 165 | |
| 269 | |
| 273 | | |||||
Intersegment sales |
| (339 | ) |
| (137 | ) |
| (376 | ) |
| (1,367 | ) |
| (1,400 | ) | |||||
Total |
| $ | 12,250 | |
| $ | 10,261 | |
| $ | 11,574 | |
| $ | 17,507 | |
| $ | 17,424 | |
Segment earnings (loss) before interest and income taxes: |
|
|
|
|
|
|
|
|
|
| ||||||||||
Flat-Rolled (a) |
| $ | 380 | |
| $ | (3 | ) |
| $ | (237 | ) |
| $ | 709 | |
| $ | 105 | |
USSE |
| 327 | |
| 185 | |
| 81 | |
| 133 | |
| 28 | | |||||
Tubular |
| (99 | ) |
| (304 | ) |
| (179 | ) |
| 261 | |
| 190 | | |||||
Total reportable segments |
| $ | 608 | |
| $ | (122 | ) |
| $ | (335 | ) |
| $ | 1,103 | |
| $ | 323 | |
Other Businesses |
| 44 | |
| 63 | |
| 33 | |
| 82 | |
| 77 | | |||||
Items not allocated to segments (b) |
| (44 | ) |
| (106 | ) |
| (900 | ) |
| (772 | ) |
| (2,300 | ) | |||||
Total earnings (loss) before interest and income taxes |
| $ | 608 | |
| $ | (165 | ) |
| $ | (1,202 | ) |
| $ | 413 | |
| $ | (1,900 | ) |
Net interest and other financial costs |
| 307 | |
| 251 | |
| 257 | |
| 243 | |
| 332 | | |||||
Income tax (benefit) provision |
| (86 | ) |
| 24 | |
| 183 | |
| 68 | |
| (587 | ) | |||||
Net earnings (loss) attributable to United States Steel Corporation |
| $ | 387 | |
| $ | (440 | ) |
| $ | (1,642 | ) |
| $ | 102 | |
| $ | (1,645 | ) |
Per common share: |
|
|
|
|
|
|
|
|
|
| ||||||||||
- Basic |
| $ | 2.21 | |
| $ | (2.81 | ) |
| $ | (11.24 | ) |
| $ | 0.71 | |
| $ | (11.37 | ) |
- Diluted |
| $ | 2.19 | |
| $ | (2.81 | ) |
| $ | (11.24 | ) |
| $ | 0.69 | |
| $ | (11.37 | ) |
(a) | Excludes the results of USSC beginning September 16, 2014 as a result of the CCAA filing. |
(b) | See Note 4 to the Consolidated Financial Statements. |
F-61
Table of Contents
FIVE-YEAR FINANCIAL SUMMARY (Unaudited) (Continued)
|
| 2017 |
| 2016 |
| 2015 |
| 2014 |
| 2013 |
| ||||||||||
Balance Sheet Position at Year-End (dollars in millions) (a) |
|
|
|
|
|
|
|
|
|
|
| ||||||||||
Current assets |
| $ | 4,755 | |
| $ | 4,356 | |
| $ | 3,917 | |
| $ | 5,829 | |
| $ | 5,502 | |
|
Net property, plant & equipment |
| 4,280 | |
| 3,979 | |
| 4,411 | |
| 4,574 | |
| 5,922 | |
| |||||
Total assets |
| 9,862 | |
| 9,160 | |
| 9,167 | | (b) | 11,975 | | (b)(c) | 12,679 | | (b)(c) | |||||
Short-term debt and current maturities of long-term debt |
| 3 | |
| 50 | |
| 45 | |
| 378 | |
| 323 | |
| |||||
Other current liabilities |
| 2,718 | |
| 2,281 | |
| 2,103 | |
| 3,191 | |
| 2,922 | |
| |||||
Long-term debt |
| 2,700 | |
| 2,981 | |
| 3,093 | | (b) | 3,082 | | (b) | 3,569 | | (b) | |||||
Employee benefits |
| 759 | |
| 1,216 | |
| 1,101 | |
| 1,117 | |
| 2,064 | |
| |||||
Total United States Steel Corporation stockholders' equity |
| 3,320 | |
| 2,274 | |
| 2,436 | |
| 3,799 | |
| 3,375 | |
| |||||
Cash Flow Data (dollars in millions) |
|
|
|
|
|
|
|
|
|
|
| ||||||||||
Net cash provided by operating activities (a) (d) |
| $ | 802 | |
| $ | 731 | | (e) | $ | 360 | | (e) | $ | 1,558 | | (e) | $ | 408 | | (e) |
Capital expenditures (a) (d) |
| 505 | |
| 306 | |
| 500 | |
| 480 | |
| 468 | |
| |||||
Dividends paid |
| 35 | |
| 31 | |
| 29 | |
| 29 | |
| 29 | |
| |||||
Employee Data |
|
|
|
|
|
|
|
|
|
|
| ||||||||||
Total employment costs (dollars in millions) (a) |
| $ | 2,477 | | | $ | 2,342 | | | $ | 2,780 | |
| $ | 3,408 | |
| $ | 3,611 | |
|
Average North America employment costs (dollars per hour) (a) |
| $ | 62.32 | |
| $ | 61.75 | |
| $ | 65.64 | |
| $ | 57.55 | |
| $ | 55.06 | |
|
Average number of North America employees (a) |
| 15,326 | |
| 15,048 | |
| 19,391 | |
| 22,408 | |
| 25,621 | |
| |||||
Average number of USSE employees |
| 11,948 | | | 11,927 | | | 12,052 | |
| 12,272 | |
| 12,470 | |
| |||||
Number of pensioners at year-end |
| 45,837 | |
| 47,765 | |
| 49,802 | |
| 52,483 | |
| 68,221 | |
| |||||
Stockholder Data at Year-End |
|
|
|
|
|
|
|
|
|
|
| ||||||||||
Common shares outstanding, net of treasury shares (millions) |
| 175.2 | |
| 173.8 | |
| 146.3 | |
| 145.7 | |
| 144.7 | |
| |||||
Registered shareholders (thousands) |
| 13.8 | |
| 14.8 | |
| 15.4 | |
| 16.1 | |
| 16.8 | |
| |||||
Market price of common stock |
| $ | 35.19 | |
| $ | 33.01 | |
| $ | 7.98 | |
| $ | 26.74 | |
| $ | 29.50 | |
|
(a) | Excludes the results of USSC beginning September 16, 2014 as a result of the CCAA filing. |
(b) | 2015, 2014 and 2013 amounts have been adjusted to retroactively adopt Accounting Standards Update 2015-03, Interest-Imputation of Interest (Subtopic 835-30) - Simplifying the Presentation of Debt Issuance Costs , which requires that debt issuance costs related to a recognized debt liability be presented in the balance sheet as a direct deduction from the carrying amount of the debt liability. |
(c) | 2014 and 2013 amounts have been adjusted to retroactively adopt Accounting Standards Update 2015-17, Balance Sheet Classification of Deferred Taxes , which requires that all deferred tax assets and liabilities, along with any related valuation allowance, be classified as noncurrent on the balance sheet. |
(d) | 2014 and 2013 amounts have been revised to correct a prior period error that resulted in an increase in capital expenditures of $61 million, and a decrease in capital expenditures of $9 million, respectively, with an offsetting change to net cash provided by operating activities. |
(e) | 2016, 2015, 2014 and 2013 amounts have been adjusted to retroactively adopt Accounting Standards Update 2016-09, Compensation - Stock Compensation , which requires that cash taxes paid by the Company when directly withholding shares for tax withholding purposes be classified as a cash flow from financing activity. |
F-62
Table of Contents
Item 9. CHANGES IN AND DISAGREEMENTS WITH ACCOUNTANTS ON ACCOUNTING AND FINANCIAL DISCLOSURE
None.
Item 9A. CONTROLS AND PROCEDURES
Conclusions Regarding the Effectiveness of Disclosure Controls and Procedures
Under the supervision and with the participation of U. S. Steel's management, including the chief executive officer and chief financial officer, U. S. Steel conducted an evaluation of our disclosure controls and procedures, as such term is defined under Rule 13a-15(e) promulgated under the Securities Exchange Act of 1934, as amended (the Exchange Act). Based on this evaluation, U. S. Steel's chief executive officer and chief financial officer concluded that U. S. Steel's disclosure controls and procedures were effective as of the end of the period covered by this annual report.
Management's Report on Internal Control Over Financial Reporting
See "Item 8. Financial Statements and Supplementary Data – Management's Reports to Stockholders – Internal Control Over Financial Reporting."
Attestation Report of Independent Registered Public Accounting Firm
See "Item 8. Financial Statements and Supplementary Data – Report of Independent Registered Public Accounting Firm."
Changes in Internal Control Over Financial Reporting
There have not been any changes in U. S. Steel's internal control over financial reporting that occurred during the fourth quarter of 2017 which have materially affected, or are reasonably likely to materially affect, U. S. Steel's internal control over financial reporting.
Item 9B. OTHER INFORMATION
None.
95
Table of Contents
PART III
Item 10. DIRECTORS, EXECUTIVE OFFICERS AND CORPORATE GOVERNANCE
Information concerning the directors of U. S. Steel required by this item is incorporated and made part hereof by reference to the material appearing under the heading "Election of Directors" in U. S. Steel's Proxy Statement for the 2018 Annual Meeting of Stockholders, which will be filed with the Securities and Exchange Commission, pursuant to Regulation 14A, no later than 120 days after the end of the fiscal year. Information concerning the Audit Committee and its financial expert required by this item is incorporated and made part hereof by reference to the material appearing under the heading "Corporate Governance - Board Committees – Audit Committee" in U. S. Steel's Proxy Statement for the 2018 Annual Meeting of Stockholders. Information regarding the Nominating Committee required by this item is incorporated and made part hereof by reference to the material appearing under the heading "Corporate Governance - Board Committees – Corporate Governance & Public Policy Committee" in U. S. Steel's Proxy Statement for the 2018 Annual Meeting of Stockholders. Information regarding the ability of stockholders to communicate with the Board of Directors is incorporated and made part hereof by reference to the material appearing under the heading "Communications from Stockholders and Interested Parties" in U. S. Steel's Proxy Statement for the 2018 Annual Meeting of Stockholders. Information regarding compliance with Section 16(a) of the Exchange Act required by this item is incorporated and made part hereof by reference to the material appearing under the heading "Section 16(a) Beneficial Ownership Reporting Compliance" in U. S. Steel's Proxy Statement for the 2018 Annual Meeting of Stockholders. Information concerning the executive officers of U. S. Steel is contained in Part I of this Form 10-K under the caption "Executive Officers of the Registrant."
U. S. Steel has adopted a Code of Ethical Business Conduct that applies to all of our directors and officers, including our principal executive officer, principal financial officer, principal accounting officer or controller, or persons performing similar functions. U. S. Steel will provide a copy of this code free of charge upon request. To obtain a copy, contact the Office of the Corporate Secretary, United States Steel Corporation, 600 Grant Street, Pittsburgh, Pennsylvania 15219-2800 (telephone: 412-433-1121). The Code of Ethical Business Conduct is also available through the Company's website at www.ussteel.com . U. S. Steel does not intend to incorporate the contents of our website into this Annual Report on Form 10-K.
Item 11. EXECUTIVE COMPENSATION
Information required by this item is incorporated and made part hereof by reference to the material appearing under the heading "Compensation & Organization Committee Report" in U. S. Steel's Proxy Statement for the 2018 Annual Meeting of Stockholders.
96
Table of Contents
Item 12. SECURITY OWNERSHIP OF CERTAIN BENEFICIAL OWNERS AND MANAGEMENT AND RELATED STOCKHOLDER MATTERS
Equity Compensation Plan Information
Plan Category |
| (1) Number of securities |
| (2) Weighted-average |
| (3) Number of securities |
Equity compensation plans approved by security holders (a) |
| 7,250,994 |
| $28.92 |
| 12,579,984 (b) |
Equity compensation plans not approved by security holders (c) |
| 5,055 |
| (one for one) |
| - |
Total |
| 7,256,049 |
| - |
| 12,579,984 |
(a) | The numbers in columns (1) and (2) of this row contemplate all shares that could potentially be issued as a result of outstanding grants under the 2005 Stock Incentive Plan and the 2016 Omnibus Incentive Compensation Plan as of December 31, 2017 . (For more information, see Note 14 to the Consolidated Financial Statements. Column (1) includes (i) 418,246 shares of common stock that could be issued for the Common Stock Units outstanding under the Deferred Compensation Program for Non-Employee Directors and (ii) 1,031,062 shares that could be issued for the 515,531 performance awards outstanding under the Long-Term Incentive Compensation Program (a program under the 2005 Stock Incentive Plan and the 2016 Omnibus Incentive Compensation Plan). The calculation in column (2) does not include the Common Stock Units since the weighted average exercise price for Common Stock Units is one for one; that is, one share of common stock will be given in exchange for each unit of such phantom stock accumulated through the date of the director's retirement. Also, the calculation in column (2) does not include the performance awards since the weighted average exercise price for performance awards can range from zero for one to two for one; that is, performance awards may result in up to 1,031,062 shares of common stock being issued (two for one), or some lesser number of shares (including zero shares of common stock issued), depending upon the Corporation's common stock performance versus that of a peer group of companies. |
(b) | Represents shares available under the 2005 Stock Incentive Plan and 2016 Omnibus Incentive Compensation Plan. |
(c) | At December 31, 2017 , U. S. Steel had no securities remaining for future issuance under equity compensation plans that had not been approved by security holders. Column (1) represents Common Stock Units that were issued pursuant to the Deferred Compensation Plan for Non-Employee Directors prior to its being amended to make it a program under the 2005 Stock Incentive Plan and 2016 Omnibus Plan. The weighted average exercise price for Common Stock Units in column (2) is one for one; that is, one share of common stock will be given in exchange for each unit of phantom stock upon the director's retirement from the Board of Directors. All future grants under this amended plan/program will count as shares issued under to the 2016 Omnibus Incentive Compensation Plan, a shareholder approved plan. |
Other information required by this item is incorporated and made part hereof by reference to the material appearing under the headings "Stock Ownership of Directors and Executive Officers" and "Stock Ownership of Certain Beneficial Owners" in U. S. Steel's Proxy Statement for the 2018 Annual Meeting of Stockholders.
Item 13. CERTAIN RELATIONSHIPS AND RELATED TRANSACTIONS, AND DIRECTOR INDEPENDENCE
Information required by this item is incorporated and made part hereof by reference to the material appearing under the headings "Policy with Respect to Related Person Transactions" and "Corporate Governance – Independence" in U. S. Steel's Proxy Statement for the 2018 Annual Meeting of Stockholders.
Item 14. PRINCIPAL ACCOUNTANT FEES AND SERVICES
Information required by this item is incorporated and made part hereof by reference to the material appearing under the heading "Audit Fees" in U. S. Steel's Proxy Statement for the 2018 Annual Meeting of Stockholders.
97
Table of Contents
PART IV
Item 15. EXHIBITS AND FINANCIAL STATEMENT SCHEDULE
A. Documents Filed as Part of the Report
1. Financial Statements
Financial Statements filed as part of this report are included in "Item 8 – Financial Statements and Supplementary Data" beginning on page F-1.
2. Financial Statement Schedules and Supplementary Data
"Schedule II – Valuation and Qualifying Accounts and Reserves" for years ended December 31, 2017, 2016, and 2015 is included on page 105. All other schedules are omitted because they are not applicable or the required information is contained in the applicable financial statements or notes thereto.
B. Exhibits
Exhibit No.
2. Plan of acquisition, reorganization, arrangement, liquidation or succession
(a) | Master Share Purchase Agreement by and between U. S. Steel Serbia B.V. and U. S. Steel Košice s.r.o., wholly owned subsidiaries of U. S. Steel, and the Republic of Serbia. |
| Incorporated by reference to Exhibit 2.1 to United States Steel Corporation's Form 8-K filed on February 6, 2012, Commission File Number 1-16811. |
3. Articles of Incorporation and By-Laws
(a) | United States Steel Corporation Restated Certificate of Incorporation dated September 30, 2003. |
| Incorporated by reference to Exhibit 3.1 to United States Steel Corporation's Form 10-Q for the quarter ended September 30, 2003, Commission File Number 1-16811. |
|
|
| |
(b) | Certificate of Amendment to Restated Certificate of Incorporation of United States Steel Corporation dated as of April 30, 2014. |
| Incorporated by reference to Exhibit 3.B to United States Steel Corporation's Form 10-K for the year ended December 31, 2015, Commission File Number 1-16811. |
|
|
|
|
(c) | Amended and Restated By-Laws of United States Steel Corporation dated as of November 1, 2016. |
| Incorporated by reference to Exhibit 3.1 to United States Steel Corporation's Form 8-K filed on November 2, 2016, Commission File Number 1-16811. |
|
|
|
|
(d) | Certificate of Amendment to Restated Certificate of Incorporation of United States Steel Corporation, dated April 21, 2016 |
| Incorporated by reference to Exhibit 3.1 to United States Steel Corporation's Form 10-Q for the quarter ended June 30, 2016, Commission File Number 1-16811. |
|
|
|
|
(e) | Amended and Restated Certificate of Incorporation of United States Steel Corporation, dated April 25, 2017 |
| Incorporated by reference to Exhibit 3.1 to United States Steel Corporation's Form 8-K filed on April 28, 2017, Commission File Number 1-16811. |
98
Table of Contents
(a) | Indenture dated as of May 21, 2007 between United States Steel Corporation and The Bank of New York Mellon, formerly known as The Bank of New York. |
| Incorporated by reference to Exhibit 4.1 to United States Steel Corporation's Form 8-K filed on May 22, 2007, Commission File Number 1-16811. |
|
|
|
|
(b) | First Supplemental Indenture dated as of May 21, 2007, between United States Steel Corporation and The Bank of New York Mellon, formerly known as The Bank of New York, regarding 5.65% Senior Notes due June 1, 2013, 6.05% Senior Notes due June 1, 2017 and 6.65% Senior Notes due June 1, 2037. |
| Incorporated by reference to Exhibit 4.2 to United States Steel Corporation's Form 8-K filed on May 22, 2007, Commission File Number 1-16811. |
|
|
| |
(c) | Second Supplemental Indenture dated as of December 10, 2007, between United States Steel Corporation and The Bank of New York Mellon, formerly known as The Bank of New York, regarding 7.00% Senior Notes due February 1, 2018. |
| Incorporated by reference to Exhibit 4.1 to United States Steel Corporation's Form 8-K filed on December 10, 2007, Commission File Number 1-16811. |
|
|
|
|
(d) | Fourth Supplemental Indenture dated as of March 19, 2010, between United States Steel Corporation and The Bank of New York Mellon, formerly known as The Bank of New York, regarding 7.375% Senior Notes due April 1, 2020. |
| Incorporated by reference to Exhibit 4.1 to United States Steel Corporation's Form 8-K filed on March 23, 2010, Commission File Number 1-16811. |
|
|
| |
(e) | Fifth Supplemental Indenture dated as of March 15, 2012, between United States Steel Corporation and The Bank of New York Mellon, formerly known as The Bank of New York, regarding 7.50% Senior Notes due March 15, 2022. |
| Incorporated by reference to Exhibit 4.1 to United States Steel Corporation's Form 8-K filed on March 16, 2012, Commission File Number 1-16811. |
|
|
| |
(f) | Sixth Supplemental Indenture dated as of March 26, 2013, between United States Steel Corporation and The Bank of New York Mellon, formerly known as The Bank of New York, regarding 6.875% Senior Notes due April 1, 2021. |
| Incorporated by reference to Exhibit 4.1 to United States Steel Corporation's Form 8-K filed on March 27, 2013, Commission File Number 1-16811. |
|
|
|
|
(g) | United States Steel Corporation Certificate of Elimination filed with the Secretary of State of the State of Delaware on December 5, 2007. |
| Incorporated by reference to Exhibit 3.1 to United States Steel Corporation's Form 8-K filed on December 6, 2007, Commission File Number 1-16811. |
|
|
|
|
(h) | Indenture, dated as of May 10, 2016, by and among United States Steel Corporation, the guarantor named on the signature page thereto and U.S. Bank National Association, as trustee and notes collateral agent. |
| Incorporated by reference to Exhibit 4.1 to United States Steel Corporation's Form 8-K filed on May 10, 2016, Commission File Number 1-16811. |
|
|
|
|
(i) | Eighth Supplemental Indenture, dated August 4, 2017, by and among United States Steel Corporation and the Bank of New York Mellon as trustee. |
| Incorporated by reference to Exhibit 4.1 to United States Steel Corporation's Form 8-K filed on August 4, 2017, Commission File Number 1-16811. |
Certain long-term debt instruments are omitted pursuant to Item 601(b)(4)(iii) of Regulation S-K. U. S. Steel agrees to furnish to the Commission on request a copy of any instrument defining the rights of holders of long-term debt of U. S. Steel and of any subsidiary for which consolidated or unconsolidated financial statements are required to be filed.
99
Table of Contents
10. Material Contracts
(a) | United States Steel Corporation Supplemental Retirement Account Program. |
| Incorporated by reference to Exhibit 10.1 to United States Steel Corporation's Form 10-Q for the quarter ended September 30, 2015, Commission File Number 1-16811. |
|
|
|
|
(b) | United States Steel Corporation Executive Management Supplemental Pension Program. |
| Incorporated by reference to Exhibit 10.2 to United States Steel Corporation's Form 8-K filed on August 21, 2015, Commission File Number 1-16811. |
|
|
| |
(c) | United States Steel Corporation Supplemental Thrift Program. |
| Incorporated by reference to Exhibit 10.7 to United States Steel Corporation's Form 10-Q for the quarter ended September 30, 2013, Commission File Number 1-16811. |
|
|
| |
(d) | United States Steel Corporation Deferred Compensation Program for Non-Employee Directors, a program under the 2005 Stock Incentive Plan. |
| Incorporated by reference to Exhibit 10(d) to United States Steel Corporation's Form 10-K for the year ended December 31, 2011, Commission File Number 1-16811. |
|
|
| |
(e) | Form of Offer Letter to Mario Longhi. |
| Incorporated by reference to Exhibit 10.1 to United States Steel Corporation's Form 8-K filed on July 2, 2012, Commission File Number 1-16811. |
|
|
| |
(f) | Exhibit A to Offer Letter to Mario Longhi – Supplemental Account as Amended and Restated (effective November 1, 2013, the Supplemental Account was merged into the Supplemental Retirement Account Program filed as Exhibit 10(b)). |
| Incorporated by reference to Exhibit 10.10 to United States Steel Corporation's Form 10-Q for the quarter ended September 30, 2013, Commission File Number 1-16811. |
|
|
| |
(g) | Form of Non-Compete Agreement attached to Offer Letter to Mario Longhi. |
| Incorporated by reference to Exhibit 10.4 to United States Steel Corporation's Form 8-K filed on July 2, 2012, Commission File Number 1-16811. |
|
|
|
|
(h) | Form of Offer Letter to David B. Burritt. |
| Incorporated by reference to Exhibit 10.2 to United States Steel Corporation's Form 8-K filed on August 20, 2013, Commission File Number 1-16811. |
|
|
| |
(i) | Tax Sharing Agreement between USX Corporation (renamed Marathon Oil Corporation) and United States Steel Corporation. |
| Incorporated by reference to Exhibit 99.3 to United States Steel Corporation's Form 8-K filed on January 3, 2002, Commission File Number 1-16811. |
|
|
| |
(j) | Financial Matters Agreement between USX Corporation (renamed Marathon Oil Corporation) and United States Steel Corporation. |
| Incorporated by reference to Exhibit 99.5 to United States Steel Corporation's Form 8-K filed on January 3, 2002, Commission File Number 1-16811. |
|
|
|
|
(k) | Third Amended and Restated Credit Agreement dated as of July 27, 2015, among United States Steel Corporation, the Lenders party thereto, the LC Issuing Banks party thereto and JPMorgan Chase Bank, National Association as Administrative Agent and Collateral Agent. |
| Incorporated by reference to Exhibit 10.1 to United States Steel Corporation's Form 10-Q for the quarter ended June 30, 2015, Commission File Number 1-16811. |
|
|
|
|
(l) | Amendment No. 1 to Third Amended and Restated Credit Agreement, dated as of February 24, 2016. |
| Incorporated by reference to Exhibit 10.1 to United States Steel Corporation's Form 8-K filed on February 24, 2016, Commission File Number 1-16811. |
|
|
|
|
100
Table of Contents
(m) | Amended and Restated Security Agreement dated as of July 27, 2015, between United States Steel Corporation and JPMorgan Chase Bank, National Association as Collateral Agent. |
| Incorporated by reference to Exhibit 10.1 to United States Steel Corporation's Form 10-Q for the quarter ended June 30, 2015, Commission File Number 1-16811. |
|
|
|
|
(n) | EUR 200,000,000 multicurrency revolving credit facility agreement dated February 22. 2016, among U. S. Steel Košice, s.r.o., and ING Bank N.V., Commerzbank Aktiengesellschaft, Slovenská sporiteĺňa, a.s., Komerční banka, a.s. and Citibank Europe plc. |
| Incorporated by reference to Exhibit 10.1 to United States Steel Corporation's Form 8-K filed on February 24, 2016, Commission File Number 1-16811. |
|
|
|
|
(o) | Summary of non-employee director fee arrangements. |
| Filed herewith as Exhibit 10.3. |
|
|
| |
(p) | United States Steel Corporation Non Tax-Qualified Pension Plan. |
| Incorporated by reference to Exhibit 10.1 to United States Steel Corporation's Form 8-K filed on August 21, 2015, Commission File Number 1-16811. |
|
|
| |
(q) | United States Steel Corporation Non Tax-Qualified Retirement Account Program. |
| Incorporated by reference to Exhibit 10(dd) to United States Steel Corporation's Form 10-K for the year ended December 31, 2013, Commission File Number 1-16811. |
|
|
| |
(r) | United States Steel Corporation 2005 Stock Incentive Plan. |
| Incorporated by reference to Appendix B to United States Steel Corporation's Definitive Proxy Statement on Schedule 14A filed on March 11, 2005, Commission File Number 1-16811. |
|
|
|
|
(s) | United States Steel Corporation 2005 Stock Incentive Plan, Amended and Restated, April 27, 2010. |
| Incorporated by reference to Appendix A to United States Steel Corporation's Definitive Proxy Statement on Schedule 14A filed on March 12, 2010, Commission File Number 1-16811. |
|
|
|
|
(t) | United States Steel Corporation 2005 Stock Incentive Plan, Amended and Restated, April 29, 2014. |
| Incorporated by reference to Appendix A to United States Steel Corporation's Definitive Proxy Statement on Schedule 14A filed on March 14, 2014, Commission File Number 1-16811. |
|
|
| |
(u) | Administrative Regulations for the Long-Term Incentive Compensation Program under the United States Steel Corporation 2005 Stock Incentive Plan, Amended and Restated, May 28, 2013. |
| Incorporated by reference to Exhibit 10.1 to United States Steel Corporation's Form 8-K filed on May 30, 2013, Commission File Number 1-16811. |
|
|
| |
(v) | Administrative Regulations for the Long-Term Incentive Compensation Program under the United States Steel Corporation 2005 Stock Incentive Plan, Amended and Restated, February 25, 2014. |
| Incorporated by reference to Exhibit 10.1 to United States Steel Corporation's Form 8-K filed on March 3, 2014, Commission File Number 1-16811. |
|
|
|
|
(w) | Administrative Procedures for the Long-Term Incentive Compensation Program under the United States Steel Corporation 2005 Stock Incentive Plan, as Amended and Restated, and under the United States Steel Corporation 2010 Annual Incentive Compensation Plan, as amended February 24, 2015. |
| Incorporated by reference to Exhibit 10.3 to United States Steel Corporation's Form 10-Q for the quarter ended March 31, 2015, Commission File Number 1-16811. |
|
|
|
|
101
Table of Contents
(x) | Non-Employee Director Stock Program, a program under the 2005 Stock Incentive Plan. |
| Incorporated by reference to Exhibit 10.1 to United States Steel Corporation's Form 8-K filed on May 31, 2005, Commission File Number 1-16811. |
|
|
| |
(y) | Form of stock option grant under the Long-Term Incentive Compensation Program, a program under the 2005 Stock Incentive Plan. |
| Incorporated by reference to Exhibit 10(x) to United States Steel Corporation's Form 10-K for the year ended December 31, 2006, Commission File Number 1-16811. |
|
|
| |
(z) | Form of Performance Award Grant Agreement under the 2005 Stock Incentive Plan. |
| Incorporated by reference to Exhibit 10.3 to United States Steel Corporation's Form 10-Q for the quarter ended March 31, 2011, Commission File Number 1-16811. |
|
|
| |
(aa) | Form of Stock Option Grant Agreement under the 2005 Stock Incentive Plan. |
| Incorporated by reference to Exhibit 10.2 to United States Steel Corporation's Form 10-Q for the quarter ended March 31, 2011, Commission File Number 1-16811. |
|
|
|
|
(bb) | Form of Restricted Stock Unit Retention Grant Agreement under the 2005 Stock Incentive Plan. |
| Incorporated by reference to Exhibit 10.5 to United States Steel Corporation's Form 10-Q for the quarter ended March 31, 2011, Commission File Number 1-16811. |
|
|
| |
(cc) | Form of Restricted Stock Unit Annual Grant Agreement under the 2005 Stock Incentive Plan. |
| Incorporated by reference to Exhibit 10.4 to United States Steel Corporation's Form 10-Q for the quarter ended March 31, 2011, Commission File Number 1-16811. |
|
|
| |
(dd) | Form of Retention Performance Award Grant Agreement. |
| Incorporated by reference to Exhibit 10.5 to United States Steel Corporation's Form 8-K filed on July 2, 2012, Commission File Number 1-16811. |
|
|
| |
(ee) | Form of Non-Qualified Stock Option Grant Agreement. |
| Incorporated by reference to Exhibit 10.1 to United States Steel Corporation's Form 10-Q for the quarter ended March 31, 2015, Commission File Number 1-16811. |
|
|
|
|
(ff) | Form of Incentive Award Agreement, 2010 Annual Incentive Compensation Plan. |
| Incorporated by reference to Exhibit 10.2 to United States Steel Corporation's Form 10-Q for the quarter ended March 31, 2015, Commission File Number 1-16811. |
|
|
|
|
(gg) | United States Steel Corporation 2010 Annual Incentive Compensation Plan. |
| Incorporated by reference to Appendix B to United States Steel Corporation's Definitive Proxy Statement on Schedule 14A filed on March 12, 2010, Commission File Number 1-16811. |
|
|
| |
(hh) | Administrative Regulations for the Executive Management Annual Incentive Compensation Plan under the 2010 Annual Incentive Compensation Plan. |
| Incorporated by reference to Exhibit 10.1 to United States Steel Corporation's Form 8-K filed on January 31, 2014, Commission File Number 1-16811. |
|
|
|
|
(ii) | Administrative Procedures for the Executive Management Annual Incentive Compensation Program under the United States Steel Corporation 2010 Annual Incentive Compensation Plan, as amended January 27, 2015 . |
| Incorporated by reference to Exhibit 10.4 to United States Steel Corporation's Form 10-Q for the quarter ended March 31, 2015, Commission File Number 1-16811. |
|
|
|
|
102
Table of Contents
(jj) | United States Steel Corporation Change in Control Severance Plan effective January 1, 2016. |
| Incorporated by reference to Exhibit 10.1 to United States Steel Corporation's Form 8-K filed on November 6, 2015, Commission File Number 1-16811. |
|
|
|
|
(kk) | Administrative Procedures for the Long-Term Incentive Compensation Program under the United States Steel Corporation 2005 Stock Incentive Plan, as Amended and Restated, and under the United States Steel Corporation Annual Incentive Compensation Plan, as amended February 22, 2016. |
| Incorporated by reference to Exhibit 10(kk) to United States Steel Corporation's Form 10-K for the year ended December 31, 2015, Commission File Number 1-16811. |
|
|
|
|
(ll) | Administrative Procedures for the Executive Management Annual Incentive Compensation Program under the United States Steel Corporation Annual Incentive Compensation Plan, as amended February 22, 2016. |
| Incorporated by reference to Exhibit 10(ll) to United States Steel Corporation's Form 10-K for the year ended December 31, 2015, Commission File Number 1-16811. |
|
|
|
|
(mm) | United States Steel Corporation 2016 Omnibus Incentive Compensation Plan. |
| Incorporated by reference to Exhibit 10.1 to United States Steel Corporation's Form 10-Q for the quarter ended March 31, 2016, Commission File Number 1-16811. |
|
|
|
|
(nn) | United States Steel Corporation 2016 Omnibus Incentive Compensation Plan Restricted Stock Unit Grant Agreement - Retention Grant Form . |
| Incorporated by reference to Exhibit 10.1 to United States Steel Corporation's Form 10-Q for the quarter ended June 30, 2016, Commission File Number 1-16811. |
|
|
|
|
(oo) | United States Steel Corporation 2016 Omnibus Incentive Compensation Plan Restricted Stock Unit Grant Agreement - Annual Grant Form . |
| Incorporated by reference to Exhibit 10.2 to United States Steel Corporation's Form 10-Q for the quarter ended June 30, 2016, Commission File Number 1-16811. |
|
|
|
|
(pp) | United States Steel Corporation 2016 Omnibus Incentive Compensation Plan - Stock Option Grant Form. |
| Incorporated by reference to Exhibit 10.3 to United States Steel Corporation's Form 10-Q for the quarter ended June 30, 2016, Commission File Number 1-16811. |
|
|
|
|
(qq) | Administrative Procedures for the Executive Management Annual Incentive Compensation Program under the United States Steel Corporation Annual Incentive Compensation Plan, as amended November 1, 2016. |
| Incorporated by reference to Exhibit 10.1 to United States Steel Corporation's Form 10-Q for the quarter ended September 30, 2016, Commission File Number 1-16811. |
|
|
|
|
(rr) | United States Steel Corporation Non Tax-Qualified Retirement Account Program, amended effective as of January 1, 2016. |
| Incorporated by reference to Exhibit 10.2 to United States Steel Corporation's Form 10-Q for the quarter ended September 30, 2016, Commission File Number 1-16811. |
|
|
|
|
(ss) | United States Steel Corporation Supplemental Thrift Program, as amended November 1, 2016. |
| Incorporated by reference to Exhibit 10.3 to United States Steel Corporation's Form 10-Q for the quarter ended September 30, 2016, Commission File Number 1-16811. |
|
|
|
|
(tt) | Purchase Agreement, dated May 3, 2016, by and among United States Steel Corporation, the subsidiary guarantor named therein and J.P. Morgan Securities LLC, for itself and on behalf of the several initial purchasers listed in Schedule 1 thereto. |
| Incorporated by reference to Exhibit 10.1 to United States Steel Corporation's Form 8-K filed on May 4, 2016, Commission File Number 1-16811. |
|
|
|
|
(uu) | Collateral Agreement, dated as of May 10, 2016, by and among United States Steel Corporation, certain of its subsidiaries and U.S. Bank National Association, as collateral agent. |
| Incorporated by reference to Exhibit 10.1 to United States Steel Corporation's Form 8-K filed on May 10, 2016, Commission File Number 1-16811. |
103
Table of Contents
|
|
|
|
(vv) | Underwriting Agreement, by and among United States Steel Corporation and J.P. Morgan Securities LLC and Goldman, Sachs & Co., dated August 9, 2016. |
| Incorporated by reference to Exhibit 1.1 to United States Steel Corporation's Form 8-K filed on August 15, 2016, Commission File Number 1-16811. |
|
|
|
|
(ww) | Underwriting Agreement, by and among United States Steel Corporation and Merrill Lynch, Pierce, Fenner & Smith Inc., dated August 1, 2017. |
| Incorporated by reference to Exhibit 10.1 to United States Steel Corporation's Form 8-K filed on August 2, 2017, Commission File Number 1-16811. |
|
|
|
|
(xx) | Offer letter to Kevin Bradley, dated July 21, 2017. |
| Incorporated by reference to Exhibit 10.1 to United States Steel Corporation's Form 10-Q filed on November 1, 2017, Commission File Number 1-16811. |
|
|
|
|
(yy) | Separation Agreement, dated May 8, 2017, between United States Steel Corporation and Mario Longhi. |
| Incorporated by reference to Exhibit 10.1 to United States Steel Corporation's Form 8-K filed on May 10, 2017, Commission File Number 1-16811. |
|
|
|
|
(zz) | First Amendment to United States Steel Corporation 2016 Omnibus Incentive Compensation Plan. |
| Incorporated by reference to Exhibit 10.1 to United States Steel Corporation's Form 10-Q filed on April 26, 2017, Commission File Number 1-16811. |
|
|
10.1. | Confidential Separation Agreement and General Release, dated November 10, 2017, between United States Steel Corporation and Suzanne Rich Folsom |
|
|
10.2. | Letter Agreement dated November 20, 2017 between United States Steel Corporation and Scott Buckiso* |
|
|
12.1. | Computation of Ratio of Earnings to Fixed Charges |
|
|
21. | List of Subsidiaries |
|
|
23. | Consent of PricewaterhouseCoopers LLP |
|
|
24. | Powers of Attorney |
|
|
31.1. | Certification of Chief Executive Officer required by Rules 13a-14(a) or 15d-14(a) of the Securities Exchange Act of 1934, as promulgated by the Securities and Exchange Commission pursuant to Section 302 of the Sarbanes-Oxley Act of 2002 |
|
|
31.2. | Certification of Chief Financial Officer required by Rules 13a-14(a) or 15d-14(a) of the Securities Exchange Act of 1934, as promulgated by the Securities and Exchange Commission pursuant to Section 302 of the Sarbanes-Oxley Act of 2002 |
|
|
32.1. | Certification of Chief Executive Officer Pursuant to 18 U.S.C. Section 1350, as Adopted Pursuant to Section 906 of the Sarbanes-Oxley Act of 2002 |
|
|
32.2. | Certification of Chief Financial Officer Pursuant to 18 U.S.C. Section 1350, as Adopted Pursuant to Section 906 of the Sarbanes-Oxley Act of 2002 |
|
|
95. | Mine Safety Disclosure required under Section 1503 of the Dodd-Frank Wall Street Reform and Consumer Protection Act |
|
|
101. | INS XBRL Instance Document |
|
|
101. | SCH XBRL Taxonomy Extension Schema Document |
|
|
101. | CAL XBRL Taxonomy Extension Calculation Linkbase Document |
|
|
101. | DEF XBRL Taxonomy Extension Definition Linkbase Document |
|
|
101. | LAB XBRL Taxonomy Extension Label Linkbase Document |
|
|
101. | PRE XBRL Taxonomy Extension Presentation Linkbase Document |
* Portions of the exhibit have been omitted pursuant to a request for confidential treatment
104
Table of Contents
SCHEDULE II – VALUATION AND QUALIFYING ACCOUNTS AND RESERVES
YEARS ENDED DECEMBER 31, 2017 , 2016 AND 2015
(Millions of Dollars)
|
|
|
| Additions |
| Deductions |
|
| ||||||||||||||||
Description |
| Balance at |
| Charged to |
| Charged |
| Charged to |
| Charged |
| Balance | ||||||||||||
Year ended December 31, 2017: |
|
|
|
|
|
|
|
|
|
|
|
| ||||||||||||
Reserves deducted in the balance sheet from the assets to which they apply: |
|
|
|
|
|
|
|
|
|
|
|
| ||||||||||||
Allowance for doubtful accounts |
| $ | 25 | |
| $ | 2 | |
| $ | 2 | |
| $ | - | |
| $ | 1 | |
| $ | 28 | |
Allowance for related party doubtful accounts |
| 265 | |
| - | |
| - | |
| - | |
| 265 | |
| - | | ||||||
Investments and long-term receivables reserve |
| 10 | |
| - | |
| 1 | |
| - | |
| - | |
| 11 | | ||||||
Long-term receivables from related parties reserve |
| 1,627 | |
| - | |
| - | |
| - | |
| 1,627 | |
| - | | ||||||
Deferred tax valuation allowance: |
|
|
|
|
|
|
|
|
|
|
|
| ||||||||||||
Domestic |
| 1,109 | |
| 42 | |
| - | |
| 373 | |
| 174 | |
| 604 | | ||||||
Foreign |
| 4 | |
| - | |
| - | |
| - | |
| - | |
| 4 | | ||||||
Year ended December 31, 2016: |
|
|
|
|
|
|
|
|
|
|
|
| ||||||||||||
Reserves deducted in the balance sheet from the assets to which they apply: |
|
|
|
|
|
|
|
|
|
|
|
| ||||||||||||
Allowance for doubtful accounts |
| $ | 28 | |
| $ | - | |
| $ | - | |
| $ | - | |
| $ | 3 | |
| $ | 25 | |
Allowance for related party doubtful accounts |
| 254 | |
| - | |
| 11 | |
| - | |
| - | |
| 265 | | ||||||
Investments and long-term receivables reserve |
| 7 | |
| - | |
| 3 | |
| - | |
| - | |
| 10 | | ||||||
Long-term receivables from related parties reserve |
| 1,446 | |
| - | |
| 181 | |
| - | |
| - | |
| 1,627 | | ||||||
Deferred tax valuation allowance: |
|
|
|
|
|
|
|
|
|
|
|
| ||||||||||||
Domestic |
| 804 | |
| 174 | |
| 131 | |
| - | |
| - | |
| 1,109 | | ||||||
Foreign |
| 4 | |
| - | |
| - | |
| - | |
| - | |
| 4 | | ||||||
Year ended December 31, 2015: |
|
|
|
|
|
|
|
|
|
|
|
| ||||||||||||
Reserves deducted in the balance sheet from the assets to which they apply: |
|
|
|
|
|
|
|
|
|
|
|
| ||||||||||||
Allowance for doubtful accounts |
| $ | 45 | |
| $ | - | |
| $ | - | |
| $ | 11 | |
| $ | 6 | |
| $ | 28 | |
Allowance for related party doubtful accounts |
| 218 | |
| 74 | |
| - | |
| - | |
| 38 | |
| 254 | | ||||||
Investments and long-term receivables reserve |
| 8 | |
| - | |
| - | |
| - | |
| 1 | |
| 7 | | ||||||
Long-term receivables from related parties reserve |
| 1,188 | |
| 465 | |
| - | |
| - | |
| 207 | |
| 1,446 | | ||||||
Deferred tax valuation allowance: |
|
|
|
|
|
|
|
|
|
|
|
| ||||||||||||
Domestic |
| - | |
| 753 | |
| 51 | |
| - | |
| - | |
| 804 | | ||||||
Foreign |
| 5 | |
| - | |
| - | |
| 1 | |
| - | |
| 4 | | ||||||
105
Table of Contents
Item 16. FORM 10-K SUMMARY
None.
106
Table of Contents
SIGNATURES
Pursuant to the requirements of the Securities Exchange Act of 1934, this report has been signed below by the following persons on behalf of the registrant and in the capacity indicated on February 21, 2018 .
UNITED STATES STEEL CORPORATION
By: |
| /s/ Colleen M. Darragh |
|
| Colleen M. Darragh |
|
| Vice President & Controller |
Signature |
| Title |
/s/ David B. Burritt |
| President & Chief Executive Officer & |
David B. Burritt |
| |
|
|
|
/s/ Kevin P. Bradley |
| Executive Vice President & |
Kevin P. Bradley |
| |
|
|
|
/s/ Colleen M. Darragh |
| Vice President & Controller |
Colleen M. Darragh |
| |
|
|
|
* |
| Director |
Patricia Diaz Dennis |
| |
|
|
|
* |
| Director |
Dan O. Dinges |
| |
|
|
|
* |
| Director |
John G. Drosdick |
| |
|
|
|
* |
| Director |
John J. Engel |
| |
|
|
|
* |
| Director |
Murry S. Gerber |
| |
|
|
|
* |
| Director |
Stephen J. Girsky |
| |
|
|
|
* |
| Director |
Paul A. Mascarenas |
| |
|
|
|
* |
| Director |
Glenda G. McNeal |
| |
|
|
|
* |
| Director |
Eugene B. Sperling |
| |
|
|
|
* |
| Director |
Robert J. Stevens |
| |
|
|
|
* |
| Director |
David S. Sutherland |
| |
|
|
|
* |
| Director |
Patricia A. Tracey |
| |
107
Table of Contents
* |
| B Y : |
| /s/ David B. Burritt |
|
|
|
| David B. Burritt |
|
|
|
| Attorney-in-Fact |
108
Table of Contents
GLOSSARY OF CERTAIN DEFINED TERMS
The following definitions apply to terms used in this document:
Acero Prime |
| Acero Prime, S.R.L. de CV |
AD |
| antidumping |
Apolo |
| Apolo Tubulars S.A. |
ARO |
| Asset Retirement Obligation |
ASC |
| Accounting Standards Codification |
BAT |
| Best Available Technique |
CAA |
| Clean Air Act |
CAL |
| continuous annealing line |
CCAA |
| Canada's Companies' Creditors Arrangement Act |
CDC |
| Chrome Deposit Corporation |
CERCLA |
| Comprehensive Environmental Response, Compensation and Liability Act |
CMS |
| Corrective Measure Study |
CO 2 |
| carbon dioxide |
Commerce |
| U.S. Department of Commerce |
CORE |
| corrosion-resistant |
CVD |
| countervailing duties |
CWA |
| Clean Water Act |
DESCO |
| Double Eagle Steel Coating Company |
Double G |
| Double G Coatings Company LLC |
EAF |
| Electric Arc Furnace |
EBITDA |
| earnings before interest, taxes, depreciation and amortization |
EC |
| European Commission |
Economic Profit |
| After tax income from operations in excess of weighted average cost of capital |
EPA |
| U.S. Environmental Protection Agency |
ERB |
| Environmental Revenue Bond |
ERP |
| Enterprise resource planning |
ERW |
| electric resistance welded |
ETS |
| Emissions Trading System |
EU |
| European Union |
Eurofer |
| European Confederation of Iron and Steel Industries |
Flat-Rolled |
| Flat-Rolled Products segment |
FPC |
| Feralloy Processing Company |
Gateway |
| Gateway Energy & Coke Company, LLC, a subsidiary of SunCoke Energy |
GHG |
| greenhouse gas |
Hibbing |
| Hibbing Taconite Company |
HWD |
| hazardous waste disposal |
HWT |
| hazardous waste treatment |
Keetac |
| U. S. Steel's iron ore operations at Keewatin, Minnesota |
MACT |
| Maximum Achievable Control Technology |
Minntac |
| U. S. Steel's iron ore operations at Mt. Iron, Minnesota |
NAAQS |
| National Ambient Air Quality Standards |
NESHAP |
| National Emission Standards for Hazardous Air Pollutants |
NPDES |
| National Pollutant Discharge Elimination System |
O. D. |
| outer diameter |
OCTG |
| oil country tubular goods |
OSHA |
| Occupational Safety and Health Administration |
PRO-TEC |
| PRO-TEC Coating Company, U. S. Steel and Kobe Steel Ltd. joint venture |
PRP |
| potentially responsible party |
RCRA |
| Resource Conservation and Recovery Act |
REACH |
| Registration, Evaluation, Authorization and Restriction of Chemicals, Regulation 1907/2006 |
RFI |
| RCRA Facility Investigation |
SEC |
| Securities and Exchange Commission |
SIP |
| State Implementation Plan |
SPT |
| Steelworkers Pension Trust |
109
Table of Contents
SWMU |
| Solid Waste Management Units |
Tilden |
| Tilden Mining Company, L.C. |
tons |
| net tons |
Tubular |
| Tubular Products segment |
U.S. GAAP |
| accounting standards generally accepted in the United States |
UPI |
| USS-POSCO Industries, U. S. Steel and POSCO joint venture |
USITC |
| U.S. International Trade Commission |
USSC |
| U. S. Steel Canada Inc. |
USSE |
| U. S. Steel Europe segment |
USSK |
| U. S. Steel Košice |
USSTP |
| U. S. Steel Tubular Products |
USW |
| United Steelworkers |
Worthington |
| Worthington Specialty Processing, U. S. Steel and Worthington Industries, Inc. joint venture |
WTO |
| World Trade Organization |
110