|
UNITED STATES SECURITIES AND EXCHANGE COMMISSION
Washington, D.C. 20549
FORM 10-Q
(Mark One)
☑ | QUARTERLY REPORT PURSUANT TO SECTION 13 OR 15(d) OF THE SECURITIES EXCHANGE ACT OF 1934 |
For the quarterly period ended March 31, 2017
or
¨ | TRANSITION REPORT PURSUANT TO SECTION 13 OR 15(d) OF THE SECURITIES EXCHANGE ACT OF 1934 |
For the transition period from _____________ to ____________ _
Commission file number 1-4174
THE WILLIAMS COMPANIES, INC. |
(Exact name of registrant as specified in its charter) |
DELAWARE |
| 73-0569878 |
(State or other jurisdiction of incorporation or organization) |
| (I.R.S. Employer Identification No.) |
|
|
|
ONE WILLIAMS CENTER |
|
|
TULSA, OKLAHOMA |
| 74172-0172 |
(Address of principal executive offices) |
| (Zip Code) |
Registrant's telephone number, including area code: (918) 573-2000
NO CHANGE
|
(Former name, former address and former fiscal year, if changed since last report.)
Indicate by check mark whether the registrant (1) has filed all reports required to be filed by Section 13 or 15(d) of the Securities Exchange Act of 1934 during the preceding 12 months (or for such shorter period that the registrant was required to file such reports), and (2) has been subject to such filing requirements for the past 90 days. Yes ☑ No ¨
Indicate by check mark whether the registrant has submitted electronically and posted on its corporate Web site, if any, every Interactive Data File required to be submitted and posted pursuant to Rule 405 of Regulation S-T (§232.405 of this chapter) during the preceding 12 months (or for such shorter period that the registrant was required to submit and post such files). Yes ☑ No ¨
Indicate by check mark whether the registrant is a large accelerated filer, an accelerated filer, a non-accelerated filer, a smaller reporting company, or an emerging growth company. See the definitions of "large accelerated filer," "accelerated filer," "smaller reporting company," and "emerging growth company" in Rule 12b-2 of the Exchange Act.
Large accelerated filer ☑ |
| Accelerated filer ¨ |
| Non-accelerated filer ¨ |
| Smaller reporting company ¨ |
| Emerging growth company ¨ |
|
|
|
| (Do not check if a smaller reporting company) |
|
|
|
|
If an emerging growth company, indicate by check mark if the registrant has elected not to use the extended transition period for complying with any new or revised financial accounting standards provided pursuant to Section 13(a) of the Exchange Act. ¨
Indicate by check mark whether the registrant is a shell company (as defined in Rule 12b-2 of the Exchange Act.) Yes ¨ No ☑
Indicate the number of shares outstanding of each of the issuer's classes of common stock, as of the latest practicable date.
Class |
| Shares Outstanding at April 28, 2017 |
Common Stock, $1 par value |
| 826,274,756 |
|
The Williams Companies, Inc.
Index
|
| Page |
Part I. Financial Information |
|
|
Item 1. Financial Statements |
|
|
Consolidated Statement of Operations – Three Months Ended March 31, 2017 and 2016 |
| 6 |
Consolidated Statement of Comprehensive Income (Loss) – Three Months Ended March 31, 2017 and 2016 |
| 7 |
Consolidated Balance Sheet – March 31, 2017 and December 31, 2016 |
| 8 |
Consolidated Statement of Changes in Equity – Three Months Ended March 31, 2017 |
| 9 |
Consolidated Statement of Cash Flows – Three Months Ended March 31, 2017 and 2016 |
| 10 |
Notes to Consolidated Financial Statements |
| 11 |
Item 2. Management's Discussion and Analysis of Financial Condition and Results of Operations |
| 32 |
Item 3. Quantitative and Qualitative Disclosures About Market Risk |
| 49 |
Item 4. Controls and Procedures |
| 50 |
Part II. Other Information |
| 50 |
Item 1. Legal Proceedings |
| 50 |
Item 6. Exhibits |
| 51 |
The reports, filings, and other public announcements of The Williams Companies, Inc. (Williams) may contain or incorporate by reference statements that do not directly or exclusively relate to historical facts. Such statements are "forward-looking statements" within the meaning of Section 27A of the Securities Act of 1933, as amended (Securities Act), and Section 21E of the Securities Exchange Act of 1934, as amended (Exchange Act). These forward-looking statements relate to anticipated financial performance, management's plans, and objectives for future operations, business prospects, outcome of regulatory proceedings, market conditions, and other matters. We make these forward-looking statements in reliance on the safe harbor protections provided under the Private Securities Litigation Reform Act of 1995.
All statements, other than statements of historical facts, included in this report that address activities, events or developments that we expect, believe or anticipate will exist or may occur in the future, are forward-looking statements. Forward-looking statements can be identified by various forms of words such as "anticipates," "believes," "seeks," "could," "may," "should," "continues," "estimates," "expects," "forecasts," "intends," "might," "goals," "objectives," "targets," "planned," "potential," "projects," "scheduled," "will," "assumes," "guidance," "outlook," "in service date," or other similar expressions. These forward-looking statements are based on management's beliefs and assumptions and on information currently available to management and include, among others, statements regarding:
• | Expected levels of cash distributions by Williams Partners L.P. (WPZ) with respect to limited partner interests; |
• | Levels of dividends to Williams stockholders; |
• | Future credit ratings of Williams, WPZ, and their affiliates; |
• | Amounts and nature of future capital expenditures; |
• | Expansion and growth of our business and operations; |
1
• | Financial condition and liquidity; |
• | Business strategy; |
• | Cash flow from operations or results of operations; |
• | Seasonality of certain business components; |
• | Natural gas, natural gas liquids, and olefins prices, supply, and demand; |
• | Demand for our services. |
Forward-looking statements are based on numerous assumptions, uncertainties and risks that could cause future events or results to be materially different from those stated or implied in this report. Many of the factors that will determine these results are beyond our ability to control or predict. Specific factors that could cause actual results to differ from results contemplated by the forward-looking statements include, among others, the following:
• | Whether WPZ will produce sufficient cash flows to provide the level of cash distributions that we expect; |
• | Whether we are able to pay current and expected levels of dividends; |
• | Whether WPZ elects to pay expected levels of cash distributions and we elect to pay expected levels of dividends; |
• | Whether we will be able to effectively execute our financing plan including the receipt of anticipated levels of proceeds from planned asset sales; |
• | Whether we will be able to effectively manage the transition in our board of directors and management as well as successfully execute our business restructuring; |
• | Availability of supplies, including lower than anticipated volumes from third parties served by our midstream business, and market demand; |
• | Volatility of pricing including the effect of lower than anticipated energy commodity prices and margins; |
• | Inflation, interest rates, and general economic conditions (including future disruptions and volatility in the global credit markets and the impact of these events on customers and suppliers); |
• | The strength and financial resources of our competitors and the effects of competition; |
• | Whether we are able to successfully identify, evaluate and timely execute our capital projects and other investment opportunities in accordance with our forecasted capital expenditures budget; |
• | Our ability to successfully expand our facilities and operations; |
• | Development of alternative energy sources; |
• | The impact of operational and developmental hazards and unforeseen interruptions and the availability of adequate insurance coverage; |
2
• | The impact of existing and future laws, regulations, the regulatory environment, environmental liabilities, and litigation, as well as our ability to obtain permits and achieve favorable rate proceeding outcomes; |
• | Our costs and funding obligations for defined benefit pension plans and other postretirement benefit plans; |
• | Changes in maintenance and construction costs; |
• | Changes in the current geopolitical situation; |
• | Our exposure to the credit risk of our customers and counterparties; |
• | Risks related to financing, including restrictions stemming from debt agreements, future changes in credit ratings as determined by nationally-recognized credit rating agencies and the availability and cost of capital; |
• | The amount of cash distributions from and capital requirements of our investments and joint ventures in which we participate; |
• | Risks associated with weather and natural phenomena, including climate conditions and physical damage to our facilities; |
• | Acts of terrorism, including cybersecurity threats and related disruptions; |
• | Additional risks described in our filings with the Securities and Exchange Commission (SEC). |
Given the uncertainties and risk factors that could cause our actual results to differ materially from those contained in any forward-looking statement, we caution investors not to unduly rely on our forward-looking statements. We disclaim any obligations to and do not intend to update the above list or announce publicly the result of any revisions to any of the forward-looking statements to reflect future events or developments.
In addition to causing our actual results to differ, the factors listed above and referred to below may cause our intentions to change from those statements of intention set forth in this report. Such changes in our intentions may also cause our results to differ. We may change our intentions, at any time and without notice, based upon changes in such factors, our assumptions, or otherwise.
Because forward-looking statements involve risks and uncertainties, we caution that there are important factors, in addition to those listed above, that may cause actual results to differ materially from those contained in the forward-looking statements. For a detailed discussion of those factors, see Part I, Item 1A. Risk Factors in our Annual Report on Form 10-K filed with the SEC on February 22, 2017.
3
DEFINITIONS
The following is a listing of certain abbreviations, acronyms, and other industry terminology used throughout this Form 10-Q.
Measurements :
Barrel : One barrel of petroleum products that equals 42 U.S. gallons
Bcf : One billion cubic feet of natural gas
Bcf/d : One billion cubic feet of natural gas per day
British Thermal Unit (Btu) : A unit of energy needed to raise the temperature of one pound of water by one degree
Fahrenheit
Dekatherms (Dth) : A unit of energy equal to one million British thermal units
Mbbls/d : One thousand barrels per day
Mdth/d : One thousand dekatherms per day
MMcf/d : One million cubic feet per day
MMdth : One million dekatherms or approximately one trillion British thermal units
MMdth/d : One million dekatherms per day
Tbtu : One trillion British thermal units
Consolidated Entities :
Cardinal: Cardinal Gas Services, L.L.C.
Constitution: Constitution Pipeline Company, LLC
Gulfstar One: Gulfstar One LLC
Jackalope: Jackalope Gas Gathering Services, L.L.C.
Northwest Pipeline: Northwest Pipeline LLC
Transco: Transcontinental Gas Pipe Line Company, LLC
WPZ: Williams Partners L.P.
Partially Owned Entities : Entities in which we do not own a 100 percent ownership interest and which, as of March 31, 2017 , we account for as an equity-method investment, including principally the following:
Aux Sable: Aux Sable Liquid Products LP
Caiman II: Caiman Energy II, LLC
Discovery: Discovery Producer Services LLC
Gulfstream: Gulfstream Natural Gas System, L.L.C.
Laurel Mountain: Laurel Mountain Midstream, LLC
OPPL: Overland Pass Pipeline Company LLC
UEOM: Utica East Ohio Midstream LLC
4
Government and Regulatory:
EPA: Environmental Protection Agency
FERC: Federal Energy Regulatory Commission
SEC: Securities and Exchange Commission
Other :
Merger Agreement : Merger Agreement and Plan of Merger of Williams with Energy Transfer and certain of its affiliates
Fractionation: The process by which a mixed stream of natural gas liquids is separated into constituent products, such as ethane, propane, and butane
GAAP: U.S. generally accepted accounting principles
IDR: Incentive distribution right
NGLs: Natural gas liquids; natural gas liquids result from natural gas processing and crude oil refining and are
used as petrochemical feedstocks, heating fuels, and gasoline additives, among other applications
NGL margins : NGL revenues less any applicable Btu replacement cost, plant fuel, and third-party transportation and fractionation
PDH facility: Propane dehydrogenation facility
5
PART I – FINANCIAL INFORMATION
The Williams Companies, Inc.
Consolidated Statement of Operations
(Unaudited)
| Three Months Ended | ||||||
| 2017 |
| 2016 | ||||
| (Millions, except per-share amounts) | ||||||
Revenues: |
|
|
| ||||
Service revenues | $ | 1,261 | | | $ | 1,229 | |
Product sales | 727 | | | 431 | | ||
Total revenues | 1,988 | | | 1,660 | | ||
Costs and expenses: | | | | ||||
Product costs | 579 | | | 318 | | ||
Operating and maintenance expenses | 368 | | | 391 | | ||
Depreciation and amortization expenses | 442 | | | 445 | | ||
Selling, general, and administrative expenses | 161 | | | 221 | | ||
Other (income) expense – net | 5 | | | 23 | | ||
Total costs and expenses | 1,555 | | | 1,398 | | ||
Operating income (loss) | 433 | | | 262 | | ||
Equity earnings (losses) | 107 | | | 97 | | ||
Impairment of equity-method investments (Note 10) | - | |
| (112 | ) | ||
Other investing income (loss) – net (Note 3) | 272 | |
| 18 | | ||
Interest incurred | (287 | ) | | (306 | ) | ||
Interest capitalized | 7 | | | 15 | | ||
Other income (expense) – net | 74 | | | 15 | | ||
Income (loss) before income taxes | 606 | | | (11 | ) | ||
Provision (benefit) for income taxes | 37 | | | 2 | | ||
Net income (loss) | 569 | | | (13 | ) | ||
Less: Net income (loss) attributable to noncontrolling interests | 196 | | | 52 | | ||
Net income (loss) attributable to The Williams Companies, Inc. | $ | 373 | | | $ | (65 | ) |
Amounts attributable to The Williams Companies, Inc.: |
|
|
| ||||
Basic earnings (loss) per common share: |
|
|
| ||||
Net income (loss) | $ | .45 | |
| $ | (.09 | ) |
Weighted-average shares (thousands) | 824,548 | |
| 750,332 | | ||
Diluted earnings (loss) per common share: |
|
|
| ||||
Net income (loss) | $ | .45 | |
| $ | (.09 | ) |
Weighted-average shares (thousands) | 826,476 | |
| 750,332 | | ||
Cash dividends declared per common share | $ | .30 | |
| $ | .64 | |
See accompanying notes.
6
The Williams Companies, Inc.
Consolidated Statement of Comprehensive Income (Loss)
(Unaudited)
| Three Months Ended | ||||||
| 2017 |
| 2016 | ||||
| (Millions) | ||||||
Net income (loss) | $ | 569 | |
| $ | (13 | ) |
Other comprehensive income (loss): |
|
|
| ||||
Cash flow hedging activities: |
|
|
| ||||
Net unrealized gain (loss) from derivative instruments, net of taxes of ($1) in 2017 | 3 | |
| - | | ||
Foreign currency translation activities: |
|
|
| ||||
Foreign currency translation adjustments, net of taxes of ($15) in 2016 | - | |
| 89 | | ||
Pension and other postretirement benefits: |
|
|
| ||||
Amortization of prior service cost (credit) included in net periodic benefit cost | (1 | ) |
| (1 | ) | ||
Amortization of actuarial (gain) loss included in net periodic benefit cost, net of taxes of ($3) in 2017 and 2016 | 4 | |
| 5 | | ||
Other comprehensive income (loss) | 6 | |
| 93 | | ||
Comprehensive income (loss) | 575 | |
| 80 | | ||
Less: Comprehensive income (loss) attributable to noncontrolling interests | 197 | |
| 81 | | ||
Comprehensive income (loss) attributable to The Williams Companies, Inc. | $ | 378 | |
| $ | (1 | ) |
See accompanying notes.
7
The Williams Companies, Inc.
Consolidated Balance Sheet
(Unaudited)
|
| March 31, |
| December 31, | ||||
|
| (Millions, except per-share amounts) | ||||||
ASSETS |
|
| ||||||
Current assets: |
|
|
|
| ||||
Cash and cash equivalents |
| $ | 639 | |
| $ | 170 | |
Trade accounts and other receivables (net of allowance of $6 at March 31, 2017 and $6 at December 31, 2016) |
| 867 | |
| 938 | | ||
Inventories |
| 148 | |
| 138 | | ||
Assets held for sale (Note 1) |
| 1,023 | |
| 24 | | ||
Other current assets and deferred charges |
| 168 | |
| 192 | | ||
Total current assets |
| 2,845 | |
| 1,462 | | ||
Investments |
| 6,738 | |
| 6,701 | | ||
Property, plant, and equipment, at cost |
| 38,342 | |
| 38,912 | | ||
Accumulated depreciation and amortization |
| (10,580 | ) |
| (10,484 | ) | ||
Property, plant, and equipment – net |
| 27,762 | |
| 28,428 | | ||
Intangible assets – net of accumulated amortization |
| 9,570 | |
| 9,663 | | ||
Regulatory assets, deferred charges, and other |
| 597 | |
| 581 | | ||
Total assets |
| $ | 47,512 | |
| $ | 46,835 | |
LIABILITIES AND EQUITY |
|
|
|
| ||||
Current liabilities: |
|
|
|
| ||||
Accounts payable |
| $ | 680 | |
| $ | 623 | |
Liabilities held for sale (Note 1) |
| 43 | |
| - | | ||
Accrued liabilities |
| 1,322 | |
| 1,448 | | ||
Commercial paper |
| - | |
| 93 | | ||
Long-term debt due within one year |
| - | |
| 785 | | ||
Total current liabilities |
| 2,045 | |
| 2,949 | | ||
Long-term debt |
| 21,825 | |
| 22,624 | | ||
Deferred income tax liabilities |
| 5,133 | |
| 4,238 | | ||
Regulatory liabilities, deferred income, and other |
| 3,100 | |
| 2,978 | | ||
Contingent liabilities (Note 11) |
| |
| | ||||
Equity: |
|
|
|
| ||||
Stockholders' equity: |
|
|
|
| ||||
Common stock (960 million shares authorized at $1 par value; |
| 861 | |
| 785 | | ||
Capital in excess of par value |
| 18,445 | |
| 14,887 | | ||
Retained deficit |
| (9,487 | ) |
| (9,649 | ) | ||
Accumulated other comprehensive income (loss) |
| (334 | ) |
| (339 | ) | ||
Treasury stock, at cost (35 million shares of common stock) |
| (1,041 | ) |
| (1,041 | ) | ||
Total stockholders' equity |
| 8,444 | |
| 4,643 | | ||
Noncontrolling interests in consolidated subsidiaries |
| 6,965 | |
| 9,403 | | ||
Total equity |
| 15,409 | |
| 14,046 | | ||
Total liabilities and equity |
| $ | 47,512 | |
| $ | 46,835 | |
See accompanying notes.
8
The Williams Companies, Inc.
Consolidated Statement of Changes in Equity
(Unaudited)
| The Williams Companies, Inc., Stockholders |
|
|
|
| ||||||||||||||||||||||||||
| Common Stock |
| Capital in Excess of Par Value |
| Retained Deficit |
| Accumulated Other Comprehensive Income (Loss) |
| Treasury Stock |
| Total Stockholders' Equity |
| Noncontrolling Interests |
| Total Equity | ||||||||||||||||
| (Millions) | ||||||||||||||||||||||||||||||
Balance – December 31, 2016 | $ | 785 | |
| $ | 14,887 | |
| $ | (9,649 | ) |
| $ | (339 | ) |
| $ | (1,041 | ) |
| $ | 4,643 | |
| $ | 9,403 | |
| $ | 14,046 | |
Net income (loss) | - | |
| - | |
| 373 | |
| - | |
| - | |
| 373 | |
| 196 | |
| 569 | | ||||||||
Other comprehensive income (loss) | - | |
| - | |
| - | |
| 5 | |
| - | |
| 5 | |
| 1 | |
| 6 | | ||||||||
Issuance of common stock (Note 9) | 75 | |
| 2,043 | |
| - | |
| - | |
| - | |
| 2,118 | |
| - | |
| 2,118 | | ||||||||
Cash dividends – common stock | - | |
| - | |
| (248 | ) |
| - | |
| - | |
| (248 | ) |
| - | |
| (248 | ) | ||||||||
Dividends and distributions to noncontrolling interests | - | |
| - | |
| - | |
| - | |
| - | |
| - | |
| (258 | ) |
| (258 | ) | ||||||||
Stock-based compensation and related common stock issuances, net of tax | 1 | |
| 17 | |
| - | |
| - | |
| - | |
| 18 | |
| - | |
| 18 | | ||||||||
Adoption of ASU 2016-09 (Note 1) | - | |
| 1 | |
| 36 | |
| - | |
| - | |
| 37 | |
| - | |
| 37 | | ||||||||
Sales of limited partner units of Williams Partners L.P. | - | |
| - | | | - | | | - | | | - | | | - | | | 16 | | | 16 | | ||||||||
Changes in ownership of consolidated subsidiaries, net | - | |
| 1,496 | |
| - | |
| - | |
| - | |
| 1,496 | |
| (2,397 | ) |
| (901 | ) | ||||||||
Contributions from noncontrolling interests | - | |
| - | |
| - | |
| - | |
| - | |
| - | |
| 4 | |
| 4 | | ||||||||
Other | - | |
| 1 | |
| 1 | |
| - | |
| - | |
| 2 | |
| - | |
| 2 | | ||||||||
Net increase (decrease) in equity | 76 | |
| 3,558 | |
| 162 | |
| 5 | |
| - | |
| 3,801 | |
| (2,438 | ) |
| 1,363 | | ||||||||
Balance – March 31, 2017 | $ | 861 | |
| $ | 18,445 | |
| $ | (9,487 | ) |
| $ | (334 | ) |
| $ | (1,041 | ) |
| $ | 8,444 | |
| $ | 6,965 | |
| $ | 15,409 | |
See accompanying notes.
9
The Williams Companies, Inc.
Consolidated Statement of Cash Flows
| Three Months Ended | ||||||
| 2017 |
| 2016 | ||||
| (Millions) | ||||||
OPERATING ACTIVITIES: |
| ||||||
Net income (loss) | $ | 569 | |
| $ | (13 | ) |
Adjustments to reconcile to net cash provided (used) by operating activities: |
|
|
| ||||
Depreciation and amortization | 442 | |
| 445 | | ||
Provision (benefit) for deferred income taxes | 28 | |
| 2 | | ||
Net (gain) loss on disposition of equity-method investments | (269 | ) |
| - | | ||
Impairment of equity-method investments | - | |
| 112 | | ||
Amortization of stock-based awards | 21 | |
| 21 | | ||
Cash provided (used) by changes in current assets and liabilities: |
|
|
| ||||
Accounts and notes receivable | 29 | |
| 298 | | ||
Inventories | (30 | ) |
| (16 | ) | ||
Other current assets and deferred charges | 18 | |
| 16 | | ||
Accounts payable | 32 | |
| (23 | ) | ||
Accrued liabilities | (133 | ) |
| (141 | ) | ||
Other, including changes in noncurrent assets and liabilities | (101 | ) |
| 82 | | ||
Net cash provided (used) by operating activities | 606 | |
| 783 | | ||
FINANCING ACTIVITIES: |
|
|
| ||||
Proceeds from (payments of) commercial paper – net | (93 | ) |
| (365 | ) | ||
Proceeds from long-term debt | 470 | |
| 2,688 | | ||
Payments of long-term debt | (2,000 | ) |
| (1,991 | ) | ||
Proceeds from issuance of common stock | 2,122 | |
| 6 | | ||
Dividends paid | (248 | ) |
| (480 | ) | ||
Dividends and distributions paid to noncontrolling interests | (242 | ) |
| (236 | ) | ||
Contributions from noncontrolling interests | 4 | |
| 16 | | ||
Payments for debt issuance costs | - | |
| (8 | ) | ||
Other – net | (28 | ) |
| (3 | ) | ||
Net cash provided (used) by financing activities | (15 | ) |
| (373 | ) | ||
INVESTING ACTIVITIES: |
|
|
| ||||
Property, plant, and equipment: |
|
|
| ||||
Capital expenditures (1) | (511 | ) |
| (513 | ) | ||
Net proceeds from dispositions | (2 | ) |
| 24 | | ||
Proceeds from dispositions of equity-method investments | 200 | |
| - | | ||
Purchases of and contributions to equity-method investments | (52 | ) |
| (63 | ) | ||
Distributions from unconsolidated affiliates in excess of cumulative earnings | 121 | |
| 109 | | ||
Other – net | 122 | |
| 97 | | ||
Net cash provided (used) by investing activities | (122 | ) |
| (346 | ) | ||
Increase (decrease) in cash and cash equivalents | 469 | |
| 64 | | ||
Cash and cash equivalents at beginning of year | 170 | |
| 100 | | ||
Cash and cash equivalents at end of period | $ | 639 | |
| $ | 164 | |
_____________ |
|
|
| ||||
(1) Increases to property, plant, and equipment | $ | (569 | ) |
| $ | (525 | ) |
Changes in related accounts payable and accrued liabilities | 58 | |
| 12 | | ||
Capital expenditures | $ | (511 | ) |
| $ | (513 | ) |
See accompanying notes.
10
The Williams Companies, Inc.
Notes to Consolidated Financial Statements
(Unaudited)
Note 1 – General, Description of Business, and Basis of Presentation
General
Our accompanying interim consolidated financial statements do not include all the notes in our annual financial statements and, therefore, should be read in conjunction with the consolidated financial statements and notes thereto for the year ended December 31, 2016, in our Annual Report on Form 10-K. The accompanying unaudited financial statements include all normal recurring adjustments and others that, in the opinion of management, are necessary to present fairly our interim financial statements.
The preparation of financial statements in conformity with accounting principles generally accepted in the United States requires management to make estimates and assumptions that affect the amounts reported in the consolidated financial statements and accompanying notes. Actual results could differ from those estimates.
Unless the context clearly indicates otherwise, references in this report to "Williams," "we," "our," "us," or like terms refer to The Williams Companies, Inc. and its subsidiaries. Unless the context clearly indicates otherwise, references to "Williams," "we," "our," and "us" include the operations in which we own interests accounted for as equity-method investments that are not consolidated in our financial statements. When we refer to our equity investees by name, we are referring exclusively to their businesses and operations.
Financial Repositioning
In January 2017, we announced agreements with Williams Partners L.P. (WPZ), wherein we permanently waived the general partner's incentive distribution rights (IDRs) and converted our 2 percent general partner interest in WPZ to a non-economic interest in exchange for 289 million newly issued WPZ common units. Pursuant to this agreement, we also purchased approximately 277 thousand WPZ common units for $10 million . Additionally, we purchased approximately 59 million common units of WPZ at a price of $36.08586 per unit in a private placement transaction, funded with proceeds from our equity offering (see Note 9 – Stockholders' Equity). According to the terms of this agreement, following WPZ's quarterly distribution in February 2017, we paid additional consideration of approximately $50 million to WPZ for these units. Subsequent to these transactions and as of March 31, 2017, we own a 74 percent limited partner interest in WPZ.
Geismar Olefins Facility Assets Held For Sale
On April 17, 2017, WPZ announced that it agreed to sell Williams Olefins, L.L.C., a wholly owned subsidiary which owns an interest in the Geismar, Louisiana, olefins plant (Geismar Interest) for $2.1 billion in cash, subject to customary closing conditions and regulatory approvals. Upon closing of the sale, WPZ will enter into a long-term supply and transportation agreement with the purchaser to provide feedstock to the plant via its Bayou Ethane pipeline system. WPZ expects that the sale will close during the summer of 2017.
11
Notes (Continued)
The assets and liabilities of the Geismar olefins plant are presented as held for sale as of March 31, 2017. The following table presents the carrying amounts of the major classes of assets and liabilities included as part of the Geismar disposal group, which are presented within Assets held for sale and Liabilities held for sale in the Consolidated Balance Sheet. Also included in Assets held for sale in the Consolidated Balance Sheet are $24 million of assets held for sale in the Williams Partners segment unrelated to the Geismar Interest and at December 31, 2016, were previously included in Other current assets and deferred charges .
|
| Carrying Amount | ||
|
| March 31, 2017 | ||
|
| (Millions) | ||
Assets: |
|
| ||
Current assets |
| $ | 71 | |
Property, plant, and equipment – net |
| 901 | | |
Other noncurrent assets |
| 27 | | |
|
| $ | 999 | |
Liabilities: |
|
| ||
Current liabilities |
| $ | 42 | |
Noncurrent liabilities |
| 1 | | |
|
| $ | 43 | |
The following table presents the results of operations for the Geismar disposal group.
| Three Months Ended | ||||||
| 2017 |
| 2016 | ||||
| (Millions) | ||||||
Income (loss) before income taxes of disposal group | $ | 23 | |
| $ | 18 | |
Income (loss) before income taxes of disposal group attributable to The Williams Companies, Inc. | 17 | |
| 11 | | ||
Description of Business
We are a Delaware corporation whose common stock is listed and traded on the New York Stock Exchange. Our operations are located principally in the United States. We have one reportable segment, Williams Partners. All remaining business activities are included in Other.
Williams Partners
Williams Partners consists of our consolidated master limited partnership, WPZ, and primarily includes gas pipeline and midstream businesses.
WPZ's gas pipeline businesses primarily consist of two interstate natural gas pipelines, which are Transcontinental Gas Pipe Line Company, LLC (Transco) and Northwest Pipeline LLC (Northwest Pipeline), and several joint venture investments in interstate and intrastate natural gas pipeline systems, including a 50 percent equity-method investment in Gulfstream Natural Gas System, L.L.C. (Gulfstream), and a 41 percent interest in Constitution Pipeline Company, LLC (Constitution) (a consolidated entity), which is under development.
WPZ's midstream businesses primarily consist of (1) natural gas gathering, treating, compression, and processing; (2) natural gas liquid (NGL) fractionation, storage, and transportation; (3) crude oil production handling and transportation; and (4) olefins production (see Geismar Olefin Facility Assets Held for Sale). The primary service areas are concentrated in major producing basins in Colorado, Texas, Oklahoma, Kansas, New Mexico, Wyoming, the Gulf of Mexico, Louisiana, Pennsylvania, West Virginia, New York, and Ohio which include the Barnett, Eagle Ford, Haynesville, Marcellus, Niobrara, and Utica shale plays as well as the Mid-Continent region.
12
Notes (Continued)
The midstream businesses include equity-method investments in natural gas gathering and processing assets and NGL fractionation and transportation assets, including a 62 percent equity-method investment in Utica East Ohio Midstream, LLC (UEOM), a 69 percent equity-method investment in Laurel Mountain Midstream, LLC (Laurel Mountain), a 58 percent equity-method investment in Caiman Energy II, LLC (Caiman II), a 60 percent equity-method investment in Discovery Producer Services LLC (Discovery), a 50 percent equity-method investment in Overland Pass Pipeline, LLC (OPPL), and Appalachia Midstream Services, LLC, which owns equity-method investments with an approximate average 66 percent interest in multiple gathering systems in the Marcellus Shale (Appalachia Midstream Investments), as well as our previously owned 50 percent equity-method investment in the Delaware basin gas gathering system (DBJV) in the Mid-Continent region (see Note 3 – Investing Activities ).
The midstream businesses also included our Canadian midstream operations, which were comprised of an oil sands offgas processing plant near Fort McMurray, Alberta, and an NGL/olefin fractionation facility at Redwater, Alberta. In September 2016, we completed the sale of our Canadian operations.
Other
Our former Williams NGL & Petchem Services segment included certain domestic olefins pipeline assets as well as certain Canadian assets, which included a liquids extraction plant located near Fort McMurray, Alberta, that began operations in March 2016, and a propane dehydrogenation facility which was under development. In September 2016, the Canadian assets were sold. Considering this, the remaining assets are now reported within Other, effective January 1, 2017. Other also includes minor business activities that are not operating segments, as well as corporate operations. Prior period segment disclosures have been recast for this segment change.
Basis of Presentation
Consolidated master limited partnership
As of March 31, 2017 , we own approximately 74 percent of the interests in WPZ, a variable interest entity (VIE) (see Note 2 – Variable Interest Entities ). WPZ units issued to us in connection with the Financial Repositioning, WPZ's quarterly distribution of additional paid-in-kind Class B units to us, and other equity issuances by WPZ had the combined net impact of decreasing Noncontrolling interests in consolidated subsidiaries by $2.397 billion , and increasing Capital in excess of par value by $1.496 billion and Deferred income tax liabilities by $901 million in the Consolidated Balance Sheet.
WPZ is self-funding and maintains separate lines of bank credit and cash management accounts and also has a commercial paper program. (See Note 8 – Debt and Banking Arrangements .) Cash distributions from WPZ to us, including any associated with our previous IDRs, occur through the normal partnership distributions from WPZ to all partners.
Significant risks and uncertainties
We have announced plans to monetize assets that are not core to our strategy. As we pursue these other asset monetizations, it is possible that we may incur impairments of certain equity-method investments, property, plant, and equipment, and intangible assets. Such impairments could potentially be caused by indications of fair value implied through the monetization process or, in the case of asset dispositions that are part of a broader asset group, the impact of the loss of future estimated cash flows.
Accounting standards issued and adopted
Effective January 1, 2017, we adopted Accounting Standards Update (ASU) 2016-09, "Compensation - Stock Compensation (Topic 718): Improvements to Employee Share-Based Payment Accounting" (ASU 2016-09). ASU 2016-09 changed the accounting for income taxes such that all excess tax benefits and all tax deficiencies are now recognized as a discrete item in the provision for income taxes in the financial reporting period they occur and the recognition of tax benefits is no longer delayed until the tax benefit is realized through a reduction in income taxes payable. These changes are applied prospectively beginning in 2017. We recorded a cumulative-effect adjustment as of January 1, 2017, decreasing Retained deficit by $37 million in the Consolidated Balance Sheet to recognize tax
13
Notes (Continued)
benefits that were not previously recognized. ASU 2016-09 requires entities to classify excess tax benefits as an operating activity on the statement of cash flows. We will apply this part of the guidance prospectively beginning in 2017; therefore, the cash flows for prior periods were not adjusted. In recognizing compensation cost from share-based payments, ASU 2016-09 allows entities to make an accounting policy election to either recognize forfeitures when they occur or estimate the number of forfeitures expected to occur. We will recognize forfeitures when they occur and as a result of the change in our accounting policy, we increased our Retained deficit for an insignificant cumulative-effect adjustment as of January 1, 2017. ASU 2016-09 requires entities to classify as a financing activity, on the statement of cash flows, cash paid by an employer to a taxing authority when directly withholding shares from an employee's award to satisfy the employer's statutory tax withholding obligation. This guidance must be applied retrospectively and we have adjusted operating and financing activities on the Consolidated Statement of Cash Flows for prior periods.
Accounting standards issued but not yet adopted
In March 2017, the Financial Accounting Standards Board (FASB) issued ASU 2017-07 "Compensation - Retirement Benefits (Topic 715): Improving the Presentation of Net Periodic Pension Cost and Net Periodic Postretirement Benefit Cost" (ASU 2017-07). ASU 2017-07 requires employers to report the service cost component of net benefit cost in the same line item or items as other compensation costs arising from employee services. The other components of net benefit cost must be presented in the income statement separately from the service cost component and outside a subtotal of income from operations, if one is presented. Only the service cost component is now eligible for capitalization when applicable. ASU 2017-07 is effective beginning January 1, 2018. The presentation aspect of the new standard must be applied retrospectively and the capitalization requirement prospectively. We are currently evaluating the impact of ASU 2017-07 on our consolidated financial statements.
In January 2017, the FASB issued ASU 2017-04 "Intangibles - Goodwill and Other (Topic 350): Simplifying the Test for Goodwill Impairment" (ASU 2017-04). ASU 2017-04 modifies the concept of goodwill impairment to represent the amount by which a reporting unit's carrying value exceeds its fair value, not to exceed the carrying amount of goodwill. Under the new standard, entities will no longer be required to determine the implied fair value of goodwill by assigning the fair value of a reporting unit to its individual assets and liabilities as if that reporting unit had been acquired in a business combination. ASU 2017-04 is effective for goodwill impairment testing for interim and annual periods beginning after December 15, 2019, and requires a prospective transition. Early adoption is permitted for interim and annual goodwill impairment tests performed after January 1, 2017, and we plan to adopt this standard in 2017. Our Williams Partners reportable segment has $47 million of goodwill included in Intangible assets - net of accumulated amortization in the Consolidated Balance Sheet .
In August 2016, the FASB issued ASU 2016-15 "Statement of Cash Flows (Topic 230): Classification of Certain Cash Receipts and Cash Payments" (ASU 2016-15). ASU 2016-15 provides specific guidance on eight cash flow classification issues, including debt prepayment or debt extinguishment costs and distributions received from equity method investees, to reduce diversity in practice. ASU 2016-15 is effective for interim and annual periods beginning after December 15, 2017. Early adoption is permitted. The new standard requires a retrospective transition. We are evaluating the impact of the new standard on our consolidated financial statements.
In June 2016, the FASB issued ASU 2016-13 "Financial Instruments - Credit Losses (Topic 326): Measurement of Credit Losses on Financial Instruments" (ASU 2016-13). ASU 2016-13 changes the impairment model for most financial assets and certain other instruments. For trade and other receivables, held-to-maturity debt securities, loans, and other instruments, entities will be required to use a new forward-looking "expected loss" model that generally will result in the earlier recognition of allowances for losses. The guidance also requires increased disclosures. ASU 2016-13 is effective for interim and annual periods beginning after December 15, 2019. Early adoption is permitted. The new standard requires varying transition methods for the different categories of amendments. We are evaluating the impact of the new standard on our consolidated financial statements. Although we do not expect this new standard to have a significant impact, it will impact our trade receivables as the related allowance for credit losses will be recognized earlier under the expected loss model.
In February 2016, the FASB issued ASU 2016-02 "Leases (Topic 842)" (ASU 2016-02). ASU 2016-02 establishes a comprehensive new lease accounting model. The new standard clarifies the definition of a lease, requires a dual approach to lease classification similar to current lease classifications, and causes lessees to recognize leases on the
14
Notes (Continued)
balance sheet as a lease liability with a corresponding right-of-use asset. ASU 2016-02 is effective for interim and annual periods beginning after December 15, 2018. Early adoption is permitted. The new standard requires a modified retrospective transition for capital or operating leases existing at or entered into after the beginning of the earliest comparative period presented in the financial statements. We are reviewing contracts to identify leases, particularly reviewing the applicability of the new standard to contracts involving easements/rights-of-way.
In May 2014, the FASB issued ASU 2014-09 establishing Accounting Standards Codification (ASC) Topic 606, "Revenue from Contracts with Customers" (ASC 606). ASC 606 establishes a comprehensive new revenue recognition model designed to depict the transfer of goods or services to a customer in an amount that reflects the consideration the entity expects to be entitled to receive in exchange for those goods or services and requires significantly enhanced revenue disclosures. In August 2015, the FASB issued ASU 2015-14 "Revenue from Contracts with Customers (Topic 606): Deferral of the Effective Date" (ASU 2015-14). Per ASU 2015-14, the standard is effective for interim and annual reporting periods beginning after December 15, 2017. ASC 606 allows either full retrospective or modified retrospective transition and early adoption is permitted for annual periods beginning after December 15, 2016.
We continue to evaluate the impact the standard may have on our financial statements. For each revenue contract type, we are conducting a formal contract review process to evaluate the impact, if any, that the new revenue standard may have. We have substantially completed that process, but continue to evaluate our accounting for noncash consideration, which exists in contracts where we receive commodities as full or partial consideration, and contracts with a significant financing component, which may exist in situations where the timing of the consideration we received varies significantly from the timing of when we provide the service. As such, we are unable to determine the potential impact upon the amount and timing of revenue recognition and related disclosures. Additionally, we have identified possible financial system and internal control changes necessary for adoption. We currently anticipate utilizing a modified retrospective transition upon the adoption of ASC 606 as of January 1, 2018.
Termination of WPZ Merger Agreement
On May 12, 2015, we entered into an agreement for a unit-for-stock transaction whereby we would have acquired all of the publicly held outstanding common units of WPZ in exchange for shares of our common stock (WPZ Merger Agreement).
On September 28, 2015, we entered into a Termination Agreement and Release (Termination Agreement), terminating the WPZ Merger Agreement. Under the terms of the Termination Agreement, we were required to pay a $428 million termination fee to WPZ, at which time we owned approximately 60 percent , including the interests of the general partner and incentive distribution rights (IDRs). Such termination fee settled through a reduction of quarterly incentive distributions we were entitled to receive from WPZ (such reduction not to exceed $209 million per quarter). The distributions from WPZ in November 2015, February 2016, and May 2016 were reduced by $209 million , $209 million , and $10 million , respectively, related to this termination fee.
Note 2 – Variable Interest Entities
WPZ
We own a 74 percent interest in WPZ, a master limited partnership that is a VIE due to the limited partners' lack of substantive voting rights, such as either participating rights or kick-out rights that can be exercised with a simple majority of the vote of the limited partners. We are the primary beneficiary of WPZ because we have the power, through our general partner interest, to direct the activities that most significantly impact WPZ's economic performance.
15
Notes (Continued)
The following table presents amounts included in our Consolidated Balance Sheet that are for the use or obligation of WPZ and/or its subsidiaries, and which comprise a significant portion of our consolidated assets and liabilities.
| March 31, | | December 31, 2016 | | Classification | ||||
| (Millions) | | | ||||||
Assets (liabilities): | | | | | | ||||
Cash and cash equivalents | $ | 625 | |
| $ | 145 | | | Cash and cash equivalents |
Trade accounts and other receivables – net | 861 | |
| 925 | |
| Trade accounts and other receivables | ||
Inventories | 148 | |
| 138 | |
| Inventories | ||
Assets held for sale | 1,023 | |
| 24 | |
| Assets held for sale | ||
Other current assets | 157 | |
| 181 | |
| Other current assets and deferred charges | ||
Investments | 6,738 | |
| 6,701 | |
| Investments | ||
Property, plant, and equipment - net | 27,364 | |
| 28,021 | | | Property, plant, and equipment - net | ||
Intangible assets – net | 9,569 | |
| 9,662 | |
| Intangible assets – net of accumulated amortization | ||
Regulatory assets, deferred charges, and other noncurrent assets | 453 | |
| 467 | |
| Regulatory assets, deferred charges, and other | ||
Accounts payable | (656 | ) |
| (589 | ) | | Accounts payable | ||
Liabilities held for sale | (43 | ) |
| - | |
| Liabilities held for sale | ||
Accrued liabilities including current asset retirement obligations | (1,099 | ) |
| (1,122 | ) |
| Accrued liabilities | ||
Commercial paper | - | |
| (93 | ) |
| Commercial paper | ||
Long-term debt due within one year | - | |
| (785 | ) |
| Long-term debt due within one year | ||
Long-term debt | (17,065 | ) |
| (17,685 | ) |
| Long-term debt | ||
Deferred income tax liabilities | (19 | ) |
| (20 | ) |
| Deferred income tax liabilities | ||
Noncurrent asset retirement obligations | (830 | ) |
| (798 | ) |
| Regulatory liabilities, deferred income, and other | ||
Regulatory liabilities, deferred income, and other noncurrent liabilities | (1,951 | ) |
| (1,860 | ) | | Regulatory liabilities, deferred income, and other | ||
The assets and liabilities presented in the table above also include the consolidated interests of the following individual VIEs within WPZ:
Gulfstar One
WPZ owns a 51 percent interest in Gulfstar One LLC (Gulfstar One), a subsidiary that, due to certain risk-sharing provisions in its customer contracts, is a VIE. Gulfstar One includes a proprietary floating-production system, Gulfstar FPS, and associated pipelines which provide production handling and gathering services in the eastern deepwater Gulf of Mexico. WPZ is the primary beneficiary because it has the power to direct the activities that most significantly impact Gulfstar One's economic performance.
Constitution
WPZ owns a 41 percent interest in Constitution, a subsidiary that, due to shipper fixed-payment commitments under its long-term firm transportation contracts, is a VIE. WPZ is the primary beneficiary because it has the power to direct the activities that most significantly impact Constitution's economic performance. WPZ, as construction manager for Constitution, is responsible for constructing the proposed pipeline connecting its gathering system in Susquehanna County, Pennsylvania, to the Iroquois Gas Transmission and the Tennessee Gas Pipeline systems. The total remaining
16
Notes (Continued)
cost of the project is estimated to be approximately $691 million , which is expected to be funded with capital contributions from WPZ and the other equity partners on a proportional basis.
In December 2014, Constitution received approval from the Federal Energy Regulatory Commission (FERC) to construct and operate its proposed pipeline. However, in April 2016, the New York State Department of Environmental Conservation (NYSDEC) denied a necessary water quality certification for the New York portion of the pipeline. We remain steadfastly committed to the project, and in May 2016, Constitution appealed the NYSDEC's denial of the water quality certification. The oral argument before the Second Circuit Court of Appeals regarding the NYSDEC's denial of Constitution's application for water quality certification under Section 401 of the Clean Water Act was held on November 16, 2016. We anticipate a decision from the Second Circuit Court of Appeals as early as the second quarter of 2017. In light of the NYSDEC's denial of the water quality certification and the actions taken to challenge the decision, the project in-service date is targeted as early as the second half of 2018, which assumes that the legal challenge process is satisfactorily and promptly concluded. An unfavorable resolution could result in the impairment of a significant portion of the capitalized project costs, which total $381 million on a consolidated basis at March 31, 2017, and are included within Property, plant, and equipment, at cost in the Consolidated Balance Sheet . Beginning in April 2016, we discontinued capitalization of development costs related to this project. It is also possible that we could incur certain supplier-related costs in the event of a prolonged delay or termination of the project.
Cardinal
WPZ owns a 66 percent interest in Cardinal Gas Services, L.L.C. (Cardinal), a subsidiary that provides gathering services for the Utica Shale region and is a VIE due to certain risks shared with customers. WPZ is the primary beneficiary because it has the power to direct the activities that most significantly impact Cardinal's economic performance. Future expansion activity is expected to be funded with capital contributions from WPZ and the other equity partner on a proportional basis.
Jackalope
WPZ owns a 50 percent interest in Jackalope Gas Gathering Services, L.L.C. (Jackalope), a subsidiary that provides gathering and processing services for the Powder River basin and is a VIE due to certain risks shared with customers. WPZ is the primary beneficiary because it has the power to direct the activities that most significantly impact Jackalope's economic performance. Future expansion activity is expected to be funded with capital contributions from WPZ and the other equity partner on a proportional basis.
Note 3 – Investing Activities
Acquisition of Additional Interests in Appalachia Midstream Investments
During the first quarter of 2017, WPZ exchanged all of its 50 percent interest in DBJV for an increased interest in two natural gas gathering systems that are part of the Appalachia Midstream Investments and $155 million in cash. This transaction was recorded based on our estimate of the fair value of the interests received as we have more insight to this value as we operate the underlying assets. Following this exchange, we have an approximate average 66 percent interest in the Appalachia Midstream Investments. We continue to account for this investment under the equity-method due to the significant participatory rights of our partners such that we do not exercise control. WPZ also sold all of its interest in Ranch Westex JV LLC for $45 million . These transactions resulted in a total gain of $269 million reflected in Other investing income (loss) – net in the Consolidated Statement of Operations .
The fair value of the increased interests in the Appalachia Midstream Investments received as consideration was estimated to be $1.1 billion using an income approach based on expected cash flows and an appropriate discount rate (a Level 3 measurement within the fair value hierarchy). The determination of estimated future cash flows involved significant assumptions regarding gathering volumes, rates, and related capital spending. A 9.5 percent discount rate was utilized and reflected our estimate of the cost of capital as impacted by market conditions and risks associated with the underlying business.
17
Notes (Continued)
Impairments
The three months ended March 31, 2016, includes $59 million and $50 million of other-than-temporary impairment charges related to WPZ's equity-method investments in DBJV and Laurel Mountain, respectively (see Note 10 – Fair Value Measurements and Guarantees ).
Interest Income and Other
The three months ended March 31, 2016, includes $18 million of income associated with a payment received on a receivable related to the sale of certain former Venezuela assets reflected in Other investing income (loss) – net in the Consolidated Statement of Operations .
Note 4 – Other Income and Expenses
The following table presents certain gains or losses reflected in Other (income) expense – net within Costs and expenses in our Consolidated Statement of Operations :
| Three Months Ended | ||||||
| 2017 |
| 2016 | ||||
| (Millions) | ||||||
Williams Partners |
|
|
| ||||
Net foreign currency exchange (gains) losses (1) | $ | - | |
| $ | 11 | |
Gains on contract settlements and terminations | (13 | ) |
| - | | ||
Other |
|
|
| ||||
Gain on sale of unused pipe | - | |
| (10 | ) | ||
|
(1) | Primarily relates to gains and losses incurred on foreign currency transactions and the remeasurement of U.S. dollar denominated current assets and liabilities within our former Canadian operations. |
Additional Items
Certain additional items included in the Consolidated Statement of Operations are as follows:
• | Service revenues were reduced by $15 million for the three months ended March 31, 2016 , related to potential refunds associated with a ruling received in certain rate case litigation within the Williams Partners segment. |
• | Selling, general, and administrative expenses at March 31, 2016 includes $34 million of project development costs related to a proposed propane dehydrogenation facility in Alberta, Canada within the Other segment. Beginning in the first quarter of 2016, these costs did not qualify for capitalization. |
• | Selling, general, and administrative expenses and Operating and maintenance expenses include $9 million in severance and other related costs for the three months ended March 31, 2017 for the Williams Partners segment. The three months ended March 31, 2016, included $26 million in severance and other related costs associated with an approximate 10 percent reduction in workforce in the first quarter of 2016, primarily within the Williams Partners segment. |
• | Other (income) expense – net below Operating income (loss) includes $18 million and $17 million for the three months ended March 31, 2017 and 2016, respectively, for allowance for equity funds used during construction primarily within the Williams Partners segment as well as $28 million and $4 million , respectively, of income associated with a regulatory asset related to deferred taxes on equity funds used during construction. |
18
Notes (Continued)
• | Other income (expense) – net below Operating income (loss) includes a net gain of $30 million associated with the February 2017, early retirement of $750 million of 6.125 percent senior unsecured notes that were due in 2022. (See Note 8 – Debt and Banking Arrangements .) The net gain within Williams Partners reflects $53 million of unamortized premium, partially offset by $23 million in premiums paid. |
Note 5 – Provision (Benefit) for Income Taxes
The Provision (benefit) for income taxes includes:
| Three Months Ended | ||||||
| 2017 |
| 2016 | ||||
| (Millions) | ||||||
Current: |
|
|
| ||||
Federal | $ | 3 | |
| $ | - | |
State | 6 | |
| - | | ||
| 9 | |
| - | | ||
Deferred: |
|
|
| ||||
Federal | 15 | |
| (5 | ) | ||
State | 13 | |
| 7 | | ||
| 28 | |
| 2 | | ||
Provision (benefit) for income taxes | $ | 37 | |
| $ | 2 | |
The effective income tax rate for the total provision for the three months ended March 31, 2017 , is less than the federal statutory rate primarily due to releasing a $127 million valuation allowance on a capital loss carryover and the impact of nontaxable noncontrolling interests, partially offset by the effect of state income taxes. In 2016, we recorded a valuation allowance on a capital loss that was incurred with the sale of our Canadian operations. The pending sale of the Geismar olefins facility (see Note 1 – General, Description of Business, and Basis of Presentation ) is expected to generate capital gains sufficient to offset the capital loss carryover, thereby allowing us to reverse the valuation allowance in full.
The effective income tax rate for the total provision for the three months ended March 31, 2016 , is unfavorable relative to the federal statutory rate primarily due to the effect of state income taxes and the impact of nontaxable noncontrolling interests, partially offset by taxes on foreign operations.
During the next 12 months, we do not expect ultimate resolution of any unrecognized tax benefit associated with domestic or international matters to have a material impact on our unrecognized tax benefit position.
19
Notes (Continued)
| Three Months Ended | ||||||
| 2017 |
| 2016 | ||||
| (Dollars in millions, except per-share amounts; shares in thousands) | ||||||
Net income (loss) attributable to The Williams Companies, Inc. available to common stockholders for basic and diluted earnings (loss) per common share | $ | 373 | |
| $ | (65 | ) |
Basic weighted-average shares | 824,548 | |
| 750,332 | | ||
Effect of dilutive securities: |
|
|
| ||||
Nonvested restricted stock units | 1,305 | |
| - | | ||
Stock options | 623 | |
| - | | ||
Diluted weighted-average shares | 826,476 | |
| 750,332 | | ||
Earnings (loss) per common share: |
|
|
| ||||
Basic | $ | .45 | |
| $ | (.09 | ) |
Diluted | $ | .45 | |
| $ | (.09 | ) |
Note 7 – Employee Benefit Plans
| Pension Benefits | ||||||
| Three Months Ended | ||||||
| 2017 | | 2016 | ||||
| (Millions) | ||||||
Components of net periodic benefit cost: | | | | ||||
Service cost | $ | 13 | | | $ | 14 | |
Interest cost | 15 | | | 15 | | ||
Expected return on plan assets | (20 | ) | | (21 | ) | ||
Amortization of net actuarial loss | 7 | | | 8 | | ||
Net periodic benefit cost | $ | 15 | | | $ | 16 | |
| Other Postretirement Benefits | ||||||
| Three Months Ended | ||||||
| 2017 |
| 2016 | ||||
| (Millions) | ||||||
Components of net periodic benefit cost (credit): |
|
|
| ||||
Interest cost | $ | 2 | |
| $ | 2 | |
Expected return on plan assets | (3 | ) |
| (3 | ) | ||
Amortization of prior service credit | (3 | ) |
| (3 | ) | ||
Reclassification to regulatory liability | 1 | |
| 1 | | ||
Net periodic benefit cost (credit) | $ | (3 | ) |
| $ | (3 | ) |
Amortization of prior service credit and net actuarial loss included in net periodic benefit cost (credit) for our other postretirement benefit plans associated with Transco and Northwest Pipeline are recorded to regulatory assets/
20
Notes (Continued)
liabilities instead of other comprehensive income (loss). The amounts of amortization of prior service credit recognized in regulatory liabilities were $2 million for the three months ended March 31, 2017 and 2016 .
During the three months ended March 31, 2017 , we contributed $1 million to our pension plans and $1 million to our other postretirement benefit plans. We presently anticipate making additional contributions of approximately $62 million to our pension plans and approximately $6 million to our other postretirement benefit plans in the remainder of 2017.
Note 8 – Debt and Banking Arrangements
Long-Term Debt
Issuances and retirements
On April 3, 2017, Northwest Pipeline issued $250 million of 4.0 percent senior unsecured notes due 2027 to investors in a private debt placement. Northwest Pipeline used the net proceeds to retire $185 million of 5.95 percent senior unsecured notes that matured on April 15, 2017, which are classified as long-term in the accompanying Consolidated Balance Sheet due to Northwest Pipeline's intent and ability to refinance, and for general corporate purposes. As part of the new issuance, Northwest Pipeline entered into a registration rights agreement with the initial purchasers of the unsecured notes. Northwest Pipeline is obligated to file and consummate a registration statement for an offer to exchange the notes for a new issue of substantially identical notes registered under the Securities Act of 1933, as amended, within 365 days from closing and to use commercially reasonable efforts to complete the exchange offer. Northwest Pipeline is required to provide a shelf registration statement to cover resales of the notes under certain circumstances. If Northwest Pipeline fails to fulfill these obligations, additional interest will accrue on the affected securities. The rate of additional interest will be 0.25 percent per annum on the principal amount of the affected securities for the first 90-day period immediately following the occurrence of a registration default, increasing by an additional 0.25 percent per annum with respect to each subsequent 90-day period thereafter, up to a maximum amount for all such registration defaults of 0.5 percent annually. Following the cure of any registration defaults, the accrual of additional interest will cease.
On February 23, 2017, utilizing proceeds received from the Financial Repositioning (see Note 1 – General, Description of Business, and Basis of Presentation ) , WPZ early retired $750 million of 6.125 percent senior unsecured notes that were due in 2022.
WPZ retired $600 million of 7.25 percent senior unsecured notes that matured on February 1, 2017.
Commercial Paper Program
As of March 31, 2017, no Commercial paper was outstanding under WPZ's $3 billion commercial paper program.
Credit Facilities
| March 31, 2017 | ||||||
| Stated Capacity |
| Outstanding | ||||
| (Millions) | ||||||
WMB |
|
|
| ||||
Long-term credit facility | $ | 1,500 | |
| $ | 595 | |
Letters of credit under certain bilateral bank agreements |
|
| 13 | | |||
WPZ |
|
|
| ||||
Long-term credit facility (1) | 3,500 | |
| - | | ||
Letters of credit under certain bilateral bank agreements |
|
| 1 | | |||
|
(1) | In managing our available liquidity, we do not expect a maximum outstanding amount in excess of the capacity of WPZ's credit facility inclusive of any outstanding amounts under its commercial paper program. |
21
Notes (Continued)
Note 9 – Stockholders' Equity
In January 2017, we issued 65 million shares of common stock in a public offering at a price of $29.00 per share. In February 2017, we issued 9.75 million shares of common stock pursuant to the full exercise of the underwriter's option to purchase additional shares. The net proceeds of approximately $2.1 billion were used to purchase newly issued common units in WPZ as part of our Financial Repositioning. (See Note 1 – General, Description of Business, and Basis of Presentation .)
AOCI
The following table presents the changes in Accumulated other comprehensive income (loss) (AOCI) by component, net of income taxes:
| Cash Flow Hedges |
| Foreign Currency Translation |
| Pension and Other Post Retirement Benefits |
| Total | ||||||||
| (Millions) | ||||||||||||||
Balance at December 31, 2016 | $ | - | |
| $ | (2 | ) |
| $ | (337 | ) |
| $ | (339 | ) |
Other comprehensive income (loss) before reclassifications | 2 | |
| - | |
| - | |
| 2 | | ||||
Amounts reclassified from accumulated other comprehensive income (loss) | - | |
| - | |
| 3 | |
| 3 | | ||||
Other comprehensive income (loss) | 2 | |
| - | |
| 3 | |
| 5 | | ||||
Balance at March 31, 2017 | $ | 2 | |
| $ | (2 | ) |
| $ | (334 | ) |
| $ | (334 | ) |
Reclassifications out of AOCI are presented in the following table by component for the three months ended March 31, 2017 :
|
|
|
|
| ||
Component |
| Reclassifications |
| Classification | ||
|
| (Millions) |
|
| ||
Pension and other postretirement benefits: |
|
|
|
| ||
Amortization of prior service cost (credit) included in net periodic benefit cost |
| $ | (1 | ) |
| Note 7 – Employee Benefit Plans |
Amortization of actuarial (gain) loss included in net periodic benefit cost |
| 7 | |
| Note 7 – Employee Benefit Plans | |
Total pension and other postretirement benefits |
| 6 | |
|
| |
Income tax benefit |
| (3 | ) |
| Provision (benefit) for income taxes | |
Reclassifications during the period |
| $ | 3 | |
|
|
22
Notes (Continued)
Note 10 – Fair Value Measurements and Guarantees
The following table presents, by level within the fair value hierarchy, certain of our financial assets and liabilities. The carrying values of cash and cash equivalents, accounts receivable, commercial paper, and accounts payable approximate fair value because of the short-term nature of these instruments. Therefore, these assets and liabilities are not presented in the following table.
|
|
|
|
|
| Fair Value Measurements Using | ||||||||||||||
|
| Carrying Amount |
| Fair Value |
| Quoted Prices In Active Markets for Identical Assets (Level 1) |
| Significant Other Observable Inputs (Level 2) |
| Significant Unobservable Inputs (Level 3) | ||||||||||
|
| (Millions) | ||||||||||||||||||
Assets (liabilities) at March 31, 2017: |
|
|
|
|
|
|
|
|
|
| ||||||||||
Measured on a recurring basis: |
|
|
|
|
|
|
|
|
|
| ||||||||||
ARO Trust investments |
| $ | 112 | |
| $ | 112 | |
| $ | 112 | |
| $ | - | |
| $ | - | |
Energy derivatives assets designated as hedging instruments |
| 5 | |
| 5 | |
| 5 | |
| - | |
| - | | |||||
Energy derivatives assets not designated as hedging instruments |
| 2 | |
| 2 | |
| 1 | |
| - | |
| 1 | | |||||
Energy derivatives liabilities not designated as hedging instruments |
| (4 | ) |
| (4 | ) |
| - | |
| - | |
| (4 | ) | |||||
Additional disclosures: |
|
|
|
|
|
|
|
|
|
| ||||||||||
Other receivables |
| 5 | |
| 5 | |
| 5 | |
| - | |
| - | | |||||
Long-term debt |
| (21,825 | ) |
| (23,055 | ) |
| - | |
| (23,055 | ) |
| - | | |||||
Guarantees |
| (44 | ) |
| (31 | ) |
| - | |
| (15 | ) |
| (16 | ) | |||||
|
|
|
|
|
|
|
|
|
|
| ||||||||||
Assets (liabilities) at December 31, 2016: |
|
|
|
|
|
|
|
|
|
| ||||||||||
Measured on a recurring basis: |
|
|
|
|
|
|
|
|
|
| ||||||||||
ARO Trust investments |
| $ | 96 | |
| $ | 96 | |
| $ | 96 | |
| $ | - | |
| $ | - | |
Energy derivatives assets designated as hedging instruments |
| 2 | |
| 2 | |
| - | |
| 2 | |
| - | | |||||
Energy derivatives assets not designated as hedging instruments |
| 1 | |
| 1 | |
| - | |
| - | |
| 1 | | |||||
Energy derivatives liabilities not designated as hedging instruments |
| (6 | ) |
| (6 | ) |
| - | |
| - | |
| (6 | ) | |||||
Additional disclosures: |
|
|
|
|
|
|
|
|
|
| ||||||||||
Other receivables |
| 15 | |
| 15 | |
| 15 | |
| - | |
| - | | |||||
Long-term debt, including current portion |
| (23,409 | ) |
| (24,090 | ) |
| - | |
| (24,090 | ) |
| - | | |||||
Guarantees |
| (44 | ) |
| (30 | ) |
| - | |
| (14 | ) |
| (16 | ) | |||||
Fair Value Methods
We use the following methods and assumptions in estimating the fair value of our financial instruments:
Assets and liabilities measured at fair value on a recurring basis
ARO Trust investments : Transco deposits a portion of its collected rates, pursuant to its rate case settlement, into an external trust (ARO Trust) that is specifically designated to fund future asset retirement obligations (ARO). The ARO Trust invests in a portfolio of actively traded mutual funds that are measured at fair value on a recurring basis based on quoted prices in an active market, is classified as available-for-sale, and is reported in Regulatory assets, deferred charges, and other in the Consolidated Balance Sheet. Both realized and unrealized gains and losses are ultimately recorded as regulatory assets or liabilities.
Energy derivatives : Energy derivatives include commodity based exchange-traded contracts and over-the-counter contracts, which consist of physical forwards, futures, and swaps that are measured at fair value on a recurring basis.
23
Notes (Continued)
The fair value amounts are presented on a gross basis and do not reflect the netting of asset and liability positions permitted under the terms of our master netting arrangements. Further, the amounts do not include cash held on deposit in margin accounts that we have received or remitted to collateralize certain derivative positions. Energy derivatives assets are reported in Other current assets and deferred charges and Regulatory assets, deferred charges, and other in the Consolidated Balance Sheet. Energy derivatives liabilities are reported in Accrued liabilities and Regulatory liabilities, deferred income, and other in the Consolidated Balance Sheet.
Reclassifications of fair value between Level 1, Level 2, and Level 3 of the fair value hierarchy, if applicable, are made at the end of each quarter. No transfers between Level 1 and Level 2 occurred during the three months ended March 31, 2017 or 2016 .
Additional fair value disclosures
Other receivables: Other receivables consist of margin deposits, which are reported in Other current assets and deferred charges in the Consolidated Balance Sheet. The disclosed fair value of our margin deposits is considered to approximate the carrying value generally due to the short-term nature of these items.
Long-term debt : The disclosed fair value of our long-term debt is determined by a market approach using broker quoted indicative period-end bond prices. The quoted prices are based on observable transactions in less active markets for our debt or similar instruments.
Guarantees : Guarantees primarily consist of a guarantee we have provided in the event of nonpayment by our previously owned communications subsidiary, Williams Communications Group (WilTel), on a lease performance obligation that extends through 2042. Guarantees also include an indemnification related to a disposed operation.
To estimate the disclosed fair value of the WilTel guarantee, an estimated default rate is applied to the sum of the future contractual lease payments using an income approach. The estimated default rate is determined by obtaining the average cumulative issuer-weighted corporate default rate based on the credit rating of WilTel's current owner and the term of the underlying obligation. The default rate is published by Moody's Investors Service. The carrying value of the WilTel guarantee is reported in Accrued liabilities in the Consolidated Balance Sheet. The maximum potential undiscounted exposure is approximately $31 million at March 31, 2017 . Our exposure declines systematically through the remaining term of WilTel's obligation.
The fair value of the guarantee associated with the indemnification related to a disposed operation was estimated using an income approach that considered probability-weighted scenarios of potential levels of future performance. The terms of the indemnification do not limit the maximum potential future payments associated with the guarantee. The carrying value of this guarantee is reported in Regulatory liabilities, deferred income, and other in the Consolidated Balance Sheet.
We are required by our revolving credit agreements to indemnify lenders for certain taxes required to be withheld from payments due to the lenders and for certain tax payments made by the lenders. The maximum potential amount of future payments under these indemnifications is based on the related borrowings and such future payments cannot currently be determined. These indemnifications generally continue indefinitely unless limited by the underlying tax regulations and have no carrying value. We have never been called upon to perform under these indemnifications and have no current expectation of a future claim.
24
Notes (Continued)
Nonrecurring fair value measurements
The following table presents impairments of investments associated with certain nonrecurring fair value measurements within Level 3 of the fair value hierarchy.
|
|
|
|
|
|
|
|
| Impairments | ||||||||
|
|
|
|
|
|
|
|
| Three Months Ended March 31, | ||||||||
| Classification |
| Segment |
| Date of Measurement |
| Fair Value |
| 2017 |
| 2016 | ||||||
|
|
|
|
|
|
| (Millions) | ||||||||||
Equity-method investments (1) | Investments |
| Williams Partners |
| March 31, 2016 |
| $ | 1,294 | |
| $ | - | |
| $ | 109 | |
Other equity-method investment | Investments |
| Williams Partners |
| March 31, 2016 |
| - | |
| - | |
| 3 | | |||
Impairment of equity-method investments |
|
|
|
|
|
|
|
| $ | - | |
| $ | 112 | | ||
___________
(1) | Relates to equity-method investments in DBJV and Laurel Mountain. Our carrying values in these equity-method investments had been written down to fair value at December 31, 2015. Our first-quarter 2016 analysis reflected higher discount rates for both of these investments, along with lower natural gas prices for Laurel Mountain. We estimated the fair value of these investments using an income approach based on expected future cash flows and appropriate discount rates. The determination of estimated future cash flows involved significant assumptions regarding gathering volumes and related capital spending. Discount rates utilized ranged from 13.0 percent to 13.3 percent and reflected increases in our estimated cost of capital, revised estimates of expected future cash flows, and risks associated with the underlying businesses. |
Note 11 – Contingent Liabilities
Reporting of Natural Gas-Related Information to Trade Publications
Direct and indirect purchasers of natural gas in various states filed an individual and class actions against us, our former affiliate WPX and its subsidiaries, and others alleging the manipulation of published gas price indices and seeking unspecified amounts of damages. Such actions were transferred to the Nevada federal district court for consolidation of discovery and pre-trial issues. We have agreed to indemnify WPX and its subsidiaries related to this matter.
In the individual action, filed by Farmland Industries Inc. (Farmland), the court issued an order on May 24, 2016, granting one of our co-defendant's motion for summary judgment as to Farmland's claims. On January 5, 2017, the court extended such ruling to us, entering final judgment in our favor. Farmland has appealed.
In the putative class actions, on March 30, 2017, the court issued an order denying the plaintiffs' motions for class certification. On April 13, 2017, the plaintiffs filed a petition for permission to appeal such order with the United States Court of Appeals for the Ninth Circuit.
Because of the uncertainty around the remaining pending unresolved issues, we cannot reasonably estimate a range of potential exposure at this time. However, it is reasonably possible that the ultimate resolution of these actions and our related indemnification obligation could result in a potential loss that may be material to our results of operations. In connection with this indemnification, we have an accrued liability balance associated with this matter, and as a result, have exposure to future developments in this matter.
Geismar Incident
On June 13, 2013, an explosion and fire occurred at our Geismar olefins plant and rendered the facility temporarily inoperable (Geismar Incident). As a result, there were two fatalities and numerous individuals (including employees and contractors) reported injuries. We are addressing the following contingent liabilities in connection with the Geismar Incident.
25
Notes (Continued)
On October 21, 2013, the U.S. Environmental Protection Agency (EPA) issued an Inspection Report pursuant to the Clean Air Act's Risk Management Program following its inspection of the facility on June 24 through June 28, 2013. The report notes the EPA's preliminary determinations about the facility's documentation regarding process safety, process hazard analysis, as well as operating procedures, employee training, and other matters. On June 16, 2014, we received a request for information related to the Geismar Incident from the EPA under Section 114 of the Clean Air Act to which we responded on August 13, 2014. The EPA could issue penalties pertaining to final determinations.
Multiple lawsuits, including class actions for alleged offsite impacts, property damage, customer claims, and personal injury, have been filed against us. The first two trials, for nine plaintiffs claiming personal injury, were held in Louisiana state court in Iberville Parish, Louisiana in September and November 2016. The juries returned adverse verdicts against us, our subsidiary Williams Olefins, LLC, and other defendants. To date, we have settled those cases as well as settled or agreed in principle to settle numerous other personal injury claims, and such aggregate amount greater than our $2 million retention (deductible) value has been or will be recovered from our insurers. We believe these settlements to date substantially resolve any material exposure to such claims arising from the Geismar Incident. We believe that any additional losses arising from our alleged liability will be immaterial to our expected future annual results of operations, liquidity, and financial position and will be substantially covered by our general liability insurance policy, which has an aggregate limit of $610 million applicable to this event.
Alaska Refinery Contamination Litigation
In 2010, James West filed a class action lawsuit in state court in Fairbanks, Alaska on behalf of individual property owners whose water contained sulfolane contamination allegedly emanating from the Flint Hills Oil Refinery in North Pole, Alaska. The suit named our subsidiary, Williams Alaska Petroleum Inc. (WAPI), and Flint Hills Resources Alaska, LLC (FHRA), a subsidiary of Koch Industries, Inc., as defendants. We owned and operated the refinery until 2004 when we sold it to FHRA. We and FHRA made claims under the pollution liability insurance policy issued in connection with the sale of the North Pole refinery to FHRA. We and FHRA also filed claims against each other seeking, among other things, contractual indemnification alleging that the other party caused the sulfolane contamination. In 2011, we and FHRA settled the James West claim. Certain claims by FHRA against us were resolved by the Alaska Supreme Court in our favor. FHRA's claims against us for contractual indemnification and statutory claims for damages related to off-site sulfolane remain pending.
On March 6, 2014, the State of Alaska filed suit against FHRA, WAPI, and us in state court in Fairbanks seeking injunctive relief and damages in connection with sulfolane contamination of the water supply near the Flint Hills Oil Refinery in North Pole, Alaska. On May 5, 2014, FHRA filed cross-claims against us in the State of Alaska suit for contractual indemnification and statutory claims for damages related to off-site sulfolane.
On November 26, 2014, the City of North Pole (North Pole) filed suit in Alaska state court in Fairbanks against FHRA, WAPI, and us alleging nuisance and violations of municipal ordinances and state statutes based upon the same alleged sulfolane contamination of the water supply. North Pole claims an unspecified amount of past and future damages as well as punitive damages against WAPI. FHRA filed cross-claims against us.
In October of 2015, the court consolidated the State of Alaska and North Pole cases. Both we and WAPI asserted counter claims against both the State of Alaska and North Pole, and cross claims against FHRA. The underlying factual basis and claims in the consolidated State of Alaska and North Pole action are similar to and may duplicate exposure in the James West case. As such, on February 9, 2017, the remaining claims in the James West case were consolidated into the State of Alaska and North Pole action. A trial is scheduled to commence in the fall of 2017 that will encompass all three consolidated cases. Due to the ongoing assessment of the level and extent of sulfolane contamination, the lack of an articulated cleanup level for sulfolane, and the lack of a concrete remedial proposal and cost estimate, we are unable to estimate a range of exposure to the State of Alaska or North Pole at this time. We currently estimate that our reasonably possible loss exposure to Flint Hills could range from an insignificant amount up to $32 million , although uncertainties inherent in the litigation process, expert evaluations, and jury dynamics might cause our exposure to exceed that amount.
26
Notes (Continued)
Independent of the litigation matter described in the preceding paragraphs, in 2013, the Alaska Department of Environmental Conservation indicated that it views FHRA and us as responsible parties, and that it intended to enter a compliance order to address the environmental remediation of sulfolane and other possible contaminants including cleanup work outside the refinery's boundaries. Due to the ongoing assessment of the level and extent of sulfolane contamination and the ultimate cost of remediation and division of costs among the potentially responsible parties, we are unable to estimate a range of exposure at this time.
Royalty Matters
Certain of our customers, including one major customer, have been named in various lawsuits alleging underpayment of royalties and claiming, among other things, violations of anti-trust laws and the Racketeer Influenced and Corrupt Organizations Act. We have also been named as a defendant in certain of these cases in Pennsylvania based on allegations that we improperly participated with that major customer in causing the alleged royalty underpayments. We believe that the claims asserted are subject to indemnity obligations owed to us by that major customer. Due to the preliminary status of the cases, we are unable to estimate a range of potential loss at this time.
Shareholder Litigation
Between October 2015 and December 2015, purported shareholders of us filed six putative class action lawsuits in the Delaware Court of Chancery that were consolidated into a single suit on January 13, 2016. This consolidated putative class action lawsuit relates to our terminated merger with Energy Transfer Equity, L.P. (Energy Transfer). The complaint asserts various claims against the individual members of our Board of Directors, including that they breached their fiduciary duties by agreeing to sell us through an allegedly unfair process and for an allegedly unfair price and by allegedly failing to disclose allegedly material information about the merger. The complaint seeks, among other things, an injunction against the merger and an award of costs and attorneys' fees. On March 22, 2016, the court granted the parties' proposed order in the consolidated action to stay the proceedings pending the close of the transaction with Energy Transfer. The plaintiffs have not filed an amended complaint.
A purported shareholder filed a separate class action lawsuit in the Delaware Court of Chancery on January 15, 2016. The putative class action complaint alleged that the individual members of our Board of Directors breached their fiduciary duties by, among other things, agreeing to the WPZ Merger Agreement, which purportedly reduced the merger consideration to have been received in the subsequently proposed but now terminated merger with Energy Transfer. The plaintiff filed a motion to voluntarily dismiss, which the court granted on January 13, 2017. On September 2, 2016, the same purported shareholder filed a derivative action claiming that the members of our Board of Directors breached their fiduciary duties by executing the WPZ Merger Agreement as a defensive measure against Energy Transfer. On September 28, 2016, we requested the court dismiss this action also.
On March 7, 2016, a purported unitholder of WPZ filed a putative class action on behalf of certain purchasers of WPZ units in U.S. District Court in Oklahoma. The action names as defendants us, WPZ, Williams Partners GP LLC, Alan S. Armstrong, and Donald R. Chappel and alleges violations of certain federal securities laws for failure to disclose Energy Transfer's intention to pursue a purchase of us conditioned on us not closing the WPZ Merger Agreement when announcing the WPZ Merger Agreement. The complaint seeks, among other things, damages and an award of costs and attorneys' fees. The plaintiff filed an amended complaint on August 31, 2016. On October 17, 2016, we requested the court dismiss the action, and on March 8, 2017, the court dismissed the complaint with prejudice. On April 7, 2017, the plaintiff filed a notice of appeal. We cannot reasonably estimate a range of potential loss at this time.
Litigation against Energy Transfer and related parties
On April 6, 2016, we filed suit in Delaware Chancery Court against Energy Transfer and LE GP, LLC (the general partner for Energy Transfer) alleging willful and material breaches of the Agreement and Plan of Merger (Merger Agreement) with Energy Transfer resulting from the private offering by Energy Transfer on March 8, 2016, of Series A Convertible Preferred Units (Special Offering) to certain Energy Transfer insiders and other accredited investors. The suit seeks, among other things, an injunction ordering the defendants to unwind the Special Offering and to specifically perform their obligations under the Merger Agreement. On April 19, 2016, we filed an amended complaint seeking the same relief. On May 3, 2016, Energy Transfer and LE GP, LLC filed an answer and counterclaims.
27
Notes (Continued)
On May 13, 2016, we filed a separate complaint in Delaware Chancery Court against Energy Transfer, LE GP, LLC, and the other Energy Transfer affiliates that are parties to the Merger Agreement, alleging material breaches of the Merger Agreement for failing to cooperate and use necessary efforts to obtain a tax opinion required under the Merger Agreement (Tax Opinion) and for otherwise failing to use necessary efforts to consummate the merger under the Merger Agreement wherein we would be merged with and into the newly formed Energy Transfer Corp LP (ETC) (ETC Merger). The suit sought, among other things, a declaratory judgment and injunction preventing Energy Transfer from terminating or otherwise avoiding its obligations under the Merger Agreement due to any failure to obtain the Tax Opinion.
The Court of Chancery coordinated the Special Offering and Tax Opinion suits. On May 20, 2016, the Energy Transfer defendants filed amended affirmative defenses and verified counterclaims in the Special Offering and Tax Opinion suits, alleging certain breaches of the Merger Agreement by us and seeking, among other things, a declaration that we were not entitled to specific performance, that Energy Transfer could terminate the ETC Merger, and that Energy Transfer is entitled to a $1.48 billion termination fee. On June 24, 2016, following a two-day trial, the court issued a Memorandum Opinion and Order denying our requested relief in the Tax Opinion suit. The court did not rule on the substance of our claims related to the Special Offering or on the substance of Energy Transfer's counterclaims. On June 27, 2016, we filed an appeal of the court's decision with the Supreme Court of Delaware, seeking reversal and remand to pursue damages. On March 23, 2017, the Supreme Court of Delaware affirmed the Court of Chancery's ruling. On March 30, 2017, we filed a motion for reargument with the Supreme Court of Delaware, which was denied on April 5, 2017.
On September 16, 2016, we filed an amended complaint with the Court of Chancery seeking damages for breaches of the Merger Agreement by defendants. On September 23, 2016, Energy Transfer filed a second amended and supplemental affirmative defenses and verified counterclaim with the Court of Chancery seeking, among other things, payment of the $1.48 billion termination fee due to our alleged breaches of the Merger Agreement. We filed a motion to dismiss Energy Transfer's counterclaims, which was fully briefed on November 14, 2016, and oral argument occurred on November 30, 2016.
Environmental Matters
We are a participant in certain environmental activities in various stages including assessment studies, cleanup operations, and remedial processes at certain sites, some of which we currently do not own. We are monitoring these sites in a coordinated effort with other potentially responsible parties, the EPA, and other governmental authorities. We are jointly and severally liable along with unrelated third parties in some of these activities and solely responsible in others. Certain of our subsidiaries have been identified as potentially responsible parties at various Superfund and state waste disposal sites. In addition, these subsidiaries have incurred, or are alleged to have incurred, various other hazardous materials removal or remediation obligations under environmental laws. As of March 31, 2017 , we have accrued liabilities totaling $40 million for these matters, as discussed below. Our accrual reflects the most likely costs of cleanup, which are generally based on completed assessment studies, preliminary results of studies, or our experience with other similar cleanup operations. Certain assessment studies are still in process for which the ultimate outcome may yield significantly different estimates of most likely costs. Any incremental amount in excess of amounts currently accrued cannot be reasonably estimated at this time due to uncertainty about the actual number of contaminated sites ultimately identified, the actual amount and extent of contamination discovered, and the final cleanup standards mandated by the EPA and other governmental authorities.
The EPA and various state regulatory agencies routinely promulgate and propose new rules, and issue updated guidance to existing rules. More recent rules and rulemakings include, but are not limited to, rules for reciprocating internal combustion engine maximum achievable control technology, new air quality standards for one hour nitrogen dioxide emissions, and volatile organic compound and methane new source performance standards impacting design and operation of storage vessels, pressure valves, and compressors. On October 1, 2015, the EPA issued its new rule regarding National Ambient Air Quality Standards for ground-level ozone, setting a new standard of 70 parts per billion . We are monitoring the rule's implementation and evaluating potential impacts to our operations. For these and other new regulations, we are unable to estimate the costs of asset additions or modifications necessary to comply due to uncertainty created by the various legal challenges to these regulations and the need for further specific regulatory guidance.
28
Notes (Continued)
Continuing operations
Our interstate gas pipelines are involved in remediation activities related to certain facilities and locations for polychlorinated biphenyls, mercury, and other hazardous substances. These activities have involved the EPA and various state environmental authorities, resulting in our identification as a potentially responsible party at various Superfund waste sites. At March 31, 2017 , we have accrued liabilities of $9 million for these costs. We expect that these costs will be recoverable through rates.
We also accrue environmental remediation costs for natural gas underground storage facilities, primarily related to soil and groundwater contamination. At March 31, 2017 , we have accrued liabilities totaling $8 million for these costs.
Former operations, including operations classified as discontinued
We have potential obligations in connection with assets and businesses we no longer operate. These potential obligations include remediation activities at the direction of federal and state environmental authorities and the indemnification of the purchasers of certain of these assets and businesses for environmental and other liabilities existing at the time the sale was consummated. Our responsibilities relate to the operations of the assets and businesses described below.
• | Former agricultural fertilizer and chemical operations and former retail petroleum and refining operations; |
• | Former petroleum products and natural gas pipelines; |
• | Former petroleum refining facilities; |
• | Former exploration and production and mining operations; |
• | Former electricity and natural gas marketing and trading operations. |
At March 31, 2017 , we have accrued environmental liabilities of $23 million related to these matters.
Other Divestiture Indemnifications
Pursuant to various purchase and sale agreements relating to divested businesses and assets, we have indemnified certain purchasers against liabilities that they may incur with respect to the businesses and assets acquired from us. The indemnities provided to the purchasers are customary in sale transactions and are contingent upon the purchasers incurring liabilities that are not otherwise recoverable from third parties. The indemnities generally relate to breach of warranties, tax, historic litigation, personal injury, property damage, environmental matters, right of way, and other representations that we have provided.
At March 31, 2017 , other than as previously disclosed, we are not aware of any material claims against us involving the indemnities; thus, we do not expect any of the indemnities provided pursuant to the sales agreements to have a material impact on our future financial position. Any claim for indemnity brought against us in the future may have a material adverse effect on our results of operations in the period in which the claim is made.
In addition to the foregoing, various other proceedings are pending against us which are incidental to our operations.
Summary
We have disclosed our estimated range of reasonably possible losses for certain matters above, as well as all significant matters for which we are unable to reasonably estimate a range of possible loss. We estimate that for all other matters for which we are able to reasonably estimate a range of loss, our aggregate reasonably possible losses beyond amounts accrued are immaterial to our expected future annual results of operations, liquidity, and financial position. These calculations have been made without consideration of any potential recovery from third parties.
29
Notes (Continued)
Note 12 – Segment Disclosures
We have one reportable segment, Williams Partners. All remaining business activities are included in Other. (See Note 1 – General, Description of Business, and Basis of Presentation .)
Our segment presentation of Williams Partners, which includes our consolidated master limited partnership, is reflective of the parent-level focus by our chief operating decision-maker, considering the resource allocation and governance provisions associated with the master limited partnership structure. This partnership maintains capital and cash management structures that are separate from ours. It is self-funding and maintains its own lines of bank credit and cash management accounts. These factors, coupled with different costs of capital from our other businesses, serve to differentiate the management of this entity as a whole.
Performance Measurement
We evaluate segment operating performance based upon Modified EBITDA (earnings before interest, taxes, depreciation, and amortization). This measure represents the basis of our internal financial reporting and is the primary performance measure used by our chief operating decision maker in measuring performance and allocating resources among our reportable segments.
We define Modified EBITDA as follows:
• Net income (loss) before:
◦ Income (loss) from discontinued operations;
◦ Provision (benefit) for income taxes;
◦ Interest incurred, net of interest capitalized;
◦ Equity earnings (losses);
◦ Gain on remeasurement of equity-method investment;
◦ Impairment of equity-method investments;
◦ Other investing income (loss) – net;
◦ Impairment of goodwill;
◦ Depreciation and amortization expenses;
◦ Accretion expense associated with asset retirement obligations for nonregulated operations.
• | This measure is further adjusted to include our proportionate share (based on ownership interest) of Modified EBITDA from our equity-method investments calculated consistently with the definition described above. |
30
Notes (Continued)
The following table reflects the reconciliation of Segment revenues to Total revenues as reported in the Consolidated Statement of Operations and Total assets by reportable segment.
| Williams Partners |
| Other |
| Eliminations |
| Total | ||||||||
| (Millions) | ||||||||||||||
Three Months Ended March 31, 2017 | |||||||||||||||
Segment revenues: |
|
|
|
|
|
|
| ||||||||
Service revenues |
|
|
|
|
|
|
| ||||||||
External | $ | 1,256 | |
| $ | 5 | |
| $ | - | |
| $ | 1,261 | |
Internal | - | |
| 3 | |
| (3 | ) |
| - | | ||||
Total service revenues | 1,256 | |
| 8 | |
| (3 | ) |
| 1,261 | | ||||
Product sales |
|
|
|
|
|
|
| ||||||||
External | 727 | |
| - | |
| - | |
| 727 | | ||||
Internal | - | |
| - | |
| - | |
| - | | ||||
Total product sales | 727 | |
| - | |
| - | |
| 727 | | ||||
Total revenues | $ | 1,983 | |
| $ | 8 | |
| $ | (3 | ) |
| $ | 1,988 | |
|
|
|
|
|
|
|
| ||||||||
Three Months Ended March 31, 2016 | |||||||||||||||
Segment revenues: |
|
|
|
|
|
|
| ||||||||
Service revenues |
|
|
|
|
|
|
| ||||||||
External | $ | 1,222 | |
| $ | 7 | |
| $ | - | |
| $ | 1,229 | |
Internal | 4 | |
| 11 | |
| (15 | ) |
| - | | ||||
Total service revenues | 1,226 | |
| 18 | |
| (15 | ) |
| 1,229 | | ||||
Product sales |
|
|
|
|
|
|
| ||||||||
External | 428 | |
| 3 | |
| - | |
| 431 | | ||||
Internal | - | |
| - | |
| - | |
| - | | ||||
Total product sales | 428 | |
| 3 | |
| - | |
| 431 | | ||||
Total revenues | $ | 1,654 | |
| $ | 21 | |
| $ | (15 | ) |
| $ | 1,660 | |
|
|
|
|
|
|
|
| ||||||||
March 31, 2017 |
|
|
|
|
|
|
| ||||||||
Total assets | $ | 46,938 | |
| $ | 656 | |
| $ | (82 | ) |
| $ | 47,512 | |
December 31, 2016 |
|
|
|
|
|
|
| ||||||||
Total assets | $ | 46,265 | |
| $ | 685 | |
| $ | (115 | ) |
| $ | 46,835 | |
The following table reflects the reconciliation of Modified EBITDA to Net income (loss) as reported in the Consolidated Statement of Operations .
| Three Months Ended | ||||||
| 2017 |
| 2016 | ||||
| (Millions) | ||||||
Modified EBITDA by segment: |
|
|
| ||||
Williams Partners | $ | 1,132 | |
| $ | 955 | |
Other | 18 | |
| (37 | ) | ||
| 1,150 | |
| 918 | | ||
Accretion expense associated with asset retirement obligations for nonregulated operations | (7 | ) |
| (7 | ) | ||
Depreciation and amortization expenses | (442 | ) |
| (445 | ) | ||
Equity earnings (losses) | 107 | |
| 97 | | ||
Impairment of equity-method investments | - | |
| (112 | ) | ||
Other investing income (loss) – net | 272 | |
| 18 | | ||
Proportional Modified EBITDA of equity-method investments | (194 | ) |
| (189 | ) | ||
Interest expense | (280 | ) |
| (291 | ) | ||
(Provision) benefit for income taxes | (37 | ) |
| (2 | ) | ||
Net income (loss) | $ | 569 | |
| $ | (13 | ) |
31
Item 2
Management's Discussion and Analysis of
Financial Condition and Results of Operations
General
We are an energy infrastructure company focused on connecting North America's significant hydrocarbon resource plays to growing markets for natural gas and NGLs. Our operations are located principally in the United States. We have one reportable segment, Williams Partners. All remaining business activities are included in Other.
Williams Partners
Williams Partners consists of our consolidated master limited partnership, WPZ, which includes gas pipeline and midstream businesses. The gas pipeline businesses include interstate natural gas pipelines and pipeline joint project investments; and the midstream businesses provide natural gas gathering, treating, and processing services; NGL production, fractionation, storage, marketing, and transportation; deepwater production handling and crude oil transportation services; an olefin production business, and is comprised of several wholly owned and partially owned subsidiaries and joint project investments. As of March 31, 2017 , we own 74 percent of the interests in WPZ.
Williams Partners' gas pipeline businesses consist primarily of Transco and Northwest Pipeline. The gas pipeline business also holds interests in joint venture interstate and intrastate natural gas pipeline systems including a 50 percent equity-method investment in Gulfstream and a 41 percent interest in Constitution (a consolidated entity), which is under development. As of December 31, 2016, Transco and Northwest Pipeline owned and operated a combined total of approximately 13,600 miles of pipelines with a total annual throughput of approximately 4,230 Tbtu of natural gas and peak-day delivery capacity of approximately 15.5 MMdth of natural gas.
Williams Partners' midstream businesses primarily consist of (1) natural gas gathering, treating, compression, and processing; (2) NGL fractionation, storage, and transportation; (3) crude oil production handling and transportation; and (4) olefins production. (See Geismar olefins facility monetization below.) The primary service areas are concentrated in major producing basins in Colorado, Texas, Oklahoma, Kansas, New Mexico, Wyoming, the Gulf of Mexico, Louisiana, Pennsylvania, West Virginia, New York, and Ohio which include the Barnett, Eagle Ford, Haynesville, Marcellus, Niobrara, and Utica shale plays as well as the Mid-Continent region.
The midstream businesses include equity-method investments in natural gas gathering and processing assets and NGL fractionation and transportation assets, including a 62 percent equity-method investment in UEOM, a 69 percent equity-method investment in Laurel Mountain, a 58 percent equity-method investment in Caiman II, a 60 percent equity-method investment in Discovery, a 50 percent equity-method investment in OPPL, and Appalachia Midstream Services, LLC, which owns an approximate average 66 percent equity-method investment interest in multiple gas gathering systems in the Marcellus Shale (Appalachia Midstream Investments) as well as our previously owned 50 percent equity-method investment in the Delaware basin gas gathering system (DBJV) in the Mid-Continent region (see Note 3 – Investing Activities of Notes to Consolidated Financial Statements).
The midstream businesses previously included Canadian midstream operations, which were comprised of an oil sands offgas processing plant near Fort McMurray, Alberta and an NGL/olefin fractionation facility at Redwater, Alberta. In September 2016, these Canadian operations were sold.
Williams Partners' ongoing strategy is to safely and reliably operate large-scale, interstate natural gas transmission and midstream infrastructures where our assets can be fully utilized and drive low per-unit costs. We focus on consistently attracting new business by providing highly reliable service to our customers and investing in growing markets and areas of increasing natural gas demand.
Williams Partners' interstate transmission and related storage activities are subject to regulation by the FERC and as such, our rates and charges for the transportation of natural gas in interstate commerce, and the extension, expansion or abandonment of jurisdictional facilities and accounting, among other things, are subject to regulation. The rates are established through the FERC's ratemaking process. Changes in commodity prices and volumes transported have
32
Management's Discussion and Analysis (Continued)
limited near-term impact on these revenues because the majority of cost of service is recovered through firm capacity reservation charges in transportation rates.
Other
Our former NGL & Petchem Services segment included certain domestic olefins pipeline assets as well as certain Canadian assets, which included a liquids extraction plant located near Fort McMurray, Alberta, that began operations in March 2016, and a propane dehydrogenation facility which was under development. In September 2016, the Canadian assets were sold. Considering this, the remaining assets are now reported within Other, effective January 1, 2017. Other also includes minor business activities that are not operating segments, as well as corporate operations. Prior period segment disclosures have been recast for this segment change.
Financial Repositioning
In January 2017, we announced agreements with WPZ, wherein we permanently waived the general partner's IDRs and converted our 2 percent general partner interest in WPZ to a non-economic interest in exchange for 289 million newly issued WPZ common units. Pursuant to this agreement, we also purchased approximately 277 thousand WPZ common units for $10 million . Additionally, we purchased approximately 59 million common units of WPZ at a price of $36.08586 per unit in a private placement transaction, funded with proceeds from our equity offering (see Note 9 – Stockholders' Equity). According to the terms of this agreement, following WPZ's quarterly distribution in February 2017, we paid additional consideration of approximately $50 million to WPZ for these units. Subsequent to these transactions and as of March 31, 2017, we own a 74 percent limited partner interest in WPZ.
Termination of WPZ Merger Agreement
On May 12, 2015, we entered into an agreement for a unit-for-stock transaction whereby we would have acquired all of the publicly held outstanding common units of WPZ in exchange for shares of our common stock (WPZ Merger Agreement).
On September 28, 2015, prior to our entry into the Merger Agreement, we entered into a Termination Agreement and Release (Termination Agreement), terminating the WPZ Merger Agreement. Under the terms of the Termination Agreement, we were required to pay a $428 million termination fee to WPZ, at which time we owned approximately 60 percent , including the interests of the general partner and IDRs. Such termination fee settled through a reduction of quarterly incentive distributions we were entitled to receive from WPZ (such reduction not to exceed $209 million per quarter). The distributions from WPZ in November 2015, February 2016, and May 2016 were reduced by $209 million, $209 million, and $10 million, respectively, related to this termination fee.
Unless indicated otherwise, the following discussion and analysis of results of operations and financial condition and liquidity should be read in conjunction with the consolidated financial statements and notes thereto of this Form 10‑Q and our Annual Report on Form 10-K dated February 22, 2017.
Dividends
In March 2017, we paid a regular quarterly dividend of $0.30 per share.
Overview of Three Months Ended March 31, 2017
Net income (loss) attributable to The Williams Companies, Inc. , for the three months ended March 31, 2017 , changed favorably by $438 million compared to the three months ended March 31, 2016 , reflecting a gain of $269 million associated with the disposition of certain equity-method investments, an increase of $171 million in operating income and the absence of $112 million of impairments of equity-method investments incurred in 2016. These favorable changes were partially offset by a $144 million increase in net income attributable to noncontrolling interests due to increased income at WPZ and a $35 million increase in the provision for income taxes, driven by an increase in the provision due to higher pre-tax income partially offset by a $127 million benefit associated with the release of a valuation allowance on a capital loss carryover.
33
Management's Discussion and Analysis (Continued)
Williams Partners
Geismar olefins facility monetization
On April 17, 2017, WPZ announced that it agreed to sell its Geismar Interest for $2.1 billion in cash, subject to customary closing conditions and regulatory approvals. Upon closing of the sale, WPZ will enter into a long-term supply and transportation agreement with the purchaser to provide feedstock to the plant via its Bayou Ethane pipeline system. WPZ expects that the sale will close during the summer of 2017. (See Note 1 – General, Description of Business, and Basis of Presentation of Notes to Consolidated Financial Statements.)
WPZ plans to use the cash proceeds from this sale to pay off its $850 million term loan and to fund a portion of the capital and investment expenditures that are a part of its growth portfolio.
Acquisition of additional interests in Appalachia Midstream Investments
During the first quarter of 2017, WPZ exchanged all of its 50 percent interest in DBJV for an increased interest in two natural gas gathering systems that are part of the Appalachia Midstream Investments and $155 million in cash. Following this exchange, WPZ has an approximate average 66 percent interest in the Appalachia Midstream Investments. WPZ also sold all of its interest in Ranch Westex JV LLC for $45 million. These transactions resulted in a total gain of $269 million reflected in Other investing income (loss) – net in the Consolidated Statement of Operations within the Williams Partners segment. (See Note 3 - Investing Activities of Notes to Consolidated Financial Statements.)
Commodity Prices
NGL per-unit margins were approximately 120 percent higher in the first quarter of 2017 compared to the same period of 2016. The main driver for the three month comparative period increase was a 108 percent increase in per-unit non-ethane prices. The per-unit margin increase also reflects the absence of our former Canadian operations which had lower per-unit NGL margins in the prior year compared to our domestic operations. These favorable impacts were partially offset by an approximate 65 percent increase in per-unit natural gas feedstock prices.
NGL margins are defined as NGL revenues less any applicable Btu replacement cost, plant fuel, and third-party transportation and fractionation. Per-unit NGL margins are calculated based on sales of our own equity volumes at the processing plants. Our equity volumes include NGLs where we own the rights to the value from NGLs recovered at our plants under both "keep-whole" processing agreements, where we have the obligation to replace the lost heating value with natural gas, and "percent-of-liquids" agreements whereby we receive a portion of the extracted liquids with no obligation to replace the lost heating value.
34
Management's Discussion and Analysis (Continued)
The following graph illustrates the NGL production and sales volumes, as well as the margin differential between ethane and non-ethane products and the relative mix of those products.
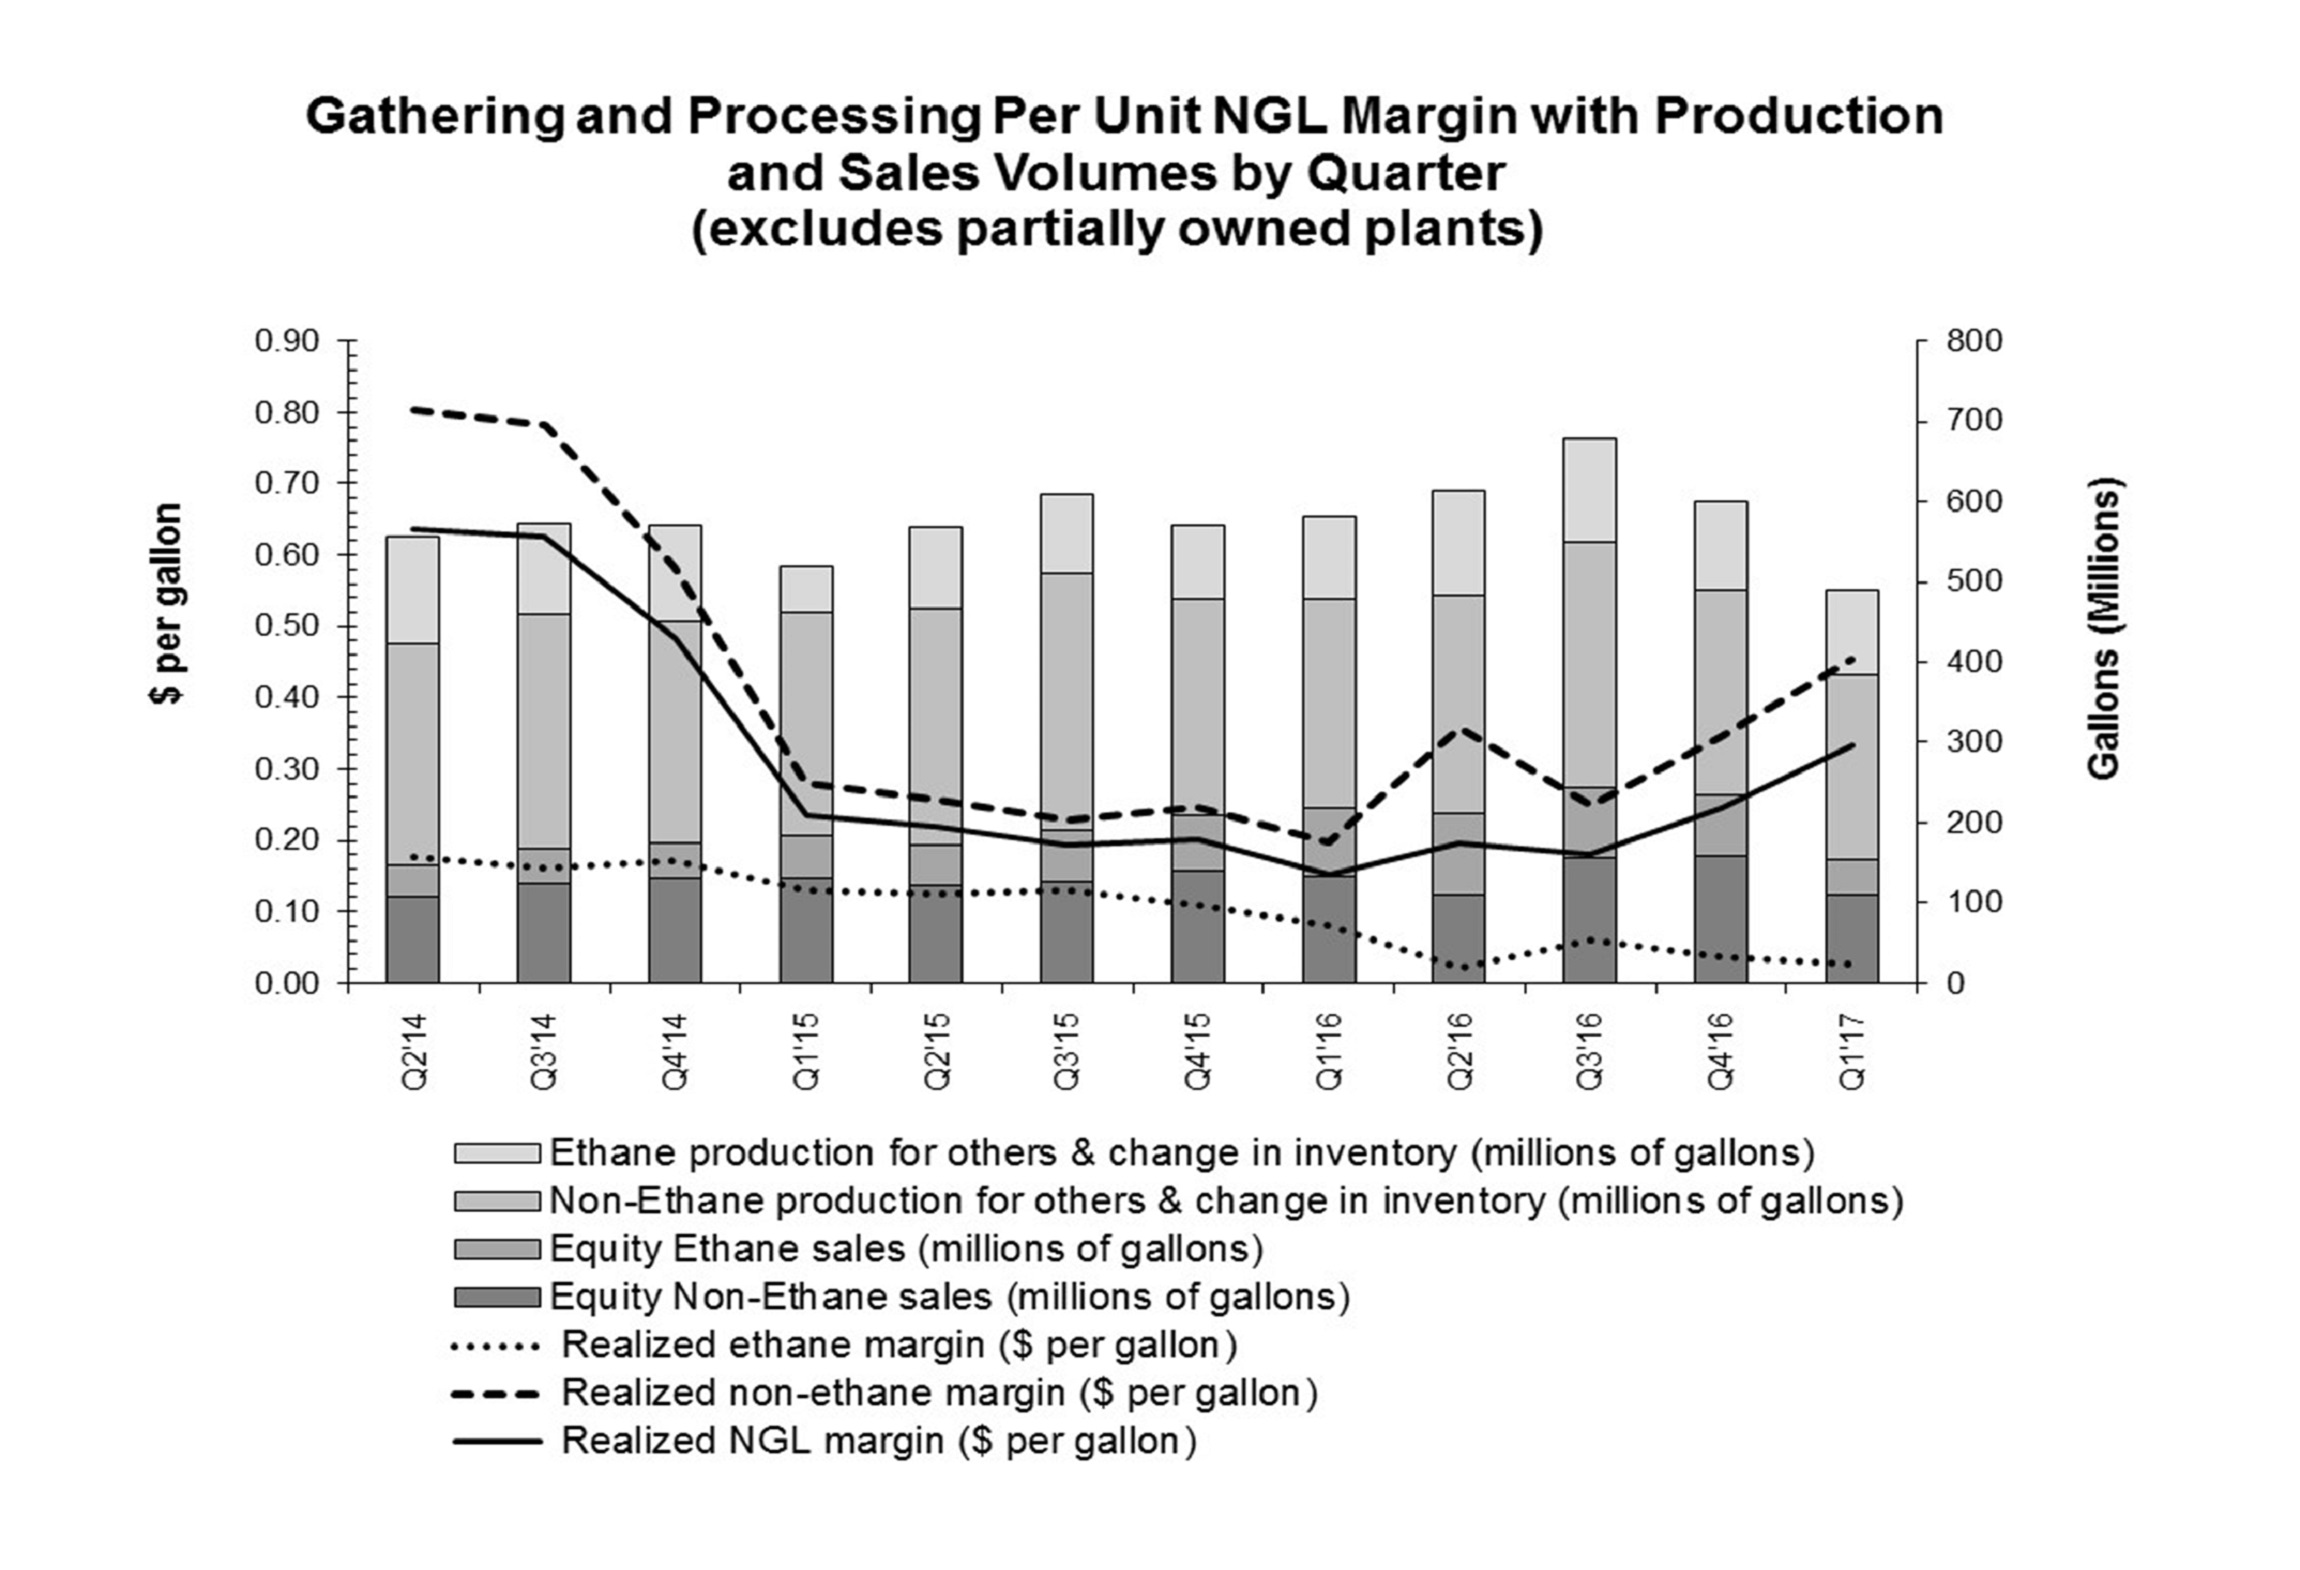 |
The potential impact of commodity prices on our business for the remainder of 2017 is further discussed in the following Company Outlook.
Company Outlook
Our strategy is to provide large-scale energy infrastructure designed to maximize the opportunities created by the vast supply of natural gas and natural gas products that exists in the United States. We accomplish this by connecting the growing demand for cleaner fuels and feedstocks with our major positions in the premier natural gas and natural gas products supply basins. We continue to maintain a strong commitment to safety, environmental stewardship, operational excellence, and customer satisfaction. We believe that accomplishing these goals will position us to deliver safe and reliable service to our customers and an attractive return to our shareholders.
Our business plan for 2017 includes the previously discussed financial repositioning transactions. We expect to maintain our dividend of $0.30 per share, or $1.20 annually, throughout 2017. Our business plan also includes previously discussed asset monetizations, including the $2.1 billion sale of our ownership interest in the Geismar olefins facility expected to close this summer, as well as other select assets that are not core to our strategy. For WPZ, these transactions are expected to improve its cost of capital, remove its need to access the public equity markets for the next several years, enhance growth, and provide for debt reduction, solidifying WPZ as an attractive financing vehicle. The transactions are also expected to facilitate a reduction of our parent-level debt and provide for dividend growth flexibility, while retaining strategic and financing flexibility.
Our growth capital and investment expenditures in 2017 are expected to total $2.1 billion to $2.8 billion. Approximately $1.4 billion to $1.9 billion of our growth capital funding needs include Transco expansions and other interstate pipeline growth projects, most of which are fully contracted with firm transportation agreements. The
35
Management's Discussion and Analysis (Continued)
remaining growth capital spending in 2017 primarily reflects investment in gathering and processing systems in the Northeast region limited primarily to known new producer volumes, including volumes that support Transco expansion projects including our Atlantic Sunrise project. In addition to growth capital and investment expenditures, we also remain committed to projects that maintain our assets for safe and reliable operations, as well as projects that meet legal, regulatory, and/or contractual commitments.
As a result of our significant continued capital and investment expenditures on Transco expansions and fee-based gathering and processing projects, as well as the previously discussed sale of our Canadian operations and the pending monetization of the Geismar olefins facility, fee-based businesses are becoming an even more significant component of our portfolio and serve to reduce the influence of commodity price fluctuations on our operating results and cash flows. We expect to benefit as continued growth in demand for low-cost natural gas is driven by increases in LNG exports, industrial demand and power generation. Current forward market prices indicate a slightly more favorable energy commodity price environment in 2017 as compared to 2016, including higher natural gas and NGL prices. However, some of our customers may continue to curtail or delay drilling plans until there is a more sustained recovery in prices, which may negatively impact our gathering volumes. Although there has been some improvement, the credit profiles of certain of our producer customers remain challenged. Unfavorable changes in energy commodity prices or the credit profile of our producer customers may also result in noncash impairments of our assets.
In 2017, our operating results are expected to include increases from our regulated fee-based businesses recently placed in service or expected to be placed in service in 2017 primarily along the Transco system. For our non-regulated businesses, we anticipate increases in fee-based revenue due to expanded capacity in the Eastern Gulf area and a slight increase in fee-based revenue in the Northeast region. Partially offsetting these increases are expected declines in fee-based revenue in the Western region. We expect overall gathering and processing volumes to remain steady in 2017 and increase thereafter to meet the growing demand for natural gas and natural gas products. We also anticipate lower general and administrative expenses due to cost reduction initiatives and asset monetizations.
Potential risks and obstacles that could impact the execution of our plan include:
• | Opposition to infrastructure projects, including the risk of delay or denial in permits needed for our projects; |
• | Unexpected significant increases in capital expenditures or delays in capital project execution; |
• | Counterparty credit and performance risk, including that of Chesapeake Energy Corporation and its affiliates; |
• | Inability to execute or delay in completing planned asset monetizations; |
• | Lower than anticipated demand for natural gas and natural gas products which could result in lower than expected volumes, energy commodity prices and margins; |
• | General economic, financial markets, or further industry downturn, including increased interest rates; |
• | Physical damages to facilities, including damage to offshore facilities by named windstorms; |
• | Reduced availability of insurance coverage; |
• | Lower than expected distributions from WPZ. |
We seek to maintain a strong financial position and liquidity, as well as manage a diversified portfolio of energy infrastructure assets which continue to serve key growth markets and supply basins in the United States.
36
Management's Discussion and Analysis (Continued)
Expansion Projects
Williams Partners' ongoing major expansion projects include the following:
Atlantic Sunrise
In February 2017, we received approval from the FERC to expand Transco's existing natural gas transmission system along with greenfield facilities to provide incremental firm transportation capacity from the northeastern Marcellus producing area to markets along Transco's mainline as far south as Station 85 in west central Alabama. On April 19, 2017, we filed a request with the FERC for approval of an approximately six mile route variance for the greenfield pipeline, which the FERC is treating as an application to amend our certificate for the project. We expect to place a portion of the mainline project facilities into service during the second half of 2017 and are targeting a full in-service during mid-2018, assuming timely receipt of all necessary regulatory approvals. The project is expected to increase capacity by 1,700 Mdth/d.
Constitution Pipeline
In December 2014, we received approval from the FERC to construct and operate the jointly owned Constitution pipeline, which will have an expected capacity of 650 Mdth/d. However, in April 2016, the New York State Department of Environmental Conservation (NYSDEC) denied a necessary water quality certification for the New York portion of the pipeline. We remain steadfastly committed to the project, and in May 2016, Constitution appealed the NYSDEC's denial of the certification and filed an action in federal court seeking a declaration that the State of New York's authority to exercise permitting jurisdiction over certain other environmental matters is preempted by federal law. The oral argument before the Second Circuit Court of Appeals regarding the NYSDEC's denial of Constitution's application for water quality certification under Section 401 of the Clean Water Act was held on November 16, 2016. We anticipate a decision from the Second Circuit Court of Appeals as early as the second quarter of 2017. (See Note 2 – Variable Interest Entities of Notes to Consolidated Financial Statements.) We currently own 41 percent of Constitution with three other parties holding 25 percent, 24 percent, and 10 percent, respectively. We will be the operator of Constitution. The 126-mile Constitution pipeline will connect our gathering system in Susquehanna County, Pennsylvania, to the Iroquois Gas Transmission and Tennessee Gas Pipeline systems in New York, as well as to a local distribution company serving New York and Pennsylvania. In light of the NYSDEC's denial of the water quality certification and the actions taken to challenge the decision, the target in-service date has been revised to as early as the second half of 2018, which assumes that the legal challenge process is satisfactorily and promptly concluded.
Dalton
In August 2016, we obtained approval from the FERC to expand Transco's existing natural gas transmission system together with greenfield facilities to provide incremental firm transportation capacity from Station 210 in New Jersey to markets in northwest Georgia. On April 1, 2017, we began providing firm transportation service through the mainline portion of the project on an interim basis, until the in-service date of the project as a whole. We plan to place the full project into service in the third quarter of 2017 and it is expected to increase capacity by 448 Mdth/d.
Eagle Ford
We plan to expand our gathering infrastructure in the Eagle Ford region in order to meet our customers' production plans. The expansion of the gathering infrastructure includes the addition of well connections and gathering pipeline to the existing systems.
Garden State
In April 2016, we received approval from the FERC to expand Transco's existing natural gas transmission system to provide incremental firm transportation capacity from Station 210 in New Jersey to a new interconnection on our Trenton Woodbury Lateral in New Jersey. The project will be constructed in phases and is expected to increase capacity by 180 Mdth/d. We plan to place the initial phase of the project into service during the third quarter of 2017 and the remaining portion in the second quarter of 2018.
37
Management's Discussion and Analysis (Continued)
Gathering System Expansion
We will continue to expand the gathering systems in the Marcellus and Utica Shale regions that are needed to meet our customers' production plans. The expansion of the gathering infrastructure includes additional compression and gathering pipeline to the existing system.
Gulf Connector
In August 2016, we filed an application with the FERC to expand Transco's existing natural gas transmission system to provide incremental firm transportation capacity from Station 65 in Louisiana to delivery points in Wharton and San Patricio Counties, Texas. The project will be constructed in two phases, with the initial phase of the project expected to be in service during the second half of 2018 and the remaining phase in 2019, assuming timely receipt of all necessary regulatory approvals. The project is expected to increase capacity by 475 Mdth/d.
Hillabee
In February 2016, the FERC issued a certificate order for the initial phases of Transco's Hillabee Expansion Project. The project involves an expansion of Transco's existing natural gas transmission system from Station 85 in west central Alabama to a proposed new interconnection with the Sabal Trail project in Alabama. The project will be constructed in phases, and all of the project expansion capacity will be leased to Sabal Trail. We plan to place a portion of the initial phase of the project into service in the second quarter of 2017 and the remainder of the initial phase into service in the third quarter of 2017. The in-service date of the second phase of the project is planned for the second quarter of 2020 and together they are expected to increase capacity by 1,025 Mdth/d.
In March 2016, WPZ entered into an agreement with the member-sponsors of Sabal Trail to resolve several matters. In accordance with the agreement, the member-sponsors will pay us an aggregate amount of $240 million in three equal installments as certain milestones of the project are met. The first $80 million payment was received in March 2016 and the second installment was received in September 2016. WPZ expects to recognize income associated with these receipts over the term of the capacity lease agreement.
New York Bay Expansion
In July 2016, we received approval from the FERC to expand Transco's existing natural gas transmission system to provide incremental firm transportation capacity from Pennsylvania to the Rockaway Delivery Lateral transfer point and the Narrows meter station in Richmond County, New York. We plan to place the project into service during the fourth quarter of 2017, and it is expected to increase capacity by 115 Mdth/d.
Norphlet Project
In March 2016, we announced that we have reached an agreement to provide deepwater gas gathering services to the Appomattox development in the Gulf of Mexico. The project will provide offshore gas gathering services to our existing Transco lateral, which will provide transmission services onshore to our Mobile Bay processing facility. We also plan to make modifications to our Main Pass 261 Platform to install an alternate delivery route from the platform, as well as modifications to our Mobile Bay processing facility. The project is scheduled to go into service during the second quarter of 2020.
Northeast Supply Enhancement
In March 2017, we filed an application with the FERC to expand Transco's existing natural gas transmission system to provide incremental firm transportation capacity from Station 195 in Pennsylvania to the Rockaway Delivery Lateral transfer point. We plan to place the project into service in late 2019 or during the first half of 2020, assuming timely receipt of all necessary regulatory approvals. The project is expected to increase capacity by 400 Mdth/d.
38
Management's Discussion and Analysis (Continued)
Virginia Southside II
In July 2016, we received approval from the FERC to expand Transco's existing natural gas transmission system together with greenfield facilities to provide incremental firm transportation capacity from Station 210 in New Jersey and Station 165 in Virginia to a new lateral extending from our Brunswick Lateral in Virginia. We plan to place the project into service during the fourth quarter of 2017 and it is expected to increase capacity by 250 Mdth/d.
Critical Accounting Estimates
Constitution Pipeline Capitalized Project Costs
As of March 31, 2017, Property, plant, and equipment, at cost in our Consolidated Balance Sheet includes approximately $381 million of capitalized project costs for Constitution, for which we are the construction manager and own a 41 percent consolidated interest. In December 2014, Constitution received approval from the FERC to construct and operate its proposed pipeline. However, in April 2016, the NYSDEC denied a necessary water quality certification for the New York portion of the pipeline. We remain steadfastly committed to the project, and in May 2016, Constitution appealed the NYSDEC's denial of the water quality certification.
As a result of the denial by the NYSDEC, we evaluated the capitalized project costs for impairment as of March 31, 2017, and determined that no impairment was necessary. Our evaluation considered probability-weighted scenarios of undiscounted future net cash flows, including a scenario assuming successful resolution with the NYSDEC and construction of the pipeline, as well as a scenario where the project does not proceed. We continue to monitor the capitalized project costs associated with Constitution for potential impairment.
39
Management's Discussion and Analysis (Continued)
Results of Operations
Consolidated Overview
The following table and discussion is a summary of our consolidated results of operations for the three months ended March 31, 2017 , compared to the three months ended March 31, 2016 . The results of operations by segment are discussed in further detail following this consolidated overview discussion.
| Three Months Ended |
|
|
|
| ||||||||
| 2017 |
| 2016 |
| $ Change* |
| % Change* | ||||||
| (Millions) |
|
|
|
| ||||||||
Revenues: |
|
|
|
|
|
|
| ||||||
Service revenues | $ | 1,261 | |
| $ | 1,229 | |
| +32 | |
| +3 | % |
Product sales | 727 | |
| 431 | |
| +296 | |
| +69 | % | ||
Total revenues | 1,988 | |
| 1,660 | |
|
|
|
| ||||
Costs and expenses: |
|
|
|
|
|
|
| ||||||
Product costs | 579 | |
| 318 | |
| -261 | |
| -82 | % | ||
Operating and maintenance expenses | 368 | |
| 391 | |
| +23 | |
| +6 | % | ||
Depreciation and amortization expenses | 442 | |
| 445 | |
| +3 | |
| +1 | % | ||
Selling, general, and administrative expenses | 161 | |
| 221 | |
| +60 | |
| +27 | % | ||
Other (income) expense – net | 5 | |
| 23 | |
| +18 | |
| +78 | % | ||
Total costs and expenses | 1,555 | |
| 1,398 | |
|
|
|
| ||||
Operating income (loss) | 433 | |
| 262 | |
|
|
|
| ||||
Equity earnings (losses) | 107 | |
| 97 | |
| +10 | |
| +10 | % | ||
Impairment of equity-method investments | - | |
| (112 | ) |
| +112 | |
| +100 | % | ||
Other investing income (loss) – net | 272 | |
| 18 | |
| +254 | |
| NM | | ||
Interest expense | (280 | ) |
| (291 | ) |
| +11 | |
| +4 | % | ||
Other income (expense) – net | 74 | |
| 15 | |
| +59 | |
| NM | | ||
Income (loss) before income taxes | 606 | |
| (11 | ) |
|
|
|
| ||||
Provision (benefit) for income taxes | 37 | |
| 2 | |
| -35 | |
| NM | | ||
Net income (loss) | 569 | |
| (13 | ) |
|
|
|
| ||||
Less: Net income (loss) attributable to noncontrolling interests | 196 | |
| 52 | |
| -144 | |
| NM | | ||
Net income (loss) attributable to The Williams Companies, Inc. | $ | 373 | |
| $ | (65 | ) |
|
|
|
| ||
|
* | + = Favorable change; - = Unfavorable change; NM = A percentage calculation is not meaningful due to a change in signs, a zero-value denominator, or a percentage change greater than 200. |
Three months ended March 31, 2017 vs. three months ended March 31, 2016
Service revenues increased primarily due to higher volumes primarily in the eastern Gulf Coast region, including the impact of new volumes at Gulfstar One related to the Gunflint expansion being placed in service in the third quarter of 2016, higher production associated with the absence of producers' 2016 operational issues in the Tubular Bells field, and higher volumes at Devils Tower related to Kodiak field production. Additionally, an increase in Transco's storage revenues reflects the absence of a reduction for potential refunds associated with a ruling received in certain rate case litigation in 2016. Service revenues also increased due to the recognition of deferred revenue in the Barnett Shale and Mid-Continent regions associated with the restructuring of contracts in the fourth quarter of 2016. These increases were partially offset by lower rates primarily in the Barnett Shale region associated with the previously discussed contract restructure as well as lower volumes primarily in the Barnett Shale region driven by natural declines. Other areas in the western region were also impacted by lower volumes related to natural declines and severe winter weather conditions.
40
Management's Discussion and Analysis (Continued)
Product sales increased due to higher marketing revenues primarily associated with significantly higher NGL prices and slightly higher NGL volumes. Revenues from the sale of our equity NGLs increased primarily due to higher NGL prices, partially offset by lower volumes. Olefins sales increased primarily due to higher propylene prices, partially offset by lower volumes. The decrease in the sale of equity NGL and olefin volumes reflect the sale of our former Canadian operations in September 2016.
The increase in Product costs is primarily due to higher marketing purchases primarily associated with an increase in per-unit costs across most products, especially NGLs, and higher volumes across most products. Product costs also reflect a slight increase in costs associated with the production of NGLs and olefins.
Operating and maintenance expenses decreased primarily due to lower labor-related costs resulting from workforce reductions that occurred late in first-quarter 2016, and ongoing cost containment efforts, as well as the absence of costs associated with our former Canadian operations. These decreases are partially offset by an increase in costs associated with Transco's expansion projects, including pipeline testing and general maintenance.
Selling, general, and administrative expenses decreased primarily due to the absence of project development costs incurred in the first quarter of 2016 associated with our former Canadian PDH facility, the absence of costs associated with our former Canadian operations, lower labor-related costs resulting from workforce reductions that occurred late in first-quarter 2016, and ongoing cost containment efforts.
The favorable change in Other (income) expense – net within Operating income (loss) includes gains from certain contract settlements and terminations in 2017, the absence of an unfavorable change in foreign currency exchange associated with our former Canadian operations, and insurance proceeds received in 2017 associated with the Geismar Incident. These favorable changes were partially offset by the absence of a $10 million gain in first-quarter 2016 associated with unused pipe and an accrual of additional expenses in 2017 related to the Geismar Incident.
Operating income (loss) changed favorably primarily due to the absence of first-quarter 2016 project development costs, lower costs and expenses primarily related to ongoing cost containment efforts, including workforce reductions in first-quarter 2016, the sale of our Canadian operations, improved product margins primarily due to a significant increase in per-unit NGL margins, and higher service revenues.
The decrease in Impairment of equity-method investments reflects the absence of first-quarter 2016 impairment charges associated with our DBJV and Laurel Mountain equity-method investments. (See Note 10 – Fair Value Measurements and Guarantees of Notes to Consolidated Financial Statements.)
Other investing income (loss) – net reflects the gain on disposition of our investments in DBJV and Ranch Westex JV LLC in 2017 (see Note 3 – Investing Activities of Notes to Consolidated Financial Statements), partially offset by the absence of interest income received in 2016 associated with a receivable related to the sale of certain former Venezuelan assets.
Interest expense decreased primarily due to lower Interest incurred primarily attributable to debt retirements and lower borrowings on our credit facilities in the first quarter of 2017. (See Note 8 – Debt and Banking Arrangements of Notes to Consolidated Financial Statements.)
Other income (expense) – net below Operating income (loss) changed favorably primarily due to a $30 million net gain on early debt retirement in 2017 and favorable changes related to equity funds used during construction (AFUDC). (See Note 4 – Other Income and Expenses of Notes to Consolidated Financial Statements.)
Provision (benefit) for income taxes changed unfavorably primarily due to higher pretax income, partially offset by a $127 million benefit associated with the release of a valuation allowance on a capital loss carryover. See Note 5 – Provision (Benefit) for Income Taxes of Notes to Consolidated Financial Statements for a discussion of the effective tax rates compared to the federal statutory rate for both periods.
The unfavorable change in Net income (loss) attributable to noncontrolling interests is primarily due to higher operating results at WPZ, partially offset by a decrease in the ownership of the noncontrolling interests associated with
41
Management's Discussion and Analysis (Continued)
the first-quarter 2017 Financial Repositioning (see Note 1 – General, Description of Business, and Basis of Presentation of Notes to Consolidated Financial Statements).
Period-Over-Period Operating Results - Segments
We evaluate segment operating performance based upon Modified EBITDA . Note 12 – Segment Disclosures of Notes to Consolidated Financial Statements includes a reconciliation of this non-GAAP measure to Net income (loss) . Management uses Modified EBITDA because it is an accepted financial indicator used by investors to compare company performance. In addition, management believes that this measure provides investors an enhanced perspective of the operating performance of our assets. Modified EBITDA should not be considered in isolation or as a substitute for a measure of performance prepared in accordance with GAAP.
Williams Partners
| Three Months Ended | ||||||
| 2017 |
| 2016 | ||||
| (Millions) | ||||||
Service revenues | $ | 1,256 | |
| $ | 1,226 | |
Product sales | 727 | |
| 428 | | ||
Segment revenues | 1,983 | |
| 1,654 | | ||
|
|
|
| ||||
Product costs | (579 | ) |
| (317 | ) | ||
Other segment costs and expenses | (466 | ) |
| (571 | ) | ||
Proportional Modified EBITDA of equity-method investments | 194 | |
| 189 | | ||
Williams Partners Modified EBITDA | $ | 1,132 | |
| $ | 955 | |
|
|
|
| ||||
NGL margin | $ | 51 | |
| $ | 34 | |
Olefin margin | 71 | |
| 71 | | ||
Three months ended March 31, 2017 vs. three months ended March 31, 2016
Modified EBITDA increased primarily due to lower segment costs and expenses, improved product margins primarily due to a significant increase in per-unit NGL margins, and higher service revenues.
Service revenues increased primarily due to higher eastern Gulf Coast region revenue of $43 million associated primarily with higher volumes, including the impact of new volumes at Gulfstar One related to the Gunflint expansion being placed in service in the third quarter of 2016, higher production from the absence of producers' 2016 operational issues in the Tubular Bells field, and higher volumes at Devils Tower related to Kodiak field production. Additionally, an increase in Transco's storage revenues reflects the absence of a $15 million reduction for potential refunds associated with a ruling received in certain rate case litigation in 2016. Service revenues also increased $58 million due to the recognition of deferred revenue in the Barnett Shale and Mid-Continent regions associated with the restructuring of contracts in the fourth quarter of 2016. These increases were partially offset by lower rates primarily in the Barnett Shale region associated with the previously discussed contract restructure as well as lower volumes primarily in the Barnett Shale region driven by natural declines. Other areas in the western region were also impacted by lower volumes related to natural declines and severe winter weather conditions.
Product sales increased primarily due to:
• | A $258 million increase in marketing revenues primarily due to significantly higher prices and volumes across all products (partially offset in marketing purchases); |
• | A $29 million increase in revenues from our equity NGLs primarily due to significantly higher NGL prices, the effect of which was partially offset by a $17 million decrease due to the sale of our Canadian operations; |
42
Management's Discussion and Analysis (Continued)
• | A $10 million increase in olefin sales primarily due to a $25 million increase at our other olefin operations that includes a $22 million increase associated with higher propylene prices, partially offset by a $10 million decrease due to the sale of our former Canadian operations, and a $4 million decrease from our Geismar plant. The decrease from our Geismar plant includes a $36 million decrease in sales volumes, partially offset by a $32 million increase in sales prices, primarily due to 46 percent higher per-unit ethylene prices. The lower volumes were driven by plant downtime in first-quarter 2017 associated with an electrical outage and miscellaneous equipment issues. |
Product costs increased primarily due to:
• | A $242 million increase in marketing purchases primarily due to the same factors that increased marketing sales (more than offset in marketing revenues). The increase in marketing costs does not reflect the intercompany costs associated with certain gathering and processing services performed by an affiliate; |
• | A $12 million increase in natural gas purchases associated with the production of equity NGLs reflecting a significant increase in per-unit natural gas prices, the effect of which was partially offset by an $12 million decrease due to the sale of our Canadian operations; |
• | A $10 million increase in olefin feedstock purchases primarily due to higher propylene feedstock costs at our other olefin operations, partially offset by $5 million in lower feedstock costs at Geismar due to lower volumes, and a $4 million reduction as a result of the sale of our former Canadian operations. |
The decrease in Other segment costs and expenses includes a $30 million net gain in the first quarter of 2017 associated with a February 2017 early debt retirement, the absence of $27 million of operating and other expenses associated with our Canadian operations, a decrease in labor-related expenses resulting from our first quarter 2016 workforce reduction, favorable contract settlements and terminations in the first quarter of 2017, and the absence of certain impairments in the first quarter of 2016, partially offset by an increase in costs associated with Transco's expansion projects, including pipeline testing and general maintenance.
The increase in Proportional Modified EBITDA of equity-method investments is primarily due to improved results at Discovery driven by higher fee revenues attributable to new connections to the Keathley Canyon Connector in the first quarter of 2016 and improved results at certain Northeast region investments, partially offset by lower UEOM results reflecting lower processing volumes.
Other
| Three Months Ended March 31, | ||||||
| 2017 |
| 2016 | ||||
| (Millions) | ||||||
Service revenues | $ | 8 | |
| $ | 18 | |
Product sales | - | |
| 3 | | ||
Segment revenues | 8 | |
| 21 | | ||
|
|
|
| ||||
Product costs | - | |
| (2 | ) | ||
Other segment costs and expenses | 10 | |
| (56 | ) | ||
Other Modified EBITDA | $ | 18 | |
| $ | (37 | ) |
43
Management's Discussion and Analysis (Continued)
Three months ended March 31, 2017 vs. three months ended March 31, 2016
Modified EBITDA increased primarily due to the favorable change in Other segment costs and expenses .
Other segment costs and expenses changed favorably primarily due to the absence of $34 million of certain project development costs associated with the Canadian PDH facility that we expensed in 2016, as well as a $24 million increase in income associated with an increase in a regulatory asset primarily driven by our increased ownership in WPZ. (See Note 4 – Other Income and Expenses of Notes to Consolidated Financial Statements.)
44
Management's Discussion and Analysis (Continued)
Management's Discussion and Analysis of Financial Condition and Liquidity
Outlook
Fee-based businesses are becoming an even more significant component of our portfolio and serve to reduce the influence of commodity price fluctuations on our cash flows. We expect to benefit as continued growth in demand for low-cost natural gas is driven by increases in LNG exports, industrial demand, and power generation.
We believe we have, or have access to, the financial resources and liquidity necessary to meet our requirements for working capital, capital and investment expenditures, dividends and distributions, debt service payments, and tax payments, while maintaining a sufficient level of liquidity. In particular, as previously discussed in Company Outlook, our expected growth capital and investment expenditures total approximately $2.1 billion to $2.8 billion in 2017. Approximately $1.4 billion to $1.9 billion of our growth capital funding needs include Transco expansions and other interstate pipeline growth projects, most of which are fully contracted with firm transportation agreements. The remaining growth capital spending in 2017 primarily reflects investment in gathering and processing systems in the Northeast region limited primarily to known new producer volumes, including volumes that support Transco expansion projects including our Atlantic Sunrise project. In addition to growth capital and investment expenditures, we also remain committed to projects that maintain our assets for safe and reliable operations, as well as projects that meet legal, regulatory, and/or contractual commitments. We retain the flexibility to adjust planned levels of capital and investment expenditures in response to changes in economic conditions or business opportunities.
We expect Williams Partners to use the cash proceeds from the $2.1 billion sale of its Geismar Interest to pay off its $850 million term loan and to fund a portion of the capital and investment expenditures that are a part of its growth portfolio. We expect that for federal tax purposes, any taxable gain generated from the sale will be sheltered by our net operating loss carry-forwards.
Liquidity
Based on our forecasted levels of cash flow from operations and other sources of liquidity, we expect to have sufficient liquidity to manage our businesses in 2017. Our internal and external sources of consolidated liquidity to fund working capital requirements, capital and investment expenditures, dividends and distributions, debt service payments, and tax payments include:
• | Cash and cash equivalents on hand; |
• | Cash generated from operations; |
• | Distributions from WPZ; |
• | Distributions from our equity-method investees based on our level of ownership; |
• | Use of our credit facility; |
• | Cash proceeds from issuances of debt and/or equity securities. |
WPZ is expected to fund its cash needs through its cash flows from operations and its credit facility and/or commercial paper program, as well as proceeds from planned asset monetizations as previously mentioned, and proceeds from the previously described exchange of its equity-method investment in certain non-operated assets in the Delaware basin for cash and additional equity-method investment in two Marcellus Shale gathering systems.
As part of the Financial Repositioning announced in January 2017, we increased our regular quarterly cash dividend by 50 percent from the previous quarterly dividend of $0.20 per share paid in December 2016, to $0.30 per share for the dividend paid in March 2017.
45
Management's Discussion and Analysis (Continued)
We anticipate our more significant uses of cash to be:
• | Working capital requirements; |
• | Maintenance and expansion capital and investment expenditures; |
• | Interest on our long-term debt; |
• | Repayment of current debt maturities and additional reductions in debt with funds received from the planned asset monetizations; |
• | Investment in WPZ as part of the Financial Repositioning (see Note 1 – General, Description of Business, and Basis of Presentation of Notes to Consolidated Financial Statements); |
• | Quarterly dividends to our shareholders. |
Potential risks associated with our planned levels of liquidity discussed above include those previously discussed in Company Outlook .
As of March 31, 2017 , we had a working capital surplus (current assets in excess of current liabilities) of $800 million. Our available liquidity is as follows:
| March 31, 2017 | ||||||||||
Available Liquidity | WPZ |
| WMB |
| Total | ||||||
| (Millions) | ||||||||||
Cash and cash equivalents | $ | 625 | |
| $ | 14 | |
| $ | 639 | |
Capacity available under our $1.5 billion credit facility (1) |
|
| 905 | |
| 905 | | ||||
Capacity available to WPZ under its $3.5 billion credit facility, less amounts outstanding under its $3 billion commercial paper program (2) | 3,500 | |
|
|
| 3,500 | | ||||
| $ | 4,125 | |
| $ | 919 | |
| $ | 5,044 | |
|
(1) | Through March 31, 2017 , the highest amount outstanding under our credit facility during 2017 was $805 million. At March 31, 2017 , we were in compliance with the financial covenants associated with this credit facility. Borrowing capacity available under this facility as of May 2, 2017, was $910 million. |
(2) | In managing our available liquidity, we do not expect a maximum outstanding amount in excess of the capacity of WPZ's credit facility inclusive of any outstanding amounts under its commercial paper program. As of March 31, 2017, no Commercial paper was outstanding under WPZ's commercial paper program. Through March 31, 2017 , the highest amount outstanding under WPZ's commercial paper program and credit facility during 2017 was $178 million. At March 31, 2017 , WPZ was in compliance with the financial covenants associated with this credit facility. Borrowing capacity available under WPZ's $3.5 billion credit facility as of May 2, 2017, was $3.5 billion. |
Registrations
In September 2016, WPZ filed a registration statement for its distribution reinvestment program.
In May 2015, we filed a shelf registration statement, as a well-known seasoned issuer.
In February 2015, WPZ filed a shelf registration statement, as a well-known seasoned issuer, and WPZ also filed a shelf registration statement for the offer and sale from time to time of common units representing limited partner interests in WPZ having an aggregate offering price of up to $1 billion. These sales are to be made over a period of time and from time to time in transactions at prices which are market prices prevailing at the time of sale, prices related to market price, or at negotiated prices. Such sales are to be made pursuant to an equity distribution agreement between WPZ and certain banks who may act as sales agents or purchase for their own accounts as principals.
46
Management's Discussion and Analysis (Continued)
Distributions from Equity-Method Investees
The organizational documents of entities in which we have an equity-method investment generally require distribution of their available cash to their members on a quarterly basis. In each case, available cash is reduced, in part, by reserves appropriate for operating their respective businesses.
Credit Ratings
Our ability to borrow money is impacted by our credit ratings and the credit ratings of WPZ. The current ratings are as follows:
| Rating Agency |
| Outlook |
| Senior Unsecured Debt Rating |
| Corporate Credit Rating |
WMB: | S&P Global Ratings |
| Stable |
| BB+ |
| BB+ |
| Moody's Investors Service |
| Stable |
| Ba2 |
| N/A |
| Fitch Ratings |
| Stable |
| BB+ |
| N/A |
|
|
|
|
|
|
|
|
WPZ: | S&P Global Ratings |
| Stable |
| BBB |
| BBB |
| Moody's Investors Service |
| Stable |
| Baa3 |
| N/A |
| Fitch Ratings |
| Rating Watch Positive |
| BBB- |
| N/A |
During March 2017, S&P Global Ratings upgraded the rating for WMB. Considering our credit ratings as of March 31, 2017 , we estimate that we could be required to provide up to $50 million in additional collateral of either cash or letters of credit with third parties under existing contracts. At the present time, we have not provided any additional collateral to third parties but no assurance can be given that we will not be requested to provide collateral in the future. During March 2017, S&P Global Ratings also upgraded the rating for WPZ, and in April 2017, Fitch Ratings changed the Outlook for WPZ to Rating Watch Positive. As of March 31, 2017 , we estimate that a downgrade to a rating below investment-grade for WPZ could require it to provide up to $403 million in additional collateral of either cash or letters of credit with third parties under existing contracts.
47
Management's Discussion and Analysis (Continued)
Sources (Uses) of Cash
The following table summarizes the sources (uses) of cash and cash equivalents for each of the periods presented (see Notes to Consolidated Financial Statements for the Notes referenced in the table):
| Cash Flow |
| Three Months Ended | ||||||
| Category |
| 2017 |
| 2016 | ||||
|
|
| (Millions) | ||||||
Sources of cash and cash equivalents: |
|
|
|
|
| ||||
Operating activities - net | Operating |
| $ | 606 | |
| $ | 783 | |
Proceeds from equity offerings | Financing |
| 2,122 | |
| 6 | | ||
Proceeds from our credit-facility borrowings | Financing |
| 470 | |
| 850 | | ||
Proceeds from dispositions of equity-method investments | Investing |
| 200 | |
| - | | ||
Distributions from unconsolidated affiliates in excess of cumulative earnings | Investing |
| 121 | |
| 109 | | ||
Contributions from noncontrolling interests | Financing |
| 4 | |
| 16 | | ||
Proceeds from long-term debt | Financing |
| - | |
| 998 | | ||
Proceeds from WPZ's credit-facility borrowings | Financing |
| - | |
| 840 | | ||
|
|
|
|
|
| ||||
Uses of cash and cash equivalents: |
|
|
|
|
| ||||
Payments of long-term debt (see Note 8) | Financing |
| (1,350 | ) |
| - | | ||
Payments on our credit-facility borrowings | Financing |
| (650 | ) |
| (465 | ) | ||
Capital expenditures | Investing |
| (511 | ) |
| (513 | ) | ||
Quarterly dividends on common stock | Financing |
| (248 | ) |
| (480 | ) | ||
Dividends and distributions to noncontrolling interests | Financing |
| (242 | ) |
| (236 | ) | ||
Payments of WPZ's commercial paper - net | Financing |
| (93 | ) |
| (365 | ) | ||
Purchases of and contributions to equity-method investments | Investing |
| (52 | ) |
| (63 | ) | ||
Payments on WPZ's credit-facility borrowings | Financing |
| - | |
| (1,525 | ) | ||
|
|
|
|
|
| ||||
Other sources / (uses) - net | Financing and Investing |
| 92 | |
| 109 | | ||
Increase (decrease) in cash and cash equivalents |
|
| $ | 469 | |
| $ | 64 | |
Operating activities
The factors that determine operating activities are largely the same as those that affect Net income (loss) , with the exception of noncash items such as Depreciation and amortization , Net (gain) loss on disposition of equity-method investments , and Impairment of equity-method investments . Our Net cash provided (used) by operating activities for the three months ended March 31, 2017, decreased from the same period in 2016 primarily due to the absence in 2017 of a Hillabee cash receipt (see Company Outlook) and certain minimum volume commitment receipts due to contract restructurings, partially offset by higher operating income in 2017.
Off-Balance Sheet Arrangements and Guarantees of Debt or Other Commitments
We have various other guarantees and commitments which are disclosed in Note 2 – Variable Interest Entities , Note 8 – Debt and Banking Arrangements , Note 10 – Fair Value Measurements and Guarantees , and Note 11 – Contingent Liabilities of Notes to Consolidated Financial Statements. We do not believe these guarantees and commitments or the possible fulfillment of them will prevent us from meeting our liquidity needs.
48
Item 3
Quantitative and Qualitative Disclosures About Market Risk
Interest Rate Risk
Our current interest rate risk exposure is related primarily to our debt portfolio and has not materially changed during the first three months of 2017 .
49
Item 4
Controls and Procedures
Our management, including our Chief Executive Officer and Chief Financial Officer, does not expect that our disclosure controls and procedures (as defined in Rules 13a - 15(e) and 15d - 15(e) of the Securities Exchange Act) (Disclosure Controls) or our internal control over financial reporting (Internal Controls) will prevent all errors and all fraud. A control system, no matter how well conceived and operated, can provide only reasonable, not absolute, assurance that the objectives of the control system are met. Further, the design of a control system must reflect the fact that there are resource constraints, and the benefits of controls must be considered relative to their costs. Because of the inherent limitations in all control systems, no evaluation of controls can provide absolute assurance that all control issues and instances of fraud, if any, within the company have been detected. These inherent limitations include the realities that judgments in decision-making can be faulty, and that breakdowns can occur because of simple error or mistake. Additionally, controls can be circumvented by the individual acts of some persons, by collusion of two or more people, or by management override of the control. The design of any system of controls also is based in part upon certain assumptions about the likelihood of future events, and there can be no assurance that any design will succeed in achieving its stated goals under all potential future conditions. Because of the inherent limitations in a cost-effective control system, misstatements due to error or fraud may occur and not be detected. We monitor our Disclosure Controls and Internal Controls and make modifications as necessary; our intent in this regard is that the Disclosure Controls and Internal Controls will be modified as systems change and conditions warrant.
Evaluation of Disclosure Controls and Procedures
An evaluation of the effectiveness of the design and operation of our Disclosure Controls was performed as of the end of the period covered by this report. This evaluation was performed under the supervision and with the participation of our management, including our Chief Executive Officer and Chief Financial Officer. Based upon that evaluation, our Chief Executive Officer and Chief Financial Officer concluded that these Disclosure Controls are effective at a reasonable assurance level.
Changes in Internal Control Over Financial Reporting
There have been no changes during the first quarter of 2017 that have materially affected, or are reasonably likely to materially affect, our Internal Control over Financial Reporting.
PART II. OTHER INFORMATION
Item 1. Legal Proceedings
Environmental
Certain reportable legal proceedings involving governmental authorities under federal, state, and local laws regulating the discharge of materials into the environment are described below. While it is not possible for us to predict the final outcome of the proceedings which are still pending, we do not anticipate a material effect on our consolidated financial position if we receive an unfavorable outcome in any one or more of such proceedings.
On February 21, 2017, we received notice from the Environmental Enforcement Section of the United States Department of Justice regarding certain alleged violations of the Clean Air Act at our Moundsville facility as set forth in a Notice of Noncompliance issued by the EPA on January 14, 2016. The notice includes an offer to avoid further legal action on the alleged violations by paying $2 million. We are currently evaluating the communication and our response.
Other
The additional information called for by this item is provided in Note 11 – Contingent Liabilities of Notes to Consolidated Financial Statements included under Part I, Item 1. Financial Statements of this report, which information is incorporated by reference into this item.
50
Item 6. Exhibits
Exhibit No. |
|
|
| Description |
|
|
|
|
|
2.1+ |
| - |
| Agreement and Plan of Merger dated as of May 12, 2015, by and among The Williams Companies, Inc., SCMS LLC, Williams Partners L.P., and WPZ GP LLC (filed on May 13, 2015 as Exhibit 2.1 to The Williams Companies, Inc.'s current report on Form 8-K (File No. 001-04174) and incorporated herein by reference). |
2.2 |
| - |
| Amendment No 1. to Agreement and Plan of Merger dated as of May 1, 2016, by and among The Williams Companies, Inc., Energy Transfer Corp LP, Energy Transfer Corp GP, LLC, Energy Transfer Equity, L.P., LE GP, LLC and Energy Transfer Equity GP, LLC (filed on May 3, 2016 as Exhibit 2.1 to The Williams Companies, Inc.'s current report on Form 8-K (File No. 001-04174) and incorporated herein by reference). |
2.3+ |
| - |
| Agreement and Plan of Merger dated as of September 28, 2015, by and among The Williams Companies, Inc., Energy Transfer Corp LP, Energy Transfer Corp GP, LLC, Energy Transfer Equity, L.P., LE GP, LLC and Energy Transfer Equity GP, LLC (filed on October 1, 2015 as Exhibit 2.1 to The Williams Companies, Inc.'s current report on Form 8-K (File No. 001-04174) and incorporated herein by reference). |
2.4+ |
| - |
| Interest Swap and Purchase Agreement by and among Western Gas Partners, LP, WGR Operating, LP, Delaware Basin JV Gathering LLC, Williams Partners L.P., Williams Midstream Gas Services LLC, and Appalachia Midstream Services, L.L.C., dated February 9, 2017 (filed on February 10, 2017 as exhibit 2.1 to The Williams Companies Inc.'s current report on Form 8-K (File No. 001-04174) and incorporated herein by reference). |
3.1 |
| - |
| Amended and Restated Certificate of Incorporation as supplemented (filed on May 26, 2010, as Exhibit 3.1 to The Williams Companies, Inc.'s current report on Form 8-K (File No. 001-04174) and incorporated herein by reference). |
3.2 |
| - |
| By-Laws (filed on January 20, 2017, as Exhibit 3.1 to The Williams Companies, Inc.'s current report on Form 8-K (File No. 001-04174) and incorporated herein by reference). |
10.1 |
| - |
| Termination Agreement and Release, dated as of September 28, 2015, by and among The Williams Companies, Inc., SCMS LLC, Williams Partners L.P. and WPZ GP LLC (filed on September 28, 2015 as Exhibit 10.1 to Williams Partners L.P.'s current report on Form 8‑K (File No. 001-34831) and incorporated herein by reference). |
10.2§ |
| - |
| Form of 2016 Performance-Based Restricted Stock Unit Agreement among Williams and certain employees and officers (filed on February 22, 2017 as Exhibit 10.18 to The Williams Companies, Inc.'s annual report on Form 10-K (File No. 001-04174) and incorporated herein by reference). |
10.3§ |
| - |
| Form of 2016 Time-Based Restricted Stock Unit Agreement among Williams and certain employees and officers (filed on February 22, 2017 as Exhibit 10.19 to The Williams Companies, Inc.'s annual report on Form 10-K (File No. 001-04174) and incorporated herein by reference). |
10.4§ |
| - |
| Form of 2016 Time-Based Restricted Stock Unit Agreement among Williams and certain employees and officers vesting February 22, 2019 (filed on February 22, 2017 as Exhibit 10.20 to The Williams Companies, Inc.'s annual report on Form 10-K (File No. 001-04174) and incorporated herein by reference). |
10.5§ |
| - |
| Form of 2016 Time-Based Restricted Stock Unit Agreement among Williams and certain non-management directors (filed on February 22, 2017 as Exhibit 10.21 to The Williams Companies, Inc.'s annual report on Form 10-K (File No. 001-04174) and incorporated herein by reference). |
10.6§ |
| - |
| Form of 2016 Nonqualified Stock Option Agreement among Williams and certain employees and officers (filed on February 22, 2017 as Exhibit 10.22 to The Williams Companies, Inc.'s annual report on Form 10-K (File No. 001-04174) and incorporated herein by reference). |
51
Exhibit No. |
|
|
| Description |
|
|
|
|
|
10.7§ |
| - |
| Form of 2017 Time-Based Restricted Stock Unit Agreement among Williams and certain employees and officers (filed on February 22, 2017 as Exhibit 10.23 to The Williams Companies, Inc.'s annual report on Form 10-K (File No. 001-04174) and incorporated herein by reference). |
10.8§ |
| - |
| Form of 2017 Time-Based Restricted Stock Unit Agreement among Williams and certain non-management directors (filed on February 22, 2017 as Exhibit 10.24 to The Williams Companies, Inc.'s annual report on Form 10-K (File No. 001-04174) and incorporated herein by reference). |
10.9§ |
| - |
| Form of 2017 Nonqualified Stock Option Agreement among Williams and certain employees and officers (filed on February 22, 2017 as Exhibit 10.25 to The Williams Companies, Inc.'s annual report on Form 10-K (File No. 001-04174) and incorporated herein by reference). |
10.10*§ |
| - |
| Form of 2017 Performance-Based Restricted Stock Unit Agreement among Williams and certain employees and officers. |
10.11 |
| - |
| Common Unit Issuance Agreement, dated January 9, 2017 (filed on January 10, 2017, as Exhibit 2 to Schedule 13D/A (File No. 005-86017) by The Williams Companies, Inc. relating to the common units representing limited partner interests of Williams Partners L.P. and incorporated herein by reference). |
10.12 |
| - |
| Common Unit Purchase Agreement, dated January 9, 2017 (filed on January 10, 2017, as Exhibit 3 to Schedule 13D/A (File No. 005-86017) by The Williams Companies, Inc. relating to the common units representing limited partner interests of Williams Partners L.P. and incorporated herein by reference). |
10.13 |
| - |
| Separation Agreement and General Release entered into by and among Robert S. Purgason and The Williams Companies, Inc., dated March 21, 2017 (filed on March 24, 2017, as Exhibit 10.1 to the Williams Companies. Inc. current report on Form 8-K (File No. 001-04174) and incorporated herein by reference). |
12* |
| - |
| Computation of Ratio of Earnings to Fixed Charges. |
31.1* |
| - |
| Certification of Chief Executive Officer pursuant to Rules 13a-14(a) and 15d-14(a) promulgated under the Securities Exchange Act of 1934, as amended, and Item 601(b)(31) of Regulation S-K, as adopted pursuant to Section 302 of the Sarbanes-Oxley Act of 2002. |
31.2* |
| - |
| Certification of Chief Financial Officer pursuant to Rules 13a-14(a) and 15d-14(a) promulgated under the Securities Exchange Act of 1934, as amended, and Item 601(b)(31) of Regulation S-K, as adopted pursuant to Section 302 of the Sarbanes-Oxley Act of 2002. |
32** |
| - |
| Certification of Chief Executive Officer and Chief Financial Officer pursuant to 18 U.S.C. Section 1350, as adopted pursuant to Section 906 of the Sarbanes-Oxley Act of 2002. |
101.INS* |
| - |
| XBRL Instance Document. |
101.SCH* |
| - |
| XBRL Taxonomy Extension Schema. |
101.CAL* |
| - |
| XBRL Taxonomy Extension Calculation Linkbase. |
101.DEF* |
| - |
| XBRL Taxonomy Extension Definition Linkbase. |
101.LAB* |
| - |
| XBRL Taxonomy Extension Label Linkbase. |
101.PRE* |
| - |
| XBRL Taxonomy Extension Presentation Linkbase. |
|
* Filed herewith.
** Furnished herewith.
§ | Management contract or compensatory plan or arrangement. |
+ | Pursuant to item 601(b)(2) of Regulation S-K, the registrant agrees to furnish supplementally a copy of any omitted exhibit or schedule to the SEC upon request. |
52
SIGNATURE
Pursuant to the requirements of the Securities Exchange Act of 1934, the registrant has duly caused this report to be signed on its behalf by the undersigned thereunto duly authorized.
| T HE W ILLIAMS C OMPANIES , I NC . |
| (Registrant) |
|
|
| /s/ T ED T. T IMMERMANS |
| Ted T. Timmermans |
| Vice President, Controller and Chief Accounting Officer (Duly Authorized Officer and Principal Accounting Officer) |
May 4, 2017
EXHIBIT INDEX
Exhibit No. |
|
|
| Description |
|
|
|
|
|
2.1+ |
| - |
| Agreement and Plan of Merger dated as of May 12, 2015, by and among The Williams Companies, Inc., SCMS LLC, Williams Partners L.P., and WPZ GP LLC (filed on May 13, 2015 as Exhibit 2.1 to The Williams Companies, Inc.'s current report on Form 8-K (File No. 001-04174) and incorporated herein by reference). |
2.2 |
| - |
| Amendment No 1. to Agreement and Plan of Merger dated as of May 1, 2016, by and among The Williams Companies, Inc., Energy Transfer Corp LP, Energy Transfer Corp GP, LLC, Energy Transfer Equity, L.P., LE GP, LLC and Energy Transfer Equity GP, LLC (filed on May 3, 2016 as Exhibit 2.1 to The Williams Companies, Inc.'s current report on Form 8-K (File No. 001-04174) and incorporated herein by reference). |
2.3+ |
| - |
| Agreement and Plan of Merger dated as of September 28, 2015, by and among The Williams Companies, Inc., Energy Transfer Corp LP, Energy Transfer Corp GP, LLC, Energy Transfer Equity, L.P., LE GP, LLC and Energy Transfer Equity GP, LLC (filed on October 1, 2015 as Exhibit 2.1 to The Williams Companies, Inc.'s current report on Form 8-K (File No. 001-04174) and incorporated herein by reference). |
2.4+ |
| - |
| Interest Swap and Purchase Agreement by and among Western Gas Partners, LP, WGR Operating, LP, Delaware Basin JV Gathering LLC, Williams Partners L.P., Williams Midstream Gas Services LLC, and Appalachia Midstream Services, L.L.C., dated February 9, 2017 (filed on February 10, 2017 as exhibit 2.1 to The Williams Companies Inc.'s current report on Form 8-K (File No. 001-04174) and incorporated herein by reference). |
3.1 |
| - |
| Amended and Restated Certificate of Incorporation as supplemented (filed on May 26, 2010, as Exhibit 3.1 to The Williams Companies, Inc.'s current report on Form 8-K (File No. 001-04174) and incorporated herein by reference). |
3.2 |
| - |
| By-Laws (filed on January 20, 2017, as Exhibit 3.1 to The Williams Companies, Inc.'s current report on Form 8-K (File No. 001-04174) and incorporated herein by reference). |
10.1 |
| - |
| Termination Agreement and Release, dated as of September 28, 2015, by and among The Williams Companies, Inc., SCMS LLC, Williams Partners L.P. and WPZ GP LLC (filed on September 28, 2015 as Exhibit 10.1 to Williams Partners L.P.'s current report on Form 8‑K (File No. 001-34831) and incorporated herein by reference). |
10.2§ |
| - |
| Form of 2016 Performance-Based Restricted Stock Unit Agreement among Williams and certain employees and officers (filed on February 22, 2017 as Exhibit 10.18 to The Williams Companies, Inc.'s annual report on Form 10-K (File No. 001-04174) and incorporated herein by reference). |
10.3§ |
| - |
| Form of 2016 Time-Based Restricted Stock Unit Agreement among Williams and certain employees and officers (filed on February 22, 2017 as Exhibit 10.19 to The Williams Companies, Inc.'s annual report on Form 10-K (File No. 001-04174) and incorporated herein by reference). |
10.4§ |
| - |
| Form of 2016 Time-Based Restricted Stock Unit Agreement among Williams and certain employees and officers vesting February 22, 2019 (filed on February 22, 2017 as Exhibit 10.20 to The Williams Companies, Inc.'s annual report on Form 10-K (File No. 001-04174) and incorporated herein by reference). |
10.5§ |
| - |
| Form of 2016 Time-Based Restricted Stock Unit Agreement among Williams and certain non-management directors (filed on February 22, 2017 as Exhibit 10.21 to The Williams Companies, Inc.'s annual report on Form 10-K (File No. 001-04174) and incorporated herein by reference). |
10.6§ |
| - |
| Form of 2016 Nonqualified Stock Option Agreement among Williams and certain employees and officers (filed on February 22, 2017 as Exhibit 10.22 to The Williams Companies, Inc.'s annual report on Form 10-K (File No. 001-04174) and incorporated herein by reference). |
Exhibit No. |
|
|
| Description |
|
|
|
|
|
10.7§ |
| - |
| Form of 2017 Time-Based Restricted Stock Unit Agreement among Williams and certain employees and officers (filed on February 22, 2017 as Exhibit 10.23 to The Williams Companies, Inc.'s annual report on Form 10-K (File No. 001-04174) and incorporated herein by reference). |
10.8§ |
| - |
| Form of 2017 Time-Based Restricted Stock Unit Agreement among Williams and certain non-management directors (filed on February 22, 2017 as Exhibit 10.24 to The Williams Companies, Inc.'s annual report on Form 10-K (File No. 001-04174) and incorporated herein by reference). |
10.9§ |
| - |
| Form of 2017 Nonqualified Stock Option Agreement among Williams and certain employees and officers (filed on February 22, 2017 as Exhibit 10.25 to The Williams Companies, Inc.'s annual report on Form 10-K (File No. 001-04174) and incorporated herein by reference). |
10.10*§ |
| - |
| Form of 2017 Performance-Based Restricted Stock Unit Agreement among Williams and certain employees and officers. |
10.11 |
| - |
| Common Unit Issuance Agreement, dated January 9, 2017 (filed on January 10, 2017, as Exhibit 2 to Schedule 13D/A (File No. 005-86017) by The Williams Companies, Inc. relating to the common units representing limited partner interests of Williams Partners L.P. and incorporated herein by reference). |
10.12 |
| - |
| Common Unit Purchase Agreement, dated January 9, 2017 (filed on January 10, 2017, as Exhibit 3 to Schedule 13D/A (File No. 005-86017) by The Williams Companies, Inc. relating to the common units representing limited partner interests of Williams Partners L.P. and incorporated herein by reference). |
10.13 |
| - |
| Separation Agreement and General Release entered into by and among Robert S. Purgason and The Williams Companies, Inc., dated March 21, 2017 (filed on March 24, 2017, as Exhibit 10.1 to the Williams Companies. Inc. current report on Form 8-K (File No. 001-04174) and incorporated herein by reference). |
12* |
| - |
| Computation of Ratio of Earnings to Fixed Charges. |
31.1* |
| - |
| Certification of Chief Executive Officer pursuant to Rules 13a-14(a) and 15d-14(a) promulgated under the Securities Exchange Act of 1934, as amended, and Item 601(b)(31) of Regulation S-K, as adopted pursuant to Section 302 of the Sarbanes-Oxley Act of 2002. |
31.2* |
| - |
| Certification of Chief Financial Officer pursuant to Rules 13a-14(a) and 15d-14(a) promulgated under the Securities Exchange Act of 1934, as amended, and Item 601(b)(31) of Regulation S-K, as adopted pursuant to Section 302 of the Sarbanes-Oxley Act of 2002. |
32** |
| - |
| Certification of Chief Executive Officer and Chief Financial Officer pursuant to 18 U.S.C. Section 1350, as adopted pursuant to Section 906 of the Sarbanes-Oxley Act of 2002. |
101.INS* |
| - |
| XBRL Instance Document. |
101.SCH* |
| - |
| XBRL Taxonomy Extension Schema. |
101.CAL* |
| - |
| XBRL Taxonomy Extension Calculation Linkbase. |
101.DEF* |
| - |
| XBRL Taxonomy Extension Definition Linkbase. |
101.LAB* |
| - |
| XBRL Taxonomy Extension Label Linkbase. |
101.PRE* |
| - |
| XBRL Taxonomy Extension Presentation Linkbase. |
|
* Filed herewith.
** Furnished herewith.
§ | Management contract or compensatory plan or arrangement. |
+ | Pursuant to item 601(b)(2) of Regulation S-K, the registrant agrees to furnish supplementally a copy of any omitted exhibit or schedule to the SEC upon request. |