|
UNITED STATES SECURITIES AND EXCHANGE COMMISSION
Washington, D.C. 20549
Form 10-K
(Mark One)
☑ | ANNUAL REPORT PURSUANT TO SECTION 13 OR 15(d) OF THE SECURITIES EXCHANGE ACT OF 1934 |
| For the fiscal year ended December 31, 2014 |
| OR |
¨ | TRANSITION REPORT PURSUANT TO SECTION 13 OR 15(d) OF THE SECURITIES EXCHANGE ACT OF 1934 |
| For the transition period from to |
Commission file number 1-4174
The Williams Companies, Inc.
(Exact Name of Registrant as Specified in Its Charter)
Delaware |
| 73-0569878 |
(State or Other Jurisdiction of Incorporation or Organization) |
| (IRS Employer Identification No.) |
|
|
|
One Williams Center, Tulsa, Oklahoma |
| 74172 |
(Address of Principal Executive Offices) |
| (Zip Code) |
918-573-2000
(Registrant's Telephone Number, Including Area Code)
Securities registered pursuant to Section 12(b) of the Act:
Title of Each Class |
| Name of Each Exchange on Which Registered |
Common Stock, $1.00 par value |
| New York Stock Exchange |
Preferred Stock Purchase Rights |
| New York Stock Exchange |
Securities registered pursuant to Section 12(g) of the Act:
5.50% Junior Subordinated Convertible Debentures due 2033
I ndicate by check mark if the registrant is a well-known seasoned issuer, as defined in Rule 405 of the Securities Act. Yes ☑ No ¨
Indicate by check mark if the registrant is not required to file reports pursuant to Section 13 or Section 15(d) of the Act. Yes ¨ No ☑
Indicate by check mark whether the registrant: (1) has filed all reports required to be filed by Section 13 or 15(d) of the Securities Exchange Act of 1934 during the preceding 12 months (or for such shorter period that the registrant was required to file such reports), and (2) has been subject to such filing requirements for the past 90 days. Yes ☑ No ¨
Indicate by check mark whether the registrant has submitted electronically and posted on its corporate Web site, if any, every Interactive Data File required to be submitted and posted pursuant to Rule 405 of Regulation S-T (§232.405 of this chapter) during the preceding 12 months (or for such shorter period that the registrant was required to submit and post such files). Yes ☑ No ¨
Indicate by check mark if disclosure of delinquent filers pursuant to Item 405 of Regulation S-K (§229.405 of this chapter) is not contained herein, and will not be contained, to the best of registrant's knowledge, in definitive proxy or information statements incorporated by reference in Part III of this Form 10-K or any amendment to this Form 10-K. ☑
Indicate by check mark whether the registrant is a large accelerated filer, an accelerated filer, a non-accelerated filer, or a smaller reporting company. See the definitions of "large accelerated filer," "accelerated filer" and "smaller reporting company" in Rule 12b-2 of the Exchange Act. (Check one):
| Large accelerated filer ☑ |
| Accelerated filer ¨ |
|
| Non-accelerated filer ¨ |
| Smaller reporting company ¨ |
|
|
|
|
|
| (Do not check if a smaller reporting company) |
| |||
Indicate by check mark whether the registrant is a shell company (as defined in Rule 12b-2 of the Act). Yes ¨ No ☑
The aggregate market value of the voting and non-voting common equity held by non-affiliates computed by reference to the price at which the common equity was last sold as of the last business day of the registrant's most recently completed second quarter was approximately $42,198,484,977.
The number of shares outstanding of the registrant's common stock outstanding at February 23, 2015 was 747,896,477 .
DOCUMENTS INCORPORATED BY REFERENCE
Portions of the Registrant's Definitive Proxy Statement for the Registrant's Annual Meeting of Stockholders to be held on May 21, 2015, are incorporated into Part III, as specifically set forth in Part III.
|
THE WILLIAMS COMPANIES, INC.
FORM 10-K
TABLE OF CONTENTS
|
| Page |
PART I |
| |
|
|
|
Item 1. | Business | 4 |
| Website Access to Reports and Other Information | 4 |
| General | 4 |
| Dividends | 4 |
| Financial Information About Segments | 5 |
| Business Segments | 5 |
| Williams Partners | 5 |
| Access Midstream Partners | 14 |
| Williams NGL & Petchem Services | 15 |
| Additional Business Segment Information | 15 |
| Regulatory Matters | 16 |
| Environmental Matters | 18 |
| Competition | 19 |
| Employees | 20 |
| Financial Information about Geographic Areas | 20 |
Item 1A. | Risk Factors | 21 |
Item 1B. | Unresolved Staff Comments | 37 |
Item 2. | Properties | 37 |
Item 3. | Legal Proceedings | 37 |
Item 4. | Mine Safety Disclosures | 38 |
| Executive Officers of the Registrant | 39 |
|
|
|
PART II |
| |
|
|
|
Item 5. | Market for Registrant's Common Equity, Related Stockholder Matters and Issuer Purchases of Equity Securities | 44 |
Item 6. | Selected Financial Data | 45 |
Item 7. | Management's Discussion and Analysis of Financial Condition and Results of Operations | 46 |
Item 7A. | Quantitative and Qualitative Disclosures About Market Risk | 80 |
Item 8. | Financial Statements and Supplementary Data | 82 |
Item 9. | Changes in and Disagreements with Accountants on Accounting and Financial Disclosure | 156 |
Item 9A. | Controls and Procedures | 156 |
Item 9B. | Other Information | 159 |
|
|
|
PART III |
| |
|
|
|
Item 10. | Directors, Executive Officers and Corporate Governance | 159 |
Item 11. | Executive Compensation | 159 |
Item 12. | Security Ownership of Certain Beneficial Owners and Management and Related Stockholder Matters | 159 |
Item 13. | Certain Relationships and Related Transactions, and Director Independence | 160 |
Item 14. | Principal Accountant Fees and Services | 160 |
|
|
|
PART IV |
| |
|
|
|
Item 15. | Exhibits and Financial Statement Schedules | 161 |
1
DEFINITIONS
The following is a listing of certain abbreviations, acronyms and other industry terminology used throughout this Annual Report.
Measurements :
Barrel : One barrel of petroleum products that equals 42 U.S. gallons
BPD: Barrels per day
Bcf : One billion cubic feet of natural gas
Bcf/d : One billion cubic feet of natural gas per day
British Thermal Unit (Btu) : A unit of energy needed to raise the temperature of one pound of water by one degree
Fahrenheit
Dekatherms (Dth) : A unit of energy equal to one million British thermal units
Mbbls/d : One thousand barrels per day
Mdth/d : One thousand dekatherms per day
MMcf/d : One million cubic feet per day
MMdth : One million dekatherms or approximately one trillion British thermal units
MMdth/d : One million dekatherms per day
TBtu : One trillion British thermal units
Consolidated Entities :
ACMP: Access Midstream Partners, L.P. prior to its merger with Pre-Merger WPZ
Constitution: Constitution Pipeline Company, LLC
Gulfstar One: Gulfstar One LLC
Pre-Merger WPZ: Williams Partners L.P. prior to its merger with ACMP
Northwest Pipeline: Northwest Pipeline LLC
Transco: Transcontinental Gas Pipe Line Company, LLC
WPZ: Williams Partners L.P.
Partially Owned Entities : Entities in which we do not own a 100 percent ownership interest and which, as of December 31, 2014, we account for as an equity investment, including principally the following:
Aux Sable: Aux Sable Liquid Products LP
Bluegrass: Bluegrass Pipeline Company LLC
Caiman II: Caiman Energy II, LLC
Discovery: Discovery Producer Services LLC
Gulfstream: Gulfstream Natural Gas System, L.L.C.
Laurel Mountain: Laurel Mountain Midstream, LLC
Moss Lake: Moss Lake Fractionation LLC and Moss Lake LPG Terminal LLC
OPPL: Overland Pass Pipeline Company LLC
UEOM: Utica East Ohio Midstream LLC
2
Government and Regulatory:
Code, the: Internal Revenue Code of 1986
EPA: Environmental Protection Agency
Exchange Act, the: Securities and Exchange Act of 1934, as amended
FERC: Federal Energy Regulatory Commission
IRS: Internal Revenue Service
SEC: Securities and Exchange Commission
Other :
B/B Splitter: Butylene/Butane splitter
Caiman Acquisition: WPZ's April 2012 purchase of 100 percent of Caiman Eastern Midstream, LLC located in the Ohio River Valley area of the Marcellus Shale region
DAC: Debutanized aromatic concentrate
Fractionation : The process by which a mixed stream of natural gas liquids is separated into its constituent products,
such as ethane, propane, and butane
IDR: Incentive distribution right
Laser Acquisition: WPZ's February 2012 purchase from Delphi Midstream Partners, LLC of 100 percent of certain entities that operate in Susquehanna County, PA and southern New York
LNG: Liquefied natural gas; natural gas which has been liquefied at cryogenic temperatures
MVC: Minimum volume commitment
NGLs: Natural gas liquids; natural gas liquids result from natural gas processing and crude oil refining and are
used as petrochemical feedstocks, heating fuels, and gasoline additives, among other applications
NGL margins : NGL revenues less Btu replacement cost, plant fuel, transportation, and fractionation
Throughput : The volume of product transported or passing through a pipeline, plant, terminal, or other facility
3
PART I
Item 1. Business
In this report, Williams (which includes The Williams Companies, Inc. and, unless the context otherwise indicates, all of our subsidiaries) is at times referred to in the first person as "we," "us" or "our." We also sometimes refer to Williams as the "Company."
WEBSITE ACCESS TO REPORTS AND OTHER INFORMATION
We file our annual report on Form 10-K, quarterly reports on Form 10-Q, current reports on Form 8-K, proxy statements and other documents electronically with the SEC under the Exchange Act. You may read and copy any materials that we file with the SEC at the SEC's Public Reference Room at 100 F Street, N.E., Washington, DC 20549. You may obtain information on the operation of the Public Reference Room by calling the SEC at 1-800-SEC-0330. You may also obtain such reports from the SEC's Internet website at www.sec.gov.
Our Internet website is www.williams.com . We make available free of charge through the Investor tab of our Internet website our annual report on Form 10-K, quarterly reports on Form 10-Q, current reports on Form 8-K and amendments to those reports filed or furnished pursuant to Section 13(a) or 15(d) of the Exchange Act as soon as reasonably practicable after we electronically file such material with, or furnish it to, the SEC. Our Corporate Governance Guidelines, Code of Ethics for Senior Officers, Board committee charters and the Williams Code of Business Conduct are also available on our Internet website. We will also provide, free of charge, a copy of any of our corporate documents listed above upon written request to our Corporate Secretary, One Williams Center, Suite 4700, Tulsa, Oklahoma 74172.
GENERAL
We are primarily an energy infrastructure company focused on connecting North America's significant hydrocarbon resource plays to growing markets for natural gas, NGLs, and olefins. Our operations are located principally in the United States, but span from the deepwater Gulf of Mexico to the Canadian oil sands.
As of December 31, 2014, our interstate gas pipelines, midstream, and olefins production interests were largely held through our significant investments in both Williams Partners L.P. (WPZ) and Access Midstream Partners, L.P. (ACMP). We owned the general partner interest and a 64 percent limited-partner interest in WPZ, as well as the general partner interest and a 49 percent limited-partner interest in ACMP. As discussed further below, we recently completed the merger of these two partnerships.
We were founded in 1908, originally incorporated under the laws of the state of Nevada in 1949 and reincorporated under the laws of the state of Delaware in 1987. Williams' headquarters are located in Tulsa, Oklahoma, with other major offices in Salt Lake City, Utah; Houston, Texas; Oklahoma City, Oklahoma; Pittsburgh, Pennsylvania; Calgary, Alberta; and the Four Corners Area. Our telephone number is 918-573-2000.
DIVIDENDS
We increased our quarterly dividends from $0.38 per share in the fourth quarter of 2013 to $0.57 per share in the fourth quarter of 2014. Our Board of Directors has approved a dividend of $0.58 per share for the first quarter of 2015.
ACMP MERGER
On February 2, 2015, we completed the merger of our consolidated master limited partnerships, WPZ and ACMP (Merger). The merged partnership is named Williams Partners L.P. Under the terms of the merger agreement, each ACMP unitholder received 1.06152 ACMP units for each ACMP unit owned immediately prior to the merger. In conjunction with the merger, each WPZ common unit held by the public was exchanged for 0.86672 ACMP common units. Each WPZ common unit held by us was exchanged for 0.80036 ACMP common units. Prior to the closing of the Merger, the Class D limited partner units of WPZ, all of which were held by us, were converted into WPZ common units on a one-for-one basis pursuant to the terms of the WPZ partnership agreement. Following the Merger, we own approximately 60 percent of the merged partnership, including the general partner interest and incentive distribution
4
rights. In this report, we refer to the post merger partnership as "WPZ" and the pre-merger entities as "Pre-merger WPZ" and "ACMP."
FINANCIAL INFORMATION ABOUT SEGMENTS
See " Item 8 - Financial Statements and Supplementary Data - Notes to Consolidated Financial Statements - Note 19 – Segment Disclosures " for information with respect to each segment's revenues, profits or losses and total assets.
BUSINESS SEGMENTS
Substantially all our operations are conducted through our subsidiaries. Our activities in 2014 were primarily operated through the following business segments as presented in the accompanying financial statements and management's discussion and analysis.
• | Williams Partners - comprised of our consolidated master limited partnership Pre-merger WPZ, which includes gas pipeline and midstream businesses. The gas pipeline business includes interstate natural gas pipelines and pipeline joint project investments, and the midstream business provides natural gas gathering, treating, and processing services; NGL production, fractionation, storage, marketing and transportation; deepwater production handling and crude oil transportation services; an olefin production business and is comprised of several wholly owned and partially owned subsidiaries and joint project investments. |
Our Canadian midstream operations include an oil sands offgas processing plant near Fort McMurray, Alberta, an NGL/olefin fractionation facility and B/B splitter facility at Redwater, Alberta, and the Boreal Pipeline.
• | Access Midstream - comprised of our consolidated master limited partnership ACMP, which includes certain domestic midstream businesses that provide gathering, treating, and compression services to producers under long-term, fee-based contracts. |
• | Williams NGL & Petchem Services - comprised of certain other domestic olefins pipeline assets and certain Canadian growth projects under development, including a propane dehydrogenation facility and a liquids extraction plant. |
• | Other - primarily comprised of corporate operations and our Canadian construction services company. |
Detailed discussion of each of our business segments follows. For a discussion of our ongoing expansion projects, see Item 7. Management's Discussion and Analysis of Financial Condition and Results of Operations.
Williams Partners
Gas Pipeline Business
Williams Partners' gas pipeline businesses consist primarily of Transco and Northwest Pipeline. Our gas pipeline business also holds interests in joint venture interstate and intrastate natural gas pipeline systems including a 50 percent interest in Gulfstream and a 41 percent interest in Constitution. Transco and Northwest Pipeline own and operate a combined total of approximately 13,600 miles of pipelines with a total annual throughput of approximately 3,870 TBtu of natural gas and peak-day delivery capacity of approximately 14 MMdth of natural gas.
Transco
Transco is an interstate natural gas transmission company that owns and operates a 9,600-mile natural gas pipeline system extending from Texas, Louisiana, Mississippi and the offshore Gulf of Mexico through Alabama, Georgia, South Carolina, North Carolina, Virginia, Maryland, Delaware, Pennsylvania and New Jersey to the New York City metropolitan area. The system serves customers in Texas and 12 southeast and Atlantic seaboard states, including major metropolitan areas in Georgia, North Carolina, Washington, D.C., Maryland, New York, New Jersey, and Pennsylvania.
5
Pipeline system and customers
At December 31, 2014, Transco's system had a mainline delivery capacity of approximately 6.2 MMdth of natural gas per day from its production areas to its primary markets, including delivery capacity from the mainline to locations on its Mobile Bay Lateral. Using its Leidy Line along with market-area storage and transportation capacity, Transco can deliver an additional 4.5 MMdth of natural gas per day for a system-wide delivery capacity total of approximately 10.7 MMdth of natural gas per day. Transco's system includes 45 compressor stations, four underground storage fields, and a LNG storage facility. Compression facilities at sea level-rated capacity total approximately 1.7 million horsepower.
Transco's major natural gas transportation customers are public utilities and municipalities that provide service to residential, commercial, industrial and electric generation end users. Shippers on Transco's system include public utilities, municipalities, intrastate pipelines, direct industrial users, electrical generators, gas marketers and producers. Transco's firm transportation agreements are generally long-term agreements with various expiration dates and account for the major portion of Transco's business. Additionally, Transco offers interruptible transportation services under shorter-term agreements.
Transco has natural gas storage capacity in four underground storage fields located on or near its pipeline system or market areas and operates two of these storage fields. Transco also has storage capacity in a LNG storage facility that we own and operate. The total usable gas storage capacity available to Transco and its customers in such underground storage fields and LNG storage facility and through storage service contracts is approximately 200 Bcf of natural gas. At December 31, 2014, our customers had stored in our facilities approximately 140 Bcf of natural gas. In addition, wholly owned subsidiaries of Transco operate and hold a 35 percent ownership interest in Pine Needle LNG Company, LLC, an LNG storage facility with 4 Bcf of storage capacity. Storage capacity permits Transco's customers to inject gas into storage during the summer and off-peak periods for delivery during peak winter demand periods.
Northwest Pipeline
Northwest Pipeline is an interstate natural gas transmission company that owns and operates a natural gas pipeline system extending from the San Juan basin in northwestern New Mexico and southwestern Colorado through Colorado, Utah, Wyoming, Idaho, Oregon, and Washington to a point on the Canadian border near Sumas, Washington. Northwest Pipeline provides services for markets in Washington, Oregon, Idaho, Wyoming, Nevada, Utah, Colorado, New Mexico, California, and Arizona directly or indirectly through interconnections with other pipelines.
Pipeline system and customers
At December 31, 2014 , Northwest Pipeline's system, having long-term firm transportation and storage redelivery agreements of approximately 3.9 MMdth/d, was composed of approximately 3,900 miles of mainline and lateral transmission pipelines and 41 transmission compressor stations having a combined sea level-rated capacity of approximately 472,000 horsepower.
Northwest Pipeline transports and stores natural gas for a broad mix of customers, including local natural gas distribution companies, municipal utilities, direct industrial users, electric power generators and natural gas marketers and producers. Northwest Pipeline's firm transportation and storage agreements are generally long-term agreements with various expiration dates and account for the major portion of Northwest Pipeline's business. Additionally, Northwest Pipeline offers interruptible and short-term firm transportation service.
Northwest Pipeline owns a one-third interest in the Jackson Prairie underground storage facility in Washington and contracts with a third party for storage service in the Clay basin underground field in Utah. Northwest Pipeline also owns and operates an LNG storage facility in Washington. These storage facilities have an aggregate working gas storage capacity of 14.2 MMdth of natural gas, which is substantially utilized for third-party natural gas. These natural gas storage facilities enable Northwest Pipeline to balance daily receipts and deliveries and provide storage services to certain customers.
6
Gulfstream
Gulfstream is an interstate natural gas pipeline system extending from the Mobile Bay area in Alabama to markets in Florida. Williams Partners owns, through a subsidiary, a 50 percent interest in Gulfstream. Spectra Energy Corporation, through its subsidiary, Spectra Energy Partners, LP, owns the other 50 percent interest. Williams Partners shares operating responsibilities for Gulfstream with Spectra Energy Corporation.
Midstream Business
Williams Partners' midstream business, one of the nation's largest natural gas gatherers and processors, has primary service areas concentrated in major producing basins in Colorado, New Mexico, Wyoming, the Gulf of Mexico, Louisiana, Pennsylvania, West Virginia, New York, and Ohio. The primary businesses are: (1) natural gas gathering, treating, and processing; (2) NGL fractionation, storage and transportation; (3) oil transportation; and (4) olefins production. These fall within the middle of the process of taking raw natural gas and crude oil from the producing fields to the consumer.
Key variables for this business will continue to be:
• | Retaining and attracting customers by continuing to provide reliable services; |
• | Revenue growth associated with additional infrastructure either completed or currently under construction; |
• | Disciplined growth in core service areas and new step-out areas; |
• | Producer drilling activities impacting natural gas supplies supporting our gathering and processing volumes; |
• | Prices impacting commodity-based activities. |
Gathering, Processing, and Treating
Williams Partners' gathering systems receive natural gas from producers' oil and natural gas wells and gather these volumes to gas processing, treating or redelivery facilities. Typically, natural gas, in its raw form, is not acceptable for transportation in major interstate natural gas pipelines or for commercial use as a fuel. Williams Partners' treating facilities remove water vapor, carbon dioxide, and other contaminants and collect condensate, but do not extract NGLs. Williams Partners' is generally paid a fee based on the volume of natural gas gathered and/or treated, generally measured in the Btu heating value.
In addition, natural gas contains various amounts of NGLs, which generally have a higher value when separated from the natural gas stream. Our processing plants extract the NGLs in addition to removing water vapor, carbon dioxide, and other contaminants. NGL products include:
• | Ethane, primarily used in the petrochemical industry as a feedstock for ethylene production, one of the basic building blocks for plastics; |
• | Propane, used for heating, fuel and as a petrochemical feedstock in the production of ethylene and propylene, another building block for petrochemical-based products such as carpets, packing materials, and molded plastic parts; |
• | Normal butane, isobutane and natural gasoline, primarily used by the refining industry as blending stocks for motor gasoline or as a petrochemical feedstock. |
7
Our gas processing services generate revenues primarily from the following three types of contracts:
• | Fee-based: We are paid a fee based on the volume of natural gas processed, generally measured in the Btu heating value. Our customers are entitled to the NGLs produced in connection with this type of processing agreement. Beginning in 2013, a portion of our fee-based processing revenues includes a share of the margins on the NGLs produced. For the year ended December 31, 2014, 79 percent of the NGL production volumes were under fee-based contracts. |
• | Keep-whole: Under keep-whole contracts, we (1) process natural gas produced by customers, (2) retain some or all of the extracted NGLs as compensation for our services, (3) replace the Btu content of the retained NGLs that were extracted during processing with natural gas purchases, also known as shrink replacement gas, and (4) deliver an equivalent Btu content of natural gas for customers at the plant outlet. NGLs we retain in connection with this type of processing agreement are referred to as our equity NGL production. Under these agreements, we have commodity price exposure on the difference between NGL and natural gas prices. For the year ended December 31, 2014, 19 percent of the NGL production volumes were under keep-whole contracts. |
• | Percent-of-Liquids: Under percent-of-liquids processing contracts, we (1) process natural gas produced by customers, (2) deliver to customers an agreed-upon percentage of the extracted NGLs, (3) retain a portion of the extracted NGLs as compensation for our services, and (4) deliver natural gas to customers at the plant outlet. Under this type of contract, we are not required to replace the Btu content of the retained NGLs that were extracted during processing, and are therefore only exposed to NGL price movements. NGLs we retain in connection with this type of processing agreement are also referred to as our equity NGL production. For the year ended December 31, 2014, 2 percent of the NGL production volumes were under percent-of-liquids contracts. |
Our gathering and processing agreements have terms ranging from month-to-month to the life of the producing lease. Generally, our gathering and processing agreements are long-term agreements.
Demand for gas gathering and processing services is dependent on producers' drilling activities, which is impacted by the strength of the economy, natural gas prices, and the resulting demand for natural gas by manufacturing and industrial companies and consumers. Williams Partners' gas gathering and processing customers are generally natural gas producers who have proved and/or producing natural gas fields in the areas surrounding its infrastructure. During 2014, Williams Partners' facilities gathered and processed gas for approximately 220 customers. Williams Partners' top five gathering and processing customers accounted for approximately 50 percent of our gathering and processing revenue.
Demand for our equity NGLs is affected by economic conditions and the resulting demand from industries using these commodities to produce petrochemical-based products such as plastics, carpets, packing materials and blending stocks for motor gasoline and the demand from consumers using these commodities for heating and fuel. NGL products are currently the preferred feedstock for ethylene and propylene production, which has been shifting away from the more expensive crude-based feedstocks.
Geographically, the midstream natural gas assets are positioned to maximize commercial and operational synergies with our other assets. For example, most of the offshore gathering and processing assets attach and process or condition natural gas supplies delivered to the Transco pipeline. Our San Juan basin, southwest Wyoming, and Piceance systems are capable of delivering residue gas volumes into Northwest Pipeline's interstate system in addition to third-party interstate systems. Our gathering system in Pennsylvania delivers residue gas volumes into Transco's pipeline in addition to third-party interstate systems.
Williams Partners owns and operates gas gathering, processing and treating assets within the states of Wyoming, Colorado, New Mexico, Pennsylvania, West Virginia, New York, and Ohio. We also own and operate gas gathering and processing assets and pipelines primarily within the onshore, offshore shelf, and deepwater areas in and around the Gulf Coast states of Texas, Louisiana, Mississippi, and Alabama.
8
The following table summarizes our significant operated natural gas gathering assets as of December 31, 2014:
| Natural Gas Gathering Assets | ||||||||
| Location |
| Pipeline Miles |
| Inlet Capacity (Bcf/d) |
| Ownership Interest |
| Supply Basins |
West |
|
|
|
|
|
|
|
|
|
Rocky Mountain | Wyoming |
| 3,587 |
| 1.1 |
| 100% |
| Wamsutter & SW Wyoming |
Four Corners | Colorado & New Mexico |
| 3,739 |
| 1.8 |
| 100% |
| San Juan |
Piceance | Colorado |
| 328 |
| 1.4 |
| (2) |
| Piceance |
Northeast |
|
|
|
|
|
|
|
|
|
Ohio Valley | West Virginia |
| 209 |
| 0.8 |
| 100% |
| Appalachian |
Susquehanna Supply Hub | Pennsylvania & New York |
| 325 |
| 2.5 |
| 100% |
| Appalachian |
Laurel Mountain (1) | Pennsylvania |
| 2,049 |
| 0.7 |
| 69% |
| Appalachian |
Atlantic-Gulf |
|
|
|
|
|
|
|
|
|
Canyon Chief & Blind Faith | Deepwater Gulf of Mexico |
| 156 |
| 0.5 |
| 100% |
| Eastern Gulf of Mexico |
Seahawk | Deepwater Gulf of Mexico |
| 115 |
| 0.4 |
| 100% |
| Western Gulf of Mexico |
Perdido Norte | Deepwater Gulf of Mexico |
| 105 |
| 0.3 |
| 100% |
| Western Gulf of Mexico |
Offshore shelf & other | Gulf of Mexico |
| 46 |
| 0.2 |
| 100% |
| Eastern Gulf of Mexico |
Offshore shelf & other | Gulf of Mexico |
| 134 |
| 0.9 |
| 100% |
| Western Gulf of Mexico |
Discovery (1) | Gulf of Mexico |
| 573 |
| 1.0 |
| 60% |
| Central Gulf of Mexico |
_______________
(1) | Statistics reflect 100 percent of the assets from the jointly owned investments that we operate; however, our financial statements report equity-method income from these investments based on our equity ownership percentage. |
(2) | We own 60 percent of a gathering system in the Ryan Gulch area, which we operate, with 140 miles of pipeline and 200 MMcf/d of inlet capacity. We own and operate 100 percent of the balance of the Piceance gathering system. |
The following table summarizes our significant operated natural gas processing facilities as of December 31, 2014:
| Natural Gas Processing Facilities | ||||||||
| Location |
| Inlet Capacity (Bcf/d) |
| NGL Production Capacity (Mbbls/d) |
| Ownership Interest |
| Supply Basins |
West |
|
|
|
|
|
|
|
|
|
Opal | Opal, WY |
| 1.1 |
| 43 |
| 100% |
| SW Wyoming |
Echo Springs | Echo Springs, WY |
| 0.7 |
| 58 |
| 100% |
| Wamsutter |
Ignacio | Ignacio, CO |
| 0.5 |
| 29 |
| 100% |
| San Juan |
Kutz | Bloomfield, NM |
| 0.2 |
| 12 |
| 100% |
| San Juan |
Willow Creek | Rio Blanco County, CO |
| 0.5 |
| 30 |
| 100% |
| Piceance |
Parachute | Garfield County, CO |
| 1.3 |
| 7 |
| 100% |
| Piceance |
Northeast |
|
|
|
|
|
|
|
|
|
Fort Beeler | Marshall County, WV |
| 0.5 |
| 62 |
| 100% |
| Appalachian |
Oak Grove | Marshall County, WV |
| 0.2 |
| 25 |
| 100% |
| Appalachian |
Atlantic-Gulf |
|
|
|
|
|
|
|
|
|
Markham | Markham, TX |
| 0.5 |
| 45 |
| 100% |
| Western Gulf of Mexico |
Mobile Bay | Coden, AL |
| 0.7 |
| 30 |
| 100% |
| Eastern Gulf of Mexico |
Discovery (1) | Larose, LA |
| 0.6 |
| 32 |
| 60% |
| Central Gulf of Mexico |
__________
(1) | Statistics reflect 100 percent of the assets from the jointly owned investment that we operate; however, our financial statements report equity-method income from this investment based on our equity ownership percentage. |
In addition, we own and operate several natural gas treating facilities in New Mexico, Colorado, Texas, and Louisiana which bring natural gas to specifications allowable by major interstate pipelines. At our Milagro treating
9
facility, we also use gas-driven turbines that have the capacity to produce 60 mega-watts per day of electricity which we primarily sell into the local electrical grid.
We also own and operate fractionation facilities at Moundsville, de-ethanization and condensate facilities at our Oak Grove processing plant, another condensate stabilization facility near our Oak Grove plant, and an ethane transportation pipeline. Our two condensate stabilizers are capable of handling more than 14 Mbbls/d of field condensate. After natural gas liquids (NGLs) are extracted from the natural gas stream in our cryogenic processing plants, our Oak Grove de-ethanizer is capable of handling up to approximately 80 Mbbls/d of mixed NGLs to extract up to approximately 40 Mbbls/d of ethane. The remaining mixed NGL stream from the de-ethanizer is then transported and fractionated at our Moundsville facilities, which are capable of handling more than 42 Mbbls/d per day of mixed NGLs. Ethane produced at our de-ethanizer is transported to markets via our 50-mile ethane pipeline from Oak Grove to Houston, Pennsylvania.
Crude Oil Transportation and Production Handling Assets
In addition to our natural gas assets, we own and operate four deepwater crude oil pipelines and own production platforms serving the deepwater in the Gulf of Mexico. Our crude oil transportation revenues are typically volumetric-based fee arrangements. However, a portion of our marketing revenues are recognized from purchase and sale arrangements whereby the oil that we transport is purchased and sold as a function of the same index-based price. Our offshore floating production platforms provide centralized services to deepwater producers such as compression, separation, production handling, water removal, and pipeline landings. Revenue sources have historically included a combination of fixed-fee, volumetric-based fee and cost reimbursement arrangements. Fixed fees associated with the resident production at our Devils Tower facility are recognized on a units-of-production basis. Fixed fees associated with the resident production at our Gulfstar facility are recognized as the guaranteed capacity is made available.
The following tables summarize our significant crude oil transportation pipelines and production handling platforms as of December 31, 2014:
| Crude Oil Pipelines | ||||||
| Pipeline Miles |
| Capacity (Mbbls/d) |
| Ownership Interest |
| Supply Basins |
Mountaineer & Blind Faith | 172 |
| 150 |
| 100% |
| Eastern Gulf of Mexico |
BANJO | 57 |
| 90 |
| 100% |
| Western Gulf of Mexico |
Alpine | 96 |
| 85 |
| 100% |
| Western Gulf of Mexico |
Perdido Norte | 74 |
| 150 |
| 100% |
| Western Gulf of Mexico |
| Production Handling Platforms | ||||||
| Gas Inlet Capacity (MMcf/d) |
| Crude/NGL Handling Capacity (Mbbls/d) |
| Ownership Interest |
| Supply Basins |
Devils Tower | 210 |
| 60 |
| 100% |
| Eastern Gulf of Mexico |
Gulfstar I FPS TM | 172 |
| 80 |
| 51% |
| Eastern Gulf of Mexico |
Discovery Grand Isle 115 (1) | 150 |
| 10 |
| 60% |
| Central Gulf of Mexico |
___________
(1) | Statistics reflect 100 percent of the assets from the jointly owned investment that we operate; however, our financial statements report equity- method income from this investment based on our equity ownership percentage. |
Canadian Operations
Our Canadian operations include an oil sands offgas processing plant located near Fort McMurray, Alberta, and an NGL/olefin fractionation facility and B/B Splitter facility, both of which are located at Redwater, Alberta, which is near Edmonton, Alberta, and the Boreal Pipeline which transports NGLs and olefins from our Fort McMurray plant to our Redwater fractionation facility. We operate the Fort McMurray area processing plant and the Boreal Pipeline, while another party operates the Redwater facilities on our behalf. Our Fort McMurray area facilities extract liquids from
10
the offgas produced by a third-party oil sands bitumen upgrader. Our arrangement with the third-party upgrader is a "keep-whole" type where we remove a mix of NGLs and olefins from the offgas and return the equivalent heating value to the third-party upgrader in the form of natural gas, as well as a profit share where a portion above a threshold is shared with the third party. We extract, fractionate, treat, store, terminal and sell the ethane/ethylene, propane, propylene, normal butane (butane), isobutane/butylene (butylene) and condensate recovered from this process. The commodity price exposure of this asset is the spread between the price for natural gas and the NGL and olefin products we produce. We continue to be the only NGL/olefins fractionator in western Canada and the only processor of oil sands upgrader offgas. Our extraction of liquids from upgrader offgas streams allows the upgraders to burn cleaner natural gas streams and reduces their overall air emissions.
The Fort McMurray extraction plant has processing capacity of 121 MMcf/d with the ability to recover 26 Mbbls/d of olefin and NGL products. Our Redwater fractionator has a liquids handling capacity of 26 Mbbls/d. The B/B Splitter, which has a production capacity of 3.7 Mbbls/d of butylene and 3.7 Mbbls/d of butane, further fractionates the butylene/butane mix produced at our Redwater fractionators into separate butylene and butane products, which receive higher values and are in greater demand. We also purchase small volumes of olefin/NGLs mixes from third-party gas processors, fractionate the olefins and NGLs at our Redwater plant and sell the resulting products. The Boreal Pipeline is a 261-mile pipeline in Canada that transports recovered NGLs and olefins from our extraction plant in Fort McMurray to our Redwater fractionation facility. The pipeline has an initial capacity of 43 Mbbls/d that can be increased to an ultimate capacity of 125 Mbbls/d with additional pump stations. Our products are sold within Canada and the United States.
Operating Statistics
The following table summarizes our significant operating statistics:
| 2014 |
| 2013 |
| 2012 | |||
Volumes: |
|
|
|
|
| |||
Canadian propylene sales (millions of pounds) | 143 | |
| 118 | |
| 153 | |
Canadian NGL sales (millions of gallons) | 218 | |
| 123 | |
| 118 | |
Gulf Olefins
Subsequent to the Geismar plant returning to production in February 2015, WPZ has an 88.5 percent undivided interest and operatorship of the olefins production facility in Geismar, Louisiana, along with a refinery grade propylene splitter, and pipelines in the Gulf region. Our olefins business also operates an ethylene storage hub at Mont Belvieu using leased third-party underground storage caverns.
Our olefins production facility has a total production capacity of 1.95 billion pounds of ethylene and 114 million pounds of propylene per year. Our feedstocks for the cracker are ethane and propane; as a result, these assets are primarily exposed to the price spread between ethane and propane, and ethylene and propylene, respectively. Ethane and propane are available for purchase from third parties and from affiliates. We own ethane and propane pipeline systems in Louisiana that provide feedstock transportation to the Geismar plant and other third-party crackers. We also own a pipeline that has the capacity to supply 12 Mbbls/d of ethane from Discovery's Paradis fractionator to the Geismar plant.
The Geismar plant restarted in February 2015, following an explosion and fire that occurred in 2013. An expansion of the plant has also been completed and is planned to increase the facility's ethylene production capacity by 600 million pounds per year. The plant is expected to continue to ramp up to the expanded capacity through March. Production during February and March is expected to be intermittent, resulting in limited financial contribution for the first quarter.
Our refinery grade propylene splitter has a production capacity of approximately 500 million pounds per year of propylene. At our propylene splitter, we purchase refinery grade propylene and fractionate it into polymer grade propylene and propane; as a result, this asset is exposed to the price spread between those commodities.
11
As a merchant producer of ethylene and propylene, our product sales are to customers for use in making plastics and other downstream petrochemical products destined for both domestic and export markets.
Marketing Services
We market NGL products to a wide range of users in the energy and petrochemical industries. The NGL marketing business transports and markets our equity NGLs from the production at our processing plants, and also markets NGLs on behalf of third-party NGL producers, including some of our fee-based processing customers, and the NGL volumes owned by Discovery. The NGL marketing business bears the risk of price changes in these NGL volumes while they are being transported to final sales delivery points. In order to meet sales contract obligations, we may purchase products in the spot market for resale. Other than a long-term agreement to sell our equity NGLs transported on OPPL to ONEOK Hydrocarbon L.P., the majority of sales are based on supply contracts of one year or less in duration. Sales to ONEOK Hydrocarbon L.P., accounted for 5 percent, 9 percent, and 14 percent of our consolidated revenues in 2014, 2013, and 2012, respectively.
In certain situations to facilitate our gas gathering and processing activities, we buy natural gas from our producer customers for resale.
We also market olefin products to a wide range of users in the energy and petrochemical industries. In order to meet sales contract obligations, we may purchase olefin products for resale.
Other NGL & Petchem Operations
We own interests in and/or operate NGL fractionation and storage assets. These assets include a 50 percent interest in an NGL fractionation facility near Conway, Kansas, with capacity of slightly more than 100 Mbbls/d and a 31.5 percent interest in another fractionation facility in Baton Rouge, Louisiana, with a capacity of 60 Mbbls/d. We also own approximately 20 million barrels of NGL storage capacity in central Kansas near Conway.
We own approximately 115 miles of pipelines in the Houston Ship Channel area which transport a variety of products including ethane, propane, ammonia, tertiary butyl alcohol, and other industrial products used in the petrochemical industry. We also own a tunnel crossing pipeline under the Houston Ship Channel. A portion of these pipelines are leased to third parties.
In addition, the first phase of the roughly 270-mile Bayou Ethane Pipeline, which operates between Texas and Louisiana, went into service in December 2014. The pipeline connects a 57-mile pipeline segment from Mount Belvieu to Port Arthur, Texas, and a 50-mile pipeline segment from Lake Charles, Louisiana, to Port Arthur. The pipeline provides ethane transportation capacity from fractionation and storage facilities in Mont Belvieu, Texas, to the WPZ Geismar olefins plant in south Louisiana and serves customers along the way. Phases 2 and 3 are planned to be brought into service in the second and fourth quarters of 2015, respectively.
We also own a 14.6 percent equity interest in Aux Sable and its Channahon, Illinois, gas processing and NGL fractionation facility near Chicago. The facility is capable of processing up to 2.1 Bcf/d of natural gas from the Alliance Pipeline system and fractionating approximately 102 Mbbls/d of extracted liquids into NGL products. Additionally, Aux Sable owns an 80 MMcf/d gas conditioning plant and a 12-inch, 83-mile gas pipeline infrastructure in North Dakota that provides additional NGLs to Channahon from the Bakken Shale in the Williston basin.
WPZ Operating Areas
WPZ organizes these businesses into the following operating areas:
Northeast G&P is comprised of the midstream gathering and processing businesses in the Marcellus and Utica shale regions, as well as a 69 percent equity investment in Laurel Mountain and a 58 percent equity investment in Caiman II.
Atlantic-Gulf is comprised of Transco and significant natural gas gathering and processing and crude production handling and transportation in the Gulf Coast region, as well as a 50 percent equity investment in Gulfstream, a 41 percent interest in Constitution (a consolidated entity), and a 60 percent equity investment in Discovery.
12
West is comprised of the gathering, processing and treating operations in New Mexico, Colorado, and Wyoming and Northwest Pipeline.
NGL & Petchem Services is comprised of our 88.5 percent interest in an olefins production facility in Geismar, Louisiana following the recent expansion to the facility, along with an RGP Splitter and various petrochemical and feedstock pipelines in the Gulf Coast region, an oil sand offgas processing plant near Fort McMurray, Alberta, and an NGL/olefin fractionation facility and B/B Splitter facility at Redwater, Alberta. This segment also includes an NGL and natural gas marketing business, storage facilities and an undivided 50 percent interest in an NGL fractionator near Conway, Kansas, and a 50 percent equity-method investment in OPPL.
Operated Equity Investments
Discovery
We own a 60 percent equity interest in and operate the facilities of Discovery. Discovery's assets include a 600 MMcf/d cryogenic natural gas processing plant near Larose, Louisiana, a 32 Mbbls/d NGL fractionator plant near Paradis, Louisiana, and an offshore natural gas gathering and transportation system in the Gulf of Mexico. Construction is complete for the Keathley Canyon Connector, a deepwater lateral pipeline in the central deepwater Gulf of Mexico. The lateral pipeline is estimated to have the capacity to flow more than 400 MMcf/d and will accommodate the tie-in of other deepwater prospects.
Laurel Mountain
We own a 69 percent equity interest in a joint venture, Laurel Mountain, that includes a gathering system that we operate in western Pennsylvania. Laurel Mountain has a long-term, dedicated, volumetric-based fee agreement, with exposure to natural gas prices, to gather the anchor customer's production in the western Pennsylvania area of the Marcellus Shale.
Overland Pass Pipeline
We also operate and own a 50 percent ownership interest in OPPL. OPPL is capable of transporting 255 Mbbls/d and includes approximately 1,096 miles of NGL pipeline extending from Opal, Wyoming, to the Mid-Continent NGL market center near Conway, Kansas, along with extensions into the Piceance and Denver-Julesberg basins in Colorado. In 2013, a pipeline connection and capacity expansions were installed to accommodate volumes coming from the Bakken Shale in the Williston basin in North Dakota. Our equity NGL volumes from our two Wyoming plants and our Willow Creek facility in Colorado are dedicated for transport on OPPL under a long-term transportation agreement.
Operating Statistics
The following table summarizes our significant operating statistics for Williams Partners' midstream business:
| 2014 |
| 2013 |
| 2012 | |||
Volumes: (1) |
|
|
|
|
| |||
Gathering (Tbtu) | 1,834 | |
| 1,731 | |
| 1,616 | |
Plant inlet natural gas (Tbtu) | 1,419 | |
| 1,549 | |
| 1,638 | |
NGL production (Mbbls/d) (2) | 144 | |
| 143 | |
| 209 | |
NGL equity sales (Mbbls/d) (2) | 41 | |
| 40 | |
| 77 | |
Crude oil transportation (Mbbls/d) (2) | 105 | |
| 117 | |
| 126 | |
Geismar ethylene sales (millions of pounds) | - | |
| 467 | |
| 1,058 | |
__________
(1) | Excludes volumes associated with Partially Owned Entities. |
(2) | Annual average Mbbls/d. |
13
Access Midstream
Our Access Midstream segment provides gathering, treating, and compression services to producers under long-term, fee-based contracts in Pennsylvania, West Virginia, Ohio, Louisiana, Texas, Arkansas, Oklahoma, Kansas, and Wyoming.
Our customer contracts provide us with extensive acreage dedications in our operating regions and generally include fee redetermination or cost of service mechanisms that are designed to support a return on invested capital and allow our gathering rates to be adjusted, subject to specified caps in certain cases, to account for variability in volume, capital expenditures, compression and other expenses.
We derive certain fee-based revenues through gas gathering agreements with two major customers. Pursuant to their respective applicable gas gathering agreements, these customers have agreed to minimum volume commitments covering their respective producing regions. If the minimum annual or semi-annual volume commitment is not met, these customers are obligated to pay a fee equal to the applicable fee for each Mcf by which the applicable customer's minimum annual or semi-annual volume commitment exceeds the actual volumes gathered. The revenue associated with such shortfall fees is recognized in the fourth quarter of each year.
Operations within Access Midstream are organized by region. The following table summarizes ACMP's average daily throughput and assets for these regions as of and for the year ended December 31, 2014:
| Location |
| Average Throughput (Bcf/d) (1) |
| Approximate Length of Pipeline (Miles) |
| Gas Compression (Horsepower) |
Region |
|
|
|
|
|
|
|
Barnett Shale | Texas |
| .907 |
| 860 |
| 134,660 |
Eagle Ford Shale | Texas |
| .321 |
| 947 |
| 104,157 |
Haynesville Shale | Louisiana |
| .672 |
| 585 |
| 20,195 |
Marcellus Shale | Pennsylvania & West Virginia |
| 1.214 |
| 940 |
| 136,090 |
Niobrara Shale | Wyoming |
| .028 |
| 168 |
| 51,345 |
Utica Shale | Ohio |
| .364 |
| 375 |
| 135,010 |
Mid-Continent | Texas, Oklahoma, Kansas, & Arkansas |
| .555 |
| 2,865 |
| 108,284 |
Total |
|
| 4.061 |
| 6,740 |
| 689,741 |
_____________
(1) | Throughput in all regions represents net throughput allocated to our interest. |
Certain Equity Investments
Delaware Basin Gas Gathering System
We own a non-operated 50 percent interest in the Delaware Basin gas gathering system in the Mid-Continent region. The system is comprised of 242 miles of gathering pipeline, located in west Texas. Our interest is accounted for as an equity-method investment.
Utica East Ohio Midstream
UEOM is a joint project to develop infrastructure for the gathering, processing and fractionation of natural gas and NGLs in the Utica Shale play in Eastern Ohio. We, along with other equity owners, operate the infrastructure complex which consists of natural gas gathering and compression facilities, four processing plants with a total capacity of 800 MMcf per day, a 135,000 barrel per day NGL fractionation facility, approximately 600,000 barrels of NGL storage capacity and other ancillary assets, including loading and terminal facilities that are operated by our partner. These assets earn a fixed fee that escalates annually within a specified range. We own a 49 percent interest and UEOM is accounted for as an equity-method investment.
14
Appalachia Midstream
Through our wholly owned subsidiary Appalachia Midstream, we operate 100 percent of and own an approximate average 45 percent interest in 11 natural gas gathering systems that consist of approximately 906 miles of gathering pipeline in the Marcellus Shale region. The majority of our volumes in the region are gathered from northern Pennsylvania, southwestern Pennsylvania and the northwestern panhandle of West Virginia in core areas of the Marcellus Shale. Appalachia Midstream operates the assets under long-term, 100 percent fixed fee gathering agreements that include significant acreage dedications and cost of service mechanisms. The 11 gathering systems are separate investments with ownership percentages ranging from 33.75 percent to 67.5 percent and each gathering system is accounted for as an equity-method investment.
Williams NGL & Petchem Services
The Williams NGL & Petchem Services segment consists primarily of certain domestic olefins pipeline assets, certain Canadian growth projects under development, including a propane dehydrogenation facility and a liquids extraction plant. As this segment is currently comprised primarily of projects under development there are no operating revenues. We anticipate contributing to WPZ the assets and projects that comprise this segment in the future. The transaction will be subject to execution of an agreement, review, and recommendation by the Conflicts Committee of the general partner of WPZ, and approval of both our and WPZ's Board of Directors.
Additional Business Segment Information
Our ongoing business segments are presented as continuing operations in the accompanying financial statements and Notes to Consolidated Financial Statements included in Part II.
We perform certain management, legal, financial, tax, consultation, information technology, administrative and other services for our subsidiaries.
Our principal sources of cash are from dividends, distributions and advances from our subsidiaries, investments, payments by subsidiaries for services rendered, and, if needed, external financings, and net proceeds from asset sales. The terms of certain subsidiaries' borrowing arrangements may limit the transfer of funds to us under certain conditions.
We believe that we have adequate sources and availability of raw materials and commodities for existing and anticipated business needs. Our interstate pipeline systems are all regulated in various ways resulting in the financial return on the investments made in the systems being limited to standards permitted by the regulatory agencies. Each of the pipeline systems has ongoing capital requirements for efficiency and mandatory improvements, with expansion opportunities also necessitating periodic capital outlays.
15
Revenues by service that exceeded 10 percent of consolidated revenue include:
| Williams |
| Access |
| Total | ||||||
| (Millions) | ||||||||||
2014 |
|
|
|
|
| ||||||
Service: |
|
|
|
| | | |||||
Regulated natural gas transportation & storage | $ | 1,781 | |
| $ | - | |
| $ | 1,781 | |
Gathering & processing | 1,015 | |
| 781 | |
| 1,796 | | |||
|
|
|
|
|
| ||||||
2013 |
|
|
|
|
| ||||||
Service: |
|
|
|
|
| ||||||
Regulated natural gas transportation & storage | $ | 1,704 | |
| N/A |
| $ | 1,704 | | ||
Gathering & processing | 932 | |
| N/A |
| 932 | | ||||
|
|
|
|
|
| ||||||
2012 |
|
|
|
|
| ||||||
Service: |
|
|
|
|
| ||||||
Regulated natural gas transportation & storage | $ | 1,598 | |
| N/A |
| $ | 1,598 | | ||
Gathering & processing | 844 | |
| N/A |
| 844 | | ||||
REGULATORY MATTERS
FERC
Our gas pipeline interstate transmission and storage activities are subject to FERC regulation under the Natural Gas Act of 1938 (NGA) and under the Natural Gas Policy Act of 1978, and, as such, its rates and charges for the transportation of natural gas in interstate commerce, its accounting, and the extension, enlargement or abandonment of its jurisdictional facilities, among other things, are subject to regulation. Each gas pipeline company holds certificates of public convenience and necessity issued by the FERC authorizing ownership and operation of all pipelines, facilities and properties for which certificates are required under the NGA. FERC Standards of Conduct govern how our interstate pipelines communicate and do business with gas marketing employees. Among other things, the Standards of Conduct require that interstate pipelines not operate their systems to preferentially benefit gas marketing functions.
FERC regulation requires all terms and conditions of service, including the rates charged, to be filed with and approved by the FERC before any changes can go into effect. Each of our interstate natural gas pipeline companies establishes its rates primarily through the FERC's ratemaking process. Key determinants in the ratemaking process are:
• | Costs of providing service, including depreciation expense; |
• | Allowed rate of return, including the equity component of the capital structure and related income taxes; |
• | Contract and volume throughput assumptions. |
The allowed rate of return is determined in each rate case. Rate design and the allocation of costs between the reservation and commodity rates also impact profitability. As a result of these proceedings, certain revenues previously collected may be subject to refund.
We also own interests in and operate two offshore transmission pipelines that are regulated by the FERC because they are deemed to transport gas in interstate commerce. Black Marlin Pipeline Company provides transportation service for offshore Texas production in the High Island area and redelivers that gas to intrastate pipeline interconnects near Texas City. Discovery provides transportation service for offshore Louisiana production from the South Timbalier, Grand Isle, Ewing Bank, and Green Canyon (deepwater) areas to an onshore processing facility and downstream interconnect points with major interstate pipelines. In addition, Williams Partners owns a 50 percent interest in and is
16
the operator of OPPL, which is an interstate natural gas liquids pipeline regulated by the FERC pursuant to the Interstate Commerce Act. OPPL provides transportation service pursuant to tariffs filed with the FERC.
Pipeline Safety
Our gas pipelines are subject to the Natural Gas Pipeline Safety Act of 1968, as amended, the Pipeline Safety Improvement Act of 2002, and the Pipeline Safety, Regulatory Certainty, and Jobs Creation Act of 2011 (Pipeline Safety Act), which regulates safety requirements in the design, construction, operation and maintenance of interstate natural gas transmission facilities. The United States Department of Transportation (USDOT) administers federal pipeline safety laws.
Federal pipeline safety laws authorize USDOT to establish minimum safety standards for pipeline facilities and persons engaged in the transportation of gas or hazardous liquids by pipeline. These safety standards apply to the design, construction, testing, operation, and maintenance of gas and hazardous liquids pipeline facilities affecting interstate or foreign commerce. USDOT has also established reporting requirements for operators of gas and hazardous liquid pipeline facilities, as well as provisions for establishing the qualification of pipeline personnel and requirements for managing the integrity of gas transmission and distribution lines and certain hazardous liquid pipelines. To ensure compliance with these provisions, USDOT performs pipeline safety inspections and has the authority to initiate enforcement actions.
Federal pipeline safety regulations contain an exemption that applies to gathering lines in certain rural locations. A substantial portion of our gathering lines qualify for that exemption and are currently not regulated under federal law. However, USDOT is completing a congressionally-mandated review of the adequacy of the existing federal and state regulations for gathering lines and has indicated that it may apply additional safety standards to rural gas gathering lines in the future.
States are preempted by federal law from regulating pipeline safety for interstate pipelines but most are certified by USDOT to assume responsibility for enforcing intrastate pipeline safety regulations and inspecting intrastate pipelines. In practice, because states can adopt stricter standards for intrastate pipelines than those imposed by the federal government for interstate lines, they vary considerably in their authority and capacity to address pipeline safety.
On January 3, 2012, the Pipeline Safety Act was enacted. The Pipeline Safety Act requires USDOT to complete a number of reports in preparation for potential rulemakings. The issues addressed in these rulemaking provisions include, but are not limited to, the use of automatic or remotely controlled shut-off valves on new or replaced transmission line facilities, modifying the requirements for pipeline leak detection systems, and expanding the scope of the pipeline integrity management requirements. USDOT is considering these and other provisions in the Pipeline Safety Act and has sought public comment on changes to the standards in its pipeline safety regulations.
Pipeline Integrity Regulations
We have developed an enterprise wide Gas Integrity Management Plan that we believe meets the United States Department of Transportation Pipeline and Hazardous Materials Safety Administration (PHMSA) final rule that was issued pursuant to the requirements of the Pipeline Safety Improvement Act of 2002. The rule requires gas pipeline operators to develop an integrity management program for gas transmission pipelines that could affect high consequence areas in the event of pipeline failure. The integrity management program includes a baseline assessment plan along with periodic reassessments to be completed within required time frames. In meeting the integrity regulations, we have identified high consequence areas and developed baseline assessment plans. We completed the assessments within the required time frames, with two exceptions that have been reported to PHMSA. Ongoing periodic reassessments and initial assessments of any new high consequence areas are expected to be completed within the time frames required by the rule. We estimate that the cost to be incurred in 2015 associated with this program to be approximately $57 million, most of which we expect to be capital expenditures. Management considers the costs associated with compliance with the rule to be prudent costs incurred in the ordinary course of business and, therefore, recoverable through Northwest Pipeline's and Transco's rates.
We developed a Liquid Integrity Management Plan that we believe meets the PHMSA final rule that was issued pursuant to the requirements of the Pipeline Safety Improvement Act of 2002. The rule requires liquid pipeline operators
17
to develop an integrity management program for liquid transmission pipelines that could affect high consequence areas (whether onshore or offshore) in the event of pipeline failure. The integrity management program includes a baseline assessment plan along with periodic reassessments expected to be completed within required time frames. In meeting the integrity regulations, we utilized government defined high consequence areas and developed baseline assessment plans. We completed assessments within the required time frames. We estimate that the cost to be incurred in 2015 associated with this program will be approximately $2 million, most of which we expect to be included in 2015 operating expenses. Ongoing periodic reassessments and initial assessments of any new high consequence areas are expected to be completed within the time frames required by the rule. Management considers the costs associated with compliance with the rule to be prudent costs incurred in the ordinary course of business.
State Gathering Regulation
Our onshore midstream gathering operations are subject to regulation by states in which we operate. Of the states where our midstream business gathers gas, currently only Texas and New York actively regulate gathering activities. Texas regulates gathering primarily through complaint mechanisms under which the state commission may resolve disputes involving an individual gathering arrangement. New York has specific regulations pertaining to the design, construction and operations of gathering lines in New York.
OCSLA
Our offshore midstream gathering is subject to the Outer Continental Shelf Lands Act (OCSLA). Although offshore gathering facilities are not subject to the NGA, offshore transmission pipelines are subject to the NGA, and in recent years the FERC has taken a broad view of offshore transmission, finding many shallow-water pipelines to be jurisdictional transmission. Most offshore gathering facilities are subject to the OCSLA, which provides in part that outer continental shelf pipelines "must provide open and nondiscriminatory access to both owner and nonowner shippers."
Olefins
Our olefins assets are regulated by the Louisiana Department of Environmental Quality, the Texas Railroad Commission, and various other state and federal entities regarding our liquids pipelines.
These olefins assets are also subject to the liquid pipeline safety and integrity regulations previously discussed above since both Louisiana and Texas have adopted the integrity management regulations defined by PHMSA.
Canadian Operations
Our Canadian assets are regulated by the Alberta Energy Regulator (AER), which includes specifics to pipeline safety and integrity. The regulatory system for the Alberta oil and gas industry incorporates a large measure of self-regulation, providing that licensed operators are held responsible for ensuring that their operations are conducted in accordance with all provincial regulatory requirements. For situations in which noncompliance with the applicable regulations is at issue, the AER has an enforcement process with escalating consequences.
See Note 18 – Contingent Liabilities and Commitments of our Notes to Consolidated Financial Statements for further details on our regulatory matters. For additional information regarding regulatory matters, please also refer to "Risk Factors - " The operation of our businesses might also be adversely affected by changes in government regulations or in their interpretation or implementation, or the introduction of new laws or regulations applicable to our businesses or our customers ."
ENVIRONMENTAL MATTERS
Our operations are subject to federal environmental laws and regulations as well as the state, local and tribal laws and regulations adopted by the jurisdictions in which we operate. We could incur liability to governments or third parties for any unlawful discharge of pollutants into the air, soil, or water, as well as liability for cleanup costs. Materials could be released into the environment in several ways including, but not limited to:
18
• | Leakage from gathering systems, underground gas storage caverns, pipelines, processing or treating facilities, transportation facilities and storage tanks; |
• | Damage to facilities resulting from accidents during normal operations; |
• | Damages to onshore and offshore equipment and facilities resulting from storm events or natural disasters; |
• | Blowouts, cratering and explosions. |
In addition, we may be liable for environmental damage caused by former owners or operators of our properties.
We believe compliance with current environmental laws and regulations will not have a material adverse effect on our capital expenditures, earnings or current competitive position. However, environmental laws and regulations could affect our business in various ways from time to time, including incurring capital and maintenance expenditures, fines and penalties, and creating the need to seek relief from the FERC for rate increases to recover the costs of certain capital expenditures and operation and maintenance expenses.
For additional information regarding the potential impact of federal, state, tribal or local regulatory measures on our business and specific environmental issues, please refer to "Risk Factors - "Our operations are subject to environmental laws and regulations, including laws and regulations relating to climate change and greenhouse gas emissions, which may expose us to significant costs, liabilities and expenditures that could exceed current expectations," and "Management's Discussion and Analysis of Financial Condition and Results of Operations - Environmental" and "Environmental Matters" in Note 18 – Contingent Liabilities and Commitments of our Notes to Consolidated Financial Statements.
COMPETITION
Gas Pipeline Business
The natural gas industry has a highly-liquid competitive commodity market in natural gas and increasingly competitive markets for natural gas services, including competitive secondary markets in pipeline capacity. Large reserves of shale gas have been discovered, in many cases much closer to major market centers. As a result, pipeline capacity is being used more efficiently and competition among pipeline suppliers to connect growing supply to market has increased.
Local distribution company (LDC) and electric industry restructuring by states have affected pipeline markets. Pipeline operators are increasingly challenged to accommodate the flexibility demanded by customers and allowed under tariffs. The state plans have in some cases discouraged LDCs from signing long-term contracts for new capacity.
States have developed new plans that require utilities to encourage energy saving measures and diversify their energy supplies to include renewable sources. This has lowered the growth of residential gas demand. However, due to relatively low prices of natural gas, demand for electric power generation has increased.
These factors have increased the risk that customers will reduce their contractual commitments for pipeline capacity from traditional producing areas. Future utilization of pipeline capacity will depend on these factors and others impacting both U.S. and global demand for natural gas.
Midstream Business
Generally, our gathering and processing agreements are long-term agreements that may include acreage dedication. We primarily face competition to the extent these agreements approach renewal or new volume opportunities arise. Competition for natural gas volumes is primarily based on reputation, commercial terms, reliability, service levels, location, available capacity, capital expenditures and fuel efficiencies. Our gathering and processing business competes with other midstream companies, interstate and intrastate pipelines, producers and independent gatherers and processors. We primarily compete with five to ten companies across all basins in which we provide services.
19
Ethylene and propylene markets, and therefore our olefins business, compete in a worldwide marketplace. At Geismar, we expect to benefit from the lower cost natural gas based feedstocks in North America versus other crude based feedstocks worldwide. The majority of North American olefins producers have significant downstream petrochemical manufacturing for plastics and other products. As such, they buy or sell ethylene and propylene as required. We operate as a merchant seller of olefins with no downstream manufacturing, and therefore can be either a supplier or a competitor at any given time to these other companies. We compete on the basis of service, price and availability of the products we produce.
Our Canadian midstream facilities continue to be the only NGL/olefins fractionator in western Canada and the only processor of oil sands upgrader offgas. Our extraction of liquids from the upgrader offgas stream allows the upgraders to burn cleaner natural gas streams and reduce their overall air emissions. Our Canadian midstream business competes for the sale of its products with traditional Canadian midstream companies on the basis of operational expertise, price, service offerings and availability of the products we produce.
For additional information regarding competition for our services or otherwise affecting our business, please refer to "Risk Factors - The long-term financial condition of our natural gas transportation and midstream businesses is dependent on the continued availability of natural gas supplies in the supply basins that we access, and demand for those supplies in our traditional markets, "- Our industry is highly competitive and increased competitive pressure could adversely affect our business and operating results ," and "- We may not be able to replace, extend, or add additional customer contracts or contracted volumes on favorable terms, or at all, which could affect our financial condition, the amount of cash available to pay dividends, and our ability to grow. "
EMPLOYEES
At February 1, 2015, we had approximately 6,742 full-time employees.
FINANCIAL INFORMATION ABOUT GEOGRAPHIC AREAS
See Note 19 – Segment Disclosures of our Notes to Consolidated Financial Statements for amounts of revenues during the last three fiscal years from external customers attributable to the United States and all foreign countries. Also see Note 19 – Segment Disclosures of our Notes to Consolidated Financial Statements for information relating to long-lived assets during the last three fiscal years, located in the United States and all foreign countries.
20
Item 1A. Risk Factors
FORWARD-LOOKING STATEMENTS AND CAUTIONARY STATEMENT
FOR PURPOSES OF THE "SAFE HARBOR" PROVISIONS OF
THE PRIVATE SECURITIES LITIGATION REFORM ACT OF 1995
Certain matters contained in this report include "forward-looking statements" within the meaning of Section 27A of the Securities Act of 1933, as amended, and Section 21E of the Securities Exchange Act of 1934, as amended. These forward-looking statements relate to anticipated financial performance, management's plans and objectives for future operations, business prospects, outcome of regulatory proceedings, market conditions and other matters. We make these forward-looking statements in reliance on the safe harbor protections provided under the Private Securities Litigation Reform Act of 1995.
All statements, other than statements of historical facts, included in this report that address activities, events or developments that we expect, believe or anticipate will exist or may occur in the future, are forward-looking statements. Forward-looking statements can be identified by various forms of words such as "anticipates," "believes," "seeks," "could," "may," "should," "continues," "estimates," "expects," "forecasts," "intends," "might," "goals," "objectives," "targets," "planned," "potential," "projects," "scheduled," "will," "assumes," "guidance," "outlook," "in service date," or other similar expressions. These forward-looking statements are based on management's beliefs and assumptions and on information currently available to management and include, among others, statements regarding:
• | Expected levels of cash distributions by Williams Partners L.P. (WPZ) with respect to general partner interests, incentive distribution rights, and limited partner interests; |
• | Levels of dividends to stockholders; |
• | Our future credit ratings; |
• | Amounts and nature of future capital expenditures; |
• | Expansion and growth of our business and operations; |
• | Financial condition and liquidity; |
• | Business strategy; |
• | Cash flow from operations or results of operations; |
• | Seasonality of certain business components; |
• | Natural gas, natural gas liquids and olefins supply, prices and demand; |
• | Demand for our services. |
Forward-looking statements are based on numerous assumptions, uncertainties and risks that could cause future events or results to be materially different from those stated or implied in this report. Many of the factors that will determine these results are beyond our ability to control or predict. Specific factors that could cause actual results to differ from results contemplated by the forward-looking statements include, among others, the following:
• | Whether WPZ will produce sufficient cash flows to provide the level of cash distributions we expect; |
• | Whether we are able to pay current and expected levels of dividends; |
• | Availability of supplies, market demand, and volatility of prices; |
21
• | Inflation, interest rates, fluctuation in foreign exchange rates, and general economic conditions (including future disruptions and volatility in the global credit markets and the impact of these events on our customers and suppliers); |
• | The strength and financial resources of our competitors and the effects of competition; |
• | Whether we are able to successfully identify, evaluate and execute investment opportunities; |
• | Our ability to acquire new businesses and assets and successfully integrate those operations and assets into our existing businesses, as well as successfully expand our facilities; |
• | Development of alternative energy sources; |
• | The impact of operational and development hazards and unforeseen interruptions; |
• | The ability to recover expected insurance proceeds related to the Geismar plant; |
• | Costs of, changes in, or the results of laws, government regulations (including safety and environmental regulations), environmental liabilities, litigation, and rate proceedings; |
• | Our costs and funding obligations for defined benefit pension plans and other postretirement benefit plans; |
• | Changes in maintenance and construction costs; |
• | Changes in the current geopolitical situation; |
• | Our exposure to the credit risk of our customers and counterparties; |
• | Risks related to financing, including restrictions stemming from our debt agreements, future changes in our credit ratings, as well as the credit rating of WPZ as determined by nationally-recognized credit rating agencies and the availability and cost of capital; |
• | The amount of cash distributions from and capital requirements of our investments and joint ventures in which we participate; |
• | Risks associated with weather and natural phenomena, including climate conditions; |
• | Acts of terrorism, including cybersecurity threats and related disruptions; |
• | Additional risks described in our filings with the SEC. |
Given the uncertainties and risk factors that could cause our actual results to differ materially from those contained in any forward-looking statement, we caution investors not to unduly rely on our forward-looking statements. We disclaim any obligations to and do not intend to update the above list or to announce publicly the result of any revisions to any of the forward-looking statements to reflect future events or developments.
In addition to causing our actual results to differ, the factors listed above and referred to below may cause our intentions to change from those statements of intention set forth in this report. Such changes in our intentions may also cause our results to differ. We may change our intentions, at any time and without notice, based upon changes in such factors, our assumptions, or otherwise.
Because forward-looking statements involve risks and uncertainties, we caution that there are important factors, in addition to those listed above, that may cause actual results to differ materially from those contained in the forward-looking statements. These factors are described in the following section.
22
RISK FACTORS
You should carefully consider the following risk factors in addition to the other information in this report. Each of these factors could adversely affect our business, operating results, and financial condition, as well as adversely affect the value of an investment in our securities.
Prices for NGLs, olefins, natural gas, oil and other commodities, are volatile and this volatility could adversely affect our financial results, cash flows, access to capital and ability to maintain our existing businesses.
Our revenues, operating results, future rate of growth and the value of certain components of our businesses depend primarily upon the prices of NGLs, olefins, natural gas, oil or other commodities, and the differences between prices of these commodities, and could be materially adversely affected by an extended period of current low commodity prices or a further decline in commodity prices. Price volatility can impact both the amount we receive for our products and services and the volume of products and services we sell. Prices affect the amount of cash flow available for capital expenditures and our ability to borrow money or raise additional capital. Price volatility can also have an adverse effect on our business, results of operations, financial condition and cash flows.
The markets for NGLs, olefins, natural gas, oil and other commodities are likely to continue to be volatile. Wide fluctuations in prices might result from one or more factors beyond our control, including:
• | Worldwide and domestic supplies of and demand for natural gas, NGLs, olefins, oil, and related commodities; |
• | Turmoil in the Middle East and other producing regions; |
• | The activities of the Organization of Petroleum Exporting Countries; |
• | The level of consumer demand; |
• | The price and availability of other types of fuels or feedstocks; |
• | The availability of pipeline capacity; |
• | Supply disruptions, including plant outages and transportation disruptions; |
• | The price and quantity of foreign imports of natural gas and oil; |
• | Domestic and foreign governmental regulations and taxes; |
• | The credit of participants in the markets where products are bought and sold. |
The long-term financial condition of our natural gas transportation and midstream businesses is dependent on the continued availability of natural gas supplies in the supply basins that we access, and demand for those supplies in our traditional markets.
Our ability to maintain and expand our natural gas transportation and midstream businesses depends on the level of drilling and production by third parties in our supply basins. Production from existing wells and natural gas supply basins with access to our pipeline and gathering systems will naturally decline over time. The amount of natural gas reserves underlying these existing wells may also be less than anticipated, and the rate at which production from these reserves declines may be greater than anticipated. We do not obtain independent evaluations of natural gas and NGL reserves connected to our systems and processing facilities. Accordingly, we do not have independent estimates of total reserves dedicated to our systems or the anticipated life of such reserves. In addition, low prices for natural gas, regulatory limitations, or the lack of available capital could adversely affect the development and production of additional natural gas reserves, the installation of gathering, storage, and pipeline transportation facilities and the import and export of natural gas supplies. The competition for natural gas supplies to serve other markets could also reduce the amount of
23
natural gas supply for our customers. A failure to obtain access to sufficient natural gas supplies will adversely impact our ability to maximize the capacities of our gathering, transportation and processing facilities.
Demand for our services is dependent on the demand for gas in the markets we serve. Alternative fuel sources such as electricity, coal, fuel oils or nuclear energy could reduce demand for natural gas in our markets and have an adverse effect on our business.
A failure to obtain access to sufficient natural gas supplies or a reduction in demand for our services in the markets we serve could result in impairments of our assets and have a material adverse effect on our business, financial condition and results of operations.
We may not be able to grow or effectively manage our growth.
As part of our growth strategy, we consider acquisition opportunities and engage in significant capital projects. We have both a project lifecycle process and an investment evaluation process. These are processes we use to identify, evaluate and execute on acquisition opportunities and capital projects. We may not always have sufficient and accurate information to identify and value potential opportunities and risks or our investment evaluation process may be incomplete or flawed. Regarding potential acquisitions, suitable acquisition candidates may not be available on terms and conditions we find acceptable or, where multiple parties are trying to acquire an acquisition candidate, we may not be chosen as the acquirer. If we are able to acquire a targeted business, we may not be able to successfully integrate the acquired businesses and realize anticipated benefits in a timely manner. Our growth may also be dependent upon the construction of new natural gas gathering, transportation, compression, processing or treating pipelines and facilities, NGL transportation, fractionation or storage facilities or olefins processing facilities, as well as the expansion of existing facilities. We also face all the risks associated with construction. These risks include the inability to obtain skilled labor, equipment, materials, permits, rights-of-way and other required inputs in a timely manner such that projects are completed on time and the risk that construction cost overruns could cause total project costs to exceed budgeted costs. Additional risks associated with growing our business include, among others, that:
• | Changing circumstances and deviations in variables could negatively impact our investment analysis, including our projections of revenues, earnings and cash flow relating to potential investment targets, resulting in outcomes which are materially different than anticipated; |
• | We could be required to contribute additional capital to support acquired businesses or assets. We may assume liabilities that were not disclosed to us, that exceed our estimates and for which contractual protections are either unavailable or prove inadequate; |
• | Acquisitions could disrupt our ongoing business, distract management, divert financial and operational resources from existing operations and make it difficult to maintain our current business standards, controls and procedures; |
• | Acquisitions and capital projects may require substantial new capital, either by the issuance of debt or equity, and we may not be able to access capital markets or obtain acceptable terms. |
If realized, any of these risks could have an adverse impact on our results of operations, including the possible impairment of our assets, and could also have an adverse impact on our financial position or cash flows.
We do not own all of the interests in the Partially Owned Entities, which could adversely affect our ability to operate and control these assets in a manner beneficial to us.
Because we do not control the Partially Owned Entities, we may have limited flexibility to control the operation of or cash distributions received from these entities. The Partially Owned Entities' organizational documents generally require distribution of their available cash to their members on a quarterly basis; however, in each case, available cash is reduced, in part, by reserves appropriate for operating the businesses. Following the closing of the Merger our investments in the Partially Owned Entities accounted for approximately 8 percent of our total consolidated assets. Conflicts of interest may arise in the future between us, on the one hand, and our Partially Owned Entities, on the other hand, with regard to our Partially Owned Entities' governance, business and operations. If a conflict of interest arises
24
between us and a Partially Owned Entity, other owners may control the Partially Owned Entity's actions with respect to such matter (subject to certain limitations), which could be detrimental to our business. Any future disagreements with the other co-owners of these assets could adversely affect our ability to respond to changing economic or industry conditions, which could have a material adverse effect on our business, financial condition, results of operations and cash flows.
Holders of our common stock may not receive dividends in the amount identified in guidance or any dividends.
We may not have sufficient cash each quarter to pay dividends or maintain current or expected levels of dividends. The actual amount of cash we dividend may fluctuate from quarter to quarter and will depend on various factors, some of which are beyond our control, including:
• | The amount of cash that WPZ and our other subsidiaries distribute to us; |
• | The amount of cash we generate from our operations, our working capital needs, our level of capital expenditures, and our ability to borrow; |
• | The restrictions contained in our indentures and credit facility and our debt service requirements; |
• | The cost of acquisitions, if any. |
A failure either to pay dividends or to pay dividends at expected levels could result in a loss of investor confidence, reputational damage and a decrease in the value of our stock price.
Our cash flow depends heavily on the earnings and distributions of WPZ.
Our partnership interest, including the general partner's holding of incentive distribution rights, in WPZ is currently our largest cash-generating asset. Therefore, our cash flow is heavily dependent upon the ability of WPZ to make distributions to its partners. A significant decline in WPZ's earnings and/or distributions would have a corresponding negative impact on us.
Our industry is highly competitive and increased competitive pressure could adversely affect our business and operating results.
We have numerous competitors in all aspects of our businesses, and additional competitors may enter our markets. Some of our competitors are large oil, natural gas and petrochemical companies that have greater access to supplies of natural gas and NGLs than we do. In addition, current or potential competitors may make strategic acquisitions or have greater financial resources than we do, which could affect our ability to make strategic investments or acquisitions. Our competitors may be able to respond more quickly to new laws or regulations or emerging technologies or to devote greater resources to the construction, expansion or refurbishment of their facilities than we can. Similarly, a highly-liquid competitive commodity market in natural gas and increasingly competitive markets for natural gas services, including competitive secondary markets in pipeline capacity, have developed. As a result, pipeline capacity is being used more efficiently, and peaking and storage services are increasingly effective substitutes for annual pipeline capacity. Failure to successfully compete against current and future competitors could have a material adverse effect on our business, results of operations, financial condition and cash flows.
We may not be able to replace, extend, or add additional customer contracts or contracted volumes on favorable terms, or at all, which could affect our financial condition, the amount of cash available to pay dividends, and our ability to grow.
We rely on a limited number of customers and producers for a significant portion of our revenues and supply of natural gas and NGLs. Although many of our customers and suppliers are subject to long-term contracts, if we are unable to replace or extend such contracts, add additional customers, or otherwise increase the contracted volumes of natural gas provided to us by current producers, in each case on favorable terms, if at all, our financial condition, growth plans, and the amount of cash available to pay dividends could be adversely affected. Our ability to replace, extend, or
25
add additional customer or supplier contracts, or increase contracted volumes of natural gas from current producers, on favorable terms, or at all, is subject to a number of factors, some of which are beyond our control, including:
• | The level of existing and new competition in our businesses or from alternative fuel sources, such as electricity, coal, fuel oils, or nuclear energy; |
• | Natural gas, NGL, and olefins prices, demand, availability and margins in our markets. Higher prices for energy commodities related to our businesses could result in a decline in the demand for those commodities and, therefore, in customer contracts or throughput on our pipeline systems. Also, lower energy commodity prices could result in a decline in the production of energy commodities resulting in reduced customer contracts, supply contracts, and throughput on our pipeline systems; |
• | General economic, financial markets and industry conditions; |
• | The effects of regulation on us, our customers and our contracting practices; |
• | Our ability to understand our customers' expectations, efficiently and reliably deliver high quality services and effectively manage customer relationships. The results of these efforts will impact our reputation and positioning in the market. |
Some of our businesses, including WPZ's Access Midstream business, are exposed to supplier concentration risks arising from dependence on a single or a limited number of suppliers.
Some of our businesses may be dependent on a small number of suppliers for delivery of critical goods or services. For instance, pursuant to a compression services agreement, WPZ's Access Midstream business receives a substantial portion of its compression capacity on certain gathering systems from EXLP Operating LLC ("Exterran Operating"). Exterran Operating has, until December 31, 2020, the exclusive right to provide the Access Midstream business with compression services on certain gas gathering systems located in Wyoming, Texas, Oklahoma, Louisiana, Kansas and Arkansas, in return for the payment of specified monthly rates for the services provided, subject to an annual escalation provision. If a supplier on which one of our businesses depends were to fail to timely supply required goods and services such business may not be able to replace such goods and services in a timely manner or otherwise on favorable terms or at all. If our business is unable to adequately diversify or otherwise mitigate such supplier concentration risks and such risks were realized, such businesses could be subject to reduced revenues and increased expenses, which could have a material adverse effect on our financial condition, results of operation and cash flows.
We conduct certain operations through joint ventures that may limit our operational flexibility or require us to make additional capital contributions.
Some of our operations are conducted through joint venture arrangements, and we may enter additional joint ventures in the future. In a joint venture arrangement, we have less operational flexibility, as actions must be taken in accordance with the applicable governing provisions of the joint venture. In certain cases we:
• | Have limited ability to influence or control certain day to day activities affecting the operations; |
• | Cannot control the amount of capital expenditures that we are required to fund with respect to these operations; |
• | Are dependent on third parties to fund their required share of capital expenditures; |
• | May be subject to restrictions or limitations on our ability to sell or transfer our interests in the jointly owned assets; |
• | May be forced to offer rights of participation to other joint venture participants in the area of mutual interest. |
In addition, joint venture participants may have obligations that are important to the success of the joint venture,
26
such as the obligation to pay substantial carried costs pertaining to the joint venture and to pay their share of capital and other costs of the joint venture. The performance and ability of third parties to satisfy their obligations under joint venture arrangements is outside our control. If these third parties do not satisfy their obligations under these arrangements, our business may be adversely affected. Joint venture partners may be in a position to take actions contrary to instructions or requests or contrary to our policies or objectives, and disputes between us and our joint venture partners may result in delays, litigation or operational impasses.
If we fail to make a required capital contribution under the applicable governing provisions of a joint venture arrangements, we could be deemed to be in default under the joint venture agreement. Joint venture partners may be permitted to fund any deficiency resulting from our failure to make such capital contribution, which would result in a dilution of our ownership interest, or such joint venture partners may have the option to purchase all of our existing interest in the subject joint venture.
The risks described above or the failure to continue joint ventures, or to resolve disagreements with joint venture partners could adversely affect our ability to conduct our operation that is the subject of a joint venture, which could in turn negatively affect our financial condition and results of operations.
Our operations are subject to operational hazards and unforeseen interruptions.
There are operational risks associated with the gathering, transporting, storage, processing and treating of natural gas, the fractionation, transportation and storage of NGLs, the processing of olefins, and crude oil transportation and production handling, including:
• | Aging infrastructure and mechanical problems; |
• | Damages to pipelines and pipeline blockages or other pipeline interruptions; |
• | Uncontrolled releases of natural gas (including sour gas), NGLs, olefins products, brine or industrial chemicals; |
• | Collapse or failure of storage caverns; |
• | Operator error; |
• | Damage caused by third-party activity, such as operation of construction equipment; |
• | Pollution and other environmental risks; |
• | Fires, explosions, craterings and blowouts; |
• | Truck and rail loading and unloading; |
• | Operating in a marine environment. |
Any of these risks could result in loss of human life, personal injuries, significant damage to property, environmental pollution, impairment of our operations, loss of services to our customers, reputational damage and substantial losses to us. The location of certain segments of our facilities in or near populated areas, including residential areas, commercial business centers and industrial sites, could increase the level of damages resulting from these risks. An event such as those described above could have a material adverse effect on our financial condition and results of operations, particularly if the event is not fully covered by insurance.
We do not insure against all potential risks and losses and could be seriously harmed by unexpected liabilities or by the inability of our insurers to satisfy our claims.
In accordance with customary industry practice, we maintain insurance against some, but not all, risks and losses, and only at levels we believe to be appropriate. We currently maintain excess liability insurance with limits of $695 million per occurrence and in the annual aggregate with a $2 million per occurrence deductible. This insurance covers
27
us, our subsidiaries, and certain of our affiliates for legal and contractual liabilities arising out of bodily injury or property damage, including resulting loss of use to third parties. This excess liability insurance includes coverage for sudden and accidental pollution liability for full limits, with the first $135 million of insurance also providing gradual pollution liability coverage for natural gas and NGL operations.
Although we maintain property insurance on certain physical assets that we own, lease or are responsible to insure, the policy may not cover the full replacement cost of all damaged assets or the entire amount of business interruption loss we may experience. In addition, certain perils may be excluded from coverage or be sub-limited. We may not be able to maintain or obtain insurance of the type and amount we desire at reasonable rates. We may elect to self-insure a portion of our risks. We do not insure our onshore underground pipelines for physical damage, except at certain locations such as river crossings and compressor stations. Offshore assets are covered for property damage when loss is due to a named windstorm event, but coverage for loss caused by a named windstorm is significantly sub-limited and subject to a large deductible. All of our insurance is subject to deductibles.
In addition, to the insurance coverage described above, we are a member of Oil Insurance Limited ("OIL"), an energy industry mutual insurance company, which provides coverage for damage to our property. As an insured member of OIL, we share in the losses among other OIL members even if our property is not damaged.
The occurrence of any risks not fully covered by insurance could have a material adverse effect on our business, results of operations, financial condition, cash flows and our ability to repay our debt.
The time required to return WPZ's Geismar plant to full expanded production following the explosion and fire at the facility on June 13, 2013, and the amount and timing of insurance recoveries related to such incident could be materially different than we anticipate and could cause our financial results and levels of dividends to be materially different than we project.
Our projections of financial results and expected levels of dividends are based on numerous assumptions and estimates, including, but not limited to, the time required to return WPZ's Geismar plant to full expanded production and the amount and timing of insurance recoveries related to the June 13, 2013, explosion and fire at our Geismar plant. Additionally, insurers continue to evaluate WPZ's claims and have raised questions around key assumptions involving its business-interruption claim; as a result, the insurers have elected to make a partial payment pending further assessment of these issues. Although we currently expect WPZ to recover most of the limits under a $500 million insurance program related to the Geismar incident, there can be no assurance that it will recover the full policy limits. Total receipts from the insurers to date are $296 million. Our financial results and levels of dividends could be materially different than we project if our assumptions and estimates related to the incident are materially different than actual outcomes.
Our assets and operations, as well as our customers' assets and operations, can be adversely affected by weather and other natural phenomena.
Our assets and operations, especially those located offshore, and our customers' assets and operations can be adversely affected by hurricanes, floods, earthquakes, landslides, tornadoes, fires and other natural phenomena and weather conditions, including extreme or unseasonable temperatures, making it more difficult for us to realize the historic rates of return associated with our assets and operations. A significant disruption in our or our customers' operations or a significant liability for which we are not fully insured could have a material adverse effect on our business, financial condition, results of operations and cash flows.
Acts of terrorism could have a material adverse effect on our business, financial condition, results of operations and cash flows.
Given the volatile nature of the commodities we transport, process, store and sell, our assets and the assets of our customers and others in our industry may be targets of terrorist activities. A terrorist attack could create significant price volatility, disrupt our business, limit our access to capital markets or cause significant harm to our operations, such as full or partial disruption to our ability to produce, process, transport or distribute natural gas, NGLs or other commodities. Acts of terrorism, as well as events occurring in response to or in connection with acts of terrorism, could cause environmental repercussions that could result in a significant decrease in revenues or significant reconstruction
28
or remediation costs, which could have a material adverse effect on our business, financial condition, results of operations and cash flows.
29
Our business could be negatively impacted by security threats, including cybersecurity threats, and related disruptions.
We rely on our information technology infrastructure to process, transmit and store electronic information, including information we use to safely operate our assets. While we believe that we maintain appropriate information security policies, practices and protocols, we face cybersecurity and other security threats to our information technology infrastructure, which could include threats to our operational industrial control systems and safety systems that operate our pipelines, plants and assets. We could face unlawful attempts to gain access to our information technology infrastructure, including coordinated attacks from hackers, whether state-sponsored groups, "hacktivists," or private individuals. The age, operating systems or condition of our current information technology infrastructure and software assets and our ability to maintain and upgrade such assets could affect our ability to resist cybersecurity threats. We could also face attempts to gain access to information related to our assets through attempts to obtain unauthorized access by targeting acts of deception against individuals with legitimate access to physical locations or information.
Breaches in our information technology infrastructure or physical facilities, or other disruptions including those arising from theft, vandalism, fraud or unethical conduct, could result in damage to our assets, unnecessary waste, safety incidents, damage to the environment, reputational damage, potential liability or the loss of contracts, and have a material adverse effect on our operations, financial position and results of operations.
The natural gas sales, transportation and storage operations of our gas pipelines are subject to regulation by the FERC, which could have an adverse impact on their ability to establish transportation and storage rates that would allow them to recover the full cost of operating their respective pipelines, including a reasonable rate of return.
In addition to regulation by other federal, state and local regulatory authorities, under the Natural Gas Act of 1938, interstate pipeline transportation and storage service is subject to regulation by the FERC. Federal regulation extends to such matters as:
• | Transportation and sale for resale of natural gas in interstate commerce; |
• | Rates, operating terms, types of services and conditions of service; |
• | Certification and construction of new interstate pipelines and storage facilities; |
• | Acquisition, extension, disposition or abandonment of existing interstate pipelines and storage facilities; |
• | Accounts and records; |
• | Depreciation and amortization policies; |
• | Relationships with affiliated companies who are involved in marketing functions of the natural gas business; |
• | Market manipulation in connection with interstate sales, purchases or transportation of natural gas. |
Regulatory or administrative actions in these areas, including successful complaints or protests against the rates of the gas pipelines, can affect our business in many ways, including decreasing tariff rates and revenues, decreasing volumes in our pipelines, increasing our costs and otherwise altering the profitability of our pipeline business.
Our operations are subject to environmental laws and regulations, including laws and regulations relating to climate change and greenhouse gas emissions, which may expose us to significant costs, liabilities and expenditures that could exceed expectations.
Our operations are subject to extensive federal, state, tribal and local laws and regulations governing environmental protection, endangered and threatened species, the discharge of materials into the environment and the security of chemical and industrial facilities. Substantial costs, liabilities, delays and other significant issues related to environmental laws and regulations are inherent in the gathering, transportation, storage, processing and treating of natural gas, fractionation, transportation and storage of NGLs, processing of olefins, and crude oil transportation and
30
production handling as well as waste disposal practices and construction activities. Failure to comply with these laws, regulations and permits may result in the assessment of administrative, civil and/or criminal penalties, the imposition of remedial obligations, the imposition of stricter conditions on or revocation of permits, the issuance of injunctions limiting or preventing some or all of our operations and delays in granting permits.
Joint and several, strict liability may be incurred without regard to fault under certain environmental laws and regulations, for the remediation of contaminated areas and in connection with spills or releases of materials associated with natural gas, oil and wastes on, under or from our properties and facilities. Private parties, including the owners of properties through which our pipeline and gathering systems pass and facilities where our wastes are taken for reclamation or disposal, may have the right to pursue legal actions to enforce compliance as well as to seek damages for noncompliance with environmental laws and regulations or for personal injury or property damage arising from our operations. Some sites at which we operate are located near current or former third-party hydrocarbon storage and processing or oil and natural gas operations or facilities, and there is a risk that contamination has migrated from those sites to ours.
We are generally responsible for all liabilities associated with the environmental condition of our facilities and assets, whether acquired or developed, regardless of when the liabilities arose and whether they are known or unknown. In connection with certain acquisitions and divestitures, we could acquire, or be required to provide indemnification against, environmental liabilities that could expose us to material losses, which may not be covered by insurance. In addition, the steps we could be required to take to bring certain facilities into compliance could be prohibitively expensive, and we might be required to shut down, divest or alter the operation of those facilities, which might cause us to incur losses.
In addition, climate change regulations and the costs associated with the regulation of emissions of greenhouse gases ("GHGs" ) have the potential to affect our business. Regulatory actions by the Environmental Protection Agency or the passage of new climate change laws or regulations could result in increased costs to (i) operate and maintain our facilities, (ii) install new emission controls on our facilities and (iii) administer and manage our GHG compliance program. If we are unable to recover or pass through a significant level of our costs related to complying with climate change regulatory requirements imposed on us, it could have a material adverse effect on our results of operations and financial condition. To the extent financial markets view climate change and GHG emissions as a financial risk, this could negatively impact our cost of and access to capital. Climate change and GHG regulation could also reduce demand for our services.
If third-party pipelines and other facilities interconnected to our pipelines and facilities become unavailable to transport natural gas and NGLs or to treat natural gas, our revenues could be adversely affected.
We depend upon third-party pipelines and other facilities that provide delivery options to and from our pipelines and facilities for the benefit of our customers. Because we do not own these third-party pipelines or other facilities, their continuing operation is not within our control. If these pipelines or facilities were to become temporarily or permanently unavailable for any reason, or if throughput were reduced because of testing, line repair, damage to pipelines or facilities, reduced operating pressures, lack of capacity, increased credit requirements or rates charged by such pipelines or facilities or other causes, we and our customers would have reduced capacity to transport, store or deliver natural gas or NGL products to end use markets or to receive deliveries of mixed NGLs, thereby reducing our revenues. Any temporary or permanent interruption at any key pipeline interconnect or in operations on third-party pipelines or facilities that would cause a material reduction in volumes transported on our pipelines or our gathering systems or processed, fractionated, treated or stored at our facilities could have a material adverse effect on our business, results of operations, financial condition and cash flows.
The operation of our businesses might also be adversely affected by changes in government regulations or in their interpretation or implementation, or the introduction of new laws or regulations applicable to our businesses or our customers.
Public and regulatory scrutiny of the energy industry has resulted in the proposal and/or implementation of increased regulations. Such scrutiny has also resulted in various inquiries, investigations and court proceedings, including litigation of energy industry matters. Both the shippers on our pipelines and regulators have rights to challenge the rates we charge under certain circumstances. Any successful challenge could materially affect our results of operations.
31
Certain inquiries, investigations and court proceedings are ongoing. Adverse effects may continue as a result of the uncertainty of ongoing inquiries, investigations and court proceedings, or additional inquiries and proceedings by federal or state regulatory agencies or private plaintiffs. In addition, we cannot predict the outcome of any of these inquiries or whether these inquiries will lead to additional legal proceedings against us, civil or criminal fines and/or penalties, or other regulatory action, including legislation, which might be materially adverse to the operation of our business and our results of operations or increase our operating costs in other ways. Current legal proceedings or other matters, including environmental matters, suits, regulatory appeals and similar matters might result in adverse decisions against us which, among other outcomes, could result in the imposition of substantial penalties and fines and could damage our reputation. The result of such adverse decisions, either individually or in the aggregate, could be material and may not be covered fully or at all by insurance.
In addition, existing regulations might be revised or reinterpreted, and new laws and regulations, including those pertaining to oil and gas hedging and cash collateral requirements, might be adopted or become applicable to us, our customers or our business activities. If new laws or regulations are imposed relating to oil and gas extraction, or if additional levels of reporting, regulation or permitting moratoria are required or imposed, including those related to hydraulic fracturing, the volumes of natural gas and other products that we transport, gather, process and treat could decline and our results of operations could be adversely affected.
Certain of our gas pipeline services are subject to long-term, fixed-price contracts that are not subject to adjustment, even if our cost to perform such services exceeds the revenues received from such contracts.
Our gas pipelines provide some services pursuant to long-term, fixed-price contracts. It is possible that costs to perform services under such contracts will exceed the revenues our pipelines collect for their services. Although most of the services are priced at cost-based rates that are subject to adjustment in rate cases, under FERC policy, a regulated service provider and a customer may mutually agree to sign a contract for service at a "negotiated rate" that may be above or below the FERC regulated cost-based rate for that service. These "negotiated rate" contracts are not generally subject to adjustment for increased costs that could be produced by inflation or other factors relating to the specific facilities being used to perform the services.
Our operating results for certain components of our business might fluctuate on a seasonal basis.
Revenues from certain components of our business can have seasonal characteristics. In many parts of the country, demand for natural gas and other fuels peaks during the winter. As a result, our overall operating results in the future might fluctuate substantially on a seasonal basis. Demand for natural gas and other fuels could vary significantly from our expectations depending on the nature and location of our facilities and pipeline systems and the terms of our natural gas transportation arrangements relative to demand created by unusual weather patterns.
We do not own all of the land on which our pipelines and facilities are located, which could disrupt our operations.
We do not own all of the land on which our pipelines and facilities have been constructed. As such, we are subject to the possibility of increased costs to retain necessary land use. In those instances in which we do not own the land on which our facilities are located, we obtain the rights to construct and operate our pipelines and gathering systems on land owned by third parties and governmental agencies for a specific period of time. In addition, some of our facilities cross Native American lands pursuant to rights-of-way of limited term. We may not have the right of eminent domain over land owned by Native American tribes. Our loss of these rights, through our inability to renew right-of-way contracts or otherwise, could have a material adverse effect on our business, results of operations, financial condition and cash flows.
Difficult conditions in the global financial markets and the economy in general could negatively affect our business and results of operations.
Our businesses may be negatively impacted by adverse economic conditions or future disruptions in global financial markets. Included among these potential negative impacts are industrial or economic contraction leading to reduced energy demand and lower prices for our products and services and increased difficulty in collecting amounts owed to us by our customers. If financing is not available when needed, or is available only on unfavorable terms, we may be unable to implement our business plans or otherwise take advantage of business opportunities or respond to competitive
32
pressures. In addition, financial markets have periodically been affected by concerns over U.S. fiscal and monetary policies. These concerns, as well as actions taken by the U.S. federal government in response to these concerns, could significantly and adversely impact the global and U.S. economies and financial markets, which could negatively impact us in the manners described above.
A downgrade of our credit ratings, which are determined outside of our control by independent third parties, could impact our liquidity, access to capital and our costs of doing business.
A downgrade of our credit ratings might increase our cost of borrowing and could require us to provide collateral to our counterparties, negatively impacting our available liquidity. In addition, our ability to access capital markets could be limited by a downgrade of our credit ratings.
Credit rating agencies perform independent analysis when assigning credit ratings. This analysis includes a number of criteria such as, business composition, market and operational risks, as well as various financial tests. Credit rating agencies continue to review the criteria for industry sectors and various debt ratings and may make changes to those criteria from time to time. Credit ratings are subject to revision or withdrawal at any time by the ratings agencies. As of February 25, 2015 we have been assigned investment-grade credit ratings at two of the three ratings agencies (subject to Negative outlook by one of such agencies) and sub-investment-grade at the third rating agency.
Our ability to obtain credit in the future could be affected by WPZ's credit ratings.
A substantial portion of our operations are conducted through, and our cash flows are substantially derived from distributions paid to us by, WPZ. Due to our relationship with WPZ, our ability to obtain credit will be affected by WPZ's credit ratings. For instance, in June 2014 one of the credit rating agencies reduced our credit rating because of our reliance on residual cash flow streams from WPZ and our transition to a holding company structure. We have been assigned investment-grade credit ratings at two of the three ratings agencies and sub-investment-grade at the third rating agency. If WPZ were to experience a deterioration in its credit standing or financial condition, our access to credit and our ratings could be adversely affected. Any future downgrading of a WPZ credit rating could also result in a downgrading of our credit rating. A downgrading of a WPZ credit rating could limit our ability to obtain financing in the future upon favorable terms, if at all.
We are exposed to the credit risk of our customers and counterparties, and our credit risk management may not be adequate to protect against such risk.
We are subject to the risk of loss resulting from nonpayment and/or nonperformance by our customers and counterparties in the ordinary course of our business. Generally, our customers are rated investment grade, are otherwise considered creditworthy or are required to make prepayments or provide security to satisfy credit concerns. However, our credit procedures and policies may not be adequate to fully eliminate customer and counterparty credit risk. Our customers and counterparties include industrial customers, local distribution companies, natural gas producers and marketers whose creditworthiness may be suddenly and disparately impacted by, among other factors, commodity price volatility, deteriorating energy market conditions, and public and regulatory opposition to energy producing activities. If we fail to adequately assess the creditworthiness of existing or future customers and counterparties, unanticipated deterioration in their creditworthiness and any resulting increase in nonpayment and/or nonperformance by them could cause us to write down or write off doubtful accounts. Such write-downs or write-offs could negatively affect our operating results in the periods in which they occur, and, if significant, could have a material adverse effect on our business, results of operations, cash flows and financial condition.
Restrictions in our debt agreements and the amount of our indebtedness may affect our future financial and operating flexibility.
Our total outstanding long-term debt (including current portion) as of December 31, 2014, was $20,892 million.
The agreements governing our indebtedness contain covenants that restrict our and our material subsidiaries' ability to incur certain liens to support indebtedness and our ability to merge or consolidate or sell all or substantially all of our assets in certain circumstances. In addition, certain of our debt agreements contain various covenants that restrict or limit, among other things, our ability to make certain distributions during the continuation of an event of default,
33
the ability of our subsidiaries to incur additional debt, and our and our material subsidiaries' ability to enter into certain affiliate transactions and certain restrictive agreements. Certain of our debt agreements also contain, and those we enter into in the future may contain, financial covenants and other limitations with which we will need to comply.
Our debt service obligations and the covenants described above could have important consequences. For example, they could:
• | Make it more difficult for us to satisfy our obligations with respect to our indebtedness, which could in turn result in an event of default on such indebtedness; |
• | Impair our ability to obtain additional financing in the future for working capital, capital expenditures, acquisitions, general corporate purposes or other purposes; |
• | Diminish our ability to withstand a continued or future downturn in our business or the economy generally; |
• | Require us to dedicate a substantial portion of our cash flow from operations to debt service payments, thereby reducing the availability of cash for working capital, capital expenditures, acquisitions, the payments of dividends, general corporate purposes or other purposes; |
• | Limit our flexibility in planning for, or reacting to, changes in our business and the industry in which we operate, including limiting our ability to expand or pursue our business activities and preventing us from engaging in certain transactions that might otherwise be considered beneficial to us. |
Our ability to comply with our debt covenants, to repay, extend or refinance our existing debt obligations and to obtain future credit will depend primarily on our operating performance. Our ability to refinance existing debt obligations or obtain future credit will also depend upon the current conditions in the credit markets and the availability of credit generally. If we are unable to comply with these covenants, meet our debt service obligations or obtain future credit on favorable terms, or at all, we could be forced to restructure or refinance our indebtedness, seek additional equity capital or sell assets. We may be unable to obtain financing or sell assets on satisfactory terms, or at all.
Our failure to comply with the covenants in the documents governing our indebtedness could result in events of default, which could render such indebtedness due and payable. We may not have sufficient liquidity to repay our indebtedness in such circumstances. In addition, cross-default or cross-acceleration provisions in our debt agreements could cause a default or acceleration to have a wider impact on our liquidity than might otherwise arise from a default or acceleration of a single debt instrument. For more information regarding our debt agreements, please read "Management's Discussion and Analysis of Financial Condition and Results of Operations - Management's Discussion and Analysis of Financial Condition and Liquidity."
Institutional knowledge residing with current employees nearing retirement eligibility or with our former employees might not be adequately preserved.
We expect that a significant percentage of employees will become eligible for retirement over the next several years. In certain areas of our business, institutional knowledge resides with employees who have many years of service. As these employees reach retirement age or their services are no longer available to us, we may not be able to replace them with employees of comparable knowledge and experience. In addition, we may not be able to retain or recruit other qualified individuals, and our efforts at knowledge transfer could be inadequate. If knowledge transfer, recruiting and retention efforts are inadequate, access to significant amounts of internal historical knowledge and expertise could become unavailable to us.
Our hedging activities might not be effective and could increase the volatility of our results.
In an effort to manage our financial exposure related to commodity price and market fluctuations, we have entered, and may in the future enter into contracts to hedge certain risks associated with our assets and operations. In these hedging activities, we have used and may in the future use fixed-price, forward, physical purchase and sales contracts, futures, financial swaps and option contracts traded in the over-the-counter markets or on exchanges. Nevertheless, no single hedging arrangement can adequately address all risks present in a given contract. For example, a forward contract
34
that would be effective in hedging commodity price volatility risks would not hedge the contract's counterparty credit or performance risk. Therefore, unhedged risks will always continue to exist. While we attempt to manage counterparty credit risk within guidelines established by our credit policy, we may not be able to successfully manage all credit risk and as such, future cash flows and results of operations could be impacted by counterparty default.
One of our subsidiaries acts as the general partner of a publicly traded limited partnership, Williams Partners L.P. As such, this subsidiary's operations may involve a greater risk of liability than ordinary business operations.
One of our subsidiaries acts as the general partner of WPZ, a publicly traded limited partnership. This subsidiary may be deemed to have undertaken contractual obligations with respect to WPZ as the general partner and to the limited partners of WPZ. Activities determined to involve such obligations to other persons or entities typically involve a higher standard of conduct than ordinary business operations and therefore may involve a greater risk of liability, particularly when a conflict of interest is found to exist. Our control of the general partner of WPZ may increase the possibility of claims of breach of such duties, including claims brought due to conflicts of interest (including conflicts of interest that may arise between WPZ, on the one hand, and its general partner and that general partner's affiliates, including us, on the other hand). Any liability resulting from such claims could be material.
Our investments and projects located outside of the United States expose us to risks related to the laws of other countries, and the taxes, economic conditions, fluctuations in currency rates, political conditions and policies of foreign governments. These risks might delay or reduce our realization of value from our international projects.
We currently own and might acquire and/or dispose of material energy-related investments and projects outside the United States. The economic, political and legal conditions and regulatory environment in the countries in which we have interests or in which we might pursue acquisition or investment opportunities present risks that are different from or greater than those in the United States. These risks include, among others, delays in construction and interruption of business, as well as risks of renegotiation, trade sanctions or nullification of existing contracts and changes in law or tax policy, including with respect to the prices we realize for the commodities we produce and sell. The uncertainty of the legal environment in certain foreign countries in which we develop or acquire projects or make investments could make it more difficult to obtain nonrecourse project financing or other financing on suitable terms, could adversely affect the ability of certain customers to honor their obligations with respect to such projects or investments and could impair our ability to enforce our rights under agreements relating to such projects or investments.
Operations and investments in foreign countries also can present currency exchange rate and convertibility, inflation and repatriation risk. In certain situations under which we develop or acquire projects or make investments, economic and monetary conditions and other factors could affect our ability to convert to U.S. dollars our earnings denominated in foreign currencies. In addition, risk from fluctuations in currency exchange rates can arise when our foreign subsidiaries expend or borrow funds in one type of currency, but receive revenue in another. In such cases, an adverse change in exchange rates can reduce our ability to meet expenses, including debt service obligations. We may or may not put contracts in place designed to mitigate our foreign currency exchange risks. We have some exposures that are not hedged and which could result in losses or volatility in our results of operations.
Failure of our service providers or disruptions to our outsourcing relationships might negatively impact our ability to conduct our business.
Certain of our accounting and information technology services are currently provided by third party vendors, and sometimes from service centers outside of the United States. Services provided pursuant to these agreements could be disrupted. Similarly, the expiration of such agreements or the transition of services between providers could lead to loss of institutional knowledge or service disruptions. Our reliance on others as service providers could have a material adverse effect on on our business, results of operations and financial condition.
The execution of the integration strategy following the Merger may not be successful.
The ultimate success of the Merger will depend, in part, on the ability of the combined company to realize the anticipated benefits from combining these formerly separate businesses. Realizing the benefits of the Merger will depend in part on the effective integration of assets, operations, functions and personnel while maintaining adequate focus on our core businesses. Any expected cost savings, economies of scale, enhanced liquidity or other operational
35
efficiencies, as well as revenue enhancement opportunities, or other synergies, may not occur.
Our management team expects to face challenges inherent in integrating certain ACMP operations into the West and Northeast G&P operating areas as well as integrating certain functions that support business such as environmental, health and safety, engineering and construction and business development. If management is unable to minimize the potential disruption of our ongoing business and the distraction of management during the integration process, the anticipated benefits of the Merger may not be realized or may only be realized to a lesser extent than expected. In addition, the inability to successfully manage the integration could have an adverse effect on us.
The integration process could result in the loss of key employees, as well as the disruption of each of our ongoing businesses or the creation of inconsistencies in standards, controls, procedures and policies. Any or all of those occurrences could adversely affect our businesses' ability to maintain relationships with service providers, customers and employees or to achieve the anticipated benefits of the Merger.
Integration may also result in additional and unforeseen expenses, which could reduce the anticipated benefits of the Merger and materially and adversely affect our business, operating results and financial condition.
Our costs and funding obligations for our defined benefit pension plans and costs for our other postretirement benefit plans are affected by factors beyond our control.
We have defined benefit pension plans covering substantially all of our U.S. employees and other post-retirement benefit plans covering certain eligible participants. The timing and amount of our funding requirements under the defined benefit pension plans depend upon a number of factors that we control, including changes to pension plan benefits, as well as factors outside of our control, such as asset returns, interest rates and changes in pension laws. Changes to these and other factors that can significantly increase our funding requirements could have a significant adverse effect on our financial condition and results of operations.
If there is a determination that the spin-off of WPX Energy, Inc (WPX) stock to our stockholders is taxable for U.S. federal income tax purposes because the facts, representations or undertakings underlying an IRS private letter ruling or a tax opinion are incorrect or for any other reason, then we and our stockholders could incur significant income tax liabilities.
In connection with our original separation plan that called for an initial public offering (IPO) of stock of WPX and a subsequent spin-off of our remaining shares of WPX to our stockholders, we obtained a private letter ruling from the IRS and an opinion of our outside tax advisor, to the effect that the distribution by us of WPX shares to our stockholders, and any related restructuring transaction undertaken by us, would not result in recognition for U.S. federal income tax purposes, of income, gain or loss to us or our stockholders under section 355 and section 368(a)(1)(D) of the Code, except for cash payments made to our stockholders in lieu of fractional shares of WPX common stock. In addition, we received an opinion from our outside tax advisor to the effect that the spin-off pursuant to our revised separation plan which was ultimately consummated on December 31, 2011, which did not involve an IPO of WPX shares, would not result in the recognition, for federal income tax purposes, of income, gain or loss to us or our stockholders under section 355 and section 368(a)(1)(D) of the Code, except for cash payments made to our stockholders in lieu of fractional shares of WPX. The private letter ruling and opinion have relied on or will rely on certain facts, representations, and undertakings from us and WPX regarding the past and future conduct of the companies' respective businesses and other matters. If any of these facts, representations, or undertakings are, or become, incorrect or are not otherwise satisfied, including as a result of certain significant changes in the stock ownership of us or WPX after the spin-off, or if the IRS disagrees with any such facts and representations upon audit, we and our stockholders may not be able to rely on the private letter ruling or the opinion of our tax advisor and could be subject to significant income tax liabilities.
The spin-off may expose us to potential liabilities arising out of state and federal fraudulent conveyance laws and legal dividend requirements that we did not assume in our agreements with WPX.
The spin-off is subject to review under various state and federal fraudulent conveyance laws. A court could deem the spin-off or certain internal restructuring transactions undertaken by us in connection with the separation to be a fraudulent conveyance or transfer. Fraudulent conveyances or transfers are defined to include transfers made or obligations incurred with the actual intent to hinder, delay or defraud current or future creditors or transfers made or
36
obligations incurred for less than reasonably equivalent value when the debtor was insolvent, or that rendered the debtor insolvent, inadequately capitalized or unable to pay its debts as they become due. A court could void the transactions or impose substantial liabilities upon us, which could adversely affect our financial condition and our results of operations. Whether a transaction is a fraudulent conveyance or transfer will vary depending upon the jurisdiction whose law is being applied. Under the separation and distribution agreement between us and WPX, from and after the spin-off, each of WPX and we are responsible for the debts, liabilities and other obligations related to the business or businesses which each owns and operates. Although we do not expect to be liable for any such obligations not expressly assumed by us pursuant to the separation and distribution agreement, it is possible that a court would disregard the allocation agreed to between the parties, and require that we assume responsibility for obligations allocated to WPX, particularly if WPX were to refuse or were unable to pay or perform the subject allocated obligations.
Increases in interest rates could adversely impact our share price, our ability to issue equity or incur debt for acquisitions or other purposes, and our ability to make cash dividends at our intended levels.
Interest rates may increase in the future. As a result, interest rates on future credit facilities and debt offerings could be higher than current levels, causing our financing costs to increase accordingly. As with other yield-oriented securities, our share price will be impacted by the level of our cash distributions and implied distribution yield. The distribution yield is often used by investors to compare and rank yield-oriented securities for investment decision-making purposes. Therefore, changes in interest rates, either positive or negative, may affect the yield requirements of investors who invest in our shares, and a rising interest rate environment could have an adverse impact on our share price and our ability to issue equity or incur debt for acquisitions or other purposes and to pay cash dividends at our intended levels.
Item 1B. Unresolved Staff Comments
Not applicable.
Item 2. Properties
Please read "Business" for a description of the location and general character of our principal physical properties. We generally own our facilities, although a substantial portion of our pipeline and gathering facilities is constructed and maintained pursuant to rights-of-way, easements, permits, licenses or consents on and across properties owned by others.
Item 3. Legal Proceedings
Environmental
Certain reportable legal proceedings involving governmental authorities under federal, state and local laws regulating the discharge of materials into the environment are described below. While it is not possible for us to predict the final outcome of the proceedings which are still pending, we do not anticipate a material effect on our consolidated financial position if we receive an unfavorable outcome in any one or more of such proceedings.
In November 2013, we became aware of deficiencies with the air permit for the Fort Beeler gas processing facility located in West Virginia. We notified the EPA and the West Virginia Department of Environmental Protection and are working to bring the Fort Beeler facility into full compliance. At December 31, 2014, we have accrued liabilities of $100,000 for potential penalties arising out of the deficiencies.
On November 7, 2014, the New Mexico Environment Department's Air Quality Bureau (Bureau) issued a Notice of Violation (NOV) to Williams Four Corners LLC (Williams) for the El Cedro Gas Treating Plant alleging a failure by Williams to limit emissions to the allowable emission rates in violation of permit requirements, and for the failure to timely file initial and excess emission reports. The NOV followed an April 2014 inspection at the plant. Williams is providing Corrective Action Verification information to the Bureau and has entered into a Tolling Agreement to allow for additional time - until May 31, 2015 - for the parties to resolve the alleged violations.
37
Other
The additional information called for by this item is provided in Note 18 – Contingent Liabilities and Commitments of the Notes to Consolidated Financial Statements included under Part II, Item 8. Financial Statements of this report, which information is incorporated by reference into this item.
Item 4. Mine Safety Disclosures
Not applicable.
38
Executive Officers of the Registrant
The name, age, period of service, and title of each of our executive officers as of February 23, 2015, are listed below. As previously discussed, Williams Partners L.P. merged with ACMP in February 2015 (the Merger). ACMP was the surviving entity in the Merger and changed its name to Williams Partners L.P. References in the biographical information below to (a) "Pre-merger WPZ" will mean Williams Partners L.P. prior to the Merger and (b) "ACMP/WPZ" will refer to both ACMP prior to and after the Merger, when it changed its name to Williams Partners L.P.
Alan S. Armstrong | Director, Chief Executive Officer, and President |
| Age: 52 |
| Position held since 2011. |
| From 2002 to 2011, Mr. Armstrong served as Senior Vice President - Midstream and acted as President of our midstream business. From 1999 to 2002, Mr. Armstrong was Vice President, Gathering and Processing in our midstream business and from 1998 to 1999 was Vice President, Commercial Development. Mr. Armstrong has served as a director of the general partner of ACMP/WPZ since 2012, as Chief Executive Officer since December 31, 2014, and as Chairman of the Board since February 2, 2015. Mr. Armstrong has served as a director of BOK Financial Corporation, a financial services company, since 2013. Mr. Armstrong also served as Chairman of the Board and Chief Executive Officer of the general partner of Pre-merger WPZ from 2011 until the Merger, as Senior Vice President - Midstream from 2010 to 2011, and director and Chief Operating Officer from 2005 to 2010. |
Walter J. Bennett | Senior Vice President - West |
| Age: 45 |
| Position held since January 1, 2015. |
| Mr. Bennett was formerly Chief Operating Officer of Chesapeake Midstream Development and served as Senior Vice President-Operations at Boardwalk Pipeline Partners. Previously, Mr. Bennett served in a variety of senior positions at Gulf South Pipeline Company that included operations and commercial responsibilities. Mr. Bennett began his career at a subsidiary of Koch Industries. Mr. Bennett has served as Senior Vice President - West of the general partner of ACMP/WPZ since December 2013 and served as Senior Vice President - West of the general partner of Pre-merger WPZ from January 2015 until the Merger. |
39
Francis (Frank) E. Billings | Senior Vice President - Corporate Strategic Development |
| Age: 52 |
| Position held since January 2014. |
| Mr. Billings served as Senior Vice President - Northeast G&P of us and Pre-merger WPZ from January 2013 to January 2014. Mr. Billings served as Vice President of our midstream gathering and processing business from 2011 until 2013 and as Vice President, Business Development from 2010 to 2011. Mr. Billings served as President of Cumberland Plateau Pipeline Company, a privately held company developing an ethane pipeline to serve the Marcellus Shale area, from 2009 until 2010. From 2008 to 2009, Mr. Billings served as Senior Vice President of Commercial for Crosstex Energy, Inc. and Crosstex Energy L.P., an independent midstream energy services master limited partnership and its parent corporation. In 1988, Mr. Billings joined MAPCO Inc., which merged with one of our subsidiaries in 1998, serving in various management roles, including in 2008 as a Vice President in the midstream business. Mr. Billings served as Senior Vice President - Corporate Strategic Development of the general partner of Pre-merger WPZ from January 2014 until the Merger. He has served as a director of the general partner of ACMP/WPZ since February 2014 and as Senior Vice President - Corporate Strategic Development since the Merger. |
Donald R. Chappel | Senior Vice President and Chief Financial Officer |
| Age: 63 |
| Position held since 2003. |
| Prior to joining us, Mr. Chappel held various financial, administrative and operational leadership positions. Mr. Chappel has served as a director of the general partner of ACMP/WPZ since 2012 and as Chief Financial Officer of the general partner of ACMP/WPZ since December 31, 2014. Mr. Chappel has also served as a member of the Management Committee of Northwest Pipeline since 2007. Mr. Chappel served as Chief Financial Officer and a director of the general partner of Pre-merger WPZ from 2005 until the Merger. Mr. Chappel was Chief Financial Officer from 2007 and a director from 2008 of the general partner of Williams Pipeline Partners L.P. (WMZ), until its merger with Pre-merger WPZ in 2010. Mr. Chappel is a director of SUPERVALU, Inc. (a grocery and pharmacy company). |
John R. Dearborn | Senior Vice President - NGL & Petchem Services |
| Age: 57 |
| Position held since 2013. |
| Mr. Dearborn served as a senior leader for Saudi Basic Industries Corporation, a petrochemical company, from 2011 to 2013. From 2001 to 2011, Mr. Dearborn served in a variety of leadership positions with the Dow Chemical Company. Mr. Dearborn also worked for Union Carbide Corporation, prior to its merger with DOW, from 1981 to 2001 where he served in several leadership roles. Mr. Dearborn also served as Senior Vice President - NGL & Petchem Services of the general partner of Pre-merger WPZ from 2013 until the Merger and has served in that role for the general partner of ACMP/WPZ since the Merger. |
40
Robyn L. Ewing | Senior Vice President and Chief Administrative Officer |
| Age: 59 |
| Position held since 2008. |
| From 2004 to 2008, Ms. Ewing was Vice President of Human Resources. Prior to joining Williams, Ms. Ewing worked at MAPCO, which merged with Williams in 1998. Ms. Ewing began her career with Cities Service Company in 1976. |
Rory L. Miller | Senior Vice President - Atlantic - Gulf |
| Age: 54 |
| Position held since 2013. |
| From 2011 until 2013, Mr. Miller was Senior Vice President - Midstream of Williams and the Pre-merger WPZ General Partner, acting as President of Williams' midstream business. Mr. Miller was a Vice President of Williams' midstream business from 2004 until 2011. Mr. Miller served as a director and Senior Vice-President - Atlantic-Gulf of the general partner of Pre-merger WPZ from 2011 until the Merger and has served in those roles for the general partner of ACMP/WPZ since the Merger. Mr. Miller has also served as a member of the Management Committee of Transco, since 2013. |
Fred E. Pace | Senior Vice President - E&C (Engineering and Construction) |
| Age: 53 |
| Position held since 2013. |
| From 2011 until 2013, Mr. Pace served Williams in project engineering and development roles, including service as Vice President Engineering and Construction for our midstream business. From 2009 to 2011, Mr. Pace was the managing member of PACE Consulting, LLC, an engineering and consulting firm serving the energy industry. In 2003, Mr. Pace co-founded Clear Creek Natural Gas, LLC, later known as Clear Creek Energy Services, LLC, a provider of engineering, construction, and operational services to the energy industry where he served as Chief Executive Officer until 2009. Mr. Pace has over 30 years of experience in the engineering, construction, operation, and project management areas of the energy industry, including prior service with Williams from 1985 to 1990. Mr. Pace also served as Senior Vice President - E&C of the general partner of Pre-merger WPZ from 2013 until the Merger and has served in that role for the general partner of Pre-merger WPZ since the Merger. |
41
Brian L. Perilloux | Senior Vice President - Operational Excellence |
| Age: 53 |
| Position held since 2013. |
| Mr. Perilloux served as a Vice President of our midstream business from 2011 until 2013. From 2007 to 2011, Mr. Perilloux served in various roles in our midstream business, including engineering and construction roles. Prior to joining Williams, Mr. Perilloux was an officer of a private international engineering and construction company. Mr. Perilloux served as Senior Vice President - Operational Excellence of the general partner of Pre-merger WPZ from 2013 until the Merger and has served in that role for the general partner of ACMP/WPZ since the Merger. |
Robert S. Purgason | Senior Vice President - Access |
| Age: 58 |
| Position held since January 1, 2015. |
| Mr. Purgason has served as a director of the general partner of ACMP/WPZ since 2012 and as Senior Vice President-Access of the general partner of ACMP/WPZ since the Merger. Mr. Purgason served as Chief Operating Officer of the general partner of ACMP/WPZ from 2010 until the Merger. Prior to joining the general partner of ACMP/WPZ, Mr. Purgason spent five years at Crosstex Energy Services, L.P. and was promoted to Senior Vice President - Chief Operating Officer in 2006. Prior to Crosstex, Mr. Purgason spent 19 years with us in various senior business development and operational roles. Mr. Purgason began his career at Perry Gas Companies in Odessa, Texas working in all facets of the natural gas treating business. Mr. Purgason has also served on the Board of Directors of L.B. Foster Company (a manufacturer, fabricator, and distributor of products and services for the rail, construction, energy, and utility markets) since December 2014. |
Craig L. Rainey | Senior Vice President and General Counsel |
| Age: 62 |
| Position held since 2012. |
| From 2001 to 2012, Mr. Rainey served as an Assistant General Counsel of Williams, primarily supporting our midstream business and former exploration and production business. Mr. Rainey joined Williams in 1999 as a senior counsel and has practiced law since 1977. Mr. Rainey served as General Counsel of the general partner of Pre-merger WPZ until the Merger and has served in that role for the general partner of ACMP/WPZ since December 31, 2014. |
42
James E. Scheel | Senior Vice President - Northeast G&P |
| Age: 50 |
| Position held since January 2014. |
| From 2012 to 2014, Mr. Scheel served as Senior Vice President - Corporate Strategic Development of us and the general partner of Pre-merger WPZ. From 2011 until 2012, Mr. Scheel served as Vice President of Business Development for our midstream business. Mr. Scheel joined Williams in 1988 and has served in leadership roles in business strategic development, engineering and operations, our NGL business, and international operations. Mr. Scheel has served as a director and Senior Vice President - Northeast G&P of the general partner of ACMP/WPZ since the Merger, having previously served as a director of the general partner of ACMP/WPZ from 2012 to February 2014. Mr. Scheel served as a director of the general partner of Pre-merger WPZ from 2012 until the Merger. |
Ted T. Timmermans | Vice President, Controller, and Chief Accounting Officer |
| Age: 58 |
| Position held since 2005. |
| Mr. Timmermans served as Assistant Controller of Williams from 1998 to 2005. Mr. Timmermans served as Vice President, Controller & Chief Accounting Officer of the general partner of Pre-merger WPZ until the Merger and has served in those roles for the general partner of ACMP/WPZ since the Merger. Mr. Timmermans served as Chief Accounting Officer of the general partner of WMZ from 2008 until its merger with Pre-merger WPZ in 2010. |
43
PART II
Item 5. Market for Registrant's Common Equity, Related Stockholder Matters and Issuer Purchases of Equity Securities
Our common stock is listed on the New York Stock Exchange under the symbol "WMB." At the close of business on February 23, 2015, we had approximately 8,050 holders of record of our common stock. The high and low sales price ranges (New York Stock Exchange composite transactions) and dividends declared by quarter for each of the past two years are as follows:
| High |
| Low |
| Dividend | ||||||
2014 |
|
|
|
|
| ||||||
First Quarter | $ | 42.94 | |
| $ | 37.77 | |
| $ | 0.4025 | |
Second Quarter | 59.68 | |
| 39.31 | |
| 0.425 | | |||
Third Quarter | 59.77 | |
| 54.28 | |
| 0.56 | | |||
Fourth Quarter | 57.00 | |
| 41.21 | |
| 0.57 | | |||
2013 |
|
|
|
|
| ||||||
First Quarter | $ | 38.00 | |
| $ | 33.09 | |
| $ | 0.33875 | |
Second Quarter | 38.57 | |
| 31.25 | |
| 0.3525 | | |||
Third Quarter | 36.94 | |
| 32.36 | |
| 0.36625 | | |||
Fourth Quarter | 38.68 | |
| 33.98 | |
| 0.38 | | |||
Some of our subsidiaries' borrowing arrangements may limit the transfer of funds to us. These terms have not impeded, nor are they expected to impede, our ability to pay dividends.
Performance Graph
Set forth below is a line graph comparing our cumulative total stockholder return on our common stock (assuming reinvestment of dividends) with the cumulative total return of the S&P 500 Stock Index and the Bloomberg U.S. Pipeline Index for the period of five fiscal years commencing January 1, 2010. The Bloomberg U.S. Pipeline Index is composed of Enbridge, Inter Pipeline Ltd., Kinder Morgan, Inc., ONEOK, Inc., Pembina Pipeline Corp, Spectra Energy Corp, TransCanada Corp., and Williams. The graph below assumes an investment of $100 at the beginning of the period.
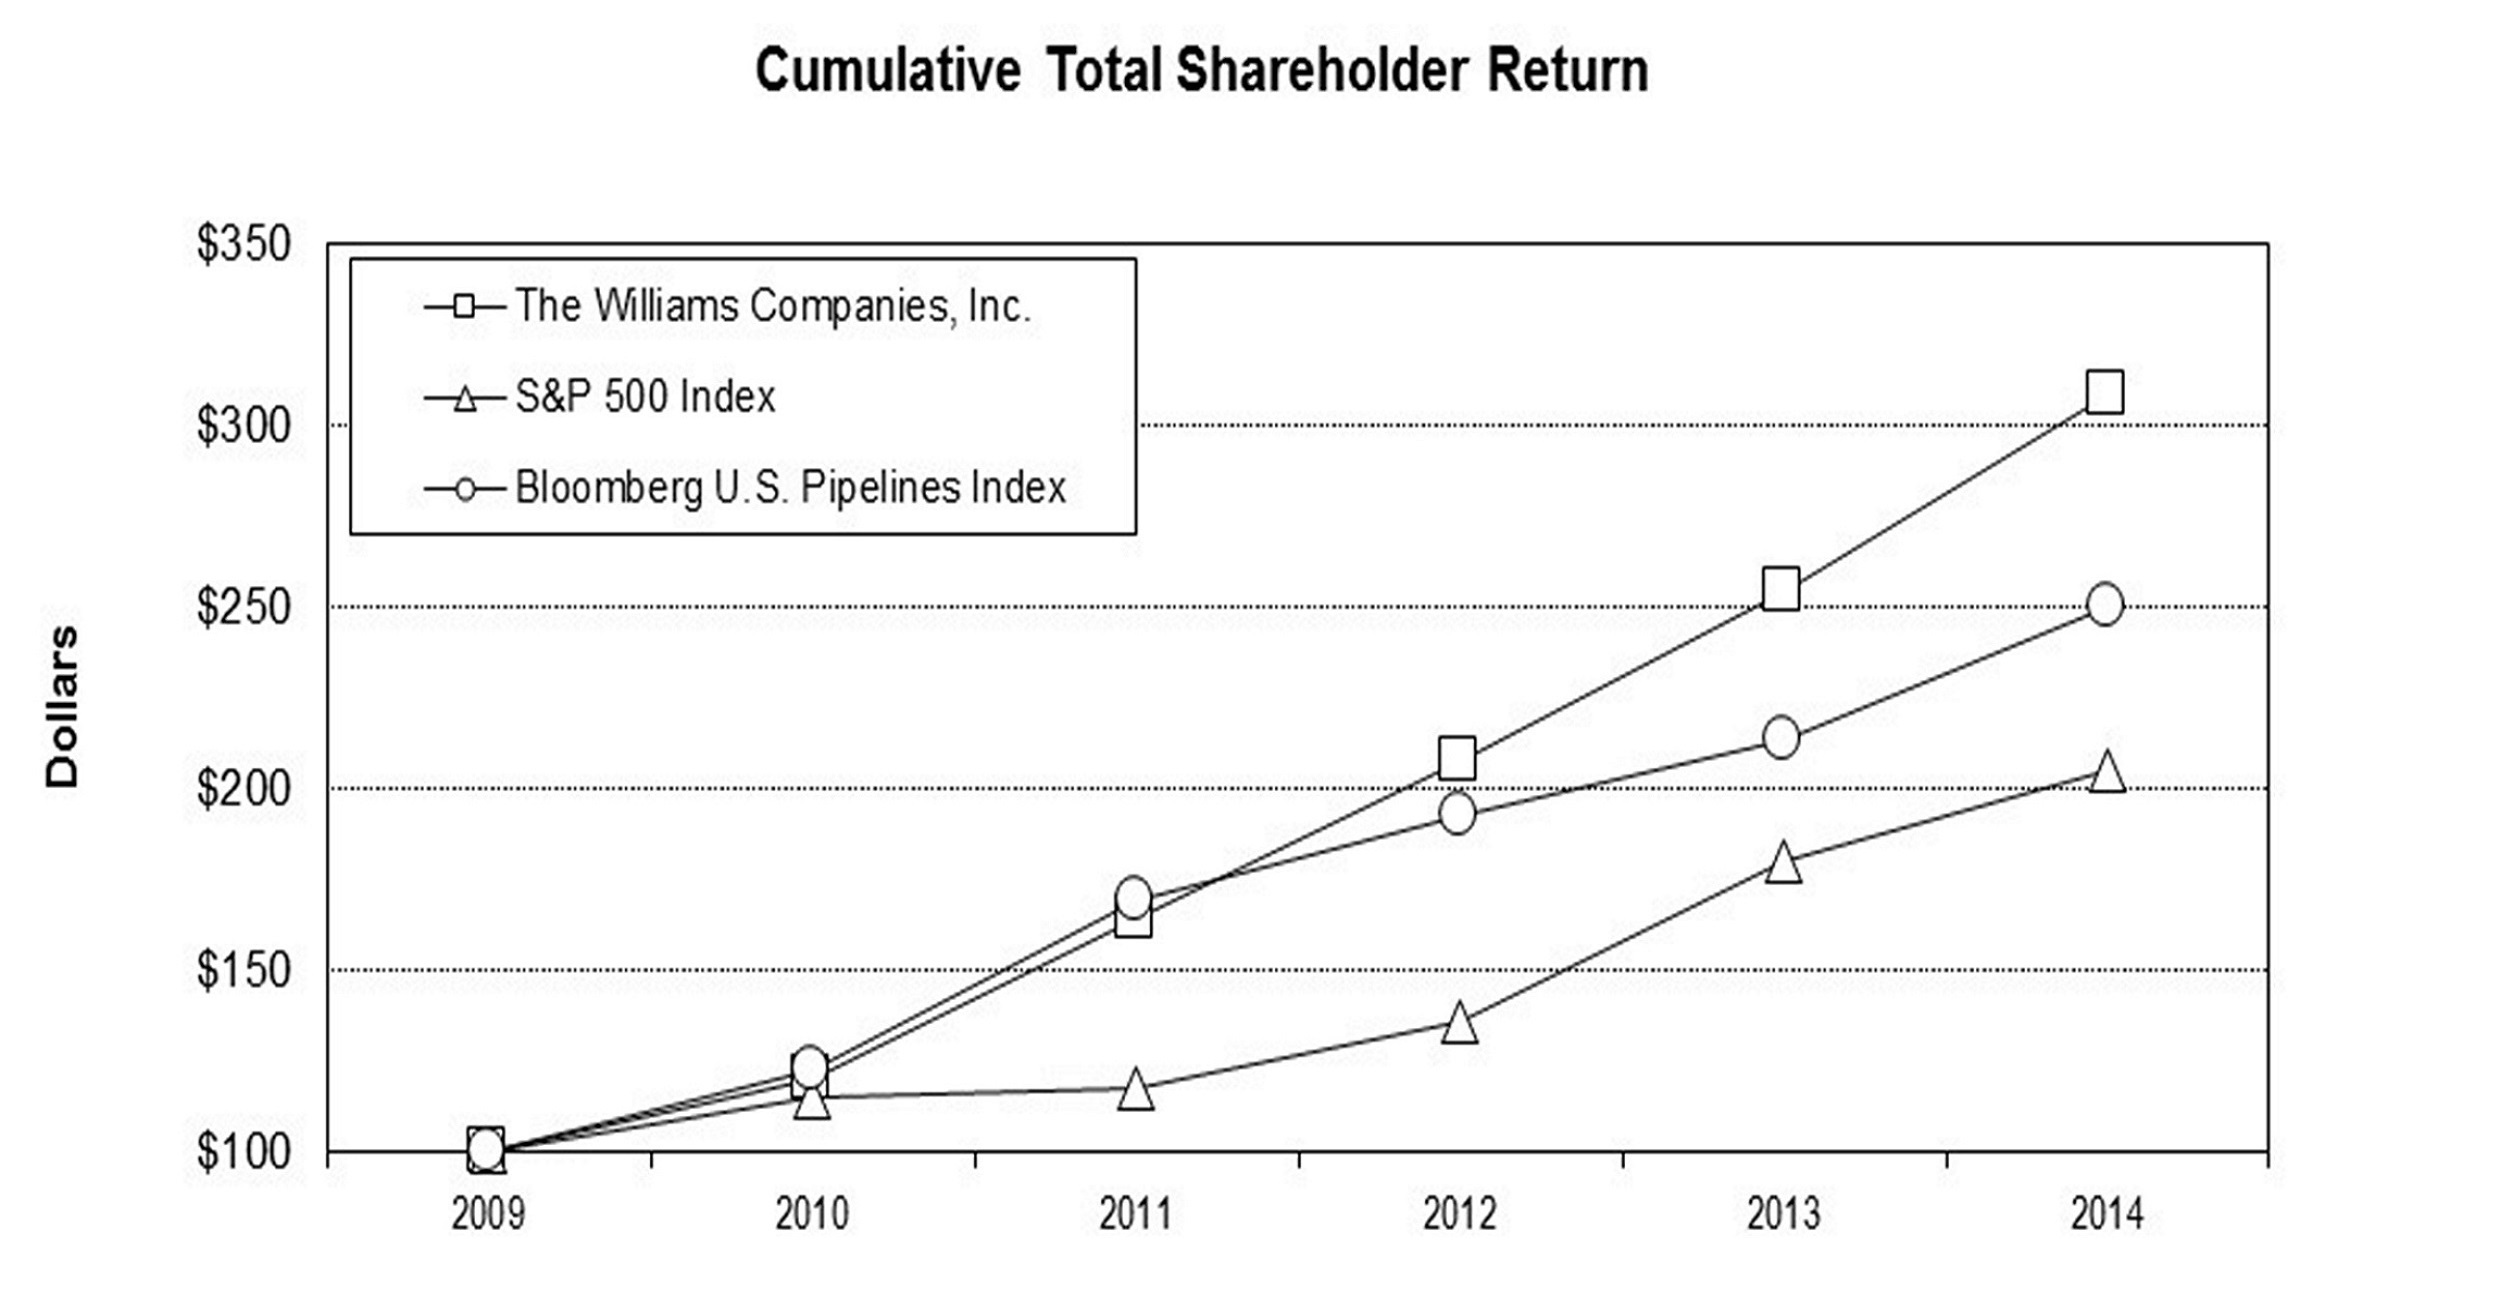
| 2009 |
| 2010 |
| 2011 |
| 2012 |
| 2013 |
| 2014 |
The Williams Companies, Inc. | 100.0 |
| 120.1 |
| 164.5 |
| 207.5 |
| 254.4 |
| 308.4 |
S&P 500 Index | 100.0 |
| 115.1 |
| 117.5 |
| 136.2 |
| 180.3 |
| 205.0 |
Bloomberg U.S. Pipelines Index | 100.0 |
| 123.0 |
| 169.6 |
| 192.4 |
| 213.6 |
| 250.1 |
44
Item 6. Selected Financial Data
The following financial data at December 31, 2014 and 2013 , and for each of the three years in the period ended December 31, 2014 , should be read in conjunction with the other financial information included in Part II, Item 7, Management's Discussion and Analysis of Financial Condition and Results of Operations and Part II, Item 8, Financial Statements and Supplementary Data of this Form 10-K. All other financial data has been prepared from our accounting records.
| 2014 |
| 2013 |
| 2012 |
| 2011 |
| 2010 | ||||||||||
| (Millions, except per-share amounts) | ||||||||||||||||||
Revenues (1) | $ | 7,637 | |
| $ | 6,860 | |
| $ | 7,486 | |
| $ | 7,930 | |
| $ | 6,638 | |
Income (loss) from continuing operations (2) | 2,335 | |
| 679 | |
| 929 | |
| 1,078 | |
| 271 | | |||||
Amounts attributable to The Williams Companies, Inc.: |
|
|
|
|
|
|
|
|
| ||||||||||
Income (loss) from continuing operations (2) | 2,110 | |
| 441 | |
| 723 | |
| 803 | |
| 104 | | |||||
Diluted earnings (loss) per common share: |
|
|
|
|
|
|
|
|
| ||||||||||
Income (loss) from continuing operations (2) | 2.91 | |
| .64 | |
| 1.15 | |
| 1.34 | |
| .17 | | |||||
Total assets at December 31 (3) (4) (5) | 50,563 | |
| 27,142 | |
| 24,327 | |
| 16,502 | |
| 24,972 | | |||||
Commercial paper and long-term debt due within one year at December 31 (6) | 802 | |
| 226 | |
| 1 | |
| 353 | |
| 508 | | |||||
Long-term debt at December 31 (3) (4) | 20,888 | |
| 11,353 | |
| 10,735 | |
| 8,369 | |
| 8,600 | | |||||
Stockholders' equity at December 31 (3) (4) (5) | 8,777 | |
| 4,864 | |
| 4,752 | |
| 1,296 | |
| 6,803 | | |||||
Cash dividends declared per common share | 1.958 | |
| 1.438 | |
| 1.196 | |
| .775 | |
| .485 | | |||||
_________
(1) | Revenues for 2014 increased reflecting the consolidation of ACMP beginning in third quarter and new Canadian construction management services. |
(2) | Income from continuing operations: |
• | For 2014 includes $2.5 billion pretax gain recognized as a result of remeasuring to fair value the equity-method investment we held before we acquired a controlling interest in ACMP, $246 million of insurance recoveries related to the 2013 explosion and fire at WPZ's Geismar olefins plant, and $154 million of cash received related to a contingency settlement. 2014 also includes $78 million of pretax equity losses from Bluegrass Pipeline and Moss Lake related primarily to the underlying write-off of previously capitalized project development costs and $76 million of pretax acquisition, merger, and transition expenses related to our acquisition of ACMP; |
• | For 2013 includes $99 million of deferred income tax expense incurred on undistributed earnings of our foreign operations that are no longer considered permanently reinvested; |
• | For 2011 includes $271 million of pretax early debt retirement costs; and |
• | For 2010 includes $648 million of debt retirement and other pretax costs associated with our strategic restructuring transaction in the first quarter of 2010. |
(3) | The increases in 2014 reflect assets acquired and debt assumed primarily related to our acquisition of ACMP (see Note 2 – Acquisitions ) in third quarter as well as $1.9 billion of related debt issuances and $2.8 billion of debt issuances at WPZ. Additionally, we issued $3.4 billion of equity (see Note 14 – Debt, Banking Arrangements, and Leases and Note 15 – Stockholders' Equity ). |
(4) | The increases in 2012 reflect assets and investments acquired, primarily related to the Caiman and Laser Acquisitions and our investment in ACMP, as well as debt and equity issuances. |
(5) | Total assets and stockholders' equity for 2011 decreased due to the special dividend to spin off our former exploration and production business. |
(6) | The increase in 2014 and 2013 reflects borrowings under WPZ's commercial paper program, which was initiated in 2013. |
45
Item 7. Management's Discussion and Analysis of Financial Condition and Results of Operations
General
We are an energy infrastructure company focused on connecting North America's significant hydrocarbon resource plays to growing markets for natural gas, NGLs, and olefins. Our operations are located principally in the United States, but span from the deepwater Gulf of Mexico to the Canadian oil sands, and are organized into the Williams Partners, Access Midstream, and Williams NGL & Petchem Services reportable segments. All remaining business activities are included in Other.
Williams Partners
At December 31, 2014,Williams Partners includes Pre-merger WPZ, our consolidated master limited partnership, which includes two interstate natural gas pipelines, as well as investments in natural gas pipeline-related companies, which serve regions from the San Juan basin in northwestern New Mexico and southwestern Colorado to Oregon and Washington and from the Gulf of Mexico to the northeastern United States. Pre-merger WPZ also includes natural gas gathering, processing, and treating facilities and oil gathering and transportation facilities located primarily in the Rocky Mountain, Gulf Coast, and Marcellus Shale regions of the United States. At December 31, 2014, WPZ also owns a 5/6 interest in an olefin production facility, along with a refinery grade propylene splitter and pipelines in the Gulf region, an oil sands offgas processing plant near Fort McMurray, Alberta, and an NGL/olefin fractionation facility and B/B splitter facility at Redwater, Alberta. As of December 31, 2014, we own approximately 66 percent of the interests in Pre-merger WPZ, including the interests of the general partner, which is wholly owned by us, and IDRs.
Williams Partners' ongoing strategy is to safely and reliably operate large-scale, interstate natural gas transmission and midstream infrastructures where our assets can be fully utilized and drive low per-unit costs. We focus on consistently attracting new business by providing highly reliable service to our customers and utilizing our low cost-of-capital to invest in growing markets, including the deepwater Gulf of Mexico, the Marcellus Shale, the Gulf Coast Region, the Canadian oil sands, and areas of increasing natural gas demand.
Williams Partners' interstate transmission and related storage activities are subject to regulation by the FERC and as such, our rates and charges for the transportation of natural gas in interstate commerce, and the extension, expansion or abandonment of jurisdictional facilities and accounting, among other things, are subject to regulation. The rates are established through the FERC's ratemaking process. Changes in commodity prices and volumes transported have little near-term impact on revenues because the majority of cost of service is recovered through firm capacity reservation charges in transportation rates.
Access Midstream
At December 31, 2014, Access Midstream consists of our consolidated master limited partnership, ACMP, which includes domestic midstream businesses that provide gathering, treating, and compression services to producers under long-term, fee-based contracts in the Marcellus and Utica shale plays as well as the Eagle Ford, Haynesville, Barnett, Mid-Continent, and Niobrara areas. ACMP also includes a 49 percent equity-method investment in UEOM, a 50 percent equity-method investment interest in the Delaware Basin gas gathering system in the Mid-Continent region, and Appalachia Midstream Services, LLC, which owns an approximate average 45 percent interest in 11 gas gathering systems in the Marcellus Shale.
We previously owned an equity-method investment in ACMP until July 1, 2014, at which time we acquired all of the interests in ACMP held by Global Infrastructure Partners II (GIP) which included 50 percent of the general partner interest and 55.1 million limited partner units for $5.995 billion in cash (ACMP Acquisition). We now own 100 percent of the general partner interest, including IDRs, and approximately 50 percent of the limited partner units in ACMP.
On October 26, 2014, we announced that our consolidated master limited partnerships Pre-merger WPZ and ACMP entered into a merger agreement and on February 2, 2015, the merger was completed (Merger). The merged partnership has been renamed Williams Partners L.P. Under the terms of the merger agreement, each ACMP unitholder received 1.06152 ACMP units for each ACMP unit owned immediately prior to the Merger. In conjunction with the Merger, each Pre-merger WPZ common unit held by the public was exchanged for 0.86672 ACMP common units. Each WPZ
46
common unit held by us was exchanged for 0.80036 ACMP common units. Prior to the closing of the Merger, the Class D limited partner units of Pre-merger WPZ, all of which were held by us, were converted into WPZ common units on a one-for-one basis pursuant to the terms of the Pre-merger WPZ partnership agreement. Following the Merger, we own an approximate 60 percent of the merged partnership, including the general partner interest and incentive distribution rights. See Note 2 – Acquisitions of Notes to Consolidated Financial Statements for further details.
Williams NGL & Petchem Services
Williams NGL & Petchem Services includes certain other domestic olefins pipeline assets, certain Canadian growth projects under development, including a propane dehydrogenation facility and a liquids extraction plant. As discussed in Note 1 – Description of Business, Basis of Presentation, and Summary of Significant Accounting Policies of Notes to Consolidated Financial Statements, the currently operating Canadian assets were contributed to Williams Partners in the first quarter of 2014 and are now presented in the Williams Partners segment. As a result, the Williams NGL & Petchem Services segment is currently comprised primarily of projects under development and thus has no operating revenues to date. In the future, we anticipate contributing to WPZ the assets and projects that comprise this segment. The transaction will be subject to execution of an agreement, review, and recommendation by the Conflicts Committee of the general partner of WPZ, and approval of both our and WPZ's Board of Directors.
Unless indicated otherwise, the following discussion and analysis of critical accounting estimates, results of operations, and financial condition and liquidity relates to our current continuing operations and should be read in conjunction with the consolidated financial statements and notes thereto included in Part II, Item 8 of this document.
Dividend Growth
In December 2014, we paid a regular quarterly dividend of $0.57 per share, which was 50 percent higher than the same period last year.
Overview
Income (loss) from continuing operations attributable to The Williams Companies, Inc. , for the year ended December 31, 2014 , changed favorably by $1,669 million compared to the year ended December 31, 2013 , primarily due to a $2.5 billion gain as a result of remeasuring our previous equity-method investment in ACMP to fair value, the receipt of an additional $192 million of insurance proceeds related to the Geismar Incident, a gain of $154 resulting from cash proceeds received for a contingency settlement, as well as increased service revenues. This gain was partially offset by higher interest expense related to higher debt levels and equity losses from the discontinuance of the Bluegrass Pipeline project, reflecting a write-off of development costs that were previously capitalized and other associated costs that were incurred during the first quarter and lower olefin production and NGL margins. See additional discussion in Results of Operations.
Abundant and low-cost natural gas reserves in the United States continue to drive demand for midstream and pipeline infrastructure. We believe that we have successfully positioned our energy infrastructure businesses for future growth.
Williams Partners
Canada Dropdown
On February 28, 2014, we contributed certain of our Canadian operations to WPZ (Canada Dropdown), including an oil sands offgas processing plant near Fort McMurray, Alberta, and an NGL/olefin fractionation facility and B/B Splitter facility at Redwater, Alberta. These businesses were previously reported within our Williams NGL & Petchem Services segment, but are now reported within Williams Partners. WPZ funded the transaction with $56 million of cash including $31 million received in the second quarter, 25,577,521 WPZ Class D limited-partner units, and an increase in the capital account of its general partner to allow us to maintain our 2 percent general partner interest. In lieu of cash distributions, the Class D units received quarterly distributions of additional paid-in-kind Class D units.
In October 2014, a purchase price adjustment was finalized whereby we paid $56 million in cash to WPZ and waived $2 million in payment of IDRs with respect to the November 2014 distribution.
47
Geismar Incident
On June 13, 2013, an explosion and fire occurred at William Partners' Geismar olefins plant. The incident (Geismar Incident) rendered the facility temporarily inoperable and resulted in significant human, financial, and operational effects. This facility is part of our Williams Partners segment.
At the time of the incident, we had insurance coverage for repair and replacement costs, lost production and additional expenses related to the incident as follows:
• | Property damage and business interruption coverage with a combined per-occurrence limit of $500 million and retentions (deductibles) of $10 million per occurrence for property damage and a 60-day waiting period per occurrence for business interruption; |
• | General liability coverage with per-occurrence and aggregate annual limits of $610 million and retentions (deductibles) of $2 million per occurrence; |
• | Workers' compensation coverage with statutory limits and retentions (deductibles) of $1 million total per occurrence. |
During the year ended December 31, 2014, we received $246 million of insurance recoveries related to the Geismar Incident and incurred $14 million of related covered insurable expenses in excess of our retentions (deductibles). These amounts are reflected as a net gain in Net insurance recoveries- Geismar Incident within Costs and expenses in our Consolidated Statement of Income .
We expect our total loss to exceed our $500 million policy limit, which would result in a total claim of approximately $72 million related to the repair of the plant and the remainder related to business interruption. Through December 31, 2014, we have received a total of $296 million from insurers. We continue to work with insurers in support of all claims, as submitted, and are vigorously pursuing collection of the remaining $200 million insurance limits.
Further, we are impacted by certain uninsured losses, including amounts associated with the 60-day waiting period for business interruption, as well as other deductibles, policy limits, and uninsured expenses. Our assumptions and estimates, including repair cost estimates and insurance proceeds associated with our property damage and business interruption coverage, are subject to various risks and uncertainties that could cause the actual results to be materially different.
Our Geismar plant, which restarted in February 2015, is expected to continue to ramp up to expanded capacity through March. Production during February and March is expected to be intermittent, resulting in limited financial contribution for the first quarter.
Gulfstar One
During the fourth quarter of 2014 we completed the Gulfstar FPS ™ , which is a proprietary floating production system that had been under construction since late 2011. It is supported by multiple agreements with two major producers to provide production handling, oil and gas gathering and gas processing services for the Tubular Bells field development located in the eastern deepwater Gulf of Mexico. The Gulfstar FPS ™ ties into our wholly owned oil and gas gathering and gas processing systems in the eastern Gulf of Mexico. Gulfstar FPS ™ has an initial capacity of 60 Mbbls/d, up to 200 MMcf/d of natural gas and the capability to provide seawater injection services. We expect Gulfstar FPS ™ to be capable of serving as a central host facility for other deepwater prospects in the area. We own a 51 percent interest in Gulfstar One. In December 2013, Gulfstar One agreed to host the Gunflint development, which will result in an expansion of the Gulfstar One system to provide production handling capacity of 20 Mbbls/d and 40 MMcf/d for Gunflint. The project has a first oil target of the first quarter of 2016, dependent on the producer's development activities.
New Transco rates effective
On August 31, 2012, Transco submitted to the FERC a general rate filing principally designed to recover increased costs and to comply with the terms of the settlement in its prior rate proceeding. The new rates became effective March 1,
48
2013, subject to refund and the outcome of a hearing. On August 27, 2013, Transco filed a stipulation and agreement with the FERC proposing to resolve all issues in this proceeding without the need for a hearing (Agreement). On December 6, 2013, the FERC issued an order approving the Agreement without modifications. Pursuant to its terms, the Agreement became effective March 1, 2014. We paid $118 million of rate refunds on April 18, 2014.
Marcellus Shale
In the first half of 2014, we added (1) fractionation capacity at our Moundsville fractionator facility bringing the NGL handling capacity to approximately 42.5 Mbbls/d, (2) the associated 50-mile ethane pipeline to Houston, Pennsylvania and (3) the first phase to the condensate stabilization project in the Marcellus Shale. In the third quarter of 2014 we completed the construction of our first deethanizer with a capacity of 40 Mbbls/d and in the fourth quarter of 2014 we completed our first turbo-expander at our Oak Grove facility to add 200 MMcf/d of processing capacity and the last phase of the condensate stabilization project.
Caiman II
As a result of contributions made in the first quarter of 2014, our ownership in the Caiman II joint project increased to 58 percent. These contributions are used to fund Caiman II's 50 percent investment in Blue Racer Midstream LLC (Blue Racer Midstream).
Through capital invested within our Caiman II equity investment we began construction of the Blue Racer Midstream joint project in 2014. Blue Racer Midstream is an expansion of the gathering and processing and the associated liquids infrastructure serving oil and gas producers in the Utica Shale, primarily in Ohio and Northwest Pennsylvania . Expansion plans included the addition of Natrium II, a second 200 MMcf/d processing plant at Natrium, West Virgina, which was completed in April 2014. Construction of an additional 200 MMcf/d processing plant is underway at the Berne complex in Monroe County, Ohio. Berne I was put into service in January 2015 .
Keathley Canyon Connector™
Discovery constructed a 215-mile, 20-inch deepwater lateral pipeline in the central deepwater Gulf of Mexico that it owns and operates. Discovery has signed long-term agreements with anchor customers for natural gas gathering and processing services for production from the Keathley Canyon and Green Canyon areas. The Keathley Canyon Connector™ lateral originates from a third-party floating production facility in the southeast portion of the Keathley Canyon area and connects to Discovery's existing 30-inch offshore natural gas transmission system. The gas is processed at Discovery's Larose Plant and the NGLs are fractionated at Discovery's Paradis Fractionator. The lateral pipeline is estimated to have the capacity to flow more than 400 MMcf/d and will accommodate the tie-in of other deepwater prospects. The pipeline was put into service in the first quarter 2015 .
Volatile commodity prices
NGL margins were approximately 25 percent lower in 2014 compared to 2013 driven primarily by lower volumes, and higher natural gas prices. Volumes declined primarily due to a customer contract in the West that expired in September 2013. Due to unfavorable ethane economics, we further reduced our recoveries of ethane in our domestic plants in 2014 compared to 2013. These reductions are substantially offset by new volumes generated by our Canadian ethane recovery facility which was placed into service in December 2013. Despite the sharp decline in NGL prices during the fourth quarter of 2014, NGL prices on average, were higher in 2014 compared to 2013.
NGL margins are defined as NGL revenues less any applicable Btu replacement cost, plant fuel, and third-party transportation and fractionation. Per-unit NGL margins are calculated based on sales of our own equity volumes at the processing plants. Our equity volumes include NGLs where we own the rights to the value from NGLs recovered at our plants under both "keep-whole" processing agreements, where we have the obligation to replace the lost heating value with natural gas, and "percent-of-liquids" agreements whereby we receive a portion of the extracted liquids with no obligation to replace the lost heating value.
49
The following graph illustrates the effects of this margin volatility, notably the decline in equity ethane sales driven by reduced recoveries, as well as the margin differential between ethane and non-ethane products and the relative mix of those products.
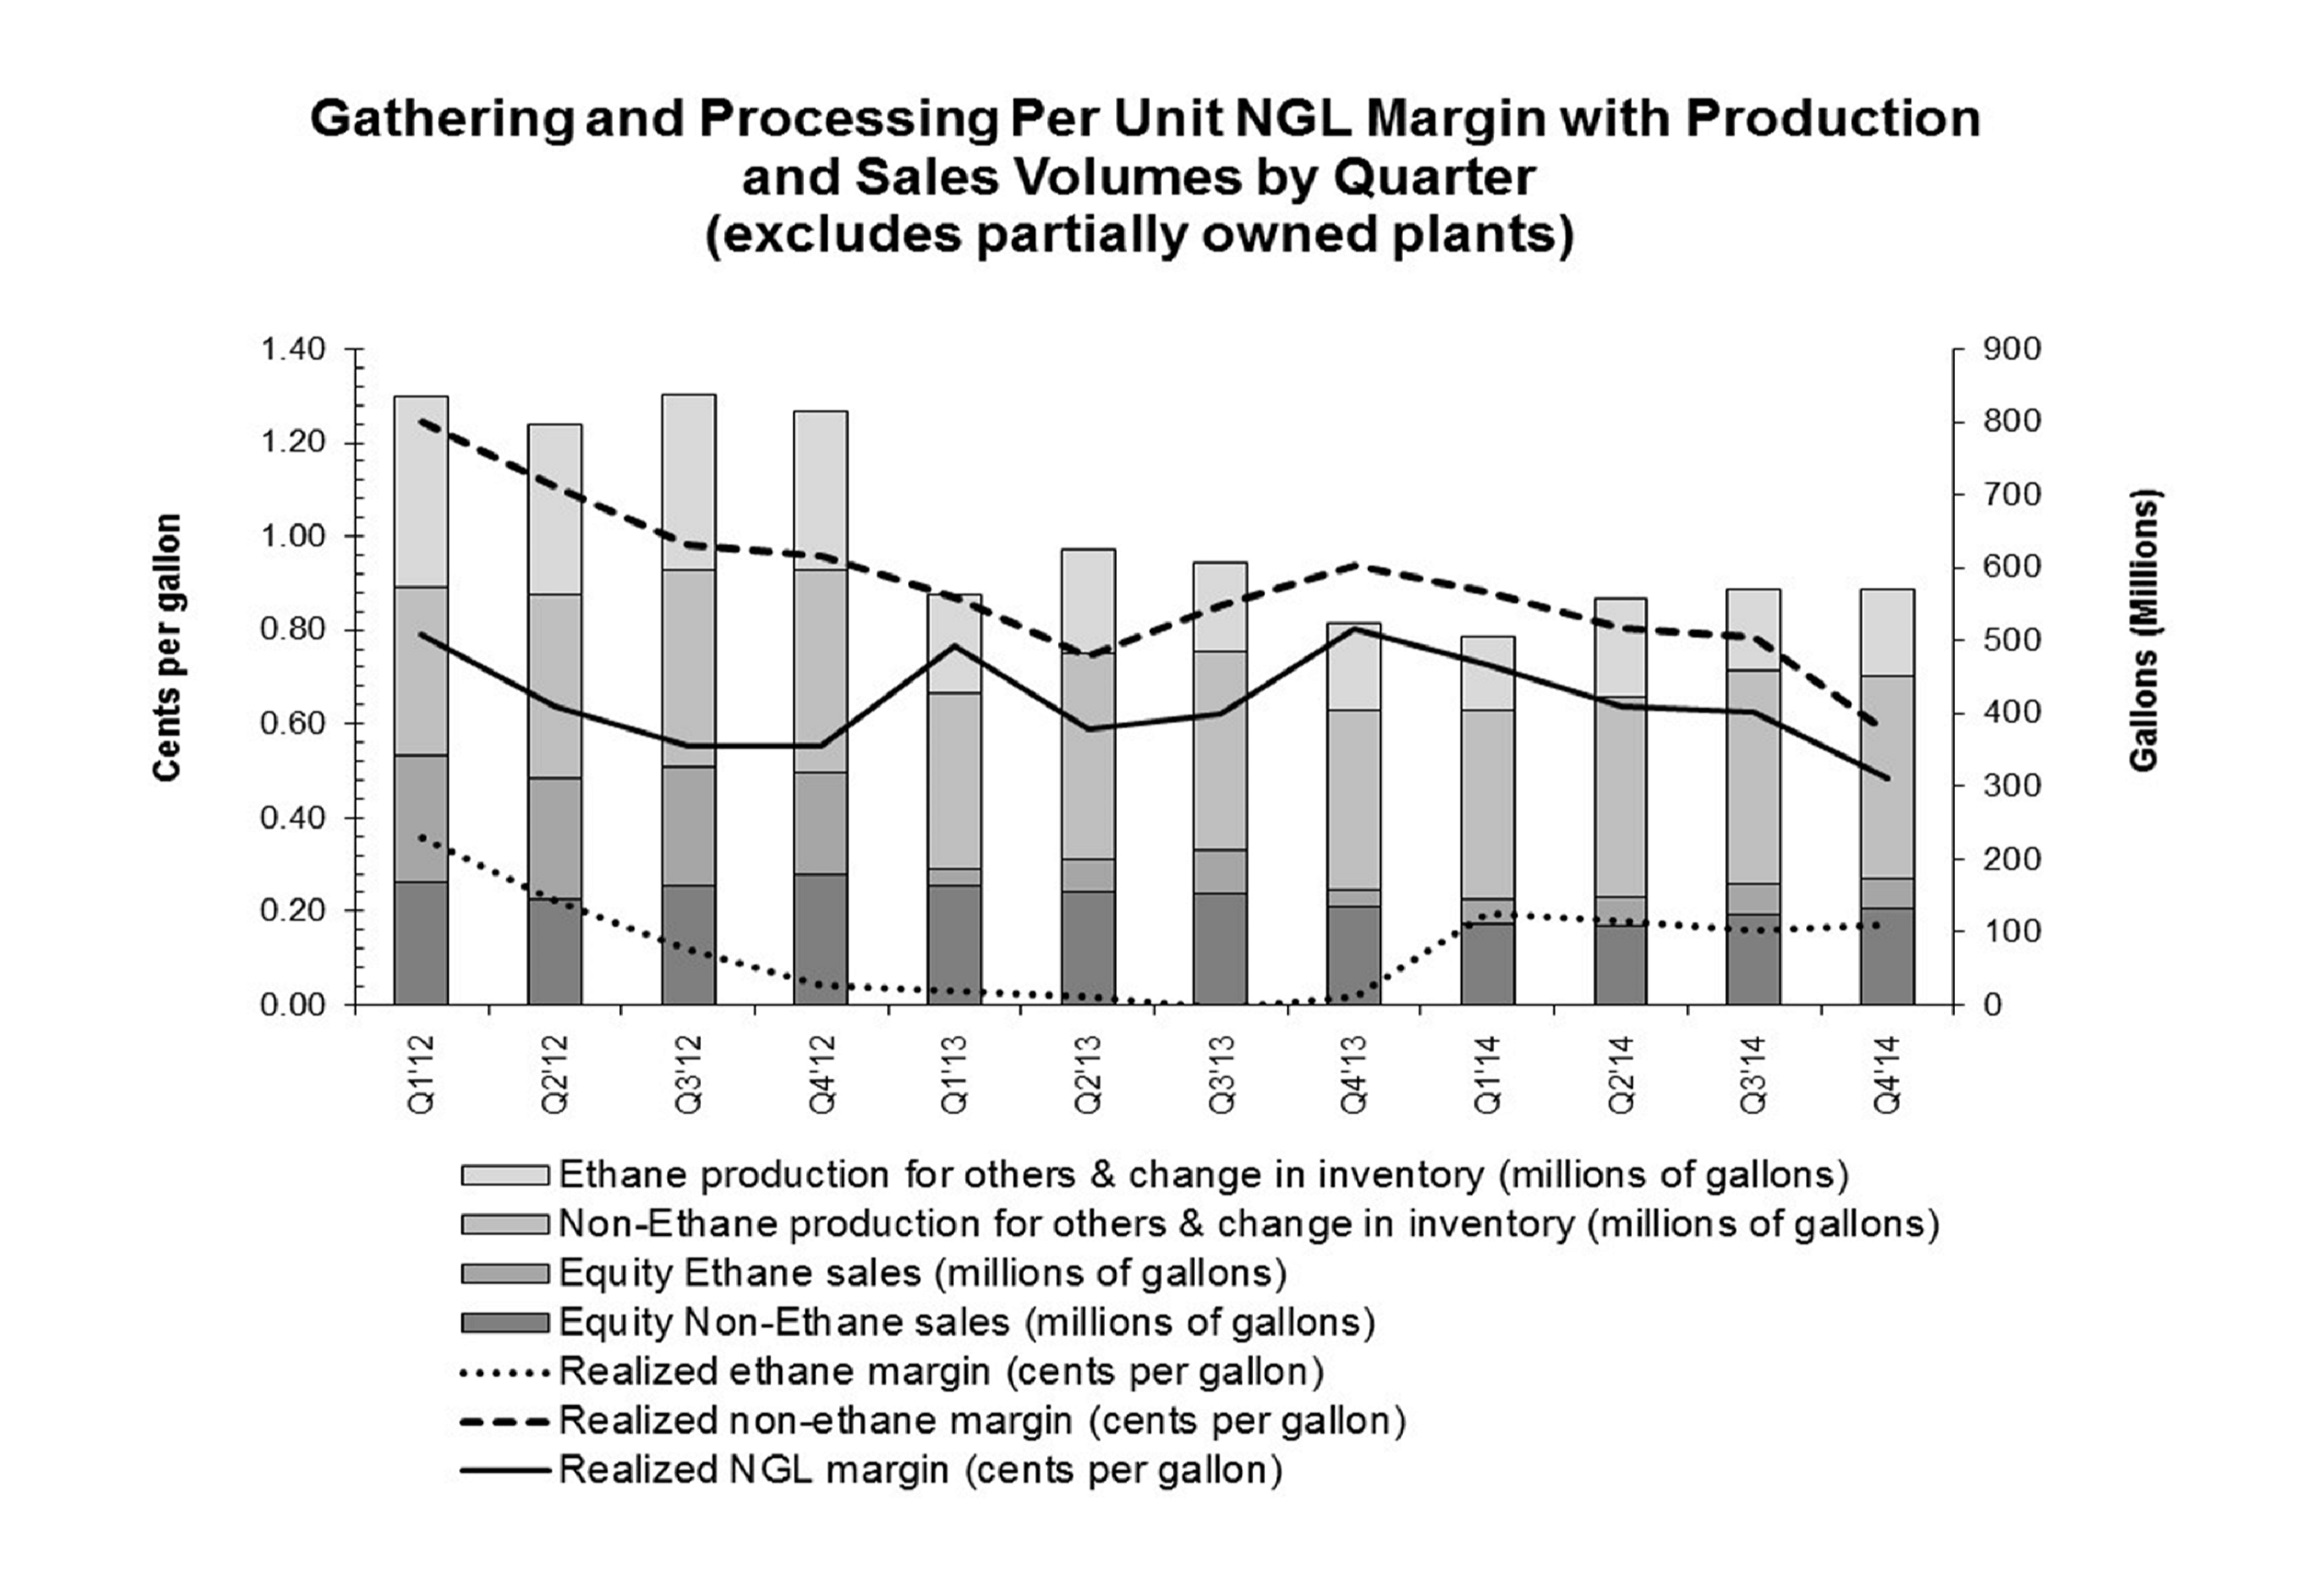 |
Williams NGL & Petchem Services
Bluegrass Pipeline and Moss Lake
We owned a 50 percent equity-method investment in Bluegrass Pipeline, which was a proposed NGL pipeline that would connect processing facilities in the Marcellus and Utica shale-gas areas in the northeastern United States to growing petrochemical and export markets in the Gulf Coast area of the United States. Completion of this project was subject to execution of customer contracts sufficient to support the project. Based on a lack of customer commitments and other factors, our management decided in April 2014 to discontinue further funding of the project. The capitalized project development costs at the Bluegrass Pipeline entity were written off as of March 31, 2014.
We also owned 50 percent interests in Moss Lake. Moss Lake was being developed to construct a proposed new large-scale fractionation plant, expand natural gas liquids storage facilities in Louisiana and construct a proposed pipeline connecting these facilities to the Bluegrass Pipeline. Additionally, Moss Lake would construct a proposed new liquefied petroleum gas (LPG) terminal. The capitalized project development costs at the Moss Lake entities were written off as of March 31, 2014.
On September 2, 2014, we received a notice of dissolution from our partner with respect to the Bluegrass entity and the related Moss Lake entities. We completed the dissolution process for both the Bluegrass Pipeline and Moss Lake entities in the fourth quarter of 2014.
50
Company Outlook
Our strategy is to provide large-scale energy infrastructure designed to maximize the opportunities created by the vast supply of natural gas, natural gas products, and crude oil that exists in North America. We seek to accomplish this through further developing our scale positions in current key markets and basins and entering new growth markets and basins where we can become the large-scale service provider. We will maintain a strong commitment to safety, environmental stewardship, operational excellence and customer satisfaction. We believe that accomplishing these goals will position us to deliver an attractive return to our shareholders.
Following the sharp decline in energy commodity prices in fourth quarter 2014, we expect crude oil, NGLs, and olefins prices to remain at lower levels throughout 2015 as compared to 2014, which will have an adverse effect on our operating results and cash flows. Fee-based businesses are a significant component of our portfolio and have further increased as a result of the ACMP Acquisition. This serves to somewhat reduce the influence of commodity price fluctuations on our operating results and cash flows. However, due in part to lower natural gas prices, we anticipate that overall producer drilling economics will decrease slightly. This may reduce our gathering volumes available for both fee-based and keep-whole processing.
Our business plan for 2015 continues to reflect both significant capital investment and continued dividend growth as compared to 2014. We continue to manage expenditures as appropriate without compromising safety and compliance. Our planned consolidated capital investments for 2015 total between $3.96 billion and $4.59 billion. We expect to maintain an attractive cost of capital and reliable access to capital markets, both of which will allow us to pursue development projects and acquisitions.
Potential risks and obstacles that could impact the execution of our plan include:
• | General economic, financial markets, or industry downturn; |
• | Lower than anticipated energy commodity prices and margins; |
• | Decreased volumes from third parties served by our midstream business; |
• | Unexpected significant increases in capital expenditures or delays in capital project execution; |
• | Lower than anticipated or delay in receiving insurance recoveries associated with the Geismar Incident; |
• | Lower than expected distributions, including IDRs, from WPZ. WPZ's liquidity could also be impacted by a lack of adequate access to capital markets to fund its growth; |
• | Limited availability of capital due to a change in our financial condition, interest rates, market or industry conditions; |
• | Downgrade of our credit ratings and associated increase in cost of borrowings; |
• | Counterparty credit and performance risk; |
• | Changes in the political and regulatory environments; |
• | Physical damages to facilities, including damage to offshore facilities by named windstorms; |
• | Reduced availability of insurance coverage. |
We continue to address these risks through disciplined investment strategies, sufficient liquidity from cash and cash equivalents and available capacity under our credit facilities.
In 2015, we anticipate an overall improvement in operating results compared to 2014 primarily due to increases in olefins volumes associated with the repair and expansion of the Geismar plant and our fee-based businesses primarily
51
a result of the ACMP Acquisition, partially offset by lower NGL margins and higher operating expenses associated with the growth of our business.
The following factors, among others, could impact our businesses in 2015.
Williams Partners
Commodity price changes
NGL and olefin price changes have historically correlated somewhat with changes in the price of crude oil, although NGL, olefin, crude, and natural gas prices are highly volatile, and difficult to predict. Commodity margins are highly dependent upon regional supply/demand balances of natural gas as they relate to NGL margins, while olefins are impacted by global supply and demand fundamentals. NGL products are currently the preferred feedstock for ethylene and propylene production, and are expected to remain advantaged over crude-based feedstocks into the foreseeable future. We continue to benefit from our strategic feedstock cost advantage in propylene production from Canadian oil sands offgas.
Following the sharp decline in the fourth quarter of 2014, we anticipate the following trends in overall energy commodity prices in 2015, compared to 2014:
• | Natural gas and ethane prices are expected to be at or below 2014 levels primarily due to higher inventory levels. |
• | Non-ethane prices, including propane, are expected to be lower primarily due to oversupply and the sharp decline in crude oil prices. |
• | Olefins prices, including propylene, ethylene, and the overall ethylene crack spread, are expected to be lower than 2014 levels due to the volatility in the price of crude oil and correlated products. |
Gathering, transportation, processing, and NGL sales volumes
The growth of natural gas production supporting our gathering and processing volumes is impacted by producer drilling activities, which are influenced by commodity prices, including natural gas, ethane and propane prices. In addition, the natural decline in production rates in producing areas impact the amount of gas available for gathering and processing.
• | In the Gulf Coast region, we expect higher production handling volumes in 2015, following the completion of Gulfstar FPS™ in the fourth quarter of 2014. |
• | We anticipate higher natural gas transportation revenues at Transco compared to 2014, as a result of expansion projects placed into service in 2014 and anticipated to be placed in service in 2015. |
• | In the northeast region, we anticipate growth in our natural gas gathering volumes compared to the prior year as our infrastructure grows to support drilling activities in the region. |
• | In the western region, we anticipate an unfavorable impact in equity NGL volumes in 2015 compared to 2014, primarily due to the sharp decline in NGL prices. |
• | In 2015, our domestic businesses anticipate a continuation of periods when it will not be economical to recover ethane. |
Olefin production volumes
• | Our Gulf olefins business anticipates higher ethylene volumes in 2015 compared to 2014 substantially due to the repair and expansion of the Geismar plant, which restarted in February 2015. |
52
Other
• | Equity earnings are expected to be higher in 2015 compared to 2014 following the completion of Discovery's Keathley Canyon Connector™ lateral in the first quarter of 2015. |
• | We expect higher operating expenses in 2015 compared to 2014, including depreciation expense related to our growing operations in the northeast region and expansion projects at Transco. |
Access Midstream
Following the ACMP Acquisition, we began consolidating Access Midstream's results of operations effective July 1, 2014. As such, we expect an increase in overall results for Access Midstream in 2015 compared to 2014 associated with a full year of consolidated results.
Additionally, we anticipate the following at Access Midstream in 2015:
Volumes
• | Volumes in the Haynesville area are expected to be higher in 2015 as compared to 2014 primarily due to an increase in customer rig count in the area; |
• | We expect an increase in volumes in 2015 as compared to 2014 in the Utica area primarily due to the build out of the Cardinal system, relieving compression constraints and adding new well connections; |
Other
• | Amounts recognized under minimum volume commitments in the Barnett area are expected to increase in 2015 compared to 2014. |
Expansion Projects
We expect to invest between $3.47 billion and $4.1 billion of capital among our business segments in 2015. Our ongoing major expansion projects include the following:
Williams Partners
Oak Grove Expansion
We plan to expand our processing capacity at our Oak Grove facility by adding a second 200MMcf/d cryogenic natural gas processing plant, which is expected to be placed into service at the end of 2015.
Susquehanna Supply Hub
We will continue to expand the gathering system in the Susquehanna Supply Hub in northeastern Pennsylvania that is needed to meet our customer's production plans. The expansion of the gathering infrastructure includes additional compression and gathering pipeline to the existing system.
Atlantic Sunrise
The Atlantic Sunrise Expansion Project involves an expansion of Transco's existing natural gas transmission system along with greenfield facilities to provide firm transportation from the northeastern Marcellus producing area to markets along Transco's mainline as far south as Station 85 in Alabama. We plan to file an application with the FERC in the second quarter of 2015 for approval of the project. We plan to place the project into service during the second half of 2017, assuming timely receipt of all necessary regulatory approvals, and it is expected to increase capacity by 1,700 Mdth/d.
53
Leidy Southeast
In December 2014, we received approval from the FERC for Transco's Leidy Southeast Expansion project to expand our existing natural gas transmission system from the Marcellus Shale production region on Transco's Leidy Line in Pennsylvania to delivery points along its mainline as far south as Station 85 in Alabama. We plan to place a portion of the project into service in March 2015, which will enable us to begin providing firm transportation service through the mainline portion of the project on an interim basis, until the in-service date of the project as a whole. We plan to place the remainder of the project into service during the fourth quarter of 2015 and expect it to increase capacity by 525 Mdth/d.
Mobile Bay South III
In April 2014, we received approval from the FERC to construct and operate an expansion of Transco's Mobile Bay line south from Station 85 in west central Alabama to delivery points along the line. We plan to place the project into service during the second quarter of 2015, and it is expected to increase capacity on the line by 225 Mdth/d.
Constitution Pipeline
In December 2014, we received approval from the FERC to construct and operate the jointly owned Constitution pipeline. We also received a Notice of Complete Application from the New York Department of Environmental Conservation in December 2014. We currently own 41 percent of Constitution with three other parties holding 25 percent, 24 percent, and 10 percent, respectively. We will be the operator of Constitution. The 124-mile Constitution pipeline will connect our gathering system in Susquehanna County, Pennsylvania, to the Iroquois Gas Transmission and Tennessee Gas Pipeline systems in New York. We plan to place the project into service in the second half of 2016, assuming timely receipt of all necessary regulatory approvals, with an expected capacity of 650 Mdth/d. The pipeline is fully subscribed with two shippers.
Northeast Connector
In May 2014, we received FERC approval to expand Transco's existing natural gas transmission system from southeastern Pennsylvania to the proposed Rockaway Delivery Lateral. In December 2014, we placed a portion of the project into service, which enabled us to begin providing 65 Mdth/d of firm transportation from Station 195 to the Rockaway Delivery Lateral junction. We plan to place the remainder of the project into service during the second quarter of 2015. In total, the project is expected to increase capacity by 100 Mdth/d.
Rockaway Delivery Lateral
In May 2014, we received FERC approval to construct a three-mile offshore lateral to a distribution system in New York. We plan to place the project into service during the second quarter of 2015, and the capacity of the lateral is expected to be 647 Mdth/d.
Virginia Southside
In November 2013, we received approval from the FERC to expand Transco's existing natural gas transmission system from New Jersey to a proposed power station in Virginia and delivery points in North Carolina. In December 2014, we placed a portion of the project into service, which enabled us to begin providing 250 Mdth/d of firm transportation capacity through the mainline portion of the project on an interim basis, until the in-service date of the project as a whole. We plan to place the remainder of the project into service during the third quarter of 2015. In total, the project is expected to increase capacity by 270 Mdth/d.
Rock Springs Expansion
In June 2014, we filed an application with the FERC for Transco's Rock Springs Expansion project to expand our existing natural gas transmission system from New Jersey to a proposed generation facility in Maryland. The
54
project is planned to be placed into service in third quarter 2016, assuming timely receipt of all necessary regulatory approvals, and is expected to increase capacity by 192 Mdth/d.
Hillabee Expansion
In November 2014, we filed an application with the FERC for approval of the initial phases of Transco's Hillabee Expansion project, which involves an expansion of our existing natural gas transmission system from our Station 85 in Alabama to a proposed new interconnection with Sabal Trail Transmission's system in Alabama. The project will be constructed in phases, and all of the project expansion capacity will be leased to Sabal Trail Transmission. We plan to place the initial phases of the project into service during the second quarter of 2017, assuming timely receipt of all necessary regulatory approvals, and together they are expected to increase capacity by 1,025 Mdth/d.
Gulf Trace Expansion
In December 2014, we filed an application with the FERC for Transco's Gulf Trace Expansion Project to expand our existing natural gas transmission system together with greenfield facilities to provide firm transportation from Station 65 in St. Helena Parish, Louisiana westward to a new interconnection with Sabine Pass Liquefaction in Cameron Parish, Louisiana. We plan to place the project into service during the second half of 2017, assuming timely receipt of all necessary regulatory approvals, and it is expected to increase capacity by 1,200 Mdth/d.
Parachute
Due to a reduction in drilling in the Piceance basin during 2012 and early 2013, we delayed the in-service date of our 350 MMcf/d cryogenic natural gas processing plant in Parachute that was planned for service in 2014. We are currently planning an in-service date in mid-2018. We will continue to monitor the situation to determine whether a different in-service date is warranted.
Redwater Expansion
As part of a long-term agreement to provide gas processing to a second bitumen upgrader in Canada's oil sands near Fort McMurray, Alberta, we are increasing the capacity of the Redwater facilities where NGL/olefins mixtures will be fractionated into an ethane/ethylene mix, propane, polymer grade propylene, normal butane, an alkylation feed and condensate. This capacity increase is expected to be placed into service during the fourth quarter of 2015.
Williams NGL & Petchem Services
Canadian PDH Facility
We are planning to build a PDH facility in Alberta that will significantly increase production of polymer-grade propylene. Start-up for the PDH facility is expected to occur in the second half of 2018. The new PDH facility is expected to produce approximately 1.1 billion pounds annually, significantly increasing Williams' production of polymer-grade propylene currently at 180 million pounds annually.
NGL Infrastructure Expansion
As part of a long-term agreement to provide gas processing to a second bitumen upgrader in Canada's oil sands near Fort McMurray, Alberta, we are building a new liquids extraction plant and an interconnection with the Boreal Pipeline, owned by our Williams Partners segment. The interconnection will enable transportation of the NGL/olefins mixture on the Boreal pipeline from the new liquids extraction plant to the Redwater facilities, owned by our Williams Partners segment. We plan to place the new liquids extraction plant and interconnection with Boreal into service during the fourth quarter 2015, and expect initial NGL/olefins recoveries of approximately 12 Mbbls/d. To mitigate the associated ethane price risk, we have a long-term supply agreement with a third-party customer.
55
Gulf Coast Expansion
In November 2012, we acquired 10 liquids pipelines in the Gulf Coast region. The acquired pipelines will be combined with an organic build-out of several projects to expand our petrochemical services in that region. The projects include the construction and commissioning of pipeline systems capable of transporting various products in the Gulf Coast region. A butanes/ gasoline pipeline is expected to be placed into service in early 2015, with additional pipelines expected to be placed into service in 2016.
Critical Accounting Estimates
The preparation of financial statements in conformity with generally accepted accounting principles requires management to make estimates and assumptions. We have reviewed the selection, application, and disclosure of these critical accounting estimates with our Audit Committee. We believe that the nature of these estimates and assumptions is material due to the subjectivity and judgment necessary, or the susceptibility of such matters to change, and the impact of these on our financial condition or results of operations.
Pension and Postretirement Obligations
We have employee benefit plans that include pension and other postretirement benefits. Net periodic benefit cost and obligations for these plans are impacted by various estimates and assumptions. These estimates and assumptions include the expected long-term rates of return on plan assets, discount rates, expected rate of compensation increase, health care cost trend rates, and employee demographics, including retirement age and mortality. These assumptions are reviewed annually and adjustments are made as needed. The assumptions utilized to compute cost and the benefit obligations are shown in Note 9 – Employee Benefit Plans of Notes to Consolidated Financial Statements.
The following table presents the estimated increase (decrease) in net periodic benefit cost and obligations resulting from a one-percentage-point change in the specific assumption.
| Benefit Cost |
| Benefit Obligation | ||||||||||||
| One- Percentage- Point Increase |
| One- Percentage- Point Decrease |
| One- Percentage- Point Increase |
| One- Percentage- Point Decrease | ||||||||
| (Millions) | ||||||||||||||
Pension benefits: |
|
|
|
|
|
|
| ||||||||
Discount rate | $ | (9 | ) |
| $ | 10 | |
| $ | (132 | ) |
| $ | 156 | |
Expected long-term rate of return on plan assets | (12 | ) |
| 12 | |
| - | |
| - | | ||||
Rate of compensation increase | 2 | |
| (1 | ) |
| 8 | |
| (6 | ) | ||||
Other postretirement benefits: |
|
|
|
|
|
|
| ||||||||
Discount rate | (1 | ) |
| 3 | |
| (26 | ) |
| 32 | | ||||
Expected long-term rate of return on plan assets | (2 | ) |
| 2 | |
| - | |
| - | | ||||
Assumed health care cost trend rate | - | |
| - | |
| 9 | |
| (7 | ) | ||||
Our expected long-term rates of return on plan assets, as determined at the beginning of each fiscal year, are based on the average rate of return expected on the funds invested in the plans. We determine our long-term expected rates of return on plan assets using our expectations of capital market results, which includes an analysis of historical results as well as forward-looking projections. These capital market expectations are based on a period of at least 10 years and take into account our investment strategy and mix of assets, which is weighted toward domestic and international equity securities. We develop our expectations using input from several external sources, including consultation with our third-party independent investment consultant. The forward-looking capital market projections are developed using a consensus of economists' expectations for inflation, GDP growth, and dividend yield along with expected changes in risk premiums. The capital market return projections for specific asset classes in the investment portfolio are then applied to the relative weightings of the asset classes in the investment portfolio. The resulting rates are an estimate of future results and, thus, likely to be different than actual results.
In 2014, the benefit plans' assets reflected above average returns for U.S. equity and fixed income strategies, but below average returns for non-U.S. equity strategies. While the 2014 investment performance was slightly less than
56
our expected rates of return, the expected rates of return on plan assets are long-term in nature and are not significantly impacted by short-term market performance. Changes to our asset allocation would also impact these expected rates of return. Our expected long-term rate of return on plan assets used for our pension plans was 6.85 percent in 2014. The 2014 actual return on plan assets for our pension plans was approximately 6.6 percent. The 10-year average rate of return on pension plan assets through December 2014 was approximately 5.3 percent.
The discount rates are used to measure the benefit obligations of our pension and other postretirement benefit plans. The objective of the discount rates is to determine the amount, if invested at the December 31 measurement date in a portfolio of high-quality debt securities, that will provide the necessary cash flows when benefit payments are due. Increases in the discount rates decrease the obligation and, generally, decrease the related cost. The discount rates for our pension and other postretirement benefit plans are determined separately based on an approach specific to our plans and their respective expected benefit cash flows as described in Note 1 – Description of Business, Basis of Presentation, and Summary of Significant Accounting Policies and Note 9 – Employee Benefit Plans of Notes to Consolidated Financial Statements. Our discount rate assumptions are impacted by changes in general economic and market conditions that affect interest rates on long-term, high-quality debt securities as well as by the duration of our plans' liabilities.
The expected rate of compensation increase represents average long-term salary increases. An increase in this rate causes the pension obligation and cost to increase.
The assumed health care cost trend rates are based on national trend rates adjusted for our actual historical cost rates and plan design. An increase in this rate causes the other postretirement benefit obligation and cost to increase.
Business Combination Accounting for the ACMP Acquisition
As previously discussed, we completed the ACMP Acquisition on July 1, 2014. We have applied the acquisition method of accounting for this acquisition achieved in stages, under which tangible and identifiable intangible assets acquired and liabilities assumed are recorded at their estimated fair values as of the acquisition date. The excess of the aggregate of the consideration transferred, the fair value of the noncontrolling interest, and the fair value of our previously held equity-method investment, over the preliminary estimated fair value of net assets acquired is reflected as goodwill on our Consolidated Balance Sheet. As disclosed in Note 2 – Acquisitions of the Notes to Consolidated Financial Statements, both the remeasurement of our previously held equity-method investment in ACMP and the allocation of the acquisition-date fair value of the assets acquired and liabilities assumed are considered preliminary. These provisional amounts are subject to change during the measurement period, which will not exceed one year from the acquisition date. Any such adjustments during the measurement period will be recognized as if they had occurred at the acquisition date, which would require retrospective revision of comparative information for prior periods presented.
Goodwill
At December 31, 2014, our Consolidated Balance Sheet includes $1.1 billion of goodwill, of which $474 million is associated with the reporting units representing the northeast, central, and west regions within our Access Midstream segment and $646 million is associated with Williams Partners' Northeast gathering and processing business. The goodwill within the Access Midstream segment was recorded in the third quarter of 2014 in conjunction with the acquisition of ACMP completed on July 1, 2014. (See Note 2 of Notes to Consolidated Financial Statements.) We performed our annual assessment of goodwill for impairment as of October 1 and no impairments were identified or recognized.
Following a significant decline in energy commodity prices in the fourth quarter of 2014, we performed an additional review of WPZ's Northeast gathering and processing business. In our evaluation of WPZ's Northeast gathering and processing business, our estimate of the fair value of the reporting unit exceeded its carrying value by 30 percent, including goodwill, and thus, no impairment was recognized in 2014. The fair value of WPZ's Northeast gathering and processing business was estimated by an income approach utilizing discounted cash flows and corroborated with a market capitalization analysis.
As a result of the decline in energy commodity prices and a decline in the trading price of ACMP's publicly-traded limited partner units, both in the fourth quarter of 2014, we performed an additional impairment evaluation as of December 31, 2014 , of the goodwill allocated to the reporting units within the Access Midstream segment. We estimated
57
the fair value of each reporting unit identified above based on an income approach that utilized a discount rate of 7.25 percent, as well as a market approach that considered appropriate peer transactions and companies, all of which was corroborated with a market capitalization analysis. In this evaluation, our estimate of the fair value of each reporting unit exceeded the related carrying value, and thus, no impairment losses were recognized in 2014. We estimate that a 75 basis point increase in the discount rate utilized could result in a partial impairment of this goodwill.
Judgments and assumptions are inherent in our estimates of future cash flows, discount rates, and market measures used to evaluate these assets. The use of alternate judgments and assumptions could result in a different calculation of fair value, which could ultimately result in the recognition of an impairment charge in the consolidated financial statements.
Equity-method Investments
At December 31, 2014 , our Consolidated Balance Sheet includes approximately $ 8.4 billion of investments that are accounted for under the equity-method of accounting. We evaluate these investments for impairment when events or changes in circumstances indicate, in our management's judgment, that the carrying value of such investments may have experienced an other-than-temporary decline in value. When evidence of loss in value has occurred, we compare our estimate of fair value of the investment to the carrying value of the investment to determine whether an impairment has occurred. We generally estimate the fair value of our investments using an income approach where significant judgments and assumptions include expected future cash flows and the appropriate discount rate. In some cases, we may utilize a form of market approach to estimate the fair value of our investments.
If the estimated fair value is less than the carrying value and we consider the decline in value to be other-than-temporary, the excess of the carrying value over the fair value is recognized in the consolidated financial statements as an impairment charge. Events or changes in circumstances that may be indicative of an other-than-temporary decline in value will vary by investment, but may include:
• | A significant or sustained decline in the market value of an investee; |
• | Lower than expected cash distributions from investees (including incentive distributions); |
• | Significant asset impairments or operating losses recognized by investees; |
• | Significant delays in or lack of producer development or significant declines in producer volumes in markets served by investees; |
• | Significant delays in or failure to complete significant growth projects of investees. |
No impairments of investments accounted for under the equity-method have been recorded for the year ended December 31, 2014.
Capitalized Project Development Costs
As of December 31, 2014 our Consolidated Balance Sheet includes approximately $320 million of capitalized costs associated with a limited number of developing and deferred projects, some of which are considered probable of future completion while certain others are only reasonably possible. Following the significant decline in energy commodity prices in the fourth quarter of 2014, we either reviewed these capitalized project costs for indicators of impairment or evaluated them for impairment as of December 31, 2014 , and determined that no impairments were necessary. Where performed, our impairment evaluations considered probability-weighted scenarios of undiscounted future net cash flows, including reasonably possible scenarios assuming the construction and operation of the underlying projects. We will continue to review and evaluate these capitalized project costs for impairment in the future if we believe events or changes in circumstances indicate that we may not be able to recover the carrying value. Such events or changes in circumstances may include changes in customer requirements associated with these projects, as well as overall changes in market demand. If, in a future evaluation, our carrying value for any of the projects exceeds the
58
undiscounted future net cash flows, we will recognize an impairment for the difference between the carrying value and our estimate of fair value of the assets.
Impairment of Long-lived Assets
We evaluate our long lived assets for impairment when events or changes in circumstances indicate, in our management's judgment, that the carrying value of such assets may not be recoverable. When an indicator of a potential impairment has occurred, we compare our management's estimate of undiscounted future cash flows attributable to the assets to the carrying value of the assets to determine whether an impairment has occurred.
In December 2010 we detected a leak in one of the seven underground natural gas storage caverns at our Eminence Storage Field in Covington County, Mississippi. Due to the leak at this cavern, damage to the well at an adjacent cavern, and operating problems at two other caverns constructed at about the same time, we determined that the four caverns should be retired, which was completed in 2014. In addition, further studies have indicated the need for capital improvements over the next several years of the remaining three caverns. As a result, we performed an assessment of our Eminence storage field for impairment as of December 31, 2014. The carrying value at that date was $78 million. These events have not affected the performance of our obligations under our service agreements with our customers. However, judgments and assumptions are inherent in our estimate of future cash flows used to evaluate Eminence. In our evaluation, our estimate of the undiscounted cash flows of Eminence exceeded its carrying value, and thus no impairment loss was recognized in 2014. If our estimates of revenues were to significantly decrease, it could result in a write down of this asset to fair value.
59
Results of Operations
Consolidated Overview
The following table and discussion is a summary of our consolidated results of operations for the three years ended December 31, 2014 . The results of operations by segment are discussed in further detail following this consolidated overview discussion.
| Years Ended December 31, | ||||||||||||||||||||||
| 2014 |
| $ Change from 2013* |
| % Change from 2013* |
| 2013 |
| $ Change from 2012* |
| % Change from 2012* |
| 2012 | ||||||||||
| (Millions) | ||||||||||||||||||||||
Revenues: |
|
|
|
|
|
|
|
|
|
|
|
|
| ||||||||||
Service revenues | $ | 4,116 | |
| +1,177 | |
| +40 | % |
| $ | 2,939 | |
| +210 | |
| +8 | % |
| $ | 2,729 | |
Product sales | 3,521 | |
| -400 | |
| -10 | % |
| 3,921 | |
| -836 | |
| -18 | % |
| 4,757 | | |||
Total revenues | 7,637 | |
|
|
|
|
| 6,860 | |
|
|
|
|
| 7,486 | | |||||||
Costs and expenses: |
|
|
|
|
|
|
|
|
|
|
|
|
| ||||||||||
Product costs | 3,016 | |
| +11 | |
| - | % |
| 3,027 | |
| +469 | |
| +13 | % |
| 3,496 | | |||
Operating and maintenance expenses | 1,492 | |
| -395 | |
| -36 | % |
| 1,097 | |
| -70 | |
| -7 | % |
| 1,027 | | |||
Depreciation and amortization expenses | 1,176 | |
| -361 | |
| -44 | % |
| 815 | |
| -59 | |
| -8 | % |
| 756 | | |||
Selling, general, and administrative expenses | 661 | |
| -149 | |
| -29 | % |
| 512 | |
| +59 | |
| +10 | % |
| 571 | | |||
Net insurance recoveries – Geismar Incident | (232 | ) |
| +192 | |
| NM | |
| (40 | ) |
| +40 | |
| NM | |
| - | | |||
Other (income) expense – net | (45 | ) |
| +119 | |
| NM | |
| 74 | |
| -50 | |
| NM | |
| 24 | | |||
Total costs and expenses | 6,068 | |
|
|
|
|
| 5,485 | |
|
|
|
|
| 5,874 | | |||||||
Operating income (loss) | 1,569 | |
|
|
|
|
| 1,375 | |
|
|
|
|
| 1,612 | | |||||||
Equity earnings (losses) | 144 | |
| +10 | |
| +7 | % |
| 134 | |
| +23 | |
| +21 | % |
| 111 | | |||
Gain on remeasurement of equity-method investment | 2,544 | |
| +2,544 | |
| NM | |
| - | |
| - | |
| - | % |
| - | | |||
Other investing income (loss) – net | 43 | |
| -38 | |
| -47 | % |
| 81 | |
| +4 | |
| +5 | % |
| 77 | | |||
Interest expense | (747 | ) |
| -237 | |
| -46 | % |
| (510 | ) |
| -1 | |
| - | % |
| (509 | ) | |||
Other income (expense) – net | 31 | |
| +31 | |
| NM | |
| - | |
| +2 | |
| +100 | % |
| (2 | ) | |||
Income (loss) from continuing operations before income taxes | 3,584 | |
|
|
|
|
| 1,080 | |
|
|
|
|
| 1,289 | | |||||||
Provision (benefit) for income taxes | 1,249 | |
| -848 | |
| NM | |
| 401 | |
| -41 | |
| -11 | % |
| 360 | | |||
Income (loss) from continuing operations | 2,335 | |
|
|
|
|
| 679 | |
|
|
|
|
| 929 | | |||||||
Income (loss) from discontinued operations | 4 | |
| +15 | |
| NM | |
| (11 | ) |
| -147 | |
| NM | |
| 136 | | |||
Net income (loss) | 2,339 | |
|
|
|
|
| 668 | |
|
|
|
|
| 1,065 | | |||||||
Less: Net income attributable to noncontrolling interests | 225 | |
| +13 | |
| +5 | % |
| 238 | |
| -32 | |
| -16 | % |
| 206 | | |||
Net income (loss) attributable to The Williams Companies, Inc. | $ | 2,114 | |
|
|
|
|
| $ | 430 | |
|
|
|
|
| $ | 859 | | ||||
_______
* | + = Favorable change; - = Unfavorable change; NM = A percentage calculation is not meaningful due to a change in signs, a zero-value denominator, or a percentage change greater than 200. |
2014 vs. 2013
Service revenues increased primarily due to the Access Midstream operations beginning in third quarter 2014, including $167 million of minimum volume commitment fees, and due to new Canadian construction management services performed for third parties reported within the Other segment. Gathering fees increased driven by higher volumes and a net increase in gathering rates primarily in the Susquehanna Supply Hub. Natural gas transportation fee
60
revenues increased primarily associated with expansion projects placed in service at Transco in 2013. In addition, Service revenues increased related to new processing, fractionation, and transportation fees from Ohio Valley Midstream facilities that were placed in service in 2013 and 2014.
Product sales decreased primarily due to lower olefin sales volumes associated with the lack of production in 2014 as a result of the Geismar Incident, partially offset by an increase in olefin sales on the RGP splitter primarily associated with higher volumes. In addition, equity NGL sales decreased primarily reflecting lower non-ethane volumes, partially offset by higher average ethane per-unit sales prices. Crude oil, natural gas, and other marketing revenues decreased primarily related to lower volumes, while NGL marketing revenues increased primarily related to higher volumes partially offset by lower NGL prices.
Product costs decreased primarily due to lower olefin feedstock purchases related to the lack of production in 2014 as a result of the Geismar Incident. In addition, natural gas purchases associated with the production of equity NGLs decreased slightly reflecting lower volumes, which were substantially offset by higher natural gas prices. These decreases were partially offset by an increase in lower-of-cost-or-market adjustments due to significant declines in NGL prices during the fourth quarter of 2014 and lower crude oil, natural gas, and olefin volumes, partially offset by higher NGL volumes.
Operating and maintenance expenses increased primarily due to costs incurred associated with new Canadian construction management services performed for third parties. In addition, increases are due to expenses associated with Access Midstream beginning in third quarter 2014, including $15 million of transition-related costs, expenses incurred in 2014 associated with the installation of certain safety equipment at the Geismar plant, and higher maintenance and growth in the our operations in the Northeast region of the U.S. These increases were partially offset by a net increase in system gains and reduced gathering fuel expense in the western region operations.
Depreciation and amortization expenses increased primarily due to the Access Midstream operations beginning in third quarter 2014 and due to depreciation on new projects placed in service.
Selling, general, and administrative expenses (SG&A) increased primarily due to the Access Midstream operations beginning in third quarter 2014 including $52 million of acquisition, merger, and transition-related costs recognized in 2014, as well as $18 million of project development costs incurred in 2014 related to the Bluegrass Pipeline reflecting 100 percent of such costs. The 50 percent noncontrolling interest share of these costs are presented in Net income attributable to noncontrolling interests . In addition, SG&A increased in the Northeast region of the U.S. related to significant operational growth driven by higher gathering fees associated with higher volumes from new well connections and the completion of various compression projects.
The favorable change in Net insurance recoveries – Geismar Incident is primarily due to the receipt of $246 million of insurance recoveries in 2014, compared to the receipt of $50 million of insurance recoveries in 2013. (See Note 6 – Other Income and Expenses of Notes to Consolidated Financial Statements).
Other (income) expense – net within Operating income (loss) includes the following increases to net income:
• | $154 million of cash proceeds received in 2014 related to a contingency settlement gain; |
• | The absence of a $25 million accrued loss recognized in 2013 associated with a producer claim against us; |
• | The absence of a $20 million write-off in 2013 for certain pipeline assets; |
• | The absence of $12 million of expense recognized in 2013 and $3 million of expense reversal in 2014, related to the portion of the Eminence abandonment regulatory asset that will not be recovered in rates; |
• | A $12 million net gain recognized in 2014 related to the settlement of a partial acreage dedication release; |
Other (income) expense – net within Operating income (loss) includes the following decreases to net income:
• | $52 million of impairment charges recognized in 2014 related to certain materials and equipment; |
61
• | The absence of $16 million of income from insurance recoveries in 2013 related to the abandonment of certain Eminence storage assets; |
• | $10 million loss on the sale of certain assets in 2014; |
• | $9 million of expenses in excess of the insurable limit associated with the Geismar Incident; |
• | A $9 million increase in expenses associated with a regulatory liability for certain employee costs; |
• | The absence of a $9 million involuntary conversion gain recognized in 2013 related to a 2012 furnace fire for our Geismar olefins plant. |
Operating income (loss) changed favorably primarily due to increased service revenues at Williams Partners of $193 million, a $192 million increase in net insurance recoveries related to the Geismar Incident, $167 million of minimum volume commitment fee revenue at Access Midstream, and $154 million of cash proceeds in 2014 related to a contingency gain settlement. These increases are partially offset by $192 million lower olefin margins, $130 million lower NGL margins and $59 million lower marketing margins, as well as higher operating costs at Williams Partners and higher impairment charges recognized in 2014.
Equity earnings (losses) changed favorably primarily due to the recognition of $96 million of equity earnings in the second half of 2014 related to equity investments of Access Midstream, and an increase in equity earnings from Caiman II and Laurel Mountain. These increases are partially offset by $78 million of equity losses from Bluegrass Pipeline and Moss Lake in 2014 related primarily to the underlying write-off of previously capitalized project development costs (see Note 3 – Variable Interest Entities of Notes to Consolidated Financial Statements), $19 million of equity losses associated with acquisition-related compensation expenses resulting from the ACMP Acquisition, and $17 million lower equity earnings related to our equity-method investment in ACMP since we consolidate this investment as of July 1, 2014.
Gain on remeasurement of equity-method investment represents the gain we recognized as a result of remeasuring to fair value the equity-method investment that we held before we acquired a controlling interest in ACMP. (See Note 2 – Acquisitions of Notes to Consolidated Financial Statements.)
Other investing income (loss) – net changed unfavorably primarily due to $26 million lower gains resulting from ACMP's equity issuances prior to our consolidation of that entity beginning in third quarter 2014 and lower interest income.
Interest expense increased due to a $277 million increase in Interest incurred primarily due to new debt issuances in the fourth quarter of 2013 and the first half of 2014, as well as combining Access Midstream's debt in third quarter 2014, and $9 million of Access Midstream acquisition-related financing costs incurred in 2014. The increase in Interest incurred is partially offset by an increase of $40 million in Interest capitalized related to construction projects in progress. (See Note 2 – Acquisitions and Note 14 – Debt, Banking Arrangements, and Leases of Notes to Consolidated Financial Statements.)
Other income (expense) – net changed favorably primarily due to the benefit from the allowance for equity funds used for construction associated with ongoing capital projects within our regulated operations.
Provision (benefit) for income taxes changed unfavorably primarily due to higher pre-tax income in 2014. This is partially offset by the absence of $99 million deferred income tax expense recognized in 2013, and a benefit of $34 million recorded in 2014 related to the undistributed earnings of certain foreign operations that are no longer considered permanently reinvested. See Note 7 – Provision (Benefit) for Income Taxes of Notes to Consolidated Financial Statements for a discussion of the effective tax rates compared to the federal statutory rate for both years.
Income (loss) from discontinued operations changed favorably primarily due to the absence of a $15 million pre-tax charge resulting from an unfavorable ruling associated with our former Alaska refinery related to the Trans-Alaska Pipeline System Quality Bank in 2013.
62
The favorable change in Net income attributable to noncontrolling interests includes the following:
• | $95 million favorable for our investment in WPZ primarily due to the impact of increased income allocated to the WPZ general partner associated with IDRs; |
• | $9 million favorable for our investment in Bluegrass Pipeline that includes our partner's 50 percent share of project development costs expensed by Bluegrass Pipeline during the portion of the first quarter of 2014 that Bluegrass Pipeline was consolidated; |
• | $71 million unfavorable for our investment in ACMP due to the consolidation of ACMP in third quarter 2014; |
• | $13 million unfavorable for our investment in Cardinal resulting from the consolidation of ACMP in third quarter 2014. |
2013 vs. 2012
The increase in Service revenues is primarily due to higher fee revenues associated with the growth in the businesses acquired in the 2012 Caiman and Laser Acquisitions (see Note 2 – Acquisitions ), as well as contributions from the processing and fractionation facilities placed in service in the latter half of 2012 and in 2013. Additionally, natural gas transportation fee revenues increased from expansion projects placed into service in 2012 and 2013 and new rates effective during first-quarter 2013. Partially offsetting these increases are decreased gathering and processing fee revenues driven by lower volumes in the Piceance, Four Corners, and eastern Gulf Coast areas.
The decrease in Product sales is primarily due to lower NGL production revenues driven by reduced ethane recoveries and decreases in average NGL per-unit sales prices, as well as lower olefin production revenues primarily from the loss of production as a result of the Geismar Incident, partially offset by higher olefin per-unit sales prices. Additionally, marketing revenues decreased resulting from lower NGL per-unit prices, and lower crude oil and ethane volumes, partially offset by higher non-ethane volumes. The changes in marketing revenues are more than offset by similar changes in marketing purchases, reflected above as Product costs .
The decrease in Product costs is primarily due to lower NGL marketing purchases resulting from lower NGL prices and lower crude oil volumes, partially offset by higher non-ethane volumes. The changes in marketing purchases are substantially offset by similar changes in marketing revenues. In addition, olefin feedstock purchases decreased reflecting lower volumes and lower average per-unit feedstock costs. Costs associated with the production of NGLs also decreased primarily resulting from lower ethane recoveries, partially offset by an increase in average natural gas prices.
The increase in Operating and maintenance expenses is primarily associated with the subsequent growth in the operations of the businesses acquired in the Caiman and Laser Acquisitions, a scheduled third-quarter 2013 shutdown to conduct maintenance at our Canadian olefins facility, and $13 million of costs incurred under our insurance deductibles resulting from the Geismar Incident. These increases are partially offset by lower compressor and natural gas pipeline maintenance and repair expenses primarily due to the absence of expenses related to the substantial completion of our natural gas pipeline integrity management plan during 2012, and lower operating costs in our Four Corners area, which experienced lower volumes.
The increase in Depreciation and amortization expenses reflects a full year of depreciation and amortization expense in 2013 related to the Caiman and Laser Acquisitions and depreciation on subsequent infrastructure additions, increased depreciation of certain assets that were decommissioned in the third quarter of 2013 in preparation for the completion of the ethane recovery system, as well as higher depreciation on the Boreal Pipeline which was placed into service in 2012. The absence of increased depreciation in 2012 on certain assets in the Gulf Coast region resulting from a change in the estimated useful lives partially offset these increases.
The decrease in SG&A is primarily due to the absence of reorganization related costs in 2012 and the absence of acquisition and transition costs incurred in 2012. (See Note 6 – Other Income and Expenses of Notes to Consolidated Financial Statements.)
63
The favorable change in Net insurance recoveries – Geismar Incident is primarily due to the receipt of $50 million of insurance recoveries in 2013. This change is partially offset by $10 million of related covered insurable expenses in excess of our retentions (deductibles) incurred in 2013. (See Note 6 – Other Income and Expenses of Notes to Consolidated Financial Statements).
Other (income) expense – net within Operating income (loss) includes the following increases to net expense:
• | $25 million accrued loss for a settlement in principle of a producer claim against us; |
• | $23 million increase in amortization expense related to our regulatory asset associated with asset retirement obligations; |
• | $20 million write-off of development costs of an abandoned project; |
• | $12 million expense recognized in 2013 related to the portion of the Eminence abandonment regulatory asset that will not be recovered in rates. |
Other (income) expense – net within Operating income (loss) includes the following decreases to net expense:
• | $16 million of income from insurance recoveries related to the abandonment of certain of Eminence storage assets in 2013; |
• | $9 million involuntary conversion gain recognized in 2013 related to a 2012 furnace fire for our Geismar olefins plant. |
The unfavorable change in Operating income (loss) generally reflects lower NGL production margins, lower olefin production margins, higher operating costs, the net unfavorable changes in Other income (expense) – net as described above, partially offset by increased fee revenues, higher marketing margins, lower SG&A expenses, and 2013 insurance receipts related to the Geismar Incident.
The favorable change in Equity earnings (losses) is primarily due to higher equity earnings from Access Midstream resulting from the acquisition of this investment in late 2012, and improved equity earnings from Laurel Mountain. These increases are partially offset by lower equity earnings from Discovery.
The favorable change in Other investing income (loss) – net is primarily due to a $43 million increase in interest income associated with a receivable related to the sale of certain former Venezuela assets and gains of $31 million resulting from ACMP's equity issuances in 2013. These increases are partially offset by the absence of $63 million of income recognized in 2012, including $10 million of interest income, related to the 2010 sale of our interest in Accroven SRL. (See Note 5 – Investing Activities of Notes to Consolidated Financial Statements.)
Interest expense increased due to a $43 million increase in Interest incurred primarily due to an increase in borrowings substantially offset by a $42 million increase in Interest capitalized related to construction projects primarily at Williams Partners (see Note 14 – Debt, Banking Arrangements, and Leases of Notes to Consolidated Financial Statements).
Provision (benefit) for income taxes changed unfavorably primarily due to $99 million of deferred income tax expense recognized in 2013 related to the undistributed earnings of certain foreign operations that are no longer considered permanently reinvested. This is partially offset by a reduction in tax expense due to lower pre-tax income. See Note 7 – Provision (Benefit) for Income Taxes of Notes to Consolidated Financial Statements for a discussion of the effective tax rates compared to the federal statutory rate for both years.
Income (loss) from discontinued operations in 2013 primarily includes a $15 million charge resulting from an unfavorable ruling associated with our former Alaska refinery related to the Trans-Alaska Pipeline System Quality Bank. Income (loss) from discontinued operations in 2012 primarily includes a $144 million gain on reconsolidation
64
following the sale of certain of our former Venezuela operations. (See Note 4 – Discontinued Operations of Notes to Consolidated Financial Statements.)
The unfavorable change in Net income attributable to noncontrolling interests primarily reflects our slightly decreased percentage of limited partner ownership of WPZ and higher operating results at WPZ, partially offset by higher income allocated to the general partner associated with incentive distribution rights. It also reflects our partners' share of increased interest income related to a receivable from the sale of certain former Venezuela assets. (See Note 5 – Investing Activities of Notes to Consolidated Financial Statements.)
Year-Over-Year Operating Results – Segments
Williams Partners
| Years Ended December 31, | ||||||||||
| 2014 |
| 2013 |
| 2012 | ||||||
| (Millions) | ||||||||||
Segment revenues | $ | 6,628 | |
| $ | 6,835 | |
| $ | 7,471 | |
Segment costs and expenses | (5,017 | ) |
| (5,262 | ) |
| (5,675 | ) | |||
Equity earnings (losses) | 132 | |
| 104 | |
| 111 | | |||
Segment profit | $ | 1,743 | |
| $ | 1,677 | |
| $ | 1,907 | |
2014 vs. 2013
The decrease in Segment revenues includes:
• | A $251 million decrease in olefin sales primarily associated with a $295 million decrease due to lower volumes related to the lack of production in 2014 as a result of the Geismar Incident, partially offset by a $42 million increase in revenues from our RGP Splitter associated with a $32 million increase in volumes due to a third-party storage facility resuming operations during 2014, and a $10 million increase due to higher per-unit sales prices (substantially offset in Product costs ). |
• | A $132 million decrease in revenues from our equity NGLs primarily reflecting a decrease of $161 million due to lower non-ethane volumes, partially offset by a $29 million increase associated with higher average ethane per-unit sales prices. Equity non-ethane sales volumes are 22% percent lower primarily due to a customer contract that expired in September 2013. |
• | A $26 million decrease in marketing revenues primarily associated with lower crude oil volumes and prices, and lower non-ethane prices, partially offset by increased non-ethane volumes. |
• | A $193 million increase in service revenues primarily due to $88 million higher fee-based revenues resulting from higher gathering volumes driven by new well connections, the completion of various compression projects, and a net increase in gathering rates associated with customer contract modifications primarily in the Susquehanna Supply Hub of the Northeast region. Fee-based revenues also increased $22 million due to contributions from our Ohio Valley Midstream business resulting from the addition of processing, fractionation and transportation facilities placed in service in 2013 and 2014. In addition, natural gas transportation revenues increased $71 million primarily from expansion projects placed into service in 2013 for Transco and $19 million in new service fees associated with the start-up of our Gulfstar One assets. |
The decrease in Segment costs and expenses includes:
• | A $192 million favorable change in Net insurance recoveries – Geismar Incident attributable to the receipt of $232 million of net insurance recoveries in 2014 compared to the receipt of $40 million in net insurance recoveries in 2013. |
65
• | A $119 million favorable change in Other (income) expense – net primarily due to $154 million settlement arising from the resolution of a contingent gain related to claims associated with the purchase of a business in a prior period and the absence of a $25 million accrued loss recognized in 2013 associated with a producer claim against us. Partially offsetting these gains are $40 million of impairment charges recognized in 2014 related to certain materials and equipment and a $9 million increase in expenses associated with a regulatory liability for certain employee costs. |
• | A $59 million decrease in olefin feedstock purchases primarily associated with a $99 million decrease due to lower volumes related to the lack of production in 2014 as a result of the Geismar Incident. Offsetting this decrease is a $36 million increase from our RGP Splitter facility attributable to a $30 million increase in volumes due to a third-party storage facility resuming operations during 2014 and a $6 million increase in per-unit costs (more than offset in Product sales ). |
• | An $80 million increase in operating costs primarily due to a $64 million increase in Depreciation and amortization expenses attributable to new assets placed in service and a $24 million increase in Selling, general and administrative expenses (SG&A) due to higher legal and arbitration costs, consulting expenses and employee costs. |
• | A $33 million increase in marketing purchases primarily due to increased NGL volumes and lower-of-cost-or-market (LCM) inventory adjustments associated with significant declines in NGL prices during the fourth quarter of 2014. |
• | A $2 million decrease in natural gas purchases associated with the production of equity NGLs reflecting $87 million associated with lower volumes, which were substantially offset by an $85 million increase associated with higher natural gas prices. |
The increase in Segment profit includes:
• | A $193 million increase in service revenues as previously discussed. |
• | A $192 million favorable change in Net insurance recoveries – Geismar Incident as previously discussed. |
• | A $119 million favorable change in Other (income) expense – net as previously discussed. |
• | A $28 million increase in equity earnings led by our Caiman II investment which reflected increased earnings of $14 million. This increase is primarily due to the receipt of business interruption proceeds, higher volumes due to assets placed in service and increased ownership. Additionally, our Laurel Mountain equity earnings increased $12 million due to the absence of certain 2013 write-offs, increased gathering volumes and increased ownership. |
• | A $192 million decrease in olefin margins, including $196 million lower olefin margins at our Geismar plant. |
• | A $130 million decrease in NGL margins driven primarily by lower non-ethane volumes and higher natural gas prices, partially offset by higher average ethane per-unit sales prices. |
• | An $80 million increase in operating costs as previously discussed. |
• | A $59 million decrease in marketing margins primarily due to losses attributable to inventory write-downs during 2014 as previously discussed. |
66
2013 vs. 2012
The decrease in segment revenues includes:
• | A $350 million decrease in revenues from our equity NGLs including $248 million due to lower volumes and a $102 million decrease associated with 10 percent lower average realized non-ethane per-unit sales prices and 44 percent lower average ethane per-unit sales prices. Equity ethane sales volumes are 80 percent lower driven by unfavorable ethane economics, as previously mentioned, and equity non-ethane volumes are 7 percent lower primarily due to a customer contract that expired in September 2013 and a change in a customer's contract at the end of 2012 to fee-based processing, along with periods of severe winter weather conditions in the first quarter of 2013 that prevented producers from delivering gas in our western onshore operations. |
• | A $314 million decrease in olefin sales due to $368 million associated with lower volumes, partially offset by $54 million associated with higher per-unit sales prices. Olefins production volumes are lower at our facilities in the Gulf Coast primarily due to the loss of production as a result of the Geismar Incident, an outage in a third-party storage facility which caused us to reduce production at our RGP splitter facility, and changes in inventory management. Our Canadian operations experienced lower olefins sales volumes due to a scheduled third-quarter 2013 shutdown to conduct maintenance and to install ethane recovery equipment, as well as the impact of delays associated with resuming production during the fourth quarter of 2013. These decreased volumes were partially offset by the absence of the impact of filling the Boreal Pipeline in June 2012. Ethylene and propylene prices averaged 21 percent and 12 percent higher, respectively, partially offset by 29 percent lower butadiene prices. |
• | A $224 million decrease in marketing revenues primarily due to $241 million associated with lower NGL prices and $136 million associated with lower crude oil volumes, partially offset by $130 million related to higher non-ethane volumes primarily related to new marketing activity in our Ohio Valley Midstream business. The changes in marketing revenues are more than offset by similar changes in marketing purchases. |
• | A $200 million increase in service revenues primarily includes $167 million higher fee revenues resulting from higher gathering volumes driven by new well connections related to infrastructure additions placed into service in 2012 and 2013, a full year of operations associated with gathering systems included in the 2012 acquisitions, and increased gathering rates associated with customer contract modifications primarily in the Susquehanna Supply Hub, as well as contributions from the processing and fractionation facilities placed in service in the latter half of 2012 and in 2013 in the Ohio Valley Midstream business. Natural gas transportation revenues also increased $106 million primarily due to expansion projects placed into service in 2012 and 2013, as well as new rates effective in first-quarter 2013. Partially offsetting these increases is a $43 million decrease in gathering and processing revenues primarily due to a natural decline in production volumes, primarily in the Piceance basin and Four Corners area, and severe winter weather conditions in the first quarter of 2013, which prevented producers from delivering gas in our western onshore operations. In addition, fee revenues decreased $34 million in the eastern Gulf Coast primarily driven by natural declines in Bass Lite and Blind Faith production area volumes. |
• | A $53 million increase in other product sales primarily due to higher system management gas sales from our gas pipeline businesses (offset in segment costs and expenses ). |
The decrease in segment costs and expenses includes:
• | A $252 million decrease in marketing purchases primarily due to lower NGL prices and lower crude oil volumes, partially offset by higher non-ethane volumes (substantially offset in marketing revenues). |
• | A $224 million decrease in olefin feedstock purchases due to $202 million associated with lower volumes, as discussed above, and $22 million lower feedstock and fuel costs, reflecting 21 percent lower average per-unit ethylene feedstock costs, partially offset by 9 percent higher average per-unit propylene feedstock costs. |
67
• | A $41 million decrease in costs associated with our equity NGLs reflecting a $117 million decrease due to lower natural gas volumes driven by lower ethane recoveries, partially offset by a $76 million increase related to a 41 percent increase in average natural gas prices. |
• | A $75 million increase in operating costs includes $61 million in higher Operating and maintenance expenses primarily associated with the businesses acquired in the Laser and Caiman Acquisitions in February and April 2012, respectively, and the subsequent growth in these operations, as well as $13 million of costs incurred under our insurance deductibles associated with the Geismar Incident and increased maintenance at our Canadian facility related to the scheduled third-quarter 2013 shutdown previously discussed. These increases are partially offset by lower compressor and pipeline maintenance and repair expenses at our Gulf Coast businesses primarily due to the absence of expenses relating to the substantial completion of a natural gas pipeline integrity management plan during 2012. Additionally, the increase in operating costs includes $57 million in higher Depreciation and amortization expenses primarily reflecting a full year of expense in 2013 associated with the businesses acquired in 2012 and depreciation on subsequent infrastructure additions and certain assets in Canada that were decommissioned in the third quarter of 2013 in preparation of the completion of the ethane recovery system, in addition to the depreciation related to the Boreal Pipeline which was placed into service in June 2012, partially offset by the absence of increased depreciation in 2012 on certain assets in the Gulf Coast region resulting from a change in the estimated useful lives. Partially offsetting these increases in operating costs is lower SG&A primarily due to the absence of acquisition and transition costs of $23 million incurred in 2012. |
• | A $44 million increase in other product costs primarily due to higher system management gas costs from our gas pipeline businesses (offset in segment revenues ). |
• | A $40 million increase associated with Net insurance recoveries-Geismar Incident. |
• | A $27 million unfavorable change in Other (income) expense – net primarily attributable to a $25 million accrued loss for a settlement in principle of a producer claim against us and $23 million higher amortization of regulatory assets associated with asset retirement obligations in 2013. These unfavorable changes are partially offset by $9 million in involuntary conversion gains related to a 2012 furnace fire at our Geismar olefins plant and a $5 million favorable change in net foreign currency exchange gains. |
The decrease in segment profit includes:
• | A $309 million decrease in NGL margins driven primarily by lower NGL volumes and prices and higher natural gas prices. |
• | A $90 million decrease in olefin margins including $156 million associated with lower product volumes at our Geismar plant offset by $41 million associated with higher ethylene per-unit sales prices and $21 million lower ethylene feedstock costs. |
• | A $75 million increase in operating costs as previously discussed. |
• | A $7 million decrease in Equity earnings (losses) primarily due to $20 million lower equity earnings from Discovery driven by lower NGL margins reflecting lower volumes including reduced ethane recoveries and natural declines, as well as lower NGL prices. In addition, charges to write-down two lateral pipelines and electrical equipment in 2013 and the absence of a favorable customer settlement in 2012 decreased equity earnings from Discovery. The decrease is partially offset by $15 million improved equity earnings from Laurel Mountain driven primarily by 55 percent higher gathering volumes, the receipt of an annual minimum volume commitment fee in 2013, and lower leased compression expenses. |
• | A $200 million increase in service revenues as previously discussed. |
68
• | A $28 million increase in marketing margins primarily due to favorable prices in 2013 and the absence of losses recognized in the second quarter of 2012 driven by significant declines in NGL prices while product was in transit. |
• | A $40 million increase associated with Net insurance recoveries-Geismar Incident, as previously discussed . |
• | A $27 million unfavorable change in Other (income) expense – net as previously discussed. |
Access Midstream
| Years Ended December 31, | ||||||||||
| 2014 |
| 2013 |
| 2012 | ||||||
| (Millions) | ||||||||||
Segment revenues | $ | 781 | |
| $ | - | |
| $ | - | |
Segment costs and expenses | 613 | |
| - | |
| - | | |||
Equity earnings (losses) | 90 | |
| 30 | |
| - | | |||
Gain on remeasurement of equity-method investment | 2,544 | |
| - | |
| - | | |||
Income (loss) from investments | 1 | |
| 31 | |
| - | | |||
Segment profit | $ | 2,803 | |
| $ | 61 | |
| $ | - | |
We began consolidating ACMP following the ACMP Acquisition on July 1, 2014. Prior to the acquisition date, we accounted for our interest in ACMP as an equity-method investment.
2014 vs. 2013
Equity earnings (losses) in 2014 includes $169 million of equity earnings primarily from our Appalachia Midstream Investments since July 1, 2014, partially offset by $79 million of noncash amortization of the difference between the cost of our investment and our underlying share of the net assets of Access Midstream. The increase in these two items for 2014 is attributable to the consolidation of ACMP. Equity earnings (losses) in 2013 includes $30 million of equity earnings recognized from our equity-method investment in ACMP.
Gain on remeasurement of equity-method investment in 2014 includes a $2.5 billion gain relating to the remeasurement of our equity-method investment in ACMP.
Income (loss) from investments in 2013 includes $31 million in gains resulting from ACMP's equity issuances in 2013. These equity issuances resulted in the dilution of our ownership from approximately 24 percent to 23 percent, which was accounted for as though we sold a portion of our investment.
2013 vs. 2012
Equity earnings (losses) in 2013 includes $93 million of equity earnings recognized from Access Midstream, which we acquired an interest in during December 2012. Offsetting the 2013 equity earnings is $63 million of noncash amortization of the difference between the cost of our investment and our underlying share of the net assets of Access Midstream.
Income (loss) from investments in 2013 includes noncash gains of $31 million resulting from Access Midstream's equity issuances in 2013. These equity issuances resulted in the dilution of our ownership of limited partnership units from approximately 24 percent to 23 percent, which is accounted for as though we sold a portion of our investment.
69
Williams NGL & Petchem Services
| Years Ended December 31, | ||||||||||
| 2014 |
| 2013 |
| 2012 | ||||||
| (Millions) | ||||||||||
Segment costs and expenses | $ | (37 | ) |
| $ | (32 | ) |
| $ | (3 | ) |
Equity earnings (losses) | (78 | ) |
| - | |
| - | | |||
Segment loss | $ | (115 | ) |
| $ | (32 | ) |
| $ | (3 | ) |
2014 vs. 2013
Segment costs and expenses increased primarily due to higher expensed costs related to development projects. We expensed $19 million of project development costs during the first quarter of 2014 related to Bluegrass Pipeline that was offset by a $20 million write-off of an abandoned project during 2013.
The unfavorable change in Equity earnings (losses) is due to equity losses from Bluegrass Pipeline and Moss Lake related primarily to the underlying write-off of previously capitalized project development costs. (See Note 3 – Variable Interest Entities of Notes to Consolidated Financial Statements.)
The unfavorable change in Segment loss is due primarily to equity losses from Bluegrass Pipeline and Moss Lake.
2013 vs. 2012
Segment costs and expenses increased primarily due to the $20 million write-off of an abandoned project during 2013 as well as costs incurred during 2013 related to the development of the Bluegrass Pipeline.
Other
| Years Ended December 31, | ||||||||||
| 2014 |
| 2013 |
| 2012 | ||||||
| (Millions) | ||||||||||
Segment revenues | $ | 259 | |
| $ | 36 | |
| $ | 27 | |
Segment profit (loss) | $ | 4 | |
| $ | (5 | ) |
| $ | 56 | |
2014 vs. 2013
Segment revenues increased due to new Canadian construction management services provided for third parties (substantially offset in segment costs and expenses ). The favorable change in segment profit is primarily due to the absence of $6 million of project development costs incurred in 2013.
2013 vs. 2012
The unfavorable change in segment profit is primarily due to the absence of the gain of $53 million recognized in 2012 related to the 2010 sale of our interest in Accroven SRL. As part of a settlement regarding certain Venezuelan assets in 2012, we received payment for all outstanding balances due from this sale. (See Note 5 – Investing Activities of Notes to Consolidated Financial Statements.) The unfavorable change also reflects $6 million of project development costs incurred in 2013.
70
Management's Discussion and Analysis of Financial Condition and Liquidity
Overview
In 2014, we continued to focus upon both growth in our businesses through disciplined investment and growth in our per-share dividends. Examples of this growth included:
• | The acquisition of ACMP which has bolstered our position in the Marcellus and Utica shale plays and added diversity via the Eagle Ford, Haynesville, Barnett, Mid-Continent, and Niobrara areas; |
• | Expansion of WPZ's interstate natural gas pipeline system to meet the demand of growth markets; |
• | Continued investment in WPZ's gathering and processing capacity and infrastructure in the Marcellus Shale area and deepwater Gulf of Mexico, as well as expansion of our olefins business in the Gulf Coast region; |
• | Expansion of our Canadian facilities, which we anticipate contributing to WPZ in the future; |
• | Total per-share dividends grew 36 percent to $1.96 in 2014 compared to $1.44 in 2013. |
This growth was funded through cash flow from operations, distributions from WPZ and ACMP, debt and equity offerings, and cash on hand.
Outlook
We seek to manage our businesses with a focus on applying conservative financial policy in order to maintain investment-grade credit metrics. We continue to transition to an overall business mix that is increasingly fee-based. Although our cash flows are impacted by fluctuations in energy commodity prices, that impact is somewhat mitigated by certain of our cash flow streams that are not directly impacted by short-term commodity price movements, including:
• | Firm demand and capacity reservation transportation revenues under long-term contracts; |
• | Fee-based revenues from certain gathering and processing services. |
We believe we have, or have access to, the financial resources and liquidity necessary to meet our requirements for working capital, capital and investment expenditures, dividends and distributions, debt service payments, and tax payments, while maintaining a sufficient level of liquidity. In particular, we note that we expect capital and investment expenditures to total between $3.96 billion and $4.59 billion in 2015. Of this total, maintenance capital expenditures, which are generally considered nondiscretionary and include expenditures to meet legal and regulatory requirements, to maintain and/or extend the operating capacity and to complete certain well connections, are expected to total $490 million. Expansion capital expenditures, which are generally more discretionary to fund projects in order to grow our business are expected to total between $3.47 billion and $4.10 billion. See Company Outlook - Expansion Projects for discussions describing the general nature of these expenditures. In addition, we retain the flexibility to adjust our planned levels of capital and investment expenditures in response to changes in economic conditions or business opportunities.
Liquidity
Based on our forecasted levels of cash flow from operations and other sources of liquidity, we expect to have sufficient liquidity to manage our businesses in 2015. Our internal and external sources of consolidated liquidity to fund working capital requirements, capital and investment expenditures, debt service payments, dividends and distributions, and tax payments include:
• | Cash and cash equivalents on hand; |
• | Cash generated from operations, including cash distributions from the merged partnership and our equity-method investees based on our level of ownership and incentive distribution rights; |
71
• | Cash proceeds from issuances of debt and/or equity securities; |
• | Use of our credit facility. |
These sources are available to us at either the parent or subsidiary level, as applicable, and are expected to be available to certain of our subsidiaries, particularly equity and debt issuances. The merged partnership is expected to be self-funding through its cash flows from operations, its credit facilities and/or commercial paper program, and its access to capital markets. We anticipate our more significant uses of cash to be:
• | Maintenance and expansion capital expenditures; |
• | Contributions to our equity-method investees to fund their expansion capital expenditures; |
• | Interest on our long-term debt; |
• | Quarterly dividends to our shareholders. |
Potential risks associated with our planned levels of liquidity and the planned capital and investment expenditures discussed above include those previously discussed in Company Outlook .
As of December 31, 2014, we had a working capital deficit (current liabilities, inclusive of commercial paper issuances and long-term debt due within one year, in excess of current assets) of $677 million . However, we note the following about our available liquidity.
|
| December 31, 2014 | ||||||||||||||
Available Liquidity |
| WPZ |
| ACMP |
| WMB |
| Total | ||||||||
|
| (Millions) | ||||||||||||||
Cash and cash equivalents |
| $ | 129 | |
| $ | 42 | |
| $ | 69 | |
| $ | 240 | |
Capacity available under our $1.5 billion credit facility (1) |
|
|
|
|
| 1,130 | |
| 1,130 | | ||||||
Capacity available to Pre-merger WPZ under its $2.5 billion credit facility less amounts outstanding under its $2 billion commercial paper program (2)(4) |
| 1,702 | |
|
|
|
|
| 1,702 | | ||||||
Capacity available to ACMP under its $1.75 billion credit facility (3)(4) |
|
|
| 1,108 | |
|
|
| 1,108 | | ||||||
|
| $ | 1,831 | |
| $ | 1,150 | |
| $ | 1,199 | |
| $ | 4,180 | |
__________
(1) | The highest amount outstanding during 2014 was $370 million. See Note 14 – Debt, Banking Arrangements, and Leases of Notes to Consolidated Financial Statements for discussion of the Second Amended and Restated Credit Agreement we entered into on February 2, 2015 extending the maturity date to February 2, 2020. We are in compliance with the financial covenants as measured at December 31, 2014. At February 24, 2015, we have no borrowings outstanding under our credit facility. |
(2) | In managing our available liquidity, we do not expect a maximum outstanding amount under WPZ's commercial paper program in excess of the capacity available under WPZ's credit facility. During 2014, Pre-merger WPZ borrowed under the commercial paper program and the highest amount outstanding during the year was $1 billion. |
(3) | The highest amount outstanding during the six months ended December 31, 2014 was $728 million. |
(4) | On February 2, 2015, in conjunction with the Merger, these credit facilities were terminated and replaced with a $3.5 billion credit facility with a maturity date of February 2, 2020, with an option to extend the maturity date up to February 2, 2022, subject to certain circumstances. The merged partnership also amended and restated the commercial paper program to allow a maximum outstanding of $3 billion. On February 3, 2015, the merged partnership also entered into a $1.5 billion short-term credit facility with a maturity date of August 3, 2015, with |
72
an option to extend the maturity date to February 2, 2016. We are in compliance with the financial covenants as measured at December 31, 2014. See Note 14 – Debt, Banking Arrangements, and Leases of Notes to Consolidated Financial Statements for further discussion. At February 24, 2015, $1.3 billion is outstanding under WPZ's credit facilities and $1.8 billion is outstanding under WPZ's commercial paper program.
As described in Note 14 – Debt, Banking Arrangements, and Leases of Notes to Consolidated Financial Statements, we have determined that we have net assets that are technically considered restricted in accordance with Rule 4-08(e) of Regulation S-X of the Securities and Exchange Commission in excess of 25 percent of our consolidated net assets. We do not expect this determination will impact our ability to pay dividends or meet future obligations as the terms of the merged partnership's agreement require it to make quarterly distributions of all available cash, as defined, to its unitholders.
Debt Issuances and Retirements
The merged partnership retired $750 million of 3.8 percent senior unsecured notes that matured on February 15, 2015.
On June 27, 2014, Pre-merger WPZ completed a public offering of $750 million of 3.9 percent senior unsecured notes due 2025 and $500 million of 4.9 percent senior unsecured notes due 2045. Pre-merger WPZ used the net proceeds to repay amounts outstanding under its commercial paper program, to fund capital expenditures, and for general partnership purposes.
On June 24, 2014, we completed a public offering of $1.25 billion of 4.55 percent senior unsecured notes due 2024 and $650 million of 5.75 percent unsecured notes due 2044. We used the net proceeds to finance a portion of the ACMP Acquisition.
On March 4, 2014, Pre-merger WPZ completed a public offering of $1 billion of 4.3 percent senior unsecured notes due 2024 and $500 million of 5.4 percent senior unsecured notes due 2044. Pre-merger WPZ used the net proceeds to repay amounts outstanding under its commercial paper program, to fund capital expenditures, and for general partnership purposes.
Equity Offering
On June 23, 2014, we issued 61 million shares of common stock in a public offering at a price of $57.00 per share. That amount includes 8 million shares purchased pursuant to the full exercise of the underwriter's option to purchase additional shares. The net proceeds of $3.378 billion were used to finance a portion of the ACMP Acquisition.
Shelf Registrations
In April 2013, Pre-merger WPZ filed a shelf registration statement for the offer and sale from time to time of common units representing limited partner interests in Pre-merger WPZ having an aggregate offering price of up to $600 million. During 2014, 1,080,448 common units were issued under this registration. The net proceeds of $55 million were used for general partnership purposes. Pre-merger WPZ's shelf registration statement was terminated on February 2, 2015 in conjunction with the Merger.
In July 2013, ACMP filed a shelf registration statement under which it may offer and sell common units representing limited partner interests in ACMP having an aggregate offering price of up to $300 million. During the last six months of 2014, no common units were issued under this registration. On February 24, 2015, the merged partnership filed a post-effective amendment to terminate the effectiveness of this shelf registration statement pertaining to sales of common units and to deregister the offer and sale of all unsold common units thereunder. The merged partnership anticipates filing a new registration statement on Form S-3 concerning the sale, on a continuous offering basis, by the merged partnership of common units.
Distributions from Equity-Method Investees
The organizational documents of entities in which we have an equity-method interest generally require distribution of their available cash to their members on a quarterly basis. In each case, available cash is reduced, in part, by reserves
73
appropriate for operating their respective businesses. See Note 5 – Investing Activities of Notes to Consolidated Financial Statements for our more significant equity-method investees.
Credit Ratings
Our ability to borrow money is impacted by our credit ratings and the credit ratings of the merged partnership. On February 24, 2015, credit ratings are as follows:
|
|
|
|
|
|
|
|
| Rating Agency |
| Outlook |
| Senior Unsecured Debt Rating |
| Corporate Credit Rating |
WMB: | Standard & Poor's |
| Stable |
| BB+ |
| BBB |
| Moody's Investors Service |
| Stable |
| Baa3 |
| N/A |
| Fitch Ratings |
| Negative |
| BBB- |
| N/A |
|
|
|
|
|
|
|
|
WPZ: | Standard & Poor's |
| Stable |
| BBB |
| BBB |
| Moody's Investors Service |
| Stable |
| Baa2 |
| N/A |
| Fitch Ratings |
| Negative |
| BBB |
| N/A |
Credit rating agencies perform independent analyses when assigning credit ratings. No assurance can be given that the credit rating agencies will continue to assign us investment grade ratings even if we meet or exceed their current criteria for investment grade ratios. A downgrade of our credit rating might increase our future cost of borrowing and would require us to post additional collateral with third parties, negatively impacting our available liquidity. As of December 31, 2014, we estimate that a downgrade to a rating below investment grade for us or WPZ could require us to post up to $584 thousand or $262 million, respectively, in additional collateral with third parties.
Sources (Uses) of Cash
| Years Ended December 31, | ||||||||||
| 2014 |
| 2013 |
| 2012 | ||||||
| (Millions) | ||||||||||
Net cash provided (used) by: |
|
|
|
|
| ||||||
Operating activities | $ | 2,115 | |
| $ | 2,217 | |
| $ | 1,835 | |
Financing activities | 7,601 | |
| 1,677 | |
| 5,036 | | |||
Investing activities | (10,157 | ) |
| (4,052 | ) |
| (6,921 | ) | |||
Increase (decrease) in cash and cash equivalents | $ | (441 | ) |
| $ | (158 | ) |
| $ | (50 | ) |
Operating activities
The factors that determine operating activities are largely the same as those that affect Net income (loss) , with the exception of noncash expenses such as Gain on remeasurement of equity-method investment , Depreciation and amortization , Provision (benefit) for deferred income taxes , and Gain on reconsolidation of Wilpro entities. Our Net cash provided by operating activities in 2014 decreased from 2013 primarily due to the impact of net unfavorable changes in operating working capital, lower olefins production margins, and increased interest payments on debt. These changes were partially offset by proceeds from insurance recoveries on the Geismar Incident, proceeds from a contingency settlement in 2014, and contributions from consolidating ACMP for the second half of 2014.
Our Net cash provided by operating activities in 2013 increased from 2012 primarily due to proceeds from insurance recoveries on the Eminence Storage Field leak and Geismar Incident, $93 million of distributions from our investment in Access Midstream Partners acquired in December 2012, and net favorable changes in operating working capital, partially offset by lower operating income.
Financing activities
Significant transactions include:
74
2014
• | $1.895 billion net received from our debt offerings; |
• | $2.74 billion net proceeds received from Pre-merger WPZ's debt offerings: |
• | $1.040 billion received from our credit facility borrowings and $1.646 billion received for the six months ended December 31, 2014, on ACMP's credit facility borrowings; |
• | $670 million paid on our credit facility borrowings and $1.156 billion paid for the six months ended December 31, 2014, on ACMP's credit facility borrowings; |
• | $572 million net proceeds received from Pre-merger WPZ's commercial paper issuances; |
• | $3.416 billion received from our equity offerings; |
• | $1.412 billion paid for quarterly dividends on common stock; |
• | $840 million paid for dividends and distributions to noncontrolling interests; |
• | $340 million received in contributions from noncontrolling interests. |
2013
• | $224 million net proceeds received from Pre-merger WPZ's commercial paper issuances; |
• | $1.705 billion received from Pre-merger WPZ's credit facility borrowings; |
• | $994 million net proceeds received from Pre-merger WPZ's November 2013 public offering of $600 million of 4.5 percent senior unsecured notes due 2023 and $400 million of 5.8 percent senior unsecured notes due 2043; |
• | $2.08 billion paid on Pre-merger WPZ's credit facility borrowings; |
• | $1.819 billion received from Pre-merger WPZ's equity offerings; |
• | $982 million paid for quarterly dividends on common stock; |
• | $489 million paid for dividends and distributions to noncontrolling interests; |
• | $467 million received in contributions from noncontrolling interests. |
2012
• | $2.55 billion net proceeds received from our 2012 equity offerings; |
• | $1.559 billion received from Pre-merger WPZ's 2012 equity offerings; |
• | $842 million net proceeds received from our December 2012 public offering of $850 million of 3.7 percent senior unsecured notes due 2023; |
• | $745 million net proceeds received from Pre-merger WPZ's August 2012 public offering of $750 million of senior unsecured notes due 2022; |
75
• | $395 million net proceeds received from Transco's July 2012 issuance of $400 million of senior unsecured notes; |
• | $1.49 billion received from Pre-merger WPZ's credit facility borrowings; |
• | $1.115 billion of Pre-merger WPZ's credit facility borrowings paid; |
• | $325 million paid to retire Transco's 8.875 percent notes that matured in July 2012; |
• | We paid $742 million of quarterly dividends on common stock; |
• | We paid $387 million of dividends and distributions to noncontrolling interests. |
Investing activities
Significant transactions include:
2014
• | Capital expenditures totaled $4.031 billion; |
• | Purchases of and contributions to our equity-method investments of $482 million; |
• | $5.958 billion paid, net of cash acquired, for the ACMP Acquisition. |
2013
• | Capital expenditures totaled $3.572 billion; |
• | Purchases of and contributions to our equity-method investments of $455 million. |
2012
• | Capital expenditures totaled $2.529 billion; |
• | Purchases of and contributions to our equity-method investments of $2.651 billion, including $2.19 billion paid in December 2012 for our investment in ACMP; |
• | $1.72 billion paid, net of purchase price adjustments, for Pre-merge WPZ's Caiman Acquisition in April 2012; |
• | $ 325 million paid, net of cash acquired in the transaction, for Pre-merger WPZ's Laser Acquisition in March 2012; |
• | $121 million received from the reconsolidation of the Wilpro entities (see Note 4 – Discontinued Operations of our Notes to Consolidated Financial Statements). |
Off-Balance Sheet Arrangements and Guarantees of Debt or Other Commitments
We have various other guarantees and commitments which are disclosed in Note 3 – Variable Interest Entities , Note 11 – Property, Plant, and Equipment , Note 14 – Debt, Banking Arrangements, and Leases , Note 17 – Fair Value Measurements, Guarantees, and Concentration of Credit Risk , and Note 18 – Contingent Liabilities and Commitments of Notes to Consolidated Financial Statements. We do not believe these guarantees or the possible fulfillment of them will prevent us from meeting our liquidity needs.
76
Contractual Obligations
The table below summarizes the maturity dates of our contractual obligations at December 31, 2014 :
| 2015 |
| 2016 - 2017 |
| 2018 - 2019 |
| Thereafter |
| Total | ||||||||||
|
|
|
|
| (Millions) |
|
|
|
| ||||||||||
Long-term debt: |
|
|
|
|
|
|
|
|
| ||||||||||
Principal | $ | - | |
| $ | 1,160 | |
| $ | 1,542 | |
| $ | 17,998 | |
| $ | 20,700 | |
Interest | 1,041 | |
| 2,000 | |
| 1,847 | |
| 7,805 | |
| 12,693 | | |||||
Commercial paper | 798 | |
| - | |
| - | |
| - | |
| 798 | | |||||
Capital leases | 4 | |
| 1 | |
| - | |
| - | |
| 5 | | |||||
Operating leases | 89 | |
| 126 | |
| 75 | |
| 129 | |
| 419 | | |||||
Purchase obligations (1) | 1,399 | |
| 400 | |
| 331 | |
| 547 | |
| 2,677 | | |||||
Other obligations (2)(3) | 2 | |
| 1 | |
| - | |
| - | |
| 3 | | |||||
Total | $ | 3,333 | |
| $ | 3,688 | |
| $ | 3,795 | |
| $ | 26,479 | |
| $ | 37,295 | |
______________
(1) | Includes approximately $616 million in open property, plant, and equipment purchase orders. Includes an estimated $389 million long-term ethane purchase obligation with index-based pricing terms that is reflected in this table at December 31, 2014 prices. This obligation is part of an overall exchange agreement whereby volumes we transport on OPPL are sold at a third-party fractionator near Conway, Kansas, and we are subsequently obligated to purchase ethane volumes at Mont Belvieu. The purchased ethane volumes may be utilized or resold at comparable prices in the Mont Belvieu market. Includes an estimated $600 million long-term NGL purchase obligation with index-based pricing terms that primarily supplies a third party at its plant and is valued in this table at a price calculated using December 31, 2014 prices. Any excess purchased volumes may be sold at comparable market prices. In addition, we have not included certain natural gas life-of-lease contracts for which the future volumes are indeterminable. We have not included commitments, beyond purchase orders, for the acquisition or construction of property, plant, and equipment or expected contributions to our jointly owned investments (See Company Outlook - Expansion Projects). |
(2) | Does not include estimated contributions to our pension and other postretirement benefit plans. We made contributions to our pension and other postretirement benefit plans of $69 million in 2014 and $100 million in 2013 . In 2015 , we expect to contribute approximately $69 million to these plans (see Note 9 – Employee Benefit Plans of Notes to Consolidated Financial Statements). Tax-qualified pension plans are required to meet minimum contribution requirements. In the past, we have contributed amounts to our tax-qualified pension plans in excess of the minimum required contribution. These excess amounts can be used to offset future minimum contribution requirements. During 2014 , we contributed $60 million to our tax-qualified pension plans. In addition to these contributions, a portion of the excess contributions was used to meet the minimum contribution requirements. During 2015 , we expect to contribute approximately $60 million to our tax-qualified pension plans and use excess amounts to satisfy minimum contribution requirements, if needed. Additionally, estimated future minimum funding requirements may vary significantly from historical requirements if actual results differ significantly from estimated results for assumptions such as returns on plan assets, interest rates, retirement rates, mortality, and other significant assumptions or by changes to current legislation and regulations. |
(3) | We have not included income tax liabilities in the table above. See Note 7 – Provision (Benefit) for Income Taxes of Notes to Consolidated Financial Statements for a discussion of income taxes, including our contingent tax liability reserves. |
Effects of Inflation
Our operations have historically not been materially affected by inflation. Approximately 35 percent of our gross property, plant, and equipment is comprised of our interstate natural gas pipeline assets. They are subject to regulation, which limits recovery to historical cost. While amounts in excess of historical cost are not recoverable under current FERC practices, we anticipate being allowed to recover and earn a return based on increased actual cost incurred to replace existing assets. Cost-based regulations, along with competition and other market factors, may limit our ability
77
to recover such increased costs. For our gathering and processing assets, operating costs are influenced to a greater extent by both competition for specialized services and specific price changes in crude oil and natural gas and related commodities than by changes in general inflation. Crude oil, natural gas, and NGL prices are particularly sensitive to the Organization of the Petroleum Exporting Countries (OPEC) production levels and/or the market perceptions concerning the supply and demand balance in the near future, as well as general economic conditions. However, our exposure to certain of these price changes is reduced through the fee-based nature of certain of our services and the use of hedging instruments.
Environmental
We are a participant in certain environmental activities in various stages including assessment studies, cleanup operations and/or remedial processes at certain sites, some of which we currently do not own (see Note 18 – Contingent Liabilities and Commitments of Notes to Consolidated Financial Statements). We are monitoring these sites in a coordinated effort with other potentially responsible parties, the EPA, or other governmental authorities. We are jointly and severally liable along with unrelated third parties in some of these activities and solely responsible in others. Current estimates of the most likely costs of such activities are approximately $44 million , all of which are included in A ccrued liabilities and Other noncurrent liabilities on the Consolidated Balance Sheet at December 31, 2014 . We will seek recovery of approximately $11 million of these accrued costs through future natural gas transmission rates. The remainder of these costs will be funded from operations. During 2014 , we paid approximately $11 million for cleanup and/or remediation and monitoring activities. We expect to pay approximately $11 million in 2015 for these activities. Estimates of the most likely costs of cleanup are generally based on completed assessment studies, preliminary results of studies or our experience with other similar cleanup operations. At December 31, 2014 , certain assessment studies were still in process for which the ultimate outcome may yield different estimates of most likely costs. Therefore, the actual costs incurred will depend on the final amount, type, and extent of contamination discovered at these sites, the final cleanup standards mandated by the EPA or other governmental authorities, and other factors.
In March 2008, the EPA promulgated a new, lower National Ambient Air Quality Standard (NAAQS) for ground-level ozone. However, in September 2009, the EPA announced it would reconsider the 2008 NAAQS for ground level ozone to ensure that the standards were clearly grounded in science and were protective of both public health and the environment. As a result, the EPA delayed designation of new eight-hour ozone nonattainment areas under the 2008 standards until the reconsideration is complete. In January 2010, the EPA proposed to further reduce the ground-level ozone NAAQS from the March 2008 levels. In September 2011, the EPA announced that it was proceeding with required actions to implement the 2008 ozone standard and area designations. In May 2012, the EPA completed designation of new eight-hour ozone nonattainment areas. Several Transco facilities are located in 2008 ozone nonattainment areas; however, each facility has been previously subjected to federal and/or state emission control requirements implemented to address the preceding ozone standards. To date, no new federal or state actions have been proposed to mandate additional emission controls at these facilities. At this time, it is unknown whether future federal or state regulatory actions associated with implementation of the 2008 ozone standard will impact our operations and increase the cost of additions to Property, plant, and equipment – net on the Consolidated Balance Sheet. Until any additional federal or state regulatory actions are proposed, we are unable to estimate the cost of additions that may be required to meet this new regulation. Additionally, several nonattainment areas exist in or near areas where we have operating assets. States are required to develop implementation plans to bring these areas into compliance. Implementing regulations are expected to result in impacts to our operations and increase the cost of additions to Property, plant, and equipment – net on the Consolidated Balance Sheet for both new and existing facilities in affected areas.
In June 2010, the EPA promulgated a final rule establishing a new one-hour sulfur dioxide (SO 2 ) NAAQS. The effective date of the new SO 2 standard was August 23, 2010. The EPA has not adopted final modeling guidance. We are unable at this time to estimate the cost of additions that may be required to meet this new regulation.
On January 22, 2010, the EPA set a new one-hour nitrogen dioxide (NO 2 ) NAAQS. The effective date of the new NO 2 standard was April 12, 2010. This standard is subject to challenge in federal court. On January 20, 2012, the EPA determined pursuant to available information that no area in the country is violating the 2010 NO 2 NAAQS and thus designated all areas of the country as "unclassifiable/attainment." Also, at that time the EPA noted its plan to deploy an expanded NO 2 monitoring network beginning in 2013. However on October 5, 2012, the EPA proposed a graduated implementation of the monitoring network between January 1, 2014 and January 1, 2017. Once three years of data is
78
collected from the new monitoring network, the EPA will reassess attainment status with the one-hour NO 2 NAAQS. Until that time, the EPA or states may require ambient air quality modeling on a case by case basis to demonstrate compliance with the NO 2 standard. Because we are unable to predict the outcome of the EPA's or states' future assessment using the new monitoring network, we are unable to estimate the cost of additions that may be required to meet this regulation.
Our interstate natural gas pipelines consider prudently incurred environmental assessment and remediation costs and the costs associated with compliance with environmental standards to be recoverable through rates.
79
Item 7A. Quantitative and Qualitative Disclosures About Market Risk
Interest Rate Risk
Our current interest rate risk exposure is related primarily to our debt portfolio. Our debt portfolio is primarily comprised of fixed rate debt, which mitigates the impact of fluctuations in interest rates. Any borrowings under the credit facilities and any issuances under WPZ's commercial paper program could be at a variable interest rate and could expose us to the risk of increasing interest rates. The maturity of our long-term debt portfolio is partially influenced by the expected lives of our operating assets. (See Note 14 – Debt, Banking Arrangements, and Leases of Notes to Consolidated Financial Statements.)
The tables below provide information by maturity date about our interest rate risk-sensitive instruments as of December 31, 2014 and 2013 . Long-term debt in the tables represents principal cash flows, net of (discount) premium, and weighted-average interest rates by expected maturity dates. The fair value of our publicly traded long-term debt is valued using indicative year-end traded bond market prices. Private debt is valued based on market rates and the prices of similar securities with similar terms and credit ratings.
|
| 2015 |
| 2016 |
| 2017 |
| 2018 |
| 2019 |
| Thereafter (1) |
| Total |
| Fair Value December 31, 2014 | ||||||||
| (Millions) | |||||||||||||||||||||||
Long-term debt, including current portion: (2) |
|
|
|
|
|
|
|
|
|
|
|
|
|
|
|
| ||||||||
Fixed rate | $ | 750 | (*) | $ | 375 | | $ | 785 | | $ | 500 | | $ | 32 | | $ | 17,435 | | $ | 19,877 | | $ | 20,121 | |
Interest rate |
| 5.2 | % |
| 5.3 | % |
| 5.2 | % |
| 5.2 | % |
| 5.1 | % |
| 5.4 | % |
|
|
|
| ||
Variable rate | $ | - | | $ | - | | $ | - | | $ | 1,010 | | $ | - | | $ | - | | $ | 1,010 | | $ | 1,010 | |
Interest rate (3) |
|
|
|
|
|
|
|
|
|
|
|
|
|
|
|
| ||||||||
Commercial paper: |
|
|
|
|
|
|
|
|
|
|
|
|
|
|
|
| ||||||||
Variable rate | $ | 798 | | $ | - | | $ | - | | $ | - | | $ | - | | $ | - | | $ | 798 | | $ | 798 | |
Interest rate (4) |
|
|
|
|
|
|
|
|
|
|
|
|
|
|
|
| ||||||||
____________ |
|
|
|
|
|
|
|
|
|
|
|
|
|
|
|
| ||||||||
(*) Presented as long-term debt at December 31, 2014 due to the merged partnership's intent and ability to refinance. | ||||||||||||||||||||||||
|
|
|
|
|
|
|
|
|
|
|
|
|
|
|
|
| ||||||||
|
| 2014 |
| 2015 |
| 2016 |
| 2017 |
| 2018 |
| Thereafter (1) |
| Total |
| Fair Value December 31, 2013 | ||||||||
| (Millions) | |||||||||||||||||||||||
Long-term debt, including current portion: (2) |
|
|
|
|
|
|
|
|
|
|
|
|
|
|
|
| ||||||||
Fixed rate | $ | - | | $ | 750 | | $ | 375 | | $ | 785 | | $ | 500 | | $ | 8,943 | | $ | 11,353 | | $ | 11,971 | |
Interest rate |
| 5.5 | % |
| 5.6 | % |
| 5.6 | % |
| 5.5 | % |
| 5.4 | % |
| 6.0 | % |
|
|
|
| ||
Commercial paper: |
|
|
|
|
|
|
|
|
|
|
|
|
|
|
|
| ||||||||
Variable rate | $ | 225 | | $ | - | | $ | - | | $ | - | | $ | - | | $ | - | | $ | 225 | | $ | 225 | |
Interest rate (4) |
|
|
|
|
|
|
|
|
|
|
|
|
|
|
|
| ||||||||
__________________
(1) | Includes unamortized discount and premium. |
(2) | Excludes capital leases. |
(3) | The weighted average interest rates for ACMP's $640 million and our $370 million credit facility borrowings at December 31, 2014 were 2.42 percent and 1.67 percent, respectively. |
(4) The weighted average interest rate was 0.92 percent and 0.42 percent at December 31, 2014 and 2013, respectively.
80
Commodity Price Risk
We are exposed to the impact of fluctuations in the market price of NGLs, olefins, and natural gas, as well as other market factors, such as market volatility and energy commodity price correlations. We are exposed to these risks in connection with our owned energy-related assets, our long-term energy-related contracts, and limited proprietary trading activities. Our management of the risks associated with these market fluctuations includes maintaining a conservative capital structure and significant liquidity, as well as using various derivatives and nonderivative energy-related contracts. The fair value of derivative contracts is subject to many factors, including changes in energy commodity market prices, the liquidity and volatility of the markets in which the contracts are transacted, and changes in interest rates. At December 31, 2014 and 2013, our derivative activity was not material. (See Note 17 – Fair Value Measurements, Guarantees, and Concentration of Credit Risk of Notes to Consolidated Financial Statements.)
Foreign Currency Risk
Our foreign operations, whose functional currency is the local currency, are located primarily in Canada. Net assets of our foreign operations were approximately $1.3 billion and $1.1 billion at December 31, 2014 and 2013 , respectively. These investments have the potential to impact our financial position due to fluctuations in these local currencies arising from the process of translating the local functional currency into the U.S. dollar. As an example, a 20 percent change in the respective functional currencies against the U.S. dollar would have changed Total stockholders' equity by approximately $157 million at December 31, 2014 .
81
Item 8. Financial Statements and Supplementary Data
Report of Independent Registered Public Accounting Firm
The Board of Directors and Stockholders of
The Williams Companies, Inc.
We have audited the accompanying consolidated balance sheet of The Williams Companies, Inc. as of December 31, 2014 and 2013, and the related consolidated statements of income, comprehensive income, changes in equity and cash flows for each of the three years in the period ended December 31, 2014. Our audits also included the financial statement schedules listed in the index at Item 15(a). These financial statements and schedules are the responsibility of the Company's management. Our responsibility is to express an opinion on these financial statements and schedules based on our audits. We did not audit the financial statements of Gulfstream Natural Gas System, L.L.C. ("Gulfstream") (a limited liability corporation in which the Company has a 50 percent interest) or, prior to 2014, the consolidated financial statements of Access Midstream Partners, L.P. ("ACMP") (a master limited partnership in which the Company acquired a 50 percent general partner interest and a 23 percent limited partner interest in December 2012 and the remaining 50 percent general partner interest and an additional 27 percent limited partner interest in July 2014). In the consolidated financial statements, the Company's investment in Gulfstream constituted one percent of the Company's assets as of December 31, 2013, and the Company's equity earnings in the net income of Gulfstream constituted six and five percent, respectively, of the Company's income from continuing operations before income taxes for the years ended December 31, 2013 and 2012. In the consolidated financial statements, the Company's investment in ACMP constituted eight percent of the Company's assets as of December 31, 2013, and the Company's equity earnings in the net income of ACMP constituted nine percent of the Company's income from continuing operations before income taxes for the year ended December 31, 2013. For the periods indicated above, Gulfstream's and ACMP's financial statements were audited by other auditors whose reports have been furnished to us, and our opinion, insofar as it relates to the amounts included for Gulfstream for 2013 and 2012 and ACMP for 2013, is based solely on the reports of the other auditors.
We conducted our audits in accordance with the standards of the Public Company Accounting Oversight Board (United States). Those standards require that we plan and perform the audit to obtain reasonable assurance about whether the financial statements are free of material misstatement. An audit includes examining, on a test basis, evidence supporting the amounts and disclosures in the financial statements. An audit also includes assessing the accounting principles used and significant estimates made by management, as well as evaluating the overall financial statement presentation. We believe that our audits and the reports of other auditors provide a reasonable basis for our opinion.
In our opinion, based on our audits and, for 2013 and 2012 for Gulfstream and for 2013 for ACMP, the reports of other auditors, the financial statements referred to above present fairly, in all material respects, the consolidated financial position of The Williams Companies, Inc. at December 31, 2014 and 2013, and the consolidated results of its operations and its cash flows for each of the three years in the period ended December 31, 2014, in conformity with U.S. generally accepted accounting principles. Also, in our opinion, the related financial statement schedules, when considered in relation to the basic financial statements taken as a whole, present fairly in all material respects the information set forth therein.
We also have audited, in accordance with the standards of the Public Company Accounting Oversight Board (United States), The Williams Companies, Inc.'s internal control over financial reporting as of December 31, 2014, based on criteria established in Internal Control-Integrated Framework issued by the Committee of Sponsoring Organizations of the Treadway Commission (2013 framework) and our report dated February 25, 2015 expressed an unqualified opinion thereon.
/s/ Ernst & Young LLP
Tulsa, Oklahoma
February 25, 2015
82
REPORT OF INDEPENDENT REGISTERED PUBLIC ACCOUNTING FIRM
To the Members of Gulfstream Natural Gas System, L.L.C.
We have audited the balance sheet of Gulfstream Natural Gas System, L.L.C., (the "Company") as of December 31, 2013, and the related statements of operations, comprehensive income, members' equity, and cash flows for each of the two years in the period ended December 31, 2013. These financial statements are the responsibility of the Company's management. Our responsibility is to express an opinion on the financial statements based on our audits.
We conducted our audits in accordance with the standards of the Public Company Accounting Oversight Board (United States). Those standards require that we plan and perform the audit to obtain reasonable assurance about whether the financial statements are free of material misstatement. The Company is not required to have, nor were we engaged to perform, an audit of its internal control over financial reporting. Our audits included consideration of internal control over financial reporting as a basis for designing audit procedures that are appropriate in the circumstances, but not for the purpose of expressing an opinion on the effectiveness of the Company's internal control over financial reporting. Accordingly, we express no such opinion. An audit also includes examining, on a test basis, evidence supporting the amounts and disclosures in the financial statements, assessing the accounting principles used and significant estimates made by management, as well as evaluating the overall financial statement presentation. We believe that our audits provide a reasonable basis for our opinion.
In our opinion, such financial statements present fairly, in all material respects, the financial position of Gulfstream Natural Gas System, L.L.C. as of December 31, 2013, and the results of its operations and its cash flows for each of the two years in the period ended December 31, 2013, in conformity with accounting principles generally accepted in the United States of America.
/s/ Deloitte & Touche LLP
Houston, Texas
February 23, 2015
83
REPORT OF INDEPENDENT REGISTERED PUBLIC ACCOUNTING FIRM
To the Board of Directors of Access Midstream Partners GP, L.L.C., as General Partner of Williams Partners, L.P. formerly known as Access Midstream Partners, L.P. and the Unitholders
In our opinion, the accompanying consolidated balance sheet and the related consolidated statement of operations, of changes in partners' capital and of cash flows present fairly, in all material respects, the financial position of Williams Partners L.P. (formerly known as Access Midstream Partners, L.P.) and its subsidiaries (the "Partnership") at December 31, 2013 and the results of their operations and their cash flows the year then ended in conformity with accounting principles generally accepted in the United States of America. These financial statements are the responsibility of the Partnership's management. Our responsibility is to express an opinion on these financial statements based on our audit. We conducted our audit of these statements in accordance with the standards of the Public Company Accounting Oversight Board (United States). Those standards require that we plan and perform the audit to obtain reasonable assurance about whether the financial statements are free of material misstatement. An audit includes examining, on a test basis, evidence supporting the amounts and disclosures in the financial statements, assessing the accounting principles used and significant estimates made by management, and evaluating the overall financial statement presentation. We believe that our audit provides a reasonable basis for our opinion.
/s/ PricewaterhouseCoopers LLP
Tulsa, Oklahoma
February 21, 2014, except for Note 16 to the consolidated financial statements appearing under Item 8 of the Partnership's 2013 Annual Report on Form 10-K/A (not presented herein), as to which the date is March 3, 2014, and except for the effects of the capital structure change described in Note 1, as to which the date is February 25, 2015
84
The Williams Companies, Inc.
Consolidated Statement of Income
|
| Years Ended December 31, | ||||||||||
|
| 2014 |
| 2013 |
| 2012 | ||||||
| (Millions, except per-share amounts) | |||||||||||
Revenues: |
|
|
|
|
|
| ||||||
Service revenues |
| $ | 4,116 | | | $ | 2,939 | |
| $ | 2,729 | |
Product sales |
| 3,521 | | | 3,921 | |
| 4,757 | | |||
Total revenues |
| 7,637 | | | 6,860 | |
| 7,486 | | |||
Costs and expenses: |
| | | |
|
| ||||||
Product costs |
| 3,016 | | | 3,027 | |
| 3,496 | | |||
Operating and maintenance expenses |
| 1,492 | | | 1,097 | |
| 1,027 | | |||
Depreciation and amortization expenses |
| 1,176 | | | 815 | |
| 756 | | |||
Selling, general, and administrative expenses |
| 661 | | | 512 | |
| 571 | | |||
Net insurance recoveries – Geismar Incident |
| (232 | ) |
| (40 | ) |
| - | | |||
Other (income) expense – net |
| (45 | ) | | 74 | |
| 24 | | |||
Total costs and expenses |
| 6,068 | | | 5,485 | |
| 5,874 | | |||
Operating income (loss) |
| 1,569 | | | 1,375 | |
| 1,612 | | |||
Equity earnings (losses) |
| 144 | | | 134 | |
| 111 | | |||
Gain on remeasurement of equity-method investment |
| 2,544 | |
| - | |
| - | | |||
Other investing income (loss) – net |
| 43 | |
| 81 | |
| 77 | | |||
Interest incurred | | (888 | ) | | (611 | ) |
| (568 | ) | |||
Interest capitalized | | 141 | | | 101 | |
| 59 | | |||
Other income (expense) – net |
| 31 | | | - | |
| (2 | ) | |||
Income (loss) from continuing operations before income taxes |
| 3,584 | | | 1,080 | |
| 1,289 | | |||
Provision (benefit) for income taxes |
| 1,249 | | | 401 | |
| 360 | | |||
Income (loss) from continuing operations |
| 2,335 | | | 679 | |
| 929 | | |||
Income (loss) from discontinued operations |
| 4 | | | (11 | ) |
| 136 | | |||
Net income (loss) |
| 2,339 | | | 668 | |
| 1,065 | | |||
Less: Net income attributable to noncontrolling interests |
| 225 | | | 238 | |
| 206 | | |||
Net income (loss) attributable to The Williams Companies, Inc. |
| $ | 2,114 | | | $ | 430 | |
| $ | 859 | |
Amounts attributable to The Williams Companies, Inc.: |
|
|
|
|
|
| ||||||
Income (loss) from continuing operations |
| $ | 2,110 | |
| $ | 441 | |
| $ | 723 | |
Income (loss) from discontinued operations |
| 4 | |
| (11 | ) |
| 136 | | |||
Net income (loss) |
| $ | 2,114 | |
| $ | 430 | |
| $ | 859 | |
Basic earnings (loss) per common share: |
|
|
|
|
|
| ||||||
Income (loss) from continuing operations |
| $ | 2.93 | |
| $ | .65 | |
| $ | 1.17 | |
Income (loss) from discontinued operations |
| .01 | |
| (.02 | ) |
| .22 | | |||
Net income (loss) |
| $ | 2.94 | |
| $ | .63 | |
| $ | 1.39 | |
Weighted-average shares (thousands) |
| 719,325 | |
| 682,948 | |
| 619,792 | | |||
Diluted earnings (loss) per common share: |
|
|
|
|
|
| ||||||
Income (loss) from continuing operations |
| $ | 2.91 | |
| $ | .64 | |
| $ | 1.15 | |
Income (loss) from discontinued operations |
| .01 | |
| (.02 | ) |
| .22 | | |||
Net income (loss) |
| $ | 2.92 | |
| $ | .62 | |
| $ | 1.37 | |
Weighted-average shares (thousands) |
| 723,641 | |
| 687,185 | |
| 625,486 | | |||
See accompanying notes.
85
The Williams Companies, Inc.
Consolidated Statement of Comprehensive Income
|
| Years Ended December 31, | ||||||||||
|
| 2014 |
| 2013 |
| 2012 | ||||||
|
| (Millions) | ||||||||||
Net income (loss) |
| $ | 2,339 | |
| $ | 668 | |
| $ | 1,065 | |
Other comprehensive income (loss): |
|
|
|
|
|
| ||||||
Cash flow hedging activities: |
|
|
|
|
|
| ||||||
Net unrealized gain (loss) from derivative instruments, net of taxes of ($7) in 2012 |
| - | |
| 1 | |
| 22 | | |||
Reclassifications into earnings of net derivative instruments (gain) loss, net of taxes of $7 in 2012 |
| - | |
| (1 | ) |
| (23 | ) | |||
Foreign currency translation adjustments, net of taxes of $18 and $24 in 2014 and 2013, respectively |
| (96 | ) |
| (41 | ) |
| 22 | | |||
Pension and other postretirement benefits: |
|
|
|
|
|
| ||||||
Prior service credit arising during the year, net of taxes of ($9) and ($1) in 2013 and 2012, respectively (Note 9) |
| (1 | ) |
| 14 | |
| 1 | | |||
Amortization of prior service cost (credit) included in net periodic benefit cost, net of taxes of $3 in 2014 and $1 in 2013 and 2012 |
| (5 | ) |
| (2 | ) |
| (1 | ) | |||
Net actuarial gain (loss) arising during the year, net of taxes of $60, ($111), and $19 in 2014, 2013, and 2012, respectively (Note 9) |
| (100 | ) |
| 189 | |
| (30 | ) | |||
Amortization of actuarial (gain) loss included in net periodic benefit cost, net of taxes of ($15), ($23) and ($22) in 2014, 2013 and 2012, respectively |
| 26 | |
| 38 | |
| 39 | | |||
Equity securities: |
|
|
|
|
|
| ||||||
Reclassifications into earnings of (gain) loss on sale of equity securities, net of taxes of $2 in 2012 |
| - | |
| - | |
| (3 | ) | |||
Other comprehensive income (loss) |
| (176 | ) |
| 198 | |
| 27 | | |||
Comprehensive income (loss) |
| 2,163 | |
| 866 | |
| 1,092 | | |||
Less: Comprehensive income (loss) attributable to noncontrolling interests |
| 206 | |
| 238 | |
| 206 | | |||
Comprehensive income (loss) attributable to The Williams Companies, Inc. |
| $ | 1,957 | |
| $ | 628 | |
| $ | 886 | |
See accompanying notes.
86
The Williams Companies, Inc.
Consolidated Balance Sheet
|
| December 31, | ||||||
|
| 2014 |
| 2013 | ||||
|
| (Millions, except per-share amounts) | ||||||
ASSETS |
|
|
|
| ||||
Current assets: |
|
|
|
| ||||
Cash and cash equivalents |
| $ | 240 | |
| $ | 681 | |
Accounts and notes receivable – net: |
|
|
|
| ||||
Trade and other |
| 972 | |
| 600 | | ||
Income tax receivable |
| 167 | |
| 74 | | ||
Deferred income tax asset |
| 67 | |
| 27 | | ||
Inventories |
| 231 | |
| 194 | | ||
Other current assets and deferred charges |
| 213 | |
| 107 | | ||
Total current assets |
| 1,890 | |
| 1,683 | | ||
|
|
|
|
| ||||
Investments |
| 8,400 | |
| 4,360 | | ||
Property, plant, and equipment – net |
| 28,081 | |
| 18,210 | | ||
Goodwill |
| 1,120 | |
| 646 | | ||
Other intangible assets – net of accumulated amortization |
| 10,453 | |
| 1,644 | | ||
Regulatory assets, deferred charges, and other |
| 619 | |
| 599 | | ||
Total assets |
| $ | 50,563 | |
| $ | 27,142 | |
|
|
|
|
| ||||
LIABILITIES AND EQUITY |
|
|
|
| ||||
Current liabilities: |
|
|
|
| ||||
Accounts payable |
| $ | 865 | |
| $ | 960 | |
Accrued liabilities |
| 900 | |
| 797 | | ||
Commercial paper |
| 798 | |
| 225 | | ||
Long-term debt due within one year |
| 4 | |
| 1 | | ||
Total current liabilities |
| 2,567 | |
| 1,983 | | ||
|
|
|
|
| ||||
Long-term debt |
| 20,888 | |
| 11,353 | | ||
Deferred income taxes |
| 4,712 | |
| 3,529 | | ||
Other noncurrent liabilities |
| 2,224 | |
| 1,356 | | ||
Contingent liabilities and commitments (Note 18) |
| |
| | ||||
|
|
|
|
| ||||
Equity: |
|
|
|
| ||||
Stockholders' equity: |
|
|
|
| ||||
Common stock (960 million shares authorized at $1 par value; 782 million shares issued at December 31, 2014 and 718 million shares issued at December 31, 2013) |
| 782 | |
| 718 | | ||
Capital in excess of par value |
| 14,925 | |
| 11,599 | | ||
Retained deficit |
| (5,548 | ) |
| (6,248 | ) | ||
Accumulated other comprehensive income (loss) |
| (341 | ) |
| (164 | ) | ||
Treasury stock, at cost (35 million shares of common stock) |
| (1,041 | ) |
| (1,041 | ) | ||
Total stockholders' equity |
| 8,777 | |
| 4,864 | | ||
Noncontrolling interests in consolidated subsidiaries |
| 11,395 | |
| 4,057 | | ||
Total equity |
| 20,172 | |
| 8,921 | | ||
Total liabilities and equity |
| $ | 50,563 | |
| $ | 27,142 | |
See accompanying notes.
87
The Williams Companies, Inc.
Consolidated Statement of Changes in Equity
| The Williams Companies, Inc., Stockholders |
|
|
|
| ||||||||||||||||||||||||||
| Common Stock |
| Capital in Excess of Par Value |
| Retained Deficit |
| Accumulated Other Comprehensive Income (Loss) |
| Treasury Stock |
| Total Stockholders' Equity |
| Noncontrolling Interests |
| Total | ||||||||||||||||
| (Millions) | ||||||||||||||||||||||||||||||
Balance – December 31, 2011 | $ | 626 | |
| $ | 7,920 | |
| $ | (5,820 | ) |
| $ | (389 | ) |
| $ | (1,041 | ) |
| $ | 1,296 | |
| $ | 1,290 | |
| $ | 2,586 | |
Net income (loss) | - | |
| - | |
| 859 | |
| - | |
| - | |
| 859 | |
| 206 | |
| 1,065 | | ||||||||
Other comprehensive income (loss) | - | |
| - | |
| - | |
| 27 | |
| - | |
| 27 | |
| - | |
| 27 | | ||||||||
Cash dividends – common stock (Note 15) | - | |
| - | |
| (742 | ) |
| - | |
| - | |
| (742 | ) |
| - | |
| (742 | ) | ||||||||
Dividends and distributions to noncontrolling interests | - | |
| - | |
| - | |
| - | |
| - | |
| - | |
| (387 | ) |
| (387 | ) | ||||||||
Issuance of common stock from debentures conversion | 1 | |
| 5 | |
| - | |
| - | |
| - | |
| 6 | |
| - | |
| 6 | | ||||||||
Stock-based compensation and related common stock issuances, net of tax | 6 | |
| 98 | |
| - | |
| - | |
| - | |
| 104 | |
| - | |
| 104 | | ||||||||
Sales of limited partner units of Williams Partners L.P. | - | |
| - | |
| - | |
| - | |
| - | |
| - | |
| 1,559 | |
| 1,559 | | ||||||||
Issuances of limited partner units of Williams Partners L.P. related to acquisitions | - | |
| - | |
| - | |
| - | |
| - | |
| - | |
| 1,044 | |
| 1,044 | | ||||||||
Changes in Williams Partners L.P. ownership interest, net | - | |
| 699 | |
| - | |
| - | |
| - | |
| 699 | |
| (1,115 | ) |
| (416 | ) | ||||||||
Sales of common stock | 83 | |
| 2,412 | |
| - | |
| - | |
| - | |
| 2,495 | |
| - | |
| 2,495 | | ||||||||
Reconsolidation of noncontrolling interest in Wilpro entities (Note 4) | - | |
| - | |
| - | |
| - | |
| - | |
| - | |
| 65 | |
| 65 | | ||||||||
Contributions from noncontrolling interest | - | |
| - | |
| - | |
| - | |
| - | |
| - | |
| 14 | |
| 14 | | ||||||||
Other | - | |
| - | |
| 8 | |
| - | |
| - | |
| 8 | |
| (1 | ) |
| 7 | | ||||||||
Net increase (decrease) in equity | 90 | |
| 3,214 | |
| 125 | |
| 27 | |
| - | |
| 3,456 | |
| 1,385 | |
| 4,841 | | ||||||||
Balance – December 31, 2012 | 716 | |
| 11,134 | |
| (5,695 | ) |
| (362 | ) |
| (1,041 | ) |
| 4,752 | |
| 2,675 | |
| 7,427 | | ||||||||
Net income (loss) | - | |
| - | |
| 430 | |
| - | |
| - | |
| 430 | |
| 238 | |
| 668 | | ||||||||
Other comprehensive income (loss) | - | |
| - | |
| - | |
| 198 | |
| - | |
| 198 | |
| - | |
| 198 | | ||||||||
Cash dividends – common stock (Note 15) | - | |
| - | |
| (982 | ) |
| - | |
| - | |
| (982 | ) |
| - | |
| (982 | ) | ||||||||
Dividends and distributions to noncontrolling interests | - | |
| - | |
| - | |
| - | |
| - | |
| - | |
| (489 | ) |
| (489 | ) | ||||||||
Issuance of common stock from debentures conversion | - | |
| 1 | |
| - | |
| - | |
| - | |
| 1 | |
| - | |
| 1 | | ||||||||
Stock-based compensation and related common stock issuances, net of tax | 2 | |
| 54 | |
| - | |
| - | |
| - | |
| 56 | |
| - | |
| 56 | | ||||||||
Sales of limited partner units of Williams Partners L.P. | - | |
| - | |
| - | |
| - | |
| - | |
| - | |
| 1,819 | |
| 1,819 | | ||||||||
Changes in ownership of consolidated subsidiaries, net | - | |
| 409 | |
| - | |
| - | |
| - | |
| 409 | |
| (652 | ) |
| (243 | ) | ||||||||
Contributions from noncontrolling interests | - | |
| - | |
| - | |
| - | |
| - | |
| - | |
| 467 | |
| 467 | | ||||||||
Other | - | |
| 1 | |
| (1 | ) |
| - | |
| - | |
| - | |
| (1 | ) |
| (1 | ) | ||||||||
Net increase (decrease) in equity | 2 | |
| 465 | |
| (553 | ) |
| 198 | |
| - | |
| 112 | |
| 1,382 | |
| 1,494 | | ||||||||
Balance – December 31, 2013 | 718 | |
| 11,599 | |
| (6,248 | ) |
| (164 | ) |
| (1,041 | ) |
| 4,864 | |
| 4,057 | |
| 8,921 | | ||||||||
Net income (loss) | - | |
| - | |
| 2,114 | |
| - | |
| - | |
| 2,114 | |
| 225 | |
| 2,339 | | ||||||||
Other comprehensive income (loss) | - | |
| - | |
| - | |
| (157 | ) |
| - | |
| (157 | ) |
| (19 | ) |
| (176 | ) | ||||||||
Issuance of common stock for acquisition of business (Note 15) | 61 | |
| 3,317 | |
| - | |
| - | |
| - | |
| 3,378 | |
| - | |
| 3,378 | | ||||||||
Noncontrolling interest resulting from acquisition of business (Note 2) | - | |
| - | |
| - | |
| - | |
| - | |
| - | |
| 7,502 | |
| 7,502 | | ||||||||
Cash dividends – common stock (Note 15) | - | |
| - | |
| (1,412 | ) |
| - | |
| - | |
| (1,412 | ) |
| - | |
| (1,412 | ) | ||||||||
Dividends and distributions to noncontrolling interests | - | |
| - | |
| - | |
| - | |
| - | |
| - | |
| (840 | ) |
| (840 | ) | ||||||||
Stock-based compensation and related common stock issuances, net of tax | 3 | |
| 85 | |
| - | |
| - | |
| - | |
| 88 | |
| - | |
| 88 | | ||||||||
Sales of limited partner units of Williams Partners L.P. | - | |
| - | |
| - | |
| - | |
| - | |
| - | |
| 55 | |
| 55 | | ||||||||
Changes in ownership of consolidated subsidiaries, net | - | |
| (73 | ) |
| - | |
| (20 | ) |
| - | |
| (93 | ) |
| 137 | |
| 44 | | ||||||||
Contributions from noncontrolling interests | - | |
| - | |
| - | |
| - | |
| - | |
| - | |
| 340 | |
| 340 | | ||||||||
Deconsolidation of Bluegrass Pipeline (Note 3) | - | |
| - | |
| - | |
| - | |
| - | |
| - | |
| (63 | ) |
| (63 | ) | ||||||||
Other | - | |
| (3 | ) |
| (2 | ) |
| - | |
| - | |
| (5 | ) |
| 1 | |
| (4 | ) | ||||||||
Net increase (decrease) in equity | 64 | |
| 3,326 | |
| 700 | |
| (177 | ) |
| - | |
| 3,913 | |
| 7,338 | |
| 11,251 | | ||||||||
Balance – December 31, 2014 | $ | 782 | |
| $ | 14,925 | |
| $ | (5,548 | ) |
| $ | (341 | ) |
| $ | (1,041 | ) |
| $ | 8,777 | |
| $ | 11,395 | |
| $ | 20,172 | |
See accompanying notes.
88
The Williams Companies, Inc.
Consolidated Statement of Cash Flows
|
| Years Ended December 31, | ||||||||||
|
| 2014 |
| 2013 |
| 2012 | ||||||
|
| (Millions) | ||||||||||
OPERATING ACTIVITIES: |
|
|
|
|
|
| ||||||
Net income (loss) |
| $ | 2,339 | |
| $ | 668 | |
| $ | 1,065 | |
Adjustments to reconcile to net cash provided (used) by operating activities: |
|
|
|
|
|
| ||||||
Depreciation and amortization |
| 1,176 | |
| 815 | |
| 756 | | |||
Provision (benefit) for deferred income taxes |
| 1,264 | |
| 424 | |
| 206 | | |||
Net (gain) loss on dispositions of assets |
| 56 | |
| 28 | |
| (52 | ) | |||
Gain on reconsolidation of Wilpro entities (Note 4) |
| - | |
| - | |
| (144 | ) | |||
Amortization of stock-based awards |
| 53 | |
| 37 | |
| 36 | | |||
Gain on remeasurement of equity-method investment |
| (2,544 | ) |
| - | |
| - | | |||
Cash provided (used) by changes in current assets and liabilities: |
|
|
|
|
|
| ||||||
Accounts and notes receivable |
| (276 | ) |
| 35 | |
| 27 | | |||
Inventories |
| (36 | ) |
| (17 | ) |
| 5 | | |||
Other current assets and deferred charges |
| (44 | ) |
| 25 | |
| 29 | | |||
Accounts payable |
| (8 | ) |
| (35 | ) |
| (110 | ) | |||
Accrued liabilities |
| (203 | ) |
| 175 | |
| - | | |||
Other, including changes in noncurrent assets and liabilities |
| 338 | |
| 62 | |
| 17 | | |||
Net cash provided (used) by operating activities |
| 2,115 | |
| 2,217 | |
| 1,835 | | |||
FINANCING ACTIVITIES: |
|
|
|
|
|
| ||||||
Proceeds from (payments of) commercial paper – net |
| 572 | |
| 224 | |
| - | | |||
Proceeds from long-term debt |
| 7,321 | |
| 2,699 | |
| 3,486 | | |||
Payments of long-term debt |
| (1,828 | ) |
| (2,081 | ) |
| (1,468 | ) | |||
Proceeds from issuance of common stock |
| 3,416 | |
| 18 | |
| 2,550 | | |||
Proceeds from sale of limited partner units of consolidated partnership |
| 55 | |
| 1,819 | |
| 1,559 | | |||
Dividends paid |
| (1,412 | ) |
| (982 | ) |
| (742 | ) | |||
Dividends and distributions paid to noncontrolling interests |
| (840 | ) |
| (489 | ) |
| (349 | ) | |||
Distributions paid to noncontrolling interests on sale of Wilpro assets (Note 4) |
| - | |
| - | |
| (38 | ) | |||
Contributions from noncontrolling interests |
| 340 | |
| 467 | |
| 13 | | |||
Payments for debt issuance costs |
| (40 | ) |
| (15 | ) |
| (17 | ) | |||
Other – net |
| 17 | |
| 17 | |
| 42 | | |||
Net cash provided (used) by financing activities |
| 7,601 | |
| 1,677 | |
| 5,036 | | |||
INVESTING ACTIVITIES: |
|
|
|
|
|
| ||||||
Capital expenditures (1) |
| (4,031 | ) |
| (3,572 | ) |
| (2,529 | ) | |||
Purchases of and contributions to equity-method investments |
| (482 | ) |
| (455 | ) |
| (2,651 | ) | |||
Purchases of businesses, net of cash acquired |
| (5,958 | ) |
| (6 | ) |
| (2,049 | ) | |||
Proceeds from dispositions of investments |
| - | |
| - | |
| 79 | | |||
Cash of Wilpro entities upon reconsolidation (Note 4) |
| - | |
| - | |
| 121 | | |||
Other – net |
| 314 | |
| (19 | ) |
| 108 | | |||
Net cash provided (used) by investing activities |
| (10,157 | ) |
| (4,052 | ) |
| (6,921 | ) | |||
Increase (decrease) in cash and cash equivalents |
| (441 | ) |
| (158 | ) |
| (50 | ) | |||
Cash and cash equivalents at beginning of year |
| 681 | |
| 839 | |
| 889 | | |||
Cash and cash equivalents at end of year |
| $ | 240 | |
| $ | 681 | |
| $ | 839 | |
_________ |
|
|
|
|
|
| ||||||
(1) Increases to property, plant, and equipment |
| $ | (3,916 | ) |
| $ | (3,653 | ) |
| $ | (2,755 | ) |
Changes in related accounts payable and accrued liabilities |
| (115 | ) |
| 81 | |
| 226 | | |||
Capital expenditures |
| $ | (4,031 | ) |
| $ | (3,572 | ) |
| $ | (2,529 | ) |
See accompanying notes .
89
The Williams Companies, Inc. | ||
Notes to Consolidated Financial Statements | ||
| ||
Note 1 – Description of Business, Basis of Presentation, and Summary of Significant Accounting Policies
Description of Business
We are a Delaware corporation whose common stock is listed and traded on the New York Stock Exchange. Our operations are located principally in the United States and are organized into the Williams Partners, Access Midstream, and Williams NGL & Petchem Services reportable segments. All remaining business activities are included in Other.
On February 2, 2015, we completed the merger of our consolidated master limited partnerships, Williams Partners L.P. (Pre-merger WPZ ) and Access Midstream Partners, L.P. ( ACMP ) (Merger). The merged partnership is named Williams Partners L.P. Under the terms of the merger agreement, each ACMP unitholder received 1.06152 ACMP units for each ACMP unit owned immediately prior to the Merger. In conjunction with the Merger, each Pre-merger WPZ common unit held by the public was exchanged for 0.86672 ACMP common units. Each Pre-merger WPZ common unit held by us was exchanged for 0.80036 ACMP common units. Prior to the closing of the merger, the Class D limited partner units of Pre-merger WPZ, all of which were held by us, were converted into WPZ common units on a one -for-one basis pursuant to the terms of the WPZ partnership agreement. Following the Merger, we own an approximate 60 percent of the merged partnership, including the general partner interest and incentive distribution rights. In this report, we refer to the post merger partnership as "WPZ" and the pre-merger entities as "Pre-merger WPZ" and "ACMP."
As of December 31, 2014, our Williams Partners segment consists of our consolidated master limited partnership, Pre-merger WPZ, and includes gas pipeline and domestic midstream businesses. The gas pipeline businesses primarily consist of two interstate natural gas pipelines, which are Transcontinental Gas Pipe Line Company, LLC (Transco) and Northwest Pipeline LLC (Northwest Pipeline), a 50 percent equity-method investment in Gulfstream Natural Gas System, L.L.C. (Gulfstream), and a 41 percent interest in Constitution Pipeline Company, LLC (Constitution) (a consolidated entity). WPZ's midstream operations are composed of significant, large-scale operations in the Rocky Mountain and Gulf Coast regions, operations in the Marcellus Shale region, and various equity-method investments in domestic natural gas gathering and processing assets and natural gas liquid (NGL) fractionation and transportation assets. WPZ's midstream assets also include an NGL fractionator and storage facilities near Conway, Kansas, as well as an NGL light-feed olefins cracker in Geismar, Louisiana, along with associated ethane and propane pipelines, a refinery grade splitter in Louisiana, an oil sands offgas processing plant located near Fort McMurray, Alberta, and an NGL/olefin fractionation facility and butylene/butane splitter facility at Redwater, Alberta.
As of December 31, 2014, our Access Midstream segment consists of our consolidated master limited partnership, ACMP, which provides domestic gathering, treating, and compression services to producers under long-term, fixed-fee contracts in the Marcellus and Utica shale plays, as well as the Eagle Ford, Haynesville, Barnett, Mid-Continent, and Niobrara areas. ACMP also includes a 49 percent equity-method investment in Utica East Ohio Midstream, LLC (UEOM), a 50 percent equity-method investment interest in the Delaware Basin gas gathering system in the Mid-Continent region, and Appalachia Midstream Services, LLC, a wholly owned subsidiary, which owns an approximate average 45 percent interest in 11 gas gathering systems in the Marcellus Shale (Appalachia Midstream Investments). We previously owned an equity-method investment in ACMP until July 1, 2014, at which time we acquired all of the interests in ACMP previously held by Global Infrastructure Partners II (GIP), which included 50 percent of the general partner interest and 55.1 million limited partner units for $5.995 billion in cash (ACMP Acquisition). (See Note 2 – Acquisitions .)
Williams NGL & Petchem Services includes certain other domestic olefins pipeline assets and certain Canadian growth projects under development (including a propane dehydrogenation facility and a liquids extractions plant).
Other includes other business activities that are not operating segments, as well as corporate operations.
90
The Williams Companies, Inc. | ||||
Notes to Consolidated Financial Statements – (Continued) | ||||
| ||||
Basis of Presentation
Canada dropdown
In February 2014, we contributed certain Canadian operations to Pre-merger WPZ (Canada Dropdown) for total consideration of $56 million of cash from Pre-merger WPZ (including a $31 million post-closing adjustment received in the second quarter), 25,577,521 Pre-merger WPZ Class D limited-partner units, and an increase in the capital account of its general partner to allow us to maintain our 2 percent general partner interest. In lieu of cash distributions, the Class D units received quarterly distributions of additional paid-in-kind Class D units. These operations were previously reported within the Williams NGL & Petchem Services segment, but are now reported within Williams Partners. Prior period segment disclosures have been recast for this transaction.
In October 2014, a purchase price adjustment was finalized whereby we paid $56 million in cash to Pre-merger WPZ in the fourth quarter and waived $2 million in payment of incentive distribution rights (IDRs) with respect to the November 2014 distribution.
Consolidated master limited partnerships
During the third quarter of 2014, Pre-merger WPZ issued 1,080,448 common units pursuant to an equity distribution agreement between Pre-merger WPZ and certain banks. Considering this, as well as our contribution of certain Canadian assets discussed above, and Pre-merger WPZ's quarterly distribution of additional paid-in-kind Class D units to us, we own approximately 66 percent of the interests in Pre-merger WPZ, including the interests of the general partner, which are wholly owned by us, and IDRs as of December 31, 2014 .
Following the ACMP Acquisition on July 1, 2014, we owned approximately 50 percent of the limited partner units, including all of the Class B units that pay quarterly distribution of additional paid-in-kind Class B units. During the second half of 2014, we received quarterly distributions of additional paid-in-kind Class B units and own 51 percent of the interests in ACMP, including the interests of the general partner, which are wholly owned by us, and IDRs as of December 31, 2014 .
The previously described equity issuances by Pre-merger WPZ and ACMP had the combined net impact of increasing Noncontrolling interests in consolidated subsidiaries by $137 million , and decreasing Capital in excess of par value by $73 million , Deferred income taxes by $44 million and Accumulated other comprehensive income (loss) by $20 million in the Consolidated Balance Sheet .
Pre-merger WPZ and ACMP are both self-funding and maintain separate lines of bank credit and cash management accounts. Pre-merger WPZ also has a commercial paper program. (See Note 14 – Debt, Banking Arrangements, and Leases .) Cash distributions from Pre-merger WPZ and ACMP to us, including any associated with our IDRs, occur through the normal partnership distributions from Pre-merger WPZ and ACMP to their respective partners.
Discontinued operations
The discontinued operations presented in the accompanying consolidated financial statements and notes primarily reflect gains in 2012 associated with certain of our former Venezuela operations. (See Note 4 – Discontinued Operations .)
Unless indicated otherwise, the information in the Notes to Consolidated Financial Statements relates to our continuing operations.
Related party transaction
A member of our Board of Directors, who was elected in 2013, is also the current chairman, president, and chief executive officer of an energy services company that is a customer of ours. We recorded $115 million and $131 million in Service revenues in the Consolidated Statement of Income from this company for transportation and storage of natural
91
The Williams Companies, Inc. | ||||
Notes to Consolidated Financial Statements – (Continued) | ||||
| ||||
gas for the years ended December 31, 2014 and 2013, respectively. This board member does not have any material interest in any transactions between the energy services company and us and he had no role in any such transactions.
Summary of Significant Accounting Policies
Principles of consolidation
The consolidated financial statements include the accounts of all entities that we control and our proportionate interest in the accounts of certain ventures in which we own an undivided interest. Management's judgment is required to evaluate whether we control an entity. Key areas of that evaluation include:
• | Determining whether an entity is a variable interest entity (VIE); |
• | Determining whether we are the primary beneficiary of a VIE, including evaluating which activities of the VIE most significantly impact its economic performance and the degree of power that we and our related parties have over those activities through our variable interests; |
• | Identifying events that require reconsideration of whether an entity is a VIE and continuously evaluating whether we are a VIE's primary beneficiary; |
• | Evaluating whether other owners in entities that are not VIEs are able to effectively participate in significant decisions that would be expected to be made in the ordinary course of business such that we do not have the power to control such entities. |
We apply the equity method of accounting to investments in entities over which we exercise significant influence but do not control.
Equity-method investment basis differences
Differences between the cost of our equity-method investments and our underlying equity in the net assets of investees are accounted for as if the investees were consolidated subsidiaries. Equity earnings (losses) in the Consolidated Statement of Income includes our allocable share of net income (loss) of investees adjusted for any depreciation and amortization, as applicable, associated with basis differences.
Use of estimates
The preparation of financial statements in conformity with accounting principles generally accepted in the United States requires management to make estimates and assumptions that affect the amounts reported in the consolidated financial statements and accompanying notes. Actual results could differ from those estimates.
Significant estimates and assumptions include:
• | Impairment assessments of investments, property, plant, and equipment, goodwill, and other identifiable intangible assets; |
• | Litigation-related contingencies; |
• | Environmental remediation obligations; |
• | Realization of deferred income tax assets; |
• | Depreciation and/or amortization of equity-method investment basis differences; |
• | Asset retirement obligations; |
92
The Williams Companies, Inc. | ||||
Notes to Consolidated Financial Statements – (Continued) | ||||
| ||||
• | Pension and postretirement valuation variables; |
• | Acquisition related purchase price allocations. |
These estimates are discussed further throughout these notes.
Regulatory accounting
Transco and Northwest Pipeline are regulated by the Federal Energy Regulatory Commission (FERC). Their rates, which are established by the FERC, are designed to recover the costs of providing the regulated services, and their competitive environment makes it probable that such rates can be charged and collected. Therefore, our management has determined that it is appropriate to account for and report regulatory assets and liabilities related to these operations consistent with the economic effect of the way in which their rates are established. Accounting for these operations that are regulated can differ from the accounting requirements for nonregulated operations. The components of our regulatory assets and liabilities relate to the effects of deferred taxes on equity funds used during construction, asset retirement obligations, fuel cost differentials, levelized incremental depreciation, negative salvage, and postretirement benefits. Our current and noncurrent regulatory asset and liability balances for the years ended December 31, 2014 and 2013 are as follows:
| December 31, | ||||||
| 2014 |
| 2013 | ||||
| (Millions) | ||||||
Current assets reported within Other current assets and deferred charges | $ | 81 | |
| $ | 39 | |
Noncurrent assets reported within Regulatory assets, deferred charges, and other | 337 | |
| 353 | | ||
Total regulated assets | $ | 418 | |
| $ | 392 | |
|
|
|
| ||||
Current liabilities reported within Accrued liabilities | $ | 11 | |
| $ | 19 | |
Noncurrent liabilities reported within Other noncurrent liabilities | 375 | |
| 329 | | ||
Total regulated liabilities | $ | 386 | |
| $ | 348 | |
Cash and cash equivalents
Cash and cash equivalents in the Consolidated Balance Sheet includes amounts primarily invested in funds with high-quality, short-term securities and instruments that are issued or guaranteed by the U.S. government. These have maturity dates of three months or less when acquired.
Accounts receivable
Accounts receivable are carried on a gross basis, with no discounting, less an allowance for doubtful accounts. We estimate the allowance for doubtful accounts based on existing economic conditions, the financial condition of our customers, and the amount and age of past due accounts. We consider receivables past due if full payment is not received by the contractual due date. Interest income related to past due accounts receivable is generally recognized at the time full payment is received or collectability is assured. Past due accounts are generally written off against the allowance for doubtful accounts only after all collection attempts have been exhausted.
Inventory valuation
All Inventories in the Consolidated Balance Sheet are stated at the lower of cost or market. The cost of inventories is primarily determined using the average-cost method.
93
The Williams Companies, Inc. | ||||
Notes to Consolidated Financial Statements – (Continued) | ||||
| ||||
Property, plant, and equipment
Property, plant, and equipment is recorded at cost. We base the carrying value of these assets on estimates, assumptions, and judgments relative to capitalized costs, useful lives, and salvage values.
As regulated entities, Northwest Pipeline and Transco provide for depreciation using the straight-line method at FERC-prescribed rates. Depreciation for nonregulated entities is provided primarily on the straight-line method over estimated useful lives, except for certain offshore facilities that apply an accelerated depreciation method. (See Note 11 – Property, Plant, and Equipment .)
Gains or losses from the ordinary sale or retirement of property, plant, and equipment for regulated pipelines are credited or charged to accumulated depreciation. Other gains or losses are recorded in Other (income) expense – net included in Operating income (loss) in the Consolidated Statement of Income .
Ordinary maintenance and repair costs are generally expensed as incurred. Costs of major renewals and replacements are capitalized as property, plant, and equipment.
We record a liability and increase the basis in the underlying asset for the present value of each expected future asset retirement obligation (ARO) at the time the liability is initially incurred, typically when the asset is acquired or constructed. As regulated entities, Northwest Pipeline and Transco offset the depreciation of the underlying asset that is attributable to capitalized ARO cost to a regulatory asset. We measure changes in the liability due to passage of time by applying an interest rate to the liability balance. This amount is recognized as an increase in the carrying amount of the liability and as a corresponding accretion expense included in Operating and maintenance expenses in the Consolidated Statement of Income , except for regulated entities, for which the liability is offset by a regulatory asset as management expects to recover amounts in future rates. The regulatory asset is amortized commensurate with our collection of those costs in rates.
Measurements of AROs include, as a component of future expected costs, an estimate of the price that a third party would demand, and could expect to receive, for bearing the uncertainties inherent in the obligations, sometimes referred to as a market-risk premium.
Goodwill
Goodwill in the Consolidated Balance Sheet represents the excess of the consideration plus the fair value of any noncontrolling interest or any previously held equity interest, over the fair value of the net assets acquired. It is not subject to amortization but is evaluated annually as of October 1 for impairment or more frequently if impairment indicators are present that would indicate it is more likely than not that the fair value of the reporting unit is less than its carrying amount. As part of the evaluation, we compare our estimate of the fair value of the reporting unit with its carrying value, including goodwill. If the carrying value of the reporting unit exceeds its fair value, a computation of the implied fair value of the goodwill is compared with its related carrying value. If the carrying value of the reporting unit goodwill exceeds the implied fair value of that goodwill, an impairment loss is recognized in the amount of the excess.
Other intangible assets
Our identifiable intangible assets are primarily related to gas gathering, processing, and fractionation contractual customer relationships. Our intangible assets are amortized on a straight-line basis over the period in which these assets contribute to our cash flows. We evaluate these assets for changes in the expected remaining useful lives and would reflect any changes prospectively through amortization over the revised remaining useful life.
Impairment of property, plant, and equipment, other identifiable intangible assets, and investments
We evaluate our property, plant, and equipment and other identifiable intangible assets for impairment when events or changes in circumstances indicate, in our management's judgment, that the carrying value of such assets may not be recoverable. When an indicator of impairment has occurred, we compare our management's estimate of undiscounted
94
The Williams Companies, Inc. | ||||
Notes to Consolidated Financial Statements – (Continued) | ||||
| ||||
future cash flows attributable to the assets to the carrying value of the assets to determine whether an impairment has occurred and we may apply a probability-weighted approach to consider the likelihood of different cash flow assumptions and possible outcomes including selling in the near term or holding for the remaining estimated useful life. If an impairment of the carrying value has occurred, we determine the amount of the impairment recognized in the financial statements by estimating the fair value of the assets and recording a loss for the amount that the carrying value exceeds the estimated fair value. This evaluation is performed at the lowest level for which separately identifiable cash flows exist.
For assets identified to be disposed of in the future and considered held for sale, we compare the carrying value to the estimated fair value less the cost to sell to determine if recognition of an impairment is required. Until the assets are disposed of, the estimated fair value, which includes estimated cash flows from operations until the assumed date of sale, is recalculated when related events or circumstances change.
We evaluate our investments for impairment when events or changes in circumstances indicate, in our management's judgment, that the carrying value of such investments may have experienced an other-than-temporary decline in value. When evidence of loss in value has occurred, we compare our estimate of fair value of the investment to the carrying value of the investment to determine whether an impairment has occurred. If the estimated fair value is less than the carrying value and we consider the decline in value to be other-than-temporary, the excess of the carrying value over the fair value is recognized in the consolidated financial statements as an impairment charge.
Judgments and assumptions are inherent in our management's estimate of undiscounted future cash flows and an asset's or investment's fair value. Additionally, judgment is used to determine the probability of sale with respect to assets considered for disposal.
Contingent liabilities
We record liabilities for estimated loss contingencies, including environmental matters, when we assess that a loss is probable and the amount of the loss can be reasonably estimated. These liabilities are calculated based upon our assumptions and estimates with respect to the likelihood or amount of loss and upon advice of legal counsel, engineers, or other third parties regarding the probable outcomes of the matters. These calculations are made without consideration of any potential recovery from third parties. We recognize insurance recoveries or reimbursements from others when realizable. Revisions to these liabilities are generally reflected in income when new or different facts or information become known or circumstances change that affect the previous assumptions or estimates.
Cash flows from revolving credit facilities and commercial paper program
Proceeds and payments related to borrowings under our credit facilities are reflected in the financing activities in the Consolidated Statement of Cash Flows on a gross basis. Proceeds and payments related to borrowings under our commercial paper program are reflected in the financing activities in the Consolidated Statement of Cash Flows on a net basis, as the outstanding notes generally have maturity dates less than three months from the date of issuance. (See Note 14 – Debt, Banking Arrangements, and Leases .)
Treasury stock
Treasury stock purchases are accounted for under the cost method whereby the entire cost of the acquired stock is recorded as Treasury stock in the Consolidated Balance Sheet . Gains and losses on the subsequent reissuance of shares are credited or charged to Capital in excess of par value in the Consolidated Balance Sheet using the average-cost method.
Derivative instruments and hedging activities
We may utilize derivatives to manage a portion of our commodity price risk. These instruments consist primarily of swaps, futures, and forward contracts involving short- and long-term purchases and sales of physical energy commodities. We report the fair value of derivatives, except those for which the normal purchases and normal sales exception has been elected, in Other current assets and deferred charges ; Regulatory assets, deferred charges, and
95
The Williams Companies, Inc. | ||||
Notes to Consolidated Financial Statements – (Continued) | ||||
| ||||
other ; Accrued liabilities ; or Other noncurrent liabilities in the Consolidated Balance Sheet . We determine the current and noncurrent classification based on the timing of expected future cash flows of individual trades. We report these amounts on a gross basis. Additionally, we report cash collateral receivables and payables with our counterparties on a gross basis. (See Note 17 – Fair Value Measurements, Guarantees, and Concentration of Credit Risk .)
The accounting for the changes in fair value of a commodity derivative can be summarized as follows:
Derivative Treatment |
| Accounting Method |
Normal purchases and normal sales exception |
| Accrual accounting |
Designated in a qualifying hedging relationship |
| Hedge accounting |
All other derivatives |
| Mark-to-market accounting |
We may elect the normal purchases and normal sales exception for certain short- and long-term purchases and sales of physical energy commodities. Under accrual accounting, any change in the fair value of these derivatives is not reflected on the balance sheet after the initial election of the exception.
We may also designate a hedging relationship for certain commodity derivatives. For a derivative to qualify for designation in a hedging relationship, it must meet specific criteria and we must maintain appropriate documentation. We establish hedging relationships pursuant to our risk management policies. We evaluate the hedging relationships at the inception of the hedge and on an ongoing basis to determine whether the hedging relationship is, and is expected to remain, highly effective in achieving offsetting changes in fair value or cash flows attributable to the underlying risk being hedged. We also regularly assess whether the hedged forecasted transaction is probable of occurring. If a derivative ceases to be or is no longer expected to be highly effective, or if we believe the likelihood of occurrence of the hedged forecasted transaction is no longer probable, hedge accounting is discontinued prospectively, and future changes in the fair value of the derivative are recognized currently in Product sales or Product costs in the Consolidated Statement of Income .
For commodity derivatives designated as a cash flow hedge, the effective portion of the change in fair value of the derivative is reported in Accumulated other comprehensive income (loss) (AOCI) in the Consolidated Balance Sheet and reclassified into earnings in the period in which the hedged item affects earnings. Any ineffective portion of the derivative's change in fair value is recognized currently in Product sales or Product costs in the Consolidated Statement of Income . Gains or losses deferred in AOCI associated with terminated derivatives, derivatives that cease to be highly effective hedges, derivatives for which the forecasted transaction is reasonably possible but no longer probable of occurring, and cash flow hedges that have been otherwise discontinued remain in AOCI until the hedged item affects earnings. If it becomes probable that the forecasted transaction designated as the hedged item in a cash flow hedge will not occur, any gain or loss deferred in AOCI is recognized in Product sales or Product costs in the Consolidated Statement of Income at that time. The change in likelihood of a forecasted transaction is a judgmental decision that includes qualitative assessments made by management.
For commodity derivatives that are not designated in a hedging relationship, and for which we have not elected the normal purchases and normal sales exception, we report changes in fair value currently in Product sales or Product costs in the Consolidated Statement of Income .
Certain gains and losses on derivative instruments included in the Consolidated Statement of Income are netted together to a single net gain or loss, while other gains and losses are reported on a gross basis. Gains and losses recorded on a net basis include unrealized gains and losses on all derivatives that are not designated as hedges and for which we have not elected the normal purchases and normal sales exception.
Realized gains and losses on derivatives that require physical delivery, as well as natural gas derivatives for NGL processing activities and which are not held for trading purposes nor were entered into as a pre-contemplated buy/sell arrangement, are recorded on a gross basis.
96
The Williams Companies, Inc. | ||||
Notes to Consolidated Financial Statements – (Continued) | ||||
| ||||
Revenues
As a result of the ratemaking process, certain revenues collected by us may be subject to refunds upon the issuance of final orders by the FERC in pending rate proceedings. We record estimates of rate refund liabilities considering our and other third-party regulatory proceedings, advice of counsel, and other risks.
Service revenues
Revenues from our gas pipeline businesses include services pursuant to long-term firm transportation and storage agreements. These agreements provide for a reservation charge based on the volume of contracted capacity and a commodity charge based on the volume of gas delivered, both at rates specified in our FERC tariffs. We recognize revenues for reservation charges ratably over the contract period regardless of the volume of natural gas that is transported or stored. Revenues for commodity charges, from both firm and interruptible transportation services, and storage injection and withdrawal services, are recognized when natural gas is delivered at the agreed upon delivery point or when natural gas is injected or withdrawn from the storage facility.
Certain revenues from our midstream operations include those derived from natural gas gathering, processing, treating, and compression services and are performed under volumetric-based fee contracts. These revenues are recorded when services have been performed.
Certain of our gas gathering agreements have minimum volume commitments. If a customer under such an agreement fails to meet its minimum volume commitment for a specified period, generally measured on an annual basis, it is obligated to pay a contractually determined fee based upon the shortfall between actual production volumes and the minimum volume commitment for that period. The revenue associated with minimum volume commitments is recognized in the period that the actual shortfall is determined and is no longer subject to future reduction or offset.
Crude oil gathering and transportation revenues and offshore production handling fees are recognized when the services have been performed. Certain offshore production handling contracts contain fixed payment terms that result in the deferral of revenues until such services have been performed or such capacity has been made available.
Storage revenues from our midstream operations associated with prepaid contracted storage capacity contracts are recognized on a straight-line basis over the life of the contract as services are provided.
Product sales
In the course of providing transportation services to customers of our interstate natural gas pipeline businesses, we may receive different quantities of gas from shippers than the quantities delivered on behalf of those shippers. The resulting imbalances are primarily settled through the purchase and sale of gas with our customers under terms provided for in our FERC tariffs. Revenue is recognized from the sale of gas upon settlement of the transportation and exchange imbalances.
We market NGLs, crude oil, natural gas, and olefins that we purchase from our producer customers as part of the overall service provided to producers. Revenues from marketing NGLs are recognized when the products have been sold and delivered.
Under our keep-whole and percent-of-liquids processing contracts, we retain the rights to all or a portion of the NGLs extracted from the producers' natural gas stream and recognize revenues when the extracted NGLs are sold and delivered.
Our domestic olefins business produces olefins from purchased or produced feedstock and we recognize revenues when the olefins are sold and delivered.
Our Canadian business has processing and fractionation operations where we retain certain NGLs and olefins from an upgrader's offgas stream and we recognize revenues when the fractionated products are sold and delivered.
97
The Williams Companies, Inc. | ||||
Notes to Consolidated Financial Statements – (Continued) | ||||
| ||||
Interest capitalized
We capitalize interest during construction on major projects with construction periods of at least 3 months and a total project cost in excess of $1 million . Interest is capitalized on borrowed funds and where regulation by the FERC exists, on internally generated funds. The latter is included in Other income (expense) – net below Operating income (loss) in the Consolidated Statement of Income . The rates used by regulated companies are calculated in accordance with FERC rules. Rates used by nonregulated companies are based on our average interest rate on debt.
Employee stock-based awards
We recognize compensation expense on employee stock-based awards, net of estimated forfeitures, on a straight-line basis. (See Note 16 – Equity-Based Compensation .)
Pension and other postretirement benefits
The funded status of each of the pension and other postretirement benefit plans is recognized separately in the Consolidated Balance Sheet as either an asset or liability. The funded status is the difference between the fair value of plan assets and the plan's benefit obligation. The plans' benefit obligations and net periodic benefit costs are actuarially determined and impacted by various assumptions and estimates. (See Note 9 – Employee Benefit Plans .)
The discount rates are determined separately for each of our pension and other postretirement benefit plans based on an approach specific to our plans. The year-end discount rates are determined considering a yield curve comprised of high-quality corporate bonds and the timing of the expected benefit cash flows of each plan.
The expected long-term rates of return on plan assets are determined by combining a review of the historical returns within the portfolio, the investment strategy included in the plans' investment policy statement, and capital market projections for the asset classes in which the portfolio is invested, as well as the weighting of each asset class.
Unrecognized actuarial gains and losses and unrecognized prior service costs and credits are deferred and recorded in accumulated other comprehensive income or, for Transco and Northwest Pipeline, as a regulatory asset or liability, until amortized as a component of net periodic benefit cost. Unrecognized actuarial gains and losses in excess of 10 percent of the greater of the benefit obligation or the market-related value of plan assets are amortized over the participants' average remaining future years of service, which is approximately 12 years for our pension plans and approximately 7 years for our other postretirement benefit plans. Unrecognized prior service costs and credits for the other postretirement benefit plans are amortized on a straight line basis over the average remaining years of service to eligibility for eligible plan participants, which is approximately 4 years .
The expected return on plan assets component of net periodic benefit cost is calculated using the market-related value of plan assets. For our pension plans, the market-related value of plan assets is equal to the fair value of plan assets adjusted to reflect the amortization of gains or losses associated with the difference between the expected and actual return on plan assets over a 5 -year period. Additionally, the market-related value of assets may be no more than 110 percent or less than 90 percent of the fair value of plan assets at the beginning of the year. The market-related value of plan assets for our other postretirement benefit plans is equal to the unadjusted fair value of plan assets at the beginning of the year.
Income taxes
We include the operations of our domestic corporate subsidiaries and income from our subsidiary partnerships in our consolidated federal income tax return and also file tax returns in various foreign and state jurisdictions as required. Deferred income taxes are computed using the liability method and are provided on all temporary differences between the financial basis and the tax basis of our assets and liabilities. Our management's judgment and income tax assumptions are used to determine the levels, if any, of valuation allowances associated with deferred tax assets.
98
The Williams Companies, Inc. | ||||
Notes to Consolidated Financial Statements – (Continued) | ||||
| ||||
Earnings (loss) per common share
Basic earnings (loss) per common share in the Consolidated Statement of Income is based on the sum of the weighted-average number of common shares outstanding and vested restricted stock units. Diluted earnings (loss) per common share in the Consolidated Statement of Income includes any dilutive effect of stock options, nonvested restricted stock units, and convertible debt, unless otherwise noted. Beginning in 2012, we have unvested service-based restricted stock units that contain a nonforfeitable right to dividends during the vesting period and are considered participating securities. Basic and diluted earnings (loss) per common share are calculated using the two-class method and the treasury-stock method. Whichever method results in the most dilutive earnings (loss) per common share is reported.
Foreign currency translation
Certain of our foreign subsidiaries use the Canadian dollar as their functional currency. Assets and liabilities of such foreign subsidiaries are translated at the spot rate in effect at the applicable reporting date, and the combined statements of income are translated into the U.S. dollar at the average exchange rates in effect during the applicable period. The resulting cumulative translation adjustment is recorded as a separate component of AOCI.
Transactions denominated in currencies other than the functional currency are recorded based on exchange rates at the time such transactions arise. Subsequent changes in exchange rates when the transactions are settled result in transaction gains and losses which are reflected in the Consolidated Statement of Income .
Accounting standards issued but not yet adopted
In May 2014, the Financial Accounting Standards Board issued Accounting Standards Update 2014-09 establishing Accounting Standards Codification Topic 606, "Revenue from Contracts with Customers" (ASC 606). ASC 606 establishes a comprehensive new revenue recognition model designed to depict the transfer of goods or services to a customer in an amount that reflects the consideration the entity expects to be entitled to receive in exchange for those goods or services and requires significantly enhanced revenue disclosures. The standard is effective for annual reporting periods beginning after December 15, 2016, and interim periods within the reporting period. Accordingly, we will adopt this standard in the first quarter of 2017. ASC 606 allows either full retrospective or modified retrospective transition and early adoption is not permitted. We continue to evaluate both the impact of this new standard on our consolidated financial statements and the transition method we will utilize for adoption.
Note 2 – Acquisitions
ACMP
On December 20, 2012, we purchased approximately 24 percent of ACMP's outstanding limited partnership units and 50 percent of the ACMP general partner 2 percent interest which includes IDRs for approximately $2.19 billion in cash, including transaction costs. We accounted for these acquired interests as equity-method investments.
On July 1, 2014, we acquired an additional 26 percent of ACMP's outstanding limited partnership units and the remaining 50 percent interest in the general partner for $5.995 billion in cash. The acquisition was funded through the issuance of equity (See Note 15 – Stockholders' Equity ) and debt (See Note 14 – Debt, Banking Arrangements, and Leases ), credit facility borrowings, and cash on hand. As of December 31, 2014 , we owned approximately 50 percent of the limited partnership units and 100 percent of the 2 percent general partner interest which includes IDRs. As a result of acquiring these additional interests, we obtained control of and now consolidate ACMP.
ACMP owns, operates, develops, and acquires natural gas gathering systems and other midstream energy assets. The purpose of the acquisition is to enhance our position in the Marcellus and Utica shale plays, provide additional diversity via the Eagle Ford, Haynesville, Barnett, Mid-Continent, and Niobrara areas, and to fortify our stable, fee-based business model and support our dividend growth strategy.
We accounted for the ACMP Acquisition using the business combination method of accounting, which requires, among other things, that identifiable assets acquired and liabilities assumed be recognized at their acquisition date fair
99
The Williams Companies, Inc. | ||||
Notes to Consolidated Financial Statements – (Continued) | ||||
| ||||
values. Prior to the ACMP Acquisition we accounted for our investment in ACMP using the equity method. The acquisition-date fair value of our equity-method investment in ACMP was $4.6 billion . As a result of remeasuring our equity-method investment to fair value, we recognized a $2.5 billion non-cash gain within the Gain on remeasurement of equity-method investment line item in the Consolidated Statement of Income .
The valuation techniques used to measure the acquisition-date fair value of the ACMP Acquisition, including our previous equity-method investment in ACMP, consisted of valuing the limited partner units and general partner interest separately. The limited partner units, consisting of common and Class B units, were valued based on ACMP's closing common unit price at July 1, 2014. The general partner interest, including IDRs, was valued on a noncontrolling basis using an income approach based on a discounted cash flow analysis and a market comparison analysis based on comparable guideline companies and an implied fair value from our purchase.
The following table presents the preliminary allocation of the acquisition-date fair value of the major classes of the assets acquired, which are presented in the Access Midstream segment, liabilities assumed, and noncontrolling interest at July 1, 2014. The allocation is considered preliminary because the valuation work has not been completed due to the ongoing review of the valuation results and validation of significant inputs and assumptions. Significant changes since the allocation disclosed in the third quarter reflect an increase in investments and decreases in goodwill, other intangible assets, and property, plant and equipment - net, generally associated with the attribution of fair value between consolidated and non-consolidated operations. The fair value of accounts receivable acquired equals contractual amounts receivable.
| (Millions) | ||
Accounts receivable | $ | 168 | |
Other current assets | 63 | | |
Investments | 5,872 | | |
Property, plant, and equipment - net | 7,015 | | |
Goodwill | 474 | | |
Other intangible assets | 9,009 | | |
Current liabilities | (408 | ) | |
Debt | (4,052 | ) | |
Other noncurrent liabilities | (9 | ) | |
Noncontrolling interest in ACMP's subsidiaries | (958 | ) | |
Noncontrolling interest in ACMP | (6,544 | ) | |
The goodwill recognized in the acquisition relates primarily to enhancing and diversifying our basin positions and was allocated to the reporting units representing the northeast, central, and west regions within our Access Midstream segment. Substantially all of the goodwill is expected to be deductible for tax purposes.
Other intangible assets recognized in the acquisition are related to contractual customer relationships from gas gathering agreements with our customers. The basis for determining the value of these intangible assets is estimated future net cash flows to be derived from acquired contractual customer relationships discounted using a risk-adjusted discount rate. These intangible assets are being amortized on a straight-line basis over 30 years during which contractual customer relationships are expected to contribute to our cash flows. Approximately 56 percent of the expected future revenues from these contractual customer relationships are impacted by our ability and intent to renew or renegotiate existing customer contracts. We expense costs incurred to renew or extend the terms of our gas gathering, processing, and fractionation contracts with customers. Based on the estimated future revenues during the current contract periods, the weighted-average periods to the next renewal or extension of the existing customer contracts is approximately 17 years .
The non-cash adjustment to record the fair value of the noncontrolling interest in ACMP was determined based on the common units and ACMP's closing common unit price at July 1, 2014.
100
The Williams Companies, Inc. | ||||
Notes to Consolidated Financial Statements – (Continued) | ||||
| ||||
The following unaudited pro forma Revenues and Net income attributable to The Williams Companies, Inc. for the years ended December 31, 2014 and 2013 , are presented as if the ACMP Acquisition had been completed on January 1, 2013. These pro forma amounts are not necessarily indicative of what the actual results would have been if the acquisition had in fact occurred on the date or for the periods indicated, nor do they purport to project Revenues or Net income attributable to The Williams Companies, Inc. for any future periods or as of any date. These amounts do not give effect to any potential cost savings, operating synergies, or revenue enhancements to result from the transactions or the potential costs to achieve these cost savings, operating synergies, and revenue enhancements.
|
| December 31, | ||||||
|
| 2014 |
| 2013 | ||||
|
| (Millions) | ||||||
Revenues |
| $ | 8,181 | |
| $ | 7,906 | |
Net income attributable to The Williams Companies, Inc. |
| $ | 622 | |
| $ | 356 | |
Significant adjustments to pro forma Net income attributable to The Williams Companies, Inc. include the removal of the previously described $2.5 billion gain on remeasurement of equity-method investment, and include additional depreciation and amortization expense associated with reflecting the acquired investments, property, plant, and equipment, and other intangible assets at fair value. The adjustments assume estimated useful lives of 30 years . Other significant adjustments to pro forma Net income attributable to The Williams Companies, Inc. include interest expense related to debt financing associated with the acquisition as well as Net income attributable to noncontrolling interests .
During the year ended December 31, 2014 , ACMP contributed Revenues of $781 million and Net income attributable to The Williams Companies, Inc. of $165 million .
Costs related to this acquisition are $16 million and are reported within our Access Midstream segment and included in Selling, general, and administrative expenses in our Consolidated Statement of Income . Direct transaction costs associated with financing commitments are $9 million and reported within Interest incurred in our Consolidated Statement of Income . Equity earnings (losses) includes $19 million of equity losses associated with certain compensation-related costs at Access Midstream that were triggered by the acquisition.
Laser and Caiman
On February 17, 2012, WPZ completed the acquisition of 100 percent of the ownership interests in certain entities from Delphi Midstream Partners, LLC, in exchange for $325 million in cash, net of cash acquired in the transaction, and 7,531,381 WPZ common units valued at $441 million (Laser Acquisition). The fair value of the common units issued as part of the consideration paid was determined on the basis of the closing market price of WPZ's common units on the acquisition date, adjusted to reflect certain time-based restrictions on resale. The acquired entities primarily own the Laser Gathering System, which is comprised of a natural gas pipeline and associated gathering facilities in the Marcellus Shale in Susquehanna County, Pennsylvania, as well as gathering lines in southern New York.
On April 27, 2012, WPZ completed the acquisition of 100 percent of the ownership interests in Caiman Eastern Midstream, LLC, from Caiman Energy, LLC in exchange for $1.72 billion in cash and 11,779,296 WPZ common units valued at $603 million (Caiman Acquisition). The fair value of the common units issued as part of the consideration paid was determined on the basis of the closing market price of WPZ's common units on the acquisition date, adjusted to reflect certain time-based restrictions on resale. The acquired entity operates a gathering and processing business in northern West Virginia, southwestern Pennsylvania, and eastern Ohio. Acquisition transaction costs of $16 million were incurred during 2012 related to the Caiman Acquisition and are reported in Selling, general, and administrative expenses at Williams Partners in the Consolidated Statement of Income .
101
The Williams Companies, Inc. | ||||
Notes to Consolidated Financial Statements – (Continued) | ||||
| ||||
The following table presents the allocation of the acquisition-date fair value of the major classes of the net assets, which are included in the Williams Partners segment:
| Laser |
| Caiman | ||||
| (Millions) | ||||||
Assets held-for-sale | $ | 18 | |
| $ | - | |
Other current assets | 3 | |
| 16 | | ||
Property, plant, and equipment | 158 | |
| 656 | | ||
Intangible assets | 318 | |
| 1,393 | | ||
Current liabilities | (21 | ) |
| (94 | ) | ||
Noncurrent liabilities | - | |
| (3 | ) | ||
Identifiable net assets acquired | 476 | |
| 1,968 | | ||
Goodwill | 290 | |
| 356 | | ||
| $ | 766 | |
| $ | 2,324 | |
Revenues and earnings related to the Laser and Caiman Acquisitions included within the Consolidated Statement of Income in 2012 are not material.
Note 3 – Variable Interest Entities
Consolidated VIEs
As of December 31, 2014 , we consolidate the following VIEs:
Gulfstar One
WPZ owns a 51 percent interest in Gulfstar One LLC (Gulfstar One), a subsidiary that, due to certain risk-sharing provisions in its customer contracts, is a VIE. WPZ is the primary beneficiary because it has the power to direct the activities that most significantly impact Gulfstar One's economic performance. WPZ, as construction agent for Gulfstar One, designed, constructed, and installed a proprietary floating-production system, Gulfstar FPS™, and associated pipelines which began providing production handling and gathering services for the Tubular Bells oil and gas discovery in the eastern deepwater Gulf of Mexico in the fourth quarter of 2014. WPZ received certain advance payments from the producer customers. In certain circumstances, the producer customers could be responsible for Gulfstar One's unrecovered portion of the firm price of building the facilities if the production handling agreement is terminated. Construction of an expansion project is underway that will provide production handling and gathering services for the Gunflint oil and gas discovery in the eastern deepwater Gulf of Mexico. The expansion project is expected to be in service in the first quarter of 2016. The current estimate of the total remaining construction costs for the expansion project is approximately $150 million , which we expect will be funded with revenues received from customers and capital contributions from WPZ and the other equity partner on a proportional basis.
Constitution
WPZ owns a 41 percent interest in Constitution, a subsidiary that, due to shipper fixed-payment commitments under its long-term firm transportation contracts, is a VIE. WPZ is the primary beneficiary because it has the power to direct the activities that most significantly impact Constitution's economic performance. WPZ, as construction agent for Constitution, is building a pipeline connecting our gathering system in Susquehanna County, Pennsylvania, to the Iroquois Gas Transmission and the Tennessee Gas Pipeline systems. WPZ plans to place the project in service in the second half of 2016 and estimates the total remaining construction costs of the project to be approximately $628 million , which will be funded with capital contributions from WPZ and the other equity partners on a proportional basis.
102
The Williams Companies, Inc. | ||||
Notes to Consolidated Financial Statements – (Continued) | ||||
| ||||
Cardinal
ACMP owns a 66 percent interest in Cardinal Gas Services, L.L.C (Cardinal Venture), a subsidiary that, due to certain risks shared with customers, is a VIE. ACMP is the primary beneficiary because it has the power to direct the activities that most significantly impact Cardinal Venture's economic performance. ACMP, as operator for Cardinal Venture, designed, constructed, and installed associated pipelines which will initially provide production handling and gathering services for the Utica region. ACMP has received certain advance payments from the equity partners during the construction process.
Jackalope
ACMP owns a 50 percent interest in Jackalope Gas Gathering Services, L.L.C (Jackalope Venture), a subsidiary that, due to certain risks shared with customers, is a VIE. ACMP is the primary beneficiary because it has the power to direct the activities that most significantly impact Jackalope Venture's economic performance. ACMP, as operator for Jackalope Venture, designed, constructed, and installed associated pipelines which will initially provide production handling and gathering services for the Niobrara region. ACMP has received certain advance payments from the equity partners during the construction process.
The following table presents amounts included in our Consolidated Balance Sheet that are for the use or obligation of our consolidated VIEs.
| December 31, |
|
| ||||||
| 2014 |
| 2013 (1) |
| Classification | ||||
| (Millions) |
|
| ||||||
Assets (liabilities): |
|
|
|
|
| ||||
Cash and cash equivalents | $ | 113 | |
| $ | 130 | |
| Cash and cash equivalents |
Accounts receivable | 52 | |
| - | |
| Accounts and notes receivable – net - Trade and other | ||
Other current assets | 3 | |
| - | |
| Other current assets and deferred charges | ||
Property, plant, and equipment – net | 2,794 | |
| 1,113 | |
| Property, plant, and equipment – net | ||
Goodwill | 103 | |
| - | |
| Goodwill | ||
Other intangible assets, net | 1,493 | |
| - | |
| Other intangible assets- net of accumulated amortization | ||
Other noncurrent assets | 14 | |
| - | |
| Regulatory assets, deferred charges, and other | ||
Accounts payable | (48 | ) |
| (146 | ) |
| Accounts payable | ||
Accrued liabilities | (36 | ) |
| (3 | ) |
| Accrued liabilities | ||
Current deferred revenue | (45 | ) |
| (10 | ) |
| Accrued liabilities | ||
Noncurrent deferred income taxes | (13 | ) |
| - | |
| Deferred income taxes | ||
Asset retirement obligation | (94 | ) |
| - | |
| Other noncurrent liabilities | ||
Noncurrent deferred revenue associated with customer advance payments | (395 | ) |
| (115 | ) |
| Other noncurrent liabilities | ||
|
(1) | Amounts presented for December 31, 2013, include balances related to Bluegrass Pipeline. See discussion of the subsequent deconsolidation of Bluegrass Pipeline below. |
Nonconsolidated VIEs
Laurel Mountain
In October 2014, Laurel Mountain Midstream, LLC (Laurel Mountain) a previously reported VIE, was restructured removing the customer risk sharing provisions and is no longer considered a VIE as of December 31, 2014. Laurel
103
The Williams Companies, Inc. | ||||
Notes to Consolidated Financial Statements – (Continued) | ||||
| ||||
Mountain continues to be reported as a 69 percent -owned equity-method investment due to the significant participatory rights of our partners such that we do not have control of Laurel Mountain .
Caiman II
During April 2014, Caiman Energy II, LLC (Caiman II) , a previously reported VIE, became able to finance its current activities without additional subordinated financial support due in part to its primary investee, Blue Racer Midstream LLC, securing a revolving credit agreement with a third party. As a result, Caiman II is no longer a VIE but continues to be reported as a 58 percent -owned equity-method investment due to the significant participatory rights of our partners such that we do not have control of Caiman II.
Bluegrass Pipeline
We owned a 50 percent equity-method investment in Bluegrass Pipeline, which was a proposed NGL pipeline that would connect processing facilities in the Marcellus and Utica shale-gas areas in the northeastern United States to growing petrochemical and export markets in the Gulf Coast area of the United States. Bluegrass Pipeline was considered to be a VIE because it had insufficient equity to finance activities during its development stage. From its inception until February 16, 2014, we were the primary beneficiary of this entity because we had the power to direct whether the project moved forward and thus we previously consolidated the Bluegrass Pipeline.
On February 16, 2014, we and our partner executed an amendment to the governing documents that removed our power to direct whether the project moved forward. As a result, we were no longer the primary beneficiary as of that date, and we deconsolidated the Bluegrass Pipeline and began reporting our 50 percent interest as an equity-method investment. There was no gain or loss recognized upon deconsolidation.
Based on a lack of customer commitments and other factors, our management decided in April 2014 to discontinue further funding of the project. The capitalized project development costs at the Bluegrass Pipeline entity were written off as of March 31, 2014, and as a result, we recognized $67 million in related equity losses in the first quarter of 2014. On September 2, 2014, we received a notice of dissolution from our partner with respect to the Bluegrass Pipeline entity and the related Moss Lake entities. We completed the dissolution process for Bluegrass Pipeline in the fourth quarter of 2014.
Moss Lake
We owned 50 percent equity-method investments in Moss Lake Fractionation LLC and Moss Lake LPG Terminal LLC (collectively referred to as Moss Lake) which were considered to be VIEs because they had insufficient equity to finance activities during their development stage. Moss Lake was being developed to construct a proposed large-scale fractionation plant, expand natural gas liquids storage facilities in Louisiana and construct a proposed pipeline connecting these facilities to the Bluegrass Pipeline. Additionally, Moss Lake would construct a proposed new liquefied petroleum gas (LPG) terminal. We were not the primary beneficiary of this entity because we did not have the power to direct the majority of the activities of Moss Lake that most significantly impact its economic performance at this stage. In the first quarter of 2014, we recognized $4 million in equity losses related to Moss Lake, primarily associated with the underlying write-off of capitalized project development costs at Moss Lake. As a result of the circumstances noted above in our Bluegrass Pipeline discussion, on September 2, 2014, we received a notice of dissolution from our partner with respect to the Bluegrass Pipeline entity and Moss Lake entities. We completed the dissolution process for Moss Lake in the fourth quarter of 2014.
Note 4 – Discontinued Operations
Income (loss) from discontinued operations for 2013 reflects a $15 million pretax charge resulting from an unfavorable ruling associated with our former Alaska refinery related to the Trans-Alaska Pipeline System Quality Bank.
104
The Williams Companies, Inc. | ||||
Notes to Consolidated Financial Statements – (Continued) | ||||
| ||||
Income (loss) from discontinued operations for 2012 reflects a $144 million pretax gain on reconsolidation related to our majority ownership in entities (the Wilpro entities) that owned and operated the El Furrial and PIGAP II gas compression facilities prior to their expropriation by the Venezuelan government in May 2009. We deconsolidated the Wilpro entities in 2009. In 2012, the El Furrial and PIGAP II assets were sold as part of a settlement related to the 2009 expropriation of these assets. Upon closing, the lenders that had provided financing for these operations were repaid in full, and the Wilpro entities received $98 million in cash and the right to receive quarterly cash installments of $15 million (receivable) plus interest through the first quarter of 2016. Following the settlement and repayment in full of the lenders, we reestablished control and, therefore, reconsolidated the Wilpro entities and recognized the gain on reconsolidation. This gain reflected our share of the cash, including cash received in the settlement, and the estimated fair value of the receivable held by the Wilpro entities at the time of reconsolidation.
To determine the fair value of the receivable at the time of reconsolidation, we considered both quantitative (income) and qualitative (market) approaches. Under our quantitative approach, we calculated the net present value of a probability-weighted set of cash flows utilizing assumptions based on contractual terms, historical payment patterns by the counterparty under similar circumstances, our likelihood of using arbitration if the counterparty does not perform, and discount rates. Our qualitative analysis utilized information as to how similar notes might be valued. This analysis also reduced the value due to its limited marketability as the payment terms are embedded within the overall settlement agreement. Both analyses resulted in similar fair values. Ultimately we determined the fair value of the receivable to be $88 million at the time of reconsolidation, utilizing a probability-weighted cash flow analysis with a discount rate of approximately 12 percent and a probability of default ranging from 15 percent to 100 percent . Utilizing different assumptions regarding the collectability of the receivable and discount rates could have resulted in a materially different fair value.
Note 5 – Investing Activities
Investing Income
| Years Ended December 31, | ||||||||||
| 2014 |
| 2013 |
| 2012 | ||||||
| (Millions) | ||||||||||
Gain on remeasurement of equity-method investment (1) | $ | 2,544 | |
| $ | - | |
| $ | - | |
Equity earnings (losses) (1) | 144 | |
| 134 | |
| 111 | | |||
Income (loss) from investments (1) | - | |
| 28 | |
| 49 | | |||
Interest income and other | 43 | |
| 53 | |
| 28 | | |||
Total investing income | $ | 2,731 | |
| $ | 215 | |
| $ | 188 | |
__________
(1) | Items also included in Segment profit (loss) . (See Note 19 – Segment Disclosures .) |
Gain on remeasurement of equity-method investment
We recognized a non-cash gain in 2014 associated with the ACMP Acquisition. (See Note 2 – Acquisitions .)
Equity earnings (losses)
Equity earnings (losses) in 2014 includes:
• | $146 million of equity earnings for the last six months of the year from equity-method investments acquired in the ACMP acquisition, partially offset by $49 million of noncash amortization of the difference between the cost of our investment and our underlying share of the net assets (See Note 2 – Acquisitions .); |
• | Write-offs of capitalized project development costs on our discontinued investments in Bluegrass Pipeline of $67 million and Moss Lake of $4 million (See Note 3 – Variable Interest Entities .); |
105
The Williams Companies, Inc. | ||||
Notes to Consolidated Financial Statements – (Continued) | ||||
| ||||
• | $23 million of equity earnings recognized from our interest in ACMP that was accounted for under the equity-method of accounting for the first six months of the year, more than offset by $30 million noncash amortization of the difference between the cost of our investment and our underlying share of the net assets for the first six months of the year. |
Equity earnings (losses) in 2013 includes $93 million of equity earnings recognized from our interest in ACMP, acquired at the end of 2012, that was accounted for under the equity-method of accounting, offset by $63 million noncash amortization of the difference between the cost of our investment and our underlying share of the net assets.
Income (loss) from investments
Included in Income (loss) from investments for 2013 is a $31 million gain resulting from ACMP's equity issuances during 2013. These equity issuances resulted in the dilution of our limited partner interest at that time from approximately 24 percent to 23 percent , which is accounted for as though we sold a portion of our investment.
In 2010, we sold our 50 percent interest in Accroven SRL (Accroven) to the state-owned oil company, Petróleos de Venezuela S.A. Income (loss) from investments in 2012 includes a gain of $53 million from the sale. Payments were recognized upon receipt, as future collections were not reasonably assured.
Interest income and other
Interest income and other includes $41 million , $50 million , and $7 million of interest income for 2014, 2013 and 2012, respectively, associated with a receivable related to the sale of certain former Venezuela assets. (See Note 4 – Discontinued Operations .) The 2014 and 2013 amounts reflect an increase in yield associated with a revision in our estimate of the cash flows expected to be received as a result of continued timely payment by the counterparty. Additionally, Interest income and other for 2012 includes $10 million of interest related to the 2010 sale of Accroven discussed above.
| December 31, | ||||||
| 2014 |
| 2013 | ||||
| (Millions) | ||||||
Equity method: |
|
|
| ||||
Appalachia Midstream Investments (2) | $ | 3,033 | |
| $ | - | |
Delaware Basin gas gathering system - 50% (2) | 1,478 | |
| - | | ||
UEOM - 49% (2) | 1,411 | |
| - | | ||
Discovery Producer Services LLC (Discovery) - 60% (1) | 602 | |
| 527 | | ||
Laurel Mountain - 69% (1) | 459 | |
| 481 | | ||
Overland Pass Pipeline Company LLC (OPPL) - 50% | 453 | |
| 452 | | ||
Caiman II - 58% (1) | 432 | |
| 256 | | ||
Gulfstream - 50% | 317 | |
| 333 | | ||
Access Midstream Partners - 24% in 2013 | - | |
| 2,161 | | ||
Other | 215 | |
| 150 | | ||
| $ | 8,400 | |
| $ | 4,360 | |
___________
(1) | We account for these investments under the equity method of accounting due to the significant participatory rights of our partners such that we do not control or are otherwise not the primary beneficiary of the investments. |
(2) | We acquired these investments in the ACMP Acquisition. ( Note 2 – Acquisitions .) As discussed in Note 1 – Description of Business, Basis of Presentation, and Summary of Significant Accounting Policies , the Appalachia Midstream Investments include investments in 11 different gathering systems in the Marcellus Shale. Ownership interests range from 33.75 percent to 67.50 percent , resulting in an overall approximate average interest of 45 |
106
The Williams Companies, Inc. | ||||
Notes to Consolidated Financial Statements – (Continued) | ||||
| ||||
percent . For those investments where we own in excess of 50 percent , we apply the equity-method of accounting due to the significant participation rights of our partners such that we do not control.
Related party transactions
We have purchases from our equity-method investees included in Product costs in the Consolidated Statement of Income of $197 million , $161 million , and $186 million for the years ended 2014 , 2013 , and 2012 , respectively. We have $13 million and $13 million included in Accounts payable in the Consolidated Balance Sheet with our equity-method investees at December 31, 2014 and 2013 , respectively.
WPZ has operating agreements with certain equity-method investees. These operating agreements typically provide for reimbursement or payment to WPZ for certain direct operational payroll and employee benefit costs, materials, supplies, and other charges and also for management services. We supplied a portion of these services, primarily those related to employees since WPZ does not have any employees, to certain equity-method investees. The total gross charges to equity-method investees for these fees included in the Consolidated Statement of Income are $75 million , $67 million and $75 million for the years ended 2014 , 2013 , and 2012 , respectively.
Equity-method investments
We have differences between the carrying value of our equity-method investments and the underlying equity in the net assets of the investees of $3.7 billion at December 31, 2014. This difference primarily relates to our investments in Appalachian Midstream Investments, Delaware Basin gas gathering system, and UEOM resulting from property, plant, and equipment, as well as customer-based intangible assets and goodwill. (See Note 2 – Acquisitions . )
We generally fund our portion of significant expansion or development projects of these investees through additional capital contributions. As of December 31, 2014 , our proportionate share of amounts remaining to be spent for specific capital projects already in progress for Discovery and Laurel Mountain totaled $98 million and $92 million , respectively. See the table below for significant contributions.
| 2014 |
| 2013 |
| 2012 | ||||||
| (Millions) | ||||||||||
Caiman II | $ | 175 | |
| $ | 192 | |
| $ | 69 | |
Discovery | 106 | |
| 193 | |
| 169 | | |||
Appalachia Midstream Investments | 84 | |
| - | |
| - | | |||
UEOM | 57 | |
| - | |
| - | | |||
Delaware Basin gas gathering system | 20 | |
| - | |
| - | | |||
Laurel Mountain | 12 | |
| 42 | |
| 174 | | |||
The organizational documents of entities in which we have an equity-method interest generally require distribution of available cash to members on a quarterly basis. Dividends and distributions, including those presented below, received from companies accounted for by the equity method of accounting were $409 million , $247 million , and $173 million in 2014 , 2013 , and 2012 , respectively. These transactions reduced the carrying value of our investments. These dividends and distributions primarily included:
| 2014 |
| 2013 |
| 2012 | ||||||
| (Millions) | ||||||||||
Appalachia Midstream Investments | $ | 120 | |
| $ | - | |
| $ | - | |
Gulfstream | 81 | |
| 81 | |
| 79 | | |||
Access Midstream | 64 | |
| 93 | |
| - | | |||
Laurel Mountain | 39 | |
| - | |
| - | | |||
Discovery | 36 | |
| 12 | |
| 21 | | |||
OPPL | 27 | |
| 27 | |
| 28 | | |||
Aux Sable Liquid Products L.P. | 15 | |
| 20 | |
| 28 | | |||
107
The Williams Companies, Inc. | ||||
Notes to Consolidated Financial Statements – (Continued) | ||||
| ||||
Summarized Financial Position and Results of Operations of All Equity-Method Investments
| December 31, | ||||||
| 2014 |
| 2013 | ||||
| (Millions) | ||||||
Assets (liabilities): |
|
|
| ||||
Current assets | $ | 599 | |
| $ | 689 | |
Noncurrent assets | 9,135 | |
| 13,621 | | ||
Current liabilities | (850 | ) |
| (573 | ) | ||
Noncurrent liabilities | (954 | ) |
| (4,563 | ) | ||
Noncontrolling interest | - | |
| (254 | ) | ||
| Years Ended December 31, | ||||||||||
| 2014 |
| 2013 |
| 2012 | ||||||
| (Millions) | ||||||||||
Gross revenue | $ | 1,623 | |
| $ | 2,406 | |
| $ | 1,821 | |
Operating income | 534 | |
| 699 | |
| 557 | | |||
Net income | 460 | |
| 627 | |
| 488 | | |||
Note 6 – Other Income and Expenses
The following table presents certain gains or losses reflected in Other (income) expense – net within Costs and expenses in our Consolidated Statement of Income :
| Years Ended December 31, | ||||||||||
| 2014 |
| 2013 |
| 2012 | ||||||
| (Millions) | ||||||||||
Williams Partners |
|
|
|
|
| ||||||
Contingency gain settlement | $ | (154 | ) |
| $ | - | |
| $ | - | |
Impairment of certain materials and equipment (See Note 17) | 40 | |
| - | |
| - | | |||
Net gain related to partial acreage dedication release | (12 | ) |
| - | |
| - | | |||
Amortization of regulatory assets associated with asset retirement obligations | 33 | |
| 30 | |
| 7 | | |||
Write-off of the Eminence abandonment regulatory asset not recoverable through rates | (3 | ) |
| 12 | |
| - | | |||
Insurance recoveries associated with the Eminence abandonment | - | |
| (16 | ) |
| - | | |||
Project feasibility costs | 2 | |
| 4 | |
| 21 | | |||
Capitalization of project feasibility costs previously expensed | (5 | ) |
| (1 | ) |
| (19 | ) | |||
Loss associated with a producer claim | - | |
| 25 | |
| - | | |||
Access Midstream |
|
|
|
|
| ||||||
Loss related to sale of certain assets | 10 | |
| - | |
| - | | |||
Impairment of certain materials and equipment held for sale (See Note 17) | 12 | |
| - | |
| - | | |||
Williams NGL & Petchem Services |
|
|
|
|
| ||||||
Write-off of an abandoned project | - | |
| 20 | |
| - | | |||
The reversals of project feasibility costs from expense to capital at Williams Partners are associated with natural gas pipeline expansion projects. These reversals were made upon determining that the related projects were probable
108
The Williams Companies, Inc. | ||||
Notes to Consolidated Financial Statements – (Continued) | ||||
| ||||
of development. These costs are now included in the capital costs of the projects, which we believe are probable of recovery through the project rates.
In November 2014, we settled a claim arising from the resolution of a contingent gain related to claims associated with the purchase of a business in a prior period. Pursuant to the settlement, we received $154 million in cash, all of which has been recognized as a gain in the fourth quarter of 2014.
Geismar Incident
On June 13, 2013, an explosion and fire occurred at Williams Partners' Geismar olefins plant. The incident (Geismar Incident) rendered the facility temporarily inoperable and resulted in significant human, financial, and operational effects.
At the time of the incident, we had insurance coverage for repair and replacement costs, lost production, and additional expenses related to the incident as follows:
• | Property damage and business interruption coverage with a combined per-occurrence limit of $500 million and retentions (deductibles) of $10 million per occurrence for property damage and a waiting period of 60 days per occurrence for business interruption; |
• | General liability coverage with per-occurrence and aggregate annual limits of $610 million and retentions (deductibles) of $2 million per occurrence; |
• | Workers' compensation coverage with statutory limits and retentions (deductibles) of $1 million total per occurrence. |
We expensed $13 million at Williams Partners during 2013 of costs under our insurance deductibles reported in Operating and maintenance expenses in the Consolidated Statement of Income . During the years ended December 31, 2014 and 2013, we received $246 million and $50 million , respectively, of insurance recoveries related to the Geismar Incident. These amounts are reported within Williams Partners and reflected as gains in Net insurance recoveries – Geismar Incident in our Consolidated Statement of Income . Also, during the years ended December 31, 2014 and 2013, we incurred $14 million , and $10 million , respectively, of covered insurable expenses in excess of our retentions (deductibles) also included in Net insurance recoveries – Geismar Incident .
Additional Items
The year ended December 31, 2014, includes $18 million of project development costs related to the Bluegrass Pipeline reported within Williams NGL & Petchem Services and reflected in Selling, general, and administrative expenses in the Consolidated Statement of Income.
Selling, general, and administrative expenses in 2014 includes $15 million of employee-related transition costs and $11 million of consulting, legal, and accounting fees related to the Merger reported primarily within the Access Midstream segment, in addition to $10 million of general corporate expenses associated with integration and re-alignment of resources. Operating and maintenance expenses in 2014 also includes $15 million of employee-related transition costs associated with the Merger reported within the Access Midstream segment.
Other income (expense) – net below Operating income (loss) includes $44 million , $22 million , and $21 million for allowance for equity used during construction (AFUDC) for the years ended December 31, 2014, 2013, and 2012, respectively. AFUDC increased during 2014 due to the increase in spending on Constitution and various Transco expansion projects.
We engaged a consulting firm in 2012 to assist in better aligning resources to support our business strategy following the spin-off of WPX Energy, Inc. (WPX). In 2012, we recorded $26 million of reorganization-related costs, including consulting costs, to Selling, general, and administrative expenses .
109
The Williams Companies, Inc. | ||||
Notes to Consolidated Financial Statements – (Continued) | ||||
| ||||
Note 7 – Provision (Benefit) for Income Taxes
The Provision (benefit) for income taxes includes:
| Years Ended December 31, | ||||||||||
| 2014 |
| 2013 |
| 2012 | ||||||
| (Millions) | ||||||||||
Current: |
|
|
|
|
| ||||||
Federal | $ | (9 | ) |
| $ | (17 | ) |
| $ | 91 | |
State | 2 | |
| 7 | |
| 17 | | |||
Foreign | 10 | |
| (13 | ) |
| 40 | | |||
| 3 | |
| (23 | ) |
| 148 | | |||
Deferred: |
|
|
|
|
| ||||||
Federal | 1,108 | |
| 348 | |
| 220 | | |||
State | 119 | |
| 40 | |
| (13 | ) | |||
Foreign | 19 | |
| 36 | |
| 5 | | |||
| 1,246 | |
| 424 | |
| 212 | | |||
Total provision (benefit) | $ | 1,249 | |
| $ | 401 | |
| $ | 360 | |
Reconciliations from the Provision (benefit) for income taxes at the federal statutory rate to the recorded Provision (benefit) for income taxes are as follows:
| Years Ended December 31, | ||||||||||
| 2014 |
| 2013 |
| 2012 | ||||||
| (Millions) | ||||||||||
Provision (benefit) at statutory rate | $ | 1,255 | |
| $ | 378 | |
| $ | 451 | |
Increases (decreases) in taxes resulting from: |
|
|
|
|
| ||||||
Impact of nontaxable noncontrolling interests | (75 | ) |
| (78 | ) |
| (72 | ) | |||
State income taxes (net of federal benefit) | 82 | |
| 26 | |
| 2 | | |||
Foreign operations – net | (11 | ) |
| (32 | ) |
| (36 | ) | |||
Taxes on undistributed earnings of foreign subsidiaries – net | (37 | ) |
| 99 | |
| - | | |||
Other – net | 35 | |
| 8 | |
| 15 | | |||
Provision (benefit) for income taxes | $ | 1,249 | |
| $ | 401 | |
| $ | 360 | |
Income (loss) from continuing operations before income taxes includes $102 million , $119 million , and $196 million of foreign income in 2014 , 2013 , and 2012 , respectively.
The December 2014 federal and state income tax provisions include the tax effect of a $2.5 billion gain associated with remeasuring our equity-method investment to fair value as a result of the ACMP Acquisition.
On October 30, 2013, WPZ announced its intent to pursue an agreement to acquire certain of our Canadian operations. As a result, we no longer consider the undistributed earnings from these foreign operations to be permanently reinvested and thus recognized $99 million of deferred income tax expense in continuing operations and $24 million of deferred tax benefit in AOCI during the fourth quarter of 2013. Taxes on undistributed earnings of foreign subsidiaries-net decreased in 2014 due to revisions of our estimate of the undistributed earnings, partially offset by an increase of tax expense, which decreased our share of the foreign tax credit due to the Canada Dropdown. As a result of the retroactive extension of bonus depreciation late in the fourth quarter of 2014, the amount previously estimated to be included in current tax liability will remain in deferred tax liability.
During the course of audits of our business by domestic and foreign tax authorities, we frequently face challenges regarding the amount of taxes due. These challenges include questions regarding the timing and amount of deductions
110
The Williams Companies, Inc. | ||||
Notes to Consolidated Financial Statements – (Continued) | ||||
| ||||
and the allocation of income among various tax jurisdictions. In evaluating the liability associated with our various filing positions, we apply the two step process of recognition and measurement. In association with this liability, we record an estimate of related interest and tax exposure as a component of our tax provision. The impact of this accrual is included within other - net in our reconciliation of the tax provision to the federal statutory rate.
Significant components of deferred tax liabilities and deferred tax assets are as follows:
| December 31, | ||||||
| 2014 |
| 2013 | ||||
| (Millions) | ||||||
Deferred tax liabilities: |
|
|
| ||||
Property, plant, and equipment | $ | 4 | |
| $ | 102 | |
Undistributed earnings of foreign subsidiaries | - | |
| 75 | | ||
Investments | 5,472 | |
| 3,663 | | ||
Other | 10 | |
| - | | ||
Total deferred tax liabilities | 5,486 | |
| 3,840 | | ||
Deferred tax assets: |
|
|
| ||||
Accrued liabilities | 178 | |
| 126 | | ||
Minimum tax credits | 137 | |
| 66 | | ||
Foreign tax credit | 251 | |
| 42 | | ||
Federal loss carryovers | 134 | |
| - | | ||
State losses and credits | 250 | |
| 194 | | ||
Other | 97 | |
| 91 | | ||
Total deferred tax assets | 1,047 | |
| 519 | | ||
Less valuation allowance | 206 | |
| 181 | | ||
Net deferred tax assets | 841 | |
| 338 | | ||
Overall net deferred tax liabilities | $ | 4,645 | |
| $ | 3,502 | |
The valuation allowance at December 31, 2014 and 2013 serves to reduce the available deferred tax assets to an amount that will, more likely than not, be realized based primarily upon management's estimate of future reversals of existing taxable temporary differences. The amounts presented in the table above are, with respect to state items, before any federal benefit. The change from prior year for the state losses and credits is primarily due to increases in losses and credits generated in the current and prior years less losses and/or credits utilized in the current year. We have loss and credit carryovers in multiple state taxing jurisdictions. These attributes generally expire between 2015 and 2034 with some carryovers having indefinite carryforward periods. In the case of the valuation allowance, the change is due to the ongoing evaluation process of the losses and credits anticipated to be realized in future years. The federal tax minimum tax credits of $137 million currently have no expiration dates. $139 million of foreign tax credit is expected to be utilized prior to expiration in 2025. The remaining foreign tax credit represents unrealized foreign tax credit that will be allocated to us in the future when deferred tax liabilities associated with temporary differences on foreign assets and liabilities become current tax liabilities in the foreign jurisdiction.
Federal net operating loss carryovers and charitable contribution carryovers of $449 million at the end of 2014 are expected to be utilized prior to expiration between 2018 and 2034. Employee share-based compensation attributable to the exercise of stock options and vesting of restricted stock is deductible by us for tax purposes. To the extent these tax deductions exceed the previously accrued deferred tax benefit for these items, the additional tax benefit is not recognized until the deduction reduces current taxes payable. Since the additional tax benefit does not reduce our current taxes payable for 2014, these tax benefits are not included in our Federal loss carryovers deferred tax asset. The additional tax benefit deductible for tax purposes but not included in our Federal loss carryovers deferred tax asset as of December 31, 2014 totaled $23 million .
111
The Williams Companies, Inc. | ||||
Notes to Consolidated Financial Statements – (Continued) | ||||
| ||||
Cash payments for income taxes (net of refunds and discontinued operations) in 2014 and 2012 were $29 million and $198 million , respectively. During 2013, we received cash refunds (net of payments) for income taxes of $50 million .
As of December 31, 2014 , we had approximately $89 million of unrecognized tax benefits. If recognized, income tax expense would be reduced by $86 million , including the effect of these changes on other tax attributes, with state income tax amounts included net of federal tax effect. A reconciliation of the beginning and ending amount of unrecognized tax benefits is as follows:
| 2014 |
| 2013 | ||||
| (Millions) | ||||||
Balance at beginning of period | $ | 66 | |
| $ | 58 | |
Additions based on tax positions related to the current year | 11 | |
| 4 | | ||
Additions for tax positions of prior years | 12 | |
| 18 | | ||
Reductions for tax positions of prior years | - | |
| (2 | ) | ||
Settlement with taxing authorities | - | |
| (12 | ) | ||
Balance at end of period | $ | 89 | |
| $ | 66 | |
We recognize related interest and penalties as a component of income tax provision. Total interest and penalties recognized as part of income tax provision were expenses of $8 million and $9 million for 2014 and 2013 , respectively, and a benefit of $7 million for 2012 . Approximately $24 million and $16 million of interest and penalties primarily relating to uncertain tax positions have been accrued as of December 31, 2014 and 2013 , respectively.
As of December 31, 2014, the IRS examination of our consolidated U.S. federal income tax returns for 2011 through 2013 tax years is in process. We do not expect material changes in our financial position resulting from this examination. However, it is reasonably possible that the amount of unrecognized benefit with respect to our uncertain tax positions could decrease by up to $45 million within the next 12 months due to the effective settlement of tax issues related to past foreign operations. The statute of limitations for most states expires one year after expiration of the IRS statute. Generally, tax returns for our Canadian entities are open to audit for tax years after 2010.
During the first quarter of 2013, we finalized a settlement with the IRS on tax matters related to the IRS's examination of our 2009 and 2010 consolidated corporate income tax returns. We recorded a tax provision of approximately $2 million related to these matters during the third quarter of 2012. With respect to the examined years, we made cash payments of $12 million to the IRS in February 2013.
On September 13, 2013, the IRS issued final regulations providing guidance on the treatment of amounts paid to acquire, produce, or improve tangible property, and proposed regulations providing guidance on the dispositions of such property. On August 18, 2014 the IRS issued final regulations providing guidance on the dispositions of such property. The implementation date for these regulations was January 1, 2014. Changes for tax treatment elected by us or required by the regulations will generally be effective prospectively; however, implementation of many of the regulations' provisions will require a calculation of the cumulative effect of the changes on prior years, and it is expected that such amount will have to be included in the determination of our taxable income in 2014, or possibly over a four-year period beginning in 2014. Since the changes will affect the timing for deducting expenditures for tax purposes, the impact of implementation will be reflected in the amount of income taxes payable or receivable, cash flows from operations and deferred taxes beginning in 2014, with no net tax provision effect. We estimate that the regulations will result in an immaterial balance sheet only impact for businesses other than our gas transmission business. The IRS is expected to issue additional procedural guidance regarding how the requirements may be implemented for the gas transmission and distribution industry. Pending the issuance of additional procedural guidance from the IRS for the gas transmission and distribution industry, we cannot at this time estimate the impact of implementing the regulations.
112
The Williams Companies, Inc. | ||||
Notes to Consolidated Financial Statements – (Continued) | ||||
| ||||
| Years Ended December 31, | ||||||||||
| 2014 |
| 2013 |
| 2012 | ||||||
| (Dollars in millions, except per-share amounts; shares in thousands) | ||||||||||
Income (loss) from continuing operations attributable to The Williams Companies, Inc. available to common stockholders for basic and diluted earnings (loss) per common share | $ | 2,110 | |
| $ | 441 | |
| $ | 723 | |
Basic weighted-average shares | 719,325 | |
| 682,948 | |
| 619,792 | | |||
Effect of dilutive securities: |
|
|
|
|
| ||||||
Nonvested restricted stock units | 2,234 | |
| 1,995 | |
| 2,694 | | |||
Stock options | 2,064 | |
| 2,149 | |
| 2,608 | | |||
Convertible debentures | 18 | |
| 93 | |
| 392 | | |||
Diluted weighted-average shares | 723,641 | |
| 687,185 | |
| 625,486 | | |||
Earnings (loss) per common share from continuing operations: |
|
|
|
|
| ||||||
Basic | $ | 2.93 | |
| $ | .65 | |
| $ | 1.17 | |
Diluted | $ | 2.91 | |
| $ | .64 | |
| $ | 1.15 | |
Beginning in 2012, we have nonvested service-based restricted stock units that contain a nonforfeitable right to dividends during the vesting period and are considered participating securities. Dividends associated with these participating securities were $4 million , $2 million and $1 million for 2014, 2013 and 2012, respectively, and have been subtracted from Income (loss) from continuing operations attributable to The Williams Companies, Inc. available to common stockholders for basic and diluted earnings (loss) per common share in the calculation of earnings (loss) per common share.
Note 9 – Employee Benefit Plans
We have noncontributory defined benefit pension plans in which all eligible employees participate. Currently, eligible employees earn benefits primarily based on a cash balance formula. Various other formulas, as defined in the plan documents, are utilized to calculate the retirement benefits for plan participants not covered by the cash balance formula. At the time of retirement, participants may elect, to the extent they are eligible for the various options, to receive annuity payments, a lump sum payment, or a combination of a lump sum and annuity payments. In addition to our pension plans, we currently provide subsidized retiree medical and life insurance benefits (other postretirement benefits) to certain eligible participants. Generally, employees hired after December 31, 1991, are not eligible for the subsidized retiree medical benefits, except for participants that were employees or retirees of Transco Energy Company on December 31, 1995, and other miscellaneous defined participant groups. Effective January 1, 2014, subsidized retiree medical benefits for eligible participants age 65 and older are paid through contributions to health reimbursement accounts. Prior to January 1, 2014, subsidized retiree medical benefits for all eligible participants were provided through a self-insured retiree medical plan sponsored by us. Subsidized retiree medical benefits for eligible participants under age 65 continue to be provided by this medical plan. The impact of this plan change was reflected in the December 31, 2013, other postretirement benefit obligation. The self-insured retiree medical plan provides for retiree contributions and contains other cost-sharing features such as deductibles, co-payments, and co-insurance. The accounting for these plans anticipates estimated future increases to contribution levels to the health reimbursement accounts for participants age 65 and older, as well as future cost-sharing that is consistent with our expressed intent to increase the retiree contribution level generally in line with health care cost increases for participants under age 65.
113
The Williams Companies, Inc. | ||||
Notes to Consolidated Financial Statements – (Continued) | ||||
| ||||
Funded Status
The following table presents the changes in benefit obligations and plan assets for pension benefits and other postretirement benefits for the years indicated.
| Pension Benefits |
| Other Postretirement Benefits | ||||||||||||
| 2014 |
| 2013 |
| 2014 |
| 2013 | ||||||||
| (Millions) | ||||||||||||||
Change in benefit obligation: |
|
|
|
|
|
|
| ||||||||
Benefit obligation at beginning of year | $ | 1,384 | |
| $ | 1,549 | |
| $ | 213 | |
| $ | 331 | |
Service cost | 40 | |
| 44 | |
| 2 | |
| 2 | | ||||
Interest cost | 62 | |
| 51 | |
| 10 | |
| 11 | | ||||
Plan participants' contributions | - | |
| - | |
| 2 | |
| 6 | | ||||
Benefits paid | (86 | ) |
| (87 | ) |
| (14 | ) |
| (19 | ) | ||||
Medicare Part D subsidy | - | |
| - | |
| - | |
| 4 | | ||||
Plan amendment | - | |
| - | |
| 1 | |
| (59 | ) | ||||
Actuarial loss (gain) | 144 | |
| (173 | ) |
| 21 | |
| (63 | ) | ||||
Settlements | (3 | ) |
| - | |
| (1 | ) |
| - | | ||||
Curtailments | - | |
| - | |
| (1 | ) |
| - | | ||||
Other | 3 | |
| - | |
| - | |
| - | | ||||
Benefit obligation at end of year | 1,544 | |
| 1,384 | |
| 233 | |
| 213 | | ||||
Change in plan assets: |
|
|
|
|
|
|
| ||||||||
Fair value of plan assets at beginning of year | 1,241 | |
| 1,071 | |
| 201 | |
| 175 | | ||||
Actual return on plan assets | 78 | |
| 165 | |
| 13 | |
| 31 | | ||||
Employer contributions | 63 | |
| 92 | |
| 6 | |
| 8 | | ||||
Plan participants' contributions | - | |
| - | |
| 2 | |
| 6 | | ||||
Benefits paid | (86 | ) |
| (87 | ) |
| (14 | ) |
| (19 | ) | ||||
Settlements | (3 | ) |
| - | |
| - | |
| - | | ||||
Fair value of plan assets at end of year | 1,293 | |
| 1,241 | |
| 208 | |
| 201 | | ||||
Funded status - underfunded | $ | (251 | ) |
| $ | (143 | ) |
| $ | (25 | ) |
| $ | (12 | ) |
Accumulated benefit obligation | $ | 1,516 | |
| $ | 1,359 | |
|
|
|
| ||||
The underfunded status of our pension plans and other postretirement benefit plans presented in the previous table are recognized in the Consolidated Balance Sheet within the following accounts:
| December 31, | ||||||
| 2014 |
| 2013 | ||||
| (Millions) | ||||||
Underfunded pension plans: |
|
|
| ||||
Current liabilities | $ | 2 | |
| $ | 1 | |
Noncurrent liabilities | 249 | |
| 142 | | ||
Underfunded other postretirement benefit plans: |
|
|
| ||||
Current liabilities | 7 | |
| 8 | | ||
Noncurrent liabilities | 18 | |
| 4 | | ||
The plan assets within our other postretirement benefit plans are intended to be used for the payment of benefits for certain groups of participants. The Current liabilities for the other postretirement benefit plans represent the current portion of benefits expected to be payable in the subsequent year for the groups of participants whose benefits are not expected to be paid from plan assets.
114
The Williams Companies, Inc. | ||||
Notes to Consolidated Financial Statements – (Continued) | ||||
| ||||
The pension plans' benefit obligation Actuarial loss (gain) of $ 144 million in 2014 is primarily due to the impact of updated mortality tables reflecting increased estimated life expectancies and a decrease in the discount rates utilized to calculate the benefit obligation. The pension plans' benefit obligation Actuarial loss (gain) of $(173) million in 2013 is primarily due to the impact of an increase in the discount rates utilized to calculate the benefit obligation.
The 2014 benefit obligation Actuarial loss (gain) of $ 21 million for our other postretirement benefit plans is primarily due to the impact of the updated mortality tables and a decrease in the discount rates utilized to calculate the benefit obligation. The 2013 benefit obligation Actuarial loss (gain) of $(63) million for our other postretirement benefit plans is primarily due to the impact of an increase in the discount rates utilized to calculate the benefit obligation as well as favorable claims experience. The Plan amendment for the other postretirement benefit plans of $ (59) million in 2013 reflects a change in the plans to provide subsidized retiree medical benefits through defined annual contributions to health reimbursement accounts for eligible participants age 65 and older effective January 1, 2014.
At December 31, 2014 and 2013 , all of our pension plans had a projected benefit obligation and accumulated benefit obligation in excess of plan assets.
Pre-tax amounts not yet recognized in Net periodic benefit cost at December 31 are as follows:
| Pension Benefits |
| Other Postretirement Benefits | ||||||||||||
| 2014 |
| 2013 |
| 2014 |
| 2013 | ||||||||
| (Millions) | ||||||||||||||
Amounts included in Accumulated other comprehensive income (loss) : |
|
|
|
|
|
|
| ||||||||
Prior service (cost) credit | $ | - | |
| $ | - | |
| $ | 17 | |
| $ | 26 | |
Net actuarial loss | (593 | ) |
| (491 | ) |
| (28 | ) |
| (11 | ) | ||||
Amounts included in regulatory liabilities associated with Transco and Northwest Pipeline: |
|
|
|
|
|
|
| ||||||||
Prior service credit | N/A | |
| N/A | |
| $ | 30 | |
| $ | 42 | | ||
Net actuarial loss | N/A | |
| N/A | |
| (4 | ) |
| (2 | ) | ||||
In addition to the regulatory liabilities included in the previous table, differences in the amount of actuarially determined Net periodic benefit cost for our other postretirement benefit plans and the other postretirement benefit costs recovered in rates for Transco and Northwest Pipeline are deferred as a regulatory asset or liability. We have regulatory liabilities of $62 million at December 31, 2014 and $44 million at December 31, 2013 related to these deferrals. These amounts will be reflected in future rates based on the rate structures of these gas pipelines.
115
The Williams Companies, Inc. | ||||
Notes to Consolidated Financial Statements – (Continued) | ||||
| ||||
Net Periodic Benefit Cost
Net periodic benefit cost for the years ended December 31 consist of the following:
| Pension Benefits |
| Other Postretirement Benefits | ||||||||||||||||||||
| 2014 |
| 2013 |
| 2012 |
| 2014 |
| 2013 |
| 2012 | ||||||||||||
| (Millions) | ||||||||||||||||||||||
Components of net periodic benefit cost: |
|
|
|
|
|
|
|
|
|
|
| ||||||||||||
Service cost | $ | 40 | |
| $ | 44 | |
| $ | 39 | |
| $ | 2 | |
| $ | 2 | |
| $ | 3 | |
Interest cost | 62 | |
| 51 | |
| 55 | |
| 10 | |
| 11 | |
| 13 | | ||||||
Expected return on plan assets | (76 | ) |
| (61 | ) |
| (64 | ) |
| (12 | ) |
| (9 | ) |
| (9 | ) | ||||||
Amortization of prior service cost (credit) | - | |
| 1 | |
| 1 | |
| (20 | ) |
| (12 | ) |
| (7 | ) | ||||||
Amortization of net actuarial loss | 39 | |
| 60 | |
| 53 | |
| - | |
| 4 | |
| 8 | | ||||||
Net actuarial loss from settlements and curtailments | 1 | |
| - | |
| 5 | |
| (1 | ) |
| - | |
| - | | ||||||
Reclassification to regulatory liability | - | |
| - | |
| - | |
| 4 | |
| 2 | |
| - | | ||||||
Net periodic benefit cost | $ | 66 | |
| $ | 95 | |
| $ | 89 | |
| $ | (17 | ) |
| $ | (2 | ) |
| $ | 8 | |
Items Recognized in Other Comprehensive Income (Loss) and Regulatory Assets/Liabilities
Other changes in plan assets and benefit obligations recognized in Other comprehensive income (loss) before taxes for the years ended December 31 consist of the following:
| Pension Benefits | | Other Postretirement Benefits | ||||||||||||||||||||
| 2014 | | 2013 | | 2012 | | 2014 | | 2013 | | 2012 | ||||||||||||
| (Millions) | ||||||||||||||||||||||
Other changes in plan assets and benefit obligations recognized in Other comprehensive income (loss) : | | | | | | | | | | | | ||||||||||||
Net actuarial gain (loss) | $ | (142 | ) | | $ | 277 | | | $ | (51 | ) | | $ | (18 | ) | | $ | 23 | | | $ | 2 | |
Prior service (cost) credit | - | | | - | | | - | | | (1 | ) | | 23 | | | 2 | | ||||||
Amortization of prior service cost (credit) | - | | | 1 | | | 1 | | | (8 | ) | | (4 | ) | | (3 | ) | ||||||
Amortization of net actuarial loss and loss from settlements and curtailments | 40 | | | 60 | | | 58 | | | 1 | | | 1 | | | 3 | | ||||||
Other changes in plan assets and benefit obligations recognized in Other comprehensive income (loss) | $ | (102 | ) | | $ | 338 | | | $ | 8 | | | $ | (26 | ) | | $ | 43 | | | $ | 4 | |
116
The Williams Companies, Inc. | ||||
Notes to Consolidated Financial Statements – (Continued) | ||||
| ||||
Other changes in plan assets and benefit obligations for our other postretirement benefit plans associated with Transco and Northwest Pipeline are recognized in regulatory assets/liabilities. Amounts recognized in regulatory assets/ liabilities for the years ended December 31 consist of the following:
|
| 2014 |
| 2013 |
| 2012 | ||||||
|
| (Millions) | ||||||||||
Other changes in plan assets and benefit obligations recognized in regulatory (assets) liabilities: |
|
|
|
|
|
| ||||||
Net actuarial gain (loss) |
| $ | (2 | ) |
| $ | 62 | |
| $ | 13 | |
Prior service credit |
| - | |
| 36 | |
| 4 | | |||
Amortization of prior service credit |
| (12 | ) |
| (8 | ) |
| (4 | ) | |||
Amortization of net actuarial loss |
| - | |
| 3 | |
| 5 | | |||
Pre-tax amounts expected to be amortized in Net periodic benefit cost in 2015 are as follows:
| Pension Benefits |
| Other Postretirement Benefits | ||||
| (Millions) | ||||||
Amounts included in Accumulated other comprehensive income (loss) : |
|
|
| ||||
Prior service credit | $ | - | |
| $ | (7 | ) |
Net actuarial loss | 43 | |
| 1 | | ||
Amounts included in regulatory liabilities associated with Transco and Northwest Pipeline: |
|
|
| ||||
Prior service credit | N/A | |
| $ | (10 | ) | |
Net actuarial loss | N/A | |
| - | | ||
Key Assumptions
The weighted-average assumptions utilized to determine benefit obligations as of December 31 are as follows:
| Pension Benefits |
| Other Postretirement Benefits | ||||||||
| 2014 |
| 2013 |
| 2014 |
| 2013 | ||||
Discount rate | 3.96 | % |
| 4.68 | % |
| 4.12 | % |
| 4.80 | % |
Rate of compensation increase | 4.62 | |
| 4.56 | |
| N/A |
| N/A | ||
The weighted-average assumptions utilized to determine Net periodic benefit cost for the years ended December 31 are as follows:
| Pension Benefits |
| Other Postretirement Benefits | ||||||||||||||
| 2014 |
| 2013 |
| 2012 |
| 2014 |
| 2013 |
| 2012 | ||||||
Discount rate | 4.68 | % |
| 3.43 | % |
| 3.98 | % |
| 4.80 | % |
| 3.97 | % |
| 4.22 | % |
Expected long-term rate of return on plan assets | 6.85 | |
| 5.90 | |
| 6.30 | |
| 6.11 | |
| 5.26 | |
| 5.71 | |
Rate of compensation increase | 4.56 | |
| 4.57 | |
| 4.52 | |
| N/A |
| N/A |
| N/A | |||
Effective December 31, 2014, the mortality assumptions used to determine the benefit obligations for our pension and other postretirement benefit plans were updated to reflect recently adopted generational projection mortality tables. These mortality tables generally reflect increased estimated life expectancy.
117
The Williams Companies, Inc. | ||||
Notes to Consolidated Financial Statements – (Continued) | ||||
| ||||
The assumed health care cost trend rate for 2015 is 6.9 percent. This rate decreases to 5.0 percent by 2023 . A one-percentage-point change in assumed health care cost trend rates would have the following effects:
| Point increase |
| Point decrease | ||||
| (Millions) | ||||||
Effect on total of service and interest cost components | $ | - | |
| $ | - | |
Effect on other postretirement benefit obligation | 9 | |
| (7 | ) | ||
Plan Assets
The investment policy for our pension and other postretirement benefit plans provides for an investment strategy in accordance with the Employee Retirement Income Security Act (ERISA), which governs the investment of the assets in a diversified portfolio. The plans follow a policy of diversifying the investments across various asset classes and investment managers. Additionally, the investment returns on approximately 38 percent of the other postretirement benefit plan assets are subject to income tax; therefore, certain investments are managed in a tax efficient manner.
The pension plans' target asset allocation range at December 31, 2014 was 54 percent to 66 percent equity securities, which includes the commingled investment funds invested in equity securities, and 36 percent to 44 percent fixed income securities, including the fixed income commingled investment fund, and cash management funds. Within equity securities, the target range for U.S. equity securities is 37 percent to 45 percent and international equity securities is 17 percent to 21 percent. The asset allocation continues to be weighted toward equity securities since the obligations of the pension and other postretirement benefit plans are long-term in nature and historically equity securities have outperformed other asset classes over long periods of time.
Equity security investments are restricted to high-quality, readily marketable securities that are actively traded on the major U.S. and foreign national exchanges. Investment in Williams' securities or an entity in which Williams has a majority ownership is prohibited in the pension plans except where these securities may be owned in a commingled investment fund in which the plans' trusts invest. No more than 5 percent of the total stock portfolio valued at market may be invested in the common stock of any one corporation.
The following securities and transactions are not authorized: unregistered securities, commodities or commodity contracts, short sales or margin transactions, or other leveraging strategies. Investment strategies using the direct holding of options or futures require approval and, historically, have not been used; however, these instruments may be used in commingled investment funds. Additionally, real estate equity and natural resource property investments are generally restricted.
Fixed income securities are generally restricted to high-quality, marketable securities that may include, but are not necessarily limited to, U.S. Treasury securities, U.S. government guaranteed and nonguaranteed mortgage-backed securities, government and municipal bonds, and investment grade corporate securities. The overall rating of the fixed income security assets is generally required to be at least "A," according to the Moody's or Standard & Poor's rating systems. No more than 5 percent of the total fixed income portfolio may be invested in the fixed income securities of any one issuer with the exception of bond index funds and U.S. government guaranteed and agency securities.
During 2014, ten active investment managers and one passive investment manager managed substantially all of the pension plans' funds and four active investment managers and one passive investment manager managed the other postretirement benefit plans' funds. Each of the managers had responsibility for managing a specific portion of these assets and each investment manager was responsible for 1 percent to 15 percent of the assets.
The pension and other postretirement benefit plans' assets are held primarily in equity securities, including commingled investment funds invested in equity securities, and fixed income securities, including a commingled fund invested in fixed income securities. Within the plans' investment securities, there are no significant concentrations of risk because of the diversity of the types of investments, diversity of the various industries, and the diversity of the fund managers and investment strategies. Generally, the investments held in the plans are publicly traded, therefore, minimizing liquidity risk in the portfolio.
118
The Williams Companies, Inc. | ||||
Notes to Consolidated Financial Statements – (Continued) | ||||
| ||||
The fair values of our pension plan assets at December 31, 2014 and 2013 by asset class are as follows:
| 2014 | ||||||||||||||
| Quoted Prices |
| Significant |
| Significant |
| Total | ||||||||
| (Millions) | ||||||||||||||
Pension assets: |
|
|
|
|
|
|
| ||||||||
Cash management fund | $ | 25 | |
| $ | - | |
| $ | - | |
| $ | 25 | |
Equity securities: |
|
|
|
|
|
|
| ||||||||
U.S. large cap | 221 | |
| - | |
| - | |
| 221 | | ||||
U.S. small cap | 139 | |
| - | |
| - | |
| 139 | | ||||
International developed markets large cap growth | - | |
| 60 | |
| - | |
| 60 | | ||||
Commingled investment funds: |
|
|
|
|
|
|
| ||||||||
Equities - U.S. large cap (1) | - | |
| 189 | |
| - | |
| 189 | | ||||
Equities - International small cap (2) | - | |
| 24 | |
| - | |
| 24 | | ||||
Equities - Emerging markets value (3) | - | |
| 27 | |
| - | |
| 27 | | ||||
Equities - Emerging markets growth (4) | - | |
| 19 | |
| - | |
| 19 | | ||||
Equities - International developed markets large cap value (5) | - | |
| 101 | |
| - | |
| 101 | | ||||
Fixed income - Corporate bonds (6) | - | |
| 163 | |
| - | |
| 163 | | ||||
Fixed income securities (7): |
|
|
|
|
|
|
| ||||||||
U.S. Treasury securities | 31 | |
| - | |
| - | |
| 31 | | ||||
Mortgage-backed securities | - | |
| 65 | |
| - | |
| 65 | | ||||
Corporate bonds | - | |
| 222 | |
| - | |
| 222 | | ||||
Insurance company investment contracts and other | - | |
| 7 | |
| - | |
| 7 | | ||||
Total assets at fair value at December 31, 2014 | $ | 416 | |
| $ | 877 | |
| $ | - | |
| $ | 1,293 | |
119
The Williams Companies, Inc. | ||||
Notes to Consolidated Financial Statements – (Continued) | ||||
| ||||
| 2013 | ||||||||||||||
| Quoted Prices |
| Significant |
| Significant |
| Total | ||||||||
| (Millions) | ||||||||||||||
Pension assets: |
|
|
|
|
|
|
| ||||||||
Cash management fund | $ | 23 | |
| $ | - | |
| $ | - | |
| $ | 23 | |
Equity securities: |
|
|
|
|
|
|
| ||||||||
U.S. large cap | 211 | |
| - | |
| - | |
| 211 | | ||||
U.S. small cap | 146 | |
| - | |
| - | |
| 146 | | ||||
International developed markets large cap growth | - | |
| 59 | |
| - | |
| 59 | | ||||
Preferred stock | 2 | |
| - | |
| - | |
| 2 | | ||||
Commingled investment funds: |
|
|
|
|
|
|
| ||||||||
Equities - U.S. large cap (1) | - | |
| 179 | |
| - | |
| 179 | | ||||
Equities - International small cap (2) | - | |
| 24 | |
| - | |
| 24 | | ||||
Equities - Emerging markets value (3) | - | |
| 34 | |
| - | |
| 34 | | ||||
Equities - Emerging markets growth (4) | - | |
| 19 | |
| - | |
| 19 | | ||||
Equities - International developed markets large cap value (5) | - | |
| 100 | |
| - | |
| 100 | | ||||
Fixed income - Corporate bonds (6) | - | |
| 140 | |
| - | |
| 140 | | ||||
Fixed income securities (7): |
|
|
|
|
|
|
| ||||||||
U.S. Treasury securities | 30 | |
| - | |
| - | |
| 30 | | ||||
Mortgage-backed securities | - | |
| 67 | |
| - | |
| 67 | | ||||
Corporate bonds | - | |
| 200 | |
| - | |
| 200 | | ||||
Insurance company investment contracts and other | - | |
| 7 | |
| - | |
| 7 | | ||||
Total assets at fair value at December 31, 2013 | $ | 412 | |
| $ | 829 | |
| $ | - | |
| $ | 1,241 | |
120
The Williams Companies, Inc. | ||||
Notes to Consolidated Financial Statements – (Continued) | ||||
| ||||
The fair values of our other postretirement benefits plan assets at December 31, 2014 and 2013 by asset class are as follows:
| 2014 | ||||||||||||||
| Quoted Prices |
| Significant |
| Significant |
| Total | ||||||||
| (Millions) | ||||||||||||||
Other postretirement benefit assets: |
|
|
|
|
|
|
| ||||||||
Cash management funds | $ | 13 | |
| $ | - | |
| $ | - | |
| $ | 13 | |
Equity securities: |
|
|
|
|
|
|
| ||||||||
U.S. large cap | 53 | |
| - | |
| - | |
| 53 | | ||||
U.S. small cap | 28 | |
| - | |
| - | |
| 28 | | ||||
International developed markets large cap growth | - | |
| 15 | |
| - | |
| 15 | | ||||
Emerging markets growth | 1 | |
| 2 | |
| - | |
| 3 | | ||||
Commingled investment funds: |
|
|
|
|
|
|
| ||||||||
Equities - U.S. large cap (1) | - | |
| 19 | |
| - | |
| 19 | | ||||
Equities - International small cap (2) | - | |
| 2 | |
| - | |
| 2 | | ||||
Equities - Emerging markets value (3) | - | |
| 3 | |
| - | |
| 3 | | ||||
Equities - Emerging markets growth (4) | - | |
| 2 | |
| - | |
| 2 | | ||||
Equities - International developed markets large cap value (5) | - | |
| 10 | |
| - | |
| 10 | | ||||
Fixed income - Corporate bonds (6) | - | |
| 16 | |
| - | |
| 16 | | ||||
Fixed income securities (8): |
|
|
|
|
|
|
| ||||||||
U.S. Treasury securities | 3 | |
| - | |
| - | |
| 3 | | ||||
Government and municipal bonds | - | |
| 11 | |
| - | |
| 11 | | ||||
Mortgage-backed securities | - | |
| 7 | |
| - | |
| 7 | | ||||
Corporate bonds | - | |
| 23 | |
| - | |
| 23 | | ||||
Total assets at fair value at December 31, 2014 | $ | 98 | |
| $ | 110 | |
| $ | - | |
| $ | 208 | |
121
The Williams Companies, Inc. | ||||
Notes to Consolidated Financial Statements – (Continued) | ||||
| ||||
| 2013 | ||||||||||||||
| Quoted Prices |
| Significant |
| Significant |
| Total | ||||||||
| (Millions) | ||||||||||||||
Other postretirement benefit assets: |
|
|
|
|
|
|
| ||||||||
Cash management funds | $ | 13 | |
| $ | - | |
| $ | - | |
| $ | 13 | |
Equity securities: |
|
|
|
|
|
|
| ||||||||
U.S. large cap | 52 | |
| - | |
| - | |
| 52 | | ||||
U.S. small cap | 29 | |
| - | |
| - | |
| 29 | | ||||
International developed markets large cap growth | - | |
| 15 | |
| - | |
| 15 | | ||||
Emerging markets growth | 1 | |
| 1 | |
| - | |
| 2 | | ||||
Commingled investment funds: |
|
|
|
|
|
|
| ||||||||
Equities - U.S. large cap (1) | - | |
| 18 | |
| - | |
| 18 | | ||||
Equities - International small cap (2) | - | |
| 2 | |
| - | |
| 2 | | ||||
Equities - Emerging markets value (3) | - | |
| 4 | |
| - | |
| 4 | | ||||
Equities - Emerging markets growth (4) | - | |
| 2 | |
| - | |
| 2 | | ||||
Equities - International developed markets large cap value (5) | - | |
| 10 | |
| - | |
| 10 | | ||||
Fixed income - Corporate bonds (6) | - | |
| 14 | |
| - | |
| 14 | | ||||
Fixed income securities (8): |
|
|
|
|
|
|
| ||||||||
U.S. Treasury securities | 3 | |
| - | |
| - | |
| 3 | | ||||
Government and municipal bonds | - | |
| 10 | |
| - | |
| 10 | | ||||
Mortgage-backed securities | - | |
| 7 | |
| - | |
| 7 | | ||||
Corporate bonds | - | |
| 20 | |
| - | |
| 20 | | ||||
Total assets at fair value at December 31, 2013 | $ | 98 | |
| $ | 103 | |
| $ | - | |
| $ | 201 | |
____________
(1) | The stated intent of this fund is to invest primarily in equity securities comprising the Standard & Poor's 500 Index. The investment objective of the fund is to approximate the performance of the Standard & Poor's 500 Index over the long term. The fund manager retains the right to restrict withdrawals from the fund so as not to disadvantage other investors in the fund. |
(2) | The stated intent of this fund is to invest in equity securities of international small capitalization companies for the purpose of capital appreciation. The fund invests primarily in equity securities of non-U.S. issuers and other Depository Receipts listed on globally recognized exchanges. The fund may also invest up to 15 percent of its net asset value in emerging markets. The plans' trustee is required to notify the fund manager 10 days prior to a withdrawal from the fund. For any redemption made within 180 days of contribution, the fund reserves the right to charge a 1.5 percent redemption fee. The fund also reserves the right to make all or a portion of redemptions in-kind rather than in cash or in a combination of cash and in-kind. |
(3) | The stated intent of this fund is to invest in equity securities of international emerging markets for the purpose of capital appreciation. The fund invests primarily in common stocks in the financial, consumer goods, information technology, energy, telecommunications, and industrial sectors. The plans' trustee is required to notify the fund manager 10 days prior to a withdrawal from the fund. The fund manager retains the right to restrict withdrawals from the fund so as not to disadvantage other investors in the fund. |
122
The Williams Companies, Inc. | ||||
Notes to Consolidated Financial Statements – (Continued) | ||||
| ||||
(4) | The stated intent of this fund is to invest mainly in equity securities of emerging market companies, or those companies that derive a significant portion of their revenues or profits from emerging economies for the purpose of long-term capital growth. The plans' trustee is required to notify the fund manager 15 days prior to a withdrawal from the fund as of the last day of any month. The fund reserves the right to suspend and compel withdrawals. The fund also reserves the right to make all or a portion of redemptions in-kind rather than in cash or in a combination of cash and in-kind. |
(5) | The stated intent of this fund is to invest in a diversified portfolio of international equity securities for the purpose of capital appreciation. The fund invests primarily in common stocks in the consumer goods, financial, health care, materials, energy, and information technology sectors. The plans' trustee is required to notify the fund manager 10 days prior to a withdrawal from the fund. The fund manager retains the right to restrict withdrawals from the fund so as not to disadvantage other investors in the fund. |
(6) | The stated intent of this fund is to invest in U.S. Corporate bonds and U.S. Treasury securities. The fund is managed to closely match the characteristics of a long-term corporate bond index fund and seeks to maintain an average credit quality target of A- or above and a maximum 10 percent allocation to BBB rated securities. The fund's target duration is approximately 20 years . The trustee of the fund reserves the right to delay the processing of deposits or withdrawals in order to ensure that securities transactions will be carried out in an orderly manner. |
(7) | The weighted-average credit quality rating of the pension assets fixed income security portfolio is investment grade with a weighted-average duration of approximately 6 years for 2014 and 2013. |
(8) | The weighted-average credit quality rating of the other postretirement benefit assets fixed income security portfolio is investment grade with a weighted-average duration of approximately 5 years for 2014 and 2013. |
The fair value measurement level within the fair value hierarchy is based on the lowest level of any input that is significant to the fair value measurement of an asset.
Shares of the cash management funds are valued at fair value based on published market prices as of the close of business on the last business day of the year, which represents the net asset values of the shares held.
The fair values of equity securities traded on U.S. exchanges are derived from quoted market prices as of the close of business on the last business day of the year. The fair values of equity securities traded on foreign exchanges are also derived from quoted market prices as of the close of business on an active foreign exchange on the last business day of the year. However, the valuation requires translation of the foreign currency to U.S. dollars and this translation is considered an observable input to the valuation.
The fair value of all commingled investment funds are determined based on the net asset values per unit of each of the funds. The net asset values per unit represent the aggregate value of the funds assets at fair value less liabilities, divided by the number of units outstanding.
The fair value of fixed income securities, except U.S. Treasury notes and bonds, are determined using pricing models. These pricing models incorporate observable inputs such as benchmark yields, reported trades, broker/dealer quotes, and issuer spreads for similar securities to determine fair value. The U.S. Treasury notes and bonds are valued at fair value based on closing prices on the last business day of the year reported in the active market in which the security is traded.
The investment contracts with insurance companies are valued at fair value by discounting the cash flow of a bond using a yield to maturity based on an investment grade index or comparable index with a similar maturity value, maturity period, and nominal coupon rate.
There have been no significant changes in the preceding valuation methodologies used at December 31, 2014 and 2013 . Additionally, there were no transfers or reclassifications of investments between Level 1 and Level 2 from
123
The Williams Companies, Inc. | ||||
Notes to Consolidated Financial Statements – (Continued) | ||||
| ||||
December 2013 to December 2014 . If transfers between levels had occurred, the transfers would have been recognized as of the end of the period.
Plan Benefit Payments and Employer Contributions
Following are the expected benefits to be paid by the plans. These estimates are based on the same assumptions previously discussed and reflect future service as appropriate. The actuarial assumptions are based on long-term expectations and include, but are not limited to, assumptions as to average expected retirement age and form of benefit payment. Actual benefit payments could differ significantly from expected benefit payments if near-term participant behaviors differ significantly from the actuarial assumptions.
| Pension Benefits |
| Other Postretirement Benefits | ||||
| (Millions) | ||||||
2015 | $ | 100 | |
| $ | 14 | |
2016 | 107 | |
| 15 | | ||
2017 | 107 | |
| 15 | | ||
2018 | 110 | |
| 16 | | ||
2019 | 117 | |
| 13 | | ||
2020-2024 | 609 | |
| 70 | | ||
In 2015, we expect to contribute approximately $60 million to our tax-qualified pension plans and approximately $2 million to our nonqualified pension plans, for a total of approximately $62 million , and approximately $7 million to our other postretirement benefit plans.
Defined Contribution Plans
We also maintain defined contribution plans for the benefit of substantially all of our employees. Generally, plan participants may contribute a portion of their compensation on a pre-tax and after-tax basis in accordance with the plans' guidelines. We match employees' contributions up to certain limits. Our matching contributions charged to expense were $39 million in 2014 , $27 million in 2013 , and $25 million in 2012 . The increase in expense in 2014 is primarily due to the impact of the consolidation of ACMP beginning in the third quarter of 2014. (See Note 2 – Acquisitions .)
Note 10 – Inventories
| December 31, | ||||||
| 2014 |
| 2013 | ||||
| (Millions) | ||||||
Natural gas liquids, olefins, and natural gas in underground storage | $ | 150 | |
| $ | 111 | |
Materials, supplies, and other | 81 | |
| 83 | | ||
| $ | 231 | |
| $ | 194 | |
124
The Williams Companies, Inc. | ||||
Notes to Consolidated Financial Statements – (Continued) | ||||
| ||||
Note 11 – Property, Plant, and Equipment
|
|
|
|
|
|
|
| ||||
| Estimated Useful Life (1) (Years) |
| Depreciation Rates (1) (%) |
| December 31, | ||||||
2014 | | 2013 | |||||||||
|
|
|
|
| (Millions) | ||||||
Nonregulated: |
|
|
|
|
|
|
| ||||
Natural gas gathering and processing facilities | 5 - 40 |
|
|
| $ | 18,749 | |
| $ | 9,185 | |
Construction in progress | Not applicable |
|
|
| 2,648 | |
| 3,123 | | ||
Other | 3 - 45 |
|
|
| 1,850 | |
| 1,316 | | ||
Regulated: |
|
|
|
|
|
|
| ||||
Natural gas transmission facilities |
|
| 1.20 - 6.97 |
| 10,867 | |
| 10,633 | | ||
Construction in progress |
|
| Not applicable |
| 985 | |
| 273 | | ||
Other |
|
| 1.35 - 33.33 |
| 1,336 | |
| 1,293 | | ||
Total property, plant, and equipment, at cost |
|
|
|
| 36,435 | |
| 25,823 | | ||
Accumulated depreciation and amortization |
|
|
|
| (8,354 | ) |
| (7,613 | ) | ||
Property, plant, and equipment - net |
|
|
|
| $ | 28,081 | |
| $ | 18,210 | |
__________
(1) | Estimated useful life and depreciation rates are presented as of December 31, 2014 . Depreciation rates for regulated assets are prescribed by the FERC. |
Depreciation and amortization expense for Property, plant, and equipment – net was $967 million in 2014 , $752 million in 2013 , and $712 million in 2012 .
Regulated Property, plant, and equipment – net includes approximately $746 million and $785 million at December 31, 2014 and 2013 , respectively, related to amounts in excess of the original cost of the regulated facilities within our gas pipeline businesses as a result of our prior acquisitions. This amount is being amortized over 40 years using the straight-line amortization method. Current FERC policy does not permit recovery through rates for amounts in excess of original cost of construction.
Asset Retirement Obligations
Our accrued obligations relate to underground storage caverns, offshore platforms and pipelines, fractionation and compression facilities, gas gathering well connections and pipelines, and gas transmission facilities. At the end of the useful life of each respective asset, we are legally obligated to plug storage caverns and remove any related surface equipment, to restore land and remove surface equipment at gas processing, fractionation and compression facilities, to dismantle offshore platforms and appropriately abandon offshore pipelines, to cap certain gathering pipelines at the wellhead connection and remove any related surface equipment, and to remove certain components of gas transmission facilities from the ground.
125
The Williams Companies, Inc. | ||||
Notes to Consolidated Financial Statements – (Continued) | ||||
| ||||
The following table presents the significant changes to our ARO, of which $791 million and $497 million are included in Other noncurrent liabilities with the remaining current portion in Accrued liabilities at December 31, 2014 and 2013 , respectively.
| December 31, | ||||||
| 2014 |
| 2013 | ||||
| (Millions) | ||||||
Beginning balance | $ | 561 | |
| $ | 579 | |
Liabilities incurred | 101 | |
| 8 | | ||
Liabilities settled (1) | (21 | ) |
| (31 | ) | ||
Accretion expense | 44 | |
| 53 | | ||
Revisions (2) | 146 | |
| (48 | ) | ||
Ending balance | $ | 831 | |
| $ | 561 | |
______________
(1) | For 2014 and 2013 liabilities settled include $7 million and $25 million , respectively, related to the abandonment of certain of Transco's natural gas storage caverns that are associated with a leak in 2010. |
(2) | Several factors are considered in the annual review process, including inflation rates, current estimates for removal cost, discount rates, and the estimated remaining life of the assets. The 2014 revisions primarily reflect an increase in the estimated retirement costs for our offshore pipelines, an increase in the inflation rate and decreases in the discount rates used in the annual review process. The 2013 revision primarily reflects increases in the estimated remaining useful life of the assets. The 2013 revision also includes an increase of $9 million related to changes in the timing and method of abandonment on certain of Transco's natural gas storage caverns that were associated with a leak in 2010. |
Transco is entitled to collect in rates the amounts necessary to fund its ARO. All funds received for such retirements are deposited into an external trust account dedicated to funding its ARO (ARO Trust). (See Note 17 – Fair Value Measurements, Guarantees, and Concentration of Credit Risk .) Under its current rate settlement, Transco's annual funding obligation is approximately $36 million , with installments to be deposited monthly.
Note 12 – Goodwill and Other Intangible Assets
Goodwill
Changes in the carrying amount of goodwill by reportable segment for the periods indicated are as follows:
| Williams Partners |
| Access Midstream |
| Total | ||||||
| (Millions) | ||||||||||
December 31, 2013 | $ | 646 | |
| $ | - | |
| $ | 646 | |
Acquisition | - | |
| 474 | |
| 474 | | |||
December 31, 2014 | $ | 646 | |
| $ | 474 | |
| $ | 1,120 | |
Our goodwill is not subject to amortization, but is evaluated at least annually for impairment or more frequently if impairment indicators are present. We did not identify or recognize any impairments to goodwill in connection with our annual evaluation of goodwill for impairment (performed as of October 1) during the years ended December 31, 2014 , 2013 , and 2012 . Following a significant decline in energy commodity prices and a decline in the fair value of ACMP's publicly-traded limited partner units, both in the fourth quarter of 2014, we performed an additional impairment evaluation as of December 31, 2014 of the goodwill recorded within the Access Midstream segment. In this evaluation, our estimate of the fair value of each reporting unit exceeded its carrying value and thus no impairment losses were recognized in 2014.
126
The Williams Companies, Inc. | ||||
Notes to Consolidated Financial Statements – (Continued) | ||||
| ||||
Other Intangible Assets
The gross carrying amount and accumulated amortization of Other intangible assets – net of accumulated amortization at December 31 are as follows:
| 2014 |
| 2013 | ||||||||||||
| Gross Carrying Amount |
| Accumulated Amortization |
| Gross Carrying Amount |
| Accumulated Amortization | ||||||||
| (Millions) | ||||||||||||||
Contractual customer relationships | $ | 10,763 | |
| $ | (310 | ) |
| $ | 1,749 | |
| $ | (105 | ) |
Other intangible assets – net of accumulated amortization primarily relate to gas gathering, processing, and fractionation contractual customer relationships recognized in the ACMP, Laser, and Caiman acquisitions (See Note 2 – Acquisitions ). The intangible assets are being amortized on a straight-line basis over an initial period of 30 years which represents a portion of the term over which the contractual customer relationships are expected to contribute to our cash flows.
We expense costs incurred to renew or extend the terms of our gas gathering, processing, and fractionation contracts with customers. Based on the estimated future revenues during the contract periods (as estimated at the time of the respective acquisition), the weighted-average periods prior to the next renewal or extension of the contractual customer relationships associated with the ACMP, Laser, and Caiman acquisitions were approximately 17 years , 9 years , and 18 years , respectively. Although a significant portion of the expected future cash flows associated with these contractual customer relationships are dependent on our ability to renew or extend the arrangements beyond the initial contract periods, these expected future cash flows are significantly influenced by the scope and pace of our producer customers' drilling programs. Once producer customers' wells are connected to our gathering infrastructure, their likelihood of switching to another provider before the wells are abandoned is reduced due to the significant capital investment required.
The amortization expense related to Other intangible assets – net of accumulated amortization was $209 million , $60 million , and $43 million in 2014 , 2013 , and 2012 , respectively. The estimated amortization expense for each of the next five succeeding fiscal years is approximately $357 million .
Note 13 – Accrued Liabilities
| December 31, | ||||||
| 2014 |
| 2013 | ||||
| (Millions) | ||||||
Interest on debt | $ | 268 | |
| $ | 167 | |
Employee costs | 167 | |
| 127 | | ||
Deferred income | 82 | |
| 47 | | ||
Estimated rate refund liability | 1 | |
| 98 | | ||
Asset retirement obligations | 40 | |
| 64 | | ||
Other, including other loss contingencies | 342 | |
| 294 | | ||
| $ | 900 | |
| $ | 797 | |
127
The Williams Companies, Inc. | ||||
Notes to Consolidated Financial Statements – (Continued) | ||||
| ||||
Note 14 – Debt, Banking Arrangements, and Leases
| December 31, | ||||||
| 2014 |
| 2013 | ||||
| (Millions) | ||||||
Unsecured: |
|
|
| ||||
Transco: |
|
|
| ||||
6.4% Notes due 2016 | $ | 200 | |
| $ | 200 | |
6.05% Notes due 2018 | 250 | |
| 250 | | ||
7.08% Debentures due 2026 | 8 | |
| 8 | | ||
7.25% Debentures due 2026 | 200 | |
| 200 | | ||
5.4% Notes due 2041 | 375 | |
| 375 | | ||
4.45% Notes due 2042 | 400 | |
| 400 | | ||
Northwest Pipeline: | |
|
| ||||
7% Notes due 2016 | 175 | |
| 175 | | ||
5.95% Notes due 2017 | 185 | |
| 185 | | ||
6.05% Notes due 2018 | 250 | |
| 250 | | ||
7.125% Debentures due 2025 | 85 | |
| 85 | | ||
Pre-merger WPZ: | |
|
| ||||
3.8% Notes due 2015 (3) | 750 | |
| 750 | | ||
7.25% Notes due 2017 | 600 | |
| 600 | | ||
5.25% Notes due 2020 | 1,500 | |
| 1,500 | | ||
4.125% Notes due 2020 | 600 | |
| 600 | | ||
4% Notes due 2021 | 500 | |
| 500 | | ||
3.35% Notes due 2022 | 750 | |
| 750 | | ||
4.5% Notes due 2023 | 600 | |
| 600 | | ||
4.3% Notes due 2024 | 1,000 | |
| - | | ||
3.9% Notes due 2025 | 750 | |
| - | | ||
6.3% Notes due 2040 | 1,250 | |
| 1,250 | | ||
5.8% Notes due 2043 | 400 | |
| 400 | | ||
5.4% Notes due 2044 | 500 | |
| - | | ||
4.9% Notes due 2045 | 500 | |
| - | | ||
ACMP (1): |
|
|
| ||||
5.875% Notes due 2021 | 750 | |
| - | | ||
6.125% Notes due 2022 | 750 | |
| - | | ||
4.875% Notes due 2023 | 1,400 | |
| - | | ||
4.875% Notes due 2024 | 750 | |
| - | | ||
Credit facility loans | 640 | |
| - | | ||
The Williams Companies, Inc. (WMB): | |
|
| ||||
7.875% Notes due 2021 | 371 | |
| 371 | | ||
3.7% Notes due 2023 | 850 | |
| 850 | | ||
4.55% Notes due 2024 | 1,250 | |
| - | | ||
7.5% Debentures due 2031 | 339 | |
| 339 | | ||
7.75% Notes due 2031 | 252 | |
| 252 | | ||
8.75% Notes due 2032 | 445 | |
| 445 | | ||
5.75% Notes due 2044 | 650 | |
| - | | ||
Various - 5.5% to 10.25% Notes and Debentures due 2019 to 2033 | 55 | |
| 55 | | ||
Credit facility loans | 370 | |
| - | | ||
Capital lease obligations | 5 | |
| 1 | | ||
Net unamortized debt premium (discount) (2) | 187 | |
| (37 | ) | ||
Total long-term debt, including current portion | 20,892 | |
| 11,354 | | ||
Long-term debt due within one year | (4 | ) |
| (1 | ) | ||
Long-term debt | $ | 20,888 | |
| $ | 11,353 | |
________________
(1) See Note 2 – Acquisitions .
(2) Includes premium related to the fair value of ACMP debt. See Note 2 – Acquisitions .
(3) Presented as long-term debt due to the merged partnership's intent and ability to refinance.
128
The Williams Companies, Inc. | ||||
Notes to Consolidated Financial Statements – (Continued) | ||||
| ||||
Certain of our debt agreements contain covenants that restrict or limit, among other things, our ability to create liens supporting indebtedness, sell assets, and incur additional debt. Default of these agreements could also restrict our ability to make certain distributions or repurchase equity.
The following table presents aggregate minimum maturities of long-term debt, excluding net unamortized debt premium (discount) and capital lease obligations, for each of the next five years:
| December 31, 2014 | ||
| (Millions) | ||
2015 | $ | - | |
2016 | 375 | | |
2017 | 785 | | |
2018 | 1,510 | | |
2019 | 32 | | |
Issuances and retirements
The merged partnership retired $750 million of 3.8 percent senior unsecured notes that matured on February 15, 2015.
On June 27, 2014, Pre-merger WPZ completed a public offering of $750 million of 3.9 percent senior unsecured notes due 2025 and $500 million of 4.9 percent senior unsecured notes due 2045. Pre-merger WPZ used the net proceeds to repay amounts outstanding under its commercial paper program, to fund capital expenditures, and for general partnership purposes.
On June 24, 2014, we completed a public offering of $1.25 billion of 4.55 percent senior unsecured notes due 2024 and $650 million of 5.75 percent unsecured notes due 2044. We used the net proceeds to finance a portion of the ACMP Acquisition. (See Note 2 – Acquisitions .)
On March 4, 2014, Pre-merger WPZ completed a public offering of $1 billion of 4.3 percent senior unsecured notes due 2024 and $500 million of 5.4 percent senior unsecured notes due 2044. Pre-merger WPZ used the net proceeds to repay amounts outstanding under its commercial paper program, to fund capital expenditures, and for general partnership purposes.
On November 15, 2013, Pre-merger WPZ completed a public offering of $600 million of 4.5 percent senior unsecured notes due 2023 and $400 million of 5.8 percent senior unsecured notes due 2043. Pre-merger WPZ used the net proceeds to repay amounts outstanding under its commercial paper program, to fund capital expenditures, and for general partnership purposes.
129
The Williams Companies, Inc. | ||||
Notes to Consolidated Financial Statements – (Continued) | ||||
| ||||
| December 31, 2014 | ||||||
| Available |
| Outstanding | ||||
| (Millions) | ||||||
Pre-merger WPZ credit facility (1)(3) |
|
|
| ||||
Loans | $ | 2,500 | |
| $ | - | |
Letters of credit sub-limit | 1,300 | |
| - | | ||
Letters of credit under certain bilateral bank agreements |
|
| 1 | | |||
ACMP credit facility (2) |
|
|
| ||||
Loans | 1,750 | |
| 640 | | ||
Letters of credit sub-limit | 200 | |
| 2 | | ||
Swing line advances sub-limit | 100 | |
| - | | ||
WMB credit facility (1) |
|
|
| ||||
Loans | 1,500 | |
| 370 | | ||
Letters of credit sub-limit | 700 | |
| - | | ||
Letters of credit under certain bilateral bank agreements |
|
| 15 | | |||
________________
(1) Under certain conditions, the amount available may be increased up to an additional $500 million.
(2) Under certain conditions, the amount available may be increased up to an additional $250 million .
(3) Transco and Northwest Pipeline are each able to borrow up to $500 million under this credit facility to the extent not otherwise utilized by the other co-borrowers.
The agreements governing the credit facilities contain these terms and conditions:
• | Various covenants may limit, among other things, a borrower's and its material subsidiaries' ability to grant certain liens supporting indebtedness, a borrower's ability to merge or consolidate, sell all or substantially all of its assets, enter into certain affiliate transactions, make certain distributions during an event of default, make investments, and allow any material change in the nature of its business. |
• | If an event of default with respect to a borrower occurs under its respective credit facility, the lenders will be able to terminate the commitments for the respective borrowers and accelerate the maturity of any loans of the defaulting borrower under the respective credit facility agreement and exercise other rights and remedies. |
• | Each time funds are borrowed under our credit facility, the borrower may choose from two methods of calculating interest: a fluctuating base rate equal to the bank's alternate base rate plus an applicable margin or a periodic fixed rate equal to LIBOR plus an applicable margin. The borrower is required to pay a commitment fee based on the unused portion of its respective credit facility. The applicable margin and the commitment fee are determined for us by reference to a pricing schedule based on our senior unsecured long-term debt ratings. |
• | Each time funds were borrowed under Pre-merger WPZ's credit facilities, the applicable borrower could choose from two methods of calculating interest: a fluctuating base rate equal to the bank's alternate base rate plus an applicable margin or a periodic fixed rate equal to LIBOR plus an applicable margin. The applicable borrower was required to pay a commitment fee based on the unused portion of its respective credit facility. The applicable margin and the commitment fee were determined for each borrower by reference to a pricing schedule based on such borrower's senior unsecured long-term debt ratings. |
• | Each time funds were borrowed under ACMP's credit facility, ACMP may choose from two methods of calculating interest: (1) the greater of (a) the reference rate of Wells Fargo Bank, NA, (b) the federal funds effective rate plus 0.50 percent or (c) the Eurodollar rate which is based on LIBOR plus 1.00 percent , each of which is subject to a margin that varies from 0.50 percent to 1.50 percent , according to ACMP's leverage ratio |
130
The Williams Companies, Inc. | ||||
Notes to Consolidated Financial Statements – (Continued) | ||||
| ||||
(as defined in the agreement), or (2) the Eurodollar rate plus a margin that varies from 1.50 percent to 2.50 percent , according to ACMP's leverage ratio. The revolving credit facility is secured by all of ACMP's assets. If ACMP reaches investment grade status, ACMP will have the option to release the security under the credit facility and amounts borrowed will bear interest under a specified ratings-based pricing grid. ACMP is required to pay a commitment fee based on the unused portion of its respective credit facility of (a) 0.25 percent to 0.375 percent while it is subject to the leverage-based pricing grid, according to its leverage ratio and (b) 0.15 percent to 0.30 percent while it is subject to the ratings-based pricing grid, according to its senior unsecured long-term debt ratings.
WMB credit facility
On June 27, 2014, we entered into Amendment No. 1 to the First Amended & Restated Credit Agreement, dated as of July 31, 2013. The amendment changed certain defined terms and provisions concerning the maintenance of ownership of the general partner of WPZ and the indebtedness of certain of our subsidiaries that act as general partner of WPZ and of ACMP and increased our permitted financial covenant thresholds.
On February 2, 2015, we entered into the Second Amended and Restated Credit Agreement. The aggregate commitments available remain at $1.5 billion , with up to an additional $500 million increase in aggregate commitments available under certain circumstances. The maturity date of the credit facility is extended to February 2, 2020. However, we may request an extension of the maturity date for an additional one year period, up to two times, to allow a maturity date as late as February 2, 2022, under certain circumstances. The agreement also allows for swing line loans up to an aggregate amount of $50 million , subject to available capacity under the credit facility, and decreases the letters of credit commitments to $675 million .
Our significant financial covenants under the agreement require the ratio of debt to EBITDA (each as defined in the credit agreement) be no greater than 5 to 1, except for the fiscal quarter and the two following fiscal quarters in which one or more acquisitions has been executed, in which case the ratio of debt to EBITDA is to be no greater than 5.5 to 1.
We are in compliance with these financial covenants as measured at December 31, 2014. At February 24, 2015, we have no borrowings outstanding under our credit facility.
Pre-merger WPZ credit facility
On December 1, 2014, Pre-merger WPZ, Transco, and Northwest Pipeline entered into Amendment No.1 and Consent to the First Amended & Restated Credit Agreement, dated as of July 31, 2013. The amendment provided the consent of the lenders for this credit agreement to continue for ACMP upon consummation of the Merger and the termination of ACMP's existing credit agreement. In addition, the amendment provided the consent that certain existing liens and guarantees of indebtedness of ACMP to be terminated in connection with the Merger would not become liens and guarantees of indebtedness under this credit agreement.
On February 2, 2015, the Pre-merger WPZ credit facility was terminated in connection with the Merger.
ACMP credit facility
On February 2, 2015, the ACMP credit facility loans outstanding were paid and terminated in connection with the Merger.
Credit facilities for the merged partnership
On February 2, 2015, the merged partnership, Transco, Northwest Pipeline, the lenders named therein, and an administrative agent entered into the Second Amended & Restated Credit Agreement with aggregate commitments available of $3.5 billion , with up to an additional $500 million increase in aggregate commitments available under certain circumstances. The maturity date of the credit facility is February 2, 2020. However, the co-borrowers may request an extension of the maturity date for an additional one year period, up to two times to allow a maturity date as
131
The Williams Companies, Inc. | ||||
Notes to Consolidated Financial Statements – (Continued) | ||||
| ||||
late as February 2, 2022, under certain circumstances. The agreement allows for swingline loans up to an aggregate amount of $150 million , subject to available capacity under the credit facility, and letters of credit commitments of $1.125 billion . Transco and Northwest Pipeline are each able to borrow up to $500 million under this credit facility to the extent not otherwise utilized by the other co-borrowers.
The agreement governing this credit facility contains the following terms and conditions:
• | Various covenants may limit, among other things, a borrower's and its material subsidiaries' ability to grant certain liens supporting indebtedness, a borrower's ability to merge or consolidate, sell all or substantially all of its assets, enter into certain affiliate transactions, make certain distributions during an event of default, enter into certain restrictive agreements, and allow any material change in the nature of its business. |
• | If an event of default with respect to a borrower occurs under the credit facility, the lenders will be able to terminate the commitments for all borrowers and accelerate the maturity of any loans of the defaulting borrower under the credit facility agreement and exercise other rights and remedies. |
• | Other than swingline loans, each time funds are borrowed, the borrower must choose whether such borrowing will be an alternate base rate borrowing or a Eurodollar borrowing. If such borrowing is an alternate base rate borrowing, interest is calculated on the basis of the greater of (a) the Prime Rate, (b) the Federal Funds Effective Rate plus ½ of 1 percent and (c) a periodic fixed rate equal to the London Interbank Offered Rate (LIBOR) plus 1 percent , plus, in the case of each of (a), (b) and (c), an applicable margin. If the borrowing is a Eurodollar borrowing, interest is calculated on the basis of LIBOR for the relevant period plus an applicable margin. Interest on swingline loans is calculated as the sum of the alternate base rate plus an applicable margin. The borrower is required to pay a commitment fee based on the unused portion of the credit facility. The applicable margin and the commitment fee are determined for each borrower by reference to a pricing schedule based on such borrower's senior unsecured long-term debt ratings. |
Significant financial covenants require:
• | The ratio of debt to EBITDA (each as defined in the credit facility) to be no greater than 5 to 1, except for the fiscal quarter and the two following fiscal quarters in which one or more acquisitions has been executed, in which case the ratio of debt to EBITDA is to be no greater than 5.5 to 1. |
• | The ratio of debt to capitalization (defined as net worth plus debt) must be no greater than 65 percent for each Transco and Northwest Pipeline. |
On February 3, 2015, the merged partnership entered into a Credit Agreement providing for a $1.5 billion short-term credit facility with a maturity date of August 3, 2015 with an option to extend the maturity date to February 2, 2016 subject to certain circumstances. The short-term credit facility has substantially the same covenants as our $3.5 billion credit facility. Under our short-term credit facility any time funds are borrowed, the merged partnership must choose whether such borrowing will be an alternate base rate borrowing or a Eurodollar borrowing. Interest is calculated on each of these types of borrowings in the same manner as under the $3.5 billion credit facility. The merged partnership is required to pay a commitment fee based on the unused portion of the short-term credit facility. The applicable margin and the commitment fee are determined by reference to a pricing schedule based on our senior unsecured long-term debt ratings.
The merged partnership is in compliance with these financial covenants as measured at December 31, 2014.
As of February 24, 2015, $1.3 billion is outstanding under the long-term credit facility.
132
The Williams Companies, Inc. | ||||
Notes to Consolidated Financial Statements – (Continued) | ||||
| ||||
Commercial Paper Program
Pre-merger WPZ's commercial paper program allows a maximum outstanding amount at any time of $2 billion of unsecured commercial paper notes. The maturities of the commercial paper notes vary but may not exceed 397 days from the date of issuance. The commercial paper notes are sold under customary terms in the commercial paper market and are issued at a discount from par, or, alternatively, are sold at par and bear varying interest rates on a fixed or floating basis. Proceeds from these notes are used for general partnership purposes, including funding capital expenditures, working capital, and partnership distributions. We classify Pre-merger WPZ's commercial paper outstanding in Current liabilities in the Consolidated Balance Sheet , as the outstanding notes at December 31, 2014 and December 31, 2013 , having maturity dates less than three months from the date of issuance. At December 31, 2014 , Pre-merger WPZ had $798 million in Commercial paper outstanding at a weighted average interest rate of 0.92 percent and at December 31, 2013 , Pre-merger WPZ had $225 million in Commercial paper outstanding at a weighted average interest rate of 0.42 percent .
On February 2, 2015, the merged partnership amended and restated the commercial paper program to allow a maximum outstanding of $3 billion of unsecured commercial paper notes. As of February 24, 2015, $1.8 billion is outstanding under this program.
Cash Payments for Interest (Net of Amounts Capitalized)
Cash payments for interest (net of amounts capitalized) were $681 million in 2014, $472 million in 2013, and $479 million in 2012.
Restricted Net Assets of Subsidiaries
We have considered the guidance in the Securities and Exchange Commission's Regulation S-X related to restricted net assets of subsidiaries. In accordance with Rule 4-08(e) of Regulation S-X, we have determined that certain net assets of our subsidiaries are considered restricted under this guidance and exceed 25 percent of our consolidated net assets. As of December 31, 2014, substantially all of these restricted net assets relate to the net assets of Pre-merger WPZ and ACMP, which are technically considered restricted under this accounting rule due to terms within WPZ's and ACMP's partnership agreements that govern the partnerships' assets. Our interest in Pre-merger WPZ's and ACMP's net assets that are considered to be restricted at December 31, 2014 was $15 billion .
Leases-Lessee
The future minimum annual rentals under noncancelable operating leases, are payable as follows:
| December 31, 2014 | ||
| (Millions) | ||
2015 | $ | 83 | |
2016 | 71 | | |
2017 | 55 | | |
2018 | 41 | | |
2019 | 33 | | |
Thereafter | 129 | | |
Total | $ | 412 | |
Total rent expense was $109 million in 2014, $58 million in 2013, and $56 million in 2012 and primarily included in Operating and maintenance expenses and Selling, general, and administrative expenses in the Consolidated Statement of Income .
133
The Williams Companies, Inc. | ||||
Notes to Consolidated Financial Statements – (Continued) | ||||
| ||||
Note 15 – Stockholders' Equity
Cash dividends declared per common share were $1.9575 , $1.4375 and $1.19625 for 2014 , 2013 , and 2012 , respectively.
On June 23, 2014, we issued 61 million shares of common stock in a public offering at a price of $57.00 per share. That amount includes 8 million shares purchased pursuant to the full exercise of the underwriter's option to purchase additional shares. The net proceeds of $3.378 billion were used in July 2014 to finance a portion of the ACMP Acquisition. (See Note 2 – Acquisitions .)
Our Stockholder Rights Plan expired in September 2014 and no actions were taken to extend the plan.
AOCI
The following table presents the changes in AOCI by component, net of income taxes:
| Cash Flow Hedges |
| Foreign Currency Translation |
| Pension and Other Post Retirement Benefits |
| Total | ||||||||
| (Millions) | ||||||||||||||
Balance at December 31, 2013 | $ | (1 | ) |
| $ | 128 | |
| $ | (291 | ) |
| $ | (164 | ) |
Other comprehensive income (loss) before reclassifications | - | |
| (77 | ) |
| (101 | ) |
| (178 | ) | ||||
Amounts reclassified from accumulated other comprehensive income (loss) | - | |
| - | |
| 21 | |
| 21 | | ||||
Other comprehensive income (loss) | - | |
| (77 | ) |
| (80 | ) |
| (157 | ) | ||||
Changes in ownership of consolidated subsidiaries, net | - | |
| (20 | ) |
| - | |
| (20 | ) | ||||
Balance at December 31, 2014 | $ | (1 | ) |
| $ | 31 | |
| $ | (371 | ) |
| $ | (341 | ) |
Reclassifications out of AOCI are presented in the following table by component for the year ended December 31, 2014 :
Component |
| Reclassifications |
| Classification | ||
|
| (Millions) |
|
| ||
Pension and other postretirement benefits: |
|
|
|
| ||
Amortization of prior service cost (credit) included in net periodic benefit cost |
| $ | (8 | ) |
| Note 9 – Employee Benefit Plans |
Amortization of actuarial (gain) loss included in net periodic benefit cost |
| 41 | |
| Note 9 – Employee Benefit Plans | |
Total pension and other postretirement benefits, before income taxes |
| 33 | |
|
| |
Income tax benefit |
| (12 | ) |
| Provision (benefit) for income taxes | |
Reclassifications during the period |
| $ | 21 | |
|
|
Note 16 – Equity-Based Compensation
Williams Plan Information
On May 17, 2007, our stockholders approved The Williams Companies, Inc. 2007 Incentive Plan (the Plan) that provides common-stock-based awards to both employees and nonmanagement directors and reserved 19 million new shares for issuance. On May 20, 2010 and May 22, 2014, our stockholders approved amendments and restatements of the Plan to increase by 11 million and 10 million , respectively, the number of new shares authorized for making awards
134
The Williams Companies, Inc. | ||||
Notes to Consolidated Financial Statements – (Continued) | ||||
| ||||
under the Plan, among other changes. The Plan permits the granting of various types of awards including, but not limited to, restricted stock units and stock options. At December 31, 2014 , 31 million shares of our common stock were reserved for issuance pursuant to existing and future stock awards, of which 22 million shares were available for future grants.
Additionally, on May 17, 2007, our stockholders approved an Employee Stock Purchase Plan (ESPP) which authorizes up to 2 million new shares of our common stock to be available for sale under the ESPP. On May 22, 2014, our stockholders approved an amendment and restatement of the 2007 ESPP to increase by 1.6 million the number of new shares authorized for sale under the ESPP. The ESPP enables eligible participants to purchase our common stock through payroll deductions not exceeding an annual amount of $15,000 per participant. The ESPP provides for offering periods during which shares may be purchased and continues until the earliest of (1) the Board of Directors terminates the ESPP, (2) the sale of all shares available under the ESPP, or (3) the tenth anniversary of the date the ESPP was approved by the stockholders. Offering periods are from January through June and from July through December. Generally, all employees are eligible to participate in the ESPP, with the exception of executives and international employees. The number of shares eligible for an employee to purchase during each offering period is limited to 750 shares. The purchase price of the stock is 85 percent of the lower closing price of either the first or the last day of the offering period. The ESPP requires a one-year holding period before the stock can be sold. Employees purchased 193 thousand shares at an average price of $35.33 per share during 2014 . Approximately 1.8 million shares were available for purchase under the ESPP at December 31, 2014 .
Operating and maintenance expenses and Selling, general and administrative expenses include equity-based compensation expense for the years ended December 31, 2014 , 2013 , and 2012 of $44 million , $37 million , and $36 million , respectively. Income tax benefit recognized related to the stock-based compensation expense for the years ended December 31, 2014 , 2013 , and 2012 was $17 million , $14 million , and $13 million , respectively. Measured but unrecognized stock-based compensation expense at December 31, 2014 , was $63 million , which does not include the effect of estimated forfeitures of $2 million . This amount is comprised of $4 million related to stock options and $59 million related to restricted stock units. These amounts are expected to be recognized over a weighted-average period of 2.0 years.
Stock Options
Stock options are valued at the date of award, which does not precede the approval date. The purchase price per share for stock options may not be less than the market price of the underlying stock on the date of grant. Stock options generally become exercisable over a three -year period from the date of grant. Stock options generally expire ten years after the grant.
The following summary reflects stock option activity and related information for the year ended December 31, 2014 :
Stock Options | Options |
| Weighted- Average Exercise Price |
| Aggregate Intrinsic Value | |||||
| (Millions) |
|
|
| (Millions) | |||||
Outstanding at December 31, 2013 | 6.7 | |
| $ | 21.82 | |
|
| ||
Granted | 0.8 | |
| $ | 41.76 | |
|
| ||
Exercised | (1.7 | ) |
| $ | 17.93 | |
|
| ||
Outstanding at December 31, 2014 | 5.8 | |
| $ | 25.86 | |
| $ | 110 | |
Exercisable at December 31, 2014 | 4.0 | |
| $ | 21.25 | |
| $ | 96 | |
135
The Williams Companies, Inc. | ||||
Notes to Consolidated Financial Statements – (Continued) | ||||
| ||||
The following table summarizes additional information related to stock option activity during each of the last three years:
| Years Ended December 31, | ||||||||||
| 2014 |
| 2013 |
| 2012 | ||||||
| (Millions) | ||||||||||
Total intrinsic value of options exercised | $ | 48 | |
| $ | 23 | |
| $ | 69 | |
Tax benefits realized on options exercised | $ | 18 | |
| $ | 9 | |
| $ | 25 | |
Cash received from the exercise of options | $ | 31 | |
| $ | 13 | |
| $ | 50 | |
The weighted-average remaining contractual life for stock options outstanding and exercisable at December 31, 2014 , was 5.4 years and 4.2 years, respectively.
The estimated fair value at date of grant of options for our common stock granted in each respective year, using the Black-Scholes option pricing model, is as follows:
| 2014 |
| 2013 |
| 2012 | ||||||
Weighted-average grant date fair value of options for our common stock granted during the year, per share | $ | 7.50 | |
| $ | 5.94 | |
| $ | 5.65 | |
Weighted-average assumptions: |
|
|
|
|
| ||||||
Dividend yield | 4.2 | % |
| 4.3 | % |
| 3.7 | % | |||
Volatility | 28.0 | % |
| 29.7 | % |
| 30.0 | % | |||
Risk-free interest rate | 2.2 | % |
| 1.4 | % |
| 1.3 | % | |||
Expected life (years) | 6.5 | |
| 6.5 | |
| 6.5 | | |||
The 2014 expected dividend yield is based on the 2014 dividend forecast and the grant-date market price of our stock. Expected volatility is based on the average of our peer group 10 -year historical volatility adjusted by a ratio of our implied volatility to the average of our peer group's implied volatility. The adjustment is made because the difference in implied volatility between our peer group and us may indicate that we are expected to be more volatile than our peer group average. The risk-free interest rate is based on the U.S. Treasury Constant Maturity rates as of the grant date. The expected life of the option is based on historical exercise behavior and expected future experience.
Nonvested Restricted Stock Units
The following summary reflects nonvested restricted stock unit activity and related information for the year ended December 31, 2014 .
Restricted Stock Units Outstanding | Shares |
| Weighted- Average Fair Value (1) | |||
| (Millions) |
|
| |||
Nonvested at December 31, 2013 | 3.5 | |
| $ | 27.16 | |
Granted | 1.4 | |
| $ | 42.79 | |
Forfeited | (0.1 | ) |
| $ | 29.57 | |
Vested | (1.2 | ) |
| $ | 24.07 | |
Nonvested at December 31, 2014 | 3.6 | |
| $ | 33.90 | |
______________
(1) | Performance-based restricted stock units are valued utilizing a Monte Carlo valuation method using measures of total shareholder return. Certain of the performance based restricted stock units are subject to a holding period of up to two years after the vesting date. Discounts for the restrictions of liquidity were applied to the estimated fair value at the date of the awards and ranged from 5.83 percent to 15.58 percent . The discounts were developed using the Chaffe model and the Finnerty model. All other restricted stock units are valued at the grant-date market |
136
The Williams Companies, Inc. | ||||
Notes to Consolidated Financial Statements – (Continued) | ||||
| ||||
price or the grant-date market price less dividends projected to be paid over the vesting period. Restricted stock units generally vest after three years .
Value of Restricted Stock Units | 2014 |
| 2013 |
| 2012 | ||||||
Weighted-average grant date fair value of restricted stock units granted during the year, per share | $ | 42.79 | |
| $ | 30.43 | |
| $ | 20.61 | |
Total fair value of restricted stock units vested during the year ($'s in millions) | $ | 27 | |
| $ | 27 | |
| $ | 22 | |
Performance-based restricted stock units granted under the Plan represent 39 percent of nonvested restricted stock units outstanding at December 31, 2014 . These grants may be earned at the end of the vesting period based on actual performance against a performance target. Based on the extent to which certain financial targets are achieved, vested shares may range from zero percent to 500 percent of the original grant amount.
ACMP Plan Information
Certain employees of ACMP's general partner received equity-based compensation through ACMP's equity-based compensation programs. The fair value of the awards issued was determined based on the fair market value of the units of ACMP on the date of grant. This value is being amortized over the vesting period, which is one to four years from the date of grant. Beginning in 2015 certain of these employees will transition to our equity-based compensation plans. No additional awards of units through ACMP's equity-based compensation programs are expected. Included in Operating and maintenance expenses ; Selling, general, and administrative expenses ; and Equity earnings (losses) is equity-based compensation expense of $11 million related to ACMP's equity-based compensation program. As of December 31, 2014, there was $65 million of unrecognized compensation expense attributable to the outstanding awards, which does not include the effect of estimated forfeitures of $6 million . These amounts are expected to be recognized over a weighted average period of 2.3 years .
The following summary reflects nonvested ACMP restricted stock unit activity and related information for the six months ended December 31, 2014 :
Restricted Stock Units Outstanding | Units |
| Weighted- Average Fair Value | |||
| (Millions) |
|
| |||
Granted | 1.3 | |
| $ | 59.67 | |
Forfeited | - | |
| $ | 63.89 | |
Vested | - | |
| $ | 63.75 | |
Nonvested at December 31, 2014 | 1.3 | |
| $ | 59.35 | |
137
The Williams Companies, Inc. | ||||
Notes to Consolidated Financial Statements – (Continued) | ||||
| ||||
Note 17 – Fair Value Measurements, Guarantees, and Concentration of Credit Risk
The following table presents, by level within the fair value hierarchy, certain of our financial assets and liabilities. The carrying values of cash and cash equivalents, accounts receivable, commercial paper, and accounts payable approximate fair value because of the short-term nature of these instruments. Therefore, these assets and liabilities are not presented in the following table.
|
|
|
|
| Fair Value Measurements Using | ||||||||||||||
| Carrying Amount |
| Fair Value |
| Quoted Prices In Active Markets for Identical Assets (Level 1) |
| Significant Other Observable Inputs (Level 2) |
| Significant Unobservable Inputs (Level 3) | ||||||||||
| (Millions) | ||||||||||||||||||
Assets (liabilities) at December 31, 2014: |
|
|
|
|
|
|
|
|
| ||||||||||
Measured on a recurring basis: |
|
|
|
|
|
|
|
|
| ||||||||||
ARO Trust investments | $ | 48 | |
| $ | 48 | |
| $ | 48 | |
| $ | - | |
| $ | - | |
Energy derivatives assets not designated as hedging instruments | 3 | |
| 3 | |
| 1 | |
| - | |
| 2 | | |||||
Energy derivatives liabilities not designated as hedging instruments | (2 | ) |
| (2 | ) |
| - | |
| - | |
| (2 | ) | |||||
Additional disclosures: |
|
|
|
|
|
|
|
|
| ||||||||||
Notes receivable and other | 30 | |
| 57 | |
| - | |
| 4 | |
| 53 | | |||||
Long-term debt, including current portion (1) | (20,887 | ) |
| (21,131 | ) |
| - | |
| (21,131 | ) |
| - | | |||||
Guarantee | (31 | ) |
| (27 | ) |
| - | |
| (27 | ) |
| - | | |||||
Assets (liabilities) at December 31, 2013: |
|
|
|
|
|
|
|
|
| ||||||||||
Measured on a recurring basis: |
|
|
|
|
|
|
|
|
| ||||||||||
ARO Trust investments | $ | 33 | |
| $ | 33 | |
| $ | 33 | |
| $ | - | |
| $ | - | |
Energy derivatives assets not designated as hedging instruments | 3 | |
| 3 | |
| - | |
| - | |
| 3 | | |||||
Energy derivatives liabilities not designated as hedging instruments | (3 | ) |
| (3 | ) |
| - | |
| (1 | ) |
| (2 | ) | |||||
Additional disclosures: |
|
|
|
|
|
|
|
|
| ||||||||||
Notes receivable and other | 77 | |
| 140 | |
| 1 | |
| 6 | |
| 133 | | |||||
Long-term debt, including current portion (1) | (11,353 | ) |
| (11,971 | ) |
| - | |
| (11,971 | ) |
| - | | |||||
Guarantee | (32 | ) |
| (29 | ) |
| - | |
| (29 | ) |
| - | | |||||
________________
(1) Excludes capital leases
Fair Value Methods
We use the following methods and assumptions in estimating the fair value of our financial instruments:
Assets and liabilities measured at fair value on a recurring basis
ARO Trust investments : Transco deposits a portion of its collected rates, pursuant to its rate case settlement, into an external trust (ARO Trust) that is specifically designated to fund future asset retirement obligations. The ARO Trust invests in a portfolio of actively traded mutual funds that are measured at fair value on a recurring basis based on quoted prices in an active market, is classified as available-for-sale, and is reported in Regulatory assets, deferred charges, and other in the Consolidated Balance Sheet. Both realized and unrealized gains and losses are ultimately recorded as regulatory assets or liabilities.
138
The Williams Companies, Inc. | ||||
Notes to Consolidated Financial Statements – (Continued) | ||||
| ||||
Energy derivatives : Energy derivatives include commodity based exchange-traded contracts and over-the-counter (OTC) contracts, which consist of physical forwards, futures, and swaps that are measured at fair value on a recurring basis. The fair value amounts are presented on a gross basis and do not reflect the netting of asset and liability positions permitted under the terms of our master netting arrangements. Further, the amounts do not include cash held on deposit in margin accounts that we have received or remitted to collateralize certain derivative positions. Energy derivatives assets are reported in Other current assets and deferred charges and Regulatory assets, deferred charges, and other in the Consolidated Balance Sheet. Energy derivatives liabilities are reported in Accrued liabilities and Other noncurrent liabilities in the Consolidated Balance Sheet.
Reclassifications of fair value between Level 1, Level 2, and Level 3 of the fair value hierarchy, if applicable, are made at the end of each quarter. No transfers between Level 1 and Level 2 occurred during the years ended December 31, 2014 or 2013 .
Additional fair value disclosures
Notes receivable and other: Notes receivable and other consists of various notes, including a receivable related to the sale of certain former Venezuela assets. The disclosed fair value of this receivable is determined by an income approach. We calculated the net present value of a probability-weighted set of cash flows utilizing assumptions based on contractual terms, historical payment patterns by the counterparty, future probabilities of default, our likelihood of using arbitration if the counterparty does not perform, and discount rates. We determined the fair value of the receivable to be $53 million at December 31, 2014 . The carrying value of this receivable is $25 million at December 31, 2014 . The current and noncurrent portions are reported in Accounts and notes receivable, net and Regulatory assets, deferred charges, and other , respectively, in the Consolidated Balance Sheet.
At December 31, 2013, notes receivable and other also included a receivable from our former affiliate, WPX, related to various proceedings involving prices charged for power in California and other western states (see Note 18 – Contingent Liabilities and Commitments ). In second quarter 2014, the proceedings related to this receivable were settled, and we received $42 million and recorded pretax Income (loss) from discontinued operations of $7 million .
Long-term debt : The disclosed fair value of our long-term debt is determined by a market approach using broker quoted indicative period-end bond prices. The quoted prices are based on observable transactions in less active markets for our debt or similar instruments.
Guarantee : The guarantee represented in the table consists of a guarantee we have provided in the event of nonpayment by our previously owned communications subsidiary, Williams Communications Group (WilTel), on a lease performance obligation that extends through 2042.
To estimate the disclosed fair value of the guarantee, an estimated default rate is applied to the sum of the future contractual lease payments using an income approach. The estimated default rate is determined by obtaining the average cumulative issuer-weighted corporate default rate based on the credit rating of WilTel's current owner and the term of the underlying obligation. The default rate is published by Moody's Investors Service. This guarantee is reported in Accrued liabilities in the Consolidated Balance Sheet.
Assets and liabilities measured at fair value on a nonrecurring basis
During 2014, we designated certain equipment within our Williams Partners segment as held for sale. The estimated fair value (less cost to sell) of the equipment at December 31, 2014, is $32 million and is reported in Other current assets and deferred charges in the Consolidated Balance Sheet. The estimated fair value was determined by a market approach based on our analysis of information related to sales of similar pre-owned equipment in the principal market. This analysis resulted in impairment charges of $27 million , recorded in Other (income) expense – net within Costs and expenses . This nonrecurring fair value measurement fell within Level 3 of the fair value hierarchy.
In December 2014, certain materials and equipment within our Access Midstream segment was designated as held for sale. The estimated fair value (less cost to sell) of the equipment at December 31, 2014, is $1 million and is reported
139
The Williams Companies, Inc. | ||||
Notes to Consolidated Financial Statements – (Continued) | ||||
| ||||
in Other current assets and deferred charges in the Consolidated Balance Sheet. The estimated fair value was determined by a market approach based on our analysis of information related to sales of similar pre-owned equipment in the principal market. This analysis resulted in an impairment charge of $12 million , which is included in Other (income) expense – net within Costs and expenses . This nonrecurring fair value measurement fell within Level 3 of the fair value hierarchy.
Guarantees
We are required by our revolving credit agreements to indemnify lenders for certain taxes required to be withheld from payments due to the lenders and for certain tax payments made by the lenders. The maximum potential amount of future payments under these indemnifications is based on the related borrowings and such future payments cannot currently be determined. These indemnifications generally continue indefinitely unless limited by the underlying tax regulations and have no carrying value. We have never been called upon to perform under these indemnifications and have no current expectation of a future claim.
Regarding our previously described guarantee of WilTel's lease performance, the maximum potential exposure is approximately $34 million at December 31, 2014 . Our exposure declines systematically throughout the remaining term of WilTel's obligation.
We have provided guarantees in the event of nonpayment by our previously owned subsidiary, WPX, on certain contracts, primarily a natural gas purchase contract extending through 2023. We estimate the maximum undiscounted potential future payment obligation under these remaining guarantees is approximately $44 million at December 31, 2014 . Our recorded liability for these guarantees, which considers our estimate of the fair value of the guarantees, is insignificant.
Concentration of Credit Risk
Cash equivalents
Our cash equivalents are primarily invested in funds with high-quality, short-term securities and instruments that are issued or guaranteed by the U.S. government.
Accounts and notes receivable
The following table summarizes concentration of receivables, net of allowances.
| December 31, | ||||||
| 2014 |
| 2013 | ||||
| (Millions) | ||||||
NGLs, natural gas, and related products and services | $ | 730 | |
| $ | 341 | |
Transportation of natural gas and related products | 175 | |
| 193 | | ||
Income tax receivable | 167 | |
| 74 | | ||
Other | 67 | |
| 66 | | ||
Total | $ | 1,139 | |
| $ | 674 | |
Customers include producers, distribution companies, industrial users, gas marketers and pipelines primarily located in the continental United States and Canada. As a general policy, collateral is not required for receivables, but customers' financial condition and credit worthiness are evaluated regularly. On December 31, 2014 , one customer accounted for $308 million of the consolidated Accounts and notes receivable balance.
140
The Williams Companies, Inc. | ||||
Notes to Consolidated Financial Statements – (Continued) | ||||
| ||||
Revenues
In 2014 , 2013 , and 2012 , we had one customer in our Williams Partners segment that accounted for 5 percent , 9 percent and 14 percent of our consolidated revenues, respectively. In 2014 we also had a customer, primarily within our Access Midstream segment, that accounted for 9 percent of our consolidated revenues.
Note 18 – Contingent Liabilities and Commitments
Indemnification of WPX
We have agreed to indemnify our former affiliate, WPX and its subsidiaries, related to the following matter.
Reporting of natural gas-related information to trade publications
Direct and indirect purchasers of natural gas in various states filed class actions against WPX and others alleging the manipulation of published gas price indices and seeking unspecified amounts of damages. Such actions were transferred to the Nevada federal district court for consolidation of discovery and pre-trial issues.
In 2011, the Nevada district court granted WPX's joint motions for summary judgment to preclude the plaintiffs' state law claims because the federal Natural Gas Act gives the FERC exclusive jurisdiction to resolve those issues. The court also denied the plaintiffs' class certification motion as moot. The plaintiffs appealed the court's ruling and on April 10, 2013, the Ninth Circuit Court of Appeals reversed the district court and remanded the cases to the district court to permit the plaintiffs to pursue their state antitrust claims for natural gas sales that were not subject to FERC jurisdiction under the Natural Gas Act. On July 1, 2014, the U.S. Supreme Court agreed to hear the cases. Because of the uncertainty around the remaining pending unresolved issues, including an insufficient description of the purported classes and other related matters, we cannot reasonably estimate a range of potential exposures at this time. However, it is reasonably possible that the ultimate resolution of these items and our related indemnification obligation could result in future charges that may be material to our results of operations. In connection with this indemnification, we have an accrued liability balance associated with this matter, and as a result, have an indirect exposure to future developments in this matter.
Other Legal Matters
Geismar Incident
As a result of the previously discussed Geismar Incident, there were two fatalities and numerous individuals (including employees and contractors) reported injuries, which varied from minor to serious. We are addressing the following matters in connection with the Geismar Incident.
On June 28, 2013, the Louisiana Department of Environmental Quality (LDEQ) issued a Consolidated Compliance Order & Notice of Potential Penalty that consolidates claims of unpermitted emissions and other deviations under the Clean Air Act that the parties had been negotiating since 2010 and alleged unpermitted emissions arising from the Geismar Incident. On November 12, 2014, the LDEQ issued a Notice of Potential Penalty for the alleged violations. LDEQ then issued a Penalty Assessment on November 21, 2014. We paid a penalty of $194,306 on December 1, 2014.
On October 21, 2013, the EPA issued an Inspection Report pursuant to the Clean Air Act's Risk Management Program following its inspection of the facility on June 24 through 28, 2013. The report notes the EPA's preliminary determinations about the facility's documentation regarding process safety, process hazard analysis, as well as operating procedures, employee training, and other matters. On June 16, 2014, we received a request for information related to the Geismar Incident from the EPA under Section 114 of the Clean Air Act to which we responded on August 13, 2014. The EPA could issue penalties pertaining to final determinations.
On December 11, 2013, the Occupational Safety and Health Administration (OSHA) issued citations in connection with its investigation of the June 13, 2013 incident, which included a Notice of Penalty for $99,000 . We settled the
141
The Williams Companies, Inc. | ||||
Notes to Consolidated Financial Statements – (Continued) | ||||
| ||||
citations with OSHA on September 12, 2014 for a penalty of $36,000 . The settlement was judicially approved on September 23, 2014 and the order approving settlement became a final order on November 10, 2014. On June 25, 2013, OSHA commenced a second inspection pursuant to its Refinery and Chemical National Emphasis Program (NEP). OSHA did not issue a citation in connection with this NEP inspection and there is a six month statute of limitations for violation of the Occupational Safety and Health Act of 1970 or regulations promulgated under such act.
Additionally, multiple lawsuits, including class actions for alleged offsite impacts, property damage, customer claims, and personal injury, have been filed against various of our subsidiaries.
Due to ongoing litigation concerning defenses to liability and limited information as to the nature and extent of plaintiffs' damages, we cannot reasonably estimate a range of potential loss related to these contingencies at this time.
Alaska refinery contamination litigation
In 2010, James West filed a class action lawsuit in state court in Fairbanks, Alaska on behalf of individual property owners whose water contained sulfolane contamination allegedly emanating from the Flint Hills Oil Refinery in North Pole, Alaska. The suit named our subsidiary, Williams Alaska Petroleum Inc. (WAPI), and Flint Hills Resources Alaska, LLC (FHRA), a subsidiary of Koch Industries, Inc., as defendants. We owned and operated the refinery until 2004 when we sold it to FHRA. We and FHRA have made claims under the pollution liability insurance policy issued in connection with the sale of the North Pole refinery to FHRA. We and FHRA also filed claims against each other seeking, among other things, contractual indemnification alleging that the other party caused the sulfolane contamination.
In 2011, we and FHRA settled the James West claim. We and FHRA subsequently filed motions for summary judgment on the other's claims. On November 5, 2013, the court ruled that the applicable statute of limitations bars all FHRA's claims against us and dismissed those claims with prejudice. FHRA asked the court to reconsider and clarify its ruling. On July 8, 2014, the court reaffirmed its dismissal of all FHRA's claims and entered judgment for us. On August 6, 2014, FHRA appealed the court's decision to the Alaska Supreme Court.
We currently estimate that our reasonably possible loss exposure in this matter could range from an insignificant amount up to $32 million , although uncertainties inherent in the litigation process, expert evaluations, and jury dynamics might cause our exposure to exceed that amount.
On November 26, 2014, the City of North Pole (North Pole) filed suit in Alaska state court in Fairbanks against FHRA and WAPI, alleging nuisance and violations of municipal and state statutes based upon the sulfolane contamination allegedly emanating from the North Pole refinery. North Pole claims an unspecified amount of past and future damages as well as punitive damages against WAPI. On December 29, 2014, we filed a motion to dismiss all claims against WAPI based upon North Pole's failure to timely file suit.
Independent of the litigation matter described in the preceding paragraphs, in 2013, the Alaska Department of Environmental Conservation (ADEC) indicated that it views FHRA and us as responsible parties, and that it intended to enter a compliance order to address the environmental remediation of sulfolane and other possible contaminants including cleanup work outside the refinery's boundaries. On March 6, 2014, the State of Alaska filed suit against FHRA and us in state court in Fairbanks seeking injunctive relief and damages in connection with the sulfolane contamination. On May 5, 2014, FHRA filed cross-claims against us in the State of Alaska suit, and FHRA also seeks injunctive relief and damages. Due to the ongoing assessment of the level and extent of sulfolane contamination and the ultimate cost of remediation and division of costs among the potentially responsible parties, we are unable to estimate a range of exposure at this time.
Royalty matters
Certain of ACMP's customers, including one of its major customers, have been named in various lawsuits alleging underpayment of royalty. In certain of these cases, ACMP has also been named as a defendant based on allegations that it improperly participated with that major customer in causing the alleged royalty underpayments. We have also received subpoenas from the United States Department of Justice and the Pennsylvania Attorney General requesting
142
The Williams Companies, Inc. | ||||
Notes to Consolidated Financial Statements – (Continued) | ||||
| ||||
documents relating to the agreements between ACMP and its major customer and calculations of the major customer's royalty payments. We believe that the claims asserted to date are subject to indemnity obligations owed to ACMP by that major customer. Due to the preliminary status of the cases, we are unable to estimate a range of liability at this time.
Environmental Matters
We are a participant in certain environmental activities in various stages including assessment studies, cleanup operations and remedial processes at certain sites, some of which we currently do not own. We are monitoring these sites in a coordinated effort with other potentially responsible parties, the EPA, and other governmental authorities. We are jointly and severally liable along with unrelated third parties in some of these activities and solely responsible in others. Certain of our subsidiaries have been identified as potentially responsible parties at various Superfund and state waste disposal sites. In addition, these subsidiaries have incurred, or are alleged to have incurred, various other hazardous materials removal or remediation obligations under environmental laws. As of December 31, 2014 , we have accrued liabilities totaling $44 million for these matters, as discussed below. Our accrual reflects the most likely costs of cleanup, which are generally based on completed assessment studies, preliminary results of studies or our experience with other similar cleanup operations. Certain assessment studies are still in process for which the ultimate outcome may yield significantly different estimates of most likely costs. Any incremental amount in excess of amounts currently accrued cannot be reasonably estimated at this time due to uncertainty about the actual number of contaminated sites ultimately identified, the actual amount and extent of contamination discovered and the final cleanup standards mandated by the EPA and other governmental authorities.
The EPA and various state regulatory agencies routinely promulgate and propose new rules, and issue updated guidance to existing rules. More recent rules and rulemakings include, but are not limited to, rules for reciprocating internal combustion engine maximum achievable control technology, new air quality standards for ground level ozone, one hour nitrogen dioxide emission limits, and new air quality standards impacting storage vessels, pressure valves, and compressors. We are unable to estimate the costs of asset additions or modifications necessary to comply with these new regulations due to uncertainty created by the various legal challenges to these regulations and the need for further specific regulatory guidance.
Continuing operations
Our interstate gas pipelines are involved in remediation activities related to certain facilities and locations for polychlorinated biphenyls, mercury, and other hazardous substances. These activities have involved the EPA and various state environmental authorities, resulting in our identification as a potentially responsible party at various Superfund waste sites. At December 31, 2014 , we have accrued liabilities of $11 million for these costs. We expect that these costs will be recoverable through rates.
We also accrue environmental remediation costs for natural gas underground storage facilities, primarily related to soil and groundwater contamination. At December 31, 2014 , we have accrued liabilities totaling $8 million for these costs.
Former operations, including operations classified as discontinued
We have potential obligations in connection with assets and businesses we no longer operate. These potential obligations include remediation activities at the direction of federal and state environmental authorities and the indemnification of the purchasers of certain of these assets and businesses for environmental and other liabilities existing at the time the sale was consummated. Our responsibilities relate to the operations of the assets and businesses described below.
• | Former agricultural fertilizer and chemical operations and former retail petroleum and refining operations; |
• | Former petroleum products and natural gas pipelines; |
143
The Williams Companies, Inc. | ||||
Notes to Consolidated Financial Statements – (Continued) | ||||
| ||||
• | Former petroleum refining facilities; |
• | Former exploration and production and mining operations; |
• | Former electricity and natural gas marketing and trading operations. |
At December 31, 2014 , we have accrued environmental liabilities of $25 million related to these matters.
Other Divestiture Indemnifications
Pursuant to various purchase and sale agreements relating to divested businesses and assets, we have indemnified certain purchasers against liabilities that they may incur with respect to the businesses and assets acquired from us. The indemnities provided to the purchasers are customary in sale transactions and are contingent upon the purchasers incurring liabilities that are not otherwise recoverable from third parties. The indemnities generally relate to breach of warranties, tax, historic litigation, personal injury, property damage, environmental matters, right of way and other representations that we have provided.
At December 31, 2014 , other than as previously disclosed, we are not aware of any material claims against us involving the indemnities; thus, we do not expect any of the indemnities provided pursuant to the sales agreements to have a material impact on our future financial position. Any claim for indemnity brought against us in the future may have a material adverse effect on our results of operations in the period in which the claim is made.
In addition to the foregoing, various other proceedings are pending against us which are incidental to our operations.
Summary
We have disclosed our estimated range of reasonably possible losses for certain matters above, as well as all significant matters for which we are unable to reasonably estimate a range of possible loss. We estimate that for all other matters for which we are able to reasonably estimate a range of loss, our aggregate reasonably possible losses beyond amounts accrued are immaterial to our expected future annual results of operations, liquidity and financial position. These calculations have been made without consideration of any potential recovery from third parties.
Commitments
Commitments for construction and acquisition of property, plant, and equipment are approximately $689 million at December 31, 2014 .
Note 19 – Segment Disclosures
Our reportable segments are Williams Partners, Access Midstream, and Williams NGL & Petchem Services. All remaining business activities are included in Other. (See Note 1 – Description of Business, Basis of Presentation, and Summary of Significant Accounting Policies .)
Our segment presentations of Williams Partners and Access Midstream are reflective of the parent-level focus by our chief operating decision-maker, considering the resource allocation and governance provisions associated with the master limited partnership structures. These partnerships maintain capital and cash management structures that are separate from ours. They are self-funding and maintain their own lines of bank credit and cash management accounts. These factors, coupled with different costs of capital from our other businesses, serve to differentiate the management of these entities as a whole.
Performance Measurement
We currently evaluate segment operating performance based upon Segment profit (loss) from operations, which includes Segment revenues from external and internal customers, segment costs and expenses, Equity earnings (losses),
144
The Williams Companies, Inc. | ||||
Notes to Consolidated Financial Statements – (Continued) | ||||
| ||||
Gain on remeasurement of equity-method investment, and Income (loss) from investments . General corporate expenses represent Selling, general, and administrative expenses that are not allocated to our segments. The accounting policies of the segments are the same as those described in Note 1 – Description of Business, Basis of Presentation, and Summary of Significant Accounting Policies . Intersegment revenues are generally accounted for at current market prices as if the sales were to unaffiliated third parties.
The following geographic area data includes Revenues from external customers based on product shipment origin and Long-lived assets based upon physical location.
|
|
| United States |
| Canada |
| Total | |||
|
|
| (Millions) | |||||||
Revenues from external customers: |
|
|
|
|
|
| ||||
| 2014 | $ | 7,229 | | $ | 408 | | $ | 7,637 | |
| 2013 |
| 6,703 | |
| 157 | |
| 6,860 | |
| 2012 |
| 7,335 | |
| 151 | |
| 7,486 | |
|
|
|
|
|
|
|
| |||
Long-lived assets: |
|
|
|
|
|
| ||||
| 2014 | $ | 38,290 | | $ | 1,364 | | $ | 39,654 | |
| 2013 |
| 19,260 | |
| 1,240 | |
| 20,500 | |
| 2012 |
| 16,940 | |
| 880 | |
| 17,820 | |
Long-lived assets are comprised of property, plant, and equipment, goodwill, and other intangible assets.
145
The Williams Companies, Inc. | ||||
Notes to Consolidated Financial Statements – (Continued) | ||||
| ||||
The following table reflects the reconciliation of Segment revenues and Segment profit (loss) to Total revenues and Operating income (loss) as reported in the Consolidated Statement of Income and Other financial information related to Long-lived assets .
| Williams Partners |
| Access |
| Williams NGL & Petchem Services |
| Other |
| Eliminations |
| Total | ||||||||||||
| (Millions) | ||||||||||||||||||||||
2014 | |||||||||||||||||||||||
Segment revenues: |
|
|
|
|
|
|
|
|
|
|
| ||||||||||||
Service revenues |
|
|
|
|
|
|
|
|
|
|
| ||||||||||||
External | $ | 3,106 | |
| $ | 781 | |
| $ | - | |
| $ | 229 | |
| $ | - | |
| $ | 4,116 | |
Internal | 1 | |
| - | |
| - | |
| 30 | |
| (31 | ) |
| - | | ||||||
Total service revenues | 3,107 | |
| 781 | |
| - | |
| 259 | |
| (31 | ) |
| 4,116 | | ||||||
Product sales |
|
|
|
|
|
|
|
|
|
|
| ||||||||||||
External | 3,521 | |
| - | |
| - | |
| - | |
| - | |
| 3,521 | | ||||||
Internal | - | |
| - | |
| - | |
| - | |
| - | |
| - | | ||||||
Total product sales | 3,521 | |
| - | |
| - | |
| - | |
| - | |
| 3,521 | | ||||||
Total revenues | $ | 6,628 | |
| $ | 781 | |
| $ | - | |
| $ | 259 | |
| $ | (31 | ) |
| $ | 7,637 | |
Segment profit (loss) | $ | 1,743 | |
| $ | 2,803 | |
| $ | (115 | ) |
| $ | 4 | |
|
|
| $ | 4,435 | | ||
Less: |
|
|
|
|
|
|
|
|
|
|
| ||||||||||||
Equity earnings (losses) | 132 | |
| 90 | |
| (78 | ) |
| - | |
|
|
| 144 | | |||||||
Gain on remeasurement of equity-method investment | - | |
| 2,544 | |
| - | |
| - | |
|
|
| 2,544 | | |||||||
Income (loss) from investments | - | |
| 1 | |
| (1 | ) |
| - | |
|
|
| - | | |||||||
Segment operating income (loss) | $ | 1,611 | |
| $ | 168 | |
| $ | (36 | ) |
| $ | 4 | |
|
|
| 1,747 | | |||
General corporate expenses |
|
|
|
|
|
|
|
|
|
| (178 | ) | |||||||||||
Operating income (loss) |
|
|
|
|
|
|
|
|
|
| $ | 1,569 | | ||||||||||
|
|
|
|
|
|
|
|
|
|
|
| ||||||||||||
Other financial information: |
|
|
|
|
|
|
|
|
|
|
| ||||||||||||
Additions to long-lived assets (1) | $ | 3,449 | |
| $ | 16,964 | |
| $ | 291 | |
| $ | 54 | |
| $ | (2 | ) |
| $ | 20,756 | |
Depreciation and amortization | 855 | |
| 296 | |
| - | |
| 25 | |
|
|
| 1,176 | | |||||||
__________________ |
|
|
|
|
|
|
|
|
|
|
| ||||||||||||
( 1) 2014 Additions to long-lived assets within our Access Midstream segment primarily includes the acquisition-date fair value of long-lived assets from the ACMP Acquisition (see Note 2 - Acquisitions). | |||||||||||||||||||||||
| |||||||||||||||||||||||
2013 | |||||||||||||||||||||||
Segment revenues: |
|
|
|
|
|
|
|
|
|
|
| ||||||||||||
Service revenues |
|
|
|
|
|
|
|
|
|
|
| ||||||||||||
External | $ | 2,914 | |
| $ | - | |
| $ | - | |
| $ | 25 | |
| $ | - | |
| $ | 2,939 | |
Internal | - | |
| - | |
| - | |
| 11 | |
| (11 | ) |
| - | | ||||||
Total service revenues | 2,914 | |
| - | |
| - | |
| 36 | |
| (11 | ) |
| 2,939 | | ||||||
Product sales |
|
|
|
|
|
|
|
|
|
|
| ||||||||||||
External | 3,921 | |
| - | |
| - | |
| - | |
| - | |
| 3,921 | | ||||||
Internal | - | |
| - | |
| - | |
| - | |
| - | |
| - | | ||||||
Total product sales | 3,921 | |
| - | |
| - | |
| - | |
| - | |
| 3,921 | | ||||||
Total revenues | $ | 6,835 | |
| $ | - | |
| $ | - | |
| $ | 36 | |
| $ | (11 | ) |
| $ | 6,860 | |
Segment profit (loss) | $ | 1,677 | |
| $ | 61 | |
| $ | (32 | ) |
| $ | (5 | ) |
|
|
| $ | 1,701 | | ||
Less: |
|
|
|
|
|
|
|
|
|
|
| ||||||||||||
Equity earnings (losses) | 104 | |
| 30 | |
| - | |
| - | |
|
|
| 134 | | |||||||
Income (loss) from investments | (3 | ) |
| 31 | |
| - | |
| - | |
|
|
| 28 | | |||||||
Segment operating income (loss) | $ | 1,576 | |
| $ | - | |
| $ | (32 | ) |
| $ | (5 | ) |
|
|
| 1,539 | | |||
General corporate expenses |
|
|
|
|
|
|
|
|
|
| (164 | ) | |||||||||||
Operating income (loss) |
|
|
|
|
|
|
|
|
|
| $ | 1,375 | | ||||||||||
|
|
|
|
|
|
|
|
|
|
|
| ||||||||||||
Other financial information: |
|
|
|
|
|
|
|
|
|
|
| ||||||||||||
Additions to long-lived assets | $ | 3,409 | |
| $ | - | |
| $ | 295 | |
| $ | 27 | |
| |
| $ | 3,731 | | ||
Depreciation and amortization | 791 | |
| - | |
| - | |
| 24 | |
|
|
| 815 | | |||||||
146
The Williams Companies, Inc. | ||||
Notes to Consolidated Financial Statements – (Continued) | ||||
| ||||
| Williams Partners |
| Access |
| Williams NGL & Petchem Services |
| Other |
| Eliminations |
| Total | ||||||||||||
| (Millions) | ||||||||||||||||||||||
|
|
|
|
|
|
|
|
|
|
|
| ||||||||||||
2012 |
|
|
|
|
|
|
|
|
|
|
| ||||||||||||
Segment revenues: |
|
|
|
|
|
|
|
|
|
|
| ||||||||||||
Service revenues |
|
|
|
|
|
|
|
|
|
|
| ||||||||||||
External | $ | 2,714 | |
| $ | - | |
| $ | - | |
| $ | 15 | |
| $ | - | |
| $ | 2,729 | |
Internal | - | |
| - | |
| - | |
| 12 | |
| (12 | ) |
| - | | ||||||
Total service revenues | 2,714 | |
| - | |
| - | |
| 27 | |
| (12 | ) |
| 2,729 | | ||||||
Product sales |
|
|
|
|
|
|
|
|
|
|
| ||||||||||||
External | 4,757 | |
| - | |
| - | |
| - | |
| - | |
| 4,757 | | ||||||
Internal | - | |
| - | |
| - | |
| - | |
| - | |
| - | | ||||||
Total product sales | 4,757 | |
| - | |
| - | |
| - | |
| - | |
| 4,757 | | ||||||
Total revenues | $ | 7,471 | |
| $ | - | |
| $ | - | |
| $ | 27 | |
| $ | (12 | ) |
| $ | 7,486 | |
Segment profit (loss) | $ | 1,907 | |
| $ | - | |
| $ | (3 | ) |
| $ | 56 | |
|
|
| $ | 1,960 | | ||
Less: |
|
|
|
|
|
|
|
|
|
|
| ||||||||||||
Equity earnings (losses) | 111 | |
| - | |
| - | |
| - | |
|
|
| 111 | | |||||||
Income (loss) from investments | (4 | ) |
| - | |
| - | |
| 53 | |
|
|
| 49 | | |||||||
Segment operating income (loss) | $ | 1,800 | |
| $ | - | |
| $ | (3 | ) |
| $ | 3 | |
|
|
| 1,800 | | |||
General corporate expenses |
|
|
|
|
|
|
|
|
|
| (188 | ) | |||||||||||
Operating income (loss) |
|
|
|
|
|
|
|
|
|
| $ | 1,612 | | ||||||||||
|
|
|
|
|
|
|
|
|
|
|
| ||||||||||||
Other financial information: |
|
|
|
|
|
|
|
|
|
|
| ||||||||||||
Additions to long-lived assets | $ | 5,851 | |
| $ | - | |
| $ | 136 | |
| $ | 31 | |
| |
| $ | 6,018 | | ||
Depreciation and amortization | 734 | |
| - | |
| - | |
| 22 | |
|
|
| 756 | | |||||||
|
|
|
|
|
|
|
|
|
|
|
| ||||||||||||
The following table reflects Total assets and Equity-method investments by reportable segments:
|
| Total Assets |
| Equity-Method Investments | ||||||||||||
|
| December 31, 2014 |
| December 31, 2013 |
| December 31, 2014 |
| December 31, 2013 | ||||||||
|
| (Millions) | ||||||||||||||
Williams Partners |
| $ | 26,298 | |
| $ | 23,571 | |
| $ | 2,395 | | | $ | 2,187 | |
Access Midstream |
| 23,024 | |
| 2,161 | |
| 6,004 | |
| 2,161 | | ||||
Williams NGL & Petchem Services |
| 612 | |
| 486 | |
| - | |
| 12 | | ||||
Other |
| 1,220 | |
| 1,359 | |
| 1 | |
| - | | ||||
Eliminations |
| (591 | ) |
| (435 | ) |
| - | |
| - | | ||||
Total |
| $ | 50,563 | |
| $ | 27,142 | |
| $ | 8,400 | |
| $ | 4,360 | |
Note 20 – Subsequent Events (Unaudited)
On February 2, 2015, we completed the Merger of our consolidated master limited partnerships, Pre-merger WPZ and ACMP. (See Note 1 – Description of Business, Basis of Presentation, and Summary of Significant Accounting Policies .)
147
The Williams Companies Inc .
Quarterly Financial Data
(Unaudited)
Summarized quarterly financial data are as follows:
| First Quarter |
| Second Quarter |
| Third Quarter |
| Fourth Quarter | ||||||||
| (Millions, except per-share amounts) | ||||||||||||||
2014 |
| ||||||||||||||
Revenues | $ | 1,749 | |
| $ | 1,678 | |
| $ | 2,069 | |
| $ | 2,141 | |
Product costs | 769 | |
| 724 | |
| 807 | |
| 716 | | ||||
Income (loss) from continuing operations | 196 | |
| 123 | |
| 1,708 | |
| 308 | | ||||
Net income (loss) | 196 | |
| 127 | |
| 1,708 | |
| 308 | | ||||
Amounts attributable to The Williams Companies, Inc.: |
|
|
|
|
|
|
| ||||||||
Income (loss) from continuing operations | 140 | |
| 99 | |
| 1,678 | |
| 193 | | ||||
Net income (loss) | 140 | |
| 103 | |
| 1,678 | |
| 193 | | ||||
Basic earnings (loss) per common share: |
|
|
|
|
|
|
| ||||||||
Income (loss) from continuing operations | .20 | |
| .14 | |
| 2.24 | |
| .26 | | ||||
Diluted earnings (loss) per common share: |
|
|
|
|
|
|
| ||||||||
Income (loss) from continuing operations | .20 | |
| .14 | |
| 2.22 | |
| .26 | | ||||
|
|
|
|
|
|
|
| ||||||||
2013 |
|
|
|
|
|
|
| ||||||||
Revenues | $ | 1,810 | |
| $ | 1,767 | |
| $ | 1,623 | |
| $ | 1,660 | |
Product costs | 790 | |
| 801 | |
| 710 | |
| 726 | | ||||
Income (loss) from continuing operations | 231 | |
| 200 | |
| 198 | |
| 50 | | ||||
Net income (loss) | 230 | |
| 192 | |
| 197 | |
| 49 | | ||||
Amounts attributable to The Williams Companies, Inc.: |
|
|
|
|
|
|
| ||||||||
Income (loss) from continuing operations | 162 | |
| 149 | |
| 143 | |
| (13 | ) | ||||
Net income (loss) | 161 | |
| 142 | |
| 141 | |
| (14 | ) | ||||
Basic earnings (loss) per common share: |
|
|
|
|
|
|
| ||||||||
Income (loss) from continuing operations | .24 | |
| .22 | |
| .21 | |
| (.02 | ) | ||||
Diluted earnings (loss) per common share: |
|
|
|
|
|
|
| ||||||||
Income (loss) from continuing operations | .23 | |
| .22 | |
| .20 | |
| (.02 | ) | ||||
The sum of earnings per share for the four quarters may not equal the total earnings per share for the year due to changes in the average number of common shares outstanding and rounding.
2014
Net income for fourth-quarter 2014 includes the following pretax items:
• | $167 million in revenue associated with minimum volume commitment fees at Access Midstream; |
• | $154 million gain related to a contingency settlement at Williams Partners (see Note 6 – Other Income and Expenses ); |
• | $71 million gain associated with insurance recoveries related to the Geismar Incident at Williams Partners (see Note 6 – Other Income and Expenses ); |
• | $22 million favorable adjustment to gain on remeasurement of equity-method investment at Access Midstream (see Note 2 – Acquisitions ); |
• | $12 million impairment loss on certain materials and equipment held for sale at Access Midstream (see Note 6 – Other Income and Expenses ); |
• | $17 million unfavorable inventory adjustment related to a decrease in prices at Williams Partners; |
• | $23 million impairment loss on certain materials and equipment at Williams Partners (see Note 6 – Other Income and Expenses ); |
148
The Williams Companies Inc .
Quarterly Financial Data – (Continued)
(Unaudited)
• | $38 million of ACMP acquisition, merger, and transition-related expenses primarily at Access Midstream (see Note 6 – Other Income and Expenses ). |
Net income for third-quarter 2014 includes the following pretax items:
• | $2,522 million gain recognized as a result of remeasuring to fair value the equity-method investment that we held before we acquired a controlling interest in ACMP at Access Midstream (see Note 2 – Acquisitions ); |
• | $14 million interest income associated with a receivable related to the sale of certain former Venezuela assets (see Note 5 – Investing Activities ); |
• | $12 million net gain related to a partial acreage dedication release at Williams Partners (see Note 6 – Other Income and Expenses ); |
• | $13 million in ACMP acquisition expenses at Access Midstream, in addition to $14 million of merger and transition-related expenses (see Note 2 – Acquisitions and Note 6 – Other Income and Expenses ); |
• | $24 million of losses associated with acquisition-related compensation expenses that were triggered by the ACMP Acquisition at Access Midstream (see Note 2 – Acquisitions ). |
Net income for second-quarter 2014 includes the following pretax items:
• | $50 million gain associated with insurance recoveries related to the Geismar Incident at Williams Partners (see Note 6 – Other Income and Expenses ); |
• | $14 million interest income associated with a receivable related to the sale of certain former Venezuela assets (see Note 5 – Investing Activities ); |
• | $11 million of ACMP acquisition-related expenses, including $9 million of financing expenses (see Note 2 – Acquisitions ); |
• | $17 million impairment loss on certain materials and equipment at Williams Partners (see Note 6 – Other Income and Expenses ). |
Net income for first-quarter 2014 includes the following pretax items:
• | $125 million gain associated with insurance recoveries related to the Geismar Incident at Williams Partners (see Note 6 – Other Income and Expenses ); |
• | $13 million interest income associated with a receivable related to the sale of certain former Venezuela assets (see Note 5 – Investing Activities ); |
• | $19 million in expenses associated with the Bluegrass Pipeline project development costs at Williams NGL & Petchem Services (see Note 6 – Other Income and Expenses ); |
• | $67 million equity losses related to the write-off of previously capitalized project development costs associated with the Bluegrass Pipeline at Williams NGL & Petchem Services (see Note 3 – Variable Interest Entities ). |
Net income for first-quarter 2014 also includes a $23 million deferred income tax benefit related to the completion of the Canada Dropdown.
149
The Williams Companies Inc.
Quarterly Financial Data – (Continued)
(Unaudited)
2013
Net income for fourth-quarter 2013 includes the following pretax items:
• | $13 million interest income on the receivable related to the sale of certain former Venezuela assets (see Note 5 – Investing Activities ); |
• | $14 million in expenses associated with the Geismar Incident at Williams Partners (see Note 6 – Other Income and Expenses ); |
• | $16 million loss associated with a producer claim against us at Williams Partners (see Note 6 – Other Income and Expenses ); |
• | $20 million write-off of an abandoned project at Williams NGL & Petchem Services (see Note 6 – Other Income and Expenses ). |
Net income for fourth-quarter 2013 also includes $99 million of deferred income tax expense incurred on undistributed earnings of our foreign operations that are no longer considered permanently reinvested (see Note 7 – Provision (Benefit) for Income Taxes ).
Net income for third-quarter 2013 includes the following pretax items:
• | $50 million gain associated with insurance recoveries related to the Geismar Incident at Williams Partners (see Note 6 – Other Income and Expenses ); |
• | $11 million of interest income associated with a receivable related to the sale of certain former Venezuela assets (see Note 5 – Investing Activities ); |
• | $9 million loss associated with a producer claim against us at Williams Partners (see Note 6 – Other Income and Expenses ). |
Net income for second-quarter 2013 includes the following pretax items:
• | $26 million gain resulting from Access Midstream's equity issuance (see Note 5 – Investing Activities ); |
• | $13 million of interest income associated with a receivable related to the sale of certain former Venezuela assets (see Note 5 – Investing Activities ); |
• | $12 million of income related to an insurance recovery associated with the Eminence abandonment regulatory asset that will not be recovered through rates at Williams Partners (see Note 6 – Other Income and Expenses ); |
• | $12 million charge resulting from an unfavorable ruling associated with our former Alaska refinery related to the Trans-Alaska Pipeline System Quality Bank (see Note 4 – Discontinued Operations ). |
Net income for first-quarter 2013 includes $13 million of interest income associated with a receivable related to the sale of certain former Venezuela assets (see Note 5 – Investing Activities ).
150
The Williams Companies, Inc.
Schedule I - Condensed Financial Information of Registrant
Statement of Comprehensive Income (Loss) (Parent)
| Years Ended December 31, | ||||||||||
| 2014 |
| 2013 |
| 2012 | ||||||
| (Millions, except per-share amounts) | ||||||||||
Equity in earnings of consolidated subsidiaries | $ | 1,799 | |
| $ | 1,564 | |
| $ | 1,895 | |
Equity earnings (losses) from investment in Access Midstream Partners | (7 | ) |
| 30 | |
| - | | |||
Interest incurred - external | (206 | ) |
| (156 | ) |
| (128 | ) | |||
Interest incurred - affiliate | (797 | ) |
| (722 | ) |
| (816 | ) | |||
Interest income - affiliate | 10 | |
| 71 | |
| 84 | | |||
Gain on remeasurement of equity-method investment | 2,544 | |
| - | |
| - | | |||
Other income (expense) - net | (13 | ) |
| 32 | |
| 3 | | |||
Income from continuing operations before income taxes | 3,330 | |
| 819 | |
| 1,038 | | |||
Provision for income taxes | 1,220 | |
| 378 | |
| 315 | | |||
Income (loss) from continuing operations | 2,110 | |
| 441 | |
| 723 | | |||
Income (loss) from discontinued operations | 4 | |
| (11 | ) |
| 136 | | |||
Net income (loss) | $ | 2,114 | |
| $ | 430 | |
| $ | 859 | |
Basic earnings (loss) per common share: |
|
|
|
|
| ||||||
Income (loss) from continuing operations | $ | 2.93 | |
| $ | .65 | |
| $ | 1.17 | |
Income (loss) from discontinued operations | .01 | |
| (.02 | ) |
| .22 | | |||
Net income (loss) | $ | 2.94 | |
| $ | .63 | |
| $ | 1.39 | |
Weighted-average shares (thousands) | 719,325 | |
| 682,948 | |
| 619,792 | | |||
Diluted earnings (loss) per common share: |
|
|
|
|
| ||||||
Income (loss) from continuing operations | 2.91 | |
| .64 | |
| $ | 1.15 | | ||
Income (loss) from discontinued operations | .01 | |
| (.02 | ) |
| .22 | | |||
Net income (loss) | $ | 2.92 | |
| $ | .62 | |
| $ | 1.37 | |
Weighted-average shares (thousands) | 723,641 | |
| 687,185 | |
| 625,486 | | |||
Other comprehensive income (loss): |
|
|
|
|
| ||||||
Equity in other comprehensive income (loss) of consolidated subsidiaries | $ | (96 | ) |
| $ | (41 | ) |
| $ | 21 | |
Other comprehensive income (loss) attributable to The Williams Companies, Inc. | (80 | ) |
| 239 | |
| 6 | | |||
Other comprehensive income (loss) | (176 | ) |
| 198 | |
| 27 | | |||
Less: Other comprehensive income (loss) attributable to noncontrolling interests | (19 | ) |
| - | |
| - | | |||
Comprehensive income (loss) attributable to The Williams Companies, Inc. | $ | 1,957 | |
| $ | 628 | |
| $ | 886 | |
See accompanying notes.
151
The Williams Companies, Inc.
Schedule I - Condensed Financial Information of Registrant – (Continued)
Balance Sheet (Parent)
| December 31, | ||||||
| 2014 |
| 2013 | ||||
| (Millions) | ||||||
ASSETS |
|
|
| ||||
Current assets: |
|
|
| ||||
Cash and cash equivalents | $ | 49 | |
| $ | 282 | |
Other current assets and deferred charges | 246 | |
| 167 | | ||
Total current assets | 295 | |
| 449 | | ||
Investments in and advances to consolidated subsidiaries | 31,405 | |
| 19,162 | | ||
Investment in Access Midstream Partners | - | |
| 2,161 | | ||
Property, plant, and, equipment - net | 99 | |
| 68 | | ||
Other noncurrent assets | 46 | |
| 34 | | ||
Total assets | $ | 31,845 | |
| $ | 21,874 | |
LIABILITIES AND STOCKHOLDERS' EQUITY |
|
|
| ||||
Current liabilities: |
|
|
| ||||
Accounts payable | $ | 27 | |
| $ | 26 | |
Long-term debt due within one year | - | |
| 1 | | ||
Other current liabilities | 174 | |
| 147 | | ||
Total current liabilities | 201 | |
| 174 | | ||
Long-term debt | 4,562 | |
| 2,296 | | ||
Notes payable - affiliates | 13,295 | |
| 10,830 | | ||
Pension, other postretirement, and other noncurrent liabilities | 409 | |
| 282 | | ||
Deferred income taxes | 4,601 | |
| 3,428 | | ||
Contingent liabilities and commitments | |
| | ||||
Equity: |
|
|
| ||||
Common stock | 782 | |
| 718 | | ||
Other stockholders' equity | 7,995 | |
| 4,146 | | ||
Total stockholders' equity | 8,777 | |
| 4,864 | | ||
Total liabilities and stockholders' equity | $ | 31,845 | |
| $ | 21,874 | |
See accompanying notes.
152
The Williams Companies, Inc.
Schedule I - Condensed Financial Information of Registrant – (Continued)
Statement of Cash Flows (Parent)
| Years Ended December 31, | ||||||||||
| 2014 |
| 2013 |
| 2012 | ||||||
| (Millions) | ||||||||||
NET CASH FLOWS PROVIDED (USED) BY OPERATING ACTIVITIES | $ | (500 | ) |
| $ | 19 | |
| $ | (11 | ) |
|
|
|
|
|
| ||||||
FINANCING ACTIVITIES: |
|
|
|
|
| ||||||
Proceeds from long-term debt | 2,935 | |
| - | |
| 848 | | |||
Payments of long-term debt | (671 | ) |
| (1 | ) |
| (28 | ) | |||
Changes in notes payable to affiliates | 2,465 | |
| 1,892 | |
| 520 | | |||
Tax benefit of stock-based awards | 25 | |
| 19 | |
| 44 | | |||
Proceeds from issuance of common stock | 3,416 | |
| 18 | |
| 2,550 | | |||
Dividends paid | (1,412 | ) |
| (982 | ) |
| (742 | ) | |||
Other - net | (17 | ) |
| (3 | ) |
| (7 | ) | |||
Net cash provided (used) by financing activities | 6,741 | |
| 943 | |
| 3,185 | | |||
|
|
|
|
|
| ||||||
INVESTING ACTIVITIES: |
|
|
|
|
| ||||||
Capital expenditures | (54 | ) |
| (23 | ) |
| (18 | ) | |||
Purchase of Access Midstream Partners | (5,995 | ) |
| - | |
| - | | |||
Purchase of investment in Access Midstream Partners | - | |
| (4 | ) |
| (2,179 | ) | |||
Changes in investments in and advances to consolidated subsidiaries | (450 | ) |
| (985 | ) |
| (953 | ) | |||
Other - net | 25 | |
| (8 | ) |
| 24 | | |||
Net cash provided (used) by investing activities | (6,474 | ) |
| (1,020 | ) |
| (3,126 | ) | |||
Increase (decrease) in cash and cash equivalents | (233 | ) |
| (58 | ) |
| 48 | | |||
Cash and cash equivalents at beginning of year | 282 | |
| 340 | |
| 292 | | |||
Cash and cash equivalents at end of year | $ | 49 | |
| $ | 282 | |
| $ | 340 | |
See accompanying notes.
153
The Williams Companies, Inc.
Schedule I - Condensed Financial Information of Registrant – (Continued)
Notes to Financial Information (Parent)
Note 1. Guarantees
In addition to the guarantees disclosed in the accompanying consolidated financial statements in Item 8, we have financially guaranteed the performance of certain consolidated subsidiaries. The duration of these guarantees varies and we estimate the maximum undiscounted potential future payment obligation related to these guarantees as of December 31, 2014, is approximately $681 million .
Note 2. Cash Dividends Received
We receive dividends and distributions either directly from our subsidiaries or indirectly through dividends received by subsidiaries and subsequent transfers of cash to us through our corporate cash management system. The total of such receipts ultimately related to dividends and distributions for the years ended December 31, 2014, 2013, and 2012 was approximately $1.9 billion , $1.5 billion , and $1.1 billion , respectively.
154
The Williams Companies, Inc.
Schedule II - Valuation and Qualifying Accounts
|
|
| Additions |
|
|
|
| ||||||||||||
| Beginning Balance |
| Charged (Credited) To Costs and Expenses |
| Other |
| Deductions |
| Ending Balance | ||||||||||
| (Millions) | ||||||||||||||||||
2014 |
|
|
|
|
|
|
|
|
| ||||||||||
Allowance for doubtful accounts - accounts and notes receivable (1) | $ | - | |
| $ | - | |
| $ | - | |
| $ | - | |
| $ | - | |
Deferred tax asset valuation allowance (1) | 181 | |
| 25 | |
| - | |
| - | |
| 206 | | |||||
2013 |
|
|
|
|
|
|
|
|
| ||||||||||
Allowance for doubtful accounts - accounts and notes receivable (1) | - | |
| - | |
| - | |
| - | |
| - | | |||||
Deferred tax asset valuation allowance (1) | 144 | |
| 37 | |
| - | |
| - | |
| 181 | | |||||
2012 |
|
|
|
|
|
|
|
|
| ||||||||||
Allowance for doubtful accounts - accounts and notes receivable (1) | 1 | |
| - | |
| - | |
| 1 | | (2) | - | | |||||
Deferred tax asset valuation allowance (1) | 145 | |
| (1 | ) |
| - | |
| - | |
| 144 | | |||||
_______________________
(1) Deducted from related assets.
(2) Represents balances written off, reclassifications, and recoveries.
155
Item 9. Changes in and Disagreements with Accountants on Accounting and Financial Disclosure
None.
Item 9A. Controls and Procedures
Disclosure Controls and Procedures
Our management, including our Chief Executive Officer and Chief Financial Officer, does not expect that our disclosure controls and procedures (as defined in Rules 13a - 15(e) and 15d - 15(e) of the Securities Exchange Act) (Disclosure Controls) will prevent all errors and all fraud. A control system, no matter how well conceived and operated, can provide only reasonable, not absolute, assurance that the objectives of the control system are met. Further, the design of a control system must reflect the fact that there are resource constraints, and the benefits of controls must be considered relative to their costs. Because of the inherent limitations in all control systems, no evaluation of controls can provide absolute assurance that all control issues and instances of fraud, if any, within the company have been detected. These inherent limitations include the realities that judgments in decision-making can be faulty, and that breakdowns can occur because of simple error or mistake. Additionally, controls can be circumvented by the individual acts of some persons, by collusion of two or more people, or by management override of the control. The design of any system of controls also is based in part upon certain assumptions about the likelihood of future events, and there can be no assurance that any design will succeed in achieving its stated goals under all potential future conditions. Because of the inherent limitations in a cost-effective control system, misstatements due to error or fraud may occur and not be detected. We monitor our Disclosure Controls and make modifications as necessary; our intent in this regard is that the Disclosure Controls will be modified as systems change and conditions warrant.
Evaluation of Disclosure Controls and Procedures
An evaluation of the effectiveness of the design and operation of our Disclosure Controls was performed as of the end of the period covered by this report. This evaluation was performed under the supervision and with the participation of our management, including our Chief Executive Officer and Chief Financial Officer. Based upon that evaluation, our Chief Executive Officer and Chief Financial Officer concluded that these Disclosure Controls are effective at a reasonable assurance level.
Changes in Internal Control Over Financial Reporting
There have been no changes during the fourth quarter of 2014 that have materially affected, or are reasonably likely to materially affect, our Internal Control over Financial Reporting.
Management's Annual Report on Internal Control over Financial Reporting
Management is responsible for establishing and maintaining adequate internal control over financial reporting (as defined in Rules 13a - 15(f) and 15d - 15(f) under the Securities Exchange Act of 1934). Our internal control over financial reporting is designed to provide reasonable assurance to our management and board of directors regarding the preparation and fair presentation of financial statements in accordance with accounting principles generally accepted in the United States. Our internal control over financial reporting includes those policies and procedures that (i) pertain to the maintenance of records that, in reasonable detail, accurately and fairly reflect the transactions and dispositions of our assets; (ii) provide reasonable assurance that transactions are recorded as to permit preparation of financial statements in accordance with generally accepted accounting principles, and that our receipts and expenditures are being made only in accordance with authorization of our management and board of directors; and (iii) provide reasonable assurance regarding prevention or timely detection of unauthorized acquisition, use or disposition of our assets that could have a material effect on our financial statements.
All internal control systems, no matter how well designed, have inherent limitations including the possibility of human error and the circumvention or overriding of controls. Therefore, even those systems determined to be effective can provide only reasonable assurance with respect to financial statement preparation and presentation.
156
Under the supervision and with the participation of our management, including our Chief Executive Officer and Chief Financial Officer, we assessed the effectiveness of our internal control over financial reporting as of December 31, 2014, based on the criteria set forth by the Committee of Sponsoring Organizations of the Treadway Commission (COSO) in Internal Control - Integrated Framework (2013). Based on our assessment, we concluded that, as of December 31, 2014, our internal control over financial reporting was effective.
Ernst & Young LLP, our independent registered public accounting firm, has audited our internal control over financial reporting, as stated in their report which is included in this Annual Report on Form 10-K.
157
Report of Independent Registered Public Accounting Firm on Internal Control Over Financial Reporting
The Board of Directors and Stockholders of
The Williams Companies, Inc.
We have audited The Williams Companies, Inc.'s internal control over financial reporting as of December 31, 2014, based on criteria established in Internal Control-Integrated Framework issued by the Committee of Sponsoring Organizations of the Treadway Commission (2013 framework) (the COSO criteria). The Williams Companies, Inc.'s management is responsible for maintaining effective internal control over financial reporting, and for its assessment of the effectiveness of internal control over financial reporting included in the accompanying Management's Annual Report on Internal Control Over Financial Reporting. Our responsibility is to express an opinion on the Company's internal control over financial reporting based on our audit.
We conducted our audit in accordance with the standards of the Public Company Accounting Oversight Board (United States). Those standards require that we plan and perform the audit to obtain reasonable assurance about whether effective internal control over financial reporting was maintained in all material respects. Our audit included obtaining an understanding of internal control over financial reporting, assessing the risk that a material weakness exists, testing and evaluating the design and operating effectiveness of internal control based on the assessed risk, and performing such other procedures as we considered necessary in the circumstances. We believe that our audit provides a reasonable basis for our opinion.
A company's internal control over financial reporting is a process designed to provide reasonable assurance regarding the reliability of financial reporting and the preparation of financial statements for external purposes in accordance with generally accepted accounting principles. A company's internal control over financial reporting includes those policies and procedures that (1) pertain to the maintenance of records that, in reasonable detail, accurately and fairly reflect the transactions and dispositions of the assets of the company; (2) provide reasonable assurance that transactions are recorded as necessary to permit preparation of financial statements in accordance with generally accepted accounting principles, and that receipts and expenditures of the company are being made only in accordance with authorizations of management and directors of the company; and (3) provide reasonable assurance regarding prevention or timely detection of unauthorized acquisition, use, or disposition of the company's assets that could have a material effect on the financial statements.
Because of its inherent limitations, internal control over financial reporting may not prevent or detect misstatements. Also, projections of any evaluation of effectiveness to future periods are subject to the risk that controls may become inadequate because of changes in conditions, or that the degree of compliance with the policies or procedures may deteriorate.
In our opinion, The Williams Companies, Inc. maintained, in all material respects, effective internal control over financial reporting as of December 31, 2014, based on the COSO criteria.
We also have audited, in accordance with the standards of the Public Company Accounting Oversight Board (United States), the consolidated balance sheet of The Williams Companies, Inc. as of December 31, 2014 and 2013, and the related consolidated statements of income, comprehensive income, changes in equity and cash flows for each of the three years in the period ended December 31, 2014 and our report dated February 25, 2015 expressed an unqualified opinion thereon .
/s/ Ernst & Young LLP
Tulsa, Oklahoma
February 25, 2015
158
Item 9B. Other Information
None.
PART III
Item 10. Directors, Executive Officers and Corporate Governance
The information regarding our directors and nominees for director required by Item 401 of Regulation S-K will be presented under the heading "Proposal 1 - Election of Directors" in our Proxy Statement prepared for the solicitation of proxies in connection with our Annual Meeting of Stockholders to be held May 21, 2015 (Proxy Statement), which information is incorporated by reference herein.
Information regarding our executive officers required by Item 401(b) of Regulation S-K is presented at the end of Part I herein and captioned "Executive Officers of the Registrant" as permitted by General Instruction G(3) to Form 10‑K and Instruction 3 to Item 401(b) of Regulation S-K.
Information required by Item 405 of Regulation S-K will be included under the heading "Section 16(a) Beneficial Ownership Reporting Compliance" in our Proxy Statement, which information is incorporated by reference herein.
Information required by paragraphs (c)(3), (d)(4) and (d)(5) of Item 407 of Regulation S-K will be included under the heading "Questions and Answers About the Annual Meeting and Voting" and "Corporate Governance and Board Matters" in our Proxy Statement, which information is incorporated by reference herein.
We have adopted a Code of Ethics for Senior Officers that applies to our Chief Executive Officer, Chief Financial Officer, and Controller, or persons performing similar functions. The Code of Ethics for Senior Officers, together with our Corporate Governance Guidelines, the charters for each of our board committees, and our Code of Business Conduct applicable to all employees are available on our Internet website at www.williams.com. We will provide, free of charge, a copy of our Code of Ethics or any of our other corporate documents listed above upon written request to our Corporate Secretary at Williams, One Williams Center, Suite 4700, Tulsa, Oklahoma 74172. We intend to disclose any amendments to or waivers of the Code of Ethics on behalf of our Chief Executive Officer, Chief Financial Officer, Controller, and persons performing similar functions on the corporate governance section of our Internet website at www.williams.com , promptly following the date of any such amendment or waiver.
Item 11. Executive Compensation
The information required by Item 402 and paragraphs (e)(4) and (e)(5) of Item 407 of Regulation S-K regarding executive compensation will be presented under the headings "Compensation Discussion and Analysis," "Executive Compensation and Other Information," "Compensation of Directors," "Compensation Committee Report on Executive Compensation," and "Compensation Committee Interlocks and Insider Participation" in our Proxy Statement, which information is incorporated by reference herein. Notwithstanding the foregoing, the information provided under the heading "Compensation Committee Report on Executive Compensation" in our Proxy Statement is furnished and shall not be deemed to be filed for purposes of Section 18 of the Securities Exchange Act of 1934, as amended, is not subject to the liabilities of that section and is not deemed incorporated by reference in any filing under the Securities Act of 1933, as amended.
Item 12. Security Ownership of Certain Beneficial Owners and Management and Related Stockholder Matters
The information regarding securities authorized for issuance under equity compensation plans required by Item 201(d) of Regulation S-K and the security ownership of certain beneficial owners and management required by Item 403 of Regulation S-K will be presented under the headings "Equity Compensation Stock Plans" and "Security Ownership of Certain Beneficial Owners and Management" in our Proxy Statement, which information is incorporated by reference herein.
159
Item 13. Certain Relationships and Related Transactions, and Director Independence
The information regarding certain relationships and related transactions required by Item 404 and Item 407(a) of Regulation S-K will be presented under the heading "Corporate Governance and Board Matters" in our Proxy Statement, which information is incorporated by reference herein.
Item 14. Principal Accountant Fees and Services
The information regarding our principal accounting fees and services required by Item 9(e) of Schedule 14A will be presented under the heading "Principal Accountant Fees and Services" in Proposal 4 Ratification of the Appointment of Independent Auditors of our Proxy Statement, which information is incorporated by reference herein.
160
PART IV
Item 15. Exhibits and Financial Statement Schedules
(a) 1 and 2.
| Page |
Covered by report of independent auditors: |
|
Consolidated statement of income for each year in the three-year period ended December 31, 201 4 | 85 |
Consolidated statement of comprehensive income for each year in the three-year period ended December 31, 201 4 | 86 |
Consolidated balance sheet at December 31, 201 4 and 2013 | 87 |
Consolidated statement of changes in equity for each year in the three-year period ended December 31, 2014 | 88 |
Consolidated statement of cash flows for each year in the three-year period ended December 31, 201 4 | 89 |
Notes to consolidated financial statements | 90 |
Schedule for each year in the three-year period ended December 31, 201 4: |
|
I - Condensed financial information of registrant | 151 |
II - Valuation and qualifying accounts | 155 |
Not covered by report of independent auditors: |
|
Quarterly financial data (unaudited) | 148 |
All other schedules have been omitted since the required information is not present or is not present in amounts sufficient to require submission of the schedule, or because the information required is included in the financial statements and notes thereto.
(a) 3 and (b). The exhibits listed below are filed as part of this annual report.
INDEX TO EXHIBITS
Exhibit | | Description |
| | |
2.1+ | - | Agreement and Plan of Merger dated as of October 24, 2014, by and among Williams Partners L.P., Williams Partners GP LLC, Access Midstream Partners, L.P., Access Midstream Partners GP L.L.C., and VHMS LLC (filed on October 27, 2014 as Exhibit 2.1 to The Williams Companies, Inc.'s current report on Form 8-K (File No. 001-04174) and incorporated herein by reference). |
| | |
3.1 | - | Amended and Restated Certificate of Incorporation, as supplemented (filed on May 26, 2010 as Exhibit 3.1 to The Williams Companies Inc.'s current report on Form 8-K (File No. 001-04174) and incorporated herein by reference). |
| | |
3.2 | - | By-Laws (filed on August 27, 2014 as Exhibit 3.1 to The Williams Companies Inc.'s current report on Form 8-K (File No. 001-04174) and incorporated herein by reference). |
| | |
4.1 | - | Senior Indenture dated February 25, 1997, between MAPCO Inc. and Bank One Trust Company, |
| | |
161
Exhibit | | Description |
| | |
4.2 | - | Supplemental Indenture No. 1 dated March 5, 1997, between MAPCO Inc. and Bank One Trust Company, N.A. (formerly The First National Bank of Chicago), as Trustee (filed as Exhibit 4(o) to MAPCO Inc.'s annual report on Form 10-K for the fiscal year ended December 31, 1997 (File No. 001-05254) and incorporated herein by reference). |
| | |
4.3 | - | Supplemental Indenture No. 2 dated March 5, 1997, between MAPCO Inc. and Bank One Trust Company, N.A. (formerly The First National Bank of Chicago), as Trustee (filed as Exhibit 4(p) to MAPCO Inc.'s annual report on Form 10-K for the fiscal year ended December 31, 1997 (File No. 001-05254) and incorporated herein by reference). |
| | |
4.4 | - | Supplemental Indenture No. 3 dated March 31, 1998, among MAPCO Inc., Williams Holdings of Delaware, Inc. and Bank One Trust Company, N.A. (formerly The First National Bank of Chicago), as Trustee (filed as Exhibit 40) to Williams Holdings of Delaware, Inc.'s annual report on Form 10 K for the fiscal year ended December 31, 1998 (File No. 000-20555) and incorporated herein by reference). |
| | |
4.5 | - | Supplemental Indenture No. 4 dated as of June 30, 1999, among Williams Holdings of Delaware, Inc., Williams and Bank One Trust Company, N.A. (formerly The First National Bank of Chicago), as Trustee (filed on March 28, 2000 as Exhibit 4(q) to The Williams Companies, Inc.'s annual report on Form 10-K (File No. 001-04174) and incorporated herein by reference). |
| | |
4.6 | - | Fifth Supplemental Indenture between Williams and Bank One Trust Company, N.A., as Trustee, dated as of January 17, 2001 (filed on March 12, 2001 as Exhibit 4(k) to The Williams Companies, Inc.'s annual report on Form 10-K (File No. 001-04174) and incorporated herein by reference). |
| | |
4.7 | - | Seventh Supplemental Indenture dated March 19, 2002, between The Williams Companies, Inc. as Issuer and Bank One Trust Company, National Association, as Trustee (filed on May 9, 2002 as Exhibit 4.1 to The Williams Companies, Inc.'s quarterly report on Form 10-Q (File No. 001-04174) and incorporated herein by reference). |
| | |
4.8 | - | Indenture dated as of May 28, 2003, by and between The Williams Companies, Inc. and JPMorgan Chase Bank, as Trustee for the issuance of the 5.50% Junior Subordinated Convertible Debentures due 2033 (filed on August 12, 2003 as Exhibit 4.2 to The Williams Companies, Inc.'s quarterly report on Form 10-Q (File No. 001-04174) and incorporated herein by reference). |
| | |
4.9 | - | Indenture dated as of March 5, 2009, among The Williams Companies, Inc. and The Bank of New York Mellon Trust Company, N.A., as Trustee (filed on March 11, 2009 as Exhibit 4.1 to The Williams Companies, Inc.'s current report on Form 8-K (File No. 001-04174) and incorporated herein by reference). |
| | |
4.10 | - | Eleventh Supplemental Indenture dated as of February 1, 2010 between The Williams Companies, Inc. and The Bank of New York Mellon Trust Company, N.A. (filed on February 2, 2010 as Exhibit 4.1 to The Williams Companies, Inc.'s current report on Form 8-K (File No. 001-04174) and incorporated herein by reference). |
| | |
4.11 | - | First Supplemental Indenture dated as of February 1, 2010 between The Williams Companies, Inc. and The Bank of New York Mellon Trust Company, N.A. (filed on February 2, 2010 as Exhibit 4.2 to The Williams Companies, Inc.'s current report on Form 8-K (File No. 001-04174) and incorporated herein by reference). |
| | |
4.12 | - | Fifth Supplemental Indenture dated as of February 1, 2010 between The Williams Companies, Inc. and The Bank of New York Mellon Trust Company, N.A. (filed on February 2, 2010 as Exhibit 4.3 to The Williams Companies, Inc.'s current report on Form 8-K (File No. 001-04174) and incorporated herein by reference). |
| | |
162
Exhibit | | Description |
| | |
4.13 | - | Indenture, dated December 18, 2012 between The Williams Companies, Inc. and The Bank of New York Mellon Trust Company, N.A. as trustee (filed on December 20, 2012 as Exhibit 4.1 to The Williams Companies, Inc.'s current report on Form 8-K (File No. 001-04174) and incorporated herein by reference). |
| | |
4.14 | - | First Supplemental Indenture, dated December 18, 2012, between The Williams Companies, Inc. and The Bank of New York Mellon Trust Company, N.A. as trustee (filed on December 20, 2012 as Exhibit 4.2 to The Williams Companies, Inc.'s current report on Form 8-K (File No. 001-04174) and incorporated herein by reference). |
| | |
4.15 | - | Second Supplemental Indenture, dated as of June 24, 2014, between The Williams Companies, Inc. and The Bank of New York Mellon Trust Company, N.A., as trustee (filed on June 24, 2014 as Exhibit 4.1 to The Williams Companies, Inc.'s current report on Form 8-K (File No. 001-04174) and incorporated herein by reference). |
| | |
4.16 | - | Indenture, dated December 13, 2006, by and among Williams Partners L.P., Williams Partners Finance Corporation and The Bank of New York (filed on December 19, 2006 as Exhibit 4.1 to Pre-merger WPZ's report on Form 8-K (File No. 001-32599) and incorporated herein by reference). |
| | |
4.17 | - | First Supplemental Indenture, dated as of February 2, 2015, among Williams Partners L.P., Williams Partners Finance Corporation and The Bank of New York Mellon Trust Company, N.A. (filed on February 3, 2015, as Exhibit 4.6 to Williams Partners L.P.'s current report on Form 8-K (File No. 001-34831) and incorporated herein by reference). |
| | |
4.18 | - | Indenture dated as of February 9, 2010, between Williams Partners L.P. and The Bank of New York Mellon Trust Company, N.A. (filed on February 10, 2010 as Exhibit 4.1 to The Williams Companies, Inc.'s current report on Form 8-K (File No. 001-04174) and incorporated herein by reference). |
| | |
4.19 | - | First Supplemental Indenture, dated as of February 2, 2015, between Williams Partners L.P. and The Bank of New York Mellon Trust Company, N.A. (filed on February 3, 2015, as Exhibit 4.5 to Williams Partners L.P.'s current report on Form 8-K (File No. 001-34831) and incorporated herein by reference). |
| | |
4.20 | - | Indenture, dated as of November 9, 2010, between Williams Partners L.P. and The Bank of New York Mellon Trust Company, N.A., as trustee (filed on November 12, 2010 as Exhibit 4.1 to Williams Partners L.P.'s current report on Form 8-K (File No. 001-32599) and incorporated herein by reference). |
| | |
4.21 | - | First Supplemental Indenture, dated as of November 9, 2010, between Williams Partners L.P. and The Bank of New York Mellon Trust Company, N.A., as trustee (filed on November 12, 2010 as Exhibit 4.1 to Williams Partners L.P.'s current report on Form 8-K (File No. 001-32599) and incorporated herein by reference). |
| | |
4.22 | - | Second Supplemental Indenture, dated as of November 17, 2011, between Williams Partners L.P. and The Bank of New York Mellon Trust Company, N.A., as trustee (filed November 18, 2011 as Exhibit 4.1 to Williams Partners L.P.'s current report on Form 8-K (File No. 001-32599) and incorporated herein by reference). |
| | |
4.23 | - | Third Supplemental Indenture (including Form of 3.35% Senior Notes due 2022), dated as of August 14, 2012, between Williams Partners L.P. and The Bank of New York Mellon Trust Company, N.A., as trustee (filed on August 14, 2012 as Exhibit 4.1 to Williams Partners L.P.'s current report on Form 8-K (File No. 001-32599) and incorporated herein by reference). |
| | |
4.24 | - | Fourth Supplemental Indenture, dated as of November 15, 2013, between Williams Partners L.P. and The Bank of New York Mellon Trust Company, N .A., as trustee (filed on November 18, 2013 as Exhibit 4.1 to Williams Partners L.P.'s current report on Form 8-K (File No. 001-32599) and incorporated herein by reference). |
| | |
163
Exhibit | | Description |
| | |
4.25 | - | Fifth Supplemental Indenture, dated as of March 4, 2014, between Williams Partners L.P. and The Bank of New York Mellon Trust Company, N.A., as trustee (filed as Exhibit 4.1 to Williams Partners L.P.'s report on Form 8-K (File No. 001-32599) and incorporated herein by reference). |
| | |
4.26 | - | Sixth Supplemental Indenture, dated as of June 27, 2014, between Williams Partners L.P. and The Bank of New York Mellon Trust Company, N.A., as trustee (filed on June 27, 2014 as Exhibit 4.1 to Williams Partners L.P.'s report on Form 8-K (File No. 001-32599)) and incorporated herein by reference. |
| | |
4.27 | - | Seventh Supplemental Indenture, dated as of February 2, 2015, between Williams Partners L.P. and The Bank of New York Mellon Trust Company, N.A. (filed on February 3, 2015, as Exhibit 4.4 to Williams Partners L.P.'s current report on Form 8-K (File No. 001-34831) and incorporated herein by reference). |
| | |
4.28 | - | Indenture, dated as of April 19, 2011, by and among the Chesapeake Midstream Partners, L.P., CHKM Finance Corp, the Guarantors named therein and The Bank of New York Mellon Trust Company, N.A., as trustee (filed on April 20, 2011 as Exhibit 4.1 to Williams Partners L.P.'s (formerly known as Access Midstream Partners L.P.) current report on 8-K (File No. 001-34831) and incorporated herein by reference). |
| | |
4.29 | - | First Supplemental Indenture, dated as of January 4, 2012 among Chesapeake Midstream Partners, L.P., CHKM Finance Corp, the Guarantors named therein and The Bank of New York Mellon Trust Company, N.A., as trustee (filed on May 1, 2014 as Exhibit 4.1 to Williams Partners L.P.'s (formerly known as Access Midstream Partners L.P.) quarterly report on 10-Q (File No. 001-34831) and incorporated herein by reference). |
| | |
4.30 | - | First Supplemental Indenture, dated as of January 7, 2013, by and among the Access Midstream Partners, L.P., ACMP Finance Corp., the guarantors named therein and The Bank of New York Mellon Trust Company, N.A., as trustee (filed on August 19, 2013 as Exhibit 4.2 to Williams Partners L.P.'s (formerly known as Access Midstream Partners L.P.) current report on 8-K (File No. 001-34831) and incorporated herein by reference). |
| | |
4.31 | - | Third Supplemental Indenture and Amendment - Subsidiary Guarantee, dated as of April 18, 2014 (filed on May 1, 2014 as Exhibit 4.5 to Williams Partners L.P.'s (formerly known as Access Midstream Partners L.P.) quarterly report on 10-Q (File No. 001-34831) and incorporated herein by reference). |
| | |
4.32 | - | Fourth Supplemental Indenture dated February 2, 2015, by and among Williams Partners L.P., ACMP Finance Corp. and The Bank of New York Mellon Trust Company, N.A., as trustee (filed on February 3, 2015, as Exhibit 4.1 to Williams Partners L.P.'s current report on Form 8-K (File No. 001-34831) and incorporated herein by reference). |
| | |
4.33 | - | Indenture, dated as of January 11, 2012, by and among the Chesapeake Midstream Partners, L.P., CHKM Finance Corp, the Guarantors named therein and The Bank of New York Mellon Trust Company, N.A., as trustee (filed on January 11, 2012 as Exhibit 4.1 to Williams Partners L.P.'s (then known as Access Midstream Partners L.P.) current report on 8-K (File No. 001-34831) and incorporated herein by reference). |
| | |
4.34 | - | First Supplemental Indenture, dated as of January 7, 2013, by and among Access Midstream Partners, L.P., ACMP Finance Corp., the guarantors named therein and The Bank of New York Mellon Trust Company, N.A., as trustee (filed on February 21, 2014 as Exhibit 4.5 to Williams Partners L.P.'s (then known as Access Midstream Partners L.P.) annual report on 10-K (File No. 001-34831) and incorporated herein by reference). |
| | |
164
Exhibit | | Description |
| | |
4.35 | - | Second Supplemental Indenture and Amendment - Subsidiary Guarantee, dated as of April 18, 2014 among the Access Midstream Partners, L.P., ACMP Finance Corp, the Guarantors named therein and The Bank of New York Mellon Trust Company, N.A., as trustee filed on May 1, 2014 as Exhibit 4.4 to Williams Partners L.P.'s (then known as Access Midstream Partners L.P.) quarterly report on 10-Q (File No. 001-34831) and incorporated herein by reference). |
| | |
4.36 | - | Third Supplemental Indenture among Williams Partners L.P., ACMP Finance Corp. and The Bank of New York Mellon Trust Company, N.A. (filed on February 3, 2015, as Exhibit 4.2 to Williams Partners L.P.'s current report on Form 8-K (File No. 001-34831) and incorporated herein by reference). |
| | |
4.37 | - | Indenture, dated as of December 19, 2012, by and among Access Midstream Partners, L.P., ACMP Finance Corp., the guarantors listed therein and The Bank of New York Mellon Trust Company, N.A., as trustee (filed on December 19, 2012 as Exhibit 4.1 to Williams Partners L.P.'s (formerly known as Access Midstream Partners L.P.) current report on 8-K (File No. 001-34831) and incorporated herein by reference). |
| | |
4.38 | - | First Supplemental Indenture, dated as of December 19, 2012, among Access Midstream Partners, L.P., ACMP Finance Corp., the guarantors listed therein and The Bank of New York Mellon Trust Company, N.A., as trustee (filed on December 19, 2012 as Exhibit 4.2 to Williams Partners L.P.'s (formerly known as Access Midstream Partners L.P.) current report on 8-K (File No. 001-34831) and incorporated herein by reference). |
| | |
4.39 | - | Second Supplemental Indenture and Amendment - Subsidiary Guarantee, dated as of January 7, 2013, by among Access Midstream Partners, L.P., ACMP Finance Corp., the guarantors named therein and The Bank of New York Mellon Trust Company, N.A., as trustee (filed on February 21, 2014 as Exhibit 4.9 to Williams Partners L.P.'s (formerly known as Access Midstream Partners L.P.) annual report on 10-K (File No. 001-34831) and incorporated herein by reference). |
| | |
4.40 | - | Third Supplemental Indenture, dated as of March 7, 2014, among the Access Midstream Partners, L.P., ACMP Finance Corp, the Guarantors named therein and The Bank of New York Mellon Trust Company, N.A., as trustee (filed on March 7, 2014 as Exhibit 4.2 to Williams Partners L.P.'s (formerly known as Access Midstream Partners L.P.) current report on 8-K (File No. 001-34831) and incorporated herein by reference). |
| | |
4.41 | - | Third Supplemental Indenture and Amendment - Subsidiary Guarantee, dated as of April 18, 2014, among the Access Midstream Partners, L.P., ACMP Finance Corp, the Guarantors named therein and The Bank of New York Mellon Trust Company, N.A., as trustee (filed on May 1, 2014 as Exhibit 4.3 to Williams Partners L.P.'s (formerly known as Access Midstream Partners L.P.) quarterly report on 10-Q (File No. 001-34831) and incorporated herein by reference). |
| | |
4.42 | - | Fifth Supplemental Indenture among Williams Partners L.P., ACMP Finance Corp. and The Bank of New York Mellon Trust Company, N.A. (filed on February 3, 2015, as Exhibit 4.3 to Williams Partners L.P.'s current report on Form 8-K (File No. 001-34831) and incorporated herein by reference). |
| | |
4.43 | - | Senior Indenture dated as of November 30, 1995, between Northwest Pipeline Corporation and Chemical Bank, Trustee (filed September 14, 1995 as Exhibit 4.1 to Northwest Pipeline's registration statement on Form S-3 (File No. 033-62639) and incorporated herein by reference). |
| | |
4.44 | - | Indenture dated as of June 22, 2006, between Northwest Pipeline Corporation and JPMorgan Chase Bank, N.A., as Trustee (filed on June 23, 2006 as Exhibit 4.1 to Northwest Pipeline's current report on Form 8-K (File No. 001-07414) and incorporated herein by reference). |
| | |
4.45 | - | Indenture dated as of April 5, 2007, between Northwest Pipeline Corporation and The Bank of New York (filed on April 5, 2007 as Exhibit 4.1 to Northwest Pipeline Corporation's current report on Form 8-K (File No. 001-07414) and incorporated herein by reference). |
| | |
165
Exhibit | | Description |
| | |
4.46 | - | Indenture dated May 22, 2008, between Northwest Pipeline GP and The Bank of New York Trust Company, N.A., as Trustee (filed on May 23, 2008 as Exhibit 4.1 to Northwest Pipeline GP's current report on Form 8-K (File No. 001-07414) and incorporated herein by reference). |
| | |
4.47 | - | Senior Indenture dated as of July 15, 1996 between Transcontinental Gas Pipe Line Corporation and Citibank, N.A., as Trustee (filed on April 2, 1996 as Exhibit 4.1 to Transcontinental Gas Pipe Line Corporation's registration statement on Form S-3 (File No. 333-02155) and incorporated herein by reference). |
| | |
4.48 | - | Indenture dated as of April 11, 2006 between Transcontinental Gas Pipe Line Corporation and JPMorgan Chase Bank, N.A., as Trustee (filed on April 11,2006 as Exhibit 4.1 to Transcontinental Gas Pipe Line Corporation's current report on Form 8-K (File No. 001-07584) and incorporated herein by reference). |
| | |
4.49 | - | Indenture dated May 22, 2008, between Transcontinental Gas Pipe Line Corporation and The Bank of New York Trust Company, N.A., as Trustee (filed on May 23, 2008 as Exhibit 4.1 to Transcontinental Gas Pipe Line Corporation's current report on Form 8-K (File No. 001-07584) and incorporated herein by reference). |
| | |
4.50 | - | Indenture dated as of August 12, 2011 , between Transcontinental Gas Pipe Line Company, LLC and The Bank of New York Mellon Trust Company, N.A., as trustee (filed on August 12, 2011 as Exhibit 4.1 to Transcontinental Gas Pipe Line Company, LLC's current report on Form 8K (File No. 001-07584) and incorporated herein by reference). |
| | |
4.51 | - | Indenture, dated as of July 13, 2012, between Transcontinental Gas Pipe Line Company, LLC and The Bank of New York Mellon Trust Company, N.A., as trustee (filed on July 16, 2012 as Exhibit 4. 1 to Transcontinental Gas Pipe Line Company, LLC's current report on Form 8-K (File No. 001-07584) and incorporated herein by reference). |
| | |
10.1§ | - | The Williams Companies Amended and Restated Retirement Restoration Plan effective January l , 2008 (filed on February 25, 2009 as Exhibit 10.1 to The Williams Companies, Inc.'s annual report on Form 10-K (File No. 001-04174) and incorporated herein by reference). |
| | |
10.2§ | - | Form of Director and Officer Indemnification Agreement (filed on September 24, 2008 as Exhibit 10.1 to The Williams Companies, Inc.'s current report on Form 8-K (File No. 001-04174) and incorporated herein by reference). |
| | |
10.3§ | - | Form of 2011 Restricted Stock Unit Agreement among Williams and certain nonmanagement directors (filed on February 27, 2012 as Exhibit 10.7 to The Williams Companies, Inc.'s annual report on Form 10-K (File No. 001-04174) and incorporated herein by reference). |
| | |
10.4§ | - | Form of 2012 Restricted Stock Unit Agreement among Williams and certain nonmanagement directors (filed on August 2, 2012 as Exhibit 10.2 to The Williams Companies, Inc.'s quarterly report on Form 10-Q (File No. 001 -04174) and incorporated herein by reference). |
| | |
10.5§ | - | Form of 2013 Performance-Based Restricted Stock Unit Agreement among Williams and certain employees and officers (filed on February 27, 2013 as Exhibit 10.4 to The Williams Companies, Inc.'s annual report on Form 10-K (File No. 001-04174) and incorporated herein by reference). |
| | |
10.6§ | - | Form of 2013 Restricted Stock Unit Agreement among Williams and certain employees and officers (filed on February 27, 2013 as Exhibit 10.5 to The Williams Companies Inc.'s annual report on Form 10-K (File No. 001-04174) and incorporated herein by reference). |
| | |
10.7§ | - | Form of 2013 Nonqualified Stock Option Agreement among Williams and certain employees and officers (filed on February 27, 2013 as Exhibit 10.6 to The Williams Companies, Inc.'s annual report on Form 10-K (File No. 001-04174) and incorporated herein by reference). |
| | |
166
Exhibit | | Description |
| | |
10.8§ | - | Form of 2013 Restricted Stock Unit Agreement among Williams and certain nonmanagement directors (filed on February 26, 2014 as Exhibit 10.11 to The Williams Companies, Inc. annual report on Form 10-K (File No. 001-04174) and incorporated herein by reference). |
| | |
10.9§ | - | Form of 2014 Performance-Based Restricted Stock Unit Agreement among Williams and certain employees and officers (filed on February 26, 2014 as Exhibit 10.6 to The Williams Companies, Inc. annual report on Form 10-K (File No. 001-04174) and incorporated herein by reference). |
| | |
10.10§ | - | Form of 2014 Restricted Stock Unit Agreement among Williams and certain employees and officers (filed on February 26, 2014 as Exhibit 10.7 to The Williams Companies, Inc. annual report on Form 10-K (File No. 001-04174) and incorporated herein by reference). |
| | |
10.11§ | - | Form of 2014 Nonqualified Stock Option Agreement among Williams and certain employees and officers (filed on February 26, 2014 as Exhibit 10.8 to The Williams Companies, Inc. annual report on Form 10-K (File No. 001-04174) and incorporated herein by reference). |
| | |
10.12* | - | Form of 2014 Restricted Stock Unit Agreement among Williams and certain nonmanagement directors. |
| | |
10.13§* | - | Form of October 2014 Leveraged Performance Unit Award Agreement among Williams and certain officers. |
| | |
10.14§* | - | Form of Leveraged Performance Unit Award Agreement dated January 1, 2015 between Williams and Walter Bennett. |
| | |
10.15§* | - | Form of 2015 Performance-Based Restricted Stock Unit Agreement among Williams and certain employees and officers. |
| | |
10.16§* | - | Form of 2015 Time-Based Restricted Stock Unit Agreement among Williams and certain employees and officers. |
| | |
10.17§* | - | Form of 2015 Nonqualified Stock Option Agreement among Williams and certain employees and officers. |
| | |
10.18§ | - | The Williams Companies, Inc. I996 Stock Plan for Nonemployee Directors (filed on March 27, 1996 as Exhibit B to The Williams Companies, Inc.'s Proxy Statement (File No. 001-04174) and incorporated herein by reference). |
| | |
10.19§ | - | The Williams Companies, Inc. 2002 Incentive Plan as amended and restated effective as of January 23, 2004 (filed on August 5, 2004 as Exhibit 10.1 to The Williams Companies, Inc.'s quarterly report on Form 10-Q (File No. 001-04174) and incorporated herein by reference). |
| | |
10.20§ | - | Amendment No. 1 to The Williams Companies, Inc. 2002 Incentive Plan (filed on February 25, 2009 as Exhibit 10.11 to The Williams Companies, Inc.'s annual report on Form 10-K (File No. 001-04174) and incorporated herein by reference). |
| | |
10.21§ | - | Amendment No. 2 to The Williams Companies, Inc. 2002 Incentive Plan (filed on February 25, 2009 as Exhibit 10.12 to The Williams Companies, Inc.'s annual report on Form 10-K (File No. 001-04174) and incorporated herein by reference). |
| | |
10.22§ | - | The Williams Companies, Inc. 2007 Incentive Plan as amended and restated effective January 19, 2012 (filed on May 1, 2012 as Exhibit 10.12 to The Williams Companies, Inc.'s annual report on Form 10-K (File No. 001-04174) and incorporated herein by reference). |
| | |
167
Exhibit | | Description |
| | |
10.23§ | - | Amended and Restated Change-in-Control Severance Agreement between the Company and certain executive officers (Tier I Executives) (filed on February 27, 2013 as Exhibit 10.14 to The Williams Companies, Inc.'s annual report on Form 10-K (File No. 001-04174) and incorporated herein by reference). |
| | |
10.24§ | - | Amended and Restated Change-in-Control Severance Agreement between the Company and certain executive officers (Tier II Executives) (filed on February 27, 2012, as Exhibit 10.14 to The Williams Companies, Inc.'s annual report on Form 10-K (File No. 001-04174) and incorporated herein by reference). |
| | |
10.25 | - | Separation and Distribution Agreement dated as of December 30, 2011 , between The Williams Companies, Inc. and WPX Energy, Inc. (Filed on February 27, 2012 as Exhibit 10.19 to The Williams Companies, Inc.'s annual report on Form 10-K (File No. 001-04174) and incorporated herein by reference). |
| | |
10.26 | - | Tax Sharing Agreement, dated as of December 30, 2011, between The Williams Companies, Inc. and WPX Energy, Inc. (filed on January 6, 2012 as Exhibit 10.3 to The Williams Companies, Inc.'s current report on Form 8-K (File No. 001-04174) and incorporated herein by reference). |
| | |
10.27 | - | Form of Commercial Paper Dealer Agreement, dated as of March 12, 2013, between Williams Partners L.P., as Issuer, and the Dealer party thereto (filed on March 18, 2013 as Exhibit 10.1 to Williams Partners L.P.'s current report on Form 8-K (File No. 001-32599) and incorporated herein by reference). |
| | |
10.28 | - | Second Amended and Restated Credit Agreement, dated as of May 13, 2013, by and among Access MLP Operating, L.L.C., as the borrower, Access Midstream Partners, L.P., Wells Fargo Bank, National Association, as Administrative Agent, Swing Line Lender and the Issuing Lender, and the other lenders party thereto (filed on May 14, 2013 as Exhibit 10.1 to Access Midstream Partners, L.P.'s current report on Form 8-K (File No. 001-34831) and incorporated herein by reference). |
| | |
10.29 | - | First Amended & Restated Credit Agreement dated as of July 31, 2013, by and among The Williams Companies, Inc., as Borrower, the lenders named therein, and Citibank N.A., as Administrative Agent (filed on July 31, 2013 as Exhibit 10.1 to The Williams Companies, Inc.'s quarterly report on Form 10-Q (File No. 001-32599) and incorporated herein by reference). |
| | |
10.30 | - | First Amended & Restated Credit Agreement dated as of July 31, 2013, by and among Williams Partners L.P., Northwest Pipeline LLC and Transcontinental Gas Pipe Line Company, LLC, as co borrowers, the lenders named therein, and Citibank N.A., as Administrative Agent (filed on July 31, 2013 as Exhibit 10 to Williams Partners L.P.'s quarterly report on Form 10-Q (File No. 001-32599) and incorporated herein by reference). |
| | |
10.31 | - | Letter Agreement, dated January 27, 2014, with James E. Scheel, Senior Vice President - Northeast G&P, regarding Relocation from Pennsylvania Benefits (filed on May 1, 2014 as Exhibit 10.2 to The Williams Companies, Inc.'s quarterly report on Form 10-Q (File No. 001-04174) and incorporated herein by reference). |
| | |
10.32 | - | Settlement Agreement, dated as of February 25, 2014, by and among Corvex Management LP, Keith Meister, Soroban Master Fund LP, Soroban Capital Partners LLC, Eric W. Mandelblatt, and The Williams Companies, Inc. (filed on February 25, 2014, as Exhibit 99.1 to The Williams Companies Inc.'s current report on Form 8-K (File No. 001-04174) and incorporated herein by reference). |
| | |
10.33 | - | The Williams Companies, Inc. 2007 Incentive Plan as amended and restated effective May 22, 2014 (filed April 11, 2014 as Appendix A to The Williams Companies, Inc.'s Definitive Proxy Statement on Schedule 14A (File No. 001-04174) and incorporated herein by reference). |
| | |
168
Exhibit | | Description |
| | |
10.34 | - | Purchase Agreement, dated as of June 14, 2014, by and among GIP II Eagle Holdings Partnership, L.P., GIP II Hawk Holdings Partnership, L.P., GIP II Eagle 2 Holding, L.P. and GIP Hawk 2 Holding, L.P., as Sellers and The Williams Companies, Inc., as Buyer (filed on June 16, 2014 as Exhibit 10.1 to The Williams Companies, Inc.'s current report on Form 8-K (File No. 001-04174) and incorporated herein by reference). |
| | |
10.35 | - | Amendment No. 1, dated as of June 27, 2014 to the First Amended & Restated Credit Agreement, by and among The Williams Companies, Inc., the lenders named therein, and Citibank, N.A., as Administrative Agent (filed on July 1, 2014 as Exhibit 10.1 to The Williams Companies, Inc.'s current report on Form 8-K (File No. 001-04174) and incorporated herein by reference). |
| | |
10.36 | - | Amendment No. 1 and Consent to First Amended & Restated Credit Agreement, dated as of December 1, 2014, by and among Williams Partners L.P., Northwest Pipeline LLC and Transcontinental Gas Pipe Line Company, LLC, as co-borrowers, the lenders named therein, and Citibank, N.A., as Administrative Agent (filed on December 4, 2014 as Exhibit 10.1 to The Williams Companies, Inc.'s current report on Form 8-K (File No. 001-04174) and incorporated herein by reference). |
| | |
10.37 | - | Second Amended and Restated Credit Agreement dated as of February 2, 2015, between The Williams Companies, Inc., the lenders named therein, and Citibank, N.A. as Administrative Agent (filed on February 3, 2014 as Exhibit 10.1 to The Williams Companies, Inc.'s current report on Form 8-K (File 001-04174) and incorporated herein by reference). |
| | |
10.38 | - | Second Amended and Restated Credit Agreement dated as of February 2, 2015, between Williams Partners L.P. (formerly known as Access Midstream Partners, L.P.), Northwest Pipeline LLC, Transcontinental Gas Pipeline Company, LLC, as co-borrowers, the lenders named therein, and Citibank, N.A. as Administrative Agent (filed on February 3, 2015 as Exhibit 10.1 to Williams Partners L.P.'s Current Report on Form 8-K (File No. 001-34831) and incorporated herein by reference). |
| | |
10.39 | - | Form of Amended and Restated Commercial Paper Dealer Agreement, dated as of February 2, 2015, between Williams Partners L.P., as Issuer, and the Dealer party thereto (filed on February 3, 2015 as Exhibit 10.3 to Williams Partners L.P.'s Current Report on Form 8-K (File No. 001-34831) and incorporated herein by reference). |
| | |
10.40 | - | Credit Agreement dated as of February 3, 2015, between Williams Partners L.P., the lenders named therein, and Barclays Bank PLC as Administrative Agent (filed on February 3, 2015 as Exhibit 10.2 to Williams Partners L.P.'s Current Report on Form 8-K (File No. 001-34831) and incorporated herein by reference). |
| | |
10.41 | - | Form of Amended and Restated Commercial Paper Dealer Agreement, dated as of February 2, 2015, between Williams Partners L.P., as Issuer, and the Dealer party thereto(filed on February 3, 2015 as Exhibit 10.3 to Williams Partners L.P.'s Current Report on Form 8-K (File No. 001-34831) and incorporated herein by reference). |
| | |
10.42 | - | Employment Agreement, effective as of January 1, 2013, between Access Midstream Partners GP, L.L.C. and Walter J. Bennett (filed on February 25, 2015 as Exhibit 10.15 to Williams Partners L.P.'s Annual Report on Form 10-K (File No. 001-34831) and incorporated herein by reference). |
| | |
10.43 | - | Employment Agreement, effective as of January 1, 2013, between Access Midstream Partners GP, L.L.C. and Robert S. Purgason (filed on December 27, 2012 as Exhibit 10.3 to Williams Partners L.P.'s current report on Form 8-K (File No. 001-34831) and incorporated herein by reference). |
| | |
10.44 | - | Amendment to Employment Agreement, effective as of October 17, 2014 between Access Midstream Partners GP, L.L.C. and Robert S. Purgason (filed on February 25, 2015 as Exhibit 10.12 to Williams Partners L.P.'s Annual Report on Form 10-K (File No. 001-34831) and incorporated herein by reference). |
169
Exhibit | | Description |
| | |
| | |
12* | - | Computation of Ratio of Earnings to Combined Fixed Charges. |
| | |
14 | - | Code of Ethics for Senior Officers (filed on March 15, 2004 as Exhibit 14 to The Williams |
| | |
21* | - | Subsidiaries of the registrant. |
| | |
23.1* | - | Consent of Independent Registered Public Accounting Firm, Ernst & Young LLP. |
| | |
23.2* | - | Consent of Independent Registered Public Accounting Firm, Deloitte & Touche LLP. |
| | |
23.3* | - | Consent of Independent Registered Public Accounting Firm, PricewaterhouseCoopers LLP. |
| | |
24* | - | Power of Attorney. |
| | |
31.1* | - | Certification of the Chief Executive Officer pursuant to Rules 13a-l 4(a) and 15d-14(a) promulgated under the Securities Exchange Act of 1934, as amended, and Item 601(b)(3 l) of Regulation S-K, as adopted pursuant to Section 302 of the Sarbanes-Oxley Act of 2002. |
| | |
31.2* | - | Certification of the Chief Financial Officer pursuant to Rules 13a-14(a) and l 5d-l 4(a) promulgated under the Securities Exchange Act of 1934, as amended, and Item 601(b)(31) of Regulation S-K, as adopted pursuant to Section 302 of the Sarbanes-Oxley Act of 2002. |
| | |
32** | - | Certification of the Chief Executive Officer and the Chief Financial Officer pursuant to 18 U.S.C. Section 1350, as adopted pursuant to Section 906 of the Sarbanes-Oxley Act of 2002. |
| | |
101.INS* | - | XBRL Instance Document. |
| | |
101.SCH* | - | XBRL Taxonomy Extension Schema. |
| | |
101.CAL* | - | XBRL Taxonomy Extension Calculation Linkbase. |
| | |
101.DEF* | - | XBRL Taxonomy Extension Definition Linkbase. |
| | |
101.LAB* | - | XBRL Taxonomy Extension Label Linkbase. |
| | |
101.PRE* | - | XBRL Taxonomy Extension Presentation Linkbase. |
______________ | |
* | Filed herewith |
** | Furnished herewith |
§ | Management contract or compensatory plan or arrangement |
+ | Pursuant to item 601(6)(2) of Regulation S-K, the registrant agrees to furnish supplementally a copy of any omitted exhibit or schedule to the SEC upon request. |
170
SIGNATURES
Pursuant to the requirements of Section 13 or 15(d) of the Securities Exchange Act of 1934, the registrant has duly caused this report to be signed on its behalf by the undersigned, thereunto duly authorized.
T HE W ILLIAMS C OMPANIES , I NC . (Registrant) | ||
|
|
|
By: |
| /s/ T ED T. T IMMERMANS |
|
| Ted T. Timmermans Vice President, Controller and Chief Accounting Officer |
Date: February 25, 2015
Pursuant to the requirements of the Securities Exchange Act of 1934, this report has been signed below by the following persons on behalf of the registrant and in the capacities and on the dates indicated.
Signature |
| Title |
| Date |
|
|
|
|
|
/s/ A LAN S. A RMSTRONG |
| President, Chief Executive Officer and Director |
| February 25, 2015 |
Alan S. Armstrong |
| (Principal Executive Officer) |
|
|
|
|
|
|
|
/s/ D ONALD R. C HAPPEL |
| Senior Vice President and Chief Financial Officer |
| February 25, 2015 |
Donald R. Chappel |
| (Principal Financial Officer) |
|
|
|
|
|
|
|
/s/ T ED T. T IMMERMANS |
| Vice President, Controller and Chief Accounting Officer |
| February 25, 2015 |
Ted T. Timmermans |
| (Principal Accounting Officer) |
|
|
|
|
|
|
|
/s/ J OSEPH R. C LEVELAND * |
| Director |
| February 25, 2015 |
Joseph R. Cleveland* |
|
|
|
|
|
|
|
|
|
/s/ K ATHLEEN B. C OOPER * |
| Director |
| February 25, 2015 |
Kathleen B. Cooper* |
|
|
|
|
|
|
|
|
|
/s/ J OHN A. H AGG * |
| Director |
| February 25, 2015 |
John A. Hagg* |
|
|
|
|
/s/ J UANITA H. H INSHAW * |
| Director |
| February 25, 2015 |
Juanita H. Hinshaw* |
|
|
|
|
|
|
|
|
|
/s/ R ALPH I ZZO * |
| Director |
| February 25, 2015 |
Ralph Izzo* |
|
|
|
|
|
|
|
|
|
/s/ F RANK T. M AC I NNIS * |
| Chairman of the Board |
| February 25, 2015 |
Frank T. MacInnis* |
|
|
|
|
|
|
|
|
|
/s/ E RIC W. M ANDELBLATT * |
| Director |
| February 25, 2015 |
Eric W. Mandelblatt* |
|
|
|
|
|
|
|
|
|
/s/ K EITH A. M EISTER * |
| Director |
| February 25, 2015 |
Keith A. Meister* |
|
|
|
|
171
Signature |
| Title |
| Date |
|
|
|
|
|
/s/ S TEVEN W. N ANCE * |
| Director |
| February 25, 2015 |
Steven W. Nance* |
|
|
|
|
|
|
|
|
|
/s/ M URRAY D. S MITH * |
| Director |
| February 25, 2015 |
Murray D. Smith* |
|
|
|
|
|
|
|
|
|
/ S / J ANICE D. S TONEY * |
| Director |
| February 25, 2015 |
Janice D. Stoney* |
|
|
|
|
|
|
|
|
|
/ S / L AURA A. S UGG * |
| Director |
| February 25, 2015 |
Laura A. Sugg* |
|
|
|
|
*By: |
| /s/ S ARAH C. M ILLER |
|
|
| February 25, 2015 |
|
| Sarah C. Miller Attorney-in-Fact |
|
|
|
|
172
INDEX TO EXHIBITS
Exhibit |
| Description |
|
|
|
2.1+ | - | Agreement and Plan of Merger dated as of October 24, 2014, by and among Williams Partners L.P., Williams Partners GP LLC, Access Midstream Partners, L.P., Access Midstream Partners GP L.L.C., and VHMS LLC (filed on October 27, 2014 as Exhibit 2.1 to The Williams Companies, Inc.'s current report on Form 8-K (File No. 001-04174) and incorporated herein by reference). |
|
|
|
3.1 | - | Amended and Restated Certificate of Incorporation, as supplemented (filed on May 26, 2010 as Exhibit 3.1 to The Williams Companies Inc.'s current report on Form 8-K (File No. 001-04174) and incorporated herein by reference). |
|
|
|
3.2 | - | By-Laws (filed on August 27, 2014 as Exhibit 3.1 to The Williams Companies Inc.'s current report on Form 8-K (File No. 001-04174) and incorporated herein by reference). |
|
|
|
4.1 | - | Senior Indenture dated February 25, 1997, between MAPCO Inc. and Bank One Trust Company, |
|
|
|
4.2 | - | Supplemental Indenture No. 1 dated March 5, 1997, between MAPCO Inc. and Bank One Trust Company, N.A. (formerly The First National Bank of Chicago), as Trustee (filed as Exhibit 4(o) to MAPCO Inc.'s annual report on Form 10-K for the fiscal year ended December 31, 1997 (File No. 001-05254) and incorporated herein by reference). |
|
|
|
4.3 | - | Supplemental Indenture No. 2 dated March 5, 1997, between MAPCO Inc. and Bank One Trust Company, N.A. (formerly The First National Bank of Chicago), as Trustee (filed as Exhibit 4(p) to MAPCO Inc.'s annual report on Form 10-K for the fiscal year ended December 31, 1997 (File No. 001-05254) and incorporated herein by reference). |
|
|
|
4.4 | - | Supplemental Indenture No. 3 dated March 31, 1998, among MAPCO Inc., Williams Holdings of Delaware, Inc. and Bank One Trust Company, N.A. (formerly The First National Bank of Chicago), as Trustee (filed as Exhibit 40) to Williams Holdings of Delaware, Inc.'s annual report on Form 10 K for the fiscal year ended December 31, 1998 (File No. 000-20555) and incorporated herein by reference). |
|
|
|
4.5 | - | Supplemental Indenture No. 4 dated as of June 30, 1999, among Williams Holdings of Delaware, Inc., Williams and Bank One Trust Company, N.A. (formerly The First National Bank of Chicago), as Trustee (filed on March 28, 2000 as Exhibit 4(q) to The Williams Companies, Inc.'s annual report on Form 10-K (File No. 001-04174) and incorporated herein by reference). |
|
|
|
4.6 | - | Fifth Supplemental Indenture between Williams and Bank One Trust Company, N.A., as Trustee, dated as of January 17, 2001 (filed on March 12, 2001 as Exhibit 4(k) to The Williams Companies, Inc.'s annual report on Form 10-K (File No. 001-04174) and incorporated herein by reference). |
|
|
|
4.7 | - | Seventh Supplemental Indenture dated March 19, 2002, between The Williams Companies, Inc. as Issuer and Bank One Trust Company, National Association, as Trustee (filed on May 9, 2002 as Exhibit 4.1 to The Williams Companies, Inc.'s quarterly report on Form 10-Q (File No. 001-04174) and incorporated herein by reference). |
|
|
|
4.8 | - | Indenture dated as of May 28, 2003, by and between The Williams Companies, Inc. and JPMorgan Chase Bank, as Trustee for the issuance of the 5.50% Junior Subordinated Convertible Debentures due 2033 (filed on August 12, 2003 as Exhibit 4.2 to The Williams Companies, Inc.'s quarterly report on Form 10-Q (File No. 001-04174) and incorporated herein by reference). |
|
|
|
173
Exhibit |
| Description |
|
|
|
4.9 | - | Indenture dated as of March 5, 2009, among The Williams Companies, Inc. and The Bank of New York Mellon Trust Company, N.A., as Trustee (filed on March 11, 2009 as Exhibit 4.1 to The Williams Companies, Inc.'s current report on Form 8-K (File No. 001-04174) and incorporated herein by reference). |
|
|
|
4.10 | - | Eleventh Supplemental Indenture dated as of February 1, 2010 between The Williams Companies, Inc. and The Bank of New York Mellon Trust Company, N.A. (filed on February 2, 2010 as Exhibit 4.1 to The Williams Companies, Inc.'s current report on Form 8-K (File No. 001-04174) and incorporated herein by reference). |
|
|
|
4.11 | - | First Supplemental Indenture dated as of February 1, 2010 between The Williams Companies, Inc. and The Bank of New York Mellon Trust Company, N.A. (filed on February 2, 2010 as Exhibit 4.2 to The Williams Companies, Inc.'s current report on Form 8-K (File No. 001-04174) and incorporated herein by reference). |
|
|
|
4.12 | - | Fifth Supplemental Indenture dated as of February 1, 2010 between The Williams Companies, Inc. and The Bank of New York Mellon Trust Company, N.A. (filed on February 2, 2010 as Exhibit 4.3 to The Williams Companies, Inc.'s current report on Form 8-K (File No. 001-04174) and incorporated herein by reference). |
|
|
|
4.13 | - | Indenture, dated December 18, 2012 between The Williams Companies, Inc. and The Bank of New York Mellon Trust Company, N.A. as trustee (filed on December 20, 2012 as Exhibit 4.1 to The Williams Companies, Inc.'s current report on Form 8-K (File No. 001-04174) and incorporated herein by reference). |
|
|
|
4.14 | - | First Supplemental Indenture, dated December 18, 2012, between The Williams Companies, Inc. and The Bank of New York Mellon Trust Company, N.A. as trustee (filed on December 20, 2012 as Exhibit 4.2 to The Williams Companies, Inc.'s current report on Form 8-K (File No. 001-04174) and incorporated herein by reference). |
|
|
|
4.15 | - | Second Supplemental Indenture, dated as of June 24, 2014, between The Williams Companies, Inc. and The Bank of New York Mellon Trust Company, N.A., as trustee (filed on June 24, 2014 as Exhibit 4.1 to The Williams Companies, Inc.'s current report on Form 8-K (File No. 001-04174) and incorporated herein by reference). |
|
|
|
4.16 | - | Indenture, dated December 13, 2006, by and among Williams Partners L.P., Williams Partners Finance Corporation and The Bank of New York (filed on December 19, 2006 as Exhibit 4.1 to Pre-merger WPZ's report on Form 8-K (File No. 001-32599) and incorporated herein by reference). |
|
|
|
4.17 | - | First Supplemental Indenture, dated as of February 2, 2015, among Williams Partners L.P., Williams Partners Finance Corporation and The Bank of New York Mellon Trust Company, N.A. (filed on February 3, 2015, as Exhibit 4.6 to Williams Partners L.P.'s current report on Form 8-K (File No. 001-34831) and incorporated herein by reference). |
|
|
|
4.18 | - | Indenture dated as of February 9, 2010, between Williams Partners L.P. and The Bank of New York Mellon Trust Company, N.A. (filed on February 10, 2010 as Exhibit 4.1 to The Williams Companies, Inc.'s current report on Form 8-K (File No. 001-04174) and incorporated herein by reference). |
|
|
|
4.19 | - | First Supplemental Indenture, dated as of February 2, 2015, between Williams Partners L.P. and The Bank of New York Mellon Trust Company, N.A. (filed on February 3, 2015, as Exhibit 4.5 to Williams Partners L.P.'s current report on Form 8-K (File No. 001-34831) and incorporated herein by reference). |
|
|
|
4.20 | - | Indenture, dated as of November 9, 2010, between Williams Partners L.P. and The Bank of New York Mellon Trust Company, N.A., as trustee (filed on November 12, 2010 as Exhibit 4.1 to Williams Partners L.P.'s current report on Form 8-K (File No. 001-32599) and incorporated herein by reference). |
|
|
|
174
Exhibit |
| Description |
|
|
|
4.21 | - | First Supplemental Indenture, dated as of November 9, 2010, between Williams Partners L.P. and The Bank of New York Mellon Trust Company, N.A., as trustee (filed on November 12, 2010 as Exhibit 4.1 to Williams Partners L.P.'s current report on Form 8-K (File No. 001-32599) and incorporated herein by reference). |
|
|
|
4.22 | - | Second Supplemental Indenture, dated as of November 17, 2011, between Williams Partners L.P. and The Bank of New York Mellon Trust Company, N.A., as trustee (filed November 18, 2011 as Exhibit 4.1 to Williams Partners L.P.'s current report on Form 8-K (File No. 001-32599) and incorporated herein by reference). |
|
|
|
4.23 | - | Third Supplemental Indenture (including Form of 3.35% Senior Notes due 2022), dated as of August 14, 2012, between Williams Partners L.P. and The Bank of New York Mellon Trust Company, N.A., as trustee (filed on August 14, 2012 as Exhibit 4.1 to Williams Partners L.P.'s current report on Form 8-K (File No. 001-32599) and incorporated herein by reference). |
|
|
|
4.24 | - | Fourth Supplemental Indenture, dated as of November 15, 2013, between Williams Partners L.P. and The Bank of New York Mellon Trust Company, N .A., as trustee (filed on November 18, 2013 as Exhibit 4.1 to Williams Partners L.P.'s current report on Form 8-K (File No. 001-32599) and incorporated herein by reference). |
|
|
|
4.25 | - | Fifth Supplemental Indenture, dated as of March 4, 2014, between Williams Partners L.P. and The Bank of New York Mellon Trust Company, N.A., as trustee (filed as Exhibit 4.1 to Williams Partners L.P.'s report on Form 8-K (File No. 001-32599) and incorporated herein by reference). |
|
|
|
4.26 | - | Sixth Supplemental Indenture, dated as of June 27, 2014, between Williams Partners L.P. and The Bank of New York Mellon Trust Company, N.A., as trustee (filed on June 27, 2014 as Exhibit 4.1 to Williams Partners L.P.'s report on Form 8-K (File No. 001-32599)) and incorporated herein by reference. |
|
|
|
4.27 | - | Seventh Supplemental Indenture, dated as of February 2, 2015, between Williams Partners L.P. and The Bank of New York Mellon Trust Company, N.A. (filed on February 3, 2015, as Exhibit 4.4 to Williams Partners L.P.'s current report on Form 8-K (File No. 001-34831) and incorporated herein by reference). |
|
|
|
4.28 | - | Indenture, dated as of April 19, 2011, by and among the Chesapeake Midstream Partners, L.P., CHKM Finance Corp, the Guarantors named therein and The Bank of New York Mellon Trust Company, N.A., as trustee (filed on April 20, 2011 as Exhibit 4.1 to Williams Partners L.P.'s (formerly known as Access Midstream Partners L.P.) current report on 8-K (File No. 001-34831) and incorporated herein by reference). |
|
|
|
4.29 | - | First Supplemental Indenture, dated as of January 4, 2012 among Chesapeake Midstream Partners, L.P., CHKM Finance Corp, the Guarantors named therein and The Bank of New York Mellon Trust Company, N.A., as trustee (filed on May 1, 2014 as Exhibit 4.1 to Williams Partners L.P.'s (formerly known as Access Midstream Partners L.P.) quarterly report on 10-Q (File No. 001-34831) and incorporated herein by reference). |
|
|
|
4.30 | - | First Supplemental Indenture, dated as of January 7, 2013, by and among the Access Midstream Partners, L.P., ACMP Finance Corp., the guarantors named therein and The Bank of New York Mellon Trust Company, N.A., as trustee (filed on August 19, 2013 as Exhibit 4.2 to Williams Partners L.P.'s (formerly known as Access Midstream Partners L.P.) current report on 8-K (File No. 001-34831) and incorporated herein by reference). |
|
|
|
4.31 | - | Third Supplemental Indenture and Amendment - Subsidiary Guarantee, dated as of April 18, 2014 (filed on May 1, 2014 as Exhibit 4.5 to Williams Partners L.P.'s (formerly known as Access Midstream Partners L.P.) quarterly report on 10-Q (File No. 001-34831) and incorporated herein by reference). |
|
|
|
175
Exhibit |
| Description |
|
|
|
4.32 | - | Fourth Supplemental Indenture dated February 2, 2015, by and among Williams Partners L.P., ACMP Finance Corp. and The Bank of New York Mellon Trust Company, N.A., as trustee (filed on February 3, 2015, as Exhibit 4.1 to Williams Partners L.P.'s current report on Form 8-K (File No. 001-34831) and incorporated herein by reference). |
|
|
|
4.33 | - | Indenture, dated as of January 11, 2012, by and among the Chesapeake Midstream Partners, L.P., CHKM Finance Corp, the Guarantors named therein and The Bank of New York Mellon Trust Company, N.A., as trustee (filed on January 11, 2012 as Exhibit 4.1 to Williams Partners L.P.'s (then known as Access Midstream Partners L.P.) current report on 8-K (File No. 001-34831) and incorporated herein by reference). |
|
|
|
4.34 | - | First Supplemental Indenture, dated as of January 7, 2013, by and among Access Midstream Partners, L.P., ACMP Finance Corp., the guarantors named therein and The Bank of New York Mellon Trust Company, N.A., as trustee (filed on February 21, 2014 as Exhibit 4.5 to Williams Partners L.P.'s (then known as Access Midstream Partners L.P.) annual report on 10-K (File No. 001-34831) and incorporated herein by reference). |
|
|
|
4.35 | - | Second Supplemental Indenture and Amendment - Subsidiary Guarantee, dated as of April 18, 2014 among the Access Midstream Partners, L.P., ACMP Finance Corp, the Guarantors named therein and The Bank of New York Mellon Trust Company, N.A., as trustee filed on May 1, 2014 as Exhibit 4.4 to Williams Partners L.P.'s (then known as Access Midstream Partners L.P.) quarterly report on 10-Q (File No. 001-34831) and incorporated herein by reference). |
|
|
|
4.36 | - | Third Supplemental Indenture among Williams Partners L.P., ACMP Finance Corp. and The Bank of New York Mellon Trust Company, N.A. (filed on February 3, 2015, as Exhibit 4.2 to Williams Partners L.P.'s current report on Form 8-K (File No. 001-34831) and incorporated herein by reference). |
|
|
|
4.37 | - | Indenture, dated as of December 19, 2012, by and among Access Midstream Partners, L.P., ACMP Finance Corp., the guarantors listed therein and The Bank of New York Mellon Trust Company, N.A., as trustee (filed on December 19, 2012 as Exhibit 4.1 to Williams Partners L.P.'s (formerly known as Access Midstream Partners L.P.) current report on 8-K (File No. 001-34831) and incorporated herein by reference). |
|
|
|
4.38 | - | First Supplemental Indenture, dated as of December 19, 2012, among Access Midstream Partners, L.P., ACMP Finance Corp., the guarantors listed therein and The Bank of New York Mellon Trust Company, N.A., as trustee (filed on December 19, 2012 as Exhibit 4.2 to Williams Partners L.P.'s (formerly known as Access Midstream Partners L.P.) current report on 8-K (File No. 001-34831) and incorporated herein by reference). |
|
|
|
4.39 | - | Second Supplemental Indenture and Amendment - Subsidiary Guarantee, dated as of January 7, 2013, by among Access Midstream Partners, L.P., ACMP Finance Corp., the guarantors named therein and The Bank of New York Mellon Trust Company, N.A., as trustee (filed on February 21, 2014 as Exhibit 4.9 to Williams Partners L.P.'s (formerly known as Access Midstream Partners L.P.) annual report on 10-K (File No. 001-34831) and incorporated herein by reference). |
|
|
|
4.40 | - | Third Supplemental Indenture, dated as of March 7, 2014, among the Access Midstream Partners, L.P., ACMP Finance Corp, the Guarantors named therein and The Bank of New York Mellon Trust Company, N.A., as trustee (filed on March 7, 2014 as Exhibit 4.2 to Williams Partners L.P.'s (formerly known as Access Midstream Partners L.P.) current report on 8-K (File No. 001-34831) and incorporated herein by reference). |
|
|
|
4.41 | - | Third Supplemental Indenture and Amendment - Subsidiary Guarantee, dated as of April 18, 2014, among the Access Midstream Partners, L.P., ACMP Finance Corp, the Guarantors named therein and The Bank of New York Mellon Trust Company, N.A., as trustee (filed on May 1, 2014 as Exhibit 4.3 to Williams Partners L.P.'s (formerly known as Access Midstream Partners L.P.) quarterly report on 10-Q (File No. 001-34831) and incorporated herein by reference). |
|
|
|
176
Exhibit |
| Description |
|
|
|
4.42 | - | Fifth Supplemental Indenture among Williams Partners L.P., ACMP Finance Corp. and The Bank of New York Mellon Trust Company, N.A. (filed on February 3, 2015, as Exhibit 4.3 to Williams Partners L.P.'s current report on Form 8-K (File No. 001-34831) and incorporated herein by reference). |
|
|
|
4.43 | - | Senior Indenture dated as of November 30, 1995, between Northwest Pipeline Corporation and Chemical Bank, Trustee (filed September 14, 1995 as Exhibit 4.1 to Northwest Pipeline's registration statement on Form S-3 (File No. 033-62639) and incorporated herein by reference). |
|
|
|
4.44 | - | Indenture dated as of June 22, 2006, between Northwest Pipeline Corporation and JPMorgan Chase Bank, N.A., as Trustee (filed on June 23, 2006 as Exhibit 4.1 to Northwest Pipeline's current report on Form 8-K (File No. 001-07414) and incorporated herein by reference). |
|
|
|
4.45 | - | Indenture dated as of April 5, 2007, between Northwest Pipeline Corporation and The Bank of New York (filed on April 5, 2007 as Exhibit 4.1 to Northwest Pipeline Corporation's current report on Form 8-K (File No. 001-07414) and incorporated herein by reference). |
|
|
|
4.46 | - | Indenture dated May 22, 2008, between Northwest Pipeline GP and The Bank of New York Trust Company, N.A., as Trustee (filed on May 23, 2008 as Exhibit 4.1 to Northwest Pipeline GP's current report on Form 8-K (File No. 001-07414) and incorporated herein by reference). |
|
|
|
4.47 | - | Senior Indenture dated as of July 15, 1996 between Transcontinental Gas Pipe Line Corporation and Citibank, N.A., as Trustee (filed on April 2, 1996 as Exhibit 4.1 to Transcontinental Gas Pipe Line Corporation's registration statement on Form S-3 (File No. 333-02155) and incorporated herein by reference). |
|
|
|
4.48 | - | Indenture dated as of April 11, 2006 between Transcontinental Gas Pipe Line Corporation and JPMorgan Chase Bank, N.A., as Trustee (filed on April 11,2006 as Exhibit 4.1 to Transcontinental Gas Pipe Line Corporation's current report on Form 8-K (File No. 001-07584) and incorporated herein by reference). |
|
|
|
4.49 | - | Indenture dated May 22, 2008, between Transcontinental Gas Pipe Line Corporation and The Bank of New York Trust Company, N.A., as Trustee (filed on May 23, 2008 as Exhibit 4.1 to Transcontinental Gas Pipe Line Corporation's current report on Form 8-K (File No. 001-07584) and incorporated herein by reference). |
|
|
|
4.50 | - | Indenture dated as of August 12, 2011 , between Transcontinental Gas Pipe Line Company, LLC and The Bank of New York Mellon Trust Company, N.A., as trustee (filed on August 12, 2011 as Exhibit 4.1 to Transcontinental Gas Pipe Line Company, LLC's current report on Form 8K (File No. 001-07584) and incorporated herein by reference). |
|
|
|
4.51 | - | Indenture, dated as of July 13, 2012, between Transcontinental Gas Pipe Line Company, LLC and The Bank of New York Mellon Trust Company, N.A., as trustee (filed on July 16, 2012 as Exhibit 4. 1 to Transcontinental Gas Pipe Line Company, LLC's current report on Form 8-K (File No. 001-07584) and incorporated herein by reference). |
|
|
|
10.1§ | - | The Williams Companies Amended and Restated Retirement Restoration Plan effective January l , 2008 (filed on February 25, 2009 as Exhibit 10.1 to The Williams Companies, Inc.'s annual report on Form 10-K (File No. 001-04174) and incorporated herein by reference). |
|
|
|
10.2§ | - | Form of Director and Officer Indemnification Agreement (filed on September 24, 2008 as Exhibit 10.1 to The Williams Companies, Inc.'s current report on Form 8-K (File No. 001-04174) and incorporated herein by reference). |
|
|
|
10.3§ | - | Form of 2011 Restricted Stock Unit Agreement among Williams and certain nonmanagement directors (filed on February 27, 2012 as Exhibit 10.7 to The Williams Companies, Inc.'s annual report on Form 10-K (File No. 001-04174) and incorporated herein by reference). |
177
Exhibit |
| Description |
|
|
|
|
|
|
10.4§ | - | Form of 2012 Restricted Stock Unit Agreement among Williams and certain nonmanagement directors (filed on August 2, 2012 as Exhibit 10.2 to The Williams Companies, Inc.'s quarterly report on Form 10-Q (File No. 001 -04174) and incorporated herein by reference). |
|
|
|
10.5§ | - | Form of 2013 Performance-Based Restricted Stock Unit Agreement among Williams and certain employees and officers (filed on February 27, 2013 as Exhibit 10.4 to The Williams Companies, Inc.'s annual report on Form 10-K (File No. 001-04174) and incorporated herein by reference). |
|
|
|
10.6§ | - | Form of 2013 Restricted Stock Unit Agreement among Williams and certain employees and officers (filed on February 27, 2013 as Exhibit 10.5 to The Williams Companies Inc.'s annual report on Form 10-K (File No. 001-04174) and incorporated herein by reference). |
|
|
|
10.7§ | - | Form of 2013 Nonqualified Stock Option Agreement among Williams and certain employees and officers (filed on February 27, 2013 as Exhibit 10.6 to The Williams Companies, Inc.'s annual report on Form 10-K (File No. 001-04174) and incorporated herein by reference). |
|
|
|
10.8§ | - | Form of 2013 Restricted Stock Unit Agreement among Williams and certain nonmanagement directors (filed on February 26, 2014 as Exhibit 10.11 to The Williams Companies, Inc. annual report on Form 10-K (File No. 001-04174) and incorporated herein by reference). |
|
|
|
10.9§ | - | Form of 2014 Performance-Based Restricted Stock Unit Agreement among Williams and certain employees and officers (filed on February 26, 2014 as Exhibit 10.6 to The Williams Companies, Inc. annual report on Form 10-K (File No. 001-04174) and incorporated herein by reference). |
|
|
|
10.10§ | - | Form of 2014 Restricted Stock Unit Agreement among Williams and certain employees and officers (filed on February 26, 2014 as Exhibit 10.7 to The Williams Companies, Inc. annual report on Form 10-K (File No. 001-04174) and incorporated herein by reference). |
|
|
|
10.11§ | - | Form of 2014 Nonqualified Stock Option Agreement among Williams and certain employees and officers (filed on February 26, 2014 as Exhibit 10.8 to The Williams Companies, Inc. annual report on Form 10-K (File No. 001-04174) and incorporated herein by reference). |
|
|
|
10.12* | - | Form of 2014 Restricted Stock Unit Agreement among Williams and certain nonmanagement directors. |
|
|
|
10.13§* | - | Form of October 2014 Leveraged Performance Unit Award Agreement among Williams and certain officers. |
|
|
|
10.14§* | - | Form of Leveraged Performance Unit Award Agreement dated January 1, 2015 between Williams and Walter Bennett. |
|
|
|
10.15§* | - | Form of 2015 Performance-Based Restricted Stock Unit Agreement among Williams and certain employees and officers. |
|
|
|
10.16§* | - | Form of 2015 Time-Based Restricted Stock Unit Agreement among Williams and certain employees and officers. |
|
|
|
10.17§* | - | Form of 2015 Nonqualified Stock Option Agreement among Williams and certain employees and officers. |
|
|
|
10.18§ | - | The Williams Companies, Inc. I996 Stock Plan for Nonemployee Directors (filed on March 27, 1996 as Exhibit B to The Williams Companies, Inc.'s Proxy Statement (File No. 001-04174) and incorporated herein by reference). |
|
|
|
178
Exhibit |
| Description |
|
|
|
10.19§ | - | The Williams Companies, Inc. 2002 Incentive Plan as amended and restated effective as of January 23, 2004 (filed on August 5, 2004 as Exhibit 10.1 to The Williams Companies, Inc.'s quarterly report on Form 10-Q (File No. 001-04174) and incorporated herein by reference). |
|
|
|
10.20§ | - | Amendment No. 1 to The Williams Companies, Inc. 2002 Incentive Plan (filed on February 25, 2009 as Exhibit 10.11 to The Williams Companies, Inc.'s annual report on Form 10-K (File No. 001-04174) and incorporated herein by reference). |
|
|
|
10.21§ | - | Amendment No. 2 to The Williams Companies, Inc. 2002 Incentive Plan (filed on February 25, 2009 as Exhibit 10.12 to The Williams Companies, Inc.'s annual report on Form 10-K (File No. 001-04174) and incorporated herein by reference). |
|
|
|
10.22§ | - | The Williams Companies, Inc. 2007 Incentive Plan as amended and restated effective January 19, 2012 (filed on May 1, 2012 as Exhibit 10.12 to The Williams Companies, Inc.'s annual report on Form 10-K (File No. 001-04174) and incorporated herein by reference). |
|
|
|
10.23§ | - | Amended and Restated Change-in-Control Severance Agreement between the Company and certain executive officers (Tier I Executives) (filed on February 27, 2013 as Exhibit 10.14 to The Williams Companies, Inc.'s annual report on Form 10-K (File No. 001-04174) and incorporated herein by reference). |
|
|
|
10.24§ | - | Amended and Restated Change-in-Control Severance Agreement between the Company and certain executive officers (Tier II Executives) (filed on February 27, 2012, as Exhibit 10.14 to The Williams Companies, Inc.'s annual report on Form 10-K (File No. 001-04174) and incorporated herein by reference). |
|
|
|
10.25 | - | Separation and Distribution Agreement dated as of December 30, 2011 , between The Williams Companies, Inc. and WPX Energy, Inc. (Filed on February 27, 2012 as Exhibit 10.19 to The Williams Companies, Inc.'s annual report on Form 10-K (File No. 001-04174) and incorporated herein by reference). |
|
|
|
10.26 | - | Tax Sharing Agreement, dated as of December 30, 2011, between The Williams Companies, Inc. and WPX Energy, Inc. (filed on January 6, 2012 as Exhibit 10.3 to The Williams Companies, Inc.'s current report on Form 8-K (File No. 001-04174) and incorporated herein by reference). |
|
|
|
10.27 | - | Form of Commercial Paper Dealer Agreement, dated as of March 12, 2013, between Williams Partners L.P., as Issuer, and the Dealer party thereto (filed on March 18, 2013 as Exhibit 10.1 to Williams Partners L.P.'s current report on Form 8-K (File No. 001-32599) and incorporated herein by reference). |
|
|
|
10.28 | - | Second Amended and Restated Credit Agreement, dated as of May 13, 2013, by and among Access MLP Operating, L.L.C., as the borrower, Access Midstream Partners, L.P., Wells Fargo Bank, National Association, as Administrative Agent, Swing Line Lender and the Issuing Lender, and the other lenders party thereto (filed on May 14, 2013 as Exhibit 10.1 to Access Midstream Partners, L.P.'s current report on Form 8-K (File No. 001-34831) and incorporated herein by reference). |
|
|
|
10.29 | - | First Amended & Restated Credit Agreement dated as of July 31, 2013, by and among The Williams Companies, Inc., as Borrower, the lenders named therein, and Citibank N.A., as Administrative Agent (filed on July 31, 2013 as Exhibit 10.1 to The Williams Companies, Inc.'s quarterly report on Form 10-Q (File No. 001-32599) and incorporated herein by reference). |
|
|
|
10.30 | - | First Amended & Restated Credit Agreement dated as of July 31, 2013, by and among Williams Partners L.P., Northwest Pipeline LLC and Transcontinental Gas Pipe Line Company, LLC, as co borrowers, the lenders named therein, and Citibank N.A., as Administrative Agent (filed on July 31, 2013 as Exhibit 10 to Williams Partners L.P.'s quarterly report on Form 10-Q (File No. 001-32599) and incorporated herein by reference). |
|
|
|
179
Exhibit |
| Description |
|
|
|
10.31 | - | Letter Agreement, dated January 27, 2014, with James E. Scheel, Senior Vice President - Northeast G&P, regarding Relocation from Pennsylvania Benefits (filed on May 1, 2014 as Exhibit 10.2 to The Williams Companies, Inc.'s quarterly report on Form 10-Q (File No. 001-04174) and incorporated herein by reference). |
|
|
|
10.32 | - | Settlement Agreement, dated as of February 25, 2014, by and among Corvex Management LP, Keith Meister, Soroban Master Fund LP, Soroban Capital Partners LLC, Eric W. Mandelblatt, and The Williams Companies, Inc. (filed on February 25, 2014, as Exhibit 99.1 to The Williams Companies Inc.'s current report on Form 8-K (File No. 001-04174) and incorporated herein by reference). |
|
|
|
10.33 | - | The Williams Companies, Inc. 2007 Incentive Plan as amended and restated effective May 22, 2014 (filed April 11, 2014 as Appendix A to The Williams Companies, Inc.'s Definitive Proxy Statement on Schedule 14A (File No. 001-04174) and incorporated herein by reference). |
|
|
|
10.34 | - | Purchase Agreement, dated as of June 14, 2014, by and among GIP II Eagle Holdings Partnership, L.P., GIP II Hawk Holdings Partnership, L.P., GIP II Eagle 2 Holding, L.P. and GIP Hawk 2 Holding, L.P., as Sellers and The Williams Companies, Inc., as Buyer (filed on June 16, 2014 as Exhibit 10.1 to The Williams Companies, Inc.'s current report on Form 8-K (File No. 001-04174) and incorporated herein by reference). |
|
|
|
10.35 | - | Amendment No. 1, dated as of June 27, 2014 to the First Amended & Restated Credit Agreement, by and among The Williams Companies, Inc., the lenders named therein, and Citibank, N.A., as Administrative Agent (filed on July 1, 2014 as Exhibit 10.1 to The Williams Companies, Inc.'s current report on Form 8-K (File No. 001-04174) and incorporated herein by reference). |
|
|
|
10.36 | - | Amendment No. 1 and Consent to First Amended & Restated Credit Agreement, dated as of December 1, 2014, by and among Williams Partners L.P., Northwest Pipeline LLC and Transcontinental Gas Pipe Line Company, LLC, as co-borrowers, the lenders named therein, and Citibank, N.A., as Administrative Agent (filed on December 4, 2014 as Exhibit 10.1 to The Williams Companies, Inc.'s current report on Form 8-K (File No. 001-04174) and incorporated herein by reference). |
|
|
|
10.37 | - | Second Amended and Restated Credit Agreement dated as of February 2, 2015, between The Williams Companies, Inc., the lenders named therein, and Citibank, N.A. as Administrative Agent (filed on February 3, 2014 as Exhibit 10.1 to The Williams Companies, Inc.'s current report on Form 8-K (File 001-04174) and incorporated herein by reference). |
|
|
|
10.38 | - | Second Amended and Restated Credit Agreement dated as of February 2, 2015, between Williams Partners L.P. (formerly known as Access Midstream Partners, L.P.), Northwest Pipeline LLC, Transcontinental Gas Pipeline Company, LLC, as co-borrowers, the lenders named therein, and Citibank, N.A. as Administrative Agent (filed on February 3, 2015 as Exhibit 10.1 to Williams Partners L.P.'s Current Report on Form 8-K (File No. 001-34831) and incorporated herein by reference). |
|
|
|
10.39 | - | Form of Amended and Restated Commercial Paper Dealer Agreement, dated as of February 2, 2015, between Williams Partners L.P., as Issuer, and the Dealer party thereto (filed on February 3, 2015 as Exhibit 10.3 to Williams Partners L.P.'s Current Report on Form 8-K (File No. 001-34831) and incorporated herein by reference). |
|
|
|
10.40 | - | Credit Agreement dated as of February 3, 2015, between Williams Partners L.P., the lenders named therein, and Barclays Bank PLC as Administrative Agent (filed on February 3, 2015 as Exhibit 10.2 to Williams Partners L.P.'s Current Report on Form 8-K (File No. 001-34831) and incorporated herein by reference). |
|
|
|
180
Exhibit |
| Description |
|
|
|
10.41 | - | Form of Amended and Restated Commercial Paper Dealer Agreement, dated as of February 2, 2015, between Williams Partners L.P., as Issuer, and the Dealer party thereto(filed on February 3, 2015 as Exhibit 10.3 to Williams Partners L.P.'s Current Report on Form 8-K (File No. 001-34831) and incorporated herein by reference). |
|
|
|
10.42 | - | Employment Agreement, effective as of January 1, 2013, between Access Midstream Partners GP, L.L.C. and Walter J. Bennett (filed on February 25, 2015 as Exhibit 10.15 to Williams Partners L.P.'s Annual Report on Form 10-K (File No. 001-34831) and incorporated herein by reference). |
|
|
|
10.43 | - | Employment Agreement, effective as of January 1, 2013, between Access Midstream Partners GP, L.L.C. and Robert S. Purgason (filed on December 27, 2012 as Exhibit 10.3 to Williams Partners L.P.'s current report on Form 8-K (File No. 001-34831) and incorporated herein by reference). |
|
|
|
10.44 | - | Amendment to Employment Agreement, effective as of October 17, 2014 between Access Midstream Partners GP, L.L.C. and Robert S. Purgason (filed on February 25, 2015 as Exhibit 10.12 to Williams Partners L.P.'s Annual Report on Form 10-K (File No. 001-34831) and incorporated herein by reference). |
|
|
|
12* | - | Computation of Ratio of Earnings to Combined Fixed Charges. |
|
|
|
14 | - | Code of Ethics for Senior Officers (filed on March 15, 2004 as Exhibit 14 to The Williams |
|
|
|
21* | - | Subsidiaries of the registrant. |
|
|
|
23.1* | - | Consent of Independent Registered Public Accounting Firm, Ernst & Young LLP. |
|
|
|
23.2* | - | Consent of Independent Registered Public Accounting Firm, Deloitte & Touche LLP. |
|
|
|
23.3* | - | Consent of Independent Registered Public Accounting Firm, PricewaterhouseCoopers LLP. |
|
|
|
24* | - | Power of Attorney. |
|
|
|
31.1* | - | Certification of the Chief Executive Officer pursuant to Rules 13a-l 4(a) and 15d-14(a) promulgated under the Securities Exchange Act of 1934, as amended, and Item 601(b)(3 l) of Regulation S-K, as adopted pursuant to Section 302 of the Sarbanes-Oxley Act of 2002. |
|
|
|
31.2* | - | Certification of the Chief Financial Officer pursuant to Rules 13a-14(a) and l 5d-l 4(a) promulgated under the Securities Exchange Act of 1934, as amended, and Item 601(b)(31) of Regulation S-K, as adopted pursuant to Section 302 of the Sarbanes-Oxley Act of 2002. |
|
|
|
32** | - | Certification of the Chief Executive Officer and the Chief Financial Officer pursuant to 18 U.S.C. Section 1350, as adopted pursuant to Section 906 of the Sarbanes-Oxley Act of 2002. |
|
|
|
101.INS* | - | XBRL Instance Document. |
|
|
|
101.SCH* | - | XBRL Taxonomy Extension Schema. |
|
|
|
101.CAL* | - | XBRL Taxonomy Extension Calculation Linkbase. |
|
|
|
101.DEF* | - | XBRL Taxonomy Extension Definition Linkbase. |
|
|
|
101.LAB* | - | XBRL Taxonomy Extension Label Linkbase. |
|
|
|
181
Exhibit |
| Description |
|
|
|
101.PRE* | - | XBRL Taxonomy Extension Presentation Linkbase. |
______________ | |
* | Filed herewith |
** | Furnished herewith |
§ | Management contract or compensatory plan or arrangement |
+ | Pursuant to item 601(6)(2) of Regulation S-K, the registrant agrees to furnish supplementally a copy of any omitted exhibit or schedule to the SEC upon request. |
182