|
UNITED STATES SECURITIES AND EXCHANGE COMMISSION
WASHINGTON, D.C. 20549
FORM 10-K
ANNUAL REPORT PURSUANT TO SECTION 13 OR 15(d)
OF THE SECURITIES EXCHANGE ACT OF 1934
For the fiscal year ended January 31, 2015
Commission File No. 001-34807

Verint Systems Inc.
(Exact Name of Registrant as Specified in its Charter)
Delaware |
| 11-3200514 |
(State or Other Jurisdiction of Incorporation or Organization) |
| (I.R.S. Employer Identification No.) |
|
|
|
330 South Service Road, Melville, New York |
| 11747 |
(Address of Principal Executive Offices) |
| (Zip Code) |
Registrant's telephone number, including area code: (631) 962-9600
Securities registered pursuant to Section 12(b) of the Act:
Title of each class |
| Name of each exchange on which registered |
Common Stock, $.001 par value per share |
| The NASDAQ Stock Market, LLC (NASDAQ Global Select Market) |
Securities registered pursuant to Section 12(g) of the Act:
None
(Title of Class)
Indicate by check mark if the registrant is a well-known seasoned issuer, as defined in Rule 405 of the Securities Act. Yes ☑ No o
Indicate by check mark if the registrant is not required to file reports pursuant to Section 13 or Section 15(d) of the Exchange Act. Yes o No ☑
Indicate by check mark whether the registrant (1) has filed all reports required to be filed by Section 13 or 15(d) of the Securities Exchange Act of 1934 during the preceding 12 months (or for such shorter period that the registrant was required to file such reports), and (2) has been subject to such filing requirements for the past 90 days. Yes ☑ No o
Indicate by check mark whether the registrant has submitted electronically and posted on its corporate Web site, if any, every Interactive Data File required to be submitted and posted pursuant to Rule 405 of Regulation S-T (§232.405 of this chapter) during the preceding 12 months (or for such shorter period that the registrant was required to submit and post such files). Yes ☑ No o
Indicate by check mark if disclosure of delinquent filers pursuant to Item 405 of Regulation S-K (§229.405 of this chapter) is not contained herein, and will not be contained, to the best of registrant's knowledge, in definitive proxy or information statements incorporated by reference in Part III of this Form 10-K or any amendment to this Form 10-K. o
Indicate by check mark whether the registrant is a large accelerated filer, an accelerated filer, a non-accelerated filer, or a smaller reporting company. See definitions of "large accelerated filer," "accelerated filer" and "smaller reporting company" in Rule 12b-2 of the Exchange Act.
Large accelerated filer ☑ Accelerated filer o
Non-accelerated filer o Smaller reporting company o
(Do not check if a smaller reporting company)
Indicate by check mark whether the registrant is a shell company (as defined in Rule 12b-2 of the Exchange Act). Yes o No ☑
The aggregate market value of common stock held by non-affiliates of the registrant, based on the closing price for the registrant's common stock on the NASDAQ Global Select Market on the last business day of the registrant's most recently completed second fiscal quarter (July 31, 2014) was approximately $2,832,767,000.
There were 60,904,912 shares of the registrant's common stock outstanding on March 13, 2015.
DOCUMENTS INCORPORATED BY REFERENCE
The information required by Part III of this report, to the extent not set forth herein, is incorporated herein by reference from the registrant's definitive proxy statement relating to the Annual Meeting of Stockholders to be held in 2015, which definitive proxy statement shall be filed with the Securities and Exchange Commission within 120 days after the end of the fiscal year to which this report relates.
|
Table of Contents
Verint Systems Inc. and Subsidiaries | ||
Index to Form 10-K | ||
For the Year Ended January 31, 2015 | ||
|
|
|
|
| Page |
|
|
|
Cautionary Note on Forward-Looking Statements | ii | |
|
|
|
PART I |
|
|
|
|
|
Item1. | Business | 1 |
Item 1A. | Risk Factors | 12 |
Item 1B. | Unresolved Staff Comments | 23 |
Item 2. | Properties | 24 |
Item 3. | Legal Proceedings | 24 |
Item 4. | Mine Safety Disclosures | 25 |
|
|
|
PART II |
|
|
|
|
|
Item 5. | Market for Registrant's Common Equity, Related Stockholder Matters and Issuer Purchases of Equity Securities | 26 |
Item 6. | Selected Financial Data | 27 |
Item 7. | Management's Discussion and Analysis of Financial Condition and Results of Operations | 29 |
Item 7A. | Quantitative and Qualitative Disclosures About Market Risk | 55 |
Item 8. | Financial Statements and Supplementary Data | 58 |
Item 9. | Changes in and Disagreements With Accountants on Accounting and Financial Disclosure | 117 |
Item 9A. | Controls and Procedures | 117 |
Item 9B. | Other Information | 120 |
|
|
|
PART III |
| 121 |
|
|
|
Item 10. | Directors, Executive Officers and Corporate Governance | 121 |
Item 11. | Executive Compensation | 121 |
Item 12. | Security Ownership of Certain Beneficial Owners and Management and Related Stockholder Matters | 121 |
Item 13. | Certain Relationships and Related Transactions, and Director Independence | 122 |
Item 14. | Principal Accounting Fees and Services | 122 |
|
|
|
PART IV |
|
|
|
|
|
Item 15. | Exhibits, Financial Statement Schedules | 123 |
|
|
|
Signatures |
| 127 |
i
Table of Contents
Cautionary Note on Forward-Looking Statements
This Annual Report on Form 10-K contains "forward-looking statements" within the meaning of the Private Securities Litigation Reform Act of 1995, the provisions of Section 27A of the Securities Act of 1933, as amended (the "Securities Act"), and Section 21E of the Securities Exchange Act of 1934, as amended (the "Exchange Act"). Forward-looking statements include financial projections, statements of plans and objectives for future operations, statements of future economic performance, and statements of assumptions relating thereto. Forward-looking statements may appear throughout this report, including without limitation, Part II, Item 7, "Management's Discussion and Analysis of Financial Condition and Results of Operations," and are often identified by future or conditional words such as "will", "plans", "expects", "intends", "believes", "seeks", "estimates", or "anticipates", or by variations of such words or by similar expressions. There can be no assurances that forward-looking statements will be achieved. By their very nature, forward-looking statements involve known and unknown risks, uncertainties, assumptions, and other important factors that could cause our actual results or conditions to differ materially from those expressed or implied by such forward-looking statements. Important risks, uncertainties, assumptions, and other factors that could cause our actual results or conditions to differ materially from our forward-looking statements include, among others:
• | uncertainties regarding the impact of general economic conditions in the United States and abroad, particularly in information technology spending and government budgets, on our business; |
• | risks associated with our ability to keep pace with technological changes, new customer challenges, and evolving industry standards in our product offerings, adapt to changing market potential from area to area within our markets and successfully develop, launch, and drive demand for new, innovative, high-quality products that meet or exceed customer needs; |
• | risks due to aggressive competition in all of our markets, including with respect to maintaining margins and sufficient levels of investment in our business; |
• | risks created by the continued consolidation of our competitors or the introduction of large competitors in our markets with greater resources than we have; |
• | risks associated with our ability to successfully compete for, consummate, and implement mergers and acquisitions, including risks associated with valuations, capital constraints, costs and expenses, maintaining profitability levels, expansion into new areas of growth, management distraction, post-acquisition integration activities, and potential asset impairments; |
• | risks relating to our ability to effectively and efficiently enhance our existing operations and execute on our growth strategy, including managing investments in our business and operations and enhancing and securing our internal and external operations; |
• | risks associated with our ability to effectively and efficiently allocate limited financial and human resources to business, development, strategic, or other opportunities that may not come to fruition or produce satisfactory returns; |
• | risks that we may be unable to establish and maintain relationships with key resellers, partners, and systems integrators; |
• | risks associated with the mishandling or perceived mishandling of sensitive or confidential information, security lapses, or with information technology system failures or disruptions; |
• | risks associated with our significant international operations, including, among others, in Israel, Europe, and Asia, exposure to regions subject to political or economic instability, and fluctuations in foreign exchange rates; |
• | risks associated with a significant amount of our business coming from domestic and foreign government customers, including the ability to maintain security clearances for certain projects; |
• | risks associated with complex and changing local and foreign regulatory environments in the jurisdictions in which we operate; |
• | risks associated with our ability to retain and recruit qualified personnel in regions in which we operate, especially in new markets and growth areas we may enter; |
ii
Table of Contents
• | challenges associated with selling sophisticated solutions, long sales cycles, and emphasis on larger transactions, including in assisting customers in realizing the benefits of our solutions and in accurately forecasting revenue and expenses and in maintaining profitability; |
• | risks that our intellectual property rights may not be adequate to protect our business or assets or that others may make claims on our intellectual property or claim infringement on their intellectual property rights; |
• | risks that our products may contain defects or may be vulnerable to cyber-attacks, which could expose us to substantial liability; |
• | risks associated with our reliance on third-party suppliers, partners, or original equipment manufacturers ("OEMs") for certain components, products, or services, including companies that may compete with us or work with our competitors; |
• | risks that our customers or partners delay or cancel orders or are unable to honor contractual commitments due to liquidity issues, challenges in their business, or otherwise; |
• | risks that we may experience liquidity or working capital issues and related risks that financing sources may be unavailable to us on reasonable terms or at all; |
• | risks associated with significant leverage resulting from our current debt position, including with respect to liquidity considerations, covenant limitations and compliance, fluctuations in interest rates, dilution considerations (with respect to our convertible notes), and our ability to maintain our credit ratings; |
• | risks arising as a result of contingent or other obligations or liabilities assumed in our acquisition of our former parent company, Comverse Technology, Inc. ("CTI"), or associated with formerly being consolidated with, and part of a consolidated tax group with, CTI, or as a result of CTI's former subsidiary, Comverse, Inc. ("Comverse"), being unwilling or unable to provide us with certain indemnities or transition services to which we are entitled; |
• | risks relating to the adequacy of our existing infrastructure, systems, processes, policies, procedures, and personnel and our ability to successfully implement and maintain adequate systems and internal controls for our current and future operations and reporting needs, including related risks of financial statement omissions, misstatements, restatements, or filing delays; and |
• | risks associated with changes in our tax position. |
These risks, uncertainties, assumptions, and challenges, as well as other factors, are discussed in greater detail in "Risk Factors" under Item 1A of this report. You are cautioned not to place undue reliance on forward-looking statements, which reflect our management's view only as of the date of this report. We make no commitment to revise or update any forward-looking statements in order to reflect events or circumstances after the date any such statement is made, except as otherwise required under the federal securities laws. If we were in any particular instance to update or correct a forward-looking statement, investors and others should not conclude that we would make additional updates or corrections thereafter except as otherwise required under the federal securities laws.
iii
Table of Contents
PART I
Table of Contents
Item 1. Business
Our Company
Verint ® Systems Inc. (together with its consolidated subsidiaries, "Verint", the "Company", "we", "us", and "our", unless the context indicates otherwise) is a global leader in Actionable Intelligence ® solutions.
Actionable Intelligence is a necessity in a dynamic world of massive information growth because it empowers organizations with crucial insights and enables decision makers to anticipate, respond, and take action. With Verint solutions and value-added services, organizations of all sizes and across many industries can make more timely and effective decisions. Today, more than 10,000 organizations in over 180 countries, including over 80 percent of the Fortune 100, use Verint solutions to improve enterprise performance and make the world a safer place. Verint's vision is to create A Smarter World with Actionable Intelligence ® .
Our Actionable Intelligence solutions help organizations address three important challenges: Customer Engagement Optimization; Security Intelligence; and Fraud, Risk and Compliance. We help our customers capture large amounts of information from numerous data types and sources, use analytics to glean insights from the information, and leverage the resulting Actionable Intelligence to help achieve their customer engagement, enhanced security, and risk mitigation goals.
We have established leadership positions in our respective markets by developing highly-scalable, enterprise-class solutions with advanced, integrated analytics for both unstructured and structured information. Our innovative solutions are developed by a large research and development ("R&D") team comprised of more than 1,500 professionals and backed by more than 700 patents and patent applications worldwide. To help our customers maximize the benefits of our technology over the solution lifecycle and provide a high degree of flexibility, we offer a broad range of services-such as strategic consulting, implementation services, training, maintenance, and 24 x 7 support, as well as a broad range of deployment models, including on premises, hosted, managed services, and software as a service ("SaaS").
Headquartered in Melville, New York, we support our customers around the globe directly and with an extensive network of selling and support partners.
Company Background
We were incorporated in Delaware in February 1994, and in 2014, celebrated our 20th anniversary. Our initial public offering ("IPO") took place in May 2002. Over the last decade, we have grown our revenue every year and expanded our portfolio of Actionable Intelligence solutions through a combination of organic innovation and acquisitions.
We have three operating segments: Enterprise Intelligence Solutions ™ ("Enterprise Intelligence"), Communications and Cyber Intelligence Solutions ™ ("Communications Intelligence"), and Video and Situation Intelligence Solutions ™ ("Video Intelligence"), each of which is described in greater detail below and in "Management's Discussion and Analysis of Financial Condition and Results of Operations" under Item 7 of this report. See also Note 18, "Segment, Geographic, and Significant Customer Information" to our consolidated financial statements included under Item 8 of this report for additional information and financial data about each of our operating segments and geographic regions. Our acquisition of KANA Software Inc. (together with its parent company and subsidiaries, "KANA") in February 2014 for net cash consideration of $516.6 million is described in greater detail in "Management's Discussion and Analysis of Financial Condition and Results of Operations - Overview - Notable Developments During the Year Ended January 31, 2015" included under Item 7 of this report and our acquisitions of CTI and KANA are both described in greater detail in Note 4, "Business Combinations" to our consolidated financial statements included under Item 8 of this report.
Through our website at www.verint.com, we make available our Annual Reports on Form 10-K, Quarterly Reports on Form 10-Q and Current Reports on Form 8-K, as well as amendments to those reports, filed or furnished by us pursuant to Section 13(a) or Section 15(d) of the Exchange Act, free of charge, as soon as reasonably practicable after we file such materials with, or furnish such materials to, the Securities and Exchange Commission ("SEC"). Our website address set forth above is not intended to be an active link and information on our website is not incorporated in, and should not be construed to be a part of, this report.
1
Table of Contents
Our Market-Actionable Intelligence
Actionable Intelligence is a necessity in a dynamic world of massive information growth because it empowers organizations with crucial insights and enables decision makers to anticipate, respond, and take action. Customers are now more aware of the value they can create by using insights gleaned from large data sets. The amount and types of structured and unstructured data available to customers is growing rapidly and presents new and increasing challenges and complexities. At the same time, organizations that are able to generate Actionable Intelligence from big data are better positioned to create value and achieve their strategic objectives.
Verint has been focused on Actionable Intelligence for more than a decade. Our solutions address three areas of the market:
• | Customer Engagement Optimization- solutions that help organizations enrich customer interactions, improve business processes, and optimize their workforces in order to enhance loyalty, increase revenue, mitigate risk, and manage operational costs. |
• | Security Intelligence- solutions that help organizations prevent, detect, neutralize, and investigate crime, terror, and cyber threats, as well as protect people and property . |
• | Fraud, Risk and Compliance- solutions that help organizations prevent loss; comply with regulations; investigate cyber, retail, and financial crime; and ensure continuity of business and protect private information. |
To address the Actionable Intelligence market, over the last decade, we have spent more than $1.0 billion in R&D, creating the foundation for Verint's advanced Actionable Intelligence platform. We use our Actionable Intelligence platform internally to efficiently develop innovative, highly-scalable, enterprise-class analytical solutions for the markets we serve. We define our platform as having the following four components:
• | Data Capture - Verint's Actionable Intelligence platform enables the capture of a wide range of data, including both structured and unstructured data such as operational, transactional, network, and web data. It is designed to support big data applications which depend on the ability to capture, store, and manage very large data sets from multiple data sources. |
• | Data Processing - Verint's Actionable Intelligence platform facilitates the process of taking structured and unstructured data from multiples sources and cleanses, fuses, and prepares the data for analysis. This data processing stage is particularly important in applications that require data capture and fusion from multiple sources, different systems, and numerous environments. |
• | Data Analysis - Verint's Actionable Intelligence platform enables the use of a wide range of analytical engines for data analytics, including classification, correlation, anomaly detection, identity extraction, behavioral analysis, and predictive analytics. Big data analysis is a crucial step in identifying critical insights that otherwise might not be intuitive. |
• | Data Visualization - Verint's Actionable Intelligence platform facilitates the presentation of crucial insights from the data to decision makers and the provision of workflow, collaboration, and case management capabilities so they can act appropriately. The platform supports many use cases, and the type of data visualization used for delivering actionable insights to users can be optimized based on the specific user environment. |
Customer Engagement Optimization
We are a leading provider of Customer Engagement Optimization software and services that help organizations transform customer engagements to drive better business outcomes by enhancing loyalty, increasing revenue, mitigating risk, and managing operational costs. Our Customer Engagement Optimization solutions provide our customers with Actionable Intelligence to enrich customer interactions, improve business processes, and optimize the workforce in order to achieve important strategic objectives. These solutions are implemented in industries that have significant customer service operations, such as insurance, banking and brokerage, telecommunications, media, retail, public services, and hospitality.
Historically, as organizations have looked to engage with their customers more effectively and address evolving communication channels and changing expectations, they have had to purchase multiple point solutions from different vendors,
2
Table of Contents
creating integration challenges. Even if such point solutions were able to be integrated, we believe they often do not work together optimally or in a unified manner. As a result, we believe that organizations can benefit from deploying a comprehensive Customer Engagement Optimization solution that includes customer analytics, engagement management, and enterprise workforce optimization capabilities, all from a single provider. As organizations take a more strategic approach to customer sales and service, they will be better positioned to gain a competitive advantage, build more meaningful customer and employee engagement, reduce operating costs, and increase revenue and customer loyalty.
We believe the key trends driving demand for Customer Engagement Optimization solutions include:
• | Evolving Customer Expectations . Customers expect a more personalized and consistent experience across service channels. The manner in which consumers obtain customer service has evolved from traditional call centers and in-store visits, to multichannel customer engagement centers that include web self-service and digital communications, such as email, chat, and social media. Today, consumers select service channels based on a number of factors, including which channels are available, their experiences with those channels, personal preference, and the type of service issue at hand. Often they use multiple channels for the same service-related issue, initially starting with a digital channel and ending with the call center or vice versa. Consumer expectations are changing rapidly as organizations provide them with more interaction channels than ever before. We believe consumers have come to expect a consistent, contextual, and personalized experience across these channels, and therefore, organizations are seeking Customer Engagement Optimization solutions to achieve better business outcomes. |
• | Evolving Employee Expectations. Employee expectations are also evolving. Employees want their voices to be heard and their opinions to be taken into account. They want their skills and preferences to be considered and leveraged, and they want to be able to do the right thing for the customer. Studies from the industry analyst community have reinforced the impact of an engaged and empowered workforce, finding that when it comes to serving customers, happier, more empowered employees can have a significant impact not only on the customer experience, but also a company's financial performance. We believe that this can be a significant differentiator for organizations that chose to act on these findings and that Customer Engagement Optimization solutions can play an important role in helping organizations train and develop employees and seek, analyze, and act on their opinions and feedback, and can contribute to a culture of empowerment, customer centricity, and continuous improvement. |
• | Evolving Customer-Centric Organizations. Customer-centric organizations are increasingly looking to aggregate, analyze, and act on big data to enhance operational efficiencies, build customer loyalty, and drive profitability. Today's organizations have a significant amount of structured and unstructured customer, workforce, and other business data that is generated from numerous departments and multiple systems across the enterprise. We believe that customer-centric organizations are increasingly seeking Customer Engagement Optimization solutions that allow them to collect and analyze intelligence across different service channels to gain a better understanding of the performance of their workforce, the effectiveness of their service processes, the quality of their interactions, and changing customer behaviors. When captured, analyzed, and acted upon, organizations can use this Actionable Intelligence to help achieve important strategic objectives, such as optimizing customer engagement, gaining a holistic view of customer service effectiveness, enhancing loyalty, maximizing revenue, reducing operational costs, and mitigating risk. |
Security Intelligence
We are a leading provider of Security Intelligence solutions. Our solutions are implemented in a variety of sectors, such as government, law enforcement, transportation, critical infrastructure, and commercial organizations.
We believe that terrorism, criminal activities, cyber-attacks, and other security threats, combined with new and more complex security challenges, are driving demand for innovative solutions that can enhance security through the extensive use of Actionable Intelligence to help anticipate, prepare, and respond to security threats.
We believe that the key trends driving demand for Security Intelligence solutions include:
• | Cyber Security-increasing frequency and complexity of cyber-attacks . As overall awareness of cyber risks has increased over the years, so have the investments made by many organizations seeking greater protection from these risks. However, despite investments in perimeter security and point solutions to address specific network and end-point vulnerabilities, there have been many reported incidents of successful cyber-attacks, demonstrating that legacy approaches are often not sufficient in protecting against these evolving and advanced threats. Organizations today face the challenge of an increasing level of sophistication and volume of cyber-attacks. We believe this trend will continue and that many organizations are unprepared to protect themselves against such attacks. We believe that cyber-attacks will become more |
3
Table of Contents
targeted and sophisticated and that government and commercial organizations need an integrated cyber security platform for better protection through Actionable Intelligence capabilities. Such capabilities include better detection of threats through the tight integration of multiple point solutions and better protection through improved unified workflows and analytics-based investigative capabilities.
• | Communications Intelligence-increasing complexity of communications networks and demand for advanced intelligence and investigative solutions . Law enforcement, national security, and intelligence agencies worldwide are responsible for investigations related to criminal activities, national security, terrorist networks, drug trafficking, financial crimes, and other illegal activities. Such investigations require highly complex methods and often involve collecting and analyzing information from multiple sources, including communications networks. Further, in many countries, communications service providers are mandated by government regulation to satisfy certain technical requirements for delivering communication content and data to law enforcement and government authorities, and we believe that the increasing complexity of and technological challenges present in communications networks coupled with the need for communications intelligence are creating demand for Actionable Intelligence solutions. |
• | Situational Awareness-demand for innovative, integrated solutions that combine physical security and intelligence to better anticipate and respond to security threats. Government and commercial organizations, in connection with safe city, border control, transportation security, critical infrastructure, and other large-scale security initiatives, are interested in improving security by deploying innovative security solutions that enhance situational awareness while fusing data from a wide range of security systems, including video and non-video sensors - such as audio, social media, access control, and intrusion detection. By aggregating data from multiple sensors, situational awareness solutions enable efficient information correlation and analysis; rapid, rules-based alerts and action; and the ability to share information easily within and across agencies to facilitate timely response and investigation. |
Fraud, Risk, and Compliance
Verint is an innovator and global provider of Fraud, Risk, and Compliance solutions. Our solutions are implemented across many industries, including financial services, retail, and telecommunications service providers.
We believe that enterprise organizations are looking to generate Actionable Intelligence to identify and prevent fraud, mitigate risk, and help ensure compliance with legal, regulatory, and internal requirements. Organizations across industries face the challenge of identifying fraud and non-compliance driven by the significant growth in information and the development of more sophisticated methods of intrusion that require advanced solutions to detect, mitigate, and prevent such breaches. The consequences of fraud and non-compliance extend far beyond direct financial loss to serious risks associated with information breaches that can harm both customers and organizations, leading to reputation damage, customer attrition, and in some cases significant fines and personal liability for responsible individuals.
We believe that the key trends driving demand for Fraud, Risk, and Compliance solutions include:
• | Ongoing fraud intensified by new vulnerabilities and sophisticated methods of attack . Fraud can take different forms across industries, and organizations must be prepared to address these risks effectively. Many of these risks are fueled by new system vulnerabilities and the rise of more sophisticated methods of attack. For example, in financial services, call center fraud has driven the demand for new solutions based on voice biometrics and predictive analytics to help authenticate customers. In retail, where profit margins are typically narrow, organizations are seeking solutions to investigate suspicious activities and reduce theft in their stores. We believe that organizations are seeking new analytical solutions that can analyze a wide range of information to better mitigate fraud and effectively manage risk. |
• | Organizations seeking innovative solutions to respond to rapidly-evolving legal and regulatory compliance requirements . Financial and other regulations - such as the Dodd-Frank Wall Street Reform and Consumer Protection Act, and the Payment Card Industry Data Security Standard (PCI DSS) - present tremendous compliance challenges. Consumer financial protection requirements continue to increase across the globe, with costly, large-scale remediation activities and significant financial penalties mandated for infractions. While organizations often have detailed processes and procedures for their employees to follow in support of regulatory requirements, we believe that many lack the tools to adequately capture and analyze the information they need, exposing these organizations to significant risk. We believe that organizations are looking to evolve their practices and tools that support these areas, and that new, sophisticated compliance solutions can help them address these requirements, mitigate risks, and make the necessary adjustments as regulations and other requirements continue to evolve. |
4
Table of Contents
• | Organizations seeking innovative solutions to identify, prevent, and manage operational risks in a globally distributed organization . Today, organizations are challenged to improve their risk assessment, management, and mitigation capabilities across their global, distributive operations. As a result, we believe organizations are seeking innovative solutions that aggregate risk-related data across disparate systems, enabling them to analyze and identify operational and strategic risk, and then prioritize, act upon, and mitigate such risks. |
Our Strategy
Our strategy to further enhance our position as a leading provider of Actionable Intelligence solutions worldwide includes the following key elements:
• | Continue to drive the development of Actionable Intelligence solutions for unstructured data . We were a pioneer in the development of solutions that help commercial businesses and governmental organizations derive intelligence from both structured and unstructured data. We intend to continue to drive the adoption of our Actionable Intelligence vision and solutions by building the Verint brand; expanding our portfolio of Customer Engagement Optimization, Security Intelligence, and Fraud, Risk, and Compliance solutions delivered from a single provider; leveraging our large install base of customers; and offering services that help our customers maximize their investments in our solutions. |
• | Maintain market leadership through innovation and customer centricity . We believe that to compete successfully we must continue to introduce solutions that better enable customers to derive Actionable Intelligence from their structured and unstructured data. In order to do this, we intend to continue to make significant investments in research and development, protect our intellectual property through patents and other means, and maintain regular dialog with our customer base in order to anticipate and understand their business objectives, challenges, and requirements. |
• | Continue to expand our market presence through OEM and partner relationships . We have expanded our relationships with OEMs and other channel partners. We believe that these relationships broaden our market coverage and help make our solutions even more widely available on a global basis. We intend to continue expanding our existing relationships, while creating new ones. |
• | Augment our organic growth with acquisitions . We examine acquisition opportunities regularly as a means to add technology, increase our geographic presence, enhance our market leadership, and/or expand into adjacent markets. Historically, we have engaged in acquisitions for all of these purposes and expect to continue doing so in the future when strategic opportunities arise. |
Our Operating Segments
We conduct our business through three operating segments - Enterprise Intelligence, Communications and Cyber Intelligence, and Video and Situation Intelligence. Organizing our business through three operating segments allows us to align our resources and domain expertise to more effectively address the Actionable Intelligence market. We address the Customer Engagement Optimization market opportunity through solutions from our Enterprise Intelligence segment. We address the Security Intelligence market opportunity through solutions from our Communications and Cyber Intelligence segment and Video and Situation Intelligence segment, and we address the Fraud, Risk and Compliance market opportunity through solutions from all three operating segments. Below is a summary of the solutions included in each of our segments. These include solutions that we have sold in the past and new solutions introduced during the year.
The Enterprise Intelligence Segment
Our Enterprise Intelligence solutions are summarized in the following table.
SOLUTION | DESCRIPTION |
Engagement Analytics | Provides Actionable Intelligence by correlating customer interactions and behaviors, and the journeys customers take across the array of channels they use to connect with organizations. Delivers analysis through dynamic dashboards, data visualization tools, and engagement capabilities. |
Speech Analytics | Provides a fast, smart, and accurate solution for analyzing and categorizing call recordings according to each organization's challenges and objectives, and proactively identifying root cause of issues. |
5
Table of Contents
Text Analytics | Analyzes text-based communications, including survey verbatims, postings on social media sites, and customer service chat sessions. |
Enterprise Feedback Management | Provides a n enterprise-class platform to help organizations gain a complete view into the perceptions, opinions, and intentions of their customers and employees via surveys delivered via email, web, SMS, IVR, and mobile devices. |
Identity Authentication and Fraud Detection | Combines recorder-embedded "passive" voice biometrics technology with unique predictive analytics to screen calls against databases of both customer and fraudster "voiceprints." Helps improve the customer experience by authenticating legitimate customers faster, reducing call handling and fraud-related losses. |
Employee Desktop | Unifies the employee's desktop by placing, in one location, all the customer contextual information and business process driven-knowledge that an agent or employee needs for omnichannel interactions, so they do not have to toggle between multiple screens. |
Case Management | Tracks the progress of customer and internal issues as they are resolved between various parties in the organization, and enables enforcement and measurement of compliance and quality. |
Knowledge Management | Intelligently delivers complete and contextual answers to employees during an interaction and/or to consumers over web self-service. Reduces effort and saves time for employees and consumers with automated search results based on the context of an interaction. |
Email and Whitemail Management | Enables organizations to respond faster to customer emails, letters, and faxes, using less agent time and reducing backlog of unanswered inquiries and unhappy customers. |
Web Self-Service | Enables consumers to accomplish many tasks on their own without direct interaction with customer service representatives. |
Live Chat and Co-Browse | Enables employees to help online customers when they need it the most-in real time via web chat. Enables employees to help customers navigate the organization ‘ s website to complete self-service transactions, or simply help them find what they are looking for. Both live chat and co-browse solutions help customers complete their transactions at the most critical junctures and reduce transaction abandonment . |
Social Engagement | Enables agents to leverage their knowledge base, case management and other support tools to address customer issues and concerns expressed in social media. |
Customer Communities | Enables organizations to set up and manage public and private communities and forums on behalf of their customers, partners, and employees in which knowledge sharing and collaboration can occur as a high-value, low-effort customer engagement channel. |
Quality Management | Provides sophisticated interaction assessment functionality, including intelligent evaluation forms and automatic delivery of calls for evaluation according to quotas or contact-related criteria. Enables organizations to deliver customer-driven quality by evaluating employees using more interactions that are of high business value and relevance. |
Recording | Reliably and securely captures, encrypts, archives, searches, and replays audio and screen interactions for compliance, liability protection, quality management and analytics purposes. |
Workforce Management | Enables organizations to efficiently plan, forecast, and schedule employees to meet service level goals by leveraging a unified, enterprise workforce management solution that provides visibility into and singularly manages the work, the people, and the processes across customer touchpoints in the contact center, back-office and branch operations. |
Desktop and Process Analytics | Enables organizations to monitor and improve employee performance by capturing and measuring their desktop application activities. Provides objective and unbiased visibility into how work is performed at the employee desktop. Facilitates process automation and privacy, and delivers real-time guidance and next best actions to employees. |
Performance Management | Provides a comprehensive view of key performance indicators with performance scorecards and reports on customer interactions, customer experience trends, and contact center, back-office, branch, and customer service staff performance. |
eLearning and Coaching | Enables enterprises to deliver web-based training to customer service staff desktops, including learning clips created from recordings and other customized materials targeted to staff needs and competencies. Features automated coaching capabilities that provide employees with personalized guidance on how to improve their performance and enhance their skills. |
6
Table of Contents
The Communications Intelligence Segment
Our Communications Intelligence solutions are summarized in the following table.
SOLUTION | DESCRIPTION |
Cyber Security Threat Protection | Enables government, critical infrastructure, service providers, and enterprise organizations to address advanced cyber-attacks by deploying an integrated cyber security platform capable of delivering threat protection through Actionable Intelligence capabilities. Includes a system that integrates multiple advanced detection engines and provides unified workflows for investigation, behavioral analytics, and forensics that analyze attack paths, enable remediation, and help protect against future attempts. |
Network Intelligence | Enables law enforcement, national security, and intelligence agencies to generate Actionable Intelligence from network traffic to rapidly uncover critical information for investigating and proactively addressing criminal, national security, and terrorist threats. Can be configured to address a wide range of communications networks and can scale to address large traffic volumes. |
Tactical Intelligence | Enables law enforcement, correction facilities, and government agencies to enhance field operations of tactical units with real-time Actionable Intelligence. Helps neutralize criminal, terrorist, and other threats by assisting tactical operation units to better focus on suspects and suspicious behavior, and deploy field resources more effectively. |
Web, Cloud and Open Source Intelligence | Enables investigative units of government and commercial organizations to leverage web, cloud, and open source data in order to identify insights and help accelerate investigations of fraud, criminal activities, terror, and national security threats. Helps transform large volumes of content into structured data and relevant information, identify suspicious behavioral patterns, identify location of suspects while using the web or mobile networks, and generates supporting evidence. |
Service Provider Compliance | Helps communications service providers comply with ETSI, CALEA, and other lawful interception regulations and standards. Supports many different network types and provides a high degree of automation of the lawful interception compliance processes with complete audit trails and low administrative overhead, and without disrupting service. |
The Video Intelligence Segment
Our Video Intelligence solutions are summarized in the following table.
7
Table of Contents
SOLUTION | DESCRIPTION |
Situational Awareness Platform | Integrates data from multiple sources, such as access control, video, intrusion, fire, public safety, weather, social media, traffic, first responder, and other mobile device systems. Provides a unified visualization layer and workflow enabling organizations to fuse, analyze, and report information, and take action on risks, alarms, and incidents across business and security systems. Helps to identify and mitigate risks, improve response times, increase operational effectiveness, and reduce total cost of ownership. |
Enterprise Video Management Software | Simplifies management of large volumes of video, including geographically dispersed surveillance video, with a suite of applications that includes automated system health monitoring, policy-based video distribution, networked video viewing, and investigation management. Designed for interoperability with other enterprise systems. |
Video Analytics | Analyzes video content to improve visibility, reduce risks and improve operational performance in the following areas: • Surveillance-automatically detects anomalies and activities of interest, such as perimeter intrusion, unattended objects, camera tampering, and vehicles moving in the wrong direction. • Security-offers advanced analytics that integrate facial detection, facial recognition, and license plate recognition capabilities for industrial applications, and further expand business value by integrating with Point of Sale (POS), ATM, and teller transactions in retail store and branch bank environments. • Business-includes industry-specific analytics applications focused primarily on retail and banking environments to help address both operational and strategic initiatives. |
EdgeVMS | Performs networked video recording utilizing secure, embedded operating systems and market-specific data integrations for security and fraud, risk, and compliance applications that require local storage, as well as remote networking. |
Public Safety Media Recorder | Allows first responders (e.g., police, fire departments, and emergency medical services) to capture, analyze, manage, and act on public safety data. Includes incident investigation, evidence preparation, and compliance audit trail capabilities. |
Customer Services
We offer a range of customer services, including implementation and training, consulting and managed services, and maintenance support, to help our customers maximize their return on investment in our solutions.
Implementation and Training
Our solutions are implemented by our service organizations, authorized partners, resellers, or customers. Our implementation services include project management, system installation, and commissioning, including integrating our solutions with our customers' environments and third-party solutions. Our training programs are designed to enable our customers to effectively use our solutions and to certify our partners to sell, install, and support our solutions. Customer and partner training is provided at the customer site, at our training centers around the world, and/or remotely online.
Consulting and Managed Services
Our management consulting capabilities include business strategy, process excellence, performance management, and project and program management, and are designed to help our customers maximize the value of our solutions in their own environments. We also offer managed services delivered on a subscription basis to help our customers gain further value from their investments in our technology and minimize the need for additional resources. Our managed services enable us to help ensure customers effectively manage our solutions and maximize the business insights produced, heighten customer engagement, and create strong relationships working together in the process .
Maintenance Support
We offer a range of customer maintenance support programs to our customers and resellers, including phone, web, and email access to technical personnel up to 24-hours-a-day, seven-days-a-week. Our support programs are designed to help ensure long-term, successful use of our solutions. We believe that customer support is critical to retaining and expanding our customer base. Our Enterprise Intelligence solutions are sold with a warranty of generally one year for hardware and 90 days for
8
Table of Contents
software. Our Communications Intelligence solutions and Video Intelligence solutions are sold with warranties that typically range from 90 days to three years and, in some cases, longer. In addition, customers are typically provided the option to purchase maintenance plans that provide a range of services, such as telephone support, advanced replacement, upgrades when and if available, and on-site repair or replacement. Currently, the majority of our maintenance revenue is related to our Enterprise Intelligence solutions.
Direct and Indirect Sales
We sell our solutions through our direct sales teams and indirect channels, including distributors, systems integrators, value-added resellers ("VARs"), and OEM partners. Approximately half of our overall sales are made through partners, distributors, resellers, and system integrators.
Each of our solutions is sold by trained, dedicated, regionally-organized direct and indirect sales teams. Our direct sales teams are focused on large and mid-sized customers and, in many cases, co-sell with our other channels and sales agents. Our indirect sales teams are focused on developing and supporting relationships with our indirect channels, which provide us with broader market coverage, including access to their customer base, integration services, and presence in certain geographies and vertical markets. Our sales teams are supported by business consultants, solutions specialists, and pre-sales engineers who, during the sales process, help determine customer requirements and develop technical responses to those requirements. While we sell directly and indirectly in all three of our segments, sales of our Video Intelligence solutions are primarily indirect, and sales of our Communications Intelligence solutions are primarily direct. See "Risk Factors - Risks Related to Our Business - Competition, Markets, and Operations - If we are unable to establish and maintain our relationships with third parties that market and sell our products, our business and ability to grow could be materially adversely affected" under Item 1A of this report.
Customers
Our solutions are used by more than 10,000 organizations in over 180 countries. In the year ended January 31, 2015, we derived approximately 58%, 32% and 10% of our revenue from the sale of our Enterprise Intelligence solutions, Communications Intelligence solutions, and Video Intelligence solutions, respectively. In the year ended January 31, 2014, we derived approximately 55%, 32%, and 13% of our revenue from the sale of our Enterprise Intelligence solutions, Communications Intelligence solutions, and Video Intelligence solutions, respectively. In the year ended January 31, 2013, we derived approximately 58%, 28%, and 14% of our revenue from the sale of our Enterprise Intelligence solutions, Communications Intelligence solutions, and Video Intelligence solutions, respectively. We are party to contracts with customers in each of our segments, the loss of which could have a material adverse effect on the segment.
In the year ended January 31, 2015, we derived approximately 52%, 31%, and 17% of our revenue from sales to end users in the Americas, in Europe, the Middle East and Africa ("EMEA"), and in the Asia-Pacific region ("APAC"), respectively. In the year ended January 31, 2014, we derived approximately 56%, 20%, and 24% of our revenue from sales to end users in the Americas, EMEA, and APAC, respectively. In the year ended January 31, 2013, we derived approximately 55%, 24%, and 21% of our revenue from sales to end users in the Americas, EMEA, and APAC, respectively. See also Note 18, "Segment, Geographic, and Significant Customer Information" to our consolidated financial statements included under Item 8 of this report for additional information and financial data about each of our operating segments and geographic regions.
For the year ended January 31, 2015, approximately one quarter of our business was generated from contracts with various governments around the world, including local, regional, and national government agencies. Due to the unique nature of the terms and conditions associated with government contracts generally, our government contracts may be subject to renegotiation or termination at the election of the government customer. Some of our customer engagements require us to have security credentials or to participate in projects through an approved legal entity.
Seasonality and Cyclicality
As is typical for many software and technology companies, our business is subject to seasonal and cyclical factors. Our revenue and operating income are typically highest in the fourth quarter and lowest in the first quarter (prior to the impact of unusual or nonrecurring items). Moreover, revenue and operating income in the first quarter of a new year may be lower than in the fourth quarter of the preceding year, potentially by a significant margin. In addition, we generally receive a higher volume of orders in the last month of a quarter, with orders concentrated in the later part of that month. We believe that these seasonal and cyclical factors primarily reflect customer spending patterns and budget cycles, as well as the impact of compensation incentive plans for our sales personnel. While seasonal and cyclical factors such as these are common in the
9
Table of Contents
software and technology industry, this pattern should not be considered a reliable indicator of our future revenue or financial performance. Many other factors, including general economic conditions, also have an impact on our business and financial results. See "Risk Factors" under Item 1A of this report for a more detailed discussion of factors which may affect our business and financial results.
Research and Development
We continue to enhance the features and performance of our existing solutions and to introduce new solutions through extensive research and development activities, including the development of new solutions, the addition of capabilities to existing solutions, quality assurance, and advanced technical support for our customer services organization. In certain instances, primarily in our Communications Intelligence segment, we may customize our products to meet the particular requirements of our customers. Research and development is performed primarily in the United States, Israel, the United Kingdom, Ireland, the Netherlands, and Indonesia for our Enterprise Intelligence segment; in Israel, Germany, Brazil, Cyprus, and Bulgaria for our Communications Intelligence segment; and primarily in Israel, the United States, and Canada for our Video Intelligence segment.
We believe that our future success depends on a number of factors, including among others, our ability to:
• | identify and respond to emerging technological trends and areas of growth in our markets; |
• | develop and maintain competitive solutions that meet or exceed our customers' changing needs and challenges; |
• | enhance our existing products by adding features and functionality to meet or exceed specific customer needs or differentiate our products from those of our competitors; and |
• | attract, recruit, and retain highly skilled and experienced employees. |
To support these efforts, we make significant investments in research and development every year. In the years ended January 31, 2015, 2014, and 2013, we spent approximately $173.8 million, $126.5 million, and $115.9 million, respectively, on research and development, net. We allocate our research and development resources in response to market research and customer demand for additional features and solutions. Our development strategy involves rolling out initial releases of our products and adding features over time. We incorporate product feedback received from our customers into our product development process. While the majority of our products are developed internally, in some cases, we also acquire or license technologies, products, and applications from third parties based on timing and cost considerations. See "Risk Factors - Risks Related to Our Business - Competition, Markets, and Operations - For certain products, components, or services, we rely on third-party suppliers, manufacturers, and partners and if these relationships are interrupted we may not be able to obtain substitute suppliers, manufacturers, or partners on favorable terms or at all, and we may be subject to other adverse effects" under Item 1A of this report.
As noted above, a significant portion of our research and development operations is located outside the United States. We have also derived benefits from participation in certain government-sponsored programs, including those of the Israeli Office of the Chief Scientist ("OCS") and in other jurisdictions, for the support of research and development activities conducted in those locations. The Israeli law under which these OCS grants are made limits our ability to manufacture products, or transfer technologies, developed using these grants outside of Israel without permission from the OCS. See "Risk Factors - Risks Related to Our Business - Competition, Markets, and Operations - Because we have significant foreign operations, we are subject to geopolitical and other risks that could materially adversely affect our business" and "Risk Factors - Risks Related to Our Business - Competition, Markets, and Operations - Conditions in and our relationship to Israel may materially adversely affect our operations and personnel and may limit our ability to produce and sell our products or engage in certain transactions" under Item 1A of this report for a discussion of certain risks associated with our foreign operations.
Manufacturing, Suppliers, and Service Providers
We rely on both unaffiliated manufacturing subcontractors, as well as on our internal operations, to produce, assemble, and deliver our hardware products and solutions. We also rely on several unaffiliated manufacturing subcontractors for the supply of specific proprietary hardware components and assemblies that are incorporated into our products and solutions. Our internal manufacturing and assembly operations consist primarily of installing our software on externally purchased hardware components, final assembly, repair, and testing, which involves the application of extensive quality control procedures to materials, components, subassemblies, and systems. We also perform system integration functions prior to shipping turnkey solutions to our customers. Our internal manufacturing and assembly operations are performed primarily in our German,
10
Table of Contents
Israeli, and Cypriot facilities for our Communications Intelligence solutions, and in our Canadian facilities for certain of our Video Intelligence solutions. Our Enterprise Intelligence solutions are substantially all software and do not require any significant internal manufacturing. Although we have occasionally experienced delays and shortages in the supply of proprietary components in the past, we have, to date, been able to obtain adequate supplies of all components in a timely manner from alternative sources, when necessary. We also rely on third parties to provide certain services to us or to our customers, including hosting providers and providers of other cloud-based services. See "Risk Factors - Risks Related to Our Business - Competition, Markets, and Operations - For certain products, components, or services, we rely on third-party suppliers, manufacturers, and partners, and if these relationships are interrupted, we may not be able to obtain substitute suppliers, manufacturers, or partners on favorable terms or at all, and we may be subject to other adverse effects" under Item 1A of this report for a discussion of risks associated with our manufacturing operations and suppliers.
Employees
As of January 31, 2015, we employed more than 4,800 professionals, including certain contractors, with approximately 40%, 26%, 23%, and 11% of our employees and contractors located in the Americas, Israel, EMEA (excluding Israel), and APAC, respectively.
We consider our relationship with our employees to be good and a critical factor in our success. Our employees in the United States are not covered by any collective bargaining agreements. In some cases, our employees outside the United States are automatically subject to certain protections negotiated by organized labor in those countries directly with the government or trade unions or are automatically entitled to severance or other benefits mandated under local laws. For example, while we are not a party to any collective bargaining or other agreement with any labor organization in Israel, certain provisions of the collective bargaining agreements between the Histadrut (General Federation of Laborers in Israel) and the Coordinating Bureau of Economic Organizations (including the Manufacturers' Association of Israel) are applicable to our Israeli employees by virtue of expansion orders of the Israeli Ministry of Industry, Trade and Labor.
Intellectual Property Rights
General
Our success depends to a significant degree on the legal protection of our software and other proprietary technology. We rely on a combination of patent, trade secret, copyright, and trademark laws, and confidentiality and non-disclosure agreements with employees and third parties to establish and protect our proprietary rights.
Patents
As of January 31, 2015, we had more than 700 patents and patent applications worldwide. We have accumulated a significant amount of proprietary know-how and expertise in developing Actionable Intelligence solutions. We regularly review new areas of technology related to our businesses to determine whether they can and should be patented.
Licenses
While we employ many of our innovations exclusively in our products and services, we also engage in outbound and inbound licensing of specific patented technologies. Our licenses are designed to prohibit unauthorized use, copying, and disclosure of our software technology. When we license our software to customers, we require license agreements containing restrictions and confidentiality terms customary in the industry in order to protect our proprietary rights in the software. These agreements generally warrant that the software and propriety hardware will materially comply with written documentation and assert that we own or have sufficient rights in the software we distribute and have not violated the intellectual property rights of others.
We license our products in a format that does not permit users to change the software code. See "Risk Factors - Risks Related to Our Business - Competition, Markets, and Operations - For certain products, components, or services, we rely on third-party suppliers, manufacturers, and partners, and if these relationships are interrupted, we may not be able to obtain substitute suppliers, manufacturers, or partners on favorable terms or at all, and we may be subject to other adverse effects" under Item 1A of this report.
We license certain software, technology, and related rights for use in the manufacture and marketing of our products and pay royalties to third parties under such licenses and other agreements. While it may be necessary in the future to seek or renew licenses relating to various aspects of our products, we believe, based on industry practice, such licenses generally could be obtained on commercially reasonable terms.
11
Table of Contents
Trademarks and Service Marks
We use various trademarks and service marks to protect the marks used in our business. We also claim common law protections for other marks we use in our business. Competitors and other companies could adopt similar marks or try to prevent us from using our marks, consequently impeding our ability to build brand identity and possibly leading to customer confusion. See "Risk Factors - Risks Related to Our Business - Intellectual Property and Data/Systems Security - Our intellectual property may not be adequately protected" under Item 1A of this report for a more detailed discussion regarding the risks associated with the protection of our intellectual property.
Competition
We face strong competition in all of our markets, and we expect that competition will persist and intensify.
In our Enterprise Intelligence segment, our competitors include Aspect Software, Inc., eGain Corporation, Genesys Telecommunications, NICE Systems Ltd. ("NICE"), Pegasystems Inc., and divisions of larger companies, including Oracle Corporation and Salesforce.com, Inc., along with many smaller companies, which can vary across regions. In our Communications Intelligence segment, our primary competitors include BAE Systems, FireEye, Inc., JSI Telecom, NICE, Rohde & Schwarz, and RSA NetWitness (a business unit of EMC Corporation), along with a number of smaller companies and divisions of larger companies that compete with us in certain regions or only with respect to portions of our product portfolio. In our Video Intelligence segment, our competitors include Avigilon Corporation, Genetec Inc., March Networks (a subsidiary of Infinova Ltd.), Milestone Systems A/S (a division of Canon), and NICE, and divisions of larger companies, such as Tyco International Ltd., along with many smaller companies, which can vary across regions.
In each of our operating segments, we believe that we compete principally on the basis of:
• | product performance and functionality; |
• | product quality and reliability; |
• | breadth of product portfolio and pre-defined integrations; |
• | global presence and high-quality customer service and support; |
• | specific industry knowledge, vision, and experience; and |
• | price. |
We believe that our competitive success depends primarily on our ability to provide technologically advanced and cost-effective solutions and services. Some of our competitors have superior brand recognition and significantly greater financial or other resources than we do. We expect that competition will increase as other established and emerging companies enter our markets or we enter theirs, and as new products, services, and technologies are introduced, such as SaaS. In addition, consolidation is common in our markets and has in the past and may in the future improve the position of our competitors. See "Risk Factors - Risks Related to Our Business - Competition, Markets, and Operations - Intense competition in our markets and competitors with greater resources than us may limit our market share, profitability, and growth" under Item 1A of this report for a more detailed discussion of the competitive risks we face.
Export Regulations
We and our subsidiaries are subject to applicable export control regulations in countries from which we export goods and services. These controls may apply by virtue of the country in which the products are located or by virtue of the origin of the content contained in the products. If the controls of a particular country apply, the level of control generally depends on the nature of the goods and services in question. For example, our Communications Intelligence solutions tend to be more highly controlled than our Enterprise Intelligence or Video Intelligence solutions. Where controls apply, the export of our products generally requires an export license or authorization (either on a per-product or per-transaction basis) or that the transaction qualify for a license exception or the equivalent, and may also be subject to corresponding reporting requirements.
Item 1A. Risk Factors
Many of the factors that affect our business and operations involve risks and uncertainties. The factors described below are risks that could materially harm our business, financial condition, and results of operations. These are not all the risks we face and other factors currently considered immaterial or unknown to us may have a material adverse impact on our future operations.
12
Table of Contents
Risks Related to Our Business
Competition, Markets, and Operations
Our business is impacted by changes in general economic conditions and information technology and government spending in particular.
Our business is subject to risks arising from adverse changes in domestic and global economic conditions. Slowdowns, recessions, economic instability, political unrest, armed conflicts, or natural disasters around the world may cause companies and governments to delay, reduce, or even cancel planned spending. In particular, declines in information technology spending and limited or reduced government budgets have affected the markets for our solutions in both the enterprise intelligence market and the security intelligence market in certain periods and in certain regions. For the year ended January 31, 2015, approximately one quarter of our business was generated from contracts with various governments around the world, including national, regional, and local government agencies. We expect that government contracts will continue to be a significant source of our revenue for the foreseeable future. Customers or partners who are facing business challenges or liquidity issues are also more likely to delay purchase decisions or cancel orders, as well as to delay or default on payments. If customers or partners significantly reduce their spending with us or significantly delay or fail to make payments to us, our business, results of operations, and financial condition would be materially adversely affected.
The industry in which we operate is characterized by rapid technological changes, evolving industry standards, and changing market potential from area to area, and if we cannot anticipate and react to such changes our results may suffer.
The markets for our products are characterized by rapidly changing technology and evolving industry standards. The introduction of products embodying new technology, new delivery platforms such as SaaS, managed services, or other cloud-based solutions, the commoditization of older technologies, and the emergence of new industry standards and technological hurdles can exert pricing pressure on existing products and/or render them unmarketable or obsolete. Moreover, the market potential and growth rates of the markets we serve are not uniform and are evolving. It is critical to our success that we are able to anticipate and respond to changes in technology and industry standards and new customer challenges by consistently developing new, innovative, high-quality products and services that meet or exceed the changing needs of our customers. We must also successfully identify, enter, and prioritize areas of growing market potential, including by launching and driving demand for new and enhanced solutions and services. If we are unable to execute on these strategic priorities, we may lose market share or experience slower growth, and our profitability and other results of operations may be materially adversely affected.
Intense competition in our markets and competitors with greater resources than us may limit our market share, profitability, and growth.
We face aggressive competition from numerous and varied competitors in all of our markets, making it difficult to maintain market share, remain profitable, invest, and grow. We are also encountering new competitors as we expand into new markets. Our competitors may be able to more quickly develop or adapt to new or emerging technologies, better respond to changes in customer needs or preferences, better identify and enter into new areas of growth, or devote greater resources to the development, promotion, and sale of their products. Some of our competitors have, in relation to us, longer operating histories, larger customer bases, longer standing relationships with customers, superior brand recognition, and significantly greater financial, technical, marketing, customer service, public relations, distribution, or other resources, especially in new markets we may enter. Consolidation among our competitors may also improve their competitive position. In recent years, several companies significantly larger than we are have also entered or increased their presence in our markets through internal development, partnerships, and acquisitions, and we have encountered larger competitors as we have expanded into new markets. We also face competition from solutions developed internally by our customers or partners. To the extent that we cannot compete effectively, our market share and, therefore, results of operations could be materially adversely affected.
Because price and related terms are key considerations for many of our customers, we may, from time to time, have to accept less-favorable payment terms, lower the prices of our products and services, and/or reduce our cost structure, including reducing headcount or investment in research and development, in order to remain competitive. Certain of our competitors have become increasingly aggressive in their pricing strategy, particularly in markets where they are trying to establish a foothold or defend existing installations. If we are forced to take these kinds of actions to remain competitive in the short-term, such actions may adversely impact our ability to execute and compete in the long-term.
13
Table of Contents
Our future success depends on our ability to enhance our existing operations, execute on our growth strategy, and properly manage investment in our business and operations.
We have experienced significant growth in recent years and our existing infrastructure, systems, processes, and personnel may not be adequate for our current or future needs. A key element of our strategy is to continue to invest in, enhance, and secure our business and operations and grow, both organically and through acquisitions. Investments in, among other things, new markets, new products, solutions, and technologies, research and development, infrastructure and systems, geographic expansion, and headcount are critical components in achieving this strategy. However, such investments and efforts may not be successful, especially in new areas or new markets in which we have little or no experience, and even if successful, may negatively impact our short-term profitability. Our success depends on our ability to effectively and efficiently enhance our existing operations and execute on our growth strategy, including our ability to properly allocate limited investment dollars, balance the extent and timing of investments with the associated impact on expenses and profitability, balance our focus between new areas or new markets and the operation and servicing of our legacy businesses and customers, capture efficiencies and economies of scale, and compete in the new areas or new markets and with the new solutions in which we have invested. If we are unable to effectively and efficiently enhance our existing operations, execute on our growth strategy, and properly manage our investments, focus, and expenditures, our results of operations and market share may be materially adversely affected.
We may not be able to identify suitable targets for acquisition or investment, or complete acquisitions or investments on terms acceptable to us, which could negatively impact our ability to implement our growth strategy.
As part of our growth strategy, we have made a number of acquisitions and investments and expect to continue to make acquisitions and investments in the future, subject to the terms of our senior credit agreement (the "Credit Agreement"), the indenture governing our 1.50% convertible senior notes due June 1, 2021 (the "Notes"), and other restrictions.
In many areas, we have seen the market for acquisitions become more competitive and valuations increase. In recent periods, several of our competitors have also completed acquisitions of companies in or adjacent to our markets. As a result, it may be more difficult for us to identify suitable acquisition or investment targets or to consummate acquisitions or investments once identified on acceptable terms or at all. If we are not able to execute on our acquisition strategy, we may not be able to achieve our growth strategy, may lose market share, or may lose our leadership position in one or more of our markets.
Our acquisition and investment activity presents certain risks to our business, operations, and financial position.
Acquisitions and investments are an important part of our strategy. Successful execution following the closing of an acquisition or investment is paramount to achieving the anticipated benefits of the transaction. If we are unable to execute successfully, we may experience both a loss on the investment and damage to our legacy business and valuation.
The process of integrating an acquired company's business into our operations and investing in new technologies is challenging and may result in expected or unexpected operating or compliance challenges, which may require significant expenditures and a significant amount of our management's attention that would otherwise be focused on the ongoing operation of our business. The potential difficulties or risks of integrating an acquired company's business include, among others:
• | the effect of the acquisition on our financial and strategic positions and our reputation; |
• | risk that we fail to successfully implement our business plan for the combined business; |
• | risk that we are unable to obtain the anticipated benefits of the acquisition, including synergies or economies of scale; |
• | risk that the market does not accept the integrated product portfolio; |
• | challenges in reconciling business practices or in integrating product development activities, logistics, or information technology and other systems; |
• | retention risk with respect to key customers, suppliers, and employees and challenges in assimilating and training new employees; |
• | challenges in complying with newly applicable laws and regulations, including obtaining or retaining required approvals, licenses, and permits; and |
• | potential impact on our internal controls over financial reporting. |
Acquisitions and/or investments may also result in potentially dilutive issuances of equity securities, the incurrence of debt and contingent liabilities, the expenditure of available cash, and amortization expenses or write-downs related to intangible assets such as goodwill, any of which could have a material adverse effect on our operating results or financial condition. Investments in immature businesses with unproven track records and technologies have an especially high degree of risk, with the possibility that we may lose the value of our entire investments or incur additional unexpected liabilities. Transactions that
14
Table of Contents
are not immediately accretive to earnings may make it more difficult for us to maintain satisfactory profitability levels or compliance with the maximum leverage ratio covenant under the revolving credit facility under our Credit Agreement. Large or costly acquisitions or investments may also diminish our capital resources and liquidity or limit our ability to engage in additional transactions for a period of time.
All of the foregoing risks may be magnified as the cost, size, or complexity of an acquisition or acquired company increases, or where the acquired company's products, market, or business are materially different from ours, or where more than one integration is occurring simultaneously or within a concentrated period of time. There can be no assurance that we will be successful in making additional acquisitions in the future or in integrating or executing on our business plan for existing or future acquisitions.
Our solutions may contain defects or may be vulnerable to cyber-attacks, which could expose us to both financial and non-financial damages.
Many of our existing solutions are and future solutions are expected to be sophisticated and may develop operational problems. New products and new product versions also give rise to the risk of defects or errors. These defects or errors may relate to the operation or the security of the products. If we do not discover and remedy such defects, errors, or other operational or security problems until after a product has been released to customers or partners, we may incur significant costs to correct such problems and/or become liable for substantial damages for product liability claims or other liabilities. Moreover, even products that are well-designed and tested may be vulnerable to cyber-attacks. If one or more of our products are found to have defects or errors, or if there is a successful cyber-attack on one of our products even absent a defect or error, it may also result in questions regarding the integrity of our products generally, which could cause adverse publicity and impair their market acceptance.
If we are unable to establish and maintain our relationships with third parties that market and sell our products, our business and ability to grow could be materially adversely affected.
Approximately half of our sales are made through partners, distributors, resellers, and systems integrators. To remain successful, we must maintain our existing relationships as well as identify and establish new relationships with such third parties. We must often compete with other suppliers for these relationships and our competitors often seek to establish exclusive relationships with these sales channels or to become a preferred partner for them. Our ability to establish and maintain these relationships is based on, among other things, factors that are similar to those on which we compete for end customers, including features, functionality, ease of use, installation and maintenance, and price. Even if we are able to secure such relationships on terms we find acceptable, there is no assurance that we will be able to realize the benefits we anticipate. Some of our channel partners may also compete with us or have affiliates that compete with us, or may partner with our competitors or even offer our products and those of our competitors as alternatives when presenting proposals to end customers. Our ability to achieve our revenue goals and growth depends to a significant extent on maintaining, enabling, and adding to these sales channels, and if we are unable to do so, our business and ability to grow could be materially adversely affected.
The sophisticated nature of our solutions, sales cycle, and unpredictable sales terms and timing may create uncertainty in, or negatively impact, our operating results and make such results more volatile and difficult to predict.
The timing of our sales cycle ranges from as little as a few weeks to more than a year. Our larger sales, which we emphasize in our sales strategy, typically require a minimum of a few months to consummate. As the length or complexity of a sales process increases, so does the risk of successfully closing the sale. Larger sales are often made by competitive bid, which also increases the time and uncertainty associated with such opportunities. In addition, because many of our solutions are sophisticated, customers may also require education on the value and functionality of our solutions as part of the sales process, further extending the time frame and uncertainty of the process.
Longer sales cycles, competitive bid processes, and the need to educate customers means that:
• | There is greater risk of customers deferring, scaling back, or cancelling sales as a result of, among other things, their receipt of a competitive proposal, changes in budgets and purchasing priorities, or the introduction or anticipated introduction of new or enhanced products by us or our competitors during the process. |
• | We may make a significant investment of time and money in opportunities that do not come to fruition, which investments may not be usable or recoverable in future projects. |
15
Table of Contents
• | We may be required to bid on a project in advance of the completion of its design or be required to begin implementation of a project in advance of finalizing a sale, in either case, increasing the risk of unforeseen technological difficulties or cost overruns. |
• | We face greater downside risks if we do not correctly and efficiently deploy limited personnel and financial resources and convert such sales opportunities into orders. |
Our emphasis on larger solution sales also requires greater expertise in sales execution and transaction implementation than more basic product sales, including in establishing and maintaining appropriate contacts and relationships with customers and partners, product development, project management, staffing, integration, services, and support. Additionally, after the completion of a solution sale or the sale of a more sophisticated product in general, our customers or partners may need assistance from us in making full use of the functionality of these solutions or products, in realizing all of their benefits, or in implementation generally. If we are unable to assist our customers and partners in realizing the benefits they expect from our solutions and products, demand for our solutions and products may decline and our operating results may suffer.
The extended time frame and uncertainty associated with many of our sales opportunities also makes it difficult for us to accurately forecast our revenues (and attendant budgeting and guidance decisions) and increases the volatility of our operating results from period to period. Our ability to forecast, and the volatility of, our operating results is also impacted by the fact that pricing, margins, and other deal terms may vary substantially from transaction to transaction, especially across business lines. The terms of our transactions, including with respect to pricing, future deliverables, delivery model (e.g., perpetual license versus SaaS), and post-contract customer support, also impact the timing of our ability to recognize revenue. Because these transaction-specific factors are difficult to predict in advance, this also complicates the forecasting of revenue. Additionally, because we emphasize larger transactions in our sales strategy, the deferral or loss of one or more significant orders or a delay in a large implementation could materially adversely affect our operating results, especially in a given quarter. As with other software-focused companies, a large amount of our quarterly business tends to come in the last few weeks, or even the last few days, of each quarter. This trend has also complicated the process of accurately predicting revenue and other operating results, particularly on a quarterly basis. Finally, our business is subject to seasonal factors that may also cause our results to fluctuate from quarter to quarter.
For certain products, components, or services, we rely on third-party suppliers, manufacturers, and partners, and if these relationships are interrupted we may not be able to obtain substitute suppliers, manufacturers, or partners on favorable terms or at all and we may be subject to other adverse effects.
Although we generally use standard parts and components in our products, we do rely on non-affiliated suppliers and OEM partners for certain non-standard products or components which may be critical to our products, including both hardware and software, and on manufacturers of assemblies that are incorporated into our products. We also purchase technology, license intellectual property rights, and oversee third-party development and localization of certain products or components, in some cases, by or from companies that may compete with us or work with our competitors. While we endeavor to use larger, more established suppliers, manufacturers, and partners wherever possible, in some cases, these providers may be smaller, less established companies, particularly in the case of suppliers of new or unique technologies that we have not developed internally. If these suppliers, manufacturers, or partners experience financial, operational, manufacturing capacity, or quality assurance difficulties, cease production and sale of the products we buy from them entirely, or there is any other disruption, including loss of license, OEM, or distribution rights, including as a result of the acquisition of a supplier or partner by a competitor, we will be required to locate alternative sources of supply or manufacturing, to internally develop the applicable technologies, to redesign our products, and/or to remove certain features from our products, any of which would be likely to increase expenses, create delivery delays, and negatively impact our sales. Although we endeavor to put in place contracts with key providers, including protections such as source code escrows (where needed), warranties, and indemnities, we may not be successful in obtaining adequate protections, these agreements may be short-term in duration, and the counterparties may be unwilling or unable to stand behind such protections. Moreover, these types of contractual protections offer limited practical benefits to us in the event our relationship with a key provider is interrupted.
We also rely on third parties to provide certain services to us or to our customers, including hosting partners and providers of other cloud-based services. If these third-party providers do not perform as expected, our customers may be adversely affected, resulting in potential liability and negative exposure for us. If it is necessary to migrate these service to other providers as a result of poor performance by these third parties or other financial or operational factors, it could result in service disruptions to our customers and significant time and expense to us, any of which could adversely affect our business.
16
Table of Contents
If we cannot retain and recruit qualified personnel, our ability to operate and grow our business may be impaired.
We depend on the continued services of our management and employees to run and grow our business. To remain successful and to grow, we need to retain existing employees and attract new employees who understand and/or have experience with our products, services, and markets, especially new markets and growth areas we may enter. As we grow, we must also enhance and expand our management team to execute on new and larger agendas and challenges. The market for qualified personnel is competitive in the geographies in which we operate and may be limited especially in areas of emerging technology, and we may be at a disadvantage to companies with greater brand recognition or financial resources in recruiting. If we are unable to attract and retain qualified personnel, when and where they are needed, our ability to operate and grow our business could be impaired. Moreover, if we are not able to properly balance investment in personnel with growth in our business, our profitability may be adversely affected.
Because we have significant foreign operations, we are subject to geopolitical and other risks that could materially adversely affect our business.
We have significant operations outside the United States, including sales, research and development, manufacturing, customer services and support, and administrative services. The countries in which we have our most significant foreign operations include Israel, the United Kingdom, India, Indonesia, the Netherlands, Cyprus, Australia, and Brazil and we intend to continue to expand our operations internationally. We believe our business may suffer if we are unable to successfully expand into new regions, as well as maintain and expand our existing foreign operations. Our foreign operations are, and any future foreign expansion will be, subject to a variety of risks, many of which are beyond our control, including risks associated with:
• | foreign currency fluctuations; |
• | political, security, and economic instability or corruption in foreign countries; |
• | changes in and compliance with both international and local laws and regulations, including those related to trade compliance, anticorruption, data privacy and protection, tax, labor, employee benefits, customs, currency restrictions, and other requirements; |
• | differences in tax regimes and potentially adverse tax consequences of operating in foreign countries; |
• | product customization or localization issues; |
• | preferences for or policies and procedures that protect local suppliers; |
• | legal uncertainties regarding intellectual property rights or rights and obligations generally; |
• | recruitment and retention of qualified foreign employees; and |
• | challenges or delays in collection of accounts receivable. |
Any or all of these factors could materially adversely affect our business or results of operations.
Conditions in and our relationship to Israel may materially adversely affect our operations and personnel and may limit our ability to produce and sell our products or engage in certain transactions.
We have significant operations in Israel, including research and development, manufacturing, sales, and support.
Since the establishment of the State of Israel in 1948, a number of armed conflicts have taken place between Israel and its neighbors, which in the past have led, and may in the future lead, to security and economic problems for Israel. In addition, Israel has faced and continues to face difficult relations with the Palestinians and the risk of terrorist violence from both Palestinian as well as foreign elements such as Hezbollah. Infighting among the Palestinians may also create security and economic risks to Israel. Current and future conflicts and political, economic, and/or military conditions in Israel and the Middle East region have affected and may in the future affect our operations in Israel. The exacerbation of violence within Israel or the outbreak of violent conflicts between Israel and its neighbors, including Iran, may impede our ability to manufacture, sell, and support our products or engage in research and development, or otherwise adversely affect our business or operations. In addition, many of our employees in Israel are required to perform annual compulsory military service and are subject to being called to active duty at any time. The absence of these employees may have an adverse effect on our
17
Table of Contents
operations. Hostilities involving Israel may also result in the interruption or curtailment of trade between Israel and its trading partners or a significant downturn in the economic or financial condition of Israel and could materially adversely affect our results of operations.
Restrictive laws, policies, or practices in certain countries directed toward Israel, Israeli goods, or companies having operations in Israel may also limit our ability to sell some of our products in certain countries.
We receive grants from the OCS for the financing of a portion of our research and development expenditures in Israel. The availability in any given year of these OCS grants depends on OCS approval of the projects and related budgets that we submit to the OCS each year. The Israeli law under which these OCS grants are made limits our ability to manufacture products, or transfer technologies, developed using these grants outside of Israel. This may limit our ability to engage in certain outsourcing or business combination transactions involving these products or require us to pay significant royalties or fees to the OCS in order to obtain any OCS consent that may be required in connection with such transactions.
We are subject to complex, evolving regulatory requirements that may be difficult and expensive to comply with and that could negatively impact our business.
Our business and operations are subject to a variety of regulatory requirements in the United States and abroad, including, among other things, with respect to government contracts, labor, tax, import and export, anti-corruption, data privacy and protection, and communications monitoring and interception. Compliance with these regulatory requirements may be onerous, time-consuming, and expensive, especially where these requirements are inconsistent from jurisdiction to jurisdiction or where the jurisdictional reach of certain requirements is not clearly defined or seeks to reach across national borders. Regulatory requirements in one jurisdiction may make it difficult or impossible to do business in another jurisdiction. We may also be unsuccessful in obtaining permits, licenses, or other authorizations required to operate our business, such as for the marketing or sale or import or export of our products and services.
While we have implemented policies, procedures, and systems designed to achieve compliance with these regulatory requirements, we cannot assure you that these policies, procedures, or systems will be adequate or that we or our personnel will not violate these policies and procedures or applicable laws and regulations. Violations of these laws or regulations may harm our reputation and deter government agencies and other existing or potential customers or partners from purchasing our solutions. Furthermore, non-compliance with applicable laws or regulations could result in fines, damages, criminal sanctions against us, our officers, or our employees, restrictions on the conduct of our business, and damage to our reputation.
Regulatory requirements, such as laws requiring telecommunications providers to facilitate the monitoring of communications by law enforcement, may also influence market demand for many of our products and/or customer requirements for specific functionality and performance or technical standards. The domestic and international regulatory environment is subject to constant change, often based on factors beyond our control or anticipation, including political climate, budgets, and current events, which could reduce demand for our products or require us to change or redesign products to maintain compliance or competitiveness.
Loss of security clearances or political factors may adversely affect our business.
Some of our subsidiaries maintain security clearances domestically and abroad in connection with the development, marketing, sale, and support of our Security Intelligence solutions. These clearances are reviewed from time to time by these countries and could be deactivated, including for political reasons unrelated to the merits of our solutions, such as the list of countries we do business with or the fact that our local entity is controlled by or affiliated with an entity based in another country. If we lose our security clearances in a particular country, we may be unable to sell our Security Intelligence solutions for secure projects in that country on a direct basis and might also experience greater challenges in selling such solutions even for non-secure projects in that country. Even if we are able to obtain and maintain applicable security clearances, government customers may decline to purchase our Security Intelligence solutions if they were not developed or manufactured in that country or if they were developed or manufactured in other countries that are considered disfavored by such country. We may also experience negative publicity or other adverse impacts on our business if we sell our Security Intelligence solutions to countries that are considered disfavored by the media or political or social rights organizations even though such transactions may be permissible under applicable law.
18
Table of Contents
Intellectual Property and Data/Systems Security
Our intellectual property may not be adequately protected.
While much of our intellectual property is protected by patents or patent applications, we have not and cannot protect all of our intellectual property with patents or other registrations. There can be no assurance that patents we have applied for will be issued on the basis of our patent applications or that, if such patents are issued, they will be sufficiently broad enough to protect our technologies, products, or services. There can be no assurance that we will file new patent, trademark, or copyright applications, that any future applications will be approved, that any existing or future patents, trademarks or copyrights will adequately protect our intellectual property, or that any existing or future patents, trademarks, or copyrights will not be challenged by third parties. Our intellectual property rights may not be successfully asserted in the future or may be invalidated, designed around, or challenged.
In order to safeguard our unpatented proprietary know-how, source code, trade secrets, and technology, we rely primarily upon trade secret protection and non-disclosure provisions in agreements with employees and other third parties having access to our confidential information. There can be no assurance that these measures will adequately protect us from improper disclosure or misappropriation of our proprietary information.
Preventing unauthorized use or infringement of our intellectual property rights is difficult even in jurisdictions with well-established legal protections for intellectual property such as the United States. It may be even more difficult to protect our intellectual property in other jurisdictions where legal protections for intellectual property rights are less established. If we are unable to adequately protect our intellectual property against unauthorized third-party use or infringement, our competitive position could be adversely affected.
Our products may infringe or may be alleged to infringe on the intellectual property rights of others, which could lead to costly disputes or disruptions for us and may require us to indemnify our customers and resellers for any damages they suffer.
The technology industry is characterized by frequent allegations of intellectual property infringement. In the past, third parties have asserted that certain of our products infringed upon their intellectual property rights and similar claims may be made in the future. Any allegation of infringement against us could be time consuming and expensive to defend or resolve, result in substantial diversion of management resources, cause product shipment delays, or force us to enter into royalty or license agreements. If patent holders or other holders of intellectual property initiate legal proceedings against us, either with respect to our own intellectual property or intellectual property we license from third parties, we may be forced into protracted and costly litigation, regardless of the merits of these claims. We may not be successful in defending such litigation, in part due to the complex technical issues and inherent uncertainties in intellectual property litigation, and may not be able to procure any required royalty or license agreements on terms acceptable to us, or at all. Third parties may also assert infringement claims against our customers. Subject to certain limitations, we generally indemnify our customers and resellers with respect to infringement by our products of the proprietary rights of third parties, which, in some cases, may not be limited to a specified maximum amount and for which we may not have sufficient insurance coverage or adequate indemnification in the case of intellectual property licensed from a third party. If any of these claims succeed, we may be forced to pay damages, be required to obtain licenses for the products our customers or partners use, or incur significant expenses in developing non-infringing alternatives. If we cannot obtain necessary licenses on commercially reasonable terms, our customers may be forced to stop using or, in the case of resellers and other partners, stop selling our products.
Use of free or open source software could expose our products to unintended restrictions and could materially adversely affect our business.
Some of our products contain free or open source software (together, open source software) and we anticipate making use of open source software in the future. Open source software is generally covered by license agreements that permit the user to use, copy, modify, and distribute the software without cost, provided that the users and modifiers abide by certain licensing requirements. The original developers of the open source software generally provide no warranties on such software or protections in the event the open source software infringes a third party's intellectual property rights. Although we endeavor to monitor the use of open source software in our product development, we cannot assure you that past, present, or future products will not contain open source software elements that impose unfavorable licensing restrictions or other requirements on our products, including the need to seek licenses from third parties, to re-engineer affected products, to discontinue sales of affected products, or to release all or portions of the source code of affected products. Any of these developments could materially adversely affect our business.
19
Table of Contents
The mishandling or the perceived mishandling of sensitive information could harm our business.
Our products are in some cases used by customers to compile and analyze highly sensitive or confidential information and data, including information or data used in intelligence gathering or law enforcement activities. While our customers' use of our products in no way affords us access to the customer's sensitive or confidential information or data, we or our partners may receive or come into contact with such information or data, including personally identifiable information, when we are asked to perform services or support functions for our customers. We or our partners may also receive or come into contact with such information or data in connection with our SaaS or other hosted or managed services offerings. We have implemented policies and procedures and use information technology systems to help ensure the proper handling of such information and data, including background screening of certain service personnel, non-disclosure agreements with employees and partners, access rules, and controls on our information technology systems. Customers are also increasingly focused on the security of our products and we work to ensure their security, including through the use of encryption, access rights, and other customary security features, which vary based on the solution in question and customer requirements. However, these measures are designed to mitigate the risks associated with handling or processing sensitive data and cannot safeguard against all risks at all times. The improper handling of sensitive data, or even the perception of such mishandling (whether or not valid), or other security lapses by us or our partners or within our products, could reduce demand for our products or otherwise expose us to financial or reputational harm or legal liability.
We may be subject to information technology system failures or disruptions that could harm our operations, financial condition, or reputation.
We rely extensively on information technology systems to operate and manage our business and to process, maintain, and safeguard information, including information belonging to our customers, partners, and personnel. These systems may be subject to failures or disruptions as a result of, among other things, natural disasters, accidents, power disruptions, telecommunications failures, new system implementations, acts of terrorism or war, physical security breaches, computer viruses, or other cyber-attacks. We have experienced cyber-attacks in the past and may experience them in the future, potentially with greater frequency. While we are continually working to maintain secure and reliable systems, our security, redundancy, and business continuity efforts may be ineffective or inadequate. We must continuously improve our design and coordination of security controls across our business groups and geographies. Despite our efforts, it is possible that our security controls and other procedures that we follow may not prevent systems failures or disruptions. Such system failures or disruptions could subject us to research and development or production downtimes, delays in our ability to process orders, delays in our ability to provide products and services to customers, including SaaS or other hosted or managed services offerings, delays or errors in financial reporting, compromise, disclosure, or loss of sensitive or confidential information or intellectual property, destruction or corruption of data, financial losses from remedial actions, liabilities to customers or other third parties, or damage to our reputation. Information system failures at one of our partners, including hosting providers or those who support other cloud-based offerings, may also result in similar adverse consequences. Any of the foregoing could harm our competitive position, result in a loss of customer confidence, and materially and adversely affect our results of operations or financial condition.
Risks Related to Our Finances and Capital Structure
If our goodwill or other intangible assets become impaired, our financial condition and results of operations could be negatively affected.
Because we have historically acquired a significant number of companies, goodwill and other intangible assets have represented a substantial portion of our assets. Goodwill and other intangible assets totaled approximately $1,513 million , or approximately 64% of our total assets, as of January 31, 2015. We test our goodwill for impairment at least annually, or more frequently if an event occurs indicating the potential for impairment, and we assess on an as-needed basis whether there have been impairments in our other intangible assets. We make assumptions and estimates in this assessment which are complex and often subjective. These assumptions and estimates can be affected by a variety of factors, including external factors such as industry and economic trends, and internal factors such as changes in our business strategy or our internal forecasts. To the extent that the factors described above change, we could be required to record additional non-cash impairment charges in the future, which could negatively affect our financial condition and results of operations.
20
Table of Contents
We may be adversely affected by our acquisition of CTI or our historical affiliation with CTI and its former subsidiaries.
As a result of the February 2013 acquisition of our former parent company, CTI (the "CTI Merger"), CTI's liabilities, including contingent liabilities, have been consolidated into our financial statements. If CTI's liabilities are greater than represented, if the contingent liabilities we have assumed become fixed, or if there are obligations of CTI of which we were not aware at the time of completion of the CTI Merger, we may have exposure for those obligations and our business or financial condition could be materially and adversely affected. Adjustments to the CTI consolidated group's tax liability for periods prior to the CTI Merger could also affect the net operating losses ("NOLs") allocated to Verint as a result of the CTI Merger and cause us to incur additional tax liability in future periods.
As a result of our historical affiliation with CTI and other members of the historical CTI consolidated tax group, we could also become liable for taxes of other members of the CTI consolidated group for historical periods under certain circumstances. Adjustments to the historical CTI consolidated group's tax liability for periods prior to Verint's IPO could also affect the NOLs allocated to Verint in the IPO and cause us to incur additional tax liability in future periods.
We are entitled to certain rights to indemnification from Comverse in connection with the transactions contemplated by our agreement and plan of merger with CTI (the "CTI Merger Agreement") and the agreements entered into in connection with the distribution by CTI to its shareholders of substantially all of its assets other than its interest in us (the "Comverse share distribution"). However, there is no assurance that Comverse will be willing and able to provide such indemnification if needed. If we become responsible for liabilities (including tax liabilities) not covered by indemnification or substantially in excess of amounts covered by indemnification, or if Comverse becomes unwilling or unable to stand behind such protections, our financial condition and results of operations could be materially and adversely affected.
Our financial results may be significantly impacted by changes in our tax position.
We are subject to taxes in the United States and numerous foreign jurisdictions. Our future effective tax rates could be affected by changes in the mix of earnings in countries with differing statutory tax rates, changes in valuation allowance on deferred tax assets (including our NOL carryforwards), changes in unrecognized tax benefits or changes in tax laws or their interpretation. Any of these changes could have a material adverse effect on our profitability. In addition, the tax authorities in the jurisdictions in which we operate, including the United States, may from time to time review the pricing arrangements between us and our foreign subsidiaries or among our foreign subsidiaries. An adverse determination by one or more tax authorities in this regard may have a material adverse effect on our financial results.
We have significant deferred tax assets which can provide us with significant future cash tax savings if we are able to use them, including significant NOLs inherited as a result of the CTI Merger. However, the extent to which we will be able to use these NOLs may be impacted, restricted, or eliminated by a number of factors, including changes in tax rates, laws or regulations, whether we generate sufficient future taxable income, and possible adjustments to the tax attributes of CTI or its non-Verint subsidiaries for periods prior to the CTI Merger. To the extent that we are unable to utilize our NOLs or other losses, our results of operations, liquidity, and financial condition could be materially adversely affected. When we cease to have NOLs available to us in a particular tax jurisdiction, either through their expiration, disallowance, or utilization, our cash tax liability will increase in that jurisdiction.
Our international operations subject us to currency exchange risk.
We earn revenue, pay expenses, own assets and incur liabilities in countries using currencies other than the U.S. dollar, including the Israeli shekel, British pound sterling, euro, and Singapore dollar, among others. Because our consolidated financial statements are presented in U.S. dollars, we must translate revenue, expenses, assets, and liabilities of entities using non-U.S. dollar functional currencies into U.S. dollars using currency exchange rates in effect during or at the end of each reporting period. Therefore, changes in currency exchange rates affect the translation of revenue and operating expenses that are denominated in non-U.S. dollar functional currencies into U.S. dollars, which impacts our consolidated operating income. In addition, our net income is further impacted by the revaluation and settlement of monetary assets and liabilities denominated in currencies other than an entity's functional currency, gains or losses on which are recorded within other income (expense), net. We attempt to mitigate a portion of these risks through foreign currency hedging, based on our judgment of the appropriate trade-offs among risk, opportunity and expense. However, our hedging activities are limited in scope and duration and may not be effective at reducing the U.S. dollar cost of our global operations.
21
Table of Contents
In addition, our financial outlooks do not assume fluctuations in currency exchange rates. Adverse fluctuations in currency exchange rates subsequent to providing our financial outlooks could cause our actual results to differ materially from those anticipated in our outlooks, which could negatively affect our business.
We have a significant amount of indebtedness, which exposes us to leverage risks and subjects us to covenants which may adversely affect our operations.
At March 13, 2015, we had total outstanding indebtedness of approximately $811 million under our Credit Agreement and the Notes, meaning that we are significantly leveraged. Our leverage position may, among other things:
• | limit our ability to obtain additional debt financing in the future for working capital, capital expenditures, acquisitions, or other general corporate purposes; |
• | require us to dedicate a substantial portion of our cash flow from operations to debt service, reducing the availability of our cash flow for other purposes; |
• | require us to repatriate cash for debt service from our foreign subsidiaries resulting in dividend tax costs or require us to adopt other disadvantageous tax structures to accommodate debt service payments; or |
• | increase our vulnerability to economic downturns, limit our ability to capitalize on significant business opportunities, and restrict our flexibility to react to changes in market or industry conditions. |
In addition, because our indebtedness under our Credit Agreement bears interest at a variable rate, we are exposed to risk from fluctuations in interest rates in periods where market rates exceed the interest rate floor provided by our Credit Agreement.
The revolving credit facility under our Credit Agreement contains a financial covenant that requires us to maintain a maximum consolidated leverage ratio. Our ability to comply with the leverage ratio covenant is dependent upon our ability to continue to generate sufficient earnings each quarter, or in the alternative, to reduce expenses and/or reduce the level of our outstanding debt and we cannot assure that we will be successful in any or all of these regards.
Our Credit Agreement also includes a number of restrictive covenants which limit our ability to, among other things:
• | incur additional indebtedness or liens or issue preferred stock; |
• | pay dividends or make other distributions or repurchase or redeem our stock or subordinated indebtedness; |
• | engage in transactions with affiliates; |
• | engage in sale-leaseback transactions; |
• | sell certain assets; |
• | change our lines of business; |
• | make investments, loans, or advances; and |
• | engage in consolidations, mergers, liquidations, or dissolutions. |
These covenants could limit our ability to plan for or react to market conditions, to meet our capital needs, or to otherwise engage in transactions that might be considered beneficial to us.
If certain events of default occur under our Credit Agreement, our lenders could declare all amounts outstanding to be immediately due and payable. An acceleration of indebtedness under our Credit Agreement may result in an event of default under the indenture governing the Notes. Additionally, if a change of control as defined in our Credit Agreement were to occur, the lenders under our credit facilities would have the right to require us to repay all of our outstanding obligations under the facilities.
If a fundamental change as defined in the indenture governing the Notes were to occur, the holders may require us to purchase for cash all or any portion of their Notes at 100% of the principal amount of the Notes, plus accrued and unpaid interest.
22
Table of Contents
Additionally, in the event the conditional conversion feature of the Notes is triggered, holders of the Notes will be entitled to convert their Notes during specified periods of time at their option. If one or more holders elect to convert their Notes, we may be required to settle all or a portion of our conversion obligation in cash, which could adversely affect our liquidity.
If any of the events described in the foregoing paragraphs were to occur, in order to satisfy our obligations we may be forced to seek an amendment of and/or waiver under our debt agreements, raise additional capital through securities offerings, asset sales, or other transactions, or seek to refinance or restructure our debt. In such a case, there can be no assurance that we will be able to consummate such a transaction on reasonable terms or at all.
We consider other financing and refinancing options from time to time, however, we cannot assure you that such options will be available to us on reasonable terms or at all. If one or more rating agencies were to downgrade our credit ratings, that could also impede our ability to refinance our existing debt or secure new debt, increase our future cost of borrowing, and create third-party concerns about our financial condition or results of operations.
Our internal controls over financial reporting may not prevent misstatements and material weaknesses or deficiencies could arise in the future which could lead to restatements or filing delays.
Our system of internal control over financial reporting is a process designed to provide reasonable assurance regarding the reliability of financial reporting and the preparation of consolidated financial statements for external reporting purposes in accordance with U.S. generally accepted accounting principles ("GAAP"). Because of its inherent limitations, internal control over financial reporting may not prevent or detect every misstatement. An evaluation of effectiveness is subject to the risk that the controls may become inadequate because of changes in conditions, because the degree of compliance with policies or procedures decreases over time, or because of unanticipated circumstances or other factors. As a result, although our management has concluded that our internal controls are effective as of January 31, 2015, we cannot assure you that our internal controls will prevent or detect every misstatement, that material weaknesses or other deficiencies will not occur or be identified in the future, that this or future financial reports will not contain material misstatements or omissions, that future restatements will not be required, or that we will be able to timely comply with our reporting obligations in the future.
The prices of our common stock and the Notes have been, and may continue to be, volatile and your investment could lose value.
The prices of our common stock and the Notes have been, and may continue to be, volatile. Those prices could be affected by any of the risk factors discussed in this Item. In addition, other factors that could impact the prices of our common stock and/or the Notes include:
• | announcements by us or our competitors regarding, among other things, new products, product enhancements or technological advances, acquisitions, major transactions, or management changes; |
• | speculation in the press and the analyst community, including with respect to changes in recommendations or earnings estimates by financial analysts, changes in investors' or analysts' valuation measures for our securities, our credit ratings, and market trends unrelated to our performance; |
• | stock sales by our directors, officers, or other significant holders; |
• | hedging or arbitrage trading activity by third parties, including by the counterparties to the note hedge and warrant transactions that we entered into in connection with the issuance of the Notes; and |
• | dilution that may occur upon any conversion of the Notes. |
A significant drop in the price of our common stock or the Notes could also expose us to the risk of securities class action lawsuits, which could result in substantial costs and divert management's attention and resources, which could adversely affect our business.
Item 1B. Unresolved Staff Comments
None.
23
Table of Contents
Item 2. Properties
The following describes our material properties as of the date of this report.
We lease a total of approximately 854,000 square feet of office space covering approximately 60 offices around the world and we own an aggregate of approximately 89,000 square feet of office space at three sites in Scotland, Germany, and Indonesia.
Other than as described below, these properties are comprised of small and mid-sized facilities that are used to support our administrative, marketing, manufacturing, product development, sales, training, support, and services needs for our three operating segments.
Our corporate headquarters is located in a leased facility in Melville, New York, and consists of approximately 45,800 square feet under a lease that expires in November 2015. The Melville facility is used primarily by our executive management and corporate groups, including finance, legal and human resources, as well as for customer support and services for our Enterprise Intelligence operations. On February 13, 2015, we entered into a new lease for a facility in Melville, New York, which we expect to occupy on or about November 1, 2015. The new Melville facility will consist of approximately 49,000 square feet under a lease that expires in 2027. The new Melville facility will serve as our corporate headquarters following the expiration of our existing corporate headquarters lease in November 2015.
We lease approximately 132,700 square feet at a facility in Alpharetta, Georgia under a lease that expires in September 2026. The Alpharetta facility is used primarily by the administrative, marketing, product development, support, and sales groups for our Enterprise Intelligence operations.
We also occupy approximately 176,000 square feet at our main facility in Herzliya, Israel under a lease that expires in October 2015. This Herzliya facility is used primarily for manufacturing, storage, development, sales, marketing, and support related to our Communications Intelligence operations, as well as for product development related to our Enterprise Intelligence and Video Intelligence operations.
From time to time, we may lease or sublease portions of our owned or leased facilities to third parties based on our operational needs. For additional information regarding our lease obligations, see Note 17, "Commitments and Contingencies" to our consolidated financial statements included under Item 8 of this report.
We believe that our leased and owned facilities are in good operating condition and are adequate for our current requirements, although growth in our business may require us to acquire additional facilities or modify existing facilities. We believe that alternative locations are available on commercially reasonable terms in all areas where we currently do business.
Item 3. Legal Proceedings
On March 26, 2009, legal actions were commenced by Ms. Orit Deutsch, a former employee of our subsidiary, Verint Systems Limited ("VSL"), against VSL in the Tel Aviv Regional Labor Court (Case Number 4186/09) (the "Deutsch Labor Action") and against CTI in the Tel Aviv District Court (Case Number 1335/09) (the "Deutsch District Action"). In the Deutsch Labor Action, Ms. Deutsch filed a motion to approve a class action lawsuit on the grounds that she purports to represent a class of our employees and former employees who were granted Verint and CTI stock options and were allegedly damaged as a result of the suspension of option exercises during our previous extended filing delay period. In the Deutsch District Action, in addition to a small amount of individual damages, Ms. Deutsch is seeking to certify a class of plaintiffs who were allegedly damaged due to their inability to exercise Verint and CTI stock options as a result of alleged negligence by CTI in its financial reporting. The class certification motions do not specify an amount of damages. On February 8, 2010, the Deutsch Labor Action was dismissed for lack of material jurisdiction and was transferred to the Tel Aviv District Court and consolidated with the Deutsch District Action. On March 16, 2009 and March 26, 2009, respectively, legal actions were commenced by Ms. Roni Katriel, a former employee of CTI's former subsidiary, Comverse Limited, against Comverse Limited in the Tel Aviv Regional Labor Court (Case Number 3444/09) (the "Katriel Labor Action") and against CTI in the Tel Aviv District Court (Case Number 1334/09) (the "Katriel District Action"). In the Katriel Labor Action, Ms. Katriel is seeking to certify a class of plaintiffs who were granted CTI stock options and were allegedly damaged as a result of the suspension of option exercises during CTI's previous extended filing delay period. In the Katriel District Action, in addition to a small amount of individual damages, Ms. Katriel is seeking to certify a class of plaintiffs who were allegedly damaged due to their inability to exercise CTI stock options as a result of alleged negligence by CTI in its financial reporting. The class certification motions do not specify an amount of damages. On March 2, 2010, the Katriel Labor Action was transferred to the Tel Aviv District Court, based on an agreed motion filed by the parties requesting such transfer.
24
Table of Contents
On April 4, 2012, Ms. Deutsch and Ms. Katriel filed an uncontested motion to consolidate and amend their claims and on June 7, 2012, the District Court allowed Ms. Deutsch and Ms. Katriel to file the consolidated class certification motion and an amended consolidated complaint against VSL, CTI, and Comverse Limited. Following CTI's announcement of its intention to effect the Comverse share distribution, on July 12, 2012, the plaintiffs filed a motion requesting that the District Court order CTI to set aside up to $150.0 million in assets to secure any future judgment. The District Court ruled that it would not decide this motion until the Deutsch and Katriel class certification motion was heard. Plaintiffs initially filed a motion to appeal this ruling in August 2012, but subsequently withdrew it in July 2014.
Prior to the consummation of the Comverse share distribution, CTI either sold or transferred substantially all of its business operations and assets (other than its equity ownership interests in us and Comverse) to Comverse or unaffiliated third parties. On October 31, 2012, CTI completed the Comverse share distribution, in which it distributed all of the outstanding shares of common stock of Comverse to CTI's shareholders. As a result of the Comverse share distribution, Comverse became an independent public company and ceased to be a wholly owned subsidiary of CTI, and CTI ceased to have any material assets other than its equity interest in us.
On February 4, 2013, we completed the CTI Merger. As a result of the CTI Merger, we have assumed certain rights and liabilities of CTI, including any liability of CTI arising out of the Deutsch District Action and the Katriel District Action. However, under the terms of the Distribution Agreement between CTI and Comverse relating to the Comverse share distribution, we, as successor to CTI, are entitled to indemnification from Comverse for any losses we suffer in our capacity as successor-in-interest to CTI in connection with the Deutsch District Action and the Katriel District Action.
Following an attempt to mediate the dispute, on July 1, 2014, the plaintiffs filed a notice with the District Court informing it that the mediation process had been unsuccessful. As a result, the parties recently filed summations on the plaintiffs' motion to certify the suit as a class action, which are under consideration by the District Court.
From time to time we or our subsidiaries may be involved in legal proceedings and/or litigation arising in the ordinary course of our business. While the outcome of these matters cannot be predicted with certainty, we do not believe that the outcome of any current claims will have a material effect on our consolidated financial position, results of operations, or cash flows.
Item 4. Mine Safety Disclosures
Not applicable.
25
Table of Contents
PART II
Item 5. Market for Registrant's Common Equity, Related Stockholder Matters, and Issuer Purchases of Equity Securities
Market Information
Our common stock trades on the NASDAQ Global Select Market under the symbol "VRNT".
The following table sets forth, for the periods indicated, the high and low sales prices per share of our common stock as reported by the NASDAQ Global Select Market.
|
| Low |
| High | ||||
Year Ended January 31, 2014: |
|
|
|
| ||||
First quarter |
| $ | 32.25 | |
| $ | 37.00 | |
Second quarter |
| $ | 32.35 | |
| $ | 37.04 | |
Third quarter |
| $ | 32.80 | |
| $ | 38.34 | |
Fourth quarter |
| $ | 35.24 | |
| $ | 48.99 | |
|
|
|
|
| ||||
Year Ended January 31, 2015: |
|
|
|
| ||||
First quarter |
| $ | 42.29 | |
| $ | 49.99 | |
Second quarter |
| $ | 41.44 | |
| $ | 53.19 | |
Third quarter |
| $ | 45.89 | |
| $ | 57.89 | |
Fourth quarter |
| $ | 52.84 | |
| $ | 61.05 | |
Holders
There were approximately 2,700 holders of record of our common stock at March 13, 2015. Such record holders include holders who are nominees for an undetermined number of beneficial owners.
Dividends
We have not declared or paid any cash dividends on our equity securities and have no current plans to pay any dividends on our equity securities. We intend to retain our earnings to finance the development of our business, repay debt, and for other corporate purposes. In addition, the terms of our Credit Agreement restrict our ability to pay cash dividends on shares of our common stock. See "Management's Discussion and Analysis of Financial Condition and Results of Operations-Liquidity and Capital Resources" included under Item 7 of this report and Note 6, "Long-Term Debt" to our consolidated financial statements included under Item 8 of this report for a more detailed discussion of these limitations.
Any future determination as to the payment of dividends on our common stock will be made by our board of directors at its discretion, subject to the limitations contained in our Credit Agreement and will depend upon our earnings, financial condition, capital requirements, and other relevant factors.
Stock Performance Graph
The following table compares the cumulative total stockholder return on our common stock with the cumulative total return on the NASDAQ Composite Index and the NASDAQ Computer & Data Processing Services Index, assuming an investment of $100 on January 31, 2010 through January 31, 2015, and the reinvestment of any dividends. The comparisons in the graph below are based upon (i) closing sale prices on NASDAQ for our common stock from July 6, 2010 through January 31, 2015 and (ii) the closing bid quotations on the over-the-counter securities market (as reported by the Pink Sheets) for the period prior to July 6, 2010. This data is not indicative of, nor intended to forecast, future performance of our common stock.
26
Table of Contents
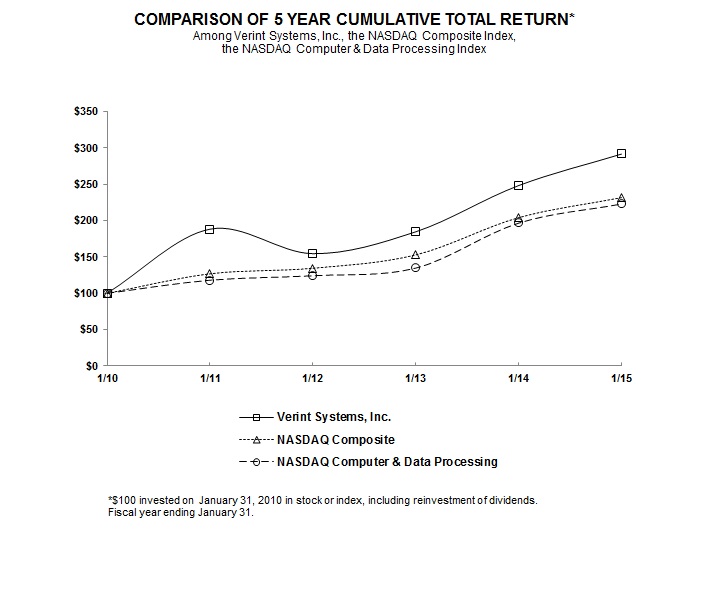
January 31, |
| 2010 |
| 2011 |
| 2012 |
| 2013 |
| 2014 |
| 2015 | ||||||||||||
|
|
|
|
|
|
|
|
|
|
|
|
| ||||||||||||
Verint Systems Inc. |
| $ | 100.00 | |
| $ | 188.31 | |
| $ | 154.54 | |
| $ | 184.70 | |
| $ | 248.31 | |
| $ | 291.69 | |
NASDAQ Composite Index |
| $ | 100.00 | |
| $ | 126.90 | |
| $ | 134.50 | |
| $ | 152.96 | |
| $ | 204.19 | |
| $ | 231.72 | |
NASDAQ Computer & Data Processing Index |
| $ | 100.00 | |
| $ | 118.10 | |
| $ | 124.19 | |
| $ | 134.80 | |
| $ | 196.61 | |
| $ | 222.92 | |
Recent Sales of Unregistered Securities
None.
Purchases of Equity Securities by the Issuer and Affiliated Purchasers
None.
Item 6. Selected Financial Data
The following selected consolidated financial data has been derived from our audited consolidated financial statements. The data below should be read in conjunction with "Management's Discussion and Analysis of Financial Condition and Results of Operations" under Item 7 and our consolidated financial statements and notes thereto included under Item 8 of this report.
27
Table of Contents
Our historical results should not be viewed as indicative of results expected for any future period.
Five-Year Selected Financial Highlights:
Consolidated Statements of Operations Data | ||||||||||||||||||||
|
| Year Ended January 31, | ||||||||||||||||||
(in thousands, except per share data) |
| 2015 |
| 2014 |
| 2013 |
| 2012 |
| 2011 | ||||||||||
Revenue |
| $ | 1,128,436 | |
| $ | 907,292 | |
| $ | 839,542 | |
| $ | 782,648 | |
| $ | 726,799 | |
Operating income |
| $ | 79,111 | |
| $ | 122,286 | |
| $ | 99,553 | |
| $ | 86,478 | |
| $ | 73,105 | |
Net income |
| $ | 36,402 | |
| $ | 58,776 | |
| $ | 58,804 | |
| $ | 40,625 | |
| $ | 28,585 | |
Net income attributable to Verint Systems Inc. |
| $ | 30,931 | |
| $ | 53,757 | |
| $ | 54,002 | |
| $ | 36,993 | |
| $ | 25,581 | |
Net income attributable to Verint Systems Inc. common shares |
| $ | 30,931 | |
| $ | 53,583 | |
| $ | 38,530 | |
| $ | 22,203 | |
| $ | 11,403 | |
Net income per share attributable to Verint Systems Inc.: |
|
|
|
|
|
|
|
|
|
| ||||||||||
Basic |
| $ | 0.53 | |
| $ | 1.01 | |
| $ | 0.97 | |
| $ | 0.58 | |
| $ | 0.33 | |
Diluted |
| $ | 0.52 | |
| $ | 0.99 | |
| $ | 0.96 | |
| $ | 0.56 | |
| $ | 0.31 | |
Weighted-average shares: |
|
|
|
|
|
|
|
|
|
| ||||||||||
Basic |
| 58,096 | |
| 52,967 | |
| 39,748 | |
| 38,419 | |
| 35,544 | | |||||
Diluted |
| 59,374 | |
| 53,878 | |
| 40,312 | |
| 39,499 | |
| 37,179 | | |||||
We have never declared a cash dividend to common stockholders.
Consolidated Balance Sheet Data | ||||||||||||||||||||
|
| January 31, | ||||||||||||||||||
(in thousands) |
| 2015 |
| 2014 |
| 2013 |
| 2012 |
| 2011 | ||||||||||
Total assets |
| $ | 2,350,996 | |
| $ | 1,772,907 | |
| $ | 1,564,269 | |
| $ | 1,502,868 | |
| $ | 1,376,127 | |
Long-term debt, including current maturities |
| $ | 736,802 | |
| $ | 642,385 | |
| $ | 576,689 | |
| $ | 597,379 | |
| $ | 583,234 | |
Preferred stock |
| $ | - | |
| $ | - | |
| $ | 285,542 | |
| $ | 285,542 | |
| $ | 285,542 | |
Total stockholders' equity |
| $ | 1,004,903 | |
| $ | 633,118 | |
| $ | 229,676 | |
| $ | 144,295 | |
| $ | 77,687 | |
During the five-year period ended January 31, 2015, we acquired a number of businesses, the more significant of which were the acquisitions of KANA in February 2014, UTX Technologies Limited ("UTX") in March 2014, Vovici Corporation in August 2011, and Global Management Technologies in October 2011. The operating results of acquired businesses have been included in our consolidated financial statements since their respective acquisition dates and have contributed to our revenue growth.
In addition to the impact of our business acquisitions, our consolidated operating results and consolidated financial condition for the years during the five-year period ended January 31, 2015 included the following notable transactions:
28
Table of Contents
As of and for the year ended January 31, |
|
| Description |
2015 |
| • | An income tax benefit of $44.4 million resulting from the reduction of a valuation allowance on our deferred income tax assets recorded in connection with the acquisition of KANA; and |
|
| • | Losses on early retirements of debt of $12.5 million, primarily associated with an amendment to our Credit Agreement and the early partial retirement of our term loans. |
|
|
|
|
2014 |
| • | Completion of the CTI Merger on February 4, 2013; and |
|
| • | Losses on early retirements of debt of $9.9 million, primarily associated with an amendment to our Credit Agreement. |
|
|
|
|
2013 |
| • | Professional fees and related expenses of $16.1 million associated with the CTI Merger. |
|
|
|
|
2012 |
| • | A loss on early retirement of debt of $8.1 million associated with the termination of our prior credit agreement. |
|
|
|
|
2011 |
| • | Realized losses on an interest rate swap of $3.1 million; and |
|
| • | Approximately $29 million in professional fees and related expenses associated with our restatement of previously filed consolidated financial statements for periods through January 31, 2005 and our previous extended filing delay period. |
Item 7. Management's Discussion and Analysis of Financial Condition and Results of Operations
The following management's discussion and analysis of our financial condition and results of operations should be read in conjunction with "Business" under Item 1, "Selected Financial Data" under Item 6, and our consolidated financial statements and the related notes thereto included under Item 8 of this report. This discussion contains a number of forward-looking statements, all of which are based on our current expectations and all of which could be affected by uncertainties and risks. Our actual results may differ materially from the results contemplated in these forward-looking statements as a result of many factors including, but not limited to, those described in "Risk Factors" under Item 1A of this report.
Overview
Our Business
Verint is a global leader in Actionable Intelligence solutions. Actionable Intelligence is a necessity in a dynamic world of massive information growth because it empowers organizations with crucial insights and enables decision makers to anticipate, respond, and take action. With Verint solutions and value-added services, organizations of all sizes and across many industries can make more timely and effective decisions. Today, more than 10,000 organizations in over 180 countries, including over 80 percent of the Fortune 100, use Verint solutions to improve enterprise performance and make the world a safer place. Verint's vision is to create A Smarter World with Actionable Intelligence.
Our Actionable Intelligence solutions help organizations address three important challenges: Customer Engagement Optimization; Security Intelligence; and Fraud, Risk, and Compliance. We help our customers capture large amounts of information from numerous data types and sources, use analytics to glean insights from the information, and leverage the resulting Actionable Intelligence to help achieve their customer engagement, enhanced security, and risk mitigation goals.
Headquartered in Melville, New York, we support our customers around the globe directly and with an extensive network of selling and support partners.
We conduct our business through three operating segments-Enterprise Intelligence, Communications and Cyber Intelligence, and Video and Situation Intelligence. Organizing our business through three operating segments allows us to align our resources and domain expertise to more effectively address the Actionable Intelligence market. We address the Customer Engagement Optimization market opportunity through solutions from our Enterprise Intelligence segment. We address the Security Intelligence market opportunity through solutions from our Communications and Cyber Intelligence segment and
29
Table of Contents
Video and Situation Intelligence segment, and we address the Fraud, Risk, and Compliance market opportunity through solutions from all three operating segments.
For the years ended January 31, 2015, 2014, and 2013, our Enterprise Intelligence segment represented approximately 58%, 55%, and 59% of our total revenue, respectively. For the years ended January 31, 2015, 2014, and 2013, our Communications and Cyber Intelligence segment represented approximately 32%, 32%, and 27% of our total revenue, respectively. For the years ended January 31, 2015, 2014, and 2013, our Video and Situation Intelligence segment represented approximately 10%, 13%, and 14% of our total revenue, respectively.
Generally, we make business decisions by evaluating the risks and rewards of the opportunities available to us in the markets served by each of our segments. We view each operating segment differently and allocate capital, personnel, resources, and management attention accordingly. In reviewing each operating segment, we also review the performance of that segment by geography. Our marketing and sales strategies, expansion opportunities, and product offerings may differ materially within a particular segment geographically, as may our allocation of resources between segments. When making decisions regarding investment in our business, increasing capital expenditures, or making other decisions that may reduce our profitability, we also consider the leverage ratio in our revolving credit facility. See "- Liquidity and Capital Resources" for more information.
Key Trends and Factors That May Impact our Performance
We believe that there are many factors that affect our ability to sustain and increase both revenue and profitability, including:
• | Market acceptance of Actionable Intelligence solutions. We compete in markets where the value of certain aspects of our products and solutions is still in the process of market acceptance. We believe that our future growth depends in part on the continued and increasing acceptance and realization of the value of our product offerings. |
• | Evolving technologies and market potential. Our success depends in part on our ability to keep pace with technological changes and evolving industry standards in our product offerings, successfully developing, launching, and driving demand for new, innovative, high-quality products and services that meet or exceed customer needs, and identifying, entering, and prioritizing areas of growing market potential. |
• | Information technology and government spending. Our growth and results depend in part on general economic conditions and the pace of information technology spending by both commercial and governmental customers. |
See also "Risk Factors" under Item 1A of this report for a more complete description of these and other risks that may impact future revenue and profitability.
Notable Developments During the Year Ended January 31, 2015
On February 3, 2014, we completed the acquisition of KANA, a leading provider of on-premises and cloud-based solutions which create differentiated, personalized, and integrated customer experiences for large enterprises and mid-market organizations, for net cash consideration of $516.6 million, through the merger of KANA Software, Inc.'s parent holding company, Kay Technology Holdings, Inc. with an indirect, wholly owned subsidiary of ours, with Kay Technology Holdings, Inc. continuing as the surviving company and as our wholly owned subsidiary.
The acquisition was funded through a combination of cash on hand, $300.0 million of incremental term loans incurred in connection with an amendment to our Credit Agreement, and $125.0 million of borrowings under our revolving credit facility.
KANA has been substantially integrated into our Enterprise Intelligence operating segment.
On March 31, 2014, we completed the acquisition of all of the outstanding shares of UTX, a provider of certain mobile device tracking solutions for security applications, from UTX Limited. UTX Limited was our supplier of these products to our Communications Intelligence operating segment prior to the transaction. The purchase price for UTX was $84.2 million, including $82.9 million of cash paid at closing. The acquisition of UTX was funded with cash on hand. UTX is based in the EMEA region.
On June 18, 2014, we completed concurrent public offerings of 5,750,000 shares of our common stock and $400.0 million in aggregate principal amount of 1.50% convertible senior notes due June 1, 2021 (the "Notes"). The aggregate net proceeds from the concurrent offerings were $657.5 million, after deducting underwriters' discounts and commissions, but excluding other offering expenses. We used $15.6 million of the net proceeds to pay the net costs of an arrangement consisting of the purchase
30
Table of Contents
of call options and the sale of warrants to purchase our common stock, the intent of which is to reduce the potential dilution to our common stock upon conversion of the Notes. We used the remainder of the net proceeds to repay a portion of the outstanding indebtedness under our Credit Agreement.
Further details regarding our acquisitions and our long-term debt appear in Note 4, "Business Combinations" and Note 6, "Long-Term Debt", respectively, to our consolidated financial statements included under Item 8 of this report.
Our Previous Extended Filing Delay Period and Related Matters
From March 2006 through March 2010, we did not make periodic filings with the SEC. This extended filing delay arose as a result of certain internal and external investigations and reviews of accounting matters discussed in our prior public filings. In connection with the foregoing and related matters, we incurred approximately $137 million of professional fees and related expenses during the four years ended January 31, 2011.
Critical Accounting Policies and Estimates
An appreciation of our critical accounting policies is necessary to understand our financial results. The accounting policies outlined below are considered to be critical because they can materially affect our operating results and financial condition, as these policies may require us to make difficult and subjective judgments regarding uncertainties. The accuracy of these estimates and the likelihood of future changes depend on a range of possible outcomes and a number of underlying variables, many of which are beyond our control, and there can be no assurance that our estimates are accurate.
Revenue Recognition
Our revenue recognition policy is a critical component of determining our operating results and is based on a complex set of accounting rules that require us to make significant judgments and estimates. We derive and report our revenue in two categories: (a) product revenue, including sale of hardware products (which include software that works together with the hardware to deliver the product's essential functionality) and licensing of software products, and (b) service and support revenue, including revenue from installation services, post-contract customer support ("PCS"), project management, hosting services, SaaS, product warranties, consulting and training services. Our customer arrangements may include any combination of these elements. We follow the appropriate revenue recognition rules for each of these revenue streams. For additional information, see Note 1, "Summary of Significant Accounting Policies" to our consolidated financial statements included under Item 8 of this report. Revenue recognition for a particular arrangement is dependent upon such factors as the level of customization within the solution and the contractual delivery, acceptance, payment, and support terms with the customer. Significant judgment is required to conclude on each of these factors, and if we were to change any of these assumptions or judgments, it could cause a material increase or decrease in the amount of revenue that we report in a particular period.
We generally consider a purchase order or executed sales quote, when combined with a master license agreement, to constitute evidence of an arrangement. Delivery occurs when the product is shipped or transmitted and title and risk of loss have transferred to the customers. Our typical customer arrangements do not include substantive product acceptance provisions; however, if such provisions are provided, delivery is deemed to occur upon acceptance. We consider the fee to be fixed or determinable unless the fee is subject to refund or adjustment or is not payable within our standard payment terms. If the fee due from a customer is not fixed or determinable due to extended payment terms, revenue is recognized when payment becomes due or upon cash receipt, whichever is earlier.
Our multiple-element arrangements consist of a combination of our product and service offerings that may be delivered at various points in time. For arrangements within the scope of the multiple-deliverable guidance, a deliverable constitutes a separate unit of accounting when it has stand-alone value and there are no customer-negotiated refunds or return rights for the delivered elements. For multiple-element arrangements comprised only of tangible products containing software components and non-software components and related services, we allocate revenue to each element in an arrangement based on a selling price hierarchy. The selling price for a deliverable is based on its vendor-specific objective evidence ("VSOE"), if available, third-party evidence ("TPE"), if VSOE is not available, or estimated selling price ("ESP"), if neither VSOE nor TPE is available. The total transaction revenue is allocated to the multiple elements based on each element's relative selling price compared to the total selling price.
We account for multiple-element arrangements that contain only software and software-related elements by allocating a portion of the total purchase price to the undelivered elements, primarily installation services, PCS, consulting, and training, using VSOE of fair value of the undelivered elements. The remaining portion of the total transaction value is allocated to the delivered software, referred to as the residual method. If we are unable to establish VSOE for the undelivered elements of the
31
Table of Contents
arrangement, revenue recognition is deferred for the entire arrangement until all elements of the arrangement are delivered. However, if the only undelivered element is PCS, we recognize the arrangement fee ratably over the PCS period.
For multiple-element arrangements that are comprised of a combination of hardware and software elements, the total transaction value is bifurcated between the hardware elements and the software elements that are not essential to the functionality of the hardware, based on the relative selling prices of the hardware elements and the software elements as a group. Revenue is then recognized for the hardware and hardware-related services following the hardware revenue recognition methodology outlined above and revenue for the software and software-related services is recognized following the residual method or ratably over the PCS period if VSOE for PCS does not exist.
Our policy for establishing VSOE for installation, consulting, and training is based upon an analysis of separate sales of services. We utilize either the substantive renewal rate approach or the bell-shaped curve approach to establish VSOE for our PCS offerings, depending upon the business segment, geographical region, or product line. The timing of revenue recognition on software licenses and other revenue could be significantly impacted if we are unable to maintain VSOE on one or more undelivered elements during any quarterly period. Loss of VSOE could result in (i) the complete deferral of all revenue or (ii) ratable recognition of all revenue under a customer arrangement until such time as VSOE is re-established. If we are unable to re-establish VSOE on one or more undelivered elements for an extended period of time it would impact our ability to accurately forecast the timing of quarterly revenue, which could have a material adverse effect on our business, financial position, results of operations or cash flows.
We typically are not able to determine TPE for our products or our service and support offerings. TPE of selling price is established by evaluating largely similar and interchangeable competitor products or services in stand-alone sales to similarly situated customers.
If we are unable to determine the selling price because VSOE or TPE does not exist, we determine ESP for the purposes of allocating the arrangement by considering several external and internal factors including, but not limited to, pricing practices, similar product offerings, margin objectives, geographies in which we offer our products and services, internal costs, competition, and product lifecycle. The determination of ESP is made through consultation with and approval by our management, taking into consideration our go-to-market strategies. We have established processes to update ESP for each element, when appropriate, to ensure that it reflects recent pricing experience.
PCS revenue is derived from providing technical software support services and unspecified software updates and upgrades to customers on a when-and-if-available basis. PCS revenue is recognized ratably over the term of the maintenance period which, in most cases, is one year. When PCS is included within a multiple-element arrangement, we utilize either the substantive renewal rate approach or the bell-shaped curve approach to establish VSOE of the PCS, depending upon the business operating segment, geographical region, or product line.
Under the substantive renewal rate approach, we believe it is necessary to evaluate whether both the support renewal rate and term are substantive, and whether the renewal rate is being consistently applied to subsequent renewals for a particular customer. We establish VSOE under this approach through analyzing the renewal rate stated in the customer agreement and determining whether that rate is above the minimum substantive VSOE renewal rate established for that particular PCS offering. The minimum substantive VSOE rate is determined based upon an analysis of renewal rates associated with historical PCS contracts. Typically, renewal rates of 15% for PCS plans that provide when-and-if-available upgrades, and 10% for plans that do not provide for when-and-if-available upgrades, would be deemed to be minimum substantive renewal rates. For contracts that do not contain a stated renewal rate, revenue associated with the entire bundled arrangement is recognized ratably over the PCS term. Contracts that have a renewal rate below the minimum substantive VSOE rate are deemed to contain a more than insignificant discount element, for which VSOE cannot be established. We recognize revenue for these arrangements over the period that the customer is entitled to renew their PCS at the discounted rate, but not to exceed the estimated economic life of the product.
Under the bell-shaped curve approach of establishing VSOE, we perform a VSOE compliance test to ensure that a substantial majority (75% or over) of our actual PCS renewals are within a narrow range of plus or minus 15% of the median pricing.
Some of our arrangements require significant customization of the product to meet the particular requirements of the customer. For these arrangements, revenue is recognized under contract accounting methods, typically using the percentage of completion ("POC") method. Under the POC method, revenue recognition is generally based upon the ratio of hours incurred to date to the total estimated hours required to complete the contract. Profit estimates on long-term contracts are revised periodically based on changes in circumstances, and any losses on contracts are recognized in the period that such losses become evident. Generally, the terms of long-term contracts provide for progress billings based on completion of milestones or other defined
32
Table of Contents
phases of work. Significant judgment is often required when estimating total hours and progress to completion on these arrangements, as well as whether a loss is expected to be incurred on the contract due to several factors including the degree of customization required and the customer's existing environment. We use historical experience, project plans, and an assessment of the risks and uncertainties inherent in the arrangement to establish these estimates. Uncertainties in these arrangements include implementation delays or performance issues that may or may not be within our control.
Our SaaS offerings generally provide customers access to certain of our software within a cloud-based information technology environment that we manage and offer to customers on a subscription basis. We recognize revenue for subscription and related support services over the contract period originating when the subscription service is made available to the customer and the contractual hosting period has commenced.
We extend customary trade payment terms to our customers in the normal course of conducting business. To assess the probability of collection for purposes of revenue recognition, we have established credit policies that establish prudent credit limits for our customers. These credit limits are based upon our risk assessment of the customer's ability to pay, their payment history, geographic risk, and other factors, and are not contingent upon the resale of the product or upon the collection of payments from their customers. These credit limits are reviewed and revised periodically on the basis of updated customer financial statement information, payment performance, and other factors. When a customer is not deemed creditworthy, revenue is recognized when payment is received.
We record provisions for estimated product returns in the same period in which the associated revenue is recognized. We base these estimates of product returns upon historical levels of sales returns and other known factors. Actual product returns could be different from our estimates and current or future provisions for product returns may differ from historical provisions. Concessions granted to customers are recorded as reductions to revenue in the period in which they were granted and have been minimal in both amount and frequency.
Product revenue derived from shipments to resellers and OEMs who purchase our products for resale are generally recognized when such products are shipped (on a "sell-in" basis) since we do not expect our resellers or OEMs to carry inventory of our products. This policy is predicated on our ability to estimate sales returns as well as other criteria regarding these customers. We are also required to evaluate whether our resellers and OEMs have the ability to honor their commitment to make fixed or determinable payments regardless of whether they collect payment from their customers. In this regard, we assess whether our resellers and OEMs are new, poorly capitalized, or experiencing financial difficulty, and whether they have a pattern of not paying as amounts become due on previous arrangements or seeking payment terms longer than those provided to end customers. If we were to change any of these assumptions or judgments, it could cause a material change to the revenue reported in a particular period. We have historically experienced insignificant product returns from resellers and OEMs, and our payment terms for these customers are similar to those granted to our end-users. Our policy also presumes that we have no significant performance obligations in connection with the sale of our products by our resellers and OEMs to their customers. If a reseller or OEM develops a pattern of payment delinquency, or seeks payment terms longer than generally granted to our resellers or OEMs, we defer the recognition of revenue from transactions with that reseller or OEM until the receipt of cash.
Multiple contracts with a single counterparty executed within close proximity of each other are evaluated to determine if the contracts should be combined and accounted for as a single arrangement. We record reimbursements from customers for out-of-pocket expenses as revenue. Shipping and handling fees and expenses that are billed to customers are recognized in revenue and the costs associated with such fees and expenses are recorded in cost of revenue. Historically, these fees and expenses have not been material. Taxes collected from customers and remitted to government authorities are excluded from revenue.
For multiple-element arrangements that contain software and software related elements for which we are unable to establish VSOE of one or more elements, we use various available indicators of fair value and apply our best judgment to reasonably classify the arrangement's revenue into product revenue and service revenue for financial reporting purposes.
Allowance for Doubtful Accounts
We estimate the collectability of our accounts receivable balances each accounting period and adjust our allowance for doubtful accounts accordingly. We exercise a considerable amount of judgment in assessing the collectability of accounts receivable, including consideration of the creditworthiness of each customer, their collection history, and the related aging of past due accounts receivable balances. We evaluate specific accounts when we learn that a customer may be experiencing a deterioration of its financial condition due to lower credit ratings, bankruptcy, or other factors that may affect its ability to render payment.
Accounting for Business Combinations
33
Table of Contents
We allocate the purchase price of acquired companies to the tangible and intangible assets acquired, including in-process research and development assets, and liabilities assumed, based upon their estimated fair values at the acquisition date. These fair values are typically estimated with assistance from independent valuation specialists. The purchase price allocation process requires us to make significant estimates and assumptions, especially at the acquisition date with respect to intangible assets, contractual support obligations assumed, and pre-acquisition contingencies.
Although we believe the assumptions and estimates we have made in the past have been reasonable and appropriate, they are based in part on historical experience and information obtained from the management of the acquired companies and are inherently uncertain.
Examples of critical estimates in valuing certain of the intangible assets we have acquired or may acquire in the future include but are not limited to:
• | future expected cash flows from software license sales, support agreements, consulting contracts, other customer contracts, and acquired developed technologies; |
• | expected costs to develop in-process research and development into commercially viable products and estimated cash flows from the projects when completed; |
• | the acquired company's brand and competitive position, as well as assumptions about the period of time the acquired brand will continue to be used in the combined company's product portfolio; |
• | cost of capital and discount rates; and |
• | estimating the useful lives of acquired assets as well as the pattern or manner in which the assets will amortize. |
In connection with the purchase price allocations for applicable acquisitions, we estimate the fair value of the contractual support obligations we are assuming from the acquired business. The estimated fair value of the support obligations is determined utilizing a cost build-up approach, which determines fair value by estimating the costs related to fulfilling the obligations plus a reasonable profit margin. The estimated costs to fulfill the support obligations are based on the historical direct costs related to providing the support services. The sum of these costs and operating profit represents an approximation of the amount that we would be required to pay a third party to assume the support obligations.
Impairment of Goodwill and Other Intangible Assets
We test goodwill for impairment at the reporting unit level, which can be an operating segment or one level below an operating segment, on an annual basis as of November 1, or more frequently if changes in facts and circumstances indicate that impairment in the value of goodwill may exist. As of January 31, 2015, our reporting units are consistent with our operating segments identified in Note 18, "Segment, Geographic, and Significant Customer Information" to our consolidated financial statements included under Item 8 of this report.
We review goodwill for impairment utilizing either a qualitative assessment or a two-step process. If we decide that it is appropriate to perform a qualitative assessment and conclude that the fair value of a reporting unit more likely than not exceeds its carrying value, no further evaluation is necessary. For reporting units where we perform the two-step process, the first step requires us to estimate the fair value of each reporting unit and compare that fair value to the respective carrying value, which includes goodwill. If the fair value of the reporting unit exceeds its carrying value, the goodwill is not considered impaired and no further evaluation is necessary. If the carrying value is higher than the estimated fair value, there is an indication that impairment may exist and the second step is required. In the second step, the implied fair value of goodwill is calculated as the excess of the fair value of a reporting unit over the fair values assigned to its assets and liabilities. If the implied fair value of goodwill is less than the carrying value of the reporting unit's goodwill, the difference is recognized as an impairment charge.
For reporting units where we decide to perform a qualitative assessment, we assess and make judgments regarding a variety of factors which potentially impact the fair value of a reporting unit, including general economic conditions, industry and market-specific conditions, customer behavior, cost factors, our financial performance and trends, our strategies and business plans, capital requirements, management and personnel issues, and our stock price, among others. We then consider the totality of these and other factors, placing more weight on the events and circumstances that are judged to most affect a reporting unit's fair value or the carrying amount of its net assets, to reach a qualitative conclusion regarding whether it is more likely than not that the fair value of a reporting unit exceeds its carrying amount.
34
Table of Contents
For reporting units where we perform the two-step process, we utilize some or all of three primary approaches to assess fair value: (a) an income-based approach, using projected discounted cash flows, (b) a market-based approach, using multiples of comparable companies, and (c) a transaction-based approach, using multiples for recent acquisitions of similar businesses made in the marketplace.
Our estimate of fair value of each reporting unit is based on a number of subjective factors, including: (a) appropriate consideration of valuation approaches (income approach, comparable public company approach, and comparable transaction approach), (b) estimates of future growth rates, (c) estimates of our future cost structure, (d) discount rates for our estimated cash flows, (e) selection of peer group companies for the comparable public company and the comparable transaction approaches, (f) required levels of working capital, (g) assumed terminal value, and (h) time horizon of cash flow forecasts.
The determination of reporting units also requires judgment. We assess whether a reporting unit exists within a reportable segment by identifying the unit, determining whether the unit qualifies as a business under GAAP, and assessing the availability and regular review by segment management of discrete financial information for the unit.
We review intangible assets that have finite useful lives and other long-lived assets when an event occurs indicating the potential for impairment. If any indicators are present, we perform a recoverability test by comparing the sum of the estimated undiscounted future cash flows attributable to the assets in question to their carrying amounts. If the undiscounted cash flows used in the test for recoverability are less than the long-lived assets carrying amount, we determine the fair value of the long-lived asset and recognize an impairment loss if the carrying amount of the long-lived asset exceeds its fair value. The impairment loss recognized is the amount by which the carrying amount of the long-lived asset exceeds its fair value.
For all of our goodwill and other intangible asset impairment reviews, the assumptions and estimates used in the process are complex and often subjective. They can be affected by a variety of factors, including external factors such as industry and economic trends, and internal factors such as changes in our business strategy or our internal forecasts. Although we believe the assumptions, judgments, and estimates we have used in our assessments are reasonable and appropriate, a material change in any of our assumptions or external factors could lead to future goodwill or other intangible asset impairment charges.
Based upon our November 1, 2014 goodwill impairment reviews, we concluded that the estimated fair values of our Enterprise Intelligence and Communications Intelligence reporting units significantly exceeded their carrying values. Our Enterprise Intelligence and Communications Intelligence reporting units carried goodwill of $1.1 billion and $101.3 million , respectively, at January 31, 2015. The estimated fair value of our Video Intelligence reporting unit was approximately 20% greater than its carrying value, which included $38.0 million of goodwill at January 31, 2015, and we have therefore concluded that this reporting unit is at more than remote risk of failing step one of future goodwill impairment tests, and is therefore at risk of future impairment in the event of significant unfavorable changes in the assumptions used in our impairment review, including the weighted average cost of capital (discount rate) and growth rates utilized in our discounted cash flow analysis. Although we believe that our current estimates are reasonable and appropriate, our Video Intelligence reporting unit competes in a challenging environment and there can be no assurance that the estimates and assumptions made for purposes of our goodwill impairment test will prove to be accurate predictions of future performance. Delays or declines in spending to install, upgrade or maintain security intelligence systems, technological changes, new competitors, or changes in buying patterns from key customers are examples of circumstances that could adversely impact the fair value of our Video Intelligence reporting unit.
We did not record any impairments of goodwill for the years ended January 31, 2015, 2014 or 2013.
Income Taxes
We account for income taxes under the asset and liability method which includes the recognition of deferred tax assets and liabilities for the expected future tax consequences of events that have been included in our consolidated financial statements. Under this approach, deferred taxes are recorded for the future tax consequences expected to occur when the reported amounts of assets and liabilities are recovered or paid. The provision for income taxes represents income taxes paid or payable for the current year plus deferred taxes. Deferred taxes result from differences between the financial statement and tax bases of our assets and liabilities, and are adjusted for changes in tax rates and tax laws when changes are enacted. The effects of future changes in income tax laws or rates are not anticipated.
We are subject to income taxes in the United States and numerous foreign jurisdictions. The calculation of our tax provision involves the application of complex tax laws and requires significant judgment and estimates.
We evaluate the realizability of our deferred tax assets for each jurisdiction in which we operate at each reporting date, and we establish a valuation allowance when it is more likely than not that all or a portion of our deferred tax assets will not be
35
Table of Contents
realized. The ultimate realization of deferred tax assets is dependent upon the generation of future taxable income of the same character and in the same jurisdiction. We consider all available positive and negative evidence in making this assessment, including, but not limited to, the scheduled reversal of deferred tax liabilities, projected future taxable income, and tax planning strategies. In circumstances where there is sufficient negative evidence indicating that our deferred tax assets are not more likely than not realizable, we establish a valuation allowance.
We use a two-step approach to recognizing and measuring uncertain tax positions. The first step is to evaluate tax positions taken or expected to be taken in a tax return by assessing whether they are more likely than not sustainable, based solely on their technical merits, upon examination, and including resolution of any related appeals or litigation process. The second step is to measure the associated tax benefit of each position as the largest amount that we believe is more likely than not realizable. Differences between the amount of tax benefits taken or expected to be taken in our income tax returns and the amount of tax benefits recognized in our financial statements represent our unrecognized income tax benefits, which we either record as a liability or as a reduction of deferred tax assets. Our policy is to include interest (expense and/or income) and penalties related to unrecognized income tax benefits as a component of the provision for income taxes.
Contingencies
We recognize an estimated loss from a claim or loss contingency when and if information available prior to issuance of the financial statements indicates that it is probable that an asset has been impaired or a liability has been incurred at the date of the financial statements and the amount of the loss can be reasonably estimated. Accounting for claims and contingencies requires the use of significant judgment and estimates. One notable potential source of loss contingencies is pending or threatened litigation. Legal counsel and other advisors and experts are consulted on issues related to litigation as well as on matters related to contingencies occurring in the ordinary course of business.
Accounting for Stock-Based Compensation
We recognize the cost of employee services received in exchange for awards of equity instruments based on the grant-date fair value of the award.
During the three-year period ended January 31, 2015, restricted stock units were our predominant stock-based payment award. The fair value of these awards is equivalent to the market value of our common stock on the grant date. We have also occasionally awarded stock options, the fair value of which is estimated on the date of grant using an option-pricing model. We use the Black-Scholes option-pricing model for this purpose, which requires the input of significant assumptions including an estimate of the average period of time employees will retain stock options before exercising them, the estimated volatility of our common stock price over the expected term, the number of options that will ultimately be forfeited before completing vesting requirements, and the risk-free interest rate.
We periodically award restricted stock units that vest upon the achievement of specified performance goals. Our estimate of the fair value of these performance-based awards requires an assessment of the probability that the specified performance criteria will be achieved. At each reporting date, we update our assessment of the probability that the specified performance criteria will be achieved and adjust our estimate of the fair value of the award, if necessary.
Changes in assumptions can materially affect the estimate of fair value of stock-based compensation and, consequently, the related expense recognized. The assumptions we use in calculating the fair value of stock-based payment awards represent our best estimates, which involve inherent uncertainties and the application of judgment. As a result, if factors change and we use different assumptions, our stock-based compensation expense could be materially different in the future.
Cost of Revenue
We have made an accounting policy election whereby certain costs of product revenue, including hardware and third-party software license fees, are capitalized and amortized over the same period that product revenue is recognized, while installation and other service costs are generally expensed as incurred, except for certain contracts recognized according to contract accounting.
For example, in a multiple-element arrangement where revenue is recognized over the PCS support period, the cost of revenue associated with the product is capitalized upon product delivery and amortized over that same period. However, the cost of revenue associated with the services is expensed as incurred in the period in which the services are performed. In addition, we expense customer acquisition and origination costs to selling, general and administrative expense, including sales commissions,
36
Table of Contents
as incurred, with the exception of certain sales referral fees in our Communications Intelligence segment which are capitalized and amortized ratably over the revenue recognition period.
Results of Operations
Seasonality and Cyclicality
As is typical for many software and technology companies, our business is subject to seasonal and cyclical factors. Our revenue and operating income are typically highest in the fourth quarter and lowest in the first quarter (prior to the impact of unusual or nonrecurring items). Moreover, revenue and operating income in the first quarter of a new year may be lower than in the fourth quarter of the preceding year, potentially by a significant margin. In addition, we generally receive a higher volume of orders in the last month of a quarter, with orders concentrated in the later part of that month. We believe that these seasonal and cyclical factors primarily reflect customer spending patterns and budget cycles, as well as the impact of incentive compensation plans for our sales personnel. While seasonal and cyclical factors such as these are common in the software and technology industry, this pattern should not be considered a reliable indicator of our future revenue or financial performance. Many other factors, including general economic conditions, may also have an impact on our business and financial results.
Overview of Operating Results
|
| Year Ended January 31, | ||||||||||
(in thousands, except per share data) |
| 2015 |
| 2014 |
| 2013 | ||||||
Revenue |
| $ | 1,128,436 | |
| $ | 907,292 | |
| $ | 839,542 | |
Operating income |
| $ | 79,111 | |
| $ | 122,286 | |
| $ | 99,553 | |
Net income attributable to Verint Systems Inc. common shares |
| $ | 30,931 | |
| $ | 53,583 | |
| $ | 38,530 | |
Net income per common share attributable to Verint Systems Inc.: |
|
| |
|
|
|
| | ||||
Basic |
| $ | 0.53 | |
| $ | 1.01 | |
| $ | 0.97 | |
Diluted |
| $ | 0.52 | |
| $ | 0.99 | |
| $ | 0.96 | |
Year Ended January 31, 2015 compared to Year Ended January 31, 2014 . Our revenue increased approximately $221.1 million , or 24% , to $1,128.4 million in the year ended January 31, 2015 from $907.3 million in the year ended January 31, 2014 . In our Enterprise Intelligence segment, revenue increased approximately $159.8 million , or 32% , to $658.7 million in the year ended January 31, 2015 from $498.9 million in the year ended January 31, 2014 . The increase consisted of a $132.9 million increase in service and support revenue and a $26.9 million increase in product revenue. In our Communications Intelligence segment, revenue increased approximately $71.4 million , or 25% , from $288.0 million in the year ended January 31, 2014 to $359.4 million in the year ended January 31, 2015 . The increase consisted of a $54.9 million increase in product revenue and a $16.5 million increase in service and support revenue. In our Video Intelligence segment, revenue decreased approximately $10.0 million , or 8% , from $120.4 million in the year ended January 31, 2014 to $110.4 million in the year ended January 31, 2015 , primarily due to a decrease in product revenue. For additional details on our revenue by segment, see "-Revenue by Operating Segment". Revenue in the Americas, EMEA, and APAC represented approximately 52% , 31% , and 17% of our total revenue, respectively, in the year ended January 31, 2015 , compared to approximately 56% , 20% , and 24% , respectively, in the year ended January 31, 2014 . The change in the percentage of revenue by geographical region in the year ended January 31, 2015 compared to the year ended January 31, 2014 primarily reflected the timing of revenue recognized in those regions under several large contracts, primarily in our Communications Intelligence segment. Further details of changes in revenue are provided below.
Operating income was $79.1 million in the year ended January 31, 2015 compared to $122.3 million in the year ended January 31, 2014 . This decrease in operating income was primarily due to $155.6 million increase in operating expenses, from $478.6 million to $634.2 million , partially offset by a $112.4 million increase in gross profit from $600.9 million to $713.3 million . The increase in gross profit was primarily due to increased gross profit in our Enterprise Intelligence and Communication Intelligence segments. Despite the increase in gross profit, our overall gross margin decreased from 66% in the year ended January 31, 2014 to 63% in the year ended January 31, 2015 primarily due to a change in the mix of services attributable to a business combination in our Enterprise Intelligence segment that closed during the year ended January 31, 2015 . The increase in operating expenses consisted of a $87.9 million increase in selling, general and administrative expense, a $47.2 million increase in net research and development expenses, and a $20.5 million increase in amortization of other acquired intangible assets. Further details of changes in operating income are provided below.
37
Table of Contents
Net income attributable to Verint Systems Inc. common shares was $30.9 million , and diluted net income per common share was $0.52 , in the year ended January 31, 2015 compared to net income attributable to Verint Systems Inc. common shares of $53.6 million , and diluted net income per common share of $0.99 , in the year ended January 31, 2014 . The decrease in net income attributable to Verint Systems Inc. common shares and diluted net income per common share in the year ended January 31, 2015 was primarily due to our decreased operating income, as described above, a $6.9 million increase in interest expense, and a $2.6 million increase in losses upon early retirement of debt recorded during year ended January 31, 2015 compared to the year ended January 31, 2014 . These decreases to net income attributable to Verint Systems Inc. common shares were partially offset by and a $19.5 million decrease in our (benefit) provision for income taxes and a $10.7 million decrease in other expense, net. During the year ended January 31, 2015 , other expense, net, included net foreign currency losses of $13.4 million , partially offset by net gains on derivative instruments of $4.0 million . During the year ended January 31, 2014 , other expense, net, included a charge of $12.9 million for the derecognition of an indemnification asset associated with the resolution of an uncertain tax position previously recorded in connection with the CTI Merger and net foreign currency losses of $6.1 million. Further details of changes in total other expense, net, are provided below.
A portion of our business is conducted in currencies other than the U.S. dollar, and therefore our revenue and operating expenses are affected by fluctuations in applicable foreign currency exchange rates. When comparing average exchange rates for the year ended January 31, 2015 to average exchange rates for the year ended January 31, 2014 , while the U.S. dollar weakened relative to the British pound sterling and our hedged Israeli shekel rate, it strengthened relative to the euro, Australian dollar, Japanese yen, Brazilian real, and Singapore dollar, resulting in an overall decrease in our revenue and cost of revenue. For operating expenses, the impact of the weakened U.S. dollar relative to the British pound sterling and our hedged Israeli shekel rate was greater than the impact of the strengthening of the U.S. dollar against the euro, Australian dollar, Japanese yen, Brazilian real, and Singapore dollar, resulting in an increase in operating expenses on a U.S. dollar-denominated basis. For the year ended January 31, 2015 , had foreign exchange rates remained unchanged from rates in effect for the year ended January 31, 2014 , our revenue would have been approximately $4.2 million higher and our cost of revenue and operating expenses on a combined basis would have been approximately $3.8 million lower , which would have resulted in a $8.0 million increase in operating income.
During the three months ended January 31, 2015 , the U.S. dollar strengthened considerably relative to several foreign currencies, particularly the British pound sterling and the euro. For the three months ended January 31, 2015, had foreign exchange rates remained unchanged from rates in effect for the three months ended January 31, 2014 , our revenue would have been approximately $9.6 million higher and our cost of revenue and operating expenses on a combined basis would have been approximately $8.1 million higher, which would have resulted in a $1.5 million increase in operating income.
As of January 31, 2015, we employed approximately 4,800 employees, including part-time employees and certain contractors, as compared to approximately 3,400 at January 31, 2014. This increase was due to a combination of acquisitions and organic growth.
Year Ended January 31, 2014 compared to Year Ended January 31, 2013. Our revenue increased approximately $67.8 million, or 8%, to $907.3 million in the year ended January 31, 2014 from $839.5 million in the year ended January 31, 2013. In our Communications Intelligence segment, revenue increased approximately $58.4 million, or 25%, from $229.6 million in the year ended January 31, 2013 to $288.0 million in the year ended January 31, 2014. The increase consisted of a $39.5 million increase in product revenue and a $18.9 million increase in service and support revenue. In our Enterprise Intelligence segment, revenue increased approximately $8.4 million, or 2%, to $498.9 million in the year ended January 31, 2014 from $490.5 million in the year ended January 31, 2013. The increase consisted of a $22.0 million increase in service and support revenue, partially offset by a $13.6 million decrease in product revenue. In our Video Intelligence segment, revenue increased approximately $0.9 million, or 1%, from $119.5 million in the year ended January 31, 2013 to $120.4 million in the year ended January 31, 2014, primarily due to an increase in product revenue. For additional details on our revenue by segment, see "-Revenue by Operating Segment". Revenue in the Americas, EMEA, and APAC represented approximately 56%, 20%, and 24% of our total revenue, respectively, in the year ended January 31, 2014, compared to approximately 55%, 24%, and 21%, respectively, in the year ended January 31, 2013. Further details of changes in revenue are provided below.
Operating income was $122.3 million in the year ended January 31, 2014 compared to $99.6 million in the year ended January 31, 2013. This increase in operating income was primarily due to a $43.4 million increase in gross profit from $557.5 million to $600.9 million, partially offset by a $20.6 million increase in operating expenses, from $458.0 million to $478.6 million. The increase in gross profit was primarily due to increased gross profit in our Communications Intelligence segment. The increase in operating expenses consisted of a $9.8 million increase in selling, general and administrative expense, a $10.6 million increase in net research and development expenses, and a $0.2 million increase in amortization of other acquired intangible assets. Further details of changes in operating income are provided below.
38
Table of Contents
Net income attributable to Verint Systems Inc. common shares was $53.6 million, and diluted net income per common share was $0.99, in the year ended January 31, 2014 compared to net income attributable to Verint Systems Inc. common shares of $38.5 million, and diluted net income per common share of $0.96, in the year ended January 31, 2013. The increase in net income attributable to Verint Systems Inc. common shares and diluted net income per common share in the year ended January 31, 2014 was primarily due to our increased operating income, as described above, a $15.3 million decrease in dividends on preferred stock resulting from the cancellation of our Series A Convertible Perpetual Preferred Stock in connection with the CTI Merger, and a $4.4 million decrease in our provision for income taxes. These increases were partially offset by a $27.2 million increase in total other expense, net, due primarily to the derecognition of a $12.9 million indemnification asset due to the resolution of an uncertain tax position recorded in connection with the CTI Merger, a $7.0 million increase in foreign currency losses, net, and $9.9 million of losses upon early retirements of debt recorded during the year ended January 31, 2014, which primarily related to the early retirement of the term loan under the 2011 Credit Agreement. Further details of changes in total other expense, net, are provided below.
When comparing average exchange rates for the year ended January 31, 2014 to average exchange rates for the year ended January 31, 2013, while the U.S. dollar weakened relative to the Israeli shekel, it strengthened relative to the British pound sterling, Australian dollar, Japanese yen, and Brazilian real, resulting in an overall decrease in our revenue, cost of revenue and operating expenses on a U.S. dollar-denominated basis. For the year ended January 31, 2014, had foreign exchange rates remained unchanged from rates in effect for the year ended January 31, 2013, our revenue would have been approximately $2.2 million higher and our cost of revenue and operating expenses would have been approximately $0.1 million higher, which would have resulted in a $2.1 million increase in operating income.
As of January 31, 2014, we employed approximately 3,400 employees, including part-time employees and certain contractors, as compared to approximately 3,200 at January 31, 2013.
Revenue by Operating Segment
|
| Year Ended January 31, |
| % Change | ||||||||||||
(in thousands) |
| 2015 |
| 2014 |
| 2013 |
| 2015 - 2014 |
| 2014 - 2013 | ||||||
Enterprise Intelligence |
| $ | 658,671 | |
| $ | 498,901 | |
| $ | 490,478 | |
| 32% |
| 2% |
Communications Intelligence |
| 359,395 | |
| 288,003 | |
| 229,607 | |
| 25% |
| 25% | |||
Video Intelligence |
| 110,370 | |
| 120,388 | |
| 119,457 | |
| (8)% |
| 1% | |||
Total revenue |
| $ | 1,128,436 | |
| $ | 907,292 | |
| $ | 839,542 | |
| 24% |
| 8% |
Enterprise Intelligence Segment
Year Ended January 31, 2015 compared to Year Ended January 31, 2014 . Enterprise Intelligence revenue increased approximately $159.8 million , or 32% , from $498.9 million in the year ended January 31, 2014 to $658.7 million in the year ended January 31, 2015 . The increase consisted of a $132.9 million increase in service and support revenue and a $26.9 million increase in product revenue. The increase in service and support revenue was primarily due to an increase in our customer install base, both organically and through business combinations, and the related support revenue generated from this customer base during the year ended January 31, 2015 , as well as increased revenue from new service offerings in the year ended January 31, 2015 . The increase in product revenue was due to an increase in product sales to new customers during the year ended January 31, 2015 . The continued growth of service revenue is attributable to various factors, including an increase in services associated with customer product upgrades, a higher component of service offerings in our standard arrangements, and growth in our install base, both organic and as a result of business combinations. The aggregate value of executed license arrangements, which comprises the majority of our product revenue, can fluctuate from period to period.
Year Ended January 31, 2014 compared to Year Ended January 31, 2013. Enterprise Intelligence revenue increased approximately $8.4 million, or 2%, from $490.5 million in the year ended January 31, 2013 to $498.9 million in the year ended January 31, 2014. The increase consisted of a $22.0 million increase in service and support revenue, offset by a $13.6 million decrease in product revenue. The increase in service and support revenue was primarily due to an increase in our customer install base and the related support revenue generated from this customer base during the year ended January 31, 2014. The decrease in product revenue was primarily due to a decrease in product sales to new and existing customers during the year ended January 31, 2014. The continued growth of service revenue is attributable to various factors, including an increase in
39
Table of Contents
services associated with customer product upgrades, a higher component of service offerings in our standard arrangements, and growth in our install base.
Communications Intelligence Segment
Year Ended January 31, 2015 compared to Year Ended January 31, 2014 . Communications Intelligence revenue increased approximately $71.4 million , or 25% , from $288.0 million in the year ended January 31, 2014 to $359.4 million in the year ended January 31, 2015 . The increase consisted of a $54.9 million increase in product revenue and a $16.5 million increase in service and support revenue. The increase in product revenue was primarily due to an increase in product deliveries to customers and an increase in progress realized during the current year on projects with revenue recognized using the percentage of completion ("POC") method, some of which commenced in the previous fiscal year. The increase in service and support revenue was primarily attributable to an increase in progress realized during the current year on projects with revenue recognized using the POC method, some of which commenced in the previous fiscal year, and an increase in revenue from software-as-a-service ("SaaS") offerings.
Year Ended January 31, 2014 compared to Year Ended January 31, 2013. Communications Intelligence revenue increased approximately $58.4 million, or 25%, from $229.6 million in the year ended January 31, 2013 to $288.0 million in the year ended January 31, 2014. The increase consisted of a $39.5 million increase in product revenue and an $18.9 million increase in service and support revenue. Approximately $23.6 million of the increase in product revenue was primarily due to an increase in product deliveries to a single large customer. The remaining $15.9 million of the increase in product revenue was primarily due to an increase in progress realized during the current year on projects with revenue recognized using the POC method, some of which commenced in the previous fiscal year. The increase in service and support revenue was primarily attributable to an increase in the customer install base, the progress realized during the current year on projects with revenue recognized using the POC method, some of which commenced in the previous fiscal year, and revenue from new communications intelligence SaaS offerings.
Video Intelligence Segment
Year Ended January 31, 2015 compared to Year Ended January 31, 2014 . Video Intelligence revenue decreased approximately $10.0 million , or 8% , from $ 120.4 million in the year ended January 31, 2014 to $110.4 million in the year ended January 31, 2015 . The decrease was primarily attributable to a decrease in sales of certain hardware products to a single large customer during the year ended January 31, 2015 as compared to the year ended January 31, 2014 .
Year Ended January 31, 2014 compared to Year Ended January 31, 2013. Video Intelligence revenue increased approximately $0.9 million, or 1%, from $119.5 million in the year ended January 31, 2013 to $120.4 million in the year ended January 31, 2014. The increase was primarily attributable to a $0.8 million increase in product revenue, resulting largely from an increase in sales of certain hardware products to a single large customer during the year ended January 31, 2014 as compared to the year ended January 31, 2013, partially offset by a decrease in product deliveries to other customers in the year ended January 31, 2014 as compared to the year ended January 31, 2013.
Volume and Price
We sell products in multiple configurations, and the price of any particular product varies depending on the configuration of the product sold. Due to the variety of customized configurations for each product we sell, we are unable to quantify the amount of any revenue increases attributable to a change in the price of any particular product and/or a change in the number of products sold.
Product Revenue and Service and Support Revenue
We derive and report our revenue in two categories: (a) product revenue, including licensing of software products and sale of hardware products (which include software that works together with the hardware to deliver the product's essential functionality), and (b) service and support revenue, including revenue from installation services, post-contract customer support, project management, hosting services, SaaS, product warranties, and training services. For multiple-element arrangements for which we are unable to establish VSOE for one or more elements, we use various available indicators of fair value and apply our best judgment to reasonably classify the arrangement's revenue into product revenue and service and support revenue.
The following table sets forth product revenue and service and support revenue for the years ended January 31, 2015 , 2014 , and 2013:
40
Table of Contents
|
| Year Ended January 31, |
| % Change | ||||||||||||
(in thousands) |
| 2015 |
| 2014 |
| 2013 |
| 2015 - 2014 |
| 2014 - 2013 | ||||||
Product revenue |
| $ | 487,617 | |
| $ | 416,478 | |
| $ | 389,787 | |
| 17% |
| 7% |
Service and support revenue |
| 640,819 | |
| 490,814 | |
| 449,755 | |
| 31% |
| 9% | |||
Total revenue |
| $ | 1,128,436 | |
| $ | 907,292 | |
| $ | 839,542 | |
| 24% |
| 8% |
Product Revenue
Year Ended January 31, 2015 compared to Year Ended January 31, 2014 . Product revenue increased approximately $71.1 million , or 17% , from $416.5 million for the year ended January 31, 2014 to $487.6 million for the year ended January 31, 2015 , resulting from a $54.9 million increase in our Communications Intelligence segment and a $26.9 million increase in our Enterprise Intelligence segment, partially offset by a $10.7 million decrease in our Video Intelligence segment.
Year Ended January 31, 2014 compared to Year Ended January 31, 2013. Product revenue increased approximately $26.7 million, or 7%, from $389.8 million for the year ended January 31, 2013 to $416.5 million for the year ended January 31, 2014, resulting from a $39.5 million increase in our Communications Intelligence segment and a $0.8 million increase in our Video Intelligence segment, partially offset by a $13.6 million decrease in our Enterprise Intelligence segment.
For additional information see "-Revenue by Operating Segment".
Service and Support Revenue
Year Ended January 31, 2015 compared to Year Ended January 31, 2014 . Service and support revenue increased approximately $150.0 million , or 31% , from $490.8 million for the year ended January 31, 2014 to $640.8 million for the year ended January 31, 2015 . This increase was primarily attributable to increases of $132.9 million and $16.5 million in our Enterprise Intelligence and Communications Intelligence segments, respectively.
Year Ended January 31, 2014 compared to Year Ended January 31, 2013. Service and support revenue increased approximately $41.0 million, or 9%, from $449.8 million for the year ended January 31, 2013 to $490.8 million for the year ended January 31, 2014. This increase was primarily attributable to increases of $22.0 million and $18.9 million in our Enterprise Intelligence and Communications Intelligence segments, respectively.
For additional information see "- Revenue by Operating Segment".
Cost of Revenue
The following table sets forth cost of revenue by product and service and support, as well as amortization of acquired technology and backlog for the years ended January 31, 2015 , 2014 , and 2013:
|
| Year Ended January 31, |
| % Change | ||||||||||||
(in thousands) |
| 2015 |
| 2014 |
| 2013 |
| 2015 - 2014 |
| 2014 - 2013 | ||||||
Cost of product revenue |
| $ | 144,870 | |
| $ | 137,558 | |
| $ | 121,748 | |
| 5% |
| 13% |
Cost of service and support revenue |
| 239,274 | |
| 156,593 | |
| 145,444 | |
| 53% |
| 8% | |||
Amortization of acquired technology and backlog |
| 31,004 | |
| 12,269 | |
| 14,812 | |
| 153% |
| (17)% | |||
Total cost of revenue |
| $ | 415,148 | |
| $ | 306,420 | |
| $ | 282,004 | |
| 35% |
| 9% |
We exclude certain costs of both product revenue and service and support revenue, including shared support costs, stock-based compensation, and asset impairment charges, among others, when calculating our operating segment gross margins.
Cost of Product Revenue
Cost of product revenue primarily consists of hardware material costs and royalties due to third parties for software components that are embedded in our software solutions. When revenue is deferred, we also defer hardware material costs and third-party software royalties and recognize those costs over the same period that the product revenue is recognized. Cost of product revenue also includes amortization of capitalized software development costs, employee compensation and related expenses associated with our global operations, facility costs, and other allocated overhead expenses. In our Communications
41
Table of Contents
Intelligence segment, cost of product revenue also includes employee compensation and related expenses, contractor and consulting expenses, and travel expenses, in each case for resources dedicated to project management and associated product delivery.
Our product gross margins are impacted by the mix of products that we sell from period to period. As with many other technology companies, our software products tend to have higher gross margins than our hardware products.
Year Ended January 31, 2015 compared to Year Ended January 31, 2014 . Cost of product revenue increased approximately 5% from $137.6 million in the year ended January 31, 2014 to $144.9 million in the year ended January 31, 2015 . Our overall product gross margins increased to 70% in the year ended January 31, 2015 from 67% in the year ended January 31, 2014 . Product gross margins in our Enterprise Intelligence segment increased from 92% in the year ended January 31, 2014 to 94% in the year ended January 31, 2015 primarily due to a continued decrease in hardware sales as part of our product offerings. Product gross margins in our Communications Intelligence segment increased from 56% in the year ended January 31, 2014 to 61% in the year ended January 31, 2015 primarily due to a change in product mix. Product gross margins in our Video Intelligence segment increased to 59% in the year ended January 31, 2015 compared to 58% in the year ended January 31, 2014 due to a change in product mix.
Year Ended January 31, 2014 compared to Year Ended January 31, 2013. Cost of product revenue increased approximately 13% from $121.7 million in the year ended January 31, 2013 to $137.6 million in the year ended January 31, 2014. Our overall product gross margins decreased to 67% in the year ended January 31, 2014 from 69% in the year ended January 31, 2013. Product gross margins in our Enterprise Intelligence segment increased from 91% in the year ended January 31, 2013 to 92% in the year ended January 31, 2014 primarily as a result of lower third-party royalty expense, as well as a continued decrease in hardware sales as part of our product offerings. Product gross margins in our Communications Intelligence segment decreased from 57% in the year ended January 31, 2013 to 56% in the year ended January 31, 2014 primarily due to a change in product mix. Product gross margins in our Video Intelligence segment increased to 58% in the year ended January 31, 2014 compared to 57% in the year ended January 31, 2013 due to a change in product mix.
Cost of Service and Support Revenue
Cost of service and support revenue primarily consists of employee compensation and related expenses, contractor costs, and travel expenses relating to installation, training, consulting, and maintenance services. Cost of service and support revenue also includes stock-based compensation expenses, facility costs, and other overhead expenses. In accordance with GAAP
and our accounting policy, the cost of service and support revenue is generally expensed as incurred in the period in which the services are performed, with the exception of certain transactions accounted for using the POC method.
Year Ended January 31, 2015 compared to Year Ended January 31, 2014 . Cost of service and support revenue increased approximately 53% from $156.6 million in the year ended January 31, 2014 to $239.3 million in the year ended January 31, 2015 . Employee compensation and related expenses increased $51.3 million due primarily to increased headcount in our Enterprise Intelligence segment in connection with a business combination that closed during the year ended January 31, 2015 . Contractor costs, travel expense, and materials expense incurred to provide services increased $10.2 million, $5.2 million, and $8.2 million, respectively, primarily due to a business combination that closed during the year ended January 31, 2015 in our Enterprise Intelligence segment. Stock-based compensation expense increased $3.4 million resulting from an increase in average amounts of outstanding restricted stock units, and continued increases in our stock price, which impacts the total stock-based compensation to be recognized over the vesting periods. Our overall service and support gross margins decreased from 68% in the year ended January 31, 2014 to 63% in the year ended January 31, 2015 primarily due to a change in the mix of services in connection with a business combination that closed during the year ended January 31, 2015 in our Enterprise Intelligence segment.
Year Ended January 31, 2014 compared to Year Ended January 31, 2013. Cost of service and support revenue increased approximately 8% from $145.4 million in the year ended January 31, 2013 to $156.6 million in the year ended January 31, 2014. Employee compensation and related expenses increased $8.0 million, primarily driven by $5.2 million and $2.0 million increases in our Enterprise Intelligence and Communications Intelligence segments, respectively, reflecting an increase in employee headcount required to deliver the increased implementation services. Contractor costs increased $2.9 million, of which $2.7 million was due to increased use of contractors in our Enterprise Intelligence segment to deliver services during the year ended January 31, 2014 compared to the year ended January 31, 2013. These increases were partially offset by a $0.5 million decrease in travel costs primarily in our Enterprise Intelligence segment, and a $0.4 million decrease in stock-based compensation expense attributable to service and support employees. Our overall service and support gross margins were 68% in each of the years ended January 31, 2014 and 2013.
42
Table of Contents
Amortization of Acquired Technology and Backlog
Amortization of acquired technology and backlog consists of amortization of technology assets and customer backlog acquired in connection with business combinations.
Year Ended January 31, 2015 compared to Year Ended January 31, 2014 . Amortization of acquired technology and backlog increased approximately 153% from $12.3 million in the year ended January 31, 2014 to $31.0 million in the year ended January 31, 2015 primarily due to an increase in amortization expense of acquired technology-based intangible assets associated with business combinations that closed during the year ended January 31, 2015 .
Year Ended January 31, 2014 compared to Year Ended January 31, 2013. Amortization of acquired technology and backlog decreased approximately 17% from $14.8 million in the year ended January 31, 2013 to $12.3 million in the year ended January 31, 2014, primarily due to a reduction in amortization of acquired technology from a historical business combination, which became fully amortized during the year ended January 31, 2014, partially offset by an increase in amortization expense of acquired technology-based intangible assets associated with business combinations that closed during the year ended January 31, 2014.
Further discussion regarding our business combinations appears in Note 4, "Business Combinations" to our consolidated financial statements included under Item 8 of this report.
Research and Development, Net
Research and development expenses consist primarily of personnel and subcontracting expenses, facility costs, and other allocated overhead, net of certain software development costs that are capitalized as well as reimbursements under government programs. Software development costs are capitalized upon the establishment of technological feasibility and continue to be capitalized through the general release of the related software product.
The following table sets forth research and development, net for the years ended January 31, 2015 , 2014 , and 2013:
|
| Year Ended January 31, |
| % Change | ||||||||||||
(in thousands) |
| 2015 |
| 2014 |
| 2013 |
| 2015 - 2014 |
| 2014 - 2013 | ||||||
Research and development, net |
| $ | 173,748 | |
| $ | 126,539 | |
| $ | 115,906 | |
| 37% |
| 9% |
Year Ended January 31, 2015 compared to Year Ended January 31, 2014 . Research and development, net increased approximately $47.2 million , or 37% , from $126.5 million in the year ended January 31, 2014 to $173.7 million in the year ended January 31, 2015 . The increase was primarily attributable to an $37.0 million increase in employee compensation and related expenses due primarily to an increase in employee headcount in connection with business combinations that closed during the year ended January 31, 2015 in our Enterprise Intelligence and Communication Intelligence segments. Stock-based compensation expense increased $3.0 million resulting from an increase in average amounts of outstanding restricted stock units, and continued increases in our stock price, which impacts the total stock-based compensation to be recognized over the vesting periods. Contractor expense increased $2.4 million due to increased use of contractors for research and development activities in our Communications Intelligence segment during the year ended January 31, 2015 compared to the year ended January 31, 2014.
Year Ended January 31, 2014 compared to Year Ended January 31, 2013. Research and development, net increased approximately $10.6 million, or 9%, from $115.9 million in the year ended January 31, 2013 to $126.5 million in the year ended January 31, 2014. The increase was primarily attributable to a $6.8 million increase in employee compensation and related expenses, which resulted from increases in employee headcount in our Enterprise Intelligence and Communication Intelligence segments and merit increases to employee salaries, and a $2.1 million increase in contractor expense primarily due to increased use of contractors in our Communications Intelligence and Enterprise Intelligence segments during the year ended January 31, 2014 compared to the year ended January 31, 2013, as well as a $0.8 million increase in stock-based compensation resulting from an increase in average amounts of outstanding restricted stock units, and continued increases in our stock price, which impacts the total stock-based compensation to be recognized over the vesting periods, in each case associated with our research and development employees.
Selling, General and Administrative Expenses
43
Table of Contents
Selling, general and administrative expenses consist primarily of personnel costs and related expenses, professional fees, sales and marketing expenses, including travel, sales commissions and sales referral fees, facility costs, communication expenses, and other administrative expenses.
The following table sets forth selling, general and administrative expenses for the years ended January 31, 2015 , 2014 , and 2013:
|
| Year Ended January 31, |
| % Change | ||||||||||||
(in thousands) |
| 2015 |
| 2014 |
| 2013 |
| 2014 - 2013 |
| 2014 - 2013 | ||||||
Selling, general and administrative |
| $ | 415,266 | |
| $ | 327,385 | |
| $ | 317,637 | |
| 27% |
| 3% |
Year Ended January 31, 2015 compared to Year Ended January 31, 2014 . Selling, general and administrative expenses increased approximately $87.9 million , or 27% , from $327.4 million in the year ended January 31, 2014 to $415.3 million in the year ended January 31, 2015 . Employee compensation and related expenses increased $34.5 million due primarily to increased employee headcount in our Enterprise Intelligence and Communications Intelligence segments, as well as an increase in employee headcount for corporate support employees. Stock-based compensation expense increased $12.6 million due primarily to an increase in average amounts of outstanding restricted stock units, and continued increases in our stock price, which impacts the total stock-based compensation to be recognized over the vesting periods. Sales and marketing expense, travel expense, and facilities expense increased $3.8 million, $4.0 million, and $6.4 million, respectively, due primarily to business combinations that closed during the year ended January 31. 2015. Also contributing to the increase in selling, general, and administrative expense was a $9.9 million increase in agent commissions expense in our Communication Intelligence segment, a $5.6 million increase in contractor expense due primarily to increased use of contractors for corporate support activities, including acquisition and integration related expenses, and a $3.5 million increase in the change in fair value of our obligations under contingent consideration arrangements. These increases were partially offset by a decrease of $3.5 million in expenses from special performance incentives associated with a prior period business combination that were included in selling, general, and administrative expenses for the year ended January 31, 2014 with no equivalent expenses in the year ended January 31, 2015 .
Year Ended January 31, 2014 compared to Year Ended January 31, 2013. Selling, general and administrative expenses increased approximately $9.8 million, or 3%, from $317.6 million in the year ended January 31, 2013 to $327.4 million in the year ended January 31, 2014 primarily due to a $9.4 million increase in stock-based compensation resulting from an increase in average amounts of outstanding restricted stock units, and continued increases in our stock price, which impacts the total stock-based compensation to be recognized over the vesting periods, a $6.4 million increase in costs associated with business combinations, a decrease in the change in fair value of our obligations under contingent consideration arrangements (from a benefit of $6.2 million to a benefit of $2.5 million), resulting in a $3.7 million increase to selling, general, and administrative expenses, a $4.4 million increase in employee compensation and related expenses, $2.5 million of which was attributable to an increase in headcount in corporate support employees and the remainder due primarily to increased selling and marketing employee headcount in our Communications Intelligence segment. Also included in selling, general, and administrative
expenses for the year ended January 31, 2014 were $3.5 million of special performance incentives associated with a prior period business combination. These increases were partially offset by a $15.5 million decrease in professional fees incurred in connection with the CTI Merger, and a $2.0 million decrease in contractor expense primarily due to decreased use of contractors for corporate support services.
Amortization of Other Acquired Intangible Assets
Amortization of other acquired intangible assets consists of amortization of certain intangible assets acquired in connection with business combinations, including customer relationships, distribution networks, trade names and non-compete agreements.
The following table sets forth amortization of other acquired intangible assets for the years ended January 31, 2015 , 2014 , and 2013:
|
| Year Ended January 31, |
| % Change | ||||||||||||
(in thousands) |
| 2015 |
| 2014 |
| 2013 |
| 2015 - 2014 |
| 2014 - 2013 | ||||||
Amortization of other acquired intangible assets |
| $ | 45,163 | |
| $ | 24,662 | |
| $ | 24,442 | |
| 83% |
| 1% |
Year Ended January 31, 2015 compared to Year Ended January 31, 2014 . Amortization of other acquired intangible assets increased approximately $20.5 million , or 83% , from $24.7 million in the year ended January 31, 2014 to $45.2 million in the
44
Table of Contents
year ended January 31, 2015 primarily due to amortization associated with business combinations that closed during the year ended January 31, 2015 .
Year Ended January 31, 2014 compared to Year Ended January 31, 2013. Amortization of other acquired intangible assets did not materially change in the year ended January 31, 2014 compared to the year ended January 31, 2013. Amortization associated with business combinations that closed during the year ended January 31, 2014 was approximately $0.4 million, which was offset by the impact of the strengthening of the foreign currencies in which some of our intangible assets are denominated during the year ended January 31, 2014 relative to the year ended January 31, 2013.
Further discussion regarding our business combinations appears in Note 4, "Business Combinations" to our consolidated financial statements included under Item 8 of this report.
Other Income (Expense), Net
The following table sets forth total other expense, net for the years ended January 31, 2015 , 2014 , and 2013:
|
| Year Ended January 31, |
| % Change | ||||||||||||
(in thousands) |
| 2015 |
| 2014 |
| 2013 |
| 2015 - 2014 |
| 2014 - 2013 | ||||||
Interest income |
| $ | 1,070 | |
| $ | 963 | |
| $ | 531 | |
| 11% |
| 81% |
Interest expense |
| (36,661 | ) |
| (29,780 | ) |
| (31,034 | ) |
| 23% | | (4)% | |||
Losses on early retirements of debt |
| (12,546 | ) |
| (9,879 | ) |
| - | |
| 27% | | * | |||
Other income (expense): |
|
| |
|
| |
|
| |
| | | | |||
Foreign currency (losses) gains |
| (13,402 | ) |
| (6,057 | ) |
| 960 | |
| 121% | | * | |||
Gains (losses) on derivatives |
| 3,986 | |
| 345 | |
| (399 | ) |
| * | | (186)% | |||
Derecognition of indemnification asset related to CTI Merger |
| - | |
| (12,874 | ) |
| - | |
| * |
| * | |||
Other, net |
| (155 | ) |
| (1,689 | ) |
| (1,847 | ) |
| (91)% | | (9)% | |||
Total other income (expense) |
| (9,571 | ) |
| (20,275 | ) |
| (1,286 | ) |
| (53)% | | * | |||
Total other expense, net |
| $ | (57,708 | ) |
| $ | (58,971 | ) |
| $ | (31,789 | ) |
| (2)% | | 86% |
* Percentage is not meaningful.
Year Ended January 31, 2015 compared to Year Ended January 31, 2014 . Total other expense, net, decreased by $1.3 million from $59.0 million in the year ended January 31, 2014 to $57.7 million in the year ended January 31, 2015 .
During the year ended January 31, 2015 , we recorded $12.5 million of losses upon early retirements of debt. Of this amount, $7.1 million was recorded in connection with the early retirement of the March 2013 Term Loans (defined below), and $5.5 million was recorded in connection with the early retirement of $530.0 million of the February 2014 Term Loans and March 2014 Term Loans (defined below). Further discussion regarding our credit facilities appears in Note 6, "Long-term Debt" to our consolidated financial statements included under Item 8 of this report.
Interest expense increased to $36.7 million in the year ended January 31, 2015 from $29.8 million in the year ended January 31, 2014 primarily due to incremental borrowings discussed in Note 6, "Long-term Debt" to our consolidated financial statements included under Item 8 of this report.
We recorded $13.4 million of net foreign currency losses in the year ended January 31, 2015 compared to $6.1 million of net losses in the year ended January 31, 2014 . Foreign currency losses in the year ended January 31, 2015 resulted primarily from (i) strengthening of the U.S. dollar against the British pound sterling, resulting in foreign currency losses on U.S. dollar-denominated net liabilities in certain entities which use a British pound sterling functional currency, (ii) weakening of the euro against the British pound sterling, resulting in foreign currency losses on euro-denominated net assets in certain entities which use a British pound sterling functional currency, and (iii) strengthening of the U.S. dollar against the Singapore dollar, resulting in foreign currency losses on Singapore dollar-denominated net assets in certain entities which use a U.S. dollar functional currency. Of the $13.4 million of net foreign currency losses in the year ended January 31, 2015 , $12.4 million were recorded during the three months ended January 31, 2015.
In the year ended January 31, 2015 , there were net gains on derivative financial instruments (not designated as hedging instruments) of $4.0 million , compared to net gains of $0.3 million on such instruments for the year ended January 31, 2014 .
45
Table of Contents
The higher net gains in the current year reflected gains on contracts executed to hedge movements in the exchange rate between the U.S. dollar and the euro.
Other, net, expense decreased to $0.2 million in the year ended January 31, 2015 from $1.7 million in the year ended January 31, 2014 due to the inclusion of a $1.1 million write-off of an indemnification asset associated with tax liabilities recorded in connection with the CTI Merger in the year ended January 31, 2014 , with no comparable expense in the year ended January 31, 2015 .
Year Ended January 31, 2014 compared to Year Ended January 31, 2013. Total other expense, net, increased by $27.2 million from $31.8 million in the year ended January 31, 2013 to $59.0 million in the year ended January 31, 2014. During the year ended January 31, 2014, we recorded $9.9 million of losses upon early retirements of debt, which primarily related to the early retirement of the term loan under our prior credit agreement. There were no such losses recognized during the year ended January 31, 2013. Further discussion regarding our credit facilities appears in Note 6, "Long-term Debt" to our consolidated financial statements included under Item 8 of this report.
Interest expense decreased to $29.8 million in the year ended January 31, 2014 from $31.0 million in the year ended January 31, 2013 primarily due to lower interest rates on borrowings under our Credit Agreement, resulting from a March 2013 amendment to the Credit Agreement. Further discussion regarding our credit facilities appears in Note 6, "Long-term Debt" to our consolidated financial statements included under Item 8 of this report.
We recorded $6.1 million of net foreign currency losses in the year ended January 31, 2014 compared to $1.0 million of net gains in the year ended January 31, 2013. Foreign currency losses in the year ended January 31, 2014 resulted primarily from (i) strengthening of the U.S. dollar against the Singapore dollar, resulting in foreign currency losses on Singapore dollar-denominated net assets in certain entities which use a U.S. dollar functional currency, (ii) weakening of the U.S. dollar against the Israeli shekel, resulting in foreign currency losses on Israeli shekel-denominated net liabilities in certain entities which use a U.S. dollar functional currency, (iii) weakening of the euro against the British pound sterling, resulting in foreign currency losses on euro-denominated net assets in certain entities which use a British pound sterling functional currency, and (iv) weakening of the Japanese yen against the U.S. dollar, resulting in foreign currency losses on U.S. dollar-denominated net liabilities in certain entities which use a Japanese yen functional currency.
In the year ended January 31, 2014, we recorded a charge of $12.9 million for the derecognition of an indemnification asset associated with the resolution of an uncertain tax position previously recorded in connection with the CTI Merger. At the closing of the CTI Merger, we recorded indemnification assets in amounts corresponding to CTI's liabilities for uncertain tax positions, recognizing Comverse's contractual obligation to indemnify us for these potential liabilities. If an uncertain tax position liability is required to be subsequently reversed, the reversal is generally recorded as a reduction to the provision for income taxes. The reversal of the corresponding indemnification asset is reflected within other income (expense), net. Accordingly, the $12.9 million charge to other income (expense) was substantially offset by a reduction to our provision for income taxes. Please refer also to the discussion under "(Benefit) Provision for Income Taxes", below. Further information regarding the CTI Merger appears in Note 15, "Merger with CTI" to our consolidated financial statements included under Item 8 of this report.
(Benefit) Provision for Income Taxes
The following table sets forth our (benefit) provision for income taxes for the years ended January 31, 2015 , 2014 , and 2013:
|
| Year Ended January 31, |
| % Change | |||||||||||||
(in thousands) |
| 2015 |
| 2014 |
| 2013 |
| 2015 - 2014 |
| 2014 - 2013 | |||||||
(Benefit) provision for income taxes |
| $ | (14,999 | ) |
| $ | 4,539 | |
| $ | 8,960 | |
| * |
| (49 | )% |
* Percentage is not meaningful.
Year Ended January 31, 2015 compared to Year Ended January 31, 2014 . Our effective income tax rate was (70.1)% for the year ended January 31, 2015 , compared to 7.2% for the year ended January 31, 2014 . For the year ended January 31, 2015 , our effective income tax rate was lower than the U.S. federal statutory income tax rate of 35% primarily due to the release of $44.4 million of Verint valuation allowances. We maintain valuation allowances on our net U.S. deferred income tax assets related to federal and certain state jurisdictions. In connection with the acquisition of KANA on February 3, 2014, we recorded deferred income tax liabilities primarily attributable to acquired intangible assets to the extent the amortization will not be deductible for income tax purposes. Under accounting guidelines, because the amortization of the intangible assets in future periods provides a source of taxable income, we expect to realize a portion of our existing deferred income tax assets. As such, we reduced the
46
Table of Contents
valuation allowance recorded on our deferred income tax assets to the extent of the deferred income tax liabilities recorded. Because the valuation allowance related to existing Verint deferred income tax assets, the impact of the release was reflected as a discrete income tax benefit and not as a component of the KANA acquisition accounting. The effective income tax rate was also affected by the mix and levels of income and losses among taxing jurisdictions, changes in unrecognized income tax benefits, and the recording of a valuation allowance on certain income tax attributes of a foreign subsidiary where we do not expect to realize the benefits. Pre-tax income in our profitable jurisdictions, where we recorded income tax provisions at rates lower than the U.S. federal statutory income tax rate, was substantially offset by our domestic losses where we maintain valuation allowances and did not record the related income tax benefits. The result was an income tax benefit of $15.0 million on $21.4 million of pre-tax income, resulting in an income tax benefit rate of 70.1% . For the year ended January 31, 2014 , our effective income tax rate was lower than the U.S. federal statutory income tax rate of 35% primarily due to the level and mix of income and losses by jurisdiction and an income tax benefit of $12.4 million for the reversal of unrecognized tax benefits established in connection with the CTI Merger. The recognition of the CTI income tax benefits resulted in a charge within other income (expense), net due to the write-off of an indemnification asset. Pre-tax income in our profitable jurisdictions, where we recorded income tax provisions at rates lower than the U.S. federal statutory income tax rate, was partially offset by our domestic losses where we maintain valuation allowances and did not record the related income tax benefits. The result was an income tax provision of $4.5 million on $63.3 million of pre-tax income, which represented an effective income tax rate of 7.2% .
Year Ended January 31, 2014 compared to Year Ended January 31, 2013. Our effective income tax rate was 7.2% for the year ended January 31, 2014, compared to 13.2% for the year ended January 31, 2013. For the year ended January 31, 2014, our effective income tax rate was lower than the U.S. federal statutory income tax rate of 35% primarily due to the mix and levels of income and losses by jurisdiction and an income tax benefit of $12.4 million for the reversal of unrecognized tax benefits established in connection with the CTI Merger. The recognition of the CTI tax benefits resulted in a charge within other income (expense), net due to the write-off of an indemnification asset. Pre-tax income in our profitable jurisdictions, where we recorded income tax provisions at rates lower than the U.S. federal statutory income tax rate, was partially offset by our domestic losses where we maintain valuation allowances and did not record the related income tax benefits. The result was an income tax provision of $4.5 million on $63.3 million of pre-tax income, resulting in an effective income tax rate of 7.2%. For the year ended January 31, 2013, our effective income tax rate was lower than the U.S. federal statutory income tax rate of 35% primarily due to the level and mix of income and losses by jurisdiction, partially offset by the write-off of certain income tax attributes resulting from the merger of certain foreign subsidiaries, an increase in unrecognized income tax benefits and an increase in the valuation allowance. Pre-tax income in our profitable jurisdictions, where we recorded income tax provisions at rates lower than the U.S. federal statutory income tax rate, was partially offset by our domestic losses where we maintain valuation allowances and did not record the related income tax benefits. The result was an income tax provision of $9.0 million on $67.8 million of pre-tax income, which represented an effective income tax rate of 13.2%.
The comparison of our effective income tax rates between periods is significantly impacted by the level and mix of earnings and losses by tax jurisdiction, foreign income tax rate differentials, amount of permanent book to tax differences, the impact of unrecognized tax benefits, and the effects of valuation allowances on certain loss jurisdictions.
Backlog
The delivery cycles of most of our products are generally very short, ranging from days to several months, with the exception of certain projects with multiple deliverables over longer periods of time. Therefore, we do not view backlog as a meaningful indicator of future business activity and do not consider it a meaningful financial metric for evaluating our business.
Liquidity and Capital Resources
Overview
Our primary recurring source of cash is the collection of proceeds from the sale of products and services to our customers, including cash periodically collected in advance of delivery or performance.
Our primary recurring use of cash is payment of our operating costs, which consist primarily of employee-related expenses, such as compensation and benefits, as well as general operating expenses for marketing, facilities and overhead costs, and capital expenditures. We also utilize cash for debt service under our Credit Agreement and our Notes, and periodically for business acquisitions. Cash generated from operations, along with our existing cash, cash equivalents, and short-term investments, are our primary sources of operating liquidity, and we believe that our operating liquidity is sufficient to support our current business operations, including debt service and capital expenditure requirements.
47
Table of Contents
In February 2014, in connection with our acquisition of KANA, we borrowed $125.0 million under the revolving credit facility under our Credit Agreement (the "2013 Revolving Credit Facility") and we also incurred $300.0 million of incremental term loans under our Credit Agreement, both for purposes of funding a portion of the purchase price for KANA. In June 2014, we completed concurrent public offerings of 5,750,000 shares of our common stock and $400.0 million in aggregate principal amount of 1.50% convertible senior notes due June 1, 2021. The aggregate net proceeds from the concurrent offerings were $657.5 million, after deducting underwriters' discounts and commissions, but excluding other offering expenses. We used $15.6 million of the net proceeds to pay the net costs of an arrangement consisting of the purchase of call options and the sale of warrants to purchase our common stock, the intent of which is to reduce the potential dilution to our common stock upon conversion of the Notes. We used the majority of the remainder of the net proceeds to repay a portion of the outstanding indebtedness under our Credit Agreement. Also in June 2014, we amended our Credit Agreement to increase the lending commitments under our 2013 Revolving Credit Facility to $300.0 million and extended the facility's term by approximately six months to September 6, 2018. Further discussion of our Credit Agreement, Notes, call options and warrants appears below, under "Financing Arrangements".
We have historically expanded our business in part by investing in strategic growth initiatives, including acquisitions of products, technologies, and businesses. We have used cash as consideration for substantially all of our historical business acquisitions, including approximately $605 million of net cash expended for business acquisitions during the year ended January 31, 2015, comprised primarily of the acquisition of KANA in February 2014 and UTX in April 2014. The acquisition of KANA was funded through a combination of cash on hand, and as described above, incremental term loans and borrowings under our 2013 Revolving Credit Facility.
We continually examine our options with respect to terms and sources of existing and future short-term and long-term capital resources to enhance our operating results and to ensure that we retain financial flexibility, and may from time to time elect to raise additional equity or debt capital in the capital markets.
A considerable portion of our operating income is earned outside the United States. Cash, cash equivalents, short-term investments, and restricted cash and bank time deposits (including any long-term portions) held by our subsidiaries outside the United States were $297.2 million and $268.6 million as of January 31, 2015 and 2014, respectively, and are generally used to fund the subsidiaries' operating requirements and to invest in company growth initiatives, including business acquisitions. Cash on hand in the United States was utilized to fund a portion of the purchase price for KANA, and cash on hand outside of the United States was utilized to fund the purchase price for UTX. We currently do not anticipate that we will need funds generated from foreign operations to fund our domestic operations for the next 12 months and for the foreseeable future.
Should other circumstances arise whereby we require more capital in the United States than is generated by our domestic operations, or should we otherwise consider it in our best interests, we could repatriate future earnings from foreign jurisdictions, which could result in higher effective tax rates. If available, our NOLs, particularly those in the United States, could reduce potential income tax liabilities that may result from repatriated earnings from foreign jurisdictions to the United States. We generally have not provided for deferred income taxes on the excess of the amount for financial reporting over the tax basis of investments in our foreign subsidiaries because we currently plan to indefinitely reinvest such earnings outside the United States.
The following table sets forth our cash and cash equivalents, restricted cash and bank time deposits, short-term investments and long-term debt as of January 31, 2015 and 2014:
|
| January 31, | ||||||
(in thousands) |
| 2015 |
| 2014 | ||||
Cash and cash equivalents |
| $ | 285,072 | |
| $ | 378,618 | |
Restricted cash and bank time deposits |
| $ | 36,920 | |
| $ | 6,423 | |
Short-term investments |
| $ | 35,751 | |
| $ | 32,049 | |
Long-term debt |
| $ | 736,779 | |
| $ | 635,830 | |
At January 31, 2015 , our cash and cash equivalents totaled $285.1 million , a decrease of $ 93.5 million from $378.6 million at January 31, 2014 . Our February 2014 acquisition of KANA, which was partially financed with approximately $96.4 million of cash on hand, including closing costs, and our March 2014 acquisition of UTX, which was entirely financed with $82.9 million of cash on hand, significantly impacted our cash and cash equivalents during the year ended January 31, 2015.
48
Table of Contents
Our operating activities generated $ 193.7 million of cash during the year ended January 31, 2015 , which was partially offset by $ 281.1 million of net cash used in combined investing and financing activities during this period. Further discussion of these items appears below.
Consolidated Cash Flow Activity
The following table summarizes selected items from our consolidated statements of cash flows for the years ended January 31, 2015 , 2014 and 2013:
|
| Year Ended January 31, | ||||||||||
(in thousands) |
| 2015 |
| 2014 |
| 2013 | ||||||
Net cash provided by operating activities |
| $ | 193,725 | |
| $ | 178,284 | |
| $ | 123,385 | |
Net cash used in investing activities |
| (676,835 | ) |
| (64,196 | ) |
| (35,696 | ) | |||
Net cash provided by (used in) financing activities |
| 395,713 | |
| 54,534 | |
| (29,306 | ) | |||
Effect of exchange rate changes on cash and cash equivalents |
| (6,149 | ) |
| 23 | |
| 928 | | |||
Net (decrease) increase in cash and cash equivalents |
| $ | (93,546 | ) |
| $ | 168,645 | |
| $ | 59,311 | |
Net Cash Provided by Operating Activities
Net cash provided by operating activities is driven primarily by our net income, adjusted for non-cash items, and working capital changes. As our business grows and we generate higher revenue, we generally expect our operating cash flow to also increase. Operating activities generated $ 193.7 million of net cash during the year ended January 31, 2015 , compared to $ 178.3 million generated during the year ended January 31, 2014 . Our operating results for the year ended January 31, 2015 included $122.1 million of net non-cash expenses, compared to $97.3 million of net non-cash expenses in the prior year, so despite reporting lower net income in the year ended January 31, 2015 compared to the prior year, our operating cash flow improved.
Operating activities generated $178.3 million of net cash during the year ended January 31, 2014, compared to $123.4 million generated during the year ended January 31, 2013. The improved operating cash flow resulted primarily from our higher operating income in the year ended January 31, 2014, which contributed to higher accounts receivable collections and customer deposits, compared to the year ended January 31, 2013, and the impact of net income tax refunds of $1.7 million in the year ended January 31, 2014, compared to net income tax payments of $18.2 million in the prior year. The net income tax refunds in the year ended January 31, 2014 resulted principally from the impact of income tax refunds in Israel associated with prior periods' income tax returns.
Net Cash Used in Investing Activities
During the year ended January 31, 2015, our investing activities used $676.8 million of net cash, the primary component of which was $605.3 million of net cash utilized for business acquisitions, including the acquisitions of KANA in February 2014 and UTX in March 2014. We also had a $36.3 million increase in restricted cash and bank time deposits during this period. Restricted cash and bank time deposits are typically short-term deposits used to secure bank guarantees in connection with sales contracts, the amounts of which will fluctuate from period to period. The increase in restricted cash and bank time deposits during the year ended January 31, 2015 reflected deposits associated with several large sales contracts. In addition, we made $29.2 million of payments for property, equipment, and capitalized software development costs, and made $7.5 million of net purchases of short-term investments, during the year.
During the year ended January 31, 2014, our investing activities used $64.2 million of net cash, the primary components of which were $32.8 million of net cash utilized for business acquisitions, $22.4 million of payments for property, equipment, and capitalized software development costs, and $18.9 million of net purchases of short-term investments. We expanded our short-term investing activity during the year ended January 31, 2014 to increase returns on available funds provided by operating and financing activities. Partially offsetting these uses was a $7.7 million decrease in restricted cash and bank time deposits.
For the year ended January 31, 2013, our investing activities used $35.7 million of net cash, primarily reflecting $20.0 million of payments for property, equipment, and capitalized software development costs. We also purchased $13.6 million of short-term investments during this year.
We had no significant commitments for capital expenditures at January 31, 2015.
Net Cash Provided by (Used in) Financing Activities
49
Table of Contents
For the year ended January 31, 2015 , our financing activities provided $395.7 million of net cash. In connection with the February 2014 acquisition of KANA, we incurred $300.0 million of incremental term loans and borrowed $125.0 million under our 2013 Revolving Credit Facility. Additionally, in March 2014, we incurred $643.5 million of new term loans, the proceeds of which were used to repay $643.5 million of prior term loans. In June 2014, we completed concurrent public offerings of 5,750,000 shares of our common stock, gross proceeds from which were $274.6 million, and $400.0 million in aggregate principal amount of the Notes. We used $15.6 million of the net proceeds from these offerings to pay the net costs of an arrangement consisting of the purchase of call options and the sale of warrants to purchase our common stock, the intent of which is to reduce the potential dilution to our common stock upon conversion of the Notes. We used the majority of the remainder of the net proceeds to retire $530.0 million of the February 2014 Term Loans and March 2014 Term Loans, and all $106.0 million of then-outstanding borrowings under the 2013 Revolving Credit Facility. In connection with these various financing activities, we paid $29.2 million of debt and equity issuance costs, including underwriting discounts and commissions associated with the public offerings. Other financing activities during the year ended January 31, 2015 included payments of $10.4 million for the financing portion of payments under contingent consideration arrangements related to prior business combinations, and the receipt of $17.6 million of proceeds from exercises of stock options.
For the year ended January 31, 2014, our financing activities provided $54.5 million of net cash. During this period, we borrowed $646.7 million under our Credit Agreement (consisting of gross borrowings of $650.0 million, reduced by a $3.3 million original issuance discount), repaid $576.0 million of outstanding borrowings under our Credit Agreement, and paid $7.8 million of related debt issuance costs. We also received $10.4 million of cash in connection with the CTI Merger during this year. Other financing activities during the year ended January 31, 2014 included payments of $16.1 million for the financing portion of payments under contingent consideration arrangements related to prior business combinations, and the receipt of $10.9 million of proceeds from exercises of stock options.
During the year ended January 31, 2013, our financing activities used $29.3 million of net cash, the primary use of which was $22.0 million of repayments of borrowings, including an optional $15.0 million term loan payment. We also made payments of $6.5 million for the financing portion of payments under contingent consideration arrangements related to prior business combinations. These uses were partially offset by $2.6 million of proceeds from exercises of stock options.
Liquidity and Capital Resources Requirements
Based on past performance and current expectations, we believe that our cash, cash equivalents, short-term investments and cash generated from operations will be sufficient to meet anticipated operating costs, required payments of principal and interest, working capital needs, ordinary course capital expenditures, research and development spending, and other commitments for at least the next 12 months. Currently, we have no plans to pay any cash dividends on our common stock, which are not permitted under our Credit Agreement.
Our liquidity could be negatively impacted by a decrease in demand for our products and service and support, including the impact of changes in customer buying behavior due to circumstances over which we have no control. If we determine to make additional business acquisitions or otherwise require additional funds, we may need to raise additional capital, which could involve the issuance of additional equity or debt securities.
Financing Arrangements
1.50% Convertible Senior Notes
On June 18, 2014, we issued $400.0 million in aggregate principal amount of 1.50% convertible senior notes due June 1, 2021, unless earlier converted by the holders pursuant to their terms. The Notes pay interest in cash semiannually in arrears at a rate of 1.50% per annum.
The Notes were issued concurrently with our issuance of 5,750,000 shares of common stock, the majority of the combined net proceeds of which were used to partially repay certain indebtedness under our Credit Agreement, as further described below.
The Notes are unsecured and rank senior in right of payment to our indebtedness that is expressly subordinated in right of payment to the Notes; equal in right of payment to our indebtedness that is not so subordinated; effectively subordinated in right of payment to any of our secured indebtedness to the extent of the value of the assets securing such indebtedness; and structurally subordinated to indebtedness and other liabilities of our subsidiaries.
50
Table of Contents
The Notes are convertible into, at our election, cash, shares of common stock, or a combination of both, subject to satisfaction of specified conditions and during specified periods, as described below. If converted, we currently intend to pay cash in respect of the principal amount.
The conversion price of the Notes at any time is equal to $1,000 divided by the then-applicable conversion rate. The Notes have an initial conversion rate of 15.5129 shares of common stock per $1,000 principal amount of Notes, which represents an initial effective conversion price of approximately $64.46 per share of common stock and would result in the issuance of approximately 6,205,000 shares if all of the Notes were converted. Throughout the term of the Notes, the conversion rate may be adjusted upon the occurrence of certain events.
Holders may surrender their Notes for conversion at any time prior to the close of business on the business day immediately preceding December 1, 2020, only under the following circumstances:
• | during any calendar quarter commencing after the calendar quarter ending on September 30, 2014, if the closing sale price of our common stock, for at least 20 trading days (whether or not consecutive) in the period of 30 consecutive trading days ending on the last trading day of the immediately preceding calendar quarter, is more than 130% of the conversion price of the Notes in effect on each applicable trading day; |
• | during the ten consecutive trading-day period following any five consecutive trading-day period in which the trading price for the Notes for each such trading day was less than 98% of the closing sale price of our common stock on such date multiplied by the then-current conversion rate; or |
• | upon the occurrence of specified corporate events, as described in the indenture governing the Notes, such as a consolidation, merger, or binding share exchange. |
On or after December 1, 2020 until the close of business on the second scheduled trading day immediately preceding the
maturity date, holders may surrender their Notes for conversion regardless of whether any of the foregoing conditions have been satisfied.
If we satisfy our conversion obligation in solely cash or a combination of cash and shares of common stock, the amount of cash and shares of common stock, if any, due upon conversion will be based on a daily conversion value for each trading day in a 50 trading-day conversion period. Holders will not receive any additional cash payment or additional shares of common stock representing accrued and unpaid interest, if any, upon conversion of a Note, except in limited circumstances. Instead, interest will be deemed to be paid by the consideration delivered upon conversion of a Note.
The conversion rate for the Notes is subject to adjustment as described in the indenture governing the Notes. An adjustment to the conversion rate will result in a corresponding (but inverse) adjustment to the conversion price.
If specified "make-whole adjustment events" occur, the conversion rate for any Notes converted in connection with such make-whole adjustment event will, in specified circumstances, be increased by a number of additional shares of common stock. In addition, holders may require us to purchase for cash all or any portion of their Notes upon the occurrence of a "fundamental change" at a price equal to 100% of the principal amount of the Notes being purchased, plus accrued and unpaid interest to, but excluding, the fundamental change purchase date.
As of January 31, 2015, the Notes were not convertible.
Note Hedges and Warrants
Concurrently with the issuance of the Notes, we entered into convertible note hedge transactions (the "Note Hedges") and sold warrants (the "Warrants"). The combination of the Note Hedges and the Warrants serves to increase the effective initial conversion price for the Notes to $75.00 per share. The Note Hedges and Warrants are each separate instruments from the Notes.
Note Hedges
Pursuant to the Note Hedges, we purchased call options on our common stock, under which we have the right to acquire from the counterparties up to approximately 6,205,000 shares of our common stock, subject to customary anti-dilution adjustments, at a price of $64.46, which equals the initial conversion price of the Notes. Our exercise rights under the Note Hedges generally trigger upon conversion of the Notes and the Note Hedges terminate upon maturity of the Notes, or the first day the Notes are
51
Table of Contents
no longer outstanding. The Note Hedges may be settled in cash, shares of our common stock, or a combination thereof, at our option, and are intended to reduce our exposure to potential dilution upon conversion of the Notes. We paid $60.8 million for the Note Hedges, which was recorded as a reduction to additional paid-in capital. As of January 31, 2015, we had not purchased any shares under the Note Hedges.
Warrants
We sold the Warrants to several counterparties. The Warrants provide the counterparties rights to acquire from us up to approximately 6,205,000 shares of our common stock at a price of $75.00 per share. The Warrants expire incrementally on a series of expiration dates beginning in August 2021. At expiration, if the market price per share of our common stock exceeds the strike price of the Warrants, we will be obligated to issue shares of our common stock having a value equal to such excess. The proceeds from the sale of the Warrants were $45.2 million and were recorded as additional paid-in capital. As of January 31, 2015, no Warrants had been exercised and all Warrants remained outstanding.
Credit Agreements
As of January 31, 2014, our Credit Agreement provided for $850.0 million of senior secured credit facilities, including $650.0 million of term loans maturing in September 2019 (the "March 2013 Term Loans"), of which $645.1 million was outstanding at January 31, 2014, and a $200.0 million 2013 Revolving Credit Facility maturing in March 2018, under which there were no borrowings at January 31, 2014. The credit facility was subject to a maximum increase of $300.0 million and reduction from time to time.
As noted above, in February 2014, in connection with our acquisition of KANA, we borrowed $125.0 million under the 2013 Revolving Credit Facility and we also incurred $300.0 million under incremental term loans under an amendment to our Credit Agreement (the "February 2014 Term Loans"), both for purposes of funding a portion of the purchase price for KANA.
In March 2014, we refinanced the $643.5 million of outstanding March 2013 Term Loans with the proceeds of new term loans (the "March 2014 Term Loans"), primarily for purposes of reducing the interest rate on such loans. We also amended our Credit Agreement in February and March 2014 to, among other things, (i) change the basis for determining the interest rate on borrowings under the 2013 Revolving Credit Facility, (ii) increase the permitted amount of incremental term loans and revolving credit commitments (beyond the incremental term loans borrowed in February 2014) by up to an aggregate of $200.0 million plus an additional amount such that our leverage ratio (as defined in the Credit Agreement) would not exceed a specified maximum ratio, (iii) permit us to issue convertible indebtedness (as defined in the Credit Agreement), (iv) permit us to refinance all or a portion of any existing term loans with replacement term loans, and (v) extend by one year, to January 31, 2016, the step-down date of the leverage ratio covenant applicable to the 2013 Revolving Credit Facility.
On June 18, 2014, we utilized the majority of the combined net proceeds from the issuance of the Notes and the concurrent issuance of 5,750,000 shares of common stock to retire $530.0 million of the February 2014 Term Loans and March 2014 Term Loans, and to repay all $106.0 million of then-outstanding borrowings under the 2013 Revolving Credit Facility.
Also in June 2014, we further amended our Credit Agreement to increase the lending commitments under our 2013 Revolving Credit Facility to $300.0 million and extended the facility's term by approximately six months to September 6, 2018.
As of January 31, 2015, we had an aggregate $411.1 million of February 2014 Term Loans and March 2014 Term Loans outstanding, bearing interest at an annual rate of 3.50%. Following the partial retirements of the term loans in June 2014, there are no scheduled principal payments on the term loans until August 2016. The vast majority of the term loans are due upon maturity in September 2019. There were no outstanding borrowings under the 2013 Revolving Credit Facility at January 31, 2015.
The 2013 Revolving Credit Facility contains a financial covenant that requires us to maintain a ratio of Consolidated Total Debt to Consolidated EBITDA (each as defined in the Credit Agreement) of no greater than 5.00 to 1 until January 31, 2016 and no greater than 4.50 to 1 thereafter (the "Leverage Ratio Covenant"). At January 31, 2015, our consolidated leverage ratio was approximately 2.3 to 1 compared to a permitted consolidated leverage ratio of 5.00 to 1, and our EBITDA for the twelve-month period then ended exceeded by at least $140.0 million the minimum EBITDA required to satisfy the Leverage Ratio Covenant given our outstanding debt as of such date.
Obligations under our Credit Agreement are guaranteed by substantially all of our domestic subsidiaries and certain foreign subsidiaries that have elected to be disregarded for U.S. tax purposes, and are secured by security interests in substantially all of our and their assets, subject to certain exceptions detailed in the Credit Agreement and related ancillary documents.
52
Table of Contents
Our Credit Agreement provides for certain customary events of default with corresponding grace periods. These events of default include failure to pay principal or interest when due under the Credit Agreement, failure to comply with covenants, any representation or warranty made by us proving to be inaccurate in any material respect, defaults under certain other indebtedness of ours or our subsidiaries, the occurrence of a Change of Control (as defined in the Credit Agreement) with respect to us and certain insolvency or receivership events affecting us or our significant subsidiaries. Upon the occurrence of an event of default resulting from a violation of the Leverage Ratio Covenant, the lenders under our 2013 Revolving Credit Facility may require us to immediately repay outstanding borrowings under the facility and may terminate their commitments to provide loans under the facility. A violation of the Leverage Ratio Covenant would not, by itself, result in an event of default under the February 2014 Term Loans or March 2014 Term Loans, but may trigger a cross-default under the term loans in the event we are required to repay outstanding borrowings under the 2013 Revolving Credit Facility. Upon the occurrence of other events of default, the lenders may require us to immediately repay all outstanding borrowings under the Credit Agreement and the lenders under our 2013 Revolving Credit Facility may terminate their commitments to provide loans under the facility.
Contractual Obligations
At January 31, 2015, our contractual obligations were as follows:
|
| Payments Due by Period | ||||||||||||||||||
(in thousands) |
| Total |
| < 1 year |
| 1-3 years |
| 3-5 years |
| > 5 years | ||||||||||
Long-term debt obligations, including interest |
| $ | 920,147 | |
| $ | 20,621 | |
| $ | 47,388 | |
| $ | 443,138 | |
| $ | 409,000 | |
Operating lease obligations |
| 85,081 | |
| 15,383 | |
| 22,728 | |
| 15,017 | |
| 31,953 | | |||||
Purchase obligations |
| 57,534 | |
| 53,722 | |
| 3,812 | |
| - | |
| - | | |||||
Other long-term obligations |
| 951 | |
| 304 | |
| 313 | |
| 94 | |
| 240 | | |||||
Total contractual obligations |
| $ | 1,063,713 | |
| $ | 90,030 | |
| $ | 74,241 | |
| $ | 458,249 | |
| $ | 441,193 | |
The long-term debt obligations reflected above include projected interest payments over the term of our outstanding debt as of January 31, 2015, assuming interest rates in effect for our term loan borrowings as of January 31, 2015.
Operating lease obligations reflected above exclude future sublease income from certain space we have subleased to third parties. As of January 31, 2015, total expected future sublease income was $2.5 million and will range from $0.1 million to $1.1 million on an annual basis through August 2018.
On February 13, 2015, we entered into a new operating lease for a facility in Melville, New York, which we expect to occupy on or about November 1, 2015. The new Melville facility will serve as our corporate headquarters following the expiration of our existing corporate headquarters lease in November 2015. The aggregate minimum lease commitment over the term of this new lease, excluding operating expenses, is approximately $18.8 million. This operating lease commitment is not reflected in the table above.
Our purchase obligations are associated with agreements for purchases of goods or services generally including agreements that are enforceable and legally binding and that specify all significant terms, including fixed or minimum quantities to be purchased; fixed, minimum, or variable price provisions; and the approximate timing of the transactions. Agreements to purchase goods or services that have cancellation provisions with no penalties are excluded from these purchase obligations.
Our consolidated balance sheet at January 31, 2015 included $50.2 million of non-current tax reserves, net of related benefits (including interest and penalties of $10.9 million ) for uncertain tax positions. However, these amounts are not included in the table above because it is not possible to predict or estimate the timing of payments for these obligations. We do not expect to make any significant payments for these uncertain tax positions within the next 12 months.
Contingent Payments Associated with Business Combinations
In connection with certain of our business combinations, we have agreed to make contingent cash payments to the former owners of the acquired companies based upon achievement of performance targets following the acquisition dates.
For the year ended January 31, 2015, we made $12.0 million of payments under contingent consideration arrangements. As of January 31, 2015, potential future cash payments and earned consideration expected to be paid subsequent to January 31, 2015 under contingent consideration arrangements total $32.9 million, the estimated fair value of which was $14.5 million , including
53
Table of Contents
$3.9 million reported in accrued expenses and other current liabilities, and $10.6 million reported in other liabilities. The performance periods associated with these potential payments extend through January 2019.
Off-Balance Sheet Arrangements
As of January 31, 2015 , we did not have any off-balance sheet arrangements that we believe have or are reasonably likely to have a current or future effect on our financial condition, changes in financial condition, revenue or expenses, results of operations, liquidity, capital expenditures or capital resources that are material to investors.
Recent Accounting Pronouncements
New Accounting Pronouncements Implemented
In March 2013, the Financial Accounting Standards Board ("FASB") issued Accounting Standards Update ("ASU") No. 2013-05, Foreign Currency Matters (Topic 830): Parent's Accounting for the Cumulative Translation Adjustment upon Derecognition of Certain Subsidiaries or Groups of Assets within a Foreign Entity or of an Investment in a Foreign Entity . This new standard is intended to resolve diversity in practice regarding the release into net income of a cumulative translation adjustment upon derecognition of a subsidiary or group of assets within a foreign entity. ASU No. 2013-05 was effective prospectively for us on February 1, 2014. The adoption of this standard did not impact our consolidated financial statements.
New Accounting Pronouncements To Be Implemented
In April 2014, the FASB issued ASU No. 2014-08, Presentation of Financial Statements (Topic 205) and Property, Plant, and Equipment (Topic 360): Reporting Discontinued Operations and Disclosures of Disposals of Components of an Entity . ASU No. 2014-08 raises the threshold for a disposal to qualify as a discontinued operation and requires new disclosures of both discontinued operations and certain other disposals that do not meet the definition of a discontinued operation. It was effective for us on February 1, 2015. We do not expect the adoption of this standard to materially impact our consolidated financial statements, absent any disposals of components or groups of components that have a material effect on our financial results in future periods.
In May 2014, the FASB issued ASU No. 2014-09, Revenue from Contracts with Customers (Topic 606). ASU No. 2014-09 supersedes the revenue recognition requirements in Topic 605, Revenue Recognition , and most industry-specific revenue recognition guidance throughout the Industry Topics of the Accounting Standards Codification. Additionally, this update supersedes some cost guidance included in Subtopic 605-35, Revenue Recognition-Construction-Type and Production-Type Contracts . The core principle of the guidance is that an entity should recognize revenue to depict the transfer of promised goods or services to customers in an amount that reflects the consideration to which the entity expects to be entitled in exchange for those goods or services. It is effective for the first interim period within annual reporting periods beginning after December 15, 2016, and early adoption is not permitted. Entities may choose from two adoption methods, with certain practical expedients. We are currently reviewing this standard to assess the impact on our future consolidated financial statements and evaluating the available adoption methods.
In June 2014, the FASB issued ASU No. 2014-10, Development Stage Entities (Topic 915): Elimination of Certain Financial Reporting Requirements, Including an Amendment to Variable Interest Entities Guidance in Topic 810, Consolidation . ASU No. 2014-10 removes the financial reporting distinction between development stage entities and other reporting entities from GAAP and it eliminates an exception provided in the consolidation guidance for development stage enterprises. It is effective for fiscal years, and interim periods within those years, beginning after December 15, 2015, although early adoption is permitted. We are currently reviewing this standard to assess the impact on our future consolidated financial statements.
In June 2014, the FASB issued ASU No. 2014-12, Compensation-Stock Compensation (Topic 718): Accounting for Share-Based Payments When the Terms of an Award Provide That a Performance Target Could Be Achieved after the Requisite Service Period, which requires that a performance target that affects vesting, and that could be achieved after the requisite service period, be treated as a performance condition. As such, the performance target should not be reflected in estimating the grant date fair value of the award. ASU No. 2014-12 is effective for annual reporting periods beginning after December 15, 2015, including interim periods within that reporting period, although early adoption is permitted. We are currently reviewing this standard to assess the impact on our future consolidated financial statements.
In August 2014, the FASB issued ASU No. 2014-15, Presentation of Financial Statements-Going Concern (Subtopic 205-40): Disclosure of Uncertainties about an Entity's Ability to Continue as a Going Concern . This ASU defines management's responsibility to evaluate whether there is substantial doubt about an organization's ability to continue as a going concern and
54
to provide related footnote disclosures. The provisions of ASU No. 2014-15 are effective for annual periods ending after December 15, 2016 and for annual and interim periods thereafter, and early adoption is permitted. The adoption of ASU No. 2014-15 is not expected to have a material effect on our future consolidated financial statements.
In January 2015, the FASB issued ASU No. 2015-01, Income Statement - Extraordinary and Unusual Items (Subtopic 225-20): Simplifying Income Statement Presentation by Eliminating the Concept of Extraordinary Items . ASU No. 2015-01 eliminates the concept of an extraordinary item from GAAP. As a result, an entity will no longer be required to separately present an extraordinary item on its statement of operations, net of tax, after income from continuing operations or to disclose income taxes and net income per share data applicable to an extraordinary item. However, ASU No. 2015-01 will still retain the presentation and disclosure guidance for items that are unusual in nature and occur infrequently. ASU No. 2015-01 is effective for annual reporting periods beginning after December 15, 2015, including interim periods within that reporting period, although early adoption is permitted. We do not expect the adoption of this standard to materially impact our consolidated financial statements, absent any material transactions in future periods that would have qualified for extraordinary item presentation under the prior guidance.
Item 7A. Quantitative and Qualitative Disclosures About Market Risk
Market risk represents the risk of loss that may impact our financial condition due to adverse changes in financial market prices and rates. We are exposed to market risk related to changes in interest rates and foreign currency exchange rate fluctuations. To manage the volatility relating to interest rate and foreign currency risks, we periodically enter into derivative instruments including foreign currency forward exchange contracts and interest rate swap agreements. It is our policy to enter into derivative transactions only to the extent considered necessary to meet our risk management objectives. We use derivative instruments solely to reduce the financial impact of these risks and do not use derivative instruments for speculative purposes.
Interest Rate Risk on Our Debt
In June 2014, we issued $400.0 million in aggregate principal amount of 1.50% convertible senior notes due June 1, 2021. Holders may convert the Notes prior to maturity upon the occurrence of certain conditions. Upon conversion, we would be required to pay the holders, at our election, cash, shares of common stock, or a combination of both. Concurrent with the issuance of the Notes, we entered into the Note Hedges and sold the Warrants. These separate transactions were completed to reduce our exposure to potential dilution upon conversion of the Notes.
The Notes have a fixed annual interest rate of 1.50% and therefore do not have interest rate exposure. However, the fair values of the Notes are subject to interest rate risk, market risk and other factors due to the convertible feature. The fair values of the Notes are also affected by our common stock price. Generally, the fair values of Notes will increase as interest rates fall and/or our common stock price increases, and decrease as interest rates rise and/or our common stock price decreases. Changes in the fair values of the Notes do not impact our financial position, cash flows, or results of operations due to the fixed nature of the debt obligations. We do not carry the Notes at fair value, but we report the fair value of the Notes for disclosure purposes.
As of January 31, 2015, we have $411.1 million of outstanding term loan borrowings maturing in September 2019 under our Credit Agreement, which also includes a $300.0 million revolving credit facility maturing in September 2018, under which there were no outstanding borrowings at January 31, 2015. Borrowings under the Credit Agreement bear interest, payable quarterly or, in the case of Eurodollar loans with an interest period of three months or less, at the end of the applicable interest period, at a per annum rate of, at our election:
• | in the case of Eurodollar loans, the Adjusted LIBO Rate plus 2.75%. The Adjusted LIBO Rate is the greater of (i) 0.75% per annum and (ii) the product of (x) the LIBO Rate and (y) Statutory Reserves (both as defined in the Credit Agreement), and |
• | in the case of Base Rate loans, the Base Rate plus 1.75%. The Base Rate is the greatest of (i) the administrative agent's prime rate, (ii) the Federal Funds Effective Rate (as defined in the Credit Agreement) plus 0.50% and (iii) the Adjusted LIBO Rate for a one-month interest period plus 1.00%. |
As of January 31, 2015, the interest rate on our term loan borrowings was 3.50%.
Because the interest rates applicable to borrowings under our Credit Agreement are variable, we are exposed to market risk from changes in the underlying index rates, which affect our cost of borrowing. The periodic interest rates on borrowings under the Credit Agreement are currently a function of several factors, the most important of which is the LIBO Rate. However,
55
Table of Contents
borrowings are subject to either a 0.75% (Eurodollar loans) or 1.00% (Base Rate loans) LIBO Rate floor in the interest rate calculation, which currently reduces the likelihood of increases in the periodic interest rate, because current short-term LIBO Rates are below 0.75%, and accordingly changes in short-term LIBO Rates will not impact the calculation unless those rates increase above the interest rate floors. Based upon our borrowings as of January 31, 2015, for each 1.00% increase in the applicable LIBO Rate above the interest rate floor, our annual interest payments would increase by approximately $4.2 million.
Previously, we utilized a pay-fixed/receive-variable interest rate swap agreement to partially mitigate the variable interest rate risk associated with a prior credit agreement. We may consider utilizing interest rate swap agreements, or other agreements intended to mitigate variable interest rate risk, in the future.
Interest Rate Risk on Our Investments
We invest in cash, cash equivalents, bank time deposits and marketable debt securities. Interest rate changes could result in an increase or decrease in interest income we generate from these interest-bearing assets. Our cash, cash equivalents, and bank time deposits are primarily maintained at high credit-quality financial institutions around the world, and our marketable debt investments are restricted to highly rated corporate debt securities. We have not invested in marketable debt securities with remaining maturities in excess of twelve months or in equity securities during the three-year period ended January 31, 2015.
The primary objective of our investment activities is the preservation of principal while maximizing investment income and minimizing risk. We have investment guidelines relative to diversification and maturities designed to maintain safety and liquidity.
As of January 31, 2015 and 2014, we had cash and cash equivalents totaling approximately $285.1 million and $378.6 million , respectively, consisting of demand deposits, bank time deposits with maturities of 90 days or less, money market accounts, and marketable debt securities with remaining maturities of 90 days or less. At such dates we also held $36.9 million and $6.4 million , respectively, of cash equivalents which were restricted and were not available for general operating use. These balances primarily represent short-term deposits to secure bank guarantees in connection with sales contracts. The amounts of these deposits can vary depending upon the terms of the underlying contracts. We also had short-term investments of $35.8 million and $32.0 million at January 31, 2015 and 2014, respectively, consisting of bank time deposits and marketable debt securities of corporations, all with remaining maturities in excess of 90 days, but less than one year, at the time of purchase.
To provide a meaningful assessment of the interest rate risk associated with our investment portfolio, we performed a sensitivity analysis to determine the impact a change in interest rates would have on the value of the investment portfolio assuming, during the year ending January 31, 2016, average short-term interest rates increase or decrease by 50 basis points relative to average rates realized during the year ended January 31, 2015. Such a change would cause our projected interest income from cash, cash equivalents, restricted cash and bank time deposits, and short-term investments to increase or decrease by approximately $1.8 million, assuming a similar level of investments in the year ending January 31, 2016 as in the year ended January 31, 2015.
Due to the short-term nature of our cash and cash equivalents, time deposits, money market accounts and marketable debt securities, their carrying values approximate their market values and are not generally subject to price risk due to fluctuations in interest rates.
Foreign Currency Exchange Risk
The functional currency for most of our foreign subsidiaries is the applicable local currency, although we have several subsidiaries with functional currencies that differ from their local currency, of which the most notable exceptions are our subsidiaries in Israel, whose functional currencies are the U.S. dollar. We are exposed to foreign exchange rate fluctuations as we convert the financial statements of our foreign subsidiaries into U.S. dollars for consolidated reporting purposes. If there are changes in foreign currency exchange rates, the conversion of the foreign subsidiaries' financial statements into U.S. dollars results in a gain or loss which is recorded as a component of accumulated other comprehensive income (loss) within stockholders' equity.
While more than half of our revenue is denominated in U.S. dollars, approximately 50% of our operating expenses, primarily labor expenses, are denominated in the local currencies where our foreign operations are located, primarily Israel, the United Kingdom, Germany, certain other European countries whose functional currency is the euro, Australia, Canada, and Singapore. We also generate some portion of our revenue in foreign currencies, mainly the British pound sterling, euro, Singapore dollar, and Australian dollar. As a result, our consolidated U.S. dollar operating results are subject to the potentially material adverse impact of fluctuations in foreign currency exchange rates between the U.S. dollar and the other currencies in which we transact.
56
Table of Contents
In addition, we have certain monetary assets and liabilities that are denominated in currencies other than the respective entity's functional currency. Changes in the functional currency value of these assets and liabilities create fluctuations that result in gains or losses. We recorded net foreign currency losses of $13.4 million and $6.1 million for the years ended January 31, 2015 and 2014, respectively, and net foreign currency gains of $1.0 million for the year ended January 31, 2013, which are recorded in other expense, net.
From time to time, we enter into foreign currency forward contracts in an effort to reduce the volatility of cash flows primarily related to forecasted payroll and payroll-related expenses denominated in Israeli shekels and Canadian dollars. These contracts are generally limited to durations of approximately 12 months or less. Our 50% owned joint venture in Singapore enters into foreign currency forward contracts in an effort to reduce the volatility of cash flows primarily related to forecasted U.S. dollar payments to its suppliers. These contracts are generally limited to durations of approximately 12 months or less. We have also periodically entered into foreign currency forward contracts to manage exposures resulting from forecasted customer collections denominated in currencies other than the respective entity's functional currency and exposures from cash, cash equivalents and short-term investments denominated in currencies other than the applicable functional currency.
During the years ended January 31, 2015 and 2014, we recorded net gains of $4.0 million and $0.3 million , respectively, on foreign currency forward contracts not designated as hedges for accounting purposes, and net losses on such contracts of $0.4 million for the year ended January 31, 2013. We had $8.8 million of net unrealized losses on outstanding foreign currency forward contracts as of January 31, 2015, with notional amounts totaling $156.8 million . We had $1.6 million of net unrealized gains on outstanding foreign currency forward contracts as of January 31, 2014, with notional amounts totaling $127.6 million.
A sensitivity analysis was performed on all of our foreign exchange derivatives as of January 31, 2015. This sensitivity analysis was based on a modeling technique that measures the hypothetical market value resulting from a 10% shift in the value of exchange rates relative to the U.S. dollar, and assumes no changes in interest rates. A 10% increase in the relative value of the U.S. dollar would decrease the estimated fair value of our foreign exchange derivatives by approximately $8.1 million. Conversely, a 10% decrease in the relative value of the U.S. dollar would increase the estimated the fair value of these financial instruments by approximately $9.9 million.
The counterparties to these foreign currency forward contracts are multinational commercial banks. While we believe the risk of counterparty nonperformance is not material, past disruptions in the global financial markets have impacted some of the financial institutions with which we do business. A sustained decline in the financial stability of financial institutions as a result of disruption in the financial markets could affect our ability to secure creditworthy counterparties for our foreign currency hedging programs.
57
Table of Contents
Item 8. Financial Statements and Supplementary Data
VERINT SYSTEMS INC. AND SUBSIDIARIES | |
Index to Consolidated Financial Statements | |
|
|
| Page |
|
|
Report of Independent Registered Public Accounting Firm | 59 |
Consolidated Balance Sheets as of January 31, 2015 and 2014 | 60 |
Consolidated Statements of Operations for the Years Ended January 31, 2015, 2014, and 2013 | 61 |
Consolidated Statements of Comprehensive (Loss) Income for the Years Ended January 31, 2015, 2014, and 2013 | 62 |
Consolidated Statements of Stockholders' Equity for the Years Ended January 31, 2015, 2014, and 2013 | 63 |
Consolidated Statements of Cash Flows for the Years Ended January 31, 2015, 2014, and 2013 | 64 |
Notes to Consolidated Financial Statements | 65 |
58
Table of Contents
Report of Independent Registered Public Accounting Firm
To the Board of Directors and Stockholders of
Verint Systems Inc.
Melville, New York
We have audited the accompanying consolidated balance sheets of Verint Systems Inc. and subsidiaries (the "Company") as of January 31, 2015 and 2014, and the related consolidated statements of operations, comprehensive (loss) income, stockholders' equity, and cash flows for each of the three years in the period ended January 31, 2015. These financial statements are the responsibility of the Company's management. Our responsibility is to express an opinion on these financial statements based on our audits.
We conducted our audits in accordance with the standards of the Public Company Accounting Oversight Board (United States). Those standards require that we plan and perform the audit to obtain reasonable assurance about whether the financial statements are free of material misstatement. An audit includes examining, on a test basis, evidence supporting the amounts and disclosures in the financial statements. An audit also includes assessing the accounting principles used and significant estimates made by management, as well as evaluating the overall financial statement presentation. We believe that our audits provide a reasonable basis for our opinion.
In our opinion, such consolidated financial statements present fairly, in all material respects, the financial position of Verint Systems Inc. and subsidiaries as of January 31, 2015 and 2014, and the results of their operations and their cash flows for each of the three years in the period ended January 31, 2015, in conformity with accounting principles generally accepted in the United States of America.
We have also audited, in accordance with the standards of the Public Company Accounting Oversight Board (United States), the Company's internal control over financial reporting as of January 31, 2015, based on the criteria established in Internal Control - Integrated Framework (2013) issued by the Committee of Sponsoring Organizations of the Treadway Commission and our report dated March 27, 2015 expressed an unqualified opinion on the Company's internal control over financial reporting.
/s/ DELOITTE & TOUCHE LLP
New York, New York
March 27, 2015
59
Table of Contents
VERINT SYSTEMS INC. AND SUBSIDIARIES
Consolidated Balance Sheets
|
| January 31, | ||||||
(in thousands, except share and per share data) | | 2015 |
| 2014 | ||||
Assets | |
| | |
| | ||
Current Assets: | |
| | |
| | ||
Cash and cash equivalents | | $ | 285,072 | | | $ | 378,618 | |
Restricted cash and bank time deposits | | 36,920 | | | 6,423 | | ||
Short-term investments |
| 35,751 | |
| 32,049 | | ||
Accounts receivable, net of allowance for doubtful accounts of $1.1 million and $1.2 million, respectively | | 262,092 | | | 194,312 | | ||
Inventories | | 17,505 | | | 10,693 | | ||
Deferred cost of revenue | | 6,722 | | | 10,818 | | ||
Deferred income taxes |
| 11,176 | |
| 9,002 | | ||
Prepaid expenses and other current assets | | 54,954 | | | 52,476 | | ||
Total current assets | | 710,192 | | | 694,391 | | ||
Property and equipment, net | | 62,490 | | | 40,145 | | ||
Goodwill | | 1,200,817 | | | 853,389 | | ||
Intangible assets, net | | 311,894 | | | 132,847 | | ||
Capitalized software development costs, net | | 10,112 | | | 8,483 | | ||
Long-term deferred cost of revenue | | 14,555 | | | 9,843 | | ||
Long-term deferred income taxes |
| 10,778 | |
| 9,783 | | ||
Other assets | | 30,158 | | | 24,026 | | ||
Total assets | | $ | 2,350,996 | | | $ | 1,772,907 | |
| | | | | | | ||
Liabilities and Stockholders' Equity | |
| | |
| | ||
Current Liabilities: | |
| | |
| | ||
Accounts payable | | $ | 72,885 | | | $ | 65,656 | |
Accrued expenses and other current liabilities | | 221,613 | | | 178,674 | | ||
Current maturities of long-term debt | | 23 | | | 6,555 | | ||
Deferred revenue | | 181,259 | | | 162,124 | | ||
Deferred income taxes |
| 2,108 | |
| 474 | | ||
Total current liabilities | | 477,888 | | | 413,483 | | ||
Long-term debt | | 736,779 | | | 635,830 | | ||
Long-term deferred revenue | | 20,544 | | | 13,661 | | ||
Long-term deferred income taxes |
| 30,664 | |
| 13,358 | | ||
Other liabilities | | 80,218 | | | 63,457 | | ||
Total liabilities | | 1,346,093 | | | 1,139,789 | | ||
Commitments and Contingencies | | | | | | | ||
Stockholders' Equity: | |
| | |
| | ||
Preferred stock - $0.001 par value; authorized 2,207,000 shares at January 31, 2015 and 2014, respectively; none issued. |
| - | |
| - | | ||
Common stock - $0.001 par value; authorized 120,000,000 shares. Issued 61,253,000 and 53,907,000 shares; outstanding 60,905,000 and 53,605,000 shares at January 31, 2015 and 2014, respectively. | | 61 | | | 54 | | ||
Additional paid-in capital | | 1,321,455 | | | 924,663 | | ||
Treasury stock, at cost - 348,000 and 302,000 shares at January 31, 2015 and 2014, respectively. | | (10,251 | ) | | (8,013 | ) | ||
Accumulated deficit | | (219,074 | ) | | (250,005 | ) | ||
Accumulated other comprehensive loss | | (94,335 | ) | | (39,725 | ) | ||
Total Verint Systems Inc. stockholders' equity | | 997,856 | | | 626,974 | | ||
Noncontrolling interest | | 7,047 | | | 6,144 | | ||
Total stockholders' equity | | 1,004,903 | | | 633,118 | | ||
Total liabilities and stockholders' equity | | $ | 2,350,996 | | | $ | 1,772,907 | |
See notes to consolidated financial statements.
60
Table of Contents
VERINT SYSTEMS INC. AND SUBSIDIARIES
Consolidated Statements of Operations
|
| Year Ended January 31, | ||||||||||
(in thousands, except per share data) |
| 2015 |
| 2014 |
| 2013 | ||||||
Revenue: |
|
| |
|
| |
|
| ||||
Product |
| $ | 487,617 | |
| $ | 416,478 | |
| $ | 389,787 | |
Service and support |
| 640,819 | |
| 490,814 | |
| 449,755 | | |||
Total revenue |
| 1,128,436 | |
| 907,292 | |
| 839,542 | | |||
Cost of revenue: |
|
| |
|
| |
|
| | |||
Product |
| 144,870 | |
| 137,558 | |
| 121,748 | | |||
Service and support |
| 239,274 | |
| 156,593 | |
| 145,444 | | |||
Amortization of acquired technology and backlog |
| 31,004 | |
| 12,269 | |
| 14,812 | | |||
Total cost of revenue |
| 415,148 | |
| 306,420 | |
| 282,004 | | |||
Gross profit |
| 713,288 | |
| 600,872 | |
| 557,538 | | |||
Operating expenses: |
|
| |
|
| |
|
| | |||
Research and development, net |
| 173,748 | |
| 126,539 | |
| 115,906 | | |||
Selling, general and administrative |
| 415,266 | |
| 327,385 | |
| 317,637 | | |||
Amortization of other acquired intangible assets |
| 45,163 | |
| 24,662 | |
| 24,442 | | |||
Total operating expenses |
| 634,177 | |
| 478,586 | |
| 457,985 | | |||
Operating income |
| 79,111 | |
| 122,286 | |
| 99,553 | | |||
Other income (expense), net: |
|
| |
|
| |
|
| | |||
Interest income |
| 1,070 | |
| 963 | |
| 531 | | |||
Interest expense |
| (36,661 | ) |
| (29,780 | ) |
| (31,034 | ) | |||
Losses on early retirements of debt |
| (12,546 | ) |
| (9,879 | ) |
| - | | |||
Other expense, net |
| (9,571 | ) |
| (20,275 | ) |
| (1,286 | ) | |||
Total other expense, net |
| (57,708 | ) |
| (58,971 | ) |
| (31,789 | ) | |||
Income before (benefit) provision for income taxes |
| 21,403 | |
| 63,315 | |
| 67,764 | | |||
(Benefit) provision for income taxes |
| (14,999 | ) |
| 4,539 | |
| 8,960 | | |||
Net income |
| 36,402 | |
| 58,776 | |
| 58,804 | | |||
Net income attributable to noncontrolling interest |
| 5,471 | |
| 5,019 | |
| 4,802 | | |||
Net income attributable to Verint Systems Inc. |
| 30,931 | |
| 53,757 | |
| 54,002 | | |||
Dividends on preferred stock |
| - | |
| (174 | ) |
| (15,472 | ) | |||
Net income attributable to Verint Systems Inc. common shares |
| $ | 30,931 | |
| $ | 53,583 | |
| $ | 38,530 | |
|
|
|
|
|
|
| ||||||
Net income per common share attributable to Verint Systems Inc.: |
|
| |
|
| |
|
| | |||
Basic |
| $ | 0.53 | |
| $ | 1.01 | |
| $ | 0.97 | |
Diluted |
| $ | 0.52 | |
| $ | 0.99 | |
| $ | 0.96 | |
|
|
|
|
|
|
| ||||||
Weighted-average common shares outstanding: |
|
| |
|
| |
|
| | |||
Basic |
| 58,096 | |
| 52,967 | |
| 39,748 | | |||
Diluted |
| 59,374 | |
| 53,878 | |
| 40,312 | | |||
See notes to consolidated financial statements.
61
Table of Contents
VERINT SYSTEMS INC. AND SUBSIDIARIES
Consolidated Statements of Comprehensive (Loss) Income
|
| Year Ended January 31, | ||||||||||
(in thousands) |
| 2015 |
| 2014 |
| 2013 | ||||||
Net income |
| $ | 36,402 | |
| $ | 58,776 | |
| $ | 58,804 | |
Other comprehensive income (loss), net of reclassification adjustments: |
|
| |
|
| |
|
| | |||
Foreign currency translation adjustments |
| (45,600 | ) |
| 5,283 | |
| 2,002 | | |||
Net unrealized gains on available-for-sale securities |
| 92 | |
| 9 | |
| - | | |||
Net unrealized (losses) gains on derivative financial instruments designated as hedges |
| (10,547 | ) |
| (1,227 | ) |
| 1,993 | | |||
Benefit (provision) for income taxes on net unrealized (losses) gains on derivative financial instruments designated as hedges |
| 1,070 | |
| 265 | |
| (212 | ) | |||
Other comprehensive (loss) income |
| (54,985 | ) |
| 4,330 | |
| 3,783 | | |||
Comprehensive (loss) income |
| (18,583 | ) |
| 63,106 | |
| 62,587 | | |||
Comprehensive income attributable to noncontrolling interest |
| 5,096 | |
| 4,849 | |
| 5,074 | | |||
Comprehensive (loss) income attributable to Verint Systems Inc. |
| $ | (23,679 | ) |
| $ | 58,257 | |
| $ | 57,513 | |
See notes to consolidated financial statements.
62
VERINT SYSTEMS INC. AND SUBSIDIARIES
|
| Verint Systems Inc. Stockholders' Equity |
|
|
|
| |||||||||||||||||||||||||||||
|
| Common Stock |
| Additional Paid-in Capital |
|
|
|
|
| Accumulated Other Comprehensive Loss |
| Total Verint Systems Inc. Stockholders' Equity |
|
|
| Total Stockholders' Equity | |||||||||||||||||||
(in thousands) |
| Shares |
| Par Value |
|
| Treasury Stock |
| Accumulated Deficit |
|
|
| Non-controlling Interest |
| |||||||||||||||||||||
Balances as of January 31, 2012 |
| 38,982 | |
| $ | 40 | |
| $ | 554,351 | |
| $ | (7,466 | ) |
| $ | (357,764 | ) |
| $ | (47,736 | ) |
| $ | 141,425 | |
| $ | 2,870 | |
| $ | 144,295 | |
Net income |
| - | |
| - | |
| - | |
| - | |
| 54,002 | |
| - | |
| 54,002 | |
| 4,802 | |
| 58,804 | | ||||||||
Other comprehensive income |
| - | |
| - | |
| - | |
| - | |
| - | |
| 3,511 | |
| 3,511 | |
| 272 | |
| 3,783 | | ||||||||
Stock-based compensation - equity portion |
| - | |
| - | |
| 20,174 | |
| - | |
| - | |
| - | |
| 20,174 | |
| - | |
| 20,174 | | ||||||||
Exercises of stock options |
| 121 | |
| - | |
| 2,222 | |
| - | |
| - | |
| - | |
| 2,222 | |
| - | |
| 2,222 | | ||||||||
Common stock issued for stock awards and stock bonuses |
| 1,076 | |
| - | |
| 4,073 | |
| - | |
| - | |
| - | |
| 4,073 | |
| - | |
| 4,073 | | ||||||||
Purchases of treasury stock |
| (21 | ) |
| - | |
| - | |
| (615 | ) |
| - | |
| - | |
| (615 | ) |
| - | |
| (615 | ) | ||||||||
Treasury stock retired |
| - | |
| - | |
| (68 | ) |
| 68 | |
| - | |
| - | |
| - | |
| - | |
| - | | ||||||||
Dividends to noncontrolling interest |
| - | |
| - | |
| - | |
| - | |
| - | |
| - | |
| - | |
| (3,070 | ) |
| (3,070 | ) | ||||||||
Tax effects from stock award plans |
| - | |
| - | |
| 10 | |
| - | |
| - | |
| - | |
| 10 | |
| - | |
| 10 | | ||||||||
Balances as of January 31, 2013 |
| 40,158 | |
| 40 | |
| 580,762 | |
| (8,013 | ) |
| (303,762 | ) |
| (44,225 | ) |
| 224,802 | |
| 4,874 | |
| 229,676 | | ||||||||
Net income |
| - | |
| - | |
| - | |
| - | |
| 53,757 | |
| - | |
| 53,757 | |
| 5,019 | |
| 58,776 | | ||||||||
Other comprehensive income (loss) |
| - | |
| - | |
| - | |
| - | |
| - | |
| 4,500 | |
| 4,500 | |
| (170 | ) |
| 4,330 | | ||||||||
Stock-based compensation - equity portion |
| - | |
| - | |
| 30,471 | |
| - | |
| - | |
| - | |
| 30,471 | |
| - | |
| 30,471 | | ||||||||
Exercises of stock options |
| 384 | |
| - | |
| 10,982 | |
| - | |
| - | |
| - | |
| 10,982 | |
| - | |
| 10,982 | | ||||||||
Common stock issued for stock awards and stock bonuses |
| 789 | |
| 1 | |
| 2,837 | |
| - | |
| - | |
| - | |
| 2,838 | |
| - | |
| 2,838 | | ||||||||
Common stock issued for CTI Merger, net |
| 12,274 | |
| 13 | |
| 299,626 | |
| - | |
| - | |
| - | |
| 299,639 | |
| - | |
| 299,639 | | ||||||||
Dividends to noncontrolling interest |
| - | |
| - | |
| - | |
| - | |
| - | |
| - | |
| - | |
| (3,579 | ) |
| (3,579 | ) | ||||||||
Tax effects from stock award plans |
| - | |
| - | |
| (15 | ) |
| - | |
| - | |
| - | |
| (15 | ) |
| - | |
| (15 | ) | ||||||||
Balances as of January 31, 2014 |
| 53,605 | |
| 54 | |
| 924,663 | |
| (8,013 | ) |
| (250,005 | ) |
| (39,725 | ) |
| 626,974 | | | 6,144 | |
| 633,118 | | ||||||||
Net income |
| - | |
| - | |
| - | |
| - | |
| 30,931 | |
| - | |
| 30,931 | |
| 5,471 | |
| 36,402 | | ||||||||
Other comprehensive loss |
| - | |
| - | |
| - | |
| - | |
| - | |
| (54,610 | ) |
| (54,610 | ) |
| (375 | ) |
| (54,985 | ) | ||||||||
Common stock issued in public offering, net of issuance costs |
| 5,750 | |
| 6 | |
| 264,927 | |
| - | |
| - | |
| - | |
| 264,933 | |
| - | |
| 264,933 | | ||||||||
Equity component of convertible notes, net of issuance costs |
| - | |
| - | |
| 78,209 | |
| - | |
| - | |
| - | |
| 78,209 | |
| - | |
| 78,209 | | ||||||||
Purchase of convertible note hedges |
| - | |
| - | |
| (60,800 | ) |
| - | |
| - | |
| - | |
| (60,800 | ) |
| - | |
| (60,800 | ) | ||||||||
Issuance of warrants |
| - | |
| - | |
| 45,188 | |
| - | |
| - | |
| - | |
| 45,188 | |
| - | |
| 45,188 | | ||||||||
Stock-based compensation - equity portion |
| - | |
| - | |
| 46,963 | |
| - | |
| - | |
| - | |
| 46,963 | |
| - | |
| 46,963 | | ||||||||
Exercises of stock options |
| 505 | |
| - | |
| 17,520 | |
| - | |
| - | |
| - | |
| 17,520 | |
| - | |
| 17,520 | | ||||||||
Common stock issued for stock awards and stock bonuses |
| 1,091 | |
| 1 | |
| 4,531 | |
| - | |
| - | |
| - | |
| 4,532 | |
| - | |
| 4,532 | | ||||||||
Purchases of treasury stock |
| (46 | ) |
| - | |
| - | |
| (2,238 | ) |
| - | |
| - | |
| (2,238 | ) |
| - | |
| (2,238 | ) | ||||||||
Dividends to noncontrolling interest |
| - | |
| - | |
| - | |
| - | |
| - | |
| - | |
| - | |
| (4,193 | ) |
| (4,193 | ) | ||||||||
Tax effects from stock award plans |
| - | |
| - | |
| 254 | |
| - | |
| - | |
| - | |
| 254 | |
| - | |
| 254 | | ||||||||
Balances as of January 31, 2015 |
| 60,905 | |
| $ | 61 | |
| $ | 1,321,455 | |
| $ | (10,251 | ) |
| $ | (219,074 | ) |
| $ | (94,335 | ) |
| $ | 997,856 | |
| $ | 7,047 | |
| $ | 1,004,903 | |
See notes to consolidated financial statements.
63
Table of Contents
VERINT SYSTEMS INC. AND SUBSIDIARIES
Consolidated Statements of Cash Flows
|
| Year Ended January 31, | ||||||||||
(in thousands) |
| 2015 |
| 2014 |
| 2013 | ||||||
Cash flows from operating activities: |
|
| |
|
| |
|
| ||||
Net income |
| $ | 36,402 | |
| $ | 58,776 | |
| $ | 58,804 | |
Adjustments to reconcile net income to net cash provided by operating activities: |
|
| |
|
| |
|
| | |||
Depreciation and amortization |
| 99,464 | |
| 55,968 | |
| 57,097 | | |||
Provision for doubtful accounts |
| 423 | |
| 1,112 | |
| 734 | | |||
Stock-based compensation - equity portion |
| 46,312 | |
| 30,173 | |
| 21,004 | | |||
Amortization of discount on convertible notes |
| 6,014 | |
| - | |
| - | | |||
(Benefit) provision for deferred income taxes |
| (47,331 | ) |
| 2,553 | |
| 328 | | |||
Excess tax benefits from stock award plans |
| (298 | ) |
| (64 | ) |
| (139 | ) | |||
Non-cash (gains) losses on derivative financial instruments, net |
| (3,986 | ) |
| (346 | ) |
| 399 | | |||
Losses on early retirements of debt |
| 12,546 | |
| 9,879 | |
| - | | |||
Other non-cash items, net |
| 8,928 | |
| (1,964 | ) |
| (5,297 | ) | |||
Changes in operating assets and liabilities, net of effects of business combinations: |
|
| |
|
| |
|
| | |||
Accounts receivable |
| (54,921 | ) |
| (23,387 | ) |
| (13,809 | ) | |||
Inventories |
| (4,223 | ) |
| 3,105 | |
| (1,957 | ) | |||
Deferred cost of revenue |
| (677 | ) |
| (6,148 | ) |
| 11,421 | | |||
Prepaid expenses and other assets |
| 21,412 | |
| 33,487 | |
| (17,577 | ) | |||
Accounts payable and accrued expenses |
| 41,414 | |
| 23,444 | |
| (598 | ) | |||
Deferred revenue |
| 24,057 | |
| (1,994 | ) |
| (6,104 | ) | |||
Other liabilities |
| 8,356 | |
| (6,513 | ) |
| 19,078 | | |||
Other, net |
| (167 | ) |
| 203 | |
| 1 | | |||
Net cash provided by operating activities |
| 193,725 | |
| 178,284 | |
| 123,385 | | |||
|
|
|
|
|
|
| ||||||
Cash flows from investing activities: |
|
| |
|
| |
|
| ||||
Cash paid for business combinations, including adjustments, net of cash acquired |
| (605,279 | ) |
| (32,767 | ) |
| (660 | ) | |||
Purchases of property and equipment |
| (23,134 | ) |
| (15,725 | ) |
| (16,045 | ) | |||
Purchases of investments |
| (21,175 | ) |
| (197,749 | ) |
| (13,593 | ) | |||
Sales and maturities of investments |
| 13,653 | |
| 178,820 | |
| - | | |||
Settlements of derivative financial instruments not designated as hedges |
| 3,858 | |
| (359 | ) |
| (270 | ) | |||
Cash paid for capitalized software development costs |
| (6,083 | ) |
| (6,668 | ) |
| (3,916 | ) | |||
Change in restricted cash and bank time deposits, including long-term portion |
| (36,291 | ) |
| 7,677 | |
| (1,212 | ) | |||
Other investing activities |
| (2,384 | ) |
| 2,575 | |
| - | | |||
Net cash used in investing activities |
| (676,835 | ) |
| (64,196 | ) |
| (35,696 | ) | |||
|
|
|
|
|
|
| ||||||
Cash flows from financing activities: |
|
| |
|
| |
|
| ||||
Proceeds from borrowings, net of original issuance discount |
| 1,526,750 | |
| 646,750 | |
| 384 | | |||
Repayments of borrowings and other financing obligations |
| (1,361,852 | ) |
| (586,126 | ) |
| (22,035 | ) | |||
Proceeds from public issuance of common stock |
| 274,563 | |
| - | |
| - | | |||
Proceeds from issuance of warrants |
| 45,188 | |
| - | |
| - | | |||
Payments for convertible note hedges |
| (60,800 | ) |
| - | |
| - | | |||
Payments of debt issuance and other debt-related costs |
| (29,164 | ) |
| (7,754 | ) |
| (217 | ) | |||
Proceeds from exercises of stock options |
| 17,606 | |
| 10,896 | |
| 2,605 | | |||
Cash received in CTI Merger |
| - | |
| 10,370 | |
| - | | |||
Dividends paid to noncontrolling interest |
| (4,193 | ) |
| (3,579 | ) |
| (3,070 | ) | |||
Purchases of treasury stock |
| (2,238 | ) |
| - | |
| (615 | ) | |||
Excess tax benefits from stock award plans |
| 298 | |
| 64 | |
| 139 | | |||
Payments of contingent consideration for business combinations (financing portion) |
| (10,445 | ) |
| (16,087 | ) |
| (6,497 | ) | |||
Net cash provided by (used in) financing activities |
| 395,713 | |
| 54,534 | |
| (29,306 | ) | |||
Effect of exchange rate changes on cash and cash equivalents |
| (6,149 | ) |
| 23 | |
| 928 | | |||
Net (decrease) increase in cash and cash equivalents |
| (93,546 | ) |
| 168,645 | |
| 59,311 | | |||
Cash and cash equivalents, beginning of period |
| 378,618 | |
| 209,973 | |
| 150,662 | | |||
Cash and cash equivalents, end of period |
| $ | 285,072 | |
| $ | 378,618 | |
| $ | 209,973 | |
See notes to consolidated financial statements.
64
Table of Contents
VERINT SYSTEMS INC. AND SUBSIDIARIES
Notes to Consolidated Financial Statements
1. | SUMMARY OF SIGNIFICANT ACCOUNTING POLICIES |
Description of Business
Unless the context otherwise requires, the terms "Verint", "we", "us", and "our" in these notes to consolidated financial statements refer to Verint Systems Inc. and its consolidated subsidiaries.
Verint is a global leader in Actionable Intelligence solutions. Actionable Intelligence is a necessity in a dynamic world of massive information growth because it empowers organizations with crucial insights and enables decision makers to anticipate, respond, and take action. With Verint solutions and value-added services, organizations of all sizes and across many industries can make more timely and effective decisions. Today, more than 10,000 organizations in over 180 countries, including over 80 percent of the Fortune 100, use Verint solutions to improve enterprise performance and make the world a safer place. Verint's vision is to create A Smarter World with Actionable Intelligence ® .
Our Actionable Intelligence solutions help organizations address three important challenges: Customer Engagement Optimization; Security Intelligence; and Fraud, Risk, and Compliance. We help our customers capture large amounts of information from numerous data types and sources, use analytics to glean insights from the information, and leverage the resulting Actionable Intelligence to help achieve their customer engagement, enhanced security, and risk mitigation goals.
Headquartered in Melville, New York, we support our customers around the globe directly and with an extensive network of selling and support partners.
Significant Change in Ownership
For the periods presented in these consolidated financial statements through and including January 31, 2013, Comverse Technology, Inc. ("CTI"), beneficially owned a majority of our common stock (assuming the conversion of CTI's preferred stock holdings into common stock) and held a majority of the voting power of our common stock. On February 4, 2013, CTI was merged with and into our new, wholly owned subsidiary, eliminating CTI's majority ownership and control of us (the "CTI Merger"). Further details are provided in Note 15, "Merger with CTI".
During the year ended January 31, 2013, CTI did not provide us with material levels of corporate or administrative services.
Principles of Consolidation
The accompanying consolidated financial statements include the accounts of Verint Systems Inc., our wholly owned subsidiaries, and a joint venture in which we hold a 50% equity interest. This joint venture functions as a systems integrator for Asian markets and is a variable interest entity in which we are the primary beneficiary. The noncontrolling interest in this joint venture is reflected within stockholders' equity on our consolidated balance sheet, but separately from our equity. Investments in companies in which we have less than a 20% ownership interest and do not exercise significant influence are accounted for at cost. We include the results of operations of acquired companies from the date of acquisition. All significant intercompany transactions and balances are eliminated.
Use of Estimates
The preparation of financial statements in conformity with U.S. generally accepted accounting principles ("GAAP") requires our management to make estimates and assumptions, which may affect the reported amounts of assets and liabilities and the disclosure of contingent assets and liabilities at the date of the consolidated financial statements and the reported amounts of revenue and expenses during the reporting period. Actual results could differ from those estimates.
Cash and Cash Equivalents
Cash primarily consists of cash on hand and bank deposits. Cash equivalents primarily consist of interest-bearing money market accounts, commercial paper, and other highly liquid investments with remaining maturities of 90 days or less when purchased.
65
Table of Contents
Restricted Cash and Restricted Bank Time Deposits
Restricted cash and restricted bank time deposits are pledged as collateral or otherwise restricted as to use for vendor payables, general liability insurance, workers' compensation insurance, warranty programs, and other obligations. Restricted bank time deposits generally consist of certificates of deposit with original maturities of between 30 and 360 days.
Investments
Our investments generally consist of bank time deposits, and marketable debt securities of corporations, the U.S. government, and agencies of the U.S. government, all with remaining maturities in excess of 90 days at the time of purchase. We do not invest in auction rate securities as a matter of policy.
Investments in marketable securities which are classified as available-for-sale are stated at fair value based on market quotes. Investments in time deposits and in certain marketable debt securities which are classified as held-to-maturity are stated at amortized cost. Occasionally, investments with stated maturities beyond one year are classified as short-term if the securities are highly marketable and readily convertible into cash for current operations, although we held no such securities at January 31, 2015 and 2014. Unrealized gains and losses on available-for-sale securities, net of applicable deferred income taxes, are recorded as a component of accumulated other comprehensive income (loss) in stockholders' equity. Gains or losses realized upon sale of short-term investments and declines in value deemed to be other than temporary, if applicable, are recorded in other income (expense), net in our consolidated statement of operations, using the specific identification method. Interest on short-term investments is recognized within income when earned.
We periodically review our investments for indications of possible impairment in value. Factors considered in determining whether a loss is other than temporary include the length of time and extent to which fair value has been below the cost basis, the financial condition and near-term prospects of the investee, and our intent and ability to hold the investment for a period of time sufficient to allow for any anticipated recovery in market value.
Concentrations of Credit Risk
Financial instruments that potentially subject us to concentrations of credit risk consist principally of cash and cash equivalents, bank time deposits, short-term investments, and trade accounts receivable. We invest our cash in bank accounts, certificates of deposit, and money market accounts with major financial institutions, in U.S. Treasury and agency obligations, and in debt securities of corporations. By policy, we seek to limit credit exposure on investments through diversification and by restricting our investments to highly rated securities.
We grant credit terms to our customers in the ordinary course of business. Concentrations of credit risk with respect to trade accounts receivable are limited due to the large number of customers comprising our customer base and their dispersion across different industries and geographic areas.
Accounts Receivable, Net
Trade accounts receivable are recorded at the invoiced amount and are not interest-bearing.
Accounts receivable, net, includes costs in excess of billings and estimated earnings on arrangements recognized under contract
accounting methods, representing revenue recognized on contracts for which billing will occur in subsequent periods, in accordance with the terms of the contracts. Costs in excess of billings and estimated earnings on such contracts were $30.2 million and $22.5 million at January 31, 2015 and 2014, respectively.
The application of our revenue recognition policies sometimes results in circumstances for which we are unable to recognize revenue relating to sales transactions that have been billed, but the related account receivable has not been collected. For consolidated balance sheet presentation purposes, we do not recognize the deferred revenue or the related account receivable and no amounts appear in our consolidated balance sheets for such transactions. Only to the extent that we have received cash for a given deferred revenue transaction is the amount included in deferred revenue on the consolidated balance sheets.
Allowance for Doubtful Accounts
We estimate the collectability of our accounts receivable balances each accounting period and adjust our allowance for doubtful
accounts accordingly. Considerable judgment is required in assessing the collectability of accounts receivable, including consideration of the creditworthiness of each customer, their collection history, and the related aging of past due accounts
66
Table of Contents
receivable balances. We evaluate specific accounts when we learn that a customer may be experiencing a deteriorating financial condition due to lower credit ratings, bankruptcy, or other factors that may affect its ability to render payment. We write-off an account receivable and charge it against its recorded allowance at the point when it is considered uncollectible.
The following table summarizes the activity in our allowance for doubtful accounts for the years ended January 31, 2015, 2014, and 2013:
|
| Year Ended January 31, | ||||||||||
(in thousands) |
| 2015 |
| 2014 |
| 2013 | ||||||
Balance at beginning of period |
| $ | 1,187 | |
| $ | 1,775 | |
| $ | 2,929 | |
Provisions charged to expense |
| 423 | |
| 1,100 | |
| 250 | | |||
Amounts written off |
| (461 | ) |
| (1,700 | ) |
| (1,520 | ) | |||
Other, including fluctuations in foreign exchange rates |
| (50 | ) |
| 12 | |
| 116 | | |||
Balance at end of period |
| $ | 1,099 | |
| $ | 1,187 | |
| $ | 1,775 | |
Inventories
Inventories are stated at the lower of cost or market. Cost is determined using the weighted-average method of inventory accounting. The valuation of our inventories requires us to make estimates regarding excess or obsolete inventories, including making estimates of the future demand for our products. Although we make every effort to ensure the accuracy of our forecasts of future product demand, any significant unanticipated changes in demand, price, or technological developments could have a significant impact on the value of our inventory and reported operating results. Charges for excess and obsolete inventories are included within cost of revenue.
Property and Equipment, net
Property and equipment are stated at cost, net of accumulated depreciation and amortization. Depreciation is computed using the straight-line method based over the estimated useful lives of the assets. The vast majority of equipment, furniture and other is depreciated over periods ranging from three to seven years. Software is depreciated over periods ranging from three to four years. Buildings are depreciated over periods ranging from ten to twenty-five years. Leasehold improvements are amortized over the shorter of their estimated useful lives or the related lease term.
The cost of maintenance and repairs of property and equipment is charged to operations as incurred. When assets are retired or
disposed of, the cost and accumulated depreciation or amortization thereon are removed from the consolidated balance sheet and any resulting gain or loss is recognized in the consolidated statement of operations.
Goodwill, Other Acquired Intangible Assets, and Long-Lived Assets
We record goodwill when the purchase price of net tangible and identifiable intangible assets we acquire exceeds their fair value. Acquired identifiable intangible assets include identifiable acquired technologies, customer relationships, trade names, distribution networks, non-competition agreements, sales backlog, and in-process research and development ("IPR&D"). We amortize the cost of finite-lived identifiable intangible assets over their estimated useful lives, which are periods of ten years or less. Amortization is based on the pattern in which the economic benefits of the intangible asset are expected to be realized, which typically is on a straight-line basis.
We regularly perform reviews to determine if the carrying values of our goodwill and other intangible assets are impaired.
We test goodwill for impairment at the reporting unit level, which can be an operating segment or one level below an operating segment, on an annual basis as of November 1 , or more frequently if changes in facts and circumstances indicate that impairment in the value of goodwill may exist. As of January 31, 2015, our reporting units are consistent with our operating segments identified in Note 18, "Segment, Geographic, and Significant Customer Information".
We review goodwill for impairment utilizing either a qualitative assessment or a two-step process. If we decide that it is appropriate to perform a qualitative assessment and conclude that the fair value of a reporting unit more likely than not exceeds its carrying value, no further evaluation is performed. For reporting units where we perform the two-step process, the first step requires us to estimate the fair value of each reporting unit and compare that fair value to the respective carrying value, which includes goodwill. If the fair value of the reporting unit exceeds its carrying value, the goodwill is not considered impaired and no further evaluation is performed. If the carrying value is higher than the estimated fair value, there is an indication that impairment may exist and the second step is performed, in which case the implied fair value of goodwill is calculated as the
67
Table of Contents
excess of the fair value of a reporting unit over the fair values assigned to its assets and liabilities. If the implied fair value of goodwill is less than the carrying value of the reporting unit's goodwill, the difference is recognized as an impairment charge.
For reporting units where we decide to perform a qualitative assessment, we assess and make judgments regarding a variety of factors which potentially impact the fair value of a reporting unit, including general economic conditions, industry and market-specific conditions, customer behavior, cost factors, our financial performance and trends, our strategies and business plans, capital requirements, management and personnel issues, and our stock price, among others. We then consider the totality of these and other factors, placing more weight on the events and circumstances that are judged to most affect a reporting unit's fair value or the carrying amount of its net assets, to reach a qualitative conclusion regarding whether it is more likely than not that the fair value of a reporting unit exceeds its carrying amount.
For reporting units where we perform the two-step process, we utilize some or all of three primary approaches to assess fair value: (a) an income-based approach, using projected discounted cash flows, (b) a market-based approach, using multiples of comparable companies, and (c) a transaction-based approach, using multiples for recent acquisitions of similar businesses made in the marketplace. Our estimate of fair value of each reporting unit is based on a number of subjective factors, including: (a) appropriate consideration of valuation approaches (income approach, comparable public company approach, and comparable transaction approach), (b) estimates of future growth rates, (c) estimates of our future cost structure, (d) discount rates for our estimated cash flows, (e) selection of peer group companies for the public company and the market transaction approaches, (f) required levels of working capital, (g) assumed terminal value, and (h) time horizon of cash flow forecasts.
Further information regarding our annual goodwill impairment reviews appears in Note 5, "Intangible Assets and Goodwill".
Acquired IPR&D projects which have not reached technological feasibility at the date of acquisition are considered indefinite-lived intangible assets and are not subject to amortization until the completion or abandonment of the associated research and development efforts. Upon completion of the development process, the IPR&D assets are amortized over their estimated useful lives. If a project is abandoned rather than completed, the IPR&D asset is written-off. IPR&D assets are tested for impairment annually or more frequently if events or changes in circumstances indicate that the assets might be impaired.
We review finite-lived intangible assets and other long-lived assets when an event occurs indicating the potential for impairment. If any indicators are present, we perform a recoverability test by comparing the sum of the estimated undiscounted future cash flows attributable to the assets in question to their carrying amounts. If the undiscounted cash flows used in the test for recoverability are less than the long-lived assets carrying amount, we determine the fair value of the long-lived asset and recognize an impairment loss if the carrying amount of the long-lived asset exceeds its fair value. The impairment loss recognized is the amount by which the carrying amount of the long-lived asset exceeds its fair value.
Fair Values of Financial Instruments
Our recorded amounts of cash and cash equivalents, restricted cash and restricted bank time deposits, accounts receivable, investments, and accounts payable approximate fair value, due to the short-term nature of these instruments. We measure certain financial assets and liabilities at fair value based on the exchange price that would be received for an asset or paid to transfer a liability (an exit price) in the principal or most advantageous market for the asset or liability in an orderly transaction between market participants. Fair value disclosures regarding our money market funds, short-term investments, derivative financial instruments, contingent consideration obligations, and long-term debt are included in Note 12, "Fair Value Measurements".
Derivative Financial Instruments
As part of our risk management strategy, when considered appropriate, we use derivative financial instruments including foreign currency forward contracts and interest rate swap agreements to hedge against certain foreign currency and interest rate exposures. Our intent is to mitigate gains and losses caused by the underlying exposures with offsetting gains and losses on the derivative contracts. By policy, we do not enter into speculative positions with derivative instruments.
The criteria we use for designating a derivative as a hedge include contemporaneous and ongoing documentation of the instrument's effectiveness in risk reduction and direct matching of the financial instrument to the underlying transaction. We record all derivatives as assets or liabilities on our consolidated balance sheets at their fair values. Gains and losses from the changes in values of these derivatives are accounted for based on the use of the derivative and whether it qualifies for hedge accounting.
68
Table of Contents
The counterparties to our derivative financial instruments consist of several major international financial institutions. We regularly monitor the financial strength of these institutions. While the counterparties to these contracts expose us to credit-related losses in the event of a counterparty's non-performance, the risk would be limited to the unrealized gains on such affected contracts. We do not anticipate any such losses.
For the years ended January 31, 2015, 2014, and 2013, certain foreign currency forward contracts qualified for accounting as hedges and accordingly, the effective portions of the changes in fair value of these instruments were recorded in accumulated other comprehensive income (loss) in our consolidated balance sheets, net of income taxes, and are reclassified to the consolidated statements of operations when the effects of the item being hedged are recognized in the consolidated statements of operations. The ineffective portion, if any, of these contracts is reported in other income (expense), net. For derivative financial instruments not accounted for as hedges, gains and losses from changes in their fair values are reported in other income (expense), net. See Note 13, "Derivative Financial Instruments", for further details.
Long-term Debt
We capitalize debt issuance costs, as well as costs incurred for subsequent modification of debt, incurred in connection with our long-term borrowings and credit facilities. We amortize these costs as an adjustment to interest expense over the remaining contractual life of the associated long-term borrowing or credit facility using the effective interest method for term loans and convertible debt borrowings, and the straight-line method for revolving credit facilities. When unscheduled principal payments are made, we adjust the amortization of our deferred debt-related costs to reflect the expected remaining terms of the borrowing.
Segment Reporting
Operating segments are defined as components of an enterprise about which separate financial information is available that is regularly evaluated by the enterprise's chief operating decision maker ("CODM"), or decision making group, in deciding how to allocate resources and in assessing performance.
We conduct our business through three operating segments, which are also our reportable segments, Enterprise Intelligence Solutions ("Enterprise Intelligence"), Communications and Cyber Intelligence Solutions ("Communications Intelligence"), and Video and Situation Intelligence Solutions ("Video Intelligence"). Organizing our business through three operating segments allows us to align our resources and domain expertise to effectively address the Actionable Intelligence market. We determine our reportable segments based on a number of factors our management uses to evaluate and run our business operations, including similarities of customers, products and technology. Our Chief Executive Officer is our CODM, who regularly reviews segment revenue and segment operating contribution when assessing financial results of segments and allocating resources.
We measure the performance of our operating segments based upon segment revenue and segment contribution. Segment contribution includes segment revenue and expenses incurred directly by the segment, including material costs, service costs, research and development and selling, marketing, and administrative expenses. We do not allocate certain expenses, which include the majority of general and administrative expenses, facilities and communication expenses, purchasing expenses, manufacturing support and logistic expenses, depreciation and amortization, amortization of capitalized software development costs, stock-based compensation, and special charges such as restructuring costs when calculating segment contribution. These expenses are included within unallocated expenses in our presentation of segment operating results. Revenue from transactions between our operating segments is not material. See Note 18, "Segment, Geographic, and Significant Customer Information", for further details.
Revenue Recognition
We derive and report our revenue in two categories: (a) product revenue, including sale of hardware products (which include software that works together with the hardware to deliver the product's essential functionality) and licensing of software products, and (b) service and support revenue, including revenue from installation services, post-contract customer support ("PCS"), project management, hosting services, software-as-a-service ("SaaS"), product warranties, consulting and training services.
Our revenue recognition policy is a critical component of determining our operating results and is based on a complex set of
accounting rules that require us to make significant judgments and estimates. Our customer arrangements typically include several elements, including products, services, and support. Revenue recognition for a particular arrangement is dependent upon such factors as the level of customization within the solution and the contractual delivery, acceptance, payment, and
69
Table of Contents
support terms with the customer. Significant judgment is required to conclude whether collectability of fees is reasonably assured and whether fees are fixed and determinable.
For arrangements that do not require significant modification or customization of the underlying products, we recognize revenue when we have persuasive evidence of an arrangement, the product has been delivered or the services have been provided to the customer, the sales price is fixed or determinable and collectability is reasonably assured. In addition, our multiple-element arrangements must be carefully reviewed to determine the selling price of each element.
Our multiple-element arrangements consist of a combination of our product and service offerings that may be delivered at various points in time. For arrangements within the scope of the multiple-deliverable accounting guidance, a deliverable constitutes a separate unit of accounting when it has stand-alone value and there are no customer-negotiated refunds or return rights for the delivered elements. For multiple-element arrangements comprised only of tangible products containing software components and non-software components and related services, we allocate revenue to each element in an arrangement based on a selling price hierarchy. The selling price for a deliverable is based on its vendor-specific objective evidence ("VSOE") if available, third-party evidence ("TPE") if VSOE is not available, or estimated selling price ("ESP") if neither VSOE nor TPE is available. The total transaction revenue is allocated to the multiple elements based on each element's relative selling price compared to the total selling price. We limit the amount of revenue recognized for delivered elements to an amount that is not contingent upon future delivery of additional products or services or meeting of any specified performance conditions.
Our policy for establishing VSOE for installation, consulting, and training is based upon an analysis of separate sales of services. We utilize either the substantive renewal rate approach or the bell-shaped curve approach to establish VSOE for our PCS offerings, depending upon the business segment, geographical region, or product line.
TPE of selling price is established by evaluating largely similar and interchangeable competitor products or services in stand-alone sales to similarly situated customers. However, as most of our products contain a significant element of proprietary technology offering substantially different features and functionality, the comparable pricing of products with similar functionality typically cannot be obtained. Additionally, as we are unable to reliably determine what competitors products' selling prices are on a stand-alone basis, we are typically not able to determine TPE.
If we are unable to determine the selling price because VSOE or TPE does not exist, we determine ESP for the purposes of allocating the arrangement's revenue by considering several external and internal factors including, but not limited to, pricing practices, similar product offerings, margin objectives, geographies in which we offer our products and services, internal costs, competition, and product life cycle. The determination of ESP is made through consultation with and approval by our management, taking into consideration our go-to-market strategies. We have established processes to update ESP for each element, when appropriate, to ensure that it reflects recent pricing experience.
For multiple-element arrangements comprised only of software products and related services, a portion of the total purchase price is allocated to the undelivered elements, primarily installation services, PCS, consulting and training services, using VSOE of fair value of the undelivered elements. The remaining portion of the total transaction value is allocated to the delivered software, referred to as the residual method. If we are unable to establish VSOE for the undelivered elements of the arrangement, revenue recognition is deferred for the entire arrangement until all elements of the arrangement are delivered. However, if the only undelivered element is PCS, we recognize the arrangement fee ratably over the PCS period.
For multiple-element arrangements that contain software and software-related elements for which we are unable to establish VSOE of one or more elements, we use various available indicators of fair value and apply our best judgment to reasonably classify the arrangement's revenue into product revenue and service revenue for financial reporting purposes.
For multiple-element arrangements that are comprised of a combination of hardware and software elements, the total transaction value is bifurcated between the hardware elements and the software elements that are not essential to the functionality of the hardware, based on the relative selling prices of the hardware elements and the software elements as a group. Revenue is then recognized for the hardware and hardware-related services following the hardware revenue recognition methodology outlined above and revenue for the software and software-related services is recognized following the residual method or ratably over the PCS period if VSOE for PCS does not exist.
PCS revenue is derived from providing technical software support services and unspecified software updates and upgrades to
customers on a when-and-if-available basis. PCS revenue is recognized ratably over the term of the maintenance period, which in most cases is one year.
70
Table of Contents
Under the substantive renewal rate approach, we believe it is necessary to evaluate whether both the support renewal rate and term are substantive and whether the renewal rate is being consistently applied to subsequent renewals for a particular customer. We establish VSOE under this approach through analyzing the renewal rate stated in the customer agreement and determining whether that rate is above the minimum substantive VSOE renewal rate established for that particular PCS offering. The minimum substantive VSOE rate is determined based upon an analysis of renewal rates associated with historical PCS contracts. For multiple-element software arrangements that do not contain a stated renewal rate, revenue associated with the entire bundled arrangement is recognized ratably over the PCS term. Multiple-element software arrangements that have a renewal rate below the minimum substantive VSOE rate are deemed to contain a more than insignificant discount element, for which VSOE cannot be established. We recognize aggregate contractual revenue for these arrangements over the period that the customer is entitled to renew its PCS at the discounted rate, but not to exceed the estimated economic life of the product. We evaluate many factors in determining the estimated economic life of our products, including the support period of the product, technological obsolescence, and customer expectations. We have concluded that our software products have estimated economic lives ranging from five to seven years.
Under the bell-shaped curve approach of establishing VSOE, we perform VSOE compliance tests to ensure that a substantial
majority of our actual PCS renewals are within a narrow range of pricing.
Some of our arrangements require significant customization of the product to meet the particular requirements of the customer. For these arrangements, revenue is recognized under contract accounting principles, typically using the percentage-of-completion ("POC") method. Under the POC method, revenue recognition is generally based upon the ratio of hours incurred to date to the total estimated hours required to complete the contract. Profit estimates on long-term contracts are revised periodically based on changes in circumstances, and any losses on contracts are recognized in the period that such losses become evident. If the range of profitability cannot be estimated, but some level of profit is assured, revenue is recognized to the extent of costs incurred, until such time that the project's profitability can be estimated or the services have been completed. In the event some level of profitability on a contract cannot be assured, the completed-contract method of revenue recognition is applied.
Our SaaS multiple-element arrangements are typically comprised of subscription and support fees from customers accessing our software, set-up fees, and fees for consultation services. We do not provide the customer the contractual right to take possession of the software at any time during the hosting period under these arrangements. We recognize revenue for subscription and support services over the contract period originating when the subscription service is made available to the customer and the contractual hosting period has commenced. The initial set-up fees are recognized over the longer of the initial contract period or the period the customer is expected to benefit from payment of the up-front fees. Revenue from consultation services is generally recognized as services are completed.
If an arrangement includes customer acceptance criteria, revenue is not recognized until we can objectively demonstrate that the software or services meet the acceptance criteria, or the acceptance period lapses, whichever occurs earlier. If an arrangement containing software elements obligates us to deliver specified future software products or upgrades, revenue related to the software elements under the arrangement is initially deferred and is recognized only when the specified future software products or upgrades are delivered, or when the obligation to deliver specified future software products expires, whichever occurs earlier.
We record provisions for estimated product returns in the same period in which the associated revenue is recognized. We base these estimates of product returns upon historical levels of sales returns and other known factors. Actual product returns could be different from our estimates, and current or future provisions for product returns may differ from historical provisions. Concessions granted to customers are recorded as reductions to revenue in the period in which they were granted. The vast majority of our contracts are successfully completed, and concessions granted to customers are minimal in both dollar value and frequency.
Product revenue derived from shipments to resellers and original equipment manufacturers ("OEMs") who purchase our products for resale are generally recognized when such products are shipped (on a "sell-in" basis) since we do not expect our resellers or OEMs to carry inventory of our products. We have historically experienced insignificant product returns from resellers and OEMs, and our payment terms for these customers are similar to those granted to our end-users. If a reseller or OEM develops a pattern of payment delinquency, or seeks payment terms longer than generally accepted, we defer the recognition of revenue until the receipt of cash. Our arrangements with resellers and OEMs are periodically reviewed as our business and products change.
71
Table of Contents
In instances where revenue is derived from sale of third-party vendor services and we are a principal in the transaction, we generally record revenue on a gross basis and record costs related to a sale within cost of revenue. Though uncommon, in cases where we act as an agent between the customer and the vendor, revenue is recorded net of costs.
Multiple contracts with a single counterparty executed within close proximity of each other are evaluated to determine if the contracts should be combined and accounted for as a single arrangement. We record reimbursements from customers for out-of-pocket expenses as revenue. Shipping and handling fees and expenses that are billed to customers are recognized in revenue and the costs associated with such fees and expenses are recorded in cost of revenue. Historically, these fees and expenses have not been material. Taxes collected from customers and remitted to government authorities are excluded from revenue.
Cost of Revenue
Our cost of revenue includes costs of materials, compensation and benefit costs for operations and service personnel, subcontractor costs, royalties and license fees, depreciation of equipment used in operations and service, amortization of capitalized software development costs and certain purchased intangible assets, and related overhead costs.
Where revenue is recognized over multiple periods in accordance with our revenue recognition policies, we have made an accounting policy election whereby cost of product revenue, including hardware and third-party software license fees, are capitalized and recognized in the same period that product revenue is recognized, while installation and other service costs are generally expensed as incurred, except for certain contracts that are accounted for using contract accounting principles.
Deferred cost of revenue is classified in its entirety as current or long-term based on whether the related revenue will be recognized within twelve months of the origination date of the arrangement.
For certain contracts accounted for using contract accounting principles, revisions in estimates of costs and profits are reflected in the accounting period in which the facts that require the revision become known, if such facts become known subsequent to the issuance of the consolidated financial statements. If such facts become known before the issuance of the consolidated financial statements, the requisite revisions in estimates of costs and profits are reflected in the consolidated financial statements. At the time a loss on a contract becomes evident, the entire amount of the estimated loss is accrued. Related contract costs include all direct material and labor costs and those indirect costs related to contract performance.
Customer acquisition and origination costs, including sales commissions, are recorded in selling, general and administrative expenses. These costs are expensed as incurred, with the exception of certain sales referral fees in our Communications Intelligence segment which are capitalized and amortized ratably over the revenue recognition period.
Research and Development, net
With the exception of certain software development costs, all research and development costs are expensed as incurred, and consist primarily of personnel and consulting costs, travel, depreciation of research and development equipment, and related overhead and other costs associated with research and development activities.
We receive non-refundable grants from the Israel Office of the Chief Scientist ("OCS") that fund a portion of our research and development expenditures. We currently only enter into non-royalty-bearing arrangements with the OCS which do not require us to pay royalties. Funds received from the OCS are recorded as a reduction to research and development expense. Royalties, to the extent paid, are recorded as part of our cost of revenue.
We also periodically derive benefits from participation in certain government-sponsored programs in other jurisdictions, for the support of research and development activities conducted in those locations.
Software Development Costs
Costs incurred to acquire or develop software to be sold, leased or otherwise marketed are capitalized after technological feasibility is established, and continue to be capitalized through the general release of the related software product. Amortization of capitalized costs begins in the period in which the related product is available for general release to customers and is recorded on a straight-line basis, which approximates the pattern in which the economic benefits of the capitalized costs are expected to be realized, over the estimated economic lives of the related software products, generally four years.
Internal-Use Software
72
Table of Contents
We capitalize costs associated with internal-use software systems that have reached the application development stage. These
capitalized costs include external direct costs utilized in developing or obtaining the applications and expenses for employees who are directly associated with the development of the applications. Capitalization of such costs begins when the preliminary project stage is complete and continues until the project is substantially complete and is ready for its intended purpose. Capitalized costs of computer software developed for internal use are amortized over estimates useful lives of four years on a straight-line basis, which best represents the pattern of the software's use.
Income Taxes
We account for income taxes under the asset and liability method which includes the recognition of deferred tax assets and liabilities for the expected future tax consequences of events that have been included in our consolidated financial statements. Under this approach, deferred taxes are recorded for the future tax consequences expected to occur when the reported amounts of assets and liabilities are recovered or paid. The provision for income taxes represents income taxes paid or payable for the current year plus deferred taxes. Deferred taxes result from differences between the financial statement and tax bases of our assets and liabilities, and are adjusted for changes in tax rates and tax laws when changes are enacted. The effects of future changes in income tax laws or rates are not anticipated.
We are subject to income taxes in the United States and numerous foreign jurisdictions. The calculation of our tax provision involves the application of complex tax laws and requires significant judgment and estimates.
We evaluate the realizability of our deferred tax assets for each jurisdiction in which we operate at each reporting date, and establish valuation allowances when it is more likely than not that all or a portion of our deferred tax assets will not be realized. The ultimate realization of deferred tax assets is dependent upon the generation of future taxable income of the same character and in the same jurisdiction. We consider all available positive and negative evidence in making this assessment, including, but not limited to, the scheduled reversal of deferred tax liabilities, projected future taxable income, and tax planning strategies. In circumstances where there is sufficient negative evidence indicating that our deferred tax assets are not more-likely-than-not realizable, we establish a valuation allowance.
We use a two-step approach to recognizing and measuring uncertain tax positions. The first step is to evaluate tax positions taken or expected to be taken in a tax return by assessing whether they are more-likely-than-not sustainable, based solely on their technical merits, upon examination and including resolution of any related appeals or litigation process. The second step is to measure the associated tax benefit of each position as the largest amount that we believe is more-likely-than-not realizable. Differences between the amount of tax benefits taken or expected to be taken in our income tax returns and the amount of tax benefits recognized in our financial statements represent our unrecognized income tax benefits, which we either record as a liability or as a reduction of deferred tax assets. Our policy is to include interest (expense and/or income) and penalties related to unrecognized income tax benefits as a component of income tax expense.
Functional Currencies and Foreign Currency Transaction Gains and Losses
The functional currency for most of our foreign subsidiaries is the applicable local currency, although we have several subsidiaries with functional currencies that differ from their local currency, of which the most notable exceptions are our subsidiaries in Israel, whose functional currencies are the U.S. dollar. One of our subsidiaries operates in two economic environments which have differing foreign exchange risks, and therefore uses a different functional currency in each environment.
Transactions denominated in currencies other than a functional currency are converted to the functional currency on the transaction date, and any resulting assets or liabilities are further translated at each reporting date and at settlement. Gains and losses recognized upon such translations are included within other income (expense), net in the consolidated statements of operations. We recorded net foreign currency losses of $13.4 million and $6.1 million for the years ended January 31, 2015 and 2014, respectively, and net foreign currency gains of $1.0 million for the year ended January 31, 2013.
For consolidated reporting purposes, in those instances where a foreign subsidiary has a functional currency other than the U.S. dollar, revenue and expenses are translated into U.S. dollars using average exchange rates for the reporting period, while assets and liabilities are translated into U.S. dollars using period-end rates. The effects of foreign currency translation adjustments are included in stockholders' equity as a component of accumulated other comprehensive income (loss) in the accompanying consolidated balance sheets.
Stock-Based Compensation
73
Table of Contents
We recognize the cost of employee services received in exchange for awards of equity instruments based on the grant-date fair value of the award. We recognize the fair value of the award as compensation expense over the period during which an employee is required to provide service in exchange for the award.
When stock options are awarded, the fair value of the option is estimated on the date of grant using the Black-Scholes option-pricing model. Expected volatility and expected term are input factors to that model that can require significant management judgment. Expected volatility is estimated utilizing daily historical volatility over a period that equates to the expected life of the option. The expected life (estimated period of time outstanding) is estimated using the historical exercise behavior of employees. The risk-free interest rate is the implied daily yield currently available on U.S. Treasury issues with a remaining term closely approximating the expected term used as the input to the Black-Scholes option pricing model.
Net Income Per Common Share Attributable to Verint Systems Inc.
Shares used in the calculation of basic net income per common share are based on the weighted-average number of common shares outstanding during the accounting period. Shares used in the calculation of basic net income per common share include vested but unissued shares underlying awards of restricted stock units when all necessary conditions for earning those shares have been satisfied at the award's vesting date, but exclude unvested shares of restricted stock because they are contingent upon future service conditions.
Shares used in the calculation of diluted net income per common share are based on the weighted-average number of common shares outstanding, adjusted for potentially dilutive common shares outstanding during the period. Potentially dilutive common shares from warrants and stock-based compensation plans are determined using the treasury stock method.
We have the option to pay cash, issue shares of common stock, or any combination thereof for the aggregate amount due upon conversion of our 1.50% convertible senior notes due June 1, 2021 (the "Notes"), further details for which appear in Note 6, "Long-Term Debt". We currently intend to settle the principal amount of the Notes in cash upon conversion and as a result, only the amounts payable in excess of the principal amounts of the Notes, if any, are assumed to be settled with shares of common stock for purposes of computing diluted net income per share.
Potentially dilutive common shares also included the assumed conversion of our Series A Convertible Perpetual Preferred Stock ("Preferred Stock"), if dilutive, for periods prior to cancellation of the Preferred Stock on February 4, 2013 in connection with the CTI Merger. The CTI Merger is further discussed in Note 15, "Merger with CTI".
In periods for which we report a net loss, basic net loss per common share and diluted net loss per common share are identical
since the effect of potential common shares is anti-dilutive and therefore excluded.
Recent Accounting Pronouncements
New Accounting Pronouncements Implemented
In March 2013, the Financial Accounting Standards Board ("FASB") issued Accounting Standards Update ("ASU") No. 2013-05, Foreign Currency Matters (Topic 830): Parent's Accounting for the Cumulative Translation Adjustment upon Derecognition of Certain Subsidiaries or Groups of Assets within a Foreign Entity or of an Investment in a Foreign Entity . This new standard is intended to resolve diversity in practice regarding the release into net income of a cumulative translation adjustment upon derecognition of a subsidiary or group of assets within a foreign entity. ASU No. 2013-05 was effective prospectively for us on February 1, 2014. The adoption of this standard did not impact our consolidated financial statements.
New Accounting Pronouncements To Be Implemented
In April 2014, the FASB issued ASU No. 2014-08, Presentation of Financial Statements (Topic 205) and Property, Plant, and Equipment (Topic 360): Reporting Discontinued Operations and Disclosures of Disposals of Components of an Entity . ASU No. 2014-08 raises the threshold for a disposal to qualify as a discontinued operation and requires new disclosures of both discontinued operations and certain other disposals that do not meet the definition of a discontinued operation. It was effective for us on February 1, 2015. We do not expect the adoption of this standard to materially impact our consolidated financial statements, absent any disposals of components or groups of components that have a material effect on our financial results in future periods.
In May 2014, the FASB issued ASU No. 2014-09, Revenue from Contracts with Customers (Topic 606). ASU No. 2014-09 supersedes the revenue recognition requirements in Topic 605, Revenue Recognition , and most industry-specific revenue
74
Table of Contents
recognition guidance throughout the Industry Topics of the Accounting Standards Codification. Additionally, this update supersedes some cost guidance included in Subtopic 605-35, Revenue Recognition-Construction-Type and Production-Type Contracts . The core principle of the guidance is that an entity should recognize revenue to depict the transfer of promised goods or services to customers in an amount that reflects the consideration to which the entity expects to be entitled in exchange for those goods or services. It is effective for the first interim period within annual reporting periods beginning after December 15, 2016, and early adoption is not permitted. Entities may choose from two adoption methods, with certain practical expedients. We are currently reviewing this standard to assess the impact on our future consolidated financial statements and evaluating the available adoption methods.
In June 2014, the FASB issued ASU No. 2014-10, Development Stage Entities (Topic 915): Elimination of Certain Financial Reporting Requirements, Including an Amendment to Variable Interest Entities Guidance in Topic 810, Consolidation . ASU No. 2014-10 removes the financial reporting distinction between development stage entities and other reporting entities from GAAP and it eliminates an exception provided in the consolidation guidance for development stage enterprises. It is effective for fiscal years, and interim periods within those years, beginning after December 15, 2015, although early adoption is permitted. We are currently reviewing this standard to assess the impact on our future consolidated financial statements.
In June 2014, the FASB issued ASU No. 2014-12, Compensation-Stock Compensation (Topic 718): Accounting for Share-Based Payments When the Terms of an Award Provide That a Performance Target Could Be Achieved after the Requisite Service Period, which requires that a performance target that affects vesting, and that could be achieved after the requisite service period, be treated as a performance condition. As such, the performance target should not be reflected in estimating the grant date fair value of the award. ASU No. 2014-12 is effective for annual reporting periods beginning after December 15, 2015, including interim periods within that reporting period, although early adoption is permitted. We are currently reviewing this standard to assess the impact on our future consolidated financial statements.
In August 2014, the FASB issued ASU No. 2014-15, Presentation of Financial Statements-Going Concern (Subtopic 205-40): Disclosure of Uncertainties about an Entity's Ability to Continue as a Going Concern . This ASU defines management's responsibility to evaluate whether there is substantial doubt about an organization's ability to continue as a going concern and to provide related footnote disclosures. The provisions of ASU No. 2014-15 are effective for annual periods ending after December 15, 2016 and for annual and interim periods thereafter, and early adoption is permitted. The adoption of ASU No. 2014-15 is not expected to have a material effect on our future consolidated financial statements.
In January 2015, the FASB issued ASU No. 2015-01, Income Statement - Extraordinary and Unusual Items (Subtopic 225-20): Simplifying Income Statement Presentation by Eliminating the Concept of Extraordinary Items . ASU No. 2015-01 eliminates the concept of an extraordinary item from GAAP. As a result, an entity will no longer be required to separately present an extraordinary item on its statement of operations, net of tax, after income from continuing operations or to disclose income taxes and net income per share data applicable to an extraordinary item. However, ASU No. 2015-01 will still retain the presentation and disclosure guidance for items that are unusual in nature and occur infrequently. ASU No. 2015-01 is effective for annual reporting periods beginning after December 15, 2015, including interim periods within that reporting period, although early adoption is permitted. We do not expect the adoption of this standard to materially impact our consolidated financial statements, absent any material transactions in future periods that would have qualified for extraordinary item presentation under the prior guidance.
2. | NET INCOME PER COMMON SHARE ATTRIBUTABLE TO VERINT SYSTEMS INC. |
The following table summarizes the calculation of basic and diluted net income per common share attributable to Verint Systems Inc. for the years ended January 31, 2015 , 2014 , and 2013 :
75
Table of Contents
|
| Year Ended January 31, | ||||||||||
(in thousands, except per share amounts) |
| 2015 |
| 2014 |
| 2013 | ||||||
Net income |
| $ | 36,402 | |
| $ | 58,776 | |
| $ | 58,804 | |
Net income attributable to noncontrolling interest |
| 5,471 | |
| 5,019 | |
| 4,802 | | |||
Net income attributable to Verint Systems Inc. |
| 30,931 | |
| 53,757 | |
| 54,002 | | |||
Dividends on Preferred Stock |
| - | |
| (174 | ) |
| (15,472 | ) | |||
Net income attributable to Verint Systems Inc. for basic net income per common share |
| 30,931 | |
| 53,583 | |
| 38,530 | | |||
Dilutive effect of dividends on Preferred Stock |
| - | |
| - | |
| - | | |||
Net income attributable to Verint Systems Inc. for diluted net income per common share |
| $ | 30,931 | |
| $ | 53,583 | |
| $ | 38,530 | |
Weighted-average shares outstanding: |
|
| |
|
| |
|
| | |||
Basic |
| 58,096 | |
| 52,967 | |
| 39,748 | | |||
Dilutive effect of employee equity award plans |
| 1,278 | |
| 911 | |
| 564 | | |||
Dilutive effect of 1.50% convertible senior notes |
| - | |
| - | |
| - | | |||
Dilutive effect of warrants |
| - | |
| - | |
| - | | |||
Dilutive effect of assumed conversion of Preferred Stock |
| - | |
| - | |
| - | | |||
Diluted |
| 59,374 | |
| 53,878 | |
| 40,312 | | |||
Net income per common share attributable to Verint Systems Inc.: |
|
| |
|
| |
|
| | |||
Basic |
| $ | 0.53 | |
| $ | 1.01 | |
| $ | 0.97 | |
Diluted |
| $ | 0.52 | |
| $ | 0.99 | |
| $ | 0.96 | |
We excluded the following weighted-average common shares underlying stock-based awards and the assumed conversion of our Preferred Stock from the calculations of diluted net income per common share because their inclusion would have been anti-dilutive:
|
| Year Ended January 31, | |||||||
(in thousands) |
| 2015 |
| 2014 |
| 2013 | |||
Common shares excluded from calculation: |
|
| |
|
| |
|
| |
Stock options and restricted stock-based awards |
| 226 | |
| 247 | |
| 749 | |
1.50% convertible senior notes |
| 3,876 | |
| - | |
| - | |
Warrants |
| 3,876 | |
| - | |
| - | |
Preferred Stock |
| - | |
| 123 | |
| 11,043 | |
The Notes will not impact the calculation of diluted net income per share unless the average price of our common stock, as calculated in accordance with the terms of the indenture governing the Notes, exceeds the conversion price of $64.46 per share. Likewise, diluted net income per share will not include any effect from the Warrants unless the average price of our common stock, as calculated under the terms of the Warrants, exceeds the exercise price of $75.00 per share. Further details regarding the Notes and the Warrants appear in Note 6, "Long-Term Debt".
The Preferred Stock was canceled in conjunction with the CTI Merger on February 4, 2013, as further discussed in Note 9, "Convertible Preferred Stock" and Note 15, "Merger with CTI". The weighted-average common shares underlying the assumed conversion of the Preferred Stock for the year ended January 31, 2014 in the table above reflect Preferred Stock as outstanding for only four days during that period.
3. CASH, CASH EQUIVALENTS AND SHORT-TERM INVESTMENTS
The following tables summarize our cash, cash equivalents and short-term investments as of January 31, 2015 and 2014:
76
Table of Contents
|
| January 31, 2015 | ||||||||||||||
(in thousands) |
| Cost Basis |
| Gross Unrealized Gains |
| Gross Unrealized Losses |
| Estimated Fair Value | ||||||||
Cash and cash equivalents: |
|
|
|
|
|
|
|
| ||||||||
Cash and bank time deposits |
| $ | 281,890 | |
| $ | - | |
| $ | - | |
| $ | 281,890 | |
Money market funds |
| 183 | |
| - | |
| - | |
| 183 | | ||||
Commercial paper |
| 2,999 | |
| - | |
| - | |
| 2,999 | | ||||
Total cash and cash equivalents |
| $ | 285,072 | |
| $ | - | |
| $ | - | |
| $ | 285,072 | |
|
|
|
|
|
|
|
|
| ||||||||
Short-term investments: |
|
|
|
|
|
|
|
| ||||||||
Commercial paper and corporate debt securities (available-for-sale) |
| $ | 13,741 | |
| $ | 101 | |
| $ | - | |
| $ | 13,842 | |
Bank time deposits |
| 21,909 | |
| - | |
| - | |
| 21,909 | | ||||
Total short-term investments |
| $ | 35,650 | |
| $ | 101 | |
| $ | - | |
| $ | 35,751 | |
|
| January 31, 2014 | ||||||||||||||
(in thousands) |
| Cost Basis |
| Gross Unrealized Gains |
| Gross Unrealized Losses |
| Estimated Fair Value | ||||||||
Cash and cash equivalents: |
|
|
|
|
|
|
|
| ||||||||
Cash and bank time deposits |
| $ | 314,604 | |
| $ | - | |
| $ | - | |
| $ | 314,604 | |
Money market funds |
| 14,023 | |
| - | |
| - | |
| 14,023 | | ||||
Commercial paper |
| 49,986 | |
| 5 | |
| - | |
| 49,991 | | ||||
Total cash and cash equivalents |
| $ | 378,613 | |
| $ | 5 | |
| $ | - | |
| $ | 378,618 | |
|
|
|
|
|
|
|
|
| ||||||||
Short-term investments: |
|
|
|
|
|
|
|
| ||||||||
Commercial paper and corporate debt securities (available-for-sale) |
| $ | 9,402 | |
| $ | 4 | |
| $ | - | |
| $ | 9,406 | |
Bank time deposits |
| 22,643 | |
| $ | - | |
| $ | - | |
| 22,643 | | ||
Total short-term investments |
| $ | 32,045 | |
| $ | 4 | |
| $ | - | |
| $ | 32,049 | |
Bank time deposits which are reported within short-term investments consist of deposits held outside of the U.S. with maturities of greater than 90 days, or without specified maturity dates which we intend to hold for periods in excess of 90 days. All other bank deposits are included within cash and cash equivalents.
As of January 31, 2015 and 2014, all of our available-for-sale investments had contractual maturities of less than one year.
Gains and losses on sales of available-for-sale securities during the years ended January 31, 2015, 2014, and 2013 were not significant.
During the years ended January 31, 2015 and 2014, proceeds from sales and maturities of available-for-sale securities were $13.7 million and $178.8 million , respectively, and were not significant for the year ended January 31, 2013.
We believe that the investments we held at January 31, 2015 were not other-than-temporarily impaired. We held no available-for-sale securities with unrealized losses at January 31, 2015. We do not intend to sell our available-for-sale securities and it is not more likely than not that we will be required to sell them before recovery at par, which may be at maturity.
4. | BUSINESS COMBINATIONS |
Year Ended January 31, 2015
KANA Software, Inc.
On February 3, 2014, we completed the acquisition of KANA Software, Inc. and its subsidiaries through the merger of KANA Software, Inc.'s parent holding company, Kay Technology Holdings, Inc. (collectively, "KANA"), with an indirect, wholly owned subsidiary of Verint, with Kay Technology Holdings, Inc. continuing as the surviving company and as our wholly owned
77
Table of Contents
subsidiary. The purchase price consisted of $542.4 million of cash paid at the closing, partially offset by $25.1 million of KANA's cash received in the acquisition, and a $0.7 million post-closing purchase price adjustment, resulting in net cash consideration of $516.6 million . The post-closing purchase price adjustment resulted from the final determination of KANA's February 3, 2014 cash, debt, net working capital, transaction expenses and taxes, and was received in cash in May 2014.
The merger consideration was funded by a combination of cash on hand, $300.0 million of incremental term loans incurred in connection with an amendment to our Credit Agreement, and $125.0 million of borrowings under our 2013 Revolving Credit Facility (further details for which appear in Note 6, "Long-Term Debt").
KANA, based in Sunnyvale, California and with global operations, is a leading provider of on-premises and cloud-based solutions which create differentiated, personalized, and integrated customer experiences for large enterprises and mid-market organizations. KANA has been substantially integrated into our Enterprise Intelligence operating segment.
Among the factors contributing to the recognition of goodwill as a component of the KANA purchase price allocation were synergies in products and technologies, and the addition of a skilled, assembled workforce. This goodwill has been assigned to our Enterprise Intelligence segment and while generally not deductible for income tax purposes, certain goodwill related to previous business combinations by KANA will be deductible for income tax purposes.
In connection with the purchase price allocation for KANA, the estimated fair value of undelivered performance obligations under customer contracts assumed in the merger was determined utilizing a cost build-up approach. The cost build-up approach calculates fair value by estimating the costs required to fulfill the obligations plus a reasonable profit margin, which approximates the amount that we believe would be required to pay a third party to assume the performance obligations. The estimated costs to fulfill the performance obligations were based on the historical direct costs for delivering similar services. As a result, in allocating the purchase price, we recorded $7.9 million of current and long-term deferred revenue, representing the estimated fair value of undelivered performance obligations for which payment had been received, which will be recognized as revenue as the underlying performance obligations are delivered. For undelivered performance obligations for which payment had not yet been received, we recorded an $18.6 million asset within prepaid expenses and other current assets as a component of the purchase price allocation. We are amortizing this asset over the underlying delivery periods for these obligations as a reduction to revenue, which reduces the revenue we recognize for providing these services to its estimated fair value.
As a result of the substantial integration of KANA into our Enterprise Intelligence operating segment, we are unable to provide a meaningful measure of the impact on revenue and net income attributable to KANA in our consolidated statements of operations for the year ended January 31, 2015.
Transaction and related costs directly related to the acquisition of KANA, consisting primarily of professional fees and integration expenses, were $10.0 million for the year ended January 31, 2015, and were expensed as incurred and are included in selling, general and administrative expenses.
UTX Technologies Limited
On March 31, 2014, we completed the acquisition of all of the outstanding shares of UTX Technologies Limited ("UTX"), a provider of certain mobile device tracking solutions for security applications, from UTX Limited. UTX Limited was our supplier of these products to our Communications Intelligence operating segment prior to the acquisition. The purchase price consisted of $82.9 million of cash paid at closing, and up to $1.5 million of potential future contingent consideration payments to UTX Limited, the acquisition date fair value of which was estimated to be $1.3 million .
UTX is based in the Europe, the Middle East and Africa ("EMEA") region and has been integrated into our Communications Intelligence operating segment.
Among the factors contributing to the recognition of goodwill as a component of the UTX purchase price allocation were synergies in products and technologies, and the addition of a skilled, assembled workforce. This goodwill has been assigned to our Communications Intelligence segment and is not deductible for income tax purposes.
For year ended January 31, 2015, we recorded a charge of $0.2 million within selling, general and administrative expenses to increase the fair value of the UTX contingent consideration obligation to $1.5 million , in consideration of UTX achieving certain performance targets. This amount was paid to UTX Limited prior to January 31, 2015.
Revenue and income before provision for income taxes attributable to UTX from March 31, 2014 through January 31, 2015 were not significant to our consolidated operating results.
78
Table of Contents
Transaction and related costs directly related to the acquisition of UTX, consisting primarily of professional fees, integration expenses and related adjustments, were $2.5 million for the year ended January 31, 2015 and were expensed as incurred and are included in selling, general and administrative expenses.
As a result of the UTX acquisition, we recorded a $2.6 million charge for the impairment of certain capitalized software development costs during the year ended January 31, 2015, reflecting strategy changes in certain product development initiatives. This charge is reflected within cost of product revenue.
Other Business Combinations
We completed two separate acquisitions of certain technologies and other assets for use in our Communications Intelligence operating segment on April 16, 2014 and January 15, 2015, respectively, in transactions that qualified as business combinations. These business combinations were not material to our consolidated financial statements, individually or in the aggregate.
Purchase Price Allocations
The purchase price allocations for the business combinations completed during the year ended January 31, 2015 were initially prepared on a preliminary basis, subject to change as additional information became available during the respective measurement periods (up to one year from the respective acquisition dates). The purchase price allocation for KANA is now complete, but the purchase price allocation for UTX remains preliminary. Fair values still under review for UTX include values assigned to identifiable intangible assets, deferred income taxes and reserves for uncertain income tax positions. Through January 31, 2015, adjustments identified and recorded subsequent to the initial purchase price allocations for both KANA and UTX were not material.
The purchase prices were allocated to the tangible and intangible assets acquired and liabilities assumed based on their estimated fair values on the acquisition dates, with the remaining unallocated purchase prices recorded as goodwill. The fair values assigned to identifiable intangible assets acquired were determined primarily by using the income approach, which discounts expected future cash flows to present value using estimates and assumptions determined by management.
The following table sets forth the components and the allocations of the purchase prices for our acquisitions of KANA and UTX, including adjustments identified subsequent to the respective acquisition dates:
(in thousands) |
| KANA |
| UTX | ||||
Components of Purchase Prices: |
|
| |
|
| |||
Cash, including post-closing adjustments |
| $ | 541,685 | |
| $ | 82,901 | |
Fair value of contingent consideration |
| - | |
| 1,347 | | ||
Total purchase prices |
| $ | 541,685 | |
| $ | 84,248 | |
|
|
|
|
| ||||
Allocation of Purchase Prices: |
|
| |
|
| |||
Net tangible assets (liabilities): |
|
| |
|
| |||
Accounts receivable |
| $ | 18,473 | |
| $ | - | |
Other current assets, including cash acquired |
| 49,798 | |
| 3,836 | | ||
Other assets |
| 12,203 | |
| 924 | | ||
Current and other liabilities |
| (17,851 | ) |
| (263 | ) | ||
Deferred revenue - current and long-term |
| (7,932 | ) |
| (340 | ) | ||
Deferred income taxes - current and long-term |
| (60,879 | ) |
| (4,882 | ) | ||
Net tangible liabilities |
| (6,188 | ) |
| (725 | ) | ||
Identifiable intangible assets: |
|
| |
|
| |||
Customer relationships |
| 152,700 | |
| 2,000 | | ||
Developed technology |
| 55,500 | |
| 37,400 | | ||
Trademarks and trade names |
| 11,500 | |
| - | | ||
Other intangible assets |
| - | |
| 1,100 | | ||
Total identifiable intangible assets |
| 219,700 | |
| 40,500 | | ||
Goodwill |
| 328,173 | |
| 44,473 | | ||
Total purchase price allocations |
| $ | 541,685 | |
| $ | 84,248 | |
79
Table of Contents
For the acquisition of KANA, the acquired customer relationships, developed technology, and trademarks and trade names were assigned estimated useful lives of five to ten years, three to five years, and five years, respectively, the weighted average of which is approximately 8.1 years.
For the acquisition of UTX, the acquired customer relationships, developed technology and other intangible assets were assigned estimated useful lives of three years, four years, and four years, respectively, the weighted average of which is approximately 4.0 years.
The weighted-average estimated useful life of all finite-lived identifiable intangible assets acquired during the year ended January 31, 2015 is 7.4 years.
The acquired identifiable intangible assets are being amortized on a straight-line basis, which we believe approximates the pattern in which the assets are utilized, over their estimated useful lives.
We have included the financial results of these business combinations in our consolidated financial statements from their respective acquisition dates.
Pro Forma Information
The following table provides unaudited pro forma operating results for the years ended January 31, 2015 and 2014, as if KANA and UTX had been acquired on February 1, 2013. These unaudited pro forma results reflect certain adjustments related to these acquisitions, including amortization expense on finite-lived intangible assets acquired from KANA and UTX, interest expense and fees associated with additional long-term debt incurred to partially fund the acquisition of KANA, and adjustments to recognize the fair value of revenue associated with performance obligations assumed in the acquisition of KANA.
For purposes of the following unaudited pro forma operating results, a $44.4 million income tax benefit resulting from a reduction of valuation allowances associated from the acquisition of KANA is reflected in the pro forma operating results for the year ended January 31, 2014. The actual tax benefit was recorded during the year ended January 31, 2015, as further described in Note 11, "Income Taxes".
The unaudited pro forma results do not include any operating efficiencies or potential cost savings which may result from these business combinations. Accordingly, such unaudited pro forma amounts are not necessarily indicative of the results that actually would have occurred had the acquisitions been completed on February 1, 2013, nor are they indicative of future operating results.
|
| Year Ended January 31, | ||||||
(in thousands, except per share amounts) |
| 2015 |
| 2014 | ||||
Revenue |
| $ | 1,158,141 | |
| $ | 1,032,733 | |
Net income |
| $ | 29,644 | |
| $ | 50,432 | |
Net income attributable to Verint Systems Inc. |
| $ | 24,173 | |
| $ | 45,413 | |
Net income per common share attributable to Verint Systems Inc.: |
|
|
|
| ||||
Basic |
| $ | 0.42 | |
| $ | 0.85 | |
Diluted |
| $ | 0.41 | |
| $ | 0.84 | |
Year Ended January 31, 2014
On February 4, 2013, we completed the CTI Merger, details for which appear in Note 15, "Merger with CTI".
Other Business Combinations
During the year ended January 31, 2014, in addition to the CTI Merger, we completed five business combinations:
• | On August 1, 2013, we acquired certain technology and other assets for use in our Communications Intelligence operating segment in a transaction that qualified as a business combination. |
80
Table of Contents
• | On October 4, 2013, we acquired all of the outstanding shares of a privately held company specializing in performance improvements in customer contact centers, based in the EMEA region, that has been integrated into our Enterprise Intelligence operating segment. |
• | On November 6, 2013, we acquired certain technology and other assets for use in our Communications Intelligence operating segment in a transaction that qualified as a business combination. |
• | On December 6, 2013, we acquired all of the outstanding shares of a privately held management consulting and performance management company, based in the Americas region, that has been integrated into our Enterprise Intelligence operating segment. |
• | On December 19, 2013, we acquired all of the outstanding shares of a privately held provider of fraud prevention and identity authentication solutions, based in the Americas region, that has been integrated into our Enterprise Intelligence operating segment. |
These business combinations were not individually material to our consolidated financial statements.
We have included the financial results of these business combinations in our consolidated financial statements from their respective acquisition dates.
The combined consideration for these business combinations was approximately $46.1 million , including $34.2 million of combined cash paid at the closings. We also agreed to make potential additional cash payments to the respective former shareholders or asset owners aggregating up to approximately $27.4 million , contingent upon the achievement of certain performance targets over periods ending through January 2019. The combined fair values of these contingent consideration obligations were estimated to be $11.9 million as of the respective acquisition dates.
The $11.9 million acquisition date combined fair values of the contingent consideration obligations were estimated based on probability adjusted present values of the consideration expected to be transferred using significant inputs that are not observable in the market. Key assumptions used in these estimates included probability assessments with respect to the likelihood of achieving the performance targets and discount rates consistent with the level of risk of achievement. At each reporting date, we revalue the contingent consideration obligations to their fair values and record increases and decreases in fair value within selling, general and administrative expenses in our consolidated statements of operations. Changes in the fair value of the contingent consideration obligations result from changes in discount periods and rates, and changes in probability assumptions with respect to the likelihood of achieving the performance targets. For the years ended January 31, 2015 and 2014, we recorded charges of $0.4 million and $0.3 million , respectively, within selling, general and administrative expenses for changes in the fair values of these contingent consideration obligations, which primarily reflected the impacts of revised expectations of achieving the performance targets. As of January 31, 2015, the aggregate fair value of the contingent consideration obligations associated with these acquisitions was $6.8 million , of which $1.3 million was recorded within accrued expenses and other current liabilities, and $5.5 million was recorded within other liabilities.
The purchase prices were allocated to the tangible assets and intangible assets acquired and liabilities assumed based on their estimated fair values on the acquisition dates, with the remaining unallocated purchase prices recorded as goodwill. The fair values assigned to identifiable intangible assets acquired in these business combinations were determined primarily by using the income approach, which discounts expected future cash flows attributable to these assets to present value using estimates and assumptions determined by management. The acquired identifiable finite-lived intangible assets are being amortized primarily on a straight-line basis, which we believe approximates the pattern in which the assets are utilized, over their estimated useful lives.
Included among the factors contributing to the recognition of goodwill in these transactions were synergies in products and technologies, and the addition of skilled, assembled workforces. Of the $19.0 million of goodwill associated with these business combinations, $18.3 million and $0.7 million was assigned to our Enterprise Intelligence and Communications Intelligence segments, respectively. For income tax purposes, $5.3 million of this goodwill is deductible and $13.7 million is not deductible.
Revenue and the impact on net income attributable to these acquisitions for the year ended January 31, 2014 were not significant.
81
Table of Contents
Transaction and related costs, consisting primarily of professional fees and integration expenses, directly related to these acquisitions, totaled $0.9 million and $2.7 million for the years ended January 31, 2015 and 2014, respectively. All transaction and related costs were expensed as incurred and are included in selling, general and administrative expenses.
The following table sets forth the components and the allocations of the combined purchase prices for the business combinations completed during the year ended January 31, 2014, other than the CTI Merger.
(in thousands) |
| Amount | ||
Components of Purchase Prices: |
|
| | |
Cash |
| $ | 34,229 | |
Fair value of contingent consideration |
| 11,907 | | |
Total purchase prices |
| $ | 46,136 | |
|
|
| ||
Allocation of Purchase Prices: |
|
| | |
Net tangible assets: |
|
| | |
Accounts receivable |
| $ | 3,687 | |
Other current assets |
| 3,050 | | |
Other assets |
| 275 | | |
Current and other liabilities |
| (2,717 | ) | |
Deferred revenue |
| (1,310 | ) | |
Deferred income taxes - current and long-term |
| (2,272 | ) | |
Net tangible assets |
| 713 | | |
Identifiable intangible assets: |
|
| | |
Developed technology |
| 14,009 | | |
Customer relationships |
| 11,714 | | |
Trademarks and trade names |
| 649 | | |
Total identifiable intangible assets |
| 26,372 | | |
Goodwill |
| 19,051 | | |
Total purchase price allocations |
| $ | 46,136 | |
For these acquisitions, customer relationships, developed technology, and trademarks and trade names were assigned estimated useful lives of from six years to nine years, from three years to five years, and from one year to two years, respectively, the weighted average of which is approximately 5.9 years.
The pro forma impact of these acquisitions was not material to our historical consolidated operating results and is therefore not presented.
Year Ended January 31, 2013
We did not complete any business combinations during the year ended January 31, 2013.
Other Business Combination Information
For the years ended January 31, 2015, 2014 and 2013, we recorded a charge of $0.3 million and benefits of $2.8 million and $6.2 million , respectively, within selling, general and administrative expenses for changes in the fair values of contingent consideration obligations associated with business combinations completed prior to January 31, 2012. The aggregate fair value of the remaining contingent consideration obligations associated with these acquisitions was not significant at January 31, 2015.
In connection with a business combination completed during the year ended January 31, 2012, we assumed approximately $5.2 million of long-term liabilities associated with uncertain tax positions of the acquired company. A corresponding indemnification asset of $5.2 million was also recorded, recognizing the selling shareholders' contractual obligation to indemnify us for these pre-acquisition liabilities. As of January 31, 2015 and 2014, these liabilities were $1.4 million and $1.5 million , respectively, and were included within other liabilities. The corresponding indemnification assets as of January 31, 2015 and 2014 were $0.4 million and $0.4 million , respectively, and were included within other assets. During the years ended January 31, 2014 and 2013, we met the criteria required to adjust several of these pre-acquisition uncertain tax positions, and
82
Table of Contents
therefore tax liabilities of $1.0 million and $1.1 million were reversed and reflected as components of the provision for income taxes for the years ended January 31, 2014 and 2013, respectively. Because the liabilities for the uncertain tax positions were reversed, we also recorded write-offs of the corresponding indemnification assets of $0.9 million and $1.1 million for the years ended January 31, 2014 and 2013, respectively, which are included in other income (expense), net for those years. In addition, during the years ended January 31, 2014 and 2013, based upon our assessment of the collectibility of the indemnification from the former shareholders of the acquired company, we recognized impairments of $0.9 million and $0.4 million , respectively, of the indemnification assets associated with these liabilities, which are included in other income (expense), net for those years. No liability reversals or impairments were recorded for the year ended January 31, 2015. The carrying values of these assets and liabilities were also impacted by foreign currency exchange rate fluctuations.
5. | INTANGIBLE ASSETS AND GOODWILL |
Acquisition-related intangible assets consisted of the following as of January 31, 2015 and 2014 :
|
| January 31, 2015 | ||||||||||
(in thousands) |
| Cost |
| Accumulated Amortization |
| Net | ||||||
Intangible assets, all with finite lives: |
|
| |
|
| |
|
| | |||
Customer relationships |
| $ | 378,756 | |
| $ | (176,796 | ) |
| $ | 201,960 | |
Acquired technology |
| 201,294 | |
| (104,117 | ) |
| 97,177 | | |||
Trade names |
| 18,799 | |
| (9,131 | ) |
| 9,668 | | |||
Non-competition agreements |
| 3,625 | |
| (2,331 | ) |
| 1,294 | | |||
Distribution network |
| 4,440 | |
| (2,645 | ) |
| 1,795 | | |||
Total intangible assets |
| $ | 606,914 | |
| $ | (295,020 | ) |
| $ | 311,894 | |
|
| January 31, 2014 | ||||||||||
(in thousands) |
| Cost |
| Accumulated Amortization |
| Net | ||||||
Intangible assets with finite lives: |
|
| |
|
| |
|
| | |||
Customer relationships |
| $ | 240,208 | |
| $ | (141,714 | ) |
| $ | 98,494 | |
Acquired technology |
| 106,361 | |
| (76,922 | ) |
| 29,439 | | |||
Trade names |
| 13,378 | |
| (11,378 | ) |
| 2,000 | | |||
Non-competition agreements |
| 5,514 | |
| (4,970 | ) |
| 544 | | |||
Distribution network |
| 2,440 | |
| (1,840 | ) |
| 600 | | |||
Backlog |
| 386 | |
| (316 | ) |
| 70 | | |||
Total intangible assets with finite lives |
| 368,287 | |
| (237,140 | ) |
| 131,147 | | |||
In-process research and development, with indefinite lives |
| 1,700 | |
| - | |
| 1,700 | | |||
Total intangible assets |
| $ | 369,987 | |
| $ | (237,140 | ) |
| $ | 132,847 | |
The following table presents net acquisition-related intangible assets by reportable segment as of January 31, 2015 and 2014 :
|
| January 31, | ||||||
(in thousands) | | 2015 | | 2014 | ||||
Enterprise Intelligence | | $ | 261,354 | | | $ | 115,928 | |
Communications Intelligence | | 49,670 | | | 14,856 | | ||
Video Intelligence | | 870 | | | 2,063 | | ||
Total | | $ | 311,894 | | | $ | 132,847 | |
Total amortization expense recorded for acquisition-related intangible assets was $76.2 million , $36.9 million , and $39.3 million for the years ended January 31, 2015 , 2014 , and 2013 , respectively. The reported amount of net acquisition-related intangible assets can fluctuate from the impact of changes in foreign exchange rates on intangible assets not denominated in U.S. dollars.
83
Table of Contents
Estimated future amortization expense on finite-lived acquisition-related intangible assets is as follows:
(in thousands) | |
| | |
Years Ending January 31, | | Amount | ||
2016 | | $ | 78,790 | |
2017 | | 72,097 | | |
2018 | | 53,788 | | |
2019 | | 25,277 | | |
2020 | | 19,237 | | |
2021 and thereafter | | 62,705 | | |
Total | | $ | 311,894 | |
During the year ended January 31, 2014, we recorded a $0.5 million impairment of an acquired intangible asset, which is included within cost of product revenue. No impairments of acquired intangible assets were recorded during the years ended January 31, 2015 and 2013.
Goodwill activity for the years ended January 31, 2015 , and 2014 , in total and by reportable segment, was as follows:
|
|
|
| Reportable Segment | ||||||||||||
(in thousands) |
| Total |
| Enterprise Intelligence |
| Communications Intelligence |
| Video Intelligence | ||||||||
Year Ended January 31, 2014: |
|
|
|
|
|
|
|
| ||||||||
Goodwill, gross, at January 31, 2013 |
| $ | 896,774 | |
| $ | 771,738 | |
| $ | 48,233 | |
| $ | 76,803 | |
Accumulated impairment losses through January 31, 2013 |
| (66,865 | ) |
| (30,791 | ) |
| - | |
| (36,074 | ) | ||||
Goodwill, net, at January 31, 2013 |
| 829,909 | |
| 740,947 | |
| 48,233 | |
| 40,729 | | ||||
Business combinations |
| 19,051 | |
| 18,339 | |
| 712 | |
| - | | ||||
Foreign currency translation and other |
| 4,429 | |
| 5,645 | |
| (1,107 | ) |
| (109 | ) | ||||
Goodwill, net, at January 31, 2014 |
| $ | 853,389 | |
| $ | 764,931 | |
| $ | 47,838 | |
| $ | 40,620 | |
|
|
|
|
|
|
|
|
| ||||||||
Year Ended January 31, 2015: |
|
|
|
|
|
|
|
| ||||||||
Goodwill, gross, at January 31, 2014 |
| $ | 920,254 | |
| $ | 795,722 | |
| $ | 47,838 | |
| $ | 76,694 | |
Accumulated impairment losses through January 31, 2014 |
| (66,865 | ) |
| (30,791 | ) |
| - | |
| (36,074 | ) | ||||
Goodwill, net, at January 31, 2014 |
| 853,389 | |
| 764,931 | |
| 47,838 | |
| 40,620 | | ||||
Business combinations |
| 382,422 | |
| 328,173 | |
| 54,249 | |
| - | | ||||
Foreign currency translation and other |
| (34,994 | ) |
| (31,582 | ) |
| (826 | ) |
| (2,586 | ) | ||||
Goodwill, net, at January 31, 2015 |
| $ | 1,200,817 | |
| $ | 1,061,522 | |
| $ | 101,261 | |
| $ | 38,034 | |
|
|
|
|
|
|
|
|
| ||||||||
Balance at January 31, 2015: |
| | |
|
| |
|
| |
|
| | ||||
Goodwill, gross, at January 31, 2015 |
| $ | 1,267,682 | |
| $ | 1,092,313 | |
| $ | 101,261 | |
| $ | 74,108 | |
Accumulated impairment losses through January 31, 2015 |
| (66,865 | ) |
| (30,791 | ) |
| - | |
| (36,074 | ) | ||||
Goodwill, net, at January 31, 2015 |
| $ | 1,200,817 | |
| $ | 1,061,522 | |
| $ | 101,261 | |
| $ | 38,034 | |
Goodwill resulting from a business combination is assigned, at the acquisition date, to those reporting units expected to benefit from the synergies of the combination.
The results of our goodwill impairment testing as of November 1, 2012 indicated that the estimated fair values of all our reporting units significantly exceeded their carrying values.
Based upon our November 1, 2014 and 2013 goodwill impairment reviews, we concluded that the estimated fair values of our Enterprise Intelligence and Communications Intelligence reporting units significantly exceeded their carrying values. The estimated fair value of our Video Intelligence reporting unit was approximately 20% and 30% greater than its carrying value at November 1, 2014 and 2013, respectively, and we have therefore concluded that this reporting unit is at more than remote risk of failing step one of future goodwill impairment tests, and is therefore at risk of future impairment in the event of significant
84
Table of Contents
unfavorable changes in the assumptions used in our impairment review, including the weighted average cost of capital (discount rate) and growth rates utilized in our discounted cash flow analysis. Although we believe that our current estimates are reasonable and appropriate, our Video Intelligence reporting unit competes in a challenging environment and there can be no assurance that the estimates and assumptions made for purposes of our goodwill impairment test will prove to be accurate predictions of future performance. Delays or declines in spending to install, upgrade or maintain security intelligence systems, technological changes, new competitors, or changes in buying patterns from key customers are examples of circumstances that could adversely impact the fair value of our Video Intelligence reporting unit.
No changes in circumstances or indicators of potential impairment were identified between November 1 and January 31 in each of the years ended January 31, 2015 , 2014 and 2013 .
No goodwill impairment was identified for the years ended January 31, 2015 , 2014 and 2013 .
6. | LONG-TERM DEBT |
The following table summarizes our long-term debt at January 31, 2015 and 2014:
|
| January 31, | ||||||
(in thousands) |
| 2015 |
| 2014 | ||||
1.50% Convertible Senior Notes: |
|
|
|
| ||||
Principal amount |
| $ | 400,000 | |
| $ | - | |
Unamortized debt discount |
| (74,086 | ) |
| - | | ||
1.50% Convertible Senior Notes, net |
| 325,914 | |
| - | | ||
February 2014 Term Loans: |
|
|
|
| ||||
Gross amount |
| 130,729 | |
| - | | ||
Unamortized debt discount |
| (277 | ) |
| - | | ||
February 2014 Term Loans, net |
| 130,452 | |
| - | | ||
March 2014 Term Loans |
| 280,413 | |
| - | | ||
March 2013 Term Loans: |
|
| |
|
| | ||
Gross amount |
| - | |
| 645,125 | | ||
Unamortized debt discount |
| - | |
| (2,827 | ) | ||
March 2013 Term Loans, net |
| - | |
| 642,298 | | ||
Other debt |
| 23 | |
| 87 | | ||
Total debt |
| 736,802 | |
| 642,385 | | ||
Less: current maturities |
| 23 | |
| 6,555 | | ||
Long-term debt |
| $ | 736,779 | |
| $ | 635,830 | |
1.50% Convertible Senior Notes
On June 18, 2014, we issued $400.0 million in aggregate principal amount of 1.50% convertible senior notes due June 1, 2021, unless earlier converted by the holders pursuant to their terms. Net proceeds from the Notes after underwriting discounts were $391.9 million . The Notes pay interest in cash semiannually in arrears at a rate of 1.50% per annum.
The Notes were issued concurrently with our public issuance of 5,750,000 shares of common stock, the majority of the combined net proceeds of which were used to partially repay certain indebtedness under our Credit Agreement, as further described below. Additional details regarding our June 18, 2014 issuance of common stock appear in Note 8, "Stockholders' Equity".
The Notes are unsecured and rank senior in right of payment to our indebtedness that is expressly subordinated in right of payment to the Notes; equal in right of payment to our indebtedness that is not so subordinated; effectively subordinated in right of payment to any of our secured indebtedness to the extent of the value of the assets securing such indebtedness; and structurally subordinated to indebtedness and other liabilities of our subsidiaries.
The Notes are convertible into, at our election, cash, shares of common stock, or a combination of both, subject to satisfaction of specified conditions and during specified periods, as described below. If converted, we currently intend to pay cash in respect of the principal amount of the Notes.
85
Table of Contents
The conversion price of the Notes at any time is equal to $1,000 divided by the then-applicable conversion rate. The Notes have a conversion rate of 15.5129 shares of common stock per $1,000 principal amount of Notes, which represents an effective conversion price of approximately $64.46 per share of common stock and would result in the issuance of approximately 6,205,000 shares if all of the Notes were converted. The conversion rate has not changed since issuance of the Notes, although throughout the term of the Notes, the conversion rate may be adjusted upon the occurrence of certain events.
Holders may surrender their Notes for conversion at any time prior to the close of business on the business day immediately preceding December 1, 2020, only under the following circumstances:
• | during any calendar quarter commencing after the calendar quarter which ended on September 30, 2014, if the closing sale price of our common stock, for at least 20 trading days (whether or not consecutive) in the period of 30 consecutive trading days ending on the last trading day of the immediately preceding calendar quarter, is more than 130% of the conversion price of the Notes in effect on each applicable trading day; |
• | during the ten consecutive trading-day period following any five consecutive trading-day period in which the trading price for the Notes for each such trading day was less than 98% of the closing sale price of our common stock on such date multiplied by the then-current conversion rate; or |
• | upon the occurrence of specified corporate events, as described in the indenture governing the Notes, such as a consolidation, merger, or binding share exchange. |
On or after December 1, 2020 until the close of business on the second scheduled trading day immediately preceding the maturity date, holders may surrender their Notes for conversion regardless of whether any of the foregoing conditions have been satisfied.
As of January 31, 2015, the Notes were not convertible.
In accordance with accounting guidance for convertible debt with a cash conversion option, we separately accounted for the debt and equity components of the Notes in a manner that reflected our estimated nonconvertible debt borrowing rate. We estimated the carrying amount of the debt component of the Notes to be $319.9 million at the issuance date, assuming a 5.00% non-convertible borrowing rate. The carrying amount of the equity component was determined to be approximately $80.1 million by deducting the carrying amount of the debt component from the principal amount of the Notes, and was recorded as an increase to additional paid-in capital. The excess of the principal amount of the debt component over its carrying amount (the "debt discount") is being amortized as interest expense over the term of the Notes using the effective interest method. The equity component is not remeasured as long as it continues to meet the conditions for equity classification.
We allocated transaction costs related to the issuance of the Notes, including underwriting discounts, of $7.6 million and $1.9 million to the debt and equity components, respectively. Issuance costs attributable to the debt component were recorded within other assets and are being amortized as interest expense over the term of the Notes, and issuance costs attributable to the equity component were netted with the equity component in additional paid-in capital. The carrying amount of the equity component, net of issuance costs, was $78.2 million at January 31, 2015. Including the impact of the debt discount and related deferred debt issuance costs, the effective interest rate on the Notes was approximately 5.29% at January 31, 2015.
Based on the closing market price of our common stock on January 31, 2015, the if-converted value of the Notes was less than the aggregate principal amount of the Notes.
Note Hedges and Warrants
Concurrently with the issuance of the Notes, we entered into convertible note hedge transactions (the "Note Hedges") and sold warrants (the "Warrants"). The combination of the Note Hedges and the Warrants serves to increase the effective initial conversion price for the Notes to $75.00 per share. The Note Hedges and Warrants are each separate instruments from the Notes.
Note Hedges
Pursuant to the Note Hedges, we purchased call options on our common stock, under which we have the right to acquire from the counterparties up to approximately 6,205,000 shares of our common stock, subject to customary anti-dilution adjustments, at a price of $64.46 , which equals the initial conversion price of the Notes. Our exercise rights under the Note Hedges generally trigger upon conversion of the Notes and the Note Hedges terminate upon maturity of the Notes, or the first day the Notes are
86
Table of Contents
no longer outstanding. The Note Hedges may be settled in cash, shares of our common stock, or a combination thereof, at our option, and are intended to reduce our exposure to potential dilution upon conversion of the Notes. We paid $60.8 million for the Note Hedges, which was recorded as a reduction to additional paid-in capital. As of January 31, 2015, we had not purchased any shares of our common stock under the Note Hedges.
Warrants
We sold the Warrants to several counterparties. The Warrants provide the counterparties rights to acquire from us up to approximately 6,205,000 shares of our common stock at a price of $75.00 per share. The Warrants expire incrementally on a series of expiration dates beginning in August 2021. At expiration, if the market price per share of our common stock exceeds the strike price of the Warrants, we will be obligated to issue shares of our common stock having a value equal to such excess. The Warrants could have a dilutive effect on net income per share to the extent that the market value of our common stock exceeds the strike price of the Warrants. Proceeds from the sale of the Warrants were $45.2 million and were recorded as additional paid-in capital. As of January 31, 2015, no Warrants had been exercised and all Warrants remained outstanding.
The Note Hedges and Warrants both meet the requirements for classification within stockholders' equity, and their respective fair values are not remeasured and adjusted as long as these instruments continue to qualify for stockholders' equity classification.
Credit Agreement
Background
In April 2011, we entered into a credit agreement (together with the subsequent amendments discussed herein, the "Credit Agreement") with our lenders and concurrently terminated a prior credit agreement. The Credit Agreement provided for $770.0 million of secured credit facilities, comprised of $600.0 million of term loans maturing in October 2017 (the "April 2011 Term Loans") and a $170.0 million revolving credit facility maturing in April 2016 (the "2011 Revolving Credit Facility"), subject to increase (up to a maximum increase of $300.0 million ) and reduction from time to time.
We incurred debt issuance costs of $14.8 million associated with the Credit Agreement, which were deferred and were classified within other assets, and were being amortized as interest expense over the term of the Credit Agreement.
2013 Amendment and Restatement of Credit Agreement
On March 6, 2013, we entered into an amendment and restatement agreement with our lenders, providing for the amendment and restatement of the Credit Agreement. The amendment and restatement agreement provided for $850.0 million of senior secured credit facilities, comprised of $650.0 million of term loans maturing in September 2019 (the "March 2013 Term Loans") and a $200.0 million revolving credit facility maturing in March 2018 (the "2013 Revolving Credit Facility"), subject to increase (up to a maximum increase of $300.0 million ) and reduction from time to time.
The March 2013 Term Loans were subject to an original issuance discount of 0.50% , or $3.3 million , resulting in net proceeds of $646.7 million . The discount was being amortized as interest expense over the term of the March 2013 Term Loans using the effective interest method.
The majority of the proceeds of the March 2013 Term Loans were used to repay all $576.0 million of outstanding April 2011 Term Loans at the March 6, 2013 closing date of the amendment and restatement agreement. There were no outstanding borrowings under the 2011 Revolving Credit Facility at the March 6, 2013 closing date.
As further described below, on March 7, 2014, the March 2013 Term Loans were extinguished and replaced with the March 2014 Term Loans, and the basis for determining the interest rate on borrowings under the 2013 Revolving Credit Facility was also amended.
From March 6, 2013 through March 6, 2014, the March 2013 Term Loans and borrowings under the 2013 Revolving Credit Facility, if any, incurred interest, payable quarterly or, in the case of Eurodollar loans with an interest period of three months or shorter, at the end of any interest period, at a per annum rate of, at our election:
• | in the case of Eurodollar loans, the Adjusted LIBO Rate plus 3.00% (or, if our corporate credit ratings are BB- and Ba3 or better, 2.75% ). The Adjusted LIBO Rate is the greater of (i) 1.00% per annum and (ii) the product of the LIBO Rate and Statutory Reserves (both as defined in the Credit Agreement), and |
87
Table of Contents
• | in the case of Base Rate loans, the Base Rate plus 2.00% (or, if our corporate credit ratings are BB- and Ba3 or better, 1.75% ). The Base Rate is the greatest of (i) the administrative agent's prime rate, (ii) the Federal Funds Effective Rate (as defined in the Credit Agreement) plus 0.50% and (iii) the Adjusted LIBO Rate for a one -month interest period plus 1.00% . |
As of January 31, 2014, the interest rate on the March 2013 Term Loans was 4.00% .
At the March 6, 2013 closing date of the amendment and restatement agreement, there were $11.0 million of unamortized deferred debt issuance costs and $2.2 million of unamortized discount associated with the April 2011 Term Loans and the 2011 Revolving Credit Facility. Of the $11.0 million of unamortized deferred debt issuance costs, $3.5 million were associated with commitments under the 2011 Revolving Credit Facility provided by lenders that continued to provide revolving credit commitments under the 2013 Revolving Credit Facility and therefore continued to be deferred, and were being amortized over the remaining term of the Credit Agreement. The remaining $7.5 million of unamortized deferred debt issuance costs and the $2.2 million unamortized discount, all of which related to the April 2011 Term Loans, were written off as a $9.7 million loss on early retirement of debt for the year ended January 31, 2014.
We incurred debt issuance costs of approximately $7.5 million associated with the March 2013 Term Loans and the 2013 Revolving Credit Facility, which were deferred and classified within other assets and were being amortized as interest expense over the remaining term of the Credit Agreement. Of these deferred debt issuance costs, $5.0 million were associated with the March 2013 Term Loans and were being amortized using the effective interest rate method, and $2.5 million were associated with the 2013 Revolving Credit Facility and were being amortized on a straight-line basis.
We are required to pay a commitment fee equal to 0.50% per annum of the undrawn portion on the 2013 Revolving Credit Facility, payable quarterly, and customary administrative agent and letter of credit fees. These fees were unchanged from the 2011 Revolving Credit Facility.
2014 Amendments to Credit Agreement
During the year ended January 31, 2015, we entered into five separate amendments to the Credit Agreement as described below.
On February 3, 2014, in connection with the acquisition of KANA, we borrowed $125.0 million under the 2013 Revolving Credit Facility and entered into Amendment No. 1 pursuant to which, on such date, we incurred $300.0 million of incremental term loans (the "February 2014 Term Loans"), maturing in September 2019. The net proceeds of these borrowings were used to fund a portion of the KANA purchase price.
The February 2014 Term Loans were subject to an original issuance discount of 0.25% , or $0.8 million . In June 2014, we wrote off $0.4 million of the unamortized discount in connection with the early retirement of a portion of the February 2014 Term Loans, as further described below. This discount is amortized as interest expense over the term of the February 2014 Term Loans using the effective interest method.
The February 2014 Term Loans bear interest, payable quarterly or, in the case of Eurodollar loans with an interest period of three months or less, at the end of the applicable interest period, at a per annum rate of, at our election:
• | in the case of Eurodollar loans, the Adjusted LIBO Rate plus 2.75% . The Adjusted LIBO Rate is the greater of (i) 0.75% per annum and (ii) the product of (x) the LIBO Rate and (y) Statutory Reserves (both as defined in the Credit Agreement), and |
• | in the case of Base Rate loans, the Base Rate plus 1.75% . The Base Rate is the greatest of (i) the administrative agent's prime rate, (ii) the Federal Funds Effective Rate (as defined in the Credit Agreement) plus 0.50% and (iii) the Adjusted LIBO Rate for a one -month interest period plus 1.00% . |
We incurred debt issuance costs of approximately $7.1 million associated with the February 2014 Term Loans, which were deferred and classified within other assets. In June 2014, we wrote off $3.8 million of these deferred costs in connection with the early retirement of a portion of the February 2014 Term Loans, as further described below. These deferred costs are amortized as interest expense over the term of the February 2014 Term Loans using the effective interest rate method.
On February 3, 2014, we also entered into Amendment No. 2 to, among other things, (i) permit us to increase the permitted amount of additional incremental term loans and revolving credit commitments under the Credit Agreement (beyond the
88
Table of Contents
February 2014 Term Loans borrowed under Amendment No. 1) by up to, in the aggregate, $200.0 million plus an additional amount such that the First Lien Leverage Ratio (as defined in Amendment No. 2) would not exceed the specified maximum ratio set forth therein, (ii) increase the size of certain negative covenant basket carve-outs, (iii) permit us to issue Permitted Convertible Indebtedness (as defined in Amendment No. 2), and (iv) permit us to refinance all or a portion of any existing class of term loans under the Credit Agreement with replacement term loans.
On February 3, 2014, we also entered into Amendment No. 3 to extend by one year, to January 31, 2016, the step-down date of the leverage ratio covenant applicable to our 2013 Revolving Credit Facility and, subject to the effectiveness of Amendment No. 4 (as described below), reprice the interest rate applicable to borrowings under the 2013 Revolving Credit Facility to the interest rate applicable to the February 2014 Term Loans.
On March 7, 2014, we entered into Amendment No. 4 to refinance all $643.5 million of outstanding March 2013 Term Loans at that date with $643.5 million of new term loans (the "March 2014 Term Loans"), maturing in September 2019. The provisions for determining the interest rate on the March 2014 Term Loans are identical to such provisions for the February 2014 Term Loans. The repricing of the interest rate applicable to borrowings under the 2013 Revolving Credit Facility contemplated by Amendment No. 3 became effective on March 7, 2014, upon the effectiveness of Amendment No. 4.
The refinancing of the March 2013 Term Loans with the proceeds of the March 2014 Term Loans pursuant to Amendment No. 4 was accounted for as an early retirement of the March 2013 Term Loans and, as a result, $4.3 million of unamortized deferred debt issuance costs and $2.8 million of unamortized discount associated with the March 2013 Term Loans as of the March 7, 2014 effective date of Amendment No. 4 were written off as a $7.1 million loss on early retirement of debt.
As of January 31, 2015, the interest rate on both the February 2014 Term Loans and the March 2014 Term Loans was 3.50% . Taking into account the impact of original issuance discounts, if any, and related deferred debt issuance costs, the effective interest rates on the February 2014 Term Loans and March 2014 Term Loans were approximately 4.03% and 3.58% , respectively, at that date.
We incurred $2.4 million of debt issuance costs in consideration of Amendment No. 4, which were deferred and classified within other assets. In June 2014, we wrote off $1.3 million of these deferred debt issuance costs in connection with the early retirement of a portion of the March 2014 Term Loans, as further described below. These deferred costs are amortized as interest expense over the remaining term of the March 2014 Term Loans using the effective interest rate method. There was no original issuance discount on the March 2014 Term Loans.
On June 18, 2014, we entered into Amendment No. 5, which increased the commitments under the 2013 Revolving Credit Facility to $300.0 million and extended the termination of the 2013 Revolving Credit Facility to September 2018. We incurred $0.7 million of costs in consideration of Amendment No. 5, which were deferred and recorded within other assets, and are being amortized as interest expense on a straight-line basis over the term of the 2013 Revolving Credit Facility.
Early Partial Retirement of Term Loans - June 2014
On June 18, 2014, we utilized the majority of the combined net proceeds from the issuance of the Notes and the concurrent issuance of 5,750,000 shares of common stock to retire $530.0 million of the February 2014 Term Loans and March 2014 Term Loans, and all $106.0 million of then-outstanding borrowings under the 2013 Revolving Credit Facility. As a result, $3.8 million and $1.3 million of deferred debt issuance costs associated with the February 2014 Term Loans and March 2014 Term Loans, respectively, and $0.4 million of unamortized discount associated with the February 2014 Term Loans, were written off as a $5.5 million loss on early retirement of debt.
Borrowings Under 2013 Revolving Credit Facility
There were no borrowings under the 2013 Revolving Credit Facility at January 31, 2015 and 2014. The initial interest rate on the February 3, 2014 borrowings under the 2013 Revolving Credit Facility was 4.00% , but was adjusted to 3.50% on March 7, 2014, as further described above.
Other Provisions of the Credit Agreement
Loans under the Credit Agreement are subject to mandatory prepayment requirements with respect to certain asset sales, excess cash flows (as defined in the Credit Agreement), and certain other events. Optional prepayments of the term loans are permitted without premium or penalty, other than customary breakage costs associated with the prepayment of loans bearing interest based on LIBO Rates. Prepayments are applied first to the eight immediately following scheduled term loan principal
89
Table of Contents
payments, then pro rata to other remaining scheduled term loan principal payments, if any, and thereafter as otherwise provided in the Credit Agreement.
Our obligations under the Credit Agreement are guaranteed by substantially all of our domestic subsidiaries and certain foreign subsidiaries that have elected to be disregarded for U.S. tax purposes, and are secured by security interests in substantially all of our and the aforementioned subsidiaries' assets, subject to certain exceptions detailed in the Credit Agreement and related ancillary documents.
The Credit Agreement contains certain customary affirmative and negative covenants for credit facilities of this type, which include limitations on us and our subsidiaries with respect to indebtedness, liens, nature of business, investments and loans, distributions, acquisitions, dispositions of assets, sale-leaseback transactions and transactions with affiliates. The 2013 Revolving Credit Facility also contains a financial covenant that requires us to maintain a ratio of Consolidated Total Debt to Consolidated EBITDA (each as defined in the Credit Agreement) of no greater than 5.00 to 1 until January 31, 2016 (as amended on February 3, 2014 by Amendment No. 3, as described above) and no greater than 4.50 to 1 thereafter (the "Leverage Ratio Covenant"). The limitations imposed by the covenants are subject to certain exceptions as detailed in the Credit Agreement.
The Credit Agreement provides for certain customary events of default with corresponding grace periods. These events of default include failure to pay principal or interest when due under the Credit Agreement, failure to comply with covenants, any representation or warranty made by us proving to be inaccurate in any material respect, defaults under certain other indebtedness of ours or our subsidiaries, the occurrence of a Change of Control (as defined in the Credit Agreement) with respect to us and certain insolvency or receivership events affecting us or our significant subsidiaries. Upon the occurrence of an event of default resulting from a violation of the Leverage Ratio Covenant, the lenders under our 2013 Revolving Credit Facility may require us to immediately repay outstanding borrowings under the 2013 Revolving Credit Facility and may terminate their commitments to provide loans under that facility. A violation of the Leverage Ratio Covenant would not, by itself, result in an event of default under the February 2014 Term Loans or March 2014 Term Loans but may trigger a cross-default under the term loans in the event we are required to repay outstanding borrowings under the 2013 Revolving Credit Facility. Upon the occurrence of other events of default, the lenders may require us to immediately repay all outstanding borrowings under the Credit Agreement and the lenders under our 2013 Revolving Credit Facility may terminate their commitments to provide loans under the facility.
Future Principal Payments on Term Loans
(in thousands) |
| February 2014 |
| March 2014 | ||||
Years Ending January 31, |
| Term Loans |
| Term Loans | ||||
2016 |
| $ | - | |
| $ | - | |
2017 |
| 669 | |
| 1,434 | | ||
2018 |
| 1,337 | |
| 2,869 | | ||
2019 |
| 1,337 | |
| 2,869 | | ||
2020 |
| 127,386 | |
| 273,241 | | ||
Total |
| $ | 130,729 | |
| $ | 280,413 | |
Interest Expense
The following table presents the components of interest expense incurred on the Notes and on borrowings under our Credit Agreement for the years ended January 31, 2015, 2014, and 2013:
90
Table of Contents
|
| Year Ended January 31, | ||||||||||
(in thousands) |
| 2015 |
| 2014 |
| 2013 | ||||||
1.50% Convertible Senior Notes: |
|
|
|
|
|
| ||||||
Interest expense at 1.50% coupon rate |
| $ | 3,717 | |
| $ | - | |
| $ | - | |
Amortization of debt discount |
| 6,014 | |
| - | |
| - | | |||
Amortization of deferred debt issuance costs |
| 566 | |
| - | |
| - | | |||
Total - 1.50% Convertible Senior Notes |
| $ | 10,297 | |
| $ | - | |
| $ | - | |
|
|
|
|
|
|
| ||||||
Borrowings under Credit Agreement: |
|
|
|
|
|
| ||||||
Interest expense at contractual rates |
| $ | 23,236 | |
| $ | 26,254 | |
| $ | 27,138 | |
Amortization of debt discounts |
| 116 | |
| 458 | |
| 486 | | |||
Amortization of deferred debt issuance costs |
| 2,435 | |
| 2,164 | |
| 3,002 | | |||
Total - Borrowings under Credit Agreement |
| $ | 25,787 | |
| $ | 28,876 | |
| $ | 30,626 | |
7. | SUPPLEMENTAL CONSOLIDATED FINANCIAL STATEMENT INFORMATION |
Consolidated Balance Sheets
Inventories consisted of the following as of January 31, 2015 and 2014 :
|
| January 31, | ||||||
(in thousands) |
| 2015 |
| 2014 | ||||
Raw materials |
| $ | 6,203 | |
| $ | 3,190 | |
Work-in-process |
| 8,481 | |
| 5,645 | | ||
Finished goods |
| 2,821 | |
| 1,858 | | ||
Total inventories |
| $ | 17,505 | |
| $ | 10,693 | |
Property and equipment, net consisted of the following as of January 31, 2015 and 2014:
|
| January 31, | ||||||
(in thousands) |
| 2015 |
| 2014 | ||||
Land and buildings |
| $ | 10,932 | |
| $ | 3,781 | |
Leasehold improvements |
| 25,747 | |
| 19,438 | | ||
Software |
| 38,305 | |
| 32,542 | | ||
Equipment, furniture, and other |
| 76,839 | |
| 62,126 | | ||
|
| 151,823 | |
| 117,887 | | ||
Less: accumulated depreciation and amortization |
| (89,333 | ) |
| (77,742 | ) | ||
Total property and equipment, net |
| $ | 62,490 | |
| $ | 40,145 | |
Depreciation expense on property and equipment was $17.7 million , $13.5 million and $11.8 million the years ended January 31, 2015, 2014, and 2013, respectively.
Other assets consisted of the following as of January 31, 2015 and 2014:
|
| January 31, | ||||||
(in thousands) |
| 2015 |
| 2014 | ||||
Deferred debt issuance costs, net |
| $ | 14,894 | |
| $ | 9,598 | |
Long-term restricted cash and time deposits |
| 1,959 | |
| 391 | | ||
Other |
| 13,305 | |
| 14,037 | | ||
Total other assets |
| $ | 30,158 | |
| $ | 24,026 | |
91
Table of Contents
|
| January 31, | ||||||
(in thousands) |
| 2015 |
| 2014 | ||||
Compensation and benefits |
| $ | 76,736 | |
| $ | 69,122 | |
Billings in excess of costs and estimated earnings on uncompleted contracts |
| 75,414 | |
| 46,569 | | ||
Professional and consulting fees |
| 7,374 | |
| 8,574 | | ||
Derivative financial instruments - current portion |
| 9,509 | |
| - | | ||
Distributor and agent commissions |
| 2,141 | |
| 3,640 | | ||
Taxes other than income taxes |
| 9,423 | |
| 8,940 | | ||
Interest on indebtedness |
| 4,597 | |
| 6,595 | | ||
Contingent consideration - current portion |
| 3,892 | |
| 9,859 | | ||
Other |
| 32,527 | |
| 25,375 | | ||
Total accrued expenses and other current liabilities |
| $ | 221,613 | |
| $ | 178,674 | |
Other liabilities consisted of the following as of January 31, 2015 and 2014:
|
| January 31, | ||||||
(in thousands) |
| 2015 |
| 2014 | ||||
Unrecognized tax benefits, including interest and penalties |
| $ | 50,451 | |
| $ | 42,280 | |
Obligations for severance compensation |
| 2,664 | |
| 3,036 | | ||
Contingent consideration - long-term portion |
| 10,615 | |
| 7,448 | | ||
Other |
| 16,488 | |
| 10,693 | | ||
Total other liabilities |
| $ | 80,218 | |
| $ | 63,457 | |
Consolidated Statements of Operations
Other expense, net consisted of the following for the years ended January 31, 2015 , 2014 , and 2013 :
|
| Year Ended January 31, | ||||||||||
(in thousands) |
| 2015 |
| 2014 |
| 2013 | ||||||
Foreign currency (losses) gains, net |
| $ | (13,402 | ) |
| $ | (6,057 | ) |
| $ | 960 | |
Gains (losses) on derivative financial instruments, net |
| 3,986 | |
| 345 | |
| (399 | ) | |||
Derecognition of indemnification asset related to CTI Merger |
| - | |
| (12,874 | ) |
| - | | |||
Other, net |
| (155 | ) |
| (1,689 | ) |
| (1,847 | ) | |||
Total other expense, net |
| $ | (9,571 | ) |
| $ | (20,275 | ) |
| $ | (1,286 | ) |
Consolidated Statements of Cash Flows
The following table provides supplemental information regarding our consolidated cash flows for the years ended January 31, 2015 , 2014 , and 2013 :
|
| Year Ended January 31, | ||||||||||
(in thousands) |
| 2015 |
| 2014 |
| 2013 | ||||||
Cash paid for interest |
| $ | 29,296 | |
| $ | 24,444 | |
| $ | 27,497 | |
Cash payments (refunds) of income taxes, net |
| $ | 15,362 | |
| $ | (1,748 | ) |
| $ | 18,161 | |
Non-cash investing and financing transactions: |
|
| |
|
|
|
| |||||
Accrued but unpaid purchases of property and equipment |
| $ | 4,258 | |
| $ | 1,161 | |
| $ | 1,058 | |
Inventory transfers to property and equipment |
| $ | 630 | |
| $ | 757 | |
| $ | 566 | |
Liabilities for contingent consideration in business combinations |
| $ | 8,347 | |
| $ | 11,907 | |
| $ | - | |
Purchases under supplier financing arrangements, including capital leases |
| $ | 634 | |
| $ | 637 | |
| $ | - | |
Leasehold improvements funded by lease incentive |
| $ | 2,242 | |
| $ | - | |
| $ | 5,042 | |
Non-cash net assets acquired in CTI Merger |
| $ | - | |
| $ | 3,727 | |
| $ | - | |
92
Table of Contents
8. | STOCKHOLDERS' EQUITY |
Issuance of Common Stock
On June 18, 2014, we completed a public offering of our common stock pursuant to which we issued and sold 5,750,000 shares of common stock at a price of $47.75 per share. We received aggregate proceeds of $265.6 million from the offering, net of underwriters' discounts and commissions, but before deducting approximately $0.7 million of other offering expenses.
Dividends on Common Stock
We did not declare or pay any dividends on our common stock during the years ended January 31, 2015, 2014, and 2013. Commencing in May 2007, with our issuance of Preferred Stock and our entry into an earlier credit agreement, and continuing currently under the terms of our Credit Agreement, we are subject to certain restrictions on declaring and paying dividends on our common stock. Our previously-outstanding Preferred Stock was canceled on February 4, 2013 in connection with the CTI Merger, further details of which appear in Note 15, "Merger with CTI".
Treasury Stock
Repurchased shares of common stock are recorded as treasury stock, at cost. At January 31, 2015, we held approximately 348,000 shares of treasury stock with a cost of $10.3 million , and at January 31, 2014, we held 302,000 shares of treasury stock with a cost of $8.0 million .
Shares of restricted stock awards that are forfeited when recipients separate from their employment prior to the lapsing of the award's restrictions are recorded as treasury stock.
From time to time, our board of directors has approved limited programs to repurchase shares of our common stock from directors or officers in connection with the vesting of restricted stock or restricted stock units to facilitate required income tax withholding by us or the payment of required income taxes by such holders. In addition, the terms of some of our equity award agreements with all grantees provide for automatic repurchases by us for the same purpose if a vesting-related or delivery-related tax event occurs at a time when the holder is not permitted to sell shares in the market. Our stock bonus program contains similar terms. Any such repurchases of common stock occur at prevailing market prices and are recorded as treasury stock.
During the year ended January 31, 2015, we acquired approximately 46,000 shares of treasury stock from directors, executive officers, and other employees at a cost of $2.2 million . We did not acquire any shares of treasury stock during the year ended January 31, 2014. During the year ended January 31, 2013, we acquired approximately 18,000 shares of treasury stock from certain executive officers and directors at a cost of $0.5 million .
Accumulated Other Comprehensive Income (Loss)
Accumulated other comprehensive income (loss) includes items such as foreign currency translation adjustments and unrealized gains and losses on certain marketable securities and derivative financial instruments designated as hedges. Accumulated other comprehensive income (loss) is presented as a separate line item in the stockholders' equity section of our consolidated balance sheets. Accumulated other comprehensive income (loss) items have no impact on our net income as presented in our consolidated statements of operations.
The following table summarizes changes in the components of our accumulated other comprehensive income (loss) by component for the years ended January 31, 2015 and 2014:
93
Table of Contents
(in thousands) |
| Unrealized Gains (Losses) on Derivative Financial Instruments Designated as Hedges |
| Unrealized Gains on Available-for-Sale Investments |
| Foreign Currency Translation Adjustments |
| Total | ||||||||
Accumulated other comprehensive income (loss) at January 31, 2013 |
| $ | 2,447 | |
| $ | - | |
| $ | (46,672 | ) |
| $ | (44,225 | ) |
Other comprehensive income before reclassifications |
| 4,062 | |
| 9 | |
| 5,453 | |
| 9,524 | | ||||
Amounts reclassified out of accumulated other comprehensive income (loss) |
| (5,024 | ) |
| - | |
| - | |
| (5,024 | ) | ||||
Net other comprehensive (loss) income |
| (962 | ) |
| 9 | |
| 5,453 | |
| 4,500 | | ||||
Accumulated other comprehensive income (loss) at January 31, 2014 |
| 1,485 | |
| 9 | |
| (41,219 | ) |
| (39,725 | ) | ||||
Other comprehensive (loss) income before reclassifications |
| (11,035 | ) |
| 92 | |
| (45,225 | ) |
| (56,168 | ) | ||||
Amounts reclassified out of accumulated other comprehensive income (loss) |
| 1,558 | |
| - | |
| - | |
| 1,558 | | ||||
Net other comprehensive (loss) income, current period |
| (9,477 | ) |
| 92 | |
| (45,225 | ) |
| (54,610 | ) | ||||
Accumulated other comprehensive (loss) income at January 31, 2015 |
| $ | (7,992 | ) |
| $ | 101 | |
| $ | (86,444 | ) |
| $ | (94,335 | ) |
All amounts presented in the table above are net of income taxes, if applicable. The accumulated net losses in foreign currency translation adjustments primarily reflect the strengthening of the U.S. dollar against the British pound sterling, which has resulted in lower U.S. dollar-translated balances of British pound sterling-denominated goodwill and intangible assets.
The amounts reclassified out of accumulated other comprehensive income (loss) into the consolidated statement of operations, with presentation location, for the years ended January 31, 2015 , 2014, and 2013 were as follows:
|
| Year Ended January 31, |
| Location | ||||||||||
(in thousands) |
| 2015 |
| 2014 |
| 2013 |
| |||||||
Unrealized losses (gains) on derivative financial instruments: |
|
|
|
|
|
|
|
| ||||||
Foreign currency forward contracts |
| $ | 190 | |
| $ | (478 | ) |
| $ | 73 | |
| Cost of product revenue |
|
| 159 | |
| (494 | ) |
| 83 | |
| Cost of service and support revenue | |||
|
| 1,050 | |
| (3,246 | ) |
| 418 | |
| Research and development, net | |||
|
| 458 | |
| (1,501 | ) |
| 229 | |
| Selling, general and administrative | |||
|
| 1,857 | |
| (5,719 | ) |
| 803 | |
| Total, before income taxes | |||
|
| (299 | ) |
| 695 | |
| (85 | ) |
| (Benefit) provision for income taxes | |||
|
| $ | 1,558 | |
| $ | (5,024 | ) |
| $ | 718 | |
| Total, net of income taxes |
9. | CONVERTIBLE PREFERRED STOCK |
In 2007, our former controlling shareholder, CTI, purchased 293,000 shares of our Series A Convertible Preferred Stock, for $293.0 million in cash.
On August 12, 2012, we entered into the CTI Merger Agreement providing for the CTI Merger. The CTI Merger was completed on February 4, 2013 and eliminated CTI's majority ownership and control of us. Upon completion of the CTI Merger, each outstanding share of Preferred Stock, all of which was held by CTI, was canceled. Further details regarding the CTI Merger appear in Note 15, "Merger Agreement with CTI".
Cash dividends on the Preferred Stock were cumulative and were calculated quarterly at a specified dividend rate on the liquidation preference in effect at such time. At the time of its cancellation in connection with the CTI Merger on February 4, 2013, the dividend rate on the Preferred Stock was 3.875% , and no dividends had been declared or paid on the Preferred Stock in any period. Other than through these cumulative dividends, the Preferred Stock did not participate in our earnings.
94
Table of Contents
Upon cancellation of 293,000 shares of Preferred Stock in connection with the CTI Merger, our authorized shares of preferred stock were reduced from 2,500,000 shares to 2,207,000 shares, in accordance with the Preferred Stock's Certificate of Designation.
10. RESEARCH AND DEVELOPMENT, NET
Our gross research and development expenses for the years ended January 31, 2015 , 2014 , and 2013 , were $178.7 million , $131.6 million , and $121.2 million , respectively. OCS reimbursements amounted to $3.2 million , $3.5 million , and $3.3 million for the years ended January 31, 2015 , 2014 , and 2013 , respectively, which were recorded as reductions of gross research and development expenses. We recorded other reimbursements of research and development expenses of $1.8 million , $1.6 million , and $1.9 million for the years ended January 31, 2015 , 2014 , and 2013 , respectively.
We capitalize certain costs incurred to develop our commercial software products, and we then recognize those costs within cost of product revenue as the products are sold. Activity for our capitalized software development costs for the years ended January 31, 2015 , 2014 , and 2013 was as follows:
|
| Year Ended January 31, | ||||||||||
(in thousands) |
| 2015 |
| 2014 |
| 2013 | ||||||
Capitalized software development costs, net, beginning of year |
| $ | 8,483 | |
| $ | 6,343 | |
| $ | 5,846 | |
Software development costs capitalized during the year |
| 6,083 | |
| 6,668 | |
| 3,916 | | |||
Amortization of capitalized software development costs |
| (1,666 | ) |
| (2,482 | ) |
| (3,089 | ) | |||
Impairments, foreign currency translation and other |
| (2,788 | ) |
| (2,046 | ) |
| (330 | ) | |||
Capitalized software development costs, net, end of year |
| $ | 10,112 | |
| $ | 8,483 | |
| $ | 6,343 | |
During the years ended January 31, 2015 and 2014, we recorded $2.6 million and $2.1 million , respectively, for impairment of capitalized software development costs reflecting strategy changes in certain product development initiatives, due primarily to acquisition of technology associated with business combinations. Impairments recorded for the year ended January 31, 2013 were not significant.
11. | INCOME TAXES |
The components of income before (benefit) provision for income taxes for the years ended January 31, 2015, 2014, and 2013 were as follows:
|
| Year Ended January 31, | ||||||||||
(in thousands) |
| 2015 |
| 2014 |
| 2013 | ||||||
Domestic |
| $ | (53,877 | ) |
| $ | (37,987 | ) |
| $ | (11,292 | ) |
Foreign |
| 75,280 | |
| 101,302 | |
| 79,056 | | |||
Total income before (benefit) provision for income taxes |
| $ | 21,403 | |
| $ | 63,315 | |
| $ | 67,764 | |
The (benefit) provision for income taxes for the years ended January 31, 2015, 2014, and 2013 consisted of the following:
95
Table of Contents
|
| Year Ended January 31, | ||||||||||
(in thousands) |
| 2015 |
| 2014 |
| 2013 | ||||||
Current provision (benefit) for income taxes: |
|
|
|
|
|
| ||||||
Federal |
| $ | 342 | |
| $ | (12,966 | ) |
| $ | 15 | |
State |
| 1,575 | |
| 664 | |
| 523 | | |||
Foreign |
| 30,415 | |
| 14,288 | |
| 8,094 | | |||
Total current provision for income taxes |
| 32,332 | |
| 1,986 | |
| 8,632 | | |||
Deferred (benefit) provision for income taxes: |
|
|
|
|
|
| ||||||
Federal |
| (40,007 | ) |
| 2,187 | |
| 3,880 | | |||
State |
| (2,610 | ) |
| 493 | |
| 226 | | |||
Foreign |
| (4,714 | ) |
| (127 | ) |
| (3,778 | ) | |||
Total deferred (benefit) provision for income taxes |
| (47,331 | ) |
| 2,553 | |
| 328 | | |||
Total (benefit) provision for income taxes |
| $ | (14,999 | ) |
| $ | 4,539 | |
| $ | 8,960 | |
The reconciliation of the U.S. federal statutory rate to our effective tax rate on income before (benefit) provision for income taxes for the years ended January 31, 2015, 2014, and 2013 was as follows:
|
| Year Ended January 31, | ||||||||||
(in thousands) |
| 2015 |
| 2014 |
| 2013 | ||||||
U.S. federal statutory income tax rate |
| 35.0 | % |
| 35.0 | % |
| 35.0 | % | |||
|
|
|
|
|
|
| ||||||
Income tax provision at the U.S. federal statutory rate |
| $ | 7,489 | |
| $ | 22,160 | |
| $ | 23,717 | |
State tax (benefit) provision |
| (1,739 | ) |
| 982 | |
| 1,055 | | |||
Foreign tax rate differential |
| (9,650 | ) |
| (15,756 | ) |
| (12,471 | ) | |||
Tax incentives |
| (14,865 | ) |
| (14,390 | ) |
| (29,171 | ) | |||
Valuation allowances |
| (10,922 | ) |
| 10,597 | |
| 4,844 | | |||
Stock-based and other compensation |
| 4,222 | |
| 3,163 | |
| 1,833 | | |||
Non-deductible expenses |
| 2,156 | |
| 4,969 | |
| 1,329 | | |||
Tax credits |
| (2,461 | ) |
| (2,277 | ) |
| (4,170 | ) | |||
Tax contingencies |
| 9,891 | |
| (5,102 | ) |
| 17,546 | | |||
U.S. tax effects of foreign operations |
| 1,451 | |
| 1,197 | |
| 3,854 | | |||
Other, net |
| (571 | ) |
| (1,004 | ) |
| 594 | | |||
Total (benefit) provision for income taxes |
| $ | (14,999 | ) |
| $ | 4,539 | |
| $ | 8,960 | |
Effective income tax rate |
| (70.1 | )% |
| 7.2 | % |
| 13.2 | % | |||
Our operations in Israel have been granted "Approved Enterprise" status by the Investment Center of the Israeli Ministry of Industry, Trade and Labor, which makes us eligible for tax benefits under the Israeli Law for Encouragement of Capital Investments, 1959. Under the terms of the program, income attributable to an approved enterprise is exempt from income tax for a period of two years and is subject to a reduced income tax rate for the subsequent five to eight years (generally 10 - 25 %, depending on the percentage of foreign investment in the company). These tax incentives decreased our effective tax rates by 64.0% , 22.7% , and 43.0% for the years ended January 31, 2015, 2014, and 2013, respectively.
Deferred tax assets and liabilities consisted of the following at January 31, 2015 and 2014:
96
Table of Contents
|
| Year Ended January 31, | ||||||
(in thousands) |
| 2015 |
| 2014 | ||||
Deferred tax assets: |
|
|
|
| ||||
Accrued expenses |
| $ | 5,876 | |
| $ | 6,800 | |
Deferred revenue |
| 10,058 | |
| 12,387 | | ||
Loss carryforwards |
| 153,351 | |
| 137,565 | | ||
Tax credits |
| 9,290 | |
| 8,795 | | ||
Stock-based and other compensation |
| 16,609 | |
| 15,060 | | ||
Capitalized research and development expenses |
| 4,883 | |
| 3,914 | | ||
Other, net |
| 1,745 | |
| 910 | | ||
Total deferred tax assets |
| 201,812 | |
| 185,431 | | ||
Deferred tax liabilities: |
|
|
|
| ||||
Goodwill and other intangible assets |
| (62,815 | ) |
| (32,134 | ) | ||
Unremitted earnings of foreign subsidiaries |
| (15,817 | ) |
| - | | ||
Other, net |
| (2,089 | ) |
| (1,484 | ) | ||
Total deferred tax liabilities |
| (80,721 | ) |
| (33,618 | ) | ||
Valuation allowance |
| (131,909 | ) |
| (146,860 | ) | ||
Net deferred tax (liabilities) assets |
| $ | (10,818 | ) |
| $ | 4,953 | |
|
|
|
|
| ||||
Recorded as: |
|
|
|
| ||||
Current deferred tax assets |
| $ | 11,176 | |
| $ | 9,002 | |
Long-term deferred tax assets |
| 10,778 | |
| 9,783 | | ||
Current deferred tax liabilities |
| (2,108 | ) |
| (474 | ) | ||
Long-term deferred tax liabilities |
| (30,664 | ) |
| (13,358 | ) | ||
Net deferred tax (liabilities) assets |
| $ | (10,818 | ) |
| $ | 4,953 | |
At January 31, 2015 and 2014, we had U.S. federal net operating loss ("NOL") carryforwards of approximately $656.5 million and $631.2 million , respectively. These loss carryforwards expire in various years ending from January 31, 2018 to 2034. We had state NOL carryforwards of approximately $247.5 million and $211.3 million in the same respective years, expiring in years ending from January 31, 2015 to 2034. We had foreign NOL carryforwards of approximately $61.8 million and $51.9 million in the same respective years. At January 31, 2015, all but $5.3 million of these foreign loss carryforwards had indefinite carryforward periods. Certain of these federal, state, and foreign loss carryforwards and credits are subject to Internal Revenue Code Section 382 or similar provisions, which impose limitations on their utilization following certain changes in ownership of the entity generating the loss carryforward. The NOL carryforwards for tax return purposes are different from the NOL carryforwards for financial statement purposes, primarily due to the reduction of NOL carryforwards for financial statement purposes under the authoritative guidance on accounting for uncertainty in income taxes. We had U.S. federal, state and foreign tax credit carryforwards of approximately $18.1 million and $14.4 million at January 31, 2015 and 2014, respectively, the utilization of which is subject to limitation. At January 31, 2015, approximately $2.7 million of these tax credit carryforwards may be carried forward indefinitely. The balance of $15.4 million expires in various years ending from January 31, 2016 to 2034.
As of January 31, 2015, we have not provided for deferred taxes on the excess of financial reporting over the tax basis of investments in certain foreign subsidiaries in the amount of $398.7 million because we plan to reinvest such earnings indefinitely outside the United States. If these earnings were repatriated in the future, additional income and withholding tax expense would be incurred. Due to complexities in the laws of the foreign jurisdictions and the assumptions that would have to be made, it is not practicable to estimate the total amount of income taxes that would have to be provided on such earnings.
As required by the authoritative guidance on accounting for income taxes, we evaluate the realizability of deferred tax assets on a jurisdictional basis at each reporting date. Accounting for income taxes requires that a valuation allowance be established when it is more likely than not that all or a portion of the deferred tax assets will not be realized. In circumstances where there is sufficient negative evidence indicating that the deferred tax assets are not more likely than not realizable, we establish a valuation allowance. We have recorded valuation allowances in the amounts of $131.9 million and $146.9 million at January 31, 2015 and 2014, respectively. The $15.0 million decrease in the valuation allowance between January 31, 2014 and January 31, 2015 arose primarily as a result of the KANA acquisition. In connection with the acquisition of KANA on February 3, 2014, we recorded deferred income tax liabilities primarily attributable to acquired intangible assets to the extent the amortization will not be deductible for income tax purposes. Under accounting guidelines, because the amortization of the
97
Table of Contents
intangible assets in future periods provides a source of taxable income, we expect to realize a portion of our existing deferred income tax assets. As such, we reduced the valuation allowance recorded on our deferred income tax assets to the extent of the deferred income tax liabilities recorded. Because the valuation allowance related to existing Verint deferred income tax assets, the impact of the release was reflected as a discrete income tax benefit and not as a component of the KANA acquisition accounting. The decrease in the valuation allowance caused by the KANA acquisition was offset by increases in net deferred tax assets primarily related to amortization of acquired intangibles, loss carryforwards, and equity compensation.
Activity in the recorded valuation allowance consisted of the following for the years ended January 31, 2015 and 2014:
|
| Year Ended January 31, | ||||||
(in thousands) |
| 2015 |
| 2014 | ||||
Valuation allowance, beginning of year |
| $ | (146,860 | ) |
| $ | (104,757 | ) |
(Benefit) provision for income taxes |
| 10,922 | |
| (10,597 | ) | ||
Additional paid-in capital |
| 6,913 | |
| 75 | | ||
Acquisitions |
| (3,473 | ) |
| (30,268 | ) | ||
Cumulative translation adjustment |
| 589 | |
| (1,313 | ) | ||
Valuation allowance, end of year |
| $ | (131,909 | ) |
| $ | (146,860 | ) |
In accordance with the authoritative guidance for accounting for stock-based compensation, we use a "with-and-without" approach to applying the intra-period allocation rules in accordance with accounting for income taxes. Under this approach, the windfall tax benefit is calculated based on the incremental tax benefit received from deductions related to stock-based compensation. The amount is measured by calculating the tax benefit both "with" and "without" the excess tax deduction; the resulting difference between the two calculations is considered the windfall. We did not recognize windfall benefits in our U.S. federal income tax (benefit) provisions for the years ended January 31, 2015, 2014, and 2013.
In accordance with the authoritative guidance on accounting for uncertainty in income taxes, differences between the amount of tax benefits taken or expected to be taken in our income tax returns and the amount of tax benefits recognized in our financial statements, determined by applying the prescribed methodologies of accounting for uncertainty in income taxes, represent our unrecognized income tax benefits, which we either record as a liability or as a reduction of deferred tax assets.
For the years ended January 31, 2015, 2014, and 2013, the aggregate changes in the balance of gross unrecognized tax benefits were as follows:
|
| Year Ended January 31, | ||||||||||
(in thousands) |
| 2015 |
| 2014 |
| 2013 | ||||||
Gross unrecognized tax benefits, beginning of year |
| $ | 145,408 | |
| $ | 55,412 | |
| $ | 36,377 | |
Increases related to tax positions taken during the current year |
| 15,522 | |
| 11,013 | |
| 8,909 | | |||
Increases as a result of acquisitions |
| 4,744 | |
| 83,523 | |
| - | | |||
Increases related to tax positions taken during prior years |
| 1,927 | |
| - | |
| 15,575 | | |||
Increases (decreases) related to foreign currency exchange rate |
| (3,900 | ) |
| 1,255 | |
| (375 | ) | |||
Reductions for tax positions of prior years |
| (3,440 | ) |
| (4,491 | ) |
| (3,602 | ) | |||
Lapses of statutes of limitations |
| (613 | ) |
| (1,304 | ) |
| (1,472 | ) | |||
Gross unrecognized tax benefits, end of year |
| $ | 159,648 | |
| $ | 145,408 | |
| $ | 55,412 | |
As of January 31, 2015, we had $159.6 million of unrecognized tax benefits, of which $153.1 million represents the amount that, if recognized, would impact the effective income tax rate in future periods. We recorded $1.9 million of expense, a $10.5 million benefit, and $0.6 million of expense for interest and penalties related to uncertain tax positions in our provision for income taxes for the years ended January 31, 2015, 2014, and 2013, respectively. Accrued liabilities for interest and penalties were $10.9 million and $8.7 million at January 31, 2015 and 2014, respectively. Interest and penalties (expense and/or benefit) are recorded as a component of the (benefit) provision for income taxes in the consolidated financial statements.
Our income tax returns are subject to ongoing tax examinations in several jurisdictions in which we operate. In the United States, with the exception of years in which are currently under examination, we are no longer subject to federal income tax examination for years prior to January 31, 2012. In Israel, we are no longer subject to income tax examination for years prior to January 31, 2007. In the United Kingdom, with the exception of years which are currently under examination, we are no longer subject to income tax examination for years prior to January 31, 2014.
98
Table of Contents
As of January 31, 2015, income tax returns are under examination in the following significant tax jurisdictions:
Jurisdiction |
| Tax Years |
Canada |
| January 31, 2011 - January 31, 2012 |
United Kingdom |
| December 31, 2006; January 31, 2008 |
India |
| March 31, 2006 - March 31, 2008; March 31, 2010 - March 31, 2013 |
United States |
| December 31, 2011, December 31, 2012 |
We regularly assess the adequacy of our provisions for income tax contingencies. As a result, we may adjust the reserves for unrecognized tax benefits for the impact of new facts and developments, such as changes to interpretations of relevant tax law, assessments from taxing authorities, settlements with taxing authorities, and lapses of statutes of expiration. We believe that it is reasonably possible that the total amount of unrecognized tax benefits at January 31, 2015 could decrease by approximately $4.7 million in the next twelve months as a result of settlement of certain tax audits or lapses of statutes of limitation. Such decreases may involve the payment of additional taxes, the adjustment of certain deferred taxes including the need for additional valuation allowances and the recognition of tax benefits.
12. | FAIR VALUE MEASUREMENTS |
Fair value is defined as the price that would be received from selling an asset or paid to transfer a liability in an orderly transaction between market participants at the measurement date. When determining the fair value measurements for assets and liabilities required to be recorded at fair value, we consider the principal or most advantageous market in which we would transact and consider assumptions that market participants would use when pricing the asset or liability, such as inherent risk, transfer restrictions, and risk of nonperformance.
Accounting guidance establishes a fair value hierarchy that requires an entity to maximize the use of observable inputs and minimize the use of unobservable inputs when measuring fair value. An instrument's categorization within the fair value hierarchy is based upon the lowest level of input that is significant to the fair value measurement. This fair value hierarchy consists of three levels of inputs that may be used to measure fair value:
• Level 1: quoted prices in active markets for identical assets or liabilities;
• | Level 2: inputs other than Level 1 that are observable, either directly or indirectly, such as quoted prices in active markets for similar assets or liabilities, quoted prices for identical or similar assets or liabilities in markets that are not active, or other inputs that are observable or can be corroborated by observable market data for substantially the full term of the assets or liabilities; or |
• | Level 3: unobservable inputs that are supported by little or no market activity. |
We review the fair value hierarchy classification of our applicable assets and liabilities at each reporting period. Changes in the observability of valuation inputs may result in transfers within the fair value measurement hierarchy. We did not identify any transfers between levels of the fair value measurement hierarchy during the years ended January 31, 2015 and 2014.
Assets and Liabilities Measured at Fair Value on a Recurring Basis
Our assets and liabilities measured at fair value on a recurring basis consisted of the following as of January 31, 2015 and 2014:
99
Table of Contents
|
| January 31, 2015 | ||||||||||
|
| Fair Value Hierarchy Category | ||||||||||
(in thousands) |
| Level 1 |
| Level 2 |
| Level 3 | ||||||
Assets: |
|
| |
|
| |
|
| | |||
Money market funds |
| $ | 183 | |
| $ | - | |
| $ | - | |
Commercial paper (1) |
| - | |
| 2,999 | |
| - | | |||
Short-term investments, classified as available-for-sale |
| - | |
| 13,842 | |
| - | | |||
Foreign currency forward contracts |
| - | |
| 763 | |
| - | | |||
Total assets |
| $ | 183 | |
| $ | 17,604 | |
| $ | - | |
Liabilities: |
|
| |
|
| |
|
| | |||
Foreign currency forward contracts |
| $ | - | |
| $ | 9,540 | |
| $ | - | |
Contingent consideration - business combinations |
| - | |
| - | |
| 14,507 | | |||
Total liabilities |
| $ | - | |
| $ | 9,540 | |
| $ | 14,507 | |
|
| January 31, 2014 | ||||||||||
|
| Fair Value Hierarchy Category | ||||||||||
(in thousands) |
| Level 1 |
| Level 2 |
| Level 3 | ||||||
Assets: |
|
| |
|
| |
|
| | |||
Money market funds |
| $ | 14,023 | |
| $ | - | |
| $ | - | |
Commercial paper (1) |
| - | |
| 49,991 | |
| - | | |||
Short-term investments, classified as available-for-sale |
| - | |
| 9,406 | |
| - | | |||
Foreign currency forward contracts |
| - | |
| 2,466 | |
| - | | |||
Total assets |
| $ | 14,023 | |
| $ | 61,863 | |
| $ | - | |
Liabilities: |
|
| |
|
| |
|
| | |||
Foreign currency forward contracts |
| $ | - | |
| $ | 846 | |
| $ | - | |
Contingent consideration - business combinations |
| - | |
| - | |
| 17,307 | | |||
Total liabilities |
| $ | - | |
| $ | 846 | |
| $ | 17,307 | |
(1) Commerical paper investments with remaining maturities of 90 days or less at time of purchase, classified within cash and cash equivalents.
The following table presents the changes in the estimated fair values of our liabilities for contingent consideration measured using significant unobservable inputs (Level 3) for the years ended January 31, 2015 and 2014 :
|
| Year Ended January 31, | ||||||
(in thousands) |
| 2015 |
| 2014 | ||||
Fair value measurement at beginning of period |
| $ | 17,307 | |
| $ | 25,041 | |
Contingent consideration liabilities recorded for business combinations |
| 8,347 | |
| 11,907 | | ||
Changes in fair values, recorded in operating expenses |
| 900 | |
| (2,588 | ) | ||
Payments of contingent consideration |
| (11,974 | ) |
| (17,094 | ) | ||
Foreign currency translation and other |
| (73 | ) |
| 41 | | ||
Fair value measurement at end of period |
| $ | 14,507 | |
| $ | 17,307 | |
Our estimated liability for contingent consideration represents potential payments of additional consideration for business combinations, payable if certain defined performance goals are achieved. Changes in fair value of contingent consideration are recorded in the consolidated statements of operations within selling, general and administrative expenses.
Fair Value Measurements
Money Market Funds - We value our money market funds using quoted active market prices for such funds.
Short-term Investments and Commercial Paper - The fair values of short-term investments, as well as commercial paper classified as cash equivalents, are estimated using observable market prices for identical securities that are traded in less-active markets, if available. When observable market prices for identical securities are not available, we value these short-term
100
Table of Contents
investments using non-binding market price quotes from brokers which we review for reasonableness using observable market data; quoted market prices for similar instruments; or pricing models, such as a discounted cash flow model.
Foreign Currency Forward Contracts - The estimated fair value of foreign currency forward contracts is based on quotes received from the counterparties thereto. These quotes are reviewed for reasonableness by discounting the future estimated cash flows under the contracts, considering the terms and maturities of the contracts and market exchange rates using readily observable market prices for similar contracts.
Contingent Consideration - Business Combinations - The fair value of the contingent consideration related to business combinations is estimated using a probability-adjusted discounted cash flow model. These fair value measurements are based on significant inputs not observable in the market. The key internally developed assumptions used in these models are discount rates and the probabilities assigned to the milestones to be achieved. We remeasure the fair value of the contingent consideration at each reporting period, and any changes in fair value resulting from either the passage of time or events occurring after the acquisition date, such as changes in discount rates, or in the expectations of achieving the performance targets, are recorded within selling, general, and administrative expenses. Increases or decreases in discount rates would have inverse impacts on the related fair value measurements, while favorable or unfavorable changes in expectations of achieving performance targets would result in corresponding increases or decreases in the related fair value measurements. We utilized discount rates ranging from 2.0% to 41.7% in our calculations of the estimated fair values of our contingent consideration liabilities as of January 31, 2015 . We utilized discount rates ranging from 1.1% to 27.0% in our calculations of the estimated fair values of our contingent consideration liabilities as of January 31, 2014 .
Other Financial Instruments
The carrying amounts of accounts receivable, accounts payable, and accrued liabilities and other current liabilities approximate fair value due to their short maturities.
The estimated fair values of our term loan borrowings were $409.0 million and $647.0 million at January 31, 2015 and 2014, respectively. The estimated fair values of the term loans are based upon indicative bid and ask prices as determined by the agent responsible for the syndication of our term loans. We consider these inputs to be within Level 3 of the fair value hierarchy because we cannot reasonably observe activity in the limited market in which participations in our term loans are traded. The indicative prices provided to us as at each of January 31, 2015 and 2014 did not significantly differ from par value. The estimated fair value of our revolving credit borrowings, if any, is based upon indicative market values provided by one of our lenders. We had no revolving credit borrowings at January 31, 2015 and 2014.
The estimated fair value of our Notes was approximately $427 million at January 31, 2015 . The estimated fair value of the Notes is determined based on quoted bid and ask prices in the over-the-counter market in which the Notes trade. We consider these inputs to be within Level 2 of the fair value hierarchy.
Assets and Liabilities Not Measured at Fair Value on a Recurring Basis
In addition to assets and liabilities that are measured at fair value on a recurring basis, we also measure certain assets and liabilities at fair value on a nonrecurring basis. Our non-financial assets, including goodwill, intangible assets and property, plant and equipment, are measured at fair value when there is an indication of impairment and the carrying amount exceeds the asset's projected undiscounted cash flows. These assets are recorded at fair value only when an impairment charge is recognized. Further details regarding our regular impairment reviews appear in Note 1, "Summary of Significant Accounting Policies".
13. | DERIVATIVE FINANCIAL INSTRUMENTS |
Our primary objective for holding derivative financial instruments is to manage foreign currency exchange rate risk and interest rate risk, when deemed appropriate. We enter into these contracts in the normal course of business to mitigate risks and not for speculative purposes.
Foreign Currency Forward Contracts
Under our risk management strategy, we periodically use foreign currency forward contracts to manage our short-term exposures to fluctuations in operational cash flows resulting from changes in foreign currency exchange rates. These cash flow exposures result from portions of our forecasted operating expenses, primarily compensation and related expenses, which are
101
Table of Contents
transacted in currencies other than the U.S. dollar, primarily the Israeli shekel and the Canadian dollar. We also periodically utilize foreign currency forward contracts to manage exposures resulting from forecasted customer collections to be remitted in currencies other than the applicable functional currency, and exposures from cash, cash equivalents and short-term investments denominated in currencies other than the applicable functional currency. Our joint venture, which has a Singapore dollar functional currency, also utilizes foreign exchange forward contracts to manage its exposure to exchange rate fluctuations related to settlements of liabilities denominated in U.S. dollars. These foreign currency forward contracts generally have maturities of no longer than twelve months, although occasionally we will execute a contract that extends beyond twelve months , depending upon the nature of the underlying risk.
Notional Amounts of Derivative Financial Instruments
Our outstanding derivative financial instruments consisted only of foreign currency forward contracts with notional amounts of $156.8 million and $127.6 million as of January 31, 2015 and 2014, respectively.
Fair Values of Derivative Financial Instruments
The fair values of our derivative financial instruments as of January 31, 2015 and 2014 were as follows:
|
| January 31, 2015 | ||||||||||
|
| Assets |
| Liabilities | ||||||||
(in thousands) |
| Balance Sheet Classification |
| Fair Value |
| Balance Sheet Classification |
| Fair Value | ||||
Derivative financial instruments designated as hedging instruments: |
|
|
|
| |
|
|
|
| | ||
Foreign currency forward contracts |
| Prepaid expenses and other current assets |
| $ | 164 | |
| Accrued expenses and other liabilities |
| $ | 9,194 | |
Total derivative financial instruments designated as hedging instruments |
|
|
| $ | 164 | |
|
|
| $ | 9,194 | |
|
|
|
|
|
|
|
|
| ||||
Derivative financial instruments not designated as hedging instruments: |
|
|
|
| |
|
|
|
| | ||
Foreign currency forward contracts |
| Prepaid expenses and other current assets |
| $ | 599 | |
| Accrued expenses and other liabilities |
| $ | 345 | |
Total derivative financial instruments not designated as hedging instruments |
|
|
| $ | 599 | |
|
|
| $ | 345 | |
|
| January 31, 2014 | ||||||||||
|
| Assets |
| Liabilities | ||||||||
(in thousands) |
| Balance Sheet Classification |
| Fair Value |
| Balance Sheet Classification |
| Fair Value | ||||
Derivative financial instruments designated as hedging instruments: |
|
|
|
| |
|
|
|
| | ||
Foreign currency forward contracts |
| Prepaid expenses and other current assets |
| $ | 2,245 | |
| Accrued expenses and other liabilities |
| $ | 769 | |
Total derivative financial instruments designated as hedging instruments |
|
|
| $ | 2,245 | |
|
|
| $ | 769 | |
|
|
|
|
|
|
|
|
| ||||
Derivative financial instruments not designated as hedging instruments: |
|
|
|
| |
|
|
|
| | ||
Foreign currency forward contracts |
| Prepaid expenses and other current assets |
| $ | 221 | |
| Accrued expenses and other liabilities |
| $ | 77 | |
Total derivative financial instruments not designated as hedging instruments |
|
|
| $ | 221 | |
|
|
| $ | 77 | |
Derivative Financial Instruments in Cash Flow Hedging Relationships
102
Table of Contents
|
| Net (Losses) Gains Recognized in Accumulated Other Comprehensive Loss |
| Classification of Net (Losses) Gains Reclassified from Other Comprehensive Loss into the Consolidated Statements of Operations |
| Net (Losses) Gains Reclassified from Other Comprehensive Loss into the Consolidated Statements of Operations | ||||||||||||||||
|
| January 31, |
|
|
| Year Ended January 31, | ||||||||||||||||
(in thousands) |
| 2015 |
| 2014 |
|
|
| 2015 |
| 2014 |
| 2013 | ||||||||||
Foreign currency forward contracts |
| $ | (7,992 | ) |
| $ | 1,485 | |
| Operating Expenses |
| $ | (1,857 | ) |
| $ | 5,719 | |
| $ | (803 | ) |
There were no gains or losses from ineffectiveness of these hedges recorded for the years ended January 31, 2015 , 2014, and 2013. All of the foreign currency forward contracts underlying the $8.0 million of net unrealized losses recorded in our accumulated other comprehensive loss at January 31, 2015 mature within twelve months, and therefore we expect all such losses to be reclassified into earnings within the next twelve months.
Derivative Financial Instruments Not Designated as Hedging Instruments
Gains (losses) recognized on derivative financial instruments not designated as hedging instruments in our consolidated statements of operations for the years ended January 31, 2015 , 2014 and 2013 were as follows:
|
| Classification in Consolidated Statements of Operations |
| Year Ended January 31, | ||||||||||
(in thousands) |
|
| 2015 |
| 2014 |
| 2013 | |||||||
Foreign currency forward contracts |
| Other income (expense), net |
| $ | 3,986 | |
| $ | 346 | |
| $ | (399 | ) |
14. | STOCK-BASED COMPENSATION AND OTHER BENEFIT PLANS |
Stock-Based Compensation Plans
Plan Summaries
We issue stock-based incentive awards to eligible employees, directors and consultants under the terms of our outstanding stock benefit plans (the "Plans" or "Stock Plans") and/or forms of equity award agreements approved by our board of directors. Our various Plans permit us to grant a variety of award types, including stock options (both incentive and non-qualified), restricted stock units ("RSUs"), restricted stock awards ("RSAs"), performance awards, stock appreciation rights, and other awards.
As of January 31, 2015, all Plans other than those described herein are either terminated or otherwise no longer active.
In July 2004, our stockholders approved the 2004 Stock Incentive Compensation Plan (the "2004 Plan") and in October 2010, approved the 2010 Long-Term Incentive Plan (the "2010 Plan"). Both the 2004 Plan and the 2010 Plan were subsequently modified to increase or transfer the number of shares authorized for issuance under the Plans. No further grants can be made under the 2004 Plan. Grants are permitted under the 2010 Plan through June 15, 2022.
In August 2011, in connection with the acquisition of Vovici Corporation, we assumed the Vovici 2006 Amended and Restated Stock Plan, as amended (the "Vovici Plan"), which will continue in effect until July 28, 2020. We do not expect to use the shares available for grant under the Vovici Plan for future awards.
In February 2013, in connection with the CTI Merger, we assumed the Comverse Technology, Inc. Stock Incentive Compensation Plan (the "CTI Plan"), which will continue in effect until September 7, 2021.
The table below summarizes key information for Plans with shares under outstanding grants and/or shares available for grant as of January 31, 2015:
103
(in thousands) |
| Number of |
| Number of |
| Number of | |||
2004 Plan |
| 3,000 | |
| 41 | |
| - | |
2010 Plan |
| 8,700 | |
| 2,260 | |
| 2,714 | |
CTI Plan |
| 2,700 | |
| 250 | |
| 2,435 | |
Vovici Plan |
| 317 | |
| 3 | |
| - | |
Total |
| | |
| 2,554 | |
| 5,149 | |
As presented in the table above, the number of shares under outstanding grants excludes, and the number of shares available for grants has not been reduced for, approximately 0.1 million RSUs with performance conditions awarded to officers for which the performance criteria has not yet been established by our board. Under applicable accounting guidance, if an award is subject to a performance vesting condition, an accounting grant date for the award is generally not established until the performance vesting condition has been defined and communicated. The table also excludes approximately 0.3 million shares available for grants under the Vovici Plan which, as noted above, are not expected to be used for future awards.
Awards are generally subject to multi-year vesting periods. We recognize compensation expense for awards on a straight-line basis over the requisite service periods of the awards, which are generally the vesting periods, reduced by estimated forfeitures. Upon exercise of stock options, issuance of restricted stock, or issuance of shares under the Plans, we generally issue new shares of common stock, but occasionally may issue treasury shares.
Stock-Based Compensation Expense
We recognized stock-based compensation expense in the following line items on the consolidated statements of operations for the years ended January 31, 2015 , 2014 and 2013:
|
| Year Ended January 31, | ||||||||||
(in thousands) |
| 2015 |
| 2014 |
| 2013 | ||||||
Component of income before (benefit) provision for income taxes: |
|
|
|
|
|
| ||||||
Cost of revenue - product |
| $ | 1,228 | |
| $ | 759 | |
| $ | 771 | |
Cost of revenue - service and support |
| 5,028 | |
| 1,678 | |
| 2,086 | | |||
Research and development, net |
| 6,421 | |
| 3,417 | |
| 2,636 | | |||
Selling, general and administrative |
| 41,781 | |
| 29,137 | |
| 19,715 | | |||
Total stock-based compensation expense |
| 54,458 | |
| 34,991 | |
| 25,208 | | |||
Income tax benefits related to stock-based compensation (before consideration of valuation allowances) |
| 12,364 | |
| 8,171 | |
| 6,456 | | |||
Total stock-based compensation, net of taxes |
| $ | 42,094 | |
| $ | 26,820 | |
| $ | 18,752 | |
The following table summarizes stock-based compensation expense by type of award for the years ended January 31, 2015, 2014, and 2013:
|
| Year Ended January 31, | ||||||||||
(in thousands) |
| 2015 |
| 2014 |
| 2013 | ||||||
Component of stock-based compensation expense: |
|
|
|
|
|
| ||||||
Restricted stock units and restricted stock awards |
| $ | 46,634 | |
| $ | 30,115 | |
| $ | 20,425 | |
Stock options |
| 15 | |
| 176 | |
| 289 | | |||
Phantom stock units |
| 129 | |
| 128 | |
| 516 | | |||
Stock bonus program |
| 7,680 | |
| 4,572 | |
| 3,978 | | |||
Total stock-based compensation expense |
| $ | 54,458 | |
| $ | 34,991 | |
| $ | 25,208 | |
Total stock-based compensation expense by classification was as follows for the years ended January 31, 2015 , 2014 and 2013:
104
|
| Year Ended January 31, | ||||||||||
(in thousands) |
| 2015 |
| 2014 |
| 2013 | ||||||
Equity-classified awards |
| $ | 46,963 | |
| $ | 30,471 | |
| $ | 20,174 | |
Stock bonus program and other reclassifications |
| (651 | ) |
| (298 | ) |
| 830 | | |||
Total equity-settled awards |
| 46,312 | |
| 30,173 | |
| 21,004 | | |||
Other liability-classified awards |
| 8,146 | |
| 4,818 | |
| 4,204 | | |||
Total stock-based compensation expense |
| $ | 54,458 | |
| $ | 34,991 | |
| $ | 25,208 | |
The increase in stock-based compensation expense during the year ended January 31, 2015, compared to the corresponding prior-year periods, resulted primarily from the combination of an increase in the number of outstanding RSUs, higher expenses associated with performance-based RSU's, a general increase in the price of our common stock, which is used to determine the grant-date fair value of an RSU, and a bonus share program, further details for which appear below under "Bonus Share Program".
Awards under our stock bonus program are accounted for as liability-classified awards, because the obligations are based predominantly on fixed monetary amounts that are generally known at inception of the obligation, to be settled with a variable number of shares of our common stock. Our other liability-classified awards include our phantom stock awards and certain discretionary bonuses. Upon settlement of other liability-classified awards with equity, compensation expense associated with those awards is reported within equity-classified awards in the table above.
Net excess tax benefits resulting from our Stock Plans were $0.3 million for the year ended January 31, 2015, and nominal for the years ended January, 2014 and 2013. Excess tax benefits represent a reduction in income taxes, otherwise payable during the period, attributable to the actual gross tax benefits in excess of the expected tax benefits, and are recorded as increases to additional paid-in capital.
Stock Options
We did not grant stock options during the years ended January 31, 2015 , 2014 , and 2013 .
The following table summarizes stock option activity under the Plans for the years ended January 31, 2015 , 2014 , and 2013 :
|
| Year Ended January 31, | |||||||||||||||||||
|
| 2015 |
| 2014 |
| 2013 | |||||||||||||||
(in thousands, except exercise prices) |
| Stock Options |
| Weighted-Average Exercise Price |
| Stock Options |
| Weighted-Average Exercise Price |
| Stock Options |
| Weighted-Average Exercise Price | |||||||||
Beginning balance |
| 516 | |
| $ | 34.60 | |
| 924 | |
| $ | 31.88 | |
| 1,114 | |
| $ | 30.40 | |
Exercised |
| (505 | ) |
| $ | 34.71 | |
| (384 | ) |
| $ | 28.61 | |
| (121 | ) |
| $ | 18.35 | |
Forfeited |
| - | |
| $ | - | |
| (8 | ) |
| $ | 8.71 | |
| (23 | ) |
| $ | 30.07 | |
Expired |
| (2 | ) |
| $ | 32.13 | |
| (16 | ) |
| $ | 35.27 | |
| (46 | ) |
| $ | 32.73 | |
Ending balance |
| 9 | |
| $ | 28.74 | |
| 516 | |
| $ | 34.60 | |
| 924 | |
| $ | 31.88 | |
Stock options exercisable |
| 9 | |
| $ | 28.74 | |
| 515 | |
| $ | 34.64 | |
| 907 | |
| $ | 32.32 | |
As of January 31, 2015, the aggregate intrinsic value for the options vested and exercisable was $0.2 million with a weighted-average remaining contractual life of 2.1 years. Additionally, there were 9,000 options vested and expected to vest with a weighted-average exercise price of $28.74 per share and an aggregate intrinsic value of $0.2 million with a weighted-average remaining contractual life of 2.1 years.
The unrecognized compensation expense calculated under the fair value method for options expected to vest (unvested shares net of expected forfeitures) as of January 31, 2015 was not significant.
Options outstanding and exercisable at January 31, 2015 had a weighted average remaining contractual life of 2.1 years.
The following table summarizes certain key data for exercised options:
105
|
| Year Ended January 31, | ||||||||||
(in thousands) |
| 2015 |
| 2014 |
| 2013 | ||||||
Intrinsic value of options exercised |
| $ | 8,759 | |
| $ | 3,817 | |
| $ | 1,450 | |
Cash received from the exercise of stock options |
| $ | 17,606 | |
| $ | 10,896 | |
| $ | 2,605 | |
Tax benefits realized from stock options exercised |
| $ | 2,306 | |
| $ | 780 | |
| $ | 339 | |
Fair value of options vested |
| $ | 178 | |
| $ | 10,524 | |
| $ | 17,832 | |
Restricted Stock Units and Restricted Stock Awards
We periodically award RSUs and RSAs to our directors, officers, and other employees. The fair value of these awards is equivalent to the market value of our common stock on the grant date. The principal difference between these instruments is that RSUs are not shares of our common stock and do not have any of the rights or privileges thereof, including voting or dividend rights. On the applicable vesting date, the holder of an RSU becomes entitled to a share of our common stock. Both RSAs and RSUs are subject to certain restrictions and forfeiture provisions prior to vesting.
Service-based RSUs typically vest based upon continued service, and we amortize the fair value of such time-based RSUs on a straight-line basis over the requisite service periods.
We periodically award RSUs to executive officers and certain employees that vest upon the achievement of specified performance goals ("PRSUs"). For some of these awards, the performance goals are established by our board subsequent to the award date. As noted above, for PRSUs, an accounting grant date for the award is generally not established until the performance vesting condition has been defined and communicated. We separately recognize compensation expense for each tranche of a PRSU award as if it were a separate award with its own vesting date. Therefore, for certain PRSUs, a grant date has been established but the requisite service period has not yet begun as of January 31, 2015.
Once the performance vesting condition has been defined and communicated, and the requisite service period has begun, our estimate of the fair value of PRSUs requires an assessment of the probability that the specified performance criteria will be achieved, which we update at each reporting date and adjust our estimate of the fair value of the PRSUs, if necessary.
RSUs that settle, or are expected to settle, with cash payments upon vesting are reflected as liabilities on our consolidated balance sheets.
The following table summarizes activity for RSAs and RSUs (including PRSUs) under the Plans for the years ended January 31, 2015, 2014, and 2013:
|
| Year Ended January 31, | |||||||||||||||||||
|
| 2015 |
| 2014 |
| 2013 | |||||||||||||||
(in thousands, except grant date fair values) |
| Shares or Units |
| Weighted-Average Grant-Date Fair Value |
| Shares or Units |
| Weighted-Average Grant-Date Fair Value |
| Shares or Units |
| Weighted-Average Grant-Date Fair Value | |||||||||
Beginning balance |
| 2,250 | |
| $ | 33.77 | |
| 1,536 | |
| $ | 31.42 | |
| 1,450 | |
| $ | 30.25 | |
Granted |
| 1,504 | |
| $ | 46.11 | |
| 1,533 | |
| $ | 34.84 | |
| 1,141 | |
| $ | 29.53 | |
Released |
| (1,009 | ) |
| $ | 33.11 | |
| (720 | ) |
| $ | 31.63 | |
| (959 | ) |
| $ | 27.30 | |
Forfeited |
| (200 | ) |
| $ | 38.46 | |
| (99 | ) |
| $ | 31.87 | |
| (96 | ) |
| $ | 32.59 | |
Ending balance |
| 2,545 | |
| $ | 40.96 | |
| 2,250 | |
| $ | 33.77 | |
| 1,536 | |
| $ | 31.42 | |
We granted 0.3 million , 0.5 million , and 0.1 million PRSUs during the years ended January 31, 2015, 2014, and 2013, respectively. Shares of common stock earned and issued and under PRSU grants totaled 0.2 million , 0.1 million , and 0.2 million during the years ended January 31, 2015, 2014, and 2013, respectively. As of January 31, 2015, there were 0.5 million unvested PRSUs outstanding.
With respect of our Stock Bonus Program, activity presented in the table above only includes shares earned and released in consideration of the discount provided under that program. Consistent with the provisions of the 2010 Plan under which such shares are issued, other shares issued under the Stock Bonus Program are not included in the table above because they do not reduce available plan capacity. Further details appear below under "Stock Bonus Program".
106
As of January 31, 2015, unrecognized compensation expense related to 2.4 million unvested RSUs expected to vest subsequent to January 31, 2015 was approximately $58.8 million , with remaining weighted-average vesting periods of approximately 1.5 years, over which such expense is expected to be recognized. The unrecognized compensation expense does not include compensation expense related to shares for which a grant date has been established but the requisite service period has not begun. The total fair values of restricted stock units vested during the years ended January 31, 2015, 2014, and 2013 were $33.4 million , $24.9 million , and $29.1 million , respectively.
Phantom Stock Units
We have periodically issued phantom stock units to certain non-officer employees that settle, or are expected to settle, with cash payments upon vesting. Like equity-settled awards, phantom stock units are awarded with vesting conditions and are subject to certain forfeiture provisions prior to vesting.
During the year ended January 31, 2013, we made $2.3 million of cash payments to plan participants upon vesting of phantom stock units.
All other phantom stock unit activity for the years ended January 31, 2015, 2014 and 2013 was not significant.
Stock Bonus Program
In September 2011, our board of directors approved a stock bonus program under which eligible employees may receive a portion of their bonuses, otherwise payable in cash, in the form of discounted shares of our common stock. Executive officers have been eligible to participate in this program from and after the year ended January 31, 2014 to the extent that shares remained available for awards following the enrollment of all other participants. Shares awarded to executive officers with respect to the discount feature of the program are subject to a one -year vesting period. This program is subject to annual funding approval by our board of directors and an annual cap on the number of shares that can be issued. Subject to these limitations, the number of shares to be issued under the program for a given year is determined using a five -day trailing average price of our common stock when the awards are calculated, reduced by a discount to be determined by the board of directors each year (the "discount"). To the extent that this program is not funded in a given year or the number of shares of common stock needed to fully satisfy employee enrollment exceeds the annual cap, the applicable portion of the employee bonuses will generally revert to being paid in cash. Obligations under this program are accounted for as liabilities, because the obligations are based predominantly on fixed monetary amounts that are generally known at inception of the obligation, to be settled with a variable number of shares of common stock determined using a discounted average price of our common stock, as described above.
The following table summarizes certain key data for the stock bonus program for the years ended January 31, 2015, 2014 and 2013:
|
| Year Ended January 31, | |||||||
(in thousands, except discount) |
| 2015 |
| 2014 |
| 2013 | |||
Maximum stock bonus program shares, as approved by board of directors |
| 125 | |
| 150 | |
| 150 | |
Discount |
| 15 | % |
| 15 | % |
| 15 | % |
Shares in lieu of cash bonus - granted and released |
| 82 | |
| 69 | |
| 116 | |
Shares in respect of discount: |
|
|
|
|
|
| |||
Granted |
| 12 | |
| 12 | |
| 28 | |
Released |
| 9 | |
| 12 | |
| 28 | |
Shares granted in a particular year, as presented in the table above, represent the shares earned under the prior year's stock bonus program authorization. Awards earned under the stock bonus program in respect of the performance period ended January 31, 2015 are expected to be issued during the first half of the year ending January 31, 2016.
The total accrued liability for the Stock Bonus Program was $3.4 million and $4.9 million as of January 31, 2015 and 2014, respectively.
On March 19, 2015, our board of directors approved up to 125,000 shares of common stock, and a discount of 15% , for awards under our stock bonus program for the year ending January 31, 2016. Executive officers will be permitted to participate in this program for the year ending January 31, 2016, but only to the extent that shares remain available for awards following the
107
enrollment of all other participants. Shares awarded to executive officers with respect to the 15% discount will be subject to a one-year vesting period.
Bonus Share Program
In February 2015, the board of directors authorized the use of shares of common stock available under our equity incentive plans to award up to approximately $4.7 million in bonuses in respect of performance during the year ended January 31, 2015, to employees other than executive officers, subject to certain limitations on the aggregate number of shares that may be issued. Similar to the accounting for the stock bonus program, obligations for these bonuses are accounted for as liabilities, because the obligations are based predominantly on fixed monetary amounts that are generally known, to be settled with a variable number of shares of common stock. The liability for these bonuses is included within accrued expenses and other current liabilities at January 31, 2015.
Shares in respect of this bonus program are expected to be issued during the first half of the year ending January 31, 2016. There is no discount feature associated with these bonus share awards.
Employee Stock Purchase Plan
Effective September 1, 2002, we adopted and implemented the 2002 Employee Stock Purchase Plan (the "ESPP"). The ESPP, use of which had been suspended since 2006, was terminated by the board of directors during the year ended January 31, 2015.
Other Benefit Plans
401(k) Plan and Other Retirement Plans
We maintain a 401(k) Plan for our full-time employees in the United States. The plan allows eligible employees who attain the age of 21 with three months of service to elect to contribute up to 60% of their annual compensation, subject to the prescribed maximum amount. We match employee contributions at a rate of 50% , up to a maximum annual matched contribution of $2,000 per employee.
Employee contributions are always fully vested, while our matching contributions for each year vest on the last day of the calendar year provided the employee remains employed with us on that day.
Our matching contribution expenses for our 401(k) Plan were $2.1 million , $1.8 million , and $1.7 million for the years ended January 31, 2015, 2014, and 2013, respectively.
We provide retirement benefits for non-U.S. employees as required by local laws or to a greater extent as we deem appropriate through plans that function similar to 401(k) plans. Funding requirements for programs required by local laws are determined on an individual country and plan basis and are subject to local country practices and market circumstances.
Severance Pay
We are obligated to make severance payments for the benefit of certain employees of our foreign subsidiaries. Severance payments made to Israeli employees are considered significant compared to all other subsidiaries with severance payment arrangements. Under Israeli law, we are obligated to make severance payments to employees of our Israeli subsidiaries, subject to certain conditions. In most cases, our liability for these severance payments is fully provided for by regular deposits to funds administered by insurance providers and by an accrual for the amount of our liability which has not yet been deposited.
Severance expenses for the years ended January 31, 2015, 2014, and 2013 were $6.8 million , $5.8 million , and $4.9 million , respectively.
15. MERGER WITH CTI
Overview
Prior to February 4, 2013, CTI beneficially owned a majority of our common stock (assuming the conversion of CTI's holdings of our Series A Convertible Preferred Stock into common stock) and held a majority of the voting power of our common stock.
108
Table of Contents
As of January 31, 2013, shortly before the CTI Merger (as described below), CTI's beneficial ownership position in us was approximately 53.5% .
On August 12, 2012, we entered into an agreement and plan of merger agreement with CTI (the "CTI Merger Agreement"), providing for the merger of CTI with and into our new, wholly owned subsidiary. The CTI Merger was completed on February 4, 2013. The CTI Merger eliminated CTI's majority ownership and control of us.
At the closing of the CTI Merger, approximately 28.6 million newly issued shares of our common stock were exchanged for approximately 220.0 million issued and outstanding shares of CTI common stock. In addition, the 16.3 million shares of our common stock and all shares of our Preferred Stock held by CTI at the time of the CTI Merger were canceled.
Holders of shares of our common stock immediately prior to the completion of the CTI Merger, other than CTI, continued to own their existing shares, which were not affected by the CTI Merger.
Expenses incurred in connection with this matter were not significant during the years ended January 31, 2015 and 2014. During the year ended January 31, 2013, we incurred expenses associated with this matter of $16.1 million , consisting primarily of legal and other professional fees, which were expensed as incurred and are reflected within selling, general and administrative expenses.
The CTI Merger qualified as a tax-free reorganization for U.S. federal income tax purposes.
Prior to the CTI Merger, CTI had distributed to its shareholders or otherwise disposed of substantially all of its assets, other than its interests in us, including the distribution of all of the outstanding common stock of its subsidiary, Comverse, Inc. ("Comverse") to its shareholders (the "Comverse share distribution"). As a result, at the time of the CTI Merger, the net assets of CTI consisted primarily of its controlling equity interests in Verint, as well as certain residual cash and cash equivalents and other sundry net assets. In addition, CTI had NOL carryforwards for income tax reporting purposes, and other tax attributes. No CTI employees, operations or business processes moved to the combined company in the CTI Merger. As a result, our existing net assets and operations represented the vast majority of the net assets and all of the operations of the combined company.
In connection with the Comverse share distribution, CTI and Comverse entered into several agreements to govern certain ongoing relationships between CTI and Comverse after the Comverse share distribution and to provide for an orderly transition.
In one of these agreements, Comverse agreed to indemnify CTI and its affiliates (including Verint following the CTI Merger) against certain losses arising as a result of the CTI Merger and the Comverse share distribution. Certain of Comverse's indemnification obligations are capped at $25.0 million and certain obligations are uncapped. Pursuant to this agreement, at the closing of the CTI Merger, CTI placed $25.0 million into an escrow account to support indemnification claims to the extent made against Comverse by CTI and its affiliates (including Verint after the CTI Merger). The balance of such escrow account was released to Comverse on August 4, 2014.
Consolidated Financial Statement Impact
For financial reporting purposes, the CTI Merger was accounted for as our acquisition of CTI in a combination of entities under common control. We are the continuing reporting entity. As a result, upon completion of the CTI Merger on February 4, 2013, our consolidated stockholders' equity was adjusted to reflect the $285.5 million carrying value of our Preferred Stock, all of which was held by CTI, and the $14.1 million carrying value of CTI's net assets (other than its equity interests in us), as increases to our additional paid-in capital. Prior to the CTI Merger, our Preferred Stock had been classified as mezzanine equity on our consolidated balance sheet.
As noted above, CTI's net assets also included net deferred tax assets primarily relating to CTI's NOL carryforwards for income tax purposes. The net deferred tax assets were fully offset by unrecognized tax benefits and valuation allowances. Also included in CTI's net assets were $15.8 million of liabilities primarily related to certain unrecognized tax benefits (not offsetting NOL carryforwards) and accrued penalties and interest and corresponding indemnification assets totaling the same amount, recognizing Comverse's contractual obligation to indemnify us for these liabilities.
16. | RELATED PARTY TRANSACTIONS |
109
Table of Contents
As noted previously, on February 4, 2013 we completed the CTI Merger, which eliminated CTI's majority ownership and control of us. As of January 31, 2013, prior to the CTI Merger, CTI beneficially owned approximately 53.5% , and also held a majority of the voting power, of our common stock on an as-converted basis.
During the year ended January 31, 2013, we paid $0.3 million to a subsidiary of CTI for its assignment to us of user licenses for certain third-party internal-use software. We also paid $1.6 million during the same year to certain subsidiaries of CTI to settle pre-existing liabilities incurred in the regular course of business.
Previous Relationships with CTI and its Subsidiaries
Prior to the CTI Merger, we were a party to several business agreements with CTI or its affiliates, each of which either terminated in connection with the CTI Merger, or is inactive and will be formally terminated, with the exception of the Federal Income Tax Sharing Agreement, which will remain in effect for the foreseeable future. These business agreements included service agreements whereby, if necessary, we received certain business support services from CTI and its other subsidiaries. Activity under these service agreements was not significant during the year ended January 31, 2013.
The Federal Income Tax Sharing Agreement with CTI applies to periods prior to our IPO in which we were included in CTI's consolidated federal tax return. By virtue of its controlling ownership and this tax sharing agreement, CTI effectively controlled all of our tax decisions for periods ending prior to the completion of our IPO, which occurred in May 2002. Under the agreement, for periods during which we were included in CTI's consolidated income tax return, we were required to pay CTI an amount equal to the tax liability we would have owed, if any, had we filed a federal income tax return on our own, as computed by CTI in its reasonable discretion. Under the agreement, we were not entitled to receive any payments from CTI in respect of, or to otherwise take advantage of, any loss resulting from the calculation of our separate income tax liability. The tax sharing agreement also provided for certain payments in the event of adjustments to the group's income tax liability. The tax sharing agreement continues in effect until 60 days after the expiration of the applicable statute of limitations for the final year in which we were part of the CTI consolidated group for income tax purposes.
Other Related Party Transactions
Our joint venture incurs certain operating expenses, including office rent and other administrative costs, under arrangements with one of its noncontrolling shareholders. These expenses totaled $0.5 million for each of the years ended January 31, 2015 , 2014, and 2013. Revenue recognized from this noncontrolling shareholder by our joint venture was not significant for the year ended January 31, 2015, and $0.2 million , and $0.3 million for the years ended January 31, 2014 and 2013, respectively.
17. | COMMITMENTS AND CONTINGENCIES |
Operating and Capital Leases
We lease office, manufacturing, and warehouse space, as well as certain equipment, under non-cancelable operating lease agreements. We have also periodically entered into capital leases. Terms of the leases, including renewal options and escalation clauses, vary by lease. When determining the term of a lease, we include renewal options that are reasonably assured. The lease agreements generally provide that we pay taxes, insurance, and maintenance expenses related to the leased assets over the initial lease term and those renewal periods that are reasonably assured.
Our facility leases may contain rent escalation clauses or rent holidays, commencing at various times during the terms of the
agreements. Rent expense on operating leases with scheduled rent increases or holidays during the lease term is recognized on a straight-line basis. The difference between rent expense and rent paid is recorded as deferred rent. Leasehold improvements are depreciated over the shorter of their economic lives, which begin once the assets are ready for their intended use, or the term of the lease.
Rent expense incurred under all operating leases was $17.2 million , $15.0 million , and $16.0 million for the years ended January 31, 2015, 2014, and 2013, respectively.
As of January 31, 2015, our minimum future rentals under non-cancelable operating leases were as follows:
110
Table of Contents
(in thousands) |
| Operating | ||
Years Ending January 31, |
| Leases | ||
2016 |
| $ | 15,383 | |
2017 |
| 12,550 | | |
2018 |
| 10,179 | | |
2019 |
| 8,564 | | |
2020 |
| 6,453 | | |
2021 and thereafter |
| 31,953 | | |
Total |
| $ | 85,082 | |
We sublease certain space in our facilities to third parties. As of January 31, 2015, total expected future sublease income was $2.5 million and will range from $0.1 million to $1.1 million on an annual basis through August 2018.
On February 13, 2015, we entered into a new operating lease for a facility in Melville, New York, which facility will serve as our corporate headquarters following the expiration of our existing corporate headquarters lease in November 2015. The new Melville facility will be occupied under a lease that expires in 2027. The aggregate minimum lease commitment over the term of this new lease, excluding operating expenses, is approximately $18.8 million . This commitment is not included in the table of minimum future rentals under non-cancelable operating leases presented above.
Unconditional Purchase Obligations
In the ordinary course of business, we enter into certain unconditional purchase obligations, which are agreements to purchase goods or services that are enforceable, legally binding, and that specify all significant terms, including: fixed or minimum quantities to be purchased; fixed, minimum, or variable price provisions; and the approximate timing of the transaction. Our purchase orders are based on current needs and are typically fulfilled by our vendors within a relatively short time horizon.
As of January 31, 2015, our unconditional purchase obligations totaled approximately $57.5 million , the majority of which were scheduled to occur within the subsequent twelve months. Due to the relatively short life of the obligations, the carrying value approximates the fair value of these obligations at January 31, 2015.
Warranty Liability
The following table summarizes the activity in our warranty liability, which is included in accrued expenses and other liabilities in the consolidated balance sheets, for the years ended January 31, 2015, 2014, and 2013:
|
| Year Ended January 31, | ||||||||||
(in thousands) |
| 2015 |
| 2014 |
| 2013 | ||||||
Warranty liability, beginning of year |
| $ | 706 | |
| $ | 1,045 | |
| $ | 2,015 | |
Provision credited against expenses |
| (60 | ) |
| (337 | ) |
| (780 | ) | |||
Warranty charges |
| - | |
| - | |
| (188 | ) | |||
Foreign currency translation and other |
| (13 | ) |
| (2 | ) |
| (2 | ) | |||
Warranty liability, end of year |
| $ | 633 | |
| $ | 706 | |
| $ | 1,045 | |
We accrue for warranty costs as part of our cost of revenue based on associated product costs, labor costs, and associated overhead. Our Enterprise Intelligence solutions are sold with a warranty of generally one year on hardware and 90 days for software. Our Communications Intelligence solutions and Video Intelligence solutions are sold with warranties that typically range in duration from 90 days to three years, and in some cases longer.
Licenses and Royalties
We license certain technology and pay royalties under such licenses and other agreements entered into in connection with research and development activities.
As discussed in Note 1, "Summary of Significant Accounting Policies", we receive non-refundable grants from the OCS that fund a portion of our research and development expenditures. The Israeli law under which the OCS grants are made limits our ability to manufacture products, or transfer technologies, developed using these grants outside of Israel. If we were to seek approval to manufacture products, or transfer technologies, developed using these grants outside of Israel, we could be subject
111
Table of Contents
to additional royalty requirements or be required to pay certain redemption fees. If we were to violate these restrictions, we could be required to refund any grants previously received, together with interest and penalties, and may be subject to criminal penalties.
Off-Balance Sheet Risk
In the normal course of business, we provide certain customers with financial performance guarantees, which are generally backed by standby letters of credit or surety bonds. In general, we would only be liable for the amounts of these guarantees in the event that our nonperformance permits termination of the related contract by our customer, which we believe is remote. At January 31, 2015, we had approximately $87.9 million of outstanding letters of credit and surety bonds relating primarily to these performance guarantees. As of January 31, 2015, we believe we were in compliance with our performance obligations under all contracts for which there is a financial performance guarantee, and the ultimate liability, if any, incurred in connection with these guarantees will not have a material adverse effect on our consolidated results of operations, financial position, or cash flows. Our historical non-compliance with our performance obligations has been insignificant.
Indemnifications
In the normal course of business, we provide indemnifications of varying scopes to customers against claims of intellectual property infringement made by third parties arising from the use of our products. Historically, costs related to these indemnification provisions have not been significant and we are unable to estimate the maximum potential impact of these indemnification provisions on our future results of operations.
To the extent permitted under Delaware law or other applicable law, we indemnify our directors, officers, employees, and agents against claims they may become subject to by virtue of serving in such capacities for us. We also have contractual indemnification agreements with our directors, officers, and certain senior executives. The maximum amount of future payments we could be required to make under these indemnification arrangements and agreements is potentially unlimited; however, we have insurance coverage that limits our exposure and enables us to recover a portion of any future amounts paid. We are not able to estimate the fair value of these indemnification arrangements and agreements in excess of applicable insurance coverage, if any.
Legal Proceedings
On March 26, 2009, legal actions were commenced by Ms. Orit Deutsch, a former employee of our subsidiary, Verint Systems Limited ("VSL"), against VSL in the Tel Aviv Regional Labor Court (Case Number 4186/09) (the "Deutsch Labor Action") and against CTI in the Tel Aviv District Court (Case Number 1335/09) (the "Deutsch District Action"). In the Deutsch Labor Action, Ms. Deutsch filed a motion to approve a class action lawsuit on the grounds that she purports to represent a class of our employees and former employees who were granted Verint and CTI stock options and were allegedly damaged as a result of the suspension of option exercises during our previous extended filing delay period. In the Deutsch District Action, in addition to a small amount of individual damages, Ms. Deutsch is seeking to certify a class of plaintiffs who were allegedly damaged due to their inability to exercise Verint and CTI stock options as a result of alleged negligence by CTI in its financial reporting. The class certification motions do not specify an amount of damages. On February 8, 2010, the Deutsch Labor Action was dismissed for lack of material jurisdiction and was transferred to the Tel Aviv District Court and consolidated with the Deutsch District Action. On March 16, 2009 and March 26, 2009, respectively, legal actions were commenced by Ms. Roni Katriel, a former employee of CTI's former subsidiary, Comverse Limited, against Comverse Limited in the Tel Aviv Regional Labor Court (Case Number 3444/09) (the "Katriel Labor Action") and against CTI in the Tel Aviv District Court (Case Number 1334/09) (the "Katriel District Action"). In the Katriel Labor Action, Ms. Katriel is seeking to certify a class of plaintiffs who were granted CTI stock options and were allegedly damaged as a result of the suspension of option exercises during CTI's previous extended filing delay period. In the Katriel District Action, in addition to a small amount of individual damages, Ms. Katriel is seeking to certify a class of plaintiffs who were allegedly damaged due to their inability to exercise CTI stock options as a result of alleged negligence by CTI in its financial reporting. The class certification motions do not specify an amount of damages. On March 2, 2010, the Katriel Labor Action was transferred to the Tel Aviv District Court, based on an agreed motion filed by the parties requesting such transfer.
On April 4, 2012, Ms. Deutsch and Ms. Katriel filed an uncontested motion to consolidate and amend their claims and on June 7, 2012, the District Court allowed Ms. Deutsch and Ms. Katriel to file the consolidated class certification motion and an amended consolidated complaint against VSL, CTI, and Comverse Limited. Following CTI's announcement of its intention to effect the Comverse share distribution, on July 12, 2012, the plaintiffs filed a motion requesting that the District Court order CTI to set aside up to $150.0 million in assets to secure any future judgment. The District Court ruled that it would not decide
112
Table of Contents
this motion until the Deutsch and Katriel class certification motion was heard. Plaintiffs initially filed a motion to appeal this ruling in August 2012, but subsequently withdrew it in July 2014.
Prior to the consummation of the Comverse share distribution, CTI either sold or transferred substantially all of its business operations and assets (other than its equity ownership interests in us and Comverse) to Comverse or unaffiliated third parties. On October 31, 2012, CTI completed the Comverse share distribution, in which it distributed all of the outstanding shares of common stock of Comverse to CTI's shareholders. As a result of the Comverse share distribution, Comverse became an independent public company and ceased to be a wholly owned subsidiary of CTI, and CTI ceased to have any material assets other than its equity interest in us.
On February 4, 2013, we completed the CTI Merger. As a result of the CTI Merger, we have assumed certain rights and liabilities of CTI, including any liability of CTI arising out of the Deutsch District Action and the Katriel District Action. However, under the terms of the Distribution Agreement between CTI and Comverse relating to the Comverse share distribution, we, as successor to CTI, are entitled to indemnification from Comverse for any losses we suffer in our capacity as successor-in-interest to CTI in connection with the Deutsch District Action and the Katriel District Action.
Following an attempt to mediate the dispute, on July 1, 2014, the plaintiffs filed a notice with the District Court informing it that the mediation process had been unsuccessful. As a result, the parties recently filed summations on the plaintiffs' motion to certify the suit as a class action, which are under consideration by the District Court.
From time to time we or our subsidiaries may be involved in legal proceedings and/or litigation arising in the ordinary course of our business. While the outcome of these matters cannot be predicted with certainty, we do not believe that the outcome of any current claims will have a material effect on our consolidated financial position, results of operations, or cash flows.
18. | SEGMENT, GEOGRAPHIC, AND SIGNIFICANT CUSTOMER INFORMATION |
Segment Information
Operating results by segment for the years ended January 31, 2015 , 2014 and 2013 were as follows:
113
Table of Contents
|
| Year Ended January 31, | ||||||||||
(in thousands) |
| 2015 |
| 2014 |
| 2013 | ||||||
Revenue: |
|
| |
|
| |
|
| ||||
Enterprise Intelligence |
|
| |
|
| |
|
| ||||
Segment revenue |
| $ | 687,703 | |
| $ | 500,847 | |
| $ | 494,967 | |
Revenue adjustments |
| (29,032 | ) |
| (1,946 | ) |
| (4,489 | ) | |||
|
| 658,671 | |
| 498,901 | |
| 490,478 | | |||
Communications Intelligence |
|
| |
|
| |
|
| ||||
Segment revenue |
| 360,090 | |
| 288,619 | |
| 231,719 | | |||
Revenue adjustments |
| (695 | ) |
| (616 | ) |
| (2,112 | ) | |||
|
| 359,395 | |
| 288,003 | |
| 229,607 | | |||
Video Intelligence |
|
| |
|
| |
|
| ||||
Segment revenue |
| 110,370 | |
| 120,555 | |
| 121,390 | | |||
Revenue adjustments |
| - | |
| (167 | ) |
| (1,933 | ) | |||
|
| 110,370 | |
| 120,388 | |
| 119,457 | | |||
Total revenue |
| $ | 1,128,436 | |
| $ | 907,292 | |
| $ | 839,542 | |
|
|
|
|
|
|
| ||||||
Segment contribution: |
|
| |
|
| |
|
| ||||
Enterprise Intelligence |
| $ | 276,754 | |
| $ | 215,368 | |
| $ | 216,941 | |
Communications Intelligence |
| 115,509 | |
| 90,658 | |
| 67,168 | | |||
Video Intelligence |
| 27,527 | |
| 28,986 | |
| 27,407 | | |||
Total segment contribution |
| 419,790 | |
| 335,012 | |
| 311,516 | | |||
|
|
|
|
|
|
| ||||||
Unallocated expenses, net: |
|
| |
|
| |
|
| ||||
Amortization of acquired intangible assets |
| 76,167 | |
| 36,931 | |
| 39,254 | | |||
Stock-based compensation |
| 54,458 | |
| 34,991 | |
| 25,208 | | |||
Other unallocated expenses |
| 210,054 | |
| 140,804 | |
| 147,501 | | |||
Total unallocated expenses, net |
| 340,679 | |
| 212,726 | |
| 211,963 | | |||
Operating income |
| 79,111 | |
| 122,286 | |
| 99,553 | | |||
Other expense, net |
| (57,708 | ) |
| (58,971 | ) |
| (31,789 | ) | |||
Income before (benefit) provision for income taxes |
| $ | 21,403 | |
| $ | 63,315 | |
| $ | 67,764 | |
Revenue adjustments represent revenue of acquired companies which is included within segment revenue reviewed by the CODM, but not recognizable within GAAP revenue. These adjustments primarily relate to the acquisition-date excess of the historical carrying value over the fair value of acquired companies' future maintenance and service performance obligations. As the obligations are satisfied, we report our segment revenue using the historical carrying values of these obligations, which we believe better reflects our ongoing maintenance and service revenue streams, whereas GAAP revenue is reported using the obligations' acquisition-date fair values.
With the exception of goodwill and acquired intangible assets, we do not identify or allocate our assets by operating segment. Consequently, it is not practical to present assets by operating segment. There were no material changes in the allocation of goodwill and acquired intangible assets by operating segment during the years ended January 31, 2015 , 2014 and 2013 . The allocations of goodwill and acquired intangible assets by operating segment appear in Note 5, "Intangible Assets and Goodwill".
Geographic Information
Revenue by major geographic region is based upon the geographic location of the customers who purchase our products. The geographic locations of distributors, resellers, and systems integrators who purchase and resell our products may be different from the geographic locations of end customers.
Revenue in the Americas includes the United States, Canada, Mexico, Brazil, and other countries in the Americas. Revenue in EMEA includes the United Kingdom, Germany, Israel, and other countries in EMEA. Revenue in the Asia-Pacific ("APAC") region includes Australia, India, Singapore, and other Asia-Pacific countries.
The information below summarizes revenue from unaffiliated customers by geographic area for the years ended January 31,
114
Table of Contents
2015 , 2014 and 2013 :
|
| Year Ended January 31, | ||||||||||
(in thousands) |
| 2015 |
| 2014 |
| 2013 | ||||||
Americas: |
|
|
|
|
|
| ||||||
United States |
| $ | 430,565 | |
| $ | 374,518 | |
| $ | 387,927 | |
Other |
| 157,992 | |
| 133,531 | |
| 72,089 | | |||
Total Americas |
| 588,557 | |
| 508,049 | |
| 460,016 | | |||
EMEA |
| 347,056 | |
| 185,151 | |
| 201,727 | | |||
APAC |
| 192,823 | |
| 214,092 | |
| 177,799 | | |||
Total revenue |
| $ | 1,128,436 | |
| $ | 907,292 | |
| $ | 839,542 | |
Our long-lived assets primarily consist of net property and equipment, goodwill and other intangible assets, capitalized software development costs, deferred cost of revenue, and deferred income taxes. We believe that our tangible long-lived assets, which consist of our net property and equipment, are exposed to greater geographic area risks and uncertainties than intangible assets and long-term cost deferrals, because these tangible assets are difficult to move and are relatively illiquid.
Property and equipment, net by geographic area consisted of the following as of January 31, 2015 , 2014 and 2013 :
|
| January 31, | ||||||||||
(in thousands) |
| 2015 |
| 2014 |
| 2013 | ||||||
United States |
| $ | 24,966 | |
| $ | 18,921 | |
| $ | 20,607 | |
Israel |
| 20,064 | |
| 14,320 | |
| 11,025 | | |||
Other countries |
| 17,460 | |
| 6,904 | |
| 6,529 | | |||
Total property and equipment, net |
| $ | 62,490 | |
| $ | 40,145 | |
| $ | 38,161 | |
Significant Customers
No single customer accounted for more than 10% of our revenue during the years ended January 31, 2015 and 2013 . One customer in our Communications Intelligence operating segment accounted for slightly more than 10% of our revenue during the year ended January 31, 2014.
19. SELECTED QUARTERLY FINANCIAL INFORMATION (UNAUDITED)
Summarized condensed quarterly financial information for the years ended January 31, 2015 and 2014 appears in the following tables:
115
Table of Contents
|
| Three Months Ended | ||||||||||||||
|
| April 30, |
| July 31, |
| October 31, |
| January 31, | ||||||||
(in thousands, except per share data) |
| 2014 |
| 2014 |
| 2014 |
| 2015 | ||||||||
Revenue |
| $ | 257,393 | |
| $ | 276,816 | |
| $ | 282,574 | |
| $ | 311,653 | |
Gross profit |
| $ | 154,570 | |
| $ | 174,261 | |
| $ | 181,471 | |
| $ | 202,986 | |
(Loss) income before (benefit) provision for income taxes |
| $ | (13,269 | ) |
| $ | (4,846 | ) |
| $ | 16,239 | |
| $ | 23,279 | |
Net income (loss) |
| $ | 28,819 | |
| $ | (10,380 | ) |
| $ | 11,473 | |
| $ | 6,490 | |
Net income (loss) attributable to Verint Systems Inc. |
| $ | 27,956 | |
| $ | (12,278 | ) |
| $ | 10,670 | |
| $ | 4,583 | |
Net income (loss) attributable to Verint Systems Inc. common shares: |
|
|
|
|
|
|
|
| ||||||||
for basic net income (loss) per common share |
| $ | 27,956 | |
| $ | (12,278 | ) |
| $ | 10,670 | |
| $ | 4,583 | |
for diluted net income (loss) per common share |
| $ | 27,956 | |
| $ | (12,278 | ) |
| $ | 10,670 | |
| $ | 4,583 | |
|
|
|
|
|
|
|
|
| ||||||||
Net income (loss) per common share attributable to Verint Systems Inc. |
|
|
|
|
|
|
|
| ||||||||
Basic |
| $ | 0.52 | |
| $ | (0.21 | ) |
| $ | 0.18 | |
| $ | 0.08 | |
Diluted |
| $ | 0.51 | |
| $ | (0.21 | ) |
| $ | 0.17 | |
| $ | 0.07 | |
|
| Three Months Ended | ||||||||||||||
|
| April 30, |
| July 31, |
| October 31, |
| January 31, | ||||||||
(in thousands, except per share data) |
| 2013 |
| 2013 |
| 2013 |
| 2014 | ||||||||
Revenue |
| $ | 204,786 | |
| $ | 222,447 | |
| $ | 224,314 | |
| $ | 255,745 | |
Gross profit |
| $ | 131,478 | |
| $ | 149,840 | |
| $ | 152,157 | |
| $ | 167,397 | |
(Loss) income before provision for income taxes |
| $ | (4,834 | ) |
| $ | 21,314 | |
| $ | 30,011 | |
| $ | 16,824 | |
Net (loss) income |
| $ | (7,937 | ) |
| $ | 18,505 | |
| $ | 24,054 | |
| $ | 24,154 | |
Net (loss) income attributable to Verint Systems Inc. |
| $ | (9,153 | ) |
| $ | 17,536 | |
| $ | 22,487 | |
| $ | 22,887 | |
Net (loss) income attributable to Verint Systems Inc. common shares: |
|
|
|
|
|
|
|
| ||||||||
for basic net (loss) income per common share |
| $ | (9,327 | ) |
| $ | 17,536 | |
| $ | 22,487 | |
| $ | 22,887 | |
for diluted net (loss) income per common share |
| $ | (9,327 | ) |
| $ | 17,536 | |
| $ | 22,487 | |
| $ | 22,887 | |
|
|
|
|
|
|
|
|
| ||||||||
Net (loss) income per common share attributable to Verint Systems Inc. |
|
|
|
|
|
|
|
| ||||||||
Basic |
| $ | (0.18 | ) |
| $ | 0.33 | |
| $ | 0.42 | |
| $ | 0.43 | |
Diluted |
| $ | (0.18 | ) |
| $ | 0.33 | |
| $ | 0.42 | |
| $ | 0.42 | |
Net income (loss) per common share attributable to Verint Systems Inc. is computed independently for each quarterly period and for the year. Therefore, the sum of quarterly net income (loss) per common share amounts may not equal the amounts reported for the years.
Quarterly operating results for the year ended January 31, 2015 include:
• | an income tax benefit of $45.2 million in the three months ended April 30, 2014 resulting from the reduction of a valuation allowance on our deferred income tax assets in connection with the acquisition of KANA; |
• | a $7.1 million loss on early retirement of debt in the three months ended April 30, 2014 associated with an amendment to our Credit Agreement, and |
• | a $5.5 million loss on early retirement of debt in the three months ended July 31, 2014 associated with an the early partial retirement of our February 2014 Term Loans and March 2014 Term Loans. |
Quarterly operating results for the year ended January 31, 2014 include a $9.7 million loss on early retirement of debt in the three months ended April 30, 2013 associated with an amendment to our Credit Agreement.
As is typical for many software and technology companies, our business is subject to seasonal and cyclical factors. Our revenue and operating income are typically highest in the fourth quarter and lowest in the first quarter (prior to the impact of unusual or nonrecurring items). Moreover, revenue and operating income in the first quarter of a new year may be lower than in the fourth
116
Table of Contents
quarter of the preceding year, potentially by a significant margin. In addition, we generally receive a higher volume of orders in the last month of a quarter, with orders concentrated in the later part of that month. We believe that these seasonal and cyclical factors primarily reflects customer spending patterns and budget cycles, as well as the impact of compensation incentive plans for our sales personnel. While seasonal and cyclical factors such as these are common in the software and technology industry, this pattern should not be considered a reliable indicator of our future revenue or financial performance. Many other factors, including general economic conditions, also have an impact on our business and financial results. See "Risk Factors" under Item 1A of this report for a more detailed discussion of factors which may affect our business and financial results.
Item 9. Changes In and Disagreements with Accountants on Accounting and Financial Disclosure
None.
Item 9A. Controls and Procedures
Evaluation of Disclosure Controls and Procedures
Management conducted an evaluation under the supervision and with the participation of our Chief Executive Officer and Chief Financial Officer, of the effectiveness of our disclosure controls and procedures, as defined in Rules 13a-15(e) and 15d-15(e) under the Exchange Act, as of January 31, 2015. Disclosure controls and procedures are those controls and other procedures that are designed to ensure that information required to be disclosed in reports filed or submitted under the Exchange Act is recorded, processed, summarized, and reported, within the time periods specified by the rules and forms promulgated by the SEC. Disclosure controls and procedures include, without limitation, controls and procedures designed to ensure that such information is accumulated and communicated to management, including our Chief Executive Officer and Chief Financial Officer, as appropriate, to allow timely decisions regarding required disclosure. As a result of this evaluation, our Chief Executive Officer and Chief Financial Officer concluded that our disclosure controls and procedures were effective as of January 31, 2015.
Management's Report on Internal Control Over Financial Reporting
Our management is responsible for establishing and maintaining adequate internal control over financial reporting, as such term is defined in Exchange Act Rules 13a-15(f) and 15d-15(f). Under the supervision and with the participation of our management, including our Chief Executive Officer and Chief Financial Officer, we conducted an evaluation of the effectiveness of our internal control over financial reporting as of January 31, 2015 based on the 2013 framework established in Internal Control - Integrated Framework (2013) issued by the Committee of Sponsoring Organizations of the Treadway Commission. Our internal control over financial reporting includes policies and procedures that provide reasonable assurance regarding the reliability of financial reporting and the preparation of financial statements for external reporting purposes in accordance with GAAP.
In accordance with guidance issued by the Securities and Exchange Commission, companies are permitted to exclude acquisitions from their final assessment of internal control over financial reporting for the first fiscal year in which the acquisition occurred. Our management's evaluation of internal control over financial reporting excluded the internal control activities of KANA, which we acquired on February 3, 2014. We have included the financial results of KANA in our consolidated financial statements from the date of acquisition. Total revenue subject to KANA's internal control over financial reporting represented less than 13% of our consolidated revenue for the fiscal year ended January 31, 2015. Total assets subject to KANA's internal control over financial reporting, excluding goodwill and intangible assets acquired from KANA, represented less than 5% of our consolidated total assets at January 31, 2015. We are currently assessing the control environment of this acquired business.
Based on the results of our evaluation, our management concluded that our internal control over financial reporting was effective as of January 31, 2015. We reviewed the results of management's assessment with our Audit Committee.
Our independent registered accounting firm, Deloitte & Touche LLP, has audited the effectiveness of our internal control over financial reporting as stated in their report included herein.
Changes in Internal Control Over Financial Reporting
117
Table of Contents
There were no changes to our internal control over financial reporting (as defined in Rules 13a-15(f) and 15d-15(f) under the Exchange Act) that occurred during the quarter ended January 31, 2015, that materially affected, or are reasonably likely to materially affect, our internal control over financial reporting.
Inherent Limitations on Effectiveness of Controls
Our management, including our Chief Executive Officer and Chief Financial Officer, does not expect that our disclosure controls or our internal control over financial reporting will prevent or detect all errors and all fraud. A control system, no matter how well conceived and operated, can provide only reasonable, not absolute, assurance that the objectives of the control system will be achieved. Further, the design of a control system must reflect the impact of resource constraints, and the benefits of controls must be considered relative to their costs. Because of the inherent limitations in all control systems, no evaluation of controls can provide absolute assurance that all control issues and instances of fraud, if any, have been detected. These inherent limitations include the possibility that judgments in decision-making can be faulty, and that breakdowns can occur because of simple errors. Additionally, controls can be circumvented by individual acts, by collusion of two or more people, or by management override of the controls. The design of any system of controls also is based in part upon certain assumptions about the likelihood of future events, and there can be no assurance that any design will succeed in achieving its stated goals under all possible conditions. Over time, controls may become inadequate because of changes in conditions or deterioration in the degree of compliance with policies or procedures. Because of the inherent limitations in a cost-effective control system, misstatements due to error or fraud may occur and not be detected.
118
Table of Contents
Report of Independent Registered Public Accounting Firm
To the Board of Directors and Stockholders of
Verint Systems Inc.
Melville, New York
We have audited the internal control over financial reporting of Verint Systems Inc. and subsidiaries (the "Company") as of January 31, 2015, based on criteria established in Internal Control - Integrated Framework (2013) issued by the Committee of Sponsoring Organizations of the Treadway Commission. As described in Management's Report on Internal Control Over Financial Reporting, management excluded from its assessment the internal control over financial reporting at KANA Software Inc. (together with its parent company and subsidiaries, "KANA"), which was acquired on February 3, 2014 and whose financial statements constitute less than 13% of consolidated revenue and less than 5% of consolidated total assets excluding goodwill and intangible assets acquired from KANA at January 31, 2015. Accordingly, our audit did not include the internal control over financial reporting at KANA. The Company's management is responsible for maintaining effective internal control over financial reporting and for its assessment of the effectiveness of internal control over financial reporting, included in the accompanying Management's Report on Internal Control Over Financial Reporting. Our responsibility is to express an opinion on the Company's internal control over financial reporting based on our audit.
We conducted our audit in accordance with the standards of the Public Company Accounting Oversight Board (United States). Those standards require that we plan and perform the audit to obtain reasonable assurance about whether effective internal control over financial reporting was maintained in all material respects. Our audit included obtaining an understanding of internal control over financial reporting, assessing the risk that a material weakness exists, testing and evaluating the design and operating effectiveness of internal control based on that risk, and performing such other procedures as we considered necessary in the circumstances. We believe that our audit provides a reasonable basis for our opinion.
A company's internal control over financial reporting is a process designed by, or under the supervision of, the company's principal executive and principal financial officers, or persons performing similar functions, and effected by the company's board of directors, management, and other personnel to provide reasonable assurance regarding the reliability of financial reporting and the preparation of financial statements for external purposes in accordance with generally accepted accounting principles. A company's internal control over financial reporting includes those policies and procedures that (1) pertain to the maintenance of records that, in reasonable detail, accurately and fairly reflect the transactions and dispositions of the assets of the company; (2) provide reasonable assurance that transactions are recorded as necessary to permit preparation of financial statements in accordance with generally accepted accounting principles, and that receipts and expenditures of the company are being made only in accordance with authorizations of management and directors of the company; and (3) provide reasonable assurance regarding prevention or timely detection of unauthorized acquisition, use, or disposition of the company's assets that could have a material effect on the financial statements.
Because of the inherent limitations of internal control over financial reporting, including the possibility of collusion or improper management override of controls, material misstatements due to error or fraud may not be prevented or detected on a timely basis. Also, projections of any evaluation of the effectiveness of the internal control over financial reporting to future periods are subject to the risk that the controls may become inadequate because of changes in conditions, or that the degree of compliance with the policies or procedures may deteriorate.
In our opinion, the Company maintained, in all material respects, effective internal control over financial reporting as of January 31, 2015, based on the criteria established in Internal Control - Integrated Framework (2013) issued by the Committee of Sponsoring Organizations of the Treadway Commission.
We have also audited, in accordance with the standards of the Public Company Accounting Oversight Board (United States), the consolidated financial statements as of and for the year ended January 31, 2015 of the Company and our report dated March 27, 2015 expressed an unqualified opinion on those financial statements.
/s/ DELOITTE & TOUCHE LLP
New York, New York
March 27, 2015
119
Table of Contents
Item 9B. Other Information
Not applicable.
120
Table of Contents
PART III
Item 10. Directors, Executive Officers and Corporate Governance
Except as set forth below, the information required by Item 10 will be included under the captions "Election of Directors", "Corporate Governance", "Executive Officers" and "Section 16(a) Beneficial Ownership Reporting Compliance" in our definitive Proxy Statement for the 2015 Annual Meeting of Stockholders to be filed with the SEC within 120 days of the fiscal year ended January 31, 2015 (the "2015 Proxy Statement") and is incorporated herein by reference.
Corporate Governance Guidelines
All of our employees, including our executive officers, are required to comply with our Code of Conduct. Additionally, our Chief Executive Officer, Chief Financial Officer, and senior officers must comply with our Code of Business Conduct and Ethics for Senior Officers. The purpose of these corporate policies is to ensure to the greatest possible extent that our business is conducted in a consistently legal and ethical manner. The text of the Code of Conduct and the Code of Business Conduct and Ethics for Senior Officers is available on our website (www.verint.com). We intend to disclose on our website any amendment to, or waiver from, a provision of our policies as required by law.
Item 11. Executive Compensation
The information required by Item 11 will be included under the captions "Executive Compensation" and "Compensation Committee Interlocks and Insider Participation" in the 2015 Proxy Statement and is incorporated herein by reference.
Item 12. Security Ownership of Certain Beneficial Owners and Management and Related Stockholder Matters
Except as set forth below, the information required by Item 12 will be included under the caption "Security Ownership of Certain Beneficial Owners and Management" in the 2015 Proxy Statement and is incorporated herein by reference.
Securities Authorized for Issuance Under Equity Compensation Plans
The following table sets forth certain information regarding our equity compensation plans as of January 31, 2015.
Plan Category |
| (a) Number of Securities to be Issued upon Exercise of Outstanding Options, Warrants, and Rights |
|
| (b) Weighted-Average Exercise Price of Outstanding Options, Warrants and Rights (1) |
| (c) Number of Securities Remaining Available for Future Issuance under Equity Compensation Plans (Excluding Securities Reflected in Column (a)) |
| ||||
|
|
|
|
|
|
|
|
| ||||
Equity compensation plans approved by security holders |
| 2,607,309 | | (2) |
| $ | 28.74 | |
| 5,163,351 | | (3) |
Equity compensation plans not approved by security holders |
| - | |
|
|
|
| - | |
| ||
|
|
|
|
|
|
|
|
| ||||
Total |
| 2,607,309 | |
|
| $ | 28.74 | |
| 5,163,351 | |
|
(1) The weighted-average price relates to outstanding stock options only (as of the applicable date). Other outstanding awards carry no exercise price and are therefore excluded from the weighted-average price.
(2) Consists of 8,891 stock options and 2,598,418 restricted stock units.
(3) Excludes 265,316 shares available under the Vovici Corporation 2006 Amended and Restated Stock Plan, which plan was assumed in connection with our acquisition of Vovici Corporation in 2011 and is not expected to be used for future awards.
121
Table of Contents
Item 13. Certain Relationships and Related Transactions, and Director Independence
The information required by Item 13 will be included under the captions "Corporate Governance" and "Certain Relationships and Related Person Transactions" in the 2015 Proxy Statement and is incorporated herein by reference.
Item 14. Principal Accounting Fees and Services
The information required by Item 14 will be included under the caption "Audit Matters" in the 2015 Proxy Statement and is incorporated herein by reference.
122
Table of Contents
PART IV
Item 15. Exhibits, Financial Statement Schedules
(a) Documents filed as part of this report
(1) Financial Statements
The consolidated financial statements filed as part of this report are listed on the Index to Consolidated Financial Statements in Part II, Item 8 of this Form 10-K.
(2) Financial Statement Schedules
All financial statement schedules have been omitted here because they are not applicable, not required, or the information is shown in the consolidated financial statements or notes thereto.
(3) Exhibits
See (b) below.
(b) Exhibits
Number |
| Description |
| Filed Herewith / Incorporated by Reference from |
|
|
|
|
|
2.1 |
| Agreement and Plan of Merger, dated August 12, 2012, by and among Comverse Technology, Inc., Verint Systems Inc. and Victory Acquisition I LLC* |
| Form 8-K filed on August 13, 2012 |
2.2 |
| Agreement and Plan of Merger, dated January 6, 2014, by and among Verint Systems Inc., Kiwi Acquisition Inc., Kay Technology Holdings, Inc. and Accel-KKR Capital Partners III, LP* |
| Form 8-K filed on January 6, 2014 |
2.3 |
| Distribution Agreement, dated as of October 31, 2012, by and between Comverse Technology, Inc. and Comverse, Inc. |
| Comverse, Inc. Current Report on Form 8-K filed with the SEC on November 2, 2012 |
2.4 |
| Tax Disaffiliation Agreement, dated as of October 31, 2012, by and between Comverse Technology, Inc. and Comverse, Inc. |
| Comverse, Inc. Current Report on Form 8-K filed with the SEC on November 2, 2012 |
3.1 |
| Amended and Restated Certificate of Incorporation of Verint Systems Inc. |
| Form S-1 (Commission File No. 333-82300) effective on May 16, 2002 |
3.2 |
| Amended and Restated By-laws of Verint Systems Inc. (as amended as of March 19, 2015) |
| Form 8-K filed on March 25, 2015 |
3.3 |
| Amended and Restated Certificate of Designation, Preferences and Rights of the Series A Convertible Perpetual Preferred Stock of Verint Systems Inc. |
| Form 10-Q filed on September 6, 2012 |
4.1 |
| Specimen Common Stock certificate |
| Form S-1 (Commission File No. 333-82300) effective on May 16, 2002 |
4.2 |
| Specimen Series A Convertible Perpetual Preferred Stock certificate |
| Form 10-K filed on March 17, 2010 |
4.3 |
| Indenture, dated as of June 18, 2014, between Verint Systems Inc. and Wilmington Trust, National Association, as trustee. |
| Form 8-K filed on June 18, 2014 |
4.4 |
| First Supplemental Indenture, dated as of June 18, 2014, between Verint Systems Inc. and Wilmington Trust, National Association, as trustee. |
| Form 8-K filed on June 18, 2014 |
10.1 |
| Form of Indemnification Agreement |
| Form S-1 (Commission File No. 333-82300) effective on May 16, 2002 |
10.2 |
| Verint Systems Inc. Stock Incentive Compensation Plan (as amended through December 12, 2002) |
| Form 10-K filed on May 1, 2003 |
10.3 |
| Amendment No. 1 to Verint Systems Inc. Stock Incentive Compensation Plan (dated December 23, 2008) |
| Form 10-K filed on March 17, 2010 |
123
Table of Contents
10.4 |
| Amendment No. 2 to Verint Systems Inc. Stock Incentive Compensation Plan (dated March 4, 2009) |
| Form 10-K filed on March 17, 2010 |
10.5 |
| Verint Systems Inc. 2004 Stock Incentive Compensation Plan, as amended and restated |
| Form 8-K filed on January 10, 2006 |
10.6 |
| Amendment No. 1 to Verint Systems Inc. 2004 Stock Incentive Compensation Plan, as amended and restated (dated December 23, 2008) |
| Form 10-K filed on March 17, 2010 |
10.7 |
| Verint Systems Inc. 2010 Long-Term Stock Incentive Plan |
| Form S-8 (Commission File No. 333-169768) effective on October 5, 2010 |
10.8 |
| Amendment No. 1 to Verint Systems Inc. 2010 Long-Term Stock Incentive Plan |
| Form 8-K filed on June 19, 2012 |
10.9 |
| Vovici Corporation Amended and Restated Stock Plan |
| Form 10-K filed on April 2, 2012 |
10.10 |
| Amended and Restated Comverse Technology, Inc. 2011 Stock Incentive Compensation Plan |
| Form S-8 (Commission File No. 333-189062) effective on June 3, 2013 |
10.11 |
| Verint Systems Inc. Stock Bonus Program** |
| Filed herewith |
10.12 |
| Form of Stock Option Award Agreement** |
| Form 8-K filed on December 7, 2004 |
10.13 |
| Form of Global Performance-Based Restricted Stock Unit Award** |
| Form 10-K filed on April 6, 2011 |
10.14 |
| Form of Global Time-Based Restricted Stock Unit Award** |
| Form 10-K filed on April 6, 2011 |
10.15 |
| Form of Performance-Based Restricted Stock Unit Award Agreement for Grants Subsequent to March 2012** |
| Form 10-K filed on April 2, 2012 |
10.16 |
| Form of Time-Based Restricted Stock Unit Award Agreement for Grants Subsequent to March 2012** |
| Form 10-K filed on April 2, 2012 |
10.17 |
| Form of Performance-Based Restricted Stock Unit Award Agreement for Grants Subsequent to March 2013** |
| Form 10-K filed on March 28, 2013 |
10.18 |
| Form of Time-Based Restricted Stock Unit Award Agreement for Grants Subsequent to March 2013** |
| Form 10-K filed on March 28, 2013 |
10.19 |
| Form of Special Performance-Based Restricted Stock Unit Award Agreement for Grants Subsequent to March 2013* |
| Form 8-K filed on April 22, 2013 |
10.20 |
| Form of Time-Based Restricted Stock Unit Award Agreement for Grants Subsequent to March 2014** |
| Form 10-K filed on March 31, 2014 |
10.21 |
| Form of Performance-Based Restricted Stock Unit Award Agreement for Grants Subsequent to March 2014** |
| Form 10-Q filed on June 5, 2014 |
10.22 |
| Form of Performance-Based Restricted Stock Unit Award Agreement for Grants Subsequent to March 2015** |
| Filed herewith |
10.23 |
| Credit Agreement dated as of April 29, 2011 among Verint Systems Inc., as Borrower, the lenders from time to time party thereto, and Credit Suisse AG, as administrative agent and collateral agent |
| Form 8-K filed on May 2, 2011 |
10.24 |
| Amendment and Restatement Agreement, dated as of March 6, 2013, among Verint Systems Inc., the lenders party thereto, and Credit Suisse AG, as administrative agent and collateral agent, including the Amended and Restated Credit Agreement, dated as of March 6, 2013, among Verint Systems Inc., as Borrower, the lenders from time to time party thereto, and Credit Suisse AG, as administrative agent and collateral agent attached as Exhibit A thereto |
| Form 8-K filed on March 8, 2013 |
10.25 |
| Amendment No. 1, Incremental Amendment and Joinder Agreement dated February 3, 2014 to the Amended and Restated Credit Agreement, dated as of March 6, 2013, among Verint Systems Inc., as Borrower, the lenders from time to time party thereto, and Credit Suisse AG, as administrative agent and collateral agent |
| Form 8-K filed on February 3, 2014 |
10.26 |
| Amendment No. 2, dated February 3, 2014 to the Amended and Restated Credit Agreement, dated as of March 6, 2013, among Verint Systems Inc., as Borrower, the lenders from time to time party thereto, and Credit Suisse AG, as administrative agent and collateral agent |
| Form 8-K filed on February 3, 2014 |
124
Table of Contents
10.27 |
| Amendment No. 3, dated February 3, 2014 to the Amended and Restated Credit Agreement, dated as of March 6, 2013, among Verint Systems Inc., as Borrower, the lenders from time to time party thereto, and Credit Suisse AG, as administrative agent and collateral agent |
| Form 8-K filed on February 3, 2014 |
10.28 |
| Amendment No. 4, dated March 7, 2014 to the Amended and Restated Credit Agreement, dated as of March 6, 2013, among Verint Systems Inc., as Borrower, the lenders from time to time party thereto, and Credit Suisse AG, as administrative agent and collateral agent |
| Form 8-K filed on March 10, 2014 |
10.29 |
| Amendment No. 5, Incremental Amendment and Joinder Agreement dated June 18, 2014 to the Amended and Restated Credit Agreement, dated as of March 6, 2013, among Verint Systems Inc., as Borrower, the lenders from time to time party thereto, and Credit Suisse AG, as administrative agent and collateral agent. |
| Form 8-K filed on June 18, 2014 |
10.30 |
| Employment Agreement, dated February 23, 2010, between Verint Systems Inc. and Dan Bodner** |
| Form 8-K filed on February 23, 2010 |
10.31 |
| Amended and Restated Employment Agreement, dated July 13, 2011, between Verint Systems Inc. and Douglas Robinson** |
| Form 8-K filed on July 14, 2011 |
10.32 |
| Second Amended and Restated Employment Agreement, dated July 13, 2011, between Verint Systems Inc. and Elan Moriah** |
| Form 8-K filed on July 14, 2011 |
10.33 |
| Contract of Employment, dated July 10, 2011, by and among Meir Sperling, Verint Systems Ltd., and Verint Systems Inc. ** |
| Form 8-K filed on July 14, 2011 |
10.34 |
| Second Amended and Restated Employment Agreement, dated July 13, 2011, between Verint Systems Inc. and Peter Fante** |
| Form 8-K filed on July 14, 2011 |
10.35 |
| Summary of the Terms of Verint Systems Inc. Executive Officer Annual Bonus Plan** |
| Filed herewith |
10.36 |
| Federal Income Tax Sharing Agreement, dated as of January 31, 2002, between Comverse Technologies, Inc. an Verint Systems Inc. |
| Form S-1 (Commission File No. 333-82300) effective on May 16, 2002 |
12.1 |
| Ratios of Earnings to Fixed Charges and Ratios of Earnings to Combined Fixed Charges and Preference Security Dividends |
| Filed herewith |
21.1 |
| Subsidiaries of Verint Systems Inc. |
| Filed herewith |
23.1 |
| Consent of Deloitte & Touche LLP, Independent Registered Public Accounting Firm |
| Filed herewith |
31.1 |
| Certification of Dan Bodner, Chief Executive Officer pursuant to Section 302 of the Sarbanes-Oxley Act of 2002 |
| Filed herewith |
31.2 |
| Certification of Douglas E. Robinson, Chief Financial Officer pursuant to Section 302 of the Sarbanes-Oxley Act of 2002 |
| Filed herewith |
32.1 |
| Certification of the Chief Executive Officer pursuant to Securities Exchange Act Rule 13a-14(b) and 18 U.S.C. Section 1350 (1) |
| Filed herewith |
32.2 |
| Certification of the Chief Financial Officer pursuant to Securities Exchange Act Rule 13a-14(b) and 18 U.S.C. Section 1350 (1) |
| Filed herewith |
101.INS |
| XBRL Instance Document |
| Filed herewith |
101.SCH |
| XBRL Taxonomy Extension Schema Document |
| Filed herewith |
101.CAL |
| XBRL Taxonomy Extension Calculation Linkbase Document |
| Filed herewith |
101.DEF |
| XBRL Taxonomy Extension Definition Linkbase Document |
| Filed herewith |
101.LAB |
| XBRL Taxonomy Extension Label Linkbase Document |
| Filed herewith |
101.PRE |
| XBRL Taxonomy Extension Presentation Linkbase Document |
| Filed herewith |
(1) These exhibits are being "furnished" with this periodic report and are not deemed "filed" with the SEC and are not incorporated by reference in any filing of the company under the Securities Act of 1933, as amended or the Securities Exchange Act of 1934, as amended.
* Certain exhibits and schedules have been omitted, and the company agrees to furnish supplementally to the SEC a copy of any omitted exhibits or schedules upon request.
125
Table of Contents
** Denotes a management contract or compensatory plan or arrangement required to be filed as an exhibit to this form pursuant to Item 15(b) of this report.
(c) Financial Statement Schedules
None
126
Table of Contents
SIGNATURES
Pursuant to the requirements of Section 13 or 15(d) of the Securities Exchange Act of 1934, the Registrant has duly caused this report to be signed on its behalf by the undersigned, thereunto duly authorized.
| VERINT SYSTEMS INC. |
|
|
|
|
March 27, 2015 | /s/ Dan Bodner |
| Dan Bodner |
| President and Chief Executive Officer |
|
|
March 27, 2015 | /s/ Douglas E. Robinson |
| Douglas E. Robinson |
| Chief Financial Officer |
Pursuant to the requirements of the Securities Exchange Act of 1934, this report has been signed by the following persons on behalf of the Registrant and in the capacities and on the dates indicated.
Name |
| Title |
| Date |
|
|
|
|
|
/s/ Dan Bodner |
| Chief Executive Officer and President, and Director |
| March 27, 2015 |
Dan Bodner |
| (Principal Executive Officer) |
|
|
|
|
|
|
|
/s/ Douglas E. Robinson |
| Chief Financial Officer |
| March 27, 2015 |
Douglas E. Robinson |
| (Principal Financial Officer and Principal Accounting Officer) |
|
|
|
|
|
|
|
/s/ Victor A. DeMarines |
| Chairman of the Board of Directors |
| March 27, 2015 |
Victor A. DeMarines |
|
|
|
|
|
|
|
|
|
/s/ John R. Egan |
| Director |
| March 27, 2015 |
John R. Egan |
|
|
|
|
|
|
|
|
|
/s/ Larry Myers |
| Director |
| March 27, 2015 |
Larry Myers |
|
|
|
|
|
|
|
|
|
/s/ Richard Nottenburg |
| Director |
| March 27, 2015 |
Richard Nottenburg |
|
|
|
|
|
|
|
|
|
/s/ Howard Safir |
| Director |
| March 27, 2015 |
Howard Safir |
|
|
|
|
|
|
|
|
|
/s/ Earl Shanks |
| Director |
| March 27, 2015 |
Earl Shanks |
|
|
|
|
127